
UNITED STATES
SECURITIES AND EXCHANGE COMMISSION
Washington, D.C. 20549
FORMN-CSRS
CERTIFIED SHAREHOLDER REPORT OF REGISTERED
MANAGEMENT INVESTMENT COMPANIES
Investment Company Act file number:811-09253
Wells Fargo Funds Trust
(Exact name of registrant as specified in charter)
525 Market St., San Francisco, CA 94105
(Address of principal executive offices) (Zip code)
Catherine Kennedy
Wells Fargo Funds Management, LLC
525 Market St., San Francisco, CA 94105
(Name and address of agent for service)
Registrant’s telephone number, including area code:800-222-8222
Date of fiscal year end: August 31
Registrant is making a filing for 9 of its series:
Wells Fargo Adjustable Rate Government Fund, Wells Fargo Conservative Income Fund, Wells Fargo Government Securities Fund, Wells Fargo High Yield Bond Fund, Wells Fargo Core Plus Bond Fund, Wells Fargo Short Duration Government Bond Fund, Wells Fargo Short-Term Bond Fund, Wells Fargo Short-Term High Yield Bond Fund, and Wells Fargo Ultra Short-Term Income Fund.
Date of reporting period: February 29, 2020
ITEM 1. REPORT TO STOCKHOLDERS
Semi-Annual Report
February 29, 2020
Wells Fargo Core Plus Bond Fund
Beginning on January 1, 2021, as permitted by new regulations adopted by the Securities and Exchange Commission, paper copies of the Wells Fargo Funds’ annual and semi-annual shareholder reports issued after this date will no longer be sent by mail, unless you specifically request paper copies of the reports. Instead, the reports will be made available on the Funds’ website, and you will be notified by mail each time a report is posted and provided with a website address to access the report.
If you already elected to receive shareholder reports electronically, you will not be affected by this change and you need not take any action. You may elect to receive shareholder reports and other communications from the Fund electronically at any time by contacting your financial intermediary (such as a broker-dealer or bank) or, if you are a direct investor, by calling1-800-222-8222 or by enrolling at wellsfargo.com/advantagedelivery.
You may elect to receive all future reports in paper free of charge. If you invest through a financial intermediary, you can contact your financial intermediary to request that you continue to receive paper copies of your shareholder reports; if you invest directly with the Fund, you can call 1-800-222-8222. Your election to receive reports in paper will apply to all Wells Fargo Funds held in your account with your financial intermediary or, if you are a direct investor, to all Wells Fargo Funds that you hold.
Contents
The views expressed and any forward-looking statements are as of February 29, 2020, unless otherwise noted, and are those of the Fund managers and/or Wells Fargo Asset Management. Discussions of individual securities, or the markets generally, or any Wells Fargo Fund are not intended as individual recommendations. Future events or results may vary significantly from those expressed in any forward-looking statements. The views expressed are subject to change at any time in response to changing circumstances in the market. Wells Fargo Asset Management and the Fund disclaim any obligation to publicly update or revise any views expressed or forward-looking statements.
INVESTMENT PRODUCTS: NOT FDIC INSURED ◾ NO BANK GUARANTEE ◾ MAY LOSE VALUE
Wells Fargo Core Plus Bond Fund | 1
Letter to shareholders (unaudited)

Andrew Owen
President
Wells Fargo Funds
“The fourth quarter started on a strong note, with U.S.-China trade tensions relaxing in October along with renewed optimism for a U.K. Brexit deal and positive macroeconomic data.”
Dear Shareholder:
We are pleased to offer you this semi-annual report for the Wells Fargo Core Plus Bond Fund for thesix-month period that ended February 29, 2020. As market volatility increased, returns for the period were more restrained after strong results in previous recent periods. However, supportive central banks addressed concerns over slowing global economic growth and international trade tensions.
Fixed-income and equity investors had mixed semi-annual returns. For the period, U.S. stocks, based on the S&P 500 Index,1 gained 1.92% and international stocks, as measured by the MSCI ACWI ex USA Index (Net),2 returned 0.13%. The MSCI EM Index (Net)3 gained 2.93%. For bond investors, the Bloomberg Barclays U.S. Aggregate Bond Index4 added 3.39%, the Bloomberg Barclays Global Aggregateex-USD Index5 returned-0.21%, the Bloomberg Barclays Municipal Bond Index6 gained 3.04%, and the ICE BofA U.S. High Yield Index7 added 1.34%.
The period began with uncertainty, leading to central bank support.
In September, as the period began, the U.S. Federal Reserve (Fed) cut interest rates a second time in the third quarter. U.S. manufacturing data disappointed investors. The U.S. Congress announced it would pursue an impeachment investigation of President Trump. Meanwhile, the Brexit impasse showed no signs of resolution. Officials in China warned it would be difficult to reach the country’s annual economic growth goals considering the weight of tariffs and trade restrictions. Although the S&P 500 Index finished the third quarter with the bestyear-to-date returns in more than 20 years, concerns about future returns remained.
The fourth quarter started on a strong note, with U.S.-China trade tensions relaxing in October along with renewed optimism for a U.K. Brexit deal and positive macroeconomic data. The initial estimate of U.S. third-quarter gross domestic product growth was a resilient 1.9% annualized rate, while the U.S. unemployment rate fell to a50-year low of 3.5% in September. However, despite resilience among U.S. consumers, business confidence declined while manufacturing activity contracted. Concerned with a potential economic slowdown, the Fed lowered interest rates another quarter point in late October—its third rate cut in four months. This helped push the S&P 500 Index to anall-time high, while emerging market equities rallied and global bonds declined overall, reflecting a broad pickup in risk appetite.
Equity markets continued to rally in November despite ongoing geopolitical risks. Hopes for a U.S.-China trade deal buoyed investor confidence. U.S. business sentiment improved
| 1 | The S&P 500 Index consists of 500 stocks chosen for market size, liquidity, and industry group representation. It is a market-value-weighted index with each stock’s weight in the index proportionate to its market value. You cannot invest directly in an index. |
| 2 | The Morgan Stanley Capital International (MSCI) All Country World Index (ACWI) ex USA Index (Net) is a free-float-adjusted market-capitalization-weighted index that is designed to measure the equity market performance of developed markets, excluding the United States. Source: MSCI. MSCI makes no express or implied warranties or representations and shall have no liability whatsoever with respect to any MSCI data contained herein. The MSCI data may not be further redistributed or used as a basis for other indices or any securities or financial products. This report is not approved, reviewed, or produced by MSCI. You cannot invest directly in an index. |
| 3 | The MSCI Emerging Markets (EM) Index (Net) is a free-float-adjusted market-capitalization-weighted index that is designed to measure equity market performance of emerging markets. You cannot invest directly in an index. |
| 4 | The Bloomberg Barclays U.S. Aggregate Bond Index is a broad-based benchmark that measures the investment-grade, U.S. dollar-denominated, fixed-rate taxable bond market, including Treasuries, government-related and corporate securities, mortgage-backed securities (agency fixed-rate and hybrid adjustable-rate mortgage pass-throughs), asset-backed securities, and commercial mortgage-backed securities. You cannot invest directly in an index. |
| 5 | The Bloomberg Barclays Global Aggregateex-USD Index is an unmanaged index that provides a broad-based measure of the global investment-grade fixed-income markets excluding the U.S. dollar-denominated debt market. You cannot invest directly in an index. |
| 6 | The Bloomberg Barclays Municipal Bond Index is an unmanaged index composed of long-termtax-exempt bonds with a minimum credit rating of Baa. You cannot invest directly in an index. |
| 7 | The ICE BofA U.S. High Yield Index is a market-capitalization-weighted index of domestic and Yankee high-yield bonds. The index tracks the performance of high-yield securities traded in the U.S. bond market. You cannot invest directly in an index. Copyright 2020. ICE Data Indices, LLC. All rights reserved. |
2 | Wells Fargo Core Plus Bond Fund
Letter to shareholders (unaudited)
slightly, and manufacturing and services activity picked up. With that positive backdrop, developed market equities outpaced those in emerging markets, and U.S. stocks, as reflected by the S&P 500 Index, outperformednon-U.S. stocks overall. While consumer confidence and purchasing manager activity rose in the eurozone, China reported weakening manufacturing and consumer data. Bond yields rose marginally, leading to slightly negative returns for global government and investment-grade corporate bonds.
Financial markets ended 2019 with a boost from the U.S. and China accord on a Phase One trade deal. That, along with the landslide win by thepro-Brexit U.K. Conservative Party in a national election and ongoing central bank support, gave investors greater confidence. U.S. economic indicators were generally positive, with the exception of manufacturing activity and business confidence. Consumer confidence was resilient, fed by a robust labor market, tame inflation, and lower interest rates, which boosted housing affordability and stimulated homebuyer activity. The impeachment of U.S. President Donald Trump had little impact on markets. Meanwhile, slowing Chinese economic activity, partly attributable to the trade war, led to further government stimulus atyear-end through lower reserve ratios, allowing banks to lend more money.
Theyear-end rally continued in early January 2020. However, capital market volatility picked up sharply in late January on concerns over the unknown impact of the novel coronavirus(COVID-19) on the global economy and stock markets. With sentiment somewhat souring, perceived safe havens did well in January. The U.S. dollar and Japanese yen both rose and government bonds outperformed equities. While the S&P 500 Index held its ground, emerging market equities tumbled, including those in Asia that are most exposed to viruses—physical or economic—originating in China.
In February, the coronavirus became the major market focus. Fears of the virus’s impact on global growth led to expectations of increased global central bank monetary policy support. That led the10-year Treasury yield to fall to anall-time low of 1.1% by the end of the month. Although equity markets initially shrugged off concerns about the outbreak, focusing instead on strong fourth-quarter earnings and improving business confidence in January, market sentiment turned sharply lower towardmonth-end and the S&P 500 Index lost 8.2% for the month. Oil prices tumbled as Russia and the Organization of the Petroleum Exporting Countries compounded a major decline in oil demand with a brutal price war, partly aimed at dissuading further U.S. shale production. As a result, the price of West Texas Intermediate crude oil fell 13% in February and 27% for 2020 year to date.
Don’t let short-term uncertainty derail long-term investment goals.
Periods of investment uncertainty can present challenges, but experience has taught us that maintaining long-term investment goals can be an effective way to plan for the future. Although diversification cannot guarantee an investment profit or prevent losses, we believe it can be an effective way to manage investment risk and potentially smooth out overall portfolio performance. We encourage investors to know their investments and to understand that appropriate levels of risk-taking may unlock opportunities.
Thank you for choosing to invest with Wells Fargo Funds. We appreciate your confidence in us and remain committed to helping you meet your financial needs.
Sincerely,

Andrew Owen
President
Wells Fargo Funds
“Capital market volatility picked up sharply in late January on concerns over the unknown impact of the novel coronavirus(COVID-19) on the global economy and stock markets.”
|
|
|
For further information about your Fund, contact your investment professional, visit our website at wfam.com, or call us directly at1-800-222-8222. |
Wells Fargo Core Plus Bond Fund | 3
Performance highlights (unaudited)
Investment objective
The Fund seeks total return, consisting of current income and capital appreciation.
Manager
Wells Fargo Funds Management, LLC
Subadviser
Wells Capital Management Incorporated
Portfolio managers
Christopher Y. Kauffman, CFA®‡
Jay N. Mueller, CFA®‡
Janet S. Rilling, CFA®‡, CPA
Michael J. Schueller, CFA®‡
Noah M. Wise, CFA®‡
Average annual total returns (%) as of February 29, 2020
| | | | | | | | | | | | | | | | | | | | | | | | | | | | | | | | | | |
| | | | |
| | | | | Including sales charge | | | Excluding sales charge | | | Expense ratios1 (%) | |
| | | | | | | | | |
| | | Inception date | | 1 year | | | 5 year | | | 10 year | | | 1 year | | | 5 year | | | 10 year | | | Gross | | | Net2 | |
| | | | | | | | | | |
| Class A (STYAX) | | 7-13-1998 | | | 5.47 | | | | 3.19 | | | | 4.13 | | | | 10.41 | | | | 4.14 | | | | 4.61 | | | | 0.91 | | | | 0.74 | |
| | | | | | | | | | |
| Class C (WFIPX) | | 7-13-1998 | | | 8.60 | | | | 3.36 | | | | 3.84 | | | | 9.60 | | | | 3.36 | | | | 3.84 | | | | 1.66 | | | | 1.49 | |
| | | | | | | | | | |
| Class R6 (STYJX)3 | | 10-31-2016 | | | – | | | | – | | | | – | | | | 10.80 | | | | 4.50 | | | | 4.95 | | | | 0.53 | | | | 0.36 | |
| | | | | | | | | | |
| Administrator Class (WIPDX)4 | | 7-30-2010 | | | – | | | | – | | | | – | | | | 10.55 | | | | 4.26 | | | | 4.74 | | | | 0.85 | | | | 0.63 | |
| | | | | | | | | | |
| Institutional Class (WIPIX) | | 7-18-2008 | | | – | | | | – | | | | – | | | | 10.84 | | | | 4.47 | | | | 4.94 | | | | 0.58 | | | | 0.41 | |
| | | | | | | | | | |
| Bloomberg Barclays U.S. Aggregate Bond Index5 | | – | | | – | | | | – | | | | – | | | | 11.68 | | | | 3.58 | | | | 3.93 | | | | – | | | | – | |
Figures quoted represent past performance, which is no guarantee of future results, and do not reflect taxes that a shareholder may pay on an investment in a fund. Investment return and principal value of an investment will fluctuate so that an investor’s shares, when redeemed, may be worth more or less than their original cost. Performance shown without sales charges would be lower if sales charges were reflected. Current performance may be lower or higher than the performance data quoted, which assumes the reinvestment of dividends and capital gains. Currentmonth-end performance is available on the Fund’s website,wfam.com.
Index returns do not include transaction costs associated with buying and selling securities, any mutual fund fees or expenses, or any taxes. It is not possible to invest directly in an index.
For Class A shares, the maximumfront-end sales charge is 4.50%. For Class C shares, the maximum contingent deferred sales charge is 1.00%. Performance including a contingent deferred sales charge assumes the sales charge for the corresponding time period. Class R6, Administrator Class, and Institutional Class shares are sold without afront-end sales charge or contingent deferred sales charge.
Bond values fluctuate in response to the financial condition of individual issuers, general market and economic conditions, and changes in interest rates. Changes in market conditions and government policies may lead to periods of heightened volatility in the bond market and reduced liquidity for certain bonds held by the Fund. In general, when interest rates rise, bond values fall and investors may lose principal value. Interest rate changes and their impact on the Fund and its share price can be sudden and unpredictable. Loans are subject to risks similar to those associated with other below-investment-grade bond investments, such as risk of greater volatility in value, credit risk (for example, risk of issuer default), and risk that the loan may become illiquid or difficult to price. The use of derivatives may reduce returns and/or increase volatility. Certain investment strategies tend to increase the total risk of an investment (relative to the broader market). The Fund is exposed to foreign investment risk, high-yield securities risk, and mortgage and asset-backed securities risk. High-yield securities have a greater risk of default and tend to be more volatile than higher rated debt securities. Consult the Fund’s prospectus for additional information on these and other risks.
Please see footnotes on page 5.
4 | Wells Fargo Core Plus Bond Fund
Performance highlights (unaudited)
| | | | |
|
| Ten largest holdings (%) as of February 29, 20206 | |
| | |
FNMA, 3.50%,8-1-2049 | | | 1.73 | |
| | |
FHLMC, 3.50%,10-1-2049 | | | 1.52 | |
| | |
U.S. Treasury Note, 1.75%,11-15-2029 | | | 1.48 | |
| | |
U.S. Treasury Bond, 0.13%,1-15-2030 | | | 1.06 | |
| | |
FNMA, 3.50%,3-1-2048 | | | 1.06 | |
| | |
U.S. Treasury Bond, 3.00%,5-15-2045 | | | 0.89 | |
| | |
Bonos y Obligaciones del Estado,0.25%, 7-30-2024 | | | 0.86 | |
| | |
TVA, 5.88%,4-1-2036 | | | 0.85 | |
| | |
U.S. Treasury Bond, 3.00%,11-15-2044 | | | 0.82 | |
| | |
Private Export Funding Corporation,2.80%, 5-15-2022 | | | 0.80 | |
|
|
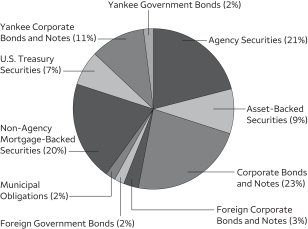
| Portfolio allocation as of February 29, 20207 |
|
 |
| ‡ | CFA® and Chartered Financial Analyst® are trademarks owned by CFA Institute. |
| 1 | Reflects the expense ratios as stated in the most recent prospectuses, which include the impact of 0.01% in acquired fund fees and expenses. The expense ratios shown are subject to change and may differ from the annualized expense ratios shown in the financial highlights of this report, which do not include acquired fund fees and expenses. |
| 2 | The manager has contractually committed through December 31, 2020, to waive fees and/or reimburse expenses to the extent necessary to cap total annual fund operating expenses after fee waivers at 0.73% for Class A, 1.48% for Class C, 0.35% for Class R6, 0.62% for Administrator Class, and 0.40% for Institutional Class. Brokerage commissions, stamp duty fees, interest, taxes, acquired fund fees and expenses (if any), and extraordinary expenses are excluded from the expense cap. Prior to or after the commitment expiration date, the cap may be increased or the commitment to maintain the cap may be terminated only with the approval of the Board of Trustees. Without this cap, the Fund’s returns would have been lower. The expense ratio paid by an investor is the net expense ratio (the total annual fund operating expenses after fee waivers) as stated in the prospectuses. |
| 3 | Historical performance shown for the Class R6 shares prior to their inception reflects the performance of the Institutional Class shares, and includes the higher expenses applicable to the Institutional Class shares. If these expenses had not been included, returns for the Class R6 shares would be higher. |
| 4 | Historical performance shown for the Administrator Class shares prior to their inception reflects the performance of the Institutional Class shares and has been adjusted to include the higher expenses applicable to the Administrator Class shares. |
| 5 | The Bloomberg Barclays U.S. Aggregate Bond Index is a broad-based benchmark that measures the investment-grade, U.S. dollar–denominated, fixed-rate taxable bond market, including Treasuries, government-related and corporate securities, mortgage-backed securities (agency fixed-rate and hybrid adjustable-rate mortgage pass-throughs), asset-backed securities, and commercial mortgage-backed securities. You cannot invest directly in an index. |
| 6 | The ten largest holdings, excluding cash, cash equivalents and any money market funds, are calculated based on the value of the investments divided by total net assets of the Fund. Holdings are subject to change and may have changed since the date specified. |
| 7 | Amounts are calculated based on the total long-term investments of the Fund. These amounts are subject to change and may have changed since the date specified. |
Wells Fargo Core Plus Bond Fund | 5
Fund expenses (unaudited)
As a shareholder of the Fund, you incur two types of costs: (1) transaction costs, including sales charges (loads) on purchase payments and contingent deferred sales charges (if any) on redemptions and (2) ongoing costs, including management fees, distribution(12b-1) and/or shareholder servicing fees, and other Fund expenses. This example is intended to help you understand your ongoing costs (in dollars) of investing in the Fund and to compare these costs with the ongoing costs of investing in other mutual funds.
The example is based on an investment of $1,000 invested at the beginning of thesix-month period and held for the entire period from September 1, 2019 to February 29, 2020.
Actual Expenses
The “Actual” line of the table below provides information about actual account values and actual expenses. You may use the information in this line, together with the amount you invested, to estimate the expenses that you paid over the period. Simply divide your account value by $1,000 (for example, an $8,600 account value divided by $1,000 = 8.6), then multiply the result by the number in the “Actual” line under the heading entitled “Expenses paid during period” for your applicable class of shares to estimate the expenses you paid on your account during this period.
Hypothetical Example for Comparison Purposes
The “Hypothetical” line of the table below provides information about hypothetical account values and hypothetical expenses based on the Fund’s actual expense ratio and an assumed rate of return of 5% per year before expenses, which is not the Fund’s actual return. The hypothetical account values and expenses may not be used to estimate the actual ending account balance or expenses you paid for the period. You may use this information to compare the ongoing costs of investing in the Fund and other funds. To do so, compare this 5% hypothetical example with the 5% hypothetical examples that appear in the shareholder reports of the other funds.
Please note that the expenses shown in the table are meant to highlight your ongoing costs only and do not reflect any transactional costs, such as sales charges (loads) and contingent deferred sales charges. Therefore, the “Hypothetical” line of the table is useful in comparing ongoing costs only and will not help you determine the relative total costs of owning different funds. In addition, if these transactional costs were included, your costs would have been higher.
| | | | | | | | | | | | | | | | |
| | | Beginning
account value
9-1-2019 | | | Ending
account value
2-29-2020 | | | Expenses
paid during
the period¹ | | | Annualized net
expense ratio | |
| | | | | |
Class A | | | | | | | | | | | | | | | | |
| | | | |
Actual | | $ | 1,000.00 | | | $ | 1,029.21 | | | $ | 3.58 | | | | 0.71 | % |
| | | | |
Hypothetical (5% return before expenses) | | $ | 1,000.00 | | | $ | 1,021.33 | | | $ | 3.57 | | | | 0.71 | % |
| | | | | |
Class C | | | | | | | | | | | | | | | | |
| | | | |
Actual | | $ | 1,000.00 | | | $ | 1,025.48 | | | $ | 7.45 | | | | 1.48 | % |
| | | | |
Hypothetical (5% return before expenses) | | $ | 1,000.00 | | | $ | 1,017.50 | | | $ | 7.42 | | | | 1.48 | % |
| | | | | |
Class R6 | | | | | | | | | | | | | | | | |
| | | | |
Actual | | $ | 1,000.00 | | | $ | 1,030.98 | | | $ | 1.77 | | | | 0.35 | % |
| | | | |
Hypothetical (5% return before expenses) | | $ | 1,000.00 | | | $ | 1,023.12 | | | $ | 1.76 | | | | 0.35 | % |
| | | | | |
Administrator Class | | | | | | | | | | | | | | | | |
| | | | |
Actual | | $ | 1,000.00 | | | $ | 1,029.75 | | | $ | 3.13 | | | | 0.62 | % |
| | | | |
Hypothetical (5% return before expenses) | | $ | 1,000.00 | | | $ | 1,021.78 | | | $ | 3.12 | | | | 0.62 | % |
| | | | | |
Institutional Class | | | | | | | | | | | | | | | | |
| | | | |
Actual | | $ | 1,000.00 | | | $ | 1,030.74 | | | $ | 2.02 | | | | 0.40 | % |
| | | | |
Hypothetical (5% return before expenses) | | $ | 1,000.00 | | | $ | 1,022.87 | | | $ | 2.01 | | | | 0.40 | % |
| 1 | Expenses paid is equal to the annualized net expense ratio of each class multiplied by the average account value over the period, multiplied by the number of days in the most recent fiscal half-year divided by the number of days in the fiscal year (to reflect theone-half-year period). |
6 | Wells Fargo Core Plus Bond Fund
Portfolio of investments—February 29, 2020 (unaudited)
| | | | | | | | | | | | | | | | |
| | | Interest
rate | | | Maturity
date | | | Principal | | | Value | |
| Agency Securities: 20.16% | |
FHLB | | | 3.00 | % | | | 9-1-2034 | | | $ | 1,535,186 | | | $ | 1,591,004 | |
FHLMC | | | 3.50 | | | | 10-1-2049 | | | | 17,010,824 | | | | 17,672,360 | |
FHLMC | | | 4.00 | | | | 5-1-2049 | | | | 8,443,162 | | | | 8,911,419 | |
FHLMC | | | 3.00 | | | | 12-1-2049 | | | | 8,238,813 | | | | 8,490,132 | |
FHLMC | | | 3.50 | | | | 6-15-2042 | | | | 2,853,992 | | | | 2,956,375 | |
FHLMC | | | 3.50 | | | | 12-1-2045 | | | | 2,846,097 | | | | 3,012,908 | |
FHLMC | | | 3.50 | | | | 12-1-2045 | | | | 915,328 | | | | 968,473 | |
FHLMC (12 Month LIBOR +1.33%)± | | | 3.52 | | | | 1-1-2036 | | | | 13,158 | | | | 13,613 | |
FHLMC | | | 4.00 | | | | 6-1-2044 | | | | 2,086,820 | | | | 2,258,802 | |
FHLMC | | | 5.00 | | | | 6-1-2036 | | | | 199,928 | | | | 226,222 | |
FHLMC | | | 5.00 | | | | 8-1-2040 | | | | 187,560 | | | | 210,217 | |
FHLMC | | | 5.50 | | | | 8-1-2038 | | | | 45,959 | | | | 52,840 | |
FHLMC | | | 5.50 | | | | 12-1-2038 | | | | 432,633 | | | | 497,340 | |
FHLMC | | | 5.50 | | | | 6-1-2040 | | | | 686,412 | | | | 776,648 | |
FHLMC | | | 6.75 | | | | 9-15-2029 | | | | 5,910,000 | | | | 8,733,824 | |
FHLMC | | | 8.00 | | | | 2-1-2030 | | | | 168 | | | | 197 | |
FHLMC Series 2015-SC01 Class 1A | | | 3.50 | | | | 5-25-2045 | | | | 678,847 | | | | 692,599 | |
FHLMC Series 3774 Class AB | | | 3.50 | | | | 12-15-2020 | | | | 16,215 | | | | 16,306 | |
FHLMC Series K020 Class X1±±(c) | | | 1.37 | | | | 5-25-2022 | | | | 12,621,381 | | | | 325,232 | |
FHLMC SeriesT-42 Class A5 | | | 7.50 | | | | 2-25-2042 | | | | 1,305,170 | | | | 1,619,910 | |
FHLMC SeriesT-57 Class 2A1±± | | | 4.04 | | | | 7-25-2043 | | | | 38,590 | | | | 42,541 | |
FHLMC SeriesT-59 Class 2A1±± | | | 3.89 | | | | 10-25-2043 | | | | 198,856 | | | | 233,421 | |
FNMA | | | 3.50 | | | | 3-1-2048 | | | | 11,685,345 | | | | 12,299,197 | |
FNMA (12 Month LIBOR +1.61%)± | | | 2.49 | | | | 5-1-2046 | | | | 1,174,831 | | | | 1,208,387 | |
FNMA (12 Month LIBOR +1.61%)± | | | 2.53 | | | | 3-1-2046 | | | | 1,034,108 | | | | 1,065,303 | |
FNMA | | | 3.00 | | | | 11-1-2045 | | | | 1,793,422 | | | | 1,875,993 | |
FNMA | | | 3.00 | | | | 12-1-2045 | | | | 4,484,307 | | | | 4,690,947 | |
FNMA | | | 3.00 | | | | 12-1-2046 | | | | 2,123,302 | | | | 2,216,355 | |
FNMA | | | 3.00 | | | | 11-1-2047 | | | | 7,535,477 | | | | 7,813,405 | |
FNMA | | | 3.00 | | | | 4-1-2048 | | | | 5,234,489 | | | | 5,411,466 | |
FNMA %% | | | 3.00 | | | | 3-12-2050 | | | | 8,000,000 | | | | 8,239,062 | |
FNMA | | | 3.02 | | | | 2-1-2026 | | | | 3,127,689 | | | | 3,364,213 | |
FNMA | | | 3.27 | | | | 7-1-2022 | | | | 1,174,220 | | | | 1,221,110 | |
FNMA | | | 3.48 | | | | 3-1-2029 | | | | 987,090 | | | | 1,113,798 | |
FNMA | | | 3.50 | | | | 10-1-2043 | | | | 961,048 | | | | 1,019,052 | |
FNMA | | | 3.50 | | | | 4-1-2045 | | | | 232,202 | | | | 245,591 | |
FNMA | | | 3.50 | | | | 8-1-2045 | | | | 5,125,352 | | | | 5,420,911 | |
FNMA | | | 3.50 | | | | 8-1-2049 | | | | 19,361,918 | | | | 20,099,987 | |
FNMA | | | 3.62 | | | | 3-1-2029 | | | | 443,000 | | | | 506,348 | |
FNMA | | | 3.63 | | | | 3-1-2029 | | | | 1,250,000 | | | | 1,426,109 | |
FNMA | | | 3.77 | | | | 3-1-2029 | | | | 988,519 | | | | 1,136,800 | |
FNMA | | | 3.77 | | | | 3-1-2029 | | | | 1,077,784 | | | | 1,238,444 | |
FNMA (1 Year Treasury Constant Maturity +2.27%)± | | | 3.90 | | | | 1-1-2036 | | | | 37,907 | | | | 40,277 | |
FNMA | | | 3.95 | | | | 9-1-2021 | | | | 392,658 | | | | 403,818 | |
FNMA (12 Month LIBOR +1.73%)± | | | 3.99 | | | | 9-1-2036 | | | | 12,800 | | | | 13,394 | |
FNMA | | | 4.00 | | | | 2-1-2046 | | | | 419,594 | | | | 450,092 | |
FNMA | | | 4.00 | | | | 4-1-2046 | | | | 2,234,376 | | | | 2,399,293 | |
FNMA | | | 4.00 | | | | 6-1-2048 | | | | 5,293,390 | | | | 5,616,972 | |
FNMA %% | | | 4.00 | | | | 3-12-2050 | | | | 6,165,000 | | | | 6,494,178 | |
FNMA (12 Month LIBOR +1.78%)± | | | 4.23 | | | | 8-1-2036 | | | | 20,033 | | | | 21,149 | |
FNMA (1 Year Treasury Constant Maturity +2.26%)± | | | 4.39 | | | | 8-1-2036 | | | | 587,112 | | | | 622,466 | |
FNMA | | | 4.50 | | | | 11-1-2048 | | | | 4,914,144 | | | | 5,257,691 | |
FNMA | | | 5.00 | | | | 1-1-2024 | | | | 38,176 | | | | 40,376 | |
FNMA | | | 5.00 | | | | 2-1-2036 | | | | 21,227 | | | | 24,007 | |
FNMA | | | 5.00 | | | | 6-1-2040 | | | | 72,584 | | | | 81,660 | |
FNMA | | | 5.00 | | | | 8-1-2040 | | | | 1,274,465 | | | | 1,433,818 | |
Wells Fargo Core Plus Bond Fund | 7
Portfolio of investments—February 29, 2020 (unaudited)
| | | | | | | | | | | | | | | | |
| | | Interest
rate | | | Maturity
date | | | Principal | | | Value | |
| Agency Securities (continued) | |
FNMA | | | 5.50 | % | | | 11-1-2023 | | | $ | 28,071 | | | $ | 29,535 | |
FNMA | | | 5.50 | | | | 8-1-2034 | | | | 76,199 | | | | 87,129 | |
FNMA | | | 5.50 | | | | 2-1-2035 | | | | 22,984 | | | | 26,295 | |
FNMA | | | 5.50 | | | | 8-1-2038 | | | | 99,415 | | | | 108,146 | |
FNMA | | | 5.50 | | | | 8-1-2038 | | | | 180,263 | | | | 196,047 | |
FNMA | | | 6.00 | | | | 10-1-2037 | | | | 423,203 | | | | 495,501 | |
FNMA | | | 6.00 | | | | 11-1-2037 | | | | 27,205 | | | | 31,972 | |
FNMA | | | 6.50 | | | | 7-1-2036 | | | | 19,201 | | | | 22,427 | |
FNMA | | | 6.50 | | | | 7-1-2036 | | | | 10,139 | | | | 11,960 | |
FNMA | | | 6.50 | | | | 11-1-2036 | | | | 4,455 | | | | 5,155 | |
FNMA | | | 6.63 | | | | 11-15-2030 | | | | 5,015,000 | | | | 7,572,291 | |
FNMA | | | 7.00 | | | | 12-1-2022 | | | | 72,684 | | | | 74,403 | |
FNMA | | | 7.00 | | | | 7-1-2036 | | | | 10,384 | | | | 11,347 | |
FNMA | | | 7.00 | | | | 11-1-2037 | | | | 4,266 | | | | 4,834 | |
FNMA | | | 7.50 | | | | 5-1-2038 | | | | 1,882 | | | | 1,903 | |
FNMA Series2002-T12 Class A3 | | | 7.50 | | | | 5-25-2042 | | | | 5,543 | | | | 6,762 | |
FNMA Series2003-W08 Class 4A±± | | | 4.27 | | | | 11-25-2042 | | | | 113,974 | | | | 119,944 | |
FNMA Series2003-W14 Class 2A±± | | | 4.00 | | | | 6-25-2045 | | | | 78,920 | | | | 83,809 | |
FNMA Series2003-W14 Class 2A±± | | | 4.42 | | | | 1-25-2043 | | | | 198,309 | | | | 208,200 | |
FNMA Series2004-W11 Class 1A3 | | | 7.00 | | | | 5-25-2044 | | | | 957,044 | | | | 1,091,994 | |
FNMA Series2004-W15 Class 1A3 | | | 7.00 | | | | 8-25-2044 | | | | 469,587 | | | | 563,152 | |
GNMA | | | 3.00 | | | | 11-20-2045 | | | | 3,543,604 | | | | 3,698,295 | |
GNMA %% | | | 3.00 | | | | 3-23-2050 | | | | 8,420,000 | | | | 8,699,570 | |
GNMA | | | 3.50 | | | | 9-20-2047 | | | | 2,738,044 | | | | 2,881,824 | |
GNMA | | | 3.50 | | | | 12-20-2047 | | | | 5,784,797 | | | | 6,056,694 | |
GNMA | | | 4.00 | | | | 12-20-2047 | | | | 3,143,837 | | | | 3,326,649 | |
GNMA | | | 4.50 | | | | 8-20-2049 | | | | 1,544,114 | | | | 1,625,468 | |
GNMA | | | 5.00 | | | | 7-20-2040 | | | | 502,722 | | | | 561,992 | |
GNMA | | | 7.50 | | | | 12-15-2029 | | | | 608 | | | | 685 | |
GNMA Series2008-22 Class XM±±(c) | | | 1.11 | | | | 2-16-2050 | | | | 832,744 | | | | 21,996 | |
Overseas Private Investment Corporation | | | 2.12 | | | | 3-20-2024 | | | | 4,635,000 | | | | 4,744,604 | |
STRIPS ¤ | | | 0.00 | | | | 5-15-2039 | | | | 4,670,000 | | | | 3,418,777 | |
STRIPS ¤ | | | 0.00 | | | | 8-15-2039 | | | | 12,360,000 | | | | 9,005,797 | |
STRIPS ¤ | | | 0.00 | | | | 5-15-2044 | | | | 9,270,000 | | | | 6,017,953 | |
TVA | | | 5.88 | | | | 4-1-2036 | | | | 6,400,000 | | | | 9,887,248 | |
| | | | |
Total Agency Securities (Cost $223,625,860) | | | | | | | | | | | | | | | 234,514,410 | |
| | | | | | | | | | | | | | | | |
| | | | |
Asset-Backed Securities: 9.20% | | | | | | | | | | | | | | | | |
Ally Auto Receivables Trust Series2019-1 Class A3 | | | 2.91 | | | | 9-15-2023 | | | | 4,945,000 | | | | 5,044,842 | |
California Republic Auto Receivables Trust Series2017-1 Class A4 | | | 2.28 | | | | 6-15-2022 | | | | 2,805,661 | | | | 2,812,131 | |
Daimler Trucks Retail Trust Series2018-1 Class A3 144A | | | 2.85 | | | | 7-15-2021 | | | | 1,386,724 | | | | 1,390,884 | |
Daimler Trucks Retail Trust Series2018-1 Class A4 144A | | | 3.03 | | | | 11-15-2024 | | | | 5,000,000 | | | | 5,059,583 | |
Dell Equipment Finance Trust Series2018-1 Class A2A 144A | | | 2.97 | | | | 10-22-2020 | | | | 1,540,133 | | | | 1,541,739 | |
Drive Auto Receivables Trust Series2018-3 Class B | | | 3.37 | | | | 9-15-2022 | | | | 382,428 | | | | 382,758 | |
Educational Services of America Series2015-1 Class A (1 Month LIBOR +0.80%) 144A± | | | 2.43 | | | | 10-25-2056 | | | | 895,643 | | | | 891,330 | |
Enterprise Fleet Financing Trust Series2017-2 Class A2 144A | | | 1.97 | | | | 1-20-2023 | | | | 1,522,405 | | | | 1,523,252 | |
Exeter Automobile Receivables Trust Series2018-1A Class C1 144A | | | 3.03 | | | | 1-17-2023 | | | | 3,250,000 | | | | 3,271,381 | |
Five Guys Funding LLC Series17-1A Class A2 144A | | | 4.60 | | | | 7-25-2047 | | | | 1,597,925 | | | | 1,700,560 | |
Flagship Credit Auto Trust Series2019-4 Class A 144A | | | 2.17 | | | | 6-17-2024 | | | | 4,530,701 | | | | 4,563,515 | |
Ford Credit Auto Owner Trust Series2017-A Class A4 | | | 1.92 | | | | 4-15-2022 | | | | 2,600,000 | | | | 2,606,416 | |
GM Financial Consumer Automobile Receivables Trust Series2017-2A Class A3 144A | | | 1.86 | | | | 12-16-2021 | | | | 2,471,237 | | | | 2,473,738 | |
Hertz Vehicle Financing LLC Series2015-1A Class A 144A | | | 2.73 | | | | 3-25-2021 | | | | 5,000,000 | | | | 5,003,302 | |
Hertz Vehicle Financing LLC Series2018-2A Class A 144A | | | 3.65 | | | | 6-27-2022 | | | | 1,800,000 | | | | 1,846,519 | |
8 | Wells Fargo Core Plus Bond Fund
Portfolio of investments—February 29, 2020 (unaudited)
| | | | | | | | | | | | | | | | |
| | | Interest
rate | | | Maturity
date | | | Principal | | | Value | |
| Asset-Backed Securities (continued) | |
Hertz Vehicle Financing LLC Series2019-1A Class A 144A | | | 3.71 | % | | | 3-25-2023 | | | $ | 3,308,000 | | | $ | 3,450,575 | |
Honda Auto Receivables Owner Trust Series2016-4 Class A4 | | | 1.36 | | | | 1-18-2023 | | | | 4,998,000 | | | | 4,997,306 | |
Honda Auto Receivables Owner Trust Series2017-1 Class A4 | | | 2.05 | | | | 6-21-2023 | | | | 4,634,000 | | | | 4,650,432 | |
MMAF Equipment Finance LLC Series2017-AA Class A4 144A | | | 2.41 | | | | 8-16-2024 | | | | 1,975,000 | | | | 2,004,760 | |
MMAF Equipment Finance LLC Series2019-A Class A2 144A | | | 2.84 | | | | 1-10-2022 | | | | 1,641,222 | | | | 1,651,751 | |
Oscar US Funding Trust Series2016-2A Class A4 144A | | | 2.99 | | | | 12-15-2023 | | | | 4,140,018 | | | | 4,163,358 | |
SLM Student Loan Trust Series2004-1 Class A4 (3 Month LIBOR +0.26%)± | | | 2.05 | | | | 10-27-2025 | | | | 1,139,468 | | | | 1,136,380 | |
South Carolina Student Loan Corporation Series2014-1 Class A1 (1 Month LIBOR +0.75%)± | | | 2.41 | | | | 5-1-2030 | | | | 2,746,969 | | | | 2,749,356 | |
Student Loan Consolidation Center Series2011-1 Class A (1 Month LIBOR +1.22%) 144A± | | | 2.85 | | | | 10-25-2027 | | | | 1,161,697 | | | | 1,165,192 | |
TCF Auto Receivables Owner Trust Series2016-1A Class A4 144A | | | 2.03 | | | | 2-15-2022 | | | | 764,382 | | | | 764,595 | |
Towd Point Asset Funding LLC Series2019-HE1 Class A1 (1 Month LIBOR +0.90%) 144A± | | | 2.53 | | | | 4-25-2048 | | | | 2,667,511 | | | | 2,674,902 | |
Towd Point Asset Trust Series2018-SL1 Class A (1 Month LIBOR +0.60%) 144A± | | | 2.23 | | | | 1-25-2046 | | | | 2,408,546 | | | | 2,398,079 | |
Toyota Auto Receivables Owner Trust Series2017-D Class A4 | | | 2.12 | | | | 2-15-2023 | | | | 8,088,000 | | | | 8,175,456 | |
Toyota Auto Receivables Owner Trust Series2018-D Class A3 | | | 3.18 | | | | 3-15-2023 | | | | 5,995,000 | | | | 6,119,094 | |
Toyota Auto Receivables Owner Trust Series 2019- B Class A2A | | | 2.59 | | | | 2-15-2022 | | | | 6,121,136 | | | | 6,149,838 | |
Volvo Financial Equipment LLC Series2018-AA Class A (1 Month LIBOR +0.52%) 144A± | | | 2.18 | | | | 7-17-2023 | | | | 2,590,000 | | | | 2,597,961 | |
Westlake Automobile Receivables Trust Series2019-1A Class A2A 144A | | | 3.06 | | | | 5-16-2022 | | | | 1,161,021 | | | | 1,166,345 | |
Westlake Automobile Receivables Trust Series2019-2A A2A 144A | | | 2.57 | | | | 2-15-2023 | | | | 5,348,385 | | | | 5,381,407 | |
Wheels SPV LLC Series2018-1A Class A2 144A | | | 3.06 | | | | 4-20-2027 | | | | 822,079 | | | | 828,015 | |
World Omni Automobiles Lease Securitization Trust Series2018-B Class A3 | | | 3.19 | | | | 12-15-2021 | | | | 4,516,000 | | | | 4,586,689 | |
| | | | |
Total Asset-Backed Securities (Cost $106,206,309) | | | | | | | | | | | | | | | 106,923,441 | |
| | | | | | | | | | | | | | | | |
| | | | |
Corporate Bonds and Notes: 22.18% | | | | | | | | | | | | | | | | |
| | | | |
Communication Services: 1.98% | | | | | | | | | | | | | | | | |
| | | | |
| Diversified Telecommunication Services: 0.32% | | | | | | | | | | | | |
AT&T Incorporated | | | 4.75 | | | | 5-15-2046 | | | | 1,975,000 | | | | 2,328,617 | |
AT&T Incorporated | | | 5.65 | | | | 2-15-2047 | | | | 1,050,000 | | | | 1,384,835 | |
| | | | |
| | | | | | | | | | | | | | | 3,713,452 | |
| | | | | | | | | | | | | | | | |
| | | | |
| Media: 0.84% | | | | | | | | | | | | |
Charter Communications Operating LLC | | | 5.38 | | | | 4-1-2038 | | | | 705,000 | | | | 809,888 | |
Charter Communications Operating LLC | | | 6.48 | | | | 10-23-2045 | | | | 655,000 | | | | 842,383 | |
Comcast Corporation | | | 4.70 | | | | 10-15-2048 | | | | 1,800,000 | | | | 2,361,898 | |
Diamond Sports Group LLC 144A | | | 5.38 | | | | 8-15-2026 | | | | 70,000 | | | | 64,541 | |
Diamond Sports Group LLC 144A | | | 6.63 | | | | 8-15-2027 | | | | 70,000 | | | | 56,700 | |
Discovery Incorporated | | | 5.30 | | | | 5-15-2049 | | | | 735,000 | | | | 890,491 | |
Discovery Incorporated | | | 6.35 | | | | 6-1-2040 | | | | 1,550,000 | | | | 2,059,895 | |
Nexstar Broadcasting Incorporated 144A | | | 5.63 | | | | 7-15-2027 | | | | 45,000 | | | | 46,577 | |
Ziggo Bond Company BV 144A | | | 3.38 | | | | 2-28-2030 | | | | 2,500,000 | | | | 2,659,140 | |
| | | | |
| | | | | | | | | | | | | | | 9,791,513 | |
| | | | | | | | | | | | | | | | |
| | | | |
| Wireless Telecommunication Services: 0.82% | | | | | | | | | | | | |
Crown Castle Towers LLC 144A | | | 3.22 | | | | 5-15-2042 | | | | 2,600,000 | | | | 2,660,895 | |
SBA Tower Trust 144A | | | 3.72 | | | | 4-9-2048 | | | | 1,968,000 | | | | 2,043,556 | |
Sprint Spectrum Company 144A | | | 4.74 | | | | 9-20-2029 | | | | 3,930,000 | | | | 4,204,904 | |
Sprint Spectrum Company 144A | | | 5.15 | | | | 9-20-2029 | | | | 530,000 | | | | 596,544 | |
| | | | |
| | | | | | | | | | | | | | | 9,505,899 | |
| | | | | | | | | | | | | | | | |
Wells Fargo Core Plus Bond Fund | 9
Portfolio of investments—February 29, 2020 (unaudited)
| | | | | | | | | | | | | | | | |
| | | Interest
rate | | | Maturity
date | | | Principal | | | Value | |
| Consumer Discretionary: 1.45% | | | | | | | | | | | | |
|
| Automobiles: 0.70% | |
General Motors Company | | | 5.95 | % | | | 4-1-2049 | | | $ | 1,985,000 | | | $ | 2,172,762 | |
Hyundai Capital America 144A | | | 2.65 | | | | 2-10-2025 | | | | 5,810,000 | | | | 5,919,695 | |
| | | | |
| | | | | | | | | | | | | | | 8,092,457 | |
| | | | | | | | | | | | | | | | |
|
| Hotels, Restaurants & Leisure: 0.27% | |
Las Vegas Sands Corporation | | | 3.90 | | | | 8-8-2029 | | | | 3,000,000 | | | | 3,170,104 | |
| | | | | | | | | | | | | | | | |
|
| Multiline Retail: 0.34% | |
Macy’s Retail Holdings Incorporated | | | 3.45 | | | | 1-15-2021 | | | | 3,940,000 | | | | 3,980,058 | |
| | | | | | | | | | | | | | | | |
|
| Specialty Retail: 0.14% | |
Asbury Automotive Group Incorporated 144A | | | 4.50 | | | | 3-1-2028 | | | | 84,000 | | | | 84,168 | |
Asbury Automotive Group Incorporated 144A | | | 4.75 | | | | 3-1-2030 | | | | 1,522,000 | | | | 1,548,635 | |
| | | | |
| | | | | | | | | | | | | | | 1,632,803 | |
| | | | | | | | | | | | | | | | |
|
Consumer Staples: 0.77% | |
|
| Beverages: 0.19% | |
Anheuser-Busch InBev Worldwide Incorporated | | | 4.60 | | | | 4-15-2048 | | | | 1,810,000 | | | | 2,164,116 | |
| | | | | | | | | | | | | | | | |
|
| Food & Staples Retailing: 0.16% | |
Kroger Company | | | 5.40 | | | | 1-15-2049 | | | | 1,500,000 | | | | 1,903,439 | |
| | | | | | | | | | | | | | | | |
|
| Food Products: 0.12% | |
Kraft Heinz Foods Company 144A | | | 4.88 | | | | 10-1-2049 | | | | 1,430,000 | | | | 1,401,599 | |
| | | | | | | | | | | | | | | | |
|
| Tobacco: 0.30% | |
Altria Group Incorporated | | | 5.95 | | | | 2-14-2049 | | | | 1,090,000 | | | | 1,383,879 | |
BAT Capital Corporation | | | 3.56 | | | | 8-15-2027 | | | | 1,510,000 | | | | 1,594,069 | |
Reynolds American Incorporated | | | 7.00 | | | | 8-4-2041 | | | | 450,000 | | | | 570,486 | |
| | | | |
| | | | | | | | | | | | | | | 3,548,434 | |
| | | | | | | | | | | | | | | | |
|
| Energy: 3.45% | |
|
| Energy Equipment & Services: 0.19% | |
Diamond Offshore Drilling Incorporated | | | 7.88 | | | | 8-15-2025 | | | | 1,250,000 | | | | 876,563 | |
Hilcorp Energy Company 144A | | | 6.25 | | | | 11-1-2028 | | | | 1,900,000 | | | | 1,382,288 | |
| | | | |
| | | | | | | | | | | | | | | 2,258,851 | |
| | | | | | | | | | | | | | | | |
|
| Oil, Gas & Consumable Fuels: 3.26% | |
Antero Midstream Partners LP 144A | | | 5.75 | | | | 1-15-2028 | | | | 1,300,000 | | | | 892,385 | |
Antero Resources Corporation | | | 5.38 | | | | 11-1-2021 | | | | 1,900,000 | | | | 1,584,125 | |
Apache Corporation « | | | 5.35 | | | | 7-1-2049 | | | | 2,250,000 | | | | 2,290,469 | |
Archrock Partners LP 144A | | | 6.88 | | | | 4-1-2027 | | | | 1,300,000 | | | | 1,320,371 | |
Baker Hughes LLC | | | 2.77 | | | | 12-15-2022 | | | | 1,870,000 | | | | 1,911,943 | |
Boardwalk Pipelines LP | | | 4.80 | | | | 5-3-2029 | | | | 1,620,000 | | | | 1,721,149 | |
Buckeye Partners LP | | | 4.13 | | | | 12-1-2027 | | | | 1,300,000 | | | | 1,254,110 | |
Carrizo Oil & Gas Incorporated | | | 6.25 | | | | 4-15-2023 | | | | 1,300,000 | | | | 1,098,526 | |
Cheniere Energy Partners LP 144A | | | 4.50 | | | | 10-1-2029 | | | | 220,000 | | | | 210,386 | |
Crestwood Midstream Partners LP 144A | | | 5.63 | | | | 5-1-2027 | | | | 1,300,000 | | | | 1,202,435 | |
Denbury Resources Incorporated 144A | | | 9.25 | | | | 3-31-2022 | | | | 1,250,000 | | | | 1,000,000 | |
Energy Transfer Operating Partners LP | | | 5.25 | | | | 4-15-2029 | | | | 905,000 | | | | 1,016,378 | |
Energy Transfer Operating Partners LP | | | 6.13 | | | | 12-15-2045 | | | | 1,330,000 | | | | 1,500,402 | |
EnLink Midstream Partners LP | | | 5.45 | | | | 6-1-2047 | | | | 1,100,000 | | | | 797,170 | |
10 | Wells Fargo Core Plus Bond Fund
Portfolio of investments—February 29, 2020 (unaudited)
| | | | | | | | | | | | | | | | |
| | | Interest
rate | | | Maturity
date | | | Principal | | | Value | |
|
| Oil, Gas & Consumable Fuels (continued) | |
Enterprise Products Operating LLC | | | 2.80 | % | | | 1-31-2030 | | | $ | 2,960,000 | | | $ | 3,023,094 | |
Enviva Partners LP 144A | | | 6.50 | | | | 1-15-2026 | | | | 575,000 | | | | 598,012 | |
EQT Corporation | | | 3.90 | | | | 10-1-2027 | | | | 4,955,000 | | | | 3,233,138 | |
EQT Corporation | | | 7.00 | | | | 2-1-2030 | | | | 1,750,000 | | | | 1,303,750 | |
Gulfport Energy Corporation | | | 6.38 | | | | 5-15-2025 | | | | 1,250,000 | | | | 396,875 | |
Indigo Natural Resources LLC 144A | | | 6.88 | | | | 2-15-2026 | | | | 1,225,000 | | | | 1,044,313 | |
Murphy Oil Corporation | | | 5.88 | | | | 12-1-2027 | | | | 1,300,000 | | | | 1,268,904 | |
Nabors Industries Incorporated | | | 4.63 | | | | 9-15-2021 | | | | 198,000 | | | | 197,010 | |
Oasis Petroleum Incorporated 144A | | | 6.25 | | | | 5-1-2026 | | | | 1,250,000 | | | | 768,750 | |
Occidental Petroleum Corporation « | | | 4.40 | | | | 8-15-2049 | | | | 1,570,000 | | | | 1,493,711 | |
QEP Resources Incorporated | | | 5.38 | | | | 10-1-2022 | | | | 650,000 | | | | 592,719 | |
Rockies Express Pipeline LLC 144A | | | 5.63 | | | | 4-15-2020 | | | | 2,250,000 | | | | 2,256,908 | |
Southern Star Central Corporation 144A | | | 5.13 | | | | 7-15-2022 | | | | 1,189,000 | | | | 1,204,732 | |
Southwestern Energy Company « | | | 7.75 | | | | 10-1-2027 | | | | 1,250,000 | | | | 946,875 | |
Whiting Petroleum Corporation | | | 1.25 | | | | 4-1-2020 | | | | 2,000,000 | | | | 1,785,000 | |
| | | | |
| | | | | | | | | | | | | | | 37,913,640 | |
| | | | | | | | | | | | | | | | |
|
Financials: 7.04% | |
|
| Banks: 2.16% | |
Bank of America Corporation | | | 2.02 | | | | 2-13-2026 | | | | 5,000,000 | | | | 5,038,550 | |
Bank of America Corporation (3 Month LIBOR +0.94%)± | | | 3.86 | | | | 7-23-2024 | | | | 1,310,000 | | | | 1,401,624 | |
Bank of America Corporation | | | 3.95 | | | | 4-21-2025 | | | | 1,170,000 | | | | 1,277,014 | |
Bank of America Corporation (3 Month LIBOR +3.90%)± | | | 6.10 | | | | 12-29-2049 | | | | 2,590,000 | | | | 2,871,300 | |
Citigroup Incorporated (U.S. SOFR +1.15%)± | | | 2.67 | | | | 1-29-2031 | | | | 5,250,000 | | | | 5,383,472 | |
Citigroup Incorporated (3 Month LIBOR +4.52%)± | | | 6.25 | | | | 12-29-2049 | | | | 1,030,000 | | | | 1,144,155 | |
JPMorgan Chase & Company | | | 2.97 | | | | 1-15-2023 | | | | 2,550,000 | | | | 2,617,953 | |
JPMorgan Chase & Company (3 Month LIBOR +3.25%)± | | | 5.15 | | | | 12-29-2049 | | | | 3,625,000 | | | | 3,641,313 | |
PNC Financial Services (3 Month LIBOR +3.30%)± | | | 5.00 | | | | 12-29-2049 | | | | 565,000 | | | | 597,488 | |
Santander Holdings USA Incorporated | | | 3.24 | | | | 10-5-2026 | | | | 1,125,000 | | | | 1,168,151 | |
| | | | |
| | | | | | | | | | | | | | | 25,141,020 | |
| | | | | | | | | | | | | | | | |
|
| Capital Markets: 1.08% | |
Blackstone Holdings Finance Company LLC 144A | | | 2.50 | | | | 1-10-2030 | | | | 5,500,000 | | | | 5,760,901 | |
Blackstone Holdings Finance Company LLC 144A | | | 5.00 | | | | 6-15-2044 | | | | 1,015,000 | | | | 1,313,313 | |
Goldman Sachs Group Incorporated (3 Month LIBOR +0.82%)± | | | 2.88 | | | | 10-31-2022 | | | | 1,910,000 | | | | 1,947,817 | |
Morgan Stanley | | | 3.70 | | | | 10-23-2024 | | | | 3,235,000 | | | | 3,517,712 | |
| | | | |
| | | | | | | | | | | | | | | 12,539,743 | |
| | | | | | | | | | | | | | | | |
|
| Consumer Finance: 0.99% | |
ERAC USA Finance LLC 144A | | | 4.50 | | | | 2-15-2045 | | | | 1,695,000 | | | | 2,009,368 | |
Ford Motor Credit Company LLC | | | 3.20 | | | | 1-15-2021 | | | | 2,890,000 | | | | 2,909,139 | |
General Motors Financial Company Incorporated | | | 5.65 | | | | 1-17-2029 | | | | 1,330,000 | | | | 1,516,591 | |
PACCAR Financial Corporation | | | 2.30 | | | | 8-10-2022 | | | | 3,000,000 | | | | 3,069,745 | |
Synchrony Financial | | | 2.85 | | | | 7-25-2022 | | | | 2,000,000 | | | | 2,045,226 | |
| | | | |
| | | | | | | | | | | | | | | 11,550,069 | |
| | | | | | | | | | | | | | | | |
|
| Diversified Financial Services: 1.01% | |
Private Export Funding Corporation | | | 2.80 | | | | 5-15-2022 | | | | 9,000,000 | | | | 9,326,205 | |
WEA Finance LLC 144A | | | 2.88 | | | | 1-15-2027 | | | | 2,390,000 | | | | 2,468,006 | |
| | | | |
| | | | | | | | | | | | | | | 11,794,211 | |
| | | | | | | | | | | | | | | | |
|
| Insurance: 1.80% | |
Athene Global Funding 144A | | | 2.95 | | | | 11-12-2026 | | | | 3,550,000 | | | | 3,738,820 | |
Wells Fargo Core Plus Bond Fund | 11
Portfolio of investments—February 29, 2020 (unaudited)
| | | | | | | | | | | | | | | | |
| | | Interest
rate | | | Maturity
date | | | Principal | | | Value | |
|
| Insurance (continued) | |
Axis Specialty Finance LLC | | | 4.90 | % | | | 1-15-2040 | | | $ | 5,105,000 | | | $ | 5,053,950 | |
Brighthouse Financial Incorporated | | | 4.70 | | | | 6-22-2047 | | | | 1,955,000 | | | | 1,977,198 | |
Guardian Life Insurance Company 144A | | | 3.70 | | | | 1-22-2070 | | | | 1,500,000 | | | | 1,692,583 | |
Guardian Life Insurance Company 144A | | | 4.85 | | | | 1-24-2077 | | | | 1,045,000 | | | | 1,421,438 | |
National Life Global Insurance Company (3 Month LIBOR +3.31%) 144A± | | | 5.25 | | | | 7-19-2068 | | | | 1,668,000 | | | | 2,016,786 | |
PartnerRe Finance II Incorporated (3 Month LIBOR +2.33%)± | | | 3.91 | | | | 12-1-2066 | | | | 1,345,000 | | | | 1,156,297 | |
Transatlantic Holdings Incorporated | | | 8.00 | | | | 11-30-2039 | | | | 2,329,000 | | | | 3,879,209 | |
| | | | |
| | | | | | | | | | | | | | | 20,936,281 | |
| | | | | | | | | | | | | | | | |
|
Health Care: 1.68% | |
|
| Biotechnology: 0.33% | |
AbbVie Incorporated 144A | | | 2.95 | | | | 11-21-2026 | | | | 3,625,000 | | | | 3,800,429 | |
| | | | | | | | | | | | | | | | |
|
| Health Care Providers & Services: 1.35% | |
Anthem Incorporated | | | 3.70 | | | | 9-15-2049 | | | | 1,000,000 | | | | 1,026,545 | |
CommonSpirit Health | | | 2.95 | | | | 11-1-2022 | | | | 1,250,000 | | | | 1,283,408 | |
CommonSpirit Health | | | 3.82 | | | | 10-1-2049 | | | | 1,810,000 | | | | 1,943,899 | |
CVS Health Corporation | | | 4.78 | | | | 3-25-2038 | | | | 1,375,000 | | | | 1,621,617 | |
Dignity Health | | | 3.81 | | | | 11-1-2024 | | | | 2,000,000 | | | | 2,177,997 | |
Highmark Incorporated 144A | | | 6.13 | | | | 5-15-2041 | | | | 710,000 | | | | 947,676 | |
Magellan Health Incorporated | | | 4.90 | | | | 9-22-2024 | | | | 2,710,000 | | | | 2,777,750 | |
WellPoint Incorporated | | | 3.13 | | | | 5-15-2022 | | | | 3,804,000 | | | | 3,927,459 | |
| | | | |
| | | | | | | | | | | | | | | 15,706,351 | |
| | | | | | | | | | | | | | | | |
|
Industrials: 1.29% | |
|
| Airlines: 0.20% | |
Delta Airlines Pass-Through Certificates Series2015-B | | | 4.25 | | | | 1-30-2025 | | | | 2,169,243 | | | | 2,339,228 | |
| | | | | | | | | | | | | | | | |
|
| Building Products: 0.09% | |
Builders Firstsource Incorporated 144A | | | 5.00 | | | | 3-1-2030 | | | | 1,000,000 | | | | 1,000,480 | |
| | | | | | | | | | | | | | | | |
|
| Industrial Conglomerates: 0.33% | |
Carlisle Companies Incorporated | | | 2.75 | | | | 3-1-2030 | | | | 2,750,000 | | | | 2,750,618 | |
General Electric Company | | | 4.63 | | | | 1-7-2021 | | | | 1,060,000 | | | | 1,087,768 | |
| | | | |
| | | | | | | | | | | | | | | 3,838,386 | |
| | | | | | | | | | | | | | | | |
|
| Machinery: 0.00% | |
Harsco Corporation 144A | | | 5.75 | | | | 7-31-2027 | | | | 20,000 | | | | 19,700 | |
| | | | | | | | | | | | | | | | |
|
| Trading Companies & Distributors: 0.13% | |
Fortress Transportation & Infrastructure Investors LLC 144A | | | 6.50 | | | | 10-1-2025 | | | | 1,500,000 | | | | 1,571,250 | |
| | | | | | | | | | | | | | | | |
|
| Transportation Infrastructure: 0.54% | |
Toll Road Investors Partnership II LP 144A¤ | | | 0.00 | | | | 2-15-2027 | | | | 1,050,000 | | | | 796,004 | |
Toll Road Investors Partnership II LP 144A¤ | | | 0.00 | | | | 2-15-2026 | | | | 5,630,000 | | | | 4,594,188 | |
Toll Road Investors Partnership II LP 144A¤ | | | 0.00 | | | | 2-15-2028 | | | | 1,150,000 | | | | 836,863 | |
| | | | |
| | | | | | | | | | | | | | | 6,227,055 | |
| | | | | | | | | | | | | | | | |
|
Information Technology: 1.74% | |
|
| Communications Equipment: 0.19% | |
Motorola Solutions Incorporated | | | 4.60 | | | | 2-23-2028 | | | | 2,000,000 | | | | 2,258,665 | |
| | | | | | | | | | | | | | | | |
12 | Wells Fargo Core Plus Bond Fund
Portfolio of investments—February 29, 2020 (unaudited)
| | | | | | | | | | | | | | | | |
| | | Interest
rate | | | Maturity
date | | | Principal | | | Value | |
|
| Electronic Equipment, Instruments & Components: 0.32% | |
Arrow Electronics Incorporated | | | 3.88 | % | | | 1-12-2028 | | | $ | 1,000,000 | | | $ | 1,055,015 | |
Corning Incorporated | | | 3.90 | | | | 11-15-2049 | | | | 2,500,000 | | | | 2,639,202 | |
| | | | |
| | | | | | | | | | | | | | | 3,694,217 | |
| | | | | | | | | | | | | | | | |
|
| Semiconductors & Semiconductor Equipment: 0.46% | |
Broadcom Corporation | | | 3.88 | | | | 1-15-2027 | | | | 1,500,000 | | | | 1,573,058 | |
Qualcomm Incorporated | | | 3.00 | | | | 5-20-2022 | | | | 3,700,000 | | | | 3,833,567 | |
| | | | |
| | | | | | | | | | | | | | | 5,406,625 | |
| | | | | | | | | | | | | | | | |
|
| Software: 0.40% | |
Citrix Systems Incorporated | | | 3.30 | | | | 3-1-2030 | | | | 2,425,000 | | | | 2,438,568 | |
Symantec Corporation | | | 4.20 | | | | 9-15-2020 | | | | 2,145,000 | | | | 2,154,657 | |
| | | | |
| | | | | | | | | | | | | | | 4,593,225 | |
| | | | | | | | | | | | | | | | |
|
| Technology Hardware, Storage & Peripherals: 0.37% | |
Apple Incorporated | | | 2.95 | | | | 9-11-2049 | | | | 1,270,000 | | | | 1,334,431 | |
Apple Incorporated | | | 4.65 | | | | 2-23-2046 | | | | 990,000 | | | | 1,316,809 | |
Diamond 1 Finance Corporation 144A | | | 8.35 | | | | 7-15-2046 | | | | 1,175,000 | | | | 1,596,480 | |
| | | | |
| | | | | | | | | | | | | | | 4,247,720 | |
| | | | | | | | | | | | | | | | |
|
Materials: 0.37% | |
|
| Containers & Packaging: 0.37% | |
Flex Acquisition Company Incorporated 144A | | | 6.88 | | | | 1-15-2025 | | | | 1,000,000 | | | | 972,520 | |
WRKCo Incorporated | | | 3.90 | | | | 6-1-2028 | | | | 3,000,000 | | | | 3,304,157 | |
| | | | |
| | | | | | | | | | | | | | | 4,276,677 | |
| | | | | | | | | | | | | | | | |
|
Real Estate: 1.61% | |
|
| Equity REITs: 1.61% | |
Federal Realty Investment Trust | | | 3.63 | | | | 8-1-2046 | | | | 915,000 | | | | 974,701 | |
Highwoods Realty LP | | | 3.05 | | | | 2-15-2030 | | | | 4,420,000 | | | | 4,602,830 | |
Omega Healthcare Investors Incorporated | | | 4.50 | | | | 1-15-2025 | | | | 2,130,000 | | | | 2,321,798 | |
Omega Healthcare Investors Incorporated | | | 5.25 | | | | 1-15-2026 | | | | 1,700,000 | | | | 1,951,138 | |
Sabra Health Care LP / Sabra Capital Corporation | | | 4.80 | | | | 6-1-2024 | | | | 2,000,000 | | | | 2,162,820 | |
Tanger Properties LP | | | 3.75 | | | | 12-1-2024 | | | | 1,600,000 | | | | 1,689,160 | |
Welltower Incorporated | | | 4.25 | | | | 4-1-2026 | | | | 4,465,000 | | | | 5,022,295 | |
| | | | |
| | | | | | | | | | | | | | | 18,724,742 | |
| | | | | | | | | | | | | | | | |
|
Utilities: 0.80% | |
|
| Electric Utilities: 0.80% | |
Basin Electric Power Cooperative 144A | | | 4.75 | | | | 4-26-2047 | | | | 1,315,000 | | | | 1,612,139 | |
Firstenergy Corporation | | | 2.05 | | | | 3-1-2025 | | | | 5,590,000 | | | | 5,667,854 | |
ITC Holdings Corporation | | | 2.70 | | | | 11-15-2022 | | | | 673,000 | | | | 694,161 | |
Oglethorpe Power Corporation | | | 5.05 | | | | 10-1-2048 | | | | 1,060,000 | | | | 1,345,859 | |
| | | | |
| | | | | | | | | | | | | | | 9,320,013 | |
| | | | | | | | | | | | | | | | |
| |
Total Corporate Bonds and Notes (Cost $249,353,172) | | | | 258,062,452 | |
| | | | | | | | | | | | | | | | |
Wells Fargo Core Plus Bond Fund | 13
Portfolio of investments—February 29, 2020 (unaudited)
| | | | | | | | | | | | | | | | |
| | | Interest
rate | | | Maturity
date | | | Principal | | | Value | |
Foreign Corporate Bonds and Notes: 2.63% | |
|
Consumer Discretionary: 0.28% | |
|
| Auto Components: 0.10% | |
HP Pelzer Holding GmbH 144A | | | 4.13 | % | | | 4-1-2024 | | | EUR | 1,200,000 | | | $ | 1,152,524 | |
| | | | | | | | | | | | | | | | |
|
| Automobiles: 0.18% | |
Peugeot SA Company | | | 2.00 | | | | 3-20-2025 | | | EUR | 1,800,000 | | | | 2,107,509 | |
| | | | | | | | | | | | | | | | |
|
Consumer Staples: 0.69% | |
|
| Food & Staples Retailing: 0.15% | |
Tasty Bondco 1 SA 144A | | | 6.25 | | | | 5-15-2026 | | | EUR | 1,600,000 | | | | 1,726,578 | |
| | | | | | | | | | | | | | | | |
|
| Food Products: 0.38% | |
Danone SA (5 Year EUR Swap +1.43%)± | | | 1.75 | | | | 12-31-2099 | | | EUR | 2,600,000 | | | | 2,884,622 | |
Sigma Holdings Company BV 144A« | | | 5.75 | | | | 5-15-2026 | | | EUR | 1,500,000 | | | | 1,540,838 | |
| | | | |
| | | | | | | | | | | | | | | 4,425,460 | |
| | | | | | | | | | | | | | | | |
|
| Household Products: 0.16% | |
Energizer Gamma Acquisition BV 144A | | | 4.63 | | | | 7-15-2026 | | | EUR | 1,600,000 | | | | 1,832,557 | |
| | | | | | | | | | | | | | | | |
|
Energy: 0.63% | |
|
| Oil, Gas & Consumable Fuels: 0.63% | |
Eni SpA | | | 1.13 | | | | 9-19-2028 | | | EUR | 3,200,000 | | | | 3,786,856 | |
Petroleos Mexicanos | | | 3.75 | | | | 2-21-2024 | | | EUR | 1,000,000 | | | | 1,157,509 | |
Total SA (5 Year EUR Swap +3.78%)± | | | 3.88 | | | | 12-29-2049 | | | EUR | 2,000,000 | | | | 2,349,096 | |
| | | | |
| | | | | | | | | | | | | | | 7,293,461 | |
| | | | | | | | | | | | | | | | |
|
Financials: 0.48% | |
|
| Banks: 0.31% | |
Bankia SA (5 Year EUR Swap +5.82%)± | | | 6.00 | | | | 12-31-2099 | | | EUR | 1,200,000 | | | | 1,364,800 | |
Caixa Geral de Depositos SA (5 Year EUR Swap +10.93%)± | | | 10.75 | | | | 12-31-2099 | | | EUR | 1,800,000 | | | | 2,293,050 | |
| | | | |
| | | | | | | | | | | | | | | 3,657,850 | |
| | | | | | | | | | | | | | | | |
|
| Diversified Financial Services: 0.17% | |
LKQ European Holdings BV Company 144A | | | 3.63 | | | | 4-1-2026 | | | EUR | 1,800,000 | | | | 1,996,843 | |
| | | | | | | | | | | | | | | | |
|
Industrials: 0.25% | |
|
| Commercial Services & Supplies: 0.10% | |
Paprec Holding SA 144A | | | 4.00 | | | | 3-31-2025 | | | EUR | 1,200,000 | | | | 1,199,950 | |
| | | | | | | | | | | | | | | | |
|
| Road & Rail: 0.15% | |
Europcar Groupe SA 144A | | | 4.13 | | | | 11-15-2024 | | | EUR | 1,800,000 | | | | 1,756,804 | |
| | | | | | | | | | | | | | | | |
|
Real Estate: 0.30% | |
|
| Real Estate Management & Development: 0.30% | |
Akelius Residential Property AB (EUR ICE Swap +3.49%)± | | | 3.88 | | | | 10-5-2078 | | | EUR | 2,500,000 | | | | 2,884,070 | |
ATF Netherlands BV | | | 1.50 | | | | 7-15-2024 | | | EUR | 500,000 | | | | 579,678 | |
| | | | |
| | | | | | | | | | | | | | | 3,463,748 | |
| | | | | | | | | | | | | | | | |
| |
Total Foreign Corporate Bonds and Notes (Cost $32,100,991) | | | | 30,613,284 | |
| | | | | | | | | | | | | | | | |
|
| Foreign Government Bonds: 1.99% | |
Bonos y Obligaciones del Estado 144A | | | 0.25 | | | | 7-30-2024 | | | EUR | 8,850,000 | | | | 9,958,589 | |
14 | Wells Fargo Core Plus Bond Fund
Portfolio of investments—February 29, 2020 (unaudited)
| | | | | | | | | | | | | | | | |
| | | Interest
rate | | | Maturity
date | | | Principal | | | Value | |
|
| Foreign Government Bonds (continued) | |
Brazil | | | 10.00 | % | | | 1-1-2025 | | | BRL | 8,600,000 | | | $ | 2,219,363 | |
Italy Buoni Poliennali del Tesoro | | | 0.05 | | | | 4-15-2021 | | | EUR | 3,500,000 | | | | 3,870,031 | |
Nota do Tesouro Nacional Notes | | | 10.00 | | | | 1-1-2029 | | | BRL | 8,000,000 | | | | 2,155,319 | |
Spain | | | 0.75 | | | | 7-30-2021 | | | EUR | 4,430,000 | | | | 4,974,655 | |
| |
Total Foreign Government Bonds (Cost $23,903,996) | | | | 23,177,957 | |
| | | | | | | | | | | | | | | | |
|
Loans: 0.33% | |
|
Communication Services: 0.23% | |
|
| Media: 0.23% | |
Ancestry.com Incorporated (1 Month LIBOR +3.75%)±‡ | | | 5.36 | | | | 10-19-2023 | | | $ | 1,209,533 | | | | 1,112,771 | |
Diamond Sports Group LLC (1 Month LIBOR +3.25%)± | | | 4.88 | | | | 8-24-2026 | | | | 1,695,750 | | | | 1,543,133 | |
| | | | |
| | | | | | | | | | | | | | | 2,655,904 | |
| | | | | | | | | | | | | | | | |
|
Health Care: 0.10% | |
|
| Health Care Providers & Services: 0.10% | |
Surgery Center Holdings Incorporated (1 Month LIBOR +3.25%)± | | | 4.86 | | | | 9-2-2024 | | | | 1,221,875 | | | | 1,179,109 | |
| | | | | | | | | | | | | | | | |
| |
Total Loans (Cost $4,137,373) | | | | 3,835,013 | |
| | | | | | | | | | | | | | | | |
|
Municipal Obligations: 1.79% | |
|
California: 0.33% | |
|
| Airport Revenue: 0.18% | |
San Jose CA Series B (AGM Insured) | | | 6.60 | | | | 3-1-2041 | | | | 2,000,000 | | | | 2,097,780 | |
| | | | | | | | | | | | | | | | |
|
| Transportation Revenue: 0.15% | |
Alameda CA Corridor Transportation Authority CAB Refunding Bond Subordinated Series B (Ambac Insured) ¤ | | | 0.00 | | | | 10-1-2028 | | | | 2,115,000 | | | | 1,704,986 | |
| | | | | | | | | | | | | | | | |
| | | | |
| | | | | | | | | | | | | | | 3,802,766 | |
| | | | | | | | | | | | | | | | |
|
Illinois: 0.98% | |
|
| GO Revenue: 0.66% | |
Cook County IL Series B (BAM Insured) | | | 6.36 | | | | 11-15-2033 | | | | 1,745,000 | | | | 2,524,404 | |
Illinois Taxable Pension « | | | 5.10 | | | | 6-1-2033 | | | | 3,040,000 | | | | 3,556,800 | |
Will County ILLincoln-Way Community High School District #210 Unrefunded CAB (AGM Insured) ¤ | | | 0.00 | | | | 1-1-2025 | | | | 1,820,000 | | | | 1,664,991 | |
| | | | |
| | | | | | | | | | | | | | | 7,746,195 | |
| | | | | | | | | | | | | | | | |
|
| Tax Revenue: 0.32% | |
Chicago IL Transit Authority Taxable Pension Funding Series A | | | 6.90 | | | | 12-1-2040 | | | | 1,075,000 | | | | 1,573,736 | |
Metropolitan Pier & Exposition Authority Illinois CAB McCormick Place Expansion Project Series2010-B1 (AGM Insured) ¤ | | | 0.00 | | | | 6-15-2026 | | | | 1,975,000 | | | | 1,804,044 | |
Metropolitan Pier & Exposition Authority Illinois CAB McCormick Place Expansion Project Series2012-B ¤ | | | 0.00 | | | | 12-15-2051 | | | | 765,000 | | | | 295,772 | |
| | | | |
| | | | | | | | | | | | | | | 3,673,552 | |
| | | | | | | | | | | | | | | | |
| | | | |
| | | | | | | | | | | | | | | 11,419,747 | |
| | | | | | | | | | | | | | | | |
|
Maryland: 0.08% | |
|
| Education Revenue: 0.08% | |
Maryland Health & HEFAR Green Street Academy Series B 144A | | | 6.75 | | | | 7-1-2023 | | | | 975,000 | | | | 987,149 | |
| | | | | | | | | | | | | | | | |
Wells Fargo Core Plus Bond Fund | 15
Portfolio of investments—February 29, 2020 (unaudited)
| | | | | | | | | | | | | | | | |
| | | Interest
rate | | | Maturity
date | | | Principal | | | Value | |
Michigan: 0.12% | |
|
| Miscellaneous Revenue: 0.12% | |
Michigan Finance Authority Local Government Loan Program Project Series E | | | 7.19 | % | | | 11-1-2022 | | | $ | 1,235,000 | | | $ | 1,344,816 | |
| | | | | | | | | | | | | | | | |
| | | | |
Pennsylvania: 0.28% | | | | | | | | | | | | | | | | |
| | | | |
| Health Revenue: 0.07% | | | | | | | | | | | | |
Quakertown PA General Authority USDA Loan Anticipation NotesSeries 2017-B | | | 3.80 | | | | 7-1-2021 | | | | 900,000 | | | | 900,288 | |
| | | | | | | | | | | | | | | | |
|
| Miscellaneous Revenue: 0.21% | |
Commonwealth of Pennsylvania Financing Authority Series A | | | 4.14 | | | | 6-1-2038 | | | | 1,995,000 | | | | 2,414,708 | |
| | | | | | | | | | | | | | | | |
| | | | |
| | | | | | | | | | | | | | | 3,314,996 | |
| | | | | | | | | | | | | | | | |
| |
Total Municipal Obligations (Cost $17,577,554) | | | | 20,869,474 | |
| | | | | | | | | | | | | | | | |
|
| Non-Agency Mortgage-Backed Securities: 19.05% | |
Agate Bay Mortgage Loan Trust Series2015-3 Class B3 144A±± | | | 3.62 | | | | 4-25-2045 | | | | 2,106,257 | | | | 2,179,338 | |
ALM Loan Funding Series2015-16A Class AAR2 (3 Month LIBOR +0.90%) 144A± | | | 2.73 | | | | 7-15-2027 | | | | 1,850,000 | | | | 1,850,339 | |
American Money Management Corporation Series2015-16A Class AR (3 Month LIBOR +1.26%) 144A± | | | 3.10 | | | | 4-14-2029 | | | | 3,000,000 | | | | 3,000,336 | |
American Money Management Corporation Series2016-19A Class AR (3 Month LIBOR +1.14%) 144A± | | | 2.97 | | | | 10-16-2028 | | | | 2,750,000 | | | | 2,750,176 | |
Angel Oak Mortgage Trust I LLC Series2019-3 Class A1 144A±± | | | 2.93 | | | | 5-25-2059 | | | | 1,074,509 | | | | 1,081,801 | |
Banc of America Funding Corporation Series2016-R1 Class A1 144A±± | | | 2.50 | | | | 3-25-2040 | | | | 517,540 | | | | 521,242 | |
BDS Limited Series2018-FL2 Class A (1 Month LIBOR +0.95%) 144A± | | | 2.61 | | | | 8-15-2035 | | | | 1,326,686 | | | | 1,325,030 | |
Benefit Street Partners CLO Limited Series2014-IVA Class A1RR (3 Month LIBOR +1.25%) 144A± | | | 3.07 | | | | 1-20-2029 | | | | 1,000,000 | | | | 1,000,375 | |
Benefit Street Partners CLO Limited Series2016-10A Class A1R (3 Month LIBOR +1.14%) 144A± | | | 2.97 | | | | 1-15-2029 | | | | 3,500,000 | | | | 3,502,828 | |
BlueMountain CLO Limited Series2012-2A Class AR2 (3 Month LIBOR +1.05%) 144A± | | | 2.74 | | | | 11-20-2028 | | | | 935,000 | | | | 935,229 | |
BlueMountain CLO Limited Series2013-1A Class A1R2 (3 Month LIBOR +1.23%) 144A± | | | 3.05 | | | | 1-20-2029 | | | | 1,935,000 | | | | 1,935,726 | |
Bunker Hill Loan Depositary Trust Series2019-3 Class A1 144A | | | 2.72 | | | | 11-25-2059 | | | | 3,698,321 | | | | 3,737,221 | |
BX Trust Series 2019-OC11 Class A 144A | | | 3.20 | | | | 12-9-2041 | | | | 4,975,000 | | | | 5,446,205 | |
Cascade Funding Mortgage Trust Series 2018- RM2 Class A 144A±± | | | 4.00 | | | | 10-25-2068 | | | | 526,920 | | | | 550,118 | |
CD Commercial Mortgage Trust Series2017-6 Class A5 | | | 3.46 | | | | 11-13-2050 | | | | 1,035,000 | | | | 1,147,040 | |
CIFC Funding Limited Series2012-2RA Class A1 (3 Month LIBOR +0.80%) 144A± | | | 2.62 | | | | 1-20-2028 | | | | 2,525,000 | | | | 2,525,045 | |
Citigroup Commercial Mortgage Trust 2017-MDRA Class A 144A | | | 3.66 | | | | 7-10-2030 | | | | 2,000,000 | | | | 2,062,848 | |
CNH Equipment Trust Series2019-A Class A2 | | | 2.96 | | | | 5-16-2022 | | | | 2,505,423 | | | | 2,521,533 | |
Colt Funding LLC Series2018-3 Class A1 144A±± | | | 3.69 | | | | 10-26-2048 | | | | 1,361,360 | | | | 1,367,583 | |
Colt Funding LLC Series2019-1 Class A1 144A±± | | | 3.71 | | | | 3-25-2049 | | | | 1,534,412 | | | | 1,561,686 | |
Commercial Mortgage Trust Series 2014-CR15 Class A2 | | | 2.93 | | | | 2-10-2047 | | | | 295,009 | | | | 295,388 | |
Credit Suisse Mortgage Trust Series 2013 Class B4 144A±± | | | 3.42 | | | | 4-25-2043 | | | | 4,122,101 | | | | 4,211,780 | |
Credit Suisse Mortgage Trust Series 2018 Class A1 144A±± | | | 4.13 | | | | 7-25-2058 | | | | 1,614,535 | | | | 1,628,350 | |
Crown Point Limited Series2015-3A Class A1AR (3 Month LIBOR +0.91%) 144A± | | | 2.74 | | | | 12-31-2027 | | | | 1,969,190 | | | | 1,969,731 | |
Crown Point Limited Series2018-6A Class A1 (3 Month LIBOR +1.17%) 144A± | | | 2.99 | | | | 10-20-2028 | | | | 3,500,000 | | | | 3,500,406 | |
CSAIL Commercial Mortgage Trust Series2015-C4 Class A1 | | | 2.01 | | | | 11-15-2048 | | | | 75,548 | | | | 75,490 | |
CSMLT Trust Series2015-1 Class B4 144A±± | | | 3.88 | | | | 5-25-2045 | | | | 4,686,162 | | | | 4,875,119 | |
Deephaven Residential Mortgage Series2019-2A Class A1 144A±± | | | 3.56 | | | | 4-25-2059 | | | | 1,950,218 | | | | 1,971,218 | |
Deephaven Residential Mortgage Series2019-4A Class A1 144A±± | | | 2.79 | | | | 10-25-2059 | | | | 2,846,381 | | | | 2,863,618 | |
DLL Securitization Trust Series2019-MT3 Class A1 144A | | | 2.06 | | | | 10-20-2020 | | | | 3,916,039 | | | | 3,920,335 | |
Dryden Senior Loan Fund Series2013-28A Class A2LR (3 Month LIBOR +1.65%) 144A± | | | 3.34 | | | | 8-15-2030 | | | | 4,000,000 | | | | 4,000,652 | |
16 | Wells Fargo Core Plus Bond Fund
Portfolio of investments—February 29, 2020 (unaudited)
| | | | | | | | | | | | | | | | |
| | | Interest
rate | | | Maturity
date | | | Principal | | | Value | |
|
| Non-Agency Mortgage-Backed Securities (continued) | |
Financial Asset Securitization Incorporated Series 1997-NAM2 Class B2 † | | | 8.00 | % | | | 7-25-2027 | | | $ | 17,926 | | | $ | 931 | |
FirstKey Mortgage Trust Series2014-1 Class A2 144A±± | | | 3.00 | | | | 11-25-2044 | | | | 193,659 | | | | 193,308 | |
GCAT Series 2019-NQM1 Class A1 144A | | | 2.99 | | | | 2-25-2059 | | | | 3,280,188 | | | | 3,313,536 | |
GCAT Series 2019-NQM2 Class A1 144A | | | 2.86 | | | | 9-25-2059 | | | | 4,342,547 | | | | 4,388,452 | |
GCAT Series 2019-RPl1 Class A1 144A±± | | | 2.65 | | | | 10-25-2068 | | | | 4,654,188 | | | | 4,719,086 | |
Gilbert Park CLO Series2017-1A Class B (3 Month LIBOR +1.60%) 144A± | | | 3.43 | | | | 10-15-2030 | | | | 3,000,000 | | | | 3,000,060 | |
Great Wolf Trust Series 2019-WOLF Class A (1 Month LIBOR +1.03%) 144A± | | | 2.69 | | | | 12-15-2036 | | | | 2,350,000 | | | | 2,350,004 | |
Goldman Sachs Mortgage Securities Trust Series 2019-GSA1 Class C±± | | | 3.81 | | | | 11-10-2052 | | | | 500,000 | | | | 534,233 | |
Goldman Sachs Mortgage Securities Trust Series 2019- PJ1 Class A6 144A±± | | | 4.00 | | | | 8-25-2049 | | | | 691,359 | | | | 699,073 | |
Homeward Opportunities Fund I Trust Series2019-1 Class A1 144A±± | | | 3.45 | | | | 1-25-2059 | | | | 1,915,764 | | | | 1,937,099 | |
Hospitality Mortgage Trust Series 2019 Class A (1 Month LIBOR +1.00%) 144A± | | | 2.66 | | | | 11-15-2036 | | | | 2,718,220 | | | | 2,714,954 | |
JPMorgan Mortgage Trust Series2014-2 Class B4 144A±± | | | 3.40 | | | | 6-25-2029 | | | | 1,215,000 | | | | 1,265,679 | |
JPMorgan Mortgage Trust Series2020-1 Class A15 144A±± | | | 3.50 | | | | 6-25-2050 | | | | 5,560,973 | | | | 5,691,172 | |
JPMorgan Chase Commercial Mortgage Securities Trust Series2012-C8 Class ASB | | | 2.38 | | | | 10-15-2045 | | | | 2,070,793 | | | | 2,099,092 | |
JPMorgan Chase Commercial Mortgage Securities Trust Series2019-MFP Class A (1 Month LIBOR +0.96%) 144A± | | | 2.62 | | | | 7-15-2036 | | | | 5,000,000 | | | | 4,999,995 | |
Lendmark Funding Trust Series2018-1A Class A 144A | | | 3.81 | | | | 12-21-2026 | | | | 2,685,000 | | | | 2,755,504 | |
Lendmark Funding Trust Series2018-2A Class A 144A | | | 4.23 | | | | 4-20-2027 | | | | 600,000 | | | | 627,106 | |
LoanCore Limited Series 2018-CRE1 Class A (1 Month LIBOR +1.13%) 144A± | | | 2.79 | | | | 5-15-2028 | | | | 3,000,000 | | | | 3,002,814 | |
Mach One Trust Commercial Mortgage Backed Series2004-1 Class X 144A ±±(c) | | | 0.78 | | | | 5-28-2040 | | | | 62,017 | | | | 0 | |
Mello Warehouse Securitization Series2019-1 Class A (1 Month LIBOR +0.80%) 144A± | | | 2.43 | | | | 6-25-2052 | | | | 3,115,000 | | | | 3,117,080 | |
Metlife Securitization Trust2019-1A Class A1A 144A±± | | | 3.75 | | | | 4-25-2058 | | | | 2,417,373 | | | | 2,548,267 | |
Mill City Mortgage Trust Series 2019 Class M2 144A±± | | | 3.25 | | | | 7-25-2059 | | | | 4,592,000 | | | | 4,756,362 | |
Morgan Stanley Bank of America Merrill Lynch Trust Series2016-C30 Class B ±± | | | 3.31 | | | | 9-15-2049 | | | | 610,000 | | | | 639,996 | |
Morgan Stanley Capital I Series2004-RR2 Class X 144A±±(c) | | | 0.35 | | | | 10-28-2033 | | | | 3,349 | | | | 12 | |
Neuberger Berman Limited Series2015-20A Class AR (3 Month LIBOR +0.80%) 144A± | | | 2.63 | | | | 1-15-2028 | | | | 1,575,000 | | | | 1,575,187 | |
New Residential Mortgage Loan Trust Series 2018-NQM1 Class A1 144A±± | | | 3.99 | | | | 11-25-2048 | | | | 2,068,789 | | | | 2,105,984 | |
New Residential Mortgage Loan Trust Series 2019-RPL3 Class M1 144A±± | | | 3.25 | | | | 7-25-2059 | | | | 5,000,000 | | | | 5,177,146 | |
Octagon Investment Partners Series2017-1A Class B1 (3 Month LIBOR +1.70%) 144A± | | | 3.52 | | | | 7-20-2030 | | | | 1,000,000 | | | | 1,000,053 | |
Ondeck Asset Securitization Trust LLC Series2018-1A Class A 144A | | | 3.50 | | | | 4-18-2022 | | | | 5,020,000 | | | | 5,035,789 | |
Onslow Bay Financial LLC Series 2020 Class A21 144A±± | | | 3.50 | | | | 12-25-2049 | | | | 4,347,209 | | | | 4,459,967 | |
OZLM Funding Limited Series2014-8A Class A2RR (3 Month LIBOR +1.80%) 144A± | | | 3.64 | | | | 10-17-2029 | | | | 5,400,000 | | | | 5,380,771 | |
Palmer Square Loan Funding Limited Series2019-2A Class A1 (3 Month LIBOR +0.97%) 144A± | | | 2.79 | | | | 4-20-2027 | | | | 2,586,103 | | | | 2,586,931 | |
Residential Mortgage Loan Trust Series2020-1 Class M1 144A±± | | | 3.24 | | | | 2-25-2024 | | | | 5,000,000 | | | | 5,074,920 | |
Shellpoint Company Originator Trust Series2016-1 Class B2 144A±± | | | 3.62 | | | | 11-25-2046 | | | | 6,089,664 | | | | 6,401,493 | |
Sound Point CLO Limited Series2013-2RA Class A1 (3 Month LIBOR +0.95%) 144A± | | | 2.78 | | | | 4-15-2029 | | | | 2,825,000 | | | | 2,798,007 | |
Starwood Mortgage Residential Trust Series2019-1 Class A1 144A±± | | | 2.94 | | | | 6-25-2049 | | | | 2,831,384 | | | | 2,864,401 | |
Starwood Mortgage Residential Trust Series 2019-INV1 Class A1 144A±± | | | 2.61 | | | | 9-27-2049 | | | | 3,225,687 | | | | 3,234,024 | |
TCW CLO2017-1 Limited Series2017-1A Class BR (3 Month LIBOR +1.55%) 144A%%± | | | 3.30 | | | | 7-29-2029 | | | | 5,545,000 | | | | 5,536,677 | |
TCW CLO2019-1 AMR Limited Series2019-1A Class A (3 Month LIBOR +1.44%) 144A± | | | 3.13 | | | | 2-15-2029 | | | | 4,210,000 | | | | 4,213,153 | |
Towd Point Mortgage Trust Series2015-1 Class A3 144A±± | | | 3.25 | | | | 10-25-2053 | | | | 5,000,000 | | | | 5,133,518 | |
Towd Point Mortgage Trust Series2015-4 Class A2 144A±± | | | 3.75 | | | | 4-25-2055 | | | | 2,675,000 | | | | 2,773,421 | |
Towd Point Mortgage Trust Series2017-4 Class A1 144A±± | | | 2.75 | | | | 6-25-2057 | | | | 2,357,508 | | | | 2,415,140 | |
Towd Point Mortgage Trust Series 2019- MH1 Class A1 144A±± | | | 3.00 | | | | 11-25-2058 | | | | 1,986,684 | | | | 2,016,107 | |
Wells Fargo Core Plus Bond Fund | 17
Portfolio of investments—February 29, 2020 (unaudited)
| | | | | | | | | | | | | | | | |
| | | Interest
rate | | | Maturity
date | | | Principal | | | Value | |
|
| Non-Agency Mortgage-Backed Securities (continued) | |
Towd Point Mortgage Trust Series2019-4 Class M1 144A±± | | | 3.50 | % | | | 10-25-2059 | | | $ | 4,000,000 | | | $ | 4,260,032 | |
Towd Point Mortgage Trust Series2019-SJ3 Class A1 144A±± | | | 3.00 | | | | 11-25-2059 | | | | 4,602,415 | | | | 4,635,908 | |
UBS Commercial Mortgage Trust Series2017-C5 Class A5 | | | 3.47 | | | | 11-15-2050 | | | | 1,140,000 | | | | 1,263,914 | |
UBS Commercial Mortgage Trust Series 2018-NYCH Class A (1 Month LIBOR +0.85%) 144A± | | | 2.51 | | | | 2-15-2032 | | | | 2,930,000 | | | | 2,923,609 | |
Venture Limited Series 2018 Class 35A 144A | | | 4.40 | | | | 10-22-2031 | | | | 2,000,000 | | | | 2,023,510 | |
Verus Securitization Trust Series2019-1 Class A1 144A±± | | | 3.40 | | | | 12-25-2059 | | | | 1,994,300 | | | | 2,015,948 | |
Verus Securitization Trust Series2019-2 Class A1 144A±± | | | 3.21 | | | | 5-25-2059 | | | | 3,692,321 | | | | 3,731,085 | |
Voya CLO Limited Series2015-2A Class AR (3 Month LIBOR +0.97%) 144A± | | | 2.78 | | | | 7-23-2027 | | | | 2,900,000 | | | | 2,900,142 | |
West CLO Limited Series2014-2A Class A1 (3 Month LIBOR +0.87%) 144A± | | | 2.71 | | | | 1-16-2027 | | | | 1,423,776 | | | | 1,423,212 | |
Whitehorse Limited Series2014-1A Class AR (3 Month LIBOR +0.90%) 144A ± | | | 2.66 | | | | 5-1-2026 | | | | 1,025,202 | | | | 1,025,594 | |
| |
TotalNon-Agency Mortgage-Backed Securities (Cost $219,663,869) | | | | 221,653,244 | |
| | | | | | | | | | | | | | | | |
|
| U.S. Treasury Securities: 7.20% | |
TIPS | | | 1.38 | | | | 2-15-2044 | | | | 3,098,334 | | | | 4,011,402 | |
U.S. Treasury Bond | | | 1.50 | | | | 2-15-2030 | | | | 1,100,000 | | | | 1,137,469 | |
U.S. Treasury Bond ¤ | | | 0.00 | | | | 11-15-2027 | | | | 1,795,000 | | | | 1,643,122 | |
U.S. Treasury Bond | | | 0.13 | | | | 1-15-2030 | | | | 11,895,708 | | | | 12,370,414 | |
U.S. Treasury Bond | | | 2.00 | | | | 2-15-2050 | | | | 5,015,000 | | | | 5,415,021 | |
U.S. Treasury Bond | | | 2.25 | | | | 8-15-2049 | | | | 600,000 | | | | 682,008 | |
U.S. Treasury Bond | | | 2.38 | | | | 11-15-2049 | | | | 3,745,000 | | | | 4,371,556 | |
U.S. Treasury Bond | | | 2.88 | | | | 8-15-2045 | | | | 2,495,000 | | | | 3,115,631 | |
U.S. Treasury Bond | | | 3.00 | | | | 11-15-2044 | | | | 7,545,000 | | | | 9,583,918 | |
U.S. Treasury Bond | | | 3.00 | | | | 5-15-2045 | | | | 8,145,000 | | | | 10,373,739 | |
U.S. Treasury Bond | | | 3.00 | | | | 2-15-2047 | | | | 5,555,000 | | | | 7,167,686 | |
U.S. Treasury Bond | | | 4.25 | | | | 11-15-2040 | | | | 4,560,000 | | | | 6,771,778 | |
U.S. Treasury Note | | | 1.75 | | | | 11-15-2029 | | | | 16,265,000 | | | | 17,173,553 | |
| |
Total U.S. Treasury Securities (Cost $77,794,492) | | | | 83,817,297 | |
| | | | | | | | | | | | | | | | |
|
Yankee Corporate Bonds and Notes: 10.41% | |
|
Communication Services: 0.66% | |
|
| Diversified Telecommunication Services: 0.16% | |
Telefonica Emisiones SAU | | | 5.21 | | | | 3-8-2047 | | | | 1,485,000 | | | | 1,823,694 | |
| | | | | | | | | | | | | | | | |
|
| Interactive Media & Services: 0.29% | |
Tencent Holdings Limited 144A | | | 3.98 | | | | 4-11-2029 | | | | 3,000,000 | | | | 3,399,885 | |
| | | | | | | | | | | | | | | | |
|
| Wireless Telecommunication Services: 0.21% | |
Vodafone Group plc | | | 4.25 | | | | 9-17-2050 | | | | 2,270,000 | | | | 2,511,063 | |
| | | | | | | | | | | | | | | | |
|
Consumer Discretionary: 0.43% | |
|
| Automobiles: 0.43% | |
Fiat Chrysler Automobiles NV | | | 4.50 | | | | 4-15-2020 | | | | 4,945,000 | | | | 4,950,538 | |
| | | | | | | | | | | | | | | | |
|
Consumer Staples: 0.65% | |
|
| Beverages: 0.28% | |
Fomento Economico SA | | | 3.50 | | | | 1-16-2050 | | | | 3,080,000 | | | | 3,254,706 | |
| | | | | | | | | | | | | | | | |
|
| Tobacco: 0.37% | |
Imperial Brands Finance plc 144A | | | 3.50 | | | | 7-26-2026 | | | | 4,055,000 | | | | 4,256,139 | |
| | | | | | | | | | | | | | | | |
|
Energy: 0.91% | |
|
| Energy Equipment & Services: 0.04% | |
Valaris plc | | | 5.75 | | | | 10-1-2044 | | | | 1,500,000 | | | | 458,445 | |
| | | | | | | | | | | | | | | | |
18 | Wells Fargo Core Plus Bond Fund
Portfolio of investments—February 29, 2020 (unaudited)
| | | | | | | | | | | | | | | | |
| | | Interest
rate | | | Maturity
date | | | Principal | | | Value | |
|
| Oil, Gas & Consumable Fuels: 0.87% | |
Aker BP ASA 144A | | | 3.00 | % | | | 1-15-2025 | | | $ | 3,500,000 | | | $ | 3,543,944 | |
Baytex Energy Corporation 144A | | | 5.63 | | | | 6-1-2024 | | | | 2,000,000 | | | | 1,800,000 | |
Comision Federal de Electricidad 144A | | | 4.75 | | | | 2-23-2027 | | | | 1,140,000 | | | | 1,231,211 | |
EnCana Corporation | | | 6.50 | | | | 2-1-2038 | | | | 836,000 | | | | 918,021 | |
Petroleos Mexicanos Company 144A | | | 6.84 | | | | 1-23-2030 | | | | 1,870,000 | | | | 1,954,150 | |
Transocean Incorporated | | | 7.50 | | | | 4-15-2031 | | | | 1,250,000 | | | | 743,750 | |
| | | | |
| | | | | | | | | | | | | | | 10,191,076 | |
| | | | | | | | | | | | | | | | |
|
Financials: 6.63% | |
|
| Banks: 4.17% | |
ABN AMRO Bank NV 144A | | | 4.75 | | | | 7-28-2025 | | | | 1,800,000 | | | | 2,003,381 | |
Banco Bradesco 144A | | | 2.85 | | | | 1-27-2023 | | | | 3,205,000 | | | | 3,189,937 | |
Banco de Bogota SA 144A | | | 4.38 | | | | 8-3-2027 | | | | 1,110,000 | | | | 1,181,884 | |
Banco del Estado de Chile 144A | | | 2.70 | | | | 1-9-2025 | | | | 4,165,000 | | | | 4,210,815 | |
Banco do Brasil SA 144A | | | 4.63 | | | | 1-15-2025 | | | | 1,615,000 | | | | 1,709,881 | |
Banco General SA 144A | | | 4.13 | | | | 8-7-2027 | | | | 1,035,000 | | | | 1,097,411 | |
Banco Internacional del Peru 144A | | | 3.25 | | | | 10-4-2026 | | | | 1,600,000 | | | | 1,620,320 | |
Banco Mercantil del Norte SA (5 Year Treasury Constant Maturity +4.97%) 144A± | | | 6.75 | | | | 12-31-2099 | | | | 1,565,000 | | | | 1,655,003 | |
Banco Safra SA 144A | | | 4.13 | | | | 2-8-2023 | | | | 1,695,000 | | | | 1,733,138 | |
Banco Santander Mexico (5 Year Treasury Constant Maturity +3.00%) 144A± | | | 5.95 | | | | 10-1-2028 | | | | 1,700,000 | | | | 1,838,142 | |
Banco Santander SA | | | 4.25 | | | | 4-11-2027 | | | | 1,600,000 | | | | 1,780,344 | |
Bancolombia SA | | | 3.00 | | | | 1-29-2025 | | | | 5,700,000 | | | | 5,697,150 | |
Banistmo SA 144A | | | 3.65 | | | | 9-19-2022 | | | | 1,160,000 | | | | 1,165,812 | |
Bank of New Zealand 144A | | | 2.00 | | | | 2-21-2025 | | | | 4,000,000 | | | | 4,054,747 | |
Banque Ouest Africaine de Developpement 144A | | | 5.00 | | | | 7-27-2027 | | | | 2,520,000 | | | | 2,731,630 | |
BBVA Bancomer SA 144A | | | 7.25 | | | | 4-22-2020 | | | | 283,000 | | | | 284,064 | |
BPCE SA 144A | | | 5.15 | | | | 7-21-2024 | | | | 1,725,000 | | | | 1,903,512 | |
Danske Bank 144A | | | 5.38 | | | | 1-12-2024 | | | | 1,705,000 | | | | 1,910,994 | |
Deutsche Bank AG (5 Year USD Swap +2.55%)± | | | 4.88 | | | | 12-1-2032 | | | | 1,750,000 | | | | 1,665,948 | |
Itau Unibanco Holding SA 144A | | | 3.25 | | | | 1-24-2025 | | | | 3,510,000 | | | | 3,486,132 | |
Perrigo Finance plc | | | 4.90 | | | | 12-15-2044 | | | | 1,500,000 | | | | 1,614,931 | |
Perrigo Finance Unlimited Company | | | 4.38 | | | | 3-15-2026 | | | | 1,365,000 | | | | 1,488,455 | |
Sumitomo Mitsui Financial Group Incorporated | | | 2.44 | | | | 10-19-2021 | | | | 500,000 | | | | 507,685 | |
| | | | |
| | | | | | | | | | | | | | | 48,531,316 | |
| | | | | | | | | | | | | | | | |
|
| Capital Markets: 0.13% | |
Credit Suisse Group Funding Limited (3 Month LIBOR +1.20%) 144A± | | | 3.00 | | | | 12-14-2023 | | | | 1,485,000 | | | | 1,529,635 | |
| | | | | | | | | | | | | | | | |
|
| Diversified Financial Services: 1.33% | |
AerCap Ireland Limited | | | 2.88 | | | | 8-14-2024 | | | | 3,655,000 | | | | 3,723,250 | |
Banco Nacional de Comercio Exterior SNC 144A | | | 4.38 | | | | 10-14-2025 | | | | 2,350,000 | | | | 2,517,461 | |
Brookfield Finance Incorporated | | | 3.90 | | | | 1-25-2028 | | | | 2,475,000 | | | | 2,741,993 | |
Corporacion Financiera de Desarrollo SA (3 Month LIBOR +5.61%) 144A± | | | 5.25 | | | | 7-15-2029 | | | | 1,185,000 | | | | 1,267,962 | |
UBS Group Funding Switzerland AG 144A | | | 3.49 | | | | 5-23-2023 | | | | 1,165,000 | | | | 1,211,008 | |
UBS Group Funding Switzerland AG (5 Year USD Swap +4.87%)± | | | 7.00 | | | | 12-29-2049 | | | | 1,650,000 | | | | 1,834,394 | |
WPP Finance Limited 2010 | | | 3.75 | | | | 9-19-2024 | | | | 2,054,000 | | | | 2,209,457 | |
| | | | |
| | | | | | | | | | | | | | | 15,505,525 | |
| | | | | | | | | | | | | | | | |
|
| Insurance: 0.77% | |
Fairfax Financials Holdings Limited | | | 4.85 | | | | 4-17-2028 | | | | 2,780,000 | | | | 3,121,474 | |
Sompo International Holdings Limited | | | 7.00 | | | | 7-15-2034 | | | | 1,330,000 | | | | 1,922,694 | |
Wells Fargo Core Plus Bond Fund | 19
Portfolio of investments—February 29, 2020 (unaudited)
| | | | | | | | | | | | | | | | |
| | | Interest
rate | | | Maturity
date | | | Principal | | | Value | |
|
| Insurance (continued) | |
Swiss Re Finance (Luxembourg) SA (5 Year Treasury Constant Maturity +3.58%) 144A± | | | 5.00 | % | | | 4-2-2049 | | | $ | 1,600,000 | | | $ | 1,810,400 | |
Validus Holdings Limited | | | 8.88 | | | | 1-26-2040 | | | | 1,210,000 | | | | 2,078,131 | |
| | | | |
| | | | | | | | | | | | | | | 8,932,699 | |
| | | | | | | | | | | | | | | | |
|
| Thrifts & Mortgage Finance: 0.23% | |
Nationwide Building Society (5 Year USD Swap +1.85%) 144A± | | | 4.13 | | | | 10-18-2032 | | | | 2,500,000 | | | | 2,648,401 | |
| | | | | | | | | | | | | | | | |
|
Health Care: 0.47% | |
|
| Pharmaceuticals: 0.47% | |
Perrigo Finance Unlimited Company | | | 3.50 | | | | 3-15-2021 | | | | 1,305,000 | | | | 1,328,108 | |
Shire Acquisitions Investment Ireland Limited | | | 2.40 | | | | 9-23-2021 | | | | 2,550,000 | | | | 2,582,793 | |
Teva Pharmaceutical Finance BV | | | 2.20 | | | | 7-21-2021 | | | | 1,600,000 | | | | 1,552,160 | |
| | | | |
| | | | | | | | | | | | | | | 5,463,061 | |
| | | | | | | | | | | | | | | | |
|
Industrials: 0.05% | |
|
| Transportation Infrastructure: 0.05% | |
Mexico City Airport Trust 144A | | | 5.50 | | | | 7-31-2047 | | | | 570,000 | | | | 622,013 | |
| | | | | | | | | | | | | | | | |
|
Utilities: 0.61% | |
|
| Electric Utilities: 0.61% | |
Enel Finance International SA 144A | | | 4.63 | | | | 9-14-2025 | | | | 3,635,000 | | | | 4,082,715 | |
Western Power Distributions Holdings Limited 144A | | | 7.38 | | | | 12-15-2028 | | | | 2,265,000 | | | | 2,960,513 | |
| | | | |
| | | | | | | | | | | | | | | 7,043,228 | |
| | | | | | | | | | | | | | | | |
| |
Total Yankee Corporate Bonds and Notes (Cost $115,017,471) | | | | 121,121,424 | |
| | | | | | | | | | | | | | | | |
|
Yankee Government Bonds: 1.53% | |
Bermuda 144A | | | 3.72 | | | | 1-25-2027 | | | | 995,000 | | | | 1,070,879 | |
Bermuda 144A | | | 4.14 | | | | 1-3-2023 | | | | 1,210,000 | | | | 1,276,562 | |
Federative Republic of Brazil | | | 4.50 | | | | 5-30-2029 | | | | 1,495,000 | | | | 1,631,045 | |
Federative Republic of Brazil | | | 4.63 | | | | 1-13-2028 | | | | 1,795,000 | | | | 1,981,698 | |
Hashemite Kingdom of Jordan | | | 3.00 | | | | 6-30-2025 | | | | 3,000,000 | | | | 3,249,426 | |
Provincia de Cordoba 144A | | | 7.13 | | | | 6-10-2021 | | | | 1,750,000 | | | | 1,296,768 | |
Provincia de Santa Fe 144A | | | 7.00 | | | | 3-23-2023 | | | | 2,000,000 | | | | 1,600,000 | |
Republic of Argentina | | | 6.88 | | | | 4-22-2021 | | | | 1,280,000 | | | | 636,800 | |
Republic of Argentina | | | 6.88 | | | | 1-11-2048 | | | | 1,000,000 | | | | 393,010 | |
Republic of Argentina | | | 7.50 | | | | 4-22-2026 | | | | 1,350,000 | | | | 583,889 | |
Republic of Kenya 144A | | | 8.25 | | | | 2-28-2048 | | | | 750,000 | | | | 801,113 | |
Republic of Paraguay 144A | | | 5.40 | | | | 3-30-2050 | | | | 1,000,000 | | | | 1,202,510 | |
Republic of Senegal 144A | | | 6.25 | | | | 5-23-2033 | | | | 750,000 | | | | 786,300 | |
Ukraine 144A | | | 7.38 | | | | 9-25-2032 | | | | 1,200,000 | | | | 1,284,782 | |
| |
Total Yankee Government Bonds (Cost $19,272,148) | | | | 17,794,782 | |
| | | | | | | | | | | | | | | | |
20 | Wells Fargo Core Plus Bond Fund
Portfolio of investments—February 29, 2020 (unaudited)
| | | | | | | | | | | | | | | | |
| | | Yield | | | | | | Shares | | | Value | |
| Short-Term Investments: 6.68% | |
|
| Investment Companies: 6.68% | |
Securities Lending Cash Investments LLC (l)(r)(u) | | | 1.66 | % | | | | | | | 7,831,543 | | | $ | 7,832,326 | |
Wells Fargo Government Money Market Fund Select Class (l)(u)## | | | 1.52 | | | | | | | | 69,840,344 | | | | 69,840,344 | |
| | | | | | | | | | | | | | | | |
| | | | |
Total Short-Term Investments (Cost $77,672,607) | | | | | | | | | | | | | | | 77,672,670 | |
| | | | | | | | | | | | | | | | |
| | | | | | | | |
| Total investments in securities (Cost $1,166,325,842) | | | 103.15 | % | | | 1,200,055,448 | |
| | |
Other assets and liabilities, net | | | (3.15 | ) | | | (36,668,718 | ) |
| | | | | | | | |
| Total net assets | | | 100.00 | % | | $ | 1,163,386,730 | |
| | | | | | | | |
| ± | Variable rate investment. The rate shown is the rate in effect at period end. |
| ±± | The coupon of the security is adjusted based on the principal and interest payments received from the underlying pool of mortgages as well as the credit quality and the actual prepayment speed of the underlying mortgages. |
| (c) | Investment in an interest-only security entitles holders to receive only the interest payments on the underlying mortgages. The principal amount shown is the notional amount of the underlying mortgages. The rate represents the coupon rate. |
| %% | The security is purchased on a when-issued basis. |
| ¤ | The security is issued in zero coupon form with no periodic interest payments. |
| 144A | The security may be resold in transactions exempt from registration, normally to qualified institutional buyers, pursuant to Rule 144A under the Securities Act of 1933. |
| « | All or a portion of this security is on loan. |
| ‡ | Security is valued using significant unobservable inputs. |
| † | Non-income-earning security |
| (l) | The issuer of the security is an affiliated person of the Fund as defined in the Investment Company Act of 1940. |
| (r) | The investment is anon-registered investment company purchased with cash collateral received from securities on loan. |
| (u) | The rate represents the7-day annualized yield at period end. |
| ## | All or a portion of this security is segregated for when-issued securities. |
Abbreviations:
| AGM | Assured Guaranty Municipal |
| Ambac | Ambac Financial Group Incorporated |
| BAM | Build America Mutual Assurance Company |
| CAB | Capital appreciation bond |
| FHLB | Federal Home Loan Bank |
| FHLMC | Federal Home Loan Mortgage Corporation |
| FNMA | Federal National Mortgage Association |
| GNMA | Government National Mortgage Association |
| HEFAR | Higher Education Facilities Authority Revenue |
| LIBOR | London Interbank Offered Rate |
| REIT | Real estate investment trust |
| SOFR | Secured Overnight Financing Rate |
| STRIPS | Separate trading of registered interest and principal securities |
| TIPS | Treasury Inflation-Protected Securities |
| TVA | Tennessee Valley Authority |
The accompanying notes are an integral part of these financial statements.
Wells Fargo Core Plus Bond Fund | 21
Portfolio of investments—February 29, 2020 (unaudited)
Futures Contracts
| | | | | | | | | | | | | | | | | | | | | | | | |
| Description | | Number of
contracts | | | Expiration
date | | | Notional
cost | | | Notional
value | | | Unrealized
gains | | | Unrealized
losses | |
| | | | | | |
Long | | | | | | | | | | | | | | | | | | | | | | | | |
| | | | | | |
U.S. Long Term Bond | | | 85 | | | | 6-19-2020 | | | $ | 14,129,672 | | | $ | 14,471,250 | | | $ | 341,578 | | | $ | 0 | |
| | | | | | |
10-Year U.S. Treasury Notes | | | 106 | | | | 6-19-2020 | | | | 14,065,883 | | | | 14,283,500 | | | | 217,617 | | | | 0 | |
| | | | | | |
U.S. Ultra Bond | | | 144 | | | | 6-19-2020 | | | | 29,229,934 | | | | 29,880,000 | | | | 650,066 | | | | 0 | |
| | | | | | |
10-Year Canadian Treasury Bonds | | | 165 | | | | 6-19-2020 | | | | 17,426,434 | | | | 17,544,273 | | | | 117,839 | | | | 0 | |
| | | | | | |
5-Year U.S. Treasury Notes | | | 528 | | | | 6-30-2020 | | | | 64,106,641 | | | | 64,812,000 | | | | 705,359 | | | | 0 | |
| | | | | | |
2-Year U.S. Treasury Notes | | | 608 | | | | 6-30-2020 | | | | 131,962,305 | | | | 132,743,501 | | | | 781,196 | | | | 0 | |
| | | | | | |
Short | | | | | | | | | | | | | | | | | | | | | | | | |
| | | | | | |
Euro-Bund Futures | | | (21) | | | | 3-6-2020 | | | | (3,996,709 | ) | | | (4,114,047 | ) | | | 0 | | | | (117,338 | ) |
| | | | | | |
Euro-Schatz Futures | | | (67) | | | | 3-6-2020 | | | | (8,282,459 | ) | | | (8,307,341 | ) | | | 0 | | | | (24,882 | ) |
| | | | | | |
Euro-BOBL Futures | | | (135) | | | | 3-6-2020 | | | | (20,003,037 | ) | | | (20,217,854 | ) | | | 0 | | | | (214,817 | ) |
| | | | | | |
10-Year Ultra Futures | | | (248) | | | | 6-19-2020 | | | | (36,668,270 | ) | | | (37,254,250 | ) | | | 0 | | | | (585,980 | ) |
| | | | | | | | | | | | | | | | | | | | | | | | |
| | | | | | |
| | | | | | | | | | | | | | | | | | $ | 2,813,655 | | | $ | (943,017 | ) |
| | | | | | | | | | | | | | | | | | | | | | | | |
Forward Foreign Currency Contracts
| | | | | | | | | | | | | | |
Currency to be
received | | Currency to be
delivered | | Counterparty | | Settlement
date | | Unrealized
gains | | | Unrealized
losses | |
| | | | | |
| 2,250,000 EUR | | 9,639,450 PLN | | Citibank | | 3-31-2020 | | $ | 30,262 | | | $ | 0 | |
| | | | | |
| 2,834,128 USD | | 43,500,000 ZAR | | Citibank | | 3-31-2020 | | | 57,418 | | | | 0 | |
| | | | | |
| 2,832,233 USD | | 43,500,000 ZAR | | Citibank | | 3-31-2020 | | | 55,523 | | | | 0 | |
| | | | | |
| 1,655,078 USD | | 1,500,000 EUR | | Citibank | | 3-31-2020 | | | 0 | | | | (3,736 | ) |
| | | | | |
| 1,103,210 USD | | 1,000,000 EUR | | Citibank | | 3-31-2020 | | | 0 | | | | (2,666 | ) |
| | | | | |
| 9,696,611 PLN | | 2,250,000 EUR | | Citibank | | 3-31-2020 | | | 0 | | | | (15,687 | ) |
| | | | | |
| 1,684,985 USD | | 1,525,000 EUR | | Citibank | | 3-31-2020 | | | 0 | | | | (1,476 | ) |
| | | | | |
| 47,485,627 USD | | 42,294,034 EUR | | Citibank | | 3-31-2020 | | | 713,664 | | | | 0 | |
| | | | | |
| 2,996,653 USD | | 2,700,000 EUR | | Citibank | | 3-31-2020 | | | 10,788 | | | | 0 | |
| | | | | | | | | | | | | | |
| | | | | |
| | | | | | | | $ | 867,655 | | | $ | (23,565 | ) |
| | | | | | | | | | | | | | |
Centrally Cleared Credit Default Swaps
| | | | | | | | | | | | | | | | | | | | | | | | | | | | | | | | |
| Reference index | | Fixed rate
received | | | Payment
frequency | | | Maturity
date | | | Notional
amount | | | Value | | | Premiums
received / paid | | | Unrealized
gains | | | Unrealized
losses | |
| | | | | | | | |
Buy protection | | | | | | | | | | | | | | | | | | | | | | | | | | | | | | | | |
| | | | | | | | |
Markit CDX North American High Yield Index | | | 5.00 | % | | | Quarterly | | | | 12-20-2024 | | | | USD 7,425,000 | | | $ | (381,100 | ) | | $ | (594,660 | ) | | $ | 213,560 | | | $ | 0 | |
| | | | | | | | |
Markit CDX North American Investment Grade Index | | | 1.00 | | | | Quarterly | | | | 12-20-2024 | | | | USD 10,000,000 | | | | (150,700 | ) | | | (204,551 | ) | | | 53,851 | | | | 0 | |
| | | | | | | | | | | | | | | | | | | | | | | | | | | | | | | | |
| | | | | | | | |
| | | | | | | | | | | | | | | | | | | | | | | (799,211 | ) | | | 267,411 | | | | 0 | |
| | | | | | | | | | | | | | | | | | | | | | | | | | | | | | | | |
| | | | | | | | |
Sell protection | | | | | | | | | | | | | | | | | | | | | | | | | | | | | | | | |
| | | | | | | | |
Markit iTraxx Europe Index | | | 1.00 | | | | Quarterly | | | | 12-20-2023 | | | | EUR 4,000,000 | | | | 77,234 | | | | 56,644 | | | | 20,590 | | | | 0 | |
| | | | | | | | | | | | | | | | | | | | | | | | | | | | | | | | |
22 | Wells Fargo Core Plus Bond Fund
Portfolio of investments—February 29, 2020 (unaudited)
Investments in Affiliates
An affiliated investment is an investment in which the Fund owns at least 5% of the outstanding voting shares of the issuer or as a result of other relationships, such as the Fund and the issuer having the same investment manager. Transactions with issuers that were either affiliated persons of the Fund at the beginning of the period or the end of the period were as follows:
| | | | | | | | | | | | | | | | | | | | | | | | | | | | | | | | | | | | |
| | | Shares,
beginning of
period | | | Shares
purchased | | | Shares
sold | | | Shares,
end of
period | | | Net
realized
gains
(losses) | | | Net
change in
unrealized
gains
(losses) | | | Income
from
affiliated
securities | | | Value,
end of
period | | | % of
net
assets | |
| | | | | | | | | |
| Short-Term Investments | | | | | | | | | | | | | | | | | | | | | | | | | | | |
Investment Companies | | | | | | | | | | | | | | | | | | | | | | | | | | | | | | | | | | | | |
Securities Lending Cash Investments LLC | | | 5,226,857 | | | | 87,296,436 | | | | (84,691,750 | ) | | | 7,831,543 | | | $ | 3,117 | | | $ | 1 | | | $ | 132,053 | # | | $ | 7,832,326 | | | | | |
Wells Fargo Government Money Market Fund Select Class | | | 86,371,118 | | | | 311,531,498 | | | | (328,062,272 | ) | | | 69,840,344 | | | | 0 | | | | 0 | | | | 465,327 | | | | 69,840,344 | | | | | |
| | | | | | | | | | | | | | | | | | | | | | | | | | | | | | | | | | | | |
| | | | | | | | | | | | | | | | | | $ | 3,117 | | | $ | 1 | | | $ | 597,380 | | | $ | 77,672,670 | | | | 6.68 | % |
| | | | | | | | | | | | | | | | | | | | | | | | | | | | | | | | | | | | |
| # | Amount shown represents income before fees and rebates. |
Wells Fargo Core Plus Bond Fund | 23
Statement of assets and liabilities—February 29, 2020 (unaudited)
| | | | |
| | | | |
| |
Assets | | | | |
Investments in unaffiliated securities (including $7,569,312 of securities loaned), at value (cost $1,088,653,235) | | $ | 1,122,382,778 | |
Investments in affiliated securities, at value (cost $77,672,607) | | | 77,672,670 | |
Cash | | | 306,827 | |
Cash at broker segregated for centrally cleared swaps | | | 552,038 | |
Cash at broker segregated for open futures contracts | | | 2,134,647 | |
Foreign currency, at value (cost $40,459) | | | 39,518 | |
Principal paydown receivable | | | 58 | |
Receivable for investments sold | | | 17,594,415 | |
Receivable for Fund shares sold | | | 6,074,657 | |
Receivable for interest | | | 6,502,693 | |
Receivable for daily variation margin on open futures contracts | | | 1,574,807 | |
Receivable for securities lending income, net | | | 6,915 | |
Unrealized gains on forward foreign currency contracts | | | 867,655 | |
Prepaid expenses and other assets | | | 299,371 | |
| | | | |
Total assets | | | 1,236,009,049 | |
| | | | |
| |
Liabilities | | | | |
Payable for investments purchased | | | 57,385,879 | |
Payable for Fund shares redeemed | | | 5,191,279 | |
Payable upon receipt of securities loaned | | | 7,827,494 | |
Unrealized losses on forward foreign currency contracts | | | 23,565 | |
Cash collateral due to broker for forward foreign currency contracts | | | 1,630,000 | |
Payable for daily variation margin on centrally cleared swaps | | | 23,026 | |
Management fee payable | | | 268,163 | |
Administration fees payable | | | 91,407 | |
Distribution fee payable | | | 13,207 | |
Trustees’ fees and expenses payable | | | 6,026 | |
Accrued expenses and other liabilities | | | 162,273 | |
| | | | |
Total liabilities | | | 72,622,319 | |
| | | | |
Total net assets | | $ | 1,163,386,730 | |
| | | | |
| |
Net assets consist of | | | | |
Paid-in capital | | $ | 1,110,898,382 | |
Total distributable earnings | | | 52,488,348 | |
| | | | |
Total net assets | | $ | 1,163,386,730 | |
| | | | |
| |
Computation of net asset value and offering price per share | | | | |
Net assets – Class A | | $ | 257,102,347 | |
Shares outstanding – Class A1 | | | 19,462,642 | |
Net asset value per share – Class A | | | $13.21 | |
Maximum offering price per share – Class A2 | | | $13.83 | |
Net assets – Class C | | $ | 22,374,991 | |
Shares outstanding – Class C1 | | | 1,694,481 | |
Net asset value per share – Class C | | | $13.20 | |
Net assets – Class R6 | | $ | 67,561,160 | |
Shares outstanding – Class R61 | | | 5,106,258 | |
Net asset value per share – Class R6 | | | $13.23 | |
Net assets – Administrator Class | | $ | 63,807,766 | |
Shares outstanding – Administrator Class1 | | | 4,838,413 | |
Net asset value per share – Administrator Class | | | $13.19 | |
Net assets – Institutional Class | | $ | 752,540,466 | |
Shares outstanding – Institutional Class1 | | | 56,898,317 | |
Net asset value per share – Institutional Class | | | $13.23 | |
| 1 | The Fund has an unlimited number of authorized shares. |
| 2 | Maximum offering price is computed as 100/95.50 of net asset value. On investments of $50,000 or more, the offering price is reduced. |
The accompanying notes are an integral part of these financial statements.
24 | Wells Fargo Core Plus Bond Fund
Statement of operations—six months ended February 29, 2020 (unaudited)
| | | | |
| | | | |
| |
Investment income | | | | |
Interest | | $ | 15,623,173 | |
Income from affiliated securities | | | 514,576 | |
Dividends | | | 301,395 | |
| | | | |
Total investment income | | | 16,439,144 | |
| | | | |
| |
Expenses | | | | |
Management fee | | | 2,177,086 | |
Administration fees | |
Class A | | | 195,934 | |
Class C | | | 15,451 | |
Class R6 | | | 9,470 | |
Administrator Class | | | 30,486 | |
Institutional Class | | | 243,708 | |
Shareholder servicing fees | |
Class A | | | 306,147 | |
Class C | | | 24,143 | |
Administrator Class | | | 76,216 | |
Distribution fee | |
Class C | | | 72,428 | |
Custody and accounting fees | | | 29,753 | |
Professional fees | | | 33,795 | |
Registration fees | | | 49,589 | |
Shareholder report expenses | | | 45,125 | |
Trustees’ fees and expenses | | | 10,909 | |
Other fees and expenses | | | 6,938 | |
| | | | |
Total expenses | | | 3,327,178 | |
Less: Fee waivers and/or expense reimbursements | |
Fund-level | | | (757,541 | ) |
Administrator Class | | | (14,721 | ) |
| | | | |
Net expenses | | | 2,554,916 | |
| | | | |
Net investment income | | | 13,884,228 | |
| | | | |
| |
Realized and unrealized gains (losses) on investments | | | | |
Net realized gains on | |
Unaffiliated securities | | | 10,619,251 | |
Affiliated securities | | | 3,117 | |
Futures contracts | | | 2,148,162 | |
Forward foreign currency contracts | | | 1,023,325 | |
Credit default swap contracts | | | 102,362 | |
| | | | |
Net realized gains on investments | | | 13,896,217 | |
| | | | |
Net change in unrealized gains (losses) on | |
Unaffiliated securities | | | 4,257,198 | |
Affiliated securities | | | 1 | |
Futures contracts | | | 1,630,480 | |
Forward foreign currency contracts | | | (619,480 | ) |
Credit default swap contracts | | | 244,040 | |
| | | | |
Net change in unrealized gains (losses) on investments | | | 5,512,239 | |
| | | | |
Net realized and unrealized gains (losses) on investments | | | 19,408,456 | |
| | | | |
Net increase in net assets resulting from operations | | $ | 33,292,684 | |
| | | | |
The accompanying notes are an integral part of these financial statements.
Wells Fargo Core Plus Bond Fund | 25
Statement of changes in net assets
| | | | | | | | | | | | | | | | |
| | | Six months ended
February 29, 2020
(unaudited) | | | Year ended
August 31, 2019 | |
| |
Operations | | | | | |
Net investment income | | | | | | $ | 13,884,228 | | | | | | | $ | 20,538,054 | |
Net realized gains on investments | | | | | | | 13,896,217 | | | | | | | | 8,587,464 | |
Net change in unrealized gains (losses) on investments | | | | | | | 5,512,239 | | | | | | | | 37,270,326 | |
| | | | |
Net increase in net assets resulting from operations | | | | | | | 33,292,684 | | | | | | | | 66,395,844 | |
| | | | |
| | | | |
Distributions to shareholders from net investment income and net realized gains | | | | | | | | | | | | | | | | |
Class A | | | | | | | (4,851,653 | ) | | | | | | | (6,574,947 | ) |
Class C | | | | | | | (309,867 | ) | | | | | | | (370,804 | ) |
Class R6 | | | | | | | (1,358,549 | ) | | | | | | | (1,715,047 | ) |
Administrator Class | | | | | | | (1,259,912 | ) | | | | | | | (771,693 | ) |
Institutional Class | | | | | | | (12,814,948 | ) | | | | | | | (10,270,164 | ) |
| | | | |
Total distributions to shareholders | | | | | | | (20,594,929 | ) | | | | | | | (19,702,655 | ) |
| | | | |
| | | | |
| | | Shares | | | | | | | | Shares | | | | | |
| | |
Capital share transactions | | | | | | | | |
Proceeds from shares sold | |
Class A | | | 1,654,622 | | | | 21,492,323 | | | | 2,680,470 | | | | 33,438,451 | |
Class C | | | 469,311 | | | | 6,091,087 | | | | 481,331 | | | | 6,064,332 | |
Class R6 | | | 431,525 | | | | 5,610,093 | | | | 1,501,220 | | | | 18,804,815 | |
Administrator Class | | | 957,877 | | | | 12,421,129 | | | | 3,315,239 | | | | 42,606,846 | |
Institutional Class | | | 23,515,191 | | | | 305,417,955 | | | | 29,266,462 | | | | 369,237,004 | |
| | | | |
| | | | | | | 351,032,587 | | | | | | | | 470,151,448 | |
| | | | |
Reinvestment of distributions | |
Class A | | | 347,476 | | | | 4,495,414 | | | | 489,790 | | | | 6,110,716 | |
Class C | | | 21,314 | | | | 275,538 | | | | 27,365 | | | | 340,533 | |
Class R6 | | | 84,658 | | | | 1,097,186 | | | | 108,554 | | | | 1,359,721 | |
Administrator Class | | | 97,362 | | | | 1,257,381 | | | | 61,503 | | | | 767,914 | |
Institutional Class | | | 843,049 | | | | 10,921,242 | | | | 744,184 | | | | 9,339,392 | |
| | | | |
| | | | | | | 18,046,761 | | | | | | | | 17,918,276 | |
| | | | |
Payment for shares redeemed | |
Class A | | | (1,317,235 | ) | | | (17,099,678 | ) | | | (3,117,801 | ) | | | (38,772,694 | ) |
Class C | | | (186,034 | ) | | | (2,414,731 | ) | | | (794,733 | ) | | | (9,880,274 | ) |
Class R6 | | | (177,413 | ) | | | (2,306,760 | ) | | | (518,426 | ) | | | (6,649,954 | ) |
Administrator Class | | | (601,109 | ) | | | (7,766,527 | ) | | | (1,625,234 | ) | | | (20,018,219 | ) |
Institutional Class | | | (7,488,476 | ) | | | (97,457,615 | ) | | | (11,506,592 | ) | | | (142,716,810 | ) |
| | | | |
| | | | | | | (127,045,311 | ) | | | | | | | (218,037,951 | ) |
| | | | |
Net increase in net assets resulting from capital share transactions | | | | | | | 242,034,037 | | | | | | | | 270,031,773 | |
| | | | |
Total increase in net assets | | | | | | | 254,731,792 | | | | | | | | 316,724,962 | |
| | | | |
| | |
Net assets | | | | | | | | |
Beginning of period | | | | | | | 908,654,938 | | | | | | | | 591,929,976 | |
| | | | |
End of period | | | | | | $ | 1,163,386,730 | | | | | | | $ | 908,654,938 | |
| | | | |
The accompanying notes are an integral part of these financial statements.
26 | Wells Fargo Core Plus Bond Fund
Financial highlights
(For a share outstanding throughout each period)
| | | | | | | | | | | | | | | | | | | | | | | | |
| | | Six months ended
February 29, 2020
(unaudited) | | | Year ended August 31 | |
| CLASS A | | 2019 | | | 2018 | | | 2017 | | | 2016 | | | 2015 | |
Net asset value, beginning of period | | | $13.09 | | | | $12.27 | | | | $12.71 | | | | $12.70 | | | | $12.14 | | | | $12.24 | |
Net investment income | | | 0.16 | | | | 0.37 | | | | 0.34 | | | | 0.36 | 1 | | | 0.33 | | | | 0.21 | 1 |
Net realized and unrealized gains (losses) on investments | | | 0.21 | | | | 0.80 | | | | (0.45 | ) | | | (0.01 | ) | | | 0.60 | | | | (0.08 | ) |
| | | | | | | | | | | | | | | | | | | | | | | | |
Total from investment operations | | | 0.37 | | | | 1.17 | | | | (0.11 | ) | | | 0.35 | | | | 0.93 | | | | 0.13 | |
Distributions to shareholders from | | | | | | | | | | | | | | | | | | | | | | | | |
Net investment income | | | (0.18 | ) | | | (0.35 | ) | | | (0.33 | ) | | | (0.33 | ) | | | (0.33 | ) | | | (0.21 | ) |
Net realized gains | | | (0.07 | ) | | | 0.00 | | | | 0.00 | | | | (0.01 | ) | | | (0.04 | ) | | | (0.02 | ) |
| | | | | | | | | | | | | | | | | | | | | | | | |
Total distributions to shareholders | | | (0.25 | ) | | | (0.35 | ) | | | (0.33 | ) | | | (0.34 | ) | | | (0.37 | ) | | | (0.23 | ) |
Net asset value, end of period | | | $13.21 | | | | $13.09 | | | | $12.27 | | | | $12.71 | | | | $12.70 | | | | $12.14 | |
Total return2 | | | 2.92 | % | | | 9.74 | % | | | (0.84 | )% | | | 2.78 | % | | | 7.78 | % | | | 1.04 | % |
Ratios to average net assets (annualized) | | | | | | | | | | | | | | | | | | | | | | | | |
Gross expenses | | | 0.88 | % | | | 0.91 | % | | | 0.92 | % | | | 0.93 | % | | | 0.93 | % | | | 0.91 | % |
Net expenses | | | 0.71 | % | | | 0.73 | % | | | 0.73 | % | | | 0.76 | % | | | 0.84 | % | | | 0.84 | % |
Net investment income | | | 2.58 | % | | | 2.99 | % | | | 2.63 | % | | | 2.88 | % | | | 2.76 | % | | | 1.69 | % |
Supplemental data | | | | | | | | | | | | | | | | | | | | | | | | |
Portfolio turnover rate | | | 52 | % | | | 89 | % | | | 148 | % | | | 199 | % | | | 288 | % | | | 322 | % |
Net assets, end of period (000s omitted) | | | $257,102 | | | | $245,879 | | | | $229,688 | | | | $255,668 | | | | $349,852 | | | | $223,755 | |
| 1 | Calculated based upon average shares outstanding |
| 2 | Total return calculations do not include any sales charges. Returns for periods of less than one year are not annualized. |
The accompanying notes are an integral part of these financial statements.
Wells Fargo Core Plus Bond Fund | 27
Financial highlights
(For a share outstanding throughout each period)
| | | | | | | | | | | | | | | | | | | | | | | | |
| | | Six months ended
February 29, 2020
(unaudited) | | | Year ended August 31 | |
| CLASS C | | 2019 | | | 2018 | | | 2017 | | | 2016 | | | 2015 | |
Net asset value, beginning of period | | | $13.09 | | | | $12.26 | | | | $12.71 | | | | $12.70 | | | | $12.14 | | | | $12.23 | |
Net investment income | | | 0.11 | | | | 0.28 | | | | 0.23 | | | | 0.26 | | | | 0.24 | 1 | | | 0.12 | 1 |
Net realized and unrealized gains (losses) on investments | | | 0.20 | | | | 0.81 | | | | (0.44 | ) | | | (0.01 | ) | | | 0.59 | | | | (0.08 | ) |
| | | | | | | | | | | | | | | | | | | | | | | | |
Total from investment operations | | | 0.31 | | | | 1.09 | | | | (0.21 | ) | | | 0.25 | | | | 0.83 | | | | 0.04 | |
Distributions to shareholders from | | | | | | | | | | | | | | | | | | | | | | | | |
Net investment income | | | (0.13 | ) | | | (0.26 | ) | | | (0.24 | ) | | | (0.23 | ) | | | (0.23 | ) | | | (0.11 | ) |
Net realized gains | | | (0.07 | ) | | | 0.00 | | | | 0.00 | | | | (0.01 | ) | | | (0.04 | ) | | | (0.02 | ) |
| | | | | | | | | | | | | | | | | | | | | | | | |
Total distributions to shareholders | | | (0.20 | ) | | | (0.26 | ) | | | (0.24 | ) | | | (0.24 | ) | | | (0.27 | ) | | | (0.13 | ) |
Net asset value, end of period | | | $13.20 | | | | $13.09 | | | | $12.26 | | | | $12.71 | | | | $12.70 | | | | $12.14 | |
Total return2 | | | 2.55 | % | | | 8.91 | % | | | (1.66 | )% | | | 2.01 | % | | | 6.99 | % | | | 0.35 | % |
Ratios to average net assets (annualized) | | | | | | | | | | | | | | | | | | | | | | | | |
Gross expenses | | | 1.63 | % | | | 1.66 | % | | | 1.67 | % | | | 1.68 | % | | | 1.68 | % | | | 1.66 | % |
Net expenses | | | 1.48 | % | | | 1.48 | % | | | 1.48 | % | | | 1.51 | % | | | 1.59 | % | | | 1.59 | % |
Net investment income | | | 1.81 | % | | | 2.25 | % | | | 1.89 | % | | | 2.12 | % | | | 2.00 | % | | | 0.95 | % |
Supplemental data | | | | | | | | | | | | | | | | | | | | | | | | |
Portfolio turnover rate | | | 52 | % | | | 89 | % | | | 148 | % | | | 199 | % | | | 288 | % | | | 322 | % |
Net assets, end of period (000s omitted) | | | $22,375 | | | | $18,195 | | | | $20,550 | | | | $19,036 | | | | $21,216 | | | | $20,381 | |
| 1 | Calculated based upon average shares outstanding |
| 2 | Total return calculations do not include any sales charges. Returns for periods of less than one year are not annualized. |
The accompanying notes are an integral part of these financial statements.
28 | Wells Fargo Core Plus Bond Fund
Financial highlights
(For a share outstanding throughout each period)
| | | | | | | | | | | | | | | | |
| | | Six months ended
February 29, 2020
(unaudited) | | | Year ended August 31 | |
| CLASS R6 | | 2019 | | | 2018 | | | 20171 | |
Net asset value, beginning of period | | | $13.11 | | | | $12.28 | | | | $12.73 | | | | $12.59 | |
Net investment income | | | 0.19 | | | | 0.41 | | | | 0.39 | | | | 0.33 | 2 |
Net realized and unrealized gains (losses) on investments | | | 0.20 | | | | 0.82 | | | | (0.46 | ) | | | 0.12 | |
| | | | | | | | | | | | | | | | |
Total from investment operations | | | 0.39 | | | | 1.23 | | | | (0.07 | ) | | | 0.45 | |
Distributions to shareholders from | | | | | | | | | | | | | | | | |
Net investment income | | | (0.20 | ) | | | (0.40 | ) | | | (0.38 | ) | | | (0.30 | ) |
Net realized gains | | | (0.07 | ) | | | 0.00 | | | | 0.00 | | | | (0.01 | ) |
| | | | | | | | | | | | | | | | |
Total distributions to shareholders | | | (0.27 | ) | | | (0.40 | ) | | | (0.38 | ) | | | (0.31 | ) |
Net asset value, end of period | | | $13.23 | | | | $13.11 | | | | $12.28 | | | | $12.73 | |
Total return3 | | | 3.10 | % | | | 10.14 | % | | | (0.55 | )% | | | 3.64 | % |
Ratios to average net assets (annualized) | | | | | | | | | | | | | | | | |
Gross expenses | | | 0.50 | % | | | 0.53 | % | | | 0.54 | % | | | 0.55 | % |
Net expenses | | | 0.35 | % | | | 0.35 | % | | | 0.35 | % | | | 0.35 | % |
Net investment income | | | 2.94 | % | | | 3.36 | % | | | 3.05 | % | | | 3.12 | % |
Supplemental data | | | | | | | | | | | | | | | | |
Portfolio turnover rate | | | 52 | % | | | 89 | % | | | 148 | % | | | 199 | % |
Net assets, end of period (000s omitted) | | | $67,561 | | | | $62,522 | | | | $45,159 | | | | $31,451 | |
| 1 | For the period from October 31, 2016 (commencement of class operations) to August 31, 2017 |
| 2 | Calculated based upon average shares outstanding |
| 3 | Returns for periods of less than one year are not annualized. |
The accompanying notes are an integral part of these financial statements.
Wells Fargo Core Plus Bond Fund | 29
Financial highlights
(For a share outstanding throughout each period)
| | | | | | | | | | | | | | | | | | | | | | | | |
| | | Six months ended
February 29, 2020
(unaudited) | | | Year ended August 31 | |
| ADMINISTRATOR CLASS | | 2019 | | | 2018 | | | 2017 | | | 2016 | | | 2015 | |
Net asset value, beginning of period | | | $13.07 | | | | $12.25 | | | | $12.69 | | | | $12.68 | | | | $12.12 | | | | $12.22 | |
Net investment income | | | 0.17 | | | | 0.38 | | | | 0.35 | | | | 0.37 | | | | 0.34 | | | | 0.22 | |
Net realized and unrealized gains (losses) on investments | | | 0.21 | | | | 0.81 | | | | (0.44 | ) | | | (0.01 | ) | | | 0.60 | | | | (0.08 | ) |
| | | | | | | | | | | | | | | | | | | | | | | | |
Total from investment operations | | | 0.38 | | | | 1.19 | | | | (0.09 | ) | | | 0.36 | | | | 0.94 | | | | 0.14 | |
Distributions to shareholders from | | | | | | | | | | | | | | | | | | | | | | | | |
Net investment income | | | (0.19 | ) | | | (0.37 | ) | | | (0.35 | ) | | | (0.34 | ) | | | (0.34 | ) | | | (0.22 | ) |
Net realized gains | | | (0.07 | ) | | | 0.00 | | | | 0.00 | | | | (0.01 | ) | | | (0.04 | ) | | | (0.02 | ) |
| | | | | | | | | | | | | | | | | | | | | | | | |
Total distributions to shareholders | | | (0.26 | ) | | | (0.37 | ) | | | (0.35 | ) | | | (0.35 | ) | | | (0.38 | ) | | | (0.24 | ) |
Net asset value, end of period | | | $13.19 | | | | $13.07 | | | | $12.25 | | | | $12.69 | | | | $12.68 | | | | $12.12 | |
Total return1 | | | 2.98 | % | | | 9.88 | % | | | (0.74 | )% | | | 2.90 | % | | | 7.92 | % | | | 1.15 | % |
Ratios to average net assets (annualized) | | | | | | | | | | | | | | | | | | | | | | | | |
Gross expenses | | | 0.82 | % | | | 0.85 | % | | | 0.86 | % | | | 0.87 | % | | | 0.87 | % | | | 0.85 | % |
Net expenses | | | 0.62 | % | | | 0.62 | % | | | 0.62 | % | | | 0.66 | % | | | 0.72 | % | | | 0.72 | % |
Net investment income | | | 2.67 | % | | | 3.07 | % | | | 2.74 | % | | | 2.97 | % | | | 2.84 | % | | | 1.82 | % |
Supplemental data | | | | | | | | | | | | | | | | | | | | | | | | |
Portfolio turnover rate | | | 52 | % | | | 89 | % | | | 148 | % | | | 199 | % | | | 288 | % | | | 322 | % |
Net assets, end of period (000s omitted) | | | $63,808 | | | | $57,316 | | | | $32,241 | | | | $41,806 | | | | $71,133 | | | | $85,431 | |
| 1 | Returns for periods of less than one year are not annualized. |
The accompanying notes are an integral part of these financial statements.
30 | Wells Fargo Core Plus Bond Fund
Financial highlights
(For a share outstanding throughout each period)
| | | | | | | | | | | | | | | | | | | | | | | | |
| | | Six months ended
February 29, 2020
(unaudited) | | | Year ended August 31 | |
| INSTITUTIONAL CLASS | | 2019 | | | 2018 | | | 2017 | | | 2016 | | | 2015 | |
Net asset value, beginning of period | | | $13.11 | | | | $12.28 | | | | $12.72 | | | | $12.71 | | | | $12.15 | | | | $12.24 | |
Net investment income | | | 0.18 | | | | 0.39 | | | | 0.37 | 1 | | | 0.38 | | | | 0.36 | | | | 0.24 | 1 |
Net realized and unrealized gains (losses) on investments | | | 0.21 | | | | 0.83 | | | | (0.44 | ) | | | 0.01 | | | | 0.60 | | | | (0.07 | ) |
| | | | | | | | | | | | | | | | | | | | | | | | |
Total from investment operations | | | 0.39 | | | | 1.22 | | | | (0.07 | ) | | | 0.39 | | | | 0.96 | | | | 0.17 | |
Distributions to shareholders from | | | | | | | | | | | | | | | | | | | | | | | | |
Net investment income | | | (0.20 | ) | | | (0.39 | ) | | | (0.37 | ) | | | (0.37 | ) | | | (0.36 | ) | | | (0.24 | ) |
Net realized gains | | | (0.07 | ) | | | 0.00 | | | | 0.00 | | | | (0.01 | ) | | | (0.04 | ) | | | (0.02 | ) |
| | | | | | | | | | | | | | | | | | | | | | | | |
Total distributions to shareholders | | | (0.27 | ) | | | (0.39 | ) | | | (0.37 | ) | | | (0.38 | ) | | | (0.40 | ) | | | (0.26 | ) |
Net asset value, end of period | | | $13.23 | | | | $13.11 | | | | $12.28 | | | | $12.72 | | | | $12.71 | | | | $12.15 | |
Total return2 | | | 3.07 | % | | | 10.17 | % | | | (0.52 | )% | | | 3.10 | % | | | 8.05 | % | | | 1.37 | % |
Ratios to average net assets (annualized) | | | | | | | | | | | | | | | | | | | | | | | | |
Gross expenses | | | 0.55 | % | | | 0.58 | % | | | 0.59 | % | | | 0.60 | % | | | 0.60 | % | | | 0.58 | % |
Net expenses | | | 0.40 | % | | | 0.40 | % | | | 0.40 | % | | | 0.44 | % | | | 0.58 | % | | | 0.58 | % |
Net investment income | | | 2.89 | % | | | 3.29 | % | | | 3.00 | % | | | 3.17 | % | | | 3.04 | % | | | 1.95 | % |
Supplemental data | | | | | | | | | | | | | | | | | | | | | | | | |
Portfolio turnover rate | | | 52 | % | | | 89 | % | | | 148 | % | | | 199 | % | | | 288 | % | | | 322 | % |
Net assets, end of period (000s omitted) | | | $752,540 | | | | $524,743 | | | | $264,292 | | | | $163,387 | | | | $79,687 | | | | $54,419 | |
| 1 | Calculated based upon average shares outstanding |
| 2 | Returns for periods of less than one year are not annualized. |
The accompanying notes are an integral part of these financial statements.
Wells Fargo Core Plus Bond Fund | 31
Notes to financial statements (unaudited)
1. ORGANIZATION
Wells Fargo Funds Trust (the “Trust”), a Delaware statutory trust organized on March 10, 1999, is anopen-end management investment company registered under the Investment Company Act of 1940, as amended (the “1940 Act”). As an investment company, the Trust follows the accounting and reporting guidance in Financial Accounting Standards Board (“FASB”)Accounting Standards Codification Topic 946, Financial Services – Investment Companies. These financial statements report on the Wells Fargo Core Plus Bond Fund (the “Fund”) which is a diversified series of the Trust.
2. SIGNIFICANT ACCOUNTING POLICIES
The following significant accounting policies, which are consistently followed in the preparation of the financial statements of the Fund, are in conformity with U.S. generally accepted accounting principles which require management to make estimates and assumptions that affect the reported amounts of assets and liabilities, disclosure of contingent assets and liabilities at the date of the financial statements, and the reported amounts of revenues and expenses during the reporting period. Actual results could differ from those estimates.
Securities valuation
All investments are valued each business day as of the close of regular trading on the New York Stock Exchange (generally 4 p.m. Eastern Time), although the Fund may deviate from this calculation time under unusual or unexpected circumstances.
Debt securities are valued at the evaluated bid price provided by an independent pricing service (e.g. taking into account various factors, including yields, maturities, or credit ratings) or, if a reliable price is not available, the quoted bid price from an independent broker-dealer.
Equity securities and futures contracts that are listed on a foreign or domestic exchange or market are valued at the official closing price or, if none, the last sales price. If no sale occurs on the principal exchange or market that day, a fair value price will be determined in accordance with the Fund’s Valuation Procedures.
Swap contracts are valued at the evaluated price provided by an independent pricing service or, if a reliable price is not available, the quoted bid price from an independent broker-dealer.
Forward foreign currency contracts are recorded at the forward rate provided by an independent foreign currency pricing source at a time each business day specified by the Wells Fargo Asset Management Pricing Committee at Wells Fargo Funds Management, LLC (“Funds Management”).
The values of securities denominated in foreign currencies are translated into U.S. dollars at rates provided by an independent foreign currency pricing source at a time each business day specified by the Wells Fargo Asset Management Pricing Committee.
Investments in registeredopen-end investment companies are valued at net asset value. Interests innon-registered investment companies that are redeemable at net asset value are fair valued normally at net asset value.
Investments which are not valued using any of the methods discussed above are valued at their fair value, as determined in good faith by the Board of Trustees of the Fund. The Board of Trustees has established a Valuation Committee comprised of the Trustees and has delegated to it the authority to take any actions regarding the valuation of portfolio securities that the Valuation Committee deems necessary or appropriate, including determining the fair value of portfolio securities, unless the determination has been delegated to the Wells Fargo Asset Management Pricing Committee.The Board of Trustees retains the authority to make or ratify any valuation decisions or approve any changes to the Valuation Procedures as it deems appropriate. On a quarterly basis, the Board of Trustees receives reports on any valuation actions taken by the Valuation Committee or the Wells Fargo Asset Management Pricing Committee which may include items for ratification.
Foreign currency translation
The accounting records of the Fund are maintained in U.S. dollars. The values of other assets and liabilities denominated in foreign currencies are translated into U.S. dollars at rates provided by an independent foreign currency pricing source at a time each business day specified by the Wells Fargo Asset Management Pricing Committee. Purchases and sales of securities, and income and expenses are converted at the rate of exchange on the respective dates of such transactions. Net realized foreign exchange gains or losses arise from sales of foreign currencies, currency gains or losses realized between the trade and settlement dates on securities transactions, and the difference between the amounts of dividends, interest and foreign withholding taxes recorded and the U.S. dollar equivalent of the amounts actually paid or received. Net unrealized foreign exchange gains and losses arise from changes in the fair value of assets and liabilities other than investments in securities resulting from changes in exchange rates. The changes in net assets arising from changes in exchange rates of securities and the changes in net assets resulting from changes in market prices of securities are not separately presented. Such changes are included in net realized and unrealized gains or losses from investments.
32 | Wells Fargo Core Plus Bond Fund
Notes to financial statements (unaudited)
Forward foreign currency contracts
A forward foreign currency contract is an agreement between two parties to purchase or sell a specific currency for an agreed-upon price at a future date. The Fund enters into forward foreign currency contracts to facilitate transactions in foreign-denominated securities and to attempt to minimize the risk to the Fund from adverse changes in the relationship between currencies. Forward foreign currency contracts are recorded at the forward rate andmarked-to-market daily. When the contracts are closed, realized gains and losses arising from such transactions are recorded as realized gains or losses on forward foreign currency contracts. The Fund is subject to foreign currency risk and may be exposed to risks if the counterparties to the contracts are unable to meet the terms of their contracts or if the value of the foreign currency changes unfavorably. The Fund’s maximum risk of loss from counterparty credit risk is the unrealized gains on the contracts. This risk may be mitigated if there is a master netting arrangement between the Fund and the counterparty.
Securities lending
The Fund may lend its securities from time to time in order to earn additional income in the form of fees or interest on securities received as collateral or the investment of any cash received as collateral. When securities are on loan, the Fund receives interest or dividends on those securities. Cash collateral received in connection with its securities lending transactions is invested in Securities Lending Cash Investments, LLC (the “Securities Lending Fund”). Investments in Securities Lending Fund are valued at the evaluated bid price provided by an independent pricing service. Income earned from investment in the Securities Lending Fund (net of fees and rebates), if any, is included in income from affiliated securities on the Statement of Operations.
In a securities lending transaction, the net asset value of the Fund is affected by an increase or decrease in the value of the securities loaned and by an increase or decrease in the value of the instrument in which collateral is invested. The amount of securities lending activity undertaken by the Fund fluctuates from time to time. The Fund has the right under the lending agreement to recover the securities from the borrower on demand. In the event of default or bankruptcy by the borrower, the Fund may be prevented from recovering the loaned securities or gaining access to the collateral or may experience delays or costs in doing so. In such an event, the terms of the agreement allows the unaffiliated securities lending agent to use the collateral to purchase replacement securities on behalf of the Fund or pay the Fund the market value of the loaned securities. The Fund bears the risk of loss with respect to depreciation of its investment of the cash collateral.
When-issued transactions
The Fund may purchase securities on a forward commitment or when-issued basis. The Fund records a when-issued transaction on the trade date and will segregate assets in an amount at least equal in value to the Fund’s commitment to purchase when-issued securities. Securities purchased on a when-issued basis aremarked-to-market daily and the Fund begins earning interest on the settlement date. Losses may arise due to changes in the market value of the underlying securities or if the counterparty does not perform under the contract.
Loans
The Fund may invest in direct debt instruments which are interests in amounts owed to lenders by corporate or other borrowers. The loans pay interest at rates which are periodically reset by reference to a base lending rate plus a spread. Investments in loans may be in the form of participations in loans or assignments of all or a portion of loans from third parties. When the Fund purchases participations, it generally has no rights to enforce compliance with the terms of the loan agreement with the borrower. As a result, the Fund assumes the credit risk of both the borrower and the lender that is selling the participation. When the Fund purchases assignments from lenders, it acquires direct rights against the borrower on the loan and may enforce compliance by the borrower with the terms of the loan agreement. Loans may include fully funded term loans or unfunded loan commitments, which are contractual obligations for future funding.
Futures contracts
Futures contracts are agreements between the Fund and a counterparty to buy or sell a specific amount of a commodity, financial instrument or currency at a specified price and on a specified date. The Fund may buy and sell futures contracts in order to gain exposure to, or protect against, changes in interest rates and foreign exchange rates and is subject to interest rate risk and foreign currency risk. The primary risks associated with the use of futures contracts are the imperfect correlation between changes in market values of securities held by the Fund and the prices of futures contracts, and the possibility of an illiquid market. Futures contracts are generally entered into on a regulated futures exchange and cleared through a clearinghouse associated with the exchange. With futures contracts, there is minimal counterparty risk to the Fund since futures contracts are exchange traded and the exchange’s clearinghouse, as the counterparty to all exchange traded futures, guarantees the futures contracts against default.
Wells Fargo Core Plus Bond Fund | 33
Notes to financial statements (unaudited)
Upon entering into a futures contracts, the Fund is required to deposit either cash or securities (initial margin) with the broker in an amount equal to a certain percentage of the contract value. Subsequent payments (variation margin) are paid to or from the broker each day equal to the daily changes in the contract value. Such payments are recorded as unrealized gains or losses and, if any, shown as variation margin receivable (payable) in the Statement of Assets and Liabilities. Should the Fund fail to make requested variation margin payments, the broker can gain access to the initial margin to satisfy the Fund’s payment obligations. When the contracts are closed, a realized gain or loss is recorded in the Statement of Operations.
Swap contracts
Swap contracts are agreements between the Fund and a counterparty to exchange a series of cash flows over a specified period. Swap agreements are privately negotiated contracts between the Fund that are entered into as bilateral contracts in the OTC market (“OTC swaps”) or centrally cleared (“centrally cleared swaps”) with a central clearinghouse.
The Fund entered into centrally cleared swaps. In a centrally cleared swap, immediately following execution of the swap contract, the swap contract is novated to a central counterparty (the “CCP”) and the Fund’s counterparty on the swap agreement becomes the CCP. Upon entering into a centrally cleared swap, the Fund is required to deposit an initial margin with the broker in the form of cash or securities. Securities deposited as initial margin are designated in the Portfolio of Investments and cash deposited is shown as cash segregated for centrally cleared swaps in the Statement of Assets and Liabilities. Pursuant to the contract, the Fund agrees to receive from or pay to the broker an amount of cash equal to the daily fluctuation in market value of the contract (“variation margin”). The variation margin is recorded as an unrealized gain (or loss) and shown as variation margin receivable (or payable) on centrally cleared swaps in the Statement of Assets and Liabilities. Payments received from (paid to) the counterparty, including at termination, are recorded as realized gains (losses) in the Statement of Operations.
Credit default swaps
The Fund may enter into credit default swaps for hedging or speculative purposes to provide or receive a measure of protection against default on a referenced entity, obligation or index or a basket of single-name issuers or traded indexes. An index credit default swap references all the names in the index, and if a credit event is triggered, the credit event is settled based on that name’s weight in the index. Credit default swaps are agreements in which the protection buyer pays fixed periodic payments to the protection seller in consideration for a promise from the protection seller to make a specific payment should a negative credit event take place with respect to the referenced entity (e.g., bankruptcy, failure to pay, obligation acceleration, repudiation, moratorium or restructuring).
The Fund may enter into credit default swaps as either the seller of protection or the buyer of protection. If the Fund is the buyer of protection and a credit event occurs, the Fund will either receive from the seller an amount equal to the notional amount of the swap and deliver the referenced security or underlying securities comprising the index, or receive a net settlement of cash equal to the notional amount of the swap less the recovery value of the security or underlying securities comprising the index. If the Fund is the seller of protection and a credit event occurs, the Fund will either pay the buyer an amount equal to the notional amount of the swap and take delivery of the referenced security or underlying securities comprising the index or pay a net settlement of cash equal to the notional amount of the swap less the recovery value of the security or underlying securities comprising the index.
As the seller of protection, the Fund is subject to investment exposure on the notional amount of the swap and has assumed the risk of default of the underlying security or index. As the buyer of protection, the Fund could be exposed to risks if the seller of the protection defaults on its obligation to perform, or if there are unfavorable changes in the fluctuation of interest rates.
By entering into credit default swap contracts, the Fund is exposed to credit risk. In addition, certain credit default swap contracts entered into by the Fund provide for conditions that result in events of default or termination that enable the counterparty to the agreement to cause an early termination of the transactions under those agreements.
Security transactions and income recognition
Securities transactions are recorded on a trade date basis. Realized gains or losses are recorded on the basis of identified cost.
Interest income is accrued daily and bond discounts are accreted and premiums are amortized daily. To the extent debt obligations are placed onnon-accrual status, any related interest income may be reduced by writing off interest receivables when the collection of all or a portion of interest has been determined to be doubtful based on consistently applied procedures and the fair value has decreased. If the issuer subsequently resumes interest payments or when the collectability of interest is reasonably assured, the debt obligation is removed fromnon-accrual status.
Income dividends and capital gain distributions from investment companies are recorded on the ex-dividend date. Capital gain distributions from investment companies are treated as realized gains.
Income from foreign securities is recorded net of foreign taxes withheld where recovery of such taxes is not assured.
34 | Wells Fargo Core Plus Bond Fund
Notes to financial statements (unaudited)
Distributions to shareholders
Distributions to shareholders are recorded on theex-dividend date and paid from net investment income monthly and any net realized gains are paid at least annually. Such distributions are determined in accordance with income tax regulations and may differ from U.S. generally accepted accounting principles. Dividend sources are estimated at the time of declaration. The tax character of distributions is determined as of the Fund’s fiscal year end. Therefore, a portion of the Fund’s distributions made prior to the Fund’s fiscal year end may be categorized as a tax return of capital at year end.
Federal and other taxes
The Fund intends to continue to qualify as a regulated investment company by distributing substantially all of its investment company taxable income and any net realized capital gains (after reduction for capital loss carryforwards) sufficient to relieve it from all, or substantially all, federal income taxes. Accordingly, no provision for federal income taxes was required.
The Fund’s income and federal excise tax returns and all financial records supporting those returns for the prior three fiscal years are subject to examination by the federal and Delaware revenue authorities. Management has analyzed the Fund’s tax positions taken on federal, state, and foreign tax returns for all open tax years and does not believe that there are any uncertain tax positions that require recognition of a tax liability.
As of February 29, 2020, the aggregate cost of all investments for federal income tax purposes was $1,166,005,539 and the unrealized gains (losses) consisted of:
| | | | |
| |
Gross unrealized gains | | $ | 52,151,181 | |
| |
Gross unrealized losses | | | (15,098,543 | ) |
| |
Net unrealized gains | | $ | 37,052,638 | |
Class allocations
The separate classes of shares offered by the Fund differ principally in applicable sales charges, distribution, shareholder servicing, and administration fees. Class specific expenses are charged directly to that share class. Investment income, common fund-level expenses, and realized and unrealized gains (losses) on investments are allocated daily to each class of shares based on the relative proportion of net assets of each class.
3. FAIR VALUATION MEASUREMENTS
Fair value measurements of investments are determined within a framework that has established a fair value hierarchy based upon the various data inputs utilized in determining the value of the Fund’s investments. The three-level hierarchy gives the highest priority to unadjusted quoted prices in active markets for identical assets or liabilities (Level 1) and the lowest priority to unobservable inputs (Level 3). The Fund’s investments are classified within the fair value hierarchy based on the lowest level of input that is significant to the fair value measurement. The inputs are summarized into three broad levels as follows:
| ∎ | | Level 1 – quoted prices in active markets for identical securities |
| ∎ | | Level 2 – other significant observable inputs (including quoted prices for similar securities, interest rates, prepayment speeds, credit risk, etc.) |
| ∎ | | Level 3 – significant unobservable inputs (including the Fund’s own assumptions |
in determining the fair value of investments)
The inputs or methodologies used for valuing investments in securities are not necessarily an indication of the risk associated with investing in those securities.
Wells Fargo Core Plus Bond Fund | 35
Notes to financial statements (unaudited)
The following is a summary of the inputs used in valuing the Fund’s assets and liabilities as of February 29, 2020:
| | | | | | | | | | | | | | | | |
| | | | |
| | | Quoted prices
(Level 1) | | | Other significant
observable inputs
(Level 2) | | | Significant
unobservable inputs
(Level 3) | | | Total | |
| | | | | | | | | | | | | | | | |
| | | | |
Assets | | | | | | | | | | | | | | | | |
Investments in: | | | | | | | | | | | | | | | | |
| | | | |
Agency securities | | $ | 0 | | | $ | 234,514,410 | | | $ | 0 | | | $ | 234,514,410 | |
| | | | |
Asset-backed securities | | | 0 | | | | 106,923,441 | | | | 0 | | |
| 106,923,441
|
|
| | | | |
Corporate bonds and notes | | | 0 | | | | 258,062,452 | | | | 0 | | | | 258,062,452 | |
| | | | |
Foreign corporate bonds and notes | | | 0 | | | | 30,613,284 | | | | 0 | | | | 30,613,284 | |
| | | | |
Foreign government bonds | | | 0 | | | | 23,177,957 | | | | 0 | | | | 23,177,957 | |
| | | | |
Loans | | | 0 | | | | 2,722,242 | | | | 1,112,771 | | | | 3,835,013 | |
| | | | |
Municipal obligations | | | 0 | | | | 20,869,474 | | | | 0 | | | | 20,869,474 | |
| | | | |
Non-agency mortgage-backed securities | | | 0 | | | | 221,653,244 | | | | 0 | | | | 221,653,244 | |
| | | | |
U.S. Treasury securities | | | 83,817,297 | | | | 0 | | | | 0 | | | | 83,817,297 | |
| | | | |
Yankee corporate bonds and notes | | | 0 | | | | 121,121,424 | | | | 0 | | | | 121,121,424 | |
| | | | |
Yankee government bonds | | | 0 | | | | 17,794,782 | | | | 0 | | | | 17,794,782 | |
| | | | |
Short-term investments | | | | | | | | | | | | | | | | |
| | | | |
Investment companies | | | 77,672,670 | | | | 0 | | | | 0 | | | | 77,672,670 | |
| | | | |
| | | 161,489,967 | | | | 1,037,452,710 | | | | 1,112,771 | | | | 1,200,055,448 | |
| | | | |
Futures contracts | | | 2,813,655 | | | | 0 | | | | 0 | | | | 2,813,655 | |
| | | | |
Forward foreign currency contracts | | | 0 | | | | 867,655 | | | | 0 | | | | 867,655 | |
| | | | |
Credit default swap contracts | | | 0 | | | | 288,001 | | | | 0 | | | | 288,001 | |
| | | | |
Total assets | | $ | 164,303,622 | | | $ | 1,038,608,366 | | | $ | 1,112,771 | | | $ | 1,204,024,759 | |
| | | | |
Liabilities | | | | | | | | | | | | | | | | |
| | | | |
Futures contracts | | $ | 943,017 | | | $ | 0 | | | $ | 0 | | | $ | 943,017 | |
| | | | |
Forward foreign currency contracts | | | 0 | | | | 23,565 | | | | 0 | | | | 23,565 | |
| | | | |
Total liabilities | | $ | 943,017 | | | $ | 23,565 | | | $ | 0 | | | $ | 966,582 | |
Additional sector, industry or geographic detail is included in the Portfolio of Investments.
Futures contracts, forward foreign currency contracts and swap contracts are reported at their cumulative unrealized gains (losses) at measurement date as reported in the tables following the Portfolio of Investments. For futures contracts and centrally cleared swaps, the current day’s variation margin is reported on the Statement of Assets and Liabilities. All other assets and liabilities are reported at their market value at measurement date.
For the six months ended February 29, 2020, the Fund had no material transfers into/out of Level 3.
4. TRANSACTIONS WITH AFFILIATES
Management fee
Funds Management, an indirect wholly owned subsidiary of Wells Fargo & Company (“Wells Fargo”), is the manager of the Fund and provides advisory and fund-level administrative services under an investment management agreement. Under the investment management agreement, Funds Management is responsible for, among other services, implementing the investment objectives and strategies of the Fund, supervising the subadviser and providing fund-level administrative services in
36 | Wells Fargo Core Plus Bond Fund
Notes to financial statements (unaudited)
connection with the Fund’s operations. As compensation for its services under the investment management agreement, Funds Management is entitled to receive a management fee at the following annual rate based on the Fund’s average daily net assets:
| | | | |
| |
| Average daily net assets | | Management fee | |
| |
First $500 million | | | 0.450 | % |
| |
Next $500 million | | | 0.425 | |
| |
Next $2 billion | | | 0.400 | |
| |
Next $2 billion | | | 0.375 | |
| |
Next $5 billion | | | 0.340 | |
| |
Over $10 billion | | | 0.320 | |
For the six months ended February 29, 2020, the management fee was equivalent to an annual rate of 0.44% of the Fund’s average daily net assets.
Funds Management has retained the services of a subadviser to provide daily portfolio management to the Fund. The fee for subadvisory services is borne by Funds Management. Wells Capital Management Incorporated (“WellsCap”), an affiliate of Funds Management and an indirect wholly owned subsidiary of Wells Fargo, is the subadviser to the Fund and is entitled to receive a fee from Funds Management at an annual rate starting at 0.20% and declining to 0.10% as the average daily net assets of the Fund increase.
Administration fees
Under a class-level administration agreement, Funds Management provides class-level administrative services to the Fund, which includes paying fees and expenses for services provided by the transfer agent,sub-transfer agents, omnibus account servicers and record-keepers. As compensation for its services under the class-level administration agreement, Funds Management receives an annual fee which is calculated based on the average daily net assets of each class as follows:
| | | | |
| |
| | | Class-level
administration fee | |
| |
Class A, Class C | | | 0.16 | % |
| |
Class R6 | | | 0.03 | |
| |
Administrator Class | | | 0.10 | |
| |
Institutional Class | | | 0.08 | |
Waivers and/or expense reimbursements
Funds Management has contractually waived and/or reimbursed management and administration fees to the extent necessary to maintain certain net operating expense ratios for the Fund. When each class of the Fund has exceeded its expense cap, Funds Management has waived fees and/or reimbursed expenses from fund-level expenses on a proportionate basis and then from class specific expenses. When only certain classes exceed their expense caps, waivers and/or reimbursements are applied against class specific expenses before fund-level expenses. Funds Management has committed through December 31, 2020 to waive fees and/or reimburse expenses to the extent necessary to cap the Fund’s expenses at 0.73% for Class A shares, 1.48% for Class C shares, 0.35% for Class R6 shares, 0.62% for Administrator Class shares, and 0.40% for Institutional Class shares. Prior to or after the commitment expiration date, the cap may be increased or the commitment to maintain the cap may be terminated only with the approval of the Board of Trustees.
Distribution fee
The Trust has adopted a distribution plan for Class C shares of the Fund pursuant to Rule12b-1 under the 1940 Act. A distribution fee is charged to Class C shares and paid to Wells Fargo Funds Distributor, LLC (“Funds Distributor”), the principal underwriter, at an annual rate of 0.75% of the average daily net assets of Class C shares.
In addition, Funds Distributor is entitled to receive thefront-end sales charge from the purchase of Class A shares and a contingent deferred sales charge on the redemption of certain Class A shares. Funds Distributor is also entitled to receive the contingent deferred sales charges from redemptions of Class C shares. For the six months ended February 29, 2020, Funds Distributor received $8,513 from the sale of Class A shares. No contingent deferred sales charges were incurred by Class A and Class C shares for the six months ended February 29, 2020.
Wells Fargo Core Plus Bond Fund | 37
Notes to financial statements (unaudited)
Shareholder servicing fees
The Trust has entered into contracts with one or more shareholder servicing agents, whereby Class A, Class C, and Administrator Class of the Fund are charged a fee at an annual rate of 0.25% of the average daily net assets of each respective class. A portion of these total shareholder servicing fees were paid to affiliates of Wells Fargo.
Interfund transactions
The Fund may purchase or sell portfolio investment securities to certain other Wells Fargo affiliates pursuant to Rule17a-7 under the 1940 Act and under procedures adopted by the Board of Trustees. The procedures have been designed to ensure that these interfund transactions, which do not incur broker commissions, are effected at current market prices. Pursuant to these procedures, the Fund had $605,669 and $0 in interfund purchases and sales, respectively, during the six months ended February 29, 2020.
5. INVESTMENT PORTFOLIO TRANSACTIONS
Purchases and sales of investments, excluding short-term securities, for the six months ended February 29, 2020 were as follows:
| | | | | | |
Purchases at cost | | Sales proceeds |
U.S.
government | | Non-U.S.
government | | U.S.
government | | Non-U.S.
government |
| $368,787,969 | | $521,566,454 | | $308,962,208 | | $188,172,464 |
6. SECURITIES LENDING TRANSACTIONS
The Fund lends its securities through an unaffiliated securities lending agent and receives collateral in the form of cash or securities with a value at least equal to the value of the securities on loan. The value of the loaned securities is determined at the close of each business day and any increases or decreases in the required collateral are exchanged between the Fund and the counterparty on the next business day. Cash collateral received is invested in the Securities Lending Fund which seeks to provide a positive return compared to the daily Fed Funds Open Rate by investing in high-quality, U.S. dollar-denominated short-term money market instruments and is exempt from registration under Section 3(c)(7) of the 1940 Act. Securities Lending Fund is managed by Funds Management and is subadvised by WellsCap. Funds Management receives an advisory fee starting at 0.05% and declining to 0.01% as the average daily net assets of the Securities Lending Fund increase. All of the fees received by Funds Management are paid to WellsCap for its services as subadviser.
In the event of counterparty default or the failure of a borrower to return a loaned security, the Fund has the right to use the collateral to offset any losses incurred. As of February 29, 2020, the Fund had securities lending transactions with the following counterparties which are subject to offset:
| | | | | | | | | | | | |
| | | |
| Counterparty | | Value of
securities on
loan | | | Collateral
received1 | | | Net amount | |
| | | |
Citigroup Global Markets Inc. | | $ | 4,652,076 | | | $ | (4,652,076 | )�� | | $ | 0 | |
| | | |
Barclays Capital Inc. | | | 2,809,976 | | | | (2,809,976 | ) | | | 0 | |
| | | |
JPMorgan Securities LLC | | | 107,260 | | | | (107,260 | ) | | | 0 | |
| 1 | Collateral received within this table is limited to the collateral for the net transaction with the counterparty. |
7. DERIVATIVE TRANSACTIONS
During the six months ended February 29, 2020, the Fund entered into futures contracts to speculate on interest rates and to help manage the duration of the portfolio. The Fund also entered into forward foreign currency contracts for economic hedging purposes and entered into credit default swap contracts to hedge risks and/or enhance total returns.
38 | Wells Fargo Core Plus Bond Fund
Notes to financial statements (unaudited)
The volume of the Fund’s derivative activity during the six months ended February 29, 2020 was as follows:
| | | | |
Futures contracts | | | | |
| |
Average notional balance on long futures | | $ | 258,598,821 | |
| |
Average notional balance on short futures | | | 47,477,171 | |
| |
Forward foreign currency contracts | | | | |
| |
Average contract amounts to buy | | | 14,076,793 | |
| |
Average contract amounts to sell | | | 62,702,219 | |
| |
Credit default swap contracts | | | | |
| |
Average notional balance | | | 13,402,747 | |
The Fund’s credit default swap may contain provisions for early termination in the event the net assets of the Fund declines below specific levels identified by the counterparty. If these levels are triggered, the counterparty may terminate the transaction and seek payment or request full collateralization of the derivative transactions in net liability positions.
A summary of the location of derivative instruments on the financial statements by risk is outlined in the following tables.
The fair value of derivative instruments as of February 29, 2020 by risk type was as follows for the Fund:
| | | | | | | | | | | | |
| | | Asset derivatives | | | Liability derivatives | |
| | | | |
| | | Statement of Assets and
Liabilities location | | Fair value | | | Statement of Assets and
Liabilities location | | Fair value | |
| | | | |
Interest rate risk | | Unrealized gains on futures contracts | | $ | 2,695,816 | * | | Unrealized losses on futures contracts | | $ | 585,980 | * |
| | | | |
Foreign currency risk | | Unrealized gains on futures contracts | | | 117,839 | * | | Unrealized losses on futures contracts | | | 357,037 | * |
| | | | |
Foreign currency risk | | Unrealized gains on forward foreign currency contracts | | | 867,655 | | | Unrealized losses on forward foreign currency contracts | | | 23,565 | |
| | | | |
Credit risk | | Net unrealized gains on swap contracts | | | 288,001 | * | | Net unrealized losses on swap contracts | | | 0 | * |
| | | | |
| | | | | $ | 3,969,311 | | | | | $ | 966,582 | |
| * | Amount represents cumulative unrealized gains (losses) as reported in the tables following the Portfolio of Investments. Only the current day’s variation margin as of February 29, 2020 is reported separately on the Statement of Assets and Liabilities. |
The effect of derivative instruments on the Statement of Operations for the six months ended February 29, 2020 was as follows for the Fund:
| | | | | | | | | | | | | | | | |
| | | Amount of realized gains (losses) on derivatives | |
| | | | |
| | | Futures
contracts | | | Forward
foreign
currency
contracts | | | Swap
contracts | | | Total | |
| | | | |
Interest rate risk | | $ | 2,212,693 | | | $ | 0 | | | $ | 0 | | | $ | 2,212,693 | |
| | | | |
Foreign currency risk | | | (64,531 | ) | | | 1,023,325 | | | | 0 | | | | 958,794 | |
| | | | |
Credit risk | | | 0 | | | | 0 | | | | 102,362 | | | | 102,362 | |
| | | | |
| | | $ | 2,148,162 | | | $ | 1,023,325 | | | $ | 102,362 | | | $ | 3,273,849 | |
| |
| | | Change in unrealized gains (losses) on derivatives | |
| | | | |
| | | Futures
contracts | | | Forward
foreign
currency
contracts | | | Swap
contracts | | | Total | |
| | | | |
Interest rate risk | | $ | 1,223,140 | | | $ | 0 | | | $ | 0 | | | $ | 1,223,140 | |
| | | | |
Foreign currency risk | | | 407,340 | | | | (619,480 | ) | | | 0 | | | | (212,140 | ) |
| | | | |
Credit risk | | | 0 | | | | 0 | | | | 244,040 | | | | 244,040 | |
| | | | |
| | | $ | 1,630,480 | | | $ | (619,480 | ) | | $ | 244,040 | | | $ | 1,255,040 | |
Wells Fargo Core Plus Bond Fund | 39
Notes to financial statements (unaudited)
For certain types of derivative transactions, the Fund has entered into International Swaps and Derivatives Association, Inc. master agreements (“ISDA Master Agreements”) or similar agreements with approved counterparties. The ISDA Master Agreements or similar agreements may have requirements to deliver/deposit securities or cash to/with an exchange or broker-dealer as collateral and allows the Fund to offset, with each counterparty, certain derivative financial instrument’s assets and/or liabilities with collateral held or pledged. Collateral requirements differ by type of derivative. Collateral or margin requirements are set by the broker or exchange clearinghouse for exchange traded derivatives while collateral terms are contract specific forover-the-counter traded derivatives. Cash collateral that has been pledged to cover obligations of the Fund under ISDA Master Agreements or similar agreements, if any, are reported separately in the Statement of Assets and Liabilities. Securities pledged as collateral, if any, are noted in the Portfolio of Investments. With respect to balance sheet offsetting, absent an event of default by the counterparty or a termination of the agreement, the reported amounts of financial assets and financial liabilities in the Statement of Assets and Liabilities are not offset across transactions between the Fund and the applicable counterparty. A reconciliation of the gross amounts on the Statement of Assets and Liabilities to the net amounts by counterparty, including any collateral exposure, is as follows:
| | | | | | | | | | | | |
| | | | |
| Counterparty | | Gross amounts
of assets in the
Statement of
Assets and
Liabilities | | Amounts
subject to
netting
agreements | | Collateral
received | | | Net amount
of assets | |
| | | | |
Citibank | | $867,655 | | $(23,565) | | $ | 0 | | | $ | 844,090 | |
| | | | | | | | | | | | |
| | | | |
| Counterparty | | Gross amounts
of liabilities in the
Statement of
Assets and
Liabilities | | Amounts
subject to
netting
agreements | | Collateral
pledged | | | Net amount
of liabilities | |
| | | | |
Citibank | | $23,565 | | $(23,565) | | $ | 0 | | | $ | 0 | |
8. BANK BORROWINGS
The Trust (excluding the money market funds), Wells Fargo Master Trust and Wells Fargo Variable Trust are parties to a $280,000,000 revolving credit agreement whereby the Fund is permitted to use bank borrowings for temporary or emergency purposes, such as to fund shareholder redemption requests. Interest under the credit agreement is charged to the Fund based on a borrowing rate equal to the higher of the Federal Funds rate in effect on that day plus 1.25% or the overnight LIBOR rate in effect on that day plus 1.25%. In addition, an annual commitment fee equal to 0.25% of the unused balance is allocated to each participating fund.
For the six months ended February 29, 2020, there were no borrowings by the Fund under the agreement.
9. INDEMNIFICATION
Under the Trust’s organizational documents, the officers and Trustees have been granted certain indemnification rights against certain liabilities that may arise out of performance of their duties to the Trust. Additionally, in the normal course of business, the Trust may enter into contracts with service providers that contain a variety of indemnification clauses. The Trust’s maximum exposure under these arrangements is dependent on future claims that may be made against the Fund and, therefore, cannot be estimated.
10. NEW ACCOUNTING PRONOUNCEMENTS
In August 2018, FASB issued Accounting Standards Update (“ASU”)No. 2018-13, Fair Value Measurement (Topic 820)Disclosure Framework—Changes to the Disclosure Requirements for Fair Value Measurement.ASU2018-13 updates the disclosure requirements for fair value measurements by modifying or removing certain disclosures and adding certain new disclosures. The amendments are effective for fiscal years, and interim periods within those fiscal years, beginning after December 15, 2019. Early adoption is permitted. Management has adopted the removal and modification of disclosures early, as permitted, and will adopt the additional new disclosures at the effective date.
In March 2017, FASB issued ASUNo. 2017-08,Premium Amortization on Purchased Callable Debt Securities. ASU2017-08 shortens the amortization period for certain callable debt securities held at a premium and requires the premium to be amortized to the earliest call date. The amendments do not require an accounting change for securities held at a discount and discounts will continue to be accreted to the maturity date of the security. ASU2017-08 is effective for fiscal years beginning
40 | Wells Fargo Core Plus Bond Fund
Notes to financial statements (unaudited)
after December 15, 2018 and for interim periods within those fiscal years. During the current reporting period, management of the Fund adopted the change in accounting policy which did not have a material impact to the Fund’s financial statements.
11. SUBSEQUENT EVENT
On March 11, 2020, the World Health Organization announced that it had made the assessment that coronavirus disease 2019(“COVID-19”) is a pandemic. The impacts ofCOVID-19 is adversely affecting the entire global economy, individual companies and investment products, and the market in general. There is significant uncertainty around the extent and duration of business disruptions related toCOVID-19 and the impact may be short term or may last for an extended period of time. The risk of further spreading ofCOVID-19 has led to significant uncertainty and volatility in the financial markets and the value of the Fund and the securities in which the Fund invests have generally been adversely affected by impacts caused byCOVID-19.
Wells Fargo Core Plus Bond Fund | 41
Other information (unaudited)
PROXY VOTING INFORMATION
A description of the policies and procedures used to determine how to vote proxies relating to portfolio securities is available, upon request, by calling1-800-222-8222, visiting our website atwfam.com, or visiting the SEC website at sec.gov. Information regarding how the proxies related to portfolio securities were voted during the most recent12-month period ended June 30 is available on the website atwfam.comor by visiting the SEC website at sec.gov.
QUARTERLY PORTFOLIO HOLDINGS INFORMATION
The Fund files its complete schedule of portfolio holdings with the SEC for the first and third quarters of each fiscal year as an exhibit to its reports on FormN-PORT. Shareholders may view the filed FormN-PORT by visiting the SEC website at sec.gov.
42 | Wells Fargo Core Plus Bond Fund
Other information (unaudited)
BOARD OF TRUSTEES AND OFFICERS
Each of the Trustees and Officers1 listed in the table below acts in identical capacities for each fund in the Wells Fargo family of funds, which consists of 146 mutual funds comprising the Wells Fargo Funds Trust, Wells Fargo Variable Trust, Wells Fargo Master Trust and fourclosed-end funds (collectively the “Fund Complex”). This table should be read in conjunction with the Prospectus and the Statement of Additional Information2. The mailing address of each Trustee and Officer is 525 Market Street, 12th Floor, San Francisco, CA 94105. Each Trustee and Officer serves an indefinite term, however, each Trustee serves such term until reaching the mandatory retirement age established by the Trustees.
Independent Trustees
| | | | | | |
Name and
year of birth | | Position held and
length of service* | | Principal occupations during past five years or longer | | Current other
public company or
investment
company
directorships |
| | | |
William R. Ebsworth (Born 1957) | | Trustee,
since 2015 | | Retired. From 1984 to 2013, equities analyst, portfolio manager, research director and chief investment officer at Fidelity Management and Research Company in Boston, Tokyo, and Hong Kong, and retired in 2013 as Chief Investment Officer of Fidelity Strategic Advisers, Inc. where he led a team of investment professionals managing client assets. Prior thereto, Board member of Hong Kong Securities Clearing Co., Hong Kong Options Clearing Corp., the Thailand International Fund, Ltd., Fidelity Investments Life Insurance Company, and Empire Fidelity Investments Life Insurance Company. Audit Committee Chair and Investment Committee Chair of the Vincent Memorial Hospital Endowment(non-profit organization). Mr. Ebsworth is a CFA® charterholder. | | N/A |
| | | |
Jane A. Freeman (Born 1953) | | Trustee,
since 2015; Chair Liaison, since 2018 | | Retired. From 2012 to 2014 and 1999 to 2008, Chief Financial Officer of Scientific Learning Corporation. From 2008 to 2012, Ms. Freeman provided consulting services related to strategic business projects. Prior to 1999, Portfolio Manager at Rockefeller & Co. and Scudder, Stevens & Clark. Board member of the Harding Loevner Funds from 1996 to 2014, serving as both Lead Independent Director and chair of the Audit Committee. Board member of the Russell Exchange Traded Funds Trust from 2011 to 2012 and the chair of the Audit Committee. Ms. Freeman is a Board Member of The Ruth Bancroft Garden(non-profit organization). She is also an inactive Chartered Financial Analyst. | | N/A |
| | | |
Isaiah Harris, Jr. (Born 1952) | | Trustee,
since 2009; Audit Committee Chairman, since 2019 | | Retired. Chairman of the Board of CIGNA Corporation since 2009, and Director since 2005. From 2003 to 2011, Director of Deluxe Corporation. Prior thereto, President and CEO of BellSouth Advertising and Publishing Corp. from 2005 to 2007, President and CEO of BellSouth Enterprises from 2004 to 2005 and President of BellSouth Consumer Services from 2000 to 2003. Emeritus member of the Iowa State University Foundation Board of Governors. Emeritus Member of the Advisory Board of Iowa State University School of Business. Advisory Board Member, Palm Harbor Academy (private school). Advisory Board Member, Child Evangelism Fellowship(non-profit). Mr. Harris is a certified public accountant (inactive status). | | CIGNA Corporation |
| | | |
Judith M. Johnson (Born 1949) | | Trustee,
since 2008; Audit Committee Chairman, from 2009 to 2018 | | Retired. Prior thereto, Chief Executive Officer and Chief Investment Officer of Minneapolis Employees Retirement Fund from 1996 to 2008. Ms. Johnson is an attorney, certified public accountant and a certified managerial accountant. | | N/A |
Wells Fargo Core Plus Bond Fund | 43
Other information (unaudited)
| | | | | | |
Name and
year of birth | | Position held and
length of service* | | Principal occupations during past five years or longer | | Current other
public company or
investment
company
directorships |
| | | |
David F. Larcker (Born 1950) | | Trustee,
since 2009 | | James Irvin Miller Professor of Accounting at the Graduate School of Business, Stanford University, Director of the Corporate Governance Research Initiative and Senior Faculty of The Rock Center for Corporate Governance since 2006. From 2005 to 2008, Professor of Accounting at the Graduate School of Business, Stanford University. Prior thereto, Ernst & Young Professor of Accounting at The Wharton School, University of Pennsylvania from 1985 to 2005. | | N/A |
| | | |
Olivia S. Mitchell (Born 1953) | | Trustee,
since 2006; Nominating and Governance Committee Chair, since 2018 | | International Foundation of Employee Benefit Plans Professor, Wharton School of the University of Pennsylvania since 1993. Director of Wharton’s Pension Research Council and Boettner Center on Pensions & Retirement Research, and Research Associate at the National Bureau of Economic Research. Previously, Cornell University Professor from 1978 to 1993. | | N/A |
| | | |
Timothy J. Penny (Born 1951) | | Trustee,
since 1996; Chairman, since 2018 | | President and Chief Executive Officer of Southern Minnesota Initiative Foundation, anon-profit organization, since 2007. Member of the Board of Trustees of NorthStar Education Finance, Inc., anon-profit organization, since 2007. | | N/A |
| | | |
James G. Polisson (Born 1959) | | Trustee,
since 2018 | | Retired. Chief Marketing Officer, Source (ETF) UK Services, Ltd, from 2015 to 2017. From 2012 to 2015, Principal of The Polisson Group, LLC, a management consulting, corporate advisory and principal investing company. Chief Executive Officer and Managing Director at Russell Investments, Global Exchange Traded Funds from 2010 to 2012. Managing Director of Barclays Global Investors from 1998 to 2010 and Global Chief Marketing Officer for iShares and Barclays Global Investors from 2000 to 2010. Trustee of the San Francisco Mechanics’ Institute, anon-profit organization, from 2013 to 2015. Board member of the Russell Exchange Traded Fund Trust from 2011 to 2012. Director of Barclays Global Investors Holdings Deutschland GmbH from 2006 to 2009. Mr. Polisson is an attorney and has a retired status with the Massachusetts and District of Columbia Bar Associations. | | N/A |
| | | |
Pamela Wheelock3 (Born 1959) | | Trustee,
since January 2020; previously Trustee from January 2018 to July 2019 | | Board member of the Destination Medical Center Economic Development Agency, Rochester, Minnesota since 2019. Acting Commissioner, Minnesota Department of Human Services, July 2019 through September 2019. Human Services Manager (part-time), Minnesota Department of Human Services, October 2019 through December 2019. Chief Operating Officer, Twin Cities Habitat for Humanity from 2017 to 2019. Vice President of University Services, University of Minnesota from 2012 to 2016. Prior thereto, on the Board of Directors, Governance Committee and Finance Committee for the Minnesota Philanthropy Partners (Saint Paul Foundation) from 2012 to 2018, Interim Chief Executive Officer of Blue Cross Blue Shield of Minnesota from 2011 to 2012, Chairman of the Board from 2009 to 2012 and Board Director from 2003 to 2015. Vice President, Leadership and Community Engagement, Bush Foundation, Saint Paul, Minnesota (a private foundation) from 2009 to 2011. Executive Vice President and Chief Financial Officer, Minnesota Sports and Entertainment from 2004 to 2009 and Senior Vice President from 2002 to 2004. Executive Vice President of the Minnesota Wild Foundation from 2004 to 2008. Commissioner of Finance, State of Minnesota, from 1999 to 2002. Currently Board Chair of the Minnesota Wild Foundation since 2010. | | N/A |
| * | Length of service dates reflect the Trustee’s commencement of service with the Trust’s predecessor entities, where applicable. |
44 | Wells Fargo Core Plus Bond Fund
Other information (unaudited)
Officers
| | | | |
Name and
year of birth | | Position held and
length of service | | Principal occupations during past five years or longer |
| | |
| Andrew Owen (Born 1960) | | President, since 2017 | | Executive Vice President of Wells Fargo & Company and Head of Affiliated Managers, Wells Fargo Asset Management, since 2014. In addition, Mr. Owen is currently President, Chief Executive Officer and Director of Wells Fargo Funds Management, LLC since 2017. Prior thereto, Executive Vice President responsible for marketing, investments and product development for Wells Fargo Funds Management, LLC, from 2009 to 2014. |
| | |
| Nancy Wiser1 (Born 1967) | | Treasurer, since 2012 | | Executive Vice President of Wells Fargo Funds Management, LLC since 2011. Chief Operating Officer and Chief Compliance Officer at LightBox Capital Management LLC, from 2008 to 2011. |
| | |
| Michelle Rhee (Born 1966) | | Chief Legal Officer, since 2019 | | Secretary of Wells Fargo Funds Management, LLC, Chief Legal Counsel of Wells Fargo Asset Management and Assistant General Counsel of Wells Fargo Bank, N.A. since 2018. Associate General Counsel and Managing Director of Bank of America Corporation from 2004 to 2018. |
| | |
| Catherine Kennedy (Born 1969) | | Secretary, since 2019 | | Vice President of Wells Fargo Funds Management, LLC and Senior Counsel of the Wells Fargo Legal Department since 2010. Vice President and Senior Counsel of Evergreen Investment Management Company, LLC from 1998 to 2010. |
| | |
| Michael H. Whitaker(Born 1967) | | Chief Compliance Officer, since 2016 | | Chief Compliance Officer of Wells Fargo Asset Management since 2016. Senior Vice President and Chief Compliance Officer for Fidelity Investments from 2007 to 2016. |
| | |
| David Berardi (Born 1975) | | Assistant Treasurer, since 2009 | | Vice President of Wells Fargo Funds Management, LLC since 2009. Vice President of Evergreen Investment Management Company, LLC from 2008 to 2010. Manager of Fund Reporting and Control for Evergreen Investment Management Company, LLC from 2004 to 2010. |
| | |
| Jeremy DePalma1 (Born 1974) | | Assistant Treasurer, since 2009 | | Senior Vice President of Wells Fargo Funds Management, LLC since 2009. Senior Vice President of Evergreen Investment Management Company, LLC from 2008 to 2010 and head of the Fund Reporting and Control Team within Fund Administration from 2005 to 2010. |
| 1 | Nancy Wiser acts as Treasurer of 64 funds in the Fund Complex. Jeremy DePalma acts as Treasurer of 82 funds and Assistant Treasurer of 64 funds in the Fund Complex. |
| 2 | The Statement of Additional Information includes additional information about the Trustees and is available, without charge, upon request, by calling1-800-222-8222 or by visiting the website atwfam.com. |
| 3 | Pamela Wheelock wasre-appointed to the Board effective January 1, 2020. |
Wells Fargo Core Plus Bond Fund | 45
Appendix I (unaudited)
Effective on or about May 1, 2020, if you purchase Fund shares through a Janney Montgomery Scott LLC (“Janney”) brokerage account, you will be eligible for the following load waivers(front-end sales charge waivers and contingent deferred sales charge (“CDSC”), orback-end sales charge, waivers) and discounts, which may differ from those disclosed elsewhere in the Fund’s Prospectus or SAI.
|
|
| Front-end sales charge* waivers on Class A shares available at Janney |
|
| Shares purchased through reinvestment of capital gains distributions and dividend reinvestment when purchasing shares of the same fund (but not any other fund within the fund family). |
|
| Shares purchased by employees and registered representatives of Janney or its affiliates and their family members as designated by Janney. |
|
| Shares purchased from the proceeds of redemptions within the same fund family, provided (1) the repurchase occurs within ninety (90) days following the redemption, (2) the redemption and purchase occur in the same account, and (3) redeemed shares were subject to afront-end or deferred sales load (i.e., right of reinstatement). |
|
| Employer-sponsored retirement plans (e.g., 401(k) plans, 457 plans, employer-sponsored 403(b) plans, profit sharing and money purchase pension plans and defined benefit plans). For purposes of this provision, employer-sponsored retirement plans do not include SEP IRAs, Simple IRAs,SAR-SEPs or Keogh plans. |
|
| Shares acquired through a right of reinstatement. |
|
| Class C shares that are no longer subject to a contingent deferred sales charge and are converted to Class A shares of the same fund pursuant to Janney’s policies and procedures. |
|
| CDSC waivers on Class A and Class C shares available at Janney |
|
| Shares sold upon the death or disability of the shareholder. |
|
| Shares sold as part of a systematic withdrawal plan as described in the Fund’s Prospectus. |
|
| Shares purchased in connection with a return of excess contributions from an IRA account. |
|
| Shares sold as part of a required minimum distribution for IRA and retirement accounts if the redemption is taken in or after the year the shareholder reaches qualified age based on applicable IRS regulations. |
|
| Shares sold to pay Janney fees but only if the transaction is initiated by Janney. |
|
| Shares acquired through a right of reinstatement. |
|
| Shares exchanged into the same share class of a different fund. |
|
|
| Front-end sales charge* discounts available at Janney; breakpoints, rights of accumulation and/or letters of intent |
|
| Breakpoints as described in the Fund’s Prospectus. |
|
| Rights of accumulation (“ROA”), which entitle shareholders to breakpoint discounts, will be automatically calculated based on the aggregated holding of fund family assets held by accounts within the purchaser’s household at Janney. Eligible fund family assets not held at Janney may be included in the ROA calculation only if the shareholder notifies his or her financial advisor about such assets. |
|
| Letters of intent which allow for breakpoint discounts based on anticipated purchases within a fund family, over a13-month time period. Eligible fund family assets not held at Janney Montgomery Scott may be included in the calculation of letters of intent only if the shareholder notifies his or her financial advisor about such assets. |
| * | Also referred to as an “initial sales charge.” |
46 | Wells Fargo Core Plus Bond Fund
Appendix II (unaudited)
Effective on or after May 1, 2020, clients of Edward Jones (also referred to as “shareholders”) purchasing Fund shares on the Edward Jones commission andfee-based platforms are eligible only for the following sales charge discounts (also referred to as “breakpoints”) and waivers, which can differ from breakpoints and waivers described elsewhere in this Prospectus or SAI or through another broker-dealer. In all instances, it is the shareholder’s responsibility to inform Edward Jones at the time of purchase of any relationship, holdings of Wells Fargo Funds or other facts qualifying the purchaser for breakpoints or waivers. Edward Jones can ask for documentation of such circumstance.
|
| Breakpoints available at Edward Jones |
|
| Rights of Accumulation (ROA) |
|
The applicable sales charge on a purchase of Class A shares is determined by taking into account all share classes (except any money market funds and retirement plan share classes) of Wells Fargo Funds held by the shareholder or in an account grouped by Edward Jones with other accounts for the purpose of providing certain pricing considerations (“pricing groups”). This includes all share classes held on the Edward Jones platform and/or held on another platform. The inclusion of eligible fund family assets in the rights of accumulation calculation is dependent on the shareholder notifying his or her financial advisor of such assets at the time of calculation. |
|
ROA is determined by calculating the higher of cost or market value (current shares x NAV). |
|
| Letter of Intent (LOI) |
|
Through a LOI, shareholders can receive the sales charge and breakpoint discounts for purchases shareholders intend to makeover a13-month period from the date Edward Jones receives the LOI. The LOI is determined by calculating the higher of cost or market value of qualifying holdings at LOI initiation in combination with the value that the shareholder intends to buy over a13-month period to calculate thefront-end sales charge and any breakpoint discounts. Each purchase the shareholder makes during that13-month period will receive the sales charge and breakpoint discount that applies to the total amount. The inclusion of eligible fund family assets in the LOI calculation is dependent on the shareholder notifying his or her financial advisor of such assets at the time of calculation. Purchases made before the LOI is received by Edward Jones are not covered under the LOI and will not reduce the sales charge previously paid. Sales charges will be adjusted if LOI is not met. |
| Sales charges are waived for the following shareholders and in the following situations at Edward Jones: |
● Associates of Edward Jones and its affiliates and their family members who are in the same pricing group (as determined by Edward Jones under its policies and procedures) as the associate. This waiver will continue for the remainder of the associate’s life if the associate retires from Edward Jones in good-standing. |
● Shares purchased in an Edward Jonesfee-based program. |
● Shares purchased through reinvestment of capital gains distributions and dividend reinvestment. |
● Shares purchased from the proceeds of redeemed shares of the same fund family so long as the following conditions are met: 1)the proceeds are from the sale of shares within 60 days of the purchase, and 2) the sale and purchase are made in the same share class and the same account or the purchase is made in an individual retirement account with proceeds from liquidations in anon-retirement account. |
● Shares exchanged into Class A shares from another share class so long as the exchange is into the same fund and was initiated at the discretion of Edward Jones. Edward Jones is responsible for any remaining CDSC due to the fund company, if applicable. Any future purchases are subject to the applicable sales charge as disclosed in the prospectus. |
● Exchanges from Class C shares to Class A shares of the same fund, generally, in the 84th month following the anniversary of the purchase date or earlier at the discretion of Edward Jones. |
If the shareholder purchases shares that are subject to a CDSC and those shares are redeemed before the CDSC is expired, the shareholder is
responsible to pay the CDSC except in the following conditions available at Edward Jones: |
● The death or disability of the shareholder. |
● Systematic withdrawals with up to 10% per year of the account value. |
● Return of excess contributions from an Individual Retirement Account (IRA). |
● Shares sold as part of a required minimum distribution for IRA and retirement accounts if the redemption is taken in or after the year the shareholder reaches qualified age based on applicable IRS regulation. |
● Shares sold to pay Edward Jones fees or costs in such cases where the transaction is initiated by Edward Jones. |
● Shares exchanged in an Edward Jonesfee-based program. |
● Shares acquired through NAV reinstatement. |
Wells Fargo Core Plus Bond Fund | 47
Appendix II (unaudited)
|
| Other Important Information for accounts at Edward Jones: |
Minimum Purchase Amounts ● $250 initial purchase minimum ● $50 subsequent purchase minimum |
Minimum Balances Edward Jones has the right to redeem at its discretion fund holdings with a balance of $250 or less. The following are examples of accounts that are not included in this policy: ● Afee-based account held on an Edward Jones platform ● A 529 account held on an Edward Jones platform ● An account with an active systematic investment plan or letter of intent (LOI) |
Changing Share Classes At any time it deems necessary, Edward Jones has the authority to exchange at NAV a shareholder’s holdings in a fund to Class A shares. |
48 | Wells Fargo Core Plus Bond Fund

For more information
More information about Wells Fargo Funds is available free upon request. To obtain literature, please write, visit the Fund’s website, or call:
Wells Fargo Funds
P.O. Box 219967
Kansas City, MO 64121-9967
Website:wfam.com
Individual investors:1-800-222-8222
Retail investment professionals:1-888-877-9275
Institutional investment professionals:1-866-765-0778

This report and the financial statements contained herein are submitted for the general information of the shareholders of the Fund. If this report is used for promotional purposes, distribution of the report must be accompanied or preceded by a current prospectus. Before investing, please consider the investment objectives, risks, charges, and expenses of the investment. For a current prospectus and, if available, a summary prospectus, containing this information, call1-800-222-8222 or visit the Fund’s website atwfam.com. Read the prospectus carefully before you invest or send money.
Wells Fargo Asset Management (WFAM) is the trade name for certain investment advisory/management firms owned by Wells Fargo & Company. These firms include but are not limited to Wells Capital Management Incorporated and Wells Fargo Funds Management, LLC. Certain products managed by WFAM entities are distributed by Wells Fargo Funds Distributor, LLC (a broker-dealer and Member FINRA).
This material is for general informational and educational purposes only and is NOT intended to provide investment advice or a recommendation of any kind—including a recommendation for any specific investment, strategy, or plan.
INVESTMENT PRODUCTS: NOT FDIC INSURED ◾ NO BANK GUARANTEE ◾ MAY LOSE VALUE
© 2020 Wells Fargo & Company. All rights reserved
PAR-0220-04692 04-20
SA219/SAR219 02-20
Semi-Annual Report
February 29, 2020
Wells Fargo
Short Duration Government Bond Fund
Beginning on January 1, 2021, as permitted by new regulations adopted by the Securities and Exchange Commission, paper copies of the Wells Fargo Funds’ annual and semi-annual shareholder reports issued after this date will no longer be sent by mail, unless you specifically request paper copies of the reports. Instead, the reports will be made available on the Funds’ website, and you will be notified by mail each time a report is posted and provided with a website address to access the report.
If you already elected to receive shareholder reports electronically, you will not be affected by this change and you need not take any action. You may elect to receive shareholder reports and other communications from the Fund electronically at any time by contacting your financial intermediary (such as a broker-dealer or bank) or, if you are a direct investor, by calling1-800-222-8222 or by enrolling at wellsfargo.com/advantagedelivery.
You may elect to receive all future reports in paper free of charge. If you invest through a financial intermediary, you can contact your financial intermediary to request that you continue to receive paper copies of your shareholder reports; if you invest directly with the Fund, you can call 1-800-222-8222. Your election to receive reports in paper will apply to all Wells Fargo Funds held in your account with your financial intermediary or, if you are a direct investor, to all Wells Fargo Funds that you hold.
|
|
|
Reduce clutter. Save trees. |
Sign up for
electronic delivery
of prospectuses
and shareholder
reports at
wellsfargo.com/
advantagedelivery |
The views expressed and any forward-looking statements are as of February 29, 2020, unless otherwise noted, and are those of the Fund managers and/or Wells Fargo Asset Management. Discussions of individual securities, or the markets generally, or any Wells Fargo Fund are not intended as individual recommendations. Future events or results may vary significantly from those expressed in any forward-looking statements. The views expressed are subject to change at any time in response to changing circumstances in the market. Wells Fargo Asset Management and the Fund disclaim any obligation to publicly update or revise any views expressed or forward-looking statements.
INVESTMENT PRODUCTS: NOT FDIC INSURED ◾ NO BANK GUARANTEE ◾ MAY LOSE VALUE
Wells Fargo Short Duration Government Bond Fund | 1
Letter to shareholders (unaudited)

Andrew Owen
President
Wells Fargo Funds
“The fourth quarter started on a strong note, with U.S.-China trade tensions relaxing in October along with renewed optimism for a U.K. Brexit deal and positive macroeconomic data.”
Dear Shareholder:
We are pleased to offer you this semi-annual report for the Wells Fargo Short Duration Government Bond Fund for thesix-month period that ended February 29, 2020. As market volatility increased, returns for the period were more restrained after strong results in previous recent periods. However, supportive central banks addressed concerns over slowing global economic growth and international trade tensions.
Fixed-income and equity investors had mixed semi-annual returns. For the period, U.S. stocks, based on the S&P 500 Index,1 gained 1.92% and international stocks, as measured by the MSCI ACWI ex USA Index (Net),2 returned 0.13%. The MSCI EM Index (Net)3 gained 2.93%. For bond investors, the Bloomberg Barclays U.S. Aggregate Bond Index4 added 3.39%, the Bloomberg Barclays Global Aggregateex-USD Index5 returned-0.21%, the Bloomberg Barclays Municipal Bond Index6 gained 3.04%, and the ICE BofA U.S. High Yield Index7 added 1.34%.
The period began with uncertainty, leading to central bank support.
In September, as the period began, the U.S. Federal Reserve (Fed) cut interest rates a second time in the third quarter. U.S. manufacturing data disappointed investors. The U.S. Congress announced it would pursue an impeachment investigation of President Trump. Meanwhile, the Brexit impasse showed no signs of resolution. Officials in China warned it would be difficult to reach the country’s annual economic growth goals considering the weight of tariffs and trade restrictions. Although the S&P 500 Index finished the third quarter with the bestyear-to-date returns in more than 20 years, concerns about future returns remained.
The fourth quarter started on a strong note, with U.S.-China trade tensions relaxing in October along with renewed optimism for a U.K. Brexit deal and positive macroeconomic data. The initial estimate of U.S. third-quarter gross domestic product growth was a resilient 1.9% annualized rate, while the U.S. unemployment rate fell to a50-year low of 3.5% in September. However, despite resilience among U.S. consumers, business confidence declined while manufacturing activity contracted. Concerned with a potential economic slowdown, the Fed lowered interest rates another quarter point in late October—its third rate cut in four months. This helped push the S&P 500 Index to anall-time high, while emerging market equities rallied and global bonds declined overall, reflecting a broad pickup in risk appetite.
| 1 | The S&P 500 Index consists of 500 stocks chosen for market size, liquidity, and industry group representation. It is a market-value-weighted index with each stock’s weight in the index proportionate to its market value. You cannot invest directly in an index. |
| 2 | The Morgan Stanley Capital International (MSCI) All Country World Index (ACWI) ex USA Index (Net) is a free-float-adjusted market-capitalization-weighted index that is designed to measure the equity market performance of developed markets, excluding the United States. Source: MSCI. MSCI makes no express or implied warranties or representations and shall have no liability whatsoever with respect to any MSCI data contained herein. The MSCI data may not be further redistributed or used as a basis for other indices or any securities or financial products. This report is not approved, reviewed, or produced by MSCI. You cannot invest directly in an index. |
| 3 | The MSCI Emerging Markets (EM) Index (Net) is a free-float-adjusted market-capitalization-weighted index that is designed to measure equity market performance of emerging markets. You cannot invest directly in an index. |
| 4 | The Bloomberg Barclays U.S. Aggregate Bond Index is a broad-based benchmark that measures the investment-grade, U.S. dollar-denominated, fixed-rate taxable bond market, including Treasuries, government-related and corporate securities, mortgage-backed securities (agency fixed-rate and hybrid adjustable-rate mortgage pass-throughs), asset-backed securities, and commercial mortgage-backed securities. You cannot invest directly in an index. |
| 5 | The Bloomberg Barclays Global Aggregateex-USD Index is an unmanaged index that provides a broad-based measure of the global investment-grade fixed-income markets excluding the U.S. dollar-denominated debt market. You cannot invest directly in an index. |
| 6 | The Bloomberg Barclays Municipal Bond Index is an unmanaged index composed of long-termtax-exempt bonds with a minimum credit rating of Baa. You cannot invest directly in an index. |
| 7 | The ICE BofA U.S. High Yield Index is a market-capitalization-weighted index of domestic and Yankee high-yield bonds. The index tracks the performance of high-yield securities traded in the U.S. bond market. You cannot invest directly in an index. Copyright 2020. ICE Data Indices, LLC. All rights reserved. |
2 | Wells Fargo Short Duration Government Bond Fund
Letter to shareholders (unaudited)
Equity markets continued to rally in November despite ongoing geopolitical risks. Hopes for a U.S.-China trade deal buoyed investor confidence. U.S. business sentiment improved slightly, and manufacturing and services activity picked up. With that positive backdrop, developed market equities outpaced those in emerging markets, and U.S. stocks, as reflected by the S&P 500 Index, outperformednon-U.S. stocks overall. While consumer confidence and purchasing manager activity rose in the eurozone, China reported weakening manufacturing and consumer data. Bond yields rose marginally, leading to slightly negative returns for global government and investment-grade corporate bonds.
Financial markets ended 2019 with a boost from the U.S. and China accord on a Phase One trade deal. That, along with the landslide win by thepro-Brexit U.K. Conservative Party in a national election and ongoing central bank support, gave investors greater confidence. U.S. economic indicators were generally positive, with the exception of manufacturing activity and business confidence. Consumer confidence was resilient, fed by a robust labor market, tame inflation, and lower interest rates, which boosted housing affordability and stimulated homebuyer activity. The impeachment of U.S. President Donald Trump had little impact on markets. Meanwhile, slowing Chinese economic activity, partly attributable to the trade war, led to further government stimulus atyear-end through lower reserve ratios, allowing banks to lend more money.
Theyear-end rally continued in early January 2020. However, capital market volatility picked up sharply in late January on concerns over the unknown impact of the novel coronavirus(COVID-19) on the global economy and stock markets. With sentiment somewhat souring, perceived safe havens did well in January. The U.S. dollar and Japanese yen both rose and government bonds outperformed equities. While the S&P 500 Index held its ground, emerging market equities tumbled, including those in Asia that are most exposed to viruses—physical or economic—originating in China.
In February, the coronavirus became the major market focus. Fears of the virus’s impact on global growth led to expectations of increased global central bank monetary policy support. That led the10-year Treasury yield to fall to anall-time low of 1.1% by the end of the month. Although equity markets initially shrugged off concerns about the outbreak, focusing instead on strong fourth-quarter earnings and improving business confidence in January, market sentiment turned sharply lower towardmonth-end and the S&P 500 Index lost 8.2% for the month. Oil prices tumbled as Russia and the Organization of the Petroleum Exporting Countries compounded a major decline in oil demand with a brutal price war, partly aimed at dissuading further U.S. shale production. As a result, the price of West Texas Intermediate crude oil fell 13% in February and 27% for 2020 year to date.
Don’t let short-term uncertainty derail long-term investment goals.
Periods of investment uncertainty can present challenges, but experience has taught us that maintaining long-term investment goals can be an effective way to plan for the future. Although diversification cannot guarantee an investment profit or prevent losses, we believe it can be an effective way to manage investment risk and potentially smooth out overall portfolio performance. We encourage investors to know their investments and to understand that appropriate levels of risk-taking may unlock opportunities.
Thank you for choosing to invest with Wells Fargo Funds. We appreciate your confidence in us and remain committed to helping you meet your financial needs.
Sincerely,

Andrew Owen
President
Wells Fargo Funds
“Capital market volatility picked up sharply in late January on concerns over the unknown impact of the novel coronavirus(COVID-19) on the global economy and stock markets.”
|
|
|
For further information about your Fund, contact your investment professional, visit our website at wfam.com, or call us directly at1-800-222-8222. |
Wells Fargo Short Duration Government Bond Fund | 3
Performance highlights (unaudited)
Investment objective
The Fund seeks to provide current income consistent with capital preservation.
Manager
Wells Fargo Funds Management, LLC
Subadviser
Wells Capital Management Incorporated
Portfolio managers
Maulik Bhansali, CFA®‡
Thomas O’Connor, CFA®‡
Jarad Vasquez
Average annual total returns (%) as of February 29, 2020
| | | | | | | | | | | | | | | | | | | | | | | | | | | | | | | | | | |
| | | | |
| | | | | Including sales charge | | | Excluding sales charge | | | Expense ratios1 (%) | |
| | | | | | | | | |
| | | Inception date | | 1 year | | | 5 year | | | 10 year | | | 1 year | | | 5 year | | | 10 year | | | Gross | | | Net2 | |
| | | | | | | | | | |
| Class A (MSDAX) | | 3-11-1996 | | | 2.53 | | | | 0.92 | | | | 1.16 | | | | 4.62 | | | | 1.33 | | | | 1.36 | | | | 0.81 | | | | 0.78 | |
| | | | | | | | | | |
| Class C (MSDCX) | | 5-31-2002 | | | 2.83 | | | | 0.58 | | | | 0.61 | | | | 3.83 | | | | 0.58 | | | | 0.61 | | | | 1.56 | | | | 1.53 | |
| | | | | | | | | | |
| Class R6 (MSDRX)3 | | 11-30-2012 | | | – | | | | – | | | | – | | | | 5.04 | | | | 1.77 | | | | 1.80 | | | | 0.43 | | | | 0.37 | |
| | | | | | | | | | |
| Administrator Class (MNSGX) | | 12-18-1992 | | | – | | | | – | | | | – | | | | 4.80 | | | | 1.51 | | | | 1.56 | | | | 0.75 | | | | 0.60 | |
| | | | | | | | | | |
| Institutional Class (WSGIX) | | 4-8-2005 | | | – | | | | – | | | | – | | | | 4.99 | | | | 1.70 | | | | 1.74 | | | | 0.48 | | | | 0.42 | |
| | | | | | | | | | |
| Bloomberg Barclays U.S.1-3 Year Government Bond Index4 | | – | | | – | | | | – | | | | – | | | | 4.70 | | | | 1.63 | | | | 1.30 | | | | – | | | | – | |
Figures quoted represent past performance, which is no guarantee of future results,and do not reflect taxes that a shareholder may pay on an investment in a fund. Investment return and principal value of an investment will fluctuate so that an investor’s shares, when redeemed, may be worth more or less than their original cost. Performance shown without sales charges would be lower if sales charges were reflected. Current performance may be lower or higher than the performance data quoted, which assumes the reinvestment of dividends and capital gains. Currentmonth-end performance is available on the Fund’s website, wfam.com.
Index returns do not include transaction costs associated with buying and selling securities, any mutual fund fees or expenses, or any taxes. It is not possible to invest directly in an index.
For Class A shares, the maximumfront-end sales charge is 2.00%. For Class C shares, the maximum contingent deferred sales charge is 1.00%. Performance including a contingent deferred sales charge assumes the sales charge for the corresponding time period. Class R6, Administrator Class, and Institutional Class shares are sold without afront-end sales charge or contingent deferred sales charge.
Bond values fluctuate in response to the financial condition of individual issuers, general market and economic conditions, and changes in interest rates. Changes in market conditions and government policies may lead to periods of heightened volatility in the bond market and reduced liquidity for certain bonds held by the Fund. In general, when interest rates rise, bond values fall and investors may lose principal value. Interest rate changes and their impact on the Fund and its share price can be sudden and unpredictable. Securities issued by U.S. government agencies or government sponsored entities may not be guaranteed by the U.S. Treasury. Certain investment strategies tend to increase the total risk of an investment (relative to the broader market). The Fund is exposed to mortgage- and asset-backed securities risk. The U.S. government guarantee applies to certain underlying securities and not to shares of the Fund. Consult the Fund’s prospectus for additional information on these and other risks.
Please see footnotes on page 5.
4 | Wells Fargo Short Duration Government Bond Fund
Performance highlights (unaudited)
| | | | |
| |
| Ten largest holdings (%) as of February 29, 20205 | | | |
| | |
FHLMC, 2.50%,11-1-2028 | | | 7.69 | |
| | |
FNMA Series2019-33 Class MA, 3.50%,7-25-2055 | | | 3.60 | |
| | |
FHLMC Series 4940 Class AG, 3.00%,5-15-2040 | | | 3.56 | |
| | |
U.S. Treasury Note, 1.13%,2-28-2022 | | | 2.97 | |
| | |
FNMA, 4.50%,10-1-2048 | | | 2.70 | |
| | |
U.S. Treasury Note, 1.50%,9-30-2021 | | | 2.37 | |
| | |
FNMA, 5.00%,1-1-2049 | | | 2.24 | |
| | |
U.S. Treasury Note, 1.38%,2-15-2023 | | | 1.96 | |
| | |
GNMA, 4.50%,6-20-2048 | | | 1.65 | |
| | |
FNMA, 2.89%,7-1-2046 | | | 1.62 | |
|
|
| Portfolio allocation as of February 29, 20206 |
|
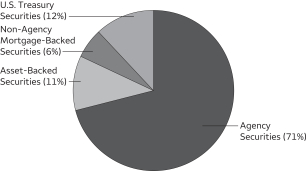
|
| 1 | Reflects the expense ratios as stated in the most recent prospectuses. The expense ratios shown are subject to change and may differ from the annualized expense ratios shown in the financial highlights of this report. |
| 2 | The manager has contractually committed through December 31, 2020, to waive fees and/or reimburse expenses to the extent necessary to cap total annual fund operating expenses after fee waivers at 0.78% for Class A, 1.53% for Class C, 0.37% for Class R6, 0.60% for Administrator Class, and 0.42% for Institutional Class. Brokerage commissions, stamp duty fees, interest, taxes, acquired fund fees and expenses (if any), and extraordinary expenses are excluded from the expense cap. Prior to or after the commitment expiration date, the cap may be increased or the commitment to maintain the cap may be terminated only with the approval of the Board of Trustees. Without this cap, the Fund’s returns would have been lower. The expense ratio paid by an investor is the net expense ratio (the total annual fund operating expenses after fee waivers) as stated in the prospectuses. |
| 3 | Historical performance shown for Class R6 shares prior to their inception reflects the performance of Institutional Class shares and includes the higher expenses applicable to Institutional Class shares. If these expenses had not been included, returns for Class R6 shares would be higher. |
| 4 | The Bloomberg Barclays U.S. 1–3 Year Government Bond Index is composed of all publicly issued, nonconvertible domestic debt of the U.S. government and its agencies. The index also includes corporate debt guaranteed by the U.S. government. Only notes and bonds with a minimum maturity of one year up to a maximum maturity of 2.9 years are included. You cannot invest directly in an index. |
| 5 | The ten largest holdings, excluding cash, cash equivalents and any money market funds, are calculated based on the value of the investments divided by total net assets of the Fund. Holdings are subject to change and may have changed since the date specified. |
| 6 | Amounts are calculated based on the total long-term investments of the Fund. These amounts are subject to change and may have changed since the date specified. |
Wells Fargo Short Duration Government Bond Fund | 5
Fund expenses (unaudited)
As a shareholder of the Fund, you incur two types of costs: (1) transaction costs, including sales charges (loads) on purchase payments and contingent deferred sales charges (if any) on redemptions and (2) ongoing costs, including management fees, distribution(12b-1) and/or shareholder servicing fees, and other Fund expenses. This example is intended to help you understand your ongoing costs (in dollars) of investing in the Fund and to compare these costs with the ongoing costs of investing in other mutual funds.
The example is based on an investment of $1,000 invested at the beginning of thesix-month period and held for the entire period from September 1, 2019 to February 29, 2020.
Actual expenses
The “Actual” line of the table below provides information about actual account values and actual expenses. You may use the information in this line, together with the amount you invested, to estimate the expenses that you paid over the period. Simply divide your account value by $1,000 (for example, an $8,600 account value divided by $1,000 = 8.6), then multiply the result by the number in the “Actual” line under the heading entitled “Expenses paid during period” for your applicable class of shares to estimate the expenses you paid on your account during this period.
Hypothetical example for comparison purposes
The “Hypothetical” line of the table below provides information about hypothetical account values and hypothetical expenses based on the Fund’s actual expense ratio and an assumed rate of return of 5% per year before expenses, which is not the Fund’s actual return. The hypothetical account values and expenses may not be used to estimate the actual ending account balance or expenses you paid for the period. You may use this information to compare the ongoing costs of investing in the Fund and other funds. To do so, compare this 5% hypothetical example with the 5% hypothetical examples that appear in the shareholder reports of the other funds.
Please note that the expenses shown in the table are meant to highlight your ongoing costs only and do not reflect any transactional costs, such as sales charges (loads) and contingent deferred sales charges. Therefore, the “Hypothetical” line of the table is useful in comparing ongoing costs only and will not help you determine the relative total costs of owning different funds. In addition, if these transactional costs were included, your costs would have been higher.
| | | | | | | | | | | | | | | | |
| | | Beginning
account value
9-1-2019 | | | Ending
account value
2-29-2020 | | | Expenses
paid during
the period¹ | | | Annualized net
expense ratio | |
| | | | | |
Class A | | | | | | | | | | | | | | | | |
| | | | |
Actual | | $ | 1,000.00 | | | $ | 1,018.70 | | | $ | 3.91 | | | | 0.78 | % |
| | | | |
Hypothetical (5% return before expenses) | | $ | 1,000.00 | | | $ | 1,020.98 | | | $ | 3.92 | | | | 0.78 | % |
| | | | | |
Class C | | | | | | | | | | | | | | | | |
| | | | |
Actual | | $ | 1,000.00 | | | $ | 1,014.89 | | | $ | 7.66 | | | | 1.53 | % |
| | | | |
Hypothetical (5% return before expenses) | | $ | 1,000.00 | | | $ | 1,017.26 | | | $ | 7.67 | | | | 1.53 | % |
| | | | | |
Class R6 | | | | | | | | | | | | | | | | |
| | | | |
Actual | | $ | 1,000.00 | | | $ | 1,020.74 | | | $ | 1.86 | | | | 0.37 | % |
| | | | |
Hypothetical (5% return before expenses) | | $ | 1,000.00 | | | $ | 1,023.02 | | | $ | 1.86 | | | | 0.37 | % |
| | | | | |
Administrator Class | | | | | | | | | | | | | | | | |
| | | | |
Actual | | $ | 1,000.00 | | | $ | 1,019.59 | | | $ | 3.01 | | | | 0.60 | % |
| | | | |
Hypothetical (5% return before expenses) | | $ | 1,000.00 | | | $ | 1,021.88 | | | $ | 3.02 | | | | 0.60 | % |
| | | | | |
Institutional Class | | | | | | | | | | | | | | | | |
| | | | |
Actual | | $ | 1,000.00 | | | $ | 1,020.51 | | | $ | 2.11 | | | | 0.42 | % |
| | | | |
Hypothetical (5% return before expenses) | | $ | 1,000.00 | | | $ | 1,022.77 | | | $ | 2.11 | | | | 0.42 | % |
| 1 | Expenses paid is equal to the annualized net expense ratio of each class multiplied by the average account value over the period, multiplied by the number of days in the most recent fiscal half-year divided by the number of days in the fiscal year (to reflect theone-half-year period). |
6 | Wells Fargo Short Duration Government Bond Fund
Portfolio of investments—February 29, 2020 (unaudited)
| | | | | | | | | | | | | | | | |
| | | Interest
rate | | | Maturity date | | | Principal | | | Value | |
| Agency Securities: 70.23% | | | | | | | | | | | | |
FHLMC (12 Month LIBOR +1.65%)± | | | 2.35 | % | | | 3-1-2043 | | | $ | 1,524,448 | | | $ | 1,560,647 | |
FHLMC | | | 2.50 | | | | 11-1-2028 | | | | 40,659,869 | | | | 42,036,656 | |
FHLMC | | | 2.50 | | | | 11-1-2028 | | | | 6,363,523 | | | | 6,622,989 | |
FHLMC±± | | | 2.58 | | | | 12-1-2042 | | | | 2,335,340 | | | | 2,407,303 | |
FHLMC (12 Month LIBOR +1.64%)± | | | 2.89 | | | | 7-1-2047 | | | | 5,952,455 | | | | 6,172,402 | |
FHLMC (12 Month LIBOR +1.84%)± | | | 3.42 | | | | 5-1-2042 | | | | 1,744,485 | | | | 1,813,080 | |
FHLMC | | | 4.00 | | | | 10-1-2033 | | | | 626,986 | | | | 686,823 | |
FHLMC | | | 4.00 | | | | 1-1-2034 | | | | 598,124 | | | | 655,158 | |
FHLMC | | | 4.00 | | | | 5-15-2039 | | | | 989,473 | | | | 1,008,383 | |
FHLMC | | | 4.50 | | | | 4-1-2031 | | | | 1,296,285 | | | | 1,410,306 | |
FHLMC Multifamily Structured Pass-Through Certificates Series KI02 Class A (1 Month LIBOR +0.20%)± | | | 1.86 | | | | 2-25-2023 | | | | 1,008,743 | | | | 1,008,656 | |
FHLMC Series 3107 Class FC (1 Month LIBOR +0.30%)± | | | 1.96 | | | | 6-15-2035 | | | | 1,162,845 | | | | 1,163,509 | |
FHLMC Series 3632 Class PK | | | 5.00 | | | | 2-15-2040 | | | | 3,367,341 | | | | 3,733,656 | |
FHLMC Series 3653 Class AU | | | 4.00 | | | | 4-15-2040 | | | | 1,138,382 | | | | 1,258,432 | |
FHLMC Series 3738 Class BP | | | 4.00 | | | | 12-15-2038 | | | | 1,108,720 | | | | 1,130,918 | |
FHLMC Series 4239 Class AB | | | 4.00 | | | | 12-15-2039 | | | | 872,550 | | | | 893,947 | |
FHLMC Series 4426 Class QC | | | 1.75 | | | | 7-15-2037 | | | | 5,486,639 | | | | 5,535,987 | |
FHLMC Series 4891 Class PA | | | 3.50 | | | | 7-15-2048 | | | | 3,641,636 | | | | 3,767,761 | |
FHLMC Series 4897 Class F (1 Month LIBOR +0.40%)± | | | 2.06 | | | | 7-15-2049 | | | | 1,326,547 | | | | 1,319,045 | |
FHLMC Series 4940 Class AG | | | 3.00 | | | | 5-15-2040 | | | | 18,506,191 | | | | 19,480,423 | |
FNMA (12 Month LIBOR +1.69%)± | | | 2.42 | | | | 11-1-2042 | | | | 2,849,077 | | | | 2,922,959 | |
FNMA (12 Month LIBOR +1.57%)± | | | 2.47 | | | | 9-1-2045 | | | | 2,351,322 | | | | 2,416,522 | |
FNMA | | | 2.50 | | | | 5-1-2028 | | | | 4,430,717 | | | | 4,578,899 | |
FNMA | | | 2.50 | | | | 1-1-2030 | | | | 2,341,080 | | | | 2,413,165 | |
FNMA | | | 2.50 | | | | 11-1-2031 | | | | 6,290,465 | | | | 6,484,160 | |
FNMA (12 Month LIBOR +1.60%)± | | | 2.54 | | | | 10-1-2046 | | | | 4,291,080 | | | | 4,418,879 | |
FNMA (12 Month LIBOR +1.59%)± | | | 2.66 | | | | 1-1-2046 | | | | 3,032,588 | | | | 3,122,870 | |
FNMA (12 Month LIBOR +1.58%)± | | | 2.69 | | | | 2-1-2046 | | | | 4,187,045 | | | | 4,319,581 | |
FNMA (12 Month LIBOR +1.61%)± | | | 2.69 | | | | 3-1-2047 | | | | 5,572,934 | | | | 5,756,275 | |
FNMA (12 Month LIBOR +1.60%)± | | | 2.72 | | | | 1-1-2045 | | | | 1,108,309 | | | | 1,138,216 | |
FNMA (12 Month LIBOR +1.58%)± | | | 2.75 | | | | 6-1-2045 | | | | 1,821,307 | | | | 1,865,774 | |
FNMA (12 Month LIBOR +1.57%)± | | | 2.76 | | | | 3-1-2045 | | | | 1,638,128 | | | | 1,688,635 | |
FNMA (12 Month LIBOR +1.60%)± | | | 2.89 | | | | 7-1-2046 | | | | 8,591,800 | | | | 8,871,875 | |
FNMA (12 Month LIBOR +1.60%)± | | | 2.96 | | | | 8-1-2047 | | | | 3,451,469 | | | | 3,586,229 | |
FNMA (12 Month LIBOR +1.61%)± | | | 3.05 | | | | 6-1-2047 | | | | 3,559,955 | | | | 3,698,420 | |
FNMA±± | | | 3.97 | | | | 3-1-2049 | | | | 3,455,548 | | | | 3,672,794 | |
FNMA | | | 4.00 | | | | 4-1-2032 | | | | 521,728 | | | | 571,151 | |
FNMA | | | 4.00 | | | | 10-1-2033 | | | | 888,245 | | | | 967,702 | |
FNMA | | | 4.00 | | | | 2-1-2034 | | | | 5,044,574 | | | | 5,435,370 | |
FNMA | | | 4.00 | | | | 7-1-2034 | | | | 1,120,454 | | | | 1,215,463 | |
FNMA | | | 4.50 | | | | 10-1-2048 | | | | 13,333,810 | | | | 14,736,938 | |
FNMA | | | 4.50 | | | | 3-1-2049 | | | | 4,113,089 | | | | 4,460,766 | |
FNMA | | | 5.00 | | | | 10-1-2040 | | | | 1,153,460 | | | | 1,309,273 | |
FNMA | | | 5.00 | | | | 5-1-2046 | | | | 455,716 | | | | 516,914 | |
FNMA | | | 5.00 | | | | 8-1-2048 | | | | 3,003,913 | | | | 3,328,235 | |
FNMA | | | 5.00 | | | | 1-1-2049 | | | | 11,083,257 | | | | 12,251,185 | |
FNMA | | | 5.00 | | | | 1-1-2049 | | | | 5,165,061 | | | | 5,771,481 | |
FNMA | | | 5.00 | | | | 2-1-2049 | | | | 263,871 | | | | 291,787 | |
FNMA | | | 5.00 | | | | 3-1-2049 | | | | 532,039 | | | | 589,541 | |
FNMA | | | 5.00 | | | | 3-1-2049 | | | | 1,962,203 | | | | 2,160,697 | |
FNMA | | | 5.00 | | | | 8-1-2049 | | | | 7,146,215 | | | | 8,004,862 | |
FNMA | | | 5.00 | | | | 12-1-2049 | | | | 2,460,000 | | | | 2,803,504 | |
FNMA | | | 5.50 | | | | 6-1-2049 | | | | 6,855,737 | | | | 7,844,294 | |
FNMA Series2009-20 Class DT | | | 4.50 | | | | 4-25-2039 | | | | 1,810,896 | | | | 2,050,949 | |
FNMA Series2011-14 Class GD | | | 4.00 | | | | 4-25-2040 | | | | 2,323,693 | | | | 2,425,545 | |
The accompanying notes are an integral part of these financial statements.
Wells Fargo Short Duration Government Bond Fund | 7
Portfolio of investments—February 29, 2020 (unaudited)
| | | | | | | | | | | | | | | | |
| | | Interest
rate | | | Maturity date | | | Principal | | | Value | |
| Agency Securities (continued) | | | | | | | | | | | | |
FNMA Series2013-103 Class H | | | 4.50 | % | | | 3-25-2038 | | | $ | 1,706,368 | | | $ | 1,767,725 | |
FNMA Series2013-90 Class A | | | 4.00 | | | | 11-25-2038 | | | | 2,045,576 | | | | 2,078,383 | |
FNMA Series2015-40 Class TC | | | 1.75 | | | | 5-25-2037 | | | | 3,852,788 | | | | 3,891,517 | |
FNMA Series2015-57 Class AB | | | 3.00 | | | | 8-25-2045 | | | | 2,843,265 | | | | 3,010,587 | |
FNMA Series2018-86 Class MF (1 Month LIBOR +0.30%)± | | | 1.93 | | | | 12-25-2048 | | | | 6,488,179 | | | | 6,445,005 | |
FNMA Series2019-13 Class FG (1 Month LIBOR +0.40%)± | | | 2.03 | | | | 4-25-2049 | | | | 2,735,608 | | | | 2,725,997 | |
FNMA Series2019-18 Class FA (1 Month LIBOR +0.45%)± | | | 2.08 | | | | 5-25-2049 | | | | 2,103,707 | | | | 2,098,467 | |
FNMA Series2019-18 Class FB (1 Month LIBOR +0.45%)± | | | 2.08 | | | | 5-25-2049 | | | | 2,537,810 | | | | 2,530,007 | |
FNMA Series2019-18 Class FE (1 Month LIBOR +0.35%)± | | | 1.98 | | | | 5-25-2049 | | | | 5,023,758 | | | | 5,002,485 | |
FNMA Series2019-33 Class MA | | | 3.50 | | | | 7-25-2055 | | | | 18,686,916 | | | | 19,654,188 | |
FNMA Series2019-6 Class FA (1 Month LIBOR +0.40%)± | | | 2.03 | | | | 3-25-2049 | | | | 4,139,611 | | | | 4,133,851 | |
FNMA Series2019-60 Class BF (1 Month LIBOR +0.45%)± | | | 2.08 | | | | 10-25-2049 | | | | 5,162,763 | | | | 5,142,838 | |
FNMA Series 4853 Class FG (1 Month LIBOR +0.40%)± | | | 2.06 | | | | 4-15-2038 | | | | 1,719,367 | | | | 1,718,605 | |
GNMA | | | 4.00 | | | | 9-20-2044 | | | | 2,058,628 | | | | 2,206,956 | |
GNMA | | | 4.00 | | | | 12-20-2044 | | | | 2,474,321 | | | | 2,652,507 | |
GNMA | | | 4.00 | | | | 1-20-2045 | | | | 1,649,419 | | | | 1,768,058 | |
GNMA | | | 4.00 | | | | 4-20-2048 | | | | 7,914,267 | | | | 8,352,988 | |
GNMA | | | 4.50 | | | | 3-20-2048 | | | | 2,113,994 | | | | 2,260,343 | |
GNMA | | | 4.50 | | | | 6-20-2048 | | | | 8,483,232 | | | | 9,003,988 | |
GNMA | | | 4.50 | | | | 6-20-2048 | | | | 2,855,617 | | | | 3,045,532 | |
GNMA | | | 4.50 | | | | 8-20-2048 | | | | 2,864,037 | | | | 3,068,156 | |
GNMA | | | 4.50 | | | | 2-20-2049 | | | | 4,440,128 | | | | 4,755,590 | |
GNMA | | | 4.50 | | | | 4-20-2049 | | | | 1,030,501 | | | | 1,103,755 | |
GNMA | | | 5.00 | | | | 10-15-2039 | | | | 976,232 | | | | 1,085,665 | |
GNMA | | | 5.00 | | | | 3-20-2048 | | | | 2,065,891 | | | | 2,239,323 | |
GNMA | | | 5.00 | | | | 6-20-2048 | | | | 327,626 | | | | 364,146 | |
GNMA | | | 5.00 | | | | 6-20-2048 | | | | 223,860 | | | | 246,813 | |
GNMA | | | 5.00 | | | | 7-20-2048 | | | | 230,684 | | | | 253,809 | |
GNMA | | | 5.00 | | | | 9-20-2048 | | | | 1,754,807 | | | | 1,929,905 | |
GNMA | | | 5.00 | | | | 3-20-2049 | | | | 457,610 | | | | 501,972 | |
GNMA | | | 5.00 | | | | 3-20-2049 | | | | 2,117,473 | | | | 2,306,858 | |
GNMA | | | 5.00 | | | | 4-20-2049 | | | | 3,697,134 | | | | 4,062,231 | |
GNMA | | | 5.00 | | | | 5-20-2049 | | | | 3,076,512 | | | | 3,377,463 | |
GNMA | | | 5.50 | | | | 8-20-2049 | | | | 6,236,552 | | | | 6,655,845 | |
GNMA | | | 5.50 | | | | 10-20-2049 | | | | 415,620 | | | | 445,576 | |
GNMA Series2011-137 Class WA±± | | | 5.56 | | | | 7-20-2040 | | | | 2,523,745 | | | | 2,960,902 | |
GNMA Series2012-141 Class WD±± | | | 4.96 | | | | 7-20-2040 | | | | 2,329,472 | | | | 2,650,296 | |
GNMA Series2017-99 Class DE | | | 2.50 | | | | 7-20-2045 | | | | 3,214,947 | | | | 3,275,928 | |
GNMA Series2018-154 Class WP | | | 3.50 | | | | 11-20-2048 | | | | 668,135 | | | | 702,320 | |
GNMA Series2018-36 Class KC | | | 3.00 | | | | 2-20-2046 | | | | 2,530,640 | | | | 2,610,197 | |
GNMA Series2019-132 Class NA | | | 3.50 | | | | 9-20-2049 | | | | 1,034,612 | | | | 1,087,662 | |
GNMA Series2020-11 Class ME | | | 2.50 | | | | 2-20-2049 | | | | 7,203,871 | | | | 7,401,854 | |
| | | | |
Total Agency Securities (Cost $377,106,543) | | | | | | | | | | | | | | | 383,933,284 | |
| | | | | | | | | | | | | | | | |
| | | | |
| Asset-Backed Securities: 10.73% | | | | | | | | | | | | |
Avis Budget Rental Car Funding LLC Series2019-1A Class A 144A | | | 3.45 | | | | 3-20-2023 | | | | 5,965,000 | | | | 6,179,973 | |
Ford Credit Auto Owner Trust Series2017-1 Class A 144A | | | 2.62 | | | | 8-15-2028 | | | | 6,085,000 | | | | 6,243,596 | |
Hertz Vehicle Financing LLC Series2016-4A Class A 144A | | | 2.65 | | | | 7-25-2022 | | | | 2,651,000 | | | | 2,686,308 | |
Hertz Vehicle Financing LLC Series2019-1A Class A 144A | | | 3.71 | | | | 3-25-2023 | | | | 4,550,000 | | | | 4,746,106 | |
Navient Student Loan Trust Series2014-CTA Class A (1 Month LIBOR +0.70%) 144A± | | | 2.36 | | | | 9-16-2024 | | | | 307,431 | | | | 307,487 | |
Navient Student Loan Trust Series2019-GA Class A 144A | | | 2.40 | | | | 10-15-2068 | | | | 6,802,170 | | | | 6,965,545 | |
Nelnet Student Loan Trust Series2004-4 Class A5 (3 Month LIBOR +0.16%)± | | | 1.95 | | | | 1-25-2037 | | | | 3,554,203 | | | | 3,477,608 | |
Nelnet Student Loan Trust Series2012-1A Class A (1 Month LIBOR +0.80%) 144A± | | | 2.43 | | | | 12-27-2039 | | | | 2,205,144 | | | | 2,202,233 | |
Nelnet Student Loan Trust Series2016-1A Class A (1 Month LIBOR +0.80%) 144A± | | | 2.43 | | | | 9-25-2065 | | | | 5,156,786 | | | | 5,163,272 | |
The accompanying notes are an integral part of these financial statements.
8 | Wells Fargo Short Duration Government Bond Fund
Portfolio of investments—February 29, 2020 (unaudited)
| | | | | | | | | | | | | | | | |
| | | Interest
rate | | | Maturity date | | | Principal | | | Value | |
| | | | |
| Asset-Backed Securities (continued) | | | | | | | | | | | | |
SLC Student Loan Trust Series2010-1 Class A (3 Month LIBOR +0.88%)± | | | 2.55 | % | | | 11-25-2042 | | | $ | 1,096,751 | | | $ | 1,100,635 | |
SLM Student Loan Trust Series2005-6 Class A6 (3 Month LIBOR +0.14%)± | | | 1.93 | | | | 10-27-2031 | | | | 2,546,510 | | | | 2,508,166 | |
SLM Student Loan Trust Series2012-3 Class A (1 Month LIBOR +0.65%)± | | | 2.28 | | | | 12-27-2038 | | | | 5,248,718 | | | | 5,220,141 | |
SMB Private Education Loan Trust Series2015-A Class A2A 144A | | | 2.49 | | | | 6-15-2027 | | | | 1,891,659 | | | | 1,904,928 | |
SMB Private Education Loan Trust Series2015-C Class A2A 144A | | | 2.75 | | | | 7-15-2027 | | | | 1,995,317 | | | | 2,023,497 | |
SMB Private Education Loan Trust Series2016-B Class A2B (1 Month LIBOR +1.45%) 144A± | | | 3.11 | | | | 2-17-2032 | | | | 1,759,604 | | | | 1,775,336 | |
SoFi Professional Loan Program LLC Series2016-C Class A1 (1 Month LIBOR +1.10%) 144A± | | | 2.73 | | | | 10-27-2036 | | | | 785,193 | | | | 788,747 | |
SoFi Professional Loan Program LLC Series2016-D Class A1 (1 Month LIBOR +0.95%) 144A± | | | 2.58 | | | | 1-25-2039 | | | | 1,699,391 | | | | 1,708,575 | |
SoFi Professional Loan Program LLC Series2016-E Class A1 (1 Month LIBOR +0.85%) 144A± | | | 2.48 | | | | 7-25-2039 | | | | 640,627 | | | | 641,153 | |
SoFi Professional Loan Program LLC Series2017-A Class A1 (1 Month LIBOR +0.70%) 144A± | | | 2.33 | | | | 3-26-2040 | | | | 906,698 | | | | 910,220 | |
SoFi Professional Loan Program LLC Series2017-C Class A1 (1 Month LIBOR +0.60%) 144A± | | | 2.23 | | | | 7-25-2040 | | | | 902,085 | | | | 904,216 | |
SoFi Professional Loan Program LLC Series2017-E Class A2B 144A | | | 2.72 | | | | 11-26-2040 | | | | 1,183,000 | | | | 1,212,924 | |
| |
Total Asset-Backed Securities (Cost $58,104,936) | | | | 58,670,666 | |
| | | | | |
|
| Non-Agency Mortgage-Backed Securities: 5.89% | |
Angel Oak Mortgage Trust Series2019-2 Class A1 144A±± | | | 3.63 | | | | 3-25-2049 | | | | 1,513,989 | | | | 1,538,045 | |
Bunker Hill Loan Depositary Trust Series2019-1 Class A1 144A | | | 3.61 | | | | 10-26-2048 | | | | 1,686,997 | | | | 1,706,836 | |
Bunker Hill Loan Depositary Trust Series2019-2 Class A1 144A | | | 2.88 | | | | 7-25-2049 | | | | 1,912,185 | | | | 1,942,741 | |
Bunker Hill Loan Depositary Trust Series2019-3 Class A1 144A | | | 2.72 | | | | 11-25-2059 | | | | 2,000,219 | | | | 2,021,258 | |
Colt Funding LLC Series2018-4 Class A1 144A±± | | | 4.01 | | | | 12-28-2048 | | | | 910,277 | | | | 922,164 | |
Colt Funding LLC Series2019-1 Class A1 144A±± | | | 3.71 | | | | 3-25-2049 | | | | 588,734 | | | | 599,198 | |
Credit Suisse Mortgage Trust Series 2020-AFC1 Class A1 144A±± | | | 2.24 | | | | 2-25-2050 | | | | 3,558,291 | | | | 3,592,209 | |
DBUBS Mortgage Trust Series 2011-LC2A Class A1 144A | | | 3.53 | | | | 7-10-2044 | | | | 134,312 | | | | 135,134 | |
GCAT Series 2019-NQM1 Class A1 144A | | | 2.99 | | | | 2-25-2059 | | | | 1,720,011 | | | | 1,737,498 | |
GS Mortgage Securities Trust Series2010-C2 Class A1 144A | | | 3.85 | | | | 12-10-2043 | | | | 177,407 | | | | 178,316 | |
GS Mortgage Securities Trust Series 2012-GCJ7 Class AAB | | | 2.94 | | | | 5-10-2045 | | | | 646,448 | | | | 648,689 | |
Morgan Stanley Capital I Trust Series2011-C2 Class A3 144A | | | 4.21 | | | | 6-15-2044 | | | | 24,601 | | | | 24,612 | |
New Residential Mortgage Loan Trust Series 2019-NQM2 Class A1 144A±± | | | 3.60 | | | | 4-25-2049 | | | | 1,552,624 | | | | 1,571,558 | |
Verus Securitization Trust Series2018-2 Class A1 144A±± | | | 3.68 | | | | 6-1-2058 | | | | 1,954,059 | | | | 1,973,882 | |
Verus Securitization Trust Series2019-3 Class A1 144A±± | | | 2.69 | | | | 11-25-2059 | | | | 2,067,933 | | | | 2,083,025 | |
Verus Securitization Trust Series2019-1 Class A1 144A±± | | | 3.84 | | | | 2-25-2059 | | | | 1,996,992 | | | | 2,026,878 | |
Verus Securitization Trust Series2019-2 Class A1 144A±± | | | 2.91 | | | | 7-25-2059 | | | | 2,732,362 | | | | 2,762,779 | |
Verus Securitization Trust Series2019-2 Class A1 144A±± | | | 3.21 | | | | 5-25-2059 | | | | 2,244,931 | | | | 2,268,500 | |
Verus Securitization Trust Series2019-3 Class A1 144A | | | 2.78 | | | | 7-25-2059 | | | | 2,534,149 | | | | 2,546,760 | |
Verus Securitization Trust Series2019-4 Class A1 144A | | | 2.64 | | | | 11-25-2059 | | | | 1,889,645 | | | | 1,905,625 | |
| |
TotalNon-Agency Mortgage-Backed Securities (Cost $31,910,306) | | | | 32,185,707 | |
| | | | | |
|
| U.S. Treasury Securities: 11.60% | |
U.S. Treasury Note | | | 1.13 | | | | 9-30-2021 | | | | 8,424,000 | | | | 8,444,073 | |
U.S. Treasury Note %% | | | 1.13 | | | | 2-28-2022 | | | | 16,154,000 | | | | 16,228,460 | |
U.S. Treasury Note | | | 1.38 | | | | 2-15-2023 | | | | 10,543,000 | | | | 10,696,615 | |
U.S. Treasury Note | | | 1.50 | | | | 9-30-2021 | | | | 12,859,000 | | | | 12,964,986 | |
U.S. Treasury Note | | | 1.50 | | | | 11-30-2021 | | | | 4,357,000 | | | | 4,399,379 | |
U.S. Treasury Note | | | 2.00 | | | | 10-31-2021 | | | | 5,661,000 | | | | 5,758,298 | |
U.S. Treasury Note | | | 2.13 | | | | 5-15-2022 | | | | 1,244,000 | | | | 1,277,044 | |
U.S. Treasury Note | | | 2.50 | | | | 1-15-2022 | | | | 1,253,000 | | | | 1,289,366 | |
U.S. Treasury Note | | | 2.88 | | | | 11-15-2021 | | | | 2,265,000 | | | | 2,338,347 | |
| |
Total U.S. Treasury Securities (Cost $62,880,814) | | | | 63,396,568 | |
| | | | | |
The accompanying notes are an integral part of these financial statements.
Wells Fargo Short Duration Government Bond Fund | 9
Portfolio of investments—February 29, 2020 (unaudited)
| | | | | | | | | | | | | | | | |
| | | Yield | | | | | | Shares | | | Value | |
Short-Term Investments: 7.40% | | | | | | | | | | | | | | | | |
| | | | |
| Investment Companies: 7.40% | | | | | | | | | | | | |
Wells Fargo Government Money Market Fund Select Class (l)(u)## | | | 1.52 | % | | | | | | | 40,472,132 | | | $ | 40,472,132 | |
| | | | | | | | | | | | | | | | |
| | | | |
Total Short-Term Investments (Cost $40,472,132) | | | | | | | | | | | | | | | 40,472,132 | |
| | | | | | | | | | | | | | | | |
| | | | | | | | |
| Total investments in securities (Cost $570,474,731) | | | 105.85 | % | | | 578,658,357 | |
| | |
Other assets and liabilities, net | | | (5.85 | ) | | | (31,992,284 | ) |
| | | | | | | | |
| Total net assets | | | 100.00 | % | | $ | 546,666,073 | |
| | | | | | | | |
| ± | Variable rate investment. The rate shown is the rate in effect at period end. |
| ±± | The coupon of the security is adjusted based on the principal and interest payments received from the underlying pool of mortgages as well as the credit quality and the actual prepayment speed of the underlying mortgages. |
| 144A | The security may be resold in transactions exempt from registration, normally to qualified institutional buyers, pursuant to Rule 144A under the Securities Act of 1933. |
| %% | The security is purchased on a when-issued basis. |
| (l) | The issuer of the security is an affiliated person of the Fund as defined in the Investment Company Act of 1940. |
| (u) | The rate represents the7-day annualized yield at period end. |
| ## | All or a portion of this security is segregated for when-issued securities. |
Abbreviations:
| FHLMC | Federal Home Loan Mortgage Corporation |
| FNMA | Federal National Mortgage Association |
| GNMA | Government National Mortgage Association |
| LIBOR | London Interbank Offered Rate |
Futures Contracts
| | | | | | | | | | | | | | | | | | | | | | | | |
| Description | | Number of
contracts | | | Expiration
date | | | Notional
cost | | | Notional
value | | | Unrealized
gains | | | Unrealized
losses | |
| | | | | | |
Long | | | | | | | | | | | | | | | | | | | | | | | | |
| | | | | | |
2-Year U.S. Treasury Notes | | | 1,119 | | | | 6-30-2020 | | | $ | 243,306,870 | | | $ | 244,309,173 | | | $ | 1,002,303 | | | $ | 0 | |
| | | | | | |
Short | | | | | | | | | | | | | | | | | | | | | | | | |
| | | | | | |
10-Year Ultra Futures | | | (95) | | | | 6-19-2020 | | | | (14,058,252 | ) | | | (14,270,781 | ) | | | 0 | | | | (212,529 | ) |
| | | | | | |
5-Year U.S. Treasury Notes | | | (403) | | | | 6-30-2020 | | | | (49,020,406 | ) | | | (49,468,250 | ) | | | 0 | | | | (447,844 | ) |
| | | | | | | | | | | | | | | | | | | | | | | | |
| | | | | | |
| | | | | | | | | | | | | | | | | | $ | 1,002,303 | | | $ | (660,373 | ) |
| | | | | | | | | | | | | | | | | | | | | | | | |
Investments in Affiliates
An affiliated investment is an investment in which the Fund owns at least 5% of the outstanding voting shares of the issuer or as a result of other relationships, such as the Fund and the issuer having the same investment manager. Transactions with issuers that were either affiliated persons of the Fund at the beginning of the period or the end of the period were as follows:
| | | | | | | | | | | | | | | | | | | | | | | | | | | | | | | | | | | | |
| | | Shares,
beginning of
period | | | Shares
purchased | | | Shares
sold | | | Shares,
end of
period | | | Net
realized
gains
(losses) | | | Net
change in
unrealized
gains
(losses) | | | Income
from
affiliated
securities | | | Value,
end of
period | | | % of
net
assets | |
Short-Term Investments | | | | | | | | | | | | | | | | | | | | | | | | | | | | | | | | | | | | |
Investment Companies | | | | | | | | | | | | | | | | | | | | | | | | | | | | | | | | | | | | |
Wells Fargo Government Money Market Fund Select Class | | | 7,563,717 | | | | 319,845,738 | | | | (286,937,323 | ) | | | 40,472,132 | | | $ | 0 | | | $ | 0 | | | $ | 107,536 | | | $ | 40,472,132 | | | | 7.40 | % |
The accompanying notes are an integral part of these financial statements.
10 | Wells Fargo Short Duration Government Bond Fund
Statement of assets and liabilities—February 29, 2020 (unaudited)
| | | | |
| | | | |
| |
Assets | | | | |
Investments in unaffiliated securities, at value (cost $530,002,599) | | $ | 538,186,225 | |
Investments in affiliated securities, at value (cost $40,472,132) | | | 40,472,132 | |
Cash | | | 18,165 | |
Cash segregated for future contracts | | | 539,331 | |
Receivable for investments sold | | | 14,483,575 | |
Principal paydown receivable | | | 143,161 | |
Receivable for Fund shares sold | | | 2,338,706 | |
Receivable for interest | | | 1,407,332 | |
Receivable for daily variation margin on open futures contracts | | | 205,353 | |
Prepaid expenses and other assets | | | 102,936 | |
| | | | |
Total assets | | | 597,896,916 | |
| | | | |
| |
Liabilities | | | | |
Payable for investments purchased | | | 50,173,986 | |
Payable for Fund shares redeemed | | | 675,895 | |
Management fee payable | | | 120,847 | |
Dividends payable | | | 51,078 | |
Administration fees payable | | | 36,313 | |
Distribution fee payable | | | 4,921 | |
Trustees’ fees and expenses payable | | | 5,766 | |
Accrued expenses and other liabilities | | | 162,037 | |
| | | | |
Total liabilities | | | 51,230,843 | |
| | | | |
Total net assets | | $ | 546,666,073 | |
| | | | |
| |
Net assets consist of | | | | |
Paid-in capital | | $ | 615,931,924 | |
Total distributable loss | | | (69,265,851 | ) |
| | | | |
Total net assets | | $ | 546,666,073 | |
| | | | |
| |
Computation of net asset value and offering price per share | | | | |
Net assets – Class A | | $ | 27,198,732 | |
Shares outstanding – Class A1 | | | 2,774,116 | |
Net asset value per share – Class A | | | $9.80 | |
Maximum offering price per share – Class A2 | | | $10.00 | |
Net assets – Class C | | $ | 8,018,496 | |
Shares outstanding – Class C1 | | | 816,439 | |
Net asset value per share – Class C | | | $9.82 | |
Net assets – Class R6 | | $ | 39,649,559 | |
Shares outstanding – Class R61 | | | 4,028,729 | |
Net asset value per share – Class R6 | | | $9.84 | |
Net assets – Administrator Class | | $ | 37,664,135 | |
Shares outstanding – Administrator Class1 | | | 3,833,604 | |
Net asset value per share – Administrator Class | | | $9.82 | |
Net assets – Institutional Class | | $ | 434,135,151 | |
Shares outstanding – Institutional Class1 | | | 44,203,808 | |
Net asset value per share – Institutional Class | | | $9.82 | |
| 1 | The Fund has an unlimited number of authorized shares. |
| 2 | Maximum offering price is computed as 100/98 of net asset value. On investments of $50,000 or more, the offering price is reduced. |
The accompanying notes are an integral part of these financial statements.
Wells Fargo Short Duration Government Bond Fund | 11
Statement of operations—six months ended February 29, 2020 (unaudited)
| | | | |
| | | | |
| |
Investment income | | | | |
Interest | | $ | 6,830,604 | |
Income from affiliated securities | | | 107,536 | |
| | | | |
Total investment income | | | 6,938,140 | |
| | | | |
| |
Expenses | | | | |
Management fee | | | 968,622 | |
Administration fees | | | | |
Class A | | | 23,190 | |
Class C | | | 7,021 | |
Class R6 | | | 5,849 | |
Administrator Class | | | 18,578 | |
Institutional Class | | | 175,836 | |
Shareholder servicing fees | | | | |
Class A | | | 36,234 | |
Class C | | | 10,969 | |
Administrator Class | | | 46,445 | |
Distribution fee | | | | |
Class C | | | 32,843 | |
Custody and accounting fees | | | 33,704 | |
Professional fees | | | 26,775 | |
Registration fees | | | 39,670 | |
Shareholder report expenses | | | 34,712 | |
Trustees’ fees and expenses | | | 10,909 | |
Other fees and expenses | | | 9,917 | |
| | | | |
Total expenses | | | 1,481,274 | |
Less: Fee waivers and/or expense reimbursements | | | | |
Fund-level | | | (103,904 | ) |
Class A | | | (262 | ) |
Class R6 | | | (5,849 | ) |
Administrator Class | | | (14,499 | ) |
Institutional Class | | | (69,840 | ) |
| | | | |
Net expenses | | | 1,286,920 | |
| | | | |
Net investment income | | | 5,651,220 | |
| | | | |
| |
Realized and unrealized gains (losses) on investments | | | | |
Net realized gains (losses) on | | | | |
Unaffiliated securities | | | 1,967,047 | |
Futures contracts | | | (231,579 | ) |
| | | | |
Net realized gains on investments | | | 1,735,468 | |
| | | | |
Net change in unrealized gains (losses) on | | | | |
Unaffiliated securities | | | 3,417,299 | |
Futures contracts | | | 332,355 | |
| | | | |
Net change in unrealized gains (losses) on investments | | | 3,749,654 | |
| | | | |
Net realized and unrealized gains (losses) on investments | | | 5,485,122 | |
| | | | |
Net increase in net assets resulting from operations | | $ | 11,136,342 | |
| | | | |
The accompanying notes are an integral part of these financial statements.
12 | Wells Fargo Short Duration Government Bond Fund
Statement of changes in net assets
| | | | | | | | | | | | | | | | |
| | | Six months ended
February 29, 2020
(unaudited) | | | Year ended
August 31, 2019 | |
| | | | |
Operations | | | | | | | | | | | | | | | | |
Net investment income | | | | | | $ | 5,651,220 | | | | | | | $ | 14,884,157 | |
Net realized gains on investments | | | | | | | 1,735,468 | | | | | | | | 50,123 | |
Net change in unrealized gains (losses) on investments | | | | | | | 3,749,654 | | | | | | | | 9,018,055 | |
| | | | |
Net increase in net assets resulting from operations | | | | | | | 11,136,342 | | | | | | | | 23,952,335 | |
| | | | |
| | | | |
Distributions to shareholders from net investment income and net realized gains | | | | | | | | | | | | | | | | |
Class A | | | | | | | (331,847 | ) | | | | | | | (753,979 | ) |
Class C | | | | | | | (67,476 | ) | | | | | | | (226,983 | ) |
Class R6 | | | | | | | (527,580 | ) | | | | | | | (1,078,024 | ) |
Administrator Class | | | | | | | (458,838 | ) | | | | | | | (1,529,339 | ) |
Institutional Class | | | | | | | (5,827,232 | ) | | | | | | | (12,903,892 | ) |
| | | | |
Total distributions to shareholders | | | | | | | (7,212,973 | ) | | | | | | | (16,492,217 | ) |
| | | | |
| | | | |
Capital share transactions | | | Shares | | | | | | | | Shares | | | | | |
Proceeds from shares sold | | | | | | | | | | | | | | | | |
Class A | | | 317,775 | | | | 3,086,221 | | | | 617,334 | | | | 5,934,764 | |
Class C | | | 65,831 | | | | 640,406 | | | | 106,035 | | | | 1,018,014 | |
Class R6 | | | 661,536 | | | | 6,454,854 | | | | 2,188,387 | | | | 21,183,601 | |
Administrator Class | | | 149,612 | | | | 1,458,249 | | | | 238,230 | | | | 2,291,607 | |
Institutional Class | | | 9,685,505 | | | | 94,255,751 | | | | 10,430,140 | | | | 100,435,708 | |
| | | | |
| | | | | | | 105,895,481 | | | | | | | | 130,863,694 | |
| | | | |
Reinvestment of distributions | | | | | | | | | | | | | | | | |
Class A | | | 32,517 | | | | 315,994 | | | | 74,715 | | | | 719,348 | |
Class C | | | 6,370 | | | | 62,005 | | | | 21,609 | | | | 208,280 | |
Class R6 | | | 46,831 | | | | 456,860 | | | | 93,340 | | | | 902,462 | |
Administrator Class | | | 46,702 | | | | 454,809 | | | | 157,806 | | | | 1,521,378 | |
Institutional Class | | | 576,061 | | | | 5,605,728 | | | | 1,279,269 | | | | 12,338,544 | |
| | | | |
| | | | | | | 6,895,396 | | | | | | | | 15,690,012 | |
| | | | |
Payment for shares redeemed | | | | | | | | | | | | | | | | |
Class A | | | (619,205 | ) | | | (6,011,588 | ) | | | (829,358 | ) | | | (7,984,256 | ) |
Class C | | | (284,667 | ) | | | (2,769,548 | ) | | | (667,791 | ) | | | (6,437,263 | ) |
Class R6 | | | (977,222 | ) | | | (9,511,431 | ) | | | (1,664,571 | ) | | | (16,097,185 | ) |
Administrator Class | | | (342,745 | ) | | | (3,334,281 | ) | | | (3,899,844 | ) | | | (37,590,853 | ) |
Institutional Class | | | (11,725,988 | ) | | | (114,084,390 | ) | | | (17,338,426 | ) | | | (166,712,595 | ) |
| | | | |
| | | | | | | (135,711,238 | ) | | | | | | | (234,822,152 | ) |
| | | | |
Net decrease in net assets resulting from capital share transactions | | | | | | | (22,920,361 | ) | | | | | | | (88,268,446 | ) |
| | | | |
Total decrease in net assets | | | | | | | (18,996,992 | ) | | | | | | | (80,808,328 | ) |
| | | | |
| | | | |
Net assets | | | | | | | | | | | | | | | | |
Beginning of period | | | | | | | 565,663,065 | | | | | | | | 646,471,393 | |
| | | | |
End of period | | | | | | $ | 546,666,073 | | | | | | | $ | 565,663,065 | |
| | | | |
The accompanying notes are an integral part of these financial statements.
Wells Fargo Short Duration Government Bond Fund | 13
Financial highlights
(For a share outstanding throughout each period)
| | | | | | | | | | | | | | | | | | | | | | | | |
| | | Six months ended
February 29, 2020
(unaudited) | | | Year ended August 31 | |
| CLASS A | | 2019 | | | 2018 | | | 2017 | | | 2016 | | | 2015 | |
Net asset value, beginning of period | | | $9.73 | | | | $9.60 | | | | $9.85 | | | | $9.96 | | | | $10.02 | | | | $10.08 | |
Net investment income | | | 0.09 | | | | 0.21 | | | | 0.14 | | | | 0.07 | | | | 0.07 | | | | 0.04 | |
Net realized and unrealized gains (losses) on investments | | | 0.09 | | | | 0.16 | | | | (0.20 | ) | | | (0.03 | ) | | | 0.02 | | | | 0.02 | |
| | | | | | | | | | | | | | | | | | | | | | | | |
Total from investment operations | | | 0.18 | | | | 0.37 | | | | (0.06 | ) | | | 0.04 | | | | 0.09 | | | | 0.06 | |
Distributions to shareholders from | | | | | | | | | | | | | | | | | | | | | | | | |
Net investment income | | | (0.11 | ) | | | (0.24 | ) | | | (0.19 | ) | | | (0.15 | ) | | | (0.15 | ) | | | (0.12 | ) |
Net asset value, end of period | | | $9.80 | | | | $9.73 | | | | $9.60 | | | | $9.85 | | | | $9.96 | | | | $10.02 | |
Total return1 | | | 1.87 | % | | | 3.92 | % | | | (0.56 | )% | | | 0.45 | % | | | 0.90 | % | | | 0.55 | % |
Ratios to average net assets (annualized) | | | | | | | | | | | | | | | | | | | | | | | | |
Gross expenses | | | 0.82 | % | | | 0.81 | % | | | 0.80 | % | | | 0.79 | % | | | 0.78 | % | | | 0.78 | % |
Net expenses | | | 0.78 | % | | | 0.78 | % | | | 0.78 | % | | | 0.78 | % | | | 0.78 | % | | | 0.78 | % |
Net investment income | | | 1.73 | % | | | 2.22 | % | | | 1.36 | % | | | 0.79 | % | | | 0.70 | % | | | 0.55 | % |
Supplemental data | | | | | | | | | | | | | | | | | | | | | | | | |
Portfolio turnover rate | | | 242 | % | | | 635 | % | | | 331 | % | | | 348 | % | | | 284 | % | | | 500 | % |
Net assets, end of period (000s omitted) | | | $27,199 | | | | $29,618 | | | | $30,538 | | | | $51,890 | | | | $57,976 | | | | $62,504 | |
| 1 | Total return calculations do not include any sales charges. Returns for periods of less than one year are not annualized. |
The accompanying notes are an integral part of these financial statements.
14 | Wells Fargo Short Duration Government Bond Fund
Financial highlights
(For a share outstanding throughout each period)
| | | | | | | | | | | | | | | | | | | | | | | | |
| | | Six months ended
February 29, 2020
(unaudited) | | | Year ended August 31 | |
| CLASS C | | 2019 | | | 2018 | | | 2017 | | | 2016 | | | 2015 | |
Net asset value, beginning of period | | | $9.75 | | | | $9.62 | | | | $9.87 | | | | $9.98 | | | | $10.03 | | | | $10.10 | |
Net investment income (loss) | | | 0.05 | | | | 0.14 | 1 | | | 0.06 | 1 | | | (0.00 | )1,2 | | | (0.01 | ) | | | (0.03 | ) |
Net realized and unrealized gains (losses) on investments | | | 0.09 | | | | 0.16 | | | | (0.19 | ) | | | (0.03 | ) | | | 0.03 | | | | 0.00 | 2 |
| | | | | | | | | | | | | | | | | | | | | | | | |
Total from investment operations | | | 0.14 | | | | 0.30 | | | | (0.13 | ) | | | (0.03 | ) | | | 0.02 | | | | (0.03 | ) |
Distributions to shareholders from | | | | | | | | | | | | | | | | | | | | | | | | |
Net investment income | | | (0.07 | ) | | | (0.17 | ) | | | (0.12 | ) | | | (0.08 | ) | | | (0.07 | ) | | | (0.04 | ) |
Net asset value, end of period | | | $9.82 | | | | $9.75 | | | | $9.62 | | | | $9.87 | | | | $9.98 | | | | $10.03 | |
Total return3 | | | 1.49 | % | | | 3.14 | % | | | (1.30 | )% | | | (0.30 | )% | | | 0.25 | % | | | (0.30 | )% |
Ratios to average net assets (annualized) | | | | | | | | | | | | | | | | | | | | | | | | |
Gross expenses | | | 1.56 | % | | | 1.56 | % | | | 1.55 | % | | | 1.54 | % | | | 1.53 | % | | | 1.53 | % |
Net expenses | | | 1.53 | % | | | 1.53 | % | | | 1.53 | % | | | 1.53 | % | | | 1.53 | % | | | 1.53 | % |
Net investment income (loss) | | | 0.98 | % | | | 1.49 | % | | | 0.62 | % | | | 0.04 | % | | | (0.05 | )% | | | (0.20 | )% |
Supplemental data | | | | | | | | | | | | | | | | | | | | | | | | |
Portfolio turnover rate | | | 242 | % | | | 635 | % | | | 331 | % | | | 348 | % | | | 284 | % | | | 500 | % |
Net assets, end of period (000s omitted) | | | $8,018 | | | | $10,032 | | | | $15,093 | | | | $20,026 | | | | $27,454 | | | | $31,910 | |
| 1 | Calculated based upon average shares outstanding |
| 2 | Amount is less than $0.005. |
| 3 | Total return calculations do not include any sales charges. Returns for periods of less than one year are not annualized. |
The accompanying notes are an integral part of these financial statements.
Wells Fargo Short Duration Government Bond Fund | 15
Financial highlights
(For a share outstanding throughout each period)
| | | | | | | | | | | | | | | | | | | | | | | | |
| | | Six months ended
February 29, 2020
(unaudited) | | | Year ended August 31 | |
| CLASS R6 | | 2019 | | | 2018 | | | 2017 | | | 2016 | | | 2015 | |
Net asset value, beginning of period | | | $9.77 | | | | $9.64 | | | | $9.89 | | | | $9.99 | | | | $10.05 | | | | $10.11 | |
Net investment income | | | 0.11 | 1 | | | 0.25 | 1 | | | 0.16 | 1 | | | 0.12 | 1 | | | 0.12 | | | | 0.09 | 1 |
Net realized and unrealized gains (losses) on investments | | | 0.09 | | | | 0.16 | | | | (0.17 | ) | | | (0.02 | ) | | | 0.01 | | | | 0.01 | |
| | | | | | | | | | | | | | | | | | | | | | | | |
Total from investment operations | | | 0.20 | | | | 0.41 | | | | (0.01 | ) | | | 0.10 | | | | 0.13 | | | | 0.10 | |
Distributions to shareholders from | | | | | | | | | | | | | | | | | | | | | | | | |
Net investment income | | | (0.13 | ) | | | (0.28 | ) | | | (0.24 | ) | | | (0.20 | ) | | | (0.19 | ) | | | (0.16 | ) |
Net asset value, end of period | | | $9.84 | | | | $9.77 | | | | $9.64 | | | | $9.89 | | | | $9.99 | | | | $10.05 | |
Total return2 | | | 2.07 | % | | | 4.34 | % | | | (0.14 | )% | | | 0.96 | % | | | 1.32 | % | | | 0.96 | % |
Ratios to average net assets (annualized) | | | | | | | | | | | | | | | | | | | | | | | | |
Gross expenses | | | 0.44 | % | | | 0.43 | % | | | 0.42 | % | | | 0.41 | % | | | 0.40 | % | | | 0.40 | % |
Net expenses | | | 0.37 | % | | | 0.37 | % | | | 0.37 | % | | | 0.37 | % | | | 0.37 | % | | | 0.37 | % |
Net investment income | | | 2.15 | % | | | 2.62 | % | | | 1.64 | % | | | 1.19 | % | | | 1.11 | % | | | 0.88 | % |
Supplemental data | | | | | | | | | | | | | | | | | | | | | | | | |
Portfolio turnover rate | | | 242 | % | | | 635 | % | | | 331 | % | | | 348 | % | | | 284 | % | | | 500 | % |
Net assets, end of period (000s omitted) | | | $39,650 | | | | $41,987 | | | | $35,472 | | | | $172,106 | | | | $233,993 | | | | $231,878 | |
| 1 | Calculated based upon average shares outstanding |
| 2 | Returns for periods of less than one year are not annualized. |
The accompanying notes are an integral part of these financial statements.
16 | Wells Fargo Short Duration Government Bond Fund
Financial highlights
(For a share outstanding throughout each period)
| | | | | | | | | | | | | | | | | | | | | | | | |
| | | Six months ended
February 29, 2020
(unaudited) | | | Year ended August 31 | |
| ADMINISTRATOR CLASS | | 2019 | | | 2018 | | | 2017 | | | 2016 | | | 2015 | |
Net asset value, beginning of period | | | $9.75 | | | | $9.62 | | | | $9.87 | | | | $9.98 | | | | $10.03 | | | | $10.10 | |
Net investment income | | | 0.09 | | | | 0.23 | 1 | | | 0.15 | 1 | | | 0.08 | | | | 0.08 | | | | 0.06 | |
Net realized and unrealized gains (losses) on investments | | | 0.10 | | | | 0.16 | | | | (0.19 | ) | | | (0.02 | ) | | | 0.04 | | | | 0.00 | 2 |
| | | | | | | | | | | | | | | | | | | | | | | | |
Total from investment operations | | | 0.19 | | | | 0.39 | | | | (0.04 | ) | | | 0.06 | | | | 0.12 | | | | 0.06 | |
Distributions to shareholders from | | | | | | | | | | | | | | | | | | | | | | | | |
Net investment income | | | (0.12 | ) | | | (0.26 | ) | | | (0.21 | ) | | | (0.17 | ) | | | (0.17 | ) | | | (0.13 | ) |
Net asset value, end of period | | | $9.82 | | | | $9.75 | | | | $9.62 | | | | $9.87 | | | | $9.98 | | | | $10.03 | |
Total return2 | | | 1.96 | % | | | 4.10 | % | | | (0.37 | )% | | | 0.63 | % | | | 1.18 | % | | | 0.63 | % |
Ratios to average net assets (annualized) | | | | | | | | | | | | | | | | | | | | | | | | |
Gross expenses | | | 0.76 | % | | | 0.75 | % | | | 0.74 | % | | | 0.73 | % | | | 0.72 | % | | | 0.72 | % |
Net expenses | | | 0.60 | % | | | 0.60 | % | | | 0.60 | % | | | 0.60 | % | | | 0.60 | % | | | 0.60 | % |
Net investment income | | | 1.91 | % | | | 2.41 | % | | | 1.56 | % | | | 0.96 | % | | | 0.87 | % | | | 0.73 | % |
Supplemental data | | | | | | | | | | | | | | | | | | | | | | | | |
Portfolio turnover rate | | | 242 | % | | | 635 | % | | | 331 | % | | | 348 | % | | | 284 | % | | | 500 | % |
Net assets, end of period (000s omitted) | | | $37,664 | | | | $38,816 | | | | $71,997 | | | | $89,743 | | | | $121,576 | | | | $156,669 | |
| 1 | Calculated based upon average shares outstanding |
| 2 | Returns for periods of less than one year are not annualized. |
The accompanying notes are an integral part of these financial statements.
Wells Fargo Short Duration Government Bond Fund | 17
Financial highlights
(For a share outstanding throughout each period)
| | | | | | | | | | | | | | | | | | | | | | | | |
| | | Six months ended
February 29, 2020
(unaudited) | | | Year ended August 31 | |
| INSTITUTIONAL CLASS | | 2019 | | | 2018 | | | 2017 | | | 2016 | | | 2015 | |
Net asset value, beginning of period | | | $9.75 | | | | $9.62 | | | | $9.87 | | | | $9.98 | | | | $10.03 | | | | $10.10 | |
Net investment income | | | 0.10 | | | | 0.25 | | | | 0.17 | | | | 0.11 | | | | 0.11 | | | | 0.09 | 1 |
Net realized and unrealized gains (losses) on investments | | | 0.10 | | | | 0.16 | | | | (0.19 | ) | | | (0.03 | ) | | | 0.03 | | | | (0.01 | ) |
| | | | | | | | | | | | | | | | | | | | | | | | |
Total from investment operations | | | 0.20 | | | | 0.41 | | | | (0.02 | ) | | | 0.08 | | | | 0.14 | | | | 0.08 | |
Distributions to shareholders from | | | | | | | | | | | | | | | | | | | | | | | | |
Net investment income | | | (0.13 | ) | | | (0.28 | ) | | | (0.23 | ) | | | (0.19 | ) | | | (0.19 | ) | | | (0.15 | ) |
Net asset value, end of period | | | $9.82 | | | | $9.75 | | | | $9.62 | | | | $9.87 | | | | $9.98 | | | | $10.03 | |
Total return1 | | | 2.05 | % | | | 4.29 | % | | | (0.20 | )% | | | 0.81 | % | | | 1.37 | % | | | 0.81 | % |
Ratios to average net assets (annualized) | | | | | | | | | | | | | | | | | | | | | | | | |
Gross expenses | | | 0.49 | % | | | 0.48 | % | | | 0.47 | % | | | 0.46 | % | | | 0.45 | % | | | 0.45 | % |
Net expenses | | | 0.42 | % | | | 0.42 | % | | | 0.42 | % | | | 0.42 | % | | | 0.42 | % | | | 0.42 | % |
Net investment income | | | 2.09 | % | | | 2.58 | % | | | 1.75 | % | | | 1.15 | % | | | 1.06 | % | | | 0.92 | % |
Supplemental data | | | | | | | | | | | | | | | | | | | | | | | | |
Portfolio turnover rate | | | 242 | % | | | 635 | % | | | 331 | % | | | 348 | % | | | 284 | % | | | 500 | % |
Net assets, end of period (000s omitted) | | | $434,135 | | | | $445,211 | | | | $493,372 | | | | $579,690 | | | | $664,047 | | | | $587,835 | |
| 1 | Returns for periods of less than one year are not annualized. |
The accompanying notes are an integral part of these financial statements.
18 | Wells Fargo Short Duration Government Bond Fund
Notes to financial statements (unaudited)
1. ORGANIZATION
Wells Fargo Funds Trust (the “Trust”), a Delaware statutory trust organized on March 10, 1999, is anopen-end management investment company registered under the Investment Company Act of 1940, as amended (the “1940 Act”). As an investment company, the Trust follows the accounting and reporting guidance in Financial Accounting Standards Board (“FASB”)Accounting Standards Codification Topic 946, Financial Services – Investment Companies. These financial statements report on the Wells Fargo Short Duration Government Bond Fund (the “Fund”) which is a diversified series of the Trust.
2. SIGNIFICANT ACCOUNTING POLICIES
The following significant accounting policies, which are consistently followed in the preparation of the financial statements of the Fund, are in conformity with U.S. generally accepted accounting principles which require management to make estimates and assumptions that affect the reported amounts of assets and liabilities, disclosure of contingent assets and liabilities at the date of the financial statements, and the reported amounts of revenues and expenses during the reporting period. Actual results could differ from those estimates.
Securities valuation
All investments are valued each business day as of the close of regular trading on the New York Stock Exchange (generally 4 p.m. Eastern Time), although the Fund may deviate from this calculation time under unusual or unexpected circumstances.
Debt securities are valued at the evaluated bid price provided by an independent pricing service (e.g. taking into account various factors, including yields, maturities, or credit ratings) or, if a reliable price is not available, the quoted bid price from an independent broker-dealer.
Futures contracts that are listed on a foreign or domestic exchange or market are valued at the official closing price or, if none, the last sales price.
Investments in registeredopen-end investment companies are valued at net asset value.
Investments which are not valued using any of the methods discussed above are valued at their fair value, as determined in good faith by the Board of Trustees of the Fund. The Board of Trustees has established a Valuation Committee comprised of the Trustees and has delegated to it the authority to take any actions regarding the valuation of portfolio securities that the Valuation Committee deems necessary or appropriate, including determining the fair value of portfolio securities, unless the determination has been delegated to the Wells Fargo Asset Management Pricing Committee at Wells Fargo Funds Management, LLC (“Funds Management”). The Board of Trustees retains the authority to make or ratify any valuation decisions or approve any changes to the Valuation Procedures as it deems appropriate. On a quarterly basis, the Board of Trustees receives reports on any valuation actions taken by the Valuation Committee or the Wells Fargo Asset Management Pricing Committee which may include items for ratification.
When-issued transactions
The Fund may purchase securities on a forward commitment or when-issued basis. The Fund records a when-issued transaction on the trade date and will segregate assets in an amount at least equal in value to the Fund’s commitment to purchase when-issued securities. Securities purchased on a when-issued basis aremarked-to-market daily and the Fund begins earning interest on the settlement date. Losses may arise due to changes in the market value of the underlying securities or if the counterparty does not perform under the contract.
Futures contracts
Futures contracts are agreements between the Fund and a counterparty to buy or sell a specific amount of a commodity, financial instrument or currency at a specified price and on a specified date. The Fund may buy and sell futures contracts in order to gain exposure to, or protect against, changes in interest rates and is subject to interest rate risk. The primary risks associated with the use of futures contracts are the imperfect correlation between changes in market values of securities held by the Fund and the prices of futures contracts, and the possibility of an illiquid market. Futures contracts are generally entered into on a regulated futures exchange and cleared through a clearinghouse associated with the exchange. With futures contracts, there is minimal counterparty risk to the Fund since futures contracts are exchange traded and the exchange’s clearinghouse, as the counterparty to all exchange traded futures, guarantees the futures contracts against default.
Upon entering into a futures contracts, the Fund is required to deposit either cash or securities (initial margin) with the broker in an amount equal to a certain percentage of the contract value. Subsequent payments (variation margin) are paid to or from the broker each day equal to the daily changes in the contract value. Such payments are recorded as unrealized gains or losses and, if any, shown as variation margin receivable (payable) in the Statement of Assets and Liabilities. Should the Fund fail to
Wells Fargo Short Duration Government Bond Fund | 19
Notes to financial statements (unaudited)
make requested variation margin payments, the broker can gain access to the initial margin to satisfy the Fund’s payment obligations. When the contracts are closed, a realized gain or loss is recorded in the Statement of Operations.
Security transactions and income recognition
Securities transactions are recorded on a trade date basis. Realized gains or losses are recorded on the basis of identified cost.
Interest income is accrued daily and bond discounts are accreted and premiums are amortized daily. To the extent debt obligations are placed onnon-accrual status, any related interest income may be reduced by writing off interest receivables when the collection of all or a portion of interest has been determined to be doubtful based on consistently applied procedures and the fair value has decreased. If the issuer subsequently resumes interest payments or when the collectability of interest is reasonably assured, the debt obligation is removed fromnon-accrual status. Paydown gains and losses are included in interest income.
Distributions to shareholders
Distributions to shareholders from net investment income are declared daily and paid monthly. Distributions from net realized gains, if any, are recorded on theex-dividend date and paid at least annually. Such distributions are determined in accordance with income tax regulations and may differ from U.S. generally accepted accounting principles. Dividend sources are estimated at the time of declaration. The tax character of distributions is determined as of the Fund’s fiscal year end. Therefore, a portion of the Fund’s distributions made prior to the Fund’s fiscal year end may be categorized as a tax return of capital at year end.
Federal and other taxes
The Fund intends to continue to qualify as a regulated investment company by distributing substantially all of its investment company taxable income and any net realized capital gains (after reduction for capital loss carryforwards) sufficient to relieve it from all, or substantially all, federal income taxes. Accordingly, no provision for federal income taxes was required.
The Fund’s income and federal excise tax returns and all financial records supporting those returns for the prior three fiscal years are subject to examination by the federal and Delaware revenue authorities. Management has analyzed the Fund’s tax positions taken on federal, state, and foreign tax returns for all open tax years and does not believe that there are any uncertain tax positions that require recognition of a tax liability.
As of February 29, 2020, the aggregate cost of all investments for federal income tax purposes was $570,544,528 and the unrealized gains (losses) consisted of:
| | | | |
| |
Gross unrealized gains | | $ | 9,548,200 | |
| |
Gross unrealized losses | | | (1,092,441 | ) |
| |
Net unrealized gains | | $ | 8,455,759 | |
As of August 31, 2019, the Fund had capital loss carryforwards which consist of $42,276,451 in short-term capital losses and $36,146,102 in long-term capital losses.
Class allocations
The separate classes of shares offered by the Fund differ principally in applicable sales charges, distribution, shareholder servicing, and administration fees. Class specific expenses are charged directly to that share class. Investment income, common fund-level expenses, and realized and unrealized gains (losses) on investments are allocated daily to each class of shares based on the relative proportion of net assets of each class.
3. FAIR VALUATION MEASUREMENTS
Fair value measurements of investments are determined within a framework that has established a fair value hierarchy based upon the various data inputs utilized in determining the value of the Fund’s investments. The three-level hierarchy gives the highest priority to unadjusted quoted prices in active markets for identical assets or liabilities (Level 1) and the lowest priority to unobservable inputs (Level 3). The Fund’s investments are classified within the fair value hierarchy based on the lowest level of input that is significant to the fair value measurement. The inputs are summarized into three broad levels as follows:
| ∎ | | Level 1 – quoted prices in active markets for identical securities |
| ∎ | | Level 2 – other significant observable inputs (including quoted prices for similar securities, interest rates, prepayment speeds, credit risk, etc.) |
| ∎ | | Level 3 – significant unobservable inputs (including the Fund’s own assumptions in determining the fair value of investments) |
The inputs or methodologies used for valuing investments in securities are not necessarily an indication of the risk associated with investing in those securities.
20 | Wells Fargo Short Duration Government Bond Fund
Notes to financial statements (unaudited)
The following is a summary of the inputs used in valuing the Fund’s assets and liabilities as of February 29, 2020:
| | | | | | | | | | | | | | | | |
| | | | |
| | | Quoted prices
(Level 1) | | | Other significant
observable inputs
(Level 2) | | | Significant
unobservable inputs
(Level 3) | | | Total | |
| | | | |
Assets | | | | | | | | | | | | | | | | |
Investments in: | | | | | | | | | | | | | | | | |
| | | | |
Agency securities | | $ | 0 | | | $ | 383,933,284 | | | $ | 0 | | | $ | 383,933,284 | |
| | | | |
Asset-backed securities | | | 0 | | | | 58,670,666 | | | | 0 | | | | 58,670,666 | |
| | | | |
Non-agency mortgage-backed securities | | | 0 | | | | 32,185,707 | | | | 0 | | | | 32,185,707 | |
| | | | |
U.S. Treasury securities | | | 63,396,568 | | | | 0 | | | | 0 | | | | 63,396,568 | |
| | | | |
Short-term investments | | | | | | | | | | | | | | | | |
| | | | |
Investment companies | | | 40,472,132 | | | | 0 | | | | 0 | | | | 40,472,132 | |
| | | | |
| | | 103,868,700 | | | | 474,789,657 | | | | 0 | | | | 578,658,357 | |
| | | | |
Futures contracts | | | 1,002,303 | | | | 0 | | | | 0 | | | | 1,002,303 | |
| | | | |
Total assets | | $ | 104,871,003 | | | $ | 474,789,657 | | | $ | 0 | | | $ | 579,660,660 | |
| | | | |
Liabilities | | | | | | | | | | | | | | | | |
| | | | |
Futures contracts | | $ | 660,373 | | | $ | 0 | | | $ | 0 | | | $ | 660,373 | |
| | | | |
Total liabilities | | $ | 660,373 | | | $ | 0 | | | $ | 0 | | | $ | 660,373 | |
Additional sector, industry or geographic detail is included in the Portfolio of Investments.
Futures contracts are reported at their cumulative unrealized gains (losses) at measurement date as reported in the table following the Portfolio of Investments. For futures contracts, the current day’s variation margin is reported on the Statement of Assets and Liabilities. All other assets and liabilities are reported at their market value at measurement date.
For the six months ended February 29, 2020, the Fund did not have any transfers into/out of Level 3.
4. TRANSACTIONS WITH AFFILIATES
Management fee
Funds Management, an indirect wholly owned subsidiary of Wells Fargo & Company (“Wells Fargo”), is the manager of the Fund and provides advisory and fund-level administrative services under an investment management agreement. Under the investment management agreement, Funds Management is responsible for, among other services, implementing the investment objectives and strategies of the Fund, supervising the subadviser and providing fund-level administrative services in connection with the Fund’s operations. As compensation for its services under the investment management agreement, Funds Management is entitled to receive a management fee at the following annual rate based on the Fund’s average daily net assets:
| | | | |
| |
| Average daily net assets | | Management fee | |
| |
First $1 billion | | | 0.350 | % |
| |
Next $4 billion | | | 0.325 | |
| |
Next $3 billion | | | 0.290 | |
| |
Next $2 billion | | | 0.265 | |
| |
Over $10 billion | | | 0.255 | |
For the six months ended February 29, 2020, the management fee was equivalent to an annual rate of 0.35% of the Fund’s average daily net assets.
Funds Management has retained the services of a subadviser to provide daily portfolio management to the Fund. The fee for subadvisory services is borne by Funds Management. Wells Capital Management Incorporated, an affiliate of Funds Management and an indirect wholly owned subsidiary of Wells Fargo, is the subadviser to the Fund and is entitled to receive a fee from Funds Management at an annual rate starting at 0.15% and declining to 0.05% as the average daily net assets of the Fund increase.
Wells Fargo Short Duration Government Bond Fund | 21
Notes to financial statements (unaudited)
Administration fees
Under a class-level administration agreement, Funds Management provides class-level administrative services to the Fund, which includes paying fees and expenses for services provided by the transfer agent,sub-transfer agents, omnibus account servicers and record-keepers. As compensation for its services under the class-level administration agreement, Funds Management receives an annual fee which is calculated based on the average daily net assets of each class as follows:
| | | | |
| |
| | | Class-level
administration fee | |
| |
Class A, Class C | | | 0.16 | % |
| |
Class R6 | | | 0.03 | |
| |
Administrator Class | | | 0.10 | |
| |
Institutional Class | | | 0.08 | |
Waivers and/or expense reimbursements
Funds Management has contractually waived and/or reimbursed management and administration fees to the extent necessary to maintain certain net operating expense ratios for the Fund. When each class of the Fund has exceeded its expense cap, Funds Management has waived fees and/or reimbursed expenses from fund-level expenses on a proportionate basis and then from class specific expenses. When only certain classes exceed their expense caps, waivers and/or reimbursements are applied against class specific expenses before fund-level expenses. Funds Management has committed through December 31, 2020 to waive fees and/or reimburse expenses to the extent necessary to cap the Fund’s expenses at 0.78% for Class A shares, 1.53% for Class C shares, 0.37% for Class R6 shares, 0.60% for Administrator Class shares, and 0.42% for Institutional Class shares. Prior to or after the commitment expiration date, the cap may be increased or the commitment to maintain the cap may be terminated only with the approval of the Board of Trustees.
Distribution fee
The Trust has adopted a distribution plan for Class C shares of the Fund pursuant to Rule12b-1 under the 1940 Act. A distribution fee is charged to Class C shares and paid to Wells Fargo Funds Distributor, LLC (“Funds Distributor”), the principal underwriter, at an annual rate of 0.75% of the average daily net assets of Class C shares.
In addition, Funds Distributor is entitled to receive thefront-end sales charge from the purchase of Class A shares and a contingent deferred sales charge on the redemption of certain Class A shares. Funds Distributor is also entitled to receive the contingent deferred sales charges from redemptions of Class C shares. For the six months ended February 29, 2020, Funds Distributor received $351 from the sale of Class A shares. No contingent deferred sales charges were incurred by Class A and Class C shares for the six months ended February 29, 2020.
Shareholder servicing fees
The Trust has entered into contracts with one or more shareholder servicing agents, whereby Class A, Class C, and Administrator Class of the Fund are charged a fee at an annual rate of 0.25% of the average daily net assets of each respective class. A portion of these total shareholder servicing fees were paid to affiliates of Wells Fargo.
Interfund transactions
The Fund may purchase or sell portfolio investment securities to certain other Wells Fargo affiliates pursuant to Rule17a-7 under the 1940 Act and under procedures adopted by the Board of Trustees. The procedures have been designed to ensure that these interfund transactions, which do not incur broker commissions, are effected at current market prices.
5. INVESTMENT PORTFOLIO TRANSACTIONS
Purchases and sales of investments, excluding short-term securities, for the six months ended February 29, 2020 were as follows:
| | | | | | |
Purchases at cost | | Sales proceeds |
U.S.
government | | Non-U.S.
government | | U.S.
government | | Non-U.S.
government |
| $1,321,676,478 | | $44,920,378 | | $1,354,001,081 | | $40,053,806 |
22 | Wells Fargo Short Duration Government Bond Fund
Notes to financial statements (unaudited)
6. DERIVATIVE TRANSACTIONS
During the six months ended February 29, 2020, the Fund entered into futures contracts to speculate on interest rates and to help manage the duration of the portfolio. The Fund had an average notional amount of $176,535,843 in long futures contracts and $60,195,905 in short futures contracts during the six months ended February 29, 2020.
The fair value, realized gains or losses and change in unrealized gains or losses, if any, on derivative instruments are reflected in the corresponding financial statement captions.
7. BANK BORROWINGS
The Trust (excluding the money market funds), Wells Fargo Master Trust and Wells Fargo Variable Trust are parties to a $280,000,000 revolving credit agreement whereby the Fund is permitted to use bank borrowings for temporary or emergency purposes, such as to fund shareholder redemption requests. Interest under the credit agreement is charged to the Fund based on a borrowing rate equal to the higher of the Federal Funds rate in effect on that day plus 1.25% or the overnight LIBOR rate in effect on that day plus 1.25%. In addition, an annual commitment fee equal to 0.25% of the unused balance is allocated to each participating fund.
For the six months ended February 29, 2020, there were no borrowings by the Fund under the agreement.
8. INDEMNIFICATION
Under the Trust’s organizational documents, the officers and Trustees have been granted certain indemnification rights against certain liabilities that may arise out of performance of their duties to the Trust. Additionally, in the normal course of business, the Trust may enter into contracts with service providers that contain a variety of indemnification clauses. The Trust’s maximum exposure under these arrangements is dependent on future claims that may be made against the Fund and, therefore, cannot be estimated.
9. NEW ACCOUNTING PRONOUNCEMENTS
In August 2018, FASB issued Accounting Standards Update (“ASU”)No. 2018-13, Fair Value Measurement (Topic 820)Disclosure Framework—Changes to the Disclosure Requirements for Fair Value Measurement. ASU2018-13 updates the disclosure requirements for fair value measurements by modifying or removing certain disclosures and adding certain new disclosures. The amendments are effective for fiscal years, and interim periods within those fiscal years, beginning after December 15, 2019. Early adoption is permitted. Management has adopted the removal and modification of disclosures early, as permitted, and will adopt the additional new disclosures at the effective date.
In March 2017, FASB issued ASUNo. 2017-08,Premium Amortization on Purchased Callable Debt Securities. ASU2017-08 shortens the amortization period for certain callable debt securities held at a premium and requires the premium to be amortized to the earliest call date. The amendments do not require an accounting change for securities held at a discount and discounts will continue to be accreted to the maturity date of the security. ASU2017-08 is effective for fiscal years beginning after December 15, 2018 and for interim periods within those fiscal years. During the current reporting period, management of the Fund adopted the change in accounting policy which did not have a material impact to the Fund’s financial statements.
10. SUBSEQUENT EVENT
On March 11, 2020, the World Health Organization announced that it had made the assessment that coronavirus disease 2019(“COVID-19”) is a pandemic. The impacts ofCOVID-19 is adversely affecting the entire global economy, individual companies and investment products, and the market in general. There is significant uncertainty around the extent and duration of business disruptions related toCOVID-19 and the impact may be short term or may last for an extended period of time. The risk of further spreading ofCOVID-19 has led to significant uncertainty and volatility in the financial markets and the value of the Fund and the securities in which the Fund invests have generally been adversely affected by impacts caused byCOVID-19.
Wells Fargo Short Duration Government Bond Fund | 23
Other information (unaudited)
PROXY VOTING INFORMATION
A description of the policies and procedures used to determine how to vote proxies relating to portfolio securities is available, upon request, by calling1-800-222-8222, visiting our website atwfam.com, or visiting the SEC website at sec.gov. Information regarding how the proxies related to portfolio securities were voted during the most recent12-month period ended June 30 is available on the website atwfam.comor by visiting the SEC website at sec.gov.
QUARTERLY PORTFOLIO HOLDINGS INFORMATION
The Fund files its complete schedule of portfolio holdings with the SEC for the first and third quarters of each fiscal year as an exhibit to its reports on FormN-PORT. Shareholders may view the filed FormN-PORT by visiting the SEC website at sec.gov.
24 | Wells Fargo Short Duration Government Bond Fund
Other information (unaudited)
BOARD OF TRUSTEES AND OFFICERS
Each of the Trustees and Officers1 listed in the table below acts in identical capacities for each fund in the Wells Fargo family of funds, which consists of 146 mutual funds comprising the Wells Fargo Funds Trust, Wells Fargo Variable Trust, Wells Fargo Master Trust and fourclosed-end funds (collectively the “Fund Complex”). This table should be read in conjunction with the Prospectus and the Statement of Additional Information2. The mailing address of each Trustee and Officer is 525 Market Street, 12th Floor, San Francisco, CA 94105. Each Trustee and Officer serves an indefinite term, however, each Trustee serves such term until reaching the mandatory retirement age established by the Trustees.
Independent Trustees
| | | | | | |
Name and
year of birth | | Position held and
length of service* | | Principal occupations during past five years or longer | | Current other
public company or
investment
company
directorships |
| | | |
William R. Ebsworth
(Born 1957) | | Trustee, since 2015 | | Retired. From 1984 to 2013, equities analyst, portfolio manager, research director and chief investment officer at Fidelity Management and Research Company in Boston, Tokyo, and Hong Kong, and retired in 2013 as Chief Investment Officer of Fidelity Strategic Advisers, Inc. where he led a team of investment professionals managing client assets. Prior thereto, Board member of Hong Kong Securities Clearing Co., Hong Kong Options Clearing Corp., the Thailand International Fund, Ltd., Fidelity Investments Life Insurance Company, and Empire Fidelity Investments Life Insurance Company. Audit Committee Chair and Investment Committee Chair of the Vincent Memorial Hospital Endowment(non-profit organization). Mr. Ebsworth is a CFA® charterholder. | | N/A |
| | | |
Jane A. Freeman
(Born 1953) | | Trustee, since 2015;
Chair Liaison, since 2018 | | Retired. From 2012 to 2014 and 1999 to 2008, Chief Financial Officer of Scientific Learning Corporation. From 2008 to 2012, Ms. Freeman provided consulting services related to strategic business projects. Prior to 1999, Portfolio Manager at Rockefeller & Co. and Scudder, Stevens & Clark. Board member of the Harding Loevner Funds from 1996 to 2014, serving as both Lead Independent Director and chair of the Audit Committee. Board member of the Russell Exchange Traded Funds Trust from 2011 to 2012 and the chair of the Audit Committee. Ms. Freeman is a Board Member of The Ruth Bancroft Garden(non-profit organization). She is also an inactive Chartered Financial Analyst. | | N/A |
| | | |
Isaiah Harris, Jr.
(Born 1952) | | Trustee,
since 2009;
Audit Committee Chairman,
since 2019 | | Retired. Chairman of the Board of CIGNA Corporation since 2009, and Director since 2005. From 2003 to 2011, Director of Deluxe Corporation. Prior thereto, President and CEO of BellSouth Advertising and Publishing Corp. from 2005 to 2007, President and CEO of BellSouth Enterprises from 2004 to 2005 and President of BellSouth Consumer Services from 2000 to 2003. Emeritus member of the Iowa State University Foundation Board of Governors. Emeritus Member of the Advisory Board of Iowa State University School of Business. Advisory Board Member, Palm Harbor Academy (private school). Advisory Board Member, Child Evangelism Fellowship(non-profit). Mr. Harris is a certified public accountant (inactive status). | | CIGNA Corporation |
| | | |
Judith M. Johnson
(Born 1949) | | Trustee,
since 2008;
Audit Committee Chairman, from 2009 to 2018 | | Retired. Prior thereto, Chief Executive Officer and Chief Investment Officer of Minneapolis Employees Retirement Fund from 1996 to 2008. Ms. Johnson is an attorney, certified public accountant and a certified managerial accountant. | | N/A |
Wells Fargo Short Duration Government Bond Fund | 25
Other information (unaudited)
| | | | | | |
Name and
year of birth | | Position held and
length of service* | | Principal occupations during past five years or longer | | Current other
public company or
investment
company
directorships |
| | | |
David F. Larcker
(Born 1950) | | Trustee,
since 2009 | | James Irvin Miller Professor of Accounting at the Graduate School of Business, Stanford University, Director of the Corporate Governance Research Initiative and Senior Faculty of The Rock Center for Corporate Governance since 2006. From 2005 to 2008, Professor of Accounting at the Graduate School of Business, Stanford University. Prior thereto, Ernst & Young Professor of Accounting at The Wharton School, University of Pennsylvania from 1985 to 2005. | | N/A |
| | | |
Olivia S. Mitchell
(Born 1953) | | Trustee,
since 2006; Nominating and Governance Committee Chair,
since 2018 | | International Foundation of Employee Benefit Plans Professor, Wharton School of the University of Pennsylvania since 1993. Director of Wharton’s Pension Research Council and Boettner Center on Pensions & Retirement Research, and Research Associate at the National Bureau of Economic Research. Previously, Cornell University Professor from 1978 to 1993. | | N/A |
| | | |
Timothy J. Penny
(Born 1951) | | Trustee,
since 1996; Chairman,
since 2018 | | President and Chief Executive Officer of Southern Minnesota Initiative Foundation, anon-profit organization, since 2007. Member of the Board of Trustees of NorthStar Education Finance, Inc., anon-profit organization, since 2007. | | N/A |
| | | |
| James G. Polisson (Born 1959) | | Trustee,
since 2018 | | Retired. Chief Marketing Officer, Source (ETF) UK Services, Ltd, from 2015 to 2017. From 2012 to 2015, Principal of The Polisson Group, LLC, a management consulting, corporate advisory and principal investing company. Chief Executive Officer and Managing Director at Russell Investments, Global Exchange Traded Funds from 2010 to 2012. Managing Director of Barclays Global Investors from 1998 to 2010 and Global Chief Marketing Officer for iShares and Barclays Global Investors from 2000 to 2010. Trustee of the San Francisco Mechanics’ Institute, anon-profit organization, from 2013 to 2015. Board member of the Russell Exchange Traded Fund Trust from 2011 to 2012. Director of Barclays Global Investors Holdings Deutschland GmbH from 2006 to 2009. Mr. Polisson is an attorney and has a retired status with the Massachusetts and District of Columbia Bar Associations. | | N/A |
| | | |
| Pamela Wheelock3 (Born 1959) | | Trustee,
since January 2020; previously Trustee from January 2018 to July 2019 | | Board member of the Destination Medical Center Economic Development Agency, Rochester, Minnesota since 2019. Acting Commissioner, Minnesota Department of Human Services, July 2019 through September 2019. Human Services Manager (part-time), Minnesota Department of Human Services, October 2019 through December 2019. Chief Operating Officer, Twin Cities Habitat for Humanity from 2017 to 2019. Vice President of University Services, University of Minnesota from 2012 to 2016. Prior thereto, on the Board of Directors, Governance Committee and Finance Committee for the Minnesota Philanthropy Partners (Saint Paul Foundation) from 2012 to 2018, Interim Chief Executive Officer of Blue Cross Blue Shield of Minnesota from 2011 to 2012, Chairman of the Board from 2009 to 2012 and Board Director from 2003 to 2015. Vice President, Leadership and Community Engagement, Bush Foundation, Saint Paul, Minnesota (a private foundation) from 2009 to 2011. Executive Vice President and Chief Financial Officer, Minnesota Sports and Entertainment from 2004 to 2009 and Senior Vice President from 2002 to 2004. Executive Vice President of the Minnesota Wild Foundation from 2004 to 2008. Commissioner of Finance, State of Minnesota, from 1999 to 2002. Currently Board Chair of the Minnesota Wild Foundation since 2010. | | N/A |
| * | Length of service dates reflect the Trustee’s commencement of service with the Trust’s predecessor entities, where applicable. |
26 | Wells Fargo Short Duration Government Bond Fund
Other information (unaudited)
Officers
| | | | |
Name and
year of birth | | Position held and
length of service | | Principal occupations during past five years or longer |
| | |
Andrew Owen
(Born 1960) | | President, since 2017 | | Executive Vice President of Wells Fargo & Company and Head of Affiliated Managers, Wells Fargo Asset Management, since 2014. In addition, Mr. Owen is currently President, Chief Executive Officer and Director of Wells Fargo Funds Management, LLC since 2017. Prior thereto, Executive Vice President responsible for marketing, investments and product development for Wells Fargo Funds Management, LLC, from 2009 to 2014. |
| | |
Nancy Wiser1
(Born 1967) | | Treasurer, since 2012 | | Executive Vice President of Wells Fargo Funds Management, LLC since 2011. Chief Operating Officer and Chief Compliance Officer at LightBox Capital Management LLC, from 2008 to 2011. |
| | |
Michelle Rhee
(Born 1966) | | Chief Legal Officer, since 2019 | | Secretary of Wells Fargo Funds Management, LLC, Chief Legal Counsel of Wells Fargo Asset Management and Assistant General Counsel of Wells Fargo Bank, N.A. since 2018. Associate General Counsel and Managing Director of Bank of America Corporation from 2004 to 2018. |
| | |
| Catherine Kennedy (Born 1969) | | Secretary, since 2019 | | Vice President of Wells Fargo Funds Management, LLC and Senior Counsel of the Wells Fargo Legal Department since 2010. Vice President and Senior Counsel of Evergreen Investment Management Company, LLC from 1998 to 2010. |
| | |
| Michael H. Whitaker(Born 1967) | | Chief Compliance Officer, since 2016 | | Chief Compliance Officer of Wells Fargo Asset Management since 2016. Senior Vice President and Chief Compliance Officer for Fidelity Investments from 2007 to 2016. |
| | |
David Berardi
(Born 1975) | | Assistant Treasurer, since 2009 | | Vice President of Wells Fargo Funds Management, LLC since 2009. Vice President of Evergreen Investment Management Company, LLC from 2008 to 2010. Manager of Fund Reporting and Control for Evergreen Investment Management Company, LLC from 2004 to 2010. |
| | |
| Jeremy DePalma1 (Born 1974) | | Assistant Treasurer, since 2009 | | Senior Vice President of Wells Fargo Funds Management, LLC since 2009. Senior Vice President of Evergreen Investment Management Company, LLC from 2008 to 2010 and head of the Fund Reporting and Control Team within Fund Administration from 2005 to 2010. |
| 1 | Nancy Wiser acts as Treasurer of 64 funds in the Fund Complex. Jeremy DePalma acts as Treasurer of 82 funds and Assistant Treasurer of 64 funds in the Fund Complex. |
| 2 | The Statement of Additional Information includes additional information about the Trustees and is available, without charge, upon request, by calling1-800-222-8222 or by visiting the website atwfam.com. |
| 3 | Pamela Wheelock wasre-appointed to the Board effective January 1, 2020. |
Wells Fargo Short Duration Government Bond Fund | 27
Appendix I (unaudited)
Effective on or about May 1, 2020, if you purchase Fund shares through a Janney Montgomery Scott LLC (“Janney”) brokerage account, you will be eligible for the following load waivers(front-end sales charge waivers and contingent deferred sales charge (“CDSC”), orback-end sales charge, waivers) and discounts, which may differ from those disclosed elsewhere in the Fund’s Prospectus or SAI.
|
| Front-end sales charge* waivers on Class A shares available at Janney |
|
| Shares purchased through reinvestment of capital gains distributions and dividend reinvestment when purchasing shares of the same fund (but not any other fund within the fund family). |
|
| Shares purchased by employees and registered representatives of Janney or its affiliates and their family members as designated by Janney. |
|
| Shares purchased from the proceeds of redemptions within the same fund family, provided (1) the repurchase occurs within ninety (90) days following the redemption, (2) the redemption and purchase occur in the same account, and (3) redeemed shares were subject to afront-end or deferred sales load (i.e., right of reinstatement). |
|
| Employer-sponsored retirement plans (e.g., 401(k) plans, 457 plans, employer-sponsored 403(b) plans, profit sharing and money purchase pension plans and defined benefit plans). For purposes of this provision, employer-sponsored retirement plans do not include SEP IRAs, Simple IRAs,SAR-SEPs or Keogh plans. |
|
| Shares acquired through a right of reinstatement. |
|
Class C shares that are no longer subject to a contingent deferred sales charge and are converted to Class A shares of the same fund pursuant to Janney’s policies and procedures. |
| CDSC waivers on Class A and Class C shares available at Janney |
|
| Shares sold upon the death or disability of the shareholder. |
|
| Shares sold as part of a systematic withdrawal plan as described in the Fund’s Prospectus. |
|
| Shares purchased in connection with a return of excess contributions from an IRA account. |
|
| Shares sold as part of a required minimum distribution for IRA and retirement accounts if the redemption is taken in or after the year the shareholder reaches qualified age based on applicable IRS regulations. |
|
| Shares sold to pay Janney fees but only if the transaction is initiated by Janney. |
|
| Shares acquired through a right of reinstatement. |
|
Shares exchanged into the same share class of a different fund. |
| Front-end sales charge* discounts available at Janney; breakpoints, rights of accumulation and/or letters of intent |
|
| Breakpoints as described in the Fund’s Prospectus. |
|
| Rights of accumulation (“ROA”), which entitle shareholders to breakpoint discounts, will be automatically calculated based on the aggregated holding of fund family assets held by accounts within the purchaser’s household at Janney. Eligible fund family assets not held at Janney may be included in the ROA calculation only if the shareholder notifies his or her financial advisor about such assets. |
|
| Letters of intent which allow for breakpoint discounts based on anticipated purchases within a fund family, over a13-month time period. Eligible fund family assets not held at Janney Montgomery Scott may be included in the calculation of letters of intent only if the shareholder notifies his or her financial advisor about such assets. |
| * | Also referred to as an “initial sales charge.” |
28 | Wells Fargo Short Duration Government Bond Fund
Appendix II (unaudited)
Effective on or after May 1, 2020, clients of Edward Jones (also referred to as “shareholders”) purchasing Fund shares on the Edward Jones commission andfee-based platforms are eligible only for the following sales charge discounts (also referred to as “breakpoints”) and waivers, which can differ from breakpoints and waivers described elsewhere in this Prospectus or SAI or through another broker-dealer. In all instances, it is the shareholder’s responsibility to inform Edward Jones at the time of purchase of any relationship, holdings of Wells Fargo Funds or other facts qualifying the purchaser for breakpoints or waivers. Edward Jones can ask for documentation of such circumstance.
|
| Breakpoints available at Edward Jones |
|
| Rights of Accumulation (ROA) |
|
The applicable sales charge on a purchase of Class A shares is determined by taking into account all share classes (except any money market funds and retirement plan share classes) of Wells Fargo Funds held by the shareholder or in an account grouped by Edward Jones with other accounts for the purpose of providing certain pricing considerations (“pricing groups”). This includes all share classes held on the Edward Jones platform and/or held on another platform. The inclusion of eligible fund family assets in the rights of accumulation calculation is dependent on the shareholder notifying his or her financial advisor of such assets at the time of calculation. |
|
ROA is determined by calculating the higher of cost or market value (current shares x NAV). |
|
| Letter of Intent (LOI) |
|
Through a LOI, shareholders can receive the sales charge and breakpoint discounts for purchases shareholders intend to makeover a13-month period from the date Edward Jones receives the LOI. The LOI is determined by calculating the higher of cost or market value of qualifying holdings at LOI initiation in combination with the value that the shareholder intends to buy over a13-month period to calculate thefront-end sales charge and any breakpoint discounts. Each purchase the shareholder makes during that13-month period will receive the sales charge and breakpoint discount that applies to the total amount. The inclusion of eligible fund family assets in the LOI calculation is dependent on the shareholder notifying his or her financial advisor of such assets at the time of calculation. Purchases made before the LOI is received by Edward Jones are not covered under the LOI and will not reduce the sales charge previously paid. Sales charges will be adjusted if LOI is not met. |
| Sales charges are waived for the following shareholders and in the following situations at Edward Jones: |
● Associates of Edward Jones and its affiliates and their family members who are in the same pricing group (as determined by Edward Jones under its policies and procedures) as the associate. This waiver will continue for the remainder of the associate’s life if the associate retires from Edward Jones in good-standing. |
● Shares purchased in an Edward Jonesfee-based program. |
● Shares purchased through reinvestment of capital gains distributions and dividend reinvestment. |
● Shares purchased from the proceeds of redeemed shares of the same fund family so long as the following conditions are met: 1)the proceeds are from the sale of shares within 60 days of the purchase, and 2) the sale and purchase are made in the same share class and the same account or the purchase is made in an individual retirement account with proceeds from liquidations in anon-retirement account. |
● Shares exchanged into Class A shares from another share class so long as the exchange is into the same fund and was initiated at the discretion of Edward Jones. Edward Jones is responsible for any remaining CDSC due to the fund company, if applicable. Any future purchases are subject to the applicable sales charge as disclosed in the prospectus. |
● Exchanges from Class C shares to Class A shares of the same fund, generally, in the 84th month following the anniversary of the purchase date or earlier at the discretion of Edward Jones. |
If the shareholder purchases shares that are subject to a CDSC and those shares are redeemed before the CDSC is expired, the shareholder is
responsible to pay the CDSC except in the following conditions available at Edward Jones: |
● The death or disability of the shareholder. |
● Systematic withdrawals with up to 10% per year of the account value. |
● Return of excess contributions from an Individual Retirement Account (IRA). |
● Shares sold as part of a required minimum distribution for IRA and retirement accounts if the redemption is taken in or after the year the shareholder reaches qualified age based on applicable IRS regulation. |
● Shares sold to pay Edward Jones fees or costs in such cases where the transaction is initiated by Edward Jones. |
● Shares exchanged in an Edward Jonesfee-based program. |
● Shares acquired through NAV reinstatement. |
Wells Fargo Short Duration Government Bond Fund | 29
Appendix II (unaudited)
|
| Other Important Information for accounts at Edward Jones: |
Minimum Purchase Amounts ● $250 initial purchase minimum ● $50 subsequent purchase minimum |
Minimum Balances Edward Jones has the right to redeem at its discretion fund holdings with a balance of $250 or less. The following are examples of accounts that are not included in this policy: ● Afee-based account held on an Edward Jones platform ● A 529 account held on an Edward Jones platform ● An account with an active systematic investment plan or letter of intent (LOI) |
Changing Share Classes At any time it deems necessary, Edward Jones has the authority to exchange at NAV a shareholder’s holdings in a fund to Class A shares. |
30 | Wells Fargo Short Duration Government Bond Fund
This page is intentionally left blank.
This page is intentionally left blank.

For more information
More information about Wells Fargo Funds is available free upon request. To obtain literature, please write, visit the Fund’s website, or call:
Wells Fargo Funds
P.O. Box 219967
Kansas City, MO 64121-9967
Website:wfam.com
Individual investors:1-800-222-8222
Retail investment professionals:1-888-877-9275
Institutional investment professionals:1-866-765-0778

This report and the financial statements contained herein are submitted for the general information of the shareholders of the Fund. If this report is used for promotional purposes, distribution of the report must be accompanied or preceded by a current prospectus. Before investing, please consider the investment objectives, risks, charges, and expenses of the investment. For a current prospectus and, if available, a summary prospectus, containing this information, call1-800-222-8222 or visit the Fund’s website atwfam.com. Read the prospectus carefully before you invest or send money.
Wells Fargo Asset Management (WFAM) is the trade name for certain investment advisory/management firms owned by Wells Fargo & Company. These firms include but are not limited to Wells Capital Management Incorporated and Wells Fargo Funds Management, LLC. Certain products managed by WFAM entities are distributed by Wells Fargo Funds Distributor, LLC (a broker-dealer and Member FINRA).
This material is for general informational and educational purposes only and is NOT intended to provide investment advice or a recommendation of any kind—including a recommendation for any specific investment, strategy, or plan.
INVESTMENT PRODUCTS: NOT FDIC INSURED ◾ NO BANK GUARANTEE ◾ MAY LOSE VALUE
© 2020 Wells Fargo & Company. All rights reserved
PAR-0320-04743 04-20
SA220/SAR220 02-20
Semi-Annual Report
February 29, 2020
Wells Fargo
Government Securities Fund
Beginning on January 1, 2021, as permitted by new regulations adopted by the Securities and Exchange Commission, paper copies of the Wells Fargo Funds’ annual and semi-annual shareholder reports issued after this date will no longer be sent by mail, unless you specifically request paper copies of the reports. Instead, the reports will be made available on the Funds’ website, and you will be notified by mail each time a report is posted and provided with a website address to access the report.
If you already elected to receive shareholder reports electronically, you will not be affected by this change and you need not take any action. You may elect to receive shareholder reports and other communications from the Fund electronically at any time by contacting your financial intermediary (such as a broker-dealer or bank) or, if you are a direct investor, by calling1-800-222-8222 or by enrolling at wellsfargo.com/advantagedelivery.
You may elect to receive all future reports in paper free of charge. If you invest through a financial intermediary, you can contact your financial intermediary to request that you continue to receive paper copies of your shareholder reports; if you invest directly with the Fund, you can call 1-800-222-8222. Your election to receive reports in paper will apply to all Wells Fargo Funds held in your account with your financial intermediary or, if you are a direct investor, to all Wells Fargo Funds that you hold.
|
|
|
Reduce clutter. Save trees. |
Sign up for electronic delivery
of prospectuses
and shareholder
reports at
wellsfargo.com/
advantagedelivery |
The views expressed and any forward-looking statements are as of February 29, 2020, unless otherwise noted, and are those of the Fund managers and/or Wells Fargo Asset Management. Discussions of individual securities, or the markets generally, or any Wells Fargo Fund are not intended as individual recommendations. Future events or results may vary significantly from those expressed in any forward-looking statements. The views expressed are subject to change at any time in response to changing circumstances in the market. Wells Fargo Asset Management and the Fund disclaim any obligation to publicly update or revise any views expressed or forward-looking statements.
INVESTMENT PRODUCTS: NOT FDIC INSURED ◾ NO BANK GUARANTEE ◾ MAY LOSE VALUE
Wells Fargo Government Securities Fund | 1
Letter to shareholders (unaudited)

Andrew Owen
President
Wells Fargo Funds
“The fourth quarter started on a strong note, with U.S.-China trade tensions relaxing in October along with renewed optimism for a U.K. Brexit deal and positive macroeconomic data.”
Dear Shareholder:
We are pleased to offer you this semi-annual report for the Wells Fargo Government Securities Fund for thesix-month period that ended February 29, 2020. As market volatility increased, returns for the period were more restrained after strong results in previous recent periods. However, supportive central banks addressed concerns over slowing global economic growth and international trade tensions.
Fixed-income and equity investors had mixed semi-annual returns. For the period, U.S. stocks, based on the S&P 500 Index,1 gained 1.92% and international stocks, as measured by the MSCI ACWI ex USA Index (Net),2 returned 0.13%. The MSCI EM Index (Net)3 gained 2.93%. For bond investors, the Bloomberg Barclays U.S. Aggregate Bond Index4 added 3.39%, the Bloomberg Barclays Global Aggregateex-USD Index5 returned-0.21%, the Bloomberg Barclays Municipal Bond Index6 gained 3.04%, and the ICE BofA U.S. High Yield Index7 added 1.34%.
The period began with uncertainty, leading to central bank support.
In September, as the period began, the U.S. Federal Reserve (Fed) cut interest rates a second time in the third quarter. U.S. manufacturing data disappointed investors. The U.S. Congress announced it would pursue an impeachment investigation of President Trump. Meanwhile, the Brexit impasse showed no signs of resolution. Officials in China warned it would be difficult to reach the country’s annual economic growth goals considering the weight of tariffs and trade restrictions. Although the S&P 500 Index finished the third quarter with the bestyear-to-date returns in more than 20 years, concerns about future returns remained.
The fourth quarter started on a strong note, with U.S.-China trade tensions relaxing in October along with renewed optimism for a U.K. Brexit deal and positive macroeconomic data. The initial estimate of U.S. third-quarter gross domestic product growth was a resilient 1.9% annualized rate, while the U.S. unemployment rate fell to a50-year low of 3.5% in September. However, despite resilience among U.S. consumers, business confidence declined while manufacturing activity contracted. Concerned with a potential economic slowdown, the Fed lowered interest rates another quarter point in late October—its third rate cut in four months. This helped push the S&P 500 Index to anall-time high, while emerging market equities rallied and global bonds declined overall, reflecting a broad pickup in risk appetite.
| 1 | The S&P 500 Index consists of 500 stocks chosen for market size, liquidity, and industry group representation. It is a market-value-weighted index with each stock’s weight in the index proportionate to its market value. You cannot invest directly in an index. |
| 2 | The Morgan Stanley Capital International (MSCI) All Country World Index (ACWI) ex USA Index (Net) is a free-float-adjusted market-capitalization-weighted index that is designed to measure the equity market performance of developed markets, excluding the United States. Source: MSCI. MSCI makes no express or implied warranties or representations and shall have no liability whatsoever with respect to any MSCI data contained herein. The MSCI data may not be further redistributed or used as a basis for other indices or any securities or financial products. This report is not approved, reviewed, or produced by MSCI. You cannot invest directly in an index. |
| 3 | The MSCI Emerging Markets (EM) Index (Net) is a free-float-adjusted market-capitalization-weighted index that is designed to measure equity market performance of emerging markets. You cannot invest directly in an index. |
| 4 | The Bloomberg Barclays U.S. Aggregate Bond Index is a broad-based benchmark that measures the investment-grade, U.S. dollar-denominated, fixed-rate taxable bond market, including Treasuries, government-related and corporate securities, mortgage-backed securities (agency fixed-rate and hybrid adjustable-rate mortgage pass-throughs), asset-backed securities, and commercial mortgage-backed securities. You cannot invest directly in an index. |
| 5 | The Bloomberg Barclays Global Aggregateex-USD Index is an unmanaged index that provides a broad-based measure of the global investment-grade fixed-income markets excluding the U.S. dollar-denominated debt market. You cannot invest directly in an index. |
| 6 | The Bloomberg Barclays Municipal Bond Index is an unmanaged index composed of long-termtax-exempt bonds with a minimum credit rating of Baa. You cannot invest directly in an index. |
| 7 | The ICE BofA U.S. High Yield Index is a market-capitalization-weighted index of domestic and Yankee high-yield bonds. The index tracks the performance of high-yield securities traded in the U.S. bond market. You cannot invest directly in an index. Copyright 2020. ICE Data Indices, LLC. All rights reserved. |
2 | Wells Fargo Government Securities Fund
Letter to shareholders (unaudited)
Equity markets continued to rally in November despite ongoing geopolitical risks. Hopes for a U.S.-China trade deal buoyed investor confidence. U.S. business sentiment improved slightly, and manufacturing and services activity picked up. With that positive backdrop, developed market equities outpaced those in emerging markets, and U.S. stocks, as reflected by the S&P 500 Index, outperformednon-U.S. stocks overall. While consumer confidence and purchasing manager activity rose in the eurozone, China reported weakening manufacturing and consumer data. Bond yields rose marginally, leading to slightly negative returns for global government and investment-grade corporate bonds.
Financial markets ended 2019 with a boost from the U.S. and China accord on a Phase One trade deal. That, along with the landslide win by thepro-Brexit U.K. Conservative Party in a national election and ongoing central bank support, gave investors greater confidence. U.S. economic indicators were generally positive, with the exception of manufacturing activity and business confidence. Consumer confidence was resilient, fed by a robust labor market, tame inflation, and lower interest rates, which boosted housing affordability and stimulated homebuyer activity. The impeachment of U.S. President Donald Trump had little impact on markets. Meanwhile, slowing Chinese economic activity, partly attributable to the trade war, led to further government stimulus atyear-end through lower reserve ratios, allowing banks to lend more money.
Theyear-end rally continued in early January 2020. However, capital market volatility picked up sharply in late January on concerns over the unknown impact of the novel coronavirus(COVID-19) on the global economy and stock markets. With sentiment somewhat souring, perceived safe havens did well in January. The U.S. dollar and Japanese yen both rose and government bonds outperformed equities. While the S&P 500 Index held its ground, emerging market equities tumbled, including those in Asia that are most exposed to viruses—physical or economic—originating in China.
In February, the coronavirus became the major market focus. Fears of the virus’s impact on global growth led to expectations of increased global central bank monetary policy support. That led the10-year Treasury yield to fall to anall-time low of 1.1% by the end of the month. Although equity markets initially shrugged off concerns about the outbreak, focusing instead on strong fourth-quarter earnings and improving business confidence in January, market sentiment turned sharply lower towardmonth-end and the S&P 500 Index lost 8.2% for the month. Oil prices tumbled as Russia and the Organization of the Petroleum Exporting Countries compounded a major decline in oil demand with a brutal price war, partly aimed at dissuading further U.S. shale production. As a result, the price of West Texas Intermediate crude oil fell 13% in February and 27% for 2020 year to date.
Don’t let short-term uncertainty derail long-term investment goals.
Periods of investment uncertainty can present challenges, but experience has taught us that maintaining long-term investment goals can be an effective way to plan for the future. Although diversification cannot guarantee an investment profit or prevent losses, we believe it can be an effective way to manage investment risk and potentially smooth out overall portfolio performance. We encourage investors to know their investments and to understand that appropriate levels of risk-taking may unlock opportunities.
Thank you for choosing to invest with Wells Fargo Funds. We appreciate your confidence in us and remain committed to helping you meet your financial needs.
Sincerely,

Andrew Owen
President
Wells Fargo Funds
“Capital market volatility picked up sharply in late January on concerns over the unknown impact of the novel coronavirus(COVID-19) on the global economy and stock markets.”
|
|
|
For further information about your Fund, contact your investment professional, visit our website at wfam.com, or call us directly at1-800-222-8222. |
Wells Fargo Government Securities Fund | 3
Performance highlights (unaudited)
Investment objective
The Fund seeks current income.
Manager
Wells Fargo Funds Management, LLC
Subadviser
Wells Capital Management Incorporated
Portfolio managers
Christopher Y. Kauffman, CFA®‡
Jay N. Mueller, CFA®
Michal Stanczyk
Average annual total returns (%) as of February 29, 2020
| | | | | | | | | | | | | | | | | | | | | | | | | | | | | | | | | | |
| | | | |
| | | | | Including sales charge | | | Excluding sales charge | | | Expense ratios1 (%) | |
| | | | | | | | | |
| | | Inception date | | 1 year | | | 5 year | | | 10 year | | | 1 year | | | 5 year | | | 10 year | | | Gross | | | Net2 | |
| | | | | | | | | | |
| Class A (SGVDX) | | 8-31-1999 | | | 4.67 | | | | 1.61 | | | | 2.42 | | | | 9.60 | | | | 2.55 | | | | 2.89 | | | | 0.91 | | | | 0.85 | |
| | | | | | | | | | |
| Class C (WGSCX) | | 12-26-2002 | | | 7.79 | | | | 1.79 | | | | 2.12 | | | | 8.79 | | | | 1.79 | | | | 2.12 | | | | 1.66 | | | | 1.60 | |
| | | | | | | | | | |
| Administrator Class (WGSDX) | | 4-8-2005 | | | – | | | | – | | | | – | | | | 9.84 | | | | 2.77 | | | | 3.11 | | | | 0.85 | | | | 0.64 | |
| | | | | | | | | | |
| Institutional Class (SGVIX) | | 8-31-1999 | | | – | | | | – | | | | – | | | | 10.01 | | | | 2.95 | | | | 3.28 | | | | 0.58 | | | | 0.48 | |
| | | | | | | | | | |
| Bloomberg Barclays U.S. Aggregate ex Credit Index3 | | – | | | – | | | | – | | | | – | | | | 10.20 | | | | 3.06 | | | | 3.34 | | | | – | | | | – | |
| | | | | | | | | | |
| Bloomberg Barclays Intermediate U.S. Government Bond Index4 | | – | | | – | | | | – | | | | – | | | | 8.05 | | | | 2.46 | | | | 2.52 | | | | – | | | | – | |
Figures quoted represent past performance, which is no guarantee of future results, and do not reflect taxes that a shareholder may pay on an investment in a fund. Investment return and principal value of an investment will fluctuate so that an investor’s shares, when redeemed, may be worth more or less than their original cost. Performance shown without sales charges would be lower if sales charges were reflected. Current performance may be lower or higher than the performance data quoted, which assumes the reinvestment of dividends and capital gains. Currentmonth-end performance is available on the Fund’s website,wfam.com.
Index returns do not include transaction costs associated with buying and selling securities, any mutual fund fees or expenses, or any taxes. It is not possible to invest directly in an index.
For Class A shares, the maximumfront-end sales charge is 4.50%. For Class C shares, the maximum contingent deferred sales charge is 1.00%. Performance including a contingent deferred sales charge assumes the sales charge for the corresponding time period. Administrator Class and Institutional Class shares are sold without afront-end sales charge or contingent deferred sales charge.
Bond values fluctuate in response to the financial condition of individual issuers, general market and economic conditions, and changes in interest rates. Changes in market conditions and government policies may lead to periods of heightened volatility in the bond market and reduced liquidity for certain bonds held by the Fund. In general, when interest rates rise, bond values fall and investors may lose principal value. Interest rate changes and their impact on the Fund and its share price can be sudden and unpredictable. The use of derivatives may reduce returns and/or increase volatility. Securities issued by U.S. government agencies or government sponsored entities may not be guaranteed by the U.S. Treasury. Certain investment strategies tend to increase the total risk of an investment (relative to the broader market). The Fund is exposed to mortgage- and asset-backed securities risk. The U.S. government guarantee applies to certain underlying securities and not to shares of the Fund. Consult the Fund’s prospectus for additional information on these and other risks.
Please see footnotes on page 5.
4 | Wells Fargo Government Securities Fund
Performance highlights (unaudited)
| | | | |
|
| Ten largest holdings (%) as of February 29, 20205 | |
| | |
FNMA, 3.00%,12-1-2045 | | | 3.35 | |
| | |
U.S. Treasury Bond, 3.00%,2-15-2047 | | | 2.44 | |
| | |
U.S. Treasury Bond, 4.25%,11-15-2040 | | | 2.44 | |
| | |
FHLMC, 4.50%,9-1-2049 | | | 2.23 | |
| | |
U.S. Treasury Bond, 3.75%,11-15-2043 | | | 2.09 | |
| | |
FNMA, 4.00%,4-1-2046 | | | 2.08 | |
| | |
FNMA, 3.00%,6-1-2034 | | | 2.07 | |
| | |
TVA, 4.63%,9-15-2060 | | | 1.92 | |
| | |
FNMA, 3.50%,4-1-2034 | | | 1.89 | |
| | |
FHLMC, 3.50%,10-1-2049 | | | 1.87 | |
|
|
| Portfolio composition as of February 29, 20206 |
|
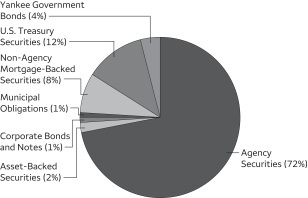 |
| ‡ | CFA® and Chartered Financial Analyst® are trademarks owned by CFA Institute. |
| 1 | Reflects the expense ratios as stated in the most recent prospectuses. The expense ratios shown are subject to change and may differ from the annualized expense ratios shown in the financial highlights of this report. |
| 2 | The manager has contractually committed through December 31, 2020, to waive fees and/or reimburse expenses to the extent necessary to cap total annual fund operating expenses after fee waivers at 0.85% for Class A, 1.60% for Class C, 0.64% for Administrator Class, and 0.48% for Institutional Class. Brokerage commissions, stamp duty fees, interest, taxes, acquired fund fees and expenses (if any), and extraordinary expenses are excluded from the expense cap. Prior to or after the commitment expiration date, the cap may be increased or the commitment to maintain the cap may be terminated only with the approval of the Board of Trustees. Without this cap, the Fund’s returns would have been lower. The expense ratio paid by an investor is the net expense ratio (the total annual fund operating expenses after fee waivers) as stated in the prospectuses. |
| 3 | The Bloomberg Barclays U.S. Aggregate ex Credit Index is composed of the Bloomberg Barclays U.S. Government Bond Index and the Bloomberg Barclays U.S. Mortgage-Backed Securities Index and includes Treasury issues, agency issues, and mortgage-backed securities. You cannot invest directly in an index. |
| 4 | The Bloomberg Barclays Intermediate U.S. Government Bond Index is an unmanaged index composed of U.S. government securities with maturities in the one to10-year range, including securities issued by the U.S. Treasury and U.S. government agencies. You cannot invest directly in an index. |
| 5 | The ten largest holdings, excluding cash, cash equivalents and any money market funds, are calculated based on the value of the investments divided by total net assets of the Fund. Holdings are subject to change and may have changed since the date specified. |
| 6 | Amounts are calculated based on the total long-term investments of the Fund. These amounts are subject to change and may have changed since the date specified. |
Wells Fargo Government Securities Fund | 5
Fund expenses (unaudited)
As a shareholder of the Fund, you incur two types of costs: (1) transaction costs, including sales charges (loads) on purchase payments and contingent deferred sales charges (if any) on redemptions and (2) ongoing costs, including management fees, distribution(12b-1) and/or shareholder servicing fees, and other Fund expenses. This example is intended to help you understand your ongoing costs (in dollars) of investing in the Fund and to compare these costs with the ongoing costs of investing in other mutual funds.
The example is based on an investment of $1,000 invested at the beginning of thesix-month period and held for the entire period from September 1, 2019 to February 29, 2020.
Actual expenses
The “Actual” line of the table below provides information about actual account values and actual expenses. You may use the information in this line, together with the amount you invested, to estimate the expenses that you paid over the period. Simply divide your account value by $1,000 (for example, an $8,600 account value divided by $1,000 = 8.6), then multiply the result by the number in the “Actual” line under the heading entitled “Expenses paid during period” for your applicable class of shares to estimate the expenses you paid on your account during this period.
Hypothetical example for comparison purposes
The “Hypothetical” line of the table below provides information about hypothetical account values and hypothetical expenses based on the Fund’s actual expense ratio and an assumed rate of return of 5% per year before expenses, which is not the Fund’s actual return. The hypothetical account values and expenses may not be used to estimate the actual ending account balance or expenses you paid for the period. You may use this information to compare the ongoing costs of investing in the Fund and other funds. To do so, compare this 5% hypothetical example with the 5% hypothetical examples that appear in the shareholder reports of the other funds.
Please note that the expenses shown in the table are meant to highlight your ongoing costs only and do not reflect any transactional costs, such as sales charges (loads) and contingent deferred sales charges. Therefore, the “Hypothetical” line of the table is useful in comparing ongoing costs only and will not help you determine the relative total costs of owning different funds. In addition, if these transactional costs were included, your costs would have been higher.
| | | | | | | | | | | | | | | | |
| | | Beginning
account value
9-1-2019 | | | Ending
account value
2-29-2020 | | | Expenses
paid during
the period¹ | | | Annualized net
expense ratio | |
| | | | | |
Class A | | | | | | | | | | | | | | | | |
| | | | |
Actual | | $ | 1,000.00 | | | $ | 1,026.55 | | | $ | 4.28 | | | | 0.85 | % |
| | | | |
Hypothetical (5% return before expenses) | | $ | 1,000.00 | | | $ | 1,020.64 | | | $ | 4.27 | | | | 0.85 | % |
| | | | | |
Class C | | | | | | | | | | | | | | | | |
| | | | |
Actual | | $ | 1,000.00 | | | $ | 1,022.74 | | | $ | 8.05 | | | | 1.60 | % |
| | | | |
Hypothetical (5% return before expenses) | | $ | 1,000.00 | | | $ | 1,016.91 | | | $ | 8.02 | | | | 1.60 | % |
| | | | | |
Administrator Class | | | | | | | | | | | | | | | | |
| | | | |
Actual | | $ | 1,000.00 | | | $ | 1,028.52 | | | $ | 3.23 | | | | 0.64 | % |
| | | | |
Hypothetical (5% return before expenses) | | $ | 1,000.00 | | | $ | 1,021.68 | | | $ | 3.22 | | | | 0.64 | % |
| | | | | |
Institutional Class | | | | | | | | | | | | | | | | |
| | | | |
Actual | | $ | 1,000.00 | | | $ | 1,029.34 | | | $ | 2.42 | | | | 0.48 | % |
| | | | |
Hypothetical (5% return before expenses) | | $ | 1,000.00 | | | $ | 1,022.48 | | | $ | 2.41 | | | | 0.48 | % |
| 1 | Expenses paid is equal to the annualized net expense ratio of each class multiplied by the average account value over the period, multiplied by the number of days in the most recent fiscal half-year divided by the number of days in the fiscal year (to reflect theone-half-year period). |
6 | Wells Fargo Government Securities Fund
Portfolio of investments—February 29, 2020 (unaudited)
| | | | | | | | | | | | | | | | |
| | | Interest
rate | | | Maturity
date | | | Principal | | | Value | |
| Agency Securities: 70.82% | |
FDIC Series2013-R1 Class A 144A | | | 1.15 | % | | | 3-25-2033 | | | $ | 301,583 | | | $ | 301,025 | |
FHLB | | | 5.63 | | | | 3-14-2036 | | | | 6,020,000 | | | | 9,108,049 | |
FHLMC | | | 4.00 | | | | 5-1-2049 | | | | 5,579,125 | | | | 5,888,543 | |
FHLMC | | | 3.50 | | | | 10-1-2049 | | | | 11,355,002 | | | | 11,796,588 | |
FHLMC | | | 5.00 | | | | 6-1-2026 | | | | 1,067,930 | | | | 1,129,875 | |
FHLMC | | | 2.38 | | | | 4-25-2023 | | | | 482,768 | | | | 486,687 | |
FHLMC | | | 2.46 | | | | 3-25-2022 | | | | 262,493 | | | | 264,136 | |
FHLMC | | | 2.62 | | | | 12-25-2026 | | | | 3,904,480 | | | | 4,075,660 | |
FHLMC | | | 2.75 | | | | 3-25-2027 | | | | 5,378,081 | | | | 5,621,642 | |
FHLMC (1 Month LIBOR +1.18%)± | | | 2.84 | | | | 12-15-2036 | | | | 320,968 | | | | 330,287 | |
FHLMC | | | 2.90 | | | | 4-25-2026 | | | | 5,894,738 | | | | 6,205,577 | |
FHLMC | | | 3.00 | | | | 5-15-2026 | | | | 510,853 | | | | 524,053 | |
FHLMC | | | 3.00 | | | | 12-1-2049 | | | | 5,807,202 | | | | 5,984,346 | |
FHLMC | | | 3.00 | | | | 1-15-2054 | | | | 120,940 | | | | 123,943 | |
FHLMC (11th District Cost of Funds +1.25%)± | | | 3.42 | | | | 7-1-2032 | | | | 305,467 | | | | 308,032 | |
FHLMC | | | 3.50 | | | | 9-15-2043 | | | | 3,744,619 | | | | 3,872,781 | |
FHLMC | | | 3.50 | | | | 8-1-2045 | | | | 4,522,683 | | | | 4,784,129 | |
FHLMC | | | 3.50 | | | | 11-1-2045 | | | | 8,198,043 | | | | 8,678,026 | |
FHLMC | | | 3.50 | | | | 12-1-2045 | | | | 5,776,445 | | | | 6,115,006 | |
FHLMC | | | 3.50 | | | | 12-1-2045 | | | | 1,665,634 | | | | 1,762,342 | |
FHLMC (3 Year Treasury Constant Maturity +2.21%)± | | | 3.83 | | | | 5-1-2026 | | | | 23,247 | | | | 23,712 | |
FHLMC | | | 4.00 | | | | 12-15-2024 | | | | 1,400,980 | | | | 1,463,447 | |
FHLMC | | | 4.00 | | | | 6-1-2044 | | | | 3,927,256 | | | | 4,250,915 | |
FHLMC | | | 4.00 | | | | 9-1-2049 | | | | 1,333,450 | | | | 1,403,814 | |
FHLMC (12 Month LIBOR +2.05%)± | | | 4.05 | | | | 1-1-2038 | | | | 562,076 | | �� | | 598,307 | |
FHLMC (12 Month LIBOR +1.91%)± | | | 4.16 | | | | 9-1-2031 | | | | 3,058 | | | | 3,081 | |
FHLMC (12 Month LIBOR +1.91%)± | | | 4.16 | | | | 9-1-2031 | | | | 41,472 | | | | 41,944 | |
FHLMC (12 Month LIBOR +1.74%)± | | | 4.22 | | | | 7-1-2038 | | | | 1,228,825 | | | | 1,297,618 | |
FHLMC (1 Year Treasury Constant Maturity +2.14%)± | | | 4.29 | | | | 10-1-2026 | | | | 111,789 | | | | 115,748 | |
FHLMC | | | 4.50 | | | | 3-1-2042 | | | | 303,683 | | | | 331,026 | |
FHLMC | | | 4.50 | | | | 9-1-2044 | | | | 3,055,124 | | | | 3,335,131 | |
FHLMC | | | 4.50 | | | | 9-1-2049 | | | | 13,185,076 | | | | 14,058,319 | |
FHLMC (1 Year Treasury Constant Maturity +2.25%)± | | | 4.67 | | | | 6-1-2032 | | | | 19,387 | | | | 20,083 | |
FHLMC (1 Year Treasury Constant Maturity +0.00%)± | | | 4.90 | | | | 7-1-2029 | | | | 24,928 | | | | 25,615 | |
FHLMC | | | 5.00 | | | | 8-1-2040 | | | | 876,386 | | | | 982,251 | |
FHLMC | | | 5.50 | | | | 7-1-2035 | | | | 2,700,178 | | | | 3,025,575 | |
FHLMC | | | 5.50 | | | | 12-1-2038 | | | | 1,731,709 | | | | 1,990,712 | |
FHLMC | | | 6.00 | | | | 10-1-2032 | | | | 22,564 | | | | 26,226 | |
FHLMC | | | 6.00 | | | | 5-25-2043 | | | | 3,880,852 | | | | 4,576,833 | |
FHLMC (1 Year Treasury Constant Maturity +2.13%)± | | | 6.38 | | | | 1-1-2026 | | | | 46,171 | | | | 45,915 | |
FHLMC | | | 6.50 | | | | 4-1-2021 | | | | 525 | | | | 528 | |
FHLMC | | | 6.50 | | | | 4-1-2022 | | | | 17,886 | | | | 19,964 | |
FHLMC | | | 6.50 | | | | 9-1-2028 | | | | 12,780 | | | | 14,266 | |
FHLMC | | | 6.50 | | | | 7-1-2031 | | | | 2 | | | | 2 | |
FHLMC | | | 6.75 | | | | 9-15-2029 | | | | 5,360,000 | | | | 7,921,031 | |
FHLMC | | | 7.00 | | | | 12-1-2023 | | | | 1,577 | | | | 1,686 | |
FHLMC | | | 7.00 | | | | 12-1-2026 | | | | 340 | | | | 369 | |
FHLMC | | | 7.00 | | | | 4-1-2029 | | | | 1,102 | | | | 1,279 | |
FHLMC | | | 7.00 | | | | 5-1-2029 | | | | 6,724 | | | | 7,894 | |
FHLMC | | | 7.00 | | | | 4-1-2032 | | | | 72,559 | | | | 85,745 | |
FHLMC | | | 7.50 | | | | 11-1-2031 | | | | 141,082 | | | | 161,676 | |
FHLMC | | | 7.50 | | | | 4-1-2032 | | | | 143,104 | | | | 167,538 | |
FHLMC | | | 8.00 | | | | 8-1-2023 | | | | 4,956 | | | | 5,180 | |
FHLMC | | | 8.00 | | | | 6-1-2024 | | | | 2,605 | | | | 2,809 | |
FHLMC | | | 8.00 | | | | 6-1-2024 | | | | 2,172 | | | | 2,193 | |
FHLMC | | | 8.00 | | | | 6-1-2024 | | | | 4,038 | | | | 4,153 | |
FHLMC | | | 8.00 | | | | 8-1-2026 | | | | 11,160 | | | | 12,772 | |
The accompanying notes are an integral part of these financial statements.
Wells Fargo Government Securities Fund | 7
Portfolio of investments—February 29, 2020 (unaudited)
| | | | | | | | | | | | | | | | |
| | | Interest
rate | | | Maturity
date | | | Principal | | | Value | |
| Agency Securities (continued) | |
FHLMC | | | 8.00 | % | | | 11-1-2026 | | | $ | 10,573 | | | $ | 12,079 | |
FHLMC | | | 8.00 | | | | 11-1-2028 | | | | 5,606 | | | | 6,077 | |
FHLMC | | | 8.50 | | | | 12-1-2025 | | | | 6,653 | | | | 7,279 | |
FHLMC | | | 8.50 | | | | 5-1-2026 | | | | 948 | | | | 991 | |
FHLMC | | | 8.50 | | | | 8-1-2026 | | | | 4,190 | | | | 4,232 | |
FHLMC | | | 8.50 | | | | 8-1-2026 | | | | 13,988 | | | | 14,037 | |
FHLMC | | | 9.00 | | | | 4-1-2021 | | | | 3 | | | | 3 | |
FHLMC | | | 9.00 | | | | 4-1-2021 | | | | 29 | | | | 30 | |
FHLMC | | | 9.00 | | | | 8-1-2021 | | | | 37 | | | | 39 | |
FHLMC | | | 9.00 | | | | 7-1-2022 | | | | 22 | | | | 22 | |
FHLMC | | | 9.00 | | | | 9-1-2024 | | | | 107 | | | | 108 | |
FHLMC | | | 9.50 | | | | 6-1-2020 | | | | 1 | | | | 1 | |
FHLMC | | | 9.50 | | | | 8-1-2020 | | | | 8 | | | | 8 | |
FHLMC | | | 9.50 | | | | 9-1-2020 | | | | 2 | | | | 2 | |
FHLMC | | | 9.50 | | | | 9-1-2020 | | | | 36 | | | | 36 | |
FHLMC | | | 9.50 | | | | 9-1-2020 | | | | 2 | | | | 2 | |
FHLMC | | | 9.50 | | | | 10-1-2020 | | | | 1 | | | | 1 | |
FHLMC | | | 9.50 | | | | 11-1-2020 | | | | 6 | | | | 6 | |
FHLMC | | | 9.50 | | | | 5-1-2021 | | | | 36 | | | | 37 | |
FHLMC | | | 9.50 | | | | 9-17-2022 | | | | 7,883 | | | | 7,920 | |
FHLMC | | | 9.50 | | | | 4-1-2025 | | | | 10,888 | | | | 11,023 | |
FHLMC | | | 10.00 | | | | 8-1-2020 | | | | 2 | | | | 2 | |
FHLMC | | | 10.00 | | | | 10-1-2021 | | | | 37 | | | | 37 | |
FHLMC | | | 10.00 | | | | 8-17-2022 | | | | 169 | | | | 171 | |
FHLMC | | | 10.00 | | | | 2-17-2025 | | | | 14,118 | | | | 14,111 | |
FHLMC Multifamily Structured Pass-through Series K075 Class A2±± | | | 3.65 | | | | 2-25-2028 | | | | 4,370,000 | | | | 4,989,989 | |
FHLMC Series 2015-SC01 Class 1A | | | 3.50 | | | | 5-25-2045 | | | | 1,761,916 | | | | 1,797,609 | |
FHLMC Series 2882 Class TF (1 Month LIBOR +0.25%)± | | | 1.91 | | | | 10-15-2034 | | | | 63,611 | | | | 63,629 | |
FHLMC Series 4218 Class DF (1 Month LIBOR +0.25%)± | | | 1.91 | | | | 7-15-2042 | | | | 554,284 | | | | 550,162 | |
FHLMC Series K020 Class X1±±(c) | | | 1.37 | | | | 5-25-2022 | | | | 42,007,135 | | | | 1,082,452 | |
FHLMC Series K032 Class A2±± | | | 3.31 | | | | 5-25-2023 | | | | 2,800,000 | | | | 2,969,277 | |
FHLMC Series K039 Class A2 | | | 3.30 | | | | 7-25-2024 | | | | 325,000 | | | | 350,022 | |
FHLMC Series K153 Class A3±± | | | 3.12 | | | | 10-25-2031 | | | | 160,000 | | | | 180,359 | |
FHLMC Series KF15 Class A (1 Month LIBOR +0.67%)± | | | 2.33 | | | | 2-25-2023 | | | | 196,607 | | | | 196,391 | |
FHLMC Series KJ14 Class A1 | | | 2.20 | | | | 11-25-2023 | | | | 1,413,770 | | | | 1,447,119 | |
FHLMC Series M036 Class A | | | 4.16 | | | | 12-15-2029 | | | | 3,440,000 | | | | 3,760,264 | |
FHLMC SeriesT-15 Class A6 (1 Month LIBOR +0.00%)± | | | 2.03 | | | | 11-25-2028 | | | | 162,777 | | | | 163,821 | |
FHLMC SeriesT-23 Class A (1 Month LIBOR +0.14%)± | | | 1.94 | | | | 5-25-2030 | | | | 529,579 | | | | 528,311 | |
FHLMC SeriesT-35 Class A (1 Month LIBOR +0.14%)± | | | 1.94 | | | | 9-25-2031 | | | | 634,574 | | | | 628,594 | |
FHLMC SeriesT-42 Class A6 | | | 9.50 | | | | 2-25-2042 | | | | 699,599 | | | | 880,301 | |
FHLMC SeriesT-55 Class 2A1±± | | | 3.80 | | | | 3-25-2043 | | | | 354,599 | | | | 360,554 | |
FHLMC SeriesT-57 Class 1A1 | | | 6.50 | | | | 7-25-2043 | | | | 903,163 | | | | 1,109,442 | |
FHLMC SeriesT-57 Class 2A1±± | | | 4.04 | | | | 7-25-2043 | | | | 1,711,012 | | | | 1,886,196 | |
FHLMC SeriesT-62 Class 1A1 (12 Month Treasury Average +0.00%)± | | | 3.25 | | | | 10-25-2044 | | | | 893,418 | | | | 894,725 | |
FHLMC SeriesT-67 Class 1A1C±± | | | 3.69 | | | | 3-25-2036 | | | | 574,795 | | | | 589,530 | |
FHLMC SeriesT-67 Class 2A1C±± | | | 3.70 | | | | 3-25-2036 | | | | 1,206,333 | | | | 1,235,127 | |
FNMA | | | 2.32 | | | | 1-1-2026 | | | | 6,336,291 | | | | 6,623,173 | |
FNMA ¤ | | | 0.00 | | | | 5-15-2030 | | | | 7,700,000 | | | | 6,506,144 | |
FNMA (1 Month LIBOR +0.25%)± | | | 1.73 | | | | 6-27-2036 | | | | 79,447 | | | | 78,093 | |
FNMA (1 Month LIBOR +0.35%)± | | | 2.01 | | | | 2-25-2032 | | | | 413,226 | | | | 413,625 | |
FNMA (11th District Cost of Funds +1.25%)± | | | 2.41 | | | | 5-1-2036 | | | | 948,464 | | | | 945,350 | |
FNMA (12 Month LIBOR +1.61%)± | | | 2.49 | | | | 5-1-2046 | | | | 4,400,924 | | | | 4,526,626 | |
FNMA | | | 2.50 | | | | 4-25-2039 | | | | 2,308 | | | | 2,304 | |
FNMA (11th District Cost of Funds +1.54%)± | | | 2.65 | | | | 5-1-2023 | | | | 15,131 | | | | 15,103 | |
FNMA (11th District Cost of Funds +1.25%)± | | | 2.78 | | | | 9-1-2027 | | | | 146,342 | | | | 147,454 | |
FNMA±± | | | 2.80 | | | | 2-25-2027 | | | | 10,000,000 | | | | 10,821,462 | |
The accompanying notes are an integral part of these financial statements.
8 | Wells Fargo Government Securities Fund
Portfolio of investments—February 29, 2020 (unaudited)
| | | | | | | | | | | | | | | | |
| | | Interest
rate | | | Maturity
date | | | Principal | | | Value | |
| Agency Securities (continued) | |
FNMA | | | 2.86 | % | | | 11-1-2021 | | | $ | 2,489,722 | | | $ | 2,558,366 | |
FNMA | | | 3.00 | | | | 5-1-2027 | | | | 1,029,955 | | | | 1,068,858 | |
FNMA | | | 3.00 | | | | 6-1-2034 | | | | 12,554,048 | | | | 13,002,788 | |
FNMA | | | 3.00 | | | | 4-1-2045 | | | | 109,116 | | | | 114,144 | |
FNMA | | | 3.00 | | | | 11-1-2045 | | | | 8,883,554 | | | | 9,292,563 | |
FNMA | | | 3.00 | | | | 12-1-2045 | | | | 20,164,109 | | | | 21,093,284 | |
FNMA | | | 3.00 | | | | 12-1-2046 | | | | 696,228 | | | | 726,739 | |
FNMA | | | 3.02 | | | | 2-1-2026 | | | | 6,098,271 | | | | 6,559,438 | |
FNMA±± | | | 3.05 | | | | 1-1-2024 | | | | 24,886 | | | | 25,440 | |
FNMA | | | 3.31 | | | | 9-25-2020 | | | | 1,589,999 | | | | 1,599,194 | |
FNMA (11th District Cost of Funds +1.25%)± | | | 3.38 | | | | 5-1-2036 | | | | 333,060 | | | | 342,528 | |
FNMA | | | 3.48 | | | | 3-1-2029 | | | | 917,993 | | | | 1,035,832 | |
FNMA | | | 3.50 | | | | 4-1-2034 | | | | 11,379,307 | | | | 11,920,047 | |
FNMA | | | 3.50 | | | | 2-1-2043 | | | | 46,233 | | | | 49,188 | |
FNMA | | | 3.50 | | | | 2-1-2045 | | | | 1,570,201 | | | | 1,660,737 | |
FNMA | | | 3.50 | | | | 4-1-2045 | | | | 4,649,559 | | | | 4,917,654 | |
FNMA | | | 3.50 | | | | 8-1-2045 | | | | 583,538 | | | | 617,188 | |
FNMA | | | 3.50 | | | | 12-1-2045 | | | | 2,272,275 | | | | 2,403,311 | |
FNMA | | | 3.50 | | | | 2-1-2046 | | | | 2,153,409 | | | | 2,277,623 | |
FNMA | | | 3.50 | | | | 8-1-2049 | | | | 8,360,932 | | | | 8,679,647 | |
FNMA (12 Month LIBOR +1.54%)± | | | 3.55 | | | | 1-1-2043 | | | | 148,639 | | | | 153,112 | |
FNMA | | | 3.63 | | | | 3-1-2029 | | | | 390,000 | | | | 444,946 | |
FNMA | | | 3.77 | | | | 3-1-2029 | | | | 988,519 | | | | 1,136,800 | |
FNMA | | | 3.86 | | | | 3-1-2029 | | | | 837,622 | | | | 968,098 | |
FNMA (12 Month LIBOR +1.73%)± | | | 3.99 | | | | 9-1-2036 | | | | 348,644 | | | | 364,821 | |
FNMA | | | 4.00 | | | | 10-25-2025 | | | | 41,553 | | | | 352 | |
FNMA | | | 4.00 | | | | 4-1-2046 | | | | 12,206,315 | | | | 13,107,262 | |
FNMA | | | 4.00 | | | | 3-1-2047 | | | | 1,483,459 | | | | 1,616,876 | |
FNMA (1 Year Treasury Constant Maturity +2.19%)± | | | 4.03 | | | | 11-1-2031 | | | | 114,385 | | | | 120,452 | |
FNMA (1 Year Treasury Constant Maturity +2.22%)± | | | 4.08 | | | | 12-1-2034 | | | | 251,649 | | | | 259,376 | |
FNMA (12 Month LIBOR +1.78%)± | | | 4.23 | | | | 8-1-2036 | | | | 523,756 | | | | 552,930 | |
FNMA (1 Year Treasury Constant Maturity +2.42%)± | | | 4.45 | | | | 10-1-2027 | | | | 101,971 | | | | 105,701 | |
FNMA (1 Year Treasury Constant Maturity +2.23%)± | | | 4.48 | | | | 12-1-2040 | | | | 23,449 | | | | 24,717 | |
FNMA | | | 4.50 | | | | 1-1-2026 | | | | 63,917 | | | | 66,367 | |
FNMA | | | 4.50 | | | | 10-1-2046 | | | | 337,649 | | | | 368,470 | |
FNMA | | | 4.50 | | | | 9-1-2049 | | | | 4,512,693 | | | | 4,831,775 | |
FNMA (1 Year Treasury Constant Maturity +2.21%)± | | | 4.52 | | | | 9-1-2031 | | | | 27,755 | | | | 29,182 | |
FNMA (12 Month LIBOR +1.63%)± | | | 4.63 | | | | 4-1-2032 | | | | 59,045 | | | | 59,265 | |
FNMA (1 Year Treasury Constant Maturity +2.26%)± | | | 4.64 | | | | 9-1-2031 | | | | 105,930 | | | | 109,733 | |
FNMA (1 Year Treasury Constant Maturity +2.30%)± | | | 4.67 | | | | 6-1-2034 | | | | 274,791 | | | | 285,313 | |
FNMA (1 Year Treasury Constant Maturity +2.22%)± | | | 4.72 | | | | 6-1-2032 | | | | 83,525 | | | | 86,599 | |
FNMA (1 Year Treasury Constant Maturity +2.31%)± | | | 4.73 | | | | 7-1-2026 | | | | 71,222 | | | | 73,846 | |
FNMA | | | 5.00 | | | | 4-1-2023 | | | | 103,975 | | | | 109,967 | |
FNMA | | | 5.00 | | | | 6-1-2023 | | | | 232,901 | | | | 246,323 | |
FNMA | | | 5.00 | | | | 3-1-2034 | | | | 386,657 | | | | 433,337 | |
FNMA | | | 5.00 | | | | 8-1-2040 | | | | 4,854,883 | | | | 5,461,916 | |
FNMA | | | 5.00 | | | | 10-1-2040 | | | | 625,457 | | | | 703,664 | |
FNMA | | | 5.00 | | | | 1-1-2042 | | | | 439,438 | | | | 493,749 | |
FNMA | | | 5.00 | | | | 11-1-2048 | | | | 1,537,955 | | | | 1,665,937 | |
FNMA | | | 5.00 | | | | 12-1-2048 | | | | 1,236,922 | | | | 1,339,954 | |
FNMA | | | 5.50 | | | | 6-1-2020 | | | | 15,408 | | | | 15,417 | |
FNMA | | | 5.50 | | | | 11-1-2023 | | | | 41,568 | | | | 43,736 | |
FNMA | | | 5.50 | | | | 1-1-2025 | | | | 17,413 | | | | 18,101 | |
FNMA | | | 5.50 | | | | 1-1-2025 | | | | 83,969 | | | | 86,874 | |
FNMA | | | 5.50 | | | | 9-1-2033 | | | | 1,622,447 | | | | 1,855,075 | |
FNMA | | | 5.50 | | | | 9-1-2033 | | | | 612,880 | | | | 700,570 | |
The accompanying notes are an integral part of these financial statements.
Wells Fargo Government Securities Fund | 9
Portfolio of investments—February 29, 2020 (unaudited)
| | | | | | | | | | | | | | | | |
| | | Interest
rate | | | Maturity
date | | | Principal | | | Value | |
| Agency Securities (continued) | |
FNMA | | | 5.50 | % | | | 8-1-2035 | | | $ | 469,991 | | | $ | 540,095 | |
FNMA | | | 5.50 | | | | 1-1-2037 | | | | 459,017 | | | | 527,711 | |
FNMA | | | 5.50 | | | | 4-1-2040 | | | | 1,208,803 | | | | 1,388,108 | |
FNMA (6 Month LIBOR +2.86%)± | | | 5.61 | | | | 4-1-2033 | | | | 11,180 | | | | 11,602 | |
FNMA | | | 5.61 | | | | 2-1-2021 | | | | 486,787 | | | | 492,013 | |
FNMA (6 Month LIBOR +3.13%)± | | | 5.61 | | | | 7-1-2033 | | | | 134,262 | | | | 135,819 | |
FNMA | | | 5.95 | | | | 6-1-2024 | | | | 1,532,557 | | | | 1,771,948 | |
FNMA | | | 6.00 | | | | 3-1-2024 | | | | 43,392 | | | | 48,021 | |
FNMA | | | 6.00 | | | | 1-1-2028 | | | | 689,713 | | | | 763,289 | |
FNMA | | | 6.00 | | | | 2-1-2035 | | | | 994,936 | | | | 1,111,264 | |
FNMA | | | 6.00 | | | | 11-1-2037 | | | | 351,139 | | | | 412,663 | |
FNMA | | | 6.00 | | | | 7-1-2038 | | | | 129,026 | | | | 151,931 | |
FNMA | | | 6.50 | | | | 1-1-2024 | | | | 9,792 | | | | 10,925 | |
FNMA | | | 6.50 | | | | 3-1-2028 | | | | 11,908 | | | | 12,859 | |
FNMA | | | 6.50 | | | | 12-1-2029 | | | | 159,457 | | | | 178,111 | |
FNMA | | | 6.50 | | | | 11-1-2031 | | | | 34,461 | | | | 38,449 | |
FNMA | | | 6.50 | | | | 7-1-2036 | | | | 292,363 | | | | 341,484 | |
FNMA | | | 6.50 | | | | 7-1-2036 | | | | 282,226 | | | | 332,910 | |
FNMA | | | 6.50 | | | | 7-25-2042 | | | | 1,262,664 | | | | 1,504,037 | |
FNMA | | | 6.63 | | | | 11-15-2030 | | | | 3,220,000 | | | | 4,861,969 | |
FNMA | | | 7.00 | | | | 11-1-2026 | | | | 3,936 | | | | 4,229 | |
FNMA | | | 7.00 | | | | 9-1-2031 | | | | 2,692 | | | | 2,697 | |
FNMA | | | 7.00 | | | | 1-1-2032 | | | | 1,948 | | | | 2,211 | |
FNMA | | | 7.00 | | | | 2-1-2032 | | | | 68,064 | | | | 80,741 | |
FNMA | | | 7.00 | | | | 10-1-2032 | | | | 162,727 | | | | 196,153 | |
FNMA | | | 7.00 | | | | 2-1-2034 | | | | 1,803 | | | | 2,090 | |
FNMA | | | 7.00 | | | | 4-1-2034 | | | | 102,213 | | | | 119,422 | |
FNMA | | | 7.00 | | | | 1-1-2036 | | | | 6,103 | | | | 6,585 | |
FNMA | | | 7.50 | | | | 9-1-2031 | | | | 68,444 | | | | 81,864 | |
FNMA | | | 7.50 | | | | 11-25-2031 | | | | 288,091 | | | | 347,860 | |
FNMA | | | 7.50 | | | | 2-1-2032 | | | | 25,858 | | | | 30,510 | |
FNMA | | | 7.50 | | | | 10-1-2037 | | | | 681,847 | | | | 829,970 | |
FNMA | | | 8.00 | | | | 5-1-2027 | | | | 24,339 | | | | 24,556 | |
FNMA | | | 8.00 | | | | 6-1-2028 | | | | 3,756 | | | | 4,121 | |
FNMA | | | 8.00 | | | | 2-1-2030 | | | | 28,446 | | | | 28,815 | |
FNMA | | | 8.00 | | | | 7-1-2031 | | | | 756,700 | | | | 868,987 | |
FNMA | | | 8.50 | | | | 8-1-2024 | | | | 4,092 | | | | 4,104 | |
FNMA | | | 8.50 | | | | 5-1-2026 | | | | 72,027 | | | | 78,809 | |
FNMA | | | 8.50 | | | | 7-1-2026 | | | | 17,757 | | | | 18,295 | |
FNMA | | | 8.50 | | | | 10-1-2026 | | | | 47 | | | | 47 | |
FNMA | | | 8.50 | | | | 10-1-2026 | | | | 1,888 | | | | 1,893 | |
FNMA | | | 8.50 | | | | 11-1-2026 | | | | 23,856 | | | | 24,165 | |
FNMA | | | 8.50 | | | | 11-1-2026 | | | | 5,563 | | | | 5,702 | |
FNMA | | | 8.50 | | | | 12-1-2026 | | | | 97,658 | | | | 109,262 | |
FNMA | | | 8.50 | | | | 12-1-2026 | | | | 12,577 | | | | 13,902 | |
FNMA | | | 8.50 | | | | 12-1-2026 | | | | 225 | | | | 225 | |
FNMA | | | 8.50 | | | | 2-1-2027 | | | | 151 | | | | 167 | |
FNMA | | | 8.50 | | | | 2-1-2027 | | | | 5,186 | | | | 5,202 | |
FNMA | | | 8.50 | | | | 3-1-2027 | | | | 667 | | | | 710 | |
FNMA | | | 8.50 | | | | 6-1-2027 | | | | 51,060 | | | | 52,899 | |
FNMA | | | 9.00 | | | | 3-1-2021 | | | | 1,446 | | | | 1,455 | |
FNMA | | | 9.00 | | | | 6-1-2021 | | | | 20 | | | | 20 | |
FNMA | | | 9.00 | | | | 8-1-2021 | | | | 26 | | | | 27 | |
FNMA | | | 9.00 | | | | 10-1-2021 | | | | 296 | | | | 299 | |
FNMA | | | 9.00 | | | | 1-1-2025 | | | | 12,327 | | | | 13,423 | |
FNMA | | | 9.00 | | | | 3-1-2025 | | | | 1,556 | | | | 1,562 | |
The accompanying notes are an integral part of these financial statements.
10 | Wells Fargo Government Securities Fund
Portfolio of investments—February 29, 2020 (unaudited)
| | | | | | | | | | | | | | | | |
| | | Interest
rate | | | Maturity
date | | | Principal | | | Value | |
| Agency Securities (continued) | |
FNMA | | | 9.00 | % | | | 3-1-2025 | | | $ | 701 | | | $ | 704 | |
FNMA | | | 9.00 | | | | 7-1-2028 | | | | 3,201 | | | | 3,231 | |
FNMA | | | 9.50 | | | | 11-1-2020 | | | | 7 | | | | 7 | |
FNMA | | | 9.50 | | | | 12-15-2020 | | | | 185 | | | | 185 | |
FNMA | | | 9.50 | | | | 6-1-2022 | | | | 195 | | | | 196 | |
FNMA | | | 9.50 | | | | 7-1-2028 | | | | 4,617 | | | | 4,635 | |
FNMA Series1990-144 Class W | | | 9.50 | | | | 12-25-2020 | | | | 4,121 | | | | 4,214 | |
FNMA Series1990-75 Class Z | | | 9.50 | | | | 7-25-2020 | | | | 193 | | | | 193 | |
FNMA Series1990-84 Class Y | | | 9.00 | | | | 7-25-2020 | | | | 302 | | | | 303 | |
FNMA Series1990-96 Class Z | | | 9.67 | | | | 8-25-2020 | | | | 4,039 | | | | 4,074 | |
FNMA Series1991-85 Class Z | | | 8.00 | | | | 6-25-2021 | | | | 6,077 | | | | 6,277 | |
FNMA Series1992-45 Class Z | | | 8.00 | | | | 4-25-2022 | | | | 23,843 | | | | 25,039 | |
FNMA Series2000-T6 Class A2 | | | 9.50 | | | | 11-25-2040 | | | | 588,998 | | | | 678,094 | |
FNMA Series2001-T10 Class A3 | | | 9.50 | | | | 12-25-2041 | | | | 659,808 | | | | 792,148 | |
FNMA Series2001-T12 Class A3 | | | 9.50 | | | | 8-25-2041 | | | | 187,711 | | | | 229,660 | |
FNMA Series2002-T12 Class A5±± | | | 4.84 | | | | 10-25-2041 | | | | 742,651 | | | | 785,555 | |
FNMA Series2002-T19 Class A1 | | | 6.50 | | | | 7-25-2042 | | | | 3,348,870 | | | | 4,019,694 | |
FNMA Series2002-T5 Class A1 (1 Month LIBOR +0.24%)± | | | 1.87 | | | | 5-25-2032 | | | | 387,669 | | | | 384,118 | |
FNMA Series2002-W4 Class A4 | | | 6.25 | | | | 5-25-2042 | | | | 484,159 | | | | 563,996 | |
FNMA Series2003-T2 Class A1 (1 Month LIBOR +0.14%)± | | | 2.01 | | | | 3-25-2033 | | | | 894,536 | | | | 877,479 | |
FNMA Series2003-W09 Class A (1 Month LIBOR +0.12%)± | | | 1.90 | | | | 6-25-2033 | | | | 75,708 | | | | 74,416 | |
FNMA Series2003-W1 Class 1A1±± | | | 5.27 | | | | 12-25-2042 | | | | 638,368 | | | | 715,197 | |
FNMA Series2003-W11 Class A1±± | | | 4.79 | | | | 6-25-2033 | | | | 39,389 | | | | 41,197 | |
FNMA Series2003-W3 Class 1A4±± | | | 4.08 | | | | 8-25-2042 | | | | 1,997,005 | | | | 2,144,831 | |
FNMA Series2003-W5 Class A (1 Month LIBOR +0.11%)± | | | 1.88 | | | | 4-25-2033 | | | | 249,771 | | | | 244,456 | |
FNMA Series2003-W6 Class 6A±± | | | 4.17 | | | | 8-25-2042 | | | | 1,093,386 | | | | 1,137,039 | |
FNMA Series2003-W6 Class PT4±± | | | 8.29 | | | | 10-25-2042 | | | | 1,155,471 | | | | 1,425,295 | |
FNMA Series2003-W8 Class PT1±± | | | 9.20 | | | | 12-25-2042 | | | | 428,972 | | | | 501,138 | |
FNMA Series2004-T1 Class 1A2 | | | 6.50 | | | | 1-25-2044 | | | | 346,095 | | | | 404,960 | |
FNMA Series2004-W01 Class 2A2 | | | 7.00 | | | | 12-25-2033 | | | | 932,114 | | | | 1,095,002 | |
FNMA Series2004-W15 Class 1A3 | | | 7.00 | | | | 8-25-2044 | | | | 596,595 | | | | 715,466 | |
FNMA Series2005-71 Class DB | | | 4.50 | | | | 8-25-2025 | | | | 357,179 | | | | 367,810 | |
FNMA Series2007-W10 Class 2A±± | | | 6.32 | | | | 8-25-2047 | | | | 288,253 | | | | 329,601 | |
FNMA Series2011-15 Class HI (c) | | | 5.50 | | | | 3-25-2026 | | | | 72,541 | | | | 1,456 | |
FNMA Series2013-17 Class PC | | | 2.00 | | | | 3-25-2039 | | | | 989,671 | | | | 998,401 | |
FNMA Series2014-20 Class TM±± | | | 5.16 | | | | 4-25-2044 | | | | 982,699 | | | | 1,144,674 | |
FNMA Series2018-M13 Class A2±± | | | 3.70 | | | | 9-25-2030 | | | | 460,000 | | | | 539,589 | |
FNMA Series 265 Class 2 | | | 9.00 | | | | 3-25-2024 | | | | 39,076 | | | | 43,166 | |
FNMA SeriesG-8 Class E | | | 9.00 | | | | 4-25-2021 | | | | 2,743 | | | | 2,768 | |
FNMA SeriesG92-30 Class Z | | | 7.00 | | | | 6-25-2022 | | | | 10,892 | | | | 11,234 | |
FNMA SeriesG93-39 Class ZQ | | | 6.50 | | | | 12-25-2023 | | | | 627,730 | | | | 669,975 | |
GNMA | | | 3.50 | | | | 12-20-2049 | | | | 8,066,281 | | | | 8,403,015 | |
GNMA±± | | | 1.68 | | | | 4-20-2069 | | | | 8,035,097 | | | | 382,472 | |
GNMA | | | 3.00 | | | | 11-20-2045 | | | | 9,063,753 | | | | 9,459,420 | |
GNMA %% | | | 3.00 | | | | 3-23-2050 | | | | 6,870,000 | | | | 7,098,105 | |
GNMA (1 Year Treasury Constant Maturity +1.50%)± | | | 3.13 | | | | 11-20-2020 | | | | 5,770 | | | | 5,793 | |
GNMA (1 Year Treasury Constant Maturity +1.50%)± | | | 3.25 | | | | 8-20-2020 | | | | 4,769 | | | | 4,776 | |
GNMA | | | 3.50 | | | | 12-20-2047 | | | | 10,969,907 | | | | 11,485,512 | |
GNMA | | | 4.00 | | | | 11-15-2024 | | | | 969,869 | | | | 1,017,153 | |
GNMA | | | 4.00 | | | | 12-20-2047 | | | | 7,505,335 | | | | 7,941,766 | |
GNMA | | | 4.25 | | | | 6-20-2036 | | | | 388,660 | | | | 412,495 | |
GNMA | | | 4.50 | | | | 8-20-2049 | | | | 2,429,848 | | | | 2,557,868 | |
GNMA | | | 5.00 | | | | 7-20-2040 | | | | 986,273 | | | | 1,102,552 | |
GNMA | | | 6.00 | | | | 8-20-2034 | | | | 83,467 | | | | 92,510 | |
GNMA | | | 6.50 | | | | 12-15-2025 | | | | 6,204 | | | | 6,885 | |
GNMA | | | 6.50 | | | | 5-15-2029 | | | | 559 | | | | 620 | |
The accompanying notes are an integral part of these financial statements.
Wells Fargo Government Securities Fund | 11
Portfolio of investments—February 29, 2020 (unaudited)
| | | | | | | | | | | | | | | | |
| | | Interest
rate | | | Maturity
date | | | Principal | | | Value | |
| Agency Securities (continued) | |
GNMA | | | 6.50 | % | | | 5-15-2031 | | | $ | 676 | | | $ | 750 | |
GNMA | | | 6.50 | | | | 9-20-2033 | | | | 41,633 | | | | 48,585 | |
GNMA | | | 7.00 | | | | 12-15-2022 | | | | 6,574 | | | | 6,819 | |
GNMA | | | 7.00 | | | | 5-15-2026 | | | | 1,483 | | | | 1,588 | |
GNMA | | | 7.00 | | | | 3-15-2028 | | | | 19,256 | | | | 19,531 | |
GNMA | | | 7.00 | | | | 4-15-2031 | | | | 832 | | | | 847 | |
GNMA | | | 7.00 | | | | 8-15-2031 | | | | 17,969 | | | | 18,740 | |
GNMA | | | 7.00 | | | | 3-15-2032 | | | | 13,501 | | | | 13,794 | |
GNMA | | | 7.34 | | | | 10-20-2021 | | | | 11,044 | | | | 11,128 | |
GNMA | | | 7.34 | | | | 9-20-2022 | | | | 4,333 | | | | 4,343 | |
GNMA | | | 8.00 | | | | 6-15-2023 | | | | 2,150 | | | | 2,272 | |
GNMA | | | 8.00 | | | | 12-15-2023 | | | | 110,781 | | | | 118,691 | |
GNMA | | | 8.00 | | | | 2-15-2024 | | | | 454 | | | | 486 | |
GNMA | | | 8.00 | | | | 9-15-2024 | | | | 2,256 | | | | 2,285 | |
GNMA | | | 8.00 | | | | 6-15-2025 | | | | 44 | | | | 44 | |
GNMA Series2002-53 Class IO±±(c) | | | 0.60 | | | | 4-16-2042 | | | | 202,040 | | | | 3 | |
GNMA Series2005-23 Class IO±±(c) | | | 0.00 | | | | 6-17-2045 | | | | 1,673,594 | | | | 177 | |
GNMA Series2006-32 Class XM±±(c) | | | 0.05 | | | | 11-16-2045 | | | | 5,267,791 | | | | 6,168 | |
GNMA Series2007-69 Class D±± | | | 5.25 | | | | 6-16-2041 | | | | 266,657 | | | | 275,570 | |
GNMA Series2008-22 Class XM±±(c) | | | 1.11 | | | | 2-16-2050 | | | | 11,393,388 | | | | 300,950 | |
GNMA Series2010-158 Class EI (c) | | | 4.00 | | | | 12-16-2025 | | | | 6,718,886 | | | | 480,122 | |
GNMA Series2012-12 Class HD | | | 2.00 | | | | 5-20-2062 | | | | 87,501 | | | | 88,115 | |
Overseas Private Investment Corporation | | | 2.12 | | | | 3-20-2024 | | | | 5,770,000 | | | | 5,906,444 | |
Resolution Funding Corporation STRIPS ¤ | | | 0.00 | | | | 4-15-2030 | | | | 6,100,000 | | | | 5,187,771 | |
Resolution Funding Corporation STRIPS ¤ | | | 0.00 | | | | 5-15-2039 | | | | 8,275,000 | | | | 6,057,898 | |
Resolution Funding Corporation STRIPS ¤ | | | 0.00 | | | | 11-15-2039 | | | | 5,865,000 | | | | 4,244,370 | |
TVA ¤ | | | 0.00 | | | | 11-1-2025 | | | | 5,000,000 | | | | 4,624,158 | |
TVA | | | 4.25 | | | | 9-15-2065 | | | | 2,600,000 | | | | 3,955,429 | |
TVA | | | 4.63 | | | | 9-15-2060 | | | | 7,550,000 | | | | 12,096,865 | |
TVA | | | 5.88 | | | | 4-1-2036 | | | | 4,380,000 | | | | 6,766,585 | |
| |
Total Agency Securities (Cost $418,985,288) | | | | 445,889,858 | |
| | | | | | | | | �� | | | | | | | |
|
| Asset-Backed Securities: 1.86% | |
Hertz Vehicle Financing LLC Series2015-1A Class A 144A | | | 2.73 | | | | 3-25-2021 | | | | 6,000,000 | | | | 6,003,962 | |
MMAF Equipment Finance LLC Series2017-AA Class A4 144A | | | 2.41 | | | | 8-16-2024 | | | | 4,445,000 | | | | 4,511,979 | |
Tesla Auto Lease Trust Series2018-B Class A 144A | | | 3.71 | | | | 8-20-2021 | | | | 1,143,116 | | | | 1,161,618 | |
| |
Total Asset-Backed Securities (Cost $11,591,886) | | | | 11,677,559 | |
| | | | | | | | | | | | | | | | |
|
Corporate Bonds and Notes: 0.70% | |
|
Financials: 0.70% | |
|
| Mortgage REITs: 0.70% | |
American Tower Trust I 144A | | | 3.65 | | | | 3-15-2048 | | | | 4,000,000 | | | | 4,394,888 | |
| | | | | | | | | | | | | | | | |
| |
Total Corporate Bonds and Notes (Cost $4,000,000) | | | | 4,394,888 | |
| | | | | | | | | | | | | | | | |
|
Municipal Obligations: 0.92% | |
|
Texas: 0.92% | |
|
| Miscellaneous Revenue: 0.92% | |
San Antonio TX Retama Development Corporation | | | 10.00 | | | | 12-15-2020 | | | | 5,405,000 | | | | 5,787,458 | |
| | | | | | | | | | | | | | | | |
| |
Total Municipal Obligations (Cost $5,599,133) | | | | 5,787,458 | |
| | | | | | | | | | | | | | | | |
The accompanying notes are an integral part of these financial statements.
12 | Wells Fargo Government Securities Fund
Portfolio of investments—February 29, 2020 (unaudited)
| | | | | | | | | | | | | | | | |
| | | Interest
rate | | | Maturity
date | | | Principal | | | Value | |
Non-Agency Mortgage-Backed Securities: 7.10% | |
Benchmark Mortgage Trust Series2018-B1 Class A4 | | | 3.40 | % | | | 1-15-2051 | | | $ | 305,000 | | | $ | 337,217 | |
BX Trust Series 2019-OC11 Class A 144A | | | 3.20 | | | | 12-9-2041 | | | | 3,030,000 | | | | 3,316,985 | |
CD Commercial Mortgage Trust Series2017-6 Class A5 | | | 3.46 | | | | 11-13-2050 | | | | 2,340,000 | | | | 2,593,307 | |
CD Commercial Mortgage Trust Series 2014-CR16 Class A3 | | | 3.78 | | | | 4-10-2047 | | | | 2,641,699 | | | | 2,857,872 | |
Goldman Sachs Mortgage Securities Trust Series2013-G1 Class A2 144A±± | | | 3.56 | | | | 4-10-2031 | | | | 5,349,842 | | | | 5,540,011 | |
Goldman Sachs Mortgage Securities Trust Series 2014-GC24 Class A4 | | | 3.67 | | | | 9-10-2047 | | | | 4,165,000 | | | | 4,505,116 | |
Goldmand Sachs Mortgage Securities Trust Series 2019- PJ1 Class A6 144A±± | | | 4.00 | | | | 8-25-2049 | | | | 671,025 | | | | 678,512 | |
JPMorgan Chase Commercial Mortgage Securities Corporation Series2015-C28 Class A4 | | | 3.23 | | | | 10-15-2048 | | | | 5,000,000 | | | | 5,356,088 | |
Mello Warehouse Securitization Series2019-1 Class A (1 Month LIBOR +0.80%) 144A± | | | 2.43 | | | | 6-25-2052 | | | | 3,000,000 | | | | 3,002,003 | |
Morgan Stanley Capital I Trust Series2011-C2 Class A4 144A | | | 4.66 | | | | 6-15-2044 | | | | 4,900,000 | | | | 5,024,270 | |
Starwood Mortgage Residential Trust Series2019-1 Class A1 144A±± | | | 2.94 | | | | 6-25-2049 | | | | 2,134,742 | | | | 2,159,635 | |
Towd Point Mortgage Trust Series2019-SJ3 Class A1 144A±± | | | 3.00 | | | | 11-25-2059 | | | | 2,805,238 | | | | 2,825,653 | |
UBS Commercial Mortgage Trust Series2017-C5 Class A5 | | | 3.47 | | | | 11-15-2050 | | | | 2,581,000 | | | | 2,861,546 | |
Vendee Mortgage Trust Series1995-1 Class 4±± | | | 8.23 | | | | 2-15-2025 | | | | 113,403 | | | | 126,194 | |
Vendee Mortgage Trust Series1995-2C Class 3A | | | 8.79 | | | | 6-15-2025 | | | | 146,417 | | | | 167,073 | |
Vendee Mortgage Trust Series2011-1 Class DA | | | 3.75 | | | | 2-15-2035 | | | | 754,147 | | | | 767,534 | |
Verus Securitization Trust Series2019-2 Class A1 144A±± | | | 3.21 | | | | 5-25-2059 | | | | 2,584,625 | | | | 2,611,759 | |
| | | | |
TotalNon-Agency Mortgage-Backed Securities (Cost $43,397,481) | | | | | | | | | | | | | | | 44,730,775 | |
| | | | | | | | | | | | | | | | |
| | | | |
| U.S. Treasury Securities: 11.15% | | | | | | | | | | | | |
TIPS | | | 1.38 | | | | 2-15-2044 | | | | 3,026,664 | | | | 3,918,612 | |
U.S. Treasury Bond | | | 1.50 | | | | 2-15-2030 | | | | 640,000 | | | | 661,800 | |
U.S. Treasury Bond | | | 0.13 | | | | 1-15-2030 | | | | 4,514,576 | | | | 4,694,733 | |
U.S. Treasury Bond | | | 1.50 | | | | 1-31-2027 | | | | 2,470,000 | | | | 2,544,679 | |
U.S. Treasury Bond | | | 2.00 | | | | 2-15-2050 | | | | 3,960,000 | | | | 4,275,872 | |
U.S. Treasury Bond | | | 3.00 | | | | 11-15-2044 | | | | 1,665,000 | | | | 2,114,940 | |
U.S. Treasury Bond ## | | | 3.00 | | | | 5-15-2045 | | | | 3,190,000 | | | | 4,062,889 | |
U.S. Treasury Bond | | | 3.00 | | | | 2-15-2047 | | | | 11,920,000 | | | | 15,380,525 | |
U.S. Treasury Bond | | | 3.75 | | | | 11-15-2043 | | | | 9,295,000 | | | | 13,172,758 | |
U.S. Treasury Bond | | | 4.25 | | | | 11-15-2040 | | | | 10,330,000 | | | | 15,340,453 | |
U.S. Treasury Note | | | 1.75 | | | | 11-15-2029 | | | | 2,580,000 | | | | 2,724,117 | |
U.S. Treasury Note | | | 1.88 | | | | 7-31-2026 | | | | 1,260,000 | | | | 1,326,593 | |
| | | | |
Total U.S. Treasury Securities (Cost $62,376,528) | | | | | | | | | | | | | | | 70,217,971 | |
| | | | | | | | | | | | | | | | |
|
| Yankee Government Bonds: 3.50% | |
Hashemite Kingdom of Jordan | | | 3.00 | | | | 6-30-2025 | | | | 10,636,000 | | | | 11,520,297 | |
Inter-American Development Bank | | | 7.00 | | | | 6-15-2025 | | | | 2,000,000 | | | | 2,562,733 | |
U.S. International Development Finance Corporation | | | 2.82 | | | | 3-20-2024 | | | | 7,605,000 | | | | 7,941,951 | |
| |
Total Yankee Government Bonds (Cost $21,361,874) | | | | 22,024,981 | |
| | | | | | | | | | | | | | | | |
| | | Yield | | | | | | Shares | | | | |
| Short-Term Investments: 5.29% | |
|
| Investment Companies: 5.29% | |
Wells Fargo Government Money Market Fund Select Class (l)(u)## | | | 1.52 | | | | | | | | 33,311,967 | | | | 33,311,967 | |
| | | | | | | | | | | | | | | | |
| |
Total Short-Term Investments (Cost $33,311,967) | | | | 33,311,967 | |
| | | | | | | | | | | | | | | | |
| | | | | | | | |
| Total investments in securities (Cost $600,624,157) | | | 101.34 | % | | | 638,035,457 | |
| | |
Other assets and liabilities, net | | | (1.34 | ) | | | (8,411,224 | ) |
| | | | | | | | |
| Total net assets | | | 100.00 | % | | $ | 629,624,233 | |
| | | | | | | | |
The accompanying notes are an integral part of these financial statements.
Wells Fargo Government Securities Fund | 13
Portfolio of investments—February 29, 2020 (unaudited)
| 144A | The security may be resold in transactions exempt from registration, normally to qualified institutional buyers, pursuant to Rule 144A under the Securities Act of 1933. |
| ± | Variable rate investment. The rate shown is the rate in effect at period end. |
| ±± | The coupon of the security is adjusted based on the principal and interest payments received from the underlying pool of mortgages as well as the credit quality and the actual prepayment speed of the underlying mortgages. |
| (c) | Investment in an interest-only security entitles holders to receive only the interest payments on the underlying mortgages. The principal amount shown is the notional amount of the underlying mortgages. The rate represents the coupon rate. |
| ¤ | The security is issued in zero coupon form with no periodic interest payments. |
| %% | The security is purchased on a when-issued basis. |
| ## | All or a portion of this security is segregated for when-issued securities. |
| (l) | The issuer of the security is an affiliated person of the Fund as defined in the Investment Company Act of 1940. |
| (u) | The rate represents the7-day annualized yield at period end. |
Futures Contracts
| | | | | | | | | | | | | | | | | | | | | | | | |
| Description | | Number of
contracts | | | Expiration
date | | | Notional
cost | | | Notional
value | | | Unrealized
gains | | | Unrealized
losses | |
| | | | | | |
Long | | | | | | | | | | | | | | | | | | | | | | | | |
| | | | | | |
2-Year U.S. Treasury Notes | | | 392 | | | | 6-30-2020 | | | $ | 85,080,959 | | | $ | 85,584,625 | | | $ | 503,666 | | | $ | 0 | |
| | | | | | |
5-Year U.S. Treasury Notes | | | 215 | | | | 6-30-2020 | | | | 26,084,212 | | | | 26,391,250 | | | | 307,038 | | | | 0 | |
| | | | | | |
10-Year U.S. Treasury Notes | | | 125 | | | | 6-19-2020 | | | | 16,587,127 | | | | 16,843,750 | | | | 256,623 | | | | 0 | |
| | | | | | |
Short | | | | | | | | | | | | | | | | | | | | | | | | |
| | | | | | |
U.S. Long Term Bonds | | | (150) | | | | 6-19-2020 | | | | (24,986,382 | ) | | | (25,537,500 | ) | | | 0 | | | | (551,118 | ) |
| | | | | | |
U.S. Ultra Bond | | | (28) | | | | 6-19-2020 | | | | (5,666,450 | ) | | | (5,810,000 | ) | | | 0 | | | | (143,550 | ) |
| | | | | | |
10-Year Ultra Futures | | | (113) | | | | 6-19-2020 | | | | (16,707,720 | ) | | | (16,974,719 | ) | | | 0 | | | | (266,999 | ) |
| | | | | | | | | | | | | | | | | | | | | | | | |
| | | | | | | | | | | | | | | | | | $ | 1,067,327 | | | $ | (961,667 | ) |
| | | | | | | | | | | | | | | | | | | | | | | | |
Investments in Affiliates
An affiliated investment is an investment in which the Fund owns at least 5% of the outstanding voting shares of the issuer or as a result of other relationships, such as the Fund and the issuer having the same investment manager. Transactions with issuers that were either affiliated persons of the Fund at the beginning of the period or the end of the period were as follows:
| | | | | | | | | | | | | | | | | | | | | | | | | | | | | | | | | | | | |
| | | Shares,
beginning of
period | | | Shares
purchased | | | Shares
sold | | | Shares,
end of
period | | | Net
realized
gains
(losses) | | | Net
change in
unrealized
gains
(losses) | | | Income
from
affiliated
securities | | | Value,
end of
period | | | % of
net
assets | |
| | | | | | | | | |
| Short-Term Investments | | | | | | | | | | | | | | | | | | | | | | | | | | | |
Investment Companies | | | | | | | | | | | | | | | | | | | | | | | | | | | | | | | | | | | | |
Wells Fargo Government Money Market Fund Select Class | | | 21,461,781 | | | | 136,727,468 | | | | (124,877,282 | ) | | | 33,311,967 | | | $ | 0 | | | $ | 0 | | | $ | 136,727 | | | $ | 33,311,967 | | | | 5.29 | % |
The accompanying notes are an integral part of these financial statements.
14 | Wells Fargo Government Securities Fund
Statement of assets and liabilities—February 29, 2020 (unaudited)
| | | | |
| | | | |
| |
Assets | | | | |
Investments in unaffiliated securities, at value (cost $567,312,190) | | $ | 604,723,490 | |
Investments in affiliated securities, at value (cost $33,311,967) | | | 33,311,967 | |
Cash | | | 961,613 | |
Cash segregated for futures contracts | | | 2,232,371 | |
Receivable for investments sold | | | 542,745 | |
Principal paydown receivable | | | 47,141 | |
Receivable for Fund shares sold | | | 4,002,953 | |
Receivable for interest | | | 2,658,279 | |
Prepaid expenses and other assets | | | 49,754 | |
| | | | |
Total assets | | | 648,530,313 | |
| | | | |
|
Liabilities | |
Payable for investments purchased | | | 17,044,798 | |
Payable for Fund shares redeemed | | | 1,165,614 | |
Payable for daily variation margin on open futures contracts | | | 44,041 | |
Management fee payable | | | 167,237 | |
Dividends payable | | | 171,514 | |
Administration fees payable | | | 59,431 | |
Distribution fee payable | | | 6,043 | |
Trustees’ fees and expenses payable | | | 5,910 | |
Accrued expenses and other liabilities | | | 241,492 | |
| | | | |
Total liabilities | | | 18,906,080 | |
| | | | |
Total net assets | | $ | 629,624,233 | |
| | | | |
|
Net assets consist of | |
Paid-in capital | | $ | 622,589,776 | |
Total distributable earnings | | | 7,034,457 | |
| | | | |
Total net assets | | $ | 629,624,233 | |
| | | | |
|
Computation of net asset value and offering price per share | |
Net assets – Class A | | $ | 267,370,591 | |
Shares outstanding – Class A1 | | | 23,266,871 | |
Net asset value per share – Class A | | | $11.49 | |
Maximum offering price per share – Class A2 | | | $12.03 | |
Net assets – Class C | | $ | 10,058,613 | |
Shares outstanding – Class C1 | | | 875,422 | |
Net asset value per share – Class C | | | $11.49 | |
Net assets – Administrator Class | | $ | 112,346,541 | |
Shares outstanding – Administrator Class1 | | | 9,780,663 | |
Net asset value per share – Administrator Class | | | $11.49 | |
Net assets – Institutional Class | | $ | 239,848,488 | |
Shares outstanding – Institutional Class1 | | | 20,879,633 | |
Net asset value per share – Institutional Class | | | $11.49 | |
| 1 | The Fund has an unlimited number of authorized shares. |
| 2 | Maximum offering price is computed as 100/95.50 of net asset value. On investments of $50,000 or more, the offering price is reduced. |
The accompanying notes are an integral part of these financial statements.
Wells Fargo Government Securities Fund | 15
Statement of operations—six months ended February 29, 2020 (unaudited)
| | | | |
| | | | |
| |
Investment income | | | | |
Interest | | $ | 7,926,406 | |
Income from affiliated securities | | | 136,727 | |
| | | | |
Total investment income | | | 8,063,133 | |
| | | | |
| |
Expenses | �� | | | |
Management fee | | | 1,318,139 | |
Administration fees | |
Class A | | | 209,512 | |
Class C | | | 8,165 | |
Administrator Class | | | 53,033 | |
Institutional Class | | | 85,219 | |
Shareholder servicing fees | |
Class A | | | 327,363 | |
Class C | | | 12,757 | |
Administrator Class | | | 132,584 | |
Distribution fee | |
Class C | | | 38,236 | |
Custody and accounting fees | | | 37,813 | |
Professional fees | | | 40,166 | |
Registration fees | | | 32,232 | |
Shareholder report expenses | | | 57,028 | |
Trustees’ fees and expenses | | | 10,909 | |
Other fees and expenses | | | 8,563 | |
| | | | |
Total expenses | | | 2,371,719 | |
Less: Fee waivers and/or expense reimbursements | | | | |
Fund-level | | | (282,890 | ) |
Administrator Class | | | (43,420 | ) |
| | | | |
Net expenses | | | 2,045,409 | |
| | | | |
Net investment income | | | 6,017,724 | |
| | | | |
| |
Realized and unrealized gains (losses) on investments | | | | |
Net realized gains (losses) on | |
Unaffiliated securities | | | 4,561,113 | |
Futures contracts | | | (281,412 | ) |
| | | | |
Net realized gains on investments | | | 4,279,701 | |
| | | | |
|
Net change in unrealized gains (losses) on | |
Unaffiliated securities | | | 6,680,816 | |
Futures contracts | | | (506,816 | ) |
| | | | |
Net change in unrealized gains (losses) on investments | | | 6,174,000 | |
| | | | |
Net realized and unrealized gains (losses) on investments | | | 10,453,701 | |
| | | | |
Net increase in net assets resulting from operations | | $ | 16,471,425 | |
| | | | |
The accompanying notes are an integral part of these financial statements.
16 | Wells Fargo Government Securities Fund
Statement of changes in net assets
| | | | | | | | | | | | | | | | |
| | | Six months ended
February 29, 2020
(unaudited) | | | Year ended
August 31, 2019 | |
| | | |
Operations | | | | | | | | | | | | |
Net investment income | | | | | | $ | 6,017,724 | | | | | | | $ | 15,143,454 | |
Net realized gains (losses) on investments | | | | | | | 4,279,701 | | | | | | | | (1,925,071 | ) |
Net change in unrealized gains (losses) on investments | | | | | | | 6,174,000 | | | | | | | | 39,126,909 | |
| | | | |
Net increase in net assets resulting from operations | | | | | | | 16,471,425 | | | | | | | | 52,345,292 | |
| | | | |
| | | | |
Distributions to shareholders from net investment income and net realized gains | | | | | | | | | | | | | | | | |
Class A | | | | | | | (2,719,826 | ) | | | | | | | (6,313,196 | ) |
Class C | | | | | | | (67,678 | ) | | | | | | | (195,136 | ) |
Administrator Class | | | | | | | (1,212,429 | ) | | | | | | | (2,239,507 | ) |
Institutional Class | | | | | | | (2,605,855 | ) | | | | | | | (7,084,150 | ) |
| | | | |
Total distributions to shareholders | | | | | | | (6,605,788 | ) | | | | | | | (15,831,989 | ) |
| | | | |
| | | | |
Capital share transactions | | | Shares | | | | | | | | Shares | | | | | |
Proceeds from shares sold | | | | | | | | | | | | | | | | |
Class A | | | 1,498,996 | | | | 16,849,033 | | | | 2,998,141 | | | | 32,247,697 | |
Class C | | | 74,452 | | | | 838,272 | | | | 130,403 | | | | 1,399,972 | |
Administrator Class | | | 1,663,329 | | | | 18,651,618 | | | | 3,748,099 | | | | 40,844,711 | |
Institutional Class | | | 4,626,895 | | | | 52,003,093 | | | | 10,629,768 | | | | 114,197,617 | |
| | | | |
| | | | | | | 88,342,016 | | | | | | | | 188,689,997 | |
| | | | |
Reinvestment of distributions | | | | | | | | | | | | | | | | |
Class A | | | 215,625 | | | | 2,425,569 | | | | 514,113 | | | | 5,557,375 | |
Class C | | | 2,109 | | | | 23,717 | | | | 6,968 | | | | 75,010 | |
Administrator Class | | | 105,652 | | | | 1,188,238 | | | | 202,767 | | | | 2,194,061 | |
Institutional Class | | | 165,742 | | | | 1,864,450 | | | | 527,779 | | | | 5,677,579 | |
| | | | |
| | | | | | | 5,501,974 | | | | | | | | 13,504,025 | |
| | | | |
Payment for shares redeemed | | | | | | | | | | | | | | | | |
Class A | | | (2,495,612 | ) | | | (27,993,940 | ) | | | (6,931,745 | ) | | | (74,634,484 | ) |
Class C | | | (176,127 | ) | | | (1,972,382 | ) | | | (618,596 | ) | | | (6,623,742 | ) |
Administrator Class | | | (1,395,647 | ) | | | (15,615,510 | ) | | | (3,152,863 | ) | | | (33,929,729 | ) |
Institutional Class | | | (2,524,894 | ) | | | (28,294,711 | ) | | | (21,756,178 | ) | | | (234,422,675 | ) |
| | | | |
| | | | | | | (73,876,543 | ) | | | | | | | (349,610,630 | ) |
| | | | |
Net increase (decrease) in net assets resulting from capital share transactions | | | | | | | 19,967,447 | | | | | | | | (147,416,608 | ) |
| | | | |
Total increase (decrease) in net assets | | | | | | | 29,833,084 | | | | | | | | (110,903,305 | ) |
| | | | |
| | |
Net assets | | | | | | | | |
Beginning of period | | | | | | | 599,791,149 | | | | | | | | 710,694,454 | |
| | | | |
End of period | | | | | | $ | 629,624,233 | | | | | | | $ | 599,791,149 | |
| | | | |
The accompanying notes are an integral part of these financial statements.
Wells Fargo Government Securities Fund | 17
Financial highlights
(For a share outstanding throughout each period)
| | | | | | | | | | | | | | | | | | | | | | | | |
| | | Six months ended
February 29, 2020
(unaudited) | | | Year ended August 31 | |
| CLASS A | | 2019 | | | 2018 | | | 2017 | | | 2016 | | | 2015 | |
Net asset value, beginning of period | | | $11.31 | | | | $10.65 | | | | $11.01 | | | | $11.51 | | | | $11.22 | | | | $11.11 | |
Net investment income | | | 0.10 | | | | 0.23 | | | | 0.19 | | | | 0.15 | | | | 0.11 | 1 | | | 0.07 | 1 |
Net realized and unrealized gains (losses) on investments | | | 0.20 | | | | 0.68 | | | | (0.35 | ) | | | (0.22 | ) | | | 0.34 | | | �� | 0.13 | |
| | | | | | | | | | | | | | | | | | | | | | | | |
Total from investment operations | | | 0.30 | | | | 0.91 | | | | (0.16 | ) | | | (0.07 | ) | | | 0.45 | | | | 0.20 | |
Distributions to shareholders from | | | | | | | | | | | | | | | | | | | | | | | | |
Net investment income | | | (0.12 | ) | | | (0.25 | ) | | | (0.20 | ) | | | (0.16 | ) | | | (0.10 | ) | | | (0.09 | ) |
Net realized gains | | | 0.00 | | | | 0.00 | | | | 0.00 | | | | (0.27 | ) | | | (0.06 | ) | | | 0.00 | |
| | | | | | | | | | | | | | | | | | | | | | | | |
Total distributions to shareholders | | | (0.12 | ) | | | (0.25 | ) | | | (0.20 | ) | | | (0.43 | ) | | | (0.16 | ) | | | (0.09 | ) |
Net asset value, end of period | | | $11.49 | | | | $11.31 | | | | $10.65 | | | | $11.01 | | | | $11.51 | | | | $11.22 | |
Total return2 | | | 2.65 | % | | | 8.65 | % | | | (1.44 | )% | | | (0.52 | )% | | | 4.03 | % | | | 1.84 | % |
Ratios to average net assets (annualized) | | | | | | | | | | | | | | | | | | | | | | | | |
Gross expenses | | | 0.92 | % | | | 0.91 | % | | | 0.90 | % | | | 0.88 | % | | | 0.87 | % | | | 0.87 | % |
Net expenses | | | 0.85 | % | | | 0.85 | % | | | 0.85 | % | | | 0.85 | % | | | 0.85 | % | | | 0.85 | % |
Net investment income | | | 1.88 | % | | | 2.20 | % | | | 1.86 | % | | | 1.38 | % | | | 0.94 | % | | | 0.59 | % |
Supplemental data | | | | | | | | | | | | | | | | | | | | | | | | |
Portfolio turnover rate | | | 43 | % | | | 178 | % | | | 197 | % | | | 299 | % | | | 397 | % | | | 349 | % |
Net assets, end of period (000s omitted) | | | $267,371 | | | | $271,986 | | | | $292,550 | | | | $394,645 | | | | $483,112 | | | | $232,545 | |
| 1 | Calculated based upon average shares outstanding |
| 2 | Total return calculations do not include any sales charges. Returns for periods of less than one year are not annualized. |
The accompanying notes are an integral part of these financial statements.
18 | Wells Fargo Government Securities Fund
Financial highlights
(For a share outstanding throughout each period)
| | | | | | | | | | | | | | | | | | | | | | | | |
| | | Six months ended
February 29, 2020
(unaudited) | | | Year ended August 31 | |
| CLASS C | | 2019 | | | 2018 | | | 2017 | | | 2016 | | | 2015 | |
Net asset value, beginning of period | | | $11.31 | | | | $10.65 | | | | $11.01 | | | | $11.51 | | | | $11.21 | | | | $11.11 | |
Net investment income (loss) | | | 0.06 | 1 | | | 0.15 | 1 | | | 0.12 | 1 | | | 0.07 | 1 | | | 0.02 | 1 | | | (0.01 | )1 |
Net realized and unrealized gains (losses) on investments | | | 0.19 | | | | 0.68 | | | | (0.36 | ) | | | (0.23 | ) | | | 0.36 | | | | 0.12 | |
| | | | | | | | | | | | | | | | | | | | | | | | |
Total from investment operations | | | 0.25 | | | | 0.83 | | | | (0.24 | ) | | | (0.16 | ) | | | 0.38 | | | | 0.11 | |
Distributions to shareholders from | | | | | | | | | | | | | | | | | | | | | | | | |
Net investment income | | | (0.07 | ) | | | (0.17 | ) | | | (0.12 | ) | | | (0.07 | ) | | | (0.02 | ) | | | (0.01 | ) |
Net realized gains | | | 0.00 | | | | 0.00 | | | | 0.00 | | | | (0.27 | ) | | | (0.06 | ) | | | 0.00 | |
| | | | | | | | | | | | | | | | | | | | | | | | |
Total distributions to shareholders | | | (0.07 | ) | | | (0.17 | ) | | | (0.12 | ) | | | (0.34 | ) | | | (0.08 | ) | | | (0.01 | ) |
Net asset value, end of period | | | $11.49 | | | | $11.31 | | | | $10.65 | | | | $11.01 | | | | $11.51 | | | | $11.21 | |
Total return2 | | | 2.27 | % | | | 7.84 | % | | | (2.18 | )% | | | (1.26 | )% | | | 3.25 | % | | | 1.08 | % |
Ratios to average net assets (annualized) | | | | | | | | | | | | | | | | | | | | | | | | |
Gross expenses | | | 1.67 | % | | | 1.66 | % | | | 1.65 | % | | | 1.61 | % | | | 1.62 | % | | | 1.62 | % |
Net expenses | | | 1.60 | % | | | 1.60 | % | | | 1.60 | % | | | 1.60 | % | | | 1.60 | % | | | 1.60 | % |
Net investment income (loss) | | | 1.13 | % | | | 1.44 | % | | | 1.12 | % | | | 0.63 | % | | | 0.16 | % | | | (0.13 | )% |
Supplemental data | | | | | | | | | | | | | | | | | | | | | | | | |
Portfolio turnover rate | | | 43 | % | | | 178 | % | | | 197 | % | | | 299 | % | | | 397 | % | | | 349 | % |
Net assets, end of period (000s omitted) | | | $10,059 | | | | $11,026 | | | | $15,508 | | | | $20,132 | | | | $27,085 | | | | $26,981 | |
| 1 | Calculated based upon average shares outstanding |
| 2 | Total return calculations do not include any sales charges. Returns for periods of less than one year are not annualized. |
The accompanying notes are an integral part of these financial statements.
Wells Fargo Government Securities Fund | 19
Financial highlights
(For a share outstanding throughout each period)
| | | | | | | | | | | | | | | | | | | | | | | | |
| | | Six months ended
February 29, 2020
(unaudited) | | | Year ended August 31 | |
| ADMINISTRATOR CLASS | | 2019 | | | 2018 | | | 2017 | | | 2016 | | | 2015 | |
Net asset value, beginning of period | | | $11.31 | | | | $10.65 | | | | $11.01 | | | | $11.51 | | | | $11.21 | | | | $11.11 | |
Net investment income | | | 0.13 | | | | 0.26 | 1 | | | 0.22 | 1 | | | 0.18 | 1 | | | 0.13 | | | | 0.10 | |
Net realized and unrealized gains (losses) on investments | | | 0.18 | | | | 0.67 | | | | (0.35 | ) | | | (0.23 | ) | | | 0.36 | | | | 0.12 | |
| | | | | | | | | | | | | | | | | | | | | | | | |
Total from investment operations | | | 0.31 | | | | 0.93 | | | | (0.13 | ) | | | (0.05 | ) | | | 0.49 | | | | 0.22 | |
Distributions to shareholders from | | | | | | | | | | | | | | | | | | | | | | | | |
Net investment income | | | (0.13 | ) | | | (0.27 | ) | | | (0.23 | ) | | | (0.18 | ) | | | (0.13 | ) | | | (0.12 | ) |
Net realized gains | | | 0.00 | | | | 0.00 | | | | 0.00 | | | | (0.27 | ) | | | (0.06 | ) | | | 0.00 | |
| | | | | | | | | | | | | | | | | | | | | | | | |
Total distributions to shareholders | | | (0.13 | ) | | | (0.27 | ) | | | (0.23 | ) | | | (0.45 | ) | | | (0.19 | ) | | | (0.12 | ) |
Net asset value, end of period | | | $11.49 | | | | $11.31 | | | | $10.65 | | | | $11.01 | | | | $11.51 | | | | $11.21 | |
Total return2 | | | 2.85 | % | | | 8.88 | % | | | (1.23 | )% | | | (0.31 | )% | | | 4.34 | % | | | 1.97 | % |
Ratios to average net assets (annualized) | | | | | | | | | | | | | | | | | | | | | | | | |
Gross expenses | | | 0.86 | % | | | 0.85 | % | | | 0.84 | % | | | 0.82 | % | | | 0.81 | % | | | 0.80 | % |
Net expenses | | | 0.64 | % | | | 0.64 | % | | | 0.64 | % | | | 0.64 | % | | | 0.64 | % | | | 0.64 | % |
Net investment income | | | 2.22 | % | | | 2.42 | % | | | 2.07 | % | | | 1.60 | % | | | 1.13 | % | | | 0.82 | % |
Supplemental data | | | | | | | | | | | | | | | | | | | | | | | | |
Portfolio turnover rate | | | 43 | % | | | 178 | % | | | 197 | % | | | 299 | % | | | 397 | % | | | 349 | % |
Net assets, end of period (000s omitted) | | | $112,347 | | | | $106,355 | | | | $91,671 | | | | $198,520 | | | | $229,169 | | | | $216,428 | |
| 1 | Calculated based upon average shares outstanding |
| 2 | Returns for periods of less than one year are not annualized. |
The accompanying notes are an integral part of these financial statements.
20 | Wells Fargo Government Securities Fund
Financial highlights
(For a share outstanding throughout each period)
| | | | | | | | | | | | | | | | | | | | | | | | |
| | | Six months ended
February 29, 2020
(unaudited) | | | Year ended August 31 | |
| INSTITUTIONAL CLASS | | 2019 | | | 2018 | | | 2017 | | | 2016 | | | 2015 | |
Net asset value, beginning of period | | | $11.31 | | | | $10.65 | | | | $11.00 | | | | $11.50 | | | | $11.21 | | | | $11.10 | |
Net investment income | | | 0.16 | | | | 0.27 | 1 | | | 0.24 | 1 | | | 0.19 | 1 | | | 0.15 | | | | 0.11 | 1 |
Net realized and unrealized gains (losses) on investments | | | 0.16 | | | | 0.68 | | | | (0.35 | ) | | | (0.22 | ) | | | 0.35 | | | | 0.14 | |
| | | | | | | | | | | | | | | | | | | | | | | | |
Total from investment operations | | | 0.32 | | | | 0.95 | | | | (0.11 | ) | | | (0.03 | ) | | | 0.50 | | | | 0.25 | |
Distributions to shareholders from | | | | | | | | | | | | | | | | | | | | | | | | |
Net investment income | | | (0.14 | ) | | | (0.29 | ) | | | (0.24 | ) | | | (0.20 | ) | | | (0.15 | ) | | | (0.14 | ) |
Net realized gains | | | 0.00 | | | | 0.00 | | | | 0.00 | | | | (0.27 | ) | | | (0.06 | ) | | | 0.00 | |
| | | | | | | | | | | | | | | | | | | | | | | | |
Total distributions to shareholders | | | (0.14 | ) | | | (0.29 | ) | | | (0.24 | ) | | | (0.47 | ) | | | (0.21 | ) | | | (0.14 | ) |
Net asset value, end of period | | | $11.49 | | | | $11.31 | | | | $10.65 | | | | $11.00 | | | | $11.50 | | | | $11.21 | |
Total return2 | | | 2.93 | % | | | 9.05 | % | | | (0.99 | )% | | | (0.15 | )% | | | 4.42 | % | | | 2.22 | % |
Ratios to average net assets (annualized) | | | | | | | | | | | | | | | | | | | | | | | | |
Gross expenses | | | 0.59 | % | | | 0.58 | % | | | 0.57 | % | | | 0.55 | % | | | 0.54 | % | | | 0.54 | % |
Net expenses | | | 0.48 | % | | | 0.48 | % | | | 0.48 | % | | | 0.48 | % | | | 0.48 | % | | | 0.48 | % |
Net investment income | | | 2.25 | % | | | 2.56 | % | | | 2.22 | % | | | 1.75 | % | | | 1.28 | % | | | 0.99 | % |
Supplemental data | | | | | | | | | | | | | | | | | | | | | | | | |
Portfolio turnover rate | | | 43 | % | | | 178 | % | | | 197 | % | | | 299 | % | | | 397 | % | | | 349 | % |
Net assets, end of period (000s omitted) | | | $239,848 | | | | $210,424 | | | | $310,966 | | | | $416,834 | | | | $487,113 | | | | $468,859 | |
| 1 | Calculated based upon average shares outstanding |
| 2 | Returns for periods of less than one year are not annualized. |
The accompanying notes are an integral part of these financial statements.
Wells Fargo Government Securities Fund | 21
Notes to financial statements (unaudited)
1. ORGANIZATION
Wells Fargo Funds Trust (the “Trust”), a Delaware statutory trust organized on March 10, 1999, is anopen-end management investment company registered under the Investment Company Act of 1940, as amended (the “1940 Act”). As an investment company, the Trust follows the accounting and reporting guidance in Financial Accounting Standards Board (“FASB”)Accounting Standards Codification Topic 946, Financial Services – Investment Companies. These financial statements report on the Wells Fargo Government Securities Fund (the “Fund”) which is a diversified series of the Trust.
2. SIGNIFICANT ACCOUNTING POLICIES
The following significant accounting policies, which are consistently followed in the preparation of the financial statements of the Fund, are in conformity with U.S. generally accepted accounting principles which require management to make estimates and assumptions that affect the reported amounts of assets and liabilities, disclosure of contingent assets and liabilities at the date of the financial statements, and the reported amounts of revenues and expenses during the reporting period. Actual results could differ from those estimates.
Securities valuation
All investments are valued each business day as of the close of regular trading on the New York Stock Exchange (generally 4 p.m. Eastern Time), although the Fund may deviate from this calculation time under unusual or unexpected circumstances.
Debt securities are valued at the evaluated bid price provided by an independent pricing service (e.g. taking into account various factors, including yields, maturities, or credit ratings) or, if a reliable price is not available, the quoted bid price from an independent broker-dealer.
Futures contracts that are listed on a foreign or domestic exchange or market are valued at the official closing price or, if none, the last sales price.
Investments in registeredopen-end investment companies are valued at net asset value.
Investments which are not valued using any of the methods discussed above are valued at their fair value, as determined in good faith by the Board of Trustees of the Fund. The Board of Trustees has established a Valuation Committee comprised of the Trustees and has delegated to it the authority to take any actions regarding the valuation of portfolio securities that the Valuation Committee deems necessary or appropriate, including determining the fair value of portfolio securities, unless the determination has been delegated to the Wells Fargo Asset Management Pricing Committee at Wells Fargo Funds Management, LLC (“Funds Management”). The Board of Trustees retains the authority to make or ratify any valuation decisions or approve any changes to the Valuation Procedures as it deems appropriate. On a quarterly basis, the Board of Trustees receives reports on any valuation actions taken by the Valuation Committee or the Wells Fargo Asset Management Pricing Committee which may include items for ratification.
When-issued transactions
The Fund may purchase securities on a forward commitment or when-issued basis. The Fund records a when-issued transaction on the trade date and will segregate assets in an amount at least equal in value to the Fund’s commitment to purchase when-issued securities. Securities purchased on a when-issued basis aremarked-to-market daily and the Fund begins earning interest on the settlement date. Losses may arise due to changes in the market value of the underlying securities or if the counterparty does not perform under the contract.
Futures contracts
Futures contracts are agreements between the Fund and a counterparty to buy or sell a specific amount of a commodity, financial instrument or currency at a specified price and on a specified date. The Fund may buy and sell futures contracts in order to gain exposure to, or protect against, changes in interest rates and is subject to interest rate risk. The primary risks associated with the use of futures contracts are the imperfect correlation between changes in market values of securities held by the Fund and the prices of futures contracts, and the possibility of an illiquid market. Futures contracts are generally entered into on a regulated futures exchange and cleared through a clearinghouse associated with the exchange. With futures contracts, there is minimal counterparty risk to the Fund since futures contracts are exchange traded and the exchange’s clearinghouse, as the counterparty to all exchange traded futures, guarantees the futures contracts against default.
Upon entering into a futures contracts, the Fund is required to deposit either cash or securities (initial margin) with the broker in an amount equal to a certain percentage of the contract value. Subsequent payments (variation margin) are paid to or from the broker each day equal to the daily changes in the contract value. Such payments are recorded as unrealized gains or losses and, if any, shown as variation margin receivable (payable) in the Statement of Assets and Liabilities. Should the Fund fail to make requested variation margin payments, the broker can gain access to the initial margin to satisfy the Fund’s payment obligations. When the contracts are closed, a realized gain or loss is recorded in the Statement of Operations.
22 | Wells Fargo Government Securities Fund
Notes to financial statements (unaudited)
Security transactions and income recognition
Securities transactions are recorded on a trade date basis. Realized gains or losses are recorded on the basis of identified cost.
Interest income is accrued daily and bond discounts are accreted and premiums are amortized daily. To the extent debt obligations are placed onnon-accrual status, any related interest income may be reduced by writing off interest receivables when the collection of all or a portion of interest has been determined to be doubtful based on consistently applied procedures and the fair value has decreased. If the issuer subsequently resumes interest payments or when the collectability of interest is reasonably assured, the debt obligation is removed fromnon-accrual status.
Distributions to shareholders
Distributions to shareholders from net investment income are declared daily and paid monthly. Distributions from net realized gains, if any, are recorded on theex-dividend date and paid at least annually. Such distributions are determined in accordance with income tax regulations and may differ from U.S. generally accepted accounting principles. Dividend sources are estimated at the time of declaration. The tax character of distributions is determined as of the Fund’s fiscal year end. Therefore, a portion of the Fund’s distributions made prior to the Fund’s fiscal year end may be categorized as a tax return of capital at year end. .
Federal and other taxes
The Fund intends to continue to qualify as a regulated investment company by distributing substantially all of its investment company taxable income and any net realized capital gains (after reduction for capital loss carryforwards) sufficient to relieve it from all, or substantially all, federal income taxes. Accordingly, no provision for federal income taxes was required.
The Fund’s income and federal excise tax returns and all financial records supporting those returns for the prior three fiscal years are subject to examination by the federal and Delaware revenue authorities. Management has analyzed the Fund’s tax positions taken on federal, state, and foreign tax returns for all open tax years and does not believe that there are any uncertain tax positions that require recognition of a tax liability.
As of February 29, 2020, the aggregate cost of all investments for federal income tax purposes was $614,990,785 and the unrealized gains (losses) consisted of:
| | | | |
| |
Gross unrealized gains | | $ | 39,280,829 | |
| |
Gross unrealized losses | | | (16,130,497 | ) |
| |
Net unrealized gains | | $ | 23,150,332 | |
As of August 31, 2019, the Fund had capital loss carryforwards which consisted of $14,573,374 in short-term capital losses and $5,297,260 in long-term capital losses.
Class allocations
The separate classes of shares offered by the Fund differ principally in applicable sales charges, distribution, shareholder servicing, and administration fees. Class specific expenses are charged directly to that share class. Investment income, common fund-level expenses, and realized and unrealized gains (losses) on investments are allocated daily to each class of shares based on the relative proportion of net assets of each class.
3. FAIR VALUATION MEASUREMENTS
Fair value measurements of investments are determined within a framework that has established a fair value hierarchy based upon the various data inputs utilized in determining the value of the Fund’s investments. The three-level hierarchy gives the highest priority to unadjusted quoted prices in active markets for identical assets or liabilities (Level 1) and the lowest priority to unobservable inputs (Level 3). The Fund’s investments are classified within the fair value hierarchy based on the lowest level of input that is significant to the fair value measurement. The inputs are summarized into three broad levels as follows:
| ∎ | | Level 1 – quoted prices in active markets for identical securities |
| ∎ | | Level 2 – other significant observable inputs (including quoted prices for similar securities, interest rates, prepayment speeds, credit risk, etc.) |
| ∎ | | Level 3 – significant unobservable inputs (including the Fund’s own assumptions in determining the fair value of investments) |
The inputs or methodologies used for valuing investments in securities are not necessarily an indication of the risk associated with investing in those securities.
Wells Fargo Government Securities Fund | 23
Notes to financial statements (unaudited)
The following is a summary of the inputs used in valuing the Fund’s assets and liabilities as of February 29, 2020:
| | | | | | | | | | | | | | | | |
| | | | |
| | | Quoted prices
(Level 1) | | | Other significant
observable inputs
(Level 2) | | | Significant
unobservable inputs (Level 3) | | | Total | |
| | | | |
Assets | | | | | | | | | | | | | | | | |
Investments in: | | | | | | | | | | | | | | | | |
| | | | |
Agency securities | | $ | 0 | | | $ | 445,889,858 | | | $ | 0 | | | $ | 445,889,858 | |
| | | | |
Asset-backed securities | | | 0 | | | | 11,677,559 | | | | 0 | | | | 11,677,559 | |
| | | | |
Corporate bonds and notes | | | 0 | | | | 4,394,888 | | | | 0 | | | | 4,394,888 | |
| | | | |
Municipal obligations | | | 0 | | | | 5,787,458 | | | | 0 | | | | 5,787,458 | |
| | | | |
Non-agency mortgage-backed securities | | | 0 | | | | 44,730,775 | | | | 0 | | | | 44,730,775 | |
| | | | |
U.S. Treasury securities | | | 70,217,971 | | | | 0 | | | | 0 | | | | 70,217,971 | |
| | | | |
Yankee government bonds | | | 0 | | | | 22,024,981 | | | | 0 | | | | 22,024,981 | |
| | | | |
Short-term investments | | | | | | | | | | | | | | | | |
| | | | |
Investment companies | | | 33,311,967 | | | | 0 | | | | 0 | | | | 33,311,967 | |
| | | | |
| | | 103,529,938 | | | | 534,505,519 | | | | 0 | | | | 638,035,457 | |
| | | | |
Futures contracts | | | 1,067,327 | | | | 0 | | | | 0 | | | | 1,067,327 | |
| | | | |
Total assets | | $ | 104,597,265 | | | $ | 534,505,519 | | | $ | 0 | | | $ | 639,102,784 | |
| | | | |
Liabilities | | | | | | | | | | | | | | | | |
| | | | |
Futures contracts | | $ | 961,667 | | | $ | 0 | | | $ | 0 | | | $ | 961,667 | |
| | | | |
Total liabilities | | $ | 961,667 | | | $ | 0 | | | $ | 0 | | | $ | 961,667 | |
Additional sector, industry or geographic detail is included in the Portfolio of Investments.
Futures contracts are reported at their cumulative unrealized gains (losses) at measurement date as reported in the table following the Portfolio of Investments. For futures contracts, the current day’s variation margin is reported on the Statement of Assets and Liabilities. All other assets and liabilities are reported at their market value at measurement date.
For the six months ended February 29, 2020, the Fund did not have any transfers into/out of Level 3.
4. TRANSACTIONS WITH AFFILIATES
Management fee
Funds Management, an indirect wholly owned subsidiary of Wells Fargo & Company (“Wells Fargo”), is the manager of the Fund and provides advisory and fund-level administrative services under an investment management agreement. Under the investment management agreement, Funds Management is responsible for, among other services, implementing the investment objectives and strategies of the Fund, supervising the subadviser and providing fund-level administrative services in connection with the Fund’s operations. As compensation for its services under the investment management agreement, Funds Management is entitled to receive a management fee at the following annual rate based on the Fund’s average daily net assets:
| | | | |
| |
| Average daily net assets | | Management fee | |
| |
First $500 million | | | 0.450 | % |
| |
Next $500 million | | | 0.425 | |
| |
Next $2 billion | | | 0.400 | |
| |
Next $2 billion | | | 0.375 | |
| |
Next $5 billion | | | 0.340 | |
| |
Over $10 billion | | | 0.320 | |
24 | Wells Fargo Government Securities Fund
Notes to financial statements (unaudited)
For the six months ended February 29, 2020, the management fee was equivalent to an annual rate of 0.45% of the Fund’s average daily net assets.
Funds Management has retained the services of a subadviser to provide daily portfolio management to the Fund. The fee for subadvisory services is borne by Funds Management. Wells Capital Management Incorporated, an affiliate of Funds Management and an indirect wholly owned subsidiary of Wells Fargo, is the subadviser to the Fund and is entitled to receive a fee from Funds Management at an annual rate starting at 0.20% and declining to 0.10% as the average daily net assets of the Fund increase.
Administration fees
Under a class-level administration agreement, Funds Management provides class-level administrative services to the Fund, which includes paying fees and expenses for services provided by the transfer agent,sub-transfer agents, omnibus account servicers and record-keepers. As compensation for its services under the class-level administration agreement, Funds Management receives an annual fee which is calculated based on the average daily net assets of each class as follows:
| | | | |
| |
| | | Class-level
administration fee | |
| |
Class A, Class C | | | 0.16 | % |
| |
Administrator Class | | | 0.10 | |
| |
Institutional Class | | | 0.08 | |
Waivers and/or expense reimbursements
Funds Management has contractually waived and/or reimbursed management and administration fees to the extent necessary to maintain certain net operating expense ratios for the Fund. When each class of the Fund has exceeded its expense cap, Funds Management has waived fees and/or reimbursed expenses from fund-level expenses on a proportionate basis and then from class specific expenses. When only certain classes exceed their expense caps, waivers and/or reimbursements are applied against class specific expenses before fund-level expenses. Funds Management has committed through December 31, 2020 to waive fees and/or reimburse expenses to the extent necessary to cap the Fund’s expenses at 0.85% for Class A shares, 1.60% for Class C shares, 0.64% for Administrator Class shares, and 0.48% for Institutional Class shares. Prior to or after the commitment expiration date, the cap may be increased or the commitment to maintain the cap may be terminated only with the approval of the Board of Trustees.
Distribution fee
The Trust has adopted a distribution plan for Class C shares of the Fund pursuant to Rule12b-1 under the 1940 Act. A distribution fee is charged to Class C shares and paid to Wells Fargo Funds Distributor, LLC (“Funds Distributor”), the principal underwriter, at an annual rate of 0.75% of the average daily net assets of Class C shares.
In addition, Funds Distributor is entitled to receive thefront-end sales charge from the purchase of Class A shares and a contingent deferred sales charge on the redemption of certain Class A shares. Funds Distributor is also entitled to receive the contingent deferred sales charges from redemptions of Class C shares. For the six months ended February 29, 2020, Funds Distributor received $2,935 from the sale of Class A shares. No contingent deferred sales charges were incurred by Class A and Class C shares for the six months ended February 29, 2020.
Shareholder servicing fees
The Trust has entered into contracts with one or more shareholder servicing agents, whereby Class A, Class C, and Administrator Class of the Fund are charged a fee at an annual rate of 0.25% of the average daily net assets of each respective class. A portion of these total shareholder servicing fees were paid to affiliates of Wells Fargo.
Interfund transactions
The Fund may purchase or sell portfolio investment securities to certain other Wells Fargo affiliates pursuant to Rule17a-7 under the 1940 Act and under procedures adopted by the Board of Trustees. The procedures have been designed to ensure that these interfund transactions, which do not incur broker commissions, are effected at current market prices.
Wells Fargo Government Securities Fund | 25
Notes to financial statements (unaudited)
5. INVESTMENT PORTFOLIO TRANSACTIONS
Purchases and sales of investments, excluding short-term securities, for the six months ended February 29, 2020 were as follows:
| | | | | | |
Purchases at cost | | Sales proceeds |
U.S.
government | | Non-U.S.
government | | U.S.
government | | Non-U.S.
government |
| $238,421,277 | | $51,483,461 | | $193,894,937 | | $61,210,702 |
6. DERIVATIVE TRANSACTIONS
During the six months ended February 29, 2020, the Fund entered into futures contracts to speculate on interest rates and to help manage the duration of the portfolio. The Fund had an average notional amount of $105,626,799 in long futures contracts and $42,794,104 in short futures contracts during the six months ended February 29, 2020.
The fair value, realized gains or losses and change in unrealized gains or losses, if any, on derivative instruments are reflected in the corresponding financial statement captions.
7. BANK BORROWINGS
The Trust (excluding the money market funds), Wells Fargo Master Trust and Wells Fargo Variable Trust are parties to a $280,000,000 revolving credit agreement whereby the Fund is permitted to use bank borrowings for temporary or emergency purposes, such as to fund shareholder redemption requests. Interest under the credit agreement is charged to the Fund based on a borrowing rate equal to the higher of the Federal Funds rate in effect on that day plus 1.25% or the overnight LIBOR rate in effect on that day plus 1.25%. In addition, an annual commitment fee equal to 0.25% of the unused balance is allocated to each participating fund.
For the six months ended February 29, 2020, there were no borrowings by the Fund under the agreement.
8. INDEMNIFICATION
Under the Trust’s organizational documents, the officers and Trustees have been granted certain indemnification rights against certain liabilities that may arise out of performance of their duties to the Trust. Additionally, in the normal course of business, the Trust may enter into contracts with service providers that contain a variety of indemnification clauses. The Trust’s maximum exposure under these arrangements is dependent on futureclaims that may be made against the Fund and, therefore, cannot be estimated.
9. NEW ACCOUNTING PRONOUNCEMENTS
In August 2018, FASB issued Accounting Standards Update (“ASU”)No. 2018-13, Fair Value Measurement (Topic 820)Disclosure Framework—Changes to the Disclosure Requirements for Fair Value Measurement.ASU2018-13 updates the disclosure requirements for fair value measurements by modifying or removing certain disclosures and adding certain new disclosures. The amendments are effective for fiscal years, and interim periods within those fiscal years, beginning after December 15, 2019. Early adoption is permitted. Management has adopted the removal and modification of disclosures early, as permitted, and will adopt the additional new disclosures at the effective date.
In March 2017, FASB issued ASUNo. 2017-08,Premium Amortization on Purchased Callable Debt Securities. ASU2017-08 shortens the amortization period for certain callable debt securities held at a premium and requires the premium to be amortized to the earliest call date. The amendments do not require an accounting change for securities held at a discount and discounts will continue to be accreted to the maturity date of the security. ASU2017-08 is effective for fiscal years beginning after December 15, 2018 and for interim periods within those fiscal years. During the current reporting period, management of the Fund adopted the change in accounting policy which did not have a material impact to the Fund’s financial statements.
10. SUBSEQUENT EVENT
On March 11, 2020, the World Health Organization announced that it had made the assessment that coronavirus disease 2019
(“COVID-19”) is a pandemic. The impacts ofCOVID-19 is adversely affecting the entire global economy, individual companies and investment products, and the market in general. There is significant uncertainty around the extent and duration of business disruptions related toCOVID-19 and the impact may be short term or may last for an extended period of time. The risk of further spreading ofCOVID-19 has led to significant uncertainty and volatility in the financial markets and the value of the Fund and the securities in which the Fund invests have generally been adversely affected by impacts caused byCOVID-19.
26 | Wells Fargo Government Securities Fund
Other information (unaudited)
PROXY VOTING INFORMATION
A description of the policies and procedures used to determine how to vote proxies relating to portfolio securities is available, upon request, by calling1-800-222-8222, visiting our website atwfam.com, or visiting the SEC website at sec.gov. Information regarding how the proxies related to portfolio securities were voted during the most recent12-month period ended June 30 is available on the website atwfam.comor by visiting the SEC website at sec.gov.
QUARTERLY PORTFOLIO HOLDINGS INFORMATION
The Fund files its complete schedule of portfolio holdings with the SEC for the first and third quarters of each fiscal year as an exhibit to its reports on FormN-PORT. Shareholders may view the filed FormN-PORT by visiting the SEC website at sec.gov.
Wells Fargo Government Securities Fund | 27
Other information (unaudited)
BOARD OF TRUSTEES AND OFFICERS
Each of the Trustees and Officers1 listed in the table below acts in identical capacities for each fund in the Wells Fargo family of funds, which consists of 146 mutual funds comprising the Wells Fargo Funds Trust, Wells Fargo Variable Trust, Wells Fargo Master Trust and fourclosed-end funds (collectively the “Fund Complex”). This table should be read in conjunction with the Prospectus and the Statement of Additional Information2. The mailing address of each Trustee and Officer is 525 Market Street, 12th Floor, San Francisco, CA 94105. Each Trustee and Officer serves an indefinite term, however, each Trustee serves such term until reaching the mandatory retirement age established by the Trustees.
Independent Trustees
| | | | | | |
Name and
year of birth | | Position held and
length of service* | | Principal occupations during past five years or longer | | Current other
public company or
investment
company
directorships |
| | | |
| William R. Ebsworth (Born 1957) | | Trustee, since 2015 | | Retired. From 1984 to 2013, equities analyst, portfolio manager, research director and chief investment officer at Fidelity Management and Research Company in Boston, Tokyo, and Hong Kong, and retired in 2013 as Chief Investment Officer of Fidelity Strategic Advisers, Inc. where he led a team of investment professionals managing client assets. Prior thereto, Board member of Hong Kong Securities Clearing Co., Hong Kong Options Clearing Corp., the Thailand International Fund, Ltd., Fidelity Investments Life Insurance Company, and Empire Fidelity Investments Life Insurance Company. Audit Committee Chair and Investment Committee Chair of the Vincent Memorial Hospital Endowment(non-profit organization). Mr. Ebsworth is a CFA® charterholder. | | N/A |
| | | |
| Jane A. Freeman (Born 1953) | | Trustee, since 2015; Chair Liaison, since 2018 | | Retired. From 2012 to 2014 and 1999 to 2008, Chief Financial Officer of Scientific Learning Corporation. From 2008 to 2012, Ms. Freeman provided consulting services related to strategic business projects. Prior to 1999, Portfolio Manager at Rockefeller & Co. and Scudder, Stevens & Clark. Board member of the Harding Loevner Funds from 1996 to 2014, serving as both Lead Independent Director and chair of the Audit Committee. Board member of the Russell Exchange Traded Funds Trust from 2011 to 2012 and the chair of the Audit Committee. Ms. Freeman is a Board Member of The Ruth Bancroft Garden(non-profit organization). She is also an inactive Chartered Financial Analyst. | | N/A |
| | | |
| Isaiah Harris, Jr. (Born 1952) | | Trustee, since 2009; Audit Committee Chairman, since 2019 | | Retired. Chairman of the Board of CIGNA Corporation since 2009, and Director since 2005. From 2003 to 2011, Director of Deluxe Corporation. Prior thereto, President and CEO of BellSouth Advertising and Publishing Corp. from 2005 to 2007, President and CEO of BellSouth Enterprises from 2004 to 2005 and President of BellSouth Consumer Services from 2000 to 2003. Emeritus member of the Iowa State University Foundation Board of Governors. Emeritus Member of the Advisory Board of Iowa State University School of Business. Advisory Board Member, Palm Harbor Academy (private school). Advisory Board Member, Child Evangelism Fellowship(non-profit). Mr. Harris is a certified public accountant (inactive status). | | CIGNA Corporation |
| | | |
| Judith M. Johnson (Born 1949) | | Trustee, since 2008; Audit Committee Chairman, from 2009 to 2018 | | Retired. Prior thereto, Chief Executive Officer and Chief Investment Officer of Minneapolis Employees Retirement Fund from 1996 to 2008. Ms. Johnson is an attorney, certified public accountant and a certified managerial accountant. | | N/A |
28 | Wells Fargo Government Securities Fund
Other information (unaudited)
| | | | | | |
Name and year of birth | | Position held and
length of service* | | Principal occupations during past five years or longer | | Current other
public company or
investment
company
directorships |
| | | |
| David F. Larcker (Born 1950) | | Trustee, since 2009 | | James Irvin Miller Professor of Accounting at the Graduate School of Business, Stanford University, Director of the Corporate Governance Research Initiative and Senior Faculty of The Rock Center for Corporate Governance since 2006. From 2005 to 2008, Professor of Accounting at the Graduate School of Business, Stanford University. Prior thereto, Ernst & Young Professor of Accounting at The Wharton School, University of Pennsylvania from 1985 to 2005. | | N/A |
| | | |
| Olivia S. Mitchell (Born 1953) | | Trustee, since 2006; Nominating and Governance Committee Chair, since 2018 | | International Foundation of Employee Benefit Plans Professor, Wharton School of the University of Pennsylvania since 1993. Director of Wharton’s Pension Research Council and Boettner Center on Pensions & Retirement Research, and Research Associate at the National Bureau of Economic Research. Previously, Cornell University Professor from 1978 to 1993. | | N/A |
| | | |
| Timothy J. Penny (Born 1951) | | Trustee, since 1996; Chairman, since 2018 | | President and Chief Executive Officer of Southern Minnesota Initiative Foundation, anon-profit organization, since 2007. Member of the Board of Trustees of NorthStar Education Finance, Inc., anon-profit organization, since 2007. | | N/A |
| | | |
| James G. Polisson (Born 1959) | | Trustee, since 2018 | | Retired. Chief Marketing Officer, Source (ETF) UK Services, Ltd, from 2015 to 2017. From 2012 to 2015, Principal of The Polisson Group, LLC, a management consulting, corporate advisory and principal investing company. Chief Executive Officer and Managing Director at Russell Investments, Global Exchange Traded Funds from 2010 to 2012. Managing Director of Barclays Global Investors from 1998 to 2010 and Global Chief Marketing Officer for iShares and Barclays Global Investors from 2000 to 2010. Trustee of the San Francisco Mechanics’ Institute, anon-profit organization, from 2013 to 2015. Board member of the Russell Exchange Traded Fund Trust from 2011 to 2012. Director of Barclays Global Investors Holdings Deutschland GmbH from 2006 to 2009. Mr. Polisson is an attorney and has a retired status with the Massachusetts and District of Columbia Bar Associations. | | N/A |
| | | |
| Pamela Wheelock3 (Born 1959) | | Trustee, since January 2020; previously Trustee from January 2018 to July 2019 | | Board member of the Destination Medical Center Economic Development Agency, Rochester, Minnesota since 2019. Acting Commissioner, Minnesota Department of Human Services, July 2019 through September 2019. Human Services Manager (part-time), Minnesota Department of Human Services, October 2019 through December 2019. Chief Operating Officer, Twin Cities Habitat for Humanity from 2017 to 2019. Vice President of University Services, University of Minnesota from 2012 to 2016. Prior thereto, on the Board of Directors, Governance Committee and Finance Committee for the Minnesota Philanthropy Partners (Saint Paul Foundation) from 2012 to 2018, Interim Chief Executive Officer of Blue Cross Blue Shield of Minnesota from 2011 to 2012, Chairman of the Board from 2009 to 2012 and Board Director from 2003 to 2015. Vice President, Leadership and Community Engagement, Bush Foundation, Saint Paul, Minnesota (a private foundation) from 2009 to 2011. Executive Vice President and Chief Financial Officer, Minnesota Sports and Entertainment from 2004 to 2009 and Senior Vice President from 2002 to 2004. Executive Vice President of the Minnesota Wild Foundation from 2004 to 2008. Commissioner of Finance, State of Minnesota, from 1999 to 2002. Currently Board Chair of the Minnesota Wild Foundation since 2010. | | N/A |
| * | Length of service dates reflect the Trustee’s commencement of service with the Trust’s predecessor entities, where applicable. |
Wells Fargo Government Securities Fund | 29
Other information (unaudited)
Officers
| | | | |
Name and
year of birth | | Position held and
length of service | | Principal occupations during past five years or longer |
| | |
| Andrew Owen (Born 1960) | | President, since 2017 | | Executive Vice President of Wells Fargo & Company and Head of Affiliated Managers, Wells Fargo Asset Management, since 2014. In addition, Mr. Owen is currently President, Chief Executive Officer and Director of Wells Fargo Funds Management, LLC since 2017. Prior thereto, Executive Vice President responsible for marketing, investments and product development for Wells Fargo Funds Management, LLC, from 2009 to 2014. |
| | |
Nancy Wiser1 (Born 1967) | | Treasurer, since 2012 | | Executive Vice President of Wells Fargo Funds Management, LLC since 2011. Chief Operating Officer and Chief Compliance Officer at LightBox Capital Management LLC, from 2008 to 2011. |
| | |
Michelle Rhee
(Born 1966) | | Chief Legal Officer, since 2019 | | Secretary of Wells Fargo Funds Management, LLC, Chief Legal Counsel of Wells Fargo Asset Management and Assistant General Counsel of Wells Fargo Bank, N.A. since 2018. Associate General Counsel and Managing Director of Bank of America Corporation from 2004 to 2018. |
| | |
| Catherine Kennedy (Born 1969) | | Secretary, since 2019 | | Vice President of Wells Fargo Funds Management, LLC and Senior Counsel of the Wells Fargo Legal Department since 2010. Vice President and Senior Counsel of Evergreen Investment Management Company, LLC from 1998 to 2010. |
| | |
| Michael H. Whitaker(Born 1967) | | Chief Compliance Officer, since 2016 | | Chief Compliance Officer of Wells Fargo Asset Management since 2016. Senior Vice President and Chief Compliance Officer for Fidelity Investments from 2007 to 2016. |
| | |
David Berardi (Born 1975) | | Assistant Treasurer, since 2009 | | Vice President of Wells Fargo Funds Management, LLC since 2009. Vice President of Evergreen Investment Management Company, LLC from 2008 to 2010. Manager of Fund Reporting and Control for Evergreen Investment Management Company, LLC from 2004 to 2010. |
| | |
| Jeremy DePalma1 (Born 1974) | | Assistant Treasurer, since 2009 | | Senior Vice President of Wells Fargo Funds Management, LLC since 2009. Senior Vice President of Evergreen Investment Management Company, LLC from 2008 to 2010 and head of the Fund Reporting and Control Team within Fund Administration from 2005 to 2010. |
| 1 | Nancy Wiser acts as Treasurer of 64 funds in the Fund Complex. Jeremy DePalma acts as Treasurer of 82 funds and Assistant Treasurer of 64 funds in the Fund Complex. |
| 2 | The Statement of Additional Information includes additional information about the Trustees and is available, without charge, upon request, by calling1-800-222-8222 or by visiting the website atwfam.com. |
| 3 | Pamela Wheelock wasre-appointed to the Board effective January 1, 2020. |
30 | Wells Fargo Government Securities Fund
Appendix I (unaudited)
Effective on or about May 1, 2020, if you purchase Fund shares through a Janney Montgomery Scott LLC (“Janney”) brokerage account, you will be eligible for the following load waivers(front-end sales charge waivers and contingent deferred sales charge (“CDSC”), orback-end sales charge, waivers) and discounts, which may differ from those disclosed elsewhere in the Fund’s Prospectus or SAI.
|
| Front-end sales charge* waivers on Class A shares available at Janney |
|
| Shares purchased through reinvestment of capital gains distributions and dividend reinvestment when purchasing shares of the same fund (but not any other fund within the fund family). |
|
| Shares purchased by employees and registered representatives of Janney or its affiliates and their family members as designated by Janney. |
|
| Shares purchased from the proceeds of redemptions within the same fund family, provided (1) the repurchase occurs within ninety (90) days following the redemption, (2) the redemption and purchase occur in the same account, and (3) redeemed shares were subject to afront-end or deferred sales load (i.e., right of reinstatement). |
|
| Employer-sponsored retirement plans (e.g., 401(k) plans, 457 plans, employer-sponsored 403(b) plans, profit sharing and money purchase pension plans and defined benefit plans). For purposes of this provision, employer-sponsored retirement plans do not include SEP IRAs, Simple IRAs,SAR-SEPs or Keogh plans. |
|
| Shares acquired through a right of reinstatement. |
|
Class C shares that are no longer subject to a contingent deferred sales charge and are converted to Class A shares of the same fund pursuant to Janney’s policies and procedures. |
| CDSC waivers on Class A and Class C shares available at Janney |
|
| Shares sold upon the death or disability of the shareholder. |
|
| Shares sold as part of a systematic withdrawal plan as described in the Fund’s Prospectus. |
|
| Shares purchased in connection with a return of excess contributions from an IRA account. |
|
| Shares sold as part of a required minimum distribution for IRA and retirement accounts if the redemption is taken in or after the year the shareholder reaches qualified age based on applicable IRS regulations. |
|
| Shares sold to pay Janney fees but only if the transaction is initiated by Janney. |
|
| Shares acquired through a right of reinstatement. |
|
Shares exchanged into the same share class of a different fund. |
| Front-end sales charge* discounts available at Janney; breakpoints, rights of accumulation and/or letters of intent |
|
| Breakpoints as described in the Fund’s Prospectus. |
|
| Rights of accumulation (“ROA”), which entitle shareholders to breakpoint discounts, will be automatically calculated based on the aggregated holding of fund family assets held by accounts within the purchaser’s household at Janney. Eligible fund family assets not held at Janney may be included in the ROA calculation only if the shareholder notifies his or her financial advisor about such assets. |
|
Letters of intent which allow for breakpoint discounts based on anticipated purchases within a fund family, over a13-month time period. Eligible fund family assets not held at Janney Montgomery Scott may be included in the calculation of letters of intent only if the shareholder notifies his or her financial advisor about such assets. |
| * | Also referred to as an “initial sales charge.” |
Wells Fargo Government Securities Fund | 31
Appendix II (unaudited)
Effective on or after May 1, 2020, clients of Edward Jones (also referred to as “shareholders”) purchasing Fund shares on the Edward Jones commission andfee-based platforms are eligible only for the following sales charge discounts (also referred to as “breakpoints”) and waivers, which can differ from breakpoints and waivers described elsewhere in this Prospectus or SAI or through another broker-dealer. In all instances, it is the shareholder’s responsibility to inform Edward Jones at the time of purchase of any relationship, holdings of Wells Fargo Funds or other facts qualifying the purchaser for breakpoints or waivers. Edward Jones can ask for documentation of such circumstance.
|
| Breakpoints available at Edward Jones |
|
| Rights of Accumulation (ROA) |
|
The applicable sales charge on a purchase of Class A shares is determined by taking into account all share classes (except any money market funds and retirement plan share classes) of Wells Fargo Funds held by the shareholder or in an account grouped by Edward Jones with other accounts for the purpose of providing certain pricing considerations (“pricing groups”). This includes all share classes held on the Edward Jones platform and/or held on another platform. The inclusion of eligible fund family assets in the rights of accumulation calculation is dependent on the shareholder notifying his or her financial advisor of such assets at the time of calculation. |
|
ROA is determined by calculating the higher of cost or market value (current shares x NAV). |
|
| Letter of Intent (LOI) |
|
Through a LOI, shareholders can receive the sales charge and breakpoint discounts for purchases shareholders intend to makeover a13-month period from the date Edward Jones receives the LOI. The LOI is determined by calculating the higher of cost or market value of qualifying holdings at LOI initiation in combination with the value that the shareholder intends to buy over a13-month period to calculate thefront-end sales charge and any breakpoint discounts. Each purchase the shareholder makes during that13-month period will receive the sales charge and breakpoint discount that applies to the total amount. The inclusion of eligible fund family assets in the LOI calculation is dependent on the shareholder notifying his or her financial advisor of such assets at the time of calculation. Purchases made before the LOI is received by Edward Jones are not covered under the LOI and will not reduce the sales charge previously paid. Sales charges will be adjusted if LOI is not met. |
| Sales charges are waived for the following shareholders and in the following situations at Edward Jones: |
● Associates of Edward Jones and its affiliates and their family members who are in the same pricing group (as determined by Edward Jones under its policies and procedures) as the associate. This waiver will continue for the remainder of the associate’s life if the associate retires from Edward Jones in good-standing. |
● Shares purchased in an Edward Jonesfee-based program. |
● Shares purchased through reinvestment of capital gains distributions and dividend reinvestment. |
● Shares purchased from the proceeds of redeemed shares of the same fund family so long as the following conditions are met: 1) the proceeds are from the sale of shares within 60 days of the purchase, and 2) the sale and purchase are made in the same share class and the same account or the purchase is made in an individual retirement account with proceeds from liquidations in anon-retirement account. |
● Shares exchanged into Class A shares from another share class so long as the exchange is into the same fund and was initiated at the discretion of Edward Jones. Edward Jones is responsible for any remaining CDSC due to the fund company, if applicable. Any future purchases are subject to the applicable sales charge as disclosed in the prospectus. |
● Exchanges from Class C shares to Class A shares of the same fund, generally, in the 84th month following the anniversary of the purchase date or earlier at the discretion of Edward Jones. |
If the shareholder purchases shares that are subject to a CDSC and those shares are redeemed before the CDSC is expired, the shareholder is
responsible to pay the CDSC except in the following conditions available at Edward Jones: |
● The death or disability of the shareholder. |
● Systematic withdrawals with up to 10% per year of the account value. |
● Return of excess contributions from an Individual Retirement Account (IRA). |
● Shares sold as part of a required minimum distribution for IRA and retirement accounts if the redemption is taken in or after the year the shareholder reaches qualified age based on applicable IRS regulation. |
● Shares sold to pay Edward Jones fees or costs in such cases where the transaction is initiated by Edward Jones. |
● Shares exchanged in an Edward Jonesfee-based program. |
● Shares acquired through NAV reinstatement. |
32 | Wells Fargo Government Securities Fund
Appendix II (unaudited)
|
| Other Important Information for accounts at Edward Jones: |
Minimum Purchase Amounts ● $250 initial purchase minimum ● $50 subsequent purchase minimum |
Minimum Balances Edward Jones has the right to redeem at its discretion fund holdings with a balance of $250 or less. The following are examples of accounts that are not included in this policy: ● Afee-based account held on an Edward Jones platform ● A 529 account held on an Edward Jones platform ● An account with an active systematic investment plan or letter of intent (LOI) |
Changing Share Classes At any time it deems necessary, Edward Jones has the authority to exchange at NAV a shareholder’s holdings in a fund to Class A shares. |
Wells Fargo Government Securities Fund | 33
This page is intentionally left blank.
This page is intentionally left blank.
This page is intentionally left blank.

For more information
More information about Wells Fargo Funds is available free upon request. To obtain literature, please write, visit the Fund’s website, or call:
Wells Fargo Funds
P.O. Box 219967
Kansas City, MO 64121-9967
Website:wfam.com
Individual investors:1-800-222-8222
Retail investment professionals:1-888-877-9275
Institutional investment professionals:1-866-765-0778

This report and the financial statements contained herein are submitted for the general information of the shareholders of the Fund. If this report is used for promotional purposes, distribution of the report must be accompanied or preceded by a current prospectus. Before investing, please consider the investment objectives, risks, charges, and expenses of the investment. For a current prospectus and, if available, a summary prospectus, containing this information, call1-800-222-8222 or visit the Fund’s website atwfam.com. Read the prospectus carefully before you invest or send money.
Wells Fargo Asset Management (WFAM) is the trade name for certain investment advisory/management firms owned by Wells Fargo & Company. These firms include but are not limited to Wells Capital Management Incorporated and Wells Fargo Funds Management, LLC. Certain products managed by WFAM entities are distributed by Wells Fargo Funds Distributor, LLC (a broker-dealer and Member FINRA).
This material is for general informational and educational purposes only and is NOT intended to provide investment advice or a recommendation of any kind—including a recommendation for any specific investment, strategy, or plan.
INVESTMENT PRODUCTS: NOT FDIC INSURED ◾ NO BANK GUARANTEE ◾ MAY LOSE VALUE
© 2020 Wells Fargo & Company. All rights reserved
PAR-0320-04740 04-20
SA216/SAR216 02-20
Semi-Annual Report
February 29, 2020
Wells Fargo Short-Term Bond Fund
Beginning on January 1, 2021, as permitted by new regulations adopted by the Securities and Exchange Commission, paper copies of the Wells Fargo Funds’ annual and semi-annual shareholder reports issued after this date will no longer be sent by mail, unless you specifically request paper copies of the reports. Instead, the reports will be made available on the Funds’ website, and you will be notified by mail each time a report is posted and provided with a website address to access the report.
If you already elected to receive shareholder reports electronically, you will not be affected by this change and you need not take any action. You may elect to receive shareholder reports and other communications from the Fund electronically at any time by contacting your financial intermediary (such as a broker-dealer or bank) or, if you are a direct investor, by calling1-800-222-8222 or by enrolling at wellsfargo.com/advantagedelivery.
You may elect to receive all future reports in paper free of charge. If you invest through a financial intermediary, you can contact your financial intermediary to request that you continue to receive paper copies of your shareholder reports; if you invest directly with the Fund, you can call 1-800-222-8222. Your election to receive reports in paper will apply to all Wells Fargo Funds held in your account with your financial intermediary or, if you are a direct investor, to all Wells Fargo Funds that you hold.
|
|
|
Reduce clutter. Save trees. |
Sign up for electronic delivery of prospectuses and shareholder reports at wellsfargo.com/ advantagedelivery |
The views expressed and any forward-looking statements are as of February 29, 2020, unless otherwise noted, and are those of the Fund managers and/or Wells Fargo Asset Management. Discussions of individual securities, or the markets generally, or any Wells Fargo Fund are not intended as individual recommendations. Future events or results may vary significantly from those expressed in any forward-looking statements. The views expressed are subject to change at any time in response to changing circumstances in the market. Wells Fargo Asset Management and the Fund disclaim any obligation to publicly update or revise any views expressed or forward-looking statements.
INVESTMENT PRODUCTS: NOT FDIC INSURED ◾ NO BANK GUARANTEE ◾ MAY LOSE VALUE
Wells Fargo Short-Term Bond Fund | 1
Letter to shareholders (unaudited)

Andrew Owen
President
Wells Fargo Funds
“The fourth quarter started on a strong note, with U.S.-China trade tensions relaxing in October along with renewed optimism for a U.K. Brexit deal and positive macroeconomic data.”
Dear Shareholder:
We are pleased to offer you this semi-annual report for the Wells Fargo Short-Term Bond Fund for thesix-month period that ended February 29, 2020. As market volatility increased, returns for the period were more restrained after strong results in previous recent periods. However, supportive central banks addressed concerns over slowing global economic growth and international trade tensions.
Fixed-income and equity investors had mixed semi-annual returns. For the period, U.S. stocks, based on the S&P 500 Index,1 gained 1.92% and international stocks, as measured by the MSCI ACWI ex USA Index (Net),2 returned 0.13%. The MSCI EM Index (Net)3 gained 2.93%. For bond investors, the Bloomberg Barclays U.S. Aggregate Bond Index4 added 3.39%, the Bloomberg Barclays Global Aggregateex-USD Index5 returned-0.21%, the Bloomberg Barclays Municipal Bond Index6 gained 3.04%, and the ICE BofA U.S. High Yield Index7 added 1.34%.
The period began with uncertainty, leading to central bank support.
In September, as the period began, the U.S. Federal Reserve (Fed) cut interest rates a second time in the third quarter. U.S. manufacturing data disappointed investors. The U.S. Congress announced it would pursue an impeachment investigation of President Trump. Meanwhile, the Brexit impasse showed no signs of resolution. Officials in China warned it would be difficult to reach the country’s annual economic growth goals considering the weight of tariffs and trade restrictions. Although the S&P 500 Index finished the third quarter with the bestyear-to-date returns in more than 20 years, concerns about future returns remained.
The fourth quarter started on a strong note, with U.S.-China trade tensions relaxing in October along with renewed optimism for a U.K. Brexit deal and positive macroeconomic data. The initial estimate of U.S. third-quarter gross domestic product growth was a resilient 1.9% annualized rate, while the U.S. unemployment rate fell to a50-year low of 3.5% in September. However, despite resilience among U.S. consumers, business confidence declined while manufacturing activity contracted. Concerned with a potential economic slowdown, the Fed lowered interest rates another quarter point in late October—its third rate cut in four months. This helped push the S&P 500 Index to anall-time high, while emerging market equities rallied and global bonds declined overall, reflecting a broad pickup in risk appetite.
| 1 | The S&P 500 Index consists of 500 stocks chosen for market size, liquidity, and industry group representation. It is a market-value-weighted index with each stock’s weight in the index proportionate to its market value. You cannot invest directly in an index. |
| 2 | The Morgan Stanley Capital International (MSCI) All Country World Index (ACWI) ex USA Index (Net) is a free-float-adjusted market-capitalization-weighted index that is designed to measure the equity market performance of developed markets, excluding the United States. Source: MSCI. MSCI makes no express or implied warranties or representations and shall have no liability whatsoever with respect to any MSCI data contained herein. The MSCI data may not be further redistributed or used as a basis for other indices or any securities or financial products. This report is not approved, reviewed, or produced by MSCI. You cannot invest directly in an index. |
| 3 | The MSCI Emerging Markets (EM) Index (Net) is a free-float-adjusted market-capitalization-weighted index that is designed to measure equity market performance of emerging markets. You cannot invest directly in an index. |
| 4 | The Bloomberg Barclays U.S. Aggregate Bond Index is a broad-based benchmark that measures the investment-grade, U.S. dollar-denominated, fixed-rate taxable bond market, including Treasuries, government-related and corporate securities, mortgage-backed securities (agency fixed-rate and hybrid adjustable-rate mortgage pass-throughs), asset-backed securities, and commercial mortgage-backed securities. You cannot invest directly in an index. |
| 5 | The Bloomberg Barclays Global Aggregateex-USD Index is an unmanaged index that provides a broad-based measure of the global investment-grade fixed-income markets excluding the U.S. dollar-denominated debt market. You cannot invest directly in an index. |
| 6 | The Bloomberg Barclays Municipal Bond Index is an unmanaged index composed of long-termtax-exempt bonds with a minimum credit rating of Baa. You cannot invest directly in an index. |
| 7 | The ICE BofA U.S. High Yield Index is a market-capitalization-weighted index of domestic and Yankee high-yield bonds. The index tracks the performance of high-yield securities traded in the U.S. bond market. You cannot invest directly in an index. Copyright 2020. ICE Data Indices, LLC. All rights reserved. |
2 | Wells Fargo Short-Term Bond Fund
Letter to shareholders (unaudited)
Equity markets continued to rally in November despite ongoing geopolitical risks. Hopes for a U.S.-China trade deal buoyed investor confidence. U.S. business sentiment improved slightly, and manufacturing and services activity picked up. With that positive backdrop, developed market equities outpaced those in emerging markets, and U.S. stocks, as reflected by the S&P 500 Index, outperformednon-U.S. stocks overall. While consumer confidence and purchasing manager activity rose in the eurozone, China reported weakening manufacturing and consumer data. Bond yields rose marginally, leading to slightly negative returns for global government and investment-grade corporate bonds.
Financial markets ended 2019 with a boost from the U.S. and China accord on a Phase One trade deal. That, along with the landslide win by thepro-Brexit U.K. Conservative Party in a national election and ongoing central bank support, gave investors greater confidence. U.S. economic indicators were generally positive, with the exception of manufacturing activity and business confidence. Consumer confidence was resilient, fed by a robust labor market, tame inflation, and lower interest rates, which boosted housing affordability and stimulated homebuyer activity. The impeachment of U.S. President Donald Trump had little impact on markets. Meanwhile, slowing Chinese economic activity, partly attributable to the trade war, led to further government stimulus atyear-end through lower reserve ratios, allowing banks to lend more money.
Theyear-end rally continued in early January 2020. However, capital market volatility picked up sharply in late January on concerns over the unknown impact of the novel coronavirus(COVID-19) on the global economy and stock markets. With sentiment somewhat souring, perceived safe havens did well in January. The U.S. dollar and Japanese yen both rose and government bonds outperformed equities. While the S&P 500 Index held its ground, emerging market equities tumbled, including those in Asia that are most exposed to viruses—physical or economic—originating in China.
In February, the coronavirus became the major market focus. Fears of the virus’s impact on global growth led to expectations of increased global central bank monetary policy support. That led the10-year Treasury yield to fall to anall-time low of 1.1% by the end of the month. Although equity markets initially shrugged off concerns about the outbreak, focusing instead on strong fourth-quarter earnings and improving business confidence in January, market sentiment turned sharply lower towardmonth-end and the S&P 500 Index lost 8.2% for the month. Oil prices tumbled as Russia and the Organization of the Petroleum Exporting Countries compounded a major decline in oil demand with a brutal price war, partly aimed at dissuading further U.S. shale production. As a result, the price of West Texas Intermediate crude oil fell 13% in February and 27% for 2020 year to date.
Don’t let short-term uncertainty derail long-term investment goals.
Periods of investment uncertainty can present challenges, but experience has taught us that maintaining long-term investment goals can be an effective way to plan for the future. Although diversification cannot guarantee an investment profit or prevent losses, we believe it can be an effective way to manage investment risk and potentially smooth out overall portfolio performance. We encourage investors to know their investments and to understand that appropriate levels of risk-taking may unlock opportunities.
Thank you for choosing to invest with Wells Fargo Funds. We appreciate your confidence in us and remain committed to helping you meet your financial needs.
Sincerely,

Andrew Owen
President
Wells Fargo Funds
“ Capital market volatility picked up sharply in late January on concerns over the unknown impact of the novel coronavirus(COVID-19) on the global economy and stock markets.”
|
|
|
For further information about your Fund, contact your investment professional, visit our website at wfam.com, or call us directly at1-800-222-8222. |
Wells Fargo Short-Term Bond Fund | 3
Performance highlights (unaudited)
Investment objective
The Fund seeks current income consistent with capital preservation.
Manager
Wells Fargo Funds Management, LLC
Subadviser
Wells Capital Management Incorporated
Portfolio managers
Christopher Y. Kauffman, CFA®‡
Jay N. Mueller, CFA®‡
Michael J. Schueller, CFA®‡
Noah M. Wise, CFA®‡
Average annual total returns (%) as of February 29, 2020
| | | | | | | | | | | | | | | | | | | | | | | | | | | | | | | | | | |
| | | | |
| | | | | Including sales charge | | | Excluding sales charge | | | Expense ratios1 (%) | |
| | | | | | | | | |
| | | Inception date | | 1 year | | | 5 year | | | 10 year | | | 1 year | | | 5 year | | | 10 year | | | Gross | | | Net2 | |
| | | | | | | | | | |
| Class A (SSTVX) | | 8-31-1999 | | | 2.71 | | | | 1.58 | | | | 1.74 | | | | 4.81 | | | | 2.00 | | | | 1.94 | | | | 0.82 | | | | 0.72 | |
| | | | | | | | | | |
| Class C (WFSHX) | | 3-31-2008 | | | 3.03 | | | | 1.23 | | | | 1.18 | | | | 4.03 | | | | 1.23 | | | | 1.18 | | | | 1.57 | | | | 1.47 | |
| | | | | | | | | | |
| Class R6 (SSTYX)3 | | 7-31-2018 | | | – | | | | – | | | | – | | | | 5.02 | | | | 2.25 | | | | 2.23 | | | | 0.44 | | | | 0.40 | |
| | | | | | | | | | |
| Institutional Class (SSHIX) | | 8-31-1999 | | | – | | | | – | | | | – | | | | 4.97 | | | | 2.26 | | | | 2.23 | | | | 0.49 | | | | 0.45 | |
| | | | | | | | | | |
| Bloomberg Barclays U.S.1-3 Year Government/Credit Bond Index4 | | – | | | – | | | | – | | | | – | | | | 4.88 | | | | 1.88 | | | | 1.58 | | | | – | | | | – | |
Figures quoted represent past performance, which is no guarantee of future results, and do not reflect taxes that a shareholder may pay on an investment in a fund. Investment return and principal value of an investment will fluctuate so that an investor’s shares, when redeemed, may be worth more or less than their original cost. Performance shown without sales charges would be lower if sales charges were reflected. Current performance may be lower or higher than the performance data quoted, which assumes the reinvestment of dividends and capital gains. Currentmonth-end performance is available on the Fund’s website, wfam.com.
Index returns do not include transaction costs associated with buying and selling securities, any mutual fund fees or expenses, or any taxes. It is not possible to invest directly in an index.
For Class A shares, the maximumfront-end sales charge is 2.00%. For Class C shares, the maximum contingent deferred sales charge is 1.00%. Performance including a contingent deferred sales charge assumes the sales charge for the corresponding time period. Class R6 and Institutional Class shares are sold without afront-end sales charge or contingent deferred sales charge.
Bond values fluctuate in response to the financial condition of individual issuers, general market and economic conditions, and changes in interest rates. Changes in market conditions and government policies may lead to periods of heightened volatility in the bond market and reduced liquidity for certain bonds held by the Fund. In general, when interest rates rise, bond values fall and investors may lose principal value. Interest rate changes and their impact on the Fund and its share price can be sudden and unpredictable. Loans are subject to risks similar to those associated with other below-investment-grade bond investments, such as credit risk (for example, risk of issuer default), below investment- grade bond risk (for example, risk of greater volatility in value), and risk that the loan may become illiquid or difficult to price. The use of derivatives may reduce returns and/or increase volatility. Certain investment strategies tend to increase the total risk of an investment (relative to the broader market). Foreign investments are especially volatile and can rise or fall dramatically due to differences in the political and economic conditions of the host country. These risks are generally intensified in emerging markets. The Fund is exposed to high-yield securities risk and mortgage- and asset-backed securities risk. Consult the Fund’s prospectus for additional information on these and other risks.
Please see footnotes on page 5.
4 | Wells Fargo Short-Term Bond Fund
Performance highlights (unaudited)
| | | | |
|
| Ten largest holdings (%) as of February 29, 20205 | |
| | |
Jackson National Life Global Company, 2.50%, 6-27-2022 | | | 1.07 | |
| | |
Hertz Vehicle Financing LLC Series 2015-1A Class A, 2.73%, 3-25-2021 | | | 1.06 | |
| | |
World Omni Automobiles Lease Securitization Trust Series 2018-B Class A3, 3.19%,12-15-2021 | | | 0.94 | |
| | |
Morgan Stanley, 2.75%, 5-19-2022 | | | 0.87 | |
| | |
Bank of America NA, 3.34%, 1-25-2023 | | | 0.87 | |
| | |
Honda Auto Receivables Owner Trust Series 2018-4 Class A3, 3.16%, 1-17-2023 | | | 0.77 | |
| | |
Ford Credit Auto Owner Trust Series 2017-A Class A4, 1.92%, 4-15-2022 | | | 0.76 | |
| | |
Westlake Automobile Receivables Trust Series 2019-2A Class A2A, 2.57%, 2-15-2023 | | | 0.76 | |
| | |
Honda Auto Receivables Owner Trust Series 2016-4 Class A4, 1.36%, 1-18-2023 | | | 0.72 | |
| | |
Hyundai Capital America Company,
2.38%, 2-10-2023 | | | 0.72 | |
|
|
| Portfolio allocation as of February 29, 20206 |
|
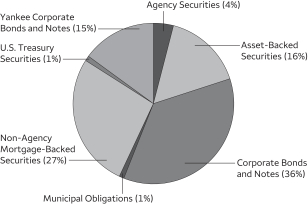 |
| ‡ | CFA® and Chartered Financial Analyst® are trademarks owned by CFA Institute. |
| 1 | Reflects the expense ratios as stated in the most recent prospectuses. The expense ratios shown are subject to change and may differ from the annualized expense ratios shown in the financial highlights of this report. |
| 2 | The manager has contractually committed through December 31, 2020, to waive fees and/or reimburse expenses to the extent necessary to cap total annual fund operating expenses after fee waivers at 0.72% for Class A, 1.47% for Class C, 0.40% for Class R6, and 0.45% for Institutional Class. Brokerage commissions, stamp duty fees, interest, taxes, acquired fund fees and expenses (if any), and extraordinary expenses are excluded from the expense cap. Prior to or after the commitment expiration date, the cap may be increased or the commitment to maintain the cap may be terminated only with the approval of the Board of Trustees. Without this cap, the Fund’s returns would have been lower. The expense ratio paid by an investor is the net expense ratio (the total annual fund operating expenses after fee waivers) as stated in the prospectuses. |
| 3 | Historical performance shown for the Class R6 shares prior to their inception reflects the performance of the Institutional Class shares and includes the higher expenses applicable to the Institutional Class shares. If these expenses had not been included, returns for the Class R6 shares would be higher. |
| 4 | The Bloomberg Barclays U.S. 1-3 Year Government/Credit Bond Index is the one- to three-year component of the Bloomberg Barclays U.S. Government/Credit Bond Index that includes securities in the Government and Credit Indexes. The Government Index includes Treasuries (that is, public obligations of the U.S. Treasury that have remaining maturities of more than one year) and agencies (that is, publicly issued debt of U.S. government agencies, quasi-federal corporations, and corporate or foreign debt guaranteed by the U.S. government). The Credit Index includes publicly issued U.S. corporate and foreign debentures and secured notes that meet specified maturity, liquidity, and quality requirements. You cannot invest directly in an index. |
| 5 | The ten largest holdings, excluding cash, cash equivalents and any money market funds, are calculated based on the value of the investments divided by total net assets of the Fund. Holdings are subject to change and may have changed since the date specified. |
| 6 | Amounts are calculated based on the total long-term investments of the Fund. These amounts are subject to change and may have changed since the date specified. |
Wells Fargo Short-Term Bond Fund | 5
Fund expenses (unaudited)
As a shareholder of the Fund, you incur two types of costs: (1) transaction costs, including sales charges (loads) on purchase payments and contingent deferred sales charges (if any) on redemptions and (2) ongoing costs, including management fees, distribution(12b-1) and/or shareholder servicing fees, and other Fund expenses. This example is intended to help you understand your ongoing costs (in dollars) of investing in the Fund and to compare these costs with the ongoing costs of investing in other mutual funds.
The example is based on an investment of $1,000 invested at the beginning of thesix-month period and held for the entire period from September 1, 2019 to February 29, 2020.
Actual expenses
The “Actual” line of the table below provides information about actual account values and actual expenses. You may use the information in this line, together with the amount you invested, to estimate the expenses that you paid over the period. Simply divide your account value by $1,000 (for example, an $8,600 account value divided by $1,000 = 8.6), then multiply the result by the number in the “Actual” line under the heading entitled “Expenses paid during period” for your applicable class of shares to estimate the expenses you paid on your account during this period.
Hypothetical example for comparison purposes
The “Hypothetical” line of the table below provides information about hypothetical account values and hypothetical expenses based on the Fund’s actual expense ratio and an assumed rate of return of 5% per year before expenses, which is not the Fund’s actual return. The hypothetical account values and expenses may not be used to estimate the actual ending account balance or expenses you paid for the period. You may use this information to compare the ongoing costs of investing in the Fund and other funds. To do so, compare this 5% hypothetical example with the 5% hypothetical examples that appear in the shareholder reports of the other funds.
Please note that the expenses shown in the table are meant to highlight your ongoing costs only and do not reflect any transactional costs, such as sales charges (loads) and contingent deferred sales charges. Therefore, the “Hypothetical” line of the table is useful in comparing ongoing costs only and will not help you determine the relative total costs of owning different funds. In addition, if these transactional costs were included, your costs would have been higher.
| | | | | | | | | | | | | | | | |
| | | Beginning
account value
9-1-2019 | | | Ending
account value
2-29-2020 | | | Expenses
paid during
the period¹ | | | Annualized net
expense ratio | |
| | | | | |
Class A | | | | | | | | | | | | | | | | |
| | | | |
Actual | | $ | 1,000.00 | | | $ | 1,018.01 | | | $ | 3.61 | | | | 0.72 | % |
| | | | |
Hypothetical (5% return before expenses) | | $ | 1,000.00 | | | $ | 1,021.28 | | | $ | 3.62 | | | | 0.72 | % |
| | | | | |
Class C | | | | | | | | | | | | | | | | |
| | | | |
Actual | | $ | 1,000.00 | | | $ | 1,014.24 | | | $ | 7.36 | | | | 1.47 | % |
| | | | |
Hypothetical (5% return before expenses) | | $ | 1,000.00 | | | $ | 1,017.55 | | | $ | 7.37 | | | | 1.47 | % |
| | | | | |
Class R6 | | | | | | | | | | | | | | | | |
| | | | |
Actual | | $ | 1,000.00 | | | $ | 1,019.63 | | | $ | 2.01 | | | | 0.40 | % |
| | | | |
Hypothetical (5% return before expenses) | | $ | 1,000.00 | | | $ | 1,022.87 | | | $ | 2.01 | | | | 0.40 | % |
| | | | | |
Institutional Class | | | | | | | | | | | | | | | | |
| | | | |
Actual | | $ | 1,000.00 | | | $ | 1,019.38 | | | $ | 2.26 | | | | 0.45 | % |
| | | | |
Hypothetical (5% return before expenses) | | $ | 1,000.00 | | | $ | 1,022.63 | | | $ | 2.26 | | | | 0.45 | % |
| 1 | Expenses paid is equal to the annualized net expense ratio of each class multiplied by the average account value over the period, multiplied by the number of days in the most recent fiscal half-year divided by the number of days in the fiscal year (to reflect theone-half-year period). |
6 | Wells Fargo Short-Term Bond Fund
Portfolio of investments—February 29, 2020 (unaudited)
| | | | | | | | | | | | | | | | |
| | | Interest
rate | | | Maturity
date | | | Principal | | | Value | |
Agency Securities: 3.43% | |
FDIC Series2013-R1 Class A 144A | | | 1.15 | % | | | 3-25-2033 | | | $ | 94,245 | | | $ | 94,070 | |
FHLMC | | | 3.50 | | | | 10-15-2025 | | | | 342,529 | | | | 359,181 | |
FHLMC | | | 3.50 | | | | 6-15-2038 | | | | 38,622 | | | | 38,630 | |
FHLMC (3 Year Treasury Constant Maturity +2.21%)± | | | 3.83 | | | | 5-1-2026 | | | | 20,365 | | | | 20,772 | |
FHLMC | | | 4.00 | | | | 5-1-2025 | | | | 606,173 | | | | 636,392 | |
FHLMC (1 Year Treasury Constant Maturity +2.25%)± | | | 4.06 | | | | 4-1-2038 | | | | 174,724 | | | | 185,558 | |
FHLMC (12 Month LIBOR +1.91%)± | | | 4.16 | | | | 9-1-2031 | | | | 2,293 | | | | 2,311 | |
FHLMC (1 Year Treasury Constant Maturity +2.25%)± | | | 4.76 | | | | 4-1-2032 | | | | 33,262 | | | | 35,048 | |
FHLMC (1 Year Treasury Constant Maturity +2.40%)± | | | 4.90 | | | | 7-1-2029 | | | | 604 | | | | 620 | |
FHLMC | | | 6.00 | | | | 10-1-2021 | | | | 46,414 | | | | 47,426 | |
FHLMC | | | 9.50 | | | | 12-1-2022 | | | | 775 | | | | 781 | |
FHLMC Series 2597 Class AE | | | 5.50 | | | | 4-15-2033 | | | | 37,608 | | | | 40,835 | |
FHLMC Series 2642 Class AR | | | 4.50 | | | | 7-15-2023 | | | | 137,457 | | | | 141,923 | |
FHLMC Series 3266 Class D | | | 5.00 | | | | 1-15-2022 | | | | 1 | | | | 1 | |
FHLMC Series 3609 Class LA | | | 4.00 | | | | 12-15-2024 | | | | 1,609 | | | | 1,615 | |
FHLMC Series 3855 Class HL | | | 3.50 | | | | 2-15-2026 | | | | 3,776 | | | | 3,773 | |
FHLMC Series 3920 Class AB | | | 3.00 | | | | 9-15-2025 | | | | 113,653 | | | | 114,499 | |
FHLMC Series KI01 Class A (1 Month LIBOR +0.16%)± | | | 1.82 | | | | 9-25-2022 | | | | 12,951 | | | | 12,939 | |
FHLMC Series QO04 Class AFL (12 Month Treasury Average +0.74%)± | | | 2.79 | | | | 5-25-2044 | | | | 819,466 | | | | 820,238 | |
FHLMC SeriesT-42 Class A6 | | | 9.50 | | | | 2-25-2042 | | | | 282,841 | | | | 355,897 | |
FHLMC SeriesT-57 Class 2A1±± | | | 4.04 | | | | 7-25-2043 | | | | 66,568 | | | | 73,383 | |
FHLMC SeriesT-59 Class 2A1±± | | | 3.89 | | | | 10-25-2043 | | | | 781,985 | | | | 917,909 | |
FHMLC Series 4358 Class DA | | | 3.00 | | | | 6-15-2040 | | | | 1,647,069 | | | | 1,692,851 | |
FNMA | | | 2.02 | | | | 6-1-2021 | | | | 1,969,664 | | | | 1,979,281 | |
FNMA (1 Year Treasury Constant Maturity +1.27%)± | | | 3.15 | | | | 8-1-2034 | | | | 194,205 | | | | 197,905 | |
FNMA | | | 4.00 | | | | 6-25-2026 | | | | 358,613 | | | | 383,435 | |
FNMA | | | 4.00 | | | | 8-25-2037 | | | | 255,639 | | | | 265,846 | |
FNMA (1 Year Treasury Constant Maturity +2.19%)± | | | 4.03 | | | | 11-1-2031 | | | | 38,128 | | | | 40,151 | |
FNMA (12 Month LIBOR +1.82%)± | | | 4.36 | | | | 9-1-2040 | | | | 545,804 | | | | 578,737 | |
FNMA (1 Year Treasury Constant Maturity +2.26%)± | | | 4.39 | | | | 8-1-2036 | | | | 880,668 | | | | 933,699 | |
FNMA (12 Month Treasury Average +2.29%)± | | | 4.45 | | | | 10-1-2036 | | | | 684,200 | | | | 718,558 | |
FNMA (12 Month Treasury Average +2.42%)± | | | 4.53 | | | | 7-1-2036 | | | | 644,653 | | | | 679,630 | |
FNMA | | | 5.50 | | | | 3-1-2023 | | | | 231,704 | | | | 240,970 | |
FNMA | | | 6.00 | | | | 4-1-2021 | | | | 10,816 | | | | 10,940 | |
FNMA | | | 6.00 | | | | 3-1-2033 | | | | 297,051 | | | | 332,189 | |
FNMA | | | 6.50 | | | | 8-1-2031 | | | | 157,558 | | | | 186,672 | |
FNMA | | | 8.00 | | | | 9-1-2023 | | | | 553 | | | | 557 | |
FNMA | | | 9.00 | | | | 11-1-2024 | | | | 26,763 | | | | 28,939 | |
FNMA Grantor Trust Series2002-T12 Class A4 | | | 9.50 | | | | 5-25-2042 | | | | 459,180 | | | | 544,488 | |
FNMA Series2002-T1 Class A4 | | | 9.50 | | | | 11-25-2031 | | | | 26,751 | | | | 32,670 | |
FNMA Series2003-41 Class PE | | | 5.50 | | | | 5-25-2023 | | | | 141,600 | | | | 147,678 | |
FNMA Series2003-W11 Class A1±± | | | 4.79 | | | | 6-25-2033 | | | | 5,410 | | | | 5,659 | |
FNMA Series2003-W6 Class 6A±± | | | 4.17 | | | | 8-25-2042 | | | | 511,795 | | | | 532,229 | |
FNMA Series2003-W6 Class PT4±± | | | 8.29 | | | | 10-25-2042 | | | | 52,582 | | | | 64,861 | |
FNMA Series2005-84 Class MB | | | 5.75 | | | | 10-25-2035 | | | | 272,992 | | | | 305,358 | |
FNMA Series2006-W1 Class 2AF2 (1 Month LIBOR +0.19%)± | | | 1.82 | | | | 2-25-2046 | | | | 1,029,555 | | | | 1,013,209 | |
FNMA Series2008-53 Class CA | | | 5.00 | | | | 7-25-2023 | | | | 66 | | | | 66 | |
FNMA Series2010-37 Class A1 | | | 5.41 | | | | 5-25-2035 | | | | 1,209,955 | | | | 1,272,203 | |
GNMA | | | 4.50 | | | | 4-20-2035 | | | | 69,910 | | | | 74,268 | |
GNMA | | | 8.00 | | | | 12-15-2023 | | | | 8,509 | | | | 9,117 | |
GNMA | | | 9.00 | | | | 11-15-2024 | | | | 1,059 | | | | 1,063 | |
GNMA Series2017-H13 Class FJ (1 Month LIBOR +0.20%)± | | | 1.93 | | | | 5-20-2067 | | | | 21,521 | | | | 21,506 | |
GNMA Series2017-H16 Class FD (1 Month LIBOR +0.20%)± | | | 1.93 | | | | 8-20-2067 | | | | 66,833 | | | | 66,819 | |
| |
Total Agency Securities (Cost $15,593,720) | | | | 16,265,355 | |
| | | | | |
The accompanying notes are an integral part of these financial statements.
Wells Fargo Short-Term Bond Fund | 7
Portfolio of investments—February 29, 2020 (unaudited)
| | | | | | | | | | | | | | | | |
| | | Interest
rate | | | Maturity
date | | | Principal | | | Value | |
Asset-Backed Securities: 15.30% | |
California Republic Auto Receivables Trust Series2017-1 Class A4 | | | 2.28 | % | | | 6-15-2022 | | | $ | 1,774,242 | | | $ | 1,778,334 | |
Chesapeake Funding II LLC Series2017-3A Class A1 144A | | | 1.91 | | | | 8-15-2029 | | | | 1,007,900 | | | | 1,009,591 | |
CPS Auto Trust Series2018-C Class A 144A | | | 2.87 | | | | 9-15-2021 | | | | 78,928 | | | | 78,965 | |
Dell Equipment Finance Trust Series2018-1 Class A2A 144A | | | 2.97 | | | | 10-22-2020 | | | | 735,447 | | | | 736,213 | |
Drive Auto Receivables Trust Series2018-3 Class C | | | 3.72 | | | | 9-16-2024 | | | | 1,000,000 | | | | 1,007,731 | |
DT Auto Owner Trust Series2017-2A Class D 144A | | | 3.89 | | | | 1-15-2023 | | | | 410,310 | | | | 413,833 | |
Education Loan Asset-Backed Trust Series2013-1 Class A1 (1 Month LIBOR +0.80%) 144A± | | | 2.43 | | | | 6-25-2026 | | | | 384,169 | | | | 384,775 | |
Educational Services of America Incorporated Series2015-2 Class A (1 Month LIBOR +1.00%) 144A± | | | 2.63 | | | | 12-25-2056 | | | | 891,007 | | | | 893,283 | |
Enterprise Fleet Financing Trust Series2017-1 Class A2 144A | | | 2.13 | | | | 7-20-2022 | | | | 164,464 | | | | 164,554 | |
Enterprise Fleet Financing Trust Series2017-2 Class A2 144A | | | 1.97 | | | | 1-20-2023 | | | | 1,027,816 | | | | 1,028,388 | |
Fifth Third Auto Trust Series2019-1 Class A2A | | | 2.66 | | | | 5-16-2022 | | | | 1,376,960 | | | | 1,383,736 | |
Flagship Credit Auto Trust Series2018-2 Class A 144A | | | 2.97 | | | | 10-17-2022 | | | | 673,282 | | | | 676,378 | |
Ford Credit Auto Owner Trust Series2017-A Class A4 | | | 1.92 | | | | 4-15-2022 | | | | 3,610,000 | | | | 3,618,908 | |
Ford Credit Floorplan Master Owner Trust LLC Series2017-1 Class A1 | | | 2.07 | | | | 5-15-2022 | | | | 2,995,000 | | | | 2,997,696 | |
GM Financial Consumer Automobile Receivables Trust Series2017-2A Class A3 144A | | | 1.86 | | | | 12-16-2021 | | | | 1,494,806 | | | | 1,496,319 | |
GM Financial Securitized Term Trust Series2018-4 Class C | | | 3.62 | | | | 6-17-2024 | | | | 300,000 | | | | 315,955 | |
Hertz Vehicle Financing LLC Series2015-1A Class A 144A | | | 2.73 | | | | 3-25-2021 | | | | 5,000,000 | | | | 5,003,302 | |
Hertz Vehicle Financing LLC Series2019-1A Class A 144A | | | 3.71 | | | | 3-25-2023 | | | | 2,280,000 | | | | 2,378,268 | |
Hertz Vehicle Financing LLC Series2019-1A Class B 144A | | | 4.10 | | | | 3-25-2023 | | | | 1,500,000 | | | | 1,557,999 | |
Home Equity Asset Trust Series2003-6 Class M1 (1 Month LIBOR +1.05%)± | | | 2.68 | | | | 2-25-2034 | | | | 827,169 | | | | 823,144 | |
Honda Auto Receivables Owner Trust Series2016-4 Class A4 | | | 1.36 | | | | 1-18-2023 | | | | 3,435,000 | | | | 3,434,523 | |
Honda Auto Receivables Owner Trust Series2018-4 Class A3 | | | 3.16 | | | | 1-17-2023 | | | | 3,565,000 | | | | 3,639,112 | |
Hyundai Auto Lease Securitization Trust Series2020-A Class A2 144A | | | 1.90 | | | | 5-16-2022 | | | | 2,000,000 | | | | 2,011,359 | |
Jimmy John’s Funding LLC Series2017-1A Class A2I 144A | | | 3.61 | | | | 7-30-2047 | | | | 1,218,750 | | | | 1,232,120 | |
MMAF Equipment Finance LLC Series2019-A Class A2 144A | | | 2.84 | | | | 1-10-2022 | | | | 1,538,645 | | | | 1,548,516 | |
Santander Drive Auto Receivables Trust Series2017-1 Class D | | | 3.17 | | | | 4-17-2023 | | | | 2,470,000 | | | | 2,501,567 | |
SLC Student Loan Trust Series2006-2 Class A5 (3 Month LIBOR +0.10%)± | | | 1.99 | | | | 9-15-2026 | | | | 737,905 | | | | 737,197 | |
SLM Student Loan Trust Series 2007- 4 Class B1 (3 Month LIBOR +0.14%)± | | | 1.93 | | | | 7-25-2025 | | | | 648,448 | | | | 646,567 | |
SLM Student Loan Trust Series2011-1 Class A1 (1 Month LIBOR +0.52%)± | | | 2.15 | | | | 3-25-2026 | | | | 74,330 | | | | 74,354 | |
SLM Student Loan Trust Series2011-2 Class A1 (1 Month LIBOR +0.60%)± | | | 2.23 | | | | 11-25-2027 | | | | 178,075 | | | | 178,394 | |
SLM Student Loan Trust Series2012-3 Class A (1 Month LIBOR +0.65%)± | | | 2.28 | | | | 12-27-2038 | | | | 1,737,678 | | | | 1,728,216 | |
SLM Student Loan Trust Series2013-1 Class A3 (1 Month LIBOR +0.55%)± | | | 2.18 | | | | 5-26-2055 | | | | 884,813 | | | | 879,854 | |
SLM Student Loan Trust Series2014-A Class B 144A | | | 3.50 | | | | 11-15-2044 | | | | 2,500,000 | | | | 2,549,543 | |
SOFI Professional Loan Program LLC Series 2016- A Class A1 (1 Month LIBOR +1.75%) 144A± | | | 3.38 | | | | 8-25-2036 | | | | 1,451,850 | | | | 1,476,979 | |
Student Loan Consolidation Center Series2011-1 Class A (1 Month LIBOR +1.22%) 144A± | | | 2.85 | | | | 10-25-2027 | | | | 1,163,784 | | | | 1,167,285 | |
Tesla Auto Lease Trust Series2018-B Class A 144A | | | 3.71 | | | | 8-20-2021 | | | | 664,839 | | | | 675,600 | |
Towd Point Asset Trust Series2018-SL1 Class A (1 Month LIBOR
+0.60%) 144A± | | | 2.23 | | | | 1-25-2046 | | | | 1,806,409 | | | | 1,798,559 | |
Toyota Auto Receivables Owner Trust Series2018-D Class A3 | | | 3.18 | | | | 3-15-2023 | | | | 1,365,000 | | | | 1,393,255 | |
Toyota Auto Receivables Owner Trust Series 2019- B Class A2A | | | 2.59 | | | | 2-15-2022 | | | | 2,813,782 | | | | 2,826,976 | |
Verizon Owner Trust Series2017-1A Class A 144A | | | 2.06 | | | | 9-20-2021 | | | | 212,227 | | | | 212,350 | |
Volvo Financial Equipment LLC Series2018-AA Class A (1 Month LIBOR +0.52%) 144A± | | | 2.18 | | | | 7-17-2023 | | | | 2,240,000 | | | | 2,246,885 | |
Westlake Automobile Receivables Trust Series2018-2A Class B 144A | | | 3.20 | | | | 1-16-2024 | | | | 1,300,000 | | | | 1,304,101 | |
Westlake Automobile Receivables Trust Series2019-2A Class A2A 144A | | | 2.57 | | | | 2-15-2023 | | | | 3,565,590 | | | | 3,587,605 | |
Wheels SPV LLC Series2018-1A Class A2 144A | | | 3.06 | | | | 4-20-2027 | | | | 706,474 | | | | 711,575 | |
World Omni Automobile Lease Southeast Series2019-A Class A4 | | | 3.01 | | | | 7-15-2024 | | | | 1,710,000 | | | | 1,753,254 | |
World Omni Automobiles Lease Securitization Trust Series2018-B Class A3 | | | 3.19 | | | | 12-15-2021 | | | | 4,395,000 | | | | 4,463,795 | |
| |
Total Asset-Backed Securities (Cost $72,141,520) | | | | 72,526,913 | |
| | | | | |
The accompanying notes are an integral part of these financial statements.
8 | Wells Fargo Short-Term Bond Fund
Portfolio of investments—February 29, 2020 (unaudited)
| | | | | | | | | | | | | | | | |
| | | Interest
rate | | | Maturity
date | | | Principal | | | Value | |
Corporate Bonds and Notes: 34.97% | |
|
Communication Services: 3.57% | |
|
| Diversified Telecommunication Services: 1.27% | |
AT&T Incorporated | | | 2.80 | % | | | 2-17-2021 | | | $ | 1,910,000 | | | $ | 1,925,651 | |
Broadcom Corporation | | | 3.00 | | | | 1-15-2022 | | | | 1,415,000 | | | | 1,442,842 | |
CyrusOne LP | | | 2.90 | | | | 11-15-2024 | | | | 2,630,000 | | | | 2,664,690 | |
| |
| | | | 6,033,183 | |
| | | | | |
|
| Media: 2.14% | |
Charter Communications Operating LLC | | | 3.58 | | | | 7-23-2020 | | | | 3,000,000 | | | | 3,016,732 | |
Discovery Communications LLC | | | 3.50 | | | | 6-15-2022 | | | | 2,025,000 | | | | 2,098,532 | |
Fox Corporation 144A | | | 4.03 | | | | 1-25-2024 | | | | 1,070,000 | | | | 1,157,150 | |
Interpublic Group Companies | | | 3.75 | | | | 2-15-2023 | | | | 2,025,000 | | | | 2,151,435 | |
NBCUniversal Enterprise Incorporated 144A | | | 5.25 | | | | 3-19-2021 | | | | 1,655,000 | | | | 1,702,168 | |
| |
| | | | 10,126,017 | |
| | | | | |
|
| Wireless Telecommunication Services: 0.16% | |
Sprint Spectrum Company LLC 144A | | | 3.36 | | | | 3-20-2023 | | | | 770,000 | | | | 776,237 | |
| | | | | | | | | | | | | | | | |
|
Consumer Discretionary: 1.46% | |
|
| Household Durables: 0.51% | |
D.R. Horton Incorporated | | | 4.75 | | | | 2-15-2023 | | | | 2,000,000 | | | | 2,165,053 | |
Lennar Corporation | | | 4.75 | | | | 11-15-2022 | | | | 251,000 | | | | 262,656 | |
| |
| | | | 2,427,709 | |
| | | | | |
|
| Internet & Direct Marketing Retail: 0.16% | |
Amazon.com Incorporated | | | 1.90 | | | | 8-21-2020 | | | | 765,000 | | | | 765,948 | |
| | | | | | | | | | | | | | | | |
|
| Multiline Retail: 0.51% | |
Macy’s Retail Holdings Incorporated | | | 3.45 | | | | 1-15-2021 | | | | 2,405,000 | | | | 2,429,452 | |
| | | | | | | | | | | | | | | | |
|
| Specialty Retail: 0.28% | |
Group 1 Automotive Incorporated | | | 5.00 | | | | 6-1-2022 | | | | 1,300,000 | | | | 1,295,143 | |
| | | | | | | | | | | | | | | | |
|
Consumer Staples: 2.28% | |
|
| Food Products: 1.16% | |
Conagra Brands Incorporated | | | 3.80 | | | | 10-22-2021 | | | | 1,440,000 | | | | 1,496,864 | |
General Mills Incorporated | | | 3.20 | | | | 4-16-2021 | | | | 1,800,000 | | | | 1,841,713 | |
Land O’Lakes Incorporated 144A | | | 6.00 | | | | 11-15-2022 | | | | 2,000,000 | | | | 2,145,876 | |
| |
| | | | 5,484,453 | |
| | | | | |
|
| Tobacco: 1.12% | |
Altria Group Incorporated | | | 2.85 | | | | 8-9-2022 | | | | 2,805,000 | | | | 2,881,787 | |
BAT Capital Corporation | | | 2.79 | | | | 9-6-2024 | | | | 2,350,000 | | | | 2,416,287 | |
| |
| | | | 5,298,074 | |
| | | | | |
|
Energy: 1.95% | |
|
| Oil, Gas & Consumable Fuels: 1.95% | |
Baker Hughes LLC | | | 2.77 | | | | 12-15-2022 | | | | 1,360,000 | | | | 1,390,504 | |
Energy Transfer Partners LP | | | 5.20 | | | | 2-1-2022 | | | | 2,060,000 | | | | 2,168,843 | |
EQT Corporation « | | | 3.00 | | | | 10-1-2022 | | | | 1,155,000 | | | | 967,313 | |
Occidental Petroleum Corporation | | | 2.90 | | | | 8-15-2024 | | | | 2,365,000 | | | | 2,396,967 | |
Rockies Express Pipeline LLC 144A | | | 5.63 | | | | 4-15-2020 | | | | 2,300,000 | | | | 2,307,062 | |
| |
| | | | 9,230,689 | |
| | | | | |
The accompanying notes are an integral part of these financial statements.
Wells Fargo Short-Term Bond Fund | 9
Portfolio of investments—February 29, 2020 (unaudited)
| | | | | | | | | | | | | | | | |
| | | Interest
rate | | | Maturity
date | | | Principal | | | Value | |
Financials: 14.67% | |
|
| Banks: 4.26% | |
Bank of America NA (3 Month LIBOR +0.65%)± | | | 3.34 | % | | | 1-25-2023 | | | $ | 4,000,000 | | | $ | 4,132,619 | |
Citibank NA | | | 3.40 | | | | 7-23-2021 | | | | 2,000,000 | | | | 2,047,553 | |
Citibank NA (3 Month LIBOR +0.60%)± | | | 2.84 | | | | 5-20-2022 | | | | 2,000,000 | | | | 2,028,308 | |
Citizens Bank | | | 2.20 | | | | 5-26-2020 | | | | 2,000,000 | | | | 2,001,695 | |
Credit Suisse New York | | | 2.10 | | | | 11-12-2021 | | | | 1,115,000 | | | | 1,126,102 | |
HSBC Bank USA NA | | | 4.88 | | | | 8-24-2020 | | | | 3,000,000 | | | | 3,045,329 | |
JPMorgan Chase & Company (3 Month LIBOR +0.70%)± | | | 3.21 | | | | 4-1-2023 | | | | 1,080,000 | | | | 1,114,575 | |
JPMorgan Chase & Company (3 Month LIBOR +0.61%)± | | | 3.51 | | | | 6-18-2022 | | | | 1,000,000 | | | | 1,024,475 | |
Synchrony Bank | | | 3.65 | | | | 5-24-2021 | | | | 1,075,000 | | | | 1,101,478 | |
US Bank NA | | | 2.05 | | | | 10-23-2020 | | | | 2,540,000 | | | | 2,547,918 | |
| |
| | | | 20,170,052 | |
| | | | | |
|
| Capital Markets: 1.50% | |
Goldman Sachs Group Incorporated (3 Month LIBOR +0.82%)± | | | 2.88 | | | | 10-31-2022 | | | | 2,900,000 | | | | 2,957,418 | |
Morgan Stanley | | | 2.75 | | | | 5-19-2022 | | | | 4,023,000 | | | | 4,133,325 | |
| |
| | | | 7,090,743 | |
| | | | | |
|
| Consumer Finance: 4.57% | |
American Express Company | | | 3.40 | | | | 2-27-2023 | | | | 1,120,000 | | | | 1,178,740 | |
Capital One Financial Corporation | | | 2.50 | | | | 5-12-2020 | | | | 3,000,000 | | | | 3,002,220 | |
Daimler Finance North America LLC 144A | | | 2.20 | | | | 5-5-2020 | | | | 520,000 | | | | 520,327 | |
Daimler Finance North America LLC 144A | | | 3.00 | | | | 2-22-2021 | | | | 2,850,000 | | | | 2,881,369 | |
Ford Motor Credit Company LLC (3 Month LIBOR +0.88%)± | | | 2.73 | | | | 10-12-2021 | | | | 1,160,000 | | | | 1,147,136 | |
Ford Motor Credit Company LLC | | | 3.20 | | | | 1-15-2021 | | | | 1,335,000 | | | | 1,343,841 | |
General Motors Financial Company | | | 3.45 | | | | 4-10-2022 | | | | 3,000,000 | | | | 3,075,781 | |
Hyundai Capital America Company 144A | | | 2.38 | | | | 2-10-2023 | | | | 3,385,000 | | | | 3,414,020 | |
Nissan Motor Acceptance Corporation 144A | | | 3.88 | | | | 9-21-2023 | | | | 2,030,000 | | | | 2,164,408 | |
Volkswagen Group of America Finance LLC 144A | | | 2.70 | | | | 9-26-2022 | | | | 1,600,000 | | | | 1,636,276 | |
Western Union Company | | | 2.85 | | | | 1-10-2025 | | | | 1,285,000 | | | | 1,321,351 | |
| |
| | | | 21,685,469 | |
| | | | | |
|
| Diversified Financial Services: 1.02% | |
IBM Credit LLC | | | 3.45 | | | | 11-30-2020 | | | | 2,590,000 | | | | 2,630,363 | |
WEA Finance LLC 144A | | | 3.25 | | | | 10-5-2020 | | | | 2,205,000 | | | | 2,221,246 | |
| |
| | | | 4,851,609 | |
| | | | | |
|
| Insurance: 3.32% | |
Athene Global Funding 144A | | | 2.50 | | | | 1-14-2025 | | | | 2,705,000 | | | | 2,775,443 | |
Axis Specialty Finance LLC | | | 5.88 | | | | 6-1-2020 | | | | 1,794,000 | | | | 1,813,393 | |
Jackson National Life Global Company 144A | | | 3.30 | | | | 6-11-2021 | | | | 2,340,000 | | | | 2,396,829 | |
Jackson National Life Global Company 144A | | | 2.50 | | | | 6-27-2022 | | | | 5,000,000 | | | | 5,088,354 | |
OneBeacon US Holdings Incorporated | | | 4.60 | | | | 11-9-2022 | | | | 2,075,000 | | | | 2,216,044 | |
Protective Life Global Funding 144A | | | 2.26 | | | | 4-8-2020 | | | | 1,450,000 | | | | 1,451,110 | |
| |
| | | | 15,741,173 | |
| | | | | |
|
Health Care: 3.84% | |
|
| Biotechnology: 1.07% | |
AbbVie Incorporated 144A | | | 2.30 | | | | 11-21-2022 | | | | 2,905,000 | | | | 2,953,492 | |
AbbVie Incorporated | | | 3.38 | | | | 11-14-2021 | | | | 2,065,000 | | | | 2,127,433 | |
| |
| | | | 5,080,925 | |
| | | | | |
The accompanying notes are an integral part of these financial statements.
10 | Wells Fargo Short-Term Bond Fund
Portfolio of investments—February 29, 2020 (unaudited)
| | | | | | | | | | | | | | | | |
| | | Interest
rate | | | Maturity
date | | | Principal | | | Value | |
| Health Care Providers & Services: 2.05% | |
Anthem Incorporated | | | 2.50 | % | | | 11-21-2020 | | | $ | 1,235,000 | | | $ | 1,241,257 | |
Cigna Corporation 144A | | | 4.00 | | | | 2-15-2022 | | | | 2,095,000 | | | | 2,173,291 | |
CVS Health Corporation | | | 2.63 | | | | 8-15-2024 | | | | 1,520,000 | | | | 1,569,966 | |
CVS Health Corporation | | | 2.80 | | | | 7-20-2020 | | | | 2,360,000 | | | | 2,366,851 | |
Dignity Health | | | 3.13 | | | | 11-1-2022 | | | | 2,255,000 | | | | 2,344,554 | |
| |
| | | | 9,695,919 | |
| | | | | |
|
| Pharmaceuticals: 0.72% | |
EMD Finance LLC 144A | | | 2.40 | | | | 3-19-2020 | | | | 1,925,000 | | | | 1,925,481 | |
Teva Pharmaceutical Finance LLC | | | 2.25 | | | | 3-18-2020 | | | | 1,500,000 | | | | 1,496,250 | |
| |
| | | | 3,421,731 | |
| | | | | |
|
Industrials: 2.61% | |
|
| Aerospace & Defense: 1.31% | |
Boeing Capital Corporation | | | 1.88 | | | | 6-15-2023 | | | | 3,000,000 | | | | 3,006,012 | |
Spirit AeroSystems Incorporated (3 Month LIBOR +0.80%)± | | | 2.69 | | | | 6-15-2021 | | | | 2,500,000 | | | | 2,475,328 | |
The Boeing Company | | | 2.70 | | | | 5-1-2022 | | | | 710,000 | | | | 726,285 | |
| |
| | | | 6,207,625 | |
| | | | | |
|
| Airlines: 0.43% | |
Delta Air Lines Incorporated | | | 3.40 | | | | 4-19-2021 | | | | 1,000,000 | | | | 1,018,369 | |
Delta Air Lines Incorporated | | | 4.75 | | | | 11-7-2021 | | | | 1,021,371 | | | | 1,027,351 | |
| |
| | | | 2,045,720 | |
| | | | | |
|
| Industrial Conglomerates: 0.76% | |
General Electric Company | | | 2.50 | | | | 3-28-2020 | | | | 3,000,000 | | | | 2,997,900 | |
General Electric Company | | | 4.63 | | | | 1-7-2021 | | | | 605,000 | | | | 620,849 | |
| |
| | | | 3,618,749 | |
| | | | | |
|
| Professional Services: 0.11% | |
Equifax Incorporated | | | 3.60 | | | | 8-15-2021 | | | | 500,000 | | | | 513,597 | |
| | | | | | | | | | | | | | | | |
|
Information Technology: 0.65% | |
|
| Technology Hardware, Storage & Peripherals: 0.65% | |
Apple Incorporated | | | 2.15 | | | | 2-9-2022 | | | | 3,000,000 | | | | 3,055,409 | |
| | | | | | | | | | | | | | | | |
|
Materials: 0.71% | |
|
| Chemicals: 0.46% | |
DowDuPont Incorporated | | | 4.21 | | | | 11-15-2023 | | | | 2,010,000 | | | | 2,183,454 | |
| | | | | | | | | | | | | | | | |
|
| Metals & Mining: 0.25% | |
Freeport-McMoRan Incorporated | | | 3.55 | | | | 3-1-2022 | | | | 1,155,000 | | | | 1,165,280 | |
| | | | | | | | | | | | | | | | |
|
Real Estate: 0.87% | |
|
| Equity REITs: 0.44% | |
DDR Corporation | | | 4.63 | | | | 7-15-2022 | | | | 739,000 | | | | 787,022 | |
Omega Healthcare Investors Incorporated | | | 4.95 | | | | 4-1-2024 | | | | 1,160,000 | | | | 1,288,373 | |
| |
| | | | 2,075,395 | |
| | | | | |
|
| Real Estate Management & Development: 0.43% | |
Washington Prime Group Incorporated « | | | 3.85 | | | | 4-1-2020 | | | | 2,065,000 | | | | 2,065,000 | |
| | | | | | | | | | | | | | | | |
The accompanying notes are an integral part of these financial statements.
Wells Fargo Short-Term Bond Fund | 11
Portfolio of investments—February 29, 2020 (unaudited)
| | | | | | | | | | | | | | | | |
| | | Interest
rate | | | Maturity
date | | | Principal | | | Value | |
Utilities: 2.36% | |
|
| Electric Utilities: 1.54% | |
DPL Incorporated | | | 7.25 | % | | | 10-15-2021 | | | $ | 855,000 | | | $ | 884,925 | |
Exelon Corporation | | | 3.50 | | | | 6-1-2022 | | | | 1,895,000 | | | | 1,966,617 | |
Georgia Power Company | | | 2.10 | | | | 7-30-2023 | | | | 2,350,000 | | | | 2,392,308 | |
NV Energy Incorporated | | | 6.25 | | | | 11-15-2020 | | | | 2,000,000 | | | | 2,062,638 | |
| |
| | | | 7,306,488 | |
| | | | | |
|
| Independent Power & Renewable Electricity Producers: 0.27% | |
The AES Corporation | | | 4.50 | | | | 3-15-2023 | | | | 1,300,000 | | | | 1,293,526 | |
| | | | | | | | | | | | | | | | |
|
| Multi-Utilities: 0.55% | |
Dominion Energy Incorporated | | | 2.72 | | | | 8-15-2021 | | | | 1,170,000 | | | | 1,188,687 | |
DTE Energy Company | | | 2.53 | | | | 10-1-2024 | | | | 1,360,000 | | | | 1,403,325 | |
| |
| | | | 2,592,012 | |
| | | | | |
| |
Total Corporate Bonds and Notes (Cost $162,545,329) | | | | 165,726,781 | |
| | | | | |
|
Municipal Obligations: 1.37% | |
|
Georgia: 0.23% | |
|
| Health Revenue: 0.23% | |
Georgia Medical Center Hospital Authority Taxable Refunding Bond | | | 4.88 | | | | 8-1-2022 | | | | 1,000,000 | | | | 1,064,790 | |
| | | | | | | | | | | | | | | | |
|
Illinois: 0.13% | |
|
| Tax Revenue: 0.13% | |
Chicago IL Retiree Health Series B | | | 6.30 | | | | 12-1-2021 | | | | 600,000 | | | | 633,858 | |
| | | | | | | | | | | | | | | | |
|
Indiana: 0.29% | |
|
| Education Revenue: 0.29% | |
Indiana Secondary Market for Education Loans Incorporated (1 Month LIBOR +0.80%)± | | | 2.43 | | | | 2-25-2044 | | | | 1,355,589 | | | | 1,353,407 | |
| | | | | | | | | | | | | | | | |
|
New Jersey: 0.43% | |
|
| Miscellaneous Revenue: 0.43% | |
New Jersey Transportation Trust Fund Authority System Series B | | | 2.55 | | | | 6-15-2023 | | | | 2,000,000 | | | | 2,056,540 | |
| | | | | | | | | | | | | | | | |
|
Pennsylvania: 0.20% | |
|
| Miscellaneous Revenue: 0.20% | |
Philadelphia PA IDA Pension Funding Series B (Ambac Insured) ¤ | | | 0.00 | | | | 4-15-2021 | | | | 970,000 | | | | 952,123 | |
| | | | | | | | | | | | | | | | |
|
Rhode Island: 0.09% | |
|
| Industrial Development Revenue: 0.09% | |
Rhode Island EDA (AGM Insured) | | | 7.75 | | | | 11-1-2020 | | | | 400,000 | | | | 412,432 | |
| | | | | | | | | | | | | | | | |
| |
Total Municipal Obligations (Cost $6,328,268) | | | | 6,473,150 | |
| | | | | |
|
Non-Agency Mortgage-Backed Securities: 25.36% | |
Angel Oak Mortgage Trust I LLC Series2019-3 Class A1 144A±± | | | 2.93 | | | | 5-25-2059 | | | | 776,663 | | | | 781,933 | |
Barclays Commercial Mortgage Trust Series2015-STP Class A 144A | | | 3.32 | | | | 9-10-2028 | | | | 1,426,788 | | | | 1,433,455 | |
BDS Limited Series2018-FL2 Class A (1 Month LIBOR +0.95%) 144A± | | | 2.61 | | | | 8-15-2035 | | | | 868,308 | | | | 867,225 | |
Benefit Street Partners CLO Limited Series2014-IVA Class A1RR (3 Month LIBOR +1.25%) 144A± | | | 3.07 | | | | 1-20-2029 | | | | 2,300,000 | | | | 2,300,863 | |
BlueMountain CLO Limited Series2012-2A Class AR2 (3 Month LIBOR +1.05%) 144A± | | | 2.74 | | | | 11-20-2028 | | | | 1,400,000 | | | | 1,400,343 | |
The accompanying notes are an integral part of these financial statements.
12 | Wells Fargo Short-Term Bond Fund
Portfolio of investments—February 29, 2020 (unaudited)
| | | | | | | | | | | | | | | | |
| | | Interest
rate | | | Maturity
date | | | Principal | | | Value | |
Non-Agency Mortgage-Backed Securities (continued) | |
Bunker Hill Loan Depositary Trust Series2019-3 Class A1 144A | | | 2.72 | % | | | 11-25-2059 | | | $ | 1,699,996 | | | $ | 1,717,878 | |
Cascade Funding Mortgage Trust Series 2018-RM2 Class A 144A±± | | | 4.00 | | | | 10-25-2068 | | | | 452,239 | | | | 472,149 | |
CCG Receivables Trust LLC Series2018-1 Class A2 144A | | | 2.50 | | | | 6-16-2025 | | | | 576,582 | | | | 579,181 | |
CD Commercial Mortgage Trust Series2017-CD3 Class A1 | | | 1.97 | | | | 2-10-2050 | | | | 756,578 | | | | 758,738 | |
CGDBB Commercial Mortgage Trust Series 2017-BIOC Class A (1 Month LIBOR +0.79%) 144A± | | | 2.45 | | | | 7-15-2032 | | | | 2,603,599 | | | | 2,603,596 | |
CIFC Funding Limited Series2012-2RA Class A1 (3 Month LIBOR +0.80%) 144A± | | | 2.62 | | | | 1-20-2028 | | | | 2,440,000 | | | | 2,440,044 | |
Citigroup Commercial Mortgage Trust Series2016-P5 Class A2 | | | 2.40 | | | | 10-10-2049 | | | | 128,000 | | | | 129,496 | |
Citigroup Commercial Mortgage Trust Series 2017-MDRB Class A (1 Month LIBOR +1.10%) 144A± | | | 2.76 | | | | 7-15-2030 | | | | 805,175 | | | | 799,323 | |
CNH Equipment Trust Series2019-A Class A2 | | | 2.96 | | | | 5-16-2022 | | | | 1,740,639 | | | | 1,751,831 | |
Colt Funding LLC Series2018-3 Class A1 144A±± | | | 3.69 | | | | 10-26-2048 | | | | 774,413 | | | | 777,953 | |
Colt Funding LLC Series2019-1 Class A1 144A±± | | | 3.71 | | | | 3-25-2049 | | | | 1,403,084 | | | | 1,428,023 | |
Commercial Mortgage Trust Series2012-CR1 Class ASB | | | 3.05 | | | | 5-15-2045 | | | | 1,325,968 | | | | 1,343,382 | |
Commercial Mortgage Trust Series2012-CR4 Class A | | | 3.25 | | | | 10-15-2045 | | | | 2,000,000 | | | | 2,031,609 | |
Commercial Mortgage Trust Series 2014-CR14 Class B±± | | | 4.63 | | | | 2-10-2047 | | | | 680,000 | | | | 751,275 | |
Commercial Mortgage Trust Series 2014-LC17 Class A2 | | | 3.16 | | | | 10-10-2047 | | | | 211,612 | | | | 212,127 | |
Commercial Mortgage Trust Series 2015-CR27 Class A1 | | | 1.58 | | | | 10-10-2048 | | | | 425,357 | | | | 424,926 | |
Commercial Mortgage Trust Series2015-DC1 Class A3 | | | 3.22 | | | | 2-10-2048 | | | | 1,500,000 | | | | 1,537,741 | |
ContiMortgage Home Equity Trust Series1996-2 Class IO±±(c) | | | 0.00 | | | | 7-15-2027 | | | | 564,910 | | | | 10,559 | |
Countrywide Home Loans Mortgage Pass-Through Trust Series 2001-HYB1 Class 2A1±± | | | 3.60 | | | | 6-19-2031 | | | | 94,754 | | | | 95,509 | |
Credit Suisse Mortgage Trust Series 2019-SKLZ Class A (1 Month LIBOR +1.25%) 144A± | | | 2.91 | | | | 1-15-2034 | | | | 1,400,000 | | | | 1,400,410 | |
Credit Suisse Mortgage Trust Series 2020-AFC1 Class A3 144A±± | | | 2.51 | | | | 2-25-2050 | | | | 2,770,106 | | | | 2,796,332 | |
Crown Point Limited Series2018-6A Class A1 (3 Month LIBOR +1.17%) 144A± | | | 2.99 | | | | 10-20-2028 | | | | 2,350,000 | | | | 2,350,273 | |
CSAIL Commercial Mortgage Trust Series2016-C5 Class A4 | | | 3.49 | | | | 11-15-2048 | | | | 2,430,000 | | | | 2,561,782 | |
CSAIL Commercial Mortgage Trust Series2019-C15 Class A1 | | | 2.99 | | | | 3-15-2052 | | | | 368,842 | | | | 380,494 | |
Deephaven Residential Mortgage Series2019-4A Class A1 144A±± | | | 2.79 | | | | 10-25-2059 | | | | 1,327,690 | | | | 1,335,730 | |
Deutsche Bank UBS Securities Mortgage Trust Series 2011-LC2A Class A4 144A | | | 4.54 | | | | 7-10-2044 | | | | 704,369 | | | | 721,280 | |
DLL Securitization Trust Series2019-MT3 Class A1 144A | | | 2.06 | | | | 10-20-2020 | | | | 534,005 | | | | 534,591 | |
EquiFirst Mortgage Loan Trust Series2003-2 Class 3A3 (1 Month LIBOR +1.13%)± | | | 2.78 | | | | 9-25-2033 | | | | 237,634 | | | | 234,804 | |
FWD Securitization Trust Class 2020-INV1 Class A3 144A±± | | | 2.44 | | | | 1-25-2050 | | | | 2,835,136 | | | | 2,842,849 | |
GCAT Series 2019-NQM1 Class A1 144A | | | 2.99 | | | | 2-25-2059 | | | | 2,290,168 | | | | 2,313,451 | |
GCAT Series 2019-NQM2 Class A1 144A | | | 2.86 | | | | 9-25-2059 | | | | 1,991,085 | | | | 2,012,132 | |
Golden National Mortgage Asset-Backed Certificates Series1998-GN1 Class M2 | | | 1.00 | | | | 2-25-2027 | | | | 34,322 | | | | 34,535 | |
Great Wolf Trust Series 2019-WOLF Class A (1 Month LIBOR +1.03%) 144A± | | | 2.69 | | | | 12-15-2036 | | | | 2,150,000 | | | | 2,150,004 | |
GS Mortgage Securities Trust Series2011-GC5 Class A3 | | | 3.82 | | | | 8-10-2044 | | | | 1,119,400 | | | | 1,130,799 | |
GS Mortgage Securities Trust Series2010-C1 Class A2 144A | | | 4.59 | | | | 8-10-2043 | | | | 2,370,223 | | | | 2,379,906 | |
GS Mortgage Securities Trust Series 2012-ALOH Class A 144A | | | 3.55 | | | | 4-10-2034 | | | | 2,414,000 | | | | 2,494,820 | |
GS Mortgage Securities Trust Series2013-G1 Class A2 144A±± | | | 3.56 | | | | 4-10-2031 | | | | 530,140 | | | | 548,985 | |
GS Mortgage Securities Trust Series 2014-GC22 Class A3 | | | 3.52 | | | | 6-10-2047 | | | | 3,031,556 | | | | 3,082,427 | |
GS Mortgage Securities Trust Series2016-GS3 Class A1 | | | 1.43 | | | | 10-10-2049 | | | | 764,175 | | | | 763,348 | |
GS Mortgage Securities Trust Series 2019- PJ1 Class A6 144A±± | | | 4.00 | | | | 8-25-2049 | | | | 516,825 | | | | 522,591 | |
GSMPS Mortgage Loan Trust Series1998-1 Class A 144A±± | | | 8.00 | | | | 9-19-2027 | | | | 144,640 | | | | 145,721 | |
Homeward Opportunities Fund I Trust Series2019-1 Class A1 144A±± | | | 3.45 | | | | 1-25-2059 | | | | 1,536,746 | | | | 1,553,860 | |
Hospitality Mortgage Trust Series 2019 Class A (1 Month LIBOR +1.00%) 144A± | | | 2.66 | | | | 11-15-2036 | | | | 1,976,887 | | | | 1,974,512 | |
JPMorgan Chase Commercial Mortgage Securities Trust Series2012-C8 Class A3 | | | 2.83 | | | | 10-15-2045 | | | | 2,272,322 | | | | 2,340,801 | |
JPMorgan Chase Commercial Mortgage Securities Trust Series 2013-LC11 Class A4 | | | 2.69 | | | | 4-15-2046 | | | | 1,608,504 | | | | 1,663,624 | |
JPMorgan Chase Commercial Mortgage Securities Trust Series2018-PHH Class A (1 Month LIBOR +0.91%) 144A± | | | 2.57 | | | | 6-15-2035 | | | | 1,051,458 | | | | 1,050,712 | |
The accompanying notes are an integral part of these financial statements.
Wells Fargo Short-Term Bond Fund | 13
Portfolio of investments—February 29, 2020 (unaudited)
| | | | | | | | | | | | | | | | |
| | | Interest
rate | | | Maturity
date | | | Principal | | | Value | |
Non-Agency Mortgage-Backed Securities (continued) | |
JPMorgan Chase Commercial Mortgage Securities Trust Series2019-MFP Class A (1 Month LIBOR +0.96%) 144A± | | | 2.62 | % | | | 7-15-2036 | | | $ | 2,500,000 | | | $ | 2,499,997 | |
KKR Financial Holdings LLC (3 Month LIBOR +1.34%) 144A± | | | 3.17 | | | | 4-15-2029 | | | | 2,250,000 | | | | 2,250,257 | |
Lendmark Funding Trust Series2018-1A Class A 144A | | | 3.81 | | | | 12-21-2026 | | | | 1,855,000 | | | | 1,903,709 | |
Lendmark Funding Trust Series2018-2A Class A 144A | | | 4.23 | | | | 4-20-2027 | | | | 160,000 | | | | 167,228 | |
Lendmark Funding Trust Series2019-2A Class A 144A | | | 2.78 | | | | 4-20-2028 | | | | 3,000,000 | | | | 3,066,853 | |
LoanCore Limited Series 2018-CRE1 Class A (1 Month LIBOR +1.13%) 144A± | | | 2.79 | | | | 5-15-2028 | | | | 2,000,000 | | | | 2,001,876 | |
Master Mortgages Trust Series2002-3 Class 4A1±± | | | 4.98 | | | | 10-25-2032 | | | | 1,035 | | | | 1,058 | |
Mello Warehouse Securitization Series2018-W1 Class A (1 Month LIBOR +0.85%) 144A± | | | 2.48 | | | | 11-25-2051 | | | | 1,333,333 | | | | 1,334,812 | |
Mello Warehouse Securitization Series2019-1 Class A (1 Month LIBOR +0.80%) 144A± | | | 2.43 | | | | 6-25-2052 | | | | 2,240,000 | | | | 2,241,496 | |
Morgan Stanley Capital I Trust Series2016-C30 Class A1 | | | 1.39 | | | | 9-15-2049 | | | | 836,203 | | | | 834,658 | |
Neuberger Berman Limited Series2015-20A Class AR (3 Month LIBOR
+0.80%) 144A± | | | 2.63 | | | | 1-15-2028 | | | | 1,340,000 | | | | 1,340,159 | |
New Residential Mortgage Loan Trust Series 2018-NQM1 Class A1 144A±± | | | 3.99 | | | | 11-25-2048 | | | | 1,185,002 | | | | 1,206,308 | |
Oaktree CLO Limited Series15-1A Class A1R (3 Month LIBOR +0.87%) 144A± | | | 2.69 | | | | 10-20-2027 | | | | 1,500,000 | | | | 1,500,221 | |
Ondeck Asset Securitization Trust LLC Series2018-1A Class A 144A | | | 3.50 | | | | 4-18-2022 | | | | 2,320,000 | | | | 2,327,297 | |
Palmer Square Loan Funding Limited Series2018-4A Class A1 (3 Month LIBOR +0.90%) 144A± | | | 2.59 | | | | 11-15-2026 | | | | 1,111,415 | | | | 1,112,073 | |
ReadyCap Commercial Mortgage Trust Series2019-5 Class A 144A | | | 3.78 | | | | 2-25-2052 | | | | 1,287,150 | | | | 1,353,966 | |
Regatta II Funding LP Series2013-2A Class A1R2 (3 Month LIBOR +1.25%) 144A± | | | 3.08 | | | | 1-15-2029 | | | | 2,925,000 | | | | 2,925,796 | |
Salem Fields CLO Limited Series2016-2A Class A (3 Month LIBOR +1.15%) 144A± | | | 2.94 | | | | 10-25-2028 | | | | 1,800,000 | | | | 1,800,241 | |
Shackleton CLO Limited Series2019-15A Class A (3 Month LIBOR +1.25%) 144A± | | | 3.15 | | | | 1-15-2030 | | | | 1,160,000 | | | | 1,161,344 | |
Starwood Mortgage Residential Trust Series2019-1 Class A1 144A±± | | | 2.94 | | | | 6-25-2049 | | | | 1,580,687 | | | | 1,599,119 | |
Starwood Mortgage Residential Trust Series2020-1 Class A3 144A±± | | | 2.56 | | | | 2-25-2050 | | | | 1,542,041 | | | | 1,553,412 | |
TCW CLO2017-1 Limited Series2017-1A Class BR (3 Month LIBOR +1.55%) 144A%%± | | | 3.30 | | | | 7-29-2029 | | | | 2,255,000 | | | | 2,251,615 | |
TCW CLO2019-1 AMR Limited Series2019-1A Class A (3 Month LIBOR +1.44%) 144A± | | | 3.13 | | | | 2-15-2029 | | | | 1,715,000 | | | | 1,716,285 | |
THL Credit Wind River CLO Limited Series2012-1A Class AR2 (3 Month LIBOR +0.88%) 144A± | | | 2.71 | | | | 1-15-2026 | | | | 1,200,945 | | | | 1,201,354 | |
Towd Point Asset Funding LLC Series2019-HE1 Class A1 (1 Month LIBOR +0.90%) 144A± | | | 2.53 | | | | 4-25-2048 | | | | 1,247,937 | | | | 1,251,395 | |
Towd Point Mortgage Trust Series2015-4 Class A2 144A±± | | | 3.75 | | | | 4-25-2055 | | | | 1,245,000 | | | | 1,290,807 | |
Towd Point Mortgage Trust Series2017-1 Class A1 144A±± | | | 2.75 | | | | 10-25-2056 | | | | 1,930,715 | | | | 1,970,620 | |
Towd Point Mortgage Trust Series2017-4 Class A1 144A±± | | | 2.75 | | | | 6-25-2057 | | | | 1,099,048 | | | | 1,125,915 | |
Towd Point Mortgage Trust Series 2019-MH1 Class A1 144A±± | | | 3.00 | | | | 11-25-2058 | | | | 882,971 | | | | 896,048 | |
Towd Point Mortgage Trust Series2019-SJ3 Class A1 144A±± | | | 3.00 | | | | 11-25-2059 | | | | 2,111,911 | | | | 2,127,280 | |
UBS Commercial Mortgage Trust Series 2018-NYCH Class A (1 Month LIBOR +0.85%) 144A± | | | 2.51 | | | | 2-15-2032 | | | | 1,680,000 | | | | 1,676,335 | |
Vendee Mortgage Trust Series2011-1 Class DA | | | 3.75 | | | | 2-15-2035 | | | | 641,182 | | | | 652,564 | |
Verus Securitization Trust Series2019-1 Class A1 144A±± | | | 3.40 | | | | 12-25-2059 | | | | 1,685,427 | | | | 1,703,722 | |
Wilshire Funding Corporation Series1996-3 Class M2±± | | | 7.08 | | | | 8-25-2032 | | | | 79,782 | | | | 83,499 | |
Wilshire Funding Corporation Series1996-3 Class M3±± | | | 7.08 | | | | 8-25-2032 | | | | 77,754 | | | | 76,043 | |
Wilshire Funding Corporation Series1998-2 Class M1±± | | | 2.00 | | | | 12-28-2037 | | | | 8,099 | | | | 8,228 | |
| |
TotalNon-Agency Mortgage-Backed Securities (Cost $119,458,873) | | | | 120,183,522 | |
| | | | | |
The accompanying notes are an integral part of these financial statements.
14 | Wells Fargo Short-Term Bond Fund
Portfolio of investments—February 29, 2020 (unaudited)
| | | | | | | | | | | | | | | | |
| | | Interest
rate | | | Maturity
date | | | Principal | | | Value | |
U.S. Treasury Securities: 0.41% | |
U.S. Treasury Note | | | 1.38 | % | | | 1-31-2025 | | | $ | 325,000 | | | $ | 332,071 | |
U.S. Treasury Note | | | 2.50 | | | | 1-15-2022 | | | | 1,545,000 | | | | 1,589,841 | |
| |
Total U.S. Treasury Securities (Cost $1,869,521) | | | | 1,921,912 | |
| | | | | |
|
Yankee Corporate Bonds and Notes: 14.50% | |
|
Communication Services: 0.52% | |
|
| Interactive Media & Services: 0.52% | |
Tencent Holdings Limited 144A | | | 3.28 | | | | 4-11-2024 | | | | 2,310,000 | | | | 2,444,354 | |
| | | | | | | | | | | | | | | | |
|
Consumer Discretionary: 1.59% | |
|
| Auto Components: 0.54% | |
Toyota Industries Corporation 144A | | | 3.11 | | | | 3-12-2022 | | | | 2,460,000 | | | | 2,532,798 | |
| | | | | | | | | | | | | | | | |
|
| Automobiles: 0.49% | |
Fiat Chrysler Automobiles NV | | | 4.50 | | | | 4-15-2020 | | | | 2,335,000 | | | | 2,337,615 | |
| | | | | | | | | | | | | | | | |
|
| Household Durables: 0.56% | |
Panasonic Corporation 144A | | | 2.54 | | | | 7-19-2022 | | | | 2,600,000 | | | | 2,652,435 | |
| | | | | | | | | | | | | | | | |
|
Energy: 0.35% | |
|
| Oil, Gas & Consumable Fuels: 0.35% | |
Aker BP ASA 144A | | | 3.00 | | | | 1-15-2025 | | | | 1,660,000 | | | | 1,680,842 | |
| | | | | | | | | | | | | | | | |
|
Financials: 9.79% | |
|
| Banks: 8.93% | |
ANZ New Zealand International Company 144A | | | 1.90 | | | | 2-13-2023 | | | | 2,200,000 | | | | 2,227,174 | |
Australia & New Zealand Banking Group Limited | | | 2.25 | | | | 11-9-2020 | | | | 2,210,000 | | | | 2,219,802 | |
Banco Bradesco (Cayman) 144A | | | 2.85 | | | | 1-27-2023 | | | | 745,000 | | | | 741,499 | |
Banco Internacional del Peru SAA Interbank 144A | | | 3.38 | | | | 1-18-2023 | | | | 1,305,000 | | | | 1,337,625 | |
Banco Santander SA 144A | | | 4.13 | | | | 11-9-2022 | | | | 2,095,000 | | | | 2,176,181 | |
Bank of New Zealand 144A | | | 2.00 | | | | 2-21-2025 | | | | 1,835,000 | | | | 1,860,115 | |
Banque Federative du Credit Mutuel SA 144A | | | 2.13 | | | | 11-21-2022 | | | | 3,135,000 | | | | 3,186,920 | |
BBVA Bancomer SA 144A | | | 7.25 | | | | 4-22-2020 | | | | 634,000 | | | | 636,384 | |
Cooperatieve Rabobank U.A. | | | 2.75 | | | | 1-10-2022 | | | | 3,000,000 | | | | 3,069,352 | |
Corporación Andina de Fomento | | | 2.13 | | | | 9-27-2021 | | | | 3,000,000 | | | | 3,022,080 | |
Credit Suisse Group Funding Limited | | | 3.13 | | | | 12-10-2020 | | | | 2,110,000 | | | | 2,131,571 | |
Danske Bank AS 144A | | | 5.00 | | | | 1-12-2022 | | | | 1,405,000 | | | | 1,488,132 | |
Global Bank Corporation 144A | | | 4.50 | | | | 10-20-2021 | | | | 470,000 | | | | 481,750 | |
Lloyds Banking Group plc (3 Month LIBOR +1.25%)± | | | 2.86 | | | | 3-17-2023 | | | | 2,000,000 | | | | 2,040,022 | |
Macquarie Bank Limited 144A | | | 2.85 | | | | 7-29-2020 | | | | 3,000,000 | | | | 3,014,319 | |
Mizuho Financial Group 144A | | | 2.63 | | | | 4-12-2021 | | | | 1,000,000 | | | | 1,012,160 | |
Nordea Bank AB 144A | | | 3.75 | | | | 8-30-2023 | | | | 2,000,000 | | | | 2,129,214 | |
Sumitomo Mitsui Financial Group (3 Month LIBOR +0.80%)± | | | 2.64 | | | | 10-16-2023 | | | | 2,000,000 | | | | 2,021,660 | |
Sumitomo Mitsui Financial Group | | | 2.70 | | | | 7-16-2024 | | | | 2,510,000 | | | | 2,609,331 | |
Svenska Handelsbanken AB | | | 1.88 | | | | 9-7-2021 | | | | 2,500,000 | | | | 2,519,398 | |
UniCredit SpA 144A | | | 6.57 | | | | 1-14-2022 | | | | 2,220,000 | | | | 2,384,360 | |
| |
| | | | 42,309,049 | |
| | | | | |
|
| Diversified Financial Services: 0.27% | |
UBS AG 144A | | | 2.20 | | | | 6-8-2020 | | | | 1,275,000 | | | | 1,276,010 | |
| | | | | | | | | | | | | | | | |
|
| Insurance: 0.59% | |
Sompo International Holdings Limited | | | 4.70 | | | | 10-15-2022 | | | | 2,628,000 | | | | 2,825,219 | |
| | | | | | | | | | | | | | | | |
The accompanying notes are an integral part of these financial statements.
Wells Fargo Short-Term Bond Fund | 15
Portfolio of investments—February 29, 2020 (unaudited)
| | | | | | | | | | | | | | | | |
| | | Interest
rate | | | Maturity
date | | | Principal | | | Value | |
Health Care: 0.51% | |
|
| Pharmaceuticals: 0.51% | |
Perrigo Company plc | | | 4.00 | % | | | 11-15-2023 | | | $ | 323,000 | | | $ | 340,186 | |
Perrigo Finance Unlimited Company | | | 3.50 | | | | 3-15-2021 | | | | 1,065,000 | | | | 1,083,859 | |
Shire Acquisitions Investment Ireland Limited | | | 2.40 | | | | 9-23-2021 | | | | 980,000 | | | | 992,603 | |
| |
| | | | 2,416,648 | |
| | | | | |
|
Industrials: 0.52% | |
|
| Semiconductors & Semiconductor Equipment: 0.13% | |
NXP BV 144A | | | 4.13 | | | | 6-1-2021 | | | | 585,000 | | | | 601,294 | |
| | | | | | | | | | | | | | | | |
|
| Transportation Infrastructure: 0.39% | |
Asciano Finance Limited 144A | | | 4.63 | | | | 9-23-2020 | | | | 1,821,000 | | | | 1,848,154 | |
| | | | | | | | | | | | | | | | |
|
Materials: 0.65% | |
|
| Chemicals: 0.65% | |
Park Aerospace Holdings Company 144A | | | 5.25 | | | | 8-15-2022 | | | | 885,000 | | | | 941,592 | |
Syngenta Finance NV 144A | | | 4.44 | | | | 4-24-2023 | | | | 2,000,000 | | | | 2,126,926 | |
| |
| | | | 3,068,518 | |
| | | | | |
|
Utilities: 0.57% | |
|
| Electric Utilities: 0.57% | |
Enel Finance International NV 144A | | | 4.25 | | | | 9-14-2023 | | | | 2,500,000 | | | | 2,705,924 | |
| | | | | | | | | | | | | | | | |
| |
Total Yankee Corporate Bonds and Notes (Cost $66,752,399) | | | | 68,698,860 | |
| | | | | |
| | | | |
| | | | | | | | | | | | | | | | |
| | | Yield | | | | | | Shares | | | | |
Short-Term Investments: 6.25% | |
|
| Investment Companies: 6.25% | |
Securities Lending Cash Investments LLC (l)(r)(u) | | | 1.66 | | | | | | | | 2,516,719 | | | | 2,516,971 | |
Wells Fargo Government Money Market Fund Select Class (l)(u)## | | | 1.52 | | | | | | | | 27,098,720 | | | | 27,098,720 | |
| |
Total Short-Term Investments (Cost $29,615,691) | | | | 29,615,691 | |
| | | | | |
| | | | | | | | |
| Total investments in securities (Cost $474,305,321) | | | 101.59 | % | | | 481,412,184 | |
| | |
Other assets and liabilities, net | | | (1.59 | ) | | | (7,518,585 | ) |
| | | | | | | | |
| Total net assets | | | 100.00 | % | | $ | 473,893,599 | |
| | | | | | | | |
| 144A | The security may be resold in transactions exempt from registration, normally to qualified institutional buyers, pursuant to Rule 144A under the Securities Act of 1933. |
| ± | Variable rate investment. The rate shown is the rate in effect at period end. |
| ±± | The coupon of the security is adjusted based on the principal and interest payments received from the underlying pool of mortgages as well as the credit quality and the actual prepayment speed of the underlying mortgages. |
| « | All or a portion of this security is on loan. |
| ¤ | The security is issued in zero coupon form with no periodic interest payments. |
| (c) | Investment in an interest-only security entitles holders to receive only the interest payments on the underlying mortgages. The principal amount shown is the notional amount of the underlying mortgages. The rate represents the coupon rate. |
| %% | The security is purchased on a when-issued basis. |
| (l) | The issuer of the security is an affiliated person of the Fund as defined in the Investment Company Act of 1940. |
| (r) | The investment is anon-registered investment company purchased with cash collateral received from securities on loan. |
| (u) | The rate represents the7-day annualized yield at period end. |
| ## | All or a portion of this security is segregated for when-issued securities. |
The accompanying notes are an integral part of these financial statements.
16 | Wells Fargo Short-Term Bond Fund
Portfolio of investments—February 29, 2020 (unaudited)
Abbreviations:
| AGM | Assured Guaranty Municipal |
| Ambac | Ambac Financial Group Incorporated |
| EDA | Economic Development Authority |
| FDIC | Federal Deposit Insurance Corporation |
| FHLMC | Federal Home Loan Mortgage Corporation |
| FNMA | Federal National Mortgage Association |
| GNMA | Government National Mortgage Association |
| IDA | Industrial Development Authority |
| LIBOR | London Interbank Offered Rate |
| REIT | Real Estate Investment Trust |
Futures Contracts
| | | | | | | | | | | | | | | | | | | | | | | | |
| Description | | Number of
contracts | | | Expiration
date | | | Notional
cost | | | Notional
value | | | Unrealized
gains | | | Unrealized
losses | |
| | | | | | |
Long | | | | | | | | | | | | | | | | | | | | | | | | |
| | | | | | |
2-Year U.S. Treasury Notes | | | 1,150 | | | | 6-30-2020 | | | $ | 249,610,248 | | | $ | 251,077,344 | | | $ | 1,467,096 | | | $ | 0 | |
| | | | | | |
Short | | | | | | | | | | | | | | | | | | | | | | | | |
| | | | | | |
5-Year U.S. Treasury Notes | | | (321) | | | | 6-30-2020 | | | | (39,002,959 | ) | | | (39,402,750 | ) | | | 0 | | | | (399,791 | ) |
| | | | | | | | | | | | | | | | | | | | | | | | |
| | | | | | |
| | | | | | | | | | | | | | | | | | $ | 1,467,096 | | | $ | (399,791 | ) |
| | | | | | | | | | | | | | | | | | | | | | | | |
Investments in Affiliates
An affiliated investment is an investment in which the Fund owns at least 5% of the outstanding voting shares of the issuer or as a result of other relationships, such as the Fund and the issuer having the same investment manager. Transactions with issuers that were either affiliated persons of the Fund at the beginning of the period or the end of the period were as follows:
| | | | | | | | | | | | | | | | | | | | | | | | | | | | | | | | | | | | |
| | | Shares,
beginning of
period | | | Shares
purchased | | | Shares
sold | | | Shares,
end of
period | | | Net
realized
gains
(losses) | | | Net
change in
unrealized
gains
(losses) | | | Income
from
affiliated
securities | | | Value,
end of period | | | % of
net
assets | |
| | | | | | | | | |
| Short-Term Investments | | | | | | | | | | | | | | | | | | | | | | | | | | | |
Investment Companies | | | | | | | | | | | | | | | | | | | | | | | | | | | | | | | | | | | | |
Securities Lending Cash Investments LLC | | | 1,285,334 | | | | 10,956,575 | | | | (9,725,190 | ) | | | 2,516,719 | | | ($ | 69 | ) | | $ | 0 | | | $ | 11,173 | # | | $ | 2,516,971 | | | | | |
Wells Fargo Government Money Market Fund Select Class | | | 9,958,213 | | | | 149,159,943 | | | | (132,019,436 | ) | | | 27,098,720 | | | | 0 | | | | 0 | | | | 157,683 | | | | 27,098,720 | | | | | |
| | | | | | | | | | | | | | | | | | | | | | | | | | | | | | | | | | | | |
| | | | | | | | | | | | | | | | | | ($ | 69 | ) | | $ | 0 | | | $ | 168,856 | | | $ | 29,615,691 | | | | 6.25 | % |
| | | | | | | | | | | | | | | | | | | | | | | | | | | | | | | | | | | | |
| # | Amount shown represents income before fees and rebates. |
The accompanying notes are an integral part of these financial statements.
Wells Fargo Short-Term Bond Fund | 17
Statement of assets and liabilities—February 29, 2020 (unaudited)
| | | | |
| | | | |
| |
Assets | | | | |
Investments in unaffiliated securities (including $2,465,465 of securities loaned), at value (cost $444,689,630) | | $ | 451,796,493 | |
Investments in affiliated securities, at value (cost $29,615,691) | | | 29,615,691 | |
Cash | | | 87,234 | |
Cash at broker segregated for futures contracts | | | 627,148 | |
Principal paydown receivable | | | 5,721 | |
Receivable for Fund shares sold | | | 2,380,305 | |
Receivable for interest | | | 2,327,750 | |
Receivable for daily variation margin on open futures contracts | | | 529,043 | |
Receivable for securities lending income, net | | | 574 | |
Prepaid expenses and other assets | | | 35,721 | |
| | | | |
Total assets | | | 487,405,680 | |
| | | | |
| |
Liabilities | | | | |
Payable upon receipt of securities loaned | | | 2,516,966 | |
Payable for investments purchased | | | 8,976,861 | |
Payable for Fund shares redeemed | | | 1,526,973 | |
Management fee payable | | | 110,901 | |
Dividends payable | | | 219,617 | |
Administration fees payable | | | 39,935 | |
Distribution fee payable | | | 2,979 | |
Trustees’ fees and expenses payable | | | 5,837 | |
Accrued expenses and other liabilities | | | 112,012 | |
| | | | |
Total liabilities | | | 13,512,081 | |
| | | | |
Total net assets | | $ | 473,893,599 | |
| | | | |
| |
Net assets consist of | | | | |
Paid-in capital | | $ | 467,028,212 | |
Total distributable earnings | | | 6,865,387 | |
| | | | |
Total net assets | | $ | 473,893,599 | |
| | | | |
| |
Computation of net asset value and offering price per share | | | | |
Net assets – Class A | | $ | 162,151,411 | |
Shares outstanding – Class A1 | | | 18,220,608 | |
Net asset value per share – Class A | | | $8.90 | |
Maximum offering price per share – Class A2 | | | $9.08 | |
Net assets – Class C | | $ | 4,827,199 | |
Shares outstanding – Class C1 | | | 543,018 | |
Net asset value per share – Class C | | | $8.89 | |
Net assets – Class R6 | | $ | 28,154,537 | |
Shares outstanding – Class R61 | | | 3,165,264 | |
Net asset value per share – Class R6 | | | $8.89 | |
Net assets – Institutional Class | | $ | 278,760,452 | |
Shares outstanding – Institutional Class1 | | | 31,310,159 | |
Net asset value per share – Institutional Class | | | $8.90 | |
| 1 | The Fund has an unlimited number of authorized shares. |
| 2 | Maximum offering price is computed as 100/98 of net asset value. On investments of $50,000 or more, the offering price is reduced. |
The accompanying notes are an integral part of these financial statements.
18 | Wells Fargo Short-Term Bond Fund
Statement of operations—six months ended February 29, 2020 (unaudited)
| | | | |
| | | | |
| |
Investment income | | | | |
Interest | | $ | 6,436,413 | |
Income from affiliated securities | | | 160,654 | |
| | | | |
Total investment income | | | 6,597,067 | |
| | | | |
| |
Expenses | | | | |
Management fee | | | 778,365 | |
Administration fees | |
Class A | | | 130,057 | |
Class C | | | 4,960 | |
Class R6 | | | 4,644 | |
Institutional Class | | | 98,020 | |
Shareholder servicing fees | |
Class A | | | 203,214 | |
Class C | | | 7,750 | |
Distribution fee | |
Class C | | | 23,242 | |
Custody and accounting fees | | | 20,779 | |
Professional fees | | | 27,053 | |
Registration fees | | | 34,712 | |
Shareholder report expenses | | | 27,769 | |
Trustees’ fees and expenses | | | 10,909 | |
Other fees and expenses | | | 5,456 | |
| | | | |
Total expenses | | | 1,376,930 | |
Less: Fee waivers and/or expense reimbursements | |
Fund-level | | | (92,064 | ) |
Class A | | | (39,264 | ) |
Class C | | | (1,495 | ) |
| | | | |
Net expenses | | | 1,244,107 | |
| | | | |
Net investment income | | | 5,352,960 | |
| | | | |
| |
Realized and unrealized gains (losses) on investments | | | | |
Net realized gains (losses) on | |
Unaffiliated securities | | | 661,203 | |
Affiliated securities | | | (69 | ) |
Futures contracts | | | 83,582 | |
| | | | |
Net realized gains on investments | | | 744,716 | |
| | | | |
|
Net change in unrealized gains (losses) on | |
Unaffiliated securities | | | 1,716,124 | |
Futures contracts | | | 836,151 | |
| | | | |
Net change in unrealized gains (losses) on investments | | | 2,552,275 | |
| | | | |
Net realized and unrealized gains (losses) on investments | | | 3,296,991 | |
| | | | |
Net increase in net assets resulting from operations | | $ | 8,649,951 | |
| | | | |
The accompanying notes are an integral part of these financial statements.
Wells Fargo Short-Term Bond Fund | 19
Statement of changes in net assets
| | | | | | | | | | | | | | | | |
| | | Six months ended
February 29, 2020 (unaudited) | | | Year ended
August 31, 2019 | |
| |
Operations | | | | | |
Net investment income | | | | | | $ | 5,352,960 | | | | | | | $ | 10,469,332 | |
Net realized gains on investments | | | | | | | 744,716 | | | | | | | | 988,172 | |
Net change in unrealized gains (losses) on investments | | | | | | | 2,552,275 | | | | | | | | 8,268,897 | |
| | | | |
Net increase in net assets resulting from operations | | | | | | | 8,649,951 | | | | | | | | 19,726,401 | |
| | | | |
| | | |
Distributions to shareholders from net investment income and net realized gains | | | | | | | | | | | | |
Class A | | | | | | | (1,814,762 | ) | | | | | | | (3,992,982 | ) |
Class C | | | | | | | (46,035 | ) | | | | | | | (120,972 | ) |
Class R6 | | | | | | | (395,159 | ) | | | | | | | (713,351 | ) |
Institutional Class | | | | | | | (3,069,177 | ) | | | | | | | (5,643,042 | ) |
| | | | |
Total distributions to shareholders | | | | | | | (5,325,133 | ) | | | | | | | (10,470,347 | ) |
| | | | |
| | | | |
Capital share transactions | | | Shares | | | | | | | | Shares | | | | | |
Proceeds from shares sold | |
Class A | | | 1,013,824 | | | | 8,954,531 | | | | 2,223,647 | | | | 19,328,602 | |
Class C | | | 103,645 | | | | 914,087 | | | | 271,321 | | | | 2,363,056 | |
Class R6 | | | 747,511 | | | | 6,597,074 | | | | 5,013,680 | | | | 43,272,366 | |
Institutional Class | | | 9,725,081 | | | | 85,943,667 | | | | 10,058,620 | | | | 87,525,507 | |
| | | | |
| | | | | | | 102,409,359 | | | | | | | | 152,489,531 | |
| | | | |
Reinvestment of distributions | |
Class A | | | 193,481 | | | | 1,710,541 | | | | 431,307 | | | | 3,760,725 | |
Class C | | | 4,662 | | | | 41,156 | | | | 11,990 | | | | 104,366 | |
Class R6 | | | 224 | | | | 1,980 | | | | 421 | | | | 3,677 | |
Institutional Class | | | 251,370 | | | | 2,223,486 | | | | 465,911 | | | | 4,065,263 | |
| | | | |
| | | | | | | 3,977,163 | | | | | | | | 7,934,031 | |
| | | | |
Payment for shares redeemed | |
Class A | | | (2,261,307 | ) | | | (19,979,196 | ) | | | (4,443,303 | ) | | | (38,566,762 | ) |
Class C | | | (374,806 | ) | | | (3,305,518 | ) | | | (467,871 | ) | | | (4,067,578 | ) |
Class R6 | | | (1,045,120 | ) | | | (9,228,917 | ) | | | (1,846,341 | ) | | | (16,085,357 | ) |
Institutional Class | | | (4,285,846 | ) | | | (37,897,683 | ) | | | (11,098,501 | ) | | | (96,341,169 | ) |
| | | | |
| | | | | | | (70,411,314 | ) | | | | | | | (155,060,866 | ) |
| | | | |
Net increase in net assets resulting from capital share transactions | | | | | | | 35,975,208 | | | | | | | | 5,362,696 | |
| | | | |
Total increase in net assets | | | | | | | 39,300,026 | | | | | | | | 14,618,750 | |
| | | | |
| | |
Net assets | | | | | | | | |
Beginning of period | | | | | | | 434,593,573 | | | | | | | | 419,974,823 | |
| | | | |
End of period | | | | | | $ | 473,893,599 | | | | | | | $ | 434,593,573 | |
| | | | |
The accompanying notes are an integral part of these financial statements.
20 | Wells Fargo Short-Term Bond Fund
Financial highlights
(For a share outstanding throughout each period)
| | | | | | | | | | | | | | | | | | | | | | | | |
| | | Six months ended
February 29, 2020
(unaudited) | | | Year ended August 31 | |
| CLASS A | | 2019 | | | 2018 | | | 2017 | | | 2016 | | | 2015 | |
Net asset value, beginning of period | | | $8.84 | | | | $8.65 | | | | $8.77 | | | | $8.78 | | | | $8.77 | | | | $8.82 | |
Net investment income | | | 0.10 | | | | 0.20 | | | | 0.15 | | | | 0.12 | | | | 0.11 | | | | 0.09 | |
Net realized and unrealized gains (losses) on investments | | | 0.06 | | | | 0.19 | | | | (0.12 | ) | | | (0.01 | ) | | | 0.04 | | | | (0.03 | ) |
| | | | | | | | | | | | | | | | | | | | | | | | |
Total from investment operations | | | 0.16 | | | | 0.39 | | | | 0.03 | | | | 0.11 | | | | 0.15 | | | | 0.06 | |
Distributions to shareholders from | | | | | | | | | | | | | | | | | | | | | | | | |
Net investment income | | | (0.10 | ) | | | (0.20 | ) | | | (0.15 | ) | | | (0.12 | ) | | | (0.11 | ) | | | (0.09 | ) |
Net realized gains | | | 0.00 | | | | 0.00 | | | | 0.00 | | | | 0.00 | | | | (0.03 | ) | | | (0.02 | ) |
| | | | | | | | | | | | | | | | | | | | | | | | |
Total distributions to shareholders | | | (0.10 | ) | | | (0.20 | ) | | | (0.15 | ) | | | (0.12 | ) | | | (0.14 | ) | | | (0.11 | ) |
Net asset value, end of period | | | $8.90 | | | | $8.84 | | | | $8.65 | | | | $8.77 | | | | $8.78 | | | | $8.77 | |
Total return1 | | | 1.80 | % | | | 4.60 | % | | | 0.31 | % | | | 1.25 | % | | | 1.77 | % | | | 0.66 | % |
Ratios to average net assets (annualized) | | | | | | | | | | | | | | | | | | | | | | | | |
Gross expenses | | | 0.82 | % | | | 0.82 | % | | | 0.82 | % | | | 0.81 | % | | | 0.81 | % | | | 0.80 | % |
Net expenses | | | 0.72 | % | | | 0.72 | % | | | 0.72 | % | | | 0.72 | % | | | 0.72 | % | | | 0.74 | % |
Net investment income | | | 2.24 | % | | | 2.33 | % | | | 1.68 | % | | | 1.35 | % | | | 1.29 | % | | | 1.00 | % |
Supplemental data | | | | | | | | | | | | | | | | | | | | | | | | |
Portfolio turnover rate | | | 23 | % | | | 43 | % | | | 43 | % | | | 50 | % | | | 59 | % | | | 57 | % |
Net assets, end of period (000s omitted) | | | $162,151 | | | | $170,345 | | | | $182,179 | | | | $225,797 | | | | $278,802 | | | | $65,454 | |
| 1 | Total return calculations do not include any sales charges. Returns for periods of less than one year are not annualized. |
The accompanying notes are an integral part of these financial statements.
Wells Fargo Short-Term Bond Fund | 21
Financial highlights
(For a share outstanding throughout each period)
| | | | | | | | | | | | | | | | | | | | | | | | |
| | | Six months ended
February 29, 2020
(unaudited) | | | Year ended August 31 | |
| CLASS C | | 2019 | | | 2018 | | | 2017 | | | 2016 | | | 2015 | |
Net asset value, beginning of period | | | $8.83 | | | | $8.64 | | | | $8.76 | | | | $8.77 | | | | $8.76 | | | | $8.81 | |
Net investment income | | | 0.06 | | | | 0.14 | | | | 0.08 | | | | 0.05 | | | | 0.05 | | | | 0.02 | |
Net realized and unrealized gains (losses) on investments | | | 0.06 | | | | 0.19 | | | | (0.12 | ) | | | (0.01 | ) | | | 0.04 | | | | (0.03 | ) |
| | | | | | | | | | | | | | | | | | | | | | | | |
Total from investment operations | | | 0.12 | | | | 0.33 | | | | (0.04 | ) | | | 0.04 | | | | 0.09 | | | | (0.01 | ) |
Distributions to shareholders from | | | | | | | | | | | | | | | | | | | | | | | | |
Net investment income | | | (0.06 | ) | | | (0.14 | ) | | | (0.08 | ) | | | (0.05 | ) | | | (0.05 | ) | | | (0.02 | ) |
Net realized gains | | | 0.00 | | | | 0.00 | | | | 0.00 | | | | 0.00 | | | | (0.03 | ) | | | (0.02 | ) |
| | | | | | | | | | | | | | | | | | | | | | | | |
Total distributions to shareholders | | | (0.06 | ) | | | (0.14 | ) | | | (0.08 | ) | | | (0.05 | ) | | | (0.08 | ) | | | (0.04 | ) |
Net asset value, end of period | | | $8.89 | | | | $8.83 | | | | $8.64 | | | | $8.76 | | | | $8.77 | | | | $8.76 | |
Total return1 | | | 1.42 | % | | | 3.82 | % | | | (0.44 | )% | | | 0.49 | % | | | 1.01 | % | | | (0.09 | )% |
Ratios to average net assets (annualized) | | | | | | | | | | | | | | | | | | | | | | | | |
Gross expenses | | | 1.57 | % | | | 1.57 | % | | | 1.57 | % | | | 1.56 | % | | | 1.56 | % | | | 1.55 | % |
Net expenses | | | 1.47 | % | | | 1.47 | % | | | 1.47 | % | | | 1.47 | % | | | 1.47 | % | | | 1.49 | % |
Net investment income | | | 1.49 | % | | | 1.57 | % | | | 0.93 | % | | | 0.61 | % | | | 0.53 | % | | | 0.25 | % |
Supplemental data | | | | | | | | | | | | | | | | | | | | | | | | |
Portfolio turnover rate | | | 23 | % | | | 43 | % | | | 43 | % | | | 50 | % | | | 59 | % | | | 57 | % |
Net assets, end of period (000s omitted) | | | $4,827 | | | | $7,146 | | | | $8,588 | | | | $11,361 | | | | $14,204 | | | | $11,508 | |
| 1 | Total return calculations do not include any sales charges. Returns for periods of less than one year are not annualized. |
The accompanying notes are an integral part of these financial statements.
22 | Wells Fargo Short-Term Bond Fund
Financial highlights
(For a share outstanding throughout each period)
| | | | | | | | | | | | |
| | | Six months ended
February 29, 2020
(unaudited) | | | Year ended August 31 | |
| CLASS R6 | | 2019 | | | 20181 | |
Net asset value, beginning of period | | | $8.83 | | | | $8.66 | | | | $8.64 | |
Net investment income | | | 0.11 | | | | 0.23 | | | | 0.02 | 2 |
Net realized and unrealized gains (losses) on investments | | | 0.06 | | | | 0.17 | | | | 0.02 | |
| | | | | | | | | | | | |
Total from investment operations | | | 0.17 | | | | 0.40 | | | | 0.04 | |
Distributions to shareholders from | | | | | | | | | | | | |
Net investment income | | | (0.11 | ) | | | (0.23 | ) | | | (0.02 | ) |
Net asset value, end of period | | | $8.89 | | | | $8.83 | | | | $8.66 | |
Total return3 | | | 1.96 | % | | | 4.69 | % | | | 0.42 | % |
Ratios to average net assets (annualized) | | | | | | | | | | | | |
Gross expenses | | | 0.44 | % | | | 0.44 | % | | | 0.44 | % |
Net expenses | | | 0.40 | % | | | 0.40 | % | | | 0.40 | % |
Net investment income | | | 2.56 | % | | | 2.71 | % | | | 2.24 | % |
Supplemental data | | | | | | | | | | | | |
Portfolio turnover rate | | | 23 | % | | | 43 | % | | | 43 | % |
Net assets, end of period (000s omitted) | | | $28,155 | | | | $30,585 | | | | $2,553 | |
| 1 | For the period from July 31, 2018 (commencement of class operations) to August 31, 2018 |
| 2 | Calculated based upon average shares outstanding |
| 3 | Returns for periods of less than one year are not annualized. |
The accompanying notes are an integral part of these financial statements.
Wells Fargo Short-Term Bond Fund | 23
Financial highlights
(For a share outstanding throughout each period)
| | | | | | | | | | | | | | | | | | | | | | | | |
| | | Six months ended
February 29, 2020
(unaudited) | | | Year ended August 31 | |
| INSTITUTIONAL CLASS | | 2019 | | | 2018 | | | 2017 | | | 2016 | | | 2015 | |
Net asset value, beginning of period | | | $8.84 | | | | $8.65 | | | | $8.78 | | | | $8.79 | | | | $8.77 | | | | $8.83 | |
Net investment income | | | 0.11 | | | | 0.23 | | | | 0.17 | | | | 0.14 | | | | 0.13 | | | | 0.11 | |
Net realized and unrealized gains (losses) on investments | | | 0.06 | | | | 0.19 | | | | (0.13 | ) | | | (0.01 | ) | | | 0.05 | | | | (0.04 | ) |
| | | | | | | | | | | | | | | | | | | | | | | | |
Total from investment operations | | | 0.17 | | | | 0.42 | | | | 0.04 | | | | 0.13 | | | | 0.18 | | | | 0.07 | |
Distributions to shareholders from | | | | | | | | | | | | | | | | | | | | | | | | |
Net investment income | | | (0.11 | ) | | | (0.23 | ) | | | (0.17 | ) | | | (0.14 | ) | | | (0.13 | ) | | | (0.11 | ) |
Net realized gains | | | 0.00 | | | | 0.00 | | | | 0.00 | | | | 0.00 | | | | (0.03 | ) | | | (0.02 | ) |
| | | | | | | | | | | | | | | | | | | | | | | | |
Total distributions to shareholders | | | (0.11 | ) | | | (0.23 | ) | | | (0.17 | ) | | | (0.14 | ) | | | (0.16 | ) | | | (0.13 | ) |
Net asset value, end of period | | | $8.90 | | | | $8.84 | | | | $8.65 | | | | $8.78 | | | | $8.79 | | | | $8.77 | |
Total return1 | | | 1.94 | % | | | 4.88 | % | | | 0.46 | % | | | 1.49 | % | | | 2.14 | % | | | 0.82 | % |
Ratios to average net assets (annualized) | | | | | | | | | | | | | | | | | | | | | | | | |
Gross expenses | | | 0.49 | % | | | 0.49 | % | | | 0.49 | % | | | 0.48 | % | | | 0.48 | % | | | 0.47 | % |
Net expenses | | | 0.45 | % | | | 0.45 | % | | | 0.46 | % | | | 0.48 | % | | | 0.48 | % | | | 0.47 | % |
Net investment income | | | 2.52 | % | | | 2.60 | % | | | 1.95 | % | | | 1.59 | % | | | 1.51 | % | | | 1.26 | % |
Supplemental data | | | | | | | | | | | | | | | | | | | | | | | | |
Portfolio turnover rate | | | 23 | % | | | 43 | % | | | 43 | % | | | 50 | % | | | 59 | % | | | 57 | % |
Net assets, end of period (000s omitted) | | | $278,760 | | | | $226,517 | | | | $226,655 | | | | $230,549 | | | | $252,961 | | | | $306,832 | |
| 1 | Returns for periods of less than one year are not annualized. |
The accompanying notes are an integral part of these financial statements.
24 | Wells Fargo Short-Term Bond Fund
Notes to financial statements (unaudited)
1. ORGANIZATION
Wells Fargo Funds Trust (the “Trust”), a Delaware statutory trust organized on March 10, 1999, is anopen-end management investment company registered under the Investment Company Act of 1940, as amended (the “1940 Act”). As an investment company, the Trust follows the accounting and reporting guidance in Financial Accounting Standards Board (“FASB”)Accounting Standards Codification Topic 946, Financial Services – Investment Companies. These financial statements report on the Wells Fargo Short-Term Bond Fund (the “Fund”) which is a diversified series of the Trust.
2. SIGNIFICANT ACCOUNTING POLICIES
The following significant accounting policies, which are consistently followed in the preparation of the financial statements of the Fund, are in conformity with U.S. generally accepted accounting principles which require management to make estimates and assumptions that affect the reported amounts of assets and liabilities, disclosure of contingent assets and liabilities at the date of the financial statements, and the reported amounts of revenues and expenses during the reporting period. Actual results could differ from those estimates.
Securities valuation
All investments are valued each business day as of the close of regular trading on the New York Stock Exchange (generally 4 p.m. Eastern Time), although the Fund may deviate from this calculation time under unusual or unexpected circumstances.
Debt securities are valued at the evaluated bid price provided by an independent pricing service (e.g. taking into account various factors, including yields, maturities, or credit ratings) or, if a reliable price is not available, the quoted bid price from an independent broker-dealer.
Futures contracts that are listed on a foreign or domestic exchange or market are valued at the official closing price or, if none, the last sales price.
Investments in registeredopen-end investment companies are valued at net asset value. Interests innon-registered investment companies that are redeemable at net asset value are fair valued normally at net asset value.
Investments which are not valued using any of the methods discussed above are valued at their fair value, as determined in good faith by the Board of Trustees of the Fund. The Board of Trustees has established a Valuation Committee comprised of the Trustees and has delegated to it the authority to take any actions regarding the valuation of portfolio securities that the Valuation Committee deems necessary or appropriate, including determining the fair value of portfolio securities, unless the determination has been delegated to the Wells Fargo Asset Management Pricing Committee at Wells Fargo Funds Management, LLC (“Funds Management”). The Board of Trustees retains the authority to make or ratify any valuation decisions or approve any changes to the Valuation Procedures as it deems appropriate. On a quarterly basis, the Board of Trustees receives reports on any valuation actions taken by the Valuation Committee or the Wells Fargo Asset Management Pricing Committee which may include items for ratification.
Securities lending
The Fund may lend its securities from time to time in order to earn additional income in the form of fees or interest on securities received as collateral or the investment of any cash received as collateral. When securities are on loan, the Fund receives interest or dividends on those securities. Cash collateral received in connection with its securities lending transactions is invested in Securities Lending Cash Investments, LLC (the “Securities Lending Fund”). Investments in Securities Lending Fund are valued at the evaluated bid price provided by an independent pricing service. Income earned from investment in the Securities Lending Fund (net of fees and rebates), if any, is included in income from affiliated securities on the Statement of Operations.
In a securities lending transaction, the net asset value of the Fund is affected by an increase or decrease in the value of the securities loaned and by an increase or decrease in the value of the instrument in which collateral is invested. The amount of securities lending activity undertaken by the Fund fluctuates from time to time. The Fund has the right under the lending agreement to recover the securities from the borrower on demand. In the event of default or bankruptcy by the borrower, the Fund may be prevented from recovering the loaned securities or gaining access to the collateral or may experience delays or costs in doing so. In such an event, the terms of the agreement allows the unaffiliated securities lending agent to use the collateral to purchase replacement securities on behalf of the Fund or pay the Fund the market value of the loaned securities. The Fund bears the risk of loss with respect to depreciation of its investment of the cash collateral.
Futures contracts
Futures contracts are agreements between the Fund and a counterparty to buy or sell a specific amount of a commodity, financial instrument or currency at a specified price and on a specified date. The Fund may buy and sell futures contracts in order to gain exposure to, or protect against, changes in interest rates and is subject to interest rate risk. The primary risks associated with the
Wells Fargo Short-Term Bond Fund | 25
Notes to financial statements (unaudited)
use of futures contracts are the imperfect correlation between changes in market values of securities held by the Fund and the prices of futures contracts, and the possibility of an illiquid market. Futures contracts are generally entered into on a regulated futures exchange and cleared through a clearinghouse associated with the exchange. With futures contracts, there is minimal counterparty risk to the Fund since futures contracts are exchange traded and the exchange’s clearinghouse, as the counterparty to all exchange traded futures, guarantees the futures contracts against default.
Upon entering into a futures contracts, the Fund is required to deposit either cash or securities (initial margin) with the broker in an amount equal to a certain percentage of the contract value. Subsequent payments (variation margin) are paid to or from the broker each day equal to the daily changes in the contract value. Such payments are recorded as unrealized gains or losses and, if any, shown as variation margin receivable (payable) in the Statement of Assets and Liabilities. Should the Fund fail to make requested variation margin payments, the broker can gain access to the initial margin to satisfy the Fund’s payment obligations. When the contracts are closed, a realized gain or loss is recorded in the Statement of Operations.
Security transactions and income recognition
Securities transactions are recorded on a trade date basis. Realized gains or losses are recorded on the basis of identified cost.
Interest income is accrued daily and bond discounts are accreted and premiums are amortized daily. To the extent debt obligations are placed onnon-accrual status, any related interest income may be reduced by writing off interest receivables when the collection of all or a portion of interest has been determined to be doubtful based on consistently applied procedures and the fair value has decreased. If the issuer subsequently resumes interest payments or when the collectability of interest is reasonably assured, the debt obligation is removed fromnon-accrual status.
Distributions to shareholders
Distributions to shareholders from net investment income are declared daily and paid monthly. Distributions from net realized gains, if any, are recorded on theex-dividend date and paid at least annually. Such distributions are determined in accordance with income tax regulations and may differ from U.S. generally accepted accounting principles. Dividend sources are estimated at the time of declaration. The tax character of distributions is determined as of the Fund’s fiscal year end. Therefore, a portion of the Fund’s distributions made prior to the Fund’s fiscal year end may be categorized as a tax return of capital at year end.
Federal and other taxes
The Fund intends to continue to qualify as a regulated investment company by distributing substantially all of its investment company taxable income and any net realized capital gains (after reduction for capital loss carryforwards) sufficient to relieve it from all, or substantially all, federal income taxes. Accordingly, no provision for federal income taxes was required.
The Fund’s income and federal excise tax returns and all financial records supporting those returns for the prior three fiscal years are subject to examination by the federal and Delaware revenue authorities. Management has analyzed the Fund’s tax positions taken on federal, state, and foreign tax returns for all open tax years and does not believe that there are any uncertain tax positions that require recognition of a tax liability.
As of February 29, 2020, the aggregate cost of all investments for federal income tax purposes was $474,591,381 and the unrealized gains (losses) consisted of:
| | | | |
| |
Gross unrealized gains | | $ | 8,315,576 | |
| |
Gross unrealized losses | | | (427,468 | ) |
| |
Net unrealized gains | | $ | 7,888,108 | |
As of August 31, 2019, the Fund had capital loss carryforwards which consisted of $209,263 in short-term capital losses and $1,720,034 in long-term capital losses.
Class allocations
The separate classes of shares offered by the Fund differ principally in applicable sales charges, distribution, shareholder servicing, and administration fees. Class specific expenses are charged directly to that share class. Investment income, common fund-level expenses, and realized and unrealized gains (losses) on investments are allocated daily to each class of shares based on the relative proportion of net assets of each class.
26 | Wells Fargo Short-Term Bond Fund
Notes to financial statements (unaudited)
3. FAIR VALUATION MEASUREMENTS
Fair value measurements of investments are determined within a framework that has established a fair value hierarchy based upon the various data inputs utilized in determining the value of the Fund’s investments. The three-level hierarchy gives the highest priority to unadjusted quoted prices in active markets for identical assets or liabilities (Level 1) and the lowest priority to unobservable inputs (Level 3). The Fund’s investments are classified within the fair value hierarchy based on the lowest level of input that is significant to the fair value measurement. The inputs are summarized into three broad levels as follows:
| ∎ | | Level 1 – quoted prices in active markets for identical securities |
| ∎ | | Level 2 – other significant observable inputs (including quoted prices for similar securities, interest rates, prepayment speeds, credit risk, etc.) |
| ∎ | | Level 3 – significant unobservable inputs (including the Fund’s own assumptions in determining the fair value of investments) |
The inputs or methodologies used for valuing investments in securities are not necessarily an indication of the risk associated with investing in those securities.
The following is a summary of the inputs used in valuing the Fund’s assets and liabilities as of February 29, 2020:
| | | | | | | | | | | | | | | | |
| | | | |
| | | Quoted prices
(Level 1) | | | Other significant
observable inputs
(Level 2) | | | Significant
unobservable inputs (Level 3) | | | Total | |
| | | | |
Assets | | | | | | | | | | | | | | | | |
Investments in: | | | | | | | | | | | | | | | | |
| | | | |
Agency securities | | $ | 0 | | | $ | 16,265,355 | | | $ | 0 | | | $ | 16,265,355 | |
| | | | |
Asset-backed securities | | | 0 | | | | 72,526,913 | | | | 0 | | | | 72,526,913 | |
| | | | |
Corporate bonds and notes | | | 0 | | | | 165,726,781 | | | | 0 | | | | 165,726,781 | |
| | | | |
Municipal obligations | | | 0 | | | | 6,473,150 | | | | 0 | | | | 6,473,150 | |
| | | | |
Non-agency mortgage-backed securities | | | 0 | | | | 120,183,522 | | | | 0 | | | | 120,183,522 | |
| | | | |
U.S. Treasury securities | | | 1,921,912 | | | | 0 | | | | 0 | | | | 1,921,912 | |
| | | | |
Yankee corporate bonds and notes | | | 0 | | | | 68,698,860 | | | | 0 | | | | 68,698,860 | |
| | | | |
Short-term investments | | | | | | | | | | | | | | | | |
| | | | |
Investment companies | | | 29,615,691 | | | | 0 | | | | 0 | | | | 29,615,691 | |
| | | | |
| | | 31,537,603 | | | | 449,874,581 | | | | 0 | | | | 481,412,184 | |
| | | | |
Futures contracts | | | 1,467,096 | | | | 0 | | | | 0 | | | | 1,467,096 | |
| | | | |
Total assets | | $ | 33,004,699 | | | $ | 449,874,581 | | | $ | 0 | | | $ | 482,879,280 | |
| | | | |
Liabilities | | | | | | | | | | | | | | | | |
| | | | |
Futures contracts | | $ | 399,791 | | | $ | 0 | | | $ | 0 | | | $ | 399,791 | |
| | | | |
Total liabilities | | $ | 399,791 | | | $ | 0 | | | $ | 0 | | | $ | 399,791 | |
Additional sector, industry or geographic detail is included in the Portfolio of Investments.
Futures contracts are reported at their cumulative unrealized gains (losses) at measurement date as reported in the table following the Portfolio of Investments. For futures contracts, the current day’s variation margin is reported on the Statement of Assets and Liabilities. All other assets and liabilities are reported at their market value at measurement date.
For the six months ended February 29, 2020, the Fund did not have any transfers into/out of Level 3.
4. TRANSACTIONS WITH AFFILIATES
Management fee
Funds Management, an indirect wholly owned subsidiary of Wells Fargo & Company (“Wells Fargo”), is the manager of the Fund and provides advisory and fund-level administrative services under an investment management agreement. Under the investment management agreement, Funds Management is responsible for, among other services, implementing the investment objectives and
Wells Fargo Short-Term Bond Fund | 27
Notes to financial statements (unaudited)
strategies of the Fund, supervising the subadviser and providing fund-level administrative services in connection with the Fund’s operations. As compensation for its services under the investment management agreement, Funds Management is entitled to receive a management fee at the following annual rate based on the Fund’s average daily net assets:
| | | | |
| |
| Average daily net assets | | Management fee | |
| |
First $1 billion | | | 0.350 | % |
| |
Next $4 billion | | | 0.325 | |
| |
Next $3 billion | | | 0.290 | |
| |
Next $2 billion | | | 0.265 | |
| |
Over $10 billion | | | 0.255 | |
For the six months ended February 29, 2020, the management fee was equivalent to an annual rate of 0.35% of the Fund’s average daily net assets.
Funds Management has retained the services of a subadviser to provide daily portfolio management to the Fund. The fee for subadvisory services is borne by Funds Management. Wells Capital Management Incorporated (“WellsCap”), an affiliate of Funds Management and an indirect wholly owned subsidiary of Wells Fargo, is the subadviser to the Fund and is entitled to receive a fee from Funds Management at an annual rate starting at 0.15% and declining to 0.05% as the average daily net assets of the Fund increase.
Administration fees
Under a class-level administration agreement, Funds Management provides class-level administrative services to the Fund, which includes paying fees and expenses for services provided by the transfer agent,sub-transfer agents, omnibus account servicers and record-keepers. As compensation for its services under the class-level administration agreement, Funds Management receives an annual fee which is calculated based on the average daily net assets of each class as follows:
| | | | |
| |
| | | Class-level
administration fee | |
| |
Class A, Class C | | | 0.16 | % |
| |
Class R6 | | | 0.03 | |
| |
Institutional Class | | | 0.08 | |
Waivers and/or expense reimbursements
Funds Management has contractually waived and/or reimbursed management and administration fees to the extent necessary to maintain certain net operating expense ratios for the Fund. When each class of the Fund has exceeded its expense cap, Funds Management has waived fees and/or reimbursed expenses from fund-level expenses on a proportionate basis and then from class specific expenses. When only certain classes exceed their expense caps, waivers and/or reimbursements are applied against class specific expenses before fund-level expenses. Funds Management has committed through December 31, 2020 to waive fees and/or reimburse expenses to the extent necessary to cap the Fund’s expenses at 0.72% for Class A shares, 1.47% for Class C shares, 0.40% for Class R6 shares, and 0.45% for Institutional Class shares. Prior to or after the commitment expiration date, the cap may be increased or the commitment to maintain the cap may be terminated only with the approval of the Board of Trustees.
Distribution fee
The Trust has adopted a distribution plan for Class C shares of the Fund pursuant to Rule12b-1 under the 1940 Act. A distribution fee is charged to Class C shares and paid to Wells Fargo Funds Distributor, LLC (“Funds Distributor”), the principal underwriter, at an annual rate of 0.75% of the average daily net assets of Class C shares.
In addition, Funds Distributor is entitled to receive thefront-end sales charge from the purchase of Class A shares and a contingent deferred sales charge on the redemption of certain Class A shares. Funds Distributor is also entitled to receive the contingent deferred sales charges from redemptions of Class C shares. For the six months ended February 29, 2020, Funds Distributor received $68 from the sale of Class A shares and $26 in contingent deferred sales charges from redemptions of Class C shares. No contingent deferred sales charges were incurred by Class A shares for the six months ended February 29, 2020.
28 | Wells Fargo Short-Term Bond Fund
Notes to financial statements (unaudited)
Shareholder servicing fees
The Trust has entered into contracts with one or more shareholder servicing agents, whereby Class A and Class C of the Fund are charged a fee at an annual rate of 0.25% of the average daily net assets of each respective class. A portion of these total shareholder servicing fees were paid to affiliates of Wells Fargo.
Interfund transactions
The Fund may purchase or sell portfolio investment securities to certain other Wells Fargo affiliates pursuant to Rule17a-7 under the 1940 Act and under procedures adopted by the Board of Trustees. The procedures have been designed to ensure that these interfund transactions, which do not incur broker commissions, are effected at current market prices.
5. INVESTMENT PORTFOLIO TRANSACTIONS
Purchases and sales of investments, excluding short-term securities, for the six months ended February 29, 2020 were as follows:
| | | | | | |
Purchases at cost | | Sales proceeds |
U.S.
government | | Non-U.S.
government | | U.S.
government | | Non-U.S.
government |
| $4,682,154 | | $170,506,421 | | $4,404,471 | | $93,329,757 |
6. SECURITIES LENDING TRANSACTIONS
The Fund lends its securities through an unaffiliated securities lending agent and receives collateral in the form of cash or securities with a value at least equal to the value of the securities on loan. The value of the loaned securities is determined at the close of each business day and any increases or decreases in the required collateral are exchanged between the Fund and the counterparty on the next business day. Cash collateral received is invested in the Securities Lending Fund which seeks to provide a positive return compared to the daily Fed Funds Open Rate by investing in high-quality, U.S. dollar-denominated short-term money market instruments and is exempt from registration under Section 3(c)(7) of the 1940 Act. Securities Lending Fund is managed by Funds Management and is subadvised by WellsCap. Funds Management receives an advisory fee starting at 0.05% and declining to 0.01% as the average daily net assets of the Securities Lending Fund increase. All of the fees received by Funds Management are paid to WellsCap for its services as subadviser.
In the event of counterparty default or the failure of a borrower to return a loaned security, the Fund has the right to use the collateral to offset any losses incurred. As of February 29, 2020, the Fund had securities lending transactions with the following counterparties which are subject to offset:
| | | | | | | | | | | | |
| | | |
| Counterparty | | Value of
securities on
loan | | | Collateral
received1 | | | Net amount | |
| | | |
Barclays Capital Inc. | | $ | 1,525,612 | | | $ | (1,525,612 | ) | | $ | 0 | |
| | | |
Citigroup Global Markets Inc. | | | 939,853 | | | | (939,853 | ) | | | 0 | |
| 1 | Collateral received within this table is limited to the collateral for the net transaction with the counterparty. |
7. DERIVATIVE TRANSACTIONS
During the six months ended February 29, 2020, the Fund entered into futures contracts to speculate on interest rates and to help manage the duration of the portfolio. The Fund had an average notional amount of $208,986,386 in long futures contracts and $36,918,272 in short futures contracts during the six months ended February 29, 2020.
The fair value, realized gains or losses and change in unrealized gains or losses, if any, on derivative instruments are reflected in the corresponding financial statement captions.
8. BANK BORROWINGS
The Trust (excluding the money market funds), Wells Fargo Master Trust and Wells Fargo Variable Trust are parties to a $280,000,000 revolving credit agreement whereby the Fund is permitted to use bank borrowings for temporary or emergency purposes, such as to fund shareholder redemption requests. Interest under the credit agreement is charged to the Fund based on a borrowing rate equal to the higher of the Federal Funds rate in effect on that day plus 1.25% or the overnight LIBOR rate in effect on that day plus 1.25%. In addition, an annual commitment fee equal to 0.25% of the unused balance is allocated to each participating fund.
For the six months ended February 29, 2020, there were no borrowings by the Fund under the agreement.
Wells Fargo Short-Term Bond Fund | 29
Notes to financial statements (unaudited)
9. INDEMNIFICATION
Under the Trust’s organizational documents, the officers and Trustees have been granted certain indemnification rights against certain liabilities that may arise out of performance of their duties to the Trust. Additionally, in the normal course of business, the Trust may enter into contracts with service providers that contain a variety of indemnification clauses. The Trust’s maximum exposure under these arrangements is dependent on future claims that may be made against the Fund and, therefore, cannot be estimated.
10. NEW ACCOUNTING PRONOUNCEMENTS
In August 2018, FASB issued Accounting Standards Update (“ASU”)No. 2018-13, Fair Value Measurement (Topic 820)Disclosure Framework—Changes to the Disclosure Requirements for Fair Value Measurement. ASU2018-13 updates the disclosure requirements for fair value measurements by modifying or removing certain disclosures and adding certain new disclosures. The amendments are effective for fiscal years, and interim periods within those fiscal years, beginning after December 15, 2019. Early adoption is permitted. Management has adopted the removal and modification of disclosures early, as permitted, and will adopt the additional new disclosures at the effective date.
In March 2017, FASB issued ASUNo. 2017-08,Premium Amortization on Purchased Callable Debt Securities. ASU2017-08
shortens the amortization period for certain callable debt securities held at a premium and requires the premium to be amortized to the earliest call date. The amendments do not require an accounting change for securities held at a discount and discounts will continue to be accreted to the maturity date of the security. ASU2017-08 is effective for fiscal years beginning after December 15, 2018 and for interim periods within those fiscal years. During the current reporting period, management of the Fund adopted the change in accounting policy which did not have a material impact to the Fund’s financial statements.
11. SUBSEQUENT EVENT
On March 11, 2020, the World Health Organization announced that it had made the assessment that coronavirus disease 2019(“COVID-19”) is a pandemic. The impacts ofCOVID-19 is adversely affecting the entire global economy, individual companies and investment products, and the market in general. There is significant uncertainty around the extent and duration of business disruptions related toCOVID-19 and the impact may be short term or may last for an extended period of time. The risk of further spreading ofCOVID-19 has led to significant uncertainty and volatility in the financial markets and the value of the Fund and the securities in which the Fund invests have generally been adversely affected by impacts caused byCOVID-19.
30 | Wells Fargo Short-Term Bond Fund
Other information (unaudited)
PROXY VOTING INFORMATION
A description of the policies and procedures used to determine how to vote proxies relating to portfolio securities is available, upon request, by calling1-800-222-8222, visiting our website atwfam.com, or visiting the SEC website at sec.gov. Information regarding how the proxies related to portfolio securities were voted during the most recent12-month period ended June 30 is available on the website atwfam.comor by visiting the SEC website at sec.gov.
QUARTERLY PORTFOLIO HOLDINGS INFORMATION
The Fund files its complete schedule of portfolio holdings with the SEC for the first and third quarters of each fiscal year as an exhibit to its reports on FormN-PORT. Shareholders may view the filed FormN-PORT by visiting the SEC website at sec.gov.
Wells Fargo Short-Term Bond Fund | 31
Other information (unaudited)
BOARD OF TRUSTEES AND OFFICERS
Each of the Trustees and Officers1 listed in the table below acts in identical capacities for each fund in the Wells Fargo family of funds, which consists of 146 mutual funds comprising the Wells Fargo Funds Trust, Wells Fargo Variable Trust, Wells Fargo Master Trust and fourclosed-end funds (collectively the “Fund Complex”). This table should be read in conjunction with the Prospectus and the Statement of Additional Information2. The mailing address of each Trustee and Officer is 525 Market Street, 12th Floor, San Francisco, CA 94105. Each Trustee and Officer serves an indefinite term, however, each Trustee serves such term until reaching the mandatory retirement age established by the Trustees.
Independent Trustees
| | | | | | |
Name and year of birth | | Position held and
length of service* | | Principal occupations during past five years or longer | | Current other
public company or
investment
company
directorships |
| | | |
William R. Ebsworth (Born 1957) | | Trustee, since 2015 | | Retired. From 1984 to 2013, equities analyst, portfolio manager, research director and chief investment officer at Fidelity Management and Research Company in Boston, Tokyo, and Hong Kong, and retired in 2013 as Chief Investment Officer of Fidelity Strategic Advisers, Inc. where he led a team of investment professionals managing client assets. Prior thereto, Board member of Hong Kong Securities Clearing Co., Hong Kong Options Clearing Corp., the Thailand International Fund, Ltd., Fidelity Investments Life Insurance Company, and Empire Fidelity Investments Life Insurance Company. Audit Committee Chair and Investment Committee Chair of the Vincent Memorial Hospital Endowment(non-profit organization). Mr. Ebsworth is a CFA® charterholder. | | N/A |
| | | |
Jane A. Freeman (Born 1953) | | Trustee, since 2015; Chair Liaison, since 2018 | | Retired. From 2012 to 2014 and 1999 to 2008, Chief Financial Officer of Scientific Learning Corporation. From 2008 to 2012, Ms. Freeman provided consulting services related to strategic business projects. Prior to 1999, Portfolio Manager at Rockefeller & Co. and Scudder, Stevens & Clark. Board member of the Harding Loevner Funds from 1996 to 2014, serving as both Lead Independent Director and chair of the Audit Committee. Board member of the Russell Exchange Traded Funds Trust from 2011 to 2012 and the chair of the Audit Committee. Ms. Freeman is a Board Member of The Ruth Bancroft Garden(non-profit organization). She is also an inactive Chartered Financial Analyst. | | N/A |
| | | |
Isaiah Harris, Jr. (Born 1952) | | Trustee, since 2009; Audit Committee Chairman, since 2019 | | Retired. Chairman of the Board of CIGNA Corporation since 2009, and Director since 2005. From 2003 to 2011, Director of Deluxe Corporation. Prior thereto, President and CEO of BellSouth Advertising and Publishing Corp. from 2005 to 2007, President and CEO of BellSouth Enterprises from 2004 to 2005 and President of BellSouth Consumer Services from 2000 to 2003. Emeritus member of the Iowa State University Foundation Board of Governors. Emeritus Member of the Advisory Board of Iowa State University School of Business. Advisory Board Member, Palm Harbor Academy (private school). Advisory Board Member, Child Evangelism Fellowship(non-profit). Mr. Harris is a certified public accountant (inactive status). | | CIGNA Corporation |
| | | |
Judith M. Johnson (Born 1949) | | Trustee, since 2008; Audit Committee Chairman, from 2009 to 2018 | | Retired. Prior thereto, Chief Executive Officer and Chief Investment Officer of Minneapolis Employees Retirement Fund from 1996 to 2008. Ms. Johnson is an attorney, certified public accountant and a certified managerial accountant. | | N/A |
32 | Wells Fargo Short-Term Bond Fund
Other information (unaudited)
| | | | | | |
Name and year of birth | | Position held and
length of service* | | Principal occupations during past five years or longer | | Current other
public company or
investment
company
directorships |
| | | |
David F. Larcker (Born 1950) | | Trustee, since 2009 | | James Irvin Miller Professor of Accounting at the Graduate School of Business, Stanford University, Director of the Corporate Governance Research Initiative and Senior Faculty of The Rock Center for Corporate Governance since 2006. From 2005 to 2008, Professor of Accounting at the Graduate School of Business, Stanford University. Prior thereto, Ernst & Young Professor of Accounting at The Wharton School, University of Pennsylvania from 1985 to 2005. | | N/A |
| | | |
Olivia S. Mitchell (Born 1953) | | Trustee, since 2006; Nominating and Governance Committee Chair, since 2018 | | International Foundation of Employee Benefit Plans Professor, Wharton School of the University of Pennsylvania since 1993. Director of Wharton’s Pension Research Council and Boettner Center on Pensions & Retirement Research, and Research Associate at the National Bureau of Economic Research. Previously, Cornell University Professor from 1978 to 1993. | | N/A |
| | | |
Timothy J. Penny (Born 1951) | | Trustee, since 1996; Chairman, since 2018 | | President and Chief Executive Officer of Southern Minnesota Initiative Foundation, anon-profit organization, since 2007. Member of the Board of Trustees of NorthStar Education Finance, Inc., anon-profit organization, since 2007. | | N/A |
| | | |
James G. Polisson (Born 1959) | | Trustee, since 2018 | | Retired. Chief Marketing Officer, Source (ETF) UK Services, Ltd, from 2015 to 2017. From 2012 to 2015, Principal of The Polisson Group, LLC, a management consulting, corporate advisory and principal investing company. Chief Executive Officer and Managing Director at Russell Investments, Global Exchange Traded Funds from 2010 to 2012. Managing Director of Barclays Global Investors from 1998 to 2010 and Global Chief Marketing Officer for iShares and Barclays Global Investors from 2000 to 2010. Trustee of the San Francisco Mechanics’ Institute, anon-profit organization, from 2013 to 2015. Board member of the Russell Exchange Traded Fund Trust from 2011 to 2012. Director of Barclays Global Investors Holdings Deutschland GmbH from 2006 to 2009. Mr. Polisson is an attorney and has a retired status with the Massachusetts and District of Columbia Bar Associations. | | N/A |
| | | |
Pamela Wheelock3 (Born 1959) | | Trustee, since January 2020; previously Trustee from January 2018 to July 2019 | | Board member of the Destination Medical Center Economic Development Agency, Rochester, Minnesota since 2019. Acting Commissioner, Minnesota Department of Human Services, July 2019 through September 2019. Human Services Manager (part-time), Minnesota Department of Human Services, October 2019 through December 2019. Chief Operating Officer, Twin Cities Habitat for Humanity from 2017 to 2019. Vice President of University Services, University of Minnesota from 2012 to 2016. Prior thereto, on the Board of Directors, Governance Committee and Finance Committee for the Minnesota Philanthropy Partners (Saint Paul Foundation) from 2012 to 2018, Interim Chief Executive Officer of Blue Cross Blue Shield of Minnesota from 2011 to 2012, Chairman of the Board from 2009 to 2012 and Board Director from 2003 to 2015. Vice President, Leadership and Community Engagement, Bush Foundation, Saint Paul, Minnesota (a private foundation) from 2009 to 2011. Executive Vice President and Chief Financial Officer, Minnesota Sports and Entertainment from 2004 to 2009 and Senior Vice President from 2002 to 2004. Executive Vice President of the Minnesota Wild Foundation from 2004 to 2008. Commissioner of Finance, State of Minnesota, from 1999 to 2002. Currently Board Chair of the Minnesota Wild Foundation since 2010. | | N/A |
| * | Length of service dates reflect the Trustee’s commencement of service with the Trust’s predecessor entities, where applicable. |
Wells Fargo Short-Term Bond Fund | 33
Other information (unaudited)
Officers
| | | | |
Name and
year of birth | | Position held and
length of service | | Principal occupations during past five years or longer |
| | |
Andrew Owen (Born 1960) | | President, since 2017 | | Executive Vice President of Wells Fargo & Company and Head of Affiliated Managers, Wells Fargo Asset Management, since 2014. In addition, Mr. Owen is currently President, Chief Executive Officer and Director of Wells Fargo Funds Management, LLC since 2017. Prior thereto, Executive Vice President responsible for marketing, investments and product development for Wells Fargo Funds Management, LLC, from 2009 to 2014. |
| | |
Nancy Wiser1 (Born 1967) | | Treasurer, since 2012 | | Executive Vice President of Wells Fargo Funds Management, LLC since 2011. Chief Operating Officer and Chief Compliance Officer at LightBox Capital Management LLC, from 2008 to 2011. |
| | |
Michelle Rhee (Born 1966) | | Chief Legal Officer, since 2019 | | Secretary of Wells Fargo Funds Management, LLC, Chief Legal Counsel of Wells Fargo Asset Management and Assistant General Counsel of Wells Fargo Bank, N.A. since 2018. Associate General Counsel and Managing Director of Bank of America Corporation from 2004 to 2018. |
| | |
Catherine Kennedy (Born 1969) | | Secretary, since 2019 | | Vice President of Wells Fargo Funds Management, LLC and Senior Counsel of the Wells Fargo Legal Department since 2010. Vice President and Senior Counsel of Evergreen Investment Management Company, LLC from 1998 to 2010. |
| | |
Michael H. Whitaker (Born 1967) | | Chief Compliance Officer, since 2016 | | Chief Compliance Officer of Wells Fargo Asset Management since 2016. Senior Vice President and Chief Compliance Officer for Fidelity Investments from 2007 to 2016. |
| | |
David Berardi (Born 1975) | | Assistant Treasurer, since 2009 | | Vice President of Wells Fargo Funds Management, LLC since 2009. Vice President of Evergreen Investment Management Company, LLC from 2008 to 2010. Manager of Fund Reporting and Control for Evergreen Investment Management Company, LLC from 2004 to 2010. |
| | |
Jeremy DePalma1 (Born 1974) | | Assistant Treasurer, since 2009 | | Senior Vice President of Wells Fargo Funds Management, LLC since 2009. Senior Vice President of Evergreen Investment Management Company, LLC from 2008 to 2010 and head of the Fund Reporting and Control Team within Fund Administration from 2005 to 2010. |
| 1 | Nancy Wiser acts as Treasurer of 64 funds in the Fund Complex. Jeremy DePalma acts as Treasurer of 82 funds and Assistant Treasurer of 64 funds in the Fund Complex. |
| 2 | The Statement of Additional Information includes additional information about the Trustees and is available, without charge, upon request, by calling1-800-222-8222 or by visiting the website atwfam.com. |
| 3 | Pamela Wheelock wasre-appointed to the Board effective January 1, 2020. |
34 | Wells Fargo Short-Term Bond Fund
Appendix I (unaudited)
Effective on or about May 1, 2020, if you purchase Fund shares through a Janney Montgomery Scott LLC (“Janney”) brokerage account, you will be eligible for the following load waivers(front-end sales charge waivers and contingent deferred sales charge (“CDSC”), orback-end sales charge, waivers) and discounts, which may differ from those disclosed elsewhere in the Fund’s Prospectus or SAI.
|
|
| Front-end sales charge* waivers on Class A shares available at Janney |
| Shares purchased through reinvestment of capital gains distributions and dividend reinvestment when purchasing shares of the same fund (but not any other fund within the fund family). |
| Shares purchased by employees and registered representatives of Janney or its affiliates and their family members as designated by Janney. |
| Shares purchased from the proceeds of redemptions within the same fund family, provided (1) the repurchase occurs within ninety (90) days following the redemption, (2) the redemption and purchase occur in the same account, and (3) redeemed shares were subject to afront-end or deferred sales load (i.e., right of reinstatement). |
| Employer-sponsored retirement plans (e.g., 401(k) plans, 457 plans, employer-sponsored 403(b) plans, profit sharing and money purchase pension plans and defined benefit plans). For purposes of this provision, employer-sponsored retirement plans do not include SEP IRAs, Simple IRAs,SAR-SEPs or Keogh plans. |
| Shares acquired through a right of reinstatement. |
| Class C shares that are no longer subject to a contingent deferred sales charge and are converted to Class A shares of the same fund pursuant to Janney’s policies and procedures. |
|
| CDSC waivers on Class A and Class C shares available at Janney |
| Shares sold upon the death or disability of the shareholder. |
| Shares sold as part of a systematic withdrawal plan as described in the Fund’s Prospectus. |
| Shares purchased in connection with a return of excess contributions from an IRA account. |
| Shares sold as part of a required minimum distribution for IRA and retirement accounts if the redemption is taken in or after the year the shareholder reaches qualified age based on applicable IRS regulations. |
| Shares sold to pay Janney fees but only if the transaction is initiated by Janney. |
| Shares acquired through a right of reinstatement. |
| Shares exchanged into the same share class of a different fund. |
|
| Front-end sales charge* discounts available at Janney; breakpoints, rights of accumulation and/or letters of intent |
| Breakpoints as described in the Fund’s Prospectus. |
| Rights of accumulation (“ROA”), which entitle shareholders to breakpoint discounts, will be automatically calculated based on the aggregated holding of fund family assets held by accounts within the purchaser’s household at Janney. Eligible fund family assets not held at Janney may be included in the ROA calculation only if the shareholder notifies his or her financial advisor about such assets. |
| Letters of intent which allow for breakpoint discounts based on anticipated purchases within a fund family, over a13-month time period. Eligible fund family assets not held at Janney Montgomery Scott may be included in the calculation of letters of intent only if the shareholder notifies his or her financial advisor about such assets. |
| * | Also referred to as an “initial sales charge.” |
Wells Fargo Short-Term Bond Fund | 35
Appendix II (unaudited)
Effective on or after May 1, 2020, clients of Edward Jones (also referred to as “shareholders”) purchasing Fund shares on the Edward Jones commission andfee-based platforms are eligible only for the following sales charge discounts (also referred to as “breakpoints”) and waivers, which can differ from breakpoints and waivers described elsewhere in this Prospectus or SAI or through another broker-dealer. In all instances, it is the shareholder’s responsibility to inform Edward Jones at the time of purchase of any relationship, holdings of Wells Fargo Funds or other facts qualifying the purchaser for breakpoints or waivers. Edward Jones can ask for documentation of such circumstance.
|
| Breakpoints available at Edward Jones |
|
| Rights of Accumulation (ROA) |
|
The applicable sales charge on a purchase of Class A shares is determined by taking into account all share classes (except any money market funds and retirement plan share classes) of Wells Fargo Funds held by the shareholder or in an account grouped by Edward Jones with other accounts for the purpose of providing certain pricing considerations (“pricing groups”). This includes all share classes held on the Edward Jones platform and/or held on another platform. The inclusion of eligible fund family assets in the rights of accumulation calculation is dependent on the shareholder notifying his or her financial advisor of such assets at the time of calculation. |
|
ROA is determined by calculating the higher of cost or market value (current shares x NAV). |
|
| Letter of Intent (LOI) |
|
Through a LOI, shareholders can receive the sales charge and breakpoint discounts for purchases shareholders intend to makeover a13-month period from the date Edward Jones receives the LOI. The LOI is determined by calculating the higher of cost or market value of qualifying holdings at LOI initiation in combination with the value that the shareholder intends to buy over a13-month period to calculate thefront-end sales charge and any breakpoint discounts. Each purchase the shareholder makes during that13-month period will receive the sales charge and breakpoint discount that applies to the total amount. The inclusion of eligible fund family assets in the LOI calculation is dependent on the shareholder notifying his or her financial advisor of such assets at the time of calculation. Purchases made before the LOI is received by Edward Jones are not covered under the LOI and will not reduce the sales charge previously paid. Sales charges will be adjusted if LOI is not met. |
| Sales charges are waived for the following shareholders and in the following situations at Edward Jones: |
● Associates of Edward Jones and its affiliates and their family members who are in the same pricing group (as determined by Edward Jones under its policies and procedures) as the associate. This waiver will continue for the remainder of the associate’s life if the associate retires from Edward Jones in good-standing. |
● Shares purchased in an Edward Jonesfee-based program. |
● Shares purchased through reinvestment of capital gains distributions and dividend reinvestment. |
● Shares purchased from the proceeds of redeemed shares of the same fund family so long as the following conditions are met: 1) the proceeds are from the sale of shares within 60 days of the purchase, and 2) the sale and purchase are made in the same share class and the same account or the purchase is made in an individual retirement account with proceeds from liquidations in anon-retirement account. |
● Shares exchanged into Class A shares from another share class so long as the exchange is into the same fund and was initiated at the discretion of Edward Jones. Edward Jones is responsible for any remaining CDSC due to the fund company, if applicable. Any future purchases are subject to the applicable sales charge as disclosed in the prospectus. |
● Exchanges from Class C shares to Class A shares of the same fund, generally, in the 84th month following the anniversary of the purchase date or earlier at the discretion of Edward Jones. |
If the shareholder purchases shares that are subject to a CDSC and those shares are redeemed before the CDSC is expired, the shareholder is
responsible to pay the CDSC except in the following conditions available at Edward Jones: |
● The death or disability of the shareholder. |
● Systematic withdrawals with up to 10% per year of the account value. |
● Return of excess contributions from an Individual Retirement Account (IRA). |
● Shares sold as part of a required minimum distribution for IRA and retirement accounts if the redemption is taken in or after the year the shareholder reaches qualified age based on applicable IRS regulation. |
● Shares sold to pay Edward Jones fees or costs in such cases where the transaction is initiated by Edward Jones. |
● Shares exchanged in an Edward Jonesfee-based program. |
● Shares acquired through NAV reinstatement. |
36 | Wells Fargo Short-Term Bond Fund
Appendix II (unaudited)
|
| Other Important Information for accounts at Edward Jones: |
Minimum Purchase Amounts ● $250 initial purchase minimum ● $50 subsequent purchase minimum |
Minimum Balances Edward Jones has the right to redeem at its discretion fund holdings with a balance of $250 or less. The following are examples of accounts that are not included in this policy: ● Afee-based account held on an Edward Jones platform ● A 529 account held on an Edward Jones platform ● An account with an active systematic investment plan or letter of intent (LOI) |
Changing Share Classes At any time it deems necessary, Edward Jones has the authority to exchange at NAV a shareholder’s holdings in a fund to Class A shares. |
Wells Fargo Short-Term Bond Fund | 37
This page is intentionally left blank.
This page is intentionally left blank.
This page is intentionally left blank.

For more information
More information about Wells Fargo Funds is available free upon request. To obtain literature, please write, visit the Fund’s website, or call:
Wells Fargo Funds
P.O. Box 219967
Kansas City, MO 64121-9967
Website:wfam.com
Individual investors:1-800-222-8222
Retail investment professionals:1-888-877-9275
Institutional investment professionals:1-866-765-0778

This report and the financial statements contained herein are submitted for the general information of the shareholders of the Fund. If this report is used for promotional purposes, distribution of the report must be accompanied or preceded by a current prospectus. Before investing, please consider the investment objectives, risks, charges, and expenses of the investment. For a current prospectus and, if available, a summary prospectus, containing this information, call1-800-222-8222 or visit the Fund’s website atwfam.com. Read the prospectus carefully before you invest or send money.
Wells Fargo Asset Management (WFAM) is the trade name for certain investment advisory/management firms owned by Wells Fargo & Company. These firms include but are not limited to Wells Capital Management Incorporated and Wells Fargo Funds Management, LLC. Certain products managed by WFAM entities are distributed by Wells Fargo Funds Distributor, LLC (a broker-dealer and Member FINRA).
This material is for general informational and educational purposes only and is NOT intended to provide investment advice or a recommendation of any kind—including a recommendation for any specific investment, strategy, or plan.
INVESTMENT PRODUCTS: NOT FDIC INSURED ◾ NO BANK GUARANTEE ◾ MAY LOSE VALUE
© 2020 Wells Fargo & Company. All rights reserved
PAR-0320-04744 04-20
SA221/SAR221 02-20
Semi-Annual Report
February 29, 2020
Wells Fargo
Short-Term High Yield Bond Fund
Beginning on January 1, 2021, as permitted by new regulations adopted by the Securities and Exchange Commission, paper copies of the Wells Fargo Funds’ annual and semi-annual shareholder reports issued after this date will no longer be sent by mail, unless you specifically request paper copies of the reports. Instead, the reports will be made available on the Funds’ website, and you will be notified by mail each time a report is posted and provided with a website address to access the report.
If you already elected to receive shareholder reports electronically, you will not be affected by this change and you need not take any action. You may elect to receive shareholder reports and other communications from the Fund electronically at any time by contacting your financial intermediary (such as a broker-dealer or bank) or, if you are a direct investor, by calling1-800-222-8222 or by enrolling at wellsfargo.com/advantagedelivery.
You may elect to receive all future reports in paper free of charge. If you invest through a financial intermediary, you can contact your financial intermediary to request that you continue to receive paper copies of your shareholder reports; if you invest directly with the Fund, you can call 1-800-222-8222. Your election to receive reports in paper will apply to all Wells Fargo Funds held in your account with your financial intermediary or, if you are a direct investor, to all Wells Fargo Funds that you hold.
|
|
|
Reduce clutter. Save trees. |
Sign up for electronic delivery of prospectuses and shareholder reports atwellsfargo.com/advantagedelivery |
The views expressed and any forward-looking statements are as of February 29, 2020, unless otherwise noted, and are those of the Fund managers and/or Wells Fargo Asset Management. Discussions of individual securities, or the markets generally, or any Wells Fargo Fund are not intended as individual recommendations. Future events or results may vary significantly from those expressed in any forward-looking statements. The views expressed are subject to change at any time in response to changing circumstances in the market. Wells Fargo Asset Management and the Fund disclaim any obligation to publicly update or revise any views expressed or forward-looking statements.
|
INVESTMENT PRODUCTS: NOT FDIC INSURED ◾ NO BANK GUARANTEE ◾ MAY LOSE VALUE |
Wells Fargo Short-Term High Yield Bond Fund | 1
Letter to shareholders (unaudited)

Andrew Owen
President
Wells Fargo Funds
“The fourth quarter started on a strong note, with U.S.-China trade tensions relaxing in October along with renewed optimism for a U.K. Brexit deal and positive macroeconomic data.”
Dear Shareholder:
We are pleased to offer you this semi-annual report for the Wells Fargo Short-Term High Yield Bond Fund for thesix-month period that ended February 29, 2020. As market volatility increased, returns for the period were more restrained after strong results in previous recent periods. However, supportive central banks addressed concerns over slowing global economic growth and international trade tensions.
Fixed-income and equity investors had
The period began with uncertainty, leading to central bank support.
In September, as the period began, the U.S. Federal Reserve (Fed) cut interest rates a second time in the third quarter. U.S. manufacturing data disappointed investors. The U.S. Congress announced it would pursue an impeachment investigation of President Trump. Meanwhile, the Brexit impasse showed no signs of resolution. Officials in China warned it would be difficult to reach the country’s annual economic growth goals considering the weight of tariffs and trade restrictions. Although the S&P 500 Index finished the third quarter with the bestyear-to-date returns in more than 20 years, concerns about future returns remained.
The fourth quarter started on a strong note, with U.S.-China trade tensions relaxing in October along with renewed optimism for a U.K. Brexit deal and positive macroeconomic data. The initial estimate of U.S. third-quarter gross domestic product growth was a resilient 1.9% annualized rate, while the U.S. unemployment rate fell to a50-year low of 3.5% in September. However, despite resilience among U.S. consumers, business confidence declined while manufacturing activity contracted. Concerned with a potential economic slowdown, the Fed lowered interest rates another quarter point in late October—its third rate cut in four months. This helped push the S&P 500 Index to anall-time high, while emerging market equities rallied and global bonds declined overall, reflecting a broad pickup in risk appetite.
| 1 | The S&P 500 Index consists of 500 stocks chosen for market size, liquidity, and industry group representation. It is a market-value-weighted index with each stock’s weight in the index proportionate to its market value. You cannot invest directly in an index. |
| 2 | The Morgan Stanley Capital International (MSCI) All Country World Index (ACWI) ex USA Index (Net) is a free-float-adjusted market-capitalization-weighted index that is designed to measure the equity market performance of developed markets, excluding the United States. Source: MSCI. MSCI makes no express or implied warranties or representations and shall have no liability whatsoever with respect to any MSCI data contained herein. The MSCI data may not be further redistributed or used as a basis for other indices or any securities or financial products. This report is not approved, reviewed, or produced by MSCI. You cannot invest directly in an index. |
| 3 | The MSCI Emerging Markets (EM) Index (Net) is a free-float-adjusted market-capitalization-weighted index that is designed to measure equity market performance of emerging markets. You cannot invest directly in an index. |
| 4 | The Bloomberg Barclays U.S. Aggregate Bond Index is a broad-based benchmark that measures the investment-grade, U.S. dollar-denominated, fixed-rate taxable bond market, including Treasuries, government-related and corporate securities, mortgage-backed securities (agency fixed-rate and hybrid adjustable-rate mortgage pass-throughs), asset-backed securities, and commercial mortgage-backed securities. You cannot invest directly in an index. |
| 5 | The Bloomberg Barclays Global Aggregateex-USD Index is an unmanaged index that provides a broad-based measure of the global investment-grade fixed-income markets excluding the U.S. dollar-denominated debt market. You cannot invest directly in an index. |
| 6 | The Bloomberg Barclays Municipal Bond Index is an unmanaged index composed of long-termtax-exempt bonds with a minimum credit rating of Baa. You cannot invest directly in an index. |
| 7 | The ICE BofA U.S. High Yield Index is a market-capitalization-weighted index of domestic and Yankee high-yield bonds. The index tracks the performance of high-yield securities traded in the U.S. bond market. You cannot invest directly in an index. Copyright 2020. ICE Data Indices, LLC. All rights reserved. |
2 | Wells Fargo Short-Term High Yield Bond Fund
Letter to shareholders (unaudited)
Equity markets continued to rally in November despite ongoing geopolitical risks. Hopes for a U.S.-China trade deal buoyed investor confidence. U.S. business sentiment improved slightly, and manufacturing and services activity picked up. With that positive backdrop, developed market equities outpaced those in emerging markets, and U.S. stocks, as reflected by the S&P 500 Index, outperformednon-U.S. stocks overall. While consumer confidence and purchasing manager activity rose in the eurozone, China reported weakening manufacturing and consumer data. Bond yields rose marginally, leading to slightly negative returns for global government and investment-grade corporate bonds.
Financial markets ended 2019 with a boost from the U.S. and China accord on a Phase One trade deal. That, along with the landslide win by thepro-Brexit U.K. Conservative Party in a national election and ongoing central bank support, gave investors greater confidence. U.S. economic indicators were generally positive, with the exception of manufacturing activity and business confidence. Consumer confidence was resilient, fed by a robust labor market, tame inflation, and lower interest rates, which boosted housing affordability and stimulated homebuyer activity. The impeachment of U.S. President Donald Trump had little impact on markets. Meanwhile, slowing Chinese economic activity, partly attributable to the trade war, led to further government stimulus atyear-end through lower reserve ratios, allowing banks to lend more money.
Theyear-end rally continued in early January 2020. However, capital market volatility picked up sharply in late January on concerns over the unknown impact of the novel coronavirus(COVID-19) on the global economy and stock markets. With sentiment somewhat souring, perceived safe havens did well in January. The U.S. dollar and Japanese yen both rose and government bonds outperformed equities. While the S&P 500 Index held its ground, emerging market equities tumbled, including those in Asia that are most exposed to viruses—physical or economic—originating in China.
In February, the coronavirus became the major market focus. Fears of the virus’s impact on global growth led to expectations of increased global central bank monetary policy support. That led the10-year Treasury yield to fall to anall-time low of 1.1% by the end of the month. Although equity markets initially shrugged off concerns about the outbreak, focusing instead on strong fourth-quarter earnings and improving business confidence in January, market sentiment turned sharply lower towardmonth-end and the S&P 500 Index lost 8.2% for the month. Oil prices tumbled as Russia and the Organization of the Petroleum Exporting Countries compounded a major decline in oil demand with a brutal price war, partly aimed at dissuading further U.S. shale production. As a result, the price of West Texas Intermediate crude oil fell 13% in February and 27% for 2020 year to date.
Don’t let short-term uncertainty derail long-term investment goals.
Periods of investment uncertainty can present challenges, but experience has taught us that maintaining long-term investment goals can be an effective way to plan for the future. Although diversification cannot guarantee an investment profit or prevent losses, we believe it can be an effective way to manage investment risk and potentially smooth out overall portfolio performance. We encourage investors to know their investments and to understand that appropriate levels of risk-taking may unlock opportunities.
Thank you for choosing to invest with Wells Fargo Funds. We appreciate your confidence in us and remain committed to helping you meet your financial needs.
Sincerely,

Andrew Owen
President
Wells Fargo Funds
“Capital market volatility picked up sharply in late January on concerns over the unknown impact of the novel coronavirus(COVID-19) on the global economy and stock markets.”
|
|
|
For further information about your Fund, contact your investment professional, visit our website at wfam.com, or call us directly at1-800-222-8222. |
Wells Fargo Short-Term High Yield Bond Fund | 3
Performance highlights (unaudited)
Investment objective
The Fund seeks total return, consisting of a high level of current income and capital appreciation.
Manager
Wells Fargo Funds Management, LLC
Subadviser
Wells Capital Management Incorporated
Portfolio managers
Niklas Nordenfelt, CFA®‡*
Michael J. Schueller, CFA®‡
Average annual total returns (%) as of February 29, 2020
| | | | | | | | | | | | | | | | | | | | | | | | | | | | | | | | | | |
| | | | |
| | | | | Including sales charge | | | Excluding sales charge | | | Expense ratios1 (%) | |
| | | | | | | | | |
| | | Inception date | | 1 year | | | 5 year | | | 10 year | | | 1 year | | | 5 year | | | 10 year | | | Gross | | | Net2 | |
| | | | | | | | | | |
| Class A (SSTHX) | | 2-29-2000 | | | -0.31 | | | | 2.03 | | | | 3.14 | | | | 2.77 | | | | 2.66 | | | | 3.46 | | | | 0.95 | | | | 0.82 | |
| | | | | | | | | | |
| Class C (WFHYX) | | 3-31-2008 | | | 1.00 | | | | 1.89 | | | | 2.68 | | | | 2.00 | | | | 1.89 | | | | 2.68 | | | | 1.70 | | | | 1.57 | |
| | | | | | | | | | |
| Administrator Class (WDHYX)3 | | 7-30-2010 | | | – | | | | – | | | | – | | | | 3.07 | | | | 2.82 | | | | 3.61 | | | | 0.89 | | | | 0.66 | |
| | | | | | | | | | |
| Institutional Class (STYIX)4 | | 11-30-2012 | | | – | | | | – | | | | – | | | | 3.22 | | | | 2.97 | | | | 3.71 | | | | 0.62 | | | | 0.51 | |
| | | | | | | | | | |
| ICE BofA High Yield U.S. Corporates, Cash Pay, BB Rated,1-5 Year Index5 | | – | | | – | | | | – | | | | – | | | | 5.03 | | | | 4.43 | | | | 6.02 | | | | – | | | | – | |
Figures quoted represent past performance, which is no guarantee of future results, and do not reflect taxes that a shareholder may pay on an investment in a fund. Investment return and principal value of an investment will fluctuate so that an investor’s shares, when redeemed, may be worth more or less than their original cost. Performance shown without sales charges would be lower if sales charges were reflected. Current performance may be lower or higher than the performance data quoted, which assumes the reinvestment of dividends and capital gains. Currentmonth-end performance is available on the Fund’s website,wfam.com.
Index returns do not include transaction costs associated with buying and selling securities, any mutual fund fees or expenses, or any taxes. It is not possible to invest directly in an index.
For Class A shares, the maximumfront-end sales charge is 3.00%. For Class C shares, the maximum contingent deferred sales charge is 1.00%. Performance including a contingent deferred sales charge assumes the sales charge for the corresponding time period. Administrator Class and Institutional Class shares are sold without afront-end sales charge or contingent deferred sales charge.
Bond values fluctuate in response to the financial condition of individual issuers, general market and economic conditions, and changes in interest rates. Changes in market conditions and government policies may lead to periods of heightened volatility in the bond market and reduced liquidity for certain bonds held by the Fund. In general, when interest rates rise, bond values fall and investors may lose principal value. Interest rate changes and their impact on the Fund and its share price can be sudden and unpredictable. High-yield securities have a greater risk of default and tend to be more volatile than higher-rated debt securities. Loans are subject to risks similar to those associated with other below investment-grade bond investments, such as credit risk (for example, risk of issuer default), below-investment-grade bond risk (for example, risk of greater volatility in value), and risk that the loan may become illiquid or difficult to price. The use of derivatives may reduce returns and/or increase volatility. Certain investment strategies tend to increase the total risk of an investment (relative to the broader market). The Fund is exposed to foreign investment risk. Consult the Fund’s prospectus for additional information on these and other risks.
Please see footnotes on page 5.
4 | Wells Fargo Short-Term High Yield Bond Fund
Performance highlights (unaudited)
| | | | |
| |
| Ten largest holdings (%) as of February 29, 20206 | | | |
| | |
Sirius XM Radio Incorporated, 3.88%,8-1-2022 | | | 1.93 | |
| | |
Charter Communications Operating LLC, 3.36%,4-30-2025 | | | 1.90 | |
| | |
Ineos US Finance LLC, 3.60%,4-1-2024 | | | 1.69 | |
| | |
TerraForm Power Operating LLC, 4.25%,1-31-2023 | | | 1.58 | |
| | |
Teva Pharmaceutical Finance BV, 2.20%,7-21-2021 | | | 1.53 | |
| | |
Netflix Incorporated, 5.38%,2-1-2021 | | | 1.49 | |
| | |
Nielsen Holding and Finance BV, 5.00%,4-14-2022 | | | 1.38 | |
| | |
Washington Prime Group Incorporated, 3.85%,4-1-2020 | | | 1.30 | |
| | |
Springleaf Finance Corporation, 7.75%,10-1-2021 | | | 1.28 | |
| | |
Advanced Disposal Services Incorporated, 3.83%,11-10-2023 | | | 1.28 | |
|
|
| Credit quality as of February 29, 20207 |
|
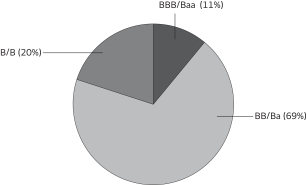 |
| ‡ | CFA® and Chartered Financial Analyst® are trademarks owned by CFA Institute. |
| * | Mr. Nordenfelt became a portfolio manager of the Fund on January 15, 2020. |
| 1 | Reflects the expense ratios as stated in the most recent prospectuses, which include the impact of 0.01% in acquired fund fees and expenses. The expense ratios shown are subject to change and may differ from the annualized expense ratios shown in the financial highlights of this report, which do not include acquired fund fees and expenses. |
| 2 | The manager has contractually committed through December 31, 2020, to waive fees and/or reimburse expenses to the extent necessary to cap total annual fund operating expenses after fee waivers at 0.81% for Class A, 1.56% for Class C, 0.65% for Administrator Class, and 0.50% for Institutional Class. Brokerage commissions, stamp duty fees, interest, taxes, acquired fund fees and expenses (if any), and extraordinary expenses are excluded from the expense cap. Prior to or after the commitment expiration date, the cap may be increased or the commitment to maintain the cap may be terminated only with the approval of the Board of Trustees. Without this cap, the Fund’s returns would have been lower. The expense ratio paid by an investor is the net expense ratio (the total annual fund operating expenses after fee waivers) as stated in the prospectuses. |
| 3 | Historical performance shown for the Administrator Class shares prior to their inception reflects the performance of the Class A shares and includes the higher expenses applicable to the Class A shares. If these expenses had not been included, returns for the Administrator Class shares would be higher. |
| 4 | Historical performance shown for the Institutional Class shares prior to their inception reflects the performance of the Administrator Class shares and includes the higher expenses applicable to the Administrator Class shares. If these expenses had not been included, returns for the Institutional Class shares would be higher. |
| 5 | The ICE BofA High Yield U.S. Corporates, Cash Pay, BB Rated,1-5 Year Index is an unmanaged index that generally tracks the performance of BB rated U.S. dollar-denominated corporate bonds publicly issued in the U.S. domestic market with maturities of one to five years. You cannot invest directly in an index. |
| 6 | The ten largest holdings, excluding cash, cash equivalents and any money market funds, are calculated based on the value of the investments divided by total net assets of the Fund. Holdings are subject to change and may have changed since the date specified. |
| 7 | The credit quality distribution of portfolio holdings reflected in the chart is based on ratings from Standard & Poor’s, Moody’s Investors Service, and/or Fitch Ratings Ltd. Credit quality ratings apply to the underlying holdings of the Fund and not to the Fund itself. The percentages of the Fund’s portfolio with the ratings depicted in the chart are calculated based on the total market value of fixed income securities held by the Fund. If a security was rated by all three rating agencies, the middle rating was utilized. If rated by two of three rating agencies, the lower rating was utilized, and if rated by one of the rating agencies, that rating was utilized. Standard & Poor’s rates the creditworthiness of bonds, ranging from AAA (highest) to D (lowest). Ratings from A to CCC may be modified by the addition of a plus (+) or minus (-) sign to show relative standing within the rating categories. Standard & Poor’s rates the creditworthiness of short-term notes fromSP-1 (highest) toSP-3 (lowest). Moody’s rates the creditworthiness of bonds, ranging from Aaa (highest) to C (lowest). Ratings Aa to B may be modified by the addition of a number 1 (highest) to 3 (lowest) to show relative standing within the ratings categories. Moody’s rates the creditworthiness of short-term U.S.tax-exempt municipal securities from MIG 1/VMIG 1 (highest) to SG (lowest). Fitch rates the creditworthiness of bonds, ranging from AAA (highest) to D (lowest). Credit quality distribution is subject to change and may have changed since the date specified. |
Wells Fargo Short-Term High Yield Bond Fund | 5
Fund expenses (unaudited)
As a shareholder of the Fund, you incur two types of costs: (1) transaction costs, including sales charges (loads) on purchase payments and contingent deferred sales charges (if any) on redemptions and (2) ongoing costs, including management fees, distribution(12b-1) and/or shareholder servicing fees, and other Fund expenses. This example is intended to help you understand your ongoing costs (in dollars) of investing in the Fund and to compare these costs with the ongoing costs of investing in other mutual funds.
The example is based on an investment of $1,000 invested at the beginning of thesix-month period and held for the entire period from September 1, 2019 to February 29, 2020.
Actual expenses
The “Actual” line of the table below provides information about actual account values and actual expenses. You may use the information in this line, together with the amount you invested, to estimate the expenses that you paid over the period. Simply divide your account value by $1,000 (for example, an $8,600 account value divided by $1,000 = 8.6), then multiply the result by the number in the “Actual” line under the heading entitled “Expenses paid during period” for your applicable class of shares to estimate the expenses you paid on your account during this period.
Hypothetical example for comparison purposes
The “Hypothetical” line of the table below provides information about hypothetical account values and hypothetical expenses based on the Fund’s actual expense ratio and an assumed rate of return of 5% per year before expenses, which is not the Fund’s actual return. The hypothetical account values and expenses may not be used to estimate the actual ending account balance or expenses you paid for the period. You may use this information to compare the ongoing costs of investing in the Fund and other funds. To do so, compare this 5% hypothetical example with the 5% hypothetical examples that appear in the shareholder reports of the other funds.
Please note that the expenses shown in the table are meant to highlight your ongoing costs only and do not reflect any transactional costs, such as sales charges (loads) and contingent deferred sales charges. Therefore, the “Hypothetical” line of the table is useful in comparing ongoing costs only and will not help you determine the relative total costs of owning different funds. In addition, if these transactional costs were included, your costs would have been higher.
| | | | | | | | | | | | | | | | |
| | | Beginning
account value
9-1-2019 | | | Ending
account value
2-29-2020 | | | Expenses
paid during
the period¹ | | | Annualized net
expense ratio | |
| | | | | |
Class A | | | | | | | | | | | | | | | | |
| | | | |
Actual | | $ | 1,000.00 | | | $ | 1,005.68 | | | $ | 4.04 | | | | 0.81 | % |
| | | | |
Hypothetical (5% return before expenses) | | $ | 1,000.00 | | | $ | 1,020.84 | | | $ | 4.07 | | | | 0.81 | % |
| | | | | |
Class C | | | | | | | | | | | | | | | | |
| | | | |
Actual | | $ | 1,000.00 | | | $ | 1,000.68 | | | $ | 7.76 | | | | 1.56 | % |
| | | | |
Hypothetical (5% return before expenses) | | $ | 1,000.00 | | | $ | 1,017.11 | | | $ | 7.82 | | | | 1.56 | % |
| | | | | |
Administrator Class | | | | | | | | | | | | | | | | |
| | | | |
Actual | | $ | 1,000.00 | | | $ | 1,006.47 | | | $ | 3.24 | | | | 0.65 | % |
| | | | |
Hypothetical (5% return before expenses) | | $ | 1,000.00 | | | $ | 1,021.63 | | | $ | 3.27 | | | | 0.65 | % |
| | | | | |
Institutional Class | | | | | | | | | | | | | | | | |
| | | | |
Actual | | $ | 1,000.00 | | | $ | 1,007.21 | | | $ | 2.50 | | | | 0.50 | % |
| | | | |
Hypothetical (5% return before expenses) | | $ | 1,000.00 | | | $ | 1,022.38 | | | $ | 2.51 | | | | 0.50 | % |
| 1 | Expenses paid is equal to the annualized net expense ratio of each class multiplied by the average account value over the period, multiplied by the number of days in the most recent fiscal half-year divided by the number of days in the fiscal year (to reflect theone-half-year period). |
6 | Wells Fargo Short-Term High Yield Bond Fund
Portfolio of investments—February 29, 2020 (unaudited)
| | | | | | | | | | | | | | | | |
| | | Interest
rate | | | Maturity
date | | | Principal | | | Value | |
| Corporate Bonds and Notes: 60.57% | |
|
Communication Services: 8.89% | |
|
| Diversified Telecommunication Services: 1.65% | |
CenturyLink Incorporated | | | 6.45 | % | | | 6-15-2021 | | | $ | 4,030,000 | | | $ | 4,181,125 | |
CenturyLink Incorporated Series W | | | 6.75 | | | | 12-1-2023 | | | | 7,000,000 | | | | 7,697,970 | |
Level 3 Financing Incorporated | | | 5.38 | | | | 1-15-2024 | | | | 3,390,000 | | | | 3,381,593 | |
| | | | |
| | | | | | | | | | | | | | | 15,260,688 | |
| | | | | | | | | | | | | | | | |
|
| Entertainment: 1.49% | |
Netflix Incorporated | | | 5.38 | | | | 2-1-2021 | | | | 13,445,000 | | | | 13,713,900 | |
| | | | | | | | | | | | | | | | |
|
| Media: 4.19% | |
Block Communications Incorporated 144A | | | 6.88 | | | | 2-15-2025 | | | | 4,770,000 | | | | 4,932,180 | |
CSC Holdings LLC | | | 6.75 | | | | 11-15-2021 | | | | 900,000 | | | | 952,218 | |
DISH DBS Corporation | | | 5.88 | | | | 7-15-2022 | | | | 4,835,000 | | | | 5,045,081 | |
DISH DBS Corporation | | | 6.75 | | | | 6-1-2021 | | | | 4,030,000 | | | | 4,173,105 | |
Lamar Media Corporation | | | 5.00 | | | | 5-1-2023 | | | | 5,115,000 | | | | 5,153,363 | |
Nielsen Finance LLC 144A | | | 5.00 | | | | 4-15-2022 | | | | 600,000 | | | | 597,000 | |
Sirius XM Radio Incorporated 144A | | | 3.88 | | | | 8-1-2022 | | | | 17,870,000 | | | | 17,827,648 | |
| | | | |
| | | | | | | | | | | | | | | 38,680,595 | |
| | | | | | | | | | | | | | | | |
|
| Wireless Telecommunication Services: 1.56% | |
Sprint Corporation | | | 7.88 | | | | 9-15-2023 | | | | 4,080,000 | | | | 4,664,786 | |
T-Mobile USA Incorporated | | | 4.00 | | | | 4-15-2022 | | | | 9,442,000 | | | | 9,689,853 | |
| | | | |
| | | | | | | | | | | | | | | 14,354,639 | |
| | | | | | | | | | | | | | | | |
|
Consumer Discretionary: 9.31% | |
|
| Auto Components: 0.34% | |
Allison Transmission Incorporated 144A | | | 5.00 | | | | 10-1-2024 | | | | 3,085,000 | | | | 3,119,583 | |
| | | | | | | | | | | | | | | | |
|
| Hotels, Restaurants & Leisure: 0.41% | |
MGM Resorts International | | | 7.75 | | | | 3-15-2022 | | | | 3,455,000 | | | | 3,783,225 | |
| | | | | | | | | | | | | | | | |
|
| Household Durables: 3.26% | |
KB Home | | | 7.50 | | | | 9-15-2022 | | | | 8,055,000 | | | | 9,041,738 | |
Lennar Corporation | | | 6.63 | | | | 5-1-2020 | | | | 2,485,000 | | | | 2,498,668 | |
Newell Brands Incorporated | | | 3.85 | | | | 4-1-2023 | | | | 6,973,000 | | | | 7,249,521 | |
Pulte Group Incorporated | | | 4.25 | | | | 3-1-2021 | | | | 11,145,000 | | | | 11,284,313 | |
| | | | |
| | | | | | | | | | | | | | | 30,074,240 | |
| | | | | | | | | | | | | | | | |
|
| Internet & Direct Marketing Retail: 0.32% | |
QVC Incorporated | | | 4.38 | | | | 3-15-2023 | | | | 2,865,000 | | | | 2,984,053 | |
| | | | | | | | | | | | | | | | |
|
| Specialty Retail: 4.53% | |
Gap Incorporated | | | 5.95 | | | | 4-12-2021 | | | | 8,965,000 | | | | 9,123,334 | |
Group 1 Automotive Incorporated | | | 5.00 | | | | 6-1-2022 | | | | 10,865,000 | | | | 10,824,408 | |
L Brands Incorporated | | | 6.63 | | | | 4-1-2021 | | | | 7,805,000 | | | | 8,127,347 | |
Penske Auto Group Incorporated | | | 3.75 | | | | 8-15-2020 | | | | 2,655,000 | | | | 2,661,638 | |
Penske Auto Group Incorporated | | | 5.75 | | | | 10-1-2022 | | | | 10,920,000 | | | | 11,029,200 | |
| | | | |
| | | | | | | | | | | | | | | 41,765,927 | |
| | | | | | | | | | | | | | | | |
|
Consumer Staples: 2.26% | |
|
| Food Products: 0.99% | |
New Albertsons Incorporated | | | 6.63 | | | | 6-15-2024 | | | | 8,895,000 | | | | 9,139,613 | |
| | | | | | | | | | | | | | | | |
The accompanying notes are an integral part of these financial statements.
Wells Fargo Short-Term High Yield Bond Fund | 7
Portfolio of investments—February 29, 2020 (unaudited)
| | | | | | | | | | | | | | | | |
| | | Interest
rate | | | Maturity
date | | | Principal | | | Value | |
|
| Personal Products: 1.27% | |
Edgewell Personal Care Company | | | 4.70 | % | | | 5-19-2021 | | | $ | 10,774,000 | | | $ | 10,900,595 | |
Edgewell Personal Care Company | | | 4.70 | | | | 5-24-2022 | | | | 785,000 | | | | 803,746 | |
| | | | |
| | | | | | | | | | | | | | | 11,704,341 | |
| | | | | | | | | | | | | | | | |
|
Energy: 9.56% | |
|
| Oil, Gas & Consumable Fuels: 9.56% | |
Antero Resources Corporation | | | 5.38 | | | | 11-1-2021 | | | | 4,955,000 | | | | 4,131,231 | |
Archrock Partners LP | | | 6.00 | | | | 10-1-2022 | | | | 6,445,000 | | | | 6,450,801 | |
Buckeye Partners LP 144A | | | 4.13 | | | | 3-1-2025 | | | | 1,360,000 | | | | 1,360,136 | |
Crestwood Midstream Partners LP | | | 6.25 | | | | 4-1-2023 | | | | 5,620,000 | | | | 5,340,124 | |
DCP Midstream Operating LP 144A | | | 4.75 | | | | 9-30-2021 | | | | 4,660,000 | | | | 4,632,972 | |
DCP Midstream Operating LP 144A | | | 5.35 | | | | 3-15-2020 | | | | 7,943,000 | | | | 7,952,942 | |
NuStar Logistics LP | | | 4.80 | | | | 9-1-2020 | | | | 5,365,000 | | | | 5,398,531 | |
Rockies Express Pipeline LLC 144A | | | 5.63 | | | | 4-15-2020 | | | | 3,390,000 | | | | 3,400,408 | |
Sabine Pass Liquefaction LLC | | | 5.63 | | | | 2-1-2021 | | | | 8,000,000 | | | | 8,186,730 | |
Southern Star Central Corporation 144A | | | 5.13 | | | | 7-15-2022 | | | | 11,095,000 | | | | 11,241,802 | |
Suburban Propane Partners LP | | | 5.50 | | | | 6-1-2024 | | | | 9,025,000 | | | | 8,930,418 | |
Sunoco LP | | | 4.88 | | | | 1-15-2023 | | | | 2,755,000 | | | | 2,746,790 | |
Tallgrass Energy Partners LP 144A | | | 4.75 | | | | 10-1-2023 | | | | 9,565,000 | | | | 9,182,591 | |
Targa Resources Partners LP | | | 4.25 | | | | 11-15-2023 | | | | 9,345,000 | | | | 9,256,223 | |
| | | | |
| | | | | | | | | | | | | | | 88,211,699 | |
| | | | | | | | | | | | | | | | |
|
Financials: 5.71% | |
|
| Banks: 1.02% | |
CIT Group Incorporated | | | 5.00 | | | | 8-15-2022 | | | | 9,000,000 | | | | 9,409,680 | |
| | | | | | | | | | | | | | | | |
|
| Capital Markets: 0.71% | |
Blue Cube Spinco Incorporated | | | 10.00 | | | | 10-15-2025 | | | | 6,045,000 | | | | 6,543,713 | |
| | | | | | | | | | | | | | | | |
|
| Consumer Finance: 3.40% | |
Ford Motor Credit Company LLC | | | 3.34 | | | | 3-18-2021 | | | | 5,105,000 | | | | 5,149,843 | |
Ford Motor Credit Company LLC | | | 5.60 | | | | 1-7-2022 | | | | 4,840,000 | | | | 5,106,789 | |
Navient Corporation | | | 5.00 | | | | 10-26-2020 | | | | 4,950,000 | | | | 4,998,015 | |
Navient Corporation | | | 8.00 | | | | 3-25-2020 | | | | 1,663,000 | | | | 1,668,821 | |
Springleaf Finance Corporation | | | 6.13 | | | | 3-15-2024 | | | | 2,500,000 | | | | 2,634,600 | |
Springleaf Finance Corporation | | | 7.75 | | | | 10-1-2021 | | | | 11,145,000 | | | | 11,842,788 | |
| | | | |
| | | | | | | | | | | | | | | 31,400,856 | |
| | | | | | | | | | | | | | | | |
|
| Insurance: 0.53% | |
Genworth Holdings Incorporated | | | 7.63 | | | | 9-24-2021 | | | | 4,760,000 | | | | 4,887,663 | |
| | | | | | | | | | | | | | | | |
|
| Mortgage REITs: 0.05% | |
Starwood Property Trust Incorporated | | | 5.00 | | | | 12-15-2021 | | | | 465,000 | | | | 459,778 | |
| | | | | | | | | | | | | | | | |
|
Health Care: 6.71% | |
|
| Health Care Providers & Services: 6.71% | |
Acadia Healthcare Company Incorporated | | | 5.13 | | | | 7-1-2022 | | | | 7,232,000 | | | | 7,241,040 | |
Acadia Healthcare Company Incorporated | | | 6.13 | | | | 3-15-2021 | | | | 1,618,000 | | | | 1,622,045 | |
Centene Corporation | | | 4.75 | | | | 5-15-2022 | | | | 10,555,000 | | | | 10,656,750 | |
Centene Corporation 144A | | | 4.75 | | | | 1-15-2025 | | | | 3,375,000 | | | | 3,460,556 | |
HCA Incorporated | | | 5.88 | | | | 5-1-2023 | | | | 4,365,000 | | | | 4,768,763 | |
HealthSouth Corporation | | | 5.13 | | | | 3-15-2023 | | | | 7,545,000 | | | | 7,563,863 | |
Magellan Health Incorporated | | | 4.90 | | | | 9-22-2024 | | | | 4,710,000 | | | | 4,827,750 | |
The accompanying notes are an integral part of these financial statements.
8 | Wells Fargo Short-Term High Yield Bond Fund
Portfolio of investments—February 29, 2020 (unaudited)
| | | | | | | | | | | | | | | | |
| | | Interest
rate | | | Maturity
date | | | Principal | | | Value | |
|
| Health Care Providers & Services (continued) | |
MEDNAX Incorporated 144A | | | 5.25 | % | | | 12-1-2023 | | | $ | 8,890,000 | | | $ | 8,701,088 | |
Molina Healthcare Incorporated | | | 5.38 | | | | 11-15-2022 | | | | 6,800,000 | | | | 7,076,896 | |
Tenet Healthcare Corporation | | | 4.63 | | | | 7-15-2024 | | | | 3,310,000 | | | | 3,310,066 | |
Universal Health Services Incorporated 144A | | | 4.75 | | | | 8-1-2022 | | | | 2,700,000 | | | | 2,705,438 | |
| | | | |
| | | | | | | | | | | | | | | 61,934,255 | |
| | | | | | | | | | | | | | | | |
|
Industrials: 5.27% | |
|
| Aerospace & Defense: 0.97% | |
Alcoa Incorporated | | | 6.15 | | | | 8-15-2020 | | | | 8,830,000 | | | | 8,965,011 | |
| | | | | | | | | | | | | | | | |
|
| Airlines: 1.34% | |
American Airlines Group Company 144A | | | 5.00 | | | | 6-1-2022 | | | | 10,255,000 | | | | 10,280,638 | |
United Continental Holdings Incorporated | | | 4.25 | | | | 10-1-2022 | | | | 2,100,000 | | | | 2,100,000 | |
| | | | |
| | | | | | | | | | | | | | | 12,380,638 | |
| | | | | | | | | | | | | | | | |
|
| Commercial Services & Supplies: 1.02% | |
ADT Corporation | | | 6.25 | | | | 10-15-2021 | | | | 9,025,000 | | | | 9,410,548 | |
| | | | | | | | | | | | | | | | |
|
| Construction & Engineering: 0.79% | |
Great Lakes Dredge & Dock Corporation | | | 8.00 | | | | 5-15-2022 | | | | 4,030,000 | | | | 4,215,783 | |
Taylor Morrison Communities Incorporated 144A | | | 5.88 | | | | 4-15-2023 | | | | 2,870,000 | | | | 3,070,900 | |
| | | | |
| | | | | | | | | | | | | | | 7,286,683 | |
| | | | | | | | | | | | | | | | |
|
| Trading Companies & Distributors: 1.15% | |
Fortress Transportation & Infrastructure Investors LLC 144A | | | 6.75 | | | | 3-15-2022 | | | | 10,600,000 | | | | 10,621,412 | |
| | | | | | | | | | | | | | | | |
|
Information Technology: 3.33% | |
|
| IT Services: 1.01% | |
Cardtronics Incorporated 144A | | | 5.50 | | | | 5-1-2025 | | | | 9,135,000 | | | | 9,363,375 | |
| | | | | | | | | | | | | | | | |
|
| Software: 1.51% | |
Symantec Corporation | | | 4.20 | | | | 9-15-2020 | | | | 10,675,000 | | | | 10,723,062 | |
Symantec Corporation 144A | | | 5.00 | | | | 4-15-2025 | | | | 3,135,000 | | | | 3,182,533 | |
| | | | |
| | | | | | | | | | | | | | | 13,905,595 | |
| | | | | | | | | | | | | | | | |
|
| Technology Hardware, Storage & Peripherals: 0.81% | |
Dell International LLC 144A | | | 5.88 | | | | 6-15-2021 | | | | 1,436,000 | | | | 1,444,544 | |
Dell International LLC 144A | | | 7.13 | | | | 6-15-2024 | | | | 2,400,000 | | | | 2,511,000 | |
EMC Corporation | | | 2.65 | | | | 6-1-2020 | | | | 3,555,000 | | | | 3,543,269 | |
| | | | |
| | | | | | | | | | | | | | | 7,498,813 | |
| | | | | | | | | | | | | | | | |
|
Materials: 3.83% | |
|
| Chemicals: 0.98% | |
Chemours Company | | | 6.63 | | | | 5-15-2023 | | | | 9,445,000 | | | | 9,098,652 | |
| | | | | | | | | | | | | | | | |
|
| Containers & Packaging: 1.48% | |
Owens-Brockway Glass Container Incorporated 144A | | | 5.00 | | | | 1-15-2022 | | | | 6,910,000 | | | | 7,117,300 | |
Sealed Air Corporation 144A | | | 5.13 | | | | 12-1-2024 | | | | 1,330,000 | | | | 1,426,425 | |
Sealed Air Corporation 144A | | | 5.25 | | | | 4-1-2023 | | | | 4,835,000 | | | | 5,094,881 | |
| | | | |
| | | | | | | | | | | | | | | 13,638,606 | |
| | | | | | | | | | | | | | | | |
|
| Metals & Mining: 1.37% | |
Freeport-McMoRan Incorporated | | | 3.55 | | | | 3-1-2022 | | | | 8,404,000 | | | | 8,478,796 | |
Freeport-McMoRan Incorporated « | | | 4.00 | | | | 11-14-2021 | | | | 4,055,000 | | | | 4,178,678 | |
| | | | |
| | | | | | | | | | | | | | | 12,657,474 | |
| | | | | | | | | | | | | | | | |
The accompanying notes are an integral part of these financial statements.
Wells Fargo Short-Term High Yield Bond Fund | 9
Portfolio of investments—February 29, 2020 (unaudited)
| | | | | | | | | | | | | | | | |
| | | Interest
rate | | | Maturity
date | | | Principal | | | Value | |
|
Real Estate: 3.37% | |
|
| Equity REITs: 1.05% | |
CoreCivic Incorporated | | | 4.63 | % | | | 5-1-2023 | | | $ | 6,812,000 | | | $ | 6,826,986 | |
CoreCivic Incorporated | | | 5.00 | | | | 10-15-2022 | | | | 970,000 | | | | 989,885 | |
SBA Communications Corporation | | | 4.00 | | | | 10-1-2022 | | | | 1,885,000 | | | | 1,905,773 | |
| | | | |
| | | | | | | | | | | | | | | 9,722,644 | |
| | | | | | | | | | | | | | | | |
|
| Real Estate Management & Development: 2.32% | |
Realogy Group LLC 144A | | | 5.25 | | | | 12-1-2021 | | | | 9,335,000 | | | | 9,381,675 | |
Washington Prime Group Incorporated « | | | 3.85 | | | | 4-1-2020 | | | | 12,039,000 | | | | 12,039,000 | |
| | | | |
| | | | | | | | | | | | | | | 21,420,675 | |
| | | | | | | | | | | | | | | | |
|
Utilities: 2.77% | |
|
| Electric Utilities: 0.68% | |
DPL Incorporated | | | 7.25 | | | | 10-15-2021 | | | | 3,490,000 | | | | 3,612,150 | |
NextEra Energy Operating Partners LP 144A | | | 4.25 | | | | 7-15-2024 | | | | 2,575,000 | | | | 2,622,638 | |
| | | | |
| | | | | | | | | | | | | | | 6,234,788 | |
| | | | | | | | | | | | | | | | |
|
| Independent Power & Renewable Electricity Producers: 2.09% | |
TerraForm Power Operating LLC 144A | | | 4.25 | | | | 1-31-2023 | | | | 14,368,000 | | | | 14,601,767 | |
The AES Corporation | | | 4.50 | | | | 3-15-2023 | | | | 4,760,000 | | | | 4,736,295 | |
| | | | |
| | | | | | | | | | | | | | | 19,338,062 | |
| | | | | | | | | | | | | | | | |
| |
Total Corporate Bonds and Notes (Cost $563,166,601) | | | | 558,971,424 | |
| | | | | |
|
| Loans: 22.60% | |
|
Communication Services: 6.54% | |
|
| Diversified Telecommunication Services: 0.38% | |
Level 3 Financing Incorporated (1 Month LIBOR +1.75%)± | | | 3.35 | | | | 3-1-2027 | | | | 3,547,913 | | | | 3,463,650 | |
| | | | | | | | | | | | | | | | |
|
| Media: 4.81% | |
Charter Communications Operating LLC (1 Month LIBOR +1.75%)± | | | 3.36 | | | | 4-30-2025 | | | | 17,745,294 | | | | 17,536,787 | |
CSC Holdings LLC (1 Month LIBOR +2.50%)± | | | 4.16 | | | | 4-15-2027 | | | | 10,924,370 | | | | 10,787,815 | |
Diamond Sports Group LLC (1 Month LIBOR +3.25%)± | | | 4.88 | | | | 8-24-2026 | | | | 9,975,000 | | | | 9,077,250 | |
Neptune Finco Corporation (1 Month LIBOR +2.25%)± | | | 3.91 | | | | 1-15-2026 | | | | 2,450,250 | | | | 2,411,977 | |
Virgin Media Bristol LLC (1 Month LIBOR +2.50%)± | | | 4.16 | | | | 1-31-2028 | | | | 4,615,000 | | | | 4,530,407 | |
| | | | |
| | | | | | | | | | | | | | | 44,344,236 | |
| | | | | | | | | | | | | | | | |
|
| Wireless Telecommunication Services: 1.35% | |
SBA Senior Finance II LLC (1 Month LIBOR +1.75%)± | | | 3.36 | | | | 4-11-2025 | | | | 5,333,719 | | | | 5,267,048 | |
Sprint Communications Incorporated (1 Month LIBOR +2.50%)±‡ | | | 4.13 | | | | 2-2-2024 | | | | 7,310,000 | | | | 7,236,900 | |
| | | | |
| | | | | | | | | | | | | | | 12,503,948 | |
| | | | | | | | | | | | | | | | |
|
Consumer Discretionary: 1.30% | |
|
| Auto Components: 0.46% | |
Allison Transmission Incorporated (1 Month LIBOR +1.75%)± | | | 3.38 | | | | 3-29-2026 | | | | 4,219,888 | | | | 4,226,049 | |
| | | | | | | | | | | | | | | | |
|
| Household Products: 0.52% | |
Michaels Stores Incorporated (1 Month LIBOR +2.50%)± | | | 4.11 | | | | 1-30-2023 | | | | 5,316,665 | | | | 4,784,998 | |
| | | | | | | | | | | | | | | | |
|
| Specialty Retail: 0.32% | |
Sally Beauty Holdings Incorporated (1 Month LIBOR +2.25%)± | | | 3.86 | | | | 7-5-2024 | | | | 3,043,299 | | | | 2,978,629 | |
| | | | | | | | | | | | | | | | |
The accompanying notes are an integral part of these financial statements.
10 | Wells Fargo Short-Term High Yield Bond Fund
Portfolio of investments—February 29, 2020 (unaudited)
| | | | | | | | | | | | | | | | |
| | | Interest
rate | | | Maturity
date | | | Principal | | | Value | |
|
Energy: 0.66% | |
|
| Oil, Gas & Consumable Fuels: 0.66% | |
Buckeye Partners LP (1 Month LIBOR +2.75%)± | | | 4.41 | % | | | 11-1-2026 | | | $ | 6,120,000 | | | $ | 6,038,420 | |
| | | | | | | | | | | | | | | | |
|
Financials: 2.77% | |
|
| Consumer Finance: 1.01% | |
TransUnion LLC (1 Month LIBOR +1.75%) | | | 3.35 | | | | 11-16-2026 | | | | 9,415,630 | | | | 9,324,392 | |
| | | | | | | | | | | | | | | | |
|
| Diversified Financial Services: 1.76% | |
Delos Finance SARL (3 Month LIBOR +1.75%)± | | | 3.69 | | | | 10-6-2023 | | | | 6,905,500 | | | | 6,862,341 | |
LPL Holdings Incorporated (1 Month LIBOR +1.75%)± | | | 3.36 | | | | 11-12-2026 | | | | 9,389,651 | | | | 9,366,177 | |
| | | | |
| | | | | | | | | | | | | | | 16,228,518 | |
| | | | | | | | | | | | | | | | |
|
Health Care: 1.64% | |
|
| Health Care Providers & Services: 1.64% | |
HCA Incorporated (1 Month LIBOR +1.75%)± | | | 3.35 | | | | 3-18-2026 | | | | 9,931,335 | | | | 9,894,093 | |
Select Medical Corporation (3 Month LIBOR +2.50%)± | | | 4.58 | | | | 3-6-2025 | | | | 5,319,589 | | | | 5,266,384 | |
| | | | |
| | | | | | | | | | | | | | | 15,160,477 | |
| | | | | | | | | | | | | | | | |
|
Industrials: 6.83% | |
|
| Aerospace & Defense: 0.62% | |
Rexnord LLC (1 Month LIBOR +1.75%)± | | | 3.38 | | | | 8-21-2024 | | | | 5,781,250 | | | | 5,755,986 | |
| | | | | | | | | | | | | | | | |
|
| Airlines: 1.58% | |
United Airlines Incorporated (1 Month LIBOR +1.75%)± | | | 3.35 | | | | 4-1-2024 | | | | 7,711,925 | | | | 7,470,927 | |
WestJet Airlines Limited (1 Month LIBOR +3.00%)± | | | 4.65 | | | | 12-11-2026 | | | | 7,340,000 | | | | 7,057,410 | |
| | | | |
| | | | | | | | | | | | | | | 14,528,337 | |
| | | | | | | | | | | | | | | | |
|
| Building Products: 0.72% | |
Flex Acquisition Company (1 Month LIBOR +3.00%)± | | | 4.90 | | | | 12-29-2023 | | | | 7,000,000 | | | | 6,679,190 | |
| | | | | | | | | | | | | | | | |
|
| Commercial Services & Supplies: 2.69% | |
Advanced Disposal Services Incorporated (1 Month LIBOR+2.25%)± | | | 3.83 | | | | 11-10-2023 | | | | 11,876,144 | | | | 11,841,465 | |
Aramark Services Incorporated (1 Month LIBOR +1.75%)± | | | 3.35 | | | | 3-28-2024 | | | | 3,736,782 | | | | 3,704,085 | |
Aramark Services Incorporated (1 Month LIBOR +1.75%)± | | | 3.35 | | | | 3-11-2025 | | | | 5,931,734 | | | | 5,879,831 | |
KAR Auction Services Incorporated (1 Month LIBOR +2.25%)±‡ | | | 3.94 | | | | 9-19-2026 | | | | 3,453,667 | | | | 3,419,131 | |
| | | | |
| | | | | | | | | | | | | | | 24,844,512 | |
| | | | | | | | | | | | | | | | |
|
| Electronic Equipment, Instruments & Components: 0.25% | |
Sensata Technologies Incorporated (1 Month LIBOR +1.75%)± | | | 3.40 | | | | 9-20-2026 | | | | 2,309,319 | | | | 2,321,443 | |
| | | | | | | | | | | | | | | | |
|
| Machinery: 0.47% | |
Columbus McKinnon Corporation (3 Month LIBOR +2.50%)±‡ | | | 4.44 | | | | 1-31-2024 | | | | 4,345,334 | | | | 4,345,334 | |
| | | | | | | | | | | | | | | | |
|
| Road & Rail: 0.50% | |
Genesee & Wyoming Incorporated (3 Month LIBOR +2.00%)± | | | 3.91 | | | | 12-30-2026 | | | | 4,620,000 | | | | 4,589,185 | |
| | | | | | | | | | | | | | | | |
|
Information Technology: 1.17% | |
|
| Electronic Equipment, Instruments & Components: 0.27% | |
Dell International LLC (1 Month LIBOR +2.00%)± | | | 3.61 | | | | 9-19-2025 | | | | 2,534,195 | | | | 2,501,732 | |
| | | | | | | | | | | | | | | | |
|
| Semiconductors & Semiconductor Equipment: 0.90% | |
ON Semiconductor Corporation (1 Month LIBOR +2.00%)± | | | 3.60 | | | | 9-19-2026 | | | | 8,437,104 | | | | 8,326,409 | |
| | | | | | | | | | | | | | | | |
The accompanying notes are an integral part of these financial statements.
Wells Fargo Short-Term High Yield Bond Fund | 11
Portfolio of investments—February 29, 2020 (unaudited)
| | | | | | | | | | | | | | | | |
| | | Interest
rate | | | Maturity
date | | | Principal | | | Value | |
|
Materials: 1.69% | |
|
| Chemicals: 1.69% | |
Ineos US Finance LLC (1 Month LIBOR +2.00%)± | | | 3.60 | % | | | 4-1-2024 | | | $ | 15,894,692 | | | $ | 15,576,799 | |
| | | | | | | | | | | | | | | | |
| |
Total Loans (Cost $213,070,484) | | | | 208,522,244 | |
| | | | | |
|
| Non-Agency Mortgage-Backed Securities: 0.00% | |
Salomon Brothers Mortgage Securities VII Series1994-5 Class B2±± | | | 4.54 | | | | 4-25-2024 | | | | 20,383 | | | | 19,055 | |
| | | | | | | | | | | | | | | | |
| |
TotalNon-Agency Mortgage-Backed Securities (Cost $20,187) | | | | 19,055 | |
| | | | | |
|
| Yankee Corporate Bonds and Notes: 10.39% | |
|
Communication Services: 1.38% | |
|
| Media: 1.38% | |
Nielsen Holding and Finance BV 144A | | | 5.50 | | | | 10-1-2021 | | | | 12,710,000 | | | | 12,725,888 | |
| | | | | | | | | | | | | | | | |
|
Consumer Discretionary: 1.39% | |
|
| Automobiles: 0.66% | |
Fiat Chrysler Automobiles NV | | | 4.50 | | | | 4-15-2020 | | | | 6,105,000 | | | | 6,111,838 | |
| | | | | | | | | | | | | | | | |
|
| Hotels, Restaurants & Leisure: 0.73% | |
International Game Technology plc 144A | | | 6.25 | | | | 2-15-2022 | | | | 6,580,000 | | | | 6,760,950 | |
| | | | | | | | | | | | | | | | |
|
Energy: 1.19% | |
|
| Energy Equipment & Services: 1.19% | |
Alcoa Nederland Holding Company BV 144A | | | 6.75 | | | | 9-30-2024 | | | | 10,705,000 | | | | 10,972,839 | |
| | | | | | | | | | | | | | | | |
|
Financials: 0.57% | |
|
| Diversified Financial Services: 0.57% | |
General Electric Capital International Funding Company | | | 2.34 | | | | 11-15-2020 | | | | 5,225,000 | | | | 5,239,264 | |
| | | | | | | | | | | | | | | | |
|
Health Care: 3.14% | |
|
| Pharmaceuticals: 3.14% | |
Bausch Health Companies Incorporated 144A | | | 6.50 | | | | 3-15-2022 | | | | 11,695,000 | | | | 11,841,188 | |
Teva Pharmaceutical Finance BV | | | 2.20 | | | | 7-21-2021 | | | | 14,600,000 | | | | 14,163,460 | |
Teva Pharmaceutical Finance BV | | | 3.65 | | | | 11-10-2021 | | | | 3,000,000 | | | | 2,981,580 | |
| | | | |
| | | | | | | | | | | | | | | 28,986,228 | |
| | | | | | | | | | | | | | | | |
|
Industrials: 0.66% | |
|
| Airlines: 0.66% | |
Air Canada Company 144A | | | 7.75 | | | | 4-15-2021 | | | | 5,870,000 | | | | 6,119,475 | |
| | | | | | | | | | | | | | | | |
|
Materials: 2.06% | |
|
| Chemicals: 1.08% | |
Park Aerospace Holdings Company 144A | | | 5.25 | | | | 8-15-2022 | | | | 9,305,000 | | | | 9,900,017 | |
| | | | | | | | | | | | | | | | |
|
| Metals & Mining: 0.98% | |
FMG Resources Proprietary Limited 144A | | | 4.75 | | | | 5-15-2022 | | | | 8,909,000 | | | | 9,066,600 | |
| | | | | | | | | | | | | | | | |
| |
Total Yankee Corporate Bonds and Notes (Cost $96,005,478) | | | | 95,883,099 | |
| | | | | |
The accompanying notes are an integral part of these financial statements.
12 | Wells Fargo Short-Term High Yield Bond Fund
Portfolio of investments—February 29, 2020 (unaudited)
| | | | | | | | | | | | | | | | |
| | | | | |
| | | | | | | | | | | | | | | | |
| | | Yield | | | | | | Shares | | | Value | |
| Short-Term Investments: 6.17% | |
|
| Investment Companies: 6.17% | |
Securities Lending Cash Investments LLC (l)(r)(u) | | | 1.66 | % | | | | | | | 2,966,349 | | | $ | 2,966,645 | |
Wells Fargo Government Money Market Fund Select Class (l)(u)## | | | 1.52 | | | | | | | | 53,994,649 | | | | 53,994,649 | |
| | | | | | | | | | | | | |
| |
Total Short-Term Investments (Cost $56,961,294) | | | | 56,961,294 | |
| | | | | |
| | | | | | | | |
| Total investments in securities (Cost $929,224,044) | | | 99.73 | % | | | 920,357,116 | |
| | |
Other assets and liabilities, net | | | 0.27 | | | | 2,512,441 | |
| | | | | | | | |
| Total net assets | | | 100.00 | % | | $ | 922,869,557 | |
| | | | | | | | |
| 144A | The security may be resold in transactions exempt from registration, normally to qualified institutional buyers, pursuant to Rule 144A under the Securities Act of 1933. |
| « | All or a portion of this security is on loan. |
| ± | Variable rate investment. The rate shown is the rate in effect at period end. |
| ‡ | Security is valued using significant unobservable inputs. |
| ±± | The coupon of the security is adjusted based on the principal and interest payments received from the underlying pool of mortgages as well as the credit quality and the actual prepayment speed of the underlying mortgages. |
| (l) | The issuer of the security is an affiliated person of the Fund as defined in the Investment Company Act of 1940. |
| (r) | The investment is anon-registered investment company purchased with cash collateral received from securities on loan. |
| (u) | The rate represents the7-day annualized yield at period end. |
| ## | All or a portion of this security is segregated for unfunded loans. |
Abbreviations:
| LIBOR | London Interbank Offered Rate |
| REIT | Real estate investment trust |
Investments in Affiliates
An affiliated investment is an investment in which the Fund owns at least 5% of the outstanding voting shares of the issuer or as a result of other relationships, such as the Fund and the issuer having the same investment manager. Transactions with issuers that were either affiliated persons of the Fund at the beginning of the period or the end of the period were as follows:
| | | | | | | | | | | | | | | | | | | | | | | | | | | | | | | | | | | | |
| | | Shares,
beginning of
period | | | Shares
purchased | | | Shares
sold | | | Shares,
end of
period | | | Net
realized
gains
(losses) | | | Net
change in
unrealized
gains
(losses) | | | Income
from
affiliated
securities | | | Value,
end of
period | | | % of
net
assets | |
| | | | | | | | | |
| Short-Term Investments | | | | | | | | | | | | | | | | | | | | | | | | | | | |
Investment Companies | | | | | | | | | | | | | | | | | | | | | | | | | | | | | | | | | | | | |
Securities Lending Cash Investments LLC | | | 5,730,371 | | | | 24,563,525 | | | | (27,327,547 | ) | | | 2,966,349 | | | $ | (33 | ) | | $ | 0 | | | $ | 42,375 | # | | $ | 2,966,645 | | | | | |
Wells Fargo Government Money Market Fund Select Class | | | 47,797,221 | | | | 335,117,163 | | | | (328,919,735 | ) | | | 53,994,649 | | | | 0 | | | | 0 | | | | 533,257 | | | | 53,994,649 | | | | | |
| | | | | | | | | | | | | | | | | | | | | | | | | | | | | | | | | | | | |
| | | | | | | | | | | | | | | | | | $ | (33 | ) | | $ | 0 | | | $ | 575,632 | | | $ | 56,961,294 | | | | 6.17 | % |
| | | | | | | | | | | | | | | | | | | | | | | | | | | | | | | | | | | | |
| # | Amount shown represents income before fees and rebates. |
The accompanying notes are an integral part of these financial statements.
Wells Fargo Short-Term High Yield Bond Fund | 13
Statement of assets and liabilities—February 29, 2020 (unaudited)
| | | | |
| | | | |
| |
Assets | | | | |
Investments in unaffiliated securities (including $2,903,547 of securities loaned), at value (cost $872,262,750) | | $ | 863,395,822 | |
Investments in affiliated securities, at value (cost $56,961,294) | | | 56,961,294 | |
Cash | | | 3,003,447 | |
Receivable for investments sold | | | 99,163 | |
Receivable for Fund shares sold | | | 655,770 | |
Receivable for interest | | | 11,112,628 | |
Receivable for securities lending income, net | | | 3,598 | |
Prepaid expenses and other assets | | | 79 | |
| | | | |
Total assets | | | 935,231,801 | |
| | | | |
| |
Liabilities | | | | |
Payable for Fund shares redeemed | | | 5,359,680 | |
Payable for investment purchased | | | 3,102,610 | |
Payable upon receipt of securities loaned | | | 2,965,842 | |
Dividends payable | | | 349,790 | |
Management fee payable | | | 282,677 | |
Administration fees payable | | | 73,224 | |
Distribution fee payable | | | 33,114 | |
Trustees’ fees and expenses payable | | | 5,769 | |
Accrued expenses and other liabilities | | | 189,538 | |
| | | | |
Total liabilities | | | 12,362,244 | |
| | | | |
Total net assets | | $ | 922,869,557 | |
| | | | |
| |
Net assets consist of | | | | |
Paid-in capital | | $ | 969,810,531 | |
Total distributable loss | | | (46,940,974 | ) |
| | | | |
Total net assets | | $ | 922,869,557 | |
| | | | |
| |
Computation of net asset value and offering price per share | | | | |
Net assets – Class A | | $ | 109,367,337 | |
Shares outstanding – Class A1 | | | 13,708,699 | |
Net asset value per share – Class A | | | $7.98 | |
Maximum offering price per share – Class A2 | | | $8.23 | |
Net assets – Class C | | $ | 53,157,883 | |
Shares outstanding – Class C1 | | | 6,661,176 | |
Net asset value per share – Class C | | | $7.98 | |
Net assets – Administrator Class | | $ | 59,980,620 | |
Shares outstanding – Administrator Class1 | | | 7,518,921 | |
Net asset value per share – Administrator Class | | | $7.98 | |
Net assets – Institutional Class | | $ | 700,363,717 | |
Shares outstanding – Institutional Class1 | | | 87,910,471 | |
Net asset value per share – Institutional Class | | | $7.97 | |
| 1 | The Fund has an unlimited number of authorized shares. |
| 2 | Maximum offering price is computed as 100/97 of net asset value. On investments of $50,000 or more, the offering price is reduced. |
The accompanying notes are an integral part of these financial statements.
14 | Wells Fargo Short-Term High Yield Bond Fund
Statement of operations—six months ended February 29, 2020 (unaudited)
| | | | |
| | | | |
| |
Investment income | | | | |
Interest | | $ | 17,768,186 | |
Income from affiliated securities | | | 547,171 | |
| | | | |
Total investment income | | | 18,315,357 | |
| | | | |
| |
Expenses | | | | |
Management fee | | | 2,259,076 | |
Administration fees | | | | |
Class A | | | 84,762 | |
Class C | | | 44,276 | |
Administrator Class | | | 39,539 | |
Institutional Class | | | 273,915 | |
Shareholder servicing fees | | | | |
Class A | | | 132,441 | |
Class C | | | 69,181 | |
Administrator Class | | | 98,847 | |
Distribution fee | | | | |
Class C | | | 207,445 | |
Custody and accounting fees | | | 39,670 | |
Professional fees | | | 27,767 | |
Registration fees | | | 49,589 | |
Shareholder report expenses | | | 49,038 | |
Trustees’ fees and expenses | | | 10,909 | |
Other fees and expenses | | | 13,384 | |
| | | | |
Total expenses | | | 3,399,839 | |
Less: Fee waivers and/or expense reimbursements | | | | |
Fund-level | | | (509,653 | ) |
Class A | | | (10,197 | ) |
Class C | | | (5,049 | ) |
Administrator Class | | | (45,326 | ) |
| | | | |
Net expenses | | | 2,829,764 | |
| | | | |
Net investment income | | | 15,485,593 | |
| | | | |
| |
Realized and unrealized gains (losses) on investments | | | | |
Net realized losses | | | | |
Unaffiliated securities | | | (670,815 | ) |
Affiliated securities | | | (33 | ) |
| | | | |
Net realized losses on investments | | | (670,848 | ) |
Net change in unrealized gains (losses) on investments | | | (9,559,001 | ) |
| | | | |
Net realized and unrealized gains (losses) on investments | | | (10,229,849 | ) |
| | | | |
Net increase in net assets resulting from operations | | $ | 5,255,744 | |
| | | | |
The accompanying notes are an integral part of these financial statements.
Wells Fargo Short-Term High Yield Bond Fund | 15
Statement of changes in net assets
| | | | | | | | | | | | | | | | |
| | | Six months ended
February 29, 2020
(unaudited) | | | Year ended
August 31, 2019 | |
| | | | |
Operations | | | | | | | | | | | | | | | | |
Net investment income | | | | | | $ | 15,485,593 | | | | | | | $ | 33,006,486 | |
Net realized losses on investments | | | | | | | (670,848 | ) | | | | | | | (2,706,939 | ) |
Net change in unrealized gains (losses) on investments | | | | | | | (9,559,001 | ) | | | | | | | 11,155,238 | |
| | | | |
Net increase in net assets resulting from operations | | | | | | | 5,255,744 | | | | | | | | 41,454,785 | |
| | | | |
| | | | |
Distributions to shareholders from net investment income and net realized gains | | | | | | | | | | | | | | | | |
Class A | | | | | | | (1,665,018 | ) | | | | | | | (3,762,988 | ) |
Class C | | | | | | | (661,157 | ) | | | | | | | (1,689,410 | ) |
Administrator Class | | | | | | | (1,303,132 | ) | | | | | | | (3,168,104 | ) |
Institutional Class | | | | | | | (11,809,991 | ) | | | | | | | (25,680,553 | ) |
| | | | |
Total distributions to shareholders | | | | | | | (15,439,298 | ) | | | | | | | (34,301,055 | ) |
| | | | |
| | | | |
Capital share transactions | | | Shares | | | | | | | | Shares | | | | | |
Proceeds from shares sold | | | | | | | | | | | | | | | | |
Class A | | | 2,291,833 | | | | 18,511,523 | | | | 2,334,881 | | | | 18,662,572 | |
Class C | | | 351,386 | | | | 2,837,715 | | | | 550,907 | | | | 4,399,664 | |
Administrator Class | | | 975,026 | | | | 7,874,340 | | | | 3,608,062 | | | | 28,884,553 | |
Institutional Class | | | 19,043,959 | | | | 153,687,647 | | | | 39,157,823 | | | | 312,749,375 | |
| | | | |
| | | | | | | 182,911,225 | | | | | | | | 364,696,164 | |
| | | | |
Reinvestment of distributions | | | | | | | | | | | | | | | | |
Class A | | | 199,734 | | | | 1,609,129 | | | | 455,888 | | | | 3,644,906 | |
Class C | | | 80,525 | | | | 649,041 | | | | 206,987 | | | | 1,655,385 | |
Administrator Class | | | 161,088 | | | | 1,298,381 | | | | 388,986 | | | | 3,109,963 | |
Institutional Class | | | 1,190,937 | | | | 9,582,286 | | | | 2,585,685 | | | | 20,647,043 | |
| | | | |
| | | | | | | 13,138,837 | | | | | | | | 29,057,297 | |
| | | | |
Payment for shares redeemed | | | | | | | | | | | | | | | | |
Class A | | | (1,761,086 | ) | | | (14,214,152 | ) | | | (5,701,043 | ) | | | (45,524,301 | ) |
Class C | | | (1,097,940 | ) | | | (8,866,201 | ) | | | (3,080,040 | ) | | | (24,607,930 | ) |
Administrator Class | | | (4,391,915 | ) | | | (35,516,822 | ) | | | (6,065,662 | ) | | | (48,429,129 | ) |
Institutional Class | | | (19,385,242 | ) | | | (156,232,624 | ) | | | (50,462,701 | ) | | | (402,058,756 | ) |
| | | | |
| | | | | | | (214,829,799 | ) | | | | | | | (520,620,116 | ) |
| | | | |
Net decrease in net assets resulting from capital share transactions | | | | | | | (18,779,737 | ) | | | | | | | (126,866,655 | ) |
| | | | |
Total decrease in net assets | | | | | | | (28,963,291 | ) | | | | | | | (119,712,925 | ) |
| | | | |
| | | | |
Net assets | | | | | | | | | | | | | | | | |
Beginning of period | | | | | | | 951,832,848 | | | | | | | | 1,071,545,773 | |
| | | | |
End of period | | | | | | $ | 922,869,557 | | | | | | | $ | 951,832,848 | |
| | | | |
The accompanying notes are an integral part of these financial statements.
16 | Wells Fargo Short-Term High Yield Bond Fund
Financial highlights
(For a share outstanding throughout each period)
| | | | | | | | | | | | | | | | | | | | | | | | |
| | | Six months ended
February 29, 2020
(unaudited) | | | Year ended August 31 | |
| CLASS A | | 2019 | | | 2018 | | | 2017 | | | 2016 | | | 2015 | |
Net asset value, beginning of period | | | $8.07 | | | | $7.99 | | | | $8.07 | | | | $8.10 | | | | $8.07 | | | | $8.20 | |
Net investment income | | | 0.13 | | | | 0.25 | | | | 0.24 | | | | 0.23 | | | | 0.24 | | | | 0.25 | |
Net realized and unrealized gains (losses) on investments | | | (0.09 | ) | | | 0.09 | | | | (0.08 | ) | | | (0.03 | ) | | | 0.03 | | | | (0.13 | ) |
| | | | | | | | | | | | | | | | | | | | | | | | |
Total from investment operations | | | 0.04 | | | | 0.34 | | | | 0.16 | | | | 0.20 | | | | 0.27 | | | | 0.12 | |
Distributions to shareholders from | | | | | | | | | | | | | | | | | | | | | | | | |
Net investment income | | | (0.13 | ) | | | (0.26 | ) | | | (0.24 | ) | | | (0.23 | ) | | | (0.24 | ) | | | (0.25 | ) |
Net asset value, end of period | | | $7.98 | | | | $8.07 | | | | $7.99 | | | | $8.07 | | | | $8.10 | | | | $8.07 | |
Total return1 | | | 0.57 | % | | | 4.40 | % | | | 2.00 | % | | | 2.51 | % | | | 3.37 | % | | | 1.46 | % |
Ratios to average net assets (annualized) | | | | | | | | | | | | | | | | | | | | | | | | |
Gross expenses | | | 0.94 | % | | | 0.94 | % | | | 0.93 | % | | | 0.92 | % | | | 0.92 | % | | | 0.92 | % |
Net expenses | | | 0.81 | % | | | 0.81 | % | | | 0.81 | % | | | 0.81 | % | | | 0.81 | % | | | 0.81 | % |
Net investment income | | | 3.15 | % | | | 3.18 | % | | | 2.96 | % | | | 2.88 | % | | | 2.95 | % | | | 3.11 | % |
Supplemental data | | | | | | | | | | | | | | | | | | | | | | | | |
Portfolio turnover rate | | | 34 | % | | | 44 | % | | | 34 | % | | | 35 | % | | | 32 | % | | | 40 | % |
Net assets, end of period (000s omitted) | | | $109,367 | | | | $104,671 | | | | $127,024 | | | | $172,151 | | | | $296,817 | | | | $203,856 | |
| 1 | Total return calculations do not include any sales charges. Returns for periods of less than one year are not annualized. |
The accompanying notes are an integral part of these financial statements.
Wells Fargo Short-Term High Yield Bond Fund | 17
Financial highlights
(For a share outstanding throughout each period)
| | | | | | | | | | | | | | | | | | | | | | | | |
| | | Six months ended
February 29, 2020
(unaudited) | | | Year ended August 31 | |
| CLASS C | | 2019 | | | 2018 | | | 2017 | | | 2016 | | | 2015 | |
Net asset value, beginning of period | | | $8.07 | | | | $8.00 | | | | $8.07 | | | | $8.10 | | | | $8.07 | | | | $8.20 | |
Net investment income | | | 0.10 | | | | 0.19 | | | | 0.18 | | | | 0.17 | | | | 0.18 | | | | 0.19 | |
Net realized and unrealized gains (losses) on investments | | | (0.09 | ) | | | 0.08 | | | | (0.07 | ) | | | (0.03 | ) | | | 0.03 | | | | (0.13 | ) |
| | | | | | | | | | | | | | | | | | | | | | | | |
Total from investment operations | | | 0.01 | | | | 0.27 | | | | 0.11 | | | | 0.14 | | | | 0.21 | | | | 0.06 | |
Distributions to shareholders from | | | | | | | | | | | | | | | | | | | | | | | | |
Net investment income | | | (0.10 | ) | | | (0.20 | ) | | | (0.18 | ) | | | (0.17 | ) | | | (0.18 | ) | | | (0.19 | ) |
Net asset value, end of period | | | $7.98 | | | | $8.07 | | | | $8.00 | | | | $8.07 | | | | $8.10 | | | | $8.07 | |
Total return1 | | | 0.07 | % | | | 3.49 | % | | | 1.36 | % | | | 1.75 | % | | | 2.60 | % | | | 0.70 | % |
Ratios to average net assets (annualized) | | | | | | | | | | | | | | | | | | | | | | | | |
Gross expenses | | | 1.69 | % | | | 1.69 | % | | | 1.68 | % | | | 1.67 | % | | | 1.67 | % | | | 1.67 | % |
Net expenses | | | 1.56 | % | | | 1.56 | % | | | 1.56 | % | | | 1.56 | % | | | 1.56 | % | | | 1.56 | % |
Net investment income | | | 2.40 | % | | | 2.43 | % | | | 2.21 | % | | | 2.11 | % | | | 2.20 | % | | | 2.36 | % |
Supplemental data | | | | | | | | | | | | | | | | | | | | | | | | |
Portfolio turnover rate | | | 34 | % | | | 44 | % | | | 34 | % | | | 35 | % | | | 32 | % | | | 40 | % |
Net assets, end of period (000s omitted) | | | $53,158 | | | | $59,113 | | | | $77,169 | | | | $111,268 | | | | $123,745 | | | | $123,521 | |
| 1 | Total return calculations do not include any sales charges. Returns for periods of less than one year are not annualized. |
The accompanying notes are an integral part of these financial statements.
18 | Wells Fargo Short-Term High Yield Bond Fund
Financial highlights
(For a share outstanding throughout each period)
| | | | | | | | | | | | | | | | | | | | | | | | |
| | | Six months ended
February 29, 2020
(unaudited) | | | Year ended August 31 | |
| ADMINISTRATOR CLASS | | 2019 | | | 2018 | | | 2017 | | | 2016 | | | 2015 | |
Net asset value, beginning of period | | | $8.06 | | | | $7.99 | | | | $8.07 | | | | $8.10 | | | | $8.07 | | | | $8.20 | |
Net investment income | | | 0.13 | | | | 0.27 | | | | 0.25 | | | | 0.24 | | | | 0.25 | | | | 0.26 | |
Net realized and unrealized gains (losses) on investments | | | (0.08 | ) | | | 0.08 | | | | (0.08 | ) | | | (0.03 | ) | | | 0.03 | | | | (0.13 | ) |
| | | | | | | | | | | | | | | | | | | | | | | | |
Total from investment operations | | | 0.05 | | | | 0.35 | | | | 0.17 | | | | 0.21 | | | | 0.28 | | | | 0.13 | |
Distributions to shareholders from | | | | | | | | | | | | | | | | | | | | | | | | |
Net investment income | | | (0.13 | ) | | | (0.28 | ) | | | (0.25 | ) | | | (0.24 | ) | | | (0.25 | ) | | | (0.26 | ) |
Net asset value, end of period | | | $7.98 | | | | $8.06 | | | | $7.99 | | | | $8.07 | | | | $8.10 | | | | $8.07 | |
Total return1 | | | 0.65 | % | | | 4.44 | % | | | 2.16 | % | | | 2.68 | % | | | 3.54 | % | | | 1.62 | % |
Ratios to average net assets (annualized) | | | | | | | | | | | | | | | | | | | | | | | | |
Gross expenses | | | 0.88 | % | | | 0.87 | % | | | 0.86 | % | | | 0.86 | % | | | 0.86 | % | | | 0.85 | % |
Net expenses | | | 0.65 | % | | | 0.65 | % | | | 0.65 | % | | | 0.65 | % | | | 0.65 | % | | | 0.65 | % |
Net investment income | | | 3.30 | % | | | 3.34 | % | | | 3.13 | % | | | 3.03 | % | | | 3.11 | % | | | 3.28 | % |
Supplemental data | | | | | | | | | | | | | | | | | | | | | | | | |
Portfolio turnover rate | | | 34 | % | | | 44 | % | | | 34 | % | | | 35 | % | | | 32 | % | | | 40 | % |
Net assets, end of period (000s omitted) | | | $59,981 | | | | $86,892 | | | | $102,673 | | | | $134,070 | | | | $274,878 | | | | $328,934 | |
| 1 | Returns for periods of less than one year are not annualized. |
The accompanying notes are an integral part of these financial statements.
Wells Fargo Short-Term High Yield Bond Fund | 19
Financial highlights
(For a share outstanding throughout each period)
| | | | | | | | | | | | | | | | | | | | | | | | |
| | | Six months ended
February 29, 2020
(unaudited) | | | Year ended August 31 | |
| INSTITUTIONAL CLASS | | 2019 | | | 2018 | | | 2017 | | | 2016 | | | 2015 | |
Net asset value, beginning of period | | | $8.05 | | | | $7.98 | | | | $8.06 | | | | $8.09 | | | | $8.06 | | | | $8.18 | |
Net investment income | | | 0.14 | | | | 0.28 | | | | 0.27 | | | | 0.25 | | | | 0.26 | | | | 0.28 | |
Net realized and unrealized gains (losses) on investments | | | (0.08 | ) | | | 0.08 | | | | (0.08 | ) | | | (0.02 | ) | | | 0.03 | | | | (0.13 | ) |
| | | | | | | | | | | | | | | | | | | | | | | | |
Total from investment operations | | | 0.06 | | | | 0.36 | | | | 0.19 | | | | 0.23 | | | | 0.29 | | | | 0.15 | |
Distributions to shareholders from | | | | | | | | | | | | | | | | | | | | | | | | |
Net investment income | | | (0.14 | ) | | | (0.29 | ) | | | (0.27 | ) | | | (0.26 | ) | | | (0.26 | ) | | | (0.27 | ) |
Net asset value, end of period | | | $7.97 | | | | $8.05 | | | | $7.98 | | | | $8.06 | | | | $8.09 | | | | $8.06 | |
Total return1 | | | 0.72 | % | | | 4.59 | % | | | 2.31 | % | | | 2.83 | % | | | 3.69 | % | | | 1.90 | % |
Ratios to average net assets (annualized) | | | | | | | | | | | | | | | | | | | | | | | | |
Gross expenses | | | 0.61 | % | | | 0.61 | % | | | 0.59 | % | | | 0.59 | % | | | 0.59 | % | | | 0.59 | % |
Net expenses | | | 0.50 | % | | | 0.50 | % | | | 0.50 | % | | | 0.50 | % | | | 0.50 | % | | | 0.50 | % |
Net investment income | | | 3.46 | % | | | 3.49 | % | | | 3.27 | % | | | 3.16 | % | | | 3.26 | % | | | 3.40 | % |
Supplemental data | | | | | | | | | | | | | | | | | | | | | | | | |
Portfolio turnover rate | | | 34 | % | | | 44 | % | | | 34 | % | | | 35 | % | | | 32 | % | | | 40 | % |
Net assets, end of period (000s omitted) | | | $700,364 | | | | $701,157 | | | | $764,680 | | | | $1,010,757 | | | | $735,285 | | | | $608,704 | |
| 1 | Returns for periods of less than one year are not annualized. |
The accompanying notes are an integral part of these financial statements.
20 | Wells Fargo Short-Term High Yield Bond Fund
Notes to financial statements (unaudited)
1. ORGANIZATION
Wells Fargo Funds Trust (the “Trust”), a Delaware statutory trust organized on March 10, 1999, is anopen-end management investment company registered under the Investment Company Act of 1940, as amended (the “1940 Act”). As an investment company, the Trust follows the accounting and reporting guidance in Financial Accounting Standards Board (“FASB”)Accounting Standards Codification Topic 946, Financial Services – Investment Companies. These financial statements report on the Wells Fargo Short-Term High Yield Bond Fund (the “Fund”) which is a diversified series of the Trust.
2. SIGNIFICANT ACCOUNTING POLICIES
The following significant accounting policies, which are consistently followed in the preparation of the financial statements of the Fund, are in conformity with U.S. generally accepted accounting principles which require management to make estimates and assumptions that affect the reported amounts of assets and liabilities, disclosure of contingent assets and liabilities at the date of the financial statements, and the reported amounts of revenues and expenses during the reporting period. Actual results could differ from those estimates.
Securities valuation
All investments are valued each business day as of the close of regular trading on the New York Stock Exchange (generally 4 p.m. Eastern Time), although the Fund may deviate from this calculation time under unusual or unexpected circumstances.
Debt securities are valued at the evaluated bid price provided by an independent pricing service (e.g. taking into account various factors, including yields, maturities, or credit ratings) or, if a reliable price is not available, the quoted bid price from an independent broker-dealer.
Investments in registeredopen-end investment companies are valued at net asset value. Interests innon-registered investment companies that are redeemable at net asset value are fair valued normally at net asset value.
Investments which are not valued using any of the methods discussed above are valued at their fair value, as determined in good faith by the Board of Trustees of the Fund. The Board of Trustees has established a Valuation Committee comprised of the Trustees and has delegated to it the authority to take any actions regarding the valuation of portfolio securities that the Valuation Committee deems necessary or appropriate, including determining the fair value of portfolio securities, unless the determination has been delegated to the Wells Fargo Asset Management Pricing Committee at Wells Fargo Funds Management, LLC (“Funds Management”). The Board of Trustees retains the authority to make or ratify any valuation decisions or approve any changes to the Valuation Procedures as it deems appropriate. On a quarterly basis, the Board of Trustees receives reports on any valuation actions taken by the Valuation Committee or the Wells Fargo Asset Management Pricing Committee which may include items for ratification.
Securities lending
The Fund may lend its securities from time to time in order to earn additional income in the form of fees or interest on securities received as collateral or the investment of any cash received as collateral. When securities are on loan, the Fund receives interest or dividends on those securities. Cash collateral received in connection with its securities lending transactions is invested in Securities Lending Cash Investments, LLC (the “Securities Lending Fund”). Investments in Securities Lending Fund are valued at the evaluated bid price provided by an independent pricing service. Income earned from investment in the Securities Lending Fund (net of fees and rebates), if any, is included in income from affiliated securities on the Statement of Operations.
In a securities lending transaction, the net asset value of the Fund will be affected by an increase or decrease in the value of the securities loaned and by an increase or decrease in the value of the instrument in which collateral is invested. The amount of securities lending activity undertaken by the Fund fluctuates from time to time. The Fund has the right under the lending agreement to recover the securities from the borrower on demand. In the event of default or bankruptcy by the borrower, the Fund may be prevented from recovering the loaned securities or gaining access to the collateral or may experience delays or costs in doing so. In such an event, the terms of the agreement allows the unaffiliated securities lending agent to use the collateral to purchase replacement securities on behalf of the Fund or pay the Fund the market value of the loaned securities. The Fund will bear the risk of loss with respect to depreciation of its investment of the cash collateral.
When-issued transactions
The Fund may purchase securities on a forward commitment or when-issued basis. The Fund records a when-issued transaction on the trade date and will segregate assets in an amount at least equal in value to the Fund’s commitment to purchase when-issued securities. Securities purchased on a when-issued basis are marked-to-market daily and the Fund begins earning interest on the settlement date. Losses may arise due to changes in the market value of the underlying securities or if the counterparty does not perform under the contract.
Wells Fargo Short-Term High Yield Bond Fund | 21
Notes to financial statements (unaudited)
Loans
The Fund may invest in direct debt instruments which are interests in amounts owed to lenders by corporate or other borrowers. The loans pay interest at rates which are periodically reset by reference to a base lending rate plus a spread. Investments in loans may be in the form of participations in loans or assignments of all or a portion of loans from third parties. When the Fund purchases participations, it generally has no rights to enforce compliance with the terms of the loan agreement with the borrower. As a result, the Fund assumes the credit risk of both the borrower and the lender that is selling the participation. When the Fund purchases assignments from lenders, it acquires direct rights against the borrower on the loan and may enforce compliance by the borrower with the terms of the loan agreement. Loans may include fully funded term loans or unfunded loan commitments, which are contractual obligations for future funding.
Security transactions and income recognition
Securities transactions are recorded on a trade date basis. Realized gains or losses are recorded on the basis of identified cost.
Interest income is accrued daily and bond discounts are accreted and premiums are amortized daily. To the extent debt obligations are placed onnon-accrual status, any related interest income may be reduced by writing off interest receivables when the collection of all or a portion of interest has been determined to be doubtful based on consistently applied procedures and the fair value has decreased. If the issuer subsequently resumes interest payments or when the collectability of interest is reasonably assured, the debt obligation is removed fromnon-accrual status.
Distributions to shareholders
Distributions to shareholders from net investment income are declared daily and paid monthly. Distributions from net realized gains, if any, are recorded on theex-dividend date and paid at least annually. Such distributions are determined in accordance with income tax regulations and may differ from U.S. generally accepted accounting principles. Dividend sources are estimated at the time of declaration. The tax character of distributions is determined as of the Fund’s fiscal year end. Therefore, a portion of the Fund’s distributions made prior to the Fund’s fiscal year end may be categorized as a tax return of capital at year end.
Federal and other taxes
The Fund intends to continue to qualify as a regulated investment company by distributing substantially all of its investment company taxable income and any net realized capital gains (after reduction for capital loss carryforwards) sufficient to relieve it from all, or substantially all, federal income taxes. Accordingly, no provision for federal income taxes was required.
The Fund’s income and federal excise tax returns and all financial records supporting those returns for the prior three fiscal years are subject to examination by the federal and Delaware revenue authorities. Management has analyzed the Fund’s tax positions taken on federal, state, and foreign tax returns for all open tax years and does not believe that there are any uncertain tax positions that require recognition of a tax liability.
As of February 29, 2020, the aggregate cost of all investments for federal income tax purposes was $930,518,239 and the unrealized gains (losses) consisted of:
| | | | |
| |
Gross unrealized gains | | $ | 1,792,961 | |
| |
Gross unrealized losses | | | (11,954,084 | ) |
| |
Net unrealized losses | | $ | (10,161,123 | ) |
As of August 31, 2019, the Fund had capital loss carryforwards which consisted of $11,453,225 in short-term capital losses and $25,995,472 in long-term capital losses.
Class allocations
The separate classes of shares offered by the Fund differ principally in applicable sales charges, distribution, shareholder servicing, and administration fees. Class specific expenses are charged directly to that share class. Investment income, common fund-level expenses, and realized and unrealized gains (losses) on investments are allocated daily to each class of shares based on the relative proportion of net assets of each class.
3. FAIR VALUATION MEASUREMENTS
Fair value measurements of investments are determined within a framework that has established a fair value hierarchy based upon the various data inputs utilized in determining the value of the Fund’s investments. The three-level hierarchy gives the highest priority to unadjusted quoted prices in active markets for identical assets or liabilities (Level 1) and the lowest priority to
22 | Wells Fargo Short-Term High Yield Bond Fund
Notes to financial statements (unaudited)
unobservable inputs (Level 3). The Fund’s investments are classified within the fair value hierarchy based on the lowest level of input that is significant to the fair value measurement. The inputs are summarized into three broad levels as follows:
| ∎ | | Level 1 – quoted prices in active markets for identical securities |
| ∎ | | Level 2 – other significant observable inputs (including quoted prices for similar securities, interest rates, prepayment speeds, credit risk, etc.) |
| ∎ | | Level 3 – significant unobservable inputs (including the Fund’s own assumptions in determining the fair value of investments) |
The inputs or methodologies used for valuing investments in securities are not necessarily an indication of the risk associated with investing in those securities.
The following is a summary of the inputs used in valuing the Fund’s assets and liabilities as of February 29, 2020:
| | | | | | | | | | | | | | | | |
| | | | |
| | | Quoted prices
(Level 1) | | | Other significant
observable inputs
(Level 2) | | | Significant
unobservable inputs (Level 3) | | | Total | |
| | | | |
Assets | | | | | | | | | | | | | | | | |
Investments in : | | | | | | | | | | | | | | | | |
| | | | |
Corporate bonds and notes | | $ | 0 | | | $ | 558,971,424 | | | $ | 0 | | | $ | 558,971,424 | |
| | | | |
Loans | | | 0 | | | | 193,520,879 | | | | 15,001,365 | | | | 208,522,244 | |
| | | | |
Non-agency mortgage-backed securities | | | 0 | | | | 19,055 | | | | 0 | | | | 19,055 | |
| | | | |
Yankee corporate bonds and notes | | | 0 | | | | 95,883,099 | | | | 0 | | | | 95,883,099 | |
| | | | |
Short-term investments | | | | | | | | | | | | | | | | |
| | | | |
Investment companies | | | 56,961,294 | | | | 0 | | | | 0 | | | | 56,961,294 | |
| | | | |
Total assets | | $ | 56,961,294 | | | $ | 848,394,457 | | | $ | 15,001,365 | | | $ | 920,357,116 | |
The following is a reconciliation of assets in which significant unobservable inputs (Level 3) were used in determining fair value:
| | | | |
| |
| | | Loans | |
Balance as of August 31, 2019 | | $ | 6,794.351 | |
| |
Accrued discounts (premiums) | | | (1,546 | ) |
| |
Realized gains (losses) | | | (1,673 | ) |
| |
Change in unrealized gains (losses) | | | (134,597 | ) |
| |
Purchases | | | 12,015,254 | |
| |
Sales | | | (691,795 | ) |
| |
Transfers into Level 3 | | | 0 | |
| |
Transfers out of Level 3 | | | (2,978,629 | ) |
| |
Balance as of February 29, 2020 | | $ | 15,001,365 | |
| |
Change in unrealized gains (losses) relating to securities still held at February 29, 2020 | | $ | (123,060 | ) |
The loan obligations in the Level 3 table were valued using indicative broker quotes. These indicative broker quotes are considered Level 3 inputs. Quantitative unobservable inputs used by the brokers are often proprietary and not provided to the Fund and therefore the disclosure that would address these inputs is not included above.
Additional sector, industry or geographic detail is included in the Portfolio of Investments.
4. TRANSACTIONS WITH AFFILIATES
Management fee
Funds Management, an indirect wholly owned subsidiary of Wells Fargo & Company (“Wells Fargo”) is the manager of the Fund and provides advisory and fund-level administrative services under an investment management agreement. Under the investment management agreement, Funds Management is responsible for, among other services, implementing the investment objectives and strategies of the Fund, supervising the subadviser and providing fund-level administrative services in
Wells Fargo Short-Term High Yield Bond Fund | 23
Notes to financial statements (unaudited)
connection with the Fund’s operations. As compensation for its services under the investment management agreement, Funds Management is entitled to receive a management fee at the following annual rate based on the Fund’s average daily net assets:
| | | | |
| |
| Average daily net assets | | Management Fee | |
| |
First $500 million | | | 0.500 | % |
| |
Next $500 million | | | 0.475 | |
| |
Next $2 billion | | | 0.450 | |
| |
Next $2 billion | | | 0.425 | |
| |
Next $5 billion | | | 0.390 | |
| |
Over $10 billion | | | 0.380 | |
For the six months ended February 29, 2020, the management fee was equivalent to an annual rate of 0.49% of the Fund’s average daily net assets.
Funds Management has retained the services of a subadviser to provide daily portfolio management to the Fund. The fee for subadvisory services is borne by Funds Management. Wells Capital Management Incorporated (“WellsCap”), an affiliate of Funds Management and an indirect wholly owned subsidiary of Wells Fargo, is the subadviser to the Fund and is entitled to receive a fee from Funds Management at an annual rate starting at 0.35% and declining to 0.20% as the average daily net assets of the Fund increase.
Administration fees
Under a class-level administration agreement, Funds Management provides class-level administrative services to the Fund, which includes paying fees and expenses for services provided by the transfer agent,sub-transfer agents, omnibus account servicers and record-keepers. As compensation for its services under the class-level administration agreement, Funds Management receives an annual fee which is calculated based on the average daily net assets of each class as follows:
| | | | |
| |
| | | Class-level
administration fee | |
| |
Class A, Class C | | | 0.16 | % |
| |
Administrator Class | | | 0.10 | |
| |
Institutional Class | | | 0.08 | |
Waivers and/or expense reimbursements
Funds Management has contractually waived and/or reimbursed management and administration fees to the extent necessary to maintain certain net operating expense ratios for the Fund. When each class of the Fund has exceeded its expense cap, Funds Management has waived fees and/or reimbursed expenses from fund-level expenses on a proportionate basis and then from class specific expenses. When only certain classes exceed their expense caps, waivers and/or reimbursements are applied against class specific expenses before fund-level expenses. Funds Management has committed through December 31, 2020 to waive fees and/or reimburse expenses to the extent necessary to cap the Fund’s expenses at 0.81% for Class A shares, 1.56% for Class C shares, and 0.65% for Administrator Class shares, and 0.50% for Institutional Class shares. Prior to or after the commitment expiration date, the cap may be increased or the commitment to maintain the cap may be terminated only with the approval of the Board of Trustees.
Distribution fee
The Trust has adopted a distribution plan for Class C shares of the Fund pursuant to Rule12b-1 under the 1940 Act. A distribution fee is charged to Class C shares and paid to Wells Fargo Funds Distributor, LLC (“Funds Distributor”), the principal underwriter, at an annual rate of 0.75% of the average daily net assets of Class C shares.
In addition, Funds Distributor is entitled to receive thefront-end sales charge from the purchase of Class A shares and a contingent deferred sales charge on the redemption of certain Class A shares. Funds Distributor is also entitled to receive the contingent deferred sales charges from redemptions of Class C shares. For the six months ended February 29, 2020, Funds Distributor received $1,948 from the sale of Class A shares. No contingent deferred sales charges were incurred by Class A and Class C shares for the six months ended February 29, 2020.
24 | Wells Fargo Short-Term High Yield Bond Fund
Notes to financial statements (unaudited)
Shareholder servicing fees
The Trust has entered into contracts with one or more shareholder servicing agents, whereby Class A, Class C and Administrator Class of the Fund are charged a fee at an annual rate of 0.25% of the average daily net assets of each respective class. A portion of these total shareholder servicing fees were paid to affiliates of Wells Fargo.
Interfund transactions
The Fund may purchase or sell portfolio investment securities to certain other Wells Fargo affiliates pursuant to Rule17a-7 under the 1940 Act and under procedures adopted by the Board of Trustees. The procedures have been designed to ensure that these interfund transactions, which do not incur broker commissions, are effected at current market prices.
5. INVESTMENT PORTFOLIO TRANSACTIONS
Purchases and sales of investments, excluding U.S. government obligations (if any) and short-term securities, for the six months ended February 29, 2020 were $335,513,089 and $303,989,736, respectively.
6. SECURITIES LENDING TRANSACTIONS
The Fund lends its securities through an unaffiliated securities lending agent and receives collateral in the form of cash or securities with a value at least equal to the value of the securities on loan. The value of the loaned securities is determined at the close of each business day and any increases or decreases in the required collateral are exchanged between the Fund and the counterparty on the next business day. Cash collateral received is invested in the Securities Lending Fund which seeks to provide a positive return compared to the daily Fed Funds Open Rate by investing in high-quality, U.S. dollar-denominated short-term money market instruments and is exempt from registration under Section 3(c)(7) of the 1940 Act. Securities Lending Fund is managed by Funds Management and is subadvised by WellsCap. Funds Management receives an advisory fee starting at 0.05% and declining to 0.01% as the average daily net assets of the Securities Lending Fund increase. All of the fees received by Funds Management are paid to WellsCap for its services as subadviser.
In the event of counterparty default or the failure of a borrower to return a loaned security, the Fund has the right to use the collateral to offset any losses incurred. As of February 29, 2020, the Fund had securities lending transactions with the following counterparties which are subject to offset:
| | | | | | | | | | | | |
| | | |
| Counterparty | | Value of
securities on
loan | | | Collateral
received1 | | | Net amount | |
| | | |
Barclays Capital Inc. | | $ | 2,838,940 | | | $ | (2,838,940 | ) | | $ | 0 | |
| | | |
JPMorgan Securities LLC | | | 64,607 | | | | (64,607 | ) | | | 0 | |
| 1 | Collateral received within this table is limited to the collateral for the net transaction with the counterparty. |
7. BANK BORROWINGS
The Trust (excluding the money market funds), Wells Fargo Master Trust and Wells Fargo Variable Trust are parties to a $280,000,000 revolving credit agreement whereby the Fund is permitted to use bank borrowings for temporary or emergency purposes, such as to fund shareholder redemption requests. Interest under the credit agreement is charged to the Fund based on a borrowing rate equal to the higher of the Federal Funds rate in effect on that day plus 1.25% or the overnight LIBOR rate in effect on that day plus 1.25%. In addition, an annual commitment fee equal to 0.25% of the unused balance is allocated to each participating fund.
For the six months ended February 29, 2020, there were no borrowings by the Fund under the agreement.
8. INDEMNIFICATION
Under the Trust’s organizational documents, the officers and Trustees have been granted certain indemnification rights against certain liabilities that may arise out of performance of their duties to the Trust. Additionally, in the normal course of business, the Trust may enter into contracts with service providers that contain a variety of indemnification clauses. The Trust’s maximum exposure under these arrangements is dependent on future claims that may be made against the Fund and, therefore, cannot be estimated.
Wells Fargo Short-Term High Yield Bond Fund | 25
Notes to financial statements (unaudited)
9. NEW ACCOUNTING PRONOUNCEMENTS
In August 2018, FASB issued Accounting Standards Update (“ASU”)No. 2018-13, Fair Value Measurement (Topic 820)Disclosure Framework – Changes to the Disclosure Requirements for Fair Value Measurement. ASU2018-13 updates the disclosure requirements for fair value measurements by modifying or removing certain disclosures and adding certain new disclosures. The amendments are effective for fiscal years, and interim periods within those fiscal years, beginning after December 15, 2019. Early adoption is permitted. Management has adopted the removal and modification of disclosures early, as permitted, and will adopt the additional new disclosures at the effective date.
In March 2017, FASB issued ASUNo. 2017-08,Premium Amortization on Purchased Callable Debt Securities. ASU2017-08 shortens the amortization period for certain callable debt securities held at a premium and requires the premium to be amortized to the earliest call date. The amendments do not require an accounting change for securities held at a discount and discounts will continue to be accreted to the maturity date of the security. ASU2017-08 is effective for fiscal years beginning after December 15, 2018 and for interim periods within those fiscal years. During the current reporting period, management of the Fund adopted the change in accounting policy which did not have a material impact to the Fund’s financial statements.
10. SUBSEQUENT EVENT
On March 11, 2020, the World Health Organization announced that it had made the assessment that coronavirus disease 2019(“COVID-19”) is a pandemic. The impacts ofCOVID-19 is adversely affecting the entire global economy, individual companies and investment products, and the market in general. There is significant uncertainty around the extent and duration of business disruptions related toCOVID-19 and the impact may be short term or may last for an extended period of time. The risk of further spreading ofCOVID-19 has led to significant uncertainty and volatility in the financial markets and the value of the Fund and the securities in which the Fund invests have generally been adversely affected by impacts caused byCOVID-19.
26 | Wells Fargo Short-Term High Yield Bond Fund
Other information (unaudited)
PROXY VOTING INFORMATION
A description of the policies and procedures used to determine how to vote proxies relating to portfolio securities is available, upon request, by calling1-800-222-8222, visiting our website atwfam.com, or visiting the SEC website at sec.gov. Information regarding how the proxies related to portfolio securities were voted during the most recent12-month period ended June 30 is available on the website atwfam.comor by visiting the SEC website at sec.gov.
QUARTERLY PORTFOLIO HOLDINGS INFORMATION
The Fund files its complete schedule of portfolio holdings with the SEC for the first and third quarters of each fiscal year as an exhibit to its reports on FormN-PORT. Shareholders may view the filed FormN-PORT by visiting the SEC website at sec.gov.
Wells Fargo Short-Term High Yield Bond Fund | 27
Other information (unaudited)
BOARD OF TRUSTEES AND OFFICERS
Each of the Trustees and Officers1 listed in the table below acts in identical capacities for each fund in the Wells Fargo family of funds, which consists of 146 mutual funds comprising the Wells Fargo Funds Trust, Wells Fargo Variable Trust, Wells Fargo Master Trust and fourclosed-end funds (collectively the “Fund Complex”). This table should be read in conjunction with the Prospectus and the Statement of Additional Information2. The mailing address of each Trustee and Officer is 525 Market Street, 12th Floor, San Francisco, CA 94105. Each Trustee and Officer serves an indefinite term, however, each Trustee serves such term until reaching the mandatory retirement age established by the Trustees.
Independent Trustees
| | | | | | |
Name and
year of birth | | Position held and
length of service* | | Principal occupations during past five years or longer | | Current other
public company or
investment
company
directorships |
| | | |
| William R. Ebsworth (Born 1957) | | Trustee,
since 2015 | | Retired. From 1984 to 2013, equities analyst, portfolio manager, research director and chief investment officer at Fidelity Management and Research Company in Boston, Tokyo, and Hong Kong, and retired in 2013 as Chief Investment Officer of Fidelity Strategic Advisers, Inc. where he led a team of investment professionals managing client assets. Prior thereto, Board member of Hong Kong Securities Clearing Co., Hong Kong Options Clearing Corp., the Thailand International Fund, Ltd., Fidelity Investments Life Insurance Company, and Empire Fidelity Investments Life Insurance Company. Audit Committee Chair and Investment Committee Chair of the Vincent Memorial Hospital Endowment(non-profit organization). Mr. Ebsworth is a CFA® charterholder. | | N/A |
| | | |
Jane A. Freeman
(Born 1953) | | Trustee,
since 2015; Chair Liaison, since 2018 | | Retired. From 2012 to 2014 and 1999 to 2008, Chief Financial Officer of Scientific Learning Corporation. From 2008 to 2012, Ms. Freeman provided consulting services related to strategic business projects. Prior to 1999, Portfolio Manager at Rockefeller & Co. and Scudder, Stevens & Clark. Board member of the Harding Loevner Funds from 1996 to 2014, serving as both Lead Independent Director and chair of the Audit Committee. Board member of the Russell Exchange Traded Funds Trust from 2011 to 2012 and the chair of the Audit Committee. Ms. Freeman is a Board Member of The Ruth Bancroft Garden(non-profit organization). She is also an inactive Chartered Financial Analyst. | | N/A |
| | | |
Isaiah Harris, Jr.
(Born 1952) | | Trustee,
since 2009; Audit Committee Chairman, since 2019 | | Retired. Chairman of the Board of CIGNA Corporation since 2009, and Director since 2005. From 2003 to 2011, Director of Deluxe Corporation. Prior thereto, President and CEO of BellSouth Advertising and Publishing Corp. from 2005 to 2007, President and CEO of BellSouth Enterprises from 2004 to 2005 and President of BellSouth Consumer Services from 2000 to 2003. Emeritus member of the Iowa State University Foundation Board of Governors. Emeritus Member of the Advisory Board of Iowa State University School of Business. Advisory Board Member, Palm Harbor Academy (private school). Advisory Board Member, Child Evangelism Fellowship(non-profit). Mr. Harris is a certified public accountant (inactive status). | | CIGNA Corporation |
| | | |
| Judith M. Johnson (Born 1949) | | Trustee,
since 2008; Audit Committee Chairman, from 2009 to 2018 | | Retired. Prior thereto, Chief Executive Officer and Chief Investment Officer of Minneapolis Employees Retirement Fund from 1996 to 2008. Ms. Johnson is an attorney, certified public accountant and a certified managerial accountant. | | N/A |
28 | Wells Fargo Short-Term High Yield Bond Fund
Other information (unaudited)
| | | | | | |
Name and
year of birth | | Position held and
length of service* | | Principal occupations during past five years or longer | | Current other
public company or
investment
company
directorships |
| | | |
| David F. Larcker (Born 1950) | | Trustee,
since 2009 | | James Irvin Miller Professor of Accounting at the Graduate School of Business, Stanford University, Director of the Corporate Governance Research Initiative and Senior Faculty of The Rock Center for Corporate Governance since 2006. From 2005 to 2008, Professor of Accounting at the Graduate School of Business, Stanford University. Prior thereto, Ernst & Young Professor of Accounting at The Wharton School, University of Pennsylvania from 1985 to 2005. | | N/A |
| | | |
| Olivia S. Mitchell (Born 1953) | | Trustee,
since 2006; Nominating and Governance Committee Chair, since 2018 | | International Foundation of Employee Benefit Plans Professor, Wharton School of the University of Pennsylvania since 1993. Director of Wharton’s Pension Research Council and Boettner Center on Pensions & Retirement Research, and Research Associate at the National Bureau of Economic Research. Previously, Cornell University Professor from 1978 to 1993. | | N/A |
| | | |
| Timothy J. Penny (Born 1951) | | Trustee,
since 1996; Chairman, since 2018 | | President and Chief Executive Officer of Southern Minnesota Initiative Foundation, anon-profit organization, since 2007. Member of the Board of Trustees of NorthStar Education Finance, Inc., anon-profit organization, since 2007. | | N/A |
| | | |
| James G. Polisson (Born 1959) | | Trustee,
since 2018 | | Retired. Chief Marketing Officer, Source (ETF) UK Services, Ltd, from 2015 to 2017. From 2012 to 2015, Principal of The Polisson Group, LLC, a management consulting, corporate advisory and principal investing company. Chief Executive Officer and Managing Director at Russell Investments, Global Exchange Traded Funds from 2010 to 2012. Managing Director of Barclays Global Investors from 1998 to 2010 and Global Chief Marketing Officer for iShares and Barclays Global Investors from 2000 to 2010. Trustee of the San Francisco Mechanics’ Institute, anon-profit organization, from 2013 to 2015. Board member of the Russell Exchange Traded Fund Trust from 2011 to 2012. Director of Barclays Global Investors Holdings Deutschland GmbH from 2006 to 2009. Mr. Polisson is an attorney and has a retired status with the Massachusetts and District of Columbia Bar Associations. | | N/A |
| | | |
| Pamela Wheelock3 (Born 1959) | | Trustee,
since January 2020; previously Trustee from January 2018 to July 2019 | | Board member of the Destination Medical Center Economic Development Agency, Rochester, Minnesota since 2019. Acting Commissioner, Minnesota Department of Human Services, July 2019 through September 2019. Human Services Manager (part-time), Minnesota Department of Human Services, October 2019 through December 2019. Chief Operating Officer, Twin Cities Habitat for Humanity from 2017 to 2019. Vice President of University Services, University of Minnesota from 2012 to 2016. Prior thereto, on the Board of Directors, Governance Committee and Finance Committee for the Minnesota Philanthropy Partners (Saint Paul Foundation) from 2012 to 2018, Interim Chief Executive Officer of Blue Cross Blue Shield of Minnesota from 2011 to 2012, Chairman of the Board from 2009 to 2012 and Board Director from 2003 to 2015. Vice President, Leadership and Community Engagement, Bush Foundation, Saint Paul, Minnesota (a private foundation) from 2009 to 2011. Executive Vice President and Chief Financial Officer, Minnesota Sports and Entertainment from 2004 to 2009 and Senior Vice President from 2002 to 2004. Executive Vice President of the Minnesota Wild Foundation from 2004 to 2008. Commissioner of Finance, State of Minnesota, from 1999 to 2002. Currently Board Chair of the Minnesota Wild Foundation since 2010. | | N/A |
| * | Length of service dates reflect the Trustee’s commencement of service with the Trust’s predecessor entities, where applicable. |
Wells Fargo Short-Term High Yield Bond Fund | 29
Other information (unaudited)
Officers
| | | | |
Name and
year of birth | | Position held and
length of service | | Principal occupations during past five years or longer |
| | |
| Andrew Owen (Born 1960) | | President,
since 2017 | | Executive Vice President of Wells Fargo & Company and Head of Affiliated Managers, Wells Fargo Asset Management, since 2014. In addition, Mr. Owen is currently President, Chief Executive Officer and Director of Wells Fargo Funds Management, LLC since 2017. Prior thereto, Executive Vice President responsible for marketing, investments and product development for Wells Fargo Funds Management, LLC, from 2009 to 2014. |
| | |
| Nancy Wiser1 (Born 1967) | | Treasurer,
since 2012 | | Executive Vice President of Wells Fargo Funds Management, LLC since 2011. Chief Operating Officer and Chief Compliance Officer at LightBox Capital Management LLC, from 2008 to 2011. |
| | |
| Michelle Rhee (Born 1966) | | Chief Legal Officer,
since 2019 | | Secretary of Wells Fargo Funds Management, LLC, Chief Legal Counsel of Wells Fargo Asset Management and Assistant General Counsel of Wells Fargo Bank, N.A. since 2018. Associate General Counsel and Managing Director of Bank of America Corporation from 2004 to 2018. |
| | |
| Catherine Kennedy (Born 1969) | | Secretary,
since 2019 | | Vice President of Wells Fargo Funds Management, LLC and Senior Counsel of the Wells Fargo Legal Department since 2010. Vice President and Senior Counsel of Evergreen Investment Management Company, LLC from 1998 to 2010. |
| | |
| Michael H. Whitaker(Born 1967) | | Chief Compliance Officer,
since 2016 | | Chief Compliance Officer of Wells Fargo Asset Management since 2016. Senior Vice President and Chief Compliance Officer for Fidelity Investments from 2007 to 2016. |
| | |
| David Berardi (Born 1975) | | Assistant Treasurer,
since 2009 | | Vice President of Wells Fargo Funds Management, LLC since 2009. Vice President of Evergreen Investment Management Company, LLC from 2008 to 2010. Manager of Fund Reporting and Control for Evergreen Investment Management Company, LLC from 2004 to 2010. |
| | |
| Jeremy DePalma1 (Born 1974) | | Assistant Treasurer,
since 2009 | | Senior Vice President of Wells Fargo Funds Management, LLC since 2009. Senior Vice President of Evergreen Investment Management Company, LLC from 2008 to 2010 and head of the Fund Reporting and Control Team within Fund Administration from 2005 to 2010. |
| 1 | Nancy Wiser acts as Treasurer of 64 funds in the Fund Complex. Jeremy DePalma acts as Treasurer of 82 funds and Assistant Treasurer of 64 funds in the Fund Complex. |
| 2 | The Statement of Additional Information includes additional information about the Trustees and is available, without charge, upon request, by calling1-800-222-8222 or by visiting the website atwfam.com. |
| 3 | Pamela Wheelock wasre-appointed to the Board effective January 1, 2020. |
30 | Wells Fargo Short-Term High Yield Bond Fund
Appendix I (unaudited)
Effective on or about May 1, 2020, if you purchase Fund shares through a Janney Montgomery Scott LLC (“Janney”) brokerage account, you will be eligible for the following load waivers(front-end sales charge waivers and contingent deferred sales charge (“CDSC”), orback-end sales charge, waivers) and discounts, which may differ from those disclosed elsewhere in the Fund’s Prospectus or SAI.
|
|
| Front-end sales charge* waivers on Class A shares available at Janney |
|
| Shares purchased through reinvestment of capital gains distributions and dividend reinvestment when purchasing shares of the same fund (but not any other fund within the fund family). |
|
| Shares purchased by employees and registered representatives of Janney or its affiliates and their family members as designated by Janney. |
|
Shares purchased from the proceeds of redemptions within the same fund family, provided (1) the repurchase occurs within ninety (90) days following the redemption, (2) the redemption and purchase occur in the same account, and (3) redeemed shares were subject to afront-end or deferred sales load (i.e., right of reinstatement). |
|
Employer-sponsored retirement plans (e.g., 401(k) plans, 457 plans, employer-sponsored 403(b) plans, profit sharing and money purchase pension plans and defined benefit plans). For purposes of this provision, employer-sponsored retirement plans do not include SEP IRAs, Simple IRAs, SAR-SEPs or Keogh plans. |
|
| Shares acquired through a right of reinstatement. |
|
| Class C shares that are no longer subject to a contingent deferred sales charge and are converted to Class A shares of the same fund pursuant to Janney’s policies and procedures. |
|
| CDSC waivers on Class A and Class C shares available at Janney |
|
| Shares sold upon the death or disability of the shareholder. |
|
| Shares sold as part of a systematic withdrawal plan as described in the Fund’s Prospectus. |
|
| Shares purchased in connection with a return of excess contributions from an IRA account. |
|
| Shares sold as part of a required minimum distribution for IRA and retirement accounts if the redemption is taken in or after the year the shareholder reaches qualified age based on applicable IRS regulations. |
|
| Shares sold to pay Janney fees but only if the transaction is initiated by Janney. |
|
| Shares acquired through a right of reinstatement. |
|
| Shares exchanged into the same share class of a different fund. |
|
| Front-end sales charge* discounts available at Janney; breakpoints, rights of accumulation and/or letters of intent |
|
| Breakpoints as described in the Fund’s Prospectus. |
|
| Rights of accumulation (“ROA”), which entitle shareholders to breakpoint discounts, will be automatically calculated based on the aggregated holding of fund family assets held by accounts within the purchaser’s household at Janney. Eligible fund family assets not held at Janney may be included in the ROA calculation only if the shareholder notifies his or her financial advisor about such assets. |
|
Letters of intent which allow for breakpoint discounts based on anticipated purchases within a fund family, over a13-month time period. Eligible fund family assets not held at Janney Montgomery Scott may be included in the calculation of letters of intent only if the shareholder notifies his or her financial advisor about such assets. |
| * | Also referred to as an “initial sales charge.” |
Wells Fargo Short-Term High Yield Bond Fund | 31
Appendix II (unaudited)
Effective on or after May 1, 2020, clients of Edward Jones (also referred to as “shareholders”) purchasing Fund shares on the Edward Jones commission andfee-based platforms are eligible only for the following sales charge discounts (also referred to as “breakpoints”) and waivers, which can differ from breakpoints and waivers described elsewhere in this Prospectus or SAI or through another broker-dealer. In all instances, it is the shareholder’s responsibility to inform Edward Jones at the time of purchase of any relationship, holdings of Wells Fargo Funds or other facts qualifying the purchaser for breakpoints or waivers. Edward Jones can ask for documentation of such circumstance.
|
| Breakpoints available at Edward Jones |
|
| Rights of Accumulation (ROA) |
|
The applicable sales charge on a purchase of Class A shares is determined by taking into account all share classes (except any money market funds and retirement plan share classes) of Wells Fargo Funds held by the shareholder or in an account grouped by Edward Jones with other accounts for the purpose of providing certain pricing considerations (“pricing groups”). This includes all share classes held on the Edward Jones platform and/or held on another platform. The inclusion of eligible fund family assets in the rights of accumulation calculation is dependent on the shareholder notifying his or her financial advisor of such assets at the time of calculation. |
|
ROA is determined by calculating the higher of cost or market value (current shares x NAV). |
|
| Letter of Intent (LOI) |
|
Through a LOI, shareholders can receive the sales charge and breakpoint discounts for purchases shareholders intend to makeover a13-month period from the date Edward Jones receives the LOI. The LOI is determined by calculating the higher of cost or market value of qualifying holdings at LOI initiation in combination with the value that the shareholder intends to buy over a13-month period to calculate thefront-end sales charge and any breakpoint discounts. Each purchase the shareholder makes during that13-month period will receive the sales charge and breakpoint discount that applies to the total amount. The inclusion of eligible fund family assets in the LOI calculation is dependent on the shareholder notifying his or her financial advisor of such assets at the time of calculation. Purchases made before the LOI is received by Edward Jones are not covered under the LOI and will not reduce the sales charge previously paid. Sales charges will be adjusted if LOI is not met. |
| Sales charges are waived for the following shareholders and in the following situations at Edward Jones: |
● Associates of Edward Jones and its affiliates and their family members who are in the same pricing group (as determined by Edward Jones under its policies and procedures) as the associate. This waiver will continue for the remainder of the associate’s life if the associate retires from Edward Jones in good-standing. |
● Shares purchased in an Edward Jonesfee-based program. |
● Shares purchased through reinvestment of capital gains distributions and dividend reinvestment. |
● Shares purchased from the proceeds of redeemed shares of the same fund family so long as the following conditions are met: 1)the proceeds are from the sale of shares within 60 days of the purchase, and 2) the sale and purchase are made in the same share class and the same account or the purchase is made in an individual retirement account with proceeds from liquidations in anon-retirement account. |
● Shares exchanged into Class A shares from another share class so long as the exchange is into the same fund and was initiated at the discretion of Edward Jones. Edward Jones is responsible for any remaining CDSC due to the fund company, if applicable. Any future purchases are subject to the applicable sales charge as disclosed in the prospectus. |
● Exchanges from Class C shares to Class A shares of the same fund, generally, in the 84th month following the anniversary of the purchase date or earlier at the discretion of Edward Jones. |
If the shareholder purchases shares that are subject to a CDSC and those shares are redeemed before the CDSC is expired, the shareholder is
responsible to pay the CDSC except in the following conditions available at Edward Jones: |
● The death or disability of the shareholder. |
● Systematic withdrawals with up to 10% per year of the account value. |
● Return of excess contributions from an Individual Retirement Account (IRA). |
● Shares sold as part of a required minimum distribution for IRA and retirement accounts if the redemption is taken in or after the year the shareholder reaches qualified age based on applicable IRS regulation. |
● Shares sold to pay Edward Jones fees or costs in such cases where the transaction is initiated by Edward Jones. |
● Shares exchanged in an Edward Jonesfee-based program. |
● Shares acquired through NAV reinstatement. |
32 | Wells Fargo Short-Term High Yield Bond Fund
Appendix II (unaudited)
|
| Other Important Information for accounts at Edward Jones: |
Minimum Purchase Amounts ● $250 initial purchase minimum ● $50 subsequent purchase minimum |
Minimum Balances Edward Jones has the right to redeem at its discretion fund holdings with a balance of $250 or less. The following are examples of accounts that are not included in this policy: ● Afee-based account held on an Edward Jones platform ● A 529 account held on an Edward Jones platform ● An account with an active systematic investment plan or letter of intent (LOI) |
Changing Share Classes At any time it deems necessary, Edward Jones has the authority to exchange at NAV a shareholder’s holdings in a fund to Class A shares. |
Wells Fargo Short-Term High Yield Bond Fund | 33
This page is intentionally left blank.
This page is intentionally left blank.
This page is intentionally left blank.

For more information
More information about Wells Fargo Funds is available free upon request. To obtain literature, please write, visit the Fund’s website, or call:
Wells Fargo Funds
P.O. Box 219967
Kansas City, MO 64121-9967
Website:wfam.com
Individual investors:1-800-222-8222
Retail investment professionals:1-888-877-9275
Institutional investment professionals:1-866-765-0778

This report and the financial statements contained herein are submitted for the general information of the shareholders of the Fund. If this report is used for promotional purposes, distribution of the report must be accompanied or preceded by a current prospectus. Before investing, please consider the investment objectives, risks, charges, and expenses of the investment. For a current prospectus and, if available, a summary prospectus, containing this information, call1-800-222-8222 or visit the Fund’s website atwfam.com. Read the prospectus carefully before you invest or send money.
Wells Fargo Asset Management (WFAM) is the trade name for certain investment advisory/management firms owned by Wells Fargo & Company. These firms include but are not limited to Wells Capital Management Incorporated and Wells Fargo Funds Management, LLC. Certain products managed by WFAM entities are distributed by Wells Fargo Funds Distributor, LLC (a broker-dealer and Member FINRA).
This material is for general informational and educational purposes only and is NOT intended to provide investment advice or a recommendation of any kind—including a recommendation for any specific investment, strategy, or plan.
INVESTMENT PRODUCTS: NOT FDIC INSURED ◾ NO BANK GUARANTEE ◾ MAY LOSE VALUE
© 2020 Wells Fargo & Company. All rights reserved
PAR-0320-04745 04-20
SA222/SAR222 02-20
Semi-Annual Report
February 29, 2020
Wells Fargo
Ultra Short-Term Income Fund
Beginning on January 1, 2021, as permitted by new regulations adopted by the Securities and Exchange Commission, paper copies of the Wells Fargo Funds’ annual and semi-annual shareholder reports issued after this date will no longer be sent by mail, unless you specifically request paper copies of the reports. Instead, the reports will be made available on the Funds’ website, and you will be notified by mail each time a report is posted and provided with a website address to access the report.
If you already elected to receive shareholder reports electronically, you will not be affected by this change and you need not take any action. You may elect to receive shareholder reports and other communications from the Fund electronically at any time by contacting your financial intermediary (such as a broker-dealer or bank) or, if you are a direct investor, by calling1-800-222-8222 or by enrolling at wellsfargo.com/advantagedelivery.
You may elect to receive all future reports in paper free of charge. If you invest through a financial intermediary, you can contact your financial intermediary to request that you continue to receive paper copies of your shareholder reports; if you invest directly with the Fund, you can call 1-800-222-8222. Your election to receive reports in paper will apply to all Wells Fargo Funds held in your account with your financial intermediary or, if you are a direct investor, to all Wells Fargo Funds that you hold.
|
|
|
Reduce clutter. Save trees. |
Sign up for electronic delivery of prospectuses and shareholder reports atwellsfargo.com/advantagedelivery |
The views expressed and any forward-looking statements are as of February 29, 2020, unless otherwise noted, and are those of the Fund managers and/or Wells Fargo Asset Management. Discussions of individual securities, or the markets generally, or any Wells Fargo Fund are not intended as individual recommendations. Future events or results may vary significantly from those expressed in any forward-looking statements. The views expressed are subject to change at any time in response to changing circumstances in the market. Wells Fargo Asset Management and the Fund disclaim any obligation to publicly update or revise any views expressed or forward-looking statements.
|
INVESTMENT PRODUCTS: NOT FDIC INSURED ◾ NO BANK GUARANTEE ◾ MAY LOSE VALUE |
Wells Fargo Ultra Short-Term Income Fund | 1
Letter to shareholders (unaudited)

Andrew Owen
President
Wells Fargo Funds
“The fourth quarter started on a strong note, with U.S.-China trade tensions relaxing in October along with renewed optimism for a U.K. Brexit deal and positive macroeconomic data.”
Dear Shareholder:
We are pleased to offer you this semi-annual report for the Wells Fargo Ultra Short-Term Income Fund for thesix-month period that ended February 29, 2020. As market volatility increased, returns for the period were more restrained after strong results in previous recent periods. However, supportive central banks addressed concerns over slowing global economic growth and international trade tensions.
Fixed-income and equity investors had mixed semi-annual returns. For the period, U.S. stocks, based on the S&P 500 Index,1 gained 1.92% and international stocks, as measured by the MSCI ACWI ex USA Index (Net),2 returned 0.13%. The MSCI EM Index (Net)3 gained 2.93%. For bond investors, the Bloomberg Barclays U.S. Aggregate Bond Index4 added 3.39%, the Bloomberg Barclays Global Aggregateex-USD Index5 returned-0.21%, the Bloomberg Barclays Municipal Bond Index6 gained 3.04%, and the ICE BofA U.S. High Yield Index7 added 1.34%.
The period began with uncertainty, leading to central bank support.
In September, as the period began, the U.S. Federal Reserve (Fed) cut interest rates a second time in the third quarter. U.S. manufacturing data disappointed investors. The U.S. Congress announced it would pursue an impeachment investigation of President Trump. Meanwhile, the Brexit impasse showed no signs of resolution. Officials in China warned it would be difficult to reach the country’s annual economic growth goals considering the weight of tariffs and trade restrictions. Although the S&P 500 Index finished the third quarter with the bestyear-to-date returns in more than 20 years, concerns about future returns remained.
The fourth quarter started on a strong note, with U.S.-China trade tensions relaxing in October along with renewed optimism for a U.K. Brexit deal and positive macroeconomic data. The initial estimate of U.S. third-quarter gross domestic product growth was a resilient 1.9% annualized rate, while the U.S. unemployment rate fell to a50-year low of 3.5% in September. However, despite resilience among U.S. consumers, business confidence declined while manufacturing activity contracted. Concerned with a potential economic slowdown, the Fed lowered interest rates another quarter point in late October—its third rate cut in four months. This helped push the S&P 500 Index to anall-time high, while emerging market equities rallied and global bonds declined overall, reflecting a broad pickup in risk appetite.
| 1 | The S&P 500 Index consists of 500 stocks chosen for market size, liquidity, and industry group representation. It is a market-value-weighted index with each stock’s weight in the index proportionate to its market value. You cannot invest directly in an index. |
| 2 | The Morgan Stanley Capital International (MSCI) All Country World Index (ACWI) ex USA Index (Net) is a free-float-adjusted market-capitalization-weighted index that is designed to measure the equity market performance of developed markets, excluding the United States. Source: MSCI. MSCI makes no express or implied warranties or representations and shall have no liability whatsoever with respect to any MSCI data contained herein. The MSCI data may not be further redistributed or used as a basis for other indices or any securities or financial products. This report is not approved, reviewed, or produced by MSCI. You cannot invest directly in an index. |
| 3 | The MSCI Emerging Markets (EM) Index (Net) is a free-float-adjusted market-capitalization-weighted index that is designed to measure equity market performance of emerging markets. You cannot invest directly in an index. |
| 4 | The Bloomberg Barclays U.S. Aggregate Bond Index is a broad-based benchmark that measures the investment-grade, U.S. dollar-denominated, fixed-rate taxable bond market, including Treasuries, government-related and corporate securities, mortgage-backed securities (agency fixed-rate and hybrid adjustable-rate mortgage pass-throughs), asset-backed securities, and commercial mortgage-backed securities. You cannot invest directly in an index. |
| 5 | The Bloomberg Barclays Global Aggregateex-USD Index is an unmanaged index that provides a broad-based measure of the global investment-grade fixed-income markets excluding the U.S. dollar-denominated debt market. You cannot invest directly in an index. |
| 6 | The Bloomberg Barclays Municipal Bond Index is an unmanaged index composed of long-termtax-exempt bonds with a minimum credit rating of Baa. You cannot invest directly in an index. |
| 7 | The ICE BofA U.S. High Yield Index is a market-capitalization-weighted index of domestic and Yankee high-yield bonds. The index tracks the performance of high-yield securities traded in the U.S. bond market. You cannot invest directly in an index. Copyright 2020. ICE Data Indices, LLC. All rights reserved. |
2 | Wells Fargo Ultra Short-Term Income Fund
Letter to shareholders (unaudited)
Equity markets continued to rally in November despite ongoing geopolitical risks. Hopes for a U.S.-China trade deal buoyed investor confidence. U.S. business sentiment improved slightly, and manufacturing and services activity picked up. With that positive backdrop, developed market equities outpaced those in emerging markets, and U.S. stocks, as reflected by the S&P 500 Index, outperformednon-U.S. stocks overall. While consumer confidence and purchasing manager activity rose in the eurozone, China reported weakening manufacturing and consumer data. Bond yields rose marginally, leading to slightly negative returns for global government and investment-grade corporate bonds.
Financial markets ended 2019 with a boost from the U.S. and China accord on a Phase One trade deal. That, along with the landslide win by thepro-Brexit U.K. Conservative Party in a national election and ongoing central bank support, gave investors greater confidence. U.S. economic indicators were generally positive, with the exception of manufacturing activity and business confidence. Consumer confidence was resilient, fed by a robust labor market, tame inflation, and lower interest rates, which boosted housing affordability and stimulated homebuyer activity. The impeachment of U.S. President Donald Trump had little impact on markets. Meanwhile, slowing Chinese economic activity, partly attributable to the trade war, led to further government stimulus atyear-end through lower reserve ratios, allowing banks to lend more money.
Theyear-end rally continued in early January 2020. However, capital market volatility picked up sharply in late January on concerns over the unknown impact of the novel coronavirus(COVID-19) on the global economy and stock markets. With sentiment somewhat souring, perceived safe havens did well in January. The U.S. dollar and Japanese yen both rose and government bonds outperformed equities. While the S&P 500 Index held its ground, emerging market equities tumbled, including those in Asia that are most exposed to viruses—physical or economic—originating in China.
In February, the coronavirus became the major market focus. Fears of the virus’s impact on global growth led to expectations of increased global central bank monetary policy support. That led the10-year Treasury yield to fall to anall-time low of 1.1% by the end of the month. Although equity markets initially shrugged off concerns about the outbreak, focusing instead on strong fourth-quarter earnings and improving business confidence in January, market sentiment turned sharply lower towardmonth-end and the S&P 500 Index lost 8.2% for the month. Oil prices tumbled as Russia and the Organization of the Petroleum Exporting Countries compounded a major decline in oil demand with a brutal price war, partly aimed at dissuading further U.S. shale production. As a result, the price of West Texas Intermediate crude oil fell 13% in February and 27% for 2020 year to date.
Don’t let short-term uncertainty derail long-term investment goals.
Periods of investment uncertainty can present challenges, but experience has taught us that maintaining long-term investment goals can be an effective way to plan for the future. Although diversification cannot guarantee an investment profit or prevent losses, we believe it can be an effective way to manage investment risk and potentially smooth out overall portfolio performance. We encourage investors to know their investments and to understand that appropriate levels of risk-taking may unlock opportunities.
“Capital market volatility picked up sharply in late January on concerns over the unknown impact of the novel coronavirus (COVID-19) on the global economy and stock markets.”
|
|
|
For further information about your Fund, contact your investment professional, visit our website at wfam.com, or call us directly at1-800-222-8222. |
Wells Fargo Ultra Short-Term Income Fund | 3
Letter to shareholders (unaudited)
Thank you for choosing to invest with Wells Fargo Funds. We appreciate your confidence in us and remain committed to helping you meet your financial needs.
Sincerely,

Andrew Owen
President
Wells Fargo Funds
4 | Wells Fargo Ultra Short-Term Income Fund
Performance highlights (unaudited)
Investment objective
The Fund seeks current income consistent with capital preservation.
Manager
Wells Fargo Funds Management, LLC
Subadviser
Wells Capital Management Incorporated
Portfolio managers
Christopher Y. Kauffman, CFA®‡
Jay N. Mueller, CFA®‡
Michael J. Schueller, CFA®‡
Noah M. Wise, CFA®‡
Average annual total returns (%) as of February 29, 2020
| | | | | | | | | | | | | | | | | | | | | | | | | | | | | | | | | | |
| | | | |
| | | | | Including sales charge | | | Excluding sales charge | | | Expense ratios1 (%) | |
| | | | | | | | | |
| | | Inception date | | 1 year | | | 5 year | | | 10 year | | | 1 year | | | 5 year | | | 10 year | | | Gross | | | Net2 | |
| | | | | | | | | | |
| Class A (SADAX) | | 8-31-1999 | | | 0.76 | | | | 1.15 | | | | 1.12 | | | | 2.82 | | | | 1.56 | | | | 1.32 | | | | 0.81 | | | | 0.71 | |
| | | | | | | | | | |
| Class C (WUSTX) | | 7-18-2008 | | | 1.05 | | | | 0.80 | | | | 0.58 | | | | 2.05 | | | | 0.80 | | | | 0.58 | | | | 1.56 | | | | 1.46 | |
| | | | | | | | | | |
| Administrator Class (WUSDX) | | 4-8-2005 | | | – | | | | – | | | | – | | | | 2.98 | | | | 1.69 | | | | 1.46 | | | | 0.75 | | | | 0.56 | |
| | | | | | | | | | |
| Institutional Class (SADIX) | | 8-31-1999 | | | – | | | | – | | | | – | | | | 3.18 | | | | 1.89 | | | | 1.68 | | | | 0.48 | | | | 0.36 | |
| | | | | | | | | | |
| Bloomberg Barclays Short-Term Government/Corporate Bond Index3 | | – | | | – | | | | – | | | | – | | | | 2.67 | | | | 1.42 | | | | 0.88 | | | | – | | | | – | |
Figures quoted represent past performance, which is no guarantee of future results, and do not reflect taxes that a shareholder may pay on an investment in a fund. Investment return and principal value of an investment will fluctuate so that an investor’s shares, when redeemed, may be worth more or less than their original cost. Performance shown without sales charges would be lower if sales charges were reflected. Current performance may be lower or higher than the performance data quoted, which assumes the reinvestment of dividends and capital gains. Currentmonth-end performance is available on the Fund’s website,wfam.com.
Index returns do not include transaction costs associated with buying and selling securities, any mutual fund fees or expenses, or any taxes. It is not possible to invest directly in an index.
For Class A shares, the maximumfront-end sales charge is 2.00%. For Class C shares, the maximum contingent deferred sales charge is 1.00%. Performance including a contingent deferred sales charge assumes the sales charge for the corresponding time period. Administrator Class and Institutional Class shares are sold without afront-end sales charge or contingent deferred sales charge.
Bond values fluctuate in response to the financial condition of individual issuers, general market and economic conditions, and changes in interest rates. Changes in market conditions and government policies may lead to periods of heightened volatility in the bond market and reduced liquidity for certain bonds held by the Fund. In general, when interest rates rise, bond values fall and investors may lose principal value. Interest rate changes and their impact on the Fund and its share price can be sudden and unpredictable. Loans are subject to risks similar to those associated with other below-investment-grade bond investments, such as credit risk (for example, risk of issuer default), below-investment-grade bond risk (for example, risk of greater volatility in value), and risk that the loan may become illiquid or difficult to price. The use of derivatives may reduce returns and/or increase volatility. Foreign investments are especially volatile and can rise or fall dramatically due to differences in the political and economic conditions of the host country. These risks are generally intensified in emerging markets. Certain investment strategies tend to increase the total risk of an investment (relative to the broader market). The Fund is exposed to high-yield securities risk and mortgage- and asset-backed securities risk. Consult the Fund’s prospectus for additional information on these and other risks.
Please see footnotes on page 6.
Wells Fargo Ultra Short-Term Income Fund | 5
Performance highlights (unaudited)
| | | | |
| |
| Ten largest holdings (%) as of February 29, 20204 | | | |
| | |
iShares Short-Term Corporate Bond ETF | | | 2.83 | |
| | |
SPDR Portfolio Short Term Corporate Bond ETF | | | 2.83 | |
| | |
Nissan Auto Lease Trust Series2019-A Class A3, 2.76%,3-15-2022 | | | 1.08 | |
| | |
Ally Master Owner Trust Series2018-4 Class A, 3.30%,7-17-2023 | | | 1.05 | |
| | |
World Omni Automobiles Lease Securitization Trust Series2018-B Class A3, 3.19%,12-15-2021 | | | 0.99 | |
| | |
Banco Santander SA, 3.50%,4-11-2022 | | | 0.95 | |
| | |
Daimler Trucks Retail Trust Series2018-1 Class A4, 3.03%,11-15-2024 | | | 0.92 | |
| | |
Bank of America Corporation, 2.33%,10-1-2021 | | | 0.91 | |
| | |
Westlake Automobile Receivables TrustSeries 2019-2A A2A, 2.57%,2-15-2023 | | | 0.90 | |
| | |
Morgan Stanley, 2.75%,5-19-2022 | | | 0.88 | |
|
|
| Portfolio composition as of February 29, 20205 |
|
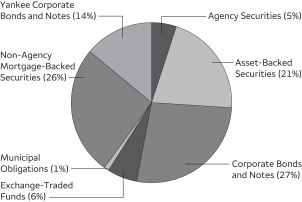 |
| ‡ | CFA® and Chartered Financial Analyst® are trademarks owned by CFA Institute. |
| 1 | Reflects the expense ratios as stated in the most recent prospectuses, which include the impact of 0.01% in acquired fund fees and expenses. The expense ratios shown are subject to change and may differ from the annualized expense ratios shown in the financial highlights of this report, which do not include acquired fund fees and expenses. |
| 2 | The manager has contractually committed through December 31, 2020, to waive fees and/or reimburse expenses to the extent necessary to cap total annual fund operating expenses after fee waivers at 0.70% for Class A, 1.45% for Class C, 0.55% for Administrator Class, and 0.35% for Institutional Class. Brokerage commissions, stamp duty fees, interest, taxes, acquired fund fees and expenses (if any), and extraordinary expenses are excluded from the expense cap. Prior to or after the commitment expiration date, the cap may be increased or the commitment to maintain the cap may be terminated only with the approval of the Board of Trustees. Without this cap, the Fund’s returns would have been lower. The expense ratio paid by an investor is the net expense ratio (the total annual fund operating expenses after fee waivers) as stated in the prospectuses. |
| 3 | The Bloomberg Barclays Short-Term Government/Corporate Bond Index contains securities that have fallen out of the Bloomberg Barclays U.S. Government/Credit Bond Index because of the standard minimumone-year-to-maturity constraint. Securities in the Bloomberg Barclays Short-Term Government/Corporate Bond Index must have a maturity from 1 up to (but not including) 12 months. You cannot invest directly in an index. |
| 4 | The ten largest holdings, excluding cash, cash equivalents and any money market funds, are calculated based on the value of the investments divided by total net assets of the Fund. Holdings are subject to change and may have changed since the date specified. |
| 5 | Amounts are calculated based on the total long-term investments of the Fund. These amounts are subject to change and may have changed since the date specified. |
6 | Wells Fargo Ultra Short-Term Income Fund
Fund expenses (unaudited)
As a shareholder of the Fund, you incur two types of costs: (1) transaction costs, including sales charges (loads) on purchase payments and contingent deferred sales charges (if any) on redemptions and (2) ongoing costs, including management fees, distribution(12b-1) and/or shareholder servicing fees, and other Fund expenses. This example is intended to help you understand your ongoing costs (in dollars) of investing in the Fund and to compare these costs with the ongoing costs of investing in other mutual funds.
The example is based on an investment of $1,000 invested at the beginning of thesix-month period and held for the entire period from September 1, 2019 to February 29, 2020.
Actual expenses
The “Actual” line of the table below provides information about actual account values and actual expenses. You may use the information in this line, together with the amount you invested, to estimate the expenses that you paid over the period. Simply divide your account value by $1,000 (for example, an $8,600 account value divided by $1,000 = 8.6), then multiply the result by the number in the “Actual” line under the heading entitled “Expenses paid during period” for your applicable class of shares to estimate the expenses you paid on your account during this period.
Hypothetical example for comparison purposes
The “Hypothetical” line of the table below provides information about hypothetical account values and hypothetical expenses based on the Fund’s actual expense ratio and an assumed rate of return of 5% per year before expenses, which is not the Fund’s actual return. The hypothetical account values and expenses may not be used to estimate the actual ending account balance or expenses you paid for the period. You may use this information to compare the ongoing costs of investing in the Fund and other funds. To do so, compare this 5% hypothetical example with the 5% hypothetical examples that appear in the shareholder reports of the other funds.
Please note that the expenses shown in the table are meant to highlight your ongoing costs only and do not reflect any transactional costs, such as sales charges (loads) and contingent deferred sales charges. Therefore, the “Hypothetical” line of the table is useful in comparing ongoing costs only and will not help you determine the relative total costs of owning different funds. In addition, if these transactional costs were included, your costs would have been higher.
| | | | | | | | | | | | | | | | |
| | | Beginning
account value
9-1-2019 | | | Ending
account value
2-29-2020 | | | Expenses
paid during
the period¹ | | | Annualized net
expense ratio | |
| | | | | |
Class A | | | | | | | | | | | | | | | | |
| | | | |
Actual | | $ | 1,000.00 | | | $ | 1,012.47 | | | $ | 3.50 | | | | 0.70 | % |
| | | | |
Hypothetical (5% return before expenses) | | $ | 1,000.00 | | | $ | 1,021.38 | | | $ | 3.52 | | | | 0.70 | % |
| | | | | |
Class C | | | | | | | | | | | | | | | | |
| | | | |
Actual | | $ | 1,000.00 | | | $ | 1,007.52 | | | $ | 7.24 | | | | 1.45 | % |
| | | | |
Hypothetical (5% return before expenses) | | $ | 1,000.00 | | | $ | 1,017.65 | | | $ | 7.27 | | | | 1.45 | % |
| | | | | |
Administrator Class | | | | | | | | | | | | | | | | |
| | | | |
Actual | | $ | 1,000.00 | | | $ | 1,012.04 | | | $ | 2.75 | | | | 0.55 | % |
| | | | |
Hypothetical (5% return before expenses) | | $ | 1,000.00 | | | $ | 1,022.13 | | | $ | 2.77 | | | | 0.55 | % |
| | | | | |
Institutional Class | | | | | | | | | | | | | | | | |
| | | | |
Actual | | $ | 1,000.00 | | | $ | 1,013.04 | | | $ | 1.75 | | | | 0.35 | % |
| | | | |
Hypothetical (5% return before expenses) | | $ | 1,000.00 | | | $ | 1,023.12 | | | $ | 1.76 | | | | 0.35 | % |
| 1 | Expenses paid is equal to the annualized net expense ratio of each class multiplied by the average account value over the period, multiplied by the number of days in the most recent fiscal half-year divided by the number of days in the fiscal year (to reflect theone-half-year period). |
Wells Fargo Ultra Short-Term Income Fund | 7
Portfolio of investments—February 29, 2020 (unaudited)
| | | | | | | | | | | | | | | | |
| | | Interest
rate | | | Maturity
date | | | Principal | | | Value | |
| Agency Securities: 5.02% | |
FDIC Series2013-R1 Class A 144A | | | 1.15 | % | | | 3-25-2033 | | | $ | 207,338 | | | $ | 206,955 | |
FHLMC (1 Month LIBOR +0.50%)± | | | 2.16 | | | | 9-15-2041 | | | | 1,351,867 | | | | 1,356,886 | |
FHLMC (1 Year Treasury Constant Maturity +2.25%)± | | | 4.06 | | | | 4-1-2038 | | | | 526,629 | | | | 559,285 | |
FHLMC (1 Year Treasury Constant Maturity +2.25%)± | | | 4.31 | | | | 9-1-2038 | | | | 1,151,803 | | | | 1,225,087 | |
FHLMC (1 Year Treasury Constant Maturity +2.25%)± | | | 4.36 | | | | 10-1-2038 | | | | 536,274 | | | | 572,297 | |
FHLMC | | | 4.50 | | | | 8-1-2020 | | | | 7,366 | | | | 7,651 | |
FHLMC | | | 4.50 | | | | 1-1-2022 | | | | 13,114 | | | | 13,622 | |
FHLMC | | | 4.50 | | | | 6-1-2024 | | | | 701,245 | | | | 735,896 | |
FHLMC | | | 4.50 | | | | 9-1-2026 | | | | 1,081,518 | | | | 1,133,553 | |
FHLMC (1 Year Treasury Constant Maturity +2.23%)± | | | 4.52 | | | | 3-1-2035 | | | | 546,410 | | | | 578,897 | |
FHLMC (1 Year Treasury Constant Maturity +2.25%)± | | | 4.60 | | | | 11-1-2035 | | | | 1,362,615 | | | | 1,445,072 | |
FHLMC (1 Year Treasury Constant Maturity +2.25%)± | | | 4.67 | | | | 6-1-2032 | | | | 1,498 | | | | 1,551 | |
FHLMC (1 Year Treasury Constant Maturity +2.20%)± | | | 4.71 | | | | 5-1-2035 | | | | 189,330 | | | | 199,630 | |
FHLMC (1 Year Treasury Constant Maturity +2.25%)± | | | 4.76 | | | | 4-1-2032 | | | | 78,996 | | | | 83,240 | |
FHLMC (1 Year Treasury Constant Maturity +2.33%)± | | | 4.83 | | | | 1-1-2029 | | | | 30,698 | | | | 30,989 | |
FHLMC (1 Year Treasury Constant Maturity +2.40%)± | | | 4.90 | | | | 7-1-2029 | | | | 604 | | | | 620 | |
FHLMC | | | 5.50 | | | | 12-1-2022 | | | | 256,740 | | | | 267,562 | |
FHLMC | | | 5.50 | | | | 12-1-2023 | | | | 289,480 | | | | 303,169 | |
FHLMC | | | 6.00 | | | | 10-1-2021 | | | | 236,114 | | | | 241,580 | |
FHLMC | | | 6.00 | | | | 10-1-2021 | | | | 259,414 | | | | 265,070 | |
FHLMC | | | 6.00 | | | | 1-1-2024 | | | | 239,890 | | | | 248,614 | |
FHLMC | | | 7.00 | | | | 6-1-2031 | | | | 212,453 | | | | 240,846 | |
FHLMC | | | 9.50 | | | | 9-1-2020 | | | | 2,100 | | | | 2,108 | |
FHLMC | | | 9.50 | | | | 12-1-2022 | | | | 1,325 | | | | 1,336 | |
FHLMC | | | 10.00 | | | | 11-17-2021 | | | | 1,472 | | | | 1,482 | |
FHLMC | | | 10.50 | | | | 5-1-2020 | | | | 739 | | | | 739 | |
FHLMC Series 2611 Class HD | | | 5.00 | | | | 5-15-2023 | | | | 348,437 | | | | 363,549 | |
FHLMC Series 2649 Class WL | | | 4.00 | | | | 7-15-2023 | | | | 576,539 | | | | 586,074 | |
FHLMC Series 2704 Class BH | | | 4.50 | | | | 11-15-2023 | | | | 256,399 | | | | 264,639 | |
FHLMC Series 2881 Class AE | | | 5.00 | | | | 8-15-2034 | | | | 133,885 | | | | 138,713 | |
FHLMC Series 2953 Class LD | | | 5.00 | | | | 12-15-2034 | | | | 116,095 | | | | 120,991 | |
FHLMC Series 3266 Class D | | | 5.00 | | | | 1-15-2022 | | | | 2 | | | | 2 | |
FHLMC Series 3609 Class LA | | | 4.00 | | | | 12-15-2024 | | | | 2,501 | | | | 2,510 | |
FHLMC Series 3821 Class LA | | | 3.50 | | | | 4-15-2025 | | | | 23,980 | | | | 23,983 | |
FHLMC Series 3834 Class EA | | | 3.50 | | | | 6-15-2029 | | | | 126,185 | | | | 127,735 | |
FHLMC Series 3888 Class NA | | | 2.25 | | | | 1-15-2040 | | | | 1,087,036 | | | | 1,100,438 | |
FHLMC Series 3898 Class NE | | | 4.00 | | | | 7-15-2040 | | | | 43,084 | | | | 43,147 | |
FHLMC Series 4172 Class PB | | | 1.50 | | | | 7-15-2040 | | | | 228,557 | | | | 228,108 | |
FHLMC Series 4318 Class LC | | | 2.00 | | | | 6-15-2038 | | | | 90,141 | | | | 90,035 | |
FHLMC Series 4348 Class MH | | | 3.00 | | | | 6-15-2039 | | | | 1,644,418 | | | | 1,687,829 | |
FHLMC Series 4764 Class BA | | | 4.00 | | | | 6-15-2042 | | | | 823,810 | | | | 846,725 | |
FHLMC Series 4889 Class CD | | | 3.00 | | | | 4-15-2049 | | | | 4,106,298 | | | | 4,221,243 | |
FHLMC Series KF15 Class A (1 Month LIBOR +0.67%)± | | | 2.33 | | | | 2-25-2023 | | | | 519,665 | | | | 519,094 | |
FHLMC Series KI01 Class A (1 Month LIBOR +0.16%)± | | | 1.82 | | | | 9-25-2022 | | | | 351,882 | | | | 351,565 | |
FHLMC Series QO04 Class AFL (12 Month Treasury Average +0.74%)± | | | 2.79 | | | | 5-25-2044 | | | | 2,568,514 | | | | 2,570,933 | |
FHLMC SeriesT-42 Class A6 | | | 9.50 | | | | 2-25-2042 | | | | 543,925 | | | | 684,418 | |
FNMA | | | 2.00 | | | | 4-1-2023 | | | | 1,995,763 | | | | 2,012,857 | |
FNMA (6 Month LIBOR +1.51%)± | | | 3.55 | | | | 9-1-2037 | | | | 285,985 | | | | 296,543 | |
FNMA (6 Month LIBOR +1.40%)± | | | 3.65 | | | | 10-1-2031 | | | | 66,957 | | | | 68,524 | |
FNMA (1 Year Treasury Constant Maturity +2.27%)± | | | 3.90 | | | | 2-1-2036 | | | | 865,917 | | | | 917,749 | |
FNMA (1 Year Treasury Constant Maturity +2.02%)± | | | 3.94 | | | | 12-1-2034 | | | | 244,633 | | | | 257,779 | |
FNMA (1 Year Treasury Constant Maturity +2.26%)± | | | 4.01 | | | | 11-1-2035 | | | | 114,286 | | | | 119,160 | |
FNMA (1 Year Treasury Constant Maturity +2.19%)± | | | 4.03 | | | | 11-1-2031 | | | | 54,802 | | | | 57,708 | |
FNMA (1 Year Treasury Constant Maturity +2.28%)± | | | 4.15 | | | | 11-1-2032 | | | | 440,040 | | | | 462,783 | |
FNMA (1 Year Treasury Constant Maturity +2.13%)± | | | 4.17 | | | | 5-1-2032 | | | | 4,572 | | | | 4,734 | |
FNMA (1 Year Treasury Constant Maturity +2.25%)± | | | 4.31 | | | | 11-1-2033 | | | | 1,222,142 | | | | 1,296,229 | |
The accompanying notes are an integral part of these financial statements.
8 | Wells Fargo Ultra Short-Term Income Fund
Portfolio of investments—February 29, 2020 (unaudited)
| | | | | | | | | | | | | | | | |
| | | Interest
rate | | | Maturity
date | | | Principal | | | Value | |
| Agency Securities (continued) | |
FNMA (1 Year Treasury Constant Maturity +2.19%)± | | | 4.32 | % | | | 4-1-2038 | | | $ | 1,506,771 | | | $ | 1,595,378 | |
FNMA (1 Year Treasury Constant Maturity +2.21%)± | | | 4.34 | | | | 7-1-2038 | | | | 953,043 | | | | 1,008,809 | |
FNMA (1 Year Treasury Constant Maturity +2.36%)± | | | 4.35 | | | | 11-1-2034 | | | | 670,525 | | | | 713,899 | |
FNMA (12 Month Treasury Average +2.22%)± | | | 4.36 | | | | 8-1-2045 | | | | 320,857 | | | | 334,781 | |
FNMA (12 Month LIBOR +1.82%)± | | | 4.36 | | | | 9-1-2040 | | | | 1,637,412 | | | | 1,736,211 | |
FNMA (1 Year Treasury Constant Maturity +2.20%)± | | | 4.38 | | | | 2-1-2035 | | | | 689,910 | | | | 728,228 | |
FNMA (1 Year Treasury Constant Maturity +2.26%)± | | | 4.39 | | | | 8-1-2036 | | | | 1,497,136 | | | | 1,587,288 | |
FNMA (1 Year Treasury Constant Maturity +2.31%)± | | | 4.43 | | | | 5-1-2036 | | | | 409,188 | | | | 434,547 | |
FNMA (12 Month Treasury Average +2.31%)± | | | 4.46 | | | | 5-1-2036 | | | | 577,112 | | | | 607,602 | |
FNMA (1 Year Treasury Constant Maturity +2.23%)± | | | 4.48 | | | | 12-1-2040 | | | | 123,109 | | | | 129,765 | |
FNMA | | | 4.50 | | | | 1-1-2027 | | | | 1,336,573 | | | | 1,413,971 | |
FNMA (1 Year Treasury Constant Maturity +2.22%)± | | | 4.69 | | | | 6-1-2034 | | | | 786,473 | | | | 831,462 | |
FNMA (1 Year Treasury Constant Maturity +2.27%)± | | | 4.71 | | | | 2-1-2033 | | | | 342,636 | | | | 356,058 | |
FNMA (1 Year Treasury Constant Maturity +2.22%)± | | | 4.72 | | | | 6-1-2032 | | | | 70,161 | | | | 72,743 | |
FNMA | | | 5.00 | | | | 5-1-2022 | | | | 127,577 | | | | 134,929 | |
FNMA | | | 5.00 | | | | 6-1-2024 | | | | 1,306,666 | | | | 1,381,966 | |
FNMA (6 Month LIBOR +2.86%)± | | | 5.61 | | | | 4-1-2033 | | | | 745 | | | | 774 | |
FNMA | | | 6.00 | | | | 4-1-2021 | | | | 20,087 | | | | 20,316 | |
FNMA | | | 6.00 | | | | 1-1-2023 | | | | 675,836 | | | | 704,236 | |
FNMA | | | 6.50 | | | | 8-1-2031 | | | | 253,492 | | | | 300,333 | |
FNMA | | | 9.00 | | | | 10-15-2021 | | | | 1,346 | | | | 1,360 | |
FNMA | | | 9.00 | | | | 6-1-2024 | | | | 4,211 | | | | 4,246 | |
FNMA | | | 9.50 | | | | 12-1-2020 | | | | 888 | | | | 892 | |
FNMA | | | 10.50 | | | | 4-1-2022 | | | | 25 | | | | 25 | |
FNMA Series1990-111 Class Z | | | 8.75 | | | | 9-25-2020 | | | | 309 | | | | 311 | |
FNMA Series1990-119 Class J | | | 9.00 | | | | 10-25-2020 | | | | 3,456 | | | | 3,512 | |
FNMA Series1990-124 Class Z | | | 9.00 | | | | 10-25-2020 | | | | 653 | | | | 660 | |
FNMA Series1990-77 Class D | | | 9.00 | | | | 6-25-2020 | | | | 485 | | | | 485 | |
FNMA Series1991-132 Class Z | | | 8.00 | | | | 10-25-2021 | | | | 11,506 | | | | 11,971 | |
FNMA Series1992-71 Class X | | | 8.25 | | | | 5-25-2022 | | | | 10,117 | | | | 10,720 | |
FNMA Series2000-T6 Class A2 | | | 9.50 | | | | 11-25-2040 | | | | 282,883 | | | | 325,673 | |
FNMA Series2001-T10 Class A3 | | | 9.50 | | | | 12-25-2041 | | | | 433,368 | | | | 520,290 | |
FNMA Series2001-T12 Class A3 | | | 9.50 | | | | 8-25-2041 | | | | 412,567 | | | | 504,765 | |
FNMA Series2002-T1 Class A4 | | | 9.50 | | | | 11-25-2031 | | | | 499,060 | | | | 609,478 | |
FNMA Series2002-W04 Class A6±± | | | 4.55 | | | | 5-25-2042 | | | | 521,075 | | | | 545,355 | |
FNMA Series2003-W11 Class A1±± | | | 4.79 | | | | 6-25-2033 | | | | 13,949 | | | | 14,589 | |
FNMA Series2003-W3 Class 1A4±± | | | 4.08 | | | | 8-25-2042 | | | | 27,940 | | | | 30,008 | |
FNMA Series2007-W2 Class 1A1 (1 Month LIBOR +0.32%)± | | | 1.98 | | | | 3-25-2037 | | | | 272,584 | | | | 271,085 | |
FNMA Series2008-76 Class GF (1 Month LIBOR +0.65%)± | | | 2.31 | | | | 9-25-2023 | | | | 399 | | | | 399 | |
FNMA Series2009-31 Class B | | | 4.00 | | | | 5-25-2024 | | | | 12,002 | | | | 12,001 | |
FNMA Series2010-115 Class NC | | | 2.75 | | | | 1-25-2039 | | | | 562,197 | | | | 566,583 | |
FNMA Series2010-25 Class ND | | | 3.50 | | | | 3-25-2025 | | | | 2,144 | | | | 2,146 | |
FNMA Series2010-37 Class A1 | | | 5.41 | | | | 5-25-2035 | | | | 3,644,956 | | | | 3,832,474 | |
FNMA Series2010-57 Class DQ | | | 3.00 | | | | 6-25-2025 | | | | 144,410 | | | | 147,227 | |
FNMA Series2012-72 Class QE | | | 3.00 | | | | 1-25-2038 | | | | 212,934 | | | | 215,750 | |
FNMA Series2013-26 Class AK | | | 2.50 | | | | 11-25-2038 | | | | 2,741,937 | | | | 2,777,919 | |
FNMA Series2014-19 Class HA | | | 2.00 | | | | 6-25-2040 | | | | 656,594 | | | | 674,226 | |
GNMA | | | 7.00 | | | | 6-15-2033 | | | | 367,073 | | | | 445,513 | |
GNMA Series2016-H19 Class FE (1 Month LIBOR +0.37%)± | | | 2.10 | | | | 6-20-2061 | | | | 8,339 | | | | 8,339 | |
GNMA Series2017-H13 Class FJ (1 Month LIBOR +0.00%)± | | | 1.93 | | | | 5-20-2067 | | | | 64,562 | | | | 64,518 | |
GNMA Series2017-H16 Class FD (1 Month LIBOR +0.20%)± | | | 1.93 | | | | 8-20-2067 | | | | 207,765 | | | | 207,720 | |
| | | | | | | | | | | | | | | | |
| |
Total Agency Securities (Cost $53,348,082) | | | | 55,093,070 | |
| | | | | | | | | | | | | | | | |
| Asset-Backed Securities: 20.13% | |
Ally Master Owner Trust Series2018-4 Class A | | | 3.30 | | | | 7-17-2023 | | | | 11,174,000 | | | | 11,476,773 | |
American Credit Acceptance Receivables Trust Series2018-1 Class C 144A | | | 3.55 | | | | 4-10-2024 | | | | 1,725,750 | | | | 1,733,768 | |
The accompanying notes are an integral part of these financial statements.
Wells Fargo Ultra Short-Term Income Fund | 9
Portfolio of investments—February 29, 2020 (unaudited)
| | | | | | | | | | | | | | | | |
| | | Interest
rate | | | Maturity
date | | | Principal | | | Value | |
| Asset-Backed Securities (continued) | |
American Credit Acceptance Receivables Trust Series2019-2 Class A 144A | | | 2.85 | % | | | 7-12-2022 | | | $ | 4,010,022 | | | $ | 4,018,889 | |
American Express Credit Account Master Trust Series2018-8 Class A | | | 3.18 | | | | 4-15-2024 | | | | 5,968,000 | | | | 6,150,686 | |
AmeriCredit Automobile Receivables Trust Series2017-2 Class A3 | | | 1.98 | | | | 12-20-2021 | | | | 587,561 | | | | 587,715 | |
Bank of the West Auto Trust Series2018-1 Class A2 144A | | | 3.09 | | | | 4-15-2021 | | | | 470,908 | | | | 471,108 | |
California Republic Auto Receivables Trust Series2017-1 Class A4 | | | 2.28 | | | | 6-15-2022 | | | | 2,139,197 | | | | 2,144,130 | |
CCG Receivables Trust Series2017-1 Class A2 144A | | | 1.84 | | | | 11-14-2023 | | | | 633,768 | | | | 633,866 | |
Chesapeake Funding II LLC Series2017-3A Class A1 144A | | | 1.91 | | | | 8-15-2029 | | | | 2,979,523 | | | | 2,984,521 | |
Chesapeake Funding II LLC Series2018-3A Class A1 144A | | | 3.39 | | | | 1-15-2031 | | | | 5,100,663 | | | | 5,230,748 | |
CPS Auto Trust Series2018-C Class A 144A | | | 2.87 | | | | 9-15-2021 | | | | 31,143 | | | | 31,157 | |
Daimler Trucks Retail Trust Series2018-1 Class A4 144A | | | 3.03 | | | | 11-15-2024 | | | | 10,000,000 | | | | 10,119,165 | |
Dell Equipment Finance Trust Series2018-1 Class A2A 144A | | | 2.97 | | | | 10-22-2020 | | | | 1,796,230 | | | | 1,798,103 | |
Drive Auto Receivables Trust Series2017-3 Class D 144A | | | 3.53 | | | | 12-15-2023 | | | | 3,750,000 | | | | 3,791,615 | |
Drive Auto Receivables Trust Series2017-BA Class D 144A | | | 3.72 | | | | 10-17-2022 | | | | 1,929,036 | | | | 1,936,755 | |
DT Auto Owner Trust Series2016-2A Class D 144A | | | 5.43 | | | | 11-15-2022 | | | | 8,817,445 | | | | 8,832,251 | |
DT Auto Owner Trust Series2017-3A Class D 144A | | | 3.58 | | | | 5-15-2023 | | | | 3,000,000 | | | | 3,025,996 | |
DT Auto Owner Trust Series2018-3A Class A 144A | | | 3.02 | | | | 2-15-2022 | | | | 815,314 | | | | 817,063 | |
Education Loan Asset-Backed Trust Series2013-1 Class A1 (1 Month LIBOR +0.80%) 144A± | | | 2.43 | | | | 6-25-2026 | | | | 1,161,101 | | | | 1,162,932 | |
Educational Services of America Incorporated Series2015-2 Class A (1 Month LIBOR +1.00%) 144A± | | | 2.63 | | | | 12-25-2056 | | | | 939,169 | | | | 941,568 | |
Enterprise Fleet Financing Trust Series2017-1 Class A2 144A | | | 2.13 | | | | 7-20-2022 | | | | 458,495 | | | | 458,744 | |
Enterprise Fleet Financing Trust Series2017-2 Class A2 144A | | | 1.97 | | | | 1-20-2023 | | | | 578,877 | | | | 579,199 | |
Exeter Automobile Receivables Trust Series2019-2A Class A 144A | | | 2.93 | | | | 7-15-2022 | | | | 1,202,170 | | | | 1,205,693 | |
Fifth Third Auto Trust Series2019-1 Class A2A | | | 2.66 | | | | 5-16-2022 | | | | 3,150,266 | | | | 3,165,767 | |
Flagship Credit Auto Trust Series2018-4 Class A 144A | | | 3.41 | | | | 5-15-2023 | | | | 1,626,442 | | | | 1,647,124 | |
Flagship Credit Auto Trust Series2019-4 Class A 144A | | | 2.17 | | | | 6-17-2024 | | | | 4,642,157 | | | | 4,675,778 | |
Ford Credit Auto Lease Trust Series2018-B Class A4 | | | 3.30 | | | | 2-15-2022 | | | | 3,835,000 | | | | 3,898,488 | |
Ford Credit Auto Owner Trust Series2017-A Class A4 | | | 1.92 | | | | 4-15-2022 | | | | 8,814,000 | | | | 8,835,750 | |
Ford Credit Floorplan Master Owner Trust LLC Series2017-1 Class A1 | | | 2.07 | | | | 5-15-2022 | | | | 7,335,000 | | | | 7,341,602 | |
GM Financial Consumer Automobile Receivables Trust Series2017-2A Class A3 144A | | | 1.86 | | | | 12-16-2021 | | | | 3,366,613 | | | | 3,370,019 | |
Hertz Vehicle Financing LLC Series2015-1A Class A 144A | | | 2.73 | | | | 3-25-2021 | | | | 5,000,000 | | | | 5,003,302 | |
Honda Auto Receivables Owner Series2019-1 Class A2 | | | 2.75 | | | | 9-20-2021 | | | | 2,276,736 | | | | 2,288,022 | |
Honda Auto Receivables Owner Trust Series2018-3 Class A2 | | | 2.67 | | | | 12-21-2020 | | | | 344,055 | | | | 344,244 | |
Honda Auto Receivables Owner Trust Series2018-4 Class A3 | | | 3.16 | | | | 1-17-2023 | | | | 8,715,000 | | | | 8,896,174 | |
Hyundai Auto Lease Securitization Trust Series2017-C Class A3 144A | | | 2.12 | | | | 2-16-2021 | | | | 192,741 | | | | 192,780 | |
Hyundai Auto Lease Securitization Trust Series2019-A Class A3 144A | | | 2.98 | | | | 7-15-2022 | | | | 5,200,000 | | | | 5,286,463 | |
Hyundai Auto Lease Securitization Trust Series2020-A Class A2 144A | | | 1.90 | | | | 5-16-2022 | | | | 1,570,000 | | | | 1,578,917 | |
Mercedes-Benz Auto Lease Trust Series2019-A Class A2 | | | 3.01 | | | | 2-16-2021 | | | | 2,096,427 | | | | 2,100,461 | |
MMAF Equipment Finance LLC Series2019-A Class A2 144A | | | 2.84 | | | | 1-10-2022 | | | | 2,543,893 | | | | 2,560,214 | |
Nissan Auto Lease Trust Series2019-A Class A3 | | | 2.76 | | | | 3-15-2022 | | | | 11,738,000 | | | | 11,905,568 | |
Nissan Auto Lease Trust Series2019-B Class A3 | | | 2.27 | | | | 7-15-2022 | | | | 5,375,000 | | | | 5,433,292 | |
Oscar US Funding Trust Series2016-2A Class A4 144A | | | 2.99 | | | | 12-15-2023 | | | | 3,603,349 | | | | 3,623,664 | |
Prestige Auto Receivables Trust Series2017-1A Class B 144A | | | 2.39 | | | | 5-16-2022 | | | | 987,383 | | | | 988,644 | |
Santander Drive Auto Receivables Trust Series2015-5 Class D | | | 3.65 | | | | 12-15-2021 | | | | 1,032,687 | | | | 1,033,598 | |
Santander Drive Auto Receivables Trust Series2017-1 Class D | | | 3.17 | | | | 4-17-2023 | | | | 6,092,000 | | | | 6,169,856 | |
Santander Retail Auto Lease Trust Series2019-A Class A2 144A | | | 2.72 | | | | 1-20-2022 | | | | 4,027,338 | | | | 4,058,656 | |
SLC Student Loan Trust Series2006-2 Class A5 (3 Month LIBOR +0.10%)± | | | 1.99 | | | | 9-15-2026 | | | | 813,798 | | | | 813,016 | |
SLM Student Loan Trust Series2006-10 Class A5A (3 Month LIBOR
+0.10%)± | | | 1.89 | | | | 4-25-2027 | | | | 404,594 | | | | 404,018 | |
SLM Student Loan Trust Series2011-2 Class A1 (1 Month LIBOR +0.00%)± | | | 2.23 | | | | 11-25-2027 | | | | 1,034,615 | | | | 1,036,470 | |
SLM Student Loan Trust Series2012-3 Class A (1 Month LIBOR +0.65%)± | | | 2.28 | | | | 12-27-2038 | | | | 4,412,190 | | | | 4,388,167 | |
SLM Student Loan Trust Series2013-1 Class A3 (1 Month LIBOR +0.55%)± | | | 2.18 | | | | 5-26-2055 | | | | 4,770,615 | | | | 4,743,879 | |
SLM Student Loan Trust Series2014-A Class B 144A | | | 3.50 | | | | 11-15-2044 | | | | 6,200,000 | | | | 6,322,867 | |
South Texas Higher Education2012-1 Class A2 (3 Month LIBOR +0.85%)± | | | 2.76 | | | | 10-1-2024 | | | | 2,054,169 | | | | 2,055,463 | |
The accompanying notes are an integral part of these financial statements.
10 | Wells Fargo Ultra Short-Term Income Fund
Portfolio of investments—February 29, 2020 (unaudited)
| | | | | | | | | | | | | | | | |
| | | Interest
rate | | | Maturity
date | | | Principal | | | Value | |
| Asset-Backed Securities (continued) | |
Structured Asset Securities Corporation Series1998-2 Class A (1 Month LIBOR +0.52%)± | | | 2.15 | % | | | 2-25-2028 | | | $ | 22,518 | | | $ | 22,475 | |
Student Loan Consolidation Center Series2011-1 Class A (1 Month LIBOR +1.22%) 144A± | | | 2.85 | | | | 10-25-2027 | | | | 3,544,220 | | | | 3,554,882 | |
Tesla Auto Lease Trust Series2018-B Class A 144A | | | 3.71 | | | | 8-20-2021 | | | | 1,722,475 | | | | 1,750,356 | |
Towd Point Asset Trust Series2018-SL1 Class A (1 Month LIBOR
+0.00%) 144A± | | | 2.23 | | | | 1-25-2046 | | | | 3,612,819 | | | | 3,597,118 | |
Transportation Finance Equipment Trust Series2019-1 Class A1 144A | | | 2.00 | | | | 10-23-2020 | | | | 2,195,645 | | | | 2,197,047 | |
Verizon Owner Trust Series2017-1A Class A 144A | | | 2.06 | | | | 9-20-2021 | | | | 610,151 | | | | 610,506 | |
Volvo Financial Equipment LLC Series2017-1A Class A3 144A | | | 1.92 | | | | 3-15-2021 | | | | 1,628,449 | | | | 1,628,990 | |
Westlake Automobile Receivables Trust Series2019-2A A2A 144A | | | 2.57 | | | | 2-15-2023 | | | | 9,805,373 | | | | 9,865,913 | |
Wheels SPV LLC Series2018-1A Class A2 144A | | | 3.06 | | | | 4-20-2027 | | | | 1,739,211 | | | | 1,751,769 | |
World Omni Auto Receivables Trust Series2016-B Class A3 | | | 1.30 | | | | 2-15-2022 | | | | 809,459 | | | | 808,873 | |
World Omni Automobiles Lease Securitization Trust Series2018-B Class A3 | | | 3.19 | | | | 12-15-2021 | | | | 10,730,000 | | | | 10,897,958 | |
| | | | | | | | | | | | | | | | |
| |
Total Asset-Backed Securities (Cost $220,065,301) | | | | 220,980,595 | |
| | | | | | | | | | | | | | | | |
| Corporate Bonds and Notes: 26.02% | | | | | | | | | | | | | | | | |
| | | | |
Communication Services: 2.27% | | | | | | | | | | | | | | | | |
| | | | |
| Diversified Telecommunication Services: 0.97% | | | | | | | | | | | | |
Broadcom Corporation | | | 2.20 | | | | 1-15-2021 | | | | 7,000,000 | | | | 7,024,987 | |
Broadcom Corporation | | | 3.00 | | | | 1-15-2022 | | | | 3,585,000 | | | | 3,655,539 | |
| | | | |
| | | | | | | | | | | | | | | 10,680,526 | |
| | | | | | | | | | | | | | | | |
| | | | |
| Media: 1.12% | | | | | | | | | | | | |
Fox Corporation 144A | | | 3.67 | | | | 1-25-2022 | | | | 3,880,000 | | | | 4,040,169 | |
Interpublic Group Companies | | | 3.50 | | | | 10-1-2020 | | | | 2,000,000 | | | | 2,018,467 | |
NBCUniversal Enterprise Incorporated 144A | | | 5.25 | | | | 12-31-2049 | | | | 6,000,000 | | | | 6,171,000 | |
| | | | |
| | | | | | | | | | | | | | | 12,229,636 | |
| | | | | | | | | | | | | | | | |
| | | | |
| Wireless Telecommunication Services: 0.18% | | | | | | | | | | | | |
Sprint Spectrum Company LLC 144A | | | 3.36 | | | | 3-20-2023 | | | | 1,968,750 | | | | 1,984,697 | |
| | | | | | | | | | | | | | | | |
| | | | |
Consumer Discretionary: 0.26% | | | | | | | | | | | | | | | | |
| | | | |
| Multiline Retail: 0.26% | | | | | | | | | | | | |
Macy’s Retail Holdings Incorporated | | | 3.45 | | | | 1-15-2021 | | | | 2,800,000 | | | | 2,828,468 | |
| | | | | | | | | | | | | | | | |
| | | | |
Consumer Staples: 1.57% | | | | | | | | | | | | | | | | |
| | | | |
| Food Products: 0.63% | | | | | | | | | | | | |
Conagra Brands Incorporated | | | 3.80 | | | | 10-22-2021 | | | | 3,560,000 | | | | 3,700,580 | |
Land O’Lakes Incorporated 144A | | | 6.00 | | | | 11-15-2022 | | | | 3,000,000 | | | | 3,218,814 | |
| | | | |
| | | | | | | | | | | | | | | 6,919,394 | |
| | | | | | | | | | | | | | | | |
| | | | |
| Tobacco: 0.94% | | | | | | | | | | | | |
Altria Group Incorporated | | | 4.75 | | | | 5-5-2021 | | | | 5,000,000 | | | | 5,183,485 | |
BAT Capital Corporation | | | 2.76 | | | | 8-15-2022 | | | | 5,000,000 | | | | 5,120,089 | |
| | | | |
| | | | | | | | | | | | | | | 10,303,574 | |
| | | | | | | | | | | | | | | | |
| | | | |
Energy: 1.78% | | | | | | | | | | | | | | | | |
| | | | |
| Oil, Gas & Consumable Fuels: 1.78% | | | | | | | | | | | | |
Energy Transfer Partners LP | | | 5.20 | | | | 2-1-2022 | | | | 5,435,000 | | | | 5,722,167 | |
EQT Corporation « | | | 3.00 | | | | 10-1-2022 | | | | 2,750,000 | | | | 2,303,125 | |
Occidental Petroleum Corporation | | | 2.60 | | | | 8-13-2021 | | | | 2,320,000 | | | | 2,349,564 | |
The accompanying notes are an integral part of these financial statements.
Wells Fargo Ultra Short-Term Income Fund | 11
Portfolio of investments—February 29, 2020 (unaudited)
| | | | | | | | | | | | | | | | |
| | | Interest
rate | | | Maturity
date | | | Principal | | | Value | |
| | | | |
| Oil, Gas & Consumable Fuels (continued) | | | | | | | | | | | | |
Occidental Petroleum Corporation | | | 2.70 | % | | | 8-15-2022 | | | $ | 3,090,000 | | | $ | 3,148,746 | |
Rockies Express Pipeline LLC 144A | | | 5.63 | | | | 4-15-2020 | | | | 5,950,000 | | | | 5,968,268 | |
| | | | |
| | | | | | | | | | | | | | | 19,491,870 | |
| | | | | | | | | | | | | | | | |
|
| Financials: 11.66% | |
|
| Banks: 4.59% | |
Bank of America Corporation (3 Month LIBOR +0.63%)± | | | 2.33 | | | | 10-1-2021 | | | | 10,000,000 | | | | 10,039,039 | |
Citibank NA (3 Month LIBOR +0.60%)± | | | 2.84 | | | | 5-20-2022 | | | | 6,000,000 | | | | 6,084,925 | |
JPMorgan Chase & Company (3 Month LIBOR +0.70%)± | | | 3.21 | | | | 4-1-2023 | | | | 2,635,000 | | | | 2,719,357 | |
JPMorgan Chase & Company (3 Month LIBOR +0.61%)± | | | 3.51 | | | | 6-18-2022 | | | | 7,000,000 | | | | 7,171,328 | |
PNC Bank | | | 2.45 | | | | 11-5-2020 | | | | 7,000,000 | | | | 7,044,824 | |
Synchrony Bank | | | 3.65 | | | | 5-24-2021 | | | | 2,650,000 | | | | 2,715,271 | |
Truist Financial Corporation | | | 2.90 | | | | 3-3-2021 | | | | 7,000,000 | | | | 7,075,538 | |
US Bank NA | | | 2.05 | | | | 10-23-2020 | | | | 7,460,000 | | | | 7,483,255 | |
| | | | |
| | | | | | | | | | | | | | | 50,333,537 | |
| | | | | | | | | | | | | | | | |
|
| Capital Markets: 1.83% | |
Goldman Sachs Group Incorporated | | | 5.38 | | | | 3-15-2020 | | | | 5,000,000 | | | | 5,006,182 | |
Goldman Sachs Group Incorporated | | | 5.75 | | | | 1-24-2022 | | | | 5,000,000 | | | | 5,380,931 | |
Morgan Stanley | | | 2.75 | | | | 5-19-2022 | | | | 9,435,000 | | | | 9,693,740 | |
| | | | |
| | | | | | | | | | | | | | | 20,080,853 | |
| | | | | | | | | | | | | | | | |
|
| Consumer Finance: 3.99% | |
BMW US Capital LLC 144A | | | 2.15 | | | | 4-6-2020 | | | | 1,000,000 | | | | 1,000,504 | |
Capital One Financial Corporation | | | 2.50 | | | | 5-12-2020 | | | | 7,000,000 | | | | 7,005,180 | |
Daimler Finance North America LLC 144A | | | 2.20 | | | | 5-5-2020 | | | | 1,480,000 | | | | 1,480,931 | |
Daimler Finance North America LLC 144A | | | 3.40 | | | | 2-22-2022 | | | | 4,000,000 | | | | 4,119,185 | |
Ford Motor Credit Company LLC (3 Month LIBOR +0.88%)± | | | 2.73 | | | | 10-12-2021 | | | | 2,840,000 | | | | 2,808,504 | |
Ford Motor Credit Company LLC | | | 3.20 | | | | 1-15-2021 | | | | 3,665,000 | | | | 3,689,271 | |
General Motors Financial Company Incorporated | | | 4.20 | | | | 11-6-2021 | | | | 5,000,000 | | | | 5,166,857 | |
Hyundai Capital America Company 144A | | | 2.38 | | | | 2-10-2023 | | | | 3,440,000 | | | | 3,469,492 | |
Hyundai Capital America Company 144A | | | 2.75 | | | | 9-18-2020 | | | | 4,000,000 | | | | 4,023,916 | |
John Deere Capital Corporation | | | 1.95 | | | | 6-22-2020 | | | | 3,000,000 | | | | 3,004,513 | |
Nissan Motor Acceptance Corporation 144A | | | 3.65 | | | | 9-21-2021 | | | | 4,000,000 | | | | 4,116,855 | |
Volkswagen Group of America Finance LLC 144A | | | 2.70 | | | | 9-26-2022 | | | | 3,875,000 | | | | 3,962,856 | |
| | | | |
| | | | | | | | | | | | | | | 43,848,064 | |
| | | | | | | | | | | | | | | | |
|
| Diversified Financial Services: 0.69% | |
IBM Credit LLC | | | 3.45 | | | | 11-30-2020 | | | | 6,500,000 | | | | 6,601,298 | |
WEA Finance LLC 144A | | | 3.25 | | | | 10-5-2020 | | | | 1,000,000 | | | | 1,007,368 | |
| | | | |
| | | | | | | | | | | | | | | 7,608,666 | |
| | | | | | | | | | | | | | | | |
|
| Insurance: 0.56% | |
Axis Specialty Finance LLC | | | 5.88 | | | | 6-1-2020 | | | | 1,685,000 | | | | 1,703,215 | |
Protective Life Global Funding 144A | | | 2.26 | | | | 4-8-2020 | | | | 4,415,000 | | | | 4,418,379 | |
| | | | |
| | | | | | | | | | | | | | | 6,121,594 | |
| | | | | | | | | | | | | | | | |
|
| Health Care: 3.17% | |
|
| Biotechnology: 1.12% | |
AbbVie Incorporated 144A | | | 2.30 | | | | 11-21-2022 | | | | 7,095,000 | | | | 7,213,433 | |
AbbVie Incorporated | | | 3.38 | | | | 11-14-2021 | | | | 4,935,000 | | | | 5,084,204 | |
| | | | |
| | | | | | | | | | | | | | | 12,297,637 | |
| | | | | | | | | | | | | | | | |
The accompanying notes are an integral part of these financial statements.
12 | Wells Fargo Ultra Short-Term Income Fund
Portfolio of investments—February 29, 2020 (unaudited)
| | | | | | | | | | | | | | | | |
| | | Interest
rate | | | Maturity
date | | | Principal | | | Value | |
|
| Health Care Providers & Services: 1.51% | |
Anthem Incorporated | | | 2.50 | % | | | 11-21-2020 | | | $ | 5,040,000 | | | $ | 5,065,535 | |
Cigna Corporation 144A | | | 4.00 | | | | 2-15-2022 | | | | 5,375,000 | | | | 5,575,865 | |
CVS Health Corporation | | | 2.80 | | | | 7-20-2020 | | | | 5,910,000 | | | | 5,927,156 | |
| | | | |
| | | | | | | | | | | | | | | 16,568,556 | |
| | | | | | | | | | | | | | | | |
|
| Pharmaceuticals: 0.54% | |
EMD Finance LLC 144A | | | 2.40 | | | | 3-19-2020 | | | | 5,965,000 | | | | 5,966,491 | |
| | | | | | | | | | | | | | | | |
|
Industrials: 1.63% | |
|
| Aerospace & Defense: 0.15% | |
The Boeing Company | | | 2.70 | | | | 5-1-2022 | | | | 1,615,000 | | | | 1,652,043 | |
| | | | | | | | | | | | | | | | |
|
| Air Freight & Logistics: 0.47% | |
FedEx Corporation | | | 3.40 | | | | 1-14-2022 | | | | 5,000,000 | | | | 5,176,798 | |
| | | | | | | | | | | | | | | | |
|
| Airlines: 0.56% | |
Delta Air Lines Incorporated | | | 3.40 | | | | 4-19-2021 | | | | 3,000,000 | | | | 3,055,108 | |
Delta Air Lines Incorporated | | | 3.63 | | | | 3-15-2022 | | | | 3,000,000 | | | | 3,089,823 | |
| | | | |
| | | | | | | | | | | | | | | 6,144,931 | |
| | | | | | | | | | | | | | | | |
|
| Industrial Conglomerates: 0.14% | |
General Electric Company | | | 4.63 | | | | 1-7-2021 | | | | 1,485,000 | | | | 1,523,901 | |
| | | | | | | | | | | | | | | | |
|
| Machinery: 0.31% | |
CNH Industrial Capital LLC | | | 4.38 | | | | 11-6-2020 | | | | 3,375,000 | | | | 3,436,781 | |
| | | | | | | | | | | | | | | | |
|
| Information Technology: 1.12% | |
|
| Semiconductors & Semiconductor Equipment: 0.47% | |
Qualcomm Incorporated | | | 3.00 | | | | 5-20-2022 | | | | 5,000,000 | | | | 5,180,496 | |
| | | | | | | | | | | | | | | | |
|
| Technology Hardware, Storage & Peripherals: 0.65% | |
Hewlett Packard Enterprise Company | | | 3.60 | | | | 10-15-2020 | | | | 7,000,000 | | | | 7,064,276 | |
| | | | | | | | | | | | | | | | |
|
Materials: 0.71% | |
|
| Chemicals: 0.46% | |
DuPont de Nemours Incorporated | | | 3.77 | | | | 11-15-2020 | | | | 5,000,000 | | | | 5,059,342 | |
| | | | | | | | | | | | | | | | |
|
| Metals & Mining: 0.25% | |
Freeport-McMoRan Incorporated | | | 3.55 | | | | 3-1-2022 | | | | 2,750,000 | | | | 2,774,475 | |
| | | | | | | | | | | | | | | | |
|
Real Estate: 0.71% | |
|
| Equity REITs: 0.43% | |
Crown Castle International Corporation | | | 2.25 | | | | 9-1-2021 | | | | 4,700,000 | | | | 4,739,327 | |
| | | | | | | | | | | | | | | | |
|
| Real Estate Management & Development: 0.28% | |
Washington Prime Group Incorporated « | | | 3.85 | | | | 4-1-2020 | | | | 3,050,000 | | | | 3,050,000 | |
| | | | | | | | | | | | | | | | |
|
Utilities: 1.14% | |
|
| Electric Utilities: 0.43% | |
DPL Incorporated | | | 7.25 | | | | 10-15-2021 | | | | 1,580,000 | | | | 1,635,300 | |
Pinnacle West Capital Corporation | | | 2.25 | | | | 11-30-2020 | | | | 3,000,000 | | | | 3,009,200 | |
| | | | |
| | | | | | | | | | | | | | | 4,644,500 | |
| | | | | | | | | | | | | | | | |
The accompanying notes are an integral part of these financial statements.
Wells Fargo Ultra Short-Term Income Fund | 13
Portfolio of investments—February 29, 2020 (unaudited)
| | | | | | | | | | | | | | | | |
| | | Interest
rate | | | Maturity
date | | | Principal | | | Value | |
|
| Multi-Utilities: 0.71% | |
Dominion Energy Incorporated | | | 2.72 | % | | | 8-15-2021 | | | $ | 2,700,000 | | | $ | 2,743,124 | |
DTE Energy Company | | | 2.25 | | | | 11-1-2022 | | | | 5,000,000 | | | | 5,083,510 | |
| | | | |
| | | | | | | | | | | | | | | 7,826,634 | |
| | | | | | | | | | | | | | | | |
| |
Total Corporate Bonds and Notes (Cost $282,402,486) | | | | 285,537,067 | |
| | | | | | | | | | | | | | | | |
| | | | |
| | | | | | | | | | | | | | | | |
| | | | | | | | | Shares | | | | |
| Exchange-Traded Funds: 5.67% | | | | | | | | | | | | |
iShares Short-Term Corporate Bond ETF « | | | | 572,000 | | | | 31,111,080 | |
SPDR Portfolio Short Term Corporate Bond ETF | | | | 1,000,000 | | | | 31,080,000 | |
| | | | | | | | | | | | | | | | |
| | | | |
Total Exchange-Traded Funds (Cost $60,738,737) | | | | | | | | | | | | | | | 62,191,080 | |
| | | | | | | | | | | | | | | | |
| | | | |
| | | | | | | | | | | | | | | | |
| | | | | | | | | Principal | | | | |
| Municipal Obligations: 0.66% | | | | | | | | | | | | | | | | |
| | | | |
Indiana: 0.27% | | | | | | | | | | | | | | | | |
| | | | |
| Education Revenue: 0.27% | | | | | | | | | | | | |
Indiana Secondary Market for Education Loans Incorporated (1 Month LIBOR +0.80%)± | | | 2.43 | | | | 2-25-2044 | | | $ | 3,017,280 | | | | 3,012,422 | |
| | | | | | | | | | | | | | | | |
| | | | |
New Jersey: 0.16% | | | | | | | | | | | | | | | | |
| | | | |
| Transportation Revenue: 0.16% | | | | | | | | | | | | |
New Jersey Transportation Trust Authority Taxable Transportation System Series B | | | 2.38 | | | | 6-15-2022 | | | | 1,700,000 | | | | 1,731,943 | |
| | | | | | | | | | | | | | | | |
|
| Wisconsin: 0.23% | |
|
| Housing Revenue: 0.23% | |
Wisconsin PFA Affinity Living Group Project (Citizens Bank LOC) | | | 3.75 | | | | 2-1-2022 | | | | 2,500,000 | | | | 2,502,700 | |
| | | | | | | | | | | | | | | | |
| | | | |
Total Municipal Obligations (Cost $7,187,771) | | | | | | | | | | | | | | | 7,247,065 | |
| | | | | | | | | | | | | | | | |
|
| Non-Agency Mortgage-Backed Securities: 25.12% | |
Angel Oak Mortgage Trust I LLC Series2019-3 Class A1 144A±± | | | 2.93 | | | | 5-25-2059 | | | | 1,919,035 | | | | 1,932,059 | |
Angel Oak Mortgage Trust I LLC Series2019-4 Class A1 144A±± | | | 2.99 | | | | 7-26-2049 | | | | 4,329,205 | | | | 4,372,398 | |
Banc of America Funding Corporation Series2016-R1 Class A1 144A±± | | | 2.50 | | | | 3-25-2040 | | | | 1,099,773 | | | | 1,107,640 | |
BDS Limited Series2018-FL2 Class A (1 Month LIBOR +0.95%) 144A± | | | 2.61 | | | | 8-15-2035 | | | | 2,127,914 | | | | 2,125,258 | |
Bluemountain CLO Limited Series2015-1A Class A1R (3 Month LIBOR
+1.33%) 144A± | | | 3.18 | | | | 4-13-2027 | | | | 597,464 | | | | 597,985 | |
Bunker Hill Loan Depositary Trust Series2019-2 Class A1 144A | | | 2.88 | | | | 7-25-2049 | | | | 4,438,683 | | | | 4,509,612 | |
Cascade Funding Mortgage Trust Series 2018- RM2 Class A 144A±± | | | 4.00 | | | | 10-25-2068 | | | | 1,111,927 | | | | 1,160,879 | |
CCG Receivables Trust Series2019-1 Class A2 144A | | | 2.80 | | | | 9-14-2026 | | | | 2,490,103 | | | | 2,521,892 | |
CD Commercial Mortgage Trust Series2017-CD3 Class A1 | | | 1.97 | | | | 2-10-2050 | | | | 2,349,607 | | | | 2,356,316 | |
CGDBB Commercial Mortgage Trust Series 2017-BIOC Class A (1 Month LIBOR +0.79%) 144A± | | | 2.45 | | | | 7-15-2032 | | | | 5,115,843 | | | | 5,115,838 | |
CIFC Funding Limited Series2012-2RA Class A1 (3 Month LIBOR
+0.80%) 144A± | | | 2.62 | | | | 1-20-2028 | | | | 7,550,000 | | | | 7,550,136 | |
CIFC Funding Limited Series2015-2A Class AR (3 Month LIBOR
+0.78%) 144A± | | | 2.61 | | | | 4-15-2027 | | | | 5,416,319 | | | | 5,417,315 | |
Citigroup Commercial Mortgage Trust Series 2015-GC27 Class A3 | | | 3.06 | | | | 2-10-2048 | | | | 5,805,000 | | | | 5,871,346 | |
Citigroup Commercial Mortgage Trust Series 2017-MDRB Class A (1 Month LIBOR +1.10%) 144A± | | | 2.76 | | | | 7-15-2030 | | | | 2,365,399 | | | | 2,348,207 | |
CNH Equipment Trust Series2016-B Class A4 | | | 1.97 | | | | 11-15-2021 | | | | 1,200,000 | | | | 1,200,532 | |
CNH Equipment Trust Series2019-A Class A2 | | | 2.96 | | | | 5-16-2022 | | | | 5,671,467 | | | | 5,707,934 | |
The accompanying notes are an integral part of these financial statements.
14 | Wells Fargo Ultra Short-Term Income Fund
Portfolio of investments—February 29, 2020 (unaudited)
| | | | | | | | | | | | | | | | |
| | | Interest
rate | | | Maturity
date | | | Principal | | | Value | |
|
| Non-Agency Mortgage-Backed Securities (continued) | |
Collateralized Mortgage Obligation Trust Series 66 Class Z | | | 8.00 | % | | | 9-20-2021 | | | $ | 1,511 | | | $ | 1,529 | |
Colt Funding LLC Series2018-3 Class A1 144A±± | | | 3.69 | | | | 10-26-2048 | | | | 1,769,768 | | | | 1,777,858 | |
Commercial Mortgage Trust Series2010-C1 Class A3 144A | | | 4.21 | | | | 7-10-2046 | | | | 1,524,394 | | | | 1,531,199 | |
Commercial Mortgage Trust Series 2014-CR15 Class A2 | | | 2.93 | | | | 2-10-2047 | | | | 2,372,757 | | | | 2,375,804 | |
Commercial Mortgage Trust Series 2014-CR16 Class ASB | | | 3.65 | | | | 4-10-2047 | | | | 3,425,514 | | | | 3,562,847 | |
Commercial Mortgage Trust Series 2014-LC17 Class A2 | | | 3.16 | | | | 10-10-2047 | | | | 729,142 | | | | 730,915 | |
Commercial Mortgage Trust Series 2014-UBS2 Class A3 | | | 3.47 | | | | 3-10-2047 | | | | 4,170,000 | | | | 4,240,548 | |
Commercial Mortgage Trust Series 2014-UBS5 Class A2 | | | 3.03 | | | | 9-10-2047 | | | | 673,473 | | | | 676,739 | |
Commercial Mortgage Trust Series 2015-LC23 Class A1 | | | 1.81 | | | | 10-10-2048 | | | | 966,632 | | | | 966,007 | |
Countrywide Home Loans Mortgage Pass-Through Trust Series 2001-HYB1 Class 1A1±± | | | 3.96 | | | | 6-19-2031 | | | | 129,686 | | | | 132,645 | |
Countrywide Home Loans Mortgage Pass-Through Trust Series 2001-HYB1 Class 2A1±± | | | 3.60 | | | | 6-19-2031 | | | | 80,897 | | | | 81,542 | |
Credit Suisse Mortgage Trust Series 2019-SKLZ Class A (1 Month LIBOR +1.25%) 144A± | | | 2.91 | | | | 1-15-2034 | | | | 3,600,000 | | | | 3,601,054 | |
Credit Suisse Mortgage Trust Series 2020-AFC1 Class A3 144A±± | | | 2.51 | | | | 2-25-2050 | | | | 6,793,785 | | | | 6,858,105 | |
Crown Point Limited Series2015-3A Class A1AR (3 Month LIBOR
+0.91%) 144A± | | | 2.74 | | | | 12-31-2027 | | | | 5,537,361 | | | | 5,538,884 | |
CSAIL Commercial Mortgage Trust Series2015-C4 Class A1 | | | 2.01 | | | | 11-15-2048 | | | | 54,155 | | | | 54,113 | |
Deephaven Residential Mortgage Series2019-4A Class A1 144A±± | | | 2.79 | | | | 10-25-2059 | | | | 3,279,628 | | | | 3,299,488 | |
Deephaven Residential Mortgage Series2020-1 Class A2 144A±± | | | 2.49 | | | | 1-25-2060 | | | | 3,085,000 | | | | 3,095,188 | |
DLL Securitization Trust Series2018-ST2 Class A3 144A | | | 3.46 | | | | 1-20-2022 | | | | 7,394,562 | | | | 7,477,799 | |
DLL Securitization Trust Series2019-MT3 Class A1 144A | | | 2.06 | | | | 10-20-2020 | | | | 3,560,036 | | | | 3,563,941 | |
EquiFirst Mortgage Loan Trust Series2003-2 Class 3A3 (1 Month LIBOR +1.13%)± | | | 2.78 | | | | 9-25-2033 | | | | 314,649 | | | | 310,901 | |
FirstKey Mortgage Trust Series2014-1 Class A2 144A±± | | | 3.00 | | | | 11-25-2044 | | | | 429,845 | | | | 429,067 | |
GCAT Series 2019-NQM1 Class A1 144A | | | 2.99 | | | | 2-25-2059 | | | | 5,152,877 | | | | 5,205,264 | |
GCAT Series 2019-NQM2 Class A1 144A | | | 2.86 | | | | 9-25-2059 | | | | 4,824,552 | | | | 4,875,552 | |
Goldman Sachs Mortgage Securities Trust Series2010-C2 Class A2 144A±± | | | 5.16 | | | | 12-10-2043 | | | | 3,190,000 | | | | 3,240,304 | |
Goldman Sachs Mortgage Securities Trust Series2011-GC3 Class A4 144A | | | 4.75 | | | | 3-10-2044 | | | | 5,799,807 | | | | 5,886,893 | |
Goldman Sachs Mortgage Securities Trust Series 2013-GC16 Class AAB | | | 3.81 | | | | 11-10-2046 | | | | 1,804,724 | | | | 1,884,424 | |
Goldman Sachs Mortgage Securities Trust Series 2014-GC22 Class A3 | | | 3.52 | | | | 6-10-2047 | | | | 3,031,556 | | | | 3,082,427 | |
Goldman Sachs Mortgage Securities Trust Series2015-GS1 Class A1 | | | 1.94 | | | | 11-10-2048 | | | | 199,346 | | | | 199,372 | |
Goldman Sachs Mortgage Securities Trust Series2016-GS3 Class A1 | | | 1.43 | | | | 10-10-2049 | | | | 625,234 | | | | 624,557 | |
GPMT Limited Series2018-FL1 Class A (1 Month LIBOR +0.90%) 144A± | | | 2.55 | | | | 11-21-2035 | | | | 1,784,297 | | | | 1,784,294 | |
Great Wolf Trust Series 2019-WOLF Class A (1 Month LIBOR +1.03%) 144A± | | | 2.69 | | | | 12-15-2036 | | | | 2,500,000 | | | | 2,500,004 | |
GSMPS Mortgage Loan Trust Series1998-1 Class A 144A±± | | | 8.00 | | | | 9-19-2027 | | | | 33,267 | | | | 33,516 | |
Halcyon Loan Advisors Funding Series2014-3A Class AR (3 Month LIBOR +1.10%) 144A± | | | 2.90 | | | | 10-22-2025 | | | | 2,420,130 | | | | 2,420,495 | |
Homeward Opportunities Fund I Trust Series2019-1 Class A1 144A±± | | | 3.45 | | | | 1-25-2059 | | | | 3,707,486 | | | | 3,748,774 | |
Hospitality Mortgage Trust Series 2019 Class A (1 Month LIBOR
+0.00%) 144A± | | | 2.66 | | | | 11-15-2036 | | | | 4,457,149 | | | | 4,451,793 | |
JPMorgan Chase Commercial Mortgage Securities Trust Series2011-C5 Class A3 | | | 4.17 | | | | 8-15-2046 | | | | 2,432,258 | | | | 2,507,926 | |
JPMorgan Chase Commercial Mortgage Securities Trust Series2015-C28 Class A2 | | | 2.77 | | | | 10-15-2048 | | | | 44,164 | | | | 44,152 | |
JPMorgan Chase Commercial Mortgage Securities Trust Series2017-JP5 Class A1 | | | 2.09 | | | | 3-15-2050 | | | | 722,737 | | | | 722,726 | |
JPMorgan Chase Commercial Mortgage Securities Trust Series2018-PHH Class A (1 Month LIBOR +0.91%) 144A± | | | 2.57 | | | | 6-15-2035 | | | | 7,447,423 | | | | 7,442,142 | |
JPMorgan Chase Commercial Mortgage Securities Trust Series2019-MFP Class A (1 Month LIBOR +0.96%) 144A± | | | 2.62 | | | | 7-15-2036 | | | | 5,000,000 | | | | 4,999,995 | |
LCM XII LP Series2013-A Class ARR (3 Month LIBOR +1.14%) 144A± | | | 2.96 | | | | 7-19-2027 | | | | 6,000,000 | | | | 6,000,438 | |
Lendmark Funding Trust Series2018-2A Class A 144A | | | 4.23 | | | | 4-20-2027 | | | | 3,000,000 | | | | 3,135,532 | |
Marlette Funding Trust Series2019-4A Class A 144A | | | 2.39 | | | | 12-17-2029 | | | | 4,192,742 | | | | 4,222,168 | |
Master Mortgages Trust Series2002-3 Class 4A1±± | | | 4.98 | | | | 10-25-2032 | | | | 2,070 | | | | 2,117 | |
The accompanying notes are an integral part of these financial statements.
Wells Fargo Ultra Short-Term Income Fund | 15
Portfolio of investments—February 29, 2020 (unaudited)
| | | | | | | | | | | | | | | | |
| | | Interest
rate | | | Maturity
date | | | Principal | | | Value | |
|
| Non-Agency Mortgage-Backed Securities (continued) | |
Mello Warehouse Securitization Series2018-W1 Class A (1 Month LIBOR +0.85%) 144A± | | | 2.48 | % | | | 11-25-2051 | | | $ | 3,666,667 | | | $ | 3,670,733 | |
Mello Warehouse Securitization Series2019-1 Class A (1 Month LIBOR +0.80%) 144A± | | | 2.43 | | | | 6-25-2052 | | | | 5,065,000 | | | | 5,068,382 | |
Morgan Stanley Capital I Trust Series2011-C2 Class A4 144A | | | 4.66 | | | | 6-15-2044 | | | | 3,125,000 | | | | 3,204,254 | |
Morgan Stanley Capital I Trust Series2016-C30 Class A1 | | | 1.39 | | | | 9-15-2049 | | | | 3,135,761 | | | | 3,129,969 | |
Neuberger Berman Limited Series2015-20A Class AR (3 Month LIBOR +0.80%) 144A± | | | 2.63 | | | | 1-15-2028 | | | | 4,085,000 | | | | 4,085,486 | |
New Residential Mortgage Loan Trust Series 2018-NQM1 Class A1 144A±± | | | 3.99 | | | | 11-25-2048 | | | | 2,914,485 | | | | 2,966,885 | |
Ondeck Asset Securitization Trust LLC Series2018-1A Class A 144A | | | 3.50 | | | | 4-18-2022 | | | | 5,919,000 | | | | 5,937,617 | |
OZML Funding Limited Series2013-3A Class AIRR (3 Month LIBOR
+1.18%) 144A± | | | 2.98 | | | | 1-22-2029 | | | | 5,000,000 | | | | 5,001,355 | |
Palmer Square Loan Funding Limited Series2018-4A Class A1 (3 Month LIBOR +0.00%) 144A± | | | 2.59 | | | | 11-15-2026 | | | | 2,811,226 | | | | 2,812,890 | |
ReadyCap Commercial Mortgage Trust Series2019-5 Class A 144A | | | 3.78 | | | | 2-25-2052 | | | | 3,255,733 | | | | 3,424,737 | |
Salomon Brothers Mortgage Securities VII Series1990-2 Class A±± | | | 2.55 | | | | 11-25-2020 | | | | 118,804 | | | | 118,833 | |
Shackleton CLO Limited Series2019-15A Class A (3 Month LIBOR
+1.25%) 144A± | | | 3.15 | | | | 1-15-2030 | | | | 2,840,000 | | | | 2,843,292 | |
Starwood Mortgage Residential Trust Series2019-1 Class A1 144A±± | | | 2.94 | | | | 6-25-2049 | | | | 4,179,857 | | | | 4,228,598 | |
Starwood Mortgage Residential Trust Series 2019-INV1 Class A1 144A±± | | | 2.61 | | | | 9-27-2049 | | | | 3,888,379 | | | | 3,898,430 | |
Starwood Mortgage Residential Trust Series2020-1 Class A3 144A±± | | | 2.56 | | | | 2-25-2050 | | | | 3,781,437 | | | | 3,809,322 | |
Structured Asset Mortgage Investments Incorporated Series2001-4
Class A2±± | | | 8.15 | | | | 10-25-2024 | | | | 1,327 | | | | 1,323 | |
TCW CLO2017-1 Limited Series2017-1A Class BR (3 Month LIBOR
+1.55%) 144A±%% | | | 3.30 | | | | 7-29-2029 | | | | 5,540,000 | | | | 5,531,684 | |
TCW CLO2019-1 AMR Limited Series2019-1A Class A (3 Month LIBOR +1.44%) 144A± | | | 3.13 | | | | 2-15-2029 | | | | 4,075,000 | | | | 4,078,052 | |
THL Credit Wind River CLO Limited Series2012-1A Class AR2 (3 Month LIBOR +0.88%) 144A± | | | 2.71 | | | | 1-15-2026 | | | | 2,763,055 | | | | 2,763,994 | |
Towd Point Asset Funding LLC Series2019-HE1 Class A1 (1 Month LIBOR +0.90%) 144A± | | | 2.53 | | | | 4-25-2048 | | | | 3,085,874 | | | | 3,094,424 | |
Towd Point Mortgage Trust Series2015-4 Class A2 144A±± | | | 3.75 | | | | 4-25-2055 | | | | 3,080,000 | | | | 3,193,322 | |
Towd Point Mortgage Trust Series2017-1 Class A1 144A±± | | | 2.75 | | | | 10-25-2056 | | | | 4,623,020 | | | | 4,718,570 | |
Towd Point Mortgage Trust Series2017-4 Class A1 144A±± | | | 2.75 | | | | 6-25-2057 | | | | 2,712,017 | | | | 2,778,315 | |
Towd Point Mortgage Trust Series2019-SJ3 Class A1 144A±± | | | 3.00 | | | | 11-25-2059 | | | | 5,149,778 | | | | 5,187,255 | |
UBS Commercial Mortgage Trust Series2012-C1 Class A3 | | | 3.40 | | | | 5-10-2045 | | | | 1,348,090 | | | | 1,385,909 | |
UBS Commercial Mortgage Trust Series 2018-NYCH Class A (1 Month LIBOR +0.85%) 144A± | | | 2.51 | | | | 2-15-2032 | | | | 4,115,000 | | | | 4,106,024 | |
Vendee Mortgage Trust Series2011-1 Class DA | | | 3.75 | | | | 2-15-2035 | | | | 1,632,100 | | | | 1,661,071 | |
Venture CDO Limited Series2015-20A Class AR (3 Month LIBOR
+0.82%) 144A± | | | 2.65 | | | | 4-15-2027 | | | | 5,453,579 | | | | 5,454,086 | |
Verus Securitization Trust Series2019-1 Class A1 144A±± | | | 3.40 | | | | 12-25-2059 | | | | 3,919,692 | | | | 3,962,240 | |
Wilshire Funding Corporation Series1996-3 Class M2±± | | | 7.08 | | | | 8-25-2032 | | | | 131,869 | | | | 138,013 | |
Wilshire Funding Corporation Series1996-3 Class M3±± | | | 7.08 | | | | 8-25-2032 | | | | 113,299 | | | | 110,805 | |
Wilshire Funding Corporation Series1998-2 Class M1±± | | | 2.00 | | | | 12-28-2037 | | | | 154,692 | | | | 157,149 | |
| | | | | | | | | | | | | | | | |
| |
TotalNon-Agency Mortgage-Backed Securities (Cost $274,357,545) | | | | 275,739,404 | |
| | | | | | | | | | | | | | | | |
| Yankee Corporate Bonds and Notes: 14.29% | |
|
Consumer Discretionary: 1.60% | |
|
| Auto Components: 0.58% | |
Toyota Industries Corporation 144A | | | 3.11 | | | | 3-12-2022 | | | | 6,145,000 | | | | 6,326,846 | |
| | | | | | | | | | | | | | | | |
|
| Automobiles: 0.52% | |
Fiat Chrysler Automobiles NV | | | 4.50 | | | | 4-15-2020 | | | | 5,720,000 | | | | 5,726,406 | |
| | | | | | | | | | | | | | | | |
The accompanying notes are an integral part of these financial statements.
16 | Wells Fargo Ultra Short-Term Income Fund
Portfolio of investments—February 29, 2020 (unaudited)
| | | | | | | | | | | | | | | | |
| | | Interest
rate | | | Maturity
date | | | Principal | | | Value | |
|
| Household Durables : 0.50% | |
Panasonic Corporation 144A | | | 2.54 | % | | | 7-19-2022 | | | $ | 5,400,000 | | | $ | 5,508,903 | |
| | | | | | | | | | | | | | | | |
|
| Consumer Staples : 0.42% | |
|
| Food & Staples Retailing : 0.42% | |
Seven & I Holdings Company Limited 144A | | | 3.35 | | | | 9-17-2021 | | | | 4,500,000 | | | | 4,619,384 | |
| | | | | | | | | | | | | | | | |
|
| Energy : 1.07% | |
|
| Oil, Gas & Consumable Fuels : 1.07% | |
Aker BP ASA 144A | | | 6.00 | | | | 7-1-2022 | | | | 5,000,000 | | | | 5,140,543 | |
TransCanada PipeLines Limited | | | 9.88 | | | | 1-1-2021 | | | | 6,200,000 | | | | 6,625,576 | |
| | | | |
| | | | | | | | | | | | | | | 11,766,119 | |
| | | | | | | | | | | | | | | | |
|
Financials : 9.85% | |
|
| Banks : 9.02% | |
ABN AMRO Bank NV 144A | | | 3.40 | | | | 8-27-2021 | | | | 7,000,000 | | | | 7,201,926 | |
ANZ New Zealand International Company 144A« | | | 1.90 | | | | 2-13-2023 | | | | 2,800,000 | | | | 2,834,585 | |
Australia & New Zealand Banking Group Limited | | | 2.25 | | | | 11-9-2020 | | | | 5,790,000 | | | | 5,815,681 | |
Banco Santander Chile 144A | | | 2.50 | | | | 12-15-2020 | | | | 8,255,000 | | | | 8,245,920 | |
Banco Santander SA | | | 3.50 | | | | 4-11-2022 | | | | 10,020,000 | | | | 10,403,211 | |
Banque Federative du Credit Mutuel SA 144A | | | 2.13 | | | | 11-21-2022 | | | | 7,700,000 | | | | 7,827,523 | |
BBVA Bancomer SA 144A | | | 7.25 | | | | 4-22-2020 | | | | 1,415,000 | | | | 1,420,320 | |
Corporación Andina de Fomento | | | 4.38 | | | | 6-15-2022 | | | | 5,400,000 | | | | 5,737,230 | |
Danske Bank AS 144A | | | 5.00 | | | | 1-12-2022 | | | | 8,565,000 | | | | 9,071,777 | |
DNB Bank ASA 144A | | | 2.13 | | | | 10-2-2020 | | | | 7,000,000 | | | | 7,034,583 | |
Federation des Caisses Desjardins du Quebec 144A | | | 2.25 | | | | 10-30-2020 | | | | 5,000,000 | | | | 5,023,004 | |
Global Bank Corporation 144A | | | 4.50 | | | | 10-20-2021 | | | | 1,180,000 | | | | 1,209,500 | |
Sumitomo Mitsui Banking Corporation (3 Month LIBOR +0.37%)± | | | 2.21 | | | | 10-16-2020 | | | | 5,000,000 | | | | 5,005,638 | |
Sumitomo Mitsui Financial Group | | | 2.06 | | | | 7-14-2021 | | | | 5,000,000 | | | | 5,035,114 | |
Suncorp-Metway Limited 144A | | | 2.38 | | | | 11-9-2020 | | | | 4,000,000 | | | | 4,028,800 | |
Svenska Handelsbanken AB | | | 1.88 | | | | 9-7-2021 | | | | 7,000,000 | | | | 7,054,314 | |
UniCredit SpA 144A | | | 6.57 | | | | 1-14-2022 | | | | 5,615,000 | | | | 6,030,713 | |
| | | | |
| | | | | | | | | | | | | | | 98,979,839 | |
| | | | | | | | | | | | | | | | |
|
| Diversified Financial Services : 0.83% | |
General Electric Capital International Funding Company | | | 2.34 | | | | 11-15-2020 | | | | 5,322,000 | | | | 5,336,529 | |
UBS AG 144A | | | 2.20 | | | | 6-8-2020 | | | | 3,725,000 | | | | 3,727,951 | |
| | | | |
| | | | | | | | | | | | | | | 9,064,480 | |
| | | | | | | | | | | | | | | | |
|
Health Care : 0.48% | |
|
| Pharmaceuticals : 0.48% | |
Perrigo Finance Unlimited Company | | | 3.50 | | | | 3-15-2021 | | | | 2,665,000 | | | | 2,712,191 | |
Shire Acquisitions Investment Ireland Limited | | | 2.40 | | | | 9-23-2021 | | | | 2,520,000 | | | | 2,552,407 | |
| | | | |
| | | | | | | | | | | | | | | 5,264,598 | |
| | | | | | | | | | | | | | | | |
|
Industrials : 0.21% | |
|
| Semiconductors & Semiconductor Equipment : 0.21% | |
NXP BV 144A | | | 4.13 | | | | 6-1-2021 | | | | 2,215,000 | | | | 2,276,696 | |
| | | | | | | | | | | | | | | | |
The accompanying notes are an integral part of these financial statements.
Wells Fargo Ultra Short-Term Income Fund | 17
Portfolio of investments—February 29, 2020 (unaudited)
| | | | | | | | | | | | | | | | |
| | | Interest
rate | | | Maturity
date | | | Principal | | | Value | |
|
Materials : 0.66% | |
|
| Chemicals : 0.66% | |
Park Aerospace Holdings Company 144A | | | 5.25 | % | | | 8-15-2022 | | | $ | 2,115,000 | | | $ | 2,250,246 | |
Syngenta Finance NV 144A | | | 3.70 | | | | 4-24-2020 | | | | 5,000,000 | | | | 5,010,522 | |
| | | | |
| | | | | | | | | | | | | | | 7,260,768 | |
| | | | | | | | | | | | | | | | |
| |
Total Yankee Corporate Bonds and Notes (Cost $154,110,197) | | | | 156,794,039 | |
| | | | | | | | | | | | | | | | |
| | | | |
| | | | | | | | | | | | | | | | |
| | | Yield | | | | | | Shares | | | | |
| Short-Term Investments : 5.13% | | | | | | | | | | | | |
| | | | |
| Investment Companies : 5.13% | | | | | | | | | | | | |
Securities Lending Cash Investments LLC (l)(r)(u) | | | 1.66 | | | | | | | | 12,791,854 | | | | 12,793,133 | |
Wells Fargo Government Money Market Fund Select Class (l)(u)## | | | 1.52 | | | | | | | | 43,536,183 | | | | 43,536,183 | |
| | | | | | | | | | | | | | | | |
| | | | |
Total Short-Term Investments (Cost $56,329,316) | | | | | | | | | | | | | | | 56,329,316 | |
| | | | | | | | | | | | | | | | |
| | | | | | | | |
| Total investments in securities (Cost $1,108,539,435) | | | 102.04 | % | | | 1,119,911,636 | |
| | |
Other assets and liabilities, net | | | (2.04 | ) | | | (22,420,606 | ) |
| | | | | | | | |
| Total net assets | | | 100.00 | % | | $ | 1,097,491,030 | |
| | | | | | | | |
| 144A | The security may be resold in transactions exempt from registration, normally to qualified institutional buyers, pursuant to Rule 144A under the Securities Act of 1933. |
| ± | Variable rate investment. The rate shown is the rate in effect at period end. |
| ±± | The coupon of the security is adjusted based on the principal and interest payments received from the underlying pool of mortgages as well as the credit quality and the actual prepayment speed of the underlying mortgages. |
| « | All or a portion of this security is on loan. |
| %% | The security is purchased on a when-issued basis. |
| (l) | The issuer of the security is an affiliated person of the Fund as defined in the Investment Company Act of 1940. |
| (r) | The investment is anon-registered investment company purchased with cash collateral received from securities on loan. |
| (u) | The rate represents the7-day annualized yield at period end. |
| ## | All or a portion of this security is segregated for when-issued securities. |
Abbreviations:
| FHLMC | Federal Home Loan Mortgage Corporation |
| FNMA | Federal National Mortgage Association |
| GNMA | Government National Mortgage Association |
| LIBOR | London Interbank Offered Rate |
| PFA | Public Finance Authority |
| REIT | Real estate investment trust |
Futures Contracts
| | | | | | | | | | | | | | | | | | | | | | | | |
| Description | | Number of
contracts | | | Expiration
date | | | Notional
cost | | | Notional
value | | | Unrealized
gains | | | Unrealized
losses | |
| | | | | | |
Short | | | | | | | | | | | | | | | | | | | | | | | | |
| | | | | | |
2-Year U.S. Treasury Notes | | | (1,126) | | | | 6-30-2020 | | | $ | (244,498,541 | ) | | $ | (245,837,470 | ) | | $ | 0 | | | $ | (1,338,929 | ) |
| | | | | | |
5-Year U.S. Treasury Notes | | | (190) | | | | 6-30-2020 | | | | (23,085,863 | ) | | | (23,322,500 | ) | | | 0 | | | | (236,637 | ) |
| | | | | | | | | | | | | | | | | | | | | | | | |
| | | | | | |
| | | | | | | | | | | | | | | | | | $ | 0 | | | $ | (1,575,566 | ) |
| | | | | | | | | | | | | | | | | | | | | | | | |
The accompanying notes are an integral part of these financial statements.
18 | Wells Fargo Ultra Short-Term Income Fund
Portfolio of investments—February 29, 2020 (unaudited)
Investments in Affiliates
An affiliated investment is an investment in which the Fund owns at least 5% of the outstanding voting shares of the issuer or as a result of other relationships, such as the Fund and the issuer having the same investment manager. Transactions with issuers that were either affiliated persons of the Fund at the beginning of the period or the end of the period were as follows:
| | | | | | | | | | | | | | | | | | | | | | | | | | | | | | | | | | | | |
| | | Shares,
beginning of
period | | | Shares
purchased | | | Shares
sold | | | Shares,
end of
period | | | Net
realized
gains
(losses) | | | Net
change in
unrealized
gains
(losses) | | | Income
from
affiliated
securities | | | Value,
end of
period | | | % of
net
assets | |
| | | | | | | | | |
| Short-Term Investments | | | | | | | | | | | | | | | | | | | | | | | | | | | |
Investment Companies | | | | | | | | | | | | | | | | | | | | | | | | | | | | | | | | | | | | |
Securities Lending Cash Investments LLC | | | 0 | | | | 252,186,882 | | | | (239,395,028 | ) | | | 12,791,854 | | | $ | 11 | | | $ | 0 | | | $ | 134,317 | # | | $ | 12,793,133 | | | | | |
Wells Fargo Government Money Market Fund Select Class | | | 62,084,487 | | | | 381,652,830 | | | | (400,201,134 | ) | | | 43,536,183 | | | | 0 | | | | 0 | | | | 534,158 | | | | 43,536,183 | | | | | |
| | | | | | | | | | | | | | | | | | | | | | | | | | | | | | | | | | | | |
| | | | | | | | | | | | | | | | | | $ | 11 | | | $ | 0 | | | $ | 668,475 | | | $ | 56,329,316 | | | | 5.13 | % |
| | | | | | | | | | | | | | | | | | | | | | | | | | | | | | | | | | | | |
| # | Amount shown represents income before fees and rebates. |
The accompanying notes are an integral part of these financial statements.
Wells Fargo Ultra Short-Term Income Fund | 19
Statement of assets and liabilities—February 29, 2020 (unaudited)
| | | | |
| | | | |
| |
Assets | | | | |
Investments in unaffiliated securities (including $12,525,851 of securities loaned), at value (cost $1,052,210,119) | | $ | 1,063,582,320 | |
Investments in affiliated securities, at value (cost $56,329,316) | | | 56,329,316 | |
Cash | | | 107,068 | |
Segregated cash for futures contracts | | | 1,956,806 | |
Principal paydown receivable | | | 64,658 | |
Receivable for Fund shares sold | | | 5,652,981 | |
Receivable for interest | | | 5,135,622 | |
Receivable for securities lending income, net | | | 3,200 | |
Prepaid expenses and other assets | | | 258 | |
| | | | |
Total assets | | | 1,132,832,229 | |
| | | | |
| |
Liabilities | | | | |
Payable upon receipt of securities loaned | | | 12,792,625 | |
Payable for investments purchased | | | 14,623,350 | |
Payable for Fund shares redeemed | | | 5,093,801 | |
Payable for daily variation margin on open futures contracts | | | 1,174,772 | |
Management fee payable | | | 218,567 | |
Dividends payable | | | 797,227 | |
Administration fees payable | | | 88,597 | |
Distribution fee payable | | | 2,633 | |
Trustees’ fees and expenses payable | | | 6,019 | |
Accrued expenses and other liabilities | | | 543,608 | |
| | | | |
Total liabilities | | | 35,341,199 | |
| | | | |
Total net assets | | $ | 1,097,491,030 | |
| | | | |
| |
Net assets consist of | | | | |
Paid-in capital | | $ | 1,118,140,719 | |
Total distributable loss | | | (20,649,689 | ) |
| | | | |
Total net assets | | $ | 1,097,491,030 | |
| | | | |
| |
Computation of net asset value and offering price per share | | | | |
Net assets – Class A | | $ | 214,938,466 | |
Shares outstanding – Class A1 | | | 25,116,720 | |
Net asset value per share – Class A | | | $8.56 | |
Maximum offering price per share – Class A2 | | | $8.73 | |
Net assets – Class C | | $ | 4,399,573 | |
Shares outstanding – Class C1 | | | 514,674 | |
Net asset value per share – Class C | | | $8.55 | |
Net assets – Administrator Class | | $ | 16,927,140 | |
Shares outstanding – Administrator Class1 | | | 1,987,013 | |
Net asset value per share – Administrator Class | | | $8.52 | |
Net assets – Institutional Class | | $ | 861,225,851 | |
Shares outstanding – Institutional Class1 | | | 100,694,237 | |
Net asset value per share – Institutional Class | | | $8.55 | |
| 1 | The Fund has an unlimited number of authorized shares. |
| 2 | Maximum offering price is computed as 100/98 of net asset value. On investments of $50,000 or more, the offering price is reduced. |
The accompanying notes are an integral part of these financial statements.
20 | Wells Fargo Ultra Short-Term Income Fund
Statement of operations—six months ended February 29, 2020 (unaudited)
| | | | |
| | | | |
| |
Investment income | | | | |
Interest | | $ | 13,532,089 | |
Dividends | | | 903,115 | |
Income from affiliated securities | | | 564,434 | |
| | | | |
Total investment income | | | 14,999,638 | |
| | | | |
| |
Expenses | | | | |
Management fee | | | 1,890,961 | |
Administration fees | |
Class A | | | 168,428 | |
Class C | | | 3,678 | |
Administrator Class | | | 7,683 | |
Institutional Class | | | 342,836 | |
Shareholder servicing fees | |
Class A | | | 263,168 | |
Class C | | | 5,747 | |
Administrator Class | | | 19,206 | |
Distribution fee | |
Class C | | | 17,226 | |
Custody and accounting fees | | | 44,629 | |
Professional fees | | | 36,694 | |
Registration fees | | | 66,945 | |
Shareholder report expenses | | | 34,712 | |
Trustees’ fees and expenses | | | 10,909 | |
Other fees and expenses | | | 11,093 | |
| | | | |
Total expenses | | | 2,923,915 | |
Less: Fee waivers and/or expense reimbursements | |
Fund-level | | | (519,728 | ) |
Administrator Class | | | (6,925 | ) |
Institutional Class | | | (84,898 | ) |
| | | | |
Net expenses | | | 2,312,364 | |
| | | | |
Net investment income | | | 12,687,274 | |
| | | | |
| |
Realized and unrealized gains (losses) on investments | | | | |
Net realized gains (losses) on | |
Unaffiliated securities | | | 808,106 | |
Affiliated securities | | | 11 | |
Futures contracts | | | (978,525 | )�� |
| | | | |
Net realized losses on investments | | | (170,408 | ) |
| | | | |
|
Net change in unrealized gains (losses) on | |
Unaffiliated securities | | | 3,274,309 | |
Futures contracts | | | (1,624,207 | ) |
| | | | |
Net change in unrealized gains (losses) on investments | | | 1,650,102 | |
| | | | |
Net realized and unrealized gains (losses) on investments | | | 1,479,694 | |
| | | | |
Net increase in net assets resulting from operations | | $ | 14,166,968 | |
| | | | |
The accompanying notes are an integral part of these financial statements.
Wells Fargo Ultra Short-Term Income Fund | 21
Statement of changes in net assets
| | | | | | | | | | | | | | | | |
| | | Six months ended
February 29, 2020
(unaudited) | | | Year ended August 31, 2019 | |
| | | | |
Operations | | | | | | | | | | | | | | | | |
Net investment income | | | | | | $ | 12,687,274 | | | | | | | $ | 23,807,281 | |
Net realized losses on investments | | | | | | | (170,408 | ) | | | | | | | (5,173,986 | ) |
Net change in unrealized gains (losses) on investments | | | | | | | 1,650,102 | | | | | | | | 14,893,045 | |
| | | | |
Net increase in net assets resulting from operations | | | | | | | 14,166,968 | | | | | | | | 33,526,340 | |
| | | | |
| | | | |
Distributions to shareholders from net investment income and net realized gains | | | | | | | | | | | | | | | | |
Class A | | | | | | | (2,128,715 | ) | | | | | | | (4,691,164 | ) |
Class C | | | | | | | (29,243 | ) | | | | | | | (69,389 | ) |
Administrator Class | | | | | | | (166,975 | ) | | | | | | | (302,857 | ) |
Institutional Class | | | | | | | (10,165,217 | ) | | | | | | | (18,718,916 | ) |
| | | | |
Total distributions to shareholders | | | | | | | (12,490,150 | ) | | | | | | | (23,782,326 | ) |
| | | | |
| | | | |
Capital share transactions | | | Shares | | | | | | | | Shares | | | | | |
Proceeds from shares sold | | | | | | | | | | | | | | | | |
Class A | | | 2,814,251 | | | | 24,066,734 | | | | 3,440,445 | | | | 29,216,109 | |
Class C | | | 85,085 | | | | 726,510 | | | | 442,509 | | | | 3,748,406 | |
Administrator Class | | | 594,590 | | | | 5,061,997 | | | | 508,071 | | | | 4,302,476 | |
Institutional Class | | | 38,580,737 | | | | 329,789,853 | | | | 79,096,663 | | | | 671,176,689 | |
| | | | |
| | | | | | | 359,645,094 | | | | | | | | 708,443,680 | |
| | | | |
Reinvestment of distributions | | | | | | | | | | | | | | | | |
Class A | | | 240,915 | | | | 2,060,629 | | | | 534,195 | | | | 4,540,259 | |
Class C | | | 3,381 | | | | 28,881 | | | | 8,101 | | | | 68,784 | |
Administrator Class | | | 19,170 | | | | 163,204 | | | | 35,444 | | | | 299,894 | |
Institutional Class | | | 645,961 | | | | 5,521,962 | | | | 1,026,803 | | | | 8,724,965 | |
| | | | |
| | | | | | | 7,774,676 | | | | | | | | 13,633,902 | |
| | | | |
Payment for shares redeemed | | | | | | | | | | | | | | | | |
Class A | | | (3,159,678 | ) | | | (27,013,748 | ) | | | (7,567,845 | ) | | | (64,257,129 | ) |
Class C | | | (189,733 | ) | | | (1,620,395 | ) | | | (432,645 | ) | | | (3,668,839 | ) |
Administrator Class | | | (242,986 | ) | | | (2,069,535 | ) | | | (711,430 | ) | | | (6,017,265 | ) |
Institutional Class | | | (36,477,905 | ) | | | (311,866,978 | ) | | | (70,211,953 | ) | | | (595,758,632 | ) |
| | | | |
| | | | | | | (342,570,656 | ) | | | | | | | (669,701,865 | ) |
| | | | |
Net increase in net assets resulting from capital share transactions | | | | | | | 24,849,114 | | | | | | | | 52,375,717 | |
| | | | |
Total increase in net assets | | | | | | | 26,525,932 | | | | | | | | 62,119,731 | |
| | | | |
| | |
Net assets | | | | | | | | |
Beginning of period | | | | | | | 1,070,965,098 | | | | | | | | 1,008,845,367 | |
| | | | |
End of period | | | | | | $ | 1,097,491,030 | | | | | | | $ | 1,070,965,098 | |
| | | | |
The accompanying notes are an integral part of these financial statements.
22 | Wells Fargo Ultra Short-Term Income Fund
Financial highlights
(For a share outstanding throughout each period)
| | | | | | | | | | | | | | | | | | | | | | | | |
| | | Six months ended
February 29, 2020
(unaudited) | | | Year ended August 31 | |
| CLASS A | | 2019 | | | 2018 | | | 2017 | | | 2016 | | | 2015 | |
Net asset value, beginning of period | | | $8.54 | | | | $8.46 | | | | $8.48 | | | | $8.49 | | | | $8.46 | | | | $8.53 | |
Net investment income | | | 0.09 | | | | 0.17 | 1 | | | 0.13 | | | | 0.09 | | | | 0.08 | | | | 0.05 | |
Net realized and unrealized gains (losses) on investments | | | 0.02 | | | | 0.08 | | | | (0.02 | ) | | | (0.01 | ) | | | 0.03 | | | | (0.06 | ) |
| | | | | | | | | | | | | | | | | | | | | | | | |
Total from investment operations | | | 0.11 | | | | 0.25 | | | | 0.11 | | | | 0.08 | | | | 0.11 | | | | (0.01 | ) |
Distributions to shareholders from | | | | | | | | | | | | | | | | | | | | | | | | |
Net investment income | | | (0.09 | ) | | | (0.17 | ) | | | (0.13 | ) | | | (0.09 | ) | | | (0.08 | ) | | | (0.05 | ) |
Tax basis return of capital | | | 0.00 | | | | 0.00 | | | | 0.00 | | | | 0.00 | | | | 0.00 | | | | (0.01 | ) |
| | | | | | | | | | | | | | | | | | | | | | | | |
Total distributions to shareholders | | | (0.09 | ) | | | (0.17 | ) | | | (0.13 | ) | | | (0.09 | ) | | | (0.08 | ) | | | (0.06 | ) |
Net asset value, end of period | | | $8.56 | | | | $8.54 | | | | $8.46 | | | | $8.48 | | | | $8.49 | | | | $8.46 | |
Total return2 | | | 1.25 | % | | | 3.04 | % | | | 1.24 | % | | | 0.97 | % | | | 1.28 | % | | | (0.07 | )% |
Ratios to average net assets (annualized) | | | | | | | | | | | | | | | | | | | | | | | | |
Gross expenses | | | 0.80 | % | | | 0.80 | % | | | 0.80 | % | | | 0.79 | % | | | 0.79 | % | | | 0.77 | % |
Net expenses | | | 0.70 | % | | | 0.70 | % | | | 0.70 | % | | | 0.70 | % | | | 0.70 | % | | | 0.70 | % |
Net investment income | | | 2.06 | % | | | 2.05 | % | | | 1.47 | % | | | 1.09 | % | | | 0.93 | % | | | 0.64 | % |
Supplemental data | | | | | | | | | | | | | | | | | | | | | | | | |
Portfolio turnover rate | | | 18 | % | | | 36 | % | | | 55 | % | | | 56 | % | | | 51 | % | | | 70 | % |
Net assets, end of period (000s omitted) | | | $214,938 | | | | $215,503 | | | | $243,909 | | | | $274,079 | | | | $319,565 | | | | $151,561 | |
| 1 | Calculated based upon average shares outstanding |
| 2 | Total return calculations do not include any sales charges. Returns for periods of less than one year are not annualized. |
The accompanying notes are an integral part of these financial statements.
Wells Fargo Ultra Short-Term Income Fund | 23
Financial highlights
(For a share outstanding throughout each period)
| | | | | | | | | | | | | | | | | | | | | | | | |
| | | Six months ended
February 29, 2020
(unaudited) | | | Year ended August 31 | |
| CLASS C | | 2019 | | | 2018 | | | 2017 | | | 2016 | | | 2015 | |
Net asset value, beginning of period | | | $8.54 | | | | $8.46 | | | | $8.47 | | | | $8.48 | | | | $8.45 | | | | $8.52 | |
Net investment income (loss) | | | 0.05 | | | | 0.11 | | | | 0.06 | | | | 0.02 | | | | 0.01 | | | | (0.01 | ) |
Net realized and unrealized gains (losses) on investments | | | 0.01 | | | | 0.08 | | | | (0.01 | ) | | | 0.00 | | | | 0.03 | | | | (0.06 | ) |
| | | | | | | | | | | | | | | | | | | | | | | | |
Total from investment operations | | | 0.06 | | | | 0.19 | | | | 0.05 | | | | 0.02 | | | | 0.04 | | | | (0.07 | ) |
Distributions to shareholders from | | | | | | | | | | | | | | | | | | | | | | | | |
Net investment income | | | (0.05 | ) | | | (0.11 | ) | | | (0.06 | ) | | | (0.03 | ) | | | (0.01 | ) | | | (0.00 | )1 |
Tax basis return of capital | | | 0.00 | | | | 0.00 | | | | 0.00 | | | | 0.00 | | | | 0.00 | | | | (0.00 | )1 |
| | | | | | | | | | | | | | | | | | | | | | | | |
Total distributions to shareholders | | | (0.05 | ) | | | (0.11 | ) | | | (0.06 | ) | | | (0.03 | ) | | | (0.01 | ) | | | (0.00 | )1 |
Net asset value, end of period | | | $8.55 | | | | $8.54 | | | | $8.46 | | | | $8.47 | | | | $8.48 | | | | $8.45 | |
Total return2 | | | 0.75 | % | | | 2.27 | % | | | 0.60 | % | | | 0.22 | % | | | 0.52 | % | | | (0.81 | )% |
Ratios to average net assets (annualized) | | | | | | | | | | | | | | | | | | | | | | | | |
Gross expenses | | | 1.54 | % | | | 1.55 | % | | | 1.55 | % | | | 1.54 | % | | | 1.54 | % | | | 1.52 | % |
Net expenses | | | 1.45 | % | | | 1.45 | % | | | 1.45 | % | | | 1.45 | % | | | 1.45 | % | | | 1.45 | % |
Net investment income (loss) | | | 1.31 | % | | | 1.31 | % | | | 0.72 | % | | | 0.34 | % | | | 0.17 | % | | | (0.10 | )% |
Supplemental data | | | | | | | | | | | | | | | | | | | | | | | | |
Portfolio turnover rate | | | 18 | % | | | 36 | % | | | 55 | % | | | 56 | % | | | 51 | % | | | 70 | % |
Net assets, end of period (000s omitted) | | | $4,400 | | | | $5,257 | | | | $5,056 | | | | $5,760 | | | | $7,464 | | | | $7,642 | |
| 1 | Amount is less than $0.005. |
| 2 | Total return calculations do not include any sales charges. Returns for periods of less than one year are not annualized. |
The accompanying notes are an integral part of these financial statements.
24 | Wells Fargo Ultra Short-Term Income Fund
Financial highlights
(For a share outstanding throughout each period)
| | | | | | | | | | | | | | | | | | | | | | | | |
| | | Six months ended
February 29, 2020
(unaudited) | | | Year ended August 31 | |
| ADMINISTRATOR CLASS | | 2019 | | | 2018 | | | 2017 | | | 2016 | | | 2015 | |
Net asset value, beginning of period | | | $8.51 | | | | $8.43 | | | | $8.45 | | | | $8.46 | | | | $8.42 | | | | $8.50 | |
Net investment income | | | 0.09 | | | | 0.19 | 1 | | | 0.13 | | | | 0.10 | | | | 0.09 | | | | 0.07 | 1 |
Net realized and unrealized gains (losses) on investments | | | 0.01 | | | | 0.08 | | | | (0.01 | ) | | | (0.01 | ) | | | 0.04 | | | | (0.07 | ) |
| | | | | | | | | | | | | | | | | | | | | | | | |
Total from investment operations | | | 0.10 | | | | 0.27 | | | | 0.12 | | | | 0.09 | | | | 0.13 | | | | 0.00 | |
Distributions to shareholders from | | | | | | | | | | | | | | | | | | | | | | | | |
Net investment income | | | (0.09 | ) | | | (0.19 | ) | | | (0.14 | ) | | | (0.10 | ) | | | (0.09 | ) | | | (0.07 | ) |
Tax basis return of capital | | | 0.00 | | | | 0.00 | | | | 0.00 | | | | 0.00 | | | | 0.00 | | | | (0.01 | ) |
| | | | | | | | | | | | | | | | | | | | | | | | |
Total distributions to shareholders | | | (0.09 | ) | | | (0.19 | ) | | | (0.14 | ) | | | (0.10 | ) | | | (0.09 | ) | | | (0.08 | ) |
Net asset value, end of period | | | $8.52 | | | | $8.51 | | | | $8.43 | | | | $8.45 | | | | $8.46 | | | | $8.42 | |
Total return2 | | | 1.20 | % | | | 3.19 | % | | | 1.39 | % | | | 1.12 | % | | | 1.55 | % | | | (0.04 | )% |
Ratios to average net assets (annualized) | | | | | | | | | | | | | | | | | | | | | | | | |
Gross expenses | | | 0.74 | % | | | 0.74 | % | | | 0.74 | % | | | 0.73 | % | | | 0.73 | % | | | 0.71 | % |
Net expenses | | | 0.55 | % | | | 0.55 | % | | | 0.55 | % | | | 0.55 | % | | | 0.55 | % | | | 0.55 | % |
Net investment income | | | 2.21 | % | | | 2.20 | % | | | 1.54 | % | | | 1.24 | % | | | 1.05 | % | | | 0.81 | % |
Supplemental data | | | | | | | | | | | | | | | | | | | | | | | | |
Portfolio turnover rate | | | 18 | % | | | 36 | % | | | 55 | % | | | 56 | % | | | 51 | % | | | 70 | % |
Net assets, end of period (000s omitted) | | | $16,927 | | | | $13,748 | | | | $15,037 | | | | $27,245 | | | | $26,679 | | | | $44,682 | |
| 1 | Calculated based upon average shares outstanding |
| 2 | Returns for periods of less than one year are not annualized. |
The accompanying notes are an integral part of these financial statements.
Wells Fargo Ultra Short-Term Income Fund | 25
Financial highlights
(For a share outstanding throughout each period)
| | | | | | | | | | | | | | | | | | | | | | | | |
| | | Six months ended
February 29, 2020
(unaudited) | | | Year ended August 31 | |
| INSTITUTIONAL CLASS | | 2019 | | | 2018 | | | 2017 | | | 2016 | | | 2015 | |
Net asset value, beginning of period | | | $8.54 | | | | $8.46 | | | | $8.48 | | | | $8.49 | | | | $8.45 | | | | $8.53 | |
Net investment income | | | 0.10 | | | | 0.20 | | | | 0.15 | | | | 0.12 | | | | 0.11 | | | | 0.08 | |
Net realized and unrealized gains (losses) on investments | | | 0.01 | | | | 0.08 | | | | (0.02 | ) | | | (0.01 | ) | | | 0.04 | | | | (0.07 | ) |
Total from investment operations | | | 0.11 | | | | 0.28 | | | | 0.13 | | | | 0.11 | | | | 0.15 | | | | 0.01 | |
Distributions to shareholders from | | | | | | | | | | | | | | | | | | | | | | | | |
Net investment income | | | (0.10 | ) | | | (0.20 | ) | | | (0.15 | ) | | | (0.12 | ) | | | (0.11 | ) | | | (0.08 | ) |
Tax basis return of capital | | | 0.00 | | | | 0.00 | | | | 0.00 | | | | 0.00 | | | | 0.00 | | | | (0.01 | ) |
Total distributions to shareholders | | | (0.10 | ) | | | (0.20 | ) | | | (0.15 | ) | | | (0.12 | ) | | | (0.11 | ) | | | (0.09 | ) |
Net asset value, end of period | | | $8.55 | | | | $8.54 | | | | $8.46 | | | | $8.48 | | | | $8.49 | | | | $8.45 | |
Total return1 | | | 1.30 | % | | | 3.40 | % | | | 1.59 | % | | | 1.33 | % | | | 1.75 | % | | | 0.16 | % |
Ratios to average net assets (annualized) | | | | | | | | | | | | | | | | | | | | | | | | |
Gross expenses | | | 0.47 | % | | | 0.47 | % | | | 0.47 | % | | | 0.46 | % | | | 0.46 | % | | | 0.44 | % |
Net expenses | | | 0.35 | % | | | 0.35 | % | | | 0.35 | % | | | 0.35 | % | | | 0.35 | % | | | 0.35 | % |
Net investment income | | | 2.41 | % | | | 2.41 | % | | | 1.80 | % | | | 1.43 | % | | | 1.27 | % | | | 0.99 | % |
Supplemental data | | | | | | | | | | | | | | | | | | | | | | | | |
Portfolio turnover rate | | | 18 | % | | | 36 | % | | | 55 | % | | | 56 | % | | | 51 | % | | | 70 | % |
Net assets, end of period (000s omitted) | | | $861,226 | | | | $836,456 | | | | $744,844 | | | | $1,061,908 | | | | $1,197,514 | | | | $1,137,808 | |
| 1 | Returns for periods of less than one year are not annualized. |
The accompanying notes are an integral part of these financial statements.
26 | Wells Fargo Ultra Short-Term Income Fund
Notes to financial statements (unaudited)
1. ORGANIZATION
Wells Fargo Funds Trust (the “Trust”), a Delaware statutory trust organized on March 10, 1999, is anopen-end management investment company registered under the Investment Company Act of 1940, as amended (the “1940 Act”). As an investment company, the Trust follows the accounting and reporting guidance in Financial Accounting Standards Board (“FASB”)Accounting Standards Codification Topic 946, Financial Services – Investment Companies. These financial statements report on the Wells Fargo Ultra Short-Term Income Fund (the “Fund”) which is a diversified series of the Trust.
2. SIGNIFICANT ACCOUNTING POLICIES
The following significant accounting policies, which are consistently followed in the preparation of the financial statements of the Fund, are in conformity with U.S. generally accepted accounting principles which require management to make estimates and assumptions that affect the reported amounts of assets and liabilities, disclosure of contingent assets and liabilities at the date of the financial statements, and the reported amounts of revenues and expenses during the reporting period. Actual results could differ from those estimates.
Securities valuation
All investments are valued each business day as of the close of regular trading on the New York Stock Exchange (generally 4 p.m. Eastern Time), although the Fund may deviate from this calculation time under unusual or unexpected circumstances.
Debt securities are valued at the evaluated bid price provided by an independent pricing service (e.g. taking into account various factors, including yields, maturities, or credit ratings) or, if a reliable price is not available, the quoted bid price from an independent broker-dealer.
Equity securities and futures contracts that are listed on a foreign or domestic exchange or market are valued at the official closing price or, if none, the last sales price. If no sale occurs on the principal exchange or market that day, a fair value price will be determined in accordance with the Fund’s Valuation Procedures.
Investments in registeredopen-end investment companies are valued at net asset value. Interests innon-registered investment companies that are redeemable at net asset value are fair valued normally at net asset value.
Investments which are not valued using any of the methods discussed above are valued at their fair value, as determined in good faith by the Board of Trustees of the Fund. The Board of Trustees has established a Valuation Committee comprised of the Trustees and has delegated to it the authority to take any actions regarding the valuation of portfolio securities that the Valuation Committee deems necessary or appropriate, including determining the fair value of portfolio securities, unless the determination has been delegated to the Wells Fargo Asset Management Pricing Committee at Wells Fargo Funds Management, LLC (“Funds Management”).The Board of Trustees retains the authority to make or ratify any valuation decisions or approve any changes to the Valuation Procedures as it deems appropriate. On a quarterly basis, the Board of Trustees receives reports on any valuation actions taken by the Valuation Committee or the Wells Fargo Asset Management Pricing Committee which may include items for ratification.
Securities lending
The Fund may lend its securities from time to time in order to earn additional income in the form of fees or interest on securities received as collateral or the investment of any cash received as collateral. When securities are on loan, the Fund receives interest or dividends on those securities. Cash collateral received in connection with its securities lending transactions is invested in Securities Lending Cash Investments, LLC (the “Securities Lending Fund”). Investments in Securities Lending Fund are valued at the evaluated bid price provided by an independent pricing service. Income earned from investment in the Securities Lending Fund (net of fees and rebates), if any, is included in income from affiliated securities on the Statement of Operations.
In a securities lending transaction, the net asset value of the Fund is affected by an increase or decrease in the value of the securities loaned and by an increase or decrease in the value of the instrument in which collateral is invested. The amount of securities lending activity undertaken by the Fund fluctuates from time to time. The Fund has the right under the lending agreement to recover the securities from the borrower on demand. In the event of default or bankruptcy by the borrower, the Fund may be prevented from recovering the loaned securities or gaining access to the collateral or may experience delays or costs in doing so. In such an event, the terms of the agreement allows the unaffiliated securities lending agent to use the collateral to purchase replacement securities on behalf of the Fund or pay the Fund the market value of the loaned securities. The Fund bears the risk of loss with respect to depreciation of its investment of the cash collateral.
Wells Fargo Ultra Short-Term Income Fund | 27
Notes to financial statements (unaudited)
When-issued transactions
The Fund may purchase securities on a forward commitment or when-issued basis. The Fund records a when-issued transaction on the trade date and will segregate assets in an amount at least equal in value to the Fund’s commitment to purchase when-issued securities. Securities purchased on a when-issued basis aremarked-to-market daily and the Fund begins earning interest on the settlement date. Losses may arise due to changes in the market value of the underlying securities or if the counterparty does not perform under the contract.
Futures contracts
Futures contracts are agreements between the Fund and a counterparty to buy or sell a specific amount of a commodity, financial instrument or currency at a specified price and on a specified date. The Fund may buy and sell futures contracts in order to gain exposure to, or protect against, changes in interest rates and is subject to interest rate risk. The primary risks associated with the use of futures contracts are the imperfect correlation between changes in market values of securities held by the Fund and the prices of futures contracts, and the possibility of an illiquid market. Futures contracts are generally entered into on a regulated futures exchange and cleared through a clearinghouse associated with the exchange. With futures contracts, there is minimal counterparty risk to the Fund since futures contracts are exchange traded and the exchange’s clearinghouse, as the counterparty to all exchange traded futures, guarantees the futures contracts against default.
Upon entering into a futures contracts, the Fund is required to deposit either cash or securities (initial margin) with the broker in an amount equal to a certain percentage of the contract value. Subsequent payments (variation margin) are paid to or from the broker each day equal to the daily changes in the contract value. Such payments are recorded as unrealized gains or losses and, if any, shown as variation margin receivable (payable) in the Statement of Assets and Liabilities. Should the Fund fail to make requested variation margin payments, the broker can gain access to the initial margin to satisfy the Fund’s payment obligations. When the contracts are closed, a realized gain or loss is recorded in the Statement of Operations.
Security transactions and income recognition
Securities transactions are recorded on a trade date basis. Realized gains or losses are recorded on the basis of identified cost.
Interest income is accrued daily and bond discounts are accreted and premiums are amortized daily. To the extent debt obligations are placed onnon-accrual status, any related interest income may be reduced by writing off interest receivables when the collection of all or a portion of interest has been determined to be doubtful based on consistently applied procedures and the fair value has decreased. If the issuer subsequently resumes interest payments or when the collectability of interest is reasonably assured, the debt obligation is removed fromnon-accrual status.
Income dividends and capital gain distributions from investment companies are recorded on theex-dividend date. Capital gain distributions from investment companies are treated as realized gains.
Distributions to shareholders
Distributions to shareholders from net investment income are declared daily and paid monthly. Distributions from net realized gains, if any, are recorded on theex-dividend date and paid at least annually. Such distributions are determined in accordance with income tax regulations and may differ from U.S. generally accepted accounting principles. Dividend sources are estimated at the time of declaration. The tax character of distributions is determined as of the Fund’s fiscal year end. Therefore, a portion of the Fund’s distributions made prior to the Fund’s fiscal year end may be categorized as a tax return of capital at year end.
Federal and other taxes
The Fund intends to continue to qualify as a regulated investment company by distributing substantially all of its investment company taxable income and any net realized capital gains (after reduction for capital loss carryforwards) sufficient to relieve it from all, or substantially all, federal income taxes. Accordingly, no provision for federal income taxes was required.
The Fund’s income and federal excise tax returns and all financial records supporting those returns for the prior three fiscal years are subject to examination by the federal and Delaware revenue authorities. Management has analyzed the Fund’s tax positions taken on federal, state, and foreign tax returns for all open tax years and does not believe that there are any uncertain tax positions that require recognition of a tax liability.
As of February 29, 2020, the aggregate cost of all investments for federal income tax purposes was $1,108,588,076 and the unrealized gains (losses) consisted of:
| | | | |
| |
Gross unrealized gains | | $ | 12,378,501 | |
| |
Gross unrealized losses | | | (2,630,507 | ) |
| |
Net unrealized gains | | $ | 9,747,994 | |
28 | Wells Fargo Ultra Short-Term Income Fund
Notes to financial statements (unaudited)
As of August 31, 2019, the Fund had capital loss carryforwards which consisted of $1,313,832 in short-term capital losses and $22,815,824 in long-term capital losses.
As of August 31, 2019, the Fund had current year deferred post-October capital losses consisting of $2,111,387 in short-term losses and $3,611,278 in long-term losses which were recognized on the first day of the current fiscal year.
Class allocations
The separate classes of shares offered by the Fund differ principally in applicable sales charges, distribution, shareholder servicing, and administration fees. Class specific expenses are charged directly to that share class. Investment income, common fund-level expenses, and realized and unrealized gains (losses) on investments are allocated daily to each class of shares based on the relative proportion of net assets of each class.
3. FAIR VALUATION MEASUREMENTS
Fair value measurements of investments are determined within a framework that has established a fair value hierarchy based upon the various data inputs utilized in determining the value of the Fund’s investments. The three-level hierarchy gives the highest priority to unadjusted quoted prices in active markets for identical assets or liabilities (Level 1) and the lowest priority to unobservable inputs (Level 3). The Fund’s investments are classified within the fair value hierarchy based on the lowest level of input that is significant to the fair value measurement. The inputs are summarized into three broad levels as follows:
| ∎ | | Level 1 – quoted prices in active markets for identical securities |
| ∎ | | Level 2 – other significant observable inputs (including quoted prices for similar securities, interest rates, prepayment speeds, credit risk, etc.) |
| ∎ | | Level 3 – significant unobservable inputs (including the Fund’s own assumptions in determining the fair value of investments) |
The inputs or methodologies used for valuing investments in securities are not necessarily an indication of the risk associated with investing in those securities.
The following is a summary of the inputs used in valuing the Fund’s assets and liabilities as of February 29, 2020:
| | | | | | | | | | | | | | | | |
| | | | |
| | | Quoted prices
(Level 1) | | | Other significant
observable inputs
(Level 2) | | | Significant
unobservable inputs
(Level 3) | | | Total | |
Assets | | | | | | | | | | | | | | | | |
Investments in: | | | | | | | | | | | | | | | | |
| | | | |
Agency securities | | $ | 0 | | | $ | 55,093,070 | | | $ | 0 | | | $ | 55,093,070 | |
| | | | |
Asset-backed securities | | | 0 | | | | 220,980,595 | | | | 0 | | | | 220,980,595 | |
| | | | |
Corporate bonds and notes | | | 0 | | | | 285,537,067 | | | | 0 | | | | 285,537,067 | |
| | | | |
Exchange-traded funds | | | 62,191,080 | | | | 0 | | | | 0 | | | | 62,191,080 | |
| | | | |
Municipal obligations | | | 0 | | | | 7,247,065 | | | | 0 | | | | 7,247,065 | |
| | | | |
Non-agency mortgage-backed securities | | | 0 | | | | 275,739,404 | | | | 0 | | | | 275,739,404 | |
| | | | |
Yankee corporate bonds and notes | | | 0 | | | | 156,794,039 | | | | 0 | | | | 156,794,039 | |
| | | | |
Short-term investments | | | | | | | | | | | | | | | | |
| | | | |
Investment companies | | | 56,329,316 | | | | 0 | | | | 0 | | | | 56,329,316 | |
| | | | |
Total assets | | $ | 118,520,396 | | | $ | 1,001,391,240 | | | $ | 0 | | | $ | 1,119,911,636 | |
Liabilities | | | | | | | | | | | | | | | | |
Futures contracts | | $ | 1,575,566 | | | $ | 0 | | | $ | 0 | | | $ | 1,575,566 | |
| | | | |
Total liabilities | | $ | 1,575,566 | | | $ | 0 | | | $ | 0 | | | $ | 1,575,566 | |
Additional sector, industry or geographic detail is included in the Portfolio of Investments.
Futures contracts are reported at their cumulative unrealized gains (losses) at measurement date as reported in the table following the Portfolio of Investments. For futures contracts, the current day’s variation margin is reported on the Statement of Assets and Liabilities. All other assets and liabilities are reported at their market value at measurement date.
For the six months ended February 29, 2020, the Fund did not have any transfers into/out of Level 3.
Wells Fargo Ultra Short-Term Income Fund | 29
Notes to financial statements (unaudited)
4. TRANSACTIONS WITH AFFILIATES
Management fee
Funds Management, an indirect wholly owned subsidiary of Wells Fargo & Company (“Wells Fargo”), is the manager of the Fund and provides advisory and fund-level administrative services under an investment management agreement. Under the investment management agreement, Funds Management is responsible for, among other services, implementing the investment objectives and strategies of the Fund, supervising the subadviser and providing fund-level administrative services in connection with the Fund’s operations. As compensation for its services under the investment management agreement, Funds Management is entitled to receive a management fee at the following annual rate based on the Fund’s average daily net assets:
| | |
| |
| Average daily net assets | | Management fee |
| |
First $1 billion | | 0.350% |
| |
Next $4 billion | | 0.325 |
| |
Next $3 billion | | 0.290 |
| |
Next $2 billion | | 0.265 |
| |
Over $10 billion | | 0.255 |
For the six months ended February 29, 2020, the management fee was equivalent to an annual rate of 0.35% of the Fund’s average daily net assets.
Funds Management has retained the services of a subadviser to provide daily portfolio management to the Fund. The fee for subadvisory services is borne by Funds Management. Wells Capital Management Incorporated (“WellsCap”), an affiliate of Funds Management and an indirect wholly owned subsidiary of Wells Fargo, is the subadviser to the Fund and is entitled to receive a fee from Funds Management at an annual rate starting at 0.15% and declining to 0.05% as the average daily net assets of the Fund increase.
Administration fees
Under a class-level administration agreement, Funds Management provides class-level administrative services to the Fund, which includes paying fees and expenses for services provided by the transfer agent,sub-transfer agents, omnibus account servicers and record-keepers. As compensation for its services under the class-level administration agreement, Funds Management receives an annual fee which is calculated based on the average daily net assets of each class as follows:
| | |
| |
| | | Class-level
administration fee |
| |
Class A, Class C | | 0.16% |
| |
Administrator Class | | 0.10 |
| |
Institutional Class | | 0.08 |
Waivers and/or expense reimbursements
Funds Management has contractually waived and/or reimbursed management and administration fees to the extent necessary to maintain certain net operating expense ratios for the Fund. When each class of the Fund has exceeded its expense cap, Funds Management has waived fees and/or reimbursed expenses from fund-level expenses on a proportionate basis and then from class specific expenses. When only certain classes exceed their expense caps, waivers and/or reimbursements are applied against class specific expenses before fund-level expenses. Funds Management has committed through December 31, 2020 to waive fees and/or reimburse expenses to the extent necessary to cap the Fund’s expenses at 0.70% for Class A shares, 1.45% for Class C shares, 0.55% for Administrator Class shares, and 0.35% for Institutional Class shares. Prior to or after the commitment expiration date, the cap may be increased or the commitment to maintain the cap may be terminated only with the approval of the Board of Trustees.
Distribution fee
The Trust has adopted a distribution plan for Class C shares of the Fund pursuant to Rule12b-1 under the 1940 Act. A distribution fee is charged to Class C shares and paid to Wells Fargo Funds Distributor, LLC (“Funds Distributor”), the principal underwriter, at an annual rate of 0.75% of the average daily net assets of Class C shares.
30 | Wells Fargo Ultra Short-Term Income Fund
Notes to financial statements (unaudited)
In addition, Funds Distributor is entitled to receive thefront-end sales charge from the purchase of Class A shares and a contingent deferred sales charge on the redemption of certain Class A shares. Funds Distributor is also entitled to receive the contingent deferred sales charges from redemptions of Class C shares. For the six months ended February 29, 2020, Funds Distributor received $433 from the sale of Class A shares. No contingent deferred sales charges were incurred by Class A and Class C shares for the six months ended February 29, 2020.
Shareholder servicing fees
The Trust has entered into contracts with one or more shareholder servicing agents, whereby Class A, Class C, and Administrator Class of the Fund are charged a fee at an annual rate of 0.25% of the average daily net assets of each respective class. A portion of these total shareholder servicing fees were paid to affiliates of Wells Fargo.
Interfund transactions
The Fund may purchase or sell portfolio investment securities to certain other Wells Fargo affiliates pursuant to Rule17a-7 under the 1940 Act and under procedures adopted by the Board of Trustees. The procedures have been designed to ensure that these interfund transactions, which do not incur broker commissions, are effected at current market prices.
5. INVESTMENT PORTFOLIO TRANSACTIONS
Purchases and sales of investments, excluding short-term securities, for the six months ended February 29, 2020 were as follows:
| | | | | | |
Purchases at cost | | Sales proceeds |
U.S.
government | | Non-U.S.
government | | U.S.
government | | Non-U.S.
government |
| $1,110,189 | | $429,498,537 | | $9,042 | | $186,470,647 |
6. SECURITIES LENDING TRANSACTIONS
The Fund lends its securities through an unaffiliated securities lending agent and receives collateral in the form of cash or securities with a value at least equal to the value of the securities on loan. The value of the loaned securities is determined at the close of each business day and any increases or decreases in the required collateral are exchanged between the Fund and the counterparty on the next business day. Cash collateral received is invested in the Securities Lending Fund which seeks to provide a positive return compared to the daily Fed Funds Open Rate by investing in high-quality, U.S. dollar-denominated short-term money market instruments and is exempt from registration under Section 3(c)(7) of the 1940 Act. Securities Lending Fund is managed by Funds Management and is subadvised by WellsCap. Funds Management receives an advisory fee starting at 0.05% and declining to 0.01% as the average daily net assets of the Securities Lending Fund increase. All of the fees received by Funds Management are paid to WellsCap for its services as subadviser.
In the event of counterparty default or the failure of a borrower to return a loaned security, the Fund has the right to use the collateral to offset any losses incurred. As of February 29, 2020, the Fund had securities lending transactions with the following counterparties which are subject to offset:
| | | | | | | | |
| | | |
| Counterparty | | Value of
securities
on loan | | Collateral
received1 | | Net
amount | |
| | | |
Bank of America Securities Inc. | | $4,112,278 | | $(4,112,278) | | $ | 0 | |
| | | |
Barclays Capital Inc. | | 1,308,627 | | (1,308,627) | | | 0 | |
| | | |
Citigroup Global Markets Inc. | | 7,104,946 | | (7,104,946) | | | 0 | |
| 1 | Collateral received within this table is limited to the collateral for the net transaction with the counterparty. |
7. DERIVATIVE TRANSACTIONS
During the six months ended February 29, 2020, the Fund entered into futures contracts to help manage duration. The Fund had an average notional amount of $263,159,475 in short futures contracts during the six months ended February 29, 2020.
The fair value, realized gains or losses and change in unrealized gains or losses, if any, on derivative instruments are reflected in the corresponding financial statement captions.
Wells Fargo Ultra Short-Term Income Fund | 31
Notes to financial statements (unaudited)
8. BANK BORROWINGS
The Trust (excluding the money market funds), Wells Fargo Master Trust and Wells Fargo Variable Trust are parties to a $280,000,000 revolving credit agreement whereby the Fund is permitted to use bank borrowings for temporary or emergency purposes, such as to fund shareholder redemption requests. Interest under the credit agreement is charged to the Fund based on a borrowing rate equal to the higher of the Federal Funds rate in effect on that day plus 1.25% or the overnight LIBOR rate in effect on that day plus 1.25%. In addition, an annual commitment fee equal to 0.25% of the unused balance is allocated to each participating fund.
For the six months ended February 29, 2020, there were no borrowings by the Fund under the agreement.
9. INDEMNIFICATION
Under the Trust’s organizational documents, the officers and Trustees have been granted certain indemnification rights against certain liabilities that may arise out of performance of their duties to the Trust. Additionally, in the normal course of business, the Trust may enter into contracts with service providers that contain a variety of indemnification clauses. The Trust’s maximum exposure under these arrangements is dependent on future claims that may be made against the Fund and, therefore, cannot be estimated.
10. NEW ACCOUNTING PRONOUNCEMENTS
In August 2018, FASB issued Accounting Standards Update (“ASU”)No. 2018-13, Fair Value Measurement (Topic 820)Disclosure Framework—Changes to the Disclosure Requirements for Fair Value Measurement. ASU2018-13 updates the disclosure requirements for fair value measurements by modifying or removing certain disclosures and adding certain new disclosures. The amendments are effective for fiscal years, and interim periods within those fiscal years, beginning after December 15, 2019. Early adoption is permitted. Management has adopted the removal and modification of disclosures early, as permitted, and will adopt the additional new disclosures at the effective date.
In March 2017, FASB issued ASUNo. 2017-08,Premium Amortization on Purchased Callable Debt Securities. ASU2017-08 shortens the amortization period for certain callable debt securities held at a premium and requires the premium to be amortized to the earliest call date. The amendments do not require an accounting change for securities held at a discount and discounts will continue to be accreted to the maturity date of the security. ASU2017-08 is effective for fiscal years beginning after December 15, 2018 and for interim periods within those fiscal years. During the current reporting period, management of the Fund adopted the change in accounting policy which did not have a material impact to the Fund’s financial statements.
11. SUBSEQUENT EVENT
On March 11, 2020, the World Health Organization announced that it had made the assessment that coronavirus disease 2019(“COVID-19”) is a pandemic. The impacts ofCOVID-19 is adversely affecting the entire global economy, individual companies and investment products, and the market in general. There is significant uncertainty around the extent and duration of business disruptions related toCOVID-19 and the impact may be short term or may last for an extended period of time. The risk of further spreading ofCOVID-19 has led to significant uncertainty and volatility in the financial markets and the value of the Fund and the securities in which the Fund invests have generally been adversely affected by impacts caused byCOVID-19.
32 | Wells Fargo Ultra Short-Term Income Fund
Other information (unaudited)
PROXY VOTING INFORMATION
A description of the policies and procedures used to determine how to vote proxies relating to portfolio securities is available, upon request, by calling1-800-222-8222, visiting our website atwfam.com, or visiting the SEC website at sec.gov. Information regarding how the proxies related to portfolio securities were voted during the most recent 12-month period ended June 30 is available on the website atwfam.comor by visiting the SEC website at sec.gov.
QUARTERLY PORTFOLIO HOLDINGS INFORMATION
The Fund files its complete schedule of portfolio holdings with the SEC for the first and third quarters of each fiscal year as an exhibit to its reports on Form N-PORT. Shareholders may view the filed Form N-PORT by visiting the SEC website at sec.gov.
Wells Fargo Ultra Short-Term Income Fund | 33
Other information (unaudited)
BOARD OF TRUSTEES AND OFFICERS
Each of the Trustees and Officers1 listed in the table below acts in identical capacities for each fund in the Wells Fargo family of funds, which consists of 146 mutual funds comprising the Wells Fargo Funds Trust, Wells Fargo Variable Trust, Wells Fargo Master Trust and fourclosed-end funds (collectively the “Fund Complex”). This table should be read in conjunction with the Prospectus and the Statement of Additional Information2. The mailing address of each Trustee and Officer is 525 Market Street, 12th Floor, San Francisco, CA 94105. Each Trustee and Officer serves an indefinite term, however, each Trustee serves such term until reaching the mandatory retirement age established by the Trustees.
Independent Trustees
| | | | | | |
Name and
year of birth | | Position held and
length of service* | | Principal occupations during past five years or longer | | Current other
public company or
investment
company
directorships |
| | | |
| William R. Ebsworth (Born 1957) | | Trustee, since 2015 | | Retired. From 1984 to 2013, equities analyst, portfolio manager, research director and chief investment officer at Fidelity Management and Research Company in Boston, Tokyo, and Hong Kong, and retired in 2013 as Chief Investment Officer of Fidelity Strategic Advisers, Inc. where he led a team of investment professionals managing client assets. Prior thereto, Board member of Hong Kong Securities Clearing Co., Hong Kong Options Clearing Corp., the Thailand International Fund, Ltd., Fidelity Investments Life Insurance Company, and Empire Fidelity Investments Life Insurance Company. Audit Committee Chair and Investment Committee Chair of the Vincent Memorial Hospital Endowment(non-profit organization). Mr. Ebsworth is a CFA® charterholder. | | N/A |
| | | |
| Jane A. Freeman (Born 1953) | | Trustee, since 2015; Chair Liaison, since 2018 | | Retired. From 2012 to 2014 and 1999 to 2008, Chief Financial Officer of Scientific Learning Corporation. From 2008 to 2012, Ms. Freeman provided consulting services related to strategic business projects. Prior to 1999, Portfolio Manager at Rockefeller & Co. and Scudder, Stevens & Clark. Board member of the Harding Loevner Funds from 1996 to 2014, serving as both Lead Independent Director and chair of the Audit Committee. Board member of the Russell Exchange Traded Funds Trust from 2011 to 2012 and the chair of the Audit Committee. Ms. Freeman is a Board Member of The Ruth Bancroft Garden(non-profit organization). She is also an inactive Chartered Financial Analyst. | | N/A |
| | | |
| Isaiah Harris, Jr. (Born 1952) | | Trustee, since 2009; Audit Committee Chairman, since 2019 | | Retired. Chairman of the Board of CIGNA Corporation since 2009, and Director since 2005. From 2003 to 2011, Director of Deluxe Corporation. Prior thereto, President and CEO of BellSouth Advertising and Publishing Corp. from 2005 to 2007, President and CEO of BellSouth Enterprises from 2004 to 2005 and President of BellSouth Consumer Services from 2000 to 2003. Emeritus member of the Iowa State University Foundation Board of Governors. Emeritus Member of the Advisory Board of Iowa State University School of Business. Advisory Board Member, Palm Harbor Academy (private school). Advisory Board Member, Child Evangelism Fellowship(non-profit). Mr. Harris is a certified public accountant (inactive status). | | CIGNA Corporation |
| | | |
| Judith M. Johnson (Born 1949) | | Trustee, since 2008; Audit Committee Chairman, from 2009 to 2018 | | Retired. Prior thereto, Chief Executive Officer and Chief Investment Officer of Minneapolis Employees Retirement Fund from 1996 to 2008. Ms. Johnson is an attorney, certified public accountant and a certified managerial accountant. | | N/A |
34 | Wells Fargo Ultra Short-Term Income Fund
Other information (unaudited)
| | | | | | |
Name and
year of birth | | Position held and
length of service* | | Principal occupations during past five years or longer | | Current other
public company or
investment
company
directorships |
| | | |
| David F. Larcker (Born 1950) | | Trustee, since 2009 | | James Irvin Miller Professor of Accounting at the Graduate School of Business, Stanford University, Director of the Corporate Governance Research Initiative and Senior Faculty of The Rock Center for Corporate Governance since 2006. From 2005 to 2008, Professor of Accounting at the Graduate School of Business, Stanford University. Prior thereto, Ernst & Young Professor of Accounting at The Wharton School, University of Pennsylvania from 1985 to 2005. | | N/A |
| | | |
| Olivia S. Mitchell (Born 1953) | | Trustee, since 2006; Nominating and Governance Committee Chair, since 2018 | | International Foundation of Employee Benefit Plans Professor, Wharton School of the University of Pennsylvania since 1993. Director of Wharton’s Pension Research Council and Boettner Center on Pensions & Retirement Research, and Research Associate at the National Bureau of Economic Research. Previously, Cornell University Professor from 1978 to 1993. | | N/A |
| | | |
| Timothy J. Penny (Born 1951) | | Trustee, since 1996; Chairman, since 2018 | | President and Chief Executive Officer of Southern Minnesota Initiative Foundation, anon-profit organization, since 2007. Member of the Board of Trustees of NorthStar Education Finance, Inc., anon-profit organization, since 2007. | | N/A |
| | | |
| James G. Polisson (Born 1959) | | Trustee, since 2018 | | Retired. Chief Marketing Officer, Source (ETF) UK Services, Ltd, from 2015 to 2017. From 2012 to 2015, Principal of The Polisson Group, LLC, a management consulting, corporate advisory and principal investing company. Chief Executive Officer and Managing Director at Russell Investments, Global Exchange Traded Funds from 2010 to 2012. Managing Director of Barclays Global Investors from 1998 to 2010 and Global Chief Marketing Officer for iShares and Barclays Global Investors from 2000 to 2010. Trustee of the San Francisco Mechanics’ Institute, anon-profit organization, from 2013 to 2015. Board member of the Russell Exchange Traded Fund Trust from 2011 to 2012. Director of Barclays Global Investors Holdings Deutschland GmbH from 2006 to 2009. Mr. Polisson is an attorney and has a retired status with the Massachusetts and District of Columbia Bar Associations. | | N/A |
| | | |
| Pamela Wheelock3 (Born 1959) | | Trustee, since January 2020; previously Trustee from January 2018 to July 2019 | | Board member of the Destination Medical Center Economic Development Agency, Rochester, Minnesota since 2019. Acting Commissioner, Minnesota Department of Human Services, July 2019 through September 2019. Human Services Manager (part-time), Minnesota Department of Human Services, October 2019 through December 2019. Chief Operating Officer, Twin Cities Habitat for Humanity from 2017 to 2019. Vice President of University Services, University of Minnesota from 2012 to 2016. Prior thereto, on the Board of Directors, Governance Committee and Finance Committee for the Minnesota Philanthropy Partners (Saint Paul Foundation) from 2012 to 2018, Interim Chief Executive Officer of Blue Cross Blue Shield of Minnesota from 2011 to 2012, Chairman of the Board from 2009 to 2012 and Board Director from 2003 to 2015. Vice President, Leadership and Community Engagement, Bush Foundation, Saint Paul, Minnesota (a private foundation) from 2009 to 2011. Executive Vice President and Chief Financial Officer, Minnesota Sports and Entertainment from 2004 to 2009 and Senior Vice President from 2002 to 2004. Executive Vice President of the Minnesota Wild Foundation from 2004 to 2008. Commissioner of Finance, State of Minnesota, from 1999 to 2002. Currently Board Chair of the Minnesota Wild Foundation since 2010. | | N/A |
| * | Length of service dates reflect the Trustee’s commencement of service with the Trust’s predecessor entities, where applicable. |
Wells Fargo Ultra Short-Term Income Fund | 35
Other information (unaudited)
Officers
| | | | |
Name and
year of birth | | Position held and
length of service | | Principal occupations during past five years or longer |
| | |
| Andrew Owen (Born 1960) | | President, since 2017 | | Executive Vice President of Wells Fargo & Company and Head of Affiliated Managers, Wells Fargo Asset Management, since 2014. In addition, Mr. Owen is currently President, Chief Executive Officer and Director of Wells Fargo Funds Management, LLC since 2017. Prior thereto, Executive Vice President responsible for marketing, investments and product development for Wells Fargo Funds Management, LLC, from 2009 to 2014. |
| | |
| Nancy Wiser1 (Born 1967) | | Treasurer, since 2012 | | Executive Vice President of Wells Fargo Funds Management, LLC since 2011. Chief Operating Officer and Chief Compliance Officer at LightBox Capital Management LLC, from 2008 to 2011. |
| | |
| Michelle Rhee (Born 1966) | | Chief Legal Officer, since 2019 | | Secretary of Wells Fargo Funds Management, LLC, Chief Legal Counsel of Wells Fargo Asset Management and Assistant General Counsel of Wells Fargo Bank, N.A. since 2018. Associate General Counsel and Managing Director of Bank of America Corporation from 2004 to 2018. |
| | |
| Catherine Kennedy (Born 1969) | | Secretary, since 2019 | | Vice President of Wells Fargo Funds Management, LLC and Senior Counsel of the Wells Fargo Legal Department since 2010. Vice President and Senior Counsel of Evergreen Investment Management Company, LLC from 1998 to 2010. |
| | |
| Michael H. Whitaker(Born 1967) | | Chief Compliance Officer, since 2016 | | Chief Compliance Officer of Wells Fargo Asset Management since 2016. Senior Vice President and Chief Compliance Officer for Fidelity Investments from 2007 to 2016. |
| | |
| David Berardi (Born 1975) | | Assistant Treasurer, since 2009 | | Vice President of Wells Fargo Funds Management, LLC since 2009. Vice President of Evergreen Investment Management Company, LLC from 2008 to 2010. Manager of Fund Reporting and Control for Evergreen Investment Management Company, LLC from 2004 to 2010. |
| | |
| Jeremy DePalma1 (Born 1974) | | Assistant Treasurer, since 2009 | | Senior Vice President of Wells Fargo Funds Management, LLC since 2009. Senior Vice President of Evergreen Investment Management Company, LLC from 2008 to 2010 and head of the Fund Reporting and Control Team within Fund Administration from 2005 to 2010. |
| 1 | Nancy Wiser acts as Treasurer of 64 funds in the Fund Complex. Jeremy DePalma acts as Treasurer of 82 funds and Assistant Treasurer of 64 funds in the Fund Complex. |
| 2 | The Statement of Additional Information includes additional information about the Trustees and is available, without charge, upon request, by calling1-800-222-8222 or by visiting the website atwfam.com. |
| 3 | Pamela Wheelock wasre-appointed to the Board effective January 1, 2020. |
36 | Wells Fargo Ultra Short-Term Income Fund
Appendix I (unaudited)
Effective on or about May 1, 2020, if you purchase Fund shares through a Janney Montgomery Scott LLC (“Janney”) brokerage account, you will be eligible for the following load waivers(front-end sales charge waivers and contingent deferred sales charge (“CDSC”), orback-end sales charge, waivers) and discounts, which may differ from those disclosed elsewhere in the Fund’s Prospectus or SAI.
|
|
| Front-end sales charge* waivers on Class A shares available at Janney |
|
| Shares purchased through reinvestment of capital gains distributions and dividend reinvestment when purchasing shares of the same fund (but not any other fund within the fund family). |
|
| Shares purchased by employees and registered representatives of Janney or its affiliates and their family members as designated by Janney. |
|
| Shares purchased from the proceeds of redemptions within the same fund family, provided (1) the repurchase occurs within ninety (90) days following the redemption, (2) the redemption and purchase occur in the same account, and (3) redeemed shares were subject to afront-end or deferred sales load (i.e., right of reinstatement). |
|
| Employer-sponsored retirement plans (e.g., 401(k) plans, 457 plans, employer-sponsored 403(b) plans, profit sharing and money purchase pension plans and defined benefit plans). For purposes of this provision, employer-sponsored retirement plans do not include SEP IRAs, Simple IRAs,SAR-SEPs or Keogh plans. |
|
| Shares acquired through a right of reinstatement. |
|
| Class C shares that are no longer subject to a contingent deferred sales charge and are converted to Class A shares of the same fund pursuant to Janney’s policies and procedures. |
|
| CDSC waivers on Class A and Class C shares available at Janney |
|
| Shares sold upon the death or disability of the shareholder. |
|
| Shares sold as part of a systematic withdrawal plan as described in the Fund’s Prospectus. |
|
| Shares purchased in connection with a return of excess contributions from an IRA account. |
|
| Shares sold as part of a required minimum distribution for IRA and retirement accounts if the redemption is taken in or after the year the shareholder reaches qualified age based on applicable IRS regulations. |
|
| Shares sold to pay Janney fees but only if the transaction is initiated by Janney. |
|
| Shares acquired through a right of reinstatement. |
|
| Shares exchanged into the same share class of a different fund. |
|
| Front-end sales charge* discounts available at Janney; breakpoints, rights of accumulation and/or letters of intent |
|
| Breakpoints as described in the Fund’s Prospectus. |
|
| Rights of accumulation (“ROA”), which entitle shareholders to breakpoint discounts, will be automatically calculated based on the aggregated holding of fund family assets held by accounts within the purchaser’s household at Janney. Eligible fund family assets not held at Janney may be included in the ROA calculation only if the shareholder notifies his or her financial advisor about such assets. |
|
| Letters of intent which allow for breakpoint discounts based on anticipated purchases within a fund family, over a13-month time period. Eligible fund family assets not held at Janney Montgomery Scott may be included in the calculation of letters of intent only if the shareholder notifies his or her financial advisor about such assets. |
| * | Also referred to as an “initial sales charge.” |
Wells Fargo Ultra Short-Term Income Fund | 37
Appendix II (unaudited)
Effective on or after May 1, 2020, clients of Edward Jones (also referred to as “shareholders”) purchasing Fund shares on the Edward Jones commission andfee-based platforms are eligible only for the following sales charge discounts (also referred to as “breakpoints”) and waivers, which can differ from breakpoints and waivers described elsewhere in this Prospectus or SAI or through another broker-dealer. In all instances, it is the shareholder’s responsibility to inform Edward Jones at the time of purchase of any relationship, holdings of Wells Fargo Funds or other facts qualifying the purchaser for breakpoints or waivers. Edward Jones can ask for documentation of such circumstance.
|
| Breakpoints available at Edward Jones |
|
| Rights of Accumulation (ROA) |
|
The applicable sales charge on a purchase of Class A shares is determined by taking into account all share classes (except any money market funds and retirement plan share classes) of Wells Fargo Funds held by the shareholder or in an account grouped by Edward Jones with other accounts for the purpose of providing certain pricing considerations (“pricing groups”). This includes all share classes held on the Edward Jones platform and/or held on another platform. The inclusion of eligible fund family assets in the rights of accumulation calculation is dependent on the shareholder notifying his or her financial advisor of such assets at the time of calculation. |
|
ROA is determined by calculating the higher of cost or market value (current shares x NAV). |
|
| Letter of Intent (LOI) |
|
Through a LOI, shareholders can receive the sales charge and breakpoint discounts for purchases shareholders intend to makeover a13-month period from the date Edward Jones receives the LOI. The LOI is determined by calculating the higher of cost or market value of qualifying holdings at LOI initiation in combination with the value that the shareholder intends to buy over a13-month period to calculate thefront-end sales charge and any breakpoint discounts. Each purchase the shareholder makes during that13-month period will receive the sales charge and breakpoint discount that applies to the total amount. The inclusion of eligible fund family assets in the LOI calculation is dependent on the shareholder notifying his or her financial advisor of such assets at the time of calculation. Purchases made before the LOI is received by Edward Jones are not covered under the LOI and will not reduce the sales charge previously paid. Sales charges will be adjusted if LOI is not met. |
| Sales charges are waived for the following shareholders and in the following situations at Edward Jones: |
● Associates of Edward Jones and its affiliates and their family members who are in the same pricing group (as determined by Edward Jones under its policies and procedures) as the associate. This waiver will continue for the remainder of the associate’s life if the associate retires from Edward Jones in good-standing. |
● Shares purchased in an Edward Jonesfee-based program. |
● Shares purchased through reinvestment of capital gains distributions and dividend reinvestment. |
● Shares purchased from the proceeds of redeemed shares of the same fund family so long as the following conditions are met: 1) the proceeds are from the sale of shares within 60 days of the purchase, and 2) the sale and purchase are made in the same share class and the same account or the purchase is made in an individual retirement account with proceeds from liquidations in anon-retirement account. |
● Shares exchanged into Class A shares from another share class so long as the exchange is into the same fund and was initiated at the discretion of Edward Jones. Edward Jones is responsible for any remaining CDSC due to the fund company, if applicable. Any future purchases are subject to the applicable sales charge as disclosed in the prospectus. |
● Exchanges from Class C shares to Class A shares of the same fund, generally, in the 84th month following the anniversary of the purchase date or earlier at the discretion of Edward Jones. |
If the shareholder purchases shares that are subject to a CDSC and those shares are redeemed before the CDSC is expired, the shareholder is
responsible to pay the CDSC except in the following conditions available at Edward Jones: |
● The death or disability of the shareholder. |
● Systematic withdrawals with up to 10% per year of the account value. |
● Return of excess contributions from an Individual Retirement Account (IRA). |
● Shares sold as part of a required minimum distribution for IRA and retirement accounts if the redemption is taken in or after the year the shareholder reaches qualified age based on applicable IRS regulation. |
● Shares sold to pay Edward Jones fees or costs in such cases where the transaction is initiated by Edward Jones. |
● Shares exchanged in an Edward Jonesfee-based program |
● Shares acquired through NAV reinstatement |
38 | Wells Fargo Ultra Short-Term Income Fund
Appendix II (unaudited)
|
| Other Important Information for accounts at Edward Jones: |
Minimum Purchase Amounts ● $250 initial purchase minimum ● $50 subsequent purchase minimum |
Minimum Balances Edward Jones has the right to redeem at its discretion fund holdings with a balance of $250 or less. The following are examples of accounts that are not included in this policy: ● Afee-based account held on an Edward Jones platform ● A 529 account held on an Edward Jones platform ● An account with an active systematic investment plan or letter of intent (LOI) |
Changing Share Classes At any time it deems necessary, Edward Jones has the authority to exchange at NAV a shareholder’s holdings in a fund to Class A shares. |
Wells Fargo Ultra Short-Term Income Fund | 39
This page is intentionally left blank.

For more information
More information about Wells Fargo Funds is available free upon request. To obtain literature, please write, visit the Fund’s website, or call:
Wells Fargo Funds
P.O. Box 219967
Kansas City, MO 64121-9967
Website:wfam.com
Individual investors:1-800-222-8222
Retail investment professionals:1-888-877-9275
Institutional investment professionals:1-866-765-0778

This report and the financial statements contained herein are submitted for the general information of the shareholders of the Fund. If this report is used for promotional purposes, distribution of the report must be accompanied or preceded by a current prospectus. Before investing, please consider the investment objectives, risks, charges, and expenses of the investment. For a current prospectus and, if available, a summary prospectus, containing this information, call1-800-222-8222 or visit the Fund’s website atwfam.com. Read the prospectus carefully before you invest or send money.
Wells Fargo Asset Management (WFAM) is the trade name for certain investment advisory/management firms owned by Wells Fargo & Company. These firms include but are not limited to Wells Capital Management Incorporated and Wells Fargo Funds Management, LLC. Certain products managed by WFAM entities are distributed by Wells Fargo Funds Distributor, LLC (a broker-dealer and Member FINRA).
This material is for general informational and educational purposes only and is NOT intended to provide investment advice or a recommendation of any kind—including a recommendation for any specific investment, strategy, or plan.
INVESTMENT PRODUCTS: NOT FDIC INSURED ◾ NO BANK GUARANTEE ◾ MAY LOSE VALUE
© 2020 Wells Fargo & Company. All rights reserved
PAR-0320-04746 04-20
SA223/SAR223 02-20
Semi-Annual Report
February 29, 2020
Wells Fargo
Adjustable Rate Government Fund
Beginning on January 1, 2021, as permitted by new regulations adopted by the Securities and Exchange Commission, paper copies of the Wells Fargo Funds’ annual and semi-annual shareholder reports issued after this date will no longer be sent by mail, unless you specifically request paper copies of the reports. Instead, the reports will be made available on the Funds’ website, and you will be notified by mail each time a report is posted and provided with a website address to access the report.
If you already elected to receive shareholder reports electronically, you will not be affected by this change and you need not take any action. You may elect to receive shareholder reports and other communications from the Fund electronically at any time by contacting your financial intermediary (such as a broker-dealer or bank) or, if you are a direct investor, by calling1-800-222-8222 or by enrolling at wellsfargo.com/advantagedelivery.
You may elect to receive all future reports in paper free of charge. If you invest through a financial intermediary, you can contact your financial intermediary to request that you continue to receive paper copies of your shareholder reports; if you invest directly with the Fund, you can call 1-800-222-8222. Your election to receive reports in paper will apply to all Wells Fargo Funds held in your account with your financial intermediary or, if you are a direct investor, to all Wells Fargo Funds that you hold.
|
|
|
Reduce clutter. Save trees. |
Sign up for electronic delivery of prospectuses and shareholder reports atwellsfargo.com/advantagedelivery |
The views expressed and any forward-looking statements are as of February 29, 2020, unless otherwise noted, and are those of the Fund managers and/or Wells Fargo Asset Management. Discussions of individual securities, or the markets generally, or any Wells Fargo Fund are not intended as individual recommendations. Future events or results may vary significantly from those expressed in any forward-looking statements. The views expressed are subject to change at any time in response to changing circumstances in the market. Wells Fargo Asset Management and the Fund disclaim any obligation to publicly update or revise any views expressed or forward-looking statements.
INVESTMENT PRODUCTS: NOT FDIC INSURED ◾ NO BANK GUARANTEE ◾ MAY LOSE VALUE
Wells Fargo Adjustable Rate Government Fund | 1
Letter to shareholders (unaudited)

Andrew Owen
President
Wells Fargo Funds
“The fourth quarter started on a strong note, with U.S.-China trade tensions relaxing in October along with renewed optimism for a U.K. Brexit deal and positive macroeconomic data.”
Dear Shareholder:
We are pleased to offer you this semi-annual report for the Wells Fargo Adjustable Rate Government Fund for thesix-month period that ended February 29, 2020. As market volatility increased, returns for the period were more restrained after strong results in previous recent periods. However, supportive central banks addressed concerns over slowing global economic growth and international trade tensions.
Fixed-income and equity investors had mixed semi-annual returns. For the period, U.S. stocks, based on the S&P 500 Index,1 gained 1.92% and international stocks, as measured by the MSCI ACWI ex USA Index (Net),2 returned 0.13%. The MSCI EM Index (Net)3 gained 2.93%. For bond investors, the Bloomberg Barclays U.S. Aggregate Bond Index4 added 3.39%, the Bloomberg Barclays Global Aggregateex-USD Index5 returned-0.21%, the Bloomberg Barclays Municipal Bond Index6 gained 3.04%, and the ICE BofA U.S. High Yield Index7 added 1.34%.
The period began with uncertainty, leading to central bank support.
In September, as the period began, the U.S. Federal Reserve (Fed) cut interest rates a second time in the third quarter. U.S. manufacturing data disappointed investors. The U.S. Congress announced it would pursue an impeachment investigation of President Trump. Meanwhile, the Brexit impasse showed no signs of resolution. Officials in China warned it would be difficult to reach the country’s annual economic growth goals considering the weight of tariffs and trade restrictions. Although the S&P 500 Index finished the third quarter with the bestyear-to-date returns in more than 20 years, concerns about future returns remained.
The fourth quarter started on a strong note, with U.S.-China trade tensions relaxing in October along with renewed optimism for a U.K. Brexit deal and positive macroeconomic data. The initial estimate of U.S. third-quarter gross domestic product growth was a resilient 1.9% annualized rate, while the U.S. unemployment rate fell to a50-year low of 3.5% in September. However, despite resilience among U.S. consumers, business confidence declined while manufacturing activity contracted. Concerned with a potential economic slowdown, the Fed lowered interest rates another quarter point in late October—its third rate cut in four months. This helped push the S&P 500 Index to anall-time high, while emerging market equities rallied and global bonds declined overall, reflecting a broad pickup in risk appetite.
| 1 | The S&P 500 Index consists of 500 stocks chosen for market size, liquidity, and industry group representation. It is a market-value-weighted index with each stock’s weight in the index proportionate to its market value. You cannot invest directly in an index. |
| 2 | The Morgan Stanley Capital International (MSCI) All Country World Index (ACWI) ex USA Index (Net) is a free-float-adjusted market-capitalization-weighted index that is designed to measure the equity market performance of developed markets, excluding the United States. Source: MSCI. MSCI makes no express or implied warranties or representations and shall have no liability whatsoever with respect to any MSCI data contained herein. The MSCI data may not be further redistributed or used as a basis for other indices or any securities or financial products. This report is not approved, reviewed, or produced by MSCI. You cannot invest directly in an index. |
| 3 | The MSCI Emerging Markets (EM) Index (Net) is a free-float-adjusted market-capitalization-weighted index that is designed to measure equity market performance of emerging markets. You cannot invest directly in an index. |
| 4 | The Bloomberg Barclays U.S. Aggregate Bond Index is a broad-based benchmark that measures the investment-grade, U.S. dollar-denominated, fixed-rate taxable bond market, including Treasuries, government-related and corporate securities, mortgage-backed securities (agency fixed-rate and hybrid adjustable-rate mortgage pass-throughs), asset-backed securities, and commercial mortgage-backed securities. You cannot invest directly in an index. |
| 5 | The Bloomberg Barclays Global Aggregateex-USD Index is an unmanaged index that provides a broad-based measure of the global investment-grade fixed-income markets excluding the U.S. dollar-denominated debt market. You cannot invest directly in an index. |
| 6 | The Bloomberg Barclays Municipal Bond Index is an unmanaged index composed of long-termtax-exempt bonds with a minimum credit rating of Baa. You cannot invest directly in an index. |
| 7 | The ICE BofA U.S. High Yield Index is a market-capitalization-weighted index of domestic and Yankee high-yield bonds. The index tracks the performance of high-yield securities traded in the U.S. bond market. You cannot invest directly in an index. Copyright 2020. ICE Data Indices, LLC. All rights reserved. |
2 | Wells Fargo Adjustable Rate Government Fund
Letter to shareholders (unaudited)
Equity markets continued to rally in November despite ongoing geopolitical risks. Hopes for a U.S.-China trade deal buoyed investor confidence. U.S. business sentiment improved slightly, and manufacturing and services activity picked up. With that positive backdrop, developed market equities outpaced those in emerging markets, and U.S. stocks, as reflected by the S&P 500 Index, outperformednon-U.S. stocks overall. While consumer confidence and purchasing manager activity rose in the eurozone, China reported weakening manufacturing and consumer data. Bond yields rose marginally, leading to slightly negative returns for global government and investment-grade corporate bonds.
Financial markets ended 2019 with a boost from the U.S. and China accord on a Phase One trade deal. That, along with the landslide win by thepro-Brexit U.K. Conservative Party in a national election and ongoing central bank support, gave investors greater confidence. U.S. economic indicators were generally positive, with the exception of manufacturing activity and business confidence. Consumer confidence was resilient, fed by a robust labor market, tame inflation, and lower interest rates, which boosted housing affordability and stimulated homebuyer activity. The impeachment of U.S. President Donald Trump had little impact on markets. Meanwhile, slowing Chinese economic activity, partly attributable to the trade war, led to further government stimulus atyear-end through lower reserve ratios, allowing banks to lend more money.
Theyear-end rally continued in early January 2020. However, capital market volatility picked up sharply in late January on concerns over the unknown impact of the novel coronavirus(COVID-19) on the global economy and stock markets. With sentiment somewhat souring, perceived safe havens did well in January. The U.S. dollar and Japanese yen both rose and government bonds outperformed equities. While the S&P 500 Index held its ground, emerging market equities tumbled, including those in Asia that are most exposed to viruses—physical or economic—originating in China.
In February, the coronavirus became the major market focus. Fears of the virus’s impact on global growth led to expectations of increased global central bank monetary policy support. That led the10-year Treasury yield to fall to anall-time low of 1.1% by the end of the month. Although equity markets initially shrugged off concerns about the outbreak, focusing instead on strong fourth-quarter earnings and improving business confidence in January, market sentiment turned sharply lower towardmonth-end and the S&P 500 Index lost 8.2% for the month. Oil prices tumbled as Russia and the Organization of the Petroleum Exporting Countries compounded a major decline in oil demand with a brutal price war, partly aimed at dissuading further U.S. shale production. As a result, the price of West Texas Intermediate crude oil fell 13% in February and 27% for 2020 year to date.
Don’t let short-term uncertainty derail long-term investment goals.
Periods of investment uncertainty can present challenges, but experience has taught us that maintaining long-term investment goals can be an effective way to plan for the future. Although diversification cannot guarantee an investment profit or prevent losses, we believe it can be an effective way to manage investment risk and potentially smooth out overall portfolio performance. We encourage investors to know their investments and to understand that appropriate levels of risk-taking may unlock opportunities.
Thank you for choosing to invest with Wells Fargo Funds. We appreciate your confidence in us and remain committed to helping you meet your financial needs.
Sincerely,

Andrew Owen
President
Wells Fargo Funds
“Capital market volatility picked up sharply in late January on concerns over the unknown impact of the novel coronavirus(COVID-19) on the global economy and stock markets.”
|
|
|
For further information about your Fund, contact your investment professional, visit our website at wfam.com, or call us directly at1-800-222-8222. |
Wells Fargo Adjustable Rate Government Fund | 3
Performance highlights (unaudited)
Investment objective
The Fund seeks current income consistent with capital preservation.
Manager
Wells Fargo Funds Management, LLC
Subadviser
Wells Capital Management Incorporated
Portfolio managers
Christopher Y. Kauffman, CFA®‡
Michal Stanczyk
Average annual total returns (%) as of February 29, 20201
| | | | | | | | | | | | | | | | | | | | | | | | | | | | | | | | | | |
| | | | |
| | | | | Including sales charge | | | Excluding sales charge | | | Expense ratios2 (%) | |
| | | | | | | | | |
| | | Inception date | | 1 year | | | 5 year | | | 10 year | | | 1 year | | | 5 year | | | 10 year | | | Gross | | | Net3 | |
| | | | | | | | | | |
| Class A (ESAAX) | | 6-30-2000 | | | 0.99 | | | | 0.62 | | | | 1.02 | | | | 3.03 | | | | 1.04 | | | | 1.22 | | | | 0.87 | | | | 0.74 | |
| | | | | | | | | | |
| Class C (ESACX) | | 6-30-2000 | | | 1.26 | | | | 0.26 | | | | 0.45 | | | | 2.26 | | | | 0.26 | | | | 0.45 | | | | 1.62 | | | | 1.49 | |
| | | | | | | | | | |
| Administrator Class (ESADX)4 | | 7-30-2010 | | | – | | | | – | | | | – | | | | 3.17 | | | | 1.18 | | | | 1.36 | | | | 0.81 | | | | 0.60 | |
| | | | | | | | | | |
| Institutional Class (EKIZX) | | 10-1-1991 | | | – | | | | – | | | | – | | | | 3.32 | | | | 1.32 | | | | 1.49 | | | | 0.54 | | | | 0.46 | |
| | | | | | | | | | |
| Bloomberg Barclays6-Month Treasury Bill Index5 | | – | | | – | | | | – | | | | – | | | | 2.55 | | | | 1.35 | | | | 0.78 | | | | – | | | | – | |
Figures quoted represent past performance, which is no guarantee of future results, and do not reflect taxes that a shareholder may pay on an investment in a fund. Investment return and principal value of an investment will fluctuate so that an investor’s shares, when redeemed, may be worth more or less than their original cost. Performance shown without sales charges would be lower if sales charges were reflected. Current performance may be lower or higher than the performance data quoted, which assumes the reinvestment of dividends and capital gains. Currentmonth-end performance is available on the Fund’s website,wfam.com.
Index returns do not include transaction costs associated with buying and selling securities, any mutual fund fees or expenses, or any taxes. It is not possible to invest directly in an index.
For Class A shares, the maximumfront-end sales charge is 2.00%. For Class C shares, the maximum contingent deferred sales charge is 1.00%. Performance including a contingent deferred sales charge assumes the sales charge for the corresponding time period. Administrator Class and Institutional Class shares are sold without afront-end sales charge or contingent deferred sales charge.
Bond values fluctuate in response to the financial condition of individual issuers, general market and economic conditions, and changes in interest rates. Changes in market conditions and government policies may lead to periods of heightened volatility in the bond market and reduced liquidity for certain bonds held by the Fund. In general, when interest rates rise, bond values fall and investors may lose principal value. Interest rate changes and their impact on the Fund and its share price can be sudden and unpredictable. The use of derivatives may reduce returns and/or increase volatility. Securities issued by U.S. government agencies or government-sponsored entities may not be guaranteed by the U.S. Treasury. Certain investment strategies tend to increase the total risk of an investment (relative to the broader market). The Fund is exposed to mortgage- and asset-backed securities risk. The U.S. government guarantee applies to certain underlying securities and not to shares of the Fund. Consult the Fund’s prospectus for additional information on these and other risks.
Please see footnotes on page 5.
4 | Wells Fargo Adjustable Rate Government Fund
Performance highlights (unaudited)
| | | | |
|
| Ten largest holdings (%) as of February 29, 20206 | |
| | |
FNMA, Series2002-66 Class A3, 4.47%,4-25-2042 | | | 2.15 | |
| | |
FNMA, Series2004-W15 Class 3A, 2.91%,6-25-2044 | | | 1.62 | |
| | |
GNMA, Series2017-H11 Class FE, 4.24%,5-20-2067 | | | 1.56 | |
| | |
FNMA, Series2006-W01 Class 3A, 3.69%,10-25-2045 | | | 1.24 | |
| | |
FHLMC, SeriesT-67 Class 1A1C, 4.59%,3-25-2036 | | | 1.15 | |
| | |
FNMA, Series2001-T12 Class A4, 3.70%,8-25-2041 | | | 1.11 | |
| | |
FHLMC, SeriesT-67 Class 2A1C, 3.13%,3-25-2036 | | | 1.09 | |
| | |
FHLMC, Series 2682 Class FK, 4.36%,1-15-2033 | | | 1.04 | |
| | |
FNMA, Series2004-W12 Class 2A, 2.01%,6-25-2044 | | | 1.04 | |
| | |
FHLMC, Series 4842 Class FA, 4.35%,11-15-2048 | | | 1.02 | |
|
|
| Portfolio allocation as of February 29, 20207 |
|
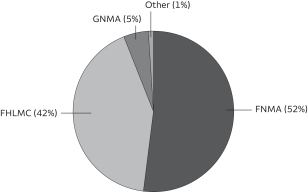 |
| ‡ | CFA®and Chartered Financial Analyst® are trademarks owned by CFA Institute. |
| 1 | Historical performance shown prior to July 12, 2010, is based on the performance of the Fund’s predecessor, Evergreen Adjustable Rate Fund. |
| 2 | Reflects the expense ratios as stated in the most recent prospectuses. The expense ratios shown are subject to change and may differ from the annualized expense ratios shown in the financial highlights of this report. |
| 3 | The manager has contractually committed through December 31, 2020, to waive fees and/or reimburse expenses to the extent necessary to cap total annual fund operating expenses after fee waivers at 0.74% for Class A, 1.49% for Class C, 0.60% for Administrator Class, and 0.46% for Institutional Class. Brokerage commissions, stamp duty fees, interest, taxes, acquired fund fees and expenses (if any), and extraordinary expenses are excluded from the expense cap. Prior to or after the commitment expiration date, the cap may be increased or the commitment to maintain the cap may be terminated only with the approval of the Board of Trustees. Without this cap, the Fund’s returns would have been lower. The expense ratio paid by an investor is the net expense ratio (the total annual fund operating expenses after fee waivers) as stated in the prospectuses. |
| 4 | Historical performance shown for the Administrator Class shares prior to their inception reflects the performance of the Institutional Class shares, adjusted to reflect the higher expenses applicable to the Administrator Class shares. |
| 5 | The Bloomberg Barclays6-Month Treasury Bill Index tracks the performance and attributes of recently issued6-Month U.S. Treasury bills. The index follows Bloomberg Barclays’ monthly rebalancing conventions. You cannot invest directly in an index. |
| 6 | The ten largest holdings, excluding cash, cash equivalents and any money market funds, are calculated based on the value of the investments divided by total net assets of the Fund. Holdings are subject to change and may have changed since the date specified. |
| 7 | Amounts are calculated based on the total long-term investments of the Fund. These amounts are subject to change and may have changed since the date specified. |
Wells Fargo Adjustable Rate Government Fund | 5
Fund expenses (unaudited)
As a shareholder of the Fund, you incur two types of costs: (1) transaction costs, including sales charges (loads) on purchase payments and contingent deferred sales charges (if any) on redemptions and (2) ongoing costs, including management fees, distribution(12b-1) and/or shareholder servicing fees, and other Fund expenses. This example is intended to help you understand your ongoing costs (in dollars) of investing in the Fund and to compare these costs with the ongoing costs of investing in other mutual funds.
The example is based on an investment of $1,000 invested at the beginning of thesix-month period and held for the entire period from September 1, 2019 to February 29, 2020.
Actual expenses
The “Actual” line of the table below provides information about actual account values and actual expenses. You may use the information in this line, together with the amount you invested, to estimate the expenses that you paid over the period. Simply divide your account value by $1,000 (for example, an $8,600 account value divided by $1,000 = 8.6), then multiply the result by the number in the “Actual” line under the heading entitled “Expenses paid during period” for your applicable class of shares to estimate the expenses you paid on your account during this period.
Hypothetical example for comparison purposes
The “Hypothetical” line of the table below provides information about hypothetical account values and hypothetical expenses based on the Fund’s actual expense ratio and an assumed rate of return of 5% per year before expenses, which is not the Fund’s actual return. The hypothetical account values and expenses may not be used to estimate the actual ending account balance or expenses you paid for the period. You may use this information to compare the ongoing costs of investing in the Fund and other funds. To do so, compare this 5% hypothetical example with the 5% hypothetical examples that appear in the shareholder reports of the other funds.
Please note that the expenses shown in the table are meant to highlight your ongoing costs only and do not reflect any transactional costs, such as sales charges (loads) and contingent deferred sales charges. Therefore, the “Hypothetical” line of the table is useful in comparing ongoing costs only and will not help you determine the relative total costs of owning different funds. In addition, if these transactional costs were included, your costs would have been higher.
| | | | | | | | | | | | | | | | |
| | | Beginning
account value
9-1-2019 | | | Ending
account value
2-29-2020 | | | Expenses
paid during
the period¹ | | | Annualized net
expense ratio | |
| | | | | |
Class A | | | | | | | | | | | | | | | | |
| | | | |
Actual | | $ | 1,000.00 | | | $ | 1,013.27 | | | $ | 3.70 | | | | 0.74 | % |
| | | | |
Hypothetical (5% return before expenses) | | $ | 1,000.00 | | | $ | 1,021.18 | | | $ | 3.72 | | | | 0.74 | % |
| | | | | |
Class C | | | | | | | | | | | | | | | | |
| | | | |
Actual | | $ | 1,000.00 | | | $ | 1,009.49 | | | $ | 7.44 | | | | 1.49 | % |
| | | | |
Hypothetical (5% return before expenses) | | $ | 1,000.00 | | | $ | 1,017.45 | | | $ | 7.47 | | | | 1.49 | % |
| | | | | |
Administrator Class | | | | | | | | | | | | | | | | |
| | | | |
Actual | | $ | 1,000.00 | | | $ | 1,013.97 | | | $ | 3.00 | | | | 0.60 | % |
| | | | |
Hypothetical (5% return before expenses) | | $ | 1,000.00 | | | $ | 1,021.88 | | | $ | 3.02 | | | | 0.60 | % |
| | | | | |
Institutional Class | | | | | | | | | | | | | | | | |
| | | | |
Actual | | $ | 1,000.00 | | | $ | 1,014.67 | | | $ | 2.30 | | | | 0.46 | % |
| | | | |
Hypothetical (5% return before expenses) | | $ | 1,000.00 | | | $ | 1,022.58 | | | $ | 2.31 | | | | 0.46 | % |
| 1 | Expenses paid is equal to the annualized net expense ratio of each class multiplied by the average account value over the period, multiplied by the number of days in the most recent fiscal half-year divided by the number of days in the fiscal year (to reflect theone-half-year period). |
6 | Wells Fargo Adjustable Rate Government Fund
Portfolio of investments—February 29, 2020 (unaudited)
| | | | | | | | | | | | | | | | |
| | | Interest
rate | | | Maturity
date | | | Principal | | | Value | |
| Agency Securities: 95.08% | | | | | | | | | | | | |
FDIC Series2010-S2 Class 3A (1 Month LIBOR +0.70%) 144A± | | | 2.35 | % | | | 12-29-2045 | | | $ | 152,219 | | | $ | 152,330 | |
FHLMC (10 Year Treasury Constant Maturity-0.85%)± | | | 0.90 | | | | 3-15-2024 | | | | 203,978 | | | | 202,921 | |
FHLMC (1 Month LIBOR +0.30%)± | | | 1.96 | | | | 11-15-2042 | | | | 1,054,949 | | | | 1,040,149 | |
FHLMC (1 Month LIBOR +0.35%)± | | | 2.01 | | | | 11-15-2036 | | | | 1,259,092 | | | | 1,248,084 | |
FHLMC (11th District Cost of Funds +0.90%)± | | | 2.04 | | | | 1-1-2022 | | | | 92 | | | | 92 | |
FHLMC (1 Month LIBOR +0.40%)± | | | 2.06 | | | | 1-15-2044 | | | | 2,212,990 | | | | 2,200,310 | |
FHLMC (1 Month LIBOR +0.45%)± | | | 2.11 | | | | 10-25-2049 | | | | 1,929,453 | | | | 1,923,955 | |
FHLMC (11th District Cost of Funds +1.25%)± | | | 2.35 | | | | 2-1-2035 | | | | 118,111 | | | | 116,551 | |
FHLMC (11th District Cost of Funds +1.25%)± | | | 2.38 | | | | 1-1-2030 | | | | 2,144 | | | | 2,120 | |
FHLMC (11th District Cost of Funds +1.25%)± | | | 2.38 | | | | 1-1-2030 | | | | 951 | | | | 947 | |
FHLMC (11th District Cost of Funds +1.25%)± | | | 2.38 | | | | 7-1-2030 | | | | 122,714 | | | | 121,424 | |
FHLMC (11th District Cost of Funds +1.37%)± | | | 2.50 | | | | 10-1-2030 | | | | 1,419 | | | | 1,415 | |
FHLMC (11th District Cost of Funds +1.75%)± | | | 2.89 | | | | 3-1-2025 | | | | 4,066 | | | | 4,051 | |
FHLMC (11th District Cost of Funds +1.25%)± | | | 3.02 | | | | 11-1-2030 | | | | 36,599 | | | | 36,991 | |
FHLMC (1 Year Treasury Constant Maturity +0.72%)± | | | 3.09 | | | | 4-1-2030 | | | | 32,165 | | | | 32,691 | |
FHLMC (6 Month LIBOR +1.42%)± | | | 3.32 | | | | 2-1-2037 | | | | 3,985 | | | | 4,120 | |
FHLMC (12 Month LIBOR +1.66%)± | | | 3.38 | | | | 2-1-2037 | | | | 50,194 | | | | 52,031 | |
FHLMC (11th District Cost of Funds +2.27%)± | | | 3.43 | | | | 6-1-2029 | | | | 27,183 | | | | 27,357 | |
FHLMC (11th District Cost of Funds +2.39%)± | | | 3.49 | | | | 6-1-2021 | | | | 12,384 | | | | 12,404 | |
FHLMC (6 Month LIBOR +1.73%)± | | | 3.61 | | | | 6-1-2024 | | | | 5,048 | | | | 5,065 | |
FHLMC (12 Month LIBOR +1.74%)± | | | 3.64 | | | | 12-1-2036 | | | | 197,983 | | | | 208,505 | |
FHLMC (1 Year Treasury Constant Maturity +1.99%)± | | | 3.74 | | | | 11-1-2034 | | | | 274,470 | | | | 290,305 | |
FHLMC (12 Month LIBOR +1.73%)± | | | 3.76 | | | | 1-1-2035 | | | | 382,503 | | | | 406,294 | |
FHLMC (6 Month LIBOR +1.68%)± | | | 3.79 | | | | 1-1-2037 | | | | 773,317 | | | | 805,639 | |
FHLMC (US Treasury H15 Treasury Bill 6 Month Auction High Discount +1.94%)± | | | 3.81 | | | | 7-1-2024 | | | | 22,372 | | | | 22,189 | |
FHLMC (US Treasury H15 Treasury Bill 6 Month Auction High Discount +1.75%)± | | | 3.81 | | | | 1-1-2023 | | | | 12,429 | | | | 12,802 | |
FHLMC (5 Year Treasury Constant Maturity +2.44%)± | | | 3.82 | | | | 8-1-2027 | | | | 29,630 | | | | 29,813 | |
FHLMC (6 Month LIBOR +1.70%)± | | | 3.82 | | | | 6-1-2037 | | | | 319,891 | | | | 329,750 | |
FHLMC (1 Year Treasury Constant Maturity +2.23%)± | | | 3.85 | | | | 2-1-2034 | | | | 884,100 | | | | 928,714 | |
FHLMC (1 Year Treasury Constant Maturity +2.23%)± | | | 3.86 | | | | 2-1-2034 | | | | 367,138 | | | | 390,448 | |
FHLMC (1 Year Treasury Constant Maturity +2.03%)± | | | 3.87 | | | | 3-1-2025 | | | | 29,747 | | | | 30,829 | |
FHLMC (12 Month LIBOR +1.78%)± | | | 3.89 | | | | 11-1-2035 | | | | 238,435 | | | | 249,727 | |
FHLMC (1 Year Treasury Constant Maturity +2.25%)± | | | 3.90 | | | | 2-1-2036 | | | | 467,532 | | | | 495,084 | |
FHLMC (1 Year Treasury Constant Maturity +2.17%)± | | | 3.92 | | | | 8-1-2034 | | | | 648,274 | | | | 682,352 | |
FHLMC (1 Year Treasury Constant Maturity +2.25%)± | | | 3.94 | | | | 11-1-2022 | | | | 50,005 | | | | 51,117 | |
FHLMC (3 Year Treasury Constant Maturity +2.44%)± | | | 3.94 | | | | 5-1-2032 | | | | 107,334 | | | | 108,218 | |
FHLMC (1 Year Treasury Constant Maturity +2.22%)± | | | 3.95 | | | | 12-1-2033 | | | | 449,371 | | | | 473,041 | |
FHLMC (1 Year Treasury Constant Maturity +2.25%)± | | | 3.97 | | | | 1-1-2037 | | | | 85,098 | | | | 90,721 | |
FHLMC (1 Year Treasury Constant Maturity +2.29%)± | | | 3.98 | | | | 11-1-2035 | | | | 624,282 | | | | 656,462 | |
FHLMC (1 Year Treasury Constant Maturity +2.25%)± | | | 3.99 | | | | 12-1-2034 | | | | 227,758 | | | | 237,724 | |
FHLMC (1 Year Treasury Constant Maturity +2.28%)± | | | 4.00 | | | | 1-1-2035 | | | | 219,492 | | | | 231,869 | |
FHLMC (1 Year Treasury Constant Maturity +2.22%)± | | | 4.01 | | | | 1-1-2033 | | | | 252,405 | | | | 264,699 | |
FHLMC (1 Year Treasury Constant Maturity +2.27%)± | | | 4.02 | | | | 11-1-2029 | | | | 36,285 | | | | 37,056 | |
FHLMC (1 Year Treasury Constant Maturity +2.36%)± | | | 4.02 | | | | 2-1-2035 | | | | 618,673 | | | | 658,493 | |
FHLMC (1 Year Treasury Constant Maturity +2.28%)± | | | 4.03 | | | | 2-1-2034 | | | | 960,224 | | | | 1,020,873 | |
FHLMC (1 Year Treasury Constant Maturity +2.29%)± | | | 4.04 | | | | 11-1-2029 | | | | 55,044 | | | | 56,392 | |
FHLMC (1 Year Treasury Constant Maturity +2.26%)± | | | 4.07 | | | | 9-1-2038 | | | | 413,337 | | | | 438,484 | |
FHLMC (12 Month LIBOR +1.87%)± | | | 4.07 | | | | 9-1-2036 | | | | 536,401 | | | | 568,033 | |
FHLMC (12 Month LIBOR +1.93%)± | | | 4.08 | | | | 4-1-2035 | | | | 743,154 | | | | 782,805 | |
FHLMC (1 Year Treasury Constant Maturity +2.25%)± | | | 4.08 | | | | 5-1-2034 | | | | 68,199 | | | | 72,538 | |
FHLMC (12 Month LIBOR +1.77%)± | | | 4.08 | | | | 9-1-2037 | | | | 349,648 | | | | 365,043 | |
FHLMC (1 Year Treasury Constant Maturity +2.23%)± | | | 4.09 | | | | 7-1-2034 | | | | 89,611 | | | | 95,185 | |
FHLMC (1 Year Treasury Constant Maturity +2.22%)± | | | 4.10 | | | | 10-1-2033 | | | | 498,918 | | | | 520,815 | |
FHLMC (1 Year Treasury Constant Maturity +2.10%)± | | | 4.10 | | | | 10-1-2037 | | | | 736,420 | | | | 777,307 | |
FHLMC (12 Month LIBOR +1.98%)± | | | 4.10 | | | | 11-1-2032 | | | | 105,551 | | | | 108,307 | |
FHLMC (6 Month LIBOR +2.08%)± | | | 4.10 | | | | 6-1-2026 | | | | 566,587 | | | | 582,691 | |
The accompanying notes are an integral part of these financial statements.
Wells Fargo Adjustable Rate Government Fund | 7
Portfolio of investments—February 29, 2020 (unaudited)
| | | | | | | | | | | | | | | | |
| | | Interest
rate | | | Maturity
date | | | Principal | | | Value | |
| Agency Securities (continued) | | | | | | | | | | | | |
FHLMC (1 Year Treasury Constant Maturity +1.88%)± | | | 4.11 | % | | | 5-1-2035 | | | $ | 278,815 | | | $ | 294,427 | |
FHLMC (1 Year Treasury Constant Maturity +2.24%)± | | | 4.12 | | | | 2-1-2034 | | | | 424,328 | | | | 455,274 | |
FHLMC (1 Year Treasury Constant Maturity +2.25%)± | | | 4.14 | | | | 4-1-2036 | | | | 349,047 | | | | 371,027 | |
FHLMC (6 Month LIBOR +2.12%)± | | | 4.14 | | | | 5-1-2037 | | | | 37,638 | | | | 39,463 | |
FHLMC (12 Month LIBOR +1.75%)± | | | 4.15 | | | | 9-1-2037 | | | | 268,053 | | | | 282,730 | |
FHLMC (1 Year Treasury Constant Maturity +2.22%)± | | | 4.16 | | | | 10-1-2033 | | | | 728,539 | | | | 773,012 | |
FHLMC (1 Year Treasury Constant Maturity +2.39%)± | | | 4.16 | | | | 12-1-2032 | | | | 204,972 | | | | 216,326 | |
FHLMC (1 Year Treasury Constant Maturity +2.18%)± | | | 4.16 | | | | 6-1-2036 | | | | 629,574 | | | | 667,771 | |
FHLMC (1 Year Treasury Constant Maturity +2.22%)± | | | 4.17 | | | | 10-1-2033 | | | | 192,555 | | | | 204,333 | |
FHLMC (1 Year Treasury Constant Maturity +2.48%)± | | | 4.18 | | | | 6-1-2030 | | | | 26,984 | | | | 27,658 | |
FHLMC (1 Year Treasury Constant Maturity +2.03%)± | | | 4.19 | | | | 12-1-2035 | | | | 388,345 | | | | 409,034 | |
FHLMC (3 Year Treasury Constant Maturity +2.27%)± | | | 4.19 | | | | 4-1-2032 | | | | 77,624 | | | | 78,029 | |
FHLMC (1 Year Treasury Constant Maturity +2.16%)± | | | 4.20 | | | | 6-1-2033 | | | | 426,445 | | | | 448,488 | |
FHLMC (12 Month LIBOR +1.86%)± | | | 4.22 | | | | 7-1-2038 | | | | 1,199,780 | | | | 1,266,656 | |
FHLMC (1 Year Treasury Constant Maturity +2.05%)± | | | 4.23 | | | | 8-1-2033 | | | | 959,154 | | | | 999,252 | |
FHLMC (1 Year Treasury Constant Maturity +2.29%)± | | | 4.23 | | | | 2-1-2036 | | | | 446,596 | | | | 474,532 | |
FHLMC (1 Year Treasury Constant Maturity +2.29%)± | | | 4.24 | | | | 11-1-2027 | | | | 317,057 | | | | 333,510 | |
FHLMC (1 Year Treasury Constant Maturity +2.28%)± | | | 4.25 | | | | 10-1-2036 | | | | 301,294 | | | | 319,772 | |
FHLMC (12 Month LIBOR +1.81%)± | | | 4.26 | | | | 5-1-2039 | | | | 420,183 | | | | 438,734 | |
FHLMC (1 Year Treasury Constant Maturity +2.25%)± | | | 4.27 | | | | 9-1-2033 | | | | 116,941 | | | | 124,178 | |
FHLMC (1 Year Treasury Constant Maturity +2.23%)± | | | 4.27 | | | | 1-1-2034 | | | | 604,453 | | | | 642,456 | |
FHLMC (1 Year Treasury Constant Maturity +2.27%)± | | | 4.27 | | | | 5-1-2025 | | | | 51,043 | | | | 51,481 | |
FHLMC (1 Year Treasury Constant Maturity +2.05%)± | | | 4.27 | | | | 1-1-2030 | | | | 12,669 | | | | 13,137 | |
FHLMC (1 Year Treasury Constant Maturity +2.33%)± | | | 4.31 | | | | 7-1-2031 | | | | 144,270 | | | | 153,034 | |
FHLMC (1 Year Treasury Constant Maturity +2.36%)± | | | 4.31 | | | | 1-1-2028 | | | | 14,508 | | | | 15,222 | |
FHLMC (1 Year Treasury Constant Maturity +2.23%)± | | | 4.31 | | | | 10-1-2036 | | | | 238,697 | | | | 246,051 | |
FHLMC (1 Year Treasury Constant Maturity +2.25%)± | | | 4.32 | | | | 8-1-2035 | | | | 299,707 | | | | 317,614 | |
FHLMC (1 Year Treasury Constant Maturity +2.34%)± | | | 4.32 | | | | 6-1-2035 | | | | 640,152 | | | | 681,026 | |
FHLMC (1 Year Treasury Constant Maturity +2.22%)± | | | 4.33 | | | | 7-1-2036 | | | | 186,738 | | | | 197,157 | |
FHLMC (1 Year Treasury Constant Maturity +2.25%)± | | | 4.33 | | | | 2-1-2036 | | | | 693,212 | | | | 735,199 | |
FHLMC (12 Month Treasury Average +1.90%)± | | | 4.34 | | | | 5-1-2028 | | | | 170,838 | | | | 177,547 | |
FHLMC (1 Year Treasury Constant Maturity +2.22%)± | | | 4.34 | | | | 1-1-2037 | | | | 649,451 | | | | 689,207 | |
FHLMC (1 Year Treasury Constant Maturity +2.24%)± | | | 4.34 | | | | 2-1-2036 | | | | 623,915 | | | | 661,053 | |
FHLMC (1 Year Treasury Constant Maturity +2.30%)± | | | 4.35 | | | | 7-1-2038 | | | | 431,859 | | | | 458,217 | |
FHLMC (1 Year Treasury Constant Maturity +2.37%)± | | | 4.36 | | | | 4-1-2034 | | | | 342,169 | | | | 359,017 | |
FHLMC (1 Year Treasury Constant Maturity +2.36%)± | | | 4.36 | | | | 6-1-2035 | | | | 319,044 | | | | 334,657 | |
FHLMC (12 Month LIBOR +1.75%)± | | | 4.37 | | | | 5-1-2037 | | | | 835,442 | | | | 880,905 | |
FHLMC (1 Year Treasury Constant Maturity +2.31%)± | | | 4.38 | | | | 3-1-2037 | | | | 220,564 | | | | 234,252 | |
FHLMC (1 Year Treasury Constant Maturity +2.24%)± | | | 4.39 | | | | 3-1-2027 | | | | 63,136 | | | | 64,619 | |
FHLMC (1 Year Treasury Constant Maturity +2.20%)± | | | 4.39 | | | | 11-1-2036 | | | | 739,221 | | | | 776,546 | |
FHLMC (1 Year Treasury Constant Maturity +2.34%)± | | | 4.40 | | | | 10-1-2033 | | | | 903,025 | | | | 942,399 | |
FHLMC (12 Month LIBOR +1.99%)± | | | 4.40 | | | | 7-1-2036 | | | | 569,076 | | | | 600,920 | |
FHLMC (1 Year Treasury Constant Maturity +2.25%)± | | | 4.40 | | | | 11-1-2036 | | | | 584,579 | | | | 617,319 | |
FHLMC (3 Year Treasury Constant Maturity +2.44%)± | | | 4.41 | | | | 5-1-2031 | | | | 93,254 | | | | 92,880 | |
FHLMC (11th District Cost of Funds +2.29%)± | | | 4.42 | | | | 12-1-2025 | | | | 5,104 | | | | 5,116 | |
FHLMC (1 Year Treasury Constant Maturity +2.28%)± | | | 4.42 | | | | 7-1-2031 | | | | 506,223 | | | | 526,239 | |
FHLMC (1 Year Treasury Constant Maturity +2.24%)± | | | 4.42 | | | | 2-1-2036 | | | | 403,454 | | | | 425,929 | |
FHLMC (1 Year Treasury Constant Maturity +2.33%)± | | | 4.43 | | | | 9-1-2033 | | | | 556,732 | | | | 590,965 | |
FHLMC (1 Year Treasury Constant Maturity +2.26%)± | | | 4.43 | | | | 2-1-2036 | | | | 307,678 | | | | 322,672 | |
FHLMC (1 Year Treasury Constant Maturity +2.55%)± | | | 4.44 | | | | 9-1-2029 | | | | 76,786 | | | | 78,202 | |
FHLMC (1 Year Treasury Constant Maturity +2.24%)± | | | 4.44 | | | | 3-1-2035 | | | | 482,099 | | | | 510,650 | |
FHLMC (1 Year Treasury Constant Maturity +2.36%)± | | | 4.45 | | | | 1-1-2028 | | | | 1,568 | | | | 1,653 | |
FHLMC (1 Year Treasury Constant Maturity +2.38%)± | | | 4.45 | | | | 1-1-2037 | | | | 1,144,748 | | | | 1,218,593 | |
FHLMC (1 Year Treasury Constant Maturity +2.25%)± | | | 4.46 | | | | 8-1-2035 | | | | 1,010,736 | | | | 1,069,133 | |
FHLMC (1 Year Treasury Constant Maturity +2.24%)± | | | 4.47 | | | | 7-1-2037 | | | | 335,862 | | | | 355,254 | |
FHLMC (1 Year Treasury Constant Maturity +2.25%)± | | | 4.48 | | | | 4-1-2037 | | | | 357,724 | | | | 380,852 | |
The accompanying notes are an integral part of these financial statements.
8 | Wells Fargo Adjustable Rate Government Fund
Portfolio of investments—February 29, 2020 (unaudited)
| | | | | | | | | | | | | | | | |
| | | Interest
rate | | | Maturity
date | | | Principal | | | Value | |
| Agency Securities (continued) | | | | | | | | | | | | |
FHLMC (3 Year Treasury Constant Maturity +2.70%)± | | | 4.48 | % | | | 6-1-2035 | | | $ | 596,811 | | | $ | 637,362 | |
FHLMC (1 Year Treasury Constant Maturity +2.26%)± | | | 4.49 | | | | 5-1-2034 | | | | 1,020,646 | | | | 1,076,431 | |
FHLMC (1 Year Treasury Constant Maturity +2.24%)± | | | 4.50 | | | | 10-1-2034 | | | | 614,194 | | | | 650,793 | |
FHLMC (1 Year Treasury Constant Maturity +2.24%)± | | | 4.50 | | | | 5-1-2038 | | | | 519,693 | | | | 544,850 | |
FHLMC (5 Year Treasury Constant Maturity +2.13%)± | | | 4.51 | | | | 8-1-2029 | | | | 8,038 | | | | 8,073 | |
FHLMC (1 Year Treasury Constant Maturity +2.46%)± | | | 4.51 | | | | 10-1-2030 | | | | 1,045,341 | | | | 1,098,117 | |
FHLMC (1 Year Treasury Constant Maturity +2.26%)± | | | 4.52 | | | | 7-1-2035 | | | | 383,928 | | | | 406,817 | |
FHLMC (1 Year Treasury Constant Maturity +2.32%)± | | | 4.53 | | | | 9-1-2029 | | | | 413,200 | | | | 435,940 | |
FHLMC (12 Month LIBOR +1.77%)± | | | 4.54 | | | | 6-1-2035 | | | | 667,776 | | | | 705,151 | |
FHLMC (1 Year Treasury Constant Maturity +2.39%)± | | | 4.54 | | | | 6-1-2035 | | | | 854,871 | | | | 895,414 | |
FHLMC (12 Month LIBOR +1.88%)± | | | 4.55 | | | | 4-1-2037 | | | | 306,881 | | | | 325,215 | |
FHLMC (1 Year Treasury Constant Maturity +2.32%)± | | | 4.55 | | | | 1-1-2036 | | | | 356,564 | | | | 378,776 | |
FHLMC (12 Month LIBOR +1.77%)± | | | 4.56 | | | | 10-1-2036 | | | | 343,307 | | | | 361,909 | |
FHLMC (1 Year Treasury Constant Maturity +2.25%)± | | | 4.56 | | | | 6-1-2035 | | | | 73,302 | | | | 77,707 | |
FHLMC (1 Year Treasury Constant Maturity +2.23%)± | | | 4.57 | | | | 9-1-2035 | | | | 953,856 | | | | 1,009,474 | |
FHLMC (1 Year Treasury Constant Maturity +2.36%)± | | | 4.58 | | | | 2-1-2031 | | | | 338,122 | | | | 354,858 | |
FHLMC (1 Year Treasury Constant Maturity +2.36%)± | | | 4.59 | | | | 9-1-2030 | | | | 98,525 | | | | 102,733 | |
FHLMC (12 Month LIBOR +1.77%)± | | | 4.59 | | | | 10-1-2035 | | | | 476,832 | | | | 499,823 | |
FHLMC (1 Year Treasury Constant Maturity +2.24%)± | | | 4.59 | | | | 8-1-2027 | | | | 4,335 | | | | 4,406 | |
FHLMC (1 Year Treasury Constant Maturity +2.22%)± | | | 4.60 | | | | 8-1-2033 | | | | 65,318 | | | | 68,178 | |
FHLMC (1 Year Treasury Constant Maturity +2.36%)± | | | 4.60 | | | | 2-1-2036 | | | | 73,945 | | | | 78,611 | |
FHLMC (1 Year Treasury Constant Maturity +2.25%)± | | | 4.60 | | | | 11-1-2035 | | | | 467,793 | | | | 496,101 | |
FHLMC (12 Month LIBOR +1.75%)± | | | 4.60 | | | | 6-1-2033 | | | | 379,388 | | | | 397,950 | |
FHLMC (1 Year Treasury Constant Maturity +2.28%)± | | | 4.60 | | | | 4-1-2037 | | | | 876,986 | | | | 929,977 | |
FHLMC (1 Year Treasury Constant Maturity +2.23%)± | | | 4.60 | | | | 11-1-2026 | | | | 57,464 | | | | 59,238 | |
FHLMC (1 Year Treasury Constant Maturity +2.35%)± | | | 4.62 | | | | 9-1-2032 | | | | 1,085,433 | | | | 1,147,483 | |
FHLMC (1 Year Treasury Constant Maturity +2.40%)± | | | 4.64 | | | | 9-1-2031 | | | | 59,974 | | | | 61,231 | |
FHLMC (1 Year Treasury Constant Maturity +2.61%)± | | | 4.65 | | | | 9-1-2030 | | | | 90,334 | | | | 92,747 | |
FHLMC (12 Month LIBOR +1.75%)± | | | 4.66 | | | | 5-1-2033 | | | | 139,464 | | | | 146,200 | |
FHLMC (12 Month LIBOR +1.75%)± | | | 4.66 | | | | 4-1-2035 | | | | 138,731 | | | | 145,797 | |
FHLMC (1 Year Treasury Constant Maturity +2.17%)± | | | 4.67 | | | | 5-1-2037 | | | | 49,254 | | | | 51,834 | |
FHLMC (1 Year Treasury Constant Maturity +2.35%)± | | | 4.68 | | | | 7-1-2034 | | | | 375,546 | | | | 393,699 | |
FHLMC (1 Year Treasury Constant Maturity +2.25%)± | | | 4.68 | | | | 4-1-2038 | | | | 665,711 | | | | 704,329 | |
FHLMC (1 Year Treasury Constant Maturity +2.25%)± | | | 4.68 | | | | 9-1-2038 | | | | 140,911 | | | | 146,474 | |
FHLMC (1 Year Treasury Constant Maturity +2.23%)± | | | 4.68 | | | | 3-1-2034 | | | | 535,908 | | | | 563,940 | |
FHLMC (1 Year Treasury Constant Maturity +2.18%)± | | | 4.69 | | | | 4-1-2023 | | | | 116,859 | | | | 117,723 | |
FHLMC (1 Year Treasury Constant Maturity +2.25%)± | | | 4.70 | | | | 3-1-2036 | | | | 415,482 | | | | 436,188 | |
FHLMC (1 Year Treasury Constant Maturity +2.63%)± | | | 4.71 | | | | 5-1-2028 | | | | 136,984 | | | | 142,701 | |
FHLMC (1 Year Treasury Constant Maturity +2.35%)± | | | 4.73 | | | | 7-1-2038 | | | | 155,244 | | | | 163,456 | |
FHLMC (1 Year Treasury Constant Maturity +2.23%)± | | | 4.73 | | | | 5-1-2032 | | | | 36,391 | | | | 37,637 | |
FHLMC (1 Year Treasury Constant Maturity +2.23%)± | | | 4.73 | | | | 5-1-2034 | | | | 502,997 | | | | 523,276 | |
FHLMC (1 Year Treasury Constant Maturity +2.23%)± | | | 4.73 | | | | 4-1-2034 | | | | 176,989 | | | | 186,188 | |
FHLMC (1 Year Treasury Constant Maturity +2.40%)± | | | 4.75 | | | | 11-1-2029 | | | | 284,852 | | | | 297,181 | |
FHLMC (12 Month LIBOR +1.87%)± | | | 4.75 | | | | 5-1-2035 | | | | 99,857 | | | | 105,634 | |
FHLMC (12 Month Treasury Average +2.30%)± | | | 4.75 | | | | 6-1-2028 | | | | 76,405 | | | | 78,229 | |
FHLMC (1 Year Treasury Constant Maturity +2.25%)± | | | 4.75 | | | | 5-1-2034 | | | | 123,784 | | | | 129,468 | |
FHLMC (1 Year Treasury Constant Maturity +2.36%)± | | | 4.76 | | | | 7-1-2027 | | | | 410,220 | | | | 414,066 | |
FHLMC (2 Year Treasury Constant Maturity +2.44%)± | | | 4.79 | | | | 8-1-2029 | | | | 85,262 | | | | 89,364 | |
FHLMC (1 Year Treasury Constant Maturity +2.23%)± | | | 4.79 | | | | 3-1-2034 | | | | 603,131 | | | | 635,795 | |
FHLMC (12 Month LIBOR +1.67%)± | | | 4.79 | | | | 8-1-2035 | | | | 133,872 | | | | 136,246 | |
FHLMC (1 Year Treasury Constant Maturity +2.29%)± | | | 4.80 | | | | 9-1-2033 | | | | 405,376 | | | | 428,439 | |
FHLMC (1 Year Treasury Constant Maturity +2.43%)± | | | 4.80 | | | | 6-1-2025 | | | | 42,857 | | | | 43,542 | |
FHLMC (11th District Cost of Funds +2.57%)± | | | 4.80 | | | | 12-1-2025 | | | | 242,823 | | | | 250,458 | |
FHLMC (1 Year Treasury Constant Maturity +2.48%)± | | | 4.81 | | | | 6-1-2030 | | | | 217,480 | | | | 227,784 | |
FHLMC (1 Year Treasury Constant Maturity +2.23%)± | | | 4.83 | | | | 4-1-2034 | | | | 187,359 | | | | 197,178 | |
FHLMC (1 Year Treasury Constant Maturity +2.36%)± | | | 4.86 | | | | 4-1-2038 | | | | 667,776 | | | | 707,351 | |
The accompanying notes are an integral part of these financial statements.
Wells Fargo Adjustable Rate Government Fund | 9
Portfolio of investments—February 29, 2020 (unaudited)
| | | | | | | | | | | | | | | | |
| | | Interest
rate | | | Maturity
date | | | Principal | | | Value | |
| Agency Securities (continued) | | | | | | | | | | | | |
FHLMC (12 Month LIBOR +1.86%)± | | | 4.87 | % | | | 4-1-2037 | | | $ | 405,906 | | | $ | 428,831 | |
FHLMC (6 Month LIBOR +2.38%)± | | | 4.89 | | | | 2-1-2024 | | | | 10,607 | | | | 10,656 | |
FHLMC (1 Year Treasury Constant Maturity +2.48%)± | | | 4.91 | | | | 10-1-2024 | | | | 57,514 | | | | 59,317 | |
FHLMC (1 Year Treasury Constant Maturity +2.40%)± | | | 4.91 | | | | 7-1-2029 | | | | 48,201 | | | | 50,334 | |
FHLMC (12 Month LIBOR +1.91%)± | | | 4.91 | | | | 3-1-2032 | | | | 259,921 | | | | 273,971 | |
FHLMC (12 Month LIBOR +1.84%)± | | | 4.91 | | | | 4-1-2035 | | | | 785,744 | | | | 823,384 | |
FHLMC (1 Year Treasury Constant Maturity +2.47%)± | | | 4.92 | | | | 7-1-2034 | | | | 387,860 | | | | 409,166 | |
FHLMC (12 Month Treasury Average +2.46%)± | | | 4.96 | | | | 10-1-2029 | | | | 86,726 | | | | 89,155 | |
FHLMC (1 Year Treasury Constant Maturity +2.47%)± | | | 4.97 | | | | 6-1-2035 | | | | 177,859 | | | | 187,121 | |
FHLMC (1 Year Treasury Constant Maturity +2.52%)± | | | 4.97 | | | | 11-1-2029 | | | | 84,156 | | | | 87,371 | |
FHLMC (1 Year Treasury Constant Maturity +2.48%)± | | | 4.99 | | | | 10-1-2025 | | | | 41,026 | | | | 41,760 | |
FHLMC (Federal Cost of Funds +2.72%)± | | | 5.00 | | | | 4-1-2023 | | | | 3,468 | | | | 3,471 | |
FHLMC | | | 5.00 | | | | 10-1-2022 | | | | 5,081 | | | | 5,376 | |
FHLMC (1 Year Treasury Constant Maturity +2.43%)± | | | 5.05 | | | | 8-1-2029 | | | | 45,747 | | | | 46,497 | |
FHLMC (1 Year Treasury Constant Maturity +2.44%)± | | | 5.07 | | | | 4-1-2029 | | | | 70,721 | | | | 71,756 | |
FHLMC (1 Year Treasury Constant Maturity +2.60%)± | | | 5.10 | | | | 6-1-2032 | | | | 133,167 | | | | 135,557 | |
FHLMC (1 Year Treasury Constant Maturity +2.48%)± | | | 5.16 | | | | 6-1-2030 | | | | 72,176 | | | | 73,893 | |
FHLMC (1 Year Treasury Constant Maturity +2.48%)± | | | 5.23 | | | | 2-1-2030 | | | | 27,017 | | | | 27,465 | |
FHLMC (1 Year Treasury Constant Maturity +2.32%)± | | | 5.49 | | | | 8-1-2024 | | | | 156,311 | | | | 159,865 | |
FHLMC (6 Month LIBOR +3.83%)± | | | 6.08 | | | | 11-1-2026 | | | | 25,168 | | | | 25,768 | |
FHLMC Series 1671 Class QA (11th District Cost of Funds +0.95%)± | | | 1.99 | | | | 2-15-2024 | | | | 590,190 | | | | 597,035 | |
FHLMC Series 1686 Class FE (11th District Cost of Funds +1.10%)± | | | 2.14 | | | | 2-15-2024 | | | | 10,185 | | | | 10,334 | |
FHLMC Series 1730 Class FA (10 Year Treasury Constant Maturity-0.60%)± | | | 1.15 | | | | 5-15-2024 | | | | 75,825 | | | | 75,758 | |
FHLMC Series 20 Class F±± | | | 3.26 | | | | 7-1-2029 | | | | 6,626 | | | | 6,804 | |
FHLMC Series 2315 Class FW (1 Month LIBOR +0.55%)± | | | 2.21 | | | | 4-15-2027 | | | | 57,101 | | | | 57,436 | |
FHLMC Series 2391 Class EF (1 Month LIBOR +0.50%)± | | | 2.16 | | | | 6-15-2031 | | | | 55,164 | | | | 55,246 | |
FHLMC Series 2454 Class SL (1 Month LIBOR +8.00%)±(c) | | | 6.34 | | | | 3-15-2032 | | | | 110,603 | | | | 19,687 | |
FHLMC Series 2461 Class FI (1 Month LIBOR +0.50%)± | | | 2.16 | | | | 4-15-2028 | | | | 73,693 | | | | 74,082 | |
FHLMC Series 2464 Class FE (1 Month LIBOR +1.00%)± | | | 2.66 | | | | 3-15-2032 | | | | 72,088 | | | | 73,587 | |
FHLMC Series 2466 Class FV (1 Month LIBOR +0.55%)± | | | 2.21 | | | | 3-15-2032 | | | | 142,259 | | | | 143,566 | |
FHLMC Series 2538 Class F (1 Month LIBOR +0.60%)± | | | 2.26 | | | | 12-15-2032 | | | | 303,421 | | | | 305,274 | |
FHLMC Series 2682 Class FK (1 Month LIBOR +1.47%)± | | | 3.13 | | | | 1-15-2033 | | | | 2,956,296 | | | | 3,057,035 | |
FHLMC Series 3140 Class GF (1 Month LIBOR +0.35%)± | | | 2.01 | | | | 3-15-2036 | | | | 704,667 | | | | 701,498 | |
FHLMC Series 3149 Class FB±± | | | 2.01 | | | | 5-15-2036 | | | | 1,169,980 | | | | 1,162,628 | |
FHLMC Series 3284 Class CF (1 Month LIBOR +0.37%)± | | | 2.03 | | | | 3-15-2037 | | | | 872,379 | | | | 869,529 | |
FHLMC Series 3436 Class A±± | | | 4.31 | | | | 11-15-2036 | | | | 450,659 | | | | 465,125 | |
FHLMC Series 3753 Class FA±± | | | 2.16 | | | | 11-15-2040 | | | | 2,261,135 | | | | 2,258,197 | |
FHLMC Series 3822 Class FY (1 Month LIBOR +0.40%)± | | | 2.06 | | | | 2-15-2033 | | | | 979,777 | | | | 977,876 | |
FHLMC Series 3827 Class DF (1 Month LIBOR +0.45%)± | | | 2.11 | | | | 3-15-2041 | | | | 900,718 | | | | 896,591 | |
FHLMC Series 4013 Class QF±± | | | 2.21 | | | | 3-15-2041 | | | | 956,514 | | | | 960,676 | |
FHLMC Series 4678 Class AF±± | | | 2.18 | | | | 12-15-2042 | | | | 2,105,021 | | | | 2,091,027 | |
FHLMC Series 4821 Class FA±± | | | 1.96 | | | | 7-15-2048 | | | | 1,553,199 | | | | 1,543,225 | |
FHLMC Series 4842 Class FA±± | | | 2.01 | | | | 11-15-2048 | | | | 3,011,703 | | | | 2,999,567 | |
FHLMC Series 4933 Class FA±± | | | 2.16 | | | | 12-25-2049 | | | | 2,649,771 | | | | 2,650,390 | |
FHLMC SeriesT-15 Class A6 (1 Month LIBOR +0.00%)± | | | 2.03 | | | | 11-25-2028 | | | | 349,231 | | | | 351,473 | |
FHLMC SeriesT-16 Class A (1 Month LIBOR +0.10%)± | | | 2.01 | | | | 6-25-2029 | | | | 1,093,653 | | | | 1,094,575 | |
FHLMC SeriesT-20 Class A7 (1 Month LIBOR +0.15%)± | | | 1.96 | | | | 12-25-2029 | | | | 2,292,428 | | | | 2,252,336 | |
FHLMC SeriesT-21 Class A (1 Month LIBOR +0.18%)± | | | 2.02 | | | | 10-25-2029 | | | | 826,435 | | | | 822,144 | |
FHLMC SeriesT-23 Class A (1 Month LIBOR +0.14%)± | | | 1.94 | | | | 5-25-2030 | | | | 1,278,551 | | | | 1,275,490 | |
FHLMC SeriesT-27 Class A (1 Month LIBOR +0.15%)± | | | 1.96 | | | | 10-25-2030 | | | | 854,228 | | | | 858,252 | |
FHLMC SeriesT-30 Class A7 (1 Month LIBOR +0.24%)± | | | 1.87 | | | | 12-25-2030 | | | | 887,526 | | | | 861,539 | |
FHLMC SeriesT-35 Class A (1 Month LIBOR +0.14%)± | | | 1.94 | | | | 9-25-2031 | | | | 2,226,179 | | | | 2,205,201 | |
FHLMC SeriesT-48 Class 2A±± | | | 4.20 | | | | 7-25-2033 | | | | 1,713,479 | | | | 1,772,989 | |
FHLMC SeriesT-54 Class 4A±± | | | 4.20 | | | | 2-25-2043 | | | | 1,197,047 | | | | 1,257,922 | |
FHLMC SeriesT-55 Class 1A1 | | | 6.50 | | | | 3-25-2043 | | | | 51,749 | | | | 60,136 | |
FHLMC SeriesT-56 Class 3AF (1 Month LIBOR +1.00%)± | | | 2.63 | | | | 5-25-2043 | | | | 828,347 | | | | 847,373 | |
The accompanying notes are an integral part of these financial statements.
10 | Wells Fargo Adjustable Rate Government Fund
Portfolio of investments—February 29, 2020 (unaudited)
| | | | | | | | | | | | | | | | |
| | | Interest
rate | | | Maturity
date | | | Principal | | | Value | |
| Agency Securities (continued) | | | | | | | | | | | | |
FHLMC SeriesT-62 Class 1A1 (12 Month Treasury Average +0.00%)± | | | 3.25 | % | | | 10-25-2044 | | | $ | 2,661,111 | | | $ | 2,665,004 | |
FHLMC SeriesT-63 Class 1A1 (12 Month Treasury Average +1.20%)± | | | 3.25 | | | | 2-25-2045 | | | | 2,365,886 | | | | 2,355,281 | |
FHLMC SeriesT-66 Class 2A1±± | | | 4.19 | | | | 1-25-2036 | | | | 1,456,000 | | | | 1,509,424 | |
FHLMC SeriesT-67 Class 1A1C±± | | | 3.69 | | | | 3-25-2036 | | | | 3,276,498 | | | | 3,360,493 | |
FHLMC SeriesT-67 Class 2A1C±± | | | 3.70 | | | | 3-25-2036 | | | | 3,111,115 | | | | 3,185,376 | |
FNMA (1 Month LIBOR +0.40%)± | | | 2.06 | | | | 4-25-2034 | | | | 777,213 | | | | 775,524 | |
FNMA (11th District Cost of Funds +1.25%)± | | | 2.29 | | | | 4-1-2042 | | | | 1,269,922 | | | | 1,264,662 | |
FNMA (11th District Cost of Funds +1.25%)± | | | 2.29 | | | | 10-1-2044 | | | | 733,760 | | | | 729,219 | |
FNMA (11th District Cost of Funds +1.25%)± | | | 2.33 | | | | 1-1-2038 | | | | 34,208 | | | | 34,237 | |
FNMA (11th District Cost of Funds +1.25%)± | | | 2.35 | | | | 11-1-2020 | | | | 4,336 | | | | 4,323 | |
FNMA (11th District Cost of Funds +1.25%)± | | | 2.35 | | | | 11-1-2023 | | | | 9,765 | | | | 9,706 | |
FNMA (11th District Cost of Funds +1.26%)± | | | 2.36 | | | | 1-1-2035 | | | | 524,896 | | | | 528,238 | |
FNMA (11th District Cost of Funds +1.25%)± | | | 2.38 | | | | 3-1-2021 | | | | 15 | | | | 15 | |
FNMA (11th District Cost of Funds +1.25%)± | | | 2.38 | | | | 3-1-2033 | | | | 84,017 | | | | 84,086 | |
FNMA (11th District Cost of Funds +1.25%)± | | | 2.41 | | | | 11-1-2024 | | | | 753 | | | | 748 | |
FNMA (11th District Cost of Funds +1.25%)± | | | 2.43 | | | | 4-1-2021 | | | | 7,015 | | | | 7,010 | |
FNMA (11th District Cost of Funds +1.25%)± | | | 2.49 | | | | 9-1-2037 | | | | 1,429,545 | | | | 1,424,408 | |
FNMA (1 Year Treasury Constant Maturity +1.66%)± | | | 2.54 | | | | 7-1-2048 | | | | 1,731,831 | | | | 1,753,335 | |
FNMA (11th District Cost of Funds +1.78%)± | | | 2.65 | | | | 1-1-2036 | | | | 184,372 | | | | 185,412 | |
FNMA (1 Month LIBOR +1.00%)± | | | 2.66 | | | | 7-25-2038 | | | | 1,062,162 | | | | 1,075,302 | |
FNMA (11th District Cost of Funds +1.43%)± | | | 2.68 | | | | 4-1-2024 | | | | 923,503 | | | | 926,103 | |
FNMA (11th District Cost of Funds +1.25%)± | | | 2.80 | | | | 7-1-2020 | | | | 45,695 | | | | 45,597 | |
FNMA (11th District Cost of Funds +1.83%)± | | | 2.82 | | | | 1-1-2036 | | | | 24,021 | | | | 24,127 | |
FNMA (11th District Cost of Funds +1.80%)± | | | 2.90 | | | | 3-1-2033 | | | | 214,961 | | | | 215,394 | |
FNMA (11th District Cost of Funds +1.78%)± | | | 2.91 | | | | 11-1-2022 | | | | 281 | | | | 280 | |
FNMA (11th District Cost of Funds +1.83%)± | | | 2.92 | | | | 10-1-2024 | | | | 201 | | | | 200 | |
FNMA (1 Month LIBOR +1.17%)± | | | 2.92 | | | | 5-1-2029 | | | | 39,092 | | | | 40,351 | |
FNMA (11th District Cost of Funds +1.82%)± | | | 2.96 | | | | 5-1-2028 | | | | 34,485 | | | | 34,677 | |
FNMA (11th District Cost of Funds +1.86%)± | | | 2.99 | | | | 10-1-2027 | | | | 269,287 | | | | 271,700 | |
FNMA (6 Month LIBOR +1.00%)± | | | 3.00 | | | | 6-1-2021 | | | | 3,650 | | | | 3,680 | |
FNMA (11th District Cost of Funds +1.70%)± | | | 3.02 | | | | 4-1-2030 | | | | 788 | | | | 782 | |
FNMA (6 Month LIBOR +1.15%)± | | | 3.02 | | | | 8-1-2032 | | | | 150,904 | | | | 151,317 | |
FNMA (6 Month LIBOR +1.03%)± | | | 3.03 | | | | 2-1-2033 | | | | 116,091 | | | | 115,741 | |
FNMA (11th District Cost of Funds +1.18%)± | | | 3.03 | | | | 10-1-2034 | | | | 84,269 | | | | 84,449 | |
FNMA (11th District Cost of Funds +1.92%)± | | | 3.05 | | | | 9-1-2030 | | | | 210,823 | | | | 209,426 | |
FNMA (11th District Cost of Funds +1.25%)± | | | 3.17 | | | | 4-1-2034 | | | | 815,589 | | | | 828,093 | |
FNMA (6 Month LIBOR +1.37%)± | | | 3.24 | | | | 1-1-2032 | | | | 183,692 | | | | 189,466 | |
FNMA (6 Month LIBOR +1.38%)± | | | 3.25 | | | | 12-1-2031 | | | | 17,242 | | | | 17,294 | |
FNMA (6 Month LIBOR +1.18%)± | | | 3.25 | | | | 8-1-2033 | | | | 154,893 | | | | 160,497 | |
FNMA (6 Month LIBOR +1.08%)± | | | 3.33 | | | | 9-1-2032 | | | | 49,570 | | | | 49,650 | |
FNMA (1 Year Treasury Constant Maturity +1.70%)± | | | 3.33 | | | | 2-1-2033 | | | | 211,990 | | | | 220,070 | |
FNMA (1 Year Treasury Constant Maturity +1.74%)± | | | 3.37 | | | | 1-1-2035 | | | | 40,031 | | | | 41,665 | |
FNMA (6 Month LIBOR +1.16%)± | | | 3.37 | | | | 8-1-2033 | | | | 3,179 | | | | 3,230 | |
FNMA (6 Month LIBOR +1.42%)± | | | 3.38 | | | | 12-1-2031 | | | | 178,985 | | | | 185,074 | |
FNMA (6 Month LIBOR +1.53%)± | | | 3.43 | | | | 1-1-2035 | | | | 863,334 | | | | 895,288 | |
FNMA (1 Year Treasury Constant Maturity +1.82%)± | | | 3.45 | | | | 4-1-2038 | | | | 368,734 | | | | 387,495 | |
FNMA (6 Month LIBOR +1.43%)± | | | 3.48 | | | | 10-1-2037 | | | | 590,401 | | | | 611,509 | |
FNMA (1 Year Treasury Constant Maturity +1.63%)± | | | 3.50 | | | | 11-1-2029 | | | | 6,624 | | | | 6,770 | |
FNMA (6 Month LIBOR +1.52%)± | | | 3.52 | | | | 11-1-2034 | | | | 328,893 | | | | 340,183 | |
FNMA (6 Month LIBOR +1.55%)± | | | 3.55 | | | | 12-1-2022 | | | | 2,738 | | | | 2,748 | |
FNMA (12 Month Treasury Average +1.40%)± | | | 3.55 | | | | 12-1-2030 | | | | 64,355 | | | | 63,615 | |
FNMA (12 Month Treasury Average +1.25%)± | | | 3.59 | | | | 1-1-2021 | | | | 300 | | | | 302 | |
FNMA (1 Year Treasury Constant Maturity +2.03%)± | | | 3.60 | | | | 11-1-2027 | | | | 5,933 | | | | 5,943 | |
FNMA (12 Month Treasury Average +1.25%)± | | | 3.60 | | | | 1-1-2021 | | | | 247 | | | | 248 | |
FNMA (6 Month LIBOR +1.38%)± | | | 3.63 | | | | 8-1-2031 | | | | 117,362 | | | | 119,521 | |
FNMA (12 Month LIBOR +1.64%)± | | | 3.65 | | | | 12-1-2033 | | | | 837,410 | | | | 872,363 | |
FNMA (6 Month LIBOR +1.42%)± | | | 3.67 | | | | 9-1-2031 | | | | 120,635 | | | | 123,647 | |
The accompanying notes are an integral part of these financial statements.
Wells Fargo Adjustable Rate Government Fund | 11
Portfolio of investments—February 29, 2020 (unaudited)
| | | | | | | | | | | | | | | | |
| | | Interest
rate | | | Maturity
date | | | Principal | | | Value | |
| Agency Securities (continued) | | | | | | | | | | | | |
FNMA (6 Month LIBOR +1.55%)± | | | 3.71 | % | | | 3-1-2034 | | | $ | 190,336 | | | $ | 197,093 | |
FNMA (1 Year Treasury Constant Maturity +1.50%)± | | | 3.71 | | | | 8-1-2030 | | | | 779,678 | | | | 801,546 | |
FNMA (5 Year Treasury Constant Maturity +1.90%)± | | | 3.74 | | | | 9-1-2031 | | | | 176,917 | | | | 176,890 | |
FNMA (6 Month LIBOR +1.74%)± | | | 3.74 | | | | 10-1-2024 | | | | 30,088 | | | | 30,222 | |
FNMA (6 Month LIBOR +1.74%)± | | | 3.74 | | | | 12-1-2024 | | | | 41,790 | | | | 41,924 | |
FNMA (6 Month LIBOR +1.63%)± | | | 3.75 | | | | 1-1-2022 | | | | 3,324 | | | | 3,327 | |
FNMA (12 Month LIBOR +1.75%)± | | | 3.75 | | | | 1-1-2035 | | | | 370,392 | | | | 389,772 | |
FNMA (1 Year Treasury Constant Maturity +2.09%)± | | | 3.76 | | | | 1-1-2036 | | | | 83,035 | | | | 87,642 | |
FNMA (3 Year Treasury Constant Maturity +2.15%)± | | | 3.77 | | | | 10-1-2024 | | | | 23,526 | | | | 23,973 | |
FNMA (1 Year Treasury Constant Maturity +1.52%)± | | | 3.79 | | | | 8-1-2033 | | | | 711,827 | | | | 736,988 | |
FNMA (1 Year Treasury Constant Maturity +2.18%)± | | | 3.80 | | | | 12-1-2024 | | | | 19,042 | | | | 19,259 | |
FNMA (1 Year Treasury Constant Maturity +2.18%)± | | | 3.80 | | | | 1-1-2035 | | | | 44,963 | | | | 46,658 | |
FNMA (12 Month LIBOR +1.56%)± | | | 3.83 | | | | 9-1-2036 | | | | 218,183 | | | | 227,426 | |
FNMA (1 Year Treasury Constant Maturity +2.22%)± | | | 3.85 | | | | 8-1-2031 | | | | 98,262 | | | | 100,571 | |
FNMA (1 Year Treasury Constant Maturity +2.07%)± | | | 3.86 | | | | 11-1-2035 | | | | 385,509 | | | | 407,575 | |
FNMA (1 Year Treasury Constant Maturity +2.25%)± | | | 3.87 | | | | 6-1-2027 | | | | 582 | | | | 598 | |
FNMA (US Treasury H15 Treasury Bill 6 Month Auction High Discount +2.23%)± | | | 3.88 | | | | 7-1-2025 | | | | 710 | | | | 718 | |
FNMA (1 Year Treasury Constant Maturity +2.18%)± | | | 3.90 | | | | 1-1-2036 | | | | 241,432 | | | | 241,625 | |
FNMA (12 Month LIBOR +1.65%)± | | | 3.90 | | | | 9-1-2037 | | | | 548,361 | | | | 569,603 | |
FNMA (1 Year Treasury Constant Maturity +2.20%)± | | | 3.90 | | | | 2-1-2035 | | | | 104,757 | | | | 110,963 | |
FNMA (1 Year Treasury Constant Maturity +2.28%)± | | | 3.90 | | | | 2-1-2037 | | | | 355,371 | | | | 376,601 | |
FNMA (12 Month LIBOR +1.83%)± | | | 3.90 | | | | 1-1-2033 | | | | 306,390 | | | | 322,543 | |
FNMA (12 Month LIBOR +1.67%)± | | | 3.92 | | | | 9-1-2034 | | | | 800,593 | | | | 845,679 | |
FNMA (1 Year Treasury Constant Maturity +2.17%)± | | | 3.92 | | | | 12-1-2039 | | | | 173,263 | | | | 178,372 | |
FNMA (1 Year Treasury Constant Maturity +2.13%)± | | | 3.92 | | | | 10-1-2035 | | | | 107,078 | | | | 112,991 | |
FNMA (6 Month LIBOR +1.93%)± | | | 3.93 | | | | 6-1-2032 | | | | 63,751 | | | | 64,469 | |
FNMA (12 Month LIBOR +1.53%)± | | | 3.93 | | | | 9-1-2035 | | | | 852,963 | | | | 871,907 | |
FNMA (3 Year Treasury Constant Maturity +1.21%)± | | | 3.95 | | | | 3-1-2030 | | | | 15,051 | | | | 15,324 | |
FNMA (1 Year Treasury Constant Maturity +2.32%)± | | | 3.95 | | | | 6-1-2032 | | | | 18,423 | | | | 18,670 | |
FNMA (12 Month LIBOR +1.82%)± | | | 3.95 | | | | 12-1-2046 | | | | 63,811 | | | | 66,829 | |
FNMA (12 Month LIBOR +1.69%)± | | | 3.98 | | | | 8-1-2036 | | | | 419,240 | | | | 440,629 | |
FNMA (6 Month LIBOR +1.93%)± | | | 3.99 | | | | 4-1-2033 | | | | 243,661 | | | | 251,454 | |
FNMA (12 Month Treasury Average +1.84%)± | | | 4.00 | | | | 11-1-2035 | | | | 24,270 | | | | 25,059 | |
FNMA (1 Year Treasury Constant Maturity +2.13%)± | | | 4.01 | | | | 10-1-2025 | | | | 72,987 | | | | 74,396 | |
FNMA (12 Month Treasury Average +1.95%)± | | | 4.02 | | | | 7-1-2035 | | | | 704,280 | | | | 729,358 | |
FNMA (6 Month LIBOR +2.00%)± | | | 4.02 | | | | 10-1-2024 | | | | 42,870 | | | | 43,643 | |
FNMA (1 Year Treasury Constant Maturity +2.17%)± | | | 4.03 | | | | 12-1-2034 | | | | 792,331 | | | | 834,246 | |
FNMA (1 Year Treasury Constant Maturity +2.20%)± | | | 4.03 | | | | 11-1-2038 | | | | 239,283 | | | | 251,465 | |
FNMA (12 Month Treasury Average +1.88%)± | | | 4.04 | | | | 11-1-2035 | | | | 605,983 | | | | 620,780 | |
FNMA (12 Month Treasury Average +1.92%)± | | | 4.05 | | | | 10-1-2035 | | | | 776,522 | | | | 803,457 | |
FNMA (1 Year Treasury Constant Maturity +2.32%)± | | | 4.07 | | | | 5-1-2025 | | | | 25,386 | | | | 25,618 | |
FNMA (1 Year Treasury Constant Maturity +2.23%)± | | | 4.08 | | | | 5-1-2035 | | | | 838,517 | | | | 886,576 | |
FNMA (12 Month Treasury Average +1.91%)± | | | 4.08 | | | | 11-1-2035 | | | | 116,979 | | | | 121,106 | |
FNMA (6 Month LIBOR +2.44%)± | | | 4.09 | | | | 1-1-2033 | | | | 86,148 | | | | 88,039 | |
FNMA (12 Month Treasury Average +1.93%)± | | | 4.09 | | | | 6-1-2035 | | | | 459,270 | | | | 475,633 | |
FNMA (1 Year Treasury Constant Maturity +2.15%)± | | | 4.09 | | | | 2-1-2033 | | | | 57,760 | | | | 59,181 | |
FNMA (12 Month LIBOR +1.68%)± | | | 4.10 | | | | 9-1-2038 | | | | 521,247 | | | | 547,773 | |
FNMA (11th District Cost of Funds +1.83%)± | | | 4.10 | | | | 6-1-2034 | | | | 102,979 | | | | 105,215 | |
FNMA (1 Year Treasury Constant Maturity +2.37%)± | | | 4.12 | | | | 7-1-2027 | | | | 17,876 | | | | 18,110 | |
FNMA (1 Year Treasury Constant Maturity +2.31%)± | | | 4.12 | | | | 12-1-2034 | | | | 583,631 | | | | 621,419 | |
FNMA (1 Year Treasury Constant Maturity +2.50%)± | | | 4.13 | | | | 6-1-2032 | | | | 81,291 | | | | 82,817 | |
FNMA (12 Month LIBOR +1.61%)± | | | 4.13 | | | | 1-1-2040 | | | | 146,399 | | | | 152,010 | |
FNMA (1 Year Treasury Constant Maturity +1.76%)± | | | 4.13 | | | | 8-1-2032 | | | | 123,826 | | | | 126,906 | |
FNMA (1 Year Treasury Constant Maturity +1.93%)± | | | 4.13 | | | | 7-1-2038 | | | | 502,039 | | | | 521,605 | |
FNMA (1 Year Treasury Constant Maturity +2.18%)± | | | 4.14 | | | | 9-1-2035 | | | | 861,890 | | | | 914,453 | |
FNMA (12 Month Treasury Average +1.98%)± | | | 4.14 | | | | 11-1-2035 | | | | 662,376 | | | | 676,781 | |
The accompanying notes are an integral part of these financial statements.
12 | Wells Fargo Adjustable Rate Government Fund
Portfolio of investments—February 29, 2020 (unaudited)
| | | | | | | | | | | | | | | | |
| | | Interest
rate | | | Maturity
date | | | Principal | | | Value | |
| Agency Securities (continued) | | | | | | | | | | | | |
FNMA (Federal Cost of Funds +2.00%)± | | | 4.14 | % | | | 8-1-2029 | | | $ | 31,173 | | | $ | 32,140 | |
FNMA (11th District Cost of Funds +1.93%)± | | | 4.15 | | | | 12-1-2036 | | | | 51,229 | | | | 53,084 | |
FNMA (1 Year Treasury Constant Maturity +2.30%)± | | | 4.15 | | | | 1-1-2026 | | | | 150,334 | | | | 154,596 | |
FNMA (1 Year Treasury Constant Maturity +2.04%)± | | | 4.15 | | | | 6-1-2034 | | | | 347,102 | | | | 358,352 | |
FNMA (1 Year Treasury Constant Maturity +2.17%)± | | | 4.15 | | | | 12-1-2035 | | | | 228,919 | | | | 242,811 | |
FNMA (1 Year Treasury Constant Maturity +2.29%)± | | | 4.15 | | | | 1-1-2031 | | | | 273,040 | | | | 289,138 | |
FNMA (1 Year Treasury Constant Maturity +2.19%)± | | | 4.15 | | | | 9-1-2035 | | | | 116,934 | | | | 124,099 | |
FNMA (12 Month Treasury Average +1.99%)± | | | 4.16 | | | | 10-1-2035 | | | | 318,821 | | | | 330,885 | |
FNMA (1 Year Treasury Constant Maturity +1.67%)± | | | 4.17 | | | | 4-1-2033 | | | | 80,840 | | | | 83,267 | |
FNMA (1 Year Treasury Constant Maturity +2.22%)± | | | 4.17 | | | | 10-1-2034 | | | | 133,104 | | | | 141,464 | |
FNMA (12 Month LIBOR +1.82%)± | | | 4.18 | | | | 4-1-2035 | | | | 724,120 | | | | 762,883 | |
FNMA (1 Year Treasury Constant Maturity +2.20%)± | | | 4.18 | | | | 5-1-2036 | | | | 447,601 | | | | 474,498 | |
FNMA (1 Year Treasury Constant Maturity +2.12%)± | | | 4.19 | | | | 4-1-2040 | | | | 99,674 | | | | 105,444 | |
FNMA (12 Month Treasury Average +2.01%)± | | | 4.19 | | | | 7-1-2035 | | | | 453,137 | | | | 470,659 | |
FNMA (12 Month Treasury Average +2.07%)± | | | 4.19 | | | | 1-1-2035 | | | | 269,874 | | | | 273,376 | |
FNMA (12 Month LIBOR +1.90%)± | | | 4.20 | | | | 10-1-2034 | | | | 393,595 | | | | 415,295 | |
FNMA (11th District Cost of Funds +1.87%)± | | | 4.20 | | | | 5-1-2034 | | | | 120,652 | | | | 123,354 | |
FNMA (1 Year Treasury Constant Maturity +2.04%)± | | | 4.20 | | | | 12-1-2033 | | | | 481,993 | | | | 502,397 | |
FNMA (1 Year Treasury Constant Maturity +2.15%)± | | | 4.21 | | | | 12-1-2034 | | | | 307,217 | | | | 324,117 | |
FNMA (5 Year Treasury Constant Maturity +2.43%)± | | | 4.21 | | | | 6-1-2028 | | | | 23,494 | | | | 23,750 | |
FNMA (1 Year Treasury Constant Maturity +2.19%)± | | | 4.22 | | | | 12-1-2032 | | | | 345,143 | | | | 365,648 | |
FNMA (1 Year Treasury Constant Maturity +2.22%)± | | | 4.22 | | | | 2-1-2034 | | | | 968,849 | | | | 1,004,767 | |
FNMA (1 Year Treasury Constant Maturity +2.22%)± | | | 4.22 | | | | 6-1-2026 | | | | 6,268 | | | | 6,450 | |
FNMA (1 Year Treasury Constant Maturity +2.60%)± | | | 4.22 | | | | 2-1-2028 | | | | 31,414 | | | | 31,824 | |
FNMA (1 Year Treasury Constant Maturity +2.03%)± | | | 4.22 | | | | 12-1-2032 | | | | 439,089 | | | | 456,224 | |
FNMA (6 Month LIBOR +1.98%)± | | | 4.23 | | | | 9-1-2033 | | | | 51,201 | | | | 51,735 | |
FNMA (1 Year Treasury Constant Maturity +2.15%)± | | | 4.23 | | | | 5-1-2035 | | | | 369,623 | | | | 391,249 | |
FNMA (1 Year Treasury Constant Maturity +2.21%)± | | | 4.23 | | | | 7-1-2029 | | | | 346,893 | | | | 366,832 | |
FNMA (12 Month LIBOR +1.72%)± | | | 4.23 | | | | 2-1-2038 | | | | 340,065 | | | | 357,752 | |
FNMA (1 Year Treasury Constant Maturity +2.50%)± | | | 4.25 | | | | 3-1-2027 | | | | 65,857 | | | | 67,726 | |
FNMA (1 Year Treasury Constant Maturity +1.88%)± | | | 4.26 | | | | 8-1-2031 | | | | 52,602 | | | | 54,697 | |
FNMA (1 Year Treasury Constant Maturity +2.52%)± | | | 4.27 | | | | 11-1-2024 | | | | 18,573 | | | | 18,714 | |
FNMA (1 Year Treasury Constant Maturity +2.19%)± | | | 4.27 | | | | 1-1-2033 | | | | 1,206,371 | | | | 1,245,084 | |
FNMA (1 Year Treasury Constant Maturity +2.11%)± | | | 4.27 | | | | 5-1-2034 | | | | 419,820 | | | | 436,278 | |
FNMA (1 Year Treasury Constant Maturity +2.21%)± | | | 4.27 | | | | 11-1-2035 | | | | 820,676 | | | | 869,656 | |
FNMA (1 Year Treasury Constant Maturity +2.19%)± | | | 4.27 | | | | 10-1-2036 | | | | 457,572 | | | | 484,879 | |
FNMA (1 Year Treasury Constant Maturity +2.49%)± | | | 4.27 | | | | 5-1-2035 | | | | 839,994 | | | | 902,553 | |
FNMA (1 Year Treasury Constant Maturity +2.28%)± | | | 4.28 | | | | 9-1-2026 | | | | 27,860 | | | | 28,394 | |
FNMA (1 Year Treasury Constant Maturity +2.37%)± | | | 4.28 | | | | 9-1-2030 | | | | 542,611 | | | | 577,164 | |
FNMA (12 Month LIBOR +1.69%)± | | | 4.29 | | | | 4-1-2034 | | | | 428,214 | | | | 448,977 | |
FNMA (1 Year Treasury Constant Maturity +2.29%)± | | | 4.29 | | | | 12-1-2030 | | | | 18,984 | | | | 19,395 | |
FNMA (1 Year Treasury Constant Maturity +1.58%)± | | | 4.30 | | | | 3-1-2034 | | | | 255,583 | | | | 269,000 | |
FNMA (1 Year Treasury Constant Maturity +2.21%)± | | | 4.31 | | | | 12-1-2036 | | | | 309,404 | | | | 328,015 | |
FNMA (12 Month LIBOR +1.99%)± | | | 4.31 | | | | 9-1-2035 | | | | 307,413 | | | | 326,406 | |
FNMA (1 Year Treasury Constant Maturity +2.26%)± | | | 4.32 | | | | 1-1-2038 | | | | 363,549 | | | | 386,230 | |
FNMA (1 Year Treasury Constant Maturity +2.41%)± | | | 4.32 | | | | 9-1-2033 | | | | 414,136 | | | | 440,768 | |
FNMA (1 Year Treasury Constant Maturity +2.19%)± | | | 4.32 | | | | 6-1-2036 | | | | 802,250 | | | | 848,883 | |
FNMA (12 Month LIBOR +1.71%)± | | | 4.33 | | | | 3-1-2037 | | | | 247,926 | | | | 261,931 | |
FNMA (1 Year Treasury Constant Maturity +2.33%)± | | | 4.33 | | | | 11-1-2024 | | | | 50,401 | | | | 51,894 | |
FNMA (3 Year Treasury Constant Maturity +2.47%)± | | | 4.34 | | | | 6-1-2024 | | | | 10,668 | | | | 10,778 | |
FNMA (1 Year Treasury Constant Maturity +2.21%)± | | | 4.34 | | | | 1-1-2027 | | | | 221,368 | | | | 223,221 | |
FNMA (1 Year Treasury Constant Maturity +2.58%)± | | | 4.35 | | | | 3-1-2032 | | | | 106,222 | | | | 109,779 | |
FNMA (12 Month LIBOR +1.74%)± | | | 4.35 | | | | 6-1-2041 | | | | 341,281 | | | | 356,195 | |
FNMA (1 Year Treasury Constant Maturity +2.36%)± | | | 4.35 | | | | 11-1-2034 | | | | 266,588 | | | | 283,833 | |
FNMA (1 Year Treasury Constant Maturity +2.19%)± | | | 4.35 | | | | 12-1-2040 | | | | 190,829 | | | | 201,504 | |
FNMA (1 Year Treasury Constant Maturity +2.14%)± | | | 4.36 | | | | 10-1-2033 | | | | 179,230 | | | | 189,114 | |
The accompanying notes are an integral part of these financial statements.
Wells Fargo Adjustable Rate Government Fund | 13
Portfolio of investments—February 29, 2020 (unaudited)
| | | | | | | | | | | | | | | | |
| | | Interest
rate | | | Maturity
date | | | Principal | | | Value | |
| Agency Securities (continued) | | | | | | | | | | | | |
FNMA (6 Month LIBOR +2.48%)± | | | 4.36 | % | | | 7-1-2033 | | | $ | 32,530 | | | $ | 32,784 | |
FNMA (1 Year Treasury Constant Maturity +2.24%)± | | | 4.36 | | | | 5-1-2033 | | | | 170,098 | | | | 177,020 | |
FNMA (1 Year Treasury Constant Maturity +2.25%)± | | | 4.37 | | | | 10-1-2035 | | | | 600,459 | | | | 636,082 | |
FNMA (6 Month LIBOR +2.25%)± | | | 4.37 | | | | 3-1-2034 | | | | 866,034 | | | | 914,085 | |
FNMA (1 Year Treasury Constant Maturity +2.22%)± | | | 4.38 | | | | 12-1-2040 | | | | 565,352 | | | | 598,376 | |
FNMA (1 Year Treasury Constant Maturity +2.21%)± | | | 4.39 | | | | 6-1-2036 | | | | 441,525 | | | | 467,164 | |
FNMA (3 Year Treasury Constant Maturity +2.14%)± | | | 4.39 | | | | 10-1-2025 | | | | 5,074 | | | | 5,118 | |
FNMA (1 Year Treasury Constant Maturity +2.22%)± | | | 4.40 | | | | 4-1-2038 | | | | 572,926 | | | | 605,482 | |
FNMA (1 Year Treasury Constant Maturity +2.05%)± | | | 4.41 | | | | 9-1-2035 | | | | 1,231,361 | | | | 1,294,845 | |
FNMA (1 Year Treasury Constant Maturity +2.28%)± | | | 4.41 | | | | 4-1-2024 | | | | 7,234 | | | | 7,433 | |
FNMA (12 Month LIBOR +1.67%)± | | | 4.42 | | | | 7-1-2035 | | | | 881,937 | | | | 926,306 | |
FNMA (1 Year Treasury Constant Maturity +2.13%)± | | | 4.42 | | | | 1-1-2037 | | | | 551,795 | | | | 581,793 | |
FNMA (12 Month Treasury Average +2.27%)± | | | 4.43 | | | | 9-1-2036 | | | | 262,804 | | | | 267,612 | |
FNMA (1 Year Treasury Constant Maturity +2.21%)± | | | 4.43 | | | | 9-1-2022 | | | | 48,749 | | | | 49,225 | |
FNMA (1 Year Treasury Constant Maturity +2.24%)± | | | 4.43 | | | | 12-1-2040 | | | | 389,077 | | | | 412,354 | |
FNMA (12 Month Treasury Average +2.31%)± | | | 4.43 | | | | 9-1-2036 | | | | 301,630 | | | | 313,727 | |
FNMA (1 Year Treasury Constant Maturity +1.87%)± | | | 4.44 | | | | 4-1-2030 | | | | 37,549 | | | | 38,044 | |
FNMA (1 Year Treasury Constant Maturity +2.22%)± | | | 4.45 | | | | 5-1-2033 | | | | 897,882 | | | | 928,343 | |
FNMA (12 Month Treasury Average +2.28%)± | | | 4.45 | | | | 8-1-2035 | | | | 532,420 | | | | 546,000 | |
FNMA (1 Year Treasury Constant Maturity +2.18%)± | | | 4.45 | | | | 1-1-2036 | | | | 386,667 | | | | 404,745 | |
FNMA (1 Year Treasury Constant Maturity +2.27%)± | | | 4.46 | | | | 5-1-2034 | | | | 172,060 | | | | 181,735 | |
FNMA (1 Year Treasury Constant Maturity +2.26%)± | | | 4.46 | | | | 7-1-2030 | | | | 316,485 | | | | 331,291 | |
FNMA (1 Year Treasury Constant Maturity +2.09%)± | | | 4.46 | | | | 8-1-2025 | | | | 16,103 | | | | 16,364 | |
FNMA (1 Year Treasury Constant Maturity +2.25%)± | | | 4.47 | | | | 5-1-2036 | | | | 1,096,717 | | | | 1,147,657 | |
FNMA (1 Year Treasury Constant Maturity +2.19%)± | | | 4.47 | | | | 2-1-2036 | | | | 391,642 | | | | 413,720 | |
FNMA (1 Year Treasury Constant Maturity +2.23%)± | | | 4.48 | | | | 11-1-2037 | | | | 442,230 | | | | 468,193 | |
FNMA (1 Year Treasury Constant Maturity +2.35%)± | | | 4.48 | | | | 7-1-2028 | | | | 343,667 | | | | 356,506 | |
FNMA (1 Year Treasury Constant Maturity +2.27%)± | | | 4.49 | | | | 10-1-2036 | | | | 377,332 | | | | 400,156 | |
FNMA (1 Year Treasury Constant Maturity +2.35%)± | | | 4.49 | | | | 1-1-2037 | | | | 539,638 | | | | 576,411 | |
FNMA (12 Month LIBOR +1.80%)± | | | 4.49 | | | | 7-1-2033 | | | | 516,029 | | | | 543,247 | |
FNMA (1 Year Treasury Constant Maturity +2.12%)± | | | 4.49 | | | | 8-1-2026 | | | | 23,939 | | | | 24,287 | |
FNMA (1 Year Treasury Constant Maturity +2.33%)± | | | 4.49 | | | | 4-1-2036 | | | | 318,728 | | | | 338,143 | |
FNMA (1 Year Treasury Constant Maturity +2.11%)± | | | 4.49 | | | | 7-1-2035 | | | | 444,283 | | | | 467,878 | |
FNMA (12 Month Treasury Average +2.35%)± | | | 4.50 | | | | 8-1-2040 | | | | 393,679 | | | | 403,290 | |
FNMA (1 Year Treasury Constant Maturity +2.18%)± | | | 4.50 | | | | 9-1-2036 | | | | 373,150 | | | | 397,083 | |
FNMA (1 Year Treasury Constant Maturity +2.28%)± | | | 4.50 | | | | 4-1-2024 | | | | 21,645 | | | | 21,909 | |
FNMA (1 Year Treasury Constant Maturity +2.24%)± | | | 4.50 | | | | 1-1-2037 | | | | 822,707 | | | | 872,631 | |
FNMA (1 Year Treasury Constant Maturity +2.20%)± | | | 4.50 | | | | 9-1-2035 | | | | 283,216 | | | | 301,373 | |
FNMA (12 Month Treasury Average +2.36%)± | | | 4.50 | | | | 5-1-2036 | | | | 274,750 | | | | 289,371 | |
FNMA (1 Year Treasury Constant Maturity +2.60%)± | | | 4.51 | | | | 10-1-2025 | | | | 6,270 | | | | 6,378 | |
FNMA (12 Month LIBOR +1.65%)± | | | 4.51 | | | | 11-1-2038 | | | | 250,799 | | | | 263,310 | |
FNMA (1 Year Treasury Constant Maturity +2.22%)± | | | 4.51 | | | | 8-1-2026 | | | | 171,671 | | | | 178,503 | |
FNMA (1 Year Treasury Constant Maturity +1.89%)± | | | 4.52 | | | | 6-1-2032 | | | | 54,167 | | | | 54,283 | |
FNMA (1 Year Treasury Constant Maturity +2.36%)± | | | 4.52 | | | | 1-1-2029 | | | | 145,235 | | | | 150,938 | |
FNMA (1 Year Treasury Constant Maturity +2.22%)± | | | 4.52 | | | | 9-1-2033 | | | | 354,077 | | | | 372,928 | |
FNMA (6 Month LIBOR +2.63%)± | | | 4.54 | | | | 4-1-2033 | | | | 215,504 | | | | 223,872 | |
FNMA (1 Year Treasury Constant Maturity +2.10%)± | | | 4.54 | | | | 7-1-2035 | | | | 80,386 | | | | 83,056 | |
FNMA (12 Month LIBOR +1.75%)± | | | 4.54 | | | | 7-1-2035 | | | | 416,859 | | | | 438,659 | |
FNMA (1 Year Treasury Constant Maturity +2.11%)± | | | 4.54 | | | | 9-1-2036 | | | | 301,997 | | | | 313,412 | |
FNMA (1 Year Treasury Constant Maturity +2.21%)± | | | 4.55 | | | | 8-1-2035 | | | | 603,274 | | | | 641,254 | |
FNMA (12 Month LIBOR +1.86%)± | | | 4.56 | | | | 5-1-2038 | | | | 506,944 | | | | 537,586 | |
FNMA (12 Month LIBOR +1.91%)± | | | 4.56 | | | | 8-1-2034 | | | | 1,069,340 | | | | 1,130,524 | |
FNMA (1 Year Treasury Constant Maturity +2.18%)± | | | 4.56 | | | | 6-1-2035 | | | | 184,475 | | | | 193,847 | |
FNMA (1 Year Treasury Constant Maturity +2.19%)± | | | 4.57 | | | | 8-1-2033 | | | | 490,871 | | | | 516,123 | |
FNMA (1 Year Treasury Constant Maturity +2.38%)± | | | 4.57 | | | | 7-1-2027 | | | | 71,484 | | | | 73,366 | |
FNMA (1 Year Treasury Constant Maturity +2.23%)± | | | 4.57 | | | | 1-1-2035 | | | | 324,674 | | | | 343,852 | |
The accompanying notes are an integral part of these financial statements.
14 | Wells Fargo Adjustable Rate Government Fund
Portfolio of investments—February 29, 2020 (unaudited)
| | | | | | | | | | | | | | | | |
| | | Interest
rate | | | Maturity
date | | | Principal | | | Value | |
| Agency Securities (continued) | | | | | | | | | | | | |
FNMA (1 Year Treasury Constant Maturity +2.50%)± | | | 4.57 | % | | | 9-1-2030 | | | $ | 419,739 | | | $ | 440,402 | |
FNMA (1 Year Treasury Constant Maturity +2.21%)± | | | 4.59 | | | | 7-1-2033 | | | | 34,004 | | | | 35,825 | |
FNMA (1 Year Treasury Constant Maturity +2.21%)± | | | 4.59 | | | | 7-1-2035 | | | | 287,607 | | | | 305,734 | |
FNMA (1 Year Treasury Constant Maturity +2.29%)± | | | 4.59 | | | | 9-1-2030 | | | | 73,867 | | | | 74,845 | |
FNMA (1 Year Treasury Constant Maturity +2.24%)± | | | 4.59 | | | | 4-1-2033 | | | | 327,621 | | | | 342,365 | |
FNMA (12 Month LIBOR +1.72%)± | | | 4.60 | | | | 6-1-2035 | | | | 127,998 | | | | 134,739 | |
FNMA (1 Year Treasury Constant Maturity +2.22%)± | | | 4.60 | | | | 7-1-2035 | | | | 98,968 | | | | 104,537 | |
FNMA (1 Year Treasury Constant Maturity +2.22%)± | | | 4.60 | | | | 7-1-2035 | | | | 412,813 | | | | 436,964 | |
FNMA (1 Year Treasury Constant Maturity +2.21%)± | | | 4.60 | | | | 6-1-2027 | | | | 64,875 | | | | 66,273 | |
FNMA (1 Year Treasury Constant Maturity +2.15%)± | | | 4.61 | | | | 4-1-2033 | | | | 745,930 | | | | 786,699 | |
FNMA (12 Month LIBOR +1.74%)± | | | 4.62 | | | | 5-1-2032 | | | | 152,347 | | | | 154,107 | |
FNMA (1 Year Treasury Constant Maturity +2.41%)± | | | 4.62 | | | | 5-1-2027 | | | | 46,616 | | | | 48,409 | |
FNMA (1 Year Treasury Constant Maturity +2.12%)± | | | 4.62 | | | | 3-1-2031 | | | | 29,556 | | | | 29,632 | |
FNMA (1 Year Treasury Constant Maturity +2.24%)± | | | 4.62 | | | | 12-1-2040 | | | | 859,077 | | | | 884,818 | |
FNMA (12 Month LIBOR +1.79%)± | | | 4.62 | | | | 6-1-2036 | | | | 226,877 | | | | 239,431 | |
FNMA (12 Month LIBOR +1.72%)± | | | 4.62 | | | | 12-1-2033 | | | | 665,363 | | | | 695,857 | |
FNMA (1 Year Treasury Constant Maturity +2.51%)± | | | 4.62 | | | | 8-1-2035 | | | | 224,802 | | | | 235,380 | |
FNMA (1 Year Treasury Constant Maturity +2.13%)± | | | 4.63 | | | | 5-1-2033 | | | | 321,433 | | | | 331,277 | |
FNMA (1 Year Treasury Constant Maturity +2.14%)± | | | 4.63 | | | | 5-1-2034 | | | | 357,129 | | | | 371,105 | |
FNMA (1 Year Treasury Constant Maturity +2.24%)± | | | 4.63 | | | | 7-1-2037 | | | | 278,254 | | | | 294,805 | |
FNMA (1 Year Treasury Constant Maturity +2.13%)± | | | 4.63 | | | | 5-1-2033 | | | | 256,903 | | | | 269,835 | |
FNMA (1 Year Treasury Constant Maturity +2.19%)± | | | 4.65 | | | | 7-1-2035 | | | | 676,311 | | | | 705,280 | |
FNMA (1 Year Treasury Constant Maturity +2.64%)± | | | 4.66 | | | | 10-1-2028 | | | | 88,425 | | | | 90,350 | |
FNMA (12 Month LIBOR +1.75%)± | | | 4.67 | | | | 4-1-2034 | | | | 257,176 | | | | 269,357 | |
FNMA (1 Year Treasury Constant Maturity +2.29%)± | | | 4.67 | | | | 6-1-2037 | | | | 264,628 | | | | 278,476 | |
FNMA (Federal Cost of Funds +2.38%)± | | | 4.67 | | | | 2-1-2029 | | | | 818,872 | | | | 840,480 | |
FNMA (1 Year Treasury Constant Maturity +2.33%)± | | | 4.67 | | | | 12-1-2030 | | | | 488,168 | | | | 510,488 | |
FNMA (1 Year Treasury Constant Maturity +2.35%)± | | | 4.67 | | | | 3-1-2033 | | | | 552,266 | | | | 585,120 | |
FNMA (1 Year Treasury Constant Maturity +2.20%)± | | | 4.67 | | | | 6-1-2033 | | | | 296,630 | | | | 309,206 | |
FNMA (1 Year Treasury Constant Maturity +2.18%)± | | | 4.69 | | | | 5-1-2035 | | | | 111,480 | | | | 118,012 | |
FNMA (1 Year Treasury Constant Maturity +2.31%)± | | | 4.69 | | | | 2-1-2035 | | | | 395,010 | | | | 419,481 | |
FNMA (12 Month LIBOR +1.75%)± | | | 4.70 | | | | 5-1-2035 | | | | 568,400 | | | | 597,621 | |
FNMA (1 Year Treasury Constant Maturity +2.21%)± | | | 4.70 | | | | 6-1-2035 | | | | 503,424 | | | | 532,405 | |
FNMA (1 Year Treasury Constant Maturity +2.22%)± | | | 4.71 | | | | 5-1-2033 | | | | 156,635 | | | | 165,466 | |
FNMA (12 Month LIBOR +1.84%)± | | | 4.72 | | | | 6-1-2041 | | | | 486,386 | | | | 508,932 | |
FNMA (12 Month LIBOR +1.80%)± | | | 4.72 | | | | 5-1-2033 | | | | 256,944 | | | | 269,951 | |
FNMA (1 Year Treasury Constant Maturity +2.22%)± | | | 4.72 | | | | 6-1-2035 | | | | 347,494 | | | | 367,684 | |
FNMA (1 Year Treasury Constant Maturity +2.21%)± | | | 4.72 | | | | 5-1-2037 | | | | 744,323 | | | | 776,043 | |
FNMA (1 Year Treasury Constant Maturity +2.35%)± | | | 4.73 | | | | 6-1-2030 | | | | 31,543 | | | | 32,168 | |
FNMA (1 Year Treasury Constant Maturity +2.23%)± | | | 4.73 | | | | 1-1-2032 | | | | 6,129 | | | | 6,194 | |
FNMA (1 Year Treasury Constant Maturity +2.27%)± | | | 4.74 | | | | 6-1-2036 | | | | 104,578 | | | | 110,857 | |
FNMA (1 Year Treasury Constant Maturity +2.32%)± | | | 4.74 | | | | 10-1-2034 | | | | 140,055 | | | | 147,982 | |
FNMA (1 Year Treasury Constant Maturity +2.24%)± | | | 4.74 | | | | 7-1-2028 | | | | 97 | | | | 101 | |
FNMA (12 Month LIBOR +1.75%)± | | | 4.75 | | | | 4-1-2033 | | | | 333,695 | | | | 346,143 | |
FNMA (1 Year Treasury Constant Maturity +2.25%)± | | | 4.75 | | | | 10-1-2029 | | | | 15,554 | | | | 15,981 | |
FNMA (1 Year Treasury Constant Maturity +2.26%)± | | | 4.76 | | | | 5-1-2035 | | | | 395,586 | | | | 415,371 | |
FNMA (1 Year Treasury Constant Maturity +2.21%)± | | | 4.77 | | | | 6-1-2033 | | | | 167,067 | | | | 172,352 | |
FNMA (12 Month LIBOR +1.90%)± | | | 4.78 | | | | 5-1-2037 | | | | 1,233,810 | | | | 1,309,311 | |
FNMA (1 Year Treasury Constant Maturity +2.31%)± | | | 4.78 | | | | 9-1-2037 | | | | 466,322 | | | | 499,162 | |
FNMA (1 Year Treasury Constant Maturity +2.22%)± | | | 4.79 | | | | 4-1-2033 | | | | 534,820 | | | | 554,369 | |
FNMA (1 Year Treasury Constant Maturity +2.31%)± | | | 4.82 | | | | 5-1-2035 | | | | 529,519 | | | | 559,498 | |
FNMA (1 Year Treasury Constant Maturity +2.47%)± | | | 4.84 | | | | 9-1-2028 | | | | 34,548 | | | | 35,339 | |
FNMA (1 Year Treasury Constant Maturity +2.35%)± | | | 4.85 | | | | 6-1-2027 | | | | 60,069 | | | | 61,003 | |
FNMA (1 Year Treasury Constant Maturity +2.47%)± | | | 4.85 | | | | 9-1-2035 | | | | 38,940 | | | | 41,561 | |
FNMA (1 Year Treasury Constant Maturity +2.32%)± | | | 4.86 | | | | 4-1-2038 | | | | 257,750 | | | | 268,499 | |
FNMA (1 Year Treasury Constant Maturity +2.64%)± | | | 4.88 | | | | 7-1-2028 | | | | 86,144 | | | | 88,267 | |
The accompanying notes are an integral part of these financial statements.
Wells Fargo Adjustable Rate Government Fund | 15
Portfolio of investments—February 29, 2020 (unaudited)
| | | | | | | | | | | | | | | | |
| | | Interest
rate | | | Maturity
date | | | Principal | | | Value | |
| Agency Securities (continued) | | | | | | | | | | | | |
FNMA (6 Month LIBOR +2.64%)± | | | 4.90 | % | | | 4-1-2024 | | | $ | 111,780 | | | $ | 116,538 | |
FNMA (3 Year Treasury Constant Maturity +2.15%)± | | | 4.90 | | | | 8-1-2031 | | | | 31,328 | | | | 31,984 | |
FNMA (12 Month Treasury Average +2.48%)± | | | 4.90 | | | | 6-1-2040 | | | | 649,468 | | | | 670,234 | |
FNMA (1 Year Treasury Constant Maturity +2.19%)± | | | 4.90 | | | | 3-1-2035 | | | | 406,328 | | | | 426,081 | |
FNMA (1 Year Treasury Constant Maturity +2.45%)± | | | 4.92 | | | | 7-1-2037 | | | | 1,375,881 | | | | 1,465,924 | |
FNMA (1 Year Treasury Constant Maturity +2.32%)± | | | 4.95 | | | | 4-1-2028 | | | | 111,571 | | | | 115,160 | |
FNMA (6 Month LIBOR +2.76%)± | | | 4.98 | | | | 5-1-2033 | | | | 879,655 | | | | 948,383 | |
FNMA (1 Year Treasury Constant Maturity +2.49%)± | | | 4.99 | | | | 7-1-2037 | | | | 217,247 | | | | 227,674 | |
FNMA (1 Year Treasury Constant Maturity +2.28%)± | | | 5.03 | | | | 7-1-2024 | | | | 7,058 | | | | 7,152 | |
FNMA (1 Year Treasury Constant Maturity +2.50%)± | | | 5.04 | | | | 10-1-2029 | | | | 271,986 | | | | 284,778 | |
FNMA (6 Month LIBOR +2.70%)± | | | 5.05 | | | | 1-1-2033 | | | | 57,796 | | | | 58,753 | |
FNMA (1 Year Treasury Constant Maturity +2.64%)± | | | 5.09 | | | | 3-1-2030 | | | | 5,154 | | | | 5,273 | |
FNMA (1 Year Treasury Constant Maturity +2.83%)± | | | 5.10 | | | | 9-1-2030 | | | | 168,245 | | | | 177,177 | |
FNMA (1 Year Treasury Constant Maturity +2.40%)± | | | 5.15 | | | | 6-1-2024 | | | | 27,059 | | | | 27,360 | |
FNMA (1 Year Treasury Constant Maturity +2.69%)± | | | 5.19 | | | | 5-1-2035 | | | | 551,371 | | | | 588,643 | |
FNMA (6 Month LIBOR +3.47%)± | | | 5.47 | | | | 12-1-2032 | | | | 138,468 | | | | 142,748 | |
FNMA (1 Year Treasury Constant Maturity +2.87%)± | | | 5.50 | | | | 8-1-2030 | | | | 72,353 | | | | 72,292 | |
FNMA (6 Month LIBOR +3.57%)± | | | 5.82 | | | | 11-1-2031 | | | | 9,174 | | | | 9,171 | |
FNMA | | | 6.50 | | | | 8-1-2028 | | | | 42,054 | | | | 43,209 | |
FNMA | | | 6.50 | | | | 5-1-2031 | | | | 85,327 | | | | 96,195 | |
FNMA | | | 7.06 | | | | 11-1-2024 | | | | 1,776 | | | | 1,779 | |
FNMA | | | 7.06 | | | | 12-1-2024 | | | | 18,960 | | | | 19,019 | |
FNMA | | | 7.06 | | | | 3-1-2025 | | | | 33,195 | | | | 33,671 | |
FNMA | | | 7.06 | | | | 1-1-2027 | | | | 19,934 | | | | 19,972 | |
FNMA | | | 7.50 | | | | 1-1-2031 | | | | 38,310 | | | | 41,687 | |
FNMA | | | 7.50 | | | | 1-1-2033 | | | | 108,730 | | | | 117,302 | |
FNMA | | | 7.50 | | | | 5-1-2033 | | | | 98,508 | | | | 108,624 | |
FNMA | | | 7.50 | | | | 5-1-2033 | | | | 106,394 | | | | 115,832 | |
FNMA | | | 7.50 | | | | 6-1-2033 | | | | 22,059 | | | | 22,231 | |
FNMA | | | 7.50 | | | | 7-1-2033 | | | | 35,789 | | | | 36,147 | |
FNMA | | | 7.50 | | | | 8-1-2033 | | | | 49,360 | | | | 51,087 | |
FNMA | | | 8.00 | | | | 12-1-2026 | | | | 31,540 | | | | 34,489 | |
FNMA | | | 8.00 | | | | 2-1-2030 | | | | 154 | | | | 155 | |
FNMA | | | 8.00 | | | | 3-1-2030 | | | | 178 | | | | 190 | |
FNMA | | | 8.00 | | | | 5-1-2033 | | | | 46,653 | | | | 47,919 | |
FNMA | | | 8.50 | | | | 10-1-2026 | | | | 631 | | | | 634 | |
FNMA | | | 8.50 | | | | 8-15-2024 | | | | 19,856 | | | | 20,103 | |
FNMA | | | 10.00 | | | | 1-20-2021 | | | | 181 | | | | 182 | |
FNMA Series1992-39 Class FA (7 Year Treasury Constant Maturity +0.00%)± | | | 1.74 | | | | 3-25-2022 | | | | 33,978 | | | | 33,921 | |
FNMA Series1992-45 Class F (7 Year Treasury Constant Maturity +0.00%)± | | | 1.74 | | | | 4-25-2022 | | | | 6,514 | | | | 6,502 | |
FNMA Series1992-87 Class Z | | | 8.00 | | | | 5-25-2022 | | | | 3,672 | | | | 3,854 | |
FNMA Series1993-113 Class FA (10 Year Treasury Constant Maturity-0.65%)± | | | 1.17 | | | | 7-25-2023 | | | | 27,933 | | | | 27,895 | |
FNMA Series1993-247 Class FM (11th District Cost of Funds +1.20%)± | | | 2.24 | | | | 12-25-2023 | | | | 146,635 | | | | 148,752 | |
FNMA Series1994-14 Class F (11th District Cost of Funds +1.60%)± | | | 2.64 | | | | 10-25-2023 | | | | 81,706 | | | | 83,384 | |
FNMA Series2001-50 Class BA | | | 7.00 | | | | 10-25-2041 | | | | 104,767 | | | | 120,210 | |
FNMA Series2001-63 Class FD (1 Month LIBOR +0.60%)± | | | 2.26 | | | | 12-18-2031 | | | | 99,006 | | | | 99,463 | |
FNMA Series2001-81 Class F (1 Month LIBOR +0.55%)± | | | 2.21 | | | | 1-25-2032 | | | | 42,281 | | | | 42,439 | |
FNMA Series2001-T08 Class A1 | | | 7.50 | | | | 7-25-2041 | | | | 97,002 | | | | 115,191 | |
FNMA Series2001-T10 Class A2 | | | 7.50 | | | | 12-25-2041 | | | | 1,574,995 | | | | 1,804,060 | |
FNMA Series2001-T12 Class A2 | | | 7.50 | | | | 8-25-2041 | | | | 130,272 | | | | 155,458 | |
FNMA Series2001-T12 Class A4±± | | | 4.59 | | | | 8-25-2041 | | | | 3,122,347 | | | | 3,242,942 | |
FNMA Series2001-W01 Class AV1 (1 Month LIBOR +0.24%)± | | | 1.90 | | | | 8-25-2031 | | | | 44,140 | | | | 43,076 | |
FNMA Series2001-W03 Class A±± | | | 7.00 | | | | 9-25-2041 | | | | 390,622 | | | | 432,751 | |
FNMA Series2002-05 Class FD (1 Month LIBOR +0.90%)± | | | 2.56 | | | | 2-25-2032 | | | | 86,266 | | | | 87,300 | |
FNMA Series2002-33 Class A4±± | | | 5.42 | | | | 11-25-2030 | | | | 106,171 | | | | 111,790 | |
FNMA Series2002-59 Class F (1 Month LIBOR +0.40%)± | | | 2.06 | | | | 9-25-2032 | | | | 287,896 | | | | 288,674 | |
The accompanying notes are an integral part of these financial statements.
16 | Wells Fargo Adjustable Rate Government Fund
Portfolio of investments—February 29, 2020 (unaudited)
| | | | | | | | | | | | | | | | |
| | | Interest
rate | | | Maturity
date | | | Principal | | | Value | |
| Agency Securities (continued) | | | | | | | | | | | | |
FNMA Series2002-66 Class A3±± | | | 4.25 | % | | | 4-25-2042 | | | $ | 6,017,603 | | | $ | 6,289,723 | |
FNMA Series2002-T12 Class A3 | | | 7.50 | | | | 5-25-2042 | | | | 1,086,367 | | | | 1,325,267 | |
FNMA Series2002-T12 Class A5±± | | | 4.84 | | | | 10-25-2041 | | | | 1,316,846 | | | | 1,392,922 | |
FNMA Series2002-T18 Class A5±± | | | 4.58 | | | | 5-25-2042 | | | | 2,649,162 | | | | 2,837,848 | |
FNMA Series2002-T19 Class A4±± | | | 4.59 | | | | 3-25-2042 | | | | 155,474 | | | | 167,447 | |
FNMA Series2002-W01 Class 3A±± | | | 4.12 | | | | 4-25-2042 | | | | 787,909 | | | | 813,162 | |
FNMA Series2002-W04 Class A6±± | | | 4.55 | | | | 5-25-2042 | | | | 1,286,152 | | | | 1,346,080 | |
FNMA Series2003-07 Class A2±± | | | 4.04 | | | | 5-25-2042 | | | | 588,519 | | | | 600,474 | |
FNMA Series2003-63 Class A8±± | | | 4.03 | | | | 1-25-2043 | | | | 953,596 | | | | 992,039 | |
FNMA Series2003-W02 Class 1A3 | | | 7.50 | | | | 7-25-2042 | | | | 299,355 | | | | 368,505 | |
FNMA Series2003-W04 Class 5A±± | | | 4.37 | | | | 10-25-2042 | | | | 802,854 | | | | 826,705 | |
FNMA Series2003-W08 Class 4A±± | | | 4.43 | | | | 11-25-2042 | | | | 973,776 | | | | 1,024,778 | |
FNMA Series2003-W09 Class A (1 Month LIBOR +0.12%)± | | | 1.90 | | | | 6-25-2033 | | | | 1,377,678 | | | | 1,354,165 | |
FNMA Series2003-W10 Class 2A±± | | | 4.12 | | | | 6-25-2043 | | | | 1,929,246 | | | | 2,042,371 | |
FNMA Series2003-W18 Class 2A±± | | | 4.35 | | | | 6-25-2043 | | | | 2,781,118 | | | | 2,969,840 | |
FNMA Series2004-T03 Class 1A3 | | | 7.00 | | | | 2-25-2044 | | | | 359,712 | | | | 428,732 | |
FNMA Series2004-T03 Class 2A±± | | | 4.35 | | | | 8-25-2043 | | | | 1,030,176 | | | | 1,072,730 | |
FNMA Series2004-W01 Class 2A2 | | | 7.00 | | | | 12-25-2033 | | | | 190,757 | | | | 224,092 | |
FNMA Series2004-W01 Class 3A±± | | | 4.45 | | | | 1-25-2043 | | | | 56,491 | | | | 59,151 | |
FNMA Series2004-W02 Class 5A | | | 7.50 | | | | 3-25-2044 | | | | 81,324 | | | | 94,636 | |
FNMA Series2004-W12 Class 2A±± | | | 4.36 | | | | 6-25-2044 | | | | 2,845,568 | | | | 3,035,200 | |
FNMA Series2004-W15 Class 3A±± | | | 4.47 | | | | 6-25-2044 | | | | 4,569,255 | | | | 4,755,055 | |
FNMA Series2005-W03 Class 3A±± | | | 4.21 | | | | 4-25-2045 | | | | 877,082 | | | | 936,438 | |
FNMA Series2006-15 Class FW (1 Month LIBOR +0.30%)± | | | 1.96 | | | | 1-25-2036 | | | | 25,689 | | | | 25,697 | |
FNMA Series2006-44 Class FY (1 Month LIBOR +0.57%)± | | | 2.23 | | | | 6-25-2036 | | | | 968,674 | | | | 975,808 | |
FNMA Series2006-W01 Class 3A±± | | | 4.24 | | | | 10-25-2045 | | | | 3,474,636 | | | | 3,634,088 | |
FNMA Series2007-95 Class A2 (1 Month LIBOR +0.25%)± | | | 1.91 | | | | 8-27-2036 | | | | 249,858 | | | | 248,689 | |
FNMA Series2012-47 Class FW (1 Month LIBOR +1.70%)± | | | 3.36 | | | | 5-25-2027 | | | | 286,236 | | | | 295,596 | |
FNMA Series2019-74 Class GF±± | | | 2.11 | | | | 11-25-2049 | | | | 2,450,279 | | | | 2,445,212 | |
FNMA SeriesG92-20 Class FB (7 Year Treasury Constant Maturity +0.00%)± | | | 1.74 | | | | 4-25-2022 | | | | 2,401 | | | | 2,398 | |
FNMA SeriesG93-1 Class K | | | 6.68 | | | | 1-25-2023 | | | | 109,846 | | | | 114,737 | |
FNMA SeriesG93-19 Class FD (10 Year Treasury Constant Maturity-0.65%)± | | | 1.17 | | | | 4-25-2023 | | | �� | 8,942 | | | | 8,942 | |
GNMA | | | 6.45 | | | | 4-20-2025 | | | | 28,092 | | | | 30,471 | |
GNMA | | | 6.45 | | | | 9-20-2025 | | | | 29,076 | | | | 32,669 | |
GNMA | | | 6.50 | | | | 6-20-2034 | | | | 69,193 | | | | 70,560 | |
GNMA | | | 6.50 | | | | 8-20-2034 | | | | 371,312 | | | | 401,714 | |
GNMA | | | 6.75 | | | | 2-15-2029 | | | | 38,078 | | | | 42,259 | |
GNMA | | | 9.00 | | | | 9-20-2024 | | | | 732 | | | | 745 | |
GNMA | | | 9.00 | | | | 11-20-2024 | | | | 98 | | | | 99 | |
GNMA | | | 9.00 | | | | 1-20-2025 | | | | 2,368 | | | | 2,482 | |
GNMA | | | 9.00 | | | | 2-20-2025 | | | | 10,785 | | | | 11,811 | |
GNMA Series2008-65 Class FG (1 Month LIBOR +0.75%)± | | | 2.40 | | | | 8-20-2038 | | | | 1,217,485 | | | | 1,231,933 | |
GNMA Series2008-68 Class FA (1 Month LIBOR +0.95%)± | | | 2.60 | | | | 8-20-2038 | | | | 1,491,420 | | | | 1,523,727 | |
GNMA Series2009-50 Class FW (1 Month LIBOR +1.00%)± | | | 2.65 | | | | 7-20-2039 | | | | 1,542,523 | | | | 1,568,521 | |
GNMA Series2009-52 Class FD (1 Month LIBOR +0.95%)± | | | 2.61 | | | | 7-16-2039 | | | | 749,833 | | | | 765,807 | |
GNMA Series2010-25 Class FH (1 Month LIBOR +0.72%)± | | | 2.38 | | | | 2-16-2040 | | | | 759,350 | | | | 767,258 | |
GNMA Series2011-H12 Class FA (1 Month LIBOR +0.49%)± | | | 2.22 | | | | 2-20-2061 | | | | 1,833,172 | | | | 1,834,142 | |
GNMA Series2011-H17 Class FA (1 Month LIBOR +0.53%)± | | | 2.26 | | | | 6-20-2061 | | | | 777,204 | | | | 778,368 | |
GNMA Series2017-H11 Class FE (12 Month LIBOR +0.18%)± | | | 2.91 | | | | 5-20-2067 | | | | 4,591,835 | | | | 4,564,034 | |
Overseas Private Investment Corporation | | | 2.12 | | | | 3-20-2024 | | | | 2,800,000 | | | | 2,866,212 | |
| |
Total Agency Securities (Cost $271,860,956) | | | | 278,395,489 | |
| | | | | | | | | | | | | | | | |
The accompanying notes are an integral part of these financial statements.
Wells Fargo Adjustable Rate Government Fund | 17
Portfolio of investments—February 29, 2020 (unaudited)
| | | | | | | | | | | | | | | | |
| | | Yield | | | | | | Shares | | | Value | |
| Short-Term Investments: 3.77% | | | | | | | | | | | | |
| | | | |
| Investment Companies: 3.77% | | | | | | | | | | | | |
Wells Fargo Government Money Market Fund Select Class (l)(u) | | | 1.52 | % | | | | | | | 11,047,967 | | | $ | 11,047,967 | |
| | | | | | | | | | | | | | | | |
| | | | |
Total Short-Term Investments (Cost $11,047,967) | | | | | | | | | | | | | | | 11,047,967 | |
| | | | | | | | | | | | | | | | |
| | | | | | | | |
| Total investments in securities (Cost $282,908,923) | | | 98.85 | % | | | 289,443,456 | |
| | |
Other assets and liabilities, net | | | 1.15 | | | | 3,366,596 | |
| | | | | | | | |
| Total net assets | | | 100.00 | % | | $ | 292,810,052 | |
| | | | | | | | |
| 144A | The security may be resold in transactions exempt from registration, normally to qualified institutional buyers, pursuant to Rule 144A under the Securities Act of 1933. |
| ± | Variable rate investment. The rate shown is the rate in effect at period end. |
| ±± | The coupon of the security is adjusted based on the principal and interest payments received from the underlying pool of mortgages as well as the credit quality and the actual prepayment speed of the underlying mortgages. |
| (c) | Investment in an interest-only security entitles holders to receive only the interest payments on the underlying mortgages. The principal amount shown is the notional amount of the underlying mortgages. The rate represents the coupon rate. |
| (l) | The issuer of the security is an affiliated person of the Fund as defined in the Investment Company Act of 1940. |
| (u) | The rate represents the7-day annualized yield at period end. |
Abbreviations:
| FHLMC | Federal Home Loan Mortgage Corporation |
| FNMA | Federal National Mortgage Association |
| GNMA | Government National Mortgage Association |
| LIBOR | London Interbank Offered Rate |
Investments in Affiliates
An affiliated investment is an investment in which the Fund owns at least 5% of the outstanding voting shares of the issuer or as a result of other relationships, such as the Fund and the issuer having the same investment manager. Transactions with issuers that were either affiliated persons of the Fund at the beginning of the period or the end of the period were as follows:
| | | | | | | | | | | | | | | | | | | | | | | | | | | | | | | | | | | | |
| | | Shares, beginning of
period | | | Shares purchased | | | Shares sold | | | Shares, end of period | | | Net realized gains (losses) | | | Net change in unrealized gains (losses) | | | Income from affiliated securities | | | Value, end of
period | | | % of net assets | |
| | | | | | | | | |
| Short-Term Investments | | | | | | | | | | | | | | | | | | | | | | | | | | | |
Investment Companies | | | | | | | | | | | | | | | | | | | | | | | | | | | | | | | | | | | | |
Wells Fargo Government Money Market Fund Select Class | | | 10,631,386 | | | | 53,432,505 | | | | (53,015,924 | ) | | | 11,047,967 | | | $ | 0 | | | $ | 0 | | | $ | 103,722 | | | $ | 11,047,967 | | | | 3.77 | % |
The accompanying notes are an integral part of these financial statements.
18 | Wells Fargo Adjustable Rate Government Fund
Statement of assets and liabilities—February 29, 2020 (unaudited)
| | | | |
| | | | |
| |
Assets | | | | |
Investments in unaffiliated securities, at value (cost $271,860,956) | | $ | 278,395,489 | |
Investments in affiliated securities, at value (cost $11,047,967) | | | 11,047,967 | |
Principal paydown receivable | | | 1,304,691 | |
Receivable for Fund shares sold | | | 1,653,538 | |
Receivable for interest | | | 1,064,448 | |
Prepaid expenses and other assets | | | 15,529 | |
| | | | |
Total assets | | | 293,481,662 | |
| | | | |
| |
Liabilities | | | | |
Payable for Fund shares redeemed | | | 387,581 | |
Management fee payable | | | 53,668 | |
Dividends payable | | | 55,595 | |
Administration fees payable | | | 27,299 | |
Distribution fee payable | | | 3,580 | |
Custody and accounting fees payable | | | 99,719 | |
Trustees’ fees and expenses payable | | | 6,002 | |
Accrued expenses and other liabilities | | | 38,166 | |
| | | | |
Total liabilities | | | 671,610 | |
| | | | |
Total net assets | | $ | 292,810,052 | |
| | | | |
| |
Net assets consist of | | | | |
Paid-in capital | | $ | 286,805,541 | |
Total distributable earnings | | | 6,004,511 | |
| | | | |
Total net assets | | $ | 292,810,052 | |
| | | | |
| |
Computation of net asset value and offering price per share | | | | |
Net assets – Class A | | $ | 118,950,692 | |
Shares outstanding – Class A1 | | | 13,216,773 | |
Net asset value per share – Class A | | | $9.00 | |
Maximum offering price per share – Class A2 | | | $9.18 | |
Net assets – Class C | | $ | 5,885,782 | |
Shares outstanding – Class C1 | | | 655,064 | |
Net asset value per share – Class C | | | $8.99 | |
Net assets – Administrator Class | | $ | 5,412,772 | |
Shares outstanding – Administrator Class1 | | | 601,283 | |
Net asset value per share – Administrator Class | | | $9.00 | |
Net assets – Institutional Class | | $ | 162,560,806 | |
Shares outstanding – Institutional Class1 | | | 18,063,703 | |
Net asset value per share – Institutional Class | | | $9.00 | |
| 1 | The Fund has an unlimited number of authorized shares. |
| 2 | Maximum offering price is computed as 100/98 of net asset value. On investments of $50,000 or more, the offering price is reduced. |
The accompanying notes are an integral part of these financial statements.
Wells Fargo Adjustable Rate Government Fund | 19
Statement of operations—six months ended February 29, 2020 (unaudited)
| | | | |
| | | | |
| |
Investment income | | | | |
Interest | | $ | 4,031,733 | |
Income from affiliated securities | | | 103,722 | |
| | | | |
Total investment income | | | 4,135,455 | |
| | | | |
| |
Expenses | | | | |
Management fee | | | 497,932 | |
Administration fees | | | | |
Class A | | | 93,177 | |
Class C | | | 4,554 | |
Administrator Class | | | 2,637 | |
Institutional Class | | | 62,838 | |
Shareholder servicing fees | | | | |
Class A | | | 145,589 | |
Class C | | | 7,116 | |
Administrator Class | | | 6,592 | |
Distribution fee | | | | |
Class C | | | 21,274 | |
Custody and accounting fees | | | 38,526 | |
Professional fees | | | 34,157 | |
Registration fees | | | 48,740 | |
Shareholder report expenses | | | 29,753 | |
Trustees’ fees and expenses | | | 10,909 | |
Other fees and expenses | | | 25,737 | |
| | | | |
Total expenses | | | 1,029,531 | |
Less: Fee waivers and/or expense reimbursements | | | | |
Fund-level | | | (146,104 | ) |
Class A | | | (28,581 | ) |
Class C | | | (1,294 | ) |
Administrator Class | | | (3,057 | ) |
| | | | |
Net expenses | | | 850,495 | |
| | | | |
Net investment income | | | 3,284,960 | |
| | | | |
| |
Realized and unrealized gains (losses) on investments | | | | |
Net realized gains on investments | | | 1,431 | |
Net change in unrealized gains (losses) on investments | | | 658,189 | |
| | | | |
Net realized and unrealized gains (losses) on investments | | | 659,620 | |
| | | | |
Net increase in net assets resulting from operations | | $ | 3,944,580 | |
| | | | |
The accompanying notes are an integral part of these financial statements.
20 | Wells Fargo Adjustable Rate Government Fund
Statement of changes in net assets
| | | | | | | | | | | | | | | | |
| | | Six months ended
February 29, 2020
(unaudited) | | | Year ended
August 31, 2019 | |
| | | |
Operations | | | | | | | | | | | | |
Net investment income | | | | | | $ | 3,284,960 | | | | | | | $ | 6,994,145 | |
Net realized gains on investments | | | | | | | 1,431 | | | | | | | | 259,753 | |
Net change in unrealized gains (losses) on investments | | | | | | | 658,189 | | | | | | | | 1,540,062 | |
| | | | |
Net increase in net assets resulting from operations | | | | | | | 3,944,580 | | | | | | | | 8,793,960 | |
| | | | |
| | | | |
Distributions to shareholders from net investment income and net realized gains | | | | | | | | | | | | | | | | |
Class A | | | | | | | (1,284,833 | ) | | | | | | | (2,312,766 | ) |
Class C | | | | | | | (41,199 | ) | | | | | | | (274,818 | ) |
Administrator Class | | | | | | | (61,805 | ) | | | | | | | (143,314 | ) |
Institutional Class | | | | | | | (1,951,859 | ) | | | | | | | (4,363,556 | ) |
| | | | |
Total distributions to shareholders | | | | | | | (3,339,696 | ) | | | | | | | (7,094,454 | ) |
| | | | |
| | | | |
Capital share transactions | | | Shares | | | | | | | | Shares | | | | | |
Proceeds from shares sold | | | | | | | | | | | | | | | | |
Class A | | | 1,001,038 | | | | 8,988,035 | | | | 4,140,943 | | | | 37,018,425 | |
Class C | | | 137,415 | | | | 1,231,816 | | | | 112,522 | | | | 1,004,070 | |
Administrator Class | | | 28,304 | | | | 254,165 | | | | 4,965 | | | | 44,434 | |
Institutional Class | | | 2,155,760 | | | | 19,364,573 | | | | 3,237,102 | | | | 28,915,014 | |
| | | | |
| | | | | | | 29,838,589 | | | | | | | | 66,981,943 | |
| | | | |
Reinvestment of distributions | | | | | | | | | | | | | | | | |
Class A | | | 124,262 | | | | 1,116,285 | | | | 220,140 | | | | 1,968,661 | |
Class C | | | 4,069 | | | | 36,495 | | | | 29,271 | | | | 261,252 | |
Administrator Class | | | 6,773 | | | | 60,848 | | | | 15,395 | | | | 137,619 | |
Institutional Class | | | 193,824 | | | | 1,740,848 | | | | 384,451 | | | | 3,436,900 | |
| | | | |
| | | | | | | 2,954,476 | | | | | | | | 5,804,432 | |
| | | | |
Payment for shares redeemed | | | | | | | | | | | | | | | | |
Class A | | | (1,122,416 | ) | | | (10,079,239 | ) | | | (2,790,788 | ) | | | (24,941,456 | ) |
Class C | | | (221,780 | ) | | | (1,989,641 | ) | | | (4,524,371 | ) | | | (40,431,473 | ) |
Administrator Class | | | (27,958 | ) | | | (251,057 | ) | | | (449,737 | ) | | | (4,015,219 | ) |
Institutional Class | | | (1,895,682 | ) | | | (17,021,154 | ) | | | (12,338,837 | ) | | | (110,218,719 | ) |
| | | | |
| | | | | | | (29,341,091 | ) | | | | | | | (179,606,867 | ) |
| | | | |
Net increase (decrease) in net assets resulting from capital share transactions | | | | | | | 3,451,974 | | | | | | | | (106,820,492 | ) |
| | | | |
Total increase (decrease) in net assets | | | | | | | 4,056,858 | | | | | | | | (105,120,986 | ) |
| | | | |
| | | | |
Net assets | | | | | | | | | | | | | | | | |
Beginning of period | | | | | | | 288,753,194 | | | | | | | | 393,874,180 | |
| | | | |
End of period | | | | | | $ | 292,810,052 | | | | | | | $ | 288,753,194 | |
| | | | |
The accompanying notes are an integral part of these financial statements.
Wells Fargo Adjustable Rate Government Fund | 21
Financial highlights
(For a share outstanding throughout each period)
| | | | | | | | | | | | | | | | | | | | | | | | |
| | | Six months ended
February 29, 2020
(unaudited) | | | Year ended August 31 | |
| CLASS A | | 2019 | | | 2018 | | | 2017 | | | 2016 | | | 2015 | |
Net asset value, beginning of period | | | $8.98 | | | | $8.93 | | | | $8.96 | | | | $9.01 | | | | $9.10 | | | | $9.15 | |
Net investment income | | | 0.10 | | | | 0.18 | 1 | | | 0.10 | | | | 0.06 | | | | 0.04 | | | | 0.05 | |
Net realized and unrealized gains (losses) on investments | | | 0.02 | | | | 0.05 | | | | (0.01 | ) | | | (0.04 | ) | | | (0.06 | ) | | | (0.03 | ) |
| | | | | | | | | | | | | | | | | | | | | | | | |
Total from investment operations | | | 0.12 | | | | 0.23 | | | | 0.09 | | | | 0.02 | | | | (0.02 | ) | | | 0.02 | |
Distributions to shareholders from | | | | | | | | | | | | | | | | | | | | | | | | |
Net investment income | | | (0.10 | ) | | | (0.18 | ) | | | (0.12 | ) | | | (0.07 | ) | | | (0.05 | ) | | | (0.05 | ) |
Net realized gains | | | (0.00 | )2 | | | 0.00 | | | | 0.00 | | | | 0.00 | | | | 0.00 | | | | 0.00 | |
Tax basis return of capital | | | 0.00 | | | | 0.00 | | | | 0.00 | | | | 0.00 | | | | (0.02 | ) | | | (0.02 | ) |
| | | | | | | | | | | | | | | | | | | | | | | | |
Total distributions to shareholders | | | (0.10 | ) | | | (0.18 | ) | | | (0.12 | ) | | | (0.07 | ) | | | (0.07 | ) | | | (0.07 | ) |
Net asset value, end of period | | | $9.00 | | | | $8.98 | | | | $8.93 | | | | $8.96 | | | | $9.01 | | | | $9.10 | |
Total return3 | | | 1.33 | % | | | 2.64 | % | | | 0.98 | % | | | 0.23 | % | | | (0.19 | )% | | | 0.24 | % |
Ratios to average net assets (annualized) | | | | | | | | | | | | | | | | | | | | | | | | |
Gross expenses | | | 0.89 | % | | | 0.88 | % | | | 0.83 | % | | | 0.80 | % | | | 0.78 | % | | | 0.79 | % |
Net expenses | | | 0.74 | % | | | 0.74 | % | | | 0.74 | % | | | 0.74 | % | | | 0.74 | % | | | 0.74 | % |
Net investment income | | | 2.17 | % | | | 2.04 | % | | | 1.28 | % | | | 0.72 | % | | | 0.56 | % | | | 0.58 | % |
Supplemental data | | | | | | | | | | | | | | | | | | | | | | | | |
Portfolio turnover rate | | | 0 | % | | | 5 | % | | | 3 | % | | | 2 | % | | | 13 | % | | | 10 | % |
Net assets, end of period (000s omitted) | | | $118,951 | | | | $118,675 | | | | $103,963 | | | | $153,953 | | | | $172,131 | | | | $215,830 | |
| 1 | Calculated based upon average shares outstanding |
| 2 | Amount is less than $0.005. |
| 3 | Total return calculations do not include any sales charges. Returns for periods of less than one year are not annualized. |
The accompanying notes are an integral part of these financial statements.
22 | Wells Fargo Adjustable Rate Government Fund
Financial highlights
(For a share outstanding throughout each period)
| | | | | | | | | | | | | | | | | | | | | | | | |
| | | Six months ended
February 29, 2020
(unaudited) | | | Year ended August 31 | |
| CLASS C | | 2019 | | | 2018 | | | 2017 | | | 2016 | | | 2015 | |
Net asset value, beginning of period | | | $8.97 | | | | $8.93 | | | | $8.96 | | | | $9.01 | | | | $9.10 | | | | $9.15 | |
Net investment income (loss) | | | 0.06 | 1 | | | 0.10 | 1 | | | 0.05 | 1 | | | (0.00 | )1,2 | | | (0.02 | )1 | | | (0.01 | )1 |
Net realized and unrealized gains (losses) on investments | | | 0.02 | | | | 0.06 | | | | (0.03 | ) | | | (0.05 | ) | | | (0.07 | ) | | | (0.04 | ) |
| | | | | | | | | | | | | | | | | | | | | | | | |
Total from investment operations | | | 0.08 | | | | 0.16 | | | | 0.02 | | | | (0.05 | ) | | | (0.09 | ) | | | (0.05 | ) |
Distributions to shareholders from | | | | | | | | | | | | | | | | | | | | | | | | |
Net investment income | | | (0.06 | ) | | | (0.12 | ) | | | (0.05 | ) | | | (0.00 | )3 | | | (0.00 | )3 | | | (0.00 | )3 |
Net realized gains | | | (0.00 | )3 | | | 0.00 | | | | 0.00 | | | | 0.00 | | | | 0.00 | | | | 0.00 | |
Tax basis return of capital | | | 0.00 | | | | 0.00 | | | | 0.00 | | | | 0.00 | | | | (0.00 | )3 | | | (0.00 | )3 |
| | | | | | | | | | | | | | | | | | | | | | | | |
Total distributions to shareholders | | | (0.06 | ) | | | (0.12 | ) | | | (0.05 | ) | | | (0.00 | )3 | | | (0.00 | )3 | | | (0.00 | )3 |
Net asset value, end of period | | | $8.99 | | | | $8.97 | | | | $8.93 | | | | $8.96 | | | | $9.01 | | | | $9.10 | |
Total return4 | | | 0.95 | % | | | 1.76 | % | | | 0.23 | % | | | (0.52 | )% | | | (0.94 | )% | | | (0.51 | )% |
Ratios to average net assets (annualized) | | | | | | | | | | | | | | | | | | | | | | | | |
Gross expenses | | | 1.64 | % | | | 1.62 | % | | | 1.55 | % | | | 1.55 | % | | | 1.53 | % | | | 1.54 | % |
Net expenses | | | 1.49 | % | | | 1.49 | % | | | 1.49 | % | | | 1.49 | % | | | 1.49 | % | | | 1.49 | % |
Net investment income (loss) | | | 1.41 | % | | | 1.13 | % | | | 0.54 | % | | | (0.04 | )% | | | (0.19 | )% | | | (0.16 | )% |
Supplemental data | | | | | | | | | | | | | | | | | | | | | | | | |
Portfolio turnover rate | | | 0 | % | | | 5 | % | | | 3 | % | | | 2 | % | | | 13 | % | | | 10 | % |
Net assets, end of period (000s omitted) | | | $5,886 | | | | $6,594 | | | | $45,693 | | | | $60,766 | | | | $97,452 | | | | $121,117 | |
| 1 | Calculated based upon average shares outstanding |
| 2 | Amount is more than $(0.005). |
| 3 | Amount is less than $0.005. |
| 4 | Total return calculations do not include any sales charges. Returns for periods of less than one year are not annualized. |
The accompanying notes are an integral part of these financial statements.
Wells Fargo Adjustable Rate Government Fund | 23
Financial highlights
(For a share outstanding throughout each period)
| | | | | | | | | | | | | | | | | | | | | | | | |
| | | Six months ended
February 29, 2020
(unaudited) | | | Year ended August 31 | |
| ADMINISTRATOR CLASS | | 2019 | | | 2018 | | | 2017 | | | 2016 | | | 2015 | |
Net asset value, beginning of period | | | $8.98 | | | | $8.93 | | | | $8.96 | | | | $9.01 | | | | $9.10 | | | | $9.15 | |
Net investment income | | | 0.10 | 1 | | | 0.19 | 1 | | | 0.13 | 1 | | | 0.07 | 1 | | | 0.06 | | | | 0.06 | |
Net realized and unrealized gains (losses) on investments | | | 0.02 | | | | 0.06 | | | | (0.03 | ) | | | (0.04 | ) | | | (0.06 | ) | | | (0.03 | ) |
| | | | | | | | | | | | | | | | | | | | | | | | |
Total from investment operations | | | 0.12 | | | | 0.25 | | | | 0.10 | | | | 0.03 | | | | 0.00 | | | | 0.03 | |
Distributions to shareholders from | | | | | | | | | | | | | | | | | | | | | | | | |
Net investment income | | | (0.10 | ) | | | (0.20 | ) | | | (0.13 | ) | | | (0.08 | ) | | | (0.07 | ) | | | (0.06 | ) |
Net realized gains | | | (0.00 | )2 | | | 0.00 | | | | 0.00 | | | | 0.00 | | | | 0.00 | | | | 0.00 | |
Tax basis return of capital | | | 0.00 | | | | 0.00 | | | | 0.00 | | | | 0.00 | | | | (0.02 | ) | | | (0.02 | ) |
| | | | | | | | | | | | | | | | | | | | | | | | |
Total distributions to shareholders | | | (0.10 | ) | | | (0.20 | ) | | | (0.13 | ) | | | (0.08 | ) | | | (0.09 | ) | | | (0.08 | ) |
Net asset value, end of period | | | $9.00 | | | | $8.98 | | | | $8.93 | | | | $8.96 | | | | $9.01 | | | | $9.10 | |
Total return3 | | | 1.40 | % | | | 2.78 | % | | | 1.12 | % | | | 0.37 | % | | | (0.05 | )% | | | 0.38 | % |
Ratios to average net assets (annualized) | | | | | | | | | | | | | | | | | | | | | | | | |
Gross expenses | | | 0.83 | % | | | 0.81 | % | | | 0.77 | % | | | 0.74 | % | | | 0.72 | % | | | 0.72 | % |
Net expenses | | | 0.60 | % | | | 0.60 | % | | | 0.60 | % | | | 0.60 | % | | | 0.60 | % | | | 0.60 | % |
Net investment income | | | 2.31 | % | | | 2.12 | % | | | 1.42 | % | | | 0.82 | % | | | 0.71 | % | | | 0.72 | % |
Supplemental data | | | | | | | | | | | | | | | | | | | | | | | | |
Portfolio turnover rate | | | 0 | % | | | 5 | % | | | 3 | % | | | 2 | % | | | 13 | % | | | 10 | % |
Net assets, end of period (000s omitted) | | | $5,413 | | | | $5,337 | | | | $9,140 | | | | $18,805 | | | | $61,658 | | | | $66,037 | |
| 1 | Calculated based upon average shares outstanding |
| 2 | Amount is less than $0.005. |
| 3 | Returns for periods of less than one year are not annualized. |
The accompanying notes are an integral part of these financial statements.
24 | Wells Fargo Adjustable Rate Government Fund
Financial highlights
(For a share outstanding throughout each period)
| | | | | | | | | | | | | | | | | | | | | | | | |
| | | Six months ended
February 29, 2020
(unaudited) | | | Year ended August 31 | |
| INSTITUTIONAL CLASS | | 2019 | | | 2018 | | | 2017 | | | 2016 | | | 2015 | |
Net asset value, beginning of period | | | $8.98 | | | | $8.93 | | | | $8.96 | | | | $9.01 | | | | $9.10 | | | | $9.15 | |
Net investment income | | | 0.11 | | | | 0.22 | | | | 0.16 | | | | 0.09 | | | | 0.08 | | | | 0.08 | |
Net realized and unrealized gains (losses) on investments | | | 0.02 | | | | 0.04 | | | | (0.05 | ) | | | (0.04 | ) | | | (0.07 | ) | | | (0.03 | ) |
| | | | | | | | | | | | | | | | | | | | | | | | |
Total from investment operations | | | 0.13 | | | | 0.26 | | | | 0.11 | | | | 0.05 | | | | 0.01 | | | | 0.05 | |
Distributions to shareholders from | | | | | | | | | | | | | | | | | | | | | | | | |
Net investment income | | | (0.11 | ) | | | (0.21 | ) | | | (0.14 | ) | | | (0.10 | ) | | | (0.07 | ) | | | (0.08 | ) |
Net realized gains | | | (0.00 | )1 | | | 0.00 | | | | 0.00 | | | | 0.00 | | | | 0.00 | | | | 0.00 | |
Tax basis return of capital | | | 0.00 | | | | 0.00 | | | | 0.00 | | | | 0.00 | | | | (0.03 | ) | | | (0.02 | ) |
| | | | | | | | | | | | | | | | | | | | | | | | |
Total distributions to shareholders | | | (0.11 | ) | | | (0.21 | ) | | | (0.14 | ) | | | (0.10 | ) | | | (0.10 | ) | | | (0.10 | ) |
Net asset value, end of period | | | $9.00 | | | | $8.98 | | | | $8.93 | | | | $8.96 | | | | $9.01 | | | | $9.10 | |
Total return2 | | | 1.47 | % | | | 2.93 | % | | | 1.26 | % | | | 0.51 | % | | | 0.09 | % | | | 0.52 | % |
Ratios to average net assets (annualized) | | | | | | | | | | | | | | | | | | | | | | | | |
Gross expenses | | | 0.56 | % | | | 0.54 | % | | | 0.50 | % | | | 0.47 | % | | | 0.45 | % | | | 0.46 | % |
Net expenses | | | 0.46 | % | | | 0.46 | % | | | 0.46 | % | | | 0.46 | % | | | 0.45 | % | | | 0.46 | % |
Net investment income | | | 2.45 | % | | | 2.27 | % | | | 1.55 | % | | | 0.98 | % | | | 0.84 | % | | | 0.87 | % |
Supplemental data | | | | | | | | | | | | | | | | | | | | | | | | |
Portfolio turnover rate | | | 0 | % | | | 5 | % | | | 3 | % | | | 2 | % | | | 13 | % | | | 10 | % |
Net assets, end of period (000s omitted) | | | $162,561 | | | | $158,147 | | | | $235,078 | | | | $397,529 | | | | $702,617 | | | | $906,536 | |
| 1 | Amount is less than $0.005. |
| 2 | Returns for periods of less than one year are not annualized. |
The accompanying notes are an integral part of these financial statements.
Wells Fargo Adjustable Rate Government Fund | 25
Notes to financial statements (unaudited)
1. ORGANIZATION
Wells Fargo Funds Trust (the “Trust”), a Delaware statutory trust organized on March 10, 1999, is anopen-end management investment company registered under the Investment Company Act of 1940, as amended (the “1940 Act”). As an investment company, the Trust follows the accounting and reporting guidance in Financial Accounting Standards Board (“FASB”)Accounting Standards Codification Topic 946, Financial Services – Investment Companies. These financial statements report on the Wells Fargo Adjustable Rate Government Fund (the “Fund”) which is a diversified series of the Trust.
2. SIGNIFICANT ACCOUNTING POLICIES
The following significant accounting policies, which are consistently followed in the preparation of the financial statements of the Fund, are in conformity with U.S. generally accepted accounting principles which require management to make estimates and assumptions that affect the reported amounts of assets and liabilities, disclosure of contingent assets and liabilities at the date of the financial statements, and the reported amounts of revenues and expenses during the reporting period. Actual results could differ from those estimates.
Securities valuation
All investments are valued each business day as of the close of regular trading on the New York Stock Exchange (generally 4 p.m. Eastern Time), although the Fund may deviate from this calculation time under unusual or unexpected circumstances.
Debt securities are valued at the evaluated bid price provided by an independent pricing service (e.g. taking into account various factors, including yields, maturities, or credit ratings) or, if a reliable price is not available, the quoted bid price from an independent broker-dealer.
Investments in registeredopen-end investment companies are valued at net asset value.
Investments which are not valued using any of the methods discussed above are valued at their fair value, as determined in good faith by the Board of Trustees of the Fund. The Board of Trustees has established a Valuation Committee comprised of the Trustees and has delegated to it the authority to take any actions regarding the valuation of portfolio securities that the Valuation Committee deems necessary or appropriate, including determining the fair value of portfolio securities, unless the determination has been delegated to the Wells Fargo Asset Management Pricing Committee at Wells Fargo Funds Management, LLC (“Funds Management”). The Board of Trustees retains the authority to make or ratify any valuation decisions or approve any changes to the Valuation Procedures as it deems appropriate. On a quarterly basis, the Board of Trustees receives reports on any valuation actions taken by the Valuation Committee or the Wells Fargo Asset Management Pricing Committee which may include items for ratification.
When-issued transactions
The Fund may purchase securities on a forward commitment or when-issued basis. The Fund records a when-issued transaction on the trade date and will segregate assets in an amount at least equal in value to the Fund’s commitment to purchase when-issued securities. Securities purchased on a when-issued basis aremarked-to-market daily and the Fund begins earning interest on the settlement date. Losses may arise due to changes in the market value of the underlying securities or if the counterparty does not perform under the contract.
Security transactions and income recognition
Securities transactions are recorded on a trade date basis. Realized gains or losses are recorded on the basis of identified cost.
Interest income is accrued daily and bond discounts are accreted and premiums are amortized daily. To the extent debt obligations are placed onnon-accrual status, any related interest income may be reduced by writing off interest receivables when the collection of all or a portion of interest has been determined to be doubtful based on consistently applied procedures and the fair value has decreased. If the issuer subsequently resumes interest payments or when the collectability of interest is reasonably assured, the debt obligation is removed fromnon-accrual status. Paydown gains and losses are included in interest income.
Distributions to shareholders
Distributions to shareholders from net investment income are declared daily and paid monthly. Distributions from net realized gains, if any, are recorded on theex-dividend date and paid at least annually. Such distributions are determined in accordance with income tax regulations and may differ from U.S. generally accepted accounting principles. Dividend sources are estimated at the time of declaration. The tax character of distributions is determined as of the Fund’s fiscal year end. Therefore, a portion of the Fund’s distributions made prior to the Fund’s fiscal year end may be categorized as a tax return of capital at year end.
26 | Wells Fargo Adjustable Rate Government Fund
Notes to financial statements (unaudited)
Federal and other taxes
The Fund intends to continue to qualify as a regulated investment company by distributing substantially all of its investment company taxable income and any net realized capital gains (after reduction for capital loss carryforwards) sufficient to relieve it from all, or substantially all, federal income taxes. Accordingly, no provision for federal income taxes was required.
The Fund’s income and federal excise tax returns and all financial records supporting those returns for the prior three fiscal years are subject to examination by the federal and Delaware revenue authorities. Management has analyzed the Fund’s tax positions taken on federal, state, and foreign tax returns for all open tax years and does not believe that there are any uncertain tax positions that require recognition of a tax liability.
As of February 29, 2020, the aggregate cost of all investments for federal income tax purposes was $283,579,831 and the unrealized gains (losses) consisted of:
| | | | |
| |
Gross unrealized gains | | $ | 7,091,987 | |
| |
Gross unrealized losses | | | (1,228,362 | ) |
| |
Net unrealized gains | | $ | 5,863,625 | |
Class allocations
The separate classes of shares offered by the Fund differ principally in applicable sales charges, distribution, shareholder servicing, and administration fees. Class specific expenses are charged directly to that share class. Investment income, common fund-level expenses, and realized and unrealized gains (losses) on investments are allocated daily to each class of shares based on the relative proportion of net assets of each class.
3. FAIR VALUATION MEASUREMENTS
Fair value measurements of investments are determined within a framework that has established a fair value hierarchy based upon the various data inputs utilized in determining the value of the Fund’s investments. The three-level hierarchy gives the highest priority to unadjusted quoted prices in active markets for identical assets or liabilities (Level 1) and the lowest priority to unobservable inputs (Level 3). The Fund’s investments are classified within the fair value hierarchy based on the lowest level of input that is significant to the fair value measurement. The inputs are summarized into three broad levels as follows:
| ∎ | | Level 1 – quoted prices in active markets for identical securities |
| ∎ | | Level 2 – other significant observable inputs (including quoted prices for similar securities, interest rates, prepayment speeds, credit risk, etc.) |
| ∎ | | Level 3 – significant unobservable inputs (including the Fund’s own assumptions in determining the fair value of investments) |
The inputs or methodologies used for valuing investments in securities are not necessarily an indication of the risk associated with investing in those securities.
The following is a summary of the inputs used in valuing the Fund’s assets and liabilities as of February 29, 2020:
| | | | | | | | | | | | | | | | |
| | | | |
| | | Quoted prices
(Level 1) | | | Other significant
observable inputs (Level 2) | | | Significant
unobservable inputs (Level 3) | | | Total | |
| | | | |
Assets | | | | | | | | | | | | | | | | |
Investments in: | | | | | | | | | | | | | | | | |
| | | | |
Agency securities | | $ | 0 | | | $ | 278,395,489 | | | $ | 0 | | | $ | 278,395,489 | |
| | | | |
Short-term investments | | | | | | | | | | | | | | | | |
| | | | |
Investment companies | | | 11,047,967 | | | | 0 | | | | 0 | | | | 11,047,967 | |
| | | | |
Total assets | | $ | 11,047,967 | | | $ | 278,395,489 | | | $ | 0 | | | $ | 289,443,456 | |
Additional sector, industry or geographic detail is included in the Portfolio of Investments.
For the six months ended February 29, 2020, the Fund did not have any transfers into/out of Level 3.
Wells Fargo Adjustable Rate Government Fund | 27
Notes to financial statements (unaudited)
4. TRANSACTIONS WITH AFFILIATES
Management fee
Funds Management, an indirect wholly owned subsidiary of Wells Fargo & Company (“Wells Fargo”), is the manager of the Fund and provides advisory and fund-level administrative services under an investment management agreement. Under the investment management agreement, Funds Management is responsible for, among other services, implementing the investment objectives and strategies of the Fund, supervising the subadviser and providing fund-level administrative services in connection with the Fund’s operations. As compensation for its services under the investment management agreement, Funds Management is entitled to receive a management fee at the following annual rate based on the Fund’s average daily net assets:
| | | | |
| |
| Average daily net assets | | Management fee | |
| |
First $1 billion | | | 0.350 | % |
| |
Next $4 billion | | | 0.325 | |
| |
Next $3 billion | | | 0.290 | |
| |
Next $2 billion | | | 0.265 | |
| |
Over $10 billion | | | 0.255 | |
For the six months ended February 29, 2020, the management fee was equivalent to an annual rate of 0.35% of the Fund’s average daily net assets.
Funds Management has retained the services of a subadviser to provide daily portfolio management to the Fund. The fee for subadvisory services is borne by Funds Management. Wells Capital Management Incorporated, an affiliate of Funds Management and an indirect wholly owned subsidiary of Wells Fargo, is the subadviser to the Fund and is entitled to receive a fee from Funds Management at an annual rate starting at 0.20% and declining to 0.10% as the average daily net assets of the Fund increase.
Administration fees
Under a class-level administration agreement, Funds Management provides class-level administrative services to the Fund, which includes paying fees and expenses for services provided by the transfer agent,sub-transfer agents, omnibus account servicers and record-keepers. As compensation for its services under the class-level administration agreement, Funds Management receives an annual fee which is calculated based on the average daily net assets of each class as follows:
| | | | |
| |
| | | Class-level
administration fee | |
| |
Class A, Class C | | | 0.16 | % |
| |
Administrator Class | | | 0.10 | |
| |
Institutional Class | | | 0.08 | |
Waivers and/or expense reimbursements
Funds Management has contractually waived and/or reimbursed management and administration fees to the extent necessary to maintain certain net operating expense ratios for the Fund. When each class of the Fund has exceeded its expense cap, Funds Management has waived fees and/or reimbursed expenses from fund-level expenses on a proportionate basis and then from class specific expenses. When only certain classes exceed their expense caps, waivers and/or reimbursements are applied against class specific expenses before fund-level expenses. Funds Management has committed through December 31, 2020 to waive fees and/or reimburse expenses to the extent necessary to cap the Fund’s expenses at 0.74% for Class A shares, 1.49% for Class C shares, 0.60% for Administrator Class shares and 0.46% for Institutional Class shares. Prior to or after the commitment expiration date, the cap may be increased or the commitment to maintain the cap may be terminated only with the approval of the Board of Trustees.
Distribution fee
The Trust has adopted a distribution plan for Class C shares of the Fund pursuant to Rule12b-1 under the 1940 Act. A distribution fee is charged to Class C shares and paid to Wells Fargo Funds Distributor, LLC (“Funds Distributor”), the principal underwriter, at an annual rate of 0.75% of the average daily net assets of Class C shares.
In addition, Funds Distributor is entitled to receive thefront-end sales charge from the purchase of Class A shares and a contingent deferred sales charge on the redemption of certain Class A shares. Funds Distributor is also entitled to receive the
28 | Wells Fargo Adjustable Rate Government Fund
Notes to financial statements (unaudited)
contingent deferred sales charges from redemptions of Class C shares. For the six months ended February 29, 2020, Funds Distributor received $635 from the sale of Class A shares. No contingent deferred sales charges were incurred by Class A and Class C shares for the six months ended February 29, 2020.
Shareholder servicing fees
The Trust has entered into contracts with one or more shareholder servicing agents, whereby Class A, Class C, and Administrator Class of the Fund are charged a fee at an annual rate of 0.25% of the average daily net assets of each respective class. A portion of these total shareholder servicing fees were paid to affiliates of Wells Fargo.
Interfund transactions
The Fund may purchase or sell portfolio investment securities to certain other Wells Fargo affiliates pursuant to Rule17a-7 under the 1940 Act and under procedures adopted by the Board of Trustees. The procedures have been designed to ensure that these interfund transactions, which do not incur broker commissions, are effected at current market prices.
5. INVESTMENT PORTFOLIO TRANSACTIONS
Purchases and sales of investments, excluding short-term securities, for the six months ended February 29, 2020 were as follows:
| | | | | | |
Purchases at cost | | Sales proceeds |
U.S.
government | | Non-U.S.
government | | U.S.
government | | Non-U.S.
government |
| $35,169,297 | | $2,822,148 | | $71,431 | | $0 |
6. BANK BORROWINGS
The Trust (excluding the money market funds), Wells Fargo Master Trust and Wells Fargo Variable Trust are parties to a $280,000,000 revolving credit agreement whereby the Fund is permitted to use bank borrowings for temporary or emergency purposes, such as to fund shareholder redemption requests. Interest under the credit agreement is charged to the Fund based on a borrowing rate equal to the higher of the Federal Funds rate in effect on that day plus 1.25% or the overnight LIBOR rate in effect on that day plus 1.25%. In addition, an annual commitment fee equal to 0.25% of the unused balance is allocated to each participating fund.
For the six months ended February 29, 2020, there were no borrowings by the Fund under the agreement.
7. INDEMNIFICATION
Under the Trust’s organizational documents, the officers and Trustees have been granted certain indemnification rights against certain liabilities that may arise out of performance of their duties to the Trust. Additionally, in the normal course of business, the Trust may enter into contracts with service providers that contain a variety of indemnification clauses. The Trust’s maximum exposure under these arrangements is dependent on future claims that may be made against the Fund and, therefore, cannot be estimated.
8. NEW ACCOUNTING PRONOUNCEMENTS
In August 2018, FASB issued Accounting Standards Update (“ASU”)No. 2018-13, Fair Value Measurement (Topic 820)Disclosure Framework—Changes to the Disclosure Requirements for Fair Value Measurement. ASU2018-13 updates the disclosure requirements for fair value measurements by modifying or removing certain disclosures and adding certain new disclosures. The amendments are effective for fiscal years, and interim periods within those fiscal years, beginning after December 15, 2019. Early adoption is permitted. Management has adopted the removal and modification of disclosures early, as permitted, and will adopt the additional new disclosures at the effective date.
In March 2017, FASB issued ASUNo. 2017-08,Premium Amortization on Purchased Callable Debt Securities. ASU2017-08 shortens the amortization period for certain callable debt securities held at a premium and requires the premium to be amortized to the earliest call date. The amendments do not require an accounting change for securities held at a discount and discounts will continue to be accreted to the maturity date of the security. ASU2017-08 is effective for fiscal years beginning after December 15, 2018 and for interim periods within those fiscal years. During the current reporting period, management of the Fund adopted the change in accounting policy which did not have a material impact to the Fund’s financial statements.
Wells Fargo Adjustable Rate Government Fund | 29
Notes to financial statements (unaudited)
9. SUBSEQUENT EVENT
On March 11, 2020, the World Health Organization announced that it had made the assessment that coronavirus disease 2019(“COVID-19”) is a pandemic. The impacts ofCOVID-19 is adversely affecting the entire global economy, individual companies and investment products, and the market in general. There is significant uncertainty around the extent and duration of business disruptions related toCOVID-19 and the impact may be short term or may last for an extended period of time. The risk of further spreading ofCOVID-19 has led to significant uncertainty and volatility in the financial markets and the value of the Fund and the securities in which the Fund invests have generally been adversely affected by impacts caused byCOVID-19.
30 | Wells Fargo Adjustable Rate Government Fund
Other information (unaudited)
PROXY VOTING INFORMATION
A description of the policies and procedures used to determine how to vote proxies relating to portfolio securities is available, upon request, by calling1-800-222-8222, visiting our website atwfam.com, or visiting the SEC website at sec.gov. Information regarding how the proxies related to portfolio securities were voted during the most recent12-month period ended June 30 is available on the website atwfam.comor by visiting the SEC website at sec.gov.
QUARTERLY PORTFOLIO HOLDINGS INFORMATION
The Fund files its complete schedule of portfolio holdings with the SEC for the first and third quarters of each fiscal year as an exhibit to its reports on FormN-PORT. Shareholders may view the filed FormN-PORT by visiting the SEC website at sec.gov.
Wells Fargo Adjustable Rate Government Fund | 31
Other information (unaudited)
BOARD OF TRUSTEES AND OFFICERS
Each of the Trustees and Officers1 listed in the table below acts in identical capacities for each fund in the Wells Fargo family of funds, which consists of 146 mutual funds comprising the Wells Fargo Funds Trust, Wells Fargo Variable Trust, Wells Fargo Master Trust and fourclosed-end funds (collectively the “Fund Complex”). This table should be read in conjunction with the Prospectus and the Statement of Additional Information2. The mailing address of each Trustee and Officer is 525 Market Street, 12th Floor, San Francisco, CA 94105. Each Trustee and Officer serves an indefinite term, however, each Trustee serves such term until reaching the mandatory retirement age established by the Trustees.
Independent Trustees
| | | | | | |
Name and
year of birth | | Position held and
length of service* | | Principal occupations during past five years or longer | | Current other
public company or
investment
company
directorships |
| | | |
| William R. Ebsworth (Born 1957) | | Trustee, since 2015 | | Retired. From 1984 to 2013, equities analyst, portfolio manager, research director and chief investment officer at Fidelity Management and Research Company in Boston, Tokyo, and Hong Kong, and retired in 2013 as Chief Investment Officer of Fidelity Strategic Advisers, Inc. where he led a team of investment professionals managing client assets. Prior thereto, Board member of Hong Kong Securities Clearing Co., Hong Kong Options Clearing Corp., the Thailand International Fund, Ltd., Fidelity Investments Life Insurance Company, and Empire Fidelity Investments Life Insurance Company. Audit Committee Chair and Investment Committee Chair of the Vincent Memorial Hospital Endowment(non-profit organization). Mr. Ebsworth is a CFA® charterholder. | | N/A |
| | | |
| Jane A. Freeman (Born 1953) | | Trustee, since 2015; Chair Liaison, since 2018 | | Retired. From 2012 to 2014 and 1999 to 2008, Chief Financial Officer of Scientific Learning Corporation. From 2008 to 2012, Ms. Freeman provided consulting services related to strategic business projects. Prior to 1999, Portfolio Manager at Rockefeller & Co. and Scudder, Stevens & Clark. Board member of the Harding Loevner Funds from 1996 to 2014, serving as both Lead Independent Director and chair of the Audit Committee. Board member of the Russell Exchange Traded Funds Trust from 2011 to 2012 and the chair of the Audit Committee. Ms. Freeman is a Board Member of The Ruth Bancroft Garden(non-profit organization). She is also an inactive Chartered Financial Analyst. | | N/A |
| | | |
| Isaiah Harris, Jr. (Born 1952) | | Trustee, since 2009; Audit Committee Chairman, since 2019 | | Retired. Chairman of the Board of CIGNA Corporation since 2009, and Director since 2005. From 2003 to 2011, Director of Deluxe Corporation. Prior thereto, President and CEO of BellSouth Advertising and Publishing Corp. from 2005 to 2007, President and CEO of BellSouth Enterprises from 2004 to 2005 and President of BellSouth Consumer Services from 2000 to 2003. Emeritus member of the Iowa State University Foundation Board of Governors. Emeritus Member of the Advisory Board of Iowa State University School of Business. Advisory Board Member, Palm Harbor Academy (private school). Advisory Board Member, Child Evangelism Fellowship(non-profit). Mr. Harris is a certified public accountant (inactive status). | | CIGNA Corporation |
| | | |
| Judith M. Johnson (Born 1949) | | Trustee, since 2008; Audit Committee Chairman, from 2009 to 2018 | | Retired. Prior thereto, Chief Executive Officer and Chief Investment Officer of Minneapolis Employees Retirement Fund from 1996 to 2008. Ms. Johnson is an attorney, certified public accountant and a certified managerial accountant. | | N/A |
32 | Wells Fargo Adjustable Rate Government Fund
Other information (unaudited)
| | | | | | |
Name and
year of birth | | Position held and
length of service* | | Principal occupations during past five years or longer | | Current other
public company or
investment
company
directorships |
| | | |
| David F. Larcker (Born 1950) | | Trustee, since 2009 | | James Irvin Miller Professor of Accounting at the Graduate School of Business, Stanford University, Director of the Corporate Governance Research Initiative and Senior Faculty of The Rock Center for Corporate Governance since 2006. From 2005 to 2008, Professor of Accounting at the Graduate School of Business, Stanford University. Prior thereto, Ernst & Young Professor of Accounting at The Wharton School, University of Pennsylvania from 1985 to 2005. | | N/A |
| | | |
| Olivia S. Mitchell (Born 1953) | | Trustee, since 2006; Nominating and Governance Committee Chair, since 2018 | | International Foundation of Employee Benefit Plans Professor, Wharton School of the University of Pennsylvania since 1993. Director of Wharton’s Pension Research Council and Boettner Center on Pensions & Retirement Research, and Research Associate at the National Bureau of Economic Research. Previously, Cornell University Professor from 1978 to 1993. | | N/A |
| | | |
| Timothy J. Penny (Born 1951) | | Trustee, since 1996; Chairman, since 2018 | | President and Chief Executive Officer of Southern Minnesota Initiative Foundation, anon-profit organization, since 2007. Member of the Board of Trustees of NorthStar Education Finance, Inc., anon-profit organization, since 2007. | | N/A |
| | | |
| James G. Polisson (Born 1959) | | Trustee, since 2018 | | Retired. Chief Marketing Officer, Source (ETF) UK Services, Ltd, from 2015 to 2017. From 2012 to 2015, Principal of The Polisson Group, LLC, a management consulting, corporate advisory and principal investing company. Chief Executive Officer and Managing Director at Russell Investments, Global Exchange Traded Funds from 2010 to 2012. Managing Director of Barclays Global Investors from 1998 to 2010 and Global Chief Marketing Officer for iShares and Barclays Global Investors from 2000 to 2010. Trustee of the San Francisco Mechanics’ Institute, anon-profit organization, from 2013 to 2015. Board member of the Russell Exchange Traded Fund Trust from 2011 to 2012. Director of Barclays Global Investors Holdings Deutschland GmbH from 2006 to 2009. Mr. Polisson is an attorney and has a retired status with the Massachusetts and District of Columbia Bar Associations. | | N/A |
| | | |
| Pamela Wheelock3 (Born 1959) | | Trustee, since January 2020; previously Trustee from January 2018 to July 2019 | | Board member of the Destination Medical Center Economic Development Agency, Rochester, Minnesota since 2019. Acting Commissioner, Minnesota Department of Human Services, July 2019 through September 2019. Human Services Manager (part-time), Minnesota Department of Human Services, October 2019 through December 2019. Chief Operating Officer, Twin Cities Habitat for Humanity from 2017 to 2019. Vice President of University Services, University of Minnesota from 2012 to 2016. Prior thereto, on the Board of Directors, Governance Committee and Finance Committee for the Minnesota Philanthropy Partners (Saint Paul Foundation) from 2012 to 2018, Interim Chief Executive Officer of Blue Cross Blue Shield of Minnesota from 2011 to 2012, Chairman of the Board from 2009 to 2012 and Board Director from 2003 to 2015. Vice President, Leadership and Community Engagement, Bush Foundation, Saint Paul, Minnesota (a private foundation) from 2009 to 2011. Executive Vice President and Chief Financial Officer, Minnesota Sports and Entertainment from 2004 to 2009 and Senior Vice President from 2002 to 2004. Executive Vice President of the Minnesota Wild Foundation from 2004 to 2008. Commissioner of Finance, State of Minnesota, from 1999 to 2002. Currently Board Chair of the Minnesota Wild Foundation since 2010. | | N/A |
| * | Length of service dates reflect the Trustee’s commencement of service with the Trust’s predecessor entities, where applicable. |
Wells Fargo Adjustable Rate Government Fund | 33
Other information (unaudited)
Officers
| | | | |
Name and
year of birth | | Position held and
length of service | | Principal occupations during past five years or longer |
| | |
| Andrew Owen (Born 1960) | | President, since 2017 | | Executive Vice President of Wells Fargo & Company and Head of Affiliated Managers, Wells Fargo Asset Management, since 2014. In addition, Mr. Owen is currently President, Chief Executive Officer and Director of Wells Fargo Funds Management, LLC since 2017. Prior thereto, Executive Vice President responsible for marketing, investments and product development for Wells Fargo Funds Management, LLC, from 2009 to 2014. |
| | |
| Nancy Wiser1 (Born 1967) | | Treasurer, since 2012 | | Executive Vice President of Wells Fargo Funds Management, LLC since 2011. Chief Operating Officer and Chief Compliance Officer at LightBox Capital Management LLC, from 2008 to 2011. |
| | |
| Michelle Rhee (Born 1966) | | Chief Legal Officer, since 2019 | | Secretary of Wells Fargo Funds Management, LLC, Chief Legal Counsel of Wells Fargo Asset Management and Assistant General Counsel of Wells Fargo Bank, N.A. since 2018. Associate General Counsel and Managing Director of Bank of America Corporation from 2004 to 2018. |
| | |
| Catherine Kennedy (Born 1969) | | Secretary, since 2019 | | Vice President of Wells Fargo Funds Management, LLC and Senior Counsel of the Wells Fargo Legal Department since 2010. Vice President and Senior Counsel of Evergreen Investment Management Company, LLC from 1998 to 2010. |
| | |
| Michael H. Whitaker(Born 1967) | | Chief Compliance Officer, since 2016 | | Chief Compliance Officer of Wells Fargo Asset Management since 2016. Senior Vice President and Chief Compliance Officer for Fidelity Investments from 2007 to 2016. |
| | |
| David Berardi (Born 1975) | | Assistant Treasurer, since 2009 | | Vice President of Wells Fargo Funds Management, LLC since 2009. Vice President of Evergreen Investment Management Company, LLC from 2008 to 2010. Manager of Fund Reporting and Control for Evergreen Investment Management Company, LLC from 2004 to 2010. |
| | |
| Jeremy DePalma1 (Born 1974) | | Assistant Treasurer, since 2009 | | Senior Vice President of Wells Fargo Funds Management, LLC since 2009. Senior Vice President of Evergreen Investment Management Company, LLC from 2008 to 2010 and head of the Fund Reporting and Control Team within Fund Administration from 2005 to 2010. |
| 1 | Nancy Wiser acts as Treasurer of 64 funds in the Fund Complex. Jeremy DePalma acts as Treasurer of 82 funds and Assistant Treasurer of 64 funds in the Fund Complex. |
| 2 | The Statement of Additional Information includes additional information about the Trustees and is available, without charge, upon request, by calling1-800-222-8222 or by visiting the website atwfam.com. |
| 3 | Pamela Wheelock wasre-appointed to the Board effective January 1, 2020. |
34 | Wells Fargo Adjustable Rate Government Fund
Appendix I (unaudited)
Effective on or about May 1, 2020, if you purchase Fund shares through a Janney Montgomery Scott LLC (“Janney”) brokerage account, you will be eligible for the following load waivers(front-end sales charge waivers and contingent deferred sales charge (“CDSC”), orback-end sales charge, waivers) and discounts, which may differ from those disclosed elsewhere in the Fund’s Prospectus or SAI.
|
| Front-end sales charge* waivers on Class A shares available at Janney |
|
| Shares purchased through reinvestment of capital gains distributions and dividend reinvestment when purchasing shares of the same fund (but not any other fund within the fund family). |
|
| Shares purchased by employees and registered representatives of Janney or its affiliates and their family members as designated by Janney. |
|
| Shares purchased from the proceeds of redemptions within the same fund family, provided (1) the repurchase occurs within ninety (90) days following the redemption, (2) the redemption and purchase occur in the same account, and (3) redeemed shares were subject to afront-end or deferred sales load (i.e., right of reinstatement). |
|
| Employer-sponsored retirement plans (e.g., 401(k) plans, 457 plans, employer-sponsored 403(b) plans, profit sharing and money purchase pension plans and defined benefit plans). For purposes of this provision, employer-sponsored retirement plans do not include SEP IRAs, Simple IRAs,SAR-SEPs or Keogh plans. |
|
| Shares acquired through a right of reinstatement. |
|
Class C shares that are no longer subject to a contingent deferred sales charge and are converted to Class A shares of the same fund pursuant to Janney’s policies and procedures. |
| CDSC waivers on Class A and Class C shares available at Janney |
|
| Shares sold upon the death or disability of the shareholder. |
|
| Shares sold as part of a systematic withdrawal plan as described in the Fund’s Prospectus. |
|
| Shares purchased in connection with a return of excess contributions from an IRA account. |
|
| Shares sold as part of a required minimum distribution for IRA and retirement accounts if the redemption is taken in or after the year the shareholder reaches qualified age based on applicable IRS regulations. |
|
| Shares sold to pay Janney fees but only if the transaction is initiated by Janney. |
|
| Shares acquired through a right of reinstatement. |
|
Shares exchanged into the same share class of a different fund. |
| Front-end sales charge* discounts available at Janney; breakpoints, rights of accumulation and/or letters of intent |
|
| Breakpoints as described in the Fund’s Prospectus. |
|
| Rights of accumulation (“ROA”), which entitle shareholders to breakpoint discounts, will be automatically calculated based on the aggregated holding of fund family assets held by accounts within the purchaser’s household at Janney. Eligible fund family assets not held at Janney may be included in the ROA calculation only if the shareholder notifies his or her financial advisor about such assets. |
|
Letters of intent which allow for breakpoint discounts based on anticipated purchases within a fund family, over a13-month time period. Eligible fund family assets not held at Janney Montgomery Scott may be included in the calculation of letters of intent only if the shareholder notifies his or her financial advisor about such assets. |
| * | Also referred to as an “initial sales charge.” |
Wells Fargo Adjustable Rate Government Fund | 35
Appendix II (unaudited)
Effective on or after May 1, 2020, clients of Edward Jones (also referred to as “shareholders”) purchasing Fund shares on the Edward Jones commission andfee-based platforms are eligible only for the following sales charge discounts (also referred to as “breakpoints”) and waivers, which can differ from breakpoints and waivers described elsewhere in this Prospectus or SAI or through another broker-dealer. In all instances, it is the shareholder’s responsibility to inform Edward Jones at the time of purchase of any relationship, holdings of Wells Fargo Funds or other facts qualifying the purchaser for breakpoints or waivers. Edward Jones can ask for documentation of such circumstance.
|
| Breakpoints available at Edward Jones |
|
| Rights of Accumulation (ROA) |
|
The applicable sales charge on a purchase of Class A shares is determined by taking into account all share classes (except any money market funds and retirement plan share classes) of Wells Fargo Funds held by the shareholder or in an account grouped by Edward Jones with other accounts for the purpose of providing certain pricing considerations (“pricing groups”). This includes all share classes held on the Edward Jones platform and/or held on another platform. The inclusion of eligible fund family assets in the rights of accumulation calculation is dependent on the shareholder notifying his or her financial advisor of such assets at the time of calculation. |
|
ROA is determined by calculating the higher of cost or market value (current shares x NAV). |
|
| Letter of Intent (LOI) |
|
Through a LOI, shareholders can receive the sales charge and breakpoint discounts for purchases shareholders intend to makeover a13-month period from the date Edward Jones receives the LOI. The LOI is determined by calculating the higher of cost or market value of qualifying holdings at LOI initiation in combination with the value that the shareholder intends to buy over a13-month period to calculate thefront-end sales charge and any breakpoint discounts. Each purchase the shareholder makes during that13-month period will receive the sales charge and breakpoint discount that applies to the total amount. The inclusion of eligible fund family assets in the LOI calculation is dependent on the shareholder notifying his or her financial advisor of such assets at the time of calculation. Purchases made before the LOI is received by Edward Jones are not covered under the LOI and will not reduce the sales charge previously paid. Sales charges will be adjusted if LOI is not met. |
| Sales charges are waived for the following shareholders and in the following situations at Edward Jones: |
● Associates of Edward Jones and its affiliates and their family members who are in the same pricing group (as determined by Edward Jones under its policies and procedures) as the associate. This waiver will continue for the remainder of the associate’s life if the associate retires from Edward Jones in good-standing. |
● Shares purchased in an Edward Jonesfee-based program. |
● Shares purchased through reinvestment of capital gains distributions and dividend reinvestment. |
● Shares purchased from the proceeds of redeemed shares of the same fund family so long as the following conditions are met: 1)the proceeds are from the sale of shares within 60 days of the purchase, and 2) the sale and purchase are made in the same share class and the same account or the purchase is made in an individual retirement account with proceeds from liquidations in anon-retirement account. |
● Shares exchanged into Class A shares from another share class so long as the exchange is into the same fund and was initiated at the discretion of Edward Jones. Edward Jones is responsible for any remaining CDSC due to the fund company, if applicable. Any future purchases are subject to the applicable sales charge as disclosed in the prospectus. |
● Exchanges from Class C shares to Class A shares of the same fund, generally, in the 84th month following the anniversary of the purchase date or earlier at the discretion of Edward Jones. |
If the shareholder purchases shares that are subject to a CDSC and those shares are redeemed before the CDSC is expired, the shareholder is
responsible to pay the CDSC except in the following conditions available at Edward Jones: |
● The death or disability of the shareholder. |
● Systematic withdrawals with up to 10% per year of the account value. |
● Return of excess contributions from an Individual Retirement Account (IRA). |
● Shares sold as part of a required minimum distribution for IRA and retirement accounts if the redemption is taken in or after the year the shareholder reaches qualified age based on applicable IRS regulation. |
● Shares sold to pay Edward Jones fees or costs in such cases where the transaction is initiated by Edward Jones. |
● Shares exchanged in an Edward Jonesfee-based program. |
● Shares acquired through NAV reinstatement. |
36 | Wells Fargo Adjustable Rate Government Fund
Appendix II (unaudited)
|
| Other Important Information for accounts at Edward Jones: |
Minimum Purchase Amounts ● $250 initial purchase minimum ● $50 subsequent purchase minimum |
Minimum Balances Edward Jones has the right to redeem at its discretion fund holdings with a balance of $250 or less. The following are examples of accounts that are not included in this policy: ● Afee-based account held on an Edward Jones platform ● A 529 account held on an Edward Jones platform ● An account with an active systematic investment plan or letter of intent (LOI) |
Changing Share Classes At any time it deems necessary, Edward Jones has the authority to exchange at NAV a shareholder’s holdings in a fund to Class A shares. |
Wells Fargo Adjustable Rate Government Fund | 37
This page is intentionally left blank.
This page is intentionally left blank.
This page is intentionally left blank.

For more information
More information about Wells Fargo Funds is available free upon request. To obtain literature, please write, visit the Fund’s website, or call:
Wells Fargo Funds
P.O. Box 219967
Kansas City, MO 64121-9967
Website:wfam.com
Individual investors:1-800-222-8222
Retail investment professionals:1-888-877-9275
Institutional investment professionals:1-866-765-0778

This report and the financial statements contained herein are submitted for the general information of the shareholders of the Fund. If this report is used for promotional purposes, distribution of the report must be accompanied or preceded by a current prospectus. Before investing, please consider the investment objectives, risks, charges, and expenses of the investment. For a current prospectus and, if available, a summary prospectus, containing this information, call1-800-222-8222 or visit the Fund’s website atwfam.com. Read the prospectus carefully before you invest or send money.
Wells Fargo Asset Management (WFAM) is the trade name for certain investment advisory/management firms owned by Wells Fargo & Company. These firms include but are not limited to Wells Capital Management Incorporated and Wells Fargo Funds Management, LLC. Certain products managed by WFAM entities are distributed by Wells Fargo Funds Distributor, LLC (a broker-dealer and Member FINRA).
This material is for general informational and educational purposes only and is NOT intended to provide investment advice or a recommendation of any kind—including a recommendation for any specific investment, strategy, or plan.
INVESTMENT PRODUCTS: NOT FDIC INSURED ◾ NO BANK GUARANTEE ◾ MAY LOSE VALUE
© 2020 Wells Fargo & Company. All rights reserved
PAR-0220-04683 04-20
SA215/SAR215 02-20
Semi-Annual Report
February 29, 2020
Wells Fargo High Yield Bond Fund
Beginning on January 1, 2021, as permitted by new regulations adopted by the Securities and Exchange Commission, paper copies of the Wells Fargo Funds’ annual and semi-annual shareholder reports issued after this date will no longer be sent by mail, unless you specifically request paper copies of the reports. Instead, the reports will be made available on the Funds’ website, and you will be notified by mail each time a report is posted and provided with a website address to access the report.
If you already elected to receive shareholder reports electronically, you will not be affected by this change and you need not take any action. You may elect to receive shareholder reports and other communications from the Fund electronically at any time by contacting your financial intermediary (such as a broker-dealer or bank) or, if you are a direct investor, by calling1-800-222-8222 or by enrolling at wellsfargo.com/advantagedelivery.
You may elect to receive all future reports in paper free of charge. If you invest through a financial intermediary, you can contact your financial intermediary to request that you continue to receive paper copies of your shareholder reports; if you invest directly with the Fund, you can call 1-800-222-8222. Your election to receive reports in paper will apply to all Wells Fargo Funds held in your account with your financial intermediary or, if you are a direct investor, to all Wells Fargo Funds that you hold.
|
|
|
Reduce clutter. Save trees. |
Sign up for electronic delivery of prospectuses and shareholder reports atwellsfargo.com/advantagedelivery |
The views expressed and any forward-looking statements are as of February 29, 2020, unless otherwise noted, and are those of the Fund managers and/or Wells Fargo Asset Management. Discussions of individual securities, or the markets generally, or any Wells Fargo Fund are not intended as individual recommendations. Future events or results may vary significantly from those expressed in any forward-looking statements. The views expressed are subject to change at any time in response to changing circumstances in the market. Wells Fargo Asset Management and the Fund disclaim any obligation to publicly update or revise any views expressed or forward-looking statements.
INVESTMENT PRODUCTS: NOT FDIC INSURED ◾ NO BANK GUARANTEE ◾ MAY LOSE VALUE
Wells Fargo High Yield Bond Fund | 1
Letter to shareholders (unaudited)

Andrew Owen
President
Wells Fargo Funds
“The fourth quarter started on a strong note, with U.S.-China trade tensions relaxing in October along with renewed optimism for a U.K. Brexit deal and positive macroeconomic data.”
Dear Shareholder:
We are pleased to offer you this semi-annual report for the Wells Fargo High Yield Bond Fund for thesix-month period that ended February 29, 2020. As market volatility increased, returns for the period were more restrained after strong results in previous recent periods. However, supportive central banks addressed concerns over slowing global economic growth and international trade tensions.
Fixed-income and equity investors had mixed semi-annual returns. For the period, U.S. stocks, based on the S&P 500 Index,1 gained 1.92% and international stocks, as measured by the MSCI ACWI ex USA Index (Net),2 returned 0.13%. The MSCI EM Index (Net)3 gained 2.93%. For bond investors, the Bloomberg Barclays U.S. Aggregate Bond Index4 added 3.39%, the Bloomberg Barclays Global Aggregateex-USD Index5 returned-0.21%, the Bloomberg Barclays Municipal Bond Index6 gained 3.04%, and the ICE BofA U.S. High Yield Index7 added 1.34%.
The period began with uncertainty, leading to central bank support.
In September, as the period began, the U.S. Federal Reserve (Fed) cut interest rates a second time in the third quarter. U.S. manufacturing data disappointed investors. The U.S. Congress announced it would pursue an impeachment investigation of President Trump. Meanwhile, the Brexit impasse showed no signs of resolution. Officials in China warned it would be difficult to reach the country’s annual economic growth goals considering the weight of tariffs and trade restrictions. Although the S&P 500 Index finished the third quarter with the bestyear-to-date returns in more than 20 years, concerns about future returns remained.
The fourth quarter started on a strong note, with U.S.-China trade tensions relaxing in October along with renewed optimism for a U.K. Brexit deal and positive macroeconomic data. The initial estimate of U.S. third-quarter gross domestic product growth was a resilient 1.9% annualized rate, while the U.S. unemployment rate fell to a50-year low of 3.5% in September. However, despite resilience among U.S. consumers, business confidence declined while manufacturing activity contracted. Concerned with a potential economic slowdown, the Fed lowered interest rates another quarter point in late October—its third rate cut in four months. This helped push the S&P 500 Index to anall-time high, while emerging market equities rallied and global bonds declined overall, reflecting a broad pickup in risk appetite.
| 1 | The S&P 500 Index consists of 500 stocks chosen for market size, liquidity, and industry group representation. It is a market-value-weighted index with each stock’s weight in the index proportionate to its market value. You cannot invest directly in an index. |
| 2 | The Morgan Stanley Capital International (MSCI) All Country World Index (ACWI) ex USA Index (Net) is a free-float-adjusted market-capitalization-weighted index that is designed to measure the equity market performance of developed markets, excluding the United States. Source: MSCI. MSCI makes no express or implied warranties or representations and shall have no liability whatsoever with respect to any MSCI data contained herein. The MSCI data may not be further redistributed or used as a basis for other indices or any securities or financial products. This report is not approved, reviewed, or produced by MSCI. You cannot invest directly in an index. |
| 3 | The MSCI Emerging Markets (EM) Index (Net) is a free-float-adjusted market-capitalization-weighted index that is designed to measure equity market performance of emerging markets. You cannot invest directly in an index. |
| 4 | The Bloomberg Barclays U.S. Aggregate Bond Index is a broad-based benchmark that measures the investment-grade, U.S. dollar-denominated, fixed-rate taxable bond market, including Treasuries, government-related and corporate securities, mortgage-backed securities (agency fixed-rate and hybrid adjustable-rate mortgage pass-throughs), asset-backed securities, and commercial mortgage-backed securities. You cannot invest directly in an index. |
| 5 | The Bloomberg Barclays Global Aggregateex-USD Index is an unmanaged index that provides a broad-based measure of the global investment-grade fixed-income markets excluding the U.S. dollar-denominated debt market. You cannot invest directly in an index. |
| 6 | The Bloomberg Barclays Municipal Bond Index is an unmanaged index composed of long-termtax-exempt bonds with a minimum credit rating of Baa. You cannot invest directly in an index. |
| 7 | The ICE BofA U.S. High Yield Index is a market-capitalization-weighted index of domestic and Yankee high-yield bonds. The index tracks the performance of high-yield securities traded in the U.S. bond market. You cannot invest directly in an index. Copyright 2020. ICE Data Indices, LLC. All rights reserved. |
2 | Wells Fargo High Yield Bond Fund
Letter to shareholders (unaudited)
Equity markets continued to rally in November despite ongoing geopolitical risks. Hopes for a U.S.-China trade deal buoyed investor confidence. U.S. business sentiment improved slightly, and manufacturing and services activity picked up. With that positive backdrop, developed market equities outpaced those in emerging markets, and U.S. stocks, as reflected by the S&P 500 Index, outperformednon-U.S. stocks overall. While consumer confidence and purchasing manager activity rose in the eurozone, China reported weakening manufacturing and consumer data. Bond yields rose marginally, leading to slightly negative returns for global government and investment-grade corporate bonds.
Financial markets ended 2019 with a boost from the U.S. and China accord on a Phase One trade deal. That, along with the landslide win by thepro-Brexit U.K. Conservative Party in a national election and ongoing central bank support, gave investors greater confidence. U.S. economic indicators were generally positive, with the exception of manufacturing activity and business confidence. Consumer confidence was resilient, fed by a robust labor market, tame inflation, and lower interest rates, which boosted housing affordability and stimulated homebuyer activity. The impeachment of U.S. President Donald Trump had little impact on markets. Meanwhile, slowing Chinese economic activity, partly attributable to the trade war, led to further government stimulus atyear-end through lower reserve ratios, allowing banks to lend more money.
Theyear-end rally continued in early January 2020. However, capital market volatility picked up sharply in late January on concerns over the unknown impact of the novel coronavirus(COVID-19) on the global economy and stock markets. With sentiment somewhat souring, perceived safe havens did well in January. The U.S. dollar and Japanese yen both rose and government bonds outperformed equities. While the S&P 500 Index held its ground, emerging market equities tumbled, including those in Asia that are most exposed to viruses—physical or economic—originating in China.
In February, the coronavirus became the major market focus. Fears of the virus’s impact on global growth led to expectations of increased global central bank monetary policy support. That led the10-year Treasury yield to fall to anall-time low of 1.1% by the end of the month. Although equity markets initially shrugged off concerns about the outbreak, focusing instead on strong fourth-quarter earnings and improving business confidence in January, market sentiment turned sharply lower towardmonth-end and the S&P 500 Index lost 8.2% for the month. Oil prices tumbled as Russia and the Organization of the Petroleum Exporting Countries compounded a major decline in oil demand with a brutal price war, partly aimed at dissuading further U.S. shale production. As a result, the price of West Texas Intermediate crude oil fell 13% in February and 27% for 2020 year to date.
Don’t let short-term uncertainty derail long-term investment goals.
Periods of investment uncertainty can present challenges, but experience has taught us that maintaining long-term investment goals can be an effective way to plan for the future. Although diversification cannot guarantee an investment profit or prevent losses, we believe it can be an effective way to manage investment risk and potentially smooth out overall portfolio performance. We encourage investors to know their investments and to understand that appropriate levels of risk-taking may unlock opportunities.
Thank you for choosing to invest with Wells Fargo Funds. We appreciate your confidence in us and remain committed to helping you meet your financial needs.
Sincerely,

Andrew Owen
President
Wells Fargo Funds
“Capital market volatility picked up sharply in late January on concerns over the unknown impact of the novel coronavirus(COVID-19) on the global economy and stock markets.”
|
|
|
For further information about your Fund, contact your investment professional, visit our website at wfam.com, or call us directly at1-800-222-8222. |
Wells Fargo High Yield Bond Fund | 3
Performance highlights (unaudited)
Investment objective
The Fund seeks total return, consisting of a high level of current income and capital appreciation.
Manager
Wells Fargo Funds Management, LLC
Subadviser
Wells Capital Management Incorporated
Portfolio managers
Robert Junkin
Margaret D. Patel
Average annual total returns (%) as of February 29, 20201
| | | | | | | | | | | | | | | | | | | | | | | | | | | | | | | | | | |
| | | | |
| | | | | Including sales charge | | | Excluding sales charge | | | Expense ratios2 (%) | |
| | | | | | | | | |
| | | Inception date | | 1 year | | | 5 year | | | 10 year | | | 1 year | | | 5 year | | | 10 year | | | Gross | | | Net3 | |
| | | | | | | | | | |
| Class A (EKHAX) | | 1-20-1998 | | | 0.80 | | | | 3.15 | | | | 5.57 | | | | 5.47 | | | | 4.13 | | | | 6.05 | | | | 1.04 | | | | 0.93 | |
| | | | | | | | | | |
| Class C (EKHCX) | | 1-21-1998 | | | 3.68 | | | | 3.36 | | | | 5.27 | | | | 4.68 | | | | 3.36 | | | | 5.27 | | | | 1.79 | | | | 1.68 | |
| | | | | | | | | | |
| Administrator Class (EKHYX) | | 4-14-1998 | | | – | | | | – | | | | – | | | | 5.28 | | | | 4.30 | | | | 6.26 | | | | 0.98 | | | | 0.80 | |
| | | | | | | | | | |
| Institutional Class (EKHIX)4 | | 10-31-2014 | | | – | | | | – | | | | – | | | | 5.56 | | | | 4.46 | | | | 6.38 | | | | 0.71 | | | | 0.53 | |
| | | | | | | | | | |
| ICE BofA U.S. High Yield Constrained Index5 | | – | | | – | | | | – | | | | – | | | | 5.91 | | | | 5.17 | | | | 7.14 | | | | – | | | | – | |
Figures quoted represent past performance, which is no guarantee of future results, and do not reflect taxes that a shareholder may pay on an investment in a fund. Investment return and principal value of an investment will fluctuate so that an investor’s shares, when redeemed, may be worth more or less than their original cost. Performance shown without sales charges would be lower if sales charges were reflected. Current performance may be lower or higher than the performance data quoted, which assumes the reinvestment of dividends and capital gains. Currentmonth-end performance is available on the Fund’s website,wfam.com.
Index returns do not include transaction costs associated with buying and selling securities, any mutual fund fees or expenses, or any taxes. It is not possible to invest directly in an index.
For Class A shares, the maximumfront-end sales charge is 4.50%. For Class C shares, the maximum contingent deferred sales charge is 1.00%. Performance including a contingent deferred sales charge assumes the sales charge for the corresponding time period. Administrator Class and Institutional Class shares are sold without afront-end sales charge or contingent deferred sales charge.
Bond values fluctuate in response to the financial condition of individual issuers, general market and economic conditions, and changes in interest rates. Changes in market conditions and government policies may lead to periods of heightened volatility in the bond market and reduced liquidity for certain bonds held by the Fund. In general, when interest rates rise, bond values fall and investors may lose principal value. Interest rate changes and their impact on the Fund and its share price can be sudden and unpredictable. The use of derivatives may reduce returns and/or increase volatility. High-yield securities have a greater risk of default and tend to be more volatile than higher-rated debt securities. Loans are subject to risks similar to those associated with other below investment-grade bond investments, such as credit risk (for example, risk of issuer default), below investment-grade bond risk (for example, risk of greater volatility in value), and risk that the loan may become illiquid or difficult to price. The Fund is exposed to foreign investment risk. Consult the Fund’s prospectus for additional information on these and other risks.
Please see footnotes on page 5.
4 | Wells Fargo High Yield Bond Fund
Performance highlights (unaudited)
| | | | |
| |
| Ten largest holdings (%) as of February 29, 20206 | | | |
| | |
Valvoline Incorporated, 4.38%,8-15-2025 | | | 3.91 | |
| | |
Bausch Health Companies Incorporated,5.25%, 1-30-2030 | | | 3.76 | |
| | |
Iron Mountain Incorporated, 5.38%,6-1-2026 | | | 3.60 | |
| | |
Western Digital Corporation, 4.75%,2-15-2026 | | | 3.10 | |
| | |
Tronox Finance plc, 5.75%,10-1-2025 | | | 3.09 | |
| | |
Broadcom Incorporated, 4.75%,4-15-2029 | | | 3.03 | |
| | |
Post Holdings Incorporated, 5.00%,8-15-2026 | | | 2.78 | |
| | |
MTS Systems Corporation, 5.75%,8-15-2027 | | | 2.78 | |
| | |
Seagate HDD, 4.88%,6-1-2027 | | | 2.76 | |
| | |
TransDigm Group Incorporated, 6.38%,6-15-2026 | | | 2.58 | |
| | |
|
| Credit quality as of February 29, 20207 |
|
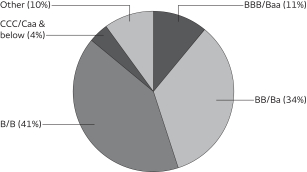 |
| 1 | Historical performance prior to July 12, 2010, is based on the performance of the Fund’s predecessor, Evergreen High Income Fund. |
| 2 | Reflects the expense ratios as stated in the most recent prospectuses. The expense ratios shown are subject to change and may differ from the annualized expense ratios shown in the financial highlights of this report. |
| 3 | Historical performance shown for the Institutional Class shares prior to their inception reflects the performance of the Administrator Class shares, and is not adjusted to reflect the Institutional Class expenses. If these expenses had been included, returns for the Institutional Class shares would be higher. |
| 4 | The manager has contractually committed through December 31, 2020, to waive fees and/or reimburse expenses to the extent necessary to cap total annual fund operating expenses after fee waivers at 0.93% for Class A, 1.68% for Class C, 0.80% for Administrator Class, and 0.53% for Institutional Class. Brokerage commissions, stamp duty fees, interest, taxes, acquired fund fees and expenses (if any), and extraordinary expenses are excluded from the expense cap. Prior to or after the commitment expiration date, the cap may be increased or the commitment to maintain the cap may be terminated only with the approval of the Board of Trustees. Without this cap, the Fund’s returns would have been lower. The expense ratio paid by an investor is the net expense ratio (the total annual fund operating expenses after fee waivers) as stated in the prospectuses. |
| 5 | The ICE BofA U.S. High Yield Constrained Index is a market value-weighted index of all domestic and Yankee high-yield bonds, including deferred interest bonds andpayment-in kind securities. Issues included in the index have maturities of one year or more and have a credit rating lower than BBB–/Baa3, but are not in default. The ICE BofA U.S. High Yield Constrained Index limits any individual issuer to a maximum of 2% benchmark exposure. You cannot invest directly in an index. Copyright 2020. ICE Data Indices, LLC. All rights reserved. |
| 6 | The ten largest holdings, excluding cash, cash equivalents and any money market funds, are calculated based on the value of the investments divided by total net assets of the Fund. Holdings are subject to change and may have changed since the date specified. |
| 7 | The credit quality distribution of portfolio holdings reflected in the chart is based on ratings from Standard & Poor’s, Moody’s Investors Service, and/or Fitch Ratings Ltd. Credit quality ratings apply to the underlying holdings of the Fund and not to the Fund itself. The percentages of the Fund’s portfolio with the ratings depicted in the chart are calculated based on the total market value of fixed income securities held by the Fund. If a security was rated by all three rating agencies, the middle rating was utilized. If rated by two of three rating agencies, the lower rating was utilized, and if rated by one of the rating agencies, that rating was utilized. Standard & Poor’s rates the creditworthiness of bonds, ranging from AAA (highest) to D (lowest). Ratings from A to CCC may be modified by the addition of a plus (+) or minus (-) sign to show relative standing within the rating categories. Standard & Poor’s rates the creditworthiness of short-term notes fromSP-1 (highest) toSP-3 (lowest). Moody’s rates the creditworthiness of bonds, ranging from Aaa (highest) to C (lowest). Ratings Aa to B may be modified by the addition of a number 1 (highest) to 3 (lowest) to show relative standing within the ratings categories. Moody’s rates the creditworthiness of short-term U.S.tax-exempt municipal securities from MIG 1/VMIG 1 (highest) to SG (lowest). Fitch rates the creditworthiness of bonds, ranging from AAA (highest) to D (lowest). Credit quality distribution is subject to change and may have changed since the date specified. |
Wells Fargo High Yield Bond Fund | 5
Fund expenses (unaudited)
As a shareholder of the Fund, you incur two types of costs: (1) transaction costs, including sales charges (loads) on purchase payments and contingent deferred sales charges (if any) on redemptions and (2) ongoing costs, including management fees, distribution(12b-1) and/or shareholder servicing fees, and other Fund expenses. This example is intended to help you understand your ongoing costs (in dollars) of investing in the Fund and to compare these costs with the ongoing costs of investing in other mutual funds.
The example is based on an investment of $1,000 invested at the beginning of thesix-month period and held for the entire period from September 1, 2019 to February 29, 2020.
Actual Expenses
The “Actual” line of the table below provides information about actual account values and actual expenses. You may use the information in this line, together with the amount you invested, to estimate the expenses that you paid over the period. Simply divide your account value by $1,000 (for example, an $8,600 account value divided by $1,000 = 8.6), then multiply the result by the number in the “Actual” line under the heading entitled “Expenses paid during period” for your applicable class of shares to estimate the expenses you paid on your account during this period.
Hypothetical Example for Comparison Purposes
The “Hypothetical” line of the table below provides information about hypothetical account values and hypothetical expenses based on the Fund’s actual expense ratio and an assumed rate of return of 5% per year before expenses, which is not the Fund’s actual return. The hypothetical account values and expenses may not be used to estimate the actual ending account balance or expenses you paid for the period. You may use this information to compare the ongoing costs of investing in the Fund and other funds. To do so, compare this 5% hypothetical example with the 5% hypothetical examples that appear in the shareholder reports of the other funds.
Please note that the expenses shown in the table are meant to highlight your ongoing costs only and do not reflect any transactional costs, such as sales charges (loads) and contingent deferred sales charges. Therefore, the “Hypothetical” line of the table is useful in comparing ongoing costs only and will not help you determine the relative total costs of owning different funds. In addition, if these transactional costs were included, your costs would have been higher.
| | | | | | | | | | | | | | | | |
| | | Beginning
account value
9-1-2019 | | | Ending
account value
2-29-2020 | | | Expenses
paid during
the period¹ | | | Annualized net
expense ratio | |
| | | | | |
Class A | | | | | | | | | | | | | | | | |
| | | | |
Actual | | $ | 1,000.00 | | | $ | 1,016.77 | | | $ | 4.66 | | | | 0.93 | % |
| | | | |
Hypothetical (5% return before expenses) | | $ | 1,000.00 | | | $ | 1,020.24 | | | $ | 4.67 | | | | 0.93 | % |
| | | | | |
Class C | | | | | | | | | | | | | | | | |
| | | | |
Actual | | $ | 1,000.00 | | | $ | 1,012.96 | | | $ | 8.41 | | | | 1.68 | % |
| | | | |
Hypothetical (5% return before expenses) | | $ | 1,000.00 | | | $ | 1,016.51 | | | $ | 8.42 | | | | 1.68 | % |
| | | | | |
Administrator Class | | | | | | | | | | | | | | | | |
| | | | |
Actual | | $ | 1,000.00 | | | $ | 1,017.43 | | | $ | 4.01 | | | | 0.80 | % |
| | | | |
Hypothetical (5% return before expenses) | | $ | 1,000.00 | | | $ | 1,020.89 | | | $ | 4.02 | | | | 0.80 | % |
| | | | | |
Institutional Class | | | | | | | | | | | | | | | | |
| | | | |
Actual | | $ | 1,000.00 | | | $ | 1,018.80 | | | $ | 2.66 | | | | 0.53 | % |
| | | | |
Hypothetical (5% return before expenses) | | $ | 1,000.00 | | | $ | 1,022.23 | | | $ | 2.66 | | | | 0.53 | % |
| 1 | Expenses paid is equal to the annualized net expense ratio of each class multiplied by the average account value over the period, multiplied by the number of days in the most recent fiscal half-year divided by the number of days in the fiscal year (to reflect theone-half-year period). |
6 | Wells Fargo High Yield Bond Fund
Portfolio of investments—February 29, 2020 (unaudited)
| | | | | | | | | | | | | | | | |
| | | | | | | | | Shares | | | Value | |
| Common Stocks: 8.71% | | | | | | | | | | | | | | | | |
| | | | |
Consumer Staples: 0.36% | | | | | | | | | | | | | | | | |
| | | | |
| Food Products: 0.36% | | | | | | | | | | | | |
Lamb Weston Holdings Incorporated | | | | | | | | | | | 15,000 | | | $ | 1,303,350 | |
| | | | | | | | | | | | | | | | |
| | | | |
Health Care: 0.93% | | | | | | | | | | | | | | | | |
| | | | |
| Biotechnology: 0.12% | | | | | | | | | | | | |
AbbVie Incorporated | | | | | | | | | | | 5,000 | | | | 428,550 | |
| | | | | | | | | | | | | | | | |
| | | | |
| Health Care Providers & Services: 0.17% | | | | | | | | | | | | |
HCA Healthcare Incorporated | | | | | | | | | | | 5,000 | | | | 635,050 | |
| | | | | | | | | | | | | | | | |
| | | | |
| Pharmaceuticals: 0.64% | | | | | | | | | | | | |
Bristol-Myers Squibb Company | | | | | | | | | | | 40,000 | | | | 2,362,400 | |
| | | | | | | | | | | | | | | | |
| | | | |
Industrials: 0.96% | | | | | | | | | | | | | | | | |
| | | | |
| Aerospace & Defense: 0.81% | | | | | | | | | | | | |
Curtiss-Wright Corporation | | | | | | | | | | | 8,381 | | | | 1,005,217 | |
Huntington Ingalls Industries Incorporated | | | | | | | | | | | 5,000 | | | | 1,027,650 | |
Raytheon Company | | | | | | | | | | | 5,000 | | | | 942,800 | |
| | | | |
| | | | | | | | | | | | | | | 2,975,667 | |
| | | | | | | | | | | | | | | | |
| | | | |
| Machinery: 0.15% | | | | | | | | | | | | |
John Bean Technologies Corporation | | | | | | | | | | | 5,773 | | | | 559,173 | |
| | | | | | | | | | | | | | | | |
| | | | |
Information Technology: 3.43% | | | | | | | | | | | | | | | | |
| | | | |
| Electronic Equipment, Instruments & Components: 0.25% | | | | | | | | | | | | |
Amphenol Corporation Class A | | | | | | | | | | | 10,000 | | | | 916,800 | |
| | | | | | | | | | | | | | | | |
| | | | |
| IT Services: 0.92% | | | | | | | | | | | | |
Akamai Technologies Incorporated † | | | | | | | | | | | 15,000 | | | | 1,297,650 | |
Leidos Holdings Incorporated | | | | | | | | | | | 20,000 | | | | 2,053,000 | |
| | | | |
| | | | | | | | | | | | | | | 3,350,650 | |
| | | | | | | | | | | | | | | | |
| | | | |
| Semiconductors & Semiconductor Equipment: 1.28% | | | | | | | | | | | | |
Applied Materials Incorporated | | | | | | | | | | | 10,000 | | | | 581,200 | |
Broadcom Incorporated | | | | | | | | | | | 5,000 | | | | 1,363,100 | |
Cypress Semiconductor Corporation | | | | | | | | | | | 35,000 | | | | 808,150 | |
Microchip Technology Incorporated | | | | | | | | | | | 7,000 | | | | 634,970 | |
Micron Technology Incorporated † | | | | | | | | | | | 25,000 | | | | 1,314,000 | |
| | | | |
| | | | | | | | | | | | | | | 4,701,420 | |
| | | | | | | | | | | | | | | | |
| | | | |
| Software: 0.96% | | | | | | | | | | | | |
Adobe Incorporated † | | | | | | | | | | | 5,000 | | | | 1,725,600 | |
Nutanix Incorporated Class A † | | | | | | | | | | | 5,000 | | | | 119,200 | |
Salesforce.com Incorporated † | | | | | | | | | | | 5,000 | | | | 852,000 | |
ServiceNow Incorporated † | | | | | | | | | | | 2,500 | | | | 815,225 | |
| | | | |
| | | | | | | | | | | | | | | 3,512,025 | |
| | | | | | | | | | | | | | | | |
| | | | |
| Technology Hardware, Storage & Peripherals: 0.02% | | | | | | | | | | | | |
Pure Storage Incorporated Class A † | | | | | | | | | | | 5,000 | | | | 76,300 | |
| | | | | | | | | | | | | | | | |
The accompanying notes are an integral part of these financial statements.
Wells Fargo High Yield Bond Fund | 7
Portfolio of investments—February 29, 2020 (unaudited)
| | | | | | | | | | | | | | | | |
| | | | | | | | | Shares | | | Value | |
Materials: 1.45% | | | | | | | | | | | | | | | | |
| | | | |
| Chemicals: 1.45% | | | | | | | | | | | | |
Celanese Corporation Series A | | | | | | | | | | | 15,000 | | | $ | 1,406,100 | |
Eastman Chemical Company | | | | | | | | | | | 10,000 | | | | 615,100 | |
Huntsman Corporation | | | | | | | | | | | 22,000 | | | | 416,680 | |
LyondellBasell Industries NV Class A | | | | | | | | | | | 40,000 | | | | 2,858,400 | |
| | | | |
| | | | | | | | | | | | | | | 5,296,280 | |
| | | | | | | | | | | | | | | | |
| | | | |
Real Estate: 0.33% | | | | | | | | | | | | | | | | |
| | | | |
| Equity REITs: 0.33% | | | | | | | | | | | | |
Crown Castle International Corporation | | | | | | | | | | | 4,000 | | | | 573,160 | |
Saul Centers Incorporated | | | | | | | | | | | 15,000 | | | | 645,150 | |
| | | | |
| | | | | | | | | | | | | | | 1,218,310 | |
| | | | | | | | | | | | | | | | |
| | | | |
Utilities: 1.25% | | | | | | | | | | | | | | | | |
| | | | |
| Gas Utilities: 0.85% | | | | | | | | | | | | |
Atmos Energy Corporation | | | | | | | | | | | 30,000 | | | | 3,097,500 | |
| | | | | | | | | | | | | | | | |
| | | | |
| Independent Power & Renewable Electricity Producers: 0.10% | | | | | | | | | | | | |
Vistra Energy Corporation | | | | | | | | | | | 20,000 | | | | 384,600 | |
| | | | | | | | | | | | | | | | |
| | | | |
| Multi-Utilities: 0.30% | | | | | | | | | | | | |
DTE Energy Company | | | | | | | | | | | 10,000 | | | | 1,116,700 | |
| | | | | | | | | | | | | | | | |
| | | | |
Total Common Stocks (Cost $28,878,536) | | | | | | | | | | | | | | | 31,934,775 | |
| | | | | | | | | | | | | | | | |
| | | | |
| | | | | | | | | | | | | | | | |
| | | Interest
rate | | | Maturity
date | | | Principal | | | | |
| Corporate Bonds and Notes: 79.24% | | | | | | | | | | | | | | | | |
| | | | |
Communication Services: 0.85% | | | | | | | | | | | | | | | | |
| | | | |
| Media: 0.85% | | | | | | | | | | | | |
CCO Holdings LLC 144A | | | 5.75 | % | | | 2-15-2026 | | | $ | 3,000,000 | | | | 3,119,100 | |
| | | | | | | | | | | | | | | | |
| | | | |
Consumer Discretionary: 3.83% | | | | | | | | | | | | | | | | |
| | | | |
| Auto Components: 2.64% | | | | | | | | | | | | |
Allison Transmission Incorporated 144A | | | 5.00 | | | | 10-1-2024 | | | | 1,000,000 | | | | 1,011,210 | |
Dana Holding Corporation | | | 5.50 | | | | 12-15-2024 | | | | 1,500,000 | | | | 1,515,570 | |
Speedway Motors Incorporated 144A | | | 4.88 | | | | 11-1-2027 | | | | 2,000,000 | | | | 1,982,600 | |
Tenneco Incorporated « | | | 5.00 | | | | 7-15-2026 | | | | 6,000,000 | | | | 5,160,000 | |
| | | | |
| | | | | | | | | | | | | | | 9,669,380 | |
| | | | | | | | | | | | | | | | |
| | | | |
| Household Durables: 1.19% | | | | | | | | | | | | |
Installed Building Company 144A | | | 5.75 | | | | 2-1-2028 | | | | 4,110,000 | | | | 4,379,698 | |
| | | | | | | | | | | | | | | | |
| | | | |
Consumer Staples: 4.47% | | | | | | | | | | | | | | | | |
| | | | |
| Food Products: 3.91% | | | | | | | | | | | | |
Lamb Weston Holdings Incorporated 144A | | | 4.63 | | | | 11-1-2024 | | | | 1,000,000 | | | | 1,040,827 | |
Lamb Weston Holdings Incorporated 144A | | | 4.88 | | | | 11-1-2026 | | | | 3,000,000 | | | | 3,112,650 | |
Post Holdings Incorporated 144A | | | 5.00 | | | | 8-15-2026 | | | | 10,000,000 | | | | 10,200,000 | |
| | | | |
| | | | | | | | | | | | | | | 14,353,477 | |
| | | | | | | | | | | | | | | | |
| | | | |
| Household Products: 0.56% | | | | | | | | | | | | |
Spectrum Brands Incorporated | | | 5.75 | | | | 7-15-2025 | | | | 2,000,000 | | | | 2,050,000 | |
| | | | | | | | | | | | | | | | |
The accompanying notes are an integral part of these financial statements.
8 | Wells Fargo High Yield Bond Fund
Portfolio of investments—February 29, 2020 (unaudited)
| | | | | | | | | | | | | | | | |
| | | Interest
rate | | | Maturity
date | | | Principal | | | Value | |
Energy: 2.64% | | | | | | | | | | | | | | | | |
| | | | |
| Energy Equipment & Services: 0.30% | | | | | | | | | | | | |
NGPL PipeCo LLC 144A | | | 4.88 | % | | | 8-15-2027 | | | $ | 1,000,000 | | | $ | 1,083,711 | |
| | | | | | | | | | | | | | | | |
| | | | |
| Oil, Gas & Consumable Fuels: 2.34% | | | | | | | | | | | | |
Cheniere Corpus Christi Holdings LLC | | | 5.13 | | | | 6-30-2027 | | | | 3,500,000 | | | | 3,801,459 | |
Cheniere Energy Partners LP 144A | | | 4.50 | | | | 10-1-2029 | | | | 5,000,000 | | | | 4,781,500 | |
| |
| | | | 8,582,959 | |
| | | | | | | | | | | | | | | | |
|
Financials: 2.41% | |
|
| Banks: 0.91% | |
Bank of America Corporation (3 Month LIBOR +3.90%)± | | | 6.10 | | | | 12-29-2049 | | | | 3,000,000 | | | | 3,325,830 | |
| | | | | | | | | | | | | | | | |
|
| Consumer Finance: 0.97% | |
Navient Corporation | | | 5.88 | | | | 10-25-2024 | | | | 1,000,000 | | | | 1,025,020 | |
SLM Corporation | | | 5.50 | | | | 1-25-2023 | | | | 2,500,000 | | | | 2,556,250 | |
| |
| | | | 3,581,270 | |
| | | | | | | | | | | | | | | | |
|
| Insurance: 0.53% | |
Genworth Holdings Incorporated « | | | 4.80 | | | | 2-15-2024 | | | | 2,000,000 | | | | 1,940,000 | |
| | | | | | | | | | | | | | | | |
|
Health Care: 15.09% | |
|
| Health Care Equipment & Supplies: 1.54% | |
Teleflex Incorporated | | | 4.88 | | | | 6-1-2026 | | | | 5,415,000 | | | | 5,645,138 | |
| | | | | | | | | | | | | | | | |
|
| Health Care Providers & Services: 4.89% | |
Centene Corporation 144A | | | 4.63 | | | | 12-15-2029 | | | | 3,000,000 | | | | 3,210,000 | |
Davita Incorporated | | | 5.00 | | | | 5-1-2025 | | | | 3,000,000 | | | | 3,044,250 | |
Encompass Health Corporation | | | 5.75 | | | | 11-1-2024 | | | | 2,334,000 | | | | 2,354,609 | |
HealthSouth Corporation | | | 5.13 | | | | 3-15-2023 | | | | 5,000,000 | | | | 5,012,500 | |
West Street Merger Sub Incorporated 144A | | | 6.38 | | | | 9-1-2025 | | | | 4,400,000 | | | | 4,310,592 | |
| |
| | | | 17,931,951 | |
| | | | | | | | | | | | | | | | |
|
| Health Care Technology: 0.85% | |
Quintiles IMS Holdings Incorporated 144A | | | 5.00 | | | | 10-15-2026 | | | | 3,000,000 | | | | 3,094,815 | |
| | | | | | | | | | | | | | | | |
|
| Life Sciences Tools & Services: 1.81% | |
Charles River Laboratories Incorporated 144A | | | 5.50 | | | | 4-1-2026 | | | | 6,300,000 | | | | 6,623,978 | |
| | | | | | | | | | | | | | | | |
|
| Pharmaceuticals: 6.00% | |
Bausch Health Companies Incorporated 144A | | | 5.25 | | | | 1-30-2030 | | | | 13,950,000 | | | | 13,793,063 | |
Catalent Pharma Solutions Incorporated 144A | | | 4.88 | | | | 1-15-2026 | | | | 8,000,000 | | | | 8,200,000 | |
| |
| | | | 21,993,063 | |
| | | | | | | | | | | | | | | | |
|
Industrials: 12.78% | |
|
| Aerospace & Defense: 4.42% | |
Huntington Ingalls Industries Incorporated 144A | | | 5.00 | | | | 11-15-2025 | | | | 2,500,000 | | | | 2,613,497 | |
Moog Incorporated 144A | | | 4.25 | | | | 12-15-2027 | | | | 4,050,000 | | | | 4,120,875 | |
TransDigm Group Incorporated | | | 6.38 | | | | 6-15-2026 | | | | 9,200,000 | | | | 9,453,460 | |
| |
| | | | 16,187,832 | |
| | | | | | | | | | | | | | | | |
|
| Commercial Services & Supplies: 3.82% | |
Clean Harbors Incorporated 144A | | | 4.88 | | | | 7-15-2027 | | | | 3,000,000 | | | | 3,134,100 | |
Clean Harbors Incorporated 144A | | | 5.13 | | | | 7-15-2029 | | | | 4,250,000 | | | | 4,552,813 | |
The accompanying notes are an integral part of these financial statements.
Wells Fargo High Yield Bond Fund | 9
Portfolio of investments—February 29, 2020 (unaudited)
| | | | | | | | | | | | | | | | |
| | | Interest
rate | | | Maturity
date | | | Principal | | | Value | |
|
| Commercial Services & Supplies (continued) | |
Stericycle Incorporated 144A | | | 5.38 | % | | | 7-15-2024 | | | $ | 6,000,000 | | | $ | 6,306,000 | |
| | | | |
| | | | | | | | | | | | | | | 13,992,913 | |
| | | | | | | | | | | | | | | | |
| | | | |
| Construction & Engineering: 0.85% | | | | | | | | | | | | |
Aecom Company | | | 5.13 | | | | 3-15-2027 | | | | 3,000,000 | | | | 3,099,810 | |
| | | | | | | | | | | | | | | | |
| | | | |
| Electrical Equipment: 0.53% | | | | | | | | | | | | |
Resideo Funding Incorporated 144A « | | | 6.13 | | | | 11-1-2026 | | | | 2,000,000 | | | | 1,955,000 | |
| | | | | | | | | | | | | | | | |
| | | | |
| Machinery: 1.41% | | | | | | | | | | | | |
SPX FLOW Incorporated 144A | | | 5.63 | | | | 8-15-2024 | | | | 5,000,000 | | | | 5,165,650 | |
| | | | | | | | | | | | | | | | |
| | | | |
| Trading Companies & Distributors: 1.75% | | | | | | | | | | | | |
WESCO Distribution Incorporated | | | 5.38 | | | | 6-15-2024 | | | | 6,245,000 | | | | 6,432,350 | |
| | | | | | | | | | | | | | | | |
|
Information Technology: 20.38% | |
|
| Communications Equipment: 3.15% | |
CommScope Incorporated 144A | | | 5.50 | | | | 6-15-2024 | | | | 8,200,000 | | | | 7,790,820 | |
CommScope Technologies Finance LLC 144A | | | 6.00 | | | | 6-15-2025 | | | | 4,000,000 | | | | 3,760,000 | |
| | | | |
| | | | | | | | | | | | | | | 11,550,820 | |
| | | | | | | | | | | | | | | | |
| | | | |
| Electronic Equipment, Instruments & Components: 5.28% | | | | | | | | | | | | |
MTS Systems Corporation 144A | | | 5.75 | | | | 8-15-2027 | | | | 10,000,000 | | | | 10,175,000 | |
TTM Technologies Incorporated 144A | | | 5.63 | | | | 10-1-2025 | | | | 9,000,000 | | | | 9,180,000 | |
| | | | |
| | | | | | | | | | | | | | | 19,355,000 | |
| | | | | | | | | | | | | | | | |
| | | | |
| IT Services: 1.41% | | | | | | | | | | | | |
Gartner Incorporated 144A | | | 5.13 | | | | 4-1-2025 | | | | 5,000,000 | | | | 5,163,000 | |
| | | | | | | | | | | | | | | | |
|
| Semiconductors & Semiconductor Equipment: 4.70% | |
Broadcom Incorporated 144A | | | 4.75 | | | | 4-15-2029 | | | | 10,000,000 | | | | 11,122,291 | |
Broadcom Incorporated 144A | | | 5.00 | | | | 4-15-2025 | | | | 6,000,000 | | | | 6,090,972 | |
| | | | |
| | | | | | | | | | | | | | | 17,213,263 | |
| | | | | | | | | | | | | | | | |
| | | | |
| Software: 0.85% | | | | | | | | | | | | |
Citrix Systems Incorporated | | | 3.30 | | | | 3-1-2030 | | | | 2,000,000 | | | | 2,011,190 | |
Fair Isaac Corporation 144A | | | 5.25 | | | | 5-15-2026 | | | | 1,000,000 | | | | 1,107,500 | |
| | | | |
| | | | | | | | | | | | | | | 3,118,690 | |
| | | | | | | | | | | | | | | | |
| | | | |
| Technology Hardware, Storage & Peripherals: 4.99% | | | | | | | | | | | | |
Diebold Nixdorf Incorporated « | | | 8.50 | | | | 4-15-2024 | | | | 7,700,000 | | | | 6,930,000 | |
Western Digital Corporation | | | 4.75 | | | | 2-15-2026 | | | | 11,000,000 | | | | 11,357,500 | |
| | | | |
| | | | | | | | | | | | | | | 18,287,500 | |
| | | | | | | | | | | | | | | | |
|
Materials: 9.50% | |
| | | | |
| Chemicals: 6.80% | | | | | | | | | | | | |
Koppers Incorporated 144A | | | 6.00 | | | | 2-15-2025 | | | | 3,363,000 | | | | 3,312,555 | |
Olin Corporation | | | 5.50 | | | | 8-15-2022 | | | | 3,275,000 | | | | 3,455,125 | |
Rayonier Advanced Materials Products Incorporated 144A « | | | 5.50 | | | | 6-1-2024 | | | | 3,310,000 | | | | 1,892,923 | |
Tronox Incorporated 144A | | | 6.50 | | | | 4-15-2026 | | | | 2,000,000 | | | | 1,919,900 | |
Valvoline Incorporated | | | 4.38 | | | | 8-15-2025 | | | | 13,901,000 | | | | 14,318,030 | |
| | | | |
| | | | | | | | | | | | | | | 24,898,533 | |
| | | | | | | | | | | | | | | | |
The accompanying notes are an integral part of these financial statements.
10 | Wells Fargo High Yield Bond Fund
Portfolio of investments—February 29, 2020 (unaudited)
| | | | | | | | | | | | | | | | |
| | | Interest
rate | | | Maturity
date | | | Principal | | | Value | |
| Containers & Packaging: 2.70% | |
Berry Global Incorporated 144A | | | 4.50 | % | | | 2-15-2026 | | | $ | 6,000,000 | | | $ | 5,902,800 | |
Berry Global Incorporated | | | 5.13 | | | | 7-15-2023 | | | | 4,000,000 | | | | 4,001,960 | |
| |
| | | | 9,904,760 | |
| | | | | | | | | | | | | | | | |
|
Real Estate: 7.29% | |
|
| Equity REITs: 7.29% | |
Equinix Incorporated | | | 5.38 | | | | 5-15-2027 | | | | 3,430,000 | | | | 3,695,482 | |
Iron Mountain Incorporated 144A | | | 4.88 | | | | 9-15-2027 | | | | 500,000 | | | | 506,250 | |
Iron Mountain Incorporated 144A | | | 5.38 | | | | 6-1-2026 | | | | 12,750,000 | | | | 13,196,250 | |
Sabra Health Care LP/Sabra Capital Corporation | | | 3.90 | | | | 10-15-2029 | | | | 3,639,000 | | | | 3,859,887 | |
SBA Communications Corporation 144A | | | 3.88 | | | | 2-15-2027 | | | | 5,350,000 | | | | 5,458,605 | |
| | | | |
| | | | | | | | | | | | | | | 26,716,474 | |
| | | | | | | | | | | | | | | | |
| | | | |
Total Corporate Bonds and Notes (Cost $288,742,928) | | | | | | | | | | | | | | | 290,415,965 | |
| | | | | | | | | | | | | | | | |
|
Yankee Corporate Bonds and Notes: 10.35% | |
|
Communication Services: 0.56% | |
|
| Diversified Telecommunication Services: 0.56% | |
Virgin Media Finance plc 144A | | | 5.75 | | | | 1-15-2025 | | | | 2,000,000 | | | | 2,035,000 | |
| | | | | | | | | | | | | | | | |
|
Consumer Discretionary: 3.05% | |
|
| Auto Components: 2.17% | |
Adient Global Holdings Limited 144A « | | | 4.88 | | | | 8-15-2026 | | | | 9,210,000 | | | | 7,943,625 | |
| | | | | | | | | | | | | | | | |
|
| Hotels, Restaurants & Leisure: 0.88% | |
International Game Technology plc 144A | | | 6.50 | | | | 2-15-2025 | | | | 3,000,000 | | | | 3,247,500 | |
| | | | | | | | | | | | | | | | |
|
Financials: 3.10% | |
|
| Diversified Financial Services: 3.10% | |
Tronox Finance plc 144A | | | 5.75 | | | | 10-1-2025 | | | | 12,000,000 | | | | 11,342,400 | |
| | | | | | | | | | | | | | | | |
|
Industrials: 0.88% | |
|
| Electrical Equipment: 0.88% | |
Sensata Technologies BV 144A | | | 5.63 | | | | 11-1-2024 | | | | 3,000,000 | | | | 3,233,250 | |
| | | | | | | | | | | | | | | | |
|
Information Technology: 2.76% | |
|
| Technology Hardware, Storage & Peripherals: 2.76% | |
Seagate HDD | | | 4.88 | | | | 6-1-2027 | | | | 9,500,000 | | | | 10,129,522 | |
| | | | | | | | | | | | | | | | |
| | | | |
Total Yankee Corporate Bonds and Notes (Cost $38,367,330) | | | | | | | | | | | | | | | 37,931,297 | |
| | | | | | | | | | | | | | | | |
| | | | |
| | | | | | | | | | | | | | | | |
| | | Yield | | | | | | Shares | | | | |
Short-Term Investments: 4.78% | |
|
| Investment Companies: 4.78% | |
Securities Lending Cash Investments LLC (l)(r)(u) | | | 1.66 | | | | | | | | 13,561,853 | | | | 13,563,209 | |
Wells Fargo Government Money Market Fund Select Class (l)(u) | | | 1.52 | | | | | | | | 3,934,142 | | | | 3,934,142 | |
| |
Total Short-Term Investments (Cost $17,497,351) | | | | 17,497,351 | |
| | | | | | | | | | | | | | | | |
| | | | | | | | |
| Total investments in securities (Cost $373,486,145) | | | 103.08 | % | | | 377,779,388 | |
| | |
Other assets and liabilities, net | | | (3.08 | ) | | | (11,291,939 | ) |
| | | | | | | | |
| Total net assets | | | 100.00 | % | | $ | 366,487,449 | |
| | | | | | | | |
The accompanying notes are an integral part of these financial statements.
Wells Fargo High Yield Bond Fund | 11
Portfolio of investments—February 29, 2020 (unaudited)
| † | Non-income-earning security |
| 144A | The security may be resold in transactions exempt from registration, normally to qualified institutional buyers, pursuant to Rule 144A under the Securities Act of 1933. |
| « | All or a portion of this security is on loan. |
| ± | Variable rate investment. The rate shown is the rate in effect at period end. |
| (l) | The issuer of the security is an affiliated person of the Fund as defined in the Investment Company Act of 1940. |
| (r) | The investment is anon-registered investment company purchased with cash collateral received from securities on loan. |
| (u) | The rate represents the7-day annualized yield at period end. |
Abbreviations:
| LIBOR | London Interbank Offered Rate |
| REIT | Real estate investment trust |
Investments in Affiliates
An affiliated investment is an investment in which the Fund owns at least 5% of the outstanding voting shares of the issuer or as a result of other relationships, such as the Fund and the issuer having the same investment manager. Transactions with issuers that were either affiliated persons of the Fund at the beginning of the period or the end of the period were as follows:
| | | | | | | | | | | | | | | | | | | | | | | | | | | | | | | | | | | | |
| | | Shares,
beginning of
period | | | Shares
purchased | | | Shares
sold | | | Shares,
end of
period | | | Net
realized
gains
(losses) | | | Net
change in
unrealized
gains
(losses) | | | Income
from
affiliated
securities | | | Value,
end of
period | | | % of
net
assets | |
| | | | | | | | | |
| Short-Term Investments | | | | | | | | | | | | | | | | | | | | | | | | | | | |
Investment Companies | | | | | | | | | | | | | | | | | | | | | | | | | | | | | | | | | | | | |
Securities Lending Cash Investments LLC | | | 8,780,656 | | | | 43,837,964 | | | | (39,056,767 | ) | | | 13,561,853 | | | $ | 842 | | | $ | 0 | | | $ | 139,429 | # | | $ | 13,563,209 | | | | | |
Wells Fargo Government Money Market Fund Select Class | | | 5,876,344 | | | | 73,344,987 | | | | (75,287,189 | ) | | | 3,934,142 | | | | 0 | | | | 0 | | | | 38,212 | | | | 3,934,142 | | | | | |
| | | | | | | | | | | | | | | | | | | | | | | | | | | | | | | | | | | | |
| | | | | | | | | | | | | | | | | | $ | 842 | | | $ | 0 | | | $ | 177,641 | | | $ | 17,497,351 | | | | 4.78 | % |
| | | | | | | | | | | | | | | | | | | | | | | | | | | | | | | | | | | | |
| # | Amount shown represents income before fees and rebates. |
The accompanying notes are an integral part of these financial statements.
12 | Wells Fargo High Yield Bond Fund
Statement of assets and liabilities—February 29, 2020 (unaudited)
| | | | |
| | | | |
| |
Assets | | | | |
Investments in unaffiliated securities (including $13,283,107 of securities loaned), at value (cost $355,988,794) | | $ | 360,282,037 | |
Investments in affiliated securities, at value (cost $17,497,351) | | | 17,497,351 | |
Receivable for investments sold | | | 165,224 | |
Receivable for Fund shares sold | | | 60,180 | |
Receivable for dividends and interest | | | 3,954,712 | |
Receivable for securities lending income, net | | | 2,445 | |
Prepaid expenses and other assets | | | 95,672 | |
| | | | |
Total assets | | | 382,057,621 | |
| | | | |
| |
Liabilities | | | | |
Payable upon receipt of securities loaned | | | 13,561,897 | |
Payable for Fund shares redeemed | | | 1,572,855 | |
Management fee payable | | | 129,289 | |
Dividends payable | | | 75,047 | |
Administration fees payable | | | 43,686 | |
Distribution fee payable | | | 6,022 | |
Trustees’ fees and expenses payable | | | 5,847 | |
Accrued expenses and other liabilities | | | 175,529 | |
| | | | |
Total liabilities | | | 15,570,172 | |
| | | | |
Total net assets | | $ | 366,487,449 | |
| | | | |
| |
Net assets consist of | | | | |
Paid-in capital | | $ | 416,087,739 | |
Total distributable loss | | | (49,600,290 | ) |
| | | | |
Total net assets | | $ | 366,487,449 | |
| | | | |
| |
Computation of net asset value and offering price per share | | | | |
Net assets – Class A | | $ | 259,352,712 | |
Shares outstanding – Class A1 | | | 79,042,087 | |
Net asset value per share – Class A | | | $3.28 | |
Maximum offering price per share – Class A2 | | | $3.43 | |
Net assets – Class C | | $ | 9,469,786 | |
Shares outstanding – Class C1 | | | 2,889,066 | |
Net asset value per share – Class C | | | $3.28 | |
Net assets – Administrator Class | | $ | 24,665,402 | |
Shares outstanding – Administrator Class1 | | | 7,509,865 | |
Net asset value per share – Administrator Class | | | $3.28 | |
Net assets – Institutional Class | | $ | 72,999,549 | |
Shares outstanding – Institutional Class1 | | | 22,224,214 | |
Net asset value per share – Institutional Class | | | $3.28 | |
| 1 | The Fund has an unlimited number of authorized shares. |
| 1 | Maximum offering price is computed as 100/95.50 of net asset value. On investments of $50,000 or more, the offering price is reduced. |
The accompanying notes are an integral part of these financial statements.
Wells Fargo High Yield Bond Fund | 13
Statement of operations—six months ended February 29, 2020 (unaudited)
| | | | |
| | | | |
| |
Investment income | | | | |
Interest | | $ | 8,931,918 | |
Dividends | | | 403,575 | |
Income from affiliated securities | | | 63,815 | |
| | | | |
Total investment income | | | 9,399,308 | |
| | | | |
| |
Expenses | | | | |
Management fee | | | 1,044,765 | |
Administration fees | | | | |
Class A | | | 214,775 | |
Class C | | | 8,429 | |
Administrator Class | | | 12,549 | |
Institutional Class | | | 30,325 | |
Shareholder servicing fees | | | | |
Class A | | | 335,587 | |
Class C | | | 13,170 | |
Administrator Class | | | 31,372 | |
Distribution fee | | | | |
Class C | | | 39,428 | |
Custody and accounting fees | | | 16,076 | |
Professional fees | | | 33,670 | |
Registration fees | | | 44,629 | |
Shareholder report expenses | | | 49,590 | |
Trustees’ fees and expenses | | | 10,909 | |
Other fees and expenses | | | 8,926 | |
| | | | |
Total expenses | | | 1,894,200 | |
Less: Fee waivers and/or expense reimbursements | | | | |
Fund-level | | | (256,025 | ) |
| | | | |
Net expenses | | | 1,638,175 | |
| | | | |
Net investment income | | | 7,761,133 | |
| | | | |
| |
Realized and unrealized gains (losses) on investments | | | | |
Net realized gains (losses) on | | | | |
Unaffiliated securities | | | (11,274,073 | ) |
Affiliated securities | | | 842 | |
| | | | |
Net realized losses on investments | | | (11,273,231 | ) |
Net change in unrealized gains (losses) on investments | | | 10,498,795 | |
| | | | |
Net realized and unrealized gains (losses) on investments | | | (774,436 | ) |
| | | | |
Net increase in net assets resulting from operations | | $ | 6,986,697 | |
| | | | |
The accompanying notes are an integral part of these financial statements.
14 | Wells Fargo High Yield Bond Fund
Statement of changes in net assets
| | | | | | | | | | | | | | | | |
| | | Six months ended February 29, 2020 (unaudited) | | | Year ended
August 31, 2019 | |
| | | | |
Operations | | | | | | | | | | | | | | | | |
Net investment income | | | | | | $ | 7,761,133 | | | | | | | $ | 18,191,630 | |
Net realized losses on investments | | | | | | | (11,273,231 | ) | | | | | | | (2,340,442 | ) |
Net change in unrealized gains (losses) on investments | | | | | | | 10,498,795 | | | | | | | | (106,513 | ) |
| | | | |
Net increase in net assets resulting from operations | | | | | | | 6,986,697 | | | | | | | | 15,744,675 | |
| | | | |
| | | | |
Distributions to shareholders from net investment income and net realized gains | | | | | | | | | | | | | | | | |
Class A | | | | | | | (5,292,856 | ) | | | | | | | (11,648,408 | ) |
Class C | | | | | | | (168,257 | ) | | | | | | | (966,845 | ) |
Administrator Class | | | | | | | (511,120 | ) | | | | | | | (1,048,193 | ) |
Institutional Class | | | | | | | (1,645,418 | ) | | | | | | | (4,608,052 | ) |
| | | | |
Total distributions to shareholders | | | | | | | (7,617,651 | ) | | | | | | | (18,271,498 | ) |
| | | | |
| | | | |
Capital share transactions | | | Shares | | | | | | | | Shares | | | | | |
Proceeds from shares sold | | | | | | | | | | | | | | | | |
Class A | | | 2,512,565 | | | | 8,373,703 | | | | 12,335,218 | | | | 39,632,798 | |
Class C | | | 101,203 | | | | 334,880 | | | | 215,166 | | | | 696,992 | |
Administrator Class | | | 930,232 | | | | 3,120,826 | | | | 1,559,733 | | | | 5,085,129 | |
Institutional Class | | | 5,259,900 | | | | 17,436,165 | | | | 24,871,051 | | | | 80,385,234 | |
| | | | |
| | | | | | | 29,265,574 | | | | | | | | 125,800,153 | |
| | | | |
Reinvestment of distributions | | | | | | | | | | | | | | | | |
Class A | | | 1,453,068 | | | | 4,824,317 | | | | 3,272,349 | | | | 10,551,156 | |
Class C | | | 47,508 | | | | 157,581 | | | | 291,746 | | | | 931,523 | |
Administrator Class | | | 147,184 | | | | 489,196 | | | | 309,697 | | | | 998,849 | |
Institutional Class | | | 492,807 | | | | 1,637,793 | | | | 1,388,617 | | | | 4,476,567 | |
| | | | |
| | | | | | | 7,108,887 | | | | | | | | 16,958,095 | |
| | | | |
Payment for shares redeemed | | | | | | | | | | | | | | | | |
Class A | | | (8,099,090 | ) | | | (27,016,895 | ) | | | (15,355,876 | ) | | | (49,481,698 | ) |
Class C | | | (979,385 | ) | | | (3,239,403 | ) | | | (11,351,514 | ) | | | (36,368,438 | ) |
Administrator Class | | | (1,060,656 | ) | | | (3,532,351 | ) | | | (1,663,412 | ) | | | (5,370,540 | ) |
Institutional Class | | | (6,573,361 | ) | | | (21,784,294 | ) | | | (44,246,117 | ) | | | (141,384,353 | ) |
| | | | |
| | | | | | | (55,572,943 | ) | | | | | | | (232,605,029 | ) |
| | | | |
Net decrease in net assets resulting from capital share transactions | | | | | | | (19,198,482 | ) | | | | | | | (89,846,781 | ) |
| | | | |
Total decrease in net assets | | | | | | | (19,829,436 | ) | | | | | | | (92,373,604 | ) |
| | | | |
| | | | |
Net assets | | | | | | | | | | | | | | | | |
Beginning of period | | | | | | | 386,316,885 | | | | | | | | 478,690,489 | |
| | | | |
End of period | | | | | | $ | 366,487,449 | | | | | | | $ | 386,316,885 | |
| | | | |
The accompanying notes are an integral part of these financial statements.
Wells Fargo High Yield Bond Fund | 15
Financial highlights
(For a share outstanding throughout each period)
| | | | | | | | | | | | | | | | | | | | | | | | |
| | | Six months ended
February 29, 2020
(unaudited) | | | Year ended August 31 | |
| CLASS A | | 2019 | | | 2018 | | | 2017 | | | 2016 | | | 2015 | |
Net asset value, beginning of period | | | $3.29 | | | | $3.28 | | | | $3.40 | | | | $3.31 | | | | $3.16 | | | | $3.35 | |
Net investment income | | | 0.07 | | | | 0.14 | | | | 0.14 | | | | 0.14 | | | | 0.13 | | | | 0.13 | |
Net realized and unrealized gains (losses) on investments | | | (0.02 | ) | | | 0.01 | | | | (0.12 | ) | | | 0.10 | | | | 0.15 | | | | (0.19 | ) |
| | | | | | | | | | | | | | | | | | | | | | | | |
Total from investment operations | | | 0.05 | | | | 0.15 | | | | 0.02 | | | | 0.24 | | | | 0.28 | | | | (0.06 | ) |
Distributions to shareholders from | | | | | | | | | | | | | | | | | | | | | | | | |
Net investment income | | | (0.06 | ) | | | (0.14 | ) | | | (0.13 | ) | | | (0.15 | ) | | | (0.13 | ) | | | (0.13 | ) |
Tax basis return of capital | | | 0.00 | | | | 0.00 | | | | (0.01 | ) | | | (0.00 | )1 | | | 0.00 | | | | 0.00 | |
| | | | | | | | | | | | | | | | | | | | | | | | |
Total distributions to shareholders | | | (0.06 | ) | | | (0.14 | ) | | | (0.14 | ) | | | (0.15 | ) | | | (0.13 | ) | | | (0.13 | ) |
Net asset value, end of period | | | $3.28 | | | | $3.29 | | | | $3.28 | | | | $3.40 | | | | $3.31 | | | | $3.16 | |
Total return2 | | | 1.68 | % | | | 4.79 | % | | | 0.68 | % | | | 7.28 | % | | | 9.25 | % | | | (1.79 | )% |
Ratios to average net assets (annualized) | | | | | | | | | | | | | | | | | | | | | | | | |
Gross expenses | | | 1.05 | % | | | 1.04 | % | | | 1.02 | % | | | 1.01 | % | | | 1.04 | % | | | 1.04 | % |
Net expenses | | | 0.93 | % | | | 0.93 | % | | | 0.93 | % | | | 0.93 | % | | | 1.01 | % | | | 1.03 | % |
Net investment income | | | 4.01 | % | | | 4.36 | % | | | 4.26 | % | | | 4.39 | % | | | 4.24 | % | | | 4.04 | % |
Supplemental data | | | | | | | | | | | | | | | | | | | | | | | | |
Portfolio turnover rate | | | 15 | % | | | 26 | % | | | 18 | % | | | 20 | % | | | 75 | % | | | 55 | % |
Net assets, end of period (000s omitted) | | | $259,353 | | | | $273,553 | | | | $272,170 | | | | $314,156 | | | | $370,560 | | | | $179,357 | |
| 1 | Amount is less than $0.005. |
| 2 | Total return calculations do not include any sales charges. Returns for periods of less than one year are not annualized. |
The accompanying notes are an integral part of these financial statements.
16 | Wells Fargo High Yield Bond Fund
Financial highlights
(For a share outstanding throughout each period)
| | | | | | | | | | | | | | | | | | | | | | | | |
| | | Six months ended
February 29, 2020
(unaudited) | | | Year ended August 31 | |
| CLASS C | | 2019 | | | 2018 | | | 2017 | | | 2016 | | | 2015 | |
Net asset value, beginning of period | | | $3.29 | | | | $3.28 | | | | $3.40 | | | | $3.31 | | | | $3.16 | | | | $3.35 | |
Net investment income | | | 0.06 | | | | 0.12 | 1 | | | 0.12 | | | | 0.12 | | | | 0.11 | | | | 0.11 | |
Net realized and unrealized gains (losses) on investments | | | (0.02 | ) | | | 0.01 | | | | (0.12 | ) | | | 0.09 | | | | 0.15 | | | | (0.19 | ) |
| | | | | | | | | | | | | | | | | | | | | | | | |
Total from investment operations | | | 0.04 | | | | 0.13 | | | | (0.00 | ) | | | 0.21 | | | | 0.26 | | | | (0.08 | ) |
Distributions to shareholders from | | | | | | | | | | | | | | | | | | | | | | | | |
Net investment income | | | (0.05 | ) | | | (0.12 | ) | | | (0.11 | ) | | | (0.12 | ) | | | (0.11 | ) | | | (0.11 | ) |
Tax basis return of capital | | | 0.00 | | | | 0.00 | | | | (0.01 | ) | | | (0.00 | )2 | | | 0.00 | | | | 0.00 | |
| | | | | | | | | | | | | | | | | | | | | | | | |
Total distributions to shareholders | | | (0.05 | ) | | | (0.12 | ) | | | (0.12 | ) | | | (0.12 | ) | | | (0.11 | ) | | | (0.11 | ) |
Net asset value, end of period | | | $3.28 | | | | $3.29 | | | | $3.28 | | | | $3.40 | | | | $3.31 | | | | $3.16 | |
Total return2 | | | 1.30 | % | | | 4.00 | % | | | (0.07 | )% | | | 6.49 | % | | | 8.44 | % | | | (2.52 | )% |
Ratios to average net assets (annualized) | | | | | | | | | | | | | | | | | | | | | | | | |
Gross expenses | | | 1.79 | % | | | 1.79 | % | | | 1.77 | % | | | 1.76 | % | | | 1.80 | % | | | 1.79 | % |
Net expenses | | | 1.68 | % | | | 1.68 | % | | | 1.68 | % | | | 1.68 | % | | | 1.77 | % | | | 1.78 | % |
Net investment income | | | 3.34 | % | | | 3.64 | % | | | 3.51 | % | | | 3.65 | % | | | 3.48 | % | | | 3.29 | % |
Supplemental data | | | | | | | | | | | | | | | | | | | | | | | | |
Portfolio turnover rate | | | 15 | % | | | 26 | % | | | 18 | % | | | 20 | % | | | 75 | % | | | 55 | % |
Net assets, end of period (000s omitted) | | | $9,470 | | | | $12,220 | | | | $47,811 | | | | $61,734 | | | | $72,908 | | | | $60,753 | |
| 1 | Calculated based upon average shares outstanding. |
| 2 | Total return calculations do not include any sales charges. Returns for periods of less than one year are not annualized. |
The accompanying notes are an integral part of these financial statements.
Wells Fargo High Yield Bond Fund | 17
Financial highlights
(For a share outstanding throughout each period)
| | | | | | | | | | | | | | | | | | | | | | | | |
| | | Six months ended
February 29, 2020
(unaudited) | | | Year ended August 31 | |
| ADMINISTRATOR CLASS | | 2019 | | | 2018 | | | 2017 | | | 2016 | | | 2015 | |
Net asset value, beginning of period | | | $3.29 | | | | $3.29 | | | | $3.41 | | | | $3.31 | | | | $3.16 | | | | $3.36 | |
Net investment income | | | 0.07 | | | | 0.15 | 1 | | | 0.15 | | | | 0.15 | | | | 0.14 | 1 | | | 0.14 | |
Net realized and unrealized gains (losses) on investments | | | (0.01 | ) | | | 0.00 | | | | (0.12 | ) | | | 0.10 | | | | 0.15 | | | | (0.20 | ) |
| | | | | | | | | | | | | | | | | | | | | | | | |
Total from investment operations | | | 0.06 | | | | 0.15 | | | | 0.03 | | | | 0.25 | | | | 0.29 | | | | (0.06 | ) |
Distributions to shareholders from | | | | | | | | | | | | | | | | | | | | | | | | |
Net investment income | | | (0.07 | ) | | | (0.15 | ) | | | (0.14 | ) | | | (0.15 | ) | | | (0.14 | ) | | | (0.14 | ) |
Tax basis return of capital | | | 0.00 | | | | 0.00 | | | | (0.01 | ) | | | (0.00 | )2 | | | 0.00 | | | | 0.00 | |
| | | | | | | | | | | | | | | | | | | | | | | | |
Total distributions to shareholders | | | (0.07 | ) | | | (0.15 | ) | | | (0.15 | ) | | | (0.15 | ) | | | (0.14 | ) | | | (0.14 | ) |
Net asset value, end of period | | | $3.28 | | | | $3.29 | | | | $3.29 | | | | $3.41 | | | | $3.31 | | | | $3.16 | |
Total return3 | | | 1.74 | % | | | 4.60 | % | | | 0.82 | % | | | 7.74 | % | | | 9.48 | % | | | (1.86 | )% |
Ratios to average net assets (annualized) | | | | | | | | | | | | | | | | | | | | | | | | |
Gross expenses | | | 0.99 | % | | | 0.98 | % | | | 0.96 | % | | | 0.95 | % | | | 0.98 | % | | | 0.98 | % |
Net expenses | | | 0.80 | % | | | 0.80 | % | | | 0.80 | % | | | 0.80 | % | | | 0.80 | % | | | 0.80 | % |
Net investment income | | | 4.14 | % | | | 4.50 | % | | | 4.39 | % | | | 4.55 | % | | | 4.43 | % | | | 4.27 | % |
Supplemental data | | | | | | | | | | | | | | | | | | | | | | | | |
Portfolio turnover rate | | | 15 | % | | | 26 | % | | | 18 | % | | | 20 | % | | | 75 | % | | | 55 | % |
Net assets, end of period (000s omitted) | | | $24,665 | | | | $24,667 | | | | $23,940 | | | | $31,592 | | | | $76,688 | | | | $13,129 | |
| 1 | Calculated based upon average shares outstanding |
| 2 | Amount is less than $0.005. |
| 3 | Returns for periods of less than one year are not annualized. |
The accompanying notes are an integral part of these financial statements.
18 | Wells Fargo High Yield Bond Fund
Financial highlights
(For a share outstanding throughout each period)
| | | | | | | | | | | | | | | | | | | | | | | | |
| | | Six months ended
February 29, 2020
(unaudited) | | | Year ended August 31 | |
| INSTITUTIONAL CLASS | | 2019 | | | 2018 | | | 2017 | | | 2016 | | | 20151 | |
Net asset value, beginning of period | | | $3.29 | | | | $3.28 | | | | $3.41 | | | | $3.31 | | | | $3.17 | | | | $3.33 | |
Net investment income | | | 0.07 | | | | 0.15 | | | | 0.16 | | | | 0.16 | | | | 0.14 | | | | 0.12 | |
Net realized and unrealized gains (losses) on investments | | | (0.01 | ) | | | 0.01 | | | | (0.13 | ) | | | 0.10 | | | | 0.14 | | | | (0.16 | ) |
| | | | | | | | | | | | | | | | | | | | | | | | |
Total from investment operations | | | 0.06 | | | | 0.16 | | | | 0.03 | | | | 0.26 | | | | 0.28 | | | | (0.04 | ) |
Distributions to shareholders from | | | | | | | | | | | | | | | | | | | | | | | | |
Net investment income | | | (0.07 | ) | | | (0.15 | ) | | | (0.15 | ) | | | (0.16 | ) | | | (0.14 | ) | | | (0.12 | ) |
Tax basis return of capital | | | 0.00 | | | | 0.00 | | | | (0.01 | ) | | | (0.00 | )2 | | | 0.00 | | | | 0.00 | |
| | | | | | | | | | | | | | | | | | | | | | | | |
Total distributions to shareholders | | | (0.07 | ) | | | (0.15 | ) | | | (0.16 | ) | | | (0.16 | ) | | | (0.14 | ) | | | (0.12 | ) |
Net asset value, end of period | | | $3.28 | | | | $3.29 | | | | $3.28 | | | | $3.41 | | | | $3.31 | | | | $3.17 | |
Total return3 | | | 1.88 | % | | | 5.20 | % | | | 0.79 | % | | | 8.03 | % | | | 9.27 | % | | | (1.31 | )% |
Ratios to average net assets (annualized) | | | | | | | | | | | | | | | | | | | | | | | | |
Gross expenses | | | 0.72 | % | | | 0.71 | % | | | 0.69 | % | | | 0.68 | % | | | 0.70 | % | | | 0.71 | % |
Net expenses | | | 0.53 | % | | | 0.53 | % | | | 0.53 | % | | | 0.53 | % | | | 0.61 | % | | | 0.70 | % |
Net investment income | | | 4.43 | % | | | 4.75 | % | | | 4.67 | % | | | 4.79 | % | | | 4.65 | % | | | 4.33 | % |
Supplemental data | | | | | | | | | | | | | | | | | | | | | | | | |
Portfolio turnover rate | | | 15 | % | | | 26 | % | | | 18 | % | | | 20 | % | | | 75 | % | | | 55 | % |
Net assets, end of period (000s omitted) | | | $73,000 | | | | $75,877 | | | | $134,770 | | | | $125,991 | | | | $100,023 | | | | $4,847 | |
| 1 | For the period from October 31, 2014 (commencement of class operations) to August 31, 2015. |
| 2 | Amount is less than $0.005. |
| 3 | Returns for periods of less than one year are not annualized. |
The accompanying notes are an integral part of these financial statements.
Wells Fargo High Yield Bond Fund | 19
Notes to financial statements (unaudited)
1. ORGANIZATION
Wells Fargo Funds Trust (the “Trust”), a Delaware statutory trust organized on March 10, 1999, is anopen-end management investment company registered under the Investment Company Act of 1940, as amended (the “1940 Act”). As an investment company, the Trust follows the accounting and reporting guidance in Financial Accounting Standards Board (“FASB”)Accounting Standards Codification Topic 946, Financial Services – Investment Companies. These financial statements report on the Wells Fargo High Yield Bond Fund (the “Fund”) which is a diversified series of the Trust.
2. SIGNIFICANT ACCOUNTING POLICIES
The following significant accounting policies, which are consistently followed in the preparation of the financial statements of the Fund, are in conformity with U.S. generally accepted accounting principles which require management to make estimates and assumptions that affect the reported amounts of assets and liabilities, disclosure of contingent assets and liabilities at the date of the financial statements, and the reported amounts of revenues and expenses during the reporting period. Actual results could differ from those estimates.
Securities valuation
All investments are valued each business day as of the close of regular trading on the New York Stock Exchange (generally 4 p.m. Eastern Time), although the Fund may deviate from this calculation time under unusual or unexpected circumstances.
Debt securities are valued at the evaluated bid price provided by an independent pricing service (e.g. taking into account various factors, including yields, maturities, or credit ratings) or, if a reliable price is not available, the quoted bid price from an independent broker-dealer.
Equity securities that are listed on a foreign or domestic exchange or market are valued at the official closing price or, if none, the last sales price. If no sale occurs on the principal exchange or market that day, a fair value price will be determined in accordance with the Fund’s Valuation Procedures.
Investments in registeredopen-end investment companies are valued at net asset value. Interests innon-registered investment companies that are redeemable at net asset value are fair valued normally at net asset value.
Investments which are not valued using any of the methods discussed above are valued at their fair value, as determined in good faith by the Board of Trustees. The Board of Trustees has established a Valuation Committee comprised of the Trustees and has delegated to it the authority to take any actions regarding the valuation of portfolio securities that the Valuation Committee deems necessary or appropriate, including determining the fair value of portfolio securities, unless the determination has been delegated to the Wells Fargo Asset Management Pricing Committee at Wells Fargo Funds Management, LLC (“Funds Management”). The Board of Trustees retains the authority to make or ratify any valuation decisions or approve any changes to the Valuation Procedures as it deems appropriate. On a quarterly basis, the Board of Trustees receives reports on any valuation actions taken by the Valuation Committee or the Wells Fargo Asset Management Pricing Committee which may include items for ratification.
Securities lending
The Fund may lend its securities from time to time in order to earn additional income in the form of fees or interest on securities received as collateral or the investment of any cash received as collateral. When securities are on loan, the Fund receives interest or dividends on those securities. Cash collateral received in connection with its securities lending transactions is invested in Securities Lending Cash Investments, LLC (the “Securities Lending Fund”). Investments in Securities Lending Fund are valued at the evaluated bid price provided by an independent pricing service. Income earned from investment in the Securities Lending Fund (net of fees and rebates), if any, is included in income from affiliated securities on the Statement of Operations.
In a securities lending transaction, the net asset value of the Fund is affected by an increase or decrease in the value of the securities loaned and by an increase or decrease in the value of the instrument in which collateral is invested. The amount of securities lending activity undertaken by the Fund fluctuates from time to time. The Fund has the right under the lending agreement to recover the securities from the borrower on demand. In the event of default or bankruptcy by the borrower, the Fund may be prevented from recovering the loaned securities or gaining access to the collateral or may experience delays or costs in doing so. In such an event, the terms of the agreement allows the unaffiliated securities lending agent to use the collateral to purchase replacement securities on behalf of the Fund or pay the Fund the market value of the loaned securities. The Fund bears the risk of loss with respect to depreciation of its investment of the cash collateral.
20 | Wells Fargo High Yield Bond Fund
Notes to financial statements (unaudited)
Security transactions and income recognition
Securities transactions are recorded on a trade date basis. Realized gains or losses are recorded on the basis of identified cost.
Interest income is accrued daily and bond discounts are accreted and premiums are amortized daily. To the extent debt obligations are placed onnon-accrual status, any related interest income may be reduced by writing off interest receivables when the collection of all or a portion of interest has been determined to be doubtful based on consistently applied procedures and the fair value has decreased. If the issuer subsequently resumes interest payments or when the collectability of interest is reasonably assured, the debt obligation is removed fromnon-accrual status.
Dividend income is recognized on theex-dividend date.
Distributions to shareholders
Distributions to shareholders from net investment income are declared daily and paid monthly. Distributions from net realized gains, if any, are recorded on theex-dividend date and paid at least annually. Such distributions are determined in accordance with income tax regulations and may differ from U.S. generally accepted accounting principles. Dividend sources are estimated at the time of declaration. The tax character of distributions is determined as of the Fund’s fiscal year end. Therefore, a portion of the Fund’s distributions made prior to the Fund’s fiscal year end may be categorized as a tax return of capital at year end.
Federal and other taxes
The Fund intends to continue to qualify as a regulated investment company by distributing substantially all of its investment company taxable income and any net realized capital gains (after reduction for capital loss carryforwards) sufficient to relieve it from all, or substantially all, federal income taxes. Accordingly, no provision for federal income taxes was required.
The Fund’s income and federal excise tax returns and all financial records supporting those returns for the prior three fiscal years are subject to examination by the federal and Delaware revenue authorities. Management has analyzed the Fund’s tax positions taken on federal, state, and foreign tax returns for all open tax years and does not believe that there are any uncertain tax positions that require recognition of a tax liability.
As of February 29, 2020, the aggregate cost of all investments for federal income tax purposes was $373,588,297 and the unrealized gains (losses) consisted of:
| | | | |
| |
Gross unrealized gains | | $ | 14,093,666 | |
| |
Gross unrealized losses | | | (9,902,575 | ) |
| |
Net unrealized gains | | $ | 4,191,091 | |
As of August 31, 2019, the Fund had capital loss carryforwards which consist of $17,264,367 in short-term capital losses $25,479,759 in long-term capital losses.
Class allocations
The separate classes of shares offered by the Fund differ principally in applicable sales charges, distribution, shareholder servicing, and administration fees. Class specific expenses are charged directly to that share class. Investment income, common fund-level expenses, and realized and unrealized gains (losses) on investments are allocated daily to each class of shares based on the relative proportion of net assets of each class.
3. FAIR VALUATION MEASUREMENTS
Fair value measurements of investments are determined within a framework that has established a fair value hierarchy based upon the various data inputs utilized in determining the value of the Fund’s investments. The three-level hierarchy gives the highest priority to unadjusted quoted prices in active markets for identical assets or liabilities (Level 1) and the lowest priority to unobservable inputs (Level 3). The Fund’s investments are classified within the fair value hierarchy based on the lowest level of input that is significant to the fair value measurement. The inputs are summarized into three broad levels as follows:
| ∎ | | Level 1 – quoted prices in active markets for identical securities |
| ∎ | | Level 2 – other significant observable inputs (including quoted prices for similar securities, interest rates, prepayment speeds, credit risk, etc.) |
| ∎ | | Level 3 – significant unobservable inputs (including the Fund’s own assumptions in determining the fair value of investments) |
Wells Fargo High Yield Bond Fund | 21
Notes to financial statements (unaudited)
The inputs or methodologies used for valuing investments in securities are not necessarily an indication of the risk associated with investing in those securities.
The following is a summary of the inputs used in valuing the Fund’s assets and liabilities as of February 29, 2020:
| | | | | | | | | | | | | | | | |
| | | | |
| | | Quoted prices
(Level 1) | | | Other significant
observable inputs
(Level 2) | | | Significant
unobservable inputs (Level 3) | | | Total | |
| | | | |
Assets | | | | | | | | | | | | | | | | |
Investments in: | | | | | | | | | | | | | | | | |
| | | | |
Common stocks | | | | | | | | | | | | | | | | |
| | | | |
Consumer staples | | $ | 1,303,350 | | | $ | 0 | | | $ | 0 | | | $ | 1,303,350 | |
| | | | |
Health care | | | 3,426,000 | | | | 0 | | | | 0 | | | | 3,426,000 | |
| | | | |
Industrials | | | 3,534,840 | | | | 0 | | | | 0 | | | | 3,534,840 | |
| | | | |
Information technology | | | 12,557,195 | | | | 0 | | | | 0 | | | | 12,557,195 | |
| | | | |
Materials | | | 5,296,280 | | | | 0 | | | | 0 | | | | 5,296,280 | |
| | | | |
Real estate | | | 1,218,310 | | | | 0 | | | | 0 | | | | 1,218,310 | |
| | | | |
Utilities | | | 4,598,800 | | | | 0 | | | | 0 | | | | 4,598,800 | |
| | | | |
Corporate bonds and notes | | | 0 | | | | 290,415,965 | | | | 0 | | | | 290,415,965 | |
| | | | |
Yankee corporate bonds and notes | | | 0 | | | | 37,931,297 | | | | 0 | | | | 37,931,297 | |
| | | | |
Short-term investments | | | | | | | | | | | | | | | | |
| | | | |
Investment companies | | | 17,497,351 | | | | 0 | | | | 0 | | | | 17,497,351 | |
| | | | |
Total assets | | $ | 49,432,126 | | | $ | 328,347,262 | | | $ | 0 | | | $ | 377,779,388 | |
Additional sector, industry or geographic detail is included in the Portfolio of Investments.
For the six months ended February 29, 2020, the Fund did not have any transfers into/out of Level 3.
4. TRANSACTIONS WITH AFFILIATES
Management fee
Funds Management, an indirect wholly owned subsidiary of Wells Fargo & Company (“Wells Fargo”), is the manager of the Fund and provides advisory and fund-level administrative services under an investment management agreement. Under the investment management agreement, Funds Management is responsible for, among other services, implementing the investment objectives and strategies of the Fund, supervising the subadviser and providing fund-level administrative services in connection with the Fund’s operations. As compensation for its services under the investment management agreement, Funds Management is entitled to receive a management fee at the following annual rate based on the Fund’s average daily net assets:
| | |
| |
| Average daily net assets | | Management fee |
| |
First $500 million | | 0.550% |
| |
Next $500 million | | 0.525 |
| |
Next $2 billion | | 0.500 |
| |
Next $2 billion | | 0.475 |
| |
Next $5 billion | | 0.440 |
| |
Over $10 billion | | 0.430 |
For the six months ended February 29, 2020, the management fee was equivalent to an annual rate of 0.55% of the Fund’s average daily net assets.
Funds Management has retained the services of a subadviser to provide daily portfolio management to the Fund. The fee for subadvisory services is borne by Funds Management. Wells Capital Management Incorporated (“WellsCap”), an affiliate of Funds Management and an indirect wholly owned subsidiary of Wells Fargo, is the subadviser to the Fund and is entitled to receive a fee from Funds Management at an annual rate starting at 0.35% and declining to 0.20% as the average daily net assets of the Fund increase.
22 | Wells Fargo High Yield Bond Fund
Notes to financial statements (unaudited)
Administration fees
Under a class-level administration agreement, Funds Management provides class-level administrative services to the Fund, which includes paying fees and expenses for services provided by the transfer agent,sub-transfer agents, omnibus account servicers and record-keepers. As compensation for its services under the class-level administration agreement, Funds Management receives an annual fee which is calculated based on the average daily net assets of each class as follows:
| | |
| |
| | | Class-level
administration fee |
| |
Class A, Class C | | 0.16% |
| |
Administrator Class | | 0.10 |
| |
Institutional Class | | 0.08 |
Waivers and/or expense reimbursements
Funds Management has contractually waived and/or reimbursed management and administration fees to the extent necessary to maintain certain net operating expense ratios for the Fund. When each class of the Fund has exceeded its expense cap, Funds Management has waived fees and/or reimbursed expenses from fund-level expenses on a proportionate basis and then from class specific expenses. When only certain classes exceed their expense caps, waivers and/or reimbursements are applied against class specific expenses before fund-level expenses. Funds Management has committed through December 31, 2020 to waive fees and/or reimburse expenses to the extent necessary to cap the Fund’s expenses at 0.93% for Class A shares, 1.68% for Class C shares, 0.80% for Administrator Class shares and 0.53% for Institutional Class shares. Prior to or after the commitment expiration date, the cap may be increased or the commitment to maintain the cap may be terminated only with the approval of the Board of Trustees.
Distribution fee
The Trust has adopted a distribution plan for Class C shares of the Fund pursuant to Rule12b-1 under the 1940 Act. A distribution fee is charged to Class C shares and paid to Wells Fargo Funds Distributor, LLC (“Funds Distributor”), the principal underwriter, at an annual rate of 0.75% of the average daily net assets of Class C shares.
In addition, Funds Distributor is entitled to receive thefront-end sales charge from the purchase of Class A shares and a contingent deferred sales charge on the redemption of certain Class A shares. Funds Distributor is also entitled to receive the contingent deferred sales charges from redemptions of Class C shares. For the six months ended February 29, 2020, Funds Distributor received $650 from the sale of Class A shares. No contingent deferred sales charges were incurred by Class A and Class C shares for the six months ended February 29, 2020.
Shareholder servicing fees
The Trust has entered into contracts with one or more shareholder servicing agents, whereby Class A, Class C and Administrator Class of the Fund are charged a fee at an annual rate of 0.25% of the average daily net assets of each respective class. A portion of these total shareholder servicing fees were paid to affiliates of Wells Fargo.
Interfund transactions
The Fund may purchase or sell portfolio investment securities to certain other Wells Fargo affiliates pursuant to Rule17a-7 under the 1940 Act and under procedures adopted by the Board of Trustees. The procedures have been designed to ensure that these interfund transactions, which do not incur broker commissions, are effected at current market prices.
5. INVESTMENT PORTFOLIO TRANSACTIONS
Purchases and sales of investments, excluding U.S. government obligations (if any) and short-term securities, for the six months ended February 29, 2020 were $55,469,781 and $72,236,168, respectively.
6. SECURITIES LENDING TRANSACTIONS
The Fund lends its securities through an unaffiliated securities lending agent and receives collateral in the form of cash or securities with a value at least equal to the value of the securities on loan. The value of the loaned securities is determined at the close of each business day and any increases or decreases in the required collateral are exchanged between the Fund and the counterparty on the next business day. Cash collateral received is invested in the Securities Lending Fund which seeks to provide a positive return compared to the daily Fed Funds Open Rate by investing in high-quality, U.S. dollar-denominated
Wells Fargo High Yield Bond Fund | 23
Notes to financial statements (unaudited)
short-term money market instruments and is exempt from registration under Section 3(c)(7) of the 1940 Act. Securities Lending Fund is managed by Funds Management and is subadvised by WellsCap. Funds Management receives an advisory fee starting at 0.05% and declining to 0.01% as the average daily net assets of the Securities Lending Fund increase. All of the fees received by Funds Management are paid to WellsCap for its services as subadviser.
As of February 29, 2020, the Fund had securities lending transactions with the following counterparties which are subject to offset:
| | | | | | | | |
| | | |
| Counterparty | | Value of
securities on
loan | | Collateral
received1 | | Net amount | |
| | | |
Barclays Capital Inc. | | $5,981,399 | | $(5,981,399) | | $ | 0 | |
| | | |
BNP Paribas Securities Corp. | | 2,418,553 | | (2,418,553) | | | 0 | |
| | | |
Citigroup Global Markets Inc. | | 1,858,252 | | (1,858,252) | | | 0 | |
| | | |
JPMorgan Securities LLC | | 2,889,278 | | (2,889,278) | | | 0 | |
| | | |
Scotia Capital (USA) Inc. | | 135,625 | | (135,625) | | | 0 | |
| 1 | Collateral received within this table is limited to the collateral for the net transaction with the counterparty. |
7. BANK BORROWINGS
The Trust (excluding the money market funds), Wells Fargo Master Trust and Wells Fargo Variable Trust are parties to a $280,000,000 revolving credit agreement whereby the Fund is permitted to use bank borrowings for temporary or emergency purposes, such as to fund shareholder redemption requests. Interest under the credit agreement is charged to the Fund based on a borrowing rate equal to the higher of the Federal Funds rate in effect on that day plus 1.25% or the overnight LIBOR rate in effect on that day plus 1.25%. In addition, an annual commitment fee equal to 0.25% of the unused balance is allocated to each participating fund.
For the six months ended February 29, 2020, there were no borrowings by the Fund under the agreement.
8. INDEMNIFICATION
Under the Trust’s organizational documents, the officers and Trustees have been granted certain indemnification rights against certain liabilities that may arise out of performance of their duties to the Trust. Additionally, in the normal course of business, the Trust may enter into contracts with service providers that contain a variety of indemnification clauses. The Trust’s maximum exposure under these arrangements is dependent on future claims that may be made against the Fund and, therefore, cannot be estimated.
9. NEW ACCOUNTING PRONOUNCEMENTS
In August 2018, FASB issued Accounting Standards Update (“ASU”)No. 2018-13, Fair Value Measurement (Topic 820)Disclosure Framework – Changes to the Disclosure Requirements for Fair Value Measurement. ASU2018-13 updates the disclosure requirements for fair value measurements by modifying or removing certain disclosures and adding certain new disclosures. The amendments are effective for fiscal years, and interim periods within those fiscal years, beginning after December 15, 2019. Early adoption is permitted. Management has adopted the removal and modification of disclosures early, as permitted, and will adopt the additional new disclosures at the effective date.
In March 2017, FASB issued ASUNo. 2017-08,Premium Amortization on Purchased Callable Debt Securities. ASU2017-08 shortens the amortization period for certain callable debt securities held at a premium and requires the premium to be amortized to the earliest call date. The amendments do not require an accounting change for securities held at a discount and discounts will continue to be accreted to the maturity date of the security. ASU2017-08 is effective for fiscal years beginning after December 15, 2018 and for interim periods within those fiscal years. During the current reporting period, management of the Fund adopted the change in accounting policy which did not have a material impact to the Fund’s financial statements.
10. SUBSEQUENT EVENT
On March 11, 2020, the World Health Organization announced that it had made the assessment that coronavirus disease 2019(“COVID-19”) is a pandemic. The impacts ofCOVID-19 is adversely affecting the entire global economy, individual companies and investment products, and the market in general. There is significant uncertainty around the extent and duration of business disruptions related toCOVID-19 and the impact may be short term or may last for an extended period of time. The risk of further spreading ofCOVID-19 has led to significant uncertainty and volatility in the financial markets and the value of the Fund and the securities in which the Fund invests have generally been adversely affected by impacts caused byCOVID-19.
24 | Wells Fargo High Yield Bond Fund
Other information (unaudited)
PROXY VOTING INFORMATION
A description of the policies and procedures used to determine how to vote proxies relating to portfolio securities is available, upon request, by calling1-800-222-8222, visiting our website atwfam.com, or visiting the SEC website at sec.gov. Information regarding how the proxies related to portfolio securities were voted during the most recent12-month period ended June 30 is available on the website atwfam.comor by visiting the SEC website at sec.gov.
QUARTERLY PORTFOLIO HOLDINGS INFORMATION
The Fund files its complete schedule of portfolio holdings with the SEC for the first and third quarters of each fiscal year as an exhibit to its reports on FormN-PORT. Shareholders may view the filed FormN-PORT by visiting the SEC website at sec.gov.
Wells Fargo High Yield Bond Fund | 25
Other information (unaudited)
BOARD OF TRUSTEES AND OFFICERS
Each of the Trustees and Officers1 listed in the table below acts in identical capacities for each fund in the Wells Fargo family of funds, which consists of 146 mutual funds comprising the Wells Fargo Funds Trust, Wells Fargo Variable Trust, Wells Fargo Master Trust and fourclosed-end funds (collectively the “Fund Complex”). This table should be read in conjunction with the Prospectus and the Statement of Additional Information2. The mailing address of each Trustee and Officer is 525 Market Street, 12th Floor, San Francisco, CA 94105. Each Trustee and Officer serves an indefinite term, however, each Trustee serves such term until reaching the mandatory retirement age established by the Trustees.
Independent Trustees
| | | | | | |
Name and
year of birth | | Position held and
length of service* | | Principal occupations during past five years or longer | | Current other
public company or
investment
company
directorships |
| | | |
| William R. Ebsworth (Born 1957) | | Trustee,
since 2015 | | Retired. From 1984 to 2013, equities analyst, portfolio manager, research director and chief investment officer at Fidelity Management and Research Company in Boston, Tokyo, and Hong Kong, and retired in 2013 as Chief Investment Officer of Fidelity Strategic Advisers, Inc. where he led a team of investment professionals managing client assets. Prior thereto, Board member of Hong Kong Securities Clearing Co., Hong Kong Options Clearing Corp., the Thailand International Fund, Ltd., Fidelity Investments Life Insurance Company, and Empire Fidelity Investments Life Insurance Company. Audit Committee Chair and Investment Committee Chair of the Vincent Memorial Hospital Endowment(non-profit organization). Mr. Ebsworth is a CFA® charterholder. | | N/A |
| | | |
| Jane A. Freeman (Born 1953) | | Trustee,
since 2015;
Chair Liaison,
since 2018 | | Retired. From 2012 to 2014 and 1999 to 2008, Chief Financial Officer of Scientific Learning Corporation. From 2008 to 2012, Ms. Freeman provided consulting services related to strategic business projects. Prior to 1999, Portfolio Manager at Rockefeller & Co. and Scudder, Stevens & Clark. Board member of the Harding Loevner Funds from 1996 to 2014, serving as both Lead Independent Director and chair of the Audit Committee. Board member of the Russell Exchange Traded Funds Trust from 2011 to 2012 and the chair of the Audit Committee. Ms. Freeman is a Board Member of The Ruth Bancroft Garden(non-profit organization). She is also an inactive Chartered Financial Analyst. | | N/A |
| | | |
| Isaiah Harris, Jr. (Born 1952) | | Trustee,
since 2009;
Audit Committee Chairman,
since 2019 | | Retired. Chairman of the Board of CIGNA Corporation since 2009, and Director since 2005. From 2003 to 2011, Director of Deluxe Corporation. Prior thereto, President and CEO of BellSouth Advertising and Publishing Corp. from 2005 to 2007, President and CEO of BellSouth Enterprises from 2004 to 2005 and President of BellSouth Consumer Services from 2000 to 2003. Emeritus member of the Iowa State University Foundation Board of Governors. Emeritus Member of the Advisory Board of Iowa State University School of Business. Advisory Board Member, Palm Harbor Academy (private school). Advisory Board Member, Child Evangelism Fellowship(non-profit). Mr. Harris is a certified public accountant (inactive status). | | CIGNA Corporation |
| | | |
| Judith M. Johnson (Born 1949) | | Trustee,
since 2008;
Audit Committee Chairman, from 2009 to 2018 | | Retired. Prior thereto, Chief Executive Officer and Chief Investment Officer of Minneapolis Employees Retirement Fund from 1996 to 2008. Ms. Johnson is an attorney, certified public accountant and a certified managerial accountant. | | N/A |
26 | Wells Fargo High Yield Bond Fund
Other information (unaudited)
| | | | | | |
Name and
year of birth | | Position held and
length of service* | | Principal occupations during past five years or longer | | Current other
public company or
investment
company
directorships |
| | | |
| David F. Larcker (Born 1950) | | Trustee, since 2009 | | James Irvin Miller Professor of Accounting at the Graduate School of Business, Stanford University, Director of the Corporate Governance Research Initiative and Senior Faculty of The Rock Center for Corporate Governance since 2006. From 2005 to 2008, Professor of Accounting at the Graduate School of Business, Stanford University. Prior thereto, Ernst & Young Professor of Accounting at The Wharton School, University of Pennsylvania from 1985 to 2005. | | N/A |
| | | |
| Olivia S. Mitchell (Born 1953) | | Trustee,
since 2006; Nominating and Governance Committee Chair, since 2018 | | International Foundation of Employee Benefit Plans Professor, Wharton School of the University of Pennsylvania since 1993. Director of Wharton’s Pension Research Council and Boettner Center on Pensions & Retirement Research, and Research Associate at the National Bureau of Economic Research. Previously, Cornell University Professor from 1978 to 1993. | | N/A |
| | | |
| Timothy J. Penny (Born 1951) | | Trustee,
since 1996; Chairman,
since 2018 | | President and Chief Executive Officer of Southern Minnesota Initiative Foundation, anon-profit organization, since 2007. Member of the Board of Trustees of NorthStar Education Finance, Inc., anon-profit organization, since 2007. | | N/A |
| | | |
| James G. Polisson (Born 1959) | | Trustee,
since 2018 | | Retired. Chief Marketing Officer, Source (ETF) UK Services, Ltd, from 2015 to 2017. From 2012 to 2015, Principal of The Polisson Group, LLC, a management consulting, corporate advisory and principal investing company. Chief Executive Officer and Managing Director at Russell Investments, Global Exchange Traded Funds from 2010 to 2012. Managing Director of Barclays Global Investors from 1998 to 2010 and Global Chief Marketing Officer for iShares and Barclays Global Investors from 2000 to 2010. Trustee of the San Francisco Mechanics’ Institute, anon-profit organization, from 2013 to 2015. Board member of the Russell Exchange Traded Fund Trust from 2011 to 2012. Director of Barclays Global Investors Holdings Deutschland GmbH from 2006 to 2009. Mr. Polisson is an attorney and has a retired status with the Massachusetts and District of Columbia Bar Associations. | | N/A |
| | | |
| Pamela Wheelock3 (Born 1959) | | Trustee, since January 2020; previously Trustee from January 2018 to July 2019 | | Board member of the Destination Medical Center Economic Development Agency, Rochester, Minnesota since 2019. Acting Commissioner, Minnesota Department of Human Services, July 2019 through September 2019. Human Services Manager (part-time), Minnesota Department of Human Services, October 2019 through December 2019. Chief Operating Officer, Twin Cities Habitat for Humanity from 2017 to 2019. Vice President of University Services, University of Minnesota from 2012 to 2016. Prior thereto, on the Board of Directors, Governance Committee and Finance Committee for the Minnesota Philanthropy Partners (Saint Paul Foundation) from 2012 to 2018, Interim Chief Executive Officer of Blue Cross Blue Shield of Minnesota from 2011 to 2012, Chairman of the Board from 2009 to 2012 and Board Director from 2003 to 2015. Vice President, Leadership and Community Engagement, Bush Foundation, Saint Paul, Minnesota (a private foundation) from 2009 to 2011. Executive Vice President and Chief Financial Officer, Minnesota Sports and Entertainment from 2004 to 2009 and Senior Vice President from 2002 to 2004. Executive Vice President of the Minnesota Wild Foundation from 2004 to 2008. Commissioner of Finance, State of Minnesota, from 1999 to 2002. Currently Board Chair of the Minnesota Wild Foundation since 2010. | | N/A |
| * | Length of service dates reflect the Trustee’s commencement of service with the Trust’s predecessor entities, where applicable. |
Wells Fargo High Yield Bond Fund | 27
Other information (unaudited)
Officers
| | | | |
Name and
year of birth | | Position held and
length of service | | Principal occupations during past five years or longer |
| | |
| Andrew Owen (Born 1960) | | President, since 2017 | | Executive Vice President of Wells Fargo & Company and Head of Affiliated Managers, Wells Fargo Asset Management, since 2014. In addition, Mr. Owen is currently President, Chief Executive Officer and Director of Wells Fargo Funds Management, LLC since 2017. Prior thereto, Executive Vice President responsible for marketing, investments and product development for Wells Fargo Funds Management, LLC, from 2009 to 2014. |
| | |
| Nancy Wiser1 (Born 1967) | | Treasurer, since 2012 | | Executive Vice President of Wells Fargo Funds Management, LLC since 2011. Chief Operating Officer and Chief Compliance Officer at LightBox Capital Management LLC, from 2008 to 2011. |
| | |
| Michelle Rhee (Born 1966) | | Chief Legal Officer, since 2019 | | Secretary of Wells Fargo Funds Management, LLC, Chief Legal Counsel of Wells Fargo Asset Management and Assistant General Counsel of Wells Fargo Bank, N.A. since 2018. Associate General Counsel and Managing Director of Bank of America Corporation from 2004 to 2018. |
| | |
| Catherine Kennedy (Born 1969) | | Secretary, since 2019 | | Vice President of Wells Fargo Funds Management, LLC and Senior Counsel of the Wells Fargo Legal Department since 2010. Vice President and Senior Counsel of Evergreen Investment Management Company, LLC from 1998 to 2010. |
| | |
| Michael H. Whitaker(Born 1967) | | Chief Compliance Officer, since 2016 | | Chief Compliance Officer of Wells Fargo Asset Management since 2016. Senior Vice President and Chief Compliance Officer for Fidelity Investments from 2007 to 2016. |
| | |
| David Berardi (Born 1975) | | Assistant Treasurer, since 2009 | | Vice President of Wells Fargo Funds Management, LLC since 2009. Vice President of Evergreen Investment Management Company, LLC from 2008 to 2010. Manager of Fund Reporting and Control for Evergreen Investment Management Company, LLC from 2004 to 2010. |
| | |
| Jeremy DePalma1 (Born 1974) | | Assistant Treasurer, since 2009 | | Senior Vice President of Wells Fargo Funds Management, LLC since 2009. Senior Vice President of Evergreen Investment Management Company, LLC from 2008 to 2010 and head of the Fund Reporting and Control Team within Fund Administration from 2005 to 2010. |
| 1 | Nancy Wiser acts as Treasurer of 64 funds in the Fund Complex. Jeremy DePalma acts as Treasurer of 82 funds and Assistant Treasurer of 64 funds in the Fund Complex. |
| 2 | The Statement of Additional Information includes additional information about the Trustees and is available, without charge, upon request, by calling1-800-222-8222 or by visiting the website atwfam.com. |
| 3 | Pamela Wheelock wasre-appointed to the Board effective January 1, 2020. |
28 | Wells Fargo High Yield Bond Fund
Appendix I (unaudited)
Effective on or about May 1, 2020, if you purchase Fund shares through a Janney Montgomery Scott LLC (“Janney”) brokerage account, you will be eligible for the following load waivers(front-end sales charge waivers and contingent deferred sales charge (“CDSC”), orback-end sales charge, waivers) and discounts, which may differ from those disclosed elsewhere in the Fund’s Prospectus or SAI.
|
|
| Front-end sales charge* waivers on Class A shares available at Janney |
|
| Shares purchased through reinvestment of capital gains distributions and dividend reinvestment when purchasing shares of the same fund (but not any other fund within the fund family). |
|
| Shares purchased by employees and registered representatives of Janney or its affiliates and their family members as designated by Janney. |
|
Shares purchased from the proceeds of redemptions within the same fund family, provided (1) the repurchase occurs within ninety (90) days following the redemption, (2) the redemption and purchase occur in the same account, and (3) redeemed shares were subject to afront-end or deferred sales load (i.e., right of reinstatement). |
|
Employer-sponsored retirement plans (e.g., 401(k) plans, 457 plans, employer-sponsored 403(b) plans, profit sharing and money purchase pension plans and defined benefit plans). For purposes of this provision, employer-sponsored retirement plans do not include SEP IRAs, Simple IRAs, SAR-SEPs or Keogh plans. |
|
| Shares acquired through a right of reinstatement. |
|
| Class C shares that are no longer subject to a contingent deferred sales charge and are converted to Class A shares of the same fund pursuant to Janney’s policies and procedures. |
|
| CDSC waivers on Class A and Class C shares available at Janney |
|
| Shares sold upon the death or disability of the shareholder. |
|
| Shares sold as part of a systematic withdrawal plan as described in the Fund’s Prospectus. |
|
| Shares purchased in connection with a return of excess contributions from an IRA account. |
|
| Shares sold as part of a required minimum distribution for IRA and retirement accounts if the redemption is taken in or after the year the shareholder reaches qualified age based on applicable IRS regulations. |
|
| Shares sold to pay Janney fees but only if the transaction is initiated by Janney. |
|
| Shares acquired through a right of reinstatement. |
|
| Shares exchanged into the same share class of a different fund. |
|
| Front-end sales charge* discounts available at Janney; breakpoints, rights of accumulation and/or letters of intent |
|
| Breakpoints as described in the Fund’s Prospectus. |
|
| Rights of accumulation (“ROA”), which entitle shareholders to breakpoint discounts, will be automatically calculated based on the aggregated holding of fund family assets held by accounts within the purchaser’s household at Janney. Eligible fund family assets not held at Janney may be included in the ROA calculation only if the shareholder notifies his or her financial advisor about such assets. |
|
Letters of intent which allow for breakpoint discounts based on anticipated purchases within a fund family, over a13-month time period. Eligible fund family assets not held at Janney Montgomery Scott may be included in the calculation of letters of intent only if the shareholder notifies his or her financial advisor about such assets. |
| * | Also referred to as an “initial sales charge.” |
Wells Fargo High Yield Bond Fund | 29
Appendix II (unaudited)
Effective on or after May 1, 2020, clients of Edward Jones (also referred to as “shareholders”) purchasing Fund shares on the Edward Jones commission andfee-based platforms are eligible only for the following sales charge discounts (also referred to as “breakpoints”) and waivers, which can differ from breakpoints and waivers described elsewhere in this Prospectus or SAI or through another broker-dealer. In all instances, it is the shareholder’s responsibility to inform Edward Jones at the time of purchase of any relationship, holdings of Wells Fargo Funds or other facts qualifying the purchaser for breakpoints or waivers. Edward Jones can ask for documentation of such circumstance.
|
| Breakpoints available at Edward Jones |
|
| Rights of Accumulation (ROA) |
|
The applicable sales charge on a purchase of Class A shares is determined by taking into account all share classes (except any money market funds and retirement plan share classes) of Wells Fargo Funds held by the shareholder or in an account grouped by Edward Jones with other accounts for the purpose of providing certain pricing considerations (“pricing groups”). This includes all share classes held on the Edward Jones platform and/or held on another platform. The inclusion of eligible fund family assets in the rights of accumulation calculation is dependent on the shareholder notifying his or her financial advisor of such assets at the time of calculation. |
|
ROA is determined by calculating the higher of cost or market value (current shares x NAV). |
|
| Letter of Intent (LOI) |
|
Through a LOI, shareholders can receive the sales charge and breakpoint discounts for purchases shareholders intend to makeover a13-month period from the date Edward Jones receives the LOI. The LOI is determined by calculating the higher of cost or market value of qualifying holdings at LOI initiation in combination with the value that the shareholder intends to buy over a13-month period to calculate thefront-end sales charge and any breakpoint discounts. Each purchase the shareholder makes during that13-month period will receive the sales charge and breakpoint discount that applies to the total amount. The inclusion of eligible fund family assets in the LOI calculation is dependent on the shareholder notifying his or her financial advisor of such assets at the time of calculation. Purchases made before the LOI is received by Edward Jones are not covered under the LOI and will not reduce the sales charge previously paid. Sales charges will be adjusted if LOI is not met. |
| Sales charges are waived for the following shareholders and in the following situations at Edward Jones: |
● Associates of Edward Jones and its affiliates and their family members who are in the same pricing group (as determined by Edward Jones under its policies and procedures) as the associate. This waiver will continue for the remainder of the associate’s life if the associate retires from Edward Jones in good-standing. |
● Shares purchased in an Edward Jonesfee-based program. |
● Shares purchased through reinvestment of capital gains distributions and dividend reinvestment. |
● Shares purchased from the proceeds of redeemed shares of the same fund family so long as the following conditions are met: 1) the proceeds are from the sale of shares within 60 days of the purchase, and 2) the sale and purchase are made in the same share class and the same account or the purchase is made in an individual retirement account with proceeds from liquidations in anon-retirement account. |
● Shares exchanged into Class A shares from another share class so long as the exchange is into the same fund and was initiated at the discretion of Edward Jones. Edward Jones is responsible for any remaining CDSC due to the fund company, if applicable. Any future purchases are subject to the applicable sales charge as disclosed in the prospectus. |
● Exchanges from Class C shares to Class A shares of the same fund, generally, in the 84th month following the anniversary of the purchase date or earlier at the discretion of Edward Jones. |
If the shareholder purchases shares that are subject to a CDSC and those shares are redeemed before the CDSC is expired, the shareholder is
responsible to pay the CDSC except in the following conditions available at Edward Jones: |
● The death or disability of the shareholder. |
● Systematic withdrawals with up to 10% per year of the account value. |
● Return of excess contributions from an Individual Retirement Account (IRA). |
● Shares sold as part of a required minimum distribution for IRA and retirement accounts if the redemption is taken in or after the year the shareholder reaches qualified age based on applicable IRS regulation. |
● Shares sold to pay Edward Jones fees or costs in such cases where the transaction is initiated by Edward Jones. |
● Shares exchanged in an Edward Jonesfee-based program. |
● Shares acquired through NAV reinstatement. |
30 | Wells Fargo High Yield Bond Fund
Appendix II (unaudited)
|
| Other Important Information for accounts at Edward Jones: |
Minimum Purchase Amounts ● $250 initial purchase minimum ● $50 subsequent purchase minimum |
Minimum Balances Edward Jones has the right to redeem at its discretion fund holdings with a balance of $250 or less. The following are examples of accounts that are not included in this policy: ● Afee-based account held on an Edward Jones platform ● A 529 account held on an Edward Jones platform ● An account with an active systematic investment plan or letter of intent (LOI) |
Changing Share Classes At any time it deems necessary, Edward Jones has the authority to exchange at NAV a shareholder’s holdings in a fund to Class A shares. |
Wells Fargo High Yield Bond Fund | 31
This page is intentionally left blank.

For more information
More information about Wells Fargo Funds is available free upon request. To obtain literature, please write, visit the Fund’s website, or call:
Wells Fargo Funds
P.O. Box 219967
Kansas City, MO 64121-9967
Website:wfam.com
Individual investors:1-800-222-8222
Retail investment professionals:1-888-877-9275
Institutional investment professionals:1-866-765-0778

This report and the financial statements contained herein are submitted for the general information of the shareholders of the Fund. If this report is used for promotional purposes, distribution of the report must be accompanied or preceded by a current prospectus. Before investing, please consider the investment objectives, risks, charges, and expenses of the investment. For a current prospectus and, if available, a summary prospectus, containing this information, call1-800-222-8222 or visit the Fund’s website atwfam.com. Read the prospectus carefully before you invest or send money.
Wells Fargo Asset Management (WFAM) is the trade name for certain investment advisory/management firms owned by Wells Fargo & Company. These firms include but are not limited to Wells Capital Management Incorporated and Wells Fargo Funds Management, LLC. Certain products managed by WFAM entities are distributed by Wells Fargo Funds Distributor, LLC (a broker-dealer and Member FINRA).
This material is for general informational and educational purposes only and is NOT intended to provide investment advice or a recommendation of any kind—including a recommendation for any specific investment, strategy, or plan.
INVESTMENT PRODUCTS: NOT FDIC INSURED ◾ NO BANK GUARANTEE ◾ MAY LOSE VALUE
© 2020 Wells Fargo & Company. All rights reserved.
PAR-0320-04742 04-20
SA218/SAR218 02-20
Semi-Annual Report
February 29, 2020
Wells Fargo
Conservative Income Fund
Beginning on January 1, 2021, as permitted by new regulations adopted by the Securities and Exchange Commission, paper copies of the Wells Fargo Funds’ annual and semi-annual shareholder reports issued after this date will no longer be sent by mail, unless you specifically request paper copies of the reports. Instead, the reports will be made available on the Funds’ website, and you will be notified by mail each time a report is posted and provided with a website address to access the report.
If you already elected to receive shareholder reports electronically, you will not be affected by this change and you need not take any action. You may elect to receive shareholder reports and other communications from the Fund electronically at any time by contacting your financial intermediary (such as a broker-dealer or bank) or, if you are a direct investor, by calling1-800-222-8222 or by enrolling at wellsfargo.com/advantagedelivery.
You may elect to receive all future reports in paper free of charge. If you invest through a financial intermediary, you can contact your financial intermediary to request that you continue to receive paper copies of your shareholder reports; if you invest directly with the Fund, you can call 1-800-222-8222. Your election to receive reports in paper will apply to all Wells Fargo Funds held in your account with your financial intermediary or, if you are a direct investor, to all Wells Fargo Funds that you hold.
|
|
|
Reduce clutter. Save trees. |
Sign up for electronic delivery
of prospectuses
and shareholder
reports at
wellsfargo.com/
advantagedelivery |
The views expressed and any forward-looking statements are as of February 29, 2020, unless otherwise noted, and are those of the Fund managers and/or Wells Fargo Asset Management. Discussions of individual securities, or the markets generally, or any Wells Fargo Fund are not intended as individual recommendations. Future events or results may vary significantly from those expressed in any forward-looking statements. The views expressed are subject to change at any time in response to changing circumstances in the market. Wells Fargo Asset Management and the Fund disclaim any obligation to publicly update or revise any views expressed or forward-looking statements.
INVESTMENT PRODUCTS: NOT FDIC INSURED ◾ NO BANK GUARANTEE ◾ MAY LOSE VALUE
Wells Fargo Conservative Income Fund | 1
Letter to shareholders (unaudited)

Andrew Owen
President
Wells Fargo Funds
“The fourth quarter started on a strong note, with U.S.-China trade tensions relaxing in October along with renewed optimism for a U.K. Brexit deal and positive macroeconomic data.”
Dear Shareholder:
We are pleased to offer you this semi-annual report for the Wells Fargo Conservative Income Fund for thesix-month period that ended February 29, 2020. As market volatility increased, returns for the period were more restrained after strong results in previous recent periods. However, supportive central banks addressed concerns over slowing global economic growth and international trade tensions.
Fixed-income and equity investors had mixed semi-annual returns. For the period, U.S. stocks, based on the S&P 500 Index,1 gained 1.92% and international stocks, as measured by the MSCI ACWI ex USA Index (Net),2 returned 0.13%. The MSCI EM Index (Net)3 gained 2.93%. For bond investors, the Bloomberg Barclays U.S. Aggregate Bond Index4 added 3.39%, the Bloomberg Barclays Global Aggregateex-USD Index5 returned-0.21%, the Bloomberg Barclays Municipal Bond Index6 gained 3.04%, and the ICE BofA U.S. High Yield Index7 added 1.34%.
The period began with uncertainty, leading to central bank support.
In September, as the period began, the U.S. Federal Reserve (Fed) cut interest rates a second time in the third quarter. U.S. manufacturing data disappointed investors. The U.S. Congress announced it would pursue an impeachment investigation of President Trump. Meanwhile, the Brexit impasse showed no signs of resolution. Officials in China warned it would be difficult to reach the country’s annual economic growth goals considering the weight of tariffs and trade restrictions. Although the S&P 500 Index finished the third quarter with the bestyear-to-date returns in more than 20 years, concerns about future returns remained.
The fourth quarter started on a strong note, with U.S.-China trade tensions relaxing in October along with renewed optimism for a U.K. Brexit deal and positive macroeconomic data. The initial estimate of U.S. third-quarter gross domestic product growth was a resilient 1.9% annualized rate, while the U.S. unemployment rate fell to a50-year low of 3.5% in September. However, despite resilience among U.S. consumers, business confidence declined while manufacturing activity contracted. Concerned with a potential economic slowdown, the Fed lowered interest rates another quarter point in late October—its third rate cut in four months. This helped push the S&P 500 Index to anall-time high, while emerging market equities rallied and global bonds declined overall, reflecting a broad pickup in risk appetite.
| 1 | The S&P 500 Index consists of 500 stocks chosen for market size, liquidity, and industry group representation. It is a market-value-weighted index with each stock’s weight in the index proportionate to its market value. You cannot invest directly in an index. |
| 2 | The Morgan Stanley Capital International (MSCI) All Country World Index (ACWI) ex USA Index (Net) is a free-float-adjusted market-capitalization-weighted index that is designed to measure the equity market performance of developed markets, excluding the United States. Source: MSCI. MSCI makes no express or implied warranties or representations and shall have no liability whatsoever with respect to any MSCI data contained herein. The MSCI data may not be further redistributed or used as a basis for other indices or any securities or financial products. This report is not approved, reviewed, or produced by MSCI. You cannot invest directly in an index. |
| 3 | The MSCI Emerging Markets (EM) Index (Net) is a free-float-adjusted market-capitalization-weighted index that is designed to measure equity market performance of emerging markets. You cannot invest directly in an index. |
| 4 | The Bloomberg Barclays U.S. Aggregate Bond Index is a broad-based benchmark that measures the investment-grade, U.S. dollar-denominated, fixed-rate taxable bond market, including Treasuries, government-related and corporate securities, mortgage-backed securities (agency fixed-rate and hybrid adjustable-rate mortgage pass-throughs), asset-backed securities, and commercial mortgage-backed securities. You cannot invest directly in an index. |
| 5 | The Bloomberg Barclays Global Aggregateex-USD Index is an unmanaged index that provides a broad-based measure of the global investment-grade fixed-income markets excluding the U.S. dollar-denominated debt market. You cannot invest directly in an index. |
| 6 | The Bloomberg Barclays Municipal Bond Index is an unmanaged index composed of long-termtax-exempt bonds with a minimum credit rating of Baa. You cannot invest directly in an index. |
| 7 | The ICE BofA U.S. High Yield Index is a market-capitalization-weighted index of domestic and Yankee high-yield bonds. The index tracks the performance of high-yield securities traded in the U.S. bond market. You cannot invest directly in an index. Copyright 2020. ICE Data Indices, LLC. All rights reserved. |
2 | Wells Fargo Conservative Income Fund
Letter to shareholders (unaudited)
Equity markets continued to rally in November despite ongoing geopolitical risks. Hopes for a U.S.-China trade deal buoyed investor confidence. U.S. business sentiment improved slightly, and manufacturing and services activity picked up. With that positive backdrop, developed market equities outpaced those in emerging markets, and U.S. stocks, as reflected by the S&P 500 Index, outperformednon-U.S. stocks overall. While consumer confidence and purchasing manager activity rose in the eurozone, China reported weakening manufacturing and consumer data. Bond yields rose marginally, leading to slightly negative returns for global government and investment-grade corporate bonds.
Financial markets ended 2019 with a boost from the U.S. and China accord on a Phase One trade deal. That, along with the landslide win by the pro-Brexit U.K. Conservative Party in a national election and ongoing central bank support, gave investors greater confidence. U.S. economic indicators were generally positive, with the exception of manufacturing activity and business confidence. Consumer confidence was resilient, fed by a robust labor market, tame inflation, and lower interest rates, which boosted housing affordability and stimulated homebuyer activity. The impeachment of U.S. President Donald Trump had little impact on markets. Meanwhile, slowing Chinese economic activity, partly attributable to the trade war, led to further government stimulus atyear-end through lower reserve ratios, allowing banks to lend more money.
Theyear-end rally continued in early January 2020. However, capital market volatility picked up sharply in late January on concerns over the unknown impact of the novel coronavirus(COVID-19) on the global economy and stock markets. With sentiment somewhat souring, perceived safe havens did well in January. The U.S. dollar and Japanese yen both rose and government bonds outperformed equities. While the S&P 500 Index held its ground, emerging market equities tumbled, including those in Asia that are most exposed to viruses—physical or economic—originating in China.
In February, the coronavirus became the major market focus. Fears of the virus’s impact on global growth led to expectations of increased global central bank monetary policy support. That led the10-year Treasury yield to fall to anall-time low of 1.1% by the end of the month. Although equity markets initially shrugged off concerns about the outbreak, focusing instead on strong fourth-quarter earnings and improving business confidence in January, market sentiment turned sharply lower towardmonth-end and the S&P 500 Index lost 8.2% for the month. Oil prices tumbled as Russia and the Organization of the Petroleum Exporting Countries compounded a major decline in oil demand with a brutal price war, partly aimed at dissuading further U.S. shale production. As a result, the price of West Texas Intermediate crude oil fell 13% in February and 27% for 2020 year to date.
Don’t let short-term uncertainty derail long-term investment goals.
Periods of investment uncertainty can present challenges, but experience has taught us that maintaining long-term investment goals can be an effective way to plan for the future. Although diversification cannot guarantee an investment profit or prevent losses, we believe it can be an effective way to manage investment risk and potentially smooth out overall portfolio performance. We encourage investors to know their investments and to understand that appropriate levels of risk-taking may unlock opportunities.
Thank you for choosing to invest with Wells Fargo Funds. We appreciate your confidence in us and remain committed to helping you meet your financial needs.
Sincerely,

Andrew Owen
President
Wells Fargo Funds
“Capital market volatility picked up sharply in late January on concerns over the unknown impact of the novel coronavirus(COVID-19) on the global economy and stock markets.”
|
|
|
For further information about your Fund, contact your investment professional, visit our website at wfam.com, or call us directly at1-800-222-8222. |
Wells Fargo Conservative Income Fund | 3
Performance highlights (unaudited)
Investment objective
The Fund seeks current income consistent with capital preservation.
Manager
Wells Fargo Funds Management, LLC
Subadviser
Wells Capital Management Incorporated
Portfolio managers
Andrew M. Greenberg, CFA®‡
Anthony J. Melville, CFA®‡
Jeffrey L. Weaver, CFA®‡
Average annual total returns (%) as of February 29, 2020
| | | | | | | | | | | | | | | | | | | | | | |
| | | |
| | | | | | | | Expense ratios1 (%) | |
| | | | | | |
| | | Inception date | | 1 year | | | 5 year | | | Since
inception | | | Gross | | | Net2 | |
| | | | | | | |
| Institutional Class (WCIIX) | | 5-31-2013 | | | 2.82 | | | | 1.57 | | | | 1.28 | | | | 0.37 | | | | 0.27 | |
| | | | | | | |
| Bloomberg Barclays6-9 Month Treasury Bill Index3 | | – | | | 2.63 | | | | 1.23 | | | | 0.94 | * | | | – | | | | – | |
| * | Based on the inception date of the Institutional Class. |
Figures quoted represent past performance, which is no guarantee of future results, and do not reflect taxes that a shareholder may pay on an investment in a fund. Investment return and principal value of an investment will fluctuate so that an investor’s shares, when redeemed, may be worth more or less than their original cost. Current performance may be lower or higher than the performance data quoted, which assumes the reinvestment of dividends and capital gains. Currentmonth-end performance is available on the Fund’s website,wfam.com.
Index returns do not include transaction costs associated with buying and selling securities, any mutual fund fees or expenses, or any taxes. It is not possible to invest directly in an index.
Institutional Class shares are sold without afront-end sales charge or contingent deferred sales charge.
Bond values fluctuate in response to the financial condition of individual issuers, general market and economic conditions, and changes in interest rates. Changes in market conditions and government policies may lead to periods of heightened volatility in the bond market and reduced liquidity for certain bonds held by the Fund. In general, when interest rates rise, bond values fall and investors may lose principal value. Interest rate changes and their impact on the Fund and its share price can be sudden and unpredictable. The use of derivatives may reduce returns and/or increase volatility. Certain investment strategies tend to increase the total risk of an investment (relative to the broader market). The Fund is exposed to foreign investment risk, mortgage- and asset-backed securities risk, and municipal securities risk. Consult the Fund’s prospectus for additional information on these and other risks.
Please see footnotes on page 5.
4 | Wells Fargo Conservative Income Fund
Performance highlights (unaudited)
| | | | |
|
| Ten largest holdings (%) as of February 29, 20204 | |
| | |
Hyundai Auto Lease Securitization Trust Series 2019-B Class A3, 2.04%, 8-15-2022 | | | 1.60 | |
| | |
Bank of America Credit Card Trust Series 2017-A1 Class A1, 1.95%, 8-15-2022 | | | 1.27 | |
| | |
Toronto-Dominion Bank, 2.06%, 1-27-2023 | | | 1.27 | |
| | |
Toyota Auto Receivables Owner Trust Series 2020-A Class A2, 1.67%, 11-15-2022 | | | 1.24 | |
| | |
FHLMC Multi Family Structured Pass-Through Securities Series K-715 Class A2, 2.86%, 1-25-2021 | | | 1.20 | |
| | |
World Omni Auto Lease Trust Series 2018-A Class A3, 2.50%, 4-17-2023 | | | 1.12 | |
| | |
USAA Capital Corporation, 2.85%, 6-28-2021 | | | 1.12 | |
| | |
Buckeye Ohio Tobacco Settlement Financing Authority, 1.58%, 6-1-2021 | | | 1.07 | |
| | |
Societe Generale SA, 3.20%, 4-8-2021 | | | 1.07 | |
| | |
WEA Finance LLC, 3.25% 10-5-2020 | | | 1.07 | |
|
|
| Portfolio composition as of February 29, 20205 |
|
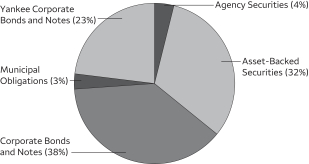 |
| ‡ | CFA® and Chartered Financial Analyst® are trademarks owned by CFA Institute. |
| 1 | Reflects the expense ratios as stated in the most recent prospectus. The expense ratios shown are subject to change and may differ from the annualized expense ratio shown in the financial highlights of this report. |
| 2 | The manager has contractually committed through December 31, 2020, to waive fees and/or reimburse expenses to the extent necessary to cap total annual fund operating expenses after fee waivers at 0.27% for Institutional Class. Brokerage commissions, stamp duty fees, interest, taxes, acquired fund fees and expenses (if any), and extraordinary expenses are excluded from the expense cap. Prior to or after the commitment expiration date, the cap may be increased or the commitment to maintain the cap may be terminated only with the approval of the Board of Trustees. Without this cap, the Fund’s returns would have been lower. The expense ratio paid by an investor is the net expense ratio (the total annual fund operating expenses after fee waivers) as stated in the prospectus. |
| 3 | The Bloomberg Barclays 6-9 Month Treasury Bill Index includes all publicly issued zero-coupon U.S. Treasury bills that have a remaining maturity of less than nine months and more than six, are rated investment-grade, and have $250 million or more of outstanding face value. You cannot invest directly in an index. |
| 4 | The ten largest holdings, excluding cash, cash equivalents and any money market, are calculated based on the value of the investments divided by total net assets of the Fund. Holdings are subject to change and may have changed since the date specified. |
| 5 | Amounts are calculated based on the total long-term investments of the Fund. These amounts are subject to change and may have changed since the date specified. |
Wells Fargo Conservative Income Fund | 5
Fund expenses (unaudited)
As a shareholder of the Fund, you incur ongoing costs, including management fees and other Fund expenses. This example is intended to help you understand your ongoing costs (in dollars) of investing in the Fund and to compare these costs with the ongoing costs of investing in other mutual funds.
The example is based on an investment of $1,000 invested at the beginning of thesix-month period and held for the entire period from September 1, 2019 to February 29, 2020.
Actual expenses
The “Actual” line of the table below provides information about actual account values and actual expenses. You may use the information in this line, together with the amount you invested, to estimate the expenses that you paid over the period. Simply divide your account value by $1,000 (for example, an $8,600 account value divided by $1,000 = 8.6), then multiply the result by the number in the “Actual” line under the heading entitled “Expenses paid during period” for your applicable class of shares to estimate the expenses you paid on your account during this period.
Hypothetical example for comparison purposes
The “Hypothetical” line of the table below provides information about hypothetical account values and hypothetical expenses based on the Fund’s actual expense ratio and an assumed rate of return of 5% per year before expenses, which is not the Fund’s actual return. The hypothetical account values and expenses may not be used to estimate the actual ending account balance or expenses you paid for the period. You may use this information to compare the ongoing costs of investing in the Fund and other funds. To do so, compare this 5% hypothetical example with the 5% hypothetical examples that appear in the shareholder reports of the other funds.
Please note that the expenses shown in the table are meant to highlight your ongoing costs. Therefore, the “Hypothetical” line of the table is useful in comparing ongoing costs only and will not help you determine the relative total costs of owning different funds.
| | | | | | | | | | | | | | | | |
| | | Beginning
account value
9-1-2019 | | | Ending
account value
2-29-2020 | | | Expenses
paid during
the period¹ | | | Annualized net
expense ratio | |
| | | | | |
Institutional Class | | | | | | | | | | | | | | | | |
| | | | |
Actual | | $ | 1,000.00 | | | $ | 1,012.91 | | | $ | 1.35 | | | | 0.27 | % |
| | | | |
Hypothetical (5% return before expenses) | | $ | 1,000.00 | | | $ | 1,023.52 | | | $ | 1.36 | | | | 0.27 | % |
| 1 | Expenses paid is equal to the annualized net expense ratio multiplied by the average account value over the period, multiplied by the number of days in the most recent fiscal half-year divided by the number of days in the fiscal year (to reflect theone-half-year period). |
6 | Wells Fargo Conservative Income Fund
Portfolio of investments—February 29, 2020 (unaudited)
| | | | | | | | | | | | | | | | |
| | | Interest
rate | | | Maturity
date | | | Principal | | | Value | |
| Agency Securities: 3.12% | | | | | | | | | | | | |
FHLMC Multi Family Structured Pass-Through Securities SeriesK-714 Class A2 ±± | | | 3.03 | % | | | 10-25-2020 | | | $ | 4,500,163 | | | $ | 4,513,471 | |
FHLMC Multi Family Structured Pass-Through Securities SeriesK-715 Class A2 ±± | | | 2.86 | | | | 1-25-2021 | | | | 5,642,350 | | | | 5,679,330 | |
GNMA Series2019-H04 Class CA±± | | | 3.00 | | | | 3-20-2069 | | | | 4,486,906 | | | | 4,566,232 | |
| |
Total Agency Securities (Cost $14,662,567) | | | | 14,759,033 | |
| | | | | | | | | | | | | | | | |
| | | | |
| Asset-Backed Securities: 24.27% | | | | | | | | | | | | |
American Express Credit Account Master Trust Series2017-6 Class A | | | 2.04 | | | | 5-15-2023 | | | | 2,236,000 | | | | 2,245,168 | |
AmeriCredit Automobile Receivables Trust Series2019-1 Class A2A | | | 2.93 | | | | 6-20-2022 | | | | 1,057,185 | | | | 1,062,386 | |
Bank of America Credit Card Trust Series2017-A1 Class A1 | | | 1.95 | | | | 8-15-2022 | | | | 6,000,000 | | | | 6,000,600 | |
Bank of the West Auto Trust Series2018-1 Class A2 144A | | | 3.09 | | | | 4-15-2021 | | | | 282,545 | | | | 282,665 | |
BlueMountain CLO Limited Series2012-2A Class AR2 (3 Month LIBOR +1.05%) 144A± | | | 2.74 | | | | 11-20-2028 | | | | 5,000,000 | | | | 5,001,225 | |
Canadian Pacer Auto Receivables Trust Series2018-2A Class A2A 144A | | | 3.00 | | | | 6-21-2021 | | | | 397,299 | | | | 398,323 | |
Canadian Pacer Auto Receivables Trust Series2019-1A Class A2 144A | | | 2.78 | | | | 3-21-2022 | | | | 1,319,907 | | | | 1,326,826 | |
CarMax Auto Owner Trust Series2018-4 Class A2A | | | 3.11 | | | | 2-15-2022 | | | | 1,352,963 | | | | 1,359,901 | |
CarMax Auto Owner Trust Series2020-1 Class A2 | | | 1.87 | | | | 4-17-2023 | | | | 2,865,000 | | | | 2,884,624 | |
CCG Receivables Trust Series2018-2 Class A2 144A | | | 3.09 | | | | 12-15-2025 | | | | 2,510,227 | | | | 2,540,143 | |
Chase Issuance Trust Series2015-A4 Class A4 | | | 1.84 | | | | 4-15-2022 | | | | 3,500,000 | | | | 3,501,050 | |
Chase Issuance Trust Series2016-A4 Class A4 | | | 1.49 | | | | 7-15-2022 | | | | 3,000,000 | | | | 3,000,000 | |
Delamare Cards Series2018-1A Class A1 (1 Month LIBOR +0.70%) 144A± | | | 2.36 | | | | 11-19-2025 | | | | 5,000,000 | | | | 5,007,695 | |
Dell Equipment Finance Trust Series2018-2 Class A2 144A | | | 3.16 | | | | 2-22-2021 | | | | 652,535 | | | | 655,586 | |
Dell Equipment Finance Trust Series2019-2 Class A2 144A | | | 1.95 | | | | 12-22-2021 | | | | 3,000,000 | | | | 3,011,524 | |
Dorchester Park CLO Limited Series2016-25A Class AR (3 Month LIBOR +0.90%) 144A± | | | 2.72 | | | | 4-20-2028 | | | | 5,000,000 | | | | 4,995,230 | |
Enterprise Fleet Financing LLC Series2020-1 Class A2 144A | | | 1.78 | | | | 12-22-2025 | | | | 2,500,000 | | | | 2,519,723 | |
Evergreen Credit Card Trust Series2019-3 Class B 144A | | | 2.36 | | | | 10-16-2023 | | | | 3,750,000 | | | | 3,786,408 | |
Ford Credit Auto Owner Trust Series2019-B Class A3 | | | 2.23 | | | | 10-15-2023 | | | | 1,785,000 | | | | 1,816,676 | |
GM Financial Securitized Term Auto Receivables Trust Series2020-1 Class A2 | | | 1.83 | | | | 1-17-2023 | | | | 1,150,000 | | | | 1,155,299 | |
Hertz Fleet Lease Funding LP Series2017-1 Class A1 (1 Month LIBOR +0.65%) 144A± | | | 2.32 | | | | 4-10-2031 | | | | 597,887 | | | | 597,935 | |
Hyundai Auto Lease Securitization Trust Series2019-B Class A3 144A | | | 2.04 | | | | 8-15-2022 | | | | 7,500,000 | | | | 7,572,469 | |
Mercedes-Benz Auto Lease Trust Series2019-A Class A2 | | | 3.01 | | | | 2-16-2021 | | | | 1,184,937 | | | | 1,187,217 | |
Mercedes-Benz Auto Receivables Trust Series2019-1 Class A2A | | | 2.04 | | | | 6-15-2022 | | | | 1,000,000 | | | | 1,003,271 | |
NextGear Floorplan Master Trust Series2018-1A Class A1 (1 Month LIBOR +0.64%) 144A± | | | 2.30 | | | | 2-15-2023 | | | | 5,000,000 | | | | 5,011,824 | |
Oscar US Funding Trust Series2018-1A Class A2B (1 Month LIBOR +0.49%) 144A± | | | 2.17 | | | | 4-12-2021 | | | | 69,220 | | | | 69,222 | |
Oscar US Funding Trust Series2018-2A Class A2A 144A | | | 3.15 | | | | 8-10-2021 | | | | 781,306 | | | | 782,401 | |
Oscar US Funding Trust Series2019-2A Class A2 144A | | | 2.49 | | | | 8-10-2022 | | | | 443,460 | | | | 445,105 | |
Penarth Master Issuer plc Series2019-1A Class A1 (1 Month LIBOR +0.54%) 144A± | | | 2.20 | | | | 7-18-2023 | | | | 2,000,000 | | | | 2,002,610 | |
Santander Retail Auto Lease Trust Series2019-B Class A2A 144A | | | 2.29 | | | | 4-20-2022 | | | | 3,382,175 | | | | 3,410,723 | |
Santander Retail Auto Lease Trust Series2019-C Class A2A 144A | | | 1.89 | | | | 9-20-2022 | | | | 3,000,000 | | | | 3,016,777 | |
Santander Retail Auto Lease Trust Series2020-A Class A2 144A | | | 1.69 | | | | 1-20-2023 | | | | 500,000 | | | | 499,972 | |
Securitized Term Auto Receivables Trust Series2018-2A Class A2A 144A | | | 3.06 | | | | 2-25-2021 | | | | 208,848 | | | | 209,154 | |
SoFi Consumer Loan Program Trust Series2018-4 Class A 144A | | | 3.54 | | | | 11-26-2027 | | | | 2,442,903 | | | | 2,468,365 | |
SoFi Consumer Loan Program Trust Series2019-2 Class A 144A | | | 3.01 | | | | 4-25-2028 | | | | 928,623 | | | | 937,299 | |
SoFi Consumer Loan Program Trust Series2020-1 Class A 144A | | | 2.02 | | | | 1-25-2029 | | | | 3,250,000 | | | | 3,249,899 | |
Toyota Auto Receivables Owner Trust Series2020-A Class A2 | | | 1.67 | | | | 11-15-2022 | | | | 5,855,000 | | | | 5,883,548 | |
Trillium Credit Card Trust II Series2019-2A Class A 144A | | | 3.04 | | | | 1-26-2024 | | | | 2,000,000 | | | | 2,029,713 | |
Trillium Credit Card Trust II Series2020-1A Class B 144A | | | 2.33 | | | | 12-26-2024 | | | | 1,355,000 | | | | 1,369,693 | |
Venture CDO Limited Series16-25A Class AR (3 Month LIBOR +1.23%) 144A± | | | 3.05 | | | | 4-20-2029 | | | | 5,000,000 | | | | 5,000,430 | |
Verizon Owner Trust Series2017-3A Class A1A 144A | | | 2.06 | | | | 4-20-2022 | | | | 2,660,038 | | | | 2,664,560 | |
Verizon Owner Trust Series2018-1A Class A1 144A | | | 2.82 | | | | 9-20-2022 | | | | 3,906,000 | | | | 3,936,759 | |
The accompanying notes are an integral part of these financial statements.
Wells Fargo Conservative Income Fund | 7
Portfolio of investments—February 29, 2020 (unaudited)
| | | | | | | | | | | | | | | | |
| | | Interest
rate | | | Maturity
date | | | Principal | | | Value | |
| Asset-Backed Securities (continued) | | | | | | | | | | | | |
Volvo Financial Equipment LLC Series2019-1A Class A2 144A | | | 2.90 | % | | | 11-15-2021 | | | $ | 1,198,402 | | | $ | 1,204,595 | |
World Omni Auto Lease Trust Series2018-A Class A3 | | | 2.50 | | | | 4-17-2023 | | | | 5,256,625 | | | | 5,294,332 | |
World Omni Auto Lease Trust Series2020-A Class A2 | | | 1.71 | | | | 11-15-2022 | | | | 2,365,000 | | | | 2,375,421 | |
| |
Total Asset-Backed Securities (Cost $114,305,985) | | | | 114,774,346 | |
| | | | | | | | | | | | | | | | |
|
| Corporate Bonds and Notes: 29.47% | |
|
Communication Services: 2.18% | |
|
| Entertainment: 0.85% | |
The Walt Disney Company | | | 1.95 | | | | 3-4-2020 | | | | 4,000,000 | | | | 4,000,040 | |
| | | | | | | | | | | | | | | | |
|
| Media: 1.33% | |
Comcast Corporation | | | 2.24 | | | | 10-1-2020 | | | | 2,279,000 | | | | 2,283,445 | |
NBCUniversal Enterprise Incorporated (3 Month LIBOR +0.40%) 144A± | | | 2.31 | | | | 4-1-2021 | | | | 4,000,000 | | | | 4,010,657 | |
| | | | |
| | | | | | | | | | | | | | | 6,294,102 | |
| | | | | | | | | | | | | | | | |
|
Consumer Discretionary: 0.68% | |
|
| Automobiles: 0.68% | |
Volkswagen Group America Company (3 Month LIBOR +0.77%) 144A± | | | 2.48 | | | | 11-13-2020 | | | | 1,500,000 | | | | 1,505,144 | |
Volkswagen Group America Company 144A | | | 2.50 | | | | 9-24-2021 | | | | 1,675,000 | | | | 1,696,506 | |
| | | | |
| | | | | | | | | | | | | | | 3,201,650 | |
| | | | | | | | | | | | | | | | |
|
Energy: 0.93% | |
|
| Oil, Gas & Consumable Fuels: 0.93% | |
Exxon Mobil Corporation (3 Month LIBOR +0.33%)± | | | 2.02 | | | | 8-16-2022 | | | | 4,375,000 | | | | 4,389,967 | |
| | | | | | | | | | | | | | | | |
|
Financials: 24.83% | |
|
| Banks: 6.70% | |
Bank of America Corporation | | | 2.37 | | | | 7-21-2021 | | | | 1,000,000 | | | | 1,002,891 | |
Bank of America Corporation (3 Month LIBOR +0.66%)± | | | 2.48 | | | | 7-21-2021 | | | | 3,432,000 | | | | 3,435,921 | |
Bank of America Corporation | | | 5.70 | | | | 1-24-2022 | | | | 1,000,000 | | | | 1,081,357 | |
Citibank NA | | | 3.40 | | | | 7-23-2021 | | | | 2,040,000 | | | | 2,088,504 | |
Citigroup Incorporated | | | 2.70 | | | | 3-30-2021 | | | | 3,000,000 | | | | 3,031,848 | |
Citigroup Incorporated | | | 3.34 | | | | 3-30-2021 | | | | 1,500,000 | | | | 1,519,990 | |
Credit Suisse New York (U.S. SOFR +0.45%)± | | | 2.04 | | | | 2-4-2022 | | | | 3,250,000 | | | | 3,247,911 | |
Credit Suisse New York | | | 2.10 | | | | 11-12-2021 | | | | 1,000,000 | | | | 1,009,957 | |
HSBC Bank USA NA | | | 4.88 | | | | 8-24-2020 | | | | 1,500,000 | | | | 1,522,664 | |
JPMorgan Chase & Company | | | 2.99 | | | | 6-7-2021 | | | | 1,000,000 | | | | 1,009,729 | |
JPMorgan Chase & Company | | | 4.25 | | | | 10-15-2020 | | | | 2,000,000 | | | | 2,032,462 | |
JPMorgan Chase & Company | | | 4.35 | | | | 8-15-2021 | | | | 1,000,000 | | | | 1,039,160 | |
PNC Bank NA | | | 2.15 | | | | 4-29-2021 | | | | 2,000,000 | | | | 2,017,781 | |
PNC Bank NA | | | 2.00 | | | | 2-24-2023 | | | | 2,300,000 | | | | 2,290,671 | |
Truist Bank | | | 2.63 | | | | 1-15-2022 | | | | 4,250,000 | | | | 4,330,730 | |
Truist Financial Corporation | | | 2.05 | | | | 5-10-2021 | | | | 1,000,000 | | | | 1,006,659 | |
| | | | |
| | | | | | | | | | | | | | | 31,668,235 | |
| | | | | | | | | | | | | | | | |
|
| Capital Markets: 4.12% | |
Bank of New York Mellon Corporation (3 Month LIBOR +0.28%)± | | | 2.18 | | | | 6-4-2021 | | | | 900,000 | | | | 900,081 | |
Charles Schwab Corporation (3 Month LIBOR +0.32%)± | | | 2.02 | | | | 5-21-2021 | | | | 4,540,000 | | | | 4,549,296 | |
Goldman Sachs Group Incorporated | | | 2.35 | | | | 11-15-2021 | | | | 1,000,000 | | | | 1,005,441 | |
Goldman Sachs Group Incorporated | | | 3.15 | | | | 4-23-2021 | | | | 2,180,000 | | | | 2,202,540 | |
Goldman Sachs Group Incorporated | | | 6.00 | | | | 6-15-2020 | | | | 1,000,000 | | | | 1,012,180 | |
Intercontinental Exchange Incorporated | | | 2.75 | | | | 12-1-2020 | | | | 4,831,000 | | | | 4,862,706 | |
Morgan Stanley (U.S. SOFR +0.70%)± | | | 2.28 | | | | 1-20-2023 | | | | 3,950,000 | | | | 3,956,996 | |
Morgan Stanley (3 Month LIBOR +1.18%)± | | | 3.00 | | | | 1-20-2022 | | | | 1,000,000 | | | | 1,006,918 | |
| | | | |
| | | | | | | | | | | | | | | 19,496,158 | |
| | | | | | | | | | | | | | | | |
The accompanying notes are an integral part of these financial statements.
8 | Wells Fargo Conservative Income Fund
Portfolio of investments—February 29, 2020 (unaudited)
| | | | | | | | | | | | | | | | |
| | | Interest
rate | | | Maturity
date | | | Principal | | | Value | |
| Consumer Finance: 3.58% | |
American Honda Finance Corporation | | | 1.70 | % | | | 9-9-2021 | | | $ | 2,000,000 | | | $ | 2,010,467 | |
Caterpillar Financial Service Corporation (3 Month LIBOR +0.30%)± | | | 2.19 | | | | 3-8-2021 | | | | 4,500,000 | | | | 4,508,008 | |
John Deere Capital Corporation | | | 2.20 | | | | 3-13-2020 | | | | 2,500,000 | | | | 2,500,466 | |
John Deere Capital Corporation | | | 2.35 | | | | 1-8-2021 | | | | 2,000,000 | | | | 2,013,122 | |
Toyota Motor Credit Corporation | | | 1.83 | | | | 8-13-2021 | | | | 1,900,000 | | | | 1,898,643 | |
Toyota Motor Credit Corporation | | | 1.90 | | | | 4-8-2021 | | | | 2,000,000 | | | | 2,015,850 | |
Toyota Motor Credit Corporation (3 Month LIBOR +0.17%)± | | | 2.07 | | | | 9-18-2020 | | | | 2,000,000 | | | | 2,001,866 | |
| | | | |
| | | | | | | | | | | | | | | 16,948,422 | |
| | | | | | | | | | | | | | | | |
|
| Diversified Financial Services: 1.06% | |
WEA Finance LLC 144A | | | 3.25 | | | | 10-5-2020 | | | | 5,000,000 | | | | 5,036,838 | |
| | | | | | | | | | | | | | | | |
|
| Insurance: 9.37% | |
AIG Global Funding (3 Month LIBOR +0.46%) 144A± | | | 2.41 | | | | 6-25-2021 | | | | 2,600,000 | | | | 2,610,231 | |
Athene Global Funding 144A | | | 2.75 | | | | 4-20-2020 | | | | 4,085,000 | | | | 4,090,448 | |
Jackson National Life Global Company 144A | | | 2.25 | | | | 4-29-2021 | | | | 4,000,000 | | | | 4,039,672 | |
Jackson National Life Global Company (3 Month LIBOR +0.48%) 144A± | | | 2.37 | | | | 6-11-2021 | | | | 2,500,000 | | | | 2,512,521 | |
Jackson National Life Global Company 144A | | | 3.30 | | | | 6-11-2021 | | | | 1,815,000 | | | | 1,859,079 | |
MassMutual Global Funding 144A | | | 2.00 | | | | 4-15-2021 | | | | 958,000 | | | | 966,907 | |
MassMutual Global Funding 144A | | | 2.45 | | | | 11-23-2020 | | | | 1,710,000 | | | | 1,724,985 | |
MassMutual Global Funding II 144A | | | 1.95 | | | | 9-22-2020 | | | | 3,826,000 | | | | 3,837,109 | |
Metropolitan Life Global Funding Incorporated 144A | | | 1.95 | | | | 9-15-2021 | | | | 3,000,000 | | | | 3,030,724 | |
Metropolitan Life Global Funding Incorporated (3 Month LIBOR +0.40%) 144A± | | | 2.29 | | | | 6-12-2020 | | | | 1,975,000 | | | | 1,977,287 | |
New York Life Global Funding 144A | | | 2.00 | | | | 4-13-2021 | | | | 600,000 | | | | 605,350 | |
New York Life Global Funding (3 Month LIBOR +0.16%) 144A± | | | 2.07 | | | | 10-1-2020 | | | | 1,300,000 | | | | 1,301,030 | |
New York Life Global Funding 144A | | | 2.95 | | | | 1-28-2021 | | | | 4,545,000 | | | | 4,605,323 | |
Protective Life Global Funding (3 Month LIBOR +0.52%) 144A± | | | 2.48 | | | | 6-28-2021 | | | | 5,000,000 | | | | 5,026,046 | |
The Allstate Corporation (3 Month LIBOR +0.43%)± | | | 2.39 | | | | 3-29-2021 | | | | 825,000 | | | | 827,731 | |
USAA Capital Corporation 144A | | | 2.00 | | | | 6-1-2021 | | | | 5,220,000 | | | | 5,278,467 | |
| | | | |
| | | | | | | | | | | | | | | 44,292,910 | |
| | | | | | | | | | | | | | | | |
|
Industrials: 0.85% | |
|
| Road & Rail: 0.85% | |
TTX Company 144A | | | 2.60 | | | | 6-15-2020 | | | | 4,000,000 | | | | 4,007,903 | |
| | | | | | | | | | | | | | | | |
| |
Total Corporate Bonds and Notes (Cost $138,846,042) | | | | 139,336,225 | |
| | | | | | | | | | | | | | | | |
|
| Municipal Obligations: 2.15% | |
|
California: 0.22% | |
|
| Miscellaneous Revenue: 0.22% | |
Fresno County CA Pension CAB Series A (National Insured) ¤ | | | 0.00 | | | | 8-15-2020 | | | $ | 1,025,000 | | | | 1,017,702 | |
| | | | | | | | | | | | | | | | |
|
Ohio: 1.07% | |
|
| Tobacco Revenue: 1.07% | |
Buckeye Ohio Tobacco Settlement Financing Authority | | | 1.58 | | | | 6-1-2021 | | | | 5,065,000 | | | | 5,081,664 | |
| | | | | | | | | | | | | | | | |
|
Tennessee: 0.86% | |
|
| Health Revenue: 0.86% | |
Nashville & Davidson Counties TN Vanderbilt University Medical Center Series D (1 Month LIBOR +2.50%)± | | | 4.17 | | | | 7-1-2046 | | | | 4,000,000 | | | | 4,067,120 | |
| | | | | | | | | | | | | | | | |
| |
Total Municipal Obligations (Cost $10,201,091) | | | | 10,166,486 | |
| | | | | | | | | | | | | | | | |
The accompanying notes are an integral part of these financial statements.
Wells Fargo Conservative Income Fund | 9
Portfolio of investments—February 29, 2020 (unaudited)
| | | | | | | | | | | | | | | | |
| | | Interest
rate | | | Maturity
date | | | Principal | | | Value | |
| Yankee Corporate Bonds and Notes: 17.32% | |
|
Energy: 0.27% | |
|
| Oil, Gas & Consumable Fuels: 0.27% | |
BP Capital Markets plc (3 Month LIBOR +0.25%)± | | | 1.93 | % | | | 11-24-2020 | | | $ | 1,270,000 | | | $ | 1,270,938 | |
| | | | | | | | | | | | | | | | |
|
Financials: 15.06% | |
|
| Banks: 14.60% | |
Australia and New Zealand Banking Group 144A | | | 4.88 | | | | 1-12-2021 | | | | 1,000,000 | | | | 1,030,113 | |
Banque Federative du Credit Mutuel 144A | | | 2.75 | | | | 10-15-2020 | | | | 4,278,000 | | | | 4,307,424 | |
Barclays Bank plc (3 Month LIBOR +0.46%)± | | | 2.31 | | | | 1-11-2021 | | | | 4,000,000 | | | | 3,995,664 | |
Cooperatieve Rabobank UA (3 Month LIBOR +0.43%)± | | | 2.22 | | | | 4-26-2021 | | | | 3,000,000 | | | | 3,013,432 | |
Credit Agricole 144A | | | 2.38 | | | | 7-1-2021 | | | | 1,000,000 | | | | 1,014,605 | |
Credit Agricole 144A | | | 2.75 | | | | 6-10-2020 | | | | 4,550,000 | | | | 4,567,420 | |
Credit Agricole 144A | | | 3.09 | | | | 7-1-2021 | | | | 1,000,000 | | | | 1,014,363 | |
DnB Bank ASA (3 Month LIBOR +0.62%) 144A± | | | 2.53 | | | | 12-2-2022 | | | | 500,000 | | | | 503,233 | |
HSBC Holdings plc | | | 2.95 | | | | 5-25-2021 | | | | 1,000,000 | | | | 1,015,811 | |
HSBC Holdings plc | | | 5.10 | | | | 4-5-2021 | | | | 3,000,000 | | | | 3,110,967 | |
Lloyds Banking Group plc | | | 2.70 | | | | 8-17-2020 | | | | 500,000 | | | | 502,569 | |
Macquarie Bank Limited 144A | | | 2.85 | | | | 1-15-2021 | | | | 4,000,000 | | | | 4,055,291 | |
National Australia Bank Limited | | | 3.70 | | | | 11-4-2021 | | | | 1,410,000 | | | | 1,460,601 | |
Royal Bank of Canada | | | 2.20 | | | | 1-17-2023 | | | | 3,650,000 | | | | 3,659,150 | |
Santander UK plc (3 Month LIBOR +0.62%)± | | | 2.53 | | | | 6-1-2021 | | | | 4,000,000 | | | | 4,018,379 | |
Santander UK plc (3 Month LIBOR +0.66%)± | | | 2.35 | | | | 11-15-2021 | | | | 2,629,000 | | | | 2,647,274 | |
Santander UK plc | | | 3.40 | | | | 6-1-2021 | | | | 520,000 | | | | 533,237 | |
Skandinaviska Enskilda Banken (3 Month LIBOR +0.65%) 144A± | | | 2.53 | | | | 12-12-2022 | | | | 1,250,000 | | | | 1,257,027 | |
Skandinaviska Enskilda Banken 144A | | | 2.63 | | | | 11-17-2020 | | | | 3,000,000 | | | | 3,022,230 | |
Societe Generale SA (3 Month LIBOR +1.33%) 144A± | | | 3.20 | | | | 4-8-2021 | | | | 5,000,000 | | | | 5,066,401 | |
Societe Generale SA 144A | | | 5.20 | | | | 4-15-2021 | | | | 1,034,000 | | | | 1,077,524 | |
Sumitomo Mitsui Banking Corporation (3 Month LIBOR +1.14%)± | | | 2.96 | | | | 10-19-2021 | | | | 815,000 | | | | 826,335 | |
Svenska Handelsbanken AB (3 Month LIBOR +0.47%)± | | | 2.15 | | | | 5-24-2021 | | | | 4,000,000 | | | | 4,015,799 | |
Toronto-Dominion Bank | | | 2.06 | | | | 1-27-2023 | | | | 6,000,000 | | | | 5,999,488 | |
United Overseas Bank Limited (3 Month LIBOR +0.48%) 144A± | | | 2.29 | | | | 4-23-2021 | | | | 1,800,000 | | | | 1,805,808 | |
Westpac Banking Corporation (3 Month LIBOR +0.39%)± | | | 2.23 | | | | 1-13-2023 | | | | 1,475,000 | | | | 1,475,562 | |
Westpac Banking Corporation (3 Month LIBOR +1.00%)± | | | 2.71 | | | | 5-13-2021 | | | | 4,000,000 | | | | 4,042,672 | |
| | | | |
| | | | | | | | | | | | | | | 69,038,379 | |
| | | | | | | | | | | | | | | | |
|
| Capital Markets: 0.46% | |
UBS Group AG 144A | | | 2.45 | | | | 12-1-2020 | | | | 1,000,000 | | | | 1,006,011 | |
UBS Group AG (3 Month LIBOR +0.48%) 144A± | | | 2.39 | | | | 12-1-2020 | | | | 1,165,000 | | | | 1,167,724 | |
| | | | |
| | | | | | | | | | | | | | | 2,173,735 | |
| | | | | | | | | | | | | | | | |
| | | | |
| Industrials: 1.99% | | | | | | | | | | | | |
| | | | |
| Electrical Equipment: 1.99% | | | | | | | | | | | | |
Siemens Financieringsmaatschappij NV 144A | | | 1.70 | | | | 9-15-2021 | | | | 2,600,000 | | | | 2,612,431 | |
Siemens Financieringsmaatschappij NV 144A | | | 2.15 | | | | 5-27-2020 | | | | 1,900,000 | | | | 1,901,745 | |
Tyco Electronics Group SA (3 Month LIBOR +0.45%)± | | | 2.34 | | | | 6-5-2020 | | | | 4,900,000 | | | | 4,904,438 | |
| | | | |
| | | | | | | | | | | | | | | 9,418,614 | |
| | | | | | | | | | | | | | | | |
| | | | |
Total Yankee Corporate Bonds and Notes (Cost $81,636,732) | | | | | | | | | | | | | | | 81,901,666 | |
| | | | | | | | | | | | | | | | |
The accompanying notes are an integral part of these financial statements.
10 | Wells Fargo Conservative Income Fund
Portfolio of investments—February 29, 2020 (unaudited)
| | | | | | | | | | | | | | | | |
| | | Interest
rate | | | Maturity
date | | | Principal | | | Value | |
Short-Term Investments: 25.20% | | | | | | | | | | | | | | | | |
| | | | |
| Commercial Paper: 24.67% | | | | | | | | | | | | |
Anglesea Funding plc 144A(p)(z) | | | 1.77 | % | | | 4-3-2020 | | | $ | 10,000,000 | | | $ | 9,984,124 | |
Bennington Sark Capital Company 144A(p)(z) | | | 1.43 | | | | 3-11-2020 | | | | 4,000,000 | | | | 3,997,807 | |
Chariot Funding LLC 144A(p)(z) | | | 0.88 | | | | 3-4-2020 | | | | 9,700,000 | | | | 9,697,778 | |
China International Marine Containers (z) | | | 0.68 | | | | 3-3-2020 | | | | 6,360,000 | | | | 6,358,881 | |
Concord Minutemen Capital Company 144A(p)(z) | | | 1.47 | | | | 3-18-2020 | | | | 5,000,000 | | | | 4,995,633 | |
Concord Minutemen Capital Company 144A(p)(z) | | | 1.65 | | | | 5-5-2020 | | | | 5,000,000 | | | | 4,985,093 | |
CRC Funding LLC 144A(p)(z) | | | 1.63 | | | | 5-8-2020 | | | | 5,000,000 | | | | 4,984,444 | |
Gotham Funding Corporation 144A(p)(z) | | | 1.85 | | | | 3-2-2020 | | | | 6,500,000 | | | | 6,499,121 | |
Great Bridge Capital Company LLC 144A(p)(z) | | | 1.80 | | | | 4-2-2020 | | | | 6,000,000 | | | | 5,991,347 | |
Institutional Secured Funding LLC 144A(p)(z) | | | 0.56 | | | | 3-3-2020 | | | | 1,700,000 | | | | 1,699,684 | |
Institutional Secured Funding LLC 144A(p)(z) | | | 1.66 | | | | 4-7-2020 | | | | 3,300,000 | | | | 3,294,180 | |
Lime Funding LLC 144A(p)(z) | | | 1.62 | | | | 3-24-2020 | | | | 2,200,000 | | | | 2,197,484 | |
LMA Americas LLC 144A(p)(z) | | | 1.58 | | | | 4-7-2020 | | | | 5,000,000 | | | | 4,991,463 | |
LMA Americas LLC 144A(p)(z) | | | 1.75 | | | | 5-5-2020 | | | | 4,000,000 | | | | 3,988,089 | |
Mountcliff Funding LLC 144A(p)(z) | | | 1.54 | | | | 3-6-2020 | | | | 10,000,000 | | | | 9,996,751 | |
Old Line Funding LLC 144A(p)(z) | | | 1.54 | | | | 4-20-2020 | | | | 10,500,000 | | | | 10,476,780 | |
Prudential plc 144A(z) | | | 1.63 | | | | 5-20-2020 | | | | 10,000,000 | | | | 9,966,266 | |
Thunder Bay Funding LLC 144A(p)(z) | | | 1.61 | | | | 4-27-2020 | | | | 1,500,000 | | | | 1,496,207 | |
Versailles CDS LLC 144A(z) | | | 1.63 | | | | 6-2-2020 | | | | 9,300,000 | | | | 9,260,782 | |
Victory Receivables 144A(p)(z) | | | 1.53 | | | | 4-1-2020 | | | | 1,800,000 | | | | 1,797,301 | |
| | | | |
| | | | | | | | | | | | | | | 116,659,215 | |
| | | | | | | | | | | | | | | | |
| | | | |
| | | | | | | | | | | | | | | | |
| | | Yield | | | | | | Shares | | | | |
| Investment Companies: 0.53% | | | | | | | | | | | | |
Wells Fargo Government Money Market Fund Select Class (l)(u) | | | 1.52 | | | | | | | | 2,518,309 | | | | 2,518,309 | |
| | | | | | | | | | | | | | | | |
| | | | |
Total Short-Term Investments (Cost $119,177,918) | | | | | | | | | | | | | | | 119,177,524 | |
| | | | | | | | | | | | | | | | |
| | | | | | | | |
| Total investments in securities (Cost $478,830,335) | | | 101.53 | % | | | 480,115,280 | |
| | |
Other assets and liabilities, net | | | (1.53 | ) | | | (7,214,561 | ) |
| | | | | | | | |
| Total net assets | | | 100.00 | % | | $ | 472,900,719 | |
| | | | | | | | |
| ±± | The coupon of the security is adjusted based on the principal and interest payments received from the underlying pool of mortgages as well as the credit quality and the actual prepayment speed of the underlying mortgages. |
| 144A | The security may be resold in transactions exempt from registration, normally to qualified institutional buyers, pursuant to Rule 144A under the Securities Act of 1933. |
| ± | Variable rate investment. The rate shown is the rate in effect at period end. |
| ¤ | The security is issued in zero coupon form with no periodic interest payments. |
| (p) | Asset-backed commercial paper |
| (z) | Zero coupon security. The rate represents the current yield to maturity. |
| (l) | The issuer of the security is an affiliated person of the Fund as defined in the Investment Company Act of 1940. |
| (u) | The rate represents the7-day annualized yield at period end. |
Abbreviations:
| CAB | Capital appreciation bond |
| FHLMC | Federal Home Loan Mortgage Corporation |
| GNMA | Government National Mortgage Association |
| LIBOR | London Interbank Offered Rate |
| National | National Public Finance Guarantee Corporation |
| SOFR | Secured Overnight Financing Rate |
The accompanying notes are an integral part of these financial statements.
Wells Fargo Conservative Income Fund | 11
Portfolio of investments—February 29, 2020 (unaudited)
Investments in Affiliates
An affiliated investment is an investment in which the Fund owns at least 5% of the outstanding voting shares of the issuer or as a result of other relationships, such as the Fund and the issuer having the same investment manager. Transactions with issuers that were either affiliated persons of the Fund at the beginning of the period or the end of the period were as follows:
| | | | | | | | | | | | | | | | | | | | | | | | | | | | | | | | | | | | |
| | | Shares,
beginning of
period | | | Shares
purchased | | | Shares
sold | | | Shares,
end of
period | | | Net
realized
gains
(losses) | | | Net
change in
unrealized
gains
(losses) | | | Income
from
affiliated
securities | | | Value,
end of
period | | | % of
net
assets | |
| | | | | | | | | |
| Short-Term Investments | | | | | | | | | | | | | | | | | | | | | | | | | | | |
Investment Companies | | | | | | | | | | | | | | | | | | | | | | | | | | | | | | | | | | | | |
Wells Fargo Government Money Market Fund Select Class | | | 220,913 | | | | 109,731,042 | | | | (107,433,646 | ) | | | 2,518,309 | | | $ | 0 | | | $ | 0 | | | $ | 19,212 | | | $ | 2,518,309 | | | | 0.53 | % |
The accompanying notes are an integral part of these financial statements.
12 | Wells Fargo Conservative Income Fund
Statement of assets and liabilities—February 29, 2020 (unaudited)
| | | | |
| | | | |
| |
Assets | | | | |
Investments in unaffiliated securities, at value (cost $476,312,026) | | $ | 477,596,971 | |
Investments in affiliated securities, at value (cost $2,518,309) | | | 2,518,309 | |
Cash | | | 15,423 | |
Receivable for interest | | | 1,407,639 | |
| | | | |
Total assets | | | 481,538,342 | |
| | | | |
| |
Liabilities | | | | |
Payable for investments purchased | | | 5,065,000 | |
Payable for Fund shares redeemed | | | 3,354,310 | |
Management fee payable | | | 56,180 | |
Dividends payable | | | 95,995 | |
Administration fee payable | | | 30,033 | |
Trustees’ fees and expenses payable | | | 5,732 | |
Accrued expenses and other liabilities | | | 30,373 | |
| | | | |
Total liabilities | | | 8,637,623 | |
| | | | |
Total net assets | | $ | 472,900,719 | |
| | | | |
| |
Net assets consist of | | | | |
Paid-in capital | | $ | 473,296,207 | |
Total distributable loss | | | (395,488 | ) |
| | | | |
Total net assets | | $ | 472,900,719 | |
| | | | |
| |
Computation of net asset value per share | | | | |
Net assets – Institutional Class | | $ | 472,900,719 | |
Shares outstanding – Institutional Class1 | | | 47,210,471 | |
Net asset value per share – Institutional Class | | | $10.02 | |
| 1 | The Fund has an unlimited number of authorized shares. |
The accompanying notes are an integral part of these financial statements.
Wells Fargo Conservative Income Fund | 13
Statement of operations—six months ended February 29, 2020 (unaudited)
| | | | |
| | | | |
| |
Investment income | | | | |
Interest (net of foreign interest withholding taxes of $3,173) | | $ | 4,514,532 | |
Income from affiliated securities | | | 19,212 | |
| | | | |
Total investment income | | | 4,533,744 | |
| | | | |
| |
Expenses | | | | |
Management fee | | | 464,247 | |
Administration fee | |
Institutional Class | | | 148,559 | |
Custody and accounting fees | | | 14,478 | |
Professional fees | | | 21,552 | |
Registration fees | | | 31,916 | |
Shareholder report expenses | | | 7,437 | |
Trustees’ fees and expenses | | | 10,909 | |
Other fees and expenses | | | 5,107 | |
| | | | |
Total expenses | | | 704,205 | |
Less: Fee waivers and/or expense reimbursements | | | | |
Fund-level | | | (202,819 | ) |
| | | | |
Net expenses | | | 501,386 | |
| | | | |
Net investment income | | | 4,032,358 | |
| | | | |
| |
Realized and unrealized gains (losses) on investments | | | | |
Net realized gains on investments | | | 83,134 | |
Net change in unrealized gains (losses) on investments | | | 474,224 | |
| | | | |
Net realized and unrealized gains (losses) on investments | | | 557,358 | |
| | | | |
Net increase in net assets resulting from operations | | $ | 4,589,716 | |
| | | | |
The accompanying notes are an integral part of these financial statements.
14 | Wells Fargo Conservative Income Fund
Statement of changes in net assets
| | | | | | | | | | | | | | | | |
| | | Six months ended
February 29, 2020 (unaudited) | | | Year ended
August 31, 2019 | |
| |
Operations | | | | | |
Net investment income | | | | | | $ | 4,032,358 | | | | | | | $ | 10,875,313 | |
Net realized gains (losses) on investments | | | | | | | 83,134 | | | | | | | | (993,936 | ) |
Net change in unrealized gains (losses) on investments | | | | | | | 474,224 | | | | | | | | 441,843 | |
| | | | |
Net increase in net assets resulting from operations | | | | | | | 4,589,716 | | | | | | | | 10,323,220 | |
| | | | |
| | | | |
Distributions to shareholders from net investment income and net realized gains | | | | | | | | | | | | | | | | |
Institutional Class | | | | | | | (4,024,393 | ) | | | | | | | (10,880,158 | ) |
| | | | |
| | | | |
Capital share transactions | | | Shares | | | | | | | | Shares | | | | | |
Proceeds from shares sold | |
Institutional Class | | | 22,662,007 | | | | 226,721,568 | | | | 62,007,026 | | | | 619,230,806 | |
Reinvestment of distributions | |
Institutional Class | | | 367,817 | | | | 3,680,676 | | | | 821,227 | | | | 8,198,093 | |
Payment for shares redeemed | |
Institutional Class | | | (9,059,982 | ) | | | (90,617,781 | ) | | | (69,621,267 | ) | | | (694,323,386 | ) |
| | | | |
Net increase (decrease) in net assets resulting from capital share transactions | | | | | | | 139,784,463 | | | | | | | | (66,894,487 | ) |
| | | | |
Total increase (decrease) in net assets | | | | | | | 140,349,786 | | | | | | | | (67,451,425 | ) |
| | | | |
| | |
Net assets | | | | | | | | |
Beginning of period | | | | | | | 332,550,933 | | | | | | | | 400,002,358 | |
| | | | |
End of period | | | | | | $ | 472,900,719 | | | | | | | $ | 332,550,933 | |
| | | | |
The accompanying notes are an integral part of these financial statements.
Wells Fargo Conservative Income Fund | 15
Financial highlights
(For a share outstanding throughout each period)
| | | | | | | | | | | | | | | | | | | | | | | | |
| | | Six months ended
February 29, 2020
(unaudited) | | | Year ended August 31 | |
| INSTITUTIONAL CLASS | | 2019 | | | 2018 | | | 2017 | | | 2016 | | | 2015 | |
Net asset value, beginning of period | | | $10.00 | | | | $9.99 | | | | $10.01 | | | | $10.01 | | | | $10.00 | | | | $10.02 | |
Net investment income | | | 0.11 | | | | 0.26 | | | | 0.18 | | | | 0.12 | | | | 0.07 | | | | 0.05 | |
Net realized and unrealized gains (losses) on investments | | | 0.02 | | | | 0.01 | | | | (0.02 | ) | | | 0.00 | 1 | | | 0.01 | | | | (0.02 | ) |
| | | | | | | | | | | | | | | | | | | | | | | | |
Total from investment operations | | | 0.13 | | | | 0.27 | | | | 0.16 | | | | 0.12 | | | | 0.08 | | | | 0.03 | |
Distributions to shareholders from | | | | | | | | | | | | | | | | | | | | | | | | |
Net investment income | | | (0.11 | ) | | | (0.26 | ) | | | (0.18 | ) | | | (0.12 | ) | | | (0.07 | ) | | | (0.05 | ) |
Net realized gains | | | 0.00 | | | | 0.00 | | | | (0.00 | )1 | | | 0.00 | | | | 0.00 | | | | (0.00 | )1 |
| | | | | | | | | | | | | | | | | | | | | | | | |
Total distributions to shareholders | | | (0.11 | ) | | | (0.26 | ) | | | (0.18 | ) | | | (0.12 | ) | | | (0.07 | ) | | | (0.05 | ) |
Net asset value, end of period | | | $10.02 | | | | $10.00 | | | | $9.99 | | | | $10.01 | | | | $10.01 | | | | $10.00 | |
Total return2 | | | 1.29 | % | | | 2.71 | % | | | 1.65 | % | | | 1.20 | % | | | 0.79 | % | | | 0.28 | % |
Ratios to average net assets (annualized) | | | | | | | | | | | | | | | | | | | | | | | | |
Gross expenses | | | 0.38 | % | | | 0.37 | % | | | 0.37 | % | | | 0.36 | % | | | 0.36 | % | | | 0.38 | % |
Net expenses | | | 0.27 | % | | | 0.27 | % | | | 0.27 | % | | | 0.27 | % | | | 0.27 | % | | | 0.27 | % |
Net investment income | | | 2.17 | % | | | 2.54 | % | | | 1.79 | % | | | 1.17 | % | | | 0.72 | % | | | 0.48 | % |
Supplemental data | | | | | | | | | | | | | | | | | | | | | | | | |
Portfolio turnover rate | | | 35 | % | | | 171 | % | | | 197 | % | | | 197 | % | | | 269 | % | | | 80 | % |
Net assets, end of period (000s omitted) | | | $472,901 | | | | $332,551 | | | | $400,002 | | | | $419,239 | | | | $547,829 | | | | $336,608 | |
| 1 | Amount is less than $0.005. |
| 2 | Returns for periods of less than one year are not annualized. |
The accompanying notes are an integral part of these financial statements.
16 | Wells Fargo Conservative Income Fund
Notes to financial statements (unaudited)
1. ORGANIZATION
Wells Fargo Funds Trust (the “Trust”), a Delaware statutory trust organized on March 10, 1999, is anopen-end management investment company registered under the Investment Company Act of 1940, as amended (the “1940 Act”). As an investment company, the Trust follows the accounting and reporting guidance in Financial Accounting Standards Board (“FASB”)Accounting Standards Codification Topic 946, Financial Services – Investment Companies. These financial statements report on the Wells Fargo Conservative Income Fund (the “Fund”) which is a diversified series of the Trust.
2. SIGNIFICANT ACCOUNTING POLICIES
The following significant accounting policies, which are consistently followed in the preparation of the financial statements of the Fund, are in conformity with U.S. generally accepted accounting principles which require management to make estimates and assumptions that affect the reported amounts of assets and liabilities, disclosure of contingent assets and liabilities at the date of the financial statements, and the reported amounts of revenues and expenses during the reporting period. Actual results could differ from those estimates.
Securities valuation
All investments are valued each business day as of the close of regular trading on the New York Stock Exchange (generally 4 p.m. Eastern Time), although the Fund may deviate from this calculation time under unusual or unexpected circumstances.
Debt securities are valued at the evaluated bid price provided by an independent pricing service (e.g. taking into account various factors, including yields, maturities, or credit ratings) or, if a reliable price is not available, the quoted bid price from an independent broker-dealer.
Investments in registeredopen-end investment companies are valued at net asset value.
Investments which are not valued using any of the methods discussed above are valued at their fair value, as determined in good faith by the Board of Trustees of the Fund. The Board of Trustees has established a Valuation Committee comprised of the Trustees and has delegated to it the authority to take any actions regarding the valuation of portfolio securities that the Valuation Committee deems necessary or appropriate, including determining the fair value of portfolio securities, unless the determination has been delegated to the Wells Fargo Asset Management Pricing Committee at Wells Fargo Funds Management, LLC (“Funds Management”). The Board of Trustees retains the authority to make or ratify any valuation decisions or approve any changes to the Valuation Procedures as it deems appropriate. On a quarterly basis, the Board of Trustees receives reports on any valuation actions taken by the Valuation Committee or the Wells Fargo Asset Management Pricing Committee which may include items for ratification.
Security transactions and income recognition
Securities transactions are recorded on a trade date basis. Realized gains or losses are recorded on the basis of identified cost.
Interest income is accrued daily and bond discounts are accreted and premiums are amortized daily. To the extent debt obligations are placed onnon-accrual status, any related interest income may be reduced by writing off interest receivables when the collection of all or a portion of interest has been determined to be doubtful based on consistently applied procedures and the fair value has decreased. If the issuer subsequently resumes interest payments or when the collectability of interest is reasonably assured, the debt obligation is removed fromnon-accrual status.
Income from foreign securities is recorded net of foreign taxes withheld where recovery of such taxes is not assured.
Distributions to shareholders
Distributions to shareholders from net investment income are declared daily and paid monthly. Distributions from net realized gains, if any, are recorded on theex-dividend date and paid at least annually. Such distributions are determined in accordance with income tax regulations and may differ from U.S. generally accepted accounting principles. Dividend sources are estimated at the time of declaration. The tax character of distributions is determined as of the Fund’s fiscal year end. Therefore, a portion of the Fund’s distributions made prior to the Fund’s fiscal year end may be categorized as a tax return of capital at year end.
Federal and other taxes
The Fund intends to continue to qualify as a regulated investment company by distributing substantially all of its investment company taxable income and any net realized capital gains (after reduction for capital loss carryforwards) sufficient to relieve it from all, or substantially all, federal income taxes. Accordingly, no provision for federal income taxes was required.
The Fund’s income and federal excise tax returns and all financial records supporting those returns for the prior three fiscal years are subject to examination by the federal and Delaware revenue authorities. Management has analyzed the Fund’s tax positions taken on federal, state, and foreign tax returns for all open tax years and does not believe that there are any uncertain tax positions that require recognition of a tax liability.
Wells Fargo Conservative Income Fund | 17
Notes to financial statements (unaudited)
As of February 29, 2020, the aggregate cost of all investments for federal income tax purposes was $478,830,335 and the unrealized gains (losses) consisted of:
| | | | |
| |
Gross unrealized gains | | $ | 1,395,209 | |
| |
Gross unrealized losses | | | (110,264 | ) |
| |
Net unrealized gains | | $ | 1,284,945 | |
As of August 31, 2019, the Fund had a capital loss carryforward which consisted of $1,770,871 in short-term capital losses.
3. FAIR VALUATION MEASUREMENTS
Fair value measurements of investments are determined within a framework that has established a fair value hierarchy based upon the various data inputs utilized in determining the value of the Fund’s investments. The three-level hierarchy gives the highest priority to unadjusted quoted prices in active markets for identical assets or liabilities (Level 1) and the lowest priority to unobservable inputs (Level 3). The Fund’s investments are classified within the fair value hierarchy based on the lowest level of input that is significant to the fair value measurement. The inputs are summarized into three broad levels as follows:
| ∎ | | Level 1 – quoted prices in active markets for identical securities |
| ∎ | | Level 2 – other significant observable inputs (including quoted prices for similar securities, interest rates, prepayment speeds, credit risk, etc.) |
| ∎ | | Level 3 – significant unobservable inputs (including the Fund’s own assumptions in determining the fair value of investments) |
The inputs or methodologies used for valuing investments in securities are not necessarily an indication of the risk associated with investing in those securities.
The following is a summary of the inputs used in valuing the Fund’s assets and liabilities as of February 29, 2020:
| | | | | | | | | | | | | | | | |
| | | | |
| | | Quoted prices
(Level 1) | | | Other significant
observable inputs
(Level 2) | | | Significant
unobservable inputs (Level 3) | | | Total | |
|
| | | | |
Assets | | | | | | | | | | | | | | | | |
Investments in: |
| | | | |
Agency securities | | $ | 0 | | | $ | 14,759,033 | | | $ | 0 | | | $ | 14,759,033 | |
| | | | |
Asset-backed securities | | | 0 | | | | 114,774,346 | | | | 0 | | | | 114,774,346 | |
| | | | |
Corporate bonds and notes | | | 0 | | | | 139,336,225 | | | | 0 | | | | 139,336,225 | |
| | | | |
Municipal obligations | | | 0 | | | | 10,166,486 | | | | 0 | | | | 10,166,486 | |
| | | | |
Yankee corporate bonds and notes | | | 0 | | | | 81,901,666 | | | | 0 | | | | 81,901,666 | |
| | | | |
Short-term investments | | | | | | | | | | | | | | | | |
| | | | |
Commercial paper | | | 0 | | | | 116,659,215 | | | | 0 | | | | 116,659,215 | |
| | | | |
Investment companies | | | 2,518,309 | | | | 0 | | | | 0 | | | | 2,518,309 | |
| | | | |
Total assets | | $ | 2,518,309 | | | $ | 477,596,971 | | | $ | 0 | | | $ | 480,115,280 | |
Additional sector, industry or geographic detail is included in the Portfolio of Investments.
For the six months ended February 29, 2020, the Fund did not have any transfers into/out of Level 3.
18 | Wells Fargo Conservative Income Fund
Notes to financial statements (unaudited)
4. TRANSACTIONS WITH AFFILIATES
Management fee
Funds Management, an indirect wholly owned subsidiary of Wells Fargo & Company (“Wells Fargo”), is the manager of the Fund and provides advisory and fund-level administrative services under an investment management agreement. Under the investment management agreement, Funds Management is responsible for, among other services, implementing the investment objectives and strategies of the Fund, supervising the subadviser and providing fund-level administrative services in connection with the Fund’s operations. As compensation for its services under the investment management agreement, Funds Management is entitled to receive a management fee at the following annual rate based on the Fund’s average daily net assets:
| | | | |
| |
| Average daily net assets | | Management fee | |
| |
First $1 billion | | | 0.250 | % |
| |
Next $4 billion | | | 0.225 | |
| |
Next $5 billion | | | 0.190 | |
| |
Over $10 billion | | | 0.180 | |
For the six months ended February 29, 2020, the management fee was equivalent to an annual rate of 0.25% of the Fund’s average daily net assets.
Funds Management has retained the services of a subadviser to provide daily portfolio management to the Fund. The fee for subadvisory services is borne by Funds Management. Wells Capital Management Incorporated, an affiliate of Funds Management and an indirect wholly owned subsidiary of Wells Fargo, is the subadviser to the Fund and is entitled to receive a fee from Funds Management at an annual rate starting at 0.10% and declining to 0.05% as the average daily net assets of the Fund increase.
Administration fee
Under a class-level administration agreement, Funds Management provides class-level administrative services to the Fund, which includes paying fees and expenses for services provided by the transfer agent,sub-transfer agents, omnibus account servicers and record-keepers. As compensation for its services under the class-level administration agreement, Funds Management receives an annual fee of 0.08% which is calculated based on the average daily net assets of the Institutional Class.
Waivers and/or expense reimbursements
Funds Management has contractually waived and/or reimbursed management and administration fees to the extent necessary to maintain certain net operating expense ratios for the Fund. When the Institutional Class of the Fund has exceeded its expense cap, Funds Management has waived fees and/or reimbursed expenses from fund-level expenses on a proportionate basis and then from class specific expenses. Funds Management has committed through December 31, 2020 to waive fees and/or reimburse expenses to the extent necessary to cap the Fund’s expenses at 0.27% for Institutional Class shares. Prior to or after the commitment expiration date, the cap may be increased or the commitment to maintain the cap may be terminated only with the approval of the Board of Trustees.
Interfund transactions
The Fund may purchase or sell portfolio investment securities to certain other Wells Fargo affiliates pursuant to Rule17a-7 under the 1940 Act and under procedures adopted by the Board of Trustees. The procedures have been designed to ensure that these interfund transactions, which do not incur broker commissions, are effected at current market prices.
5. INVESTMENT PORTFOLIO TRANSACTIONS
Purchases and sales of investments, excluding U.S. government obligations (if any) and short-term securities, for the six months ended February 29, 2020 were $205,980,034 and $105,886,045, respectively.
6. BANK BORROWINGS
The Trust (excluding the money market funds), Wells Fargo Master Trust and Wells Fargo Variable Trust are parties to a $280,000,000 revolving credit agreement whereby the Fund is permitted to use bank borrowings for temporary or emergency purposes, such as to fund shareholder redemption requests. Interest under the credit agreement is charged to the Fund based on a borrowing rate equal to the higher of the Federal Funds rate in effect on that day plus 1.25% or the overnight LIBOR rate in effect on that day plus 1.25%. In addition, an annual commitment fee equal to 0.25% of the unused balance is allocated to each participating fund.
Wells Fargo Conservative Income Fund | 19
Notes to financial statements (unaudited)
For the six months ended February 29, 2020, there were no borrowings by the Fund under the agreement.
7. INDEMNIFICATION
Under the Trust’s organizational documents, the officers and Trustees have been granted certain indemnification rights against certain liabilities that may arise out of performance of their duties to the Trust. Additionally, in the normal course of business, the Trust may enter into contracts with service providers that contain a variety of indemnification clauses. The Trust’s maximum exposure under these arrangements is dependent on future claims that may be made against the Fund and, therefore, cannot be estimated.
8. NEW ACCOUNTING PRONOUNCEMENTS
In August 2018, FASB issued Accounting Standards Update (“ASU”)No. 2018-13, Fair Value Measurement (Topic 820)Disclosure Framework—Changes to the Disclosure Requirements for Fair Value Measurement. ASU2018-13 updates the disclosure requirements for fair value measurements by modifying or removing certain disclosures and adding certain new disclosures. The amendments are effective for fiscal years, and interim periods within those fiscal years, beginning after December 15, 2019. Early adoption is permitted. Management has adopted the removal and modification of disclosures early, as permitted, and will adopt the additional new disclosures at the effective date.
In March 2017, FASB issued ASUNo. 2017-08,Premium Amortization on Purchased Callable Debt Securities. ASU2017-08 shortens the amortization period for certain callable debt securities held at a premium and requires the premium to be amortized to the earliest call date. The amendments do not require an accounting change for securities held at a discount and discounts will continue to be accreted to the maturity date of the security. ASU2017-08 is effective for fiscal years beginning after December 15, 2018 and for interim periods within those fiscal years. During the current reporting period, management of the Fund adopted the change in accounting policy which did not have a material impact to the Fund’s financial statements.
9. SUBSEQUENT EVENT
On March 11, 2020, the World Health Organization announced that it had made the assessment that coronavirus disease 2019(“COVID-19”) is a pandemic. The impacts ofCOVID-19 is adversely affecting the entire global economy, individual companies and investment products, and the market in general. There is significant uncertainty around the extent and duration of business disruptions related toCOVID-19 and the impact may be short term or may last for an extended period of time. The risk of further spreading ofCOVID-19 has led to significant uncertainty and volatility in the financial markets and the value of the Fund and the securities in which the Fund invests have generally been adversely affected by impacts caused byCOVID-19.
20 | Wells Fargo Conservative Income Fund
Other information (unaudited)
PROXY VOTING INFORMATION
A description of the policies and procedures used to determine how to vote proxies relating to portfolio securities is available, upon request, by calling1-800-222-8222, visiting our website atwfam.com, or visiting the SEC website at sec.gov. Information regarding how the proxies related to portfolio securities were voted during the most recent12-month period ended June 30 is available on the website atwfam.comor by visiting the SEC website at sec.gov.
QUARTERLY PORTFOLIO HOLDINGS INFORMATION
The Fund files its complete schedule of portfolio holdings with the SEC for the first and third quarters of each fiscal year as an exhibit to its reports on FormN-PORT. Shareholders may view the filed FormN-PORT by visiting the SEC website at sec.gov.
Wells Fargo Conservative Income Fund | 21
Other information (unaudited)
BOARD OF TRUSTEES AND OFFICERS
Each of the Trustees and Officers1 listed in the table below acts in identical capacities for each fund in the Wells Fargo family of funds, which consists of 146 mutual funds comprising the Wells Fargo Funds Trust, Wells Fargo Variable Trust, Wells Fargo Master Trust and fourclosed-end funds (collectively the “Fund Complex”). This table should be read in conjunction with the Prospectus and the Statement of Additional Information2. The mailing address of each Trustee and Officer is 525 Market Street, 12th Floor, San Francisco, CA 94105. Each Trustee and Officer serves an indefinite term, however, each Trustee serves such term until reaching the mandatory retirement age established by the Trustees.
Independent Trustees
| | | | | | |
Name and
year of birth | | Position held and
length of service* | | Principal occupations during past five years or longer | | Current other
public company or
investment
company
directorships |
| | | |
| William R. Ebsworth (Born 1957) | | Trustee, since 2015 | | Retired. From 1984 to 2013, equities analyst, portfolio manager, research director and chief investment officer at Fidelity Management and Research Company in Boston, Tokyo, and Hong Kong, and retired in 2013 as Chief Investment Officer of Fidelity Strategic Advisers, Inc. where he led a team of investment professionals managing client assets. Prior thereto, Board member of Hong Kong Securities Clearing Co., Hong Kong Options Clearing Corp., the Thailand International Fund, Ltd., Fidelity Investments Life Insurance Company, and Empire Fidelity Investments Life Insurance Company. Audit Committee Chair and Investment Committee Chair of the Vincent Memorial Hospital Endowment(non-profit organization). Mr. Ebsworth is a CFA® charterholder. | | N/A |
| | | |
| Jane A. Freeman (Born 1953) | | Trustee, since 2015; Chair Liaison, since 2018 | | Retired. From 2012 to 2014 and 1999 to 2008, Chief Financial Officer of Scientific Learning Corporation. From 2008 to 2012, Ms. Freeman provided consulting services related to strategic business projects. Prior to 1999, Portfolio Manager at Rockefeller & Co. and Scudder, Stevens & Clark. Board member of the Harding Loevner Funds from 1996 to 2014, serving as both Lead Independent Director and chair of the Audit Committee. Board member of the Russell Exchange Traded Funds Trust from 2011 to 2012 and the chair of the Audit Committee. Ms. Freeman is a Board Member of The Ruth Bancroft Garden(non-profit organization). She is also an inactive Chartered Financial Analyst. | | N/A |
| | | |
| Isaiah Harris, Jr. (Born 1952) | | Trustee, since 2009; Audit Committee Chairman, since 2019 | | Retired. Chairman of the Board of CIGNA Corporation since 2009, and Director since 2005. From 2003 to 2011, Director of Deluxe Corporation. Prior thereto, President and CEO of BellSouth Advertising and Publishing Corp. from 2005 to 2007, President and CEO of BellSouth Enterprises from 2004 to 2005 and President of BellSouth Consumer Services from 2000 to 2003. Emeritus member of the Iowa State University Foundation Board of Governors. Emeritus Member of the Advisory Board of Iowa State University School of Business. Advisory Board Member, Palm Harbor Academy (private school). Advisory Board Member, Child Evangelism Fellowship(non-profit). Mr. Harris is a certified public accountant (inactive status). | | CIGNA Corporation |
| | | |
| Judith M. Johnson (Born 1949) | | Trustee, since 2008; Audit Committee Chairman, from 2009 to 2018 | | Retired. Prior thereto, Chief Executive Officer and Chief Investment Officer of Minneapolis Employees Retirement Fund from 1996 to 2008. Ms. Johnson is an attorney, certified public accountant and a certified managerial accountant. | | N/A |
22 | Wells Fargo Conservative Income Fund
Other information (unaudited)
| | | | | | |
Name and
year of birth | | Position held and
length of service* | | Principal occupations during past five years or longer | | Current other
public company or
investment
company
directorships |
| | | |
| David F. Larcker (Born 1950) | | Trustee, since 2009 | | James Irvin Miller Professor of Accounting at the Graduate School of Business, Stanford University, Director of the Corporate Governance Research Initiative and Senior Faculty of The Rock Center for Corporate Governance since 2006. From 2005 to 2008, Professor of Accounting at the Graduate School of Business, Stanford University. Prior thereto, Ernst & Young Professor of Accounting at The Wharton School, University of Pennsylvania from 1985 to 2005. | | N/A |
| | | |
| Olivia S. Mitchell (Born 1953) | | Trustee, since 2006; Nominating and Governance Committee Chair, since 2018 | | International Foundation of Employee Benefit Plans Professor, Wharton School of the University of Pennsylvania since 1993. Director of Wharton’s Pension Research Council and Boettner Center on Pensions & Retirement Research, and Research Associate at the National Bureau of Economic Research. Previously, Cornell University Professor from 1978 to 1993. | | N/A |
| | | |
| Timothy J. Penny (Born 1951) | | Trustee, since 1996; Chairman, since 2018 | | President and Chief Executive Officer of Southern Minnesota Initiative Foundation, anon-profit organization, since 2007. Member of the Board of Trustees of NorthStar Education Finance, Inc., anon-profit organization, since 2007. | | N/A |
| | | |
| James G. Polisson (Born 1959) | | Trustee, since 2018 | | Retired. Chief Marketing Officer, Source (ETF) UK Services, Ltd, from 2015 to 2017. From 2012 to 2015, Principal of The Polisson Group, LLC, a management consulting, corporate advisory and principal investing company. Chief Executive Officer and Managing Director at Russell Investments, Global Exchange Traded Funds from 2010 to 2012. Managing Director of Barclays Global Investors from 1998 to 2010 and Global Chief Marketing Officer for iShares and Barclays Global Investors from 2000 to 2010. Trustee of the San Francisco Mechanics’ Institute, anon-profit organization, from 2013 to 2015. Board member of the Russell Exchange Traded Fund Trust from 2011 to 2012. Director of Barclays Global Investors Holdings Deutschland GmbH from 2006 to 2009. Mr. Polisson is an attorney and has a retired status with the Massachusetts and District of Columbia Bar Associations. | | N/A |
| | | |
| Pamela Wheelock3 (Born 1959) | | Trustee, since January 2020; previously Trustee from January 2018 to July 2019 | | Board member of the Destination Medical Center Economic Development Agency, Rochester, Minnesota since 2019. Acting Commissioner, Minnesota Department of Human Services, July 2019 through September 2019. Human Services Manager (part-time), Minnesota Department of Human Services, October 2019 through December 2019. Chief Operating Officer, Twin Cities Habitat for Humanity from 2017 to 2019. Vice President of University Services, University of Minnesota from 2012 to 2016. Prior thereto, on the Board of Directors, Governance Committee and Finance Committee for the Minnesota Philanthropy Partners (Saint Paul Foundation) from 2012 to 2018, Interim Chief Executive Officer of Blue Cross Blue Shield of Minnesota from 2011 to 2012, Chairman of the Board from 2009 to 2012 and Board Director from 2003 to 2015. Vice President, Leadership and Community Engagement, Bush Foundation, Saint Paul, Minnesota (a private foundation) from 2009 to 2011. Executive Vice President and Chief Financial Officer, Minnesota Sports and Entertainment from 2004 to 2009 and Senior Vice President from 2002 to 2004. Executive Vice President of the Minnesota Wild Foundation from 2004 to 2008. Commissioner of Finance, State of Minnesota, from 1999 to 2002. Currently Board Chair of the Minnesota Wild Foundation since 2010. | | N/A |
| * | Length of service dates reflect the Trustee’s commencement of service with the Trust’s predecessor entities, where applicable. |
Wells Fargo Conservative Income Fund | 23
Other information (unaudited)
Officers
| | | | |
Name and
year of birth | | Position held and
length of service | | Principal occupations during past five years or longer |
| | |
| Andrew Owen (Born 1960) | | President, since 2017 | | Executive Vice President of Wells Fargo & Company and Head of Affiliated Managers, Wells Fargo Asset Management, since 2014. In addition, Mr. Owen is currently President, Chief Executive Officer and Director of Wells Fargo Funds Management, LLC since 2017. Prior thereto, Executive Vice President responsible for marketing, investments and product development for Wells Fargo Funds Management, LLC, from 2009 to 2014. |
| | |
| Nancy Wiser1 (Born 1967) | | Treasurer, since 2012 | | Executive Vice President of Wells Fargo Funds Management, LLC since 2011. Chief Operating Officer and Chief Compliance Officer at LightBox Capital Management LLC, from 2008 to 2011. |
| | |
| Michelle Rhee (Born 1966) | | Chief Legal Officer, since 2019 | | Secretary of Wells Fargo Funds Management, LLC, Chief Legal Counsel of Wells Fargo Asset Management and Assistant General Counsel of Wells Fargo Bank, N.A. since 2018. Associate General Counsel and Managing Director of Bank of America Corporation from 2004 to 2018. |
| | |
| Catherine Kennedy (Born 1969) | | Secretary, since 2019 | | Vice President of Wells Fargo Funds Management, LLC and Senior Counsel of the Wells Fargo Legal Department since 2010. Vice President and Senior Counsel of Evergreen Investment Management Company, LLC from 1998 to 2010. |
| | |
| Michael H. Whitaker(Born 1967) | | Chief Compliance Officer, since 2016 | | Chief Compliance Officer of Wells Fargo Asset Management since 2016. Senior Vice President and Chief Compliance Officer for Fidelity Investments from 2007 to 2016. |
| | |
| David Berardi (Born 1975) | | Assistant Treasurer, since 2009 | | Vice President of Wells Fargo Funds Management, LLC since 2009. Vice President of Evergreen Investment Management Company, LLC from 2008 to 2010. Manager of Fund Reporting and Control for Evergreen Investment Management Company, LLC from 2004 to 2010. |
| | |
| Jeremy DePalma1 (Born 1974) | | Assistant Treasurer, since 2009 | | Senior Vice President of Wells Fargo Funds Management, LLC since 2009. Senior Vice President of Evergreen Investment Management Company, LLC from 2008 to 2010 and head of the Fund Reporting and Control Team within Fund Administration from 2005 to 2010. |
| 1 | Nancy Wiser acts as Treasurer of 64 funds in the Fund Complex. Jeremy DePalma acts as Treasurer of 82 funds and Assistant Treasurer of 64 funds in the Fund Complex. |
| 2 | The Statement of Additional Information includes additional information about the Trustees and is available, without charge, upon request, by calling1-800-222-8222 or by visiting the website atwfam.com. |
| 3 | Pamela Wheelock wasre-appointed to the Board effective January 1, 2020. |
24 | Wells Fargo Conservative Income Fund

For more information
More information about Wells Fargo Funds is available free upon request. To obtain literature, please write, visit the Fund’s website, or call:
Wells Fargo Funds
P.O. Box 219967
Kansas City, MO 64121-9967
Website:wfam.com
Individual investors:1-800-222-8222
Retail investment professionals:1-888-877-9275
Institutional investment professionals:1-866-765-0778

This report and the financial statements contained herein are submitted for the general information of the shareholders of the Fund. If this report is used for promotional purposes, distribution of the report must be accompanied or preceded by a current prospectus. Before investing, please consider the investment objectives, risks, charges, and expenses of the investment. For a current prospectus and, if available, a summary prospectus, containing this information, call1-800-222-8222 or visit the Fund’s website atwfam.com. Read the prospectus carefully before you invest or send money.
Wells Fargo Asset Management (WFAM) is the trade name for certain investment advisory/management firms owned by Wells Fargo & Company. These firms include but are not limited to Wells Capital Management Incorporated and Wells Fargo Funds Management, LLC. Certain products managed by WFAM entities are distributed by Wells Fargo Funds Distributor, LLC (a broker-dealer and Member FINRA).
This material is for general informational and educational purposes only and is NOT intended to provide investment advice or a recommendation of any kind—including a recommendation for any specific investment, strategy, or plan.
INVESTMENT PRODUCTS: NOT FDIC INSURED ◾ NO BANK GUARANTEE ◾ MAY LOSE VALUE
© 2020 Wells Fargo & Company. All rights reserved
PAR-0220-04689 04-20
SA265/SAR265 02-20
ITEM 2. CODE OF ETHICS
Not applicable.
ITEM 3. AUDIT COMMITTEE FINANCIAL EXPERT
Not applicable.
ITEM 4. PRINCIPAL ACCOUNTANT FEES AND SERVICES
Not applicable.
ITEM 5. AUDIT COMMITTEE OF LISTED REGISTRANTS
Not applicable.
ITEM 6. INVESTMENTS
A Portfolio of Investments for each series of Wells Fargo Funds Trust is included as part of the report to shareholders filed under Item 1 of this Form.
ITEM 7. DISCLOSURE OF PROXY VOTING POLICIES AND PROCEDURES FORCLOSED-END MANAGEMENT INVESTMENT COMPANIES
Not applicable.
ITEM 8. PORTFOLIO MANAGERS OFCLOSED-END MANAGEMENT INVESTMENT COMPANIES
Not applicable.
ITEM 9. PURCHASES OF EQUITY SECURITIES BYCLOSED-END MANAGEMEENT INVESTMENT COMPANY AND AFFILIATED PURCHASERS
Not applicable.
ITEM 10. SUBMISSION OF MATTERS TO A VOTE OF SECURITY HOLDERS
There have been no material changes to the procedures by which shareholders may recommend nominees to the registrant’s Board of Trustees that have been implemented since the registrant’s last provided disclosure in response to the requirements of this Item.
ITEM 11. CONTROLS AND PROCEDURES
(a) The President and Treasurer have concluded that the Wells Fargo Funds Trust disclosure controls and procedures (as defined in Rule30a-3(c) under the Investment Company Act of 1940) provide reasonable assurances that material information relating to the registrant is made known to them by the appropriate persons, based on their evaluation of these controls and procedures as of a date within 90 days of the filing of this report.
(b) There were no significant changes in the registrant’s internal controls over financial reporting (as defined in Rule30a-3(d) under the Investment Company Act of 1940) that occurred during the most recent fiscal half-year of the period covered by this report that materially affected, or is reasonably likely to materially affect, the registrant’s internal control over financial reporting.
ITEM 12. DISCLOSURES OF SECURITIES LENDING ACTIVITES FOR CLOSED-END MANAGEMENT INVESTMENT COMPANIES
Not applicable.
ITEM 13. EXHIBITS
SIGNATURES
Pursuant to the requirements of the Securities Exchange Act of 1934 and the Investment Company Act of 1940, the registrant has duly caused this report to be signed on its behalf by the undersigned, thereunto duly authorized.
| | |
| Wells Fargo Funds Trust |
| |
| By: | | /s/ Andrew Owen |
| |
| | Andrew Owen |
| | President |
|
| Date: April 28, 2020 |
Pursuant to the requirements of the Securities Exchange Act of 1934 and the Investment Company Act of 1940, this report has been signed below by the following persons on behalf of the registrant and in the capacities and on the date indicated.
| | |
| Wells Fargo Funds Trust |
| |
| By: | | /s/ Andrew Owen |
| |
| | Andrew Owen |
| | President |
|
| Date: April 28, 2020 |
| |
| By: | | /s/ Nancy Wiser |
| |
| | Nancy Wiser |
| | Treasurer |
|
| Date: April 28, 2020 |