
UNITED STATES
SECURITIES AND EXCHANGE COMMISSION
Washington, D.C. 20549
FORMN-CSRS
CERTIFIED SHAREHOLDER REPORT OF REGISTERED
MANAGEMENT INVESTMENT COMPANIES
Investment Company Act file number:811-09253
Wells Fargo Funds Trust
(Exact name of registrant as specified in charter)
525 Market St., San Francisco, CA 94105
(Address of principal executive offices) (Zip code)
Catherine Kennedy
Wells Fargo Funds Management, LLC
525 Market St., San Francisco, CA 94105
(Name and address of agent for service)
Registrant’s telephone number, including area code:800-222-8222
Date of fiscal year end: September 30
Registrant is making a filing for 12 of its series:
Wells Fargo Diversified Capital Builder Fund, Wells Fargo Diversified Income Builder Fund, Wells Fargo Index Asset Allocation Fund, Wells Fargo International Bond Fund, Wells Fargo Strategic Income Fund, Wells Fargo Global Investment Grade Credit Fund, Wells Fargo C&B Mid Cap Value Fund, Wells Fargo Common Stock Fund, Wells Fargo Discovery Fund, Wells Fargo Enterprise Fund, Wells Fargo Opportunity Fund, and Wells Fargo Special Mid Cap Value Fund.
Date of reporting period: March 31, 2020
| ITEM 1. | REPORT TO STOCKHOLDERS |
Semi-Annual Report
March 31, 2020
Wells Fargo
Diversified Capital Builder Fund
Beginning on January 1, 2021, as permitted by new regulations adopted by the Securities and Exchange Commission, paper copies of the Wells Fargo Funds’ annual and semi-annual shareholder reports issued after this date will no longer be sent by mail, unless you specifically request paper copies of the reports. Instead, the reports will be made available on the Funds’ website, and you will be notified by mail each time a report is posted and provided with a website address to access the report.
If you already elected to receive shareholder reports electronically, you will not be affected by this change and you need not take any action. You may elect to receive shareholder reports and other communications from the Fund electronically at any time by contacting your financial intermediary (such as a broker-dealer or bank) or, if you are a direct investor, by calling1-800-222-8222 or by enrolling at wellsfargo.com/advantagedelivery.
You may elect to receive all future reports in paper free of charge. If you invest through a financial intermediary, you can contact your financial intermediary to request that you continue to receive paper copies of your shareholder reports; if you invest directly with the Fund, you can call 1-800-222-8222. Your election to receive reports in paper will apply to all Wells Fargo Funds held in your account with your financial intermediary or, if you are a direct investor, to all Wells Fargo Funds that you hold.
|
|
|
Reduce clutter. Save trees. |
Sign up for electronic delivery of prospectuses and shareholder reports atwellsfargo.com/advantagedelivery |
The views expressed and any forward-looking statements are as of March 31, 2020, unless otherwise noted, and are those of the Fund managers and/or Wells Fargo Asset Management. Discussions of individual securities, or the markets generally, or any Wells Fargo Fund are not intended as individual recommendations. Future events or results may vary significantly from those expressed in any forward-looking statements. The views expressed are subject to change at any time in response to changing circumstances in the market. Wells Fargo Asset Management and the Fund disclaim any obligation to publicly update or revise any views expressed or forward-looking statements.
INVESTMENT PRODUCTS: NOT FDIC INSURED ◾ NO BANK GUARANTEE ◾ MAY LOSE VALUE
Wells Fargo Diversified Capital Builder Fund | 1
Letter to shareholders (unaudited)

Andrew Owen
President
Wells Fargo Funds
“The period began with mixed data, leading to central bank support.”
Dear Shareholder:
We are pleased to offer you this semi-annual report for the Wells Fargo Diversified Capital Builder Fund for thesix-month period that ended March 31, 2020. Global stock markets saw earlier gains erased in February and March as governments took unprecedented measures to stop the spread of the coronavirus at the expense of short-term economic output. Fixed-income markets were less battered, with U.S. government bonds achieving modest gains as central banks attempted to bolster capital markets and confidence.
For the period, U.S. stocks, based on the S&P 500 Index,1 returned-12.31% and international stocks, as measured by the MSCI ACWI ex USA Index (Net),2 fell 16.52%. The MSCI EM Index (Net)3 lost 14.55%. For bond investors, the Bloomberg Barclays U.S. Aggregate Bond Index4 added 3.33%, the Bloomberg Barclays Global Aggregateex-USD Index5 returned-2.03%, the Bloomberg Barclays Municipal Bond Index6 gained a modest 0.10%, and the ICE BofA U.S. High Yield Index7 returned-10.86%.
The period began with mixed data, leading to central bank support.
As the fourth quarter of 2019 started, U.S.-China trade tensions were relaxing while optimism grew for a U.K. Brexit deal. The initial estimate of U.S. third-quarter gross domestic product growth was a resilient 1.9% annualized rate, while the U.S. unemployment rate fell to a50-year low of 3.5% in September. Despite resilience among U.S. consumers, however, business confidence declined while manufacturing activity contracted. Concerned with a potential economic slowdown, the U.S. Federal Reserve (Fed) lowered interest rates a quarter point in late October—its third rate cut in four months. This helped push the S&P 500 Index to anall-time high while emerging market equities rallied and global bonds declined overall, reflecting a broad pickup in risk appetite.
Equity markets rallied in November despite ongoing geopolitical risks. Hopes for aU.S.-China trade deal buoyed investor confidence. U.S. business sentiment edged up, and manufacturing and services activity rose. With that positive backdrop, developed market equities outpaced those in emerging markets, and U.S. stocks outperformednon-U.S. stocks overall. While consumer confidence and purchasing manager activity rose in the eurozone, China reported weakening manufacturing and consumer data. Bond yields rose marginally, leading to slightly negative returns for global government and investment-grade corporate bonds.
Financial markets ended 2019 with a boost from the U.S. and China accord on a Phase One trade deal. That, along with the landslide win by thepro-Brexit U.K. Conservative
| 1 | The S&P 500 Index consists of 500 stocks chosen for market size, liquidity, and industry group representation. It is a market-value-weighted index with each stock’s weight in the index proportionate to its market value. You cannot invest directly in an index. |
| 2 | The Morgan Stanley Capital International (MSCI) All Country World Index (ACWI) ex USA Index (Net) is a free-float-adjusted market-capitalization-weighted index that is designed to measure the equity market performance of developed markets, excluding the United States. Source: MSCI. MSCI makes no express or implied warranties or representations and shall have no liability whatsoever with respect to any MSCI data contained herein. The MSCI data may not be further redistributed or used as a basis for other indices or any securities or financial products. This report is not approved, reviewed, or produced by MSCI. You cannot invest directly in an index. |
| 3 | The MSCI Emerging Markets (EM) Index (Net) is a free-float-adjusted market-capitalization-weighted index that is designed to measure equity market performance of emerging markets. You cannot invest directly in an index. |
| 4 | The Bloomberg Barclays U.S. Aggregate Bond Index is a broad-based benchmark that measures the investment-grade, U.S. dollar-denominated, fixed-rate taxable bond market, including Treasuries, government-related and corporate securities, mortgage-backed securities (agency fixed-rate and hybrid adjustable-rate mortgage pass-throughs), asset-backed securities, and commercial mortgage-backed securities. You cannot invest directly in an index. |
| 5 | The Bloomberg Barclays Global Aggregateex-USD Index is an unmanaged index that provides a broad-based measure of the global investment-grade fixed-income markets excluding the U.S. dollar-denominated debt market. You cannot invest directly in an index. |
| 6 | The Bloomberg Barclays Municipal Bond Index is an unmanaged index composed of long-termtax-exempt bonds with a minimum credit rating of Baa. You cannot invest directly in an index. |
| 7 | The ICE BofA U.S. High Yield Index is a market-capitalization-weighted index of domestic and Yankee high-yield bonds. The index tracks the performance of high-yield securities traded in the U.S. bond market. You cannot invest directly in an index. Copyright 2020. ICE Data Indices, LLC. All rights reserved. |
2 | Wells Fargo Diversified Capital Builder Fund
Letter to shareholders (unaudited)
Party in a national election and ongoing central bank support, gave investors greater confidence. U.S. economic indicators were positive overall, with the exception of manufacturing activity and business confidence. Consumer confidence was resilient, fed by a robust labor market, tame inflation, and lower interest rates, which boosted housing affordability and stimulated homebuyer activity. The impeachment of U.S. President Donald Trump had little impact on markets. Meanwhile, slowing Chinese economic activity, partly attributable to the trade war, led to further government stimulus atyear-end through lower reserve ratios, allowing banks to lend more money.
Theyear-end rally continued in early January 2020. However, capital market volatility spiked in late January on concerns over the potential impact of the coronavirus on the global economy and stock markets. With sentiment somewhat souring, perceived safe havens did well in January. The U.S. dollar and Japanese yen both rose, and government bonds outperformed equities. While the S&P 500 Index held its ground, emerging market equities tumbled, including those in Asia.
In February, the coronavirus became the major market focus. Fears of the virus’s impact on global growth led to expectations of increased global central bank monetary policy support. That led the10-year U.S. Treasury yield to fall to anall-time low of 1.1% by the end of the month. Although equity markets initially shrugged off concerns about the outbreak, focusing instead on strong fourth-quarter earnings and improving business confidence in January, market sentiment turned sharply lower towardmonth- end. Oil prices tumbled as Russia and the Organization of the Petroleum Exporting Countries compounded a major decline in oil demand with a brutal price war, causing the price of West Texas Intermediate crude oil to fall 13% in February alone.
The global spread of the coronavirus led many countries to clamp down on social and business-related activity in order to contain the virus from causing even greater devastation and overwhelming the health care system. This abrupt stoppage of economic activity led to the sharp deceleration of global output, sending economies into a deep contraction. Central bank responses were swift, as they slashed interest rates and expanded quantitative easing programs to restore liquidity and confidence to the markets. In the U.S., the Fed launched several lending programs, funding investment-grade bonds, money market mutual funds, and commercial paper while purchasing Treasuries, mortgage-backed securities, and overnight repos. Meanwhile, stock markets tumbled quickly into a bear market, ending the longest bull stock market in U.S. history.
Don’t let short-term uncertainty derail long-term investment goals.
Periods of investment uncertainty can present challenges, but experience has taught us that maintaining long-term investment goals can be an effective way to plan for the future. To help you create a sound strategy based on your personal goals and risk tolerance, Wells Fargo Funds offers more than 100 mutual funds spanning a wide range of asset classes and investment styles. Although diversification cannot guarantee an investment profit or prevent losses, we believe it can be an effective way to manage investment risk and potentially smooth out overall portfolio performance. We encourage investors to know their investments and to understand that appropriate levels of risk-taking may unlock opportunities.
Thank you for choosing to invest with Wells Fargo Funds. We appreciate your confidence in us and remain committed to helping you meet your financial needs.
Sincerely,

Andrew Owen
President
Wells Fargo Funds
“Capital market volatility spiked in late January on concerns over the potential impact of the coronavirus on the global economy and stock markets.”
|
|
|
For further information about your Fund, contact your investment professional, visit our website at wfam.com, or call us directly at1-800-222-8222. |
Wells Fargo Diversified Capital Builder Fund | 3
Performance highlights (unaudited)
Investment objective
The Fund seeks long-term total return, consisting of capital appreciation and current income.
Manager
Wells Fargo Funds Management, LLC
Subadviser
Wells Capital Management Incorporated
Portfolio managers
Robert Junkin
Margaret Patel
Average annual total returns (%) as of March 31, 20201
| | | | | | | | | | | | | | | | | | | | | | | | | | | | | | | | | | |
| | | | |
| | | | | Including sales charge | | | Excluding sales charge | | | Expense ratios2 (%) | |
| | | | | | | | | |
| | | Inception date | | 1 year | | | 5 year | | | 10 year | | | 1 year | | | 5 year | | | 10 year | | | Gross | | | Net3 | |
| | | | | | | | | | |
| Class A (EKBAX) | | 1-20-1998 | | | -13.81 | | | | 4.10 | | | | 8.25 | | | | -8.53 | | | | 5.34 | | | | 8.90 | | | | 1.12 | | | | 1.12 | |
| | | | | | | | | | |
| Class C (EKBCX) | | 1-22-1998 | | | -10.25 | | | | 4.53 | | | | 8.07 | | | | -9.25 | | | | 4.53 | | | | 8.07 | | | | 1.87 | | | | 1.87 | |
| | | | | | | | | | |
| Administrator Class (EKBDX)4 | | 7-30-2010 | | | – | | | | – | | | | – | | | | -8.46 | | | | 5.44 | | | | 9.09 | | | | 1.04 | | | | 1.04 | |
| | | | | | | | | | |
| Institutional Class (EKBYX) | | 1-26-1998 | | | – | | | | – | | | | – | | | | -8.30 | | | | 5.68 | | | | 9.31 | | | | 0.79 | | | | 0.78 | |
| | | | | | | | | | |
| Diversified Capital Builder Blended Index5 | | – | | | – | | | | – | | | | – | | | | -7.76 | | | | 5.41 | | | | 9.24 | | | | – | | | | – | |
| | | | | | | | | | |
| ICE BofA U.S. Cash Pay High Yield Index6 | | – | | | – | | | | – | | | | – | | | | -7.40 | | | | 2.68 | | | | 5.49 | | | | – | | | | – | |
| | | | | | | | | | |
| Russell 1000® Index7 | | – | | | – | | | | – | | | | – | | | | -8.03 | | | | 6.22 | | | | 10.39 | | | | – | | | | – | |
Figures quoted represent past performance, which is no guarantee of future results, and do not reflect taxes that a shareholder may pay on an investment in a fund. Investment return and principal value of an investment will fluctuate so that an investor’s shares, when redeemed, may be worth more or less than their original cost. Performance shown without sales charges would be lower if sales charges were reflected. Current performance may be lower or higher than the performance data quoted, which assumes the reinvestment of dividends and capital gains. Currentmonth-end performance is available on the Fund’s website,wfam.com
Index returns do not include transaction costs associated with buying and selling securities, any mutual fund fees or expenses, or any taxes. It is not possible to invest directly in an index.
For Class A shares, the maximumfront-end sales charge is 5.75%. For Class C shares, the maximum contingent deferred sales charge is 1.00%. Performance including a contingent deferred sales charge assumes the sales charge for the corresponding time period. Administrator Class and Institutional Class shares are sold without afront-end sales charge or contingent deferred sales charge.
Balanced funds may invest in stocks and bonds. Stock values fluctuate in response to the activities of individual companies and general market and economic conditions. Bond values fluctuate in response to the financial condition of individual issuers, general market and economic conditions, and changes in interest rates. Changes in market conditions and government policies may lead to periods of heightened volatility in the bond market and reduced liquidity for certain bonds held by the Fund. In general, when interest rates rise, bond values fall and investors may lose principal value. Interest rate changes and their impact on the Fund and its share price can be sudden and unpredictable. Certain investment strategies tend to increase the total risk of an investment (relative to the broader market). The Fund is exposed to foreign investment risk, high-yield securities risk, and smaller-company securities risk. Consult the Fund’s prospectus for additional information on these and other risks.
Please see footnotes on page 5.
4 | Wells Fargo Diversified Capital Builder Fund
Performance highlights (unaudited)
| | | | |
|
| Ten largest holdings (%) as of March 31, 20208 | |
| | |
Adobe Incorporated | | | 4.45 | |
| | |
Bristol-Myers Squibb Company | | | 3.99 | |
| | |
Broadcom Incorporated | | | 3.98 | |
| | |
Leidos Holdings Incorporated | | | 3.59 | |
| | |
Akamai Technologies Incorporated | | | 3.48 | |
| | |
Vistra Energy Corporation | | | 2.77 | |
| | |
Crown Castle International Corporation | | | 2.74 | |
| | |
Atmos Energy Corporation | | | 2.72 | |
| | |
L3Harris Technologies Incorporated | | | 2.62 | |
| | |
Amphenol Corporation Class A | | | 2.44 | |
|
|
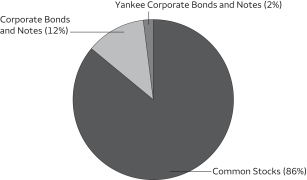
| Portfolio composition as of March 31, 20209 |
|
 |
| 1 | Historical performance prior to July 12, 2010, is based on the performance of the Fund’s predecessor, Evergreen Diversified Capital Builder Fund. |
| 2 | Reflects the expense ratios as stated in the most recent prospectuses. The expense ratios shown are subject to change and may differ from the annualized expense ratios shown in the financial highlights of this report. |
| 3 | The manager has contractually committed through January 31, 2021, to waive fees and/or reimburse expenses to the extent necessary to cap total annual fund operating expenses after fee waivers at 1.13% for Class A, 1.88% for Class C, 1.05% for Administrator Class, and 0.78% for Institutional Class. Brokerage commissions, stamp duty fees, interest, taxes, acquired fund fees and expenses (if any), and extraordinary expenses are excluded from the expense cap. Prior to or after the commitment expiration date, the cap may be increased or the commitment to maintain the cap may be terminated only with the approval of the Board of Trustees. Without this cap, the Fund’s returns would have been lower. The expense ratio paid by an investor is the net expense ratio (the total annual fund operating expenses after fee waivers) as stated in the prospectuses. |
| 4 | Historical performance shown for the Administrator Class shares prior to their inception reflects the performance of the Institutional Class shares and has been adjusted to reflect the higher expenses applicable to the Administrator Class shares. |
| 5 | Source: Wells Fargo Funds Management, LLC. The Diversified Capital Builder Blended Index is composed 75% of the Russell 1000® Index and 25% of the ICE BofA U.S. Cash Pay High Yield Index. You cannot invest directly in an index. |
| 6 | The ICE BofA U.S. Cash Pay High Yield Index is an unmanaged market index that provides a broad-based performance measure of thenon-investment grade U.S. domestic bond index. You cannot invest directly in an index. Copyright 2020. ICE Data Indices, LLC. All rights reserved. |
| 7 | The Russell 1000® Index measures the performance of the 1,000 largest companies in the Russell 3000® Index, which represents approximately 92% of the total market capitalization of the Russell 3000® Index. You cannot invest directly in an index. |
| 8 | The ten largest holdings, excluding cash, cash equivalents and any money market funds, are calculated based on the value of the investments divided by total net assets of the Fund. Holdings are subject to change and may have changed since the date specified. |
| 9 | Amounts are calculated based on the total long-term investments of the Fund. These amounts are subject to change and may have changed since the date specified. |
Wells Fargo Diversified Capital Builder Fund | 5
Fund expenses (unaudited)
As a shareholder of the Fund, you incur two types of costs: (1) transaction costs, including sales charges (loads) on purchase payments and contingent deferred sales charges (if any) on redemptions and (2) ongoing costs, including management fees, distribution(12b-1) and/or shareholder servicing fees, and other Fund expenses. This example is intended to help you understand your ongoing costs (in dollars) of investing in the Fund and to compare these costs with the ongoing costs of investing in other mutual funds.
The example is based on an investment of $1,000 invested at the beginning of thesix-month period and held for the entire period from October 1, 2019 to March 31, 2020.
Actual expenses
The “Actual” line of the table below provides information about actual account values and actual expenses. You may use the information in this line, together with the amount you invested, to estimate the expenses that you paid over the period. Simply divide your account value by $1,000 (for example, an $8,600 account value divided by $1,000 = 8.6), then multiply the result by the number in the “Actual” line under the heading entitled “Expenses paid during period” for your applicable class of shares to estimate the expenses you paid on your account during this period.
Hypothetical example for comparison purposes
The “Hypothetical” line of the table below provides information about hypothetical account values and hypothetical expenses based on the Fund’s actual expense ratio and an assumed rate of return of 5% per year before expenses, which is not the Fund’s actual return. The hypothetical account values and expenses may not be used to estimate the actual ending account balance or expenses you paid for the period. You may use this information to compare the ongoing costs of investing in the Fund and other funds. To do so, compare this 5% hypothetical example with the 5% hypothetical examples that appear in the shareholder reports of the other funds.
Please note that the expenses shown in the table are meant to highlight your ongoing costs only and do not reflect any transactional costs, such as sales charges (loads) and contingent deferred sales charges. Therefore, the “Hypothetical” line of the table is useful in comparing ongoing costs only and will not help you determine the relative total costs of owning different funds. In addition, if these transactional costs were included, your costs would have been higher.
| | | | | | | | | | | | | | | | |
| | | Beginning
account value
10-1-2019 | | | Ending
account value
3-31-2020 | | | Expenses
paid during
the period¹ | | | Annualized net
expense ratio | |
| | | | | |
Class A | | | | | | | | | | | | | | | | |
| | | | |
Actual | | $ | 1,000.00 | | | $ | 860.71 | | | $ | 5.12 | | | | 1.10 | % |
| | | | |
Hypothetical (5% return before expenses) | | $ | 1,000.00 | | | $ | 1,019.50 | | | $ | 5.55 | | | | 1.10 | % |
| | | | | |
Class C | | | | | | | | | | | | | | | | |
| | | | |
Actual | | $ | 1,000.00 | | | $ | 856.97 | | | $ | 8.63 | | | | 1.86 | % |
| | | | |
Hypothetical (5% return before expenses) | | $ | 1,000.00 | | | $ | 1,015.70 | | | $ | 9.37 | | | | 1.86 | % |
| | | | | |
Administrator Class | | | | | | | | | | | | | | | | |
| | | | |
Actual | | $ | 1,000.00 | | | $ | 861.25 | | | $ | 4.79 | | | | 1.03 | % |
| | | | |
Hypothetical (5% return before expenses) | | $ | 1,000.00 | | | $ | 1,019.85 | | | $ | 5.20 | | | | 1.03 | % |
| | | | | |
Institutional Class | | | | | | | | | | | | | | | | |
| | | | |
Actual | | $ | 1,000.00 | | | $ | 861.25 | | | $ | 3.63 | | | | 0.78 | % |
| | | | |
Hypothetical (5% return before expenses) | | $ | 1,000.00 | | | $ | 1,021.10 | | | $ | 3.94 | | | | 0.78 | % |
| 1 | Expenses paid is equal to the annualized net expense ratio of each class multiplied by the average account value over the period, multiplied by the number of days in the most recent fiscal half-year divided by the number of days in the fiscal year (to reflect theone-half-year period). |
6 | Wells Fargo Diversified Capital Builder Fund
Portfolio of investments—March 31, 2020 (unaudited)
| | | | | | | | | | | | | | | | |
| | | | | | | | | Shares | | | Value | |
| Common Stocks: 85.22% | | | | | | | | | | | | | | | | |
| | | | |
Communication Services: 0.52% | | | | | | | | | | | | | | | | |
| | | | |
| Interactive Media & Services: 0.52% | | | | | | | | | | | | |
Alphabet Incorporated Class A † | | | | | | | | | | | 4,000 | | | $ | 4,647,800 | |
| | | | | | | | | | | | | | | | |
| | | | |
Consumer Discretionary: 0.63% | | | | | | | | | | | | | | | | |
| | | | |
| Specialty Retail: 0.63% | | | | | | | | | | | | |
The Home Depot Incorporated | | | | | | | | | | | 30,000 | | | | 5,601,300 | |
| | | | | | | | | | | | | | | | |
| | | | |
Consumer Staples: 0.32% | | | | | | | | | | | | | | | | |
| | | | |
| Food Products: 0.32% | | | | | | | | | | | | |
Lamb Weston Holdings Incorporated | | | | | | | | | | | 50,001 | | | | 2,855,057 | |
| | | | | | | | | | | | | | | | |
| | | | |
Energy: 0.38% | | | | | | | | | | | | | | | | |
| | | | |
| Oil, Gas & Consumable Fuels: 0.38% | | | | | | | | | | | | |
ONEOK Incorporated | | | | | | | | | | | 155,000 | | | | 3,380,550 | |
| | | | | | | | | | | | | | | | |
| | | | |
Health Care: 17.85% | | | | | | | | | | | | | | | | |
| | | | |
| Biotechnology: 3.42% | | | | | | | | | | | | |
AbbVie Incorporated | | | | | | | | | | | 120,000 | | | | 9,142,800 | |
Amgen Incorporated | | | | | | | | | | | 55,000 | | | | 11,150,150 | |
Neurocrine Biosciences Incorporated † | | | | | | | | | | | 50,000 | | | | 4,327,500 | |
Vertex Pharmaceuticals Incorporated † | | | | | | | | | | | 25,000 | | | | 5,948,750 | |
| | | | |
| | | | | | | | | | | | | | | 30,569,200 | |
| | | | | | | | | | | | | | | | |
| | | | |
| Health Care Equipment & Supplies: 3.64% | | | | | | | | | | | | |
Abbott Laboratories | | | | | | | | | | | 50,000 | | | | 3,945,500 | |
Becton Dickinson & Company | | | | | | | | | | | 40,000 | | | | 9,190,800 | |
Danaher Corporation | | | | | | | | | | | 140,000 | | | | 19,377,400 | |
ElectroCore LLC † | | | | | | | | | | | 30,000 | | | | 28,500 | |
| | | | |
| | | | | | | | | | | | | | | 32,542,200 | |
| | | | | | | | | | | | | | | | |
| | | | |
| Health Care Providers & Services: 1.37% | | | | | | | | | | | | |
Anthem Incorporated | | | | | | | | | | | 50,000 | | | | 11,352,000 | |
HCA Healthcare Incorporated | | | | | | | | | | | 10,000 | | | | 898,500 | |
| | | | |
| | | | | | | | | | | | | | | 12,250,500 | |
| | | | | | | | | | | | | | | | |
| | | | |
| Life Sciences Tools & Services: 4.19% | | | | | | | | | | | | |
Bio-Rad Laboratories Incorporated Class A † | | | | | | | | | | | 15,000 | | | | 5,258,400 | |
Illumina Incorporated † | | | | | | | | | | | 2,000 | | | | 546,240 | |
IQVIA Holdings Incorporated † | | | | | | | | | | | 110,000 | | | | 11,864,600 | |
Thermo Fisher Scientific Incorporated | | | | | | | | | | | 70,000 | | | | 19,852,000 | |
| | | | |
| | | | | | | | | | | | | | | 37,521,240 | |
| | | | | | | | | | | | | | | | |
| | | | |
| Pharmaceuticals: 5.23% | | | | | | | | | | | | |
Bristol-Myers Squibb Company | | | | | | | | | | | 640,000 | | | | 35,673,600 | |
Horizon Therapeutics plc † | | | | | | | | | | | 100,000 | | | | 2,962,000 | |
Merck KGaA ADR | | | | | | | | | | | 400,000 | | | | 8,160,000 | |
| | | | |
| | | | | | | | | | | | | | | 46,795,600 | |
| | | | | | | | | | | | | | | | |
| | | | |
Industrials: 11.33% | | | | | | | | | | | | | | | | |
| | | | |
| Aerospace & Defense: 5.58% | | | | | | | | | | | | |
Curtiss-Wright Corporation | | | | | | | | | | | 152,100 | | | | 14,055,561 | |
Huntington Ingalls Industries Incorporated | | | | | | | | | | | 50,000 | | | | 9,110,500 | |
The accompanying notes are an integral part of these financial statements.
Wells Fargo Diversified Capital Builder Fund | 7
Portfolio of investments—March 31, 2020 (unaudited)
| | | | | | | | | | | | | | | | |
| | | | | | | | | Shares | | | Value | |
| | | | |
| Aerospace & Defense (continued) | | | | | | | | | | | | |
L3Harris Technologies Incorporated | | | | | | | | | | | 130,000 | | | $ | 23,415,600 | |
Lockheed Martin Corporation | | | | | | | | | | | 10,000 | | | | 3,389,500 | |
| | | | |
| | | | | | | | | | | | | | | 49,971,161 | |
| | | | | | | | | | | | | | | | |
| | | | |
| Electrical Equipment: 1.33% | | | | | | | | | | | | |
AMETEK Incorporated | | | | | | | | | | | 165,000 | | | | 11,883,300 | |
| | | | | | | | | | | | | | | | |
| | | | |
| Industrial Conglomerates: 0.47% | | | | | | | | | | | | |
Honeywell International Incorporated | | | | | | | | | | | 20,000 | | | | 2,675,800 | |
Roper Technologies Incorporated | | | | | | | | | | | 5,000 | | | | 1,559,050 | |
| | | | |
| | | | | | | | | | | | | | | 4,234,850 | |
| | | | | | | | | | | | | | | | |
| | | | |
| Machinery: 3.95% | | | | | | | | | | | | |
Crane Company | | | | | | | | | | | 100,000 | | | | 4,918,000 | |
IDEX Corporation | | | | | | | | | | | 120,000 | | | | 16,573,200 | |
John Bean Technologies Corporation | | | | | | | | | | | 160,000 | | | | 11,883,200 | |
Oshkosh Corporation | | | | | | | | | | | 30,000 | | | | 1,929,900 | |
| | | | |
| | | | | | | | | | | | | | | 35,304,300 | |
| | | | | | | | | | | | | | | | |
| | | | |
Information Technology: 33.99% | | | | | | | | | | | | | | | | |
| | | | |
| Communications Equipment: 1.23% | | | | | | | | | | | | |
Cisco Systems Incorporated | | | | | | | | | | | 280,000 | | | | 11,006,800 | |
| | | | | | | | | | | | | | | | |
| | | | |
| Electronic Equipment, Instruments & Components: 3.86% | | | | | | | | | | | | |
Amphenol Corporation Class A | | | | | | | | | | | 300,000 | | | | 21,864,000 | |
FLIR Systems Incorporated | | | | | | | | | | | 345,000 | | | | 11,002,050 | |
MTS Systems Corporation | | | | | | | | | | | 75,000 | | | | 1,687,500 | |
| | | | |
| | | | | | | | | | | | | | | 34,553,550 | |
| | | | | | | | | | | | | | | | |
| | | | |
| IT Services: 8.98% | | | | | | | | | | | | |
Akamai Technologies Incorporated † | | | | | | | | | | | 340,000 | | | | 31,106,600 | |
Fiserv Incorporated † | | | | | | | | | | | 155,000 | | | | 14,723,450 | |
Leidos Holdings Incorporated | | | | | | | | | | | 350,000 | | | | 32,077,500 | |
MasterCard Incorporated Class A | | | | | | | | | | | 10,000 | | | | 2,415,600 | |
| | | | |
| | | | | | | | | | | | | | | 80,323,150 | |
| | | | | | | | | | | | | | | | |
| | | | |
| Semiconductors & Semiconductor Equipment: 5.06% | | | | | | | | | | | | |
Advanced Micro Devices Incorporated † | | | | | | | | | | | 300,000 | | | | 13,644,000 | |
Analog Devices Incorporated | | | | | | | | | | | 20,000 | | | | 1,793,000 | |
Microchip Technology Incorporated | | | | | | | | | | | 235,000 | | | | 15,933,000 | |
Micron Technology Incorporated † | | | | | | | | | | | 35,000 | | | | 1,472,100 | |
Texas Instruments Incorporated | | | | | | | | | | | 70,000 | | | | 6,995,100 | |
Xilinx Incorporated | | | | | | | | | | | 70,000 | | | | 5,455,800 | |
| | | | |
| | | | | | | | | | | | | | | 45,293,000 | |
| | | | | | | | | | | | | | | | |
| | | | |
| Software: 14.39% | | | | | | | | | | | | |
Adobe Incorporated † | | | | | | | | | | | 125,000 | | | | 39,780,000 | |
ANSYS Incorporated † | | | | | | | | | | | 45,000 | | | | 10,461,150 | |
Broadcom Incorporated | | | | | | | | | | | 150,000 | | | | 35,565,000 | |
Nutanix Incorporated Class A † | | | | | | | | | | | 50,000 | | | | 790,000 | |
Palo Alto Networks Incorporated † | | | | | | | | | | | 55,000 | | | | 9,017,800 | |
Salesforce.com Incorporated † | | | | | | | | | | | 80,000 | | | | 11,518,400 | |
ServiceNow Incorporated † | | | | | | | | | | | 37,000 | | | | 10,603,460 | |
Synopsys Incorporated † | | | | | | | | | | | 85,000 | | | | 10,947,150 | |
| | | | |
| | | | | | | | | | | | | | | 128,682,960 | |
| | | | | | | | | | | | | | | | |
The accompanying notes are an integral part of these financial statements.
8 | Wells Fargo Diversified Capital Builder Fund
Portfolio of investments—March 31, 2020 (unaudited)
| | | | | | | | | | | | | | | | |
| | | | | | | | | Shares | | | Value | |
| Technology Hardware, Storage & Peripherals: 0.47% | | | | | | | | | | | | |
Pure Storage Incorporated Class A † | | | | | | | | | | | 175,000 | | | $ | 2,152,500 | |
Western Digital Corporation | | | | | | | | | | | 50,000 | | | | 2,081,000 | |
| | | | |
| | | | | | | | | | | | | | | 4,233,500 | |
| | | | | | | | | | | | | | | | |
| | | | |
Materials: 6.49% | | | | | | | | | | | | | | | | |
| | | | |
| Chemicals: 4.73% | | | | | | | | | | | | |
Celanese Corporation Series A | | | | | | | | | | | 75,000 | | | | 5,504,250 | |
Eastman Chemical Company | | | | | | | | | | | 80,000 | | | | 3,726,400 | |
Huntsman Corporation | | | | | | | | | | | 630,000 | | | | 9,090,900 | |
LyondellBasell Industries NV Class A | | | | | | | | | | | 280,000 | | | | 13,896,400 | |
The Sherwin-Williams Company | | | | | | | | | | | 17,000 | | | | 7,811,840 | |
Tronox Holdings plc Class A | | | | | | | | | | | 150,000 | | | | 747,000 | |
Westlake Chemical Corporation | | | | | | | | | | | 40,000 | | | | 1,526,800 | |
| | | | |
| | | | | | | | | | | | | | | 42,303,590 | |
| | | | | | | | | | | | | | | | |
| | | | |
| Containers & Packaging: 1.76% | | | | | | | | | | | | |
AptarGroup Incorporated | | | | | | | | | | | 76,500 | | | | 7,614,810 | |
Berry Global Group Incorporated † | | | | | | | | | | | 240,000 | | | | 8,090,400 | |
| | | | |
| | | | | | | | | | | | | | | 15,705,210 | |
| | | | | | | | | | | | | | | | |
| | | | |
Real Estate: 2.95% | | | | | | | | | | | | | | | | |
| | | | |
| Equity REITs: 2.95% | | | | | | | | | | | | |
Crown Castle International Corporation | | | | | | | | | | | 170,000 | | | | 24,548,000 | |
Saul Centers Incorporated | | | | | | | | | | | 57,168 | | | | 1,871,680 | |
| | | | |
| | | | | | | | | | | | | | | 26,419,680 | |
| | | | | | | | | | | | | | | | |
| | | | |
Utilities: 10.76% | | | | | | | | | | | | | | | | |
| | | | |
| Electric Utilities: 2.15% | | | | | | | | | | | | |
American Electric Power Company Incorporated | | | | | | | | | | | 240,000 | | | | 19,195,200 | |
| | | | | | | | | | | | | | | | |
| | | | |
| Gas Utilities: 2.72% | | | | | | | | | | | | |
Atmos Energy Corporation | | | | | | | | | | | 245,297 | | | | 24,340,821 | |
| | | | | | | | | | | | | | | | |
| | | | |
| Independent Power & Renewable Electricity Producers: 2.77% | | | | | | | | | | | | |
Vistra Energy Corporation | | | | | | | | | | | 1,550,000 | | | | 24,738,000 | |
| | | | | | | | | | | | | | | | |
| | | | |
| Multi-Utilities: 3.12% | | | | | | | | | | | | |
CMS Energy Corporation | | | | | | | | | | | 200,000 | | | | 11,750,000 | |
DTE Energy Company | | | | | | | | | | | 160,000 | | | | 15,195,200 | |
NiSource Incorporated | | | | | | | | | | | 40,000 | | | | 998,800 | |
| | | | |
| | | | | | | | | | | | | | | 27,944,000 | |
| | | | | | | | | | | | | | | | |
| | | | |
Total Common Stocks (Cost $765,592,271) | | | | | | | | | | | | | | | 762,296,519 | |
| | | | | | | | | | | | | | | | |
| | | | |
| | | | | | | | | | | | | | | | |
| | | Interest
rate | | | Maturity
date | | | Principal | | | Value | |
| Corporate Bonds and Notes: 11.85% | | | | | | | | | | | | | | | | |
| | | | |
Communication Services: 0.04% | | | | | | | | | | | | | | | | |
| | | | |
| Media: 0.04% | | | | | | | | | | | | |
McGraw-Hill Global Education Holdings LLC 144A | | | 7.88 | % | | | 5-15-2024 | | | $ | 500,000 | | | $ | 372,500 | |
| | | | | | | | | | | | | | | | |
The accompanying notes are an integral part of these financial statements.
Wells Fargo Diversified Capital Builder Fund | 9
Portfolio of investments—March 31, 2020 (unaudited)
| | | | | | | | | | | | | | | | |
| | | Interest
rate | | | Maturity
date | | | Principal | | | Value | |
Consumer Discretionary: 0.29% | | | | | | | | | | | | | | | | |
| | | | |
| Household Durables: 0.29% | | | | | | | | | | | | |
Installed Building Company 144A | | | 5.75 | % | | | 2-1-2028 | | | $ | 2,700,000 | | | $ | 2,571,750 | |
| | | | | | | | | | | | | | | | |
|
Health Care: 2.61% | |
| | | | |
| Health Care Providers & Services: 1.61% | | | | | | | | | | | | |
Davita Incorporated | | | 5.00 | | | | 5-1-2025 | | | | 7,000,000 | | | | 6,990,830 | |
Davita Incorporated | | | 5.13 | | | | 7-15-2024 | | | | 1,000,000 | | | | 997,000 | |
West Street Merger Subordinate Bond Incorporated 144A | | | 6.38 | | | | 9-1-2025 | | | | 7,400,000 | | | | 6,450,580 | |
| | | | |
| | | | | | | | | | | | | | | 14,438,410 | |
| | | | | | | | | | | | | | | | |
|
| Pharmaceuticals: 1.00% | |
Bausch Health Companies Incorporated 144A | | | 5.25 | | | | 1-30-2030 | | | | 8,500,000 | | | | 7,947,500 | |
Catalent Pharma Solutions Incorporated 144A | | | 4.88 | | | | 1-15-2026 | | | | 1,000,000 | | | | 970,000 | |
| | | | |
| | | | | | | | | | | | | | | 8,917,500 | |
| | | | | | | | | | | | | | | | |
|
Industrials: 2.68% | |
|
| Aerospace & Defense: 0.91% | |
TransDigm Group Incorporated | | | 6.38 | | | | 6-15-2026 | | | | 7,000,000 | | | | 6,702,500 | |
TransDigm Group Incorporated | | | 6.50 | | | | 5-15-2025 | | | | 1,500,000 | | | | 1,425,000 | |
| | | | |
| | | | | | | | | | | | | | | 8,127,500 | |
| | | | | | | | | | | | | | | | |
|
| Commercial Services & Supplies: 0.16% | |
ACCO Brands Corporation 144A | | | 5.25 | | | | 12-15-2024 | | | | 1,500,000 | | | | 1,440,000 | |
| | | | | | | | | | | | | | | | |
|
| Electrical Equipment: 0.11% | |
Resideo Funding Incorporated 144A | | | 6.13 | | | | 11-1-2026 | | | | 1,112,000 | | | | 970,220 | |
| | | | | | | | | | | | | | | | |
|
| Machinery: 1.12% | |
SPX FLOW Incorporated 144A | | | 5.88 | | | | 8-15-2026 | | | | 10,500,000 | | | | 10,080,000 | |
| | | | | | | | | | | | | | | | |
|
| Trading Companies & Distributors: 0.38% | |
WESCO Distribution Incorporated | | | 5.38 | | | | 6-15-2024 | | | | 4,000,000 | | | | 3,400,000 | |
| | | | | | | | | | | | | | | | |
|
Information Technology: 4.24% | |
|
| Communications Equipment: 0.62% | |
CommScope Incorporated 144A | | | 5.50 | | | | 6-15-2024 | | | | 6,000,000 | | | | 5,541,000 | |
| | | | | | | | | | | | | | | | |
|
| Electronic Equipment, Instruments & Components: 1.68% | |
MTS Systems Corporation 144A | | | 5.75 | | | | 8-15-2027 | | | | 4,000,000 | | | | 3,710,000 | |
TTM Technologies Incorporated 144A | | | 5.63 | | | | 10-1-2025 | | | | 13,505,000 | | | | 11,344,200 | |
| | | | |
| | | | | | | | | | | | | | | 15,054,200 | |
| | | | | | | | | | | | | | | | |
|
| IT Services: 1.07% | |
Gartner Incorporated 144A | | | 5.13 | | | | 4-1-2025 | | | | 9,779,000 | | | | 9,558,972 | |
| | | | | | | | | | | | | | | | |
| | | | |
| Software: 0.42% | | | | | | | | | | | | |
Citrix Systems Incorporated | | | 3.30 | | | | 3-1-2030 | | | | 4,000,000 | | | | 3,721,029 | |
| | | | | | | | | | | | | | | | |
| | | | |
| Technology Hardware, Storage & Peripherals: 0.45% | | | | | | | | | | | | |
Western Digital Corporation | | | 4.75 | | | | 2-15-2026 | | | | 4,000,000 | | | | 4,066,000 | |
| | | | | | | | | | | | | | | | |
The accompanying notes are an integral part of these financial statements.
10 | Wells Fargo Diversified Capital Builder Fund
Portfolio of investments—March 31, 2020 (unaudited)
| | | | | | | | | | | | | | | | |
| | | Interest
rate | | | Maturity
date | | | Principal | | | Value | |
Materials: 1.76% | | | | | | | | | | | | | | | | |
| | | | |
| Chemicals: 1.54% | | | | | | | | | | | | |
Koppers Incorporated 144A | | | 6.00 | % | | | 2-15-2025 | | | $ | 8,190,000 | | | $ | 6,552,000 | |
Olin Corporation | | | 5.50 | | | | 8-15-2022 | | | | 1,000,000 | | | | 920,000 | |
Platform Specialty Products Corporation 144A | | | 5.88 | | | | 12-1-2025 | | | | 3,000,000 | | | | 2,940,000 | |
Rayonier Advanced Materials Products Incorporated 144A | | | 5.50 | | | | 6-1-2024 | | | | 3,240,000 | | | | 1,474,200 | |
Valvoline Incorporated | | | 4.38 | | | | 8-15-2025 | | | | 2,000,000 | | | | 1,905,000 | |
| | | | |
| | | | | | | | | | | | | | | 13,791,200 | |
| | | | | | | | | | | | | | | | |
| | | | |
| Containers & Packaging: 0.22% | | | | | | | | | | | | |
Berry Global Incorporated 144A | | | 4.50 | | | | 2-15-2026 | | | | 2,000,000 | | | | 1,947,400 | |
| | | | | | | | | | | | | | | | |
| | | | |
Real Estate: 0.23% | | | | | | | | | | | | | | | | |
| | | | |
| Equity REITs: 0.23% | | | | | | | | | | | | |
Iron Mountain Incorporated 144A | | | 5.38 | | | | 6-1-2026 | | | | 2,000,000 | | | | 2,020,000 | |
| | | | | | | | | | | | | | | | |
| | | | |
Total Corporate Bonds and Notes (Cost $115,869,709) | | | | | | | | | | | | | | | 106,017,681 | |
| | | | | | | | | | | | | | | | |
| | | | |
| Yankee Corporate Bonds and Notes: 2.27% | | | | | | | | | | | | |
| | | | |
Financials: 0.50% | | | | | | | | | | | | | | | | |
| | | | |
| Diversified Financial Services: 0.50% | | | | | | | | | | | | |
Tronox Finance plc 144A | | | 5.75 | | | | 10-1-2025 | | | | 5,000,000 | | | | 4,462,500 | |
| | | | | | | | | | | | | | | | |
| | | | |
Information Technology: 1.77% | | | | | | | | | | | | | | | | |
| | | | |
| Technology Hardware, Storage & Peripherals: 1.77% | | | | | | | | | | | | |
Seagate HDD | | | 4.75 | | | | 6-1-2023 | | | | 9,500,000 | | | | 9,513,259 | |
Seagate HDD | | | 4.88 | | | | 6-1-2027 | | | | 6,396,000 | | | | 6,339,692 | |
| | | | |
| | | | | | | | | | | | | | | 15,852,951 | |
| | | | | | | | | | | | | | | | |
| | | | |
Total Yankee Corporate Bonds and Notes (Cost $20,089,224) | | | | | | | | | | | | | | | 20,315,451 | |
| | | | | | | | | | | | | | | | |
| | | | |
| | | | | | | | | | | | | | | | |
| | | Yield | | | | | | Shares | | | | |
| Short-Term Investments: 0.48% | | | | | | | | | | | | |
| | | | |
| Investment Companies: 0.48% | | | | | | | | | | | | |
Wells Fargo Government Money Market Fund Select Class (l)(u) | | | 0.35 | | | | | | | | 4,278,374 | | | | 4,278,374 | |
| | | | | | | | | | | | | | | | |
| | | | |
Total Short-Term Investments (Cost $4,278,374) | | | | | | | | | | | | | | | 4,278,374 | |
| | | | | | | | | | | | | | | | |
| | | | | | | | |
| Total investments in securities (Cost $905,829,578) | | | 99.82 | % | | | 892,908,025 | |
| | |
Other assets and liabilities, net | | | 0.18 | | | | 1,630,329 | |
| | | | | | | | |
| Total net assets | | | 100.00 | % | | $ | 894,538,354 | |
| | | | | | | | |
| † | Non-income-earning security |
| 144A | The security may be resold in transactions exempt from registration, normally to qualified institutional buyers, pursuant to Rule 144A under the Securities Act of 1933. |
| (l) | The issuer of the security is an affiliated person of the Fund as defined in the Investment Company Act of 1940. |
| (u) | The rate represents the7-day annualized yield at period end. |
Abbreviations:
| ADR | American depositary receipt |
| REIT | Real estate investment trust |
The accompanying notes are an integral part of these financial statements.
Wells Fargo Diversified Capital Builder Fund | 11
Portfolio of investments—March 31, 2020 (unaudited)
Investments in Affiliates
An affiliated investment is an investment in which the Fund owns at least 5% of the outstanding voting shares of the issuer or as a result of other relationships, such as the Fund and the issuer having the same investment manager. Transactions with issuers that were either affiliated persons of the Fund at the beginning of the period or the end of the period were as follows:
| | | | | | | | | | | | | | | | | | | | | | | | | | | | | | | | | | | | |
| | | Shares,
beginning of
period | | | Shares
purchased | | | Shares
sold | | | Shares,
end of
period | | | Net
realized
gains
(losses) | | | Net
change in
unrealized
gains
(losses) | | | Income
from
affiliated
securities | | | Value,
end of
period | | | % of
net
assets | |
Short-Term Investments | | | | | | | | | | | | | | | | | | | | | | | | | | | | | | | | | | | | |
Investment Companies | | | | | | | | | | | | | | | | | | | | | | | | | | | | | | | | | | | | |
Securities Lending Cash Investments LLC* | | | 5,714,900 | | | | 112,023,203 | | | | (117,738,103 | ) | | | 0 | | | $ | 353 | | | $ | 0 | | | $ | 93,929 | # | | $ | 0 | | | | | |
Wells Fargo Government Money Market Fund Select Class | | | 5,712,610 | | | | 84,862,009 | | | | (86,296,245 | ) | | | 4,278,374 | | | | 0 | | | | 0 | | | | 18,649 | | | | 4,278,374 | | | | | |
| | | | | | | | | | | | | | | | | | | | | | | | | | | | | | | | | | | | |
| | | | | | | | | |
| | | | | | | | | | | | | | | | | | $ | 353 | | | $ | 0 | | | $ | 112,578 | | | $ | 4,278,374 | | | | 0.48 | % |
| | | | | | | | | | | | | | | | | | | | | | | | | | | | | | | | | | | | |
| * | No longer held at the end of the period. |
| # | Amount shown represents income before fees and rebates. |
The accompanying notes are an integral part of these financial statements.
12 | Wells Fargo Diversified Capital Builder Fund
Statement of assets and liabilities—March 31, 2020 (unaudited)
| | | | |
| | | | |
| |
Assets | | | | |
Investments in unaffiliated securities, at value (cost $901,551,204) | | $ | 888,629,651 | |
Investments in affiliated securities, at value (cost $4,278,374) | | | 4,278,374 | |
Receivable for Fund shares sold | | | 907,366 | |
Receivable for dividends and interest | | | 2,704,292 | |
Receivable for securities lending income, net | | | 1,794 | |
Prepaid expenses and other assets | | | 288,960 | |
| | | | |
Total assets | | | 896,810,437 | |
| | | | |
| |
Liabilities | | | | |
Payable for Fund shares redeemed | | | 1,383,003 | |
Management fee payable | | | 491,457 | |
Administration fees payable | | | 145,768 | |
Distribution fee payable | | | 69,317 | |
Shareholder servicing fees payable | | | 135,792 | |
Trustees’ fees and expenses payable | | | 4,086 | |
Accrued expenses and other liabilities | | | 42,660 | |
| | | | |
Total liabilities | | | 2,272,083 | |
| | | | |
Total net assets | | $ | 894,538,354 | |
| | | | |
| |
Net assets consist of | | | | |
Paid-in capital | | $ | 886,559,832 | |
Total distributable earnings | | | 7,978,522 | |
| | | | |
Total net assets | | $ | 894,538,354 | |
| | | | |
| |
Computation of net asset value and offering price per share | | | | |
Net assets – Class A | | $ | 502,898,573 | |
Shares outstanding – Class A1 | | | 57,354,894 | |
Net asset value per share – Class A | | | $8.77 | |
Maximum offering price per share – Class A2 | | | $9.31 | |
Net assets – Class C | | $ | 104,845,986 | |
Shares outstanding – Class C1 | | | 11,982,118 | |
Net asset value per share – Class C | | | $8.75 | |
Net assets – Administrator Class | | $ | 7,920,493 | |
Shares outstanding – Administrator Class1 | | | 902,420 | |
Net asset value per share – Administrator Class | | | $8.78 | |
Net assets – Institutional Class | | $ | 278,873,302 | |
Shares outstanding – Institutional Class1 | | | 32,044,947 | |
Net asset value per share – Institutional Class | | | $8.70 | |
| 1 | The Fund has an unlimited number of authorized shares. |
| 2 | Maximum offering price is computed as 100/94.25 of net asset value. On investments of $50,000 or more, the offering price is reduced. |
The accompanying notes are an integral part of these financial statements.
Wells Fargo Diversified Capital Builder Fund | 13
Statement of operations—six months ended March 31, 2020 (unaudited)
| | | | |
| | | | |
| |
Investment income | | | | |
Dividends | | $ | 8,384,011 | |
Interest | | | 4,284,438 | |
Income from affiliated securities | | | 54,338 | |
| | | | |
Total investment income | | | 12,722,787 | |
| | | | |
| |
Expenses | | | | |
Management fee | | | 3,440,789 | |
Administration fees | |
Class A | | | 647,578 | |
Class C | | | 129,605 | |
Administrator Class | | | 6,122 | |
Institutional Class | | | 238,266 | |
Shareholder servicing fees | |
Class A | | | 770,927 | |
Class C | | | 154,291 | |
Administrator Class | | | 11,772 | |
Distribution fee | |
Class C | | | 462,770 | |
Custody and accounting fees | | | 24,568 | |
Professional fees | | | 23,118 | |
Registration fees | | | 50,137 | |
Shareholder report expenses | | | 50,137 | |
Trustees’ fees and expenses | | | 11,029 | |
Other fees and expenses | | | 16,626 | |
| | | | |
Total expenses | | | 6,037,735 | |
Less: Fee waivers and/or expense reimbursements | | | | |
Fund-level | | | (1,567 | ) |
Class A | | | (13,304 | ) |
Class C | | | (123 | ) |
Institutional Class | | | (2,922 | ) |
| | | | |
Net expenses | | | 6,019,819 | |
| | | | |
Net investment income | | | 6,702,968 | |
| | | | |
| |
Realized and unrealized gains (losses) on investments | | | | |
Net realized gains on | | | | |
Unaffiliated securities | | | 20,422,209 | |
Affiliated securities | | | 353 | |
| | | | |
Net realized gains on investments | | | 20,422,562 | |
Net change in unrealized gains (losses) on investments | | | (178,043,849 | ) |
| | | | |
Net realized and unrealized gains (losses) on investments | | | (157,621,287 | ) |
| | | | |
Net decrease in net assets resulting from operations | | $ | (150,918,319 | ) |
| | | | |
The accompanying notes are an integral part of these financial statements.
14 | Wells Fargo Diversified Capital Builder Fund
Statement of changes in net assets
| | | | | | | | | | | | | | | | |
| | | Six months ended
March 31, 2020 (unaudited) | | | Year ended
September 30, 2019 | |
| | | | |
Operations | | | | | | | | | | | | | | | | |
Net investment income | | | | | | $ | 6,702,968 | | | | | | | $ | 14,574,587 | |
Net realized gains on investments | | | | | | | 20,422,562 | | | | | | | | 53,801,908 | |
Net change in unrealized gains (losses) on investments | | | | | | | (178,043,849 | ) | | | | | | | (8,891,274 | ) |
| | | | |
Net increase (decrease) in net assets resulting from operations | | | | | | | (150,918,319 | ) | | | | | | | 59,485,221 | |
| | | | |
| | | | |
Distributions to shareholders from net investment income and net realized gains | | | | | | | | | | | | | | | | |
Class A | | | | | | | (30,018,166 | ) | | | | | | | (36,253,338 | ) |
Class C | | | | | | | (5,538,911 | ) | | | | | | | (7,460,798 | ) |
Administrator Class | | | | | | | (462,042 | ) | | | | | | | (764,433 | ) |
Institutional Class | | | | | | | (18,661,794 | ) | | | | | | | (21,977,654 | ) |
| | | | |
Total distributions to shareholders | | | | | | | (54,680,913 | ) | | | | | | | (66,456,223 | ) |
| | | | |
| | | | |
Capital share transactions | | | Shares | | | | | | | | Shares | | | | | |
Proceeds from shares sold | | | | | | | | | | | | | | | | |
Class A | | | 2,554,890 | | | | 27,379,120 | | | | 9,391,056 | | | | 93,260,195 | |
Class C | | | 2,129,955 | | | | 22,530,830 | | | | 4,595,019 | | | | 46,061,402 | |
Administrator Class | | | 81,347 | | | | 809,613 | | | | 227,726 | | | | 2,281,752 | |
Institutional Class | | | 5,078,381 | | | | 53,107,403 | | | | 15,448,752 | | | | 154,786,786 | |
| | | | |
| | | | | | | 103,826,966 | | | | | | | | 296,390,135 | |
| | | | |
Reinvestment of distributions | | | | | | | | | | | | | | | | |
Class A | | | 2,785,650 | | | | 28,776,009 | | | | 3,667,392 | | | | 34,796,863 | |
Class C | | | 515,200 | | | | 5,333,207 | | | | 774,676 | | | | 7,255,587 | |
Administrator Class | | | 44,443 | | | | 459,039 | | | | 79,989 | | | | 758,159 | |
Institutional Class | | | 1,680,563 | | | | 17,231,291 | | | | 2,124,090 | | | | 20,080,474 | |
| | | | |
| | | | | | | 51,799,546 | | | | | | | | 62,891,083 | |
| | | | |
Payment for shares redeemed | | | | | | | | | | | | | | | | |
Class A | | | (5,514,488 | ) | | | (55,602,805 | ) | | | (8,342,798 | ) | | | (83,876,599 | ) |
Class C | | | (1,729,103 | ) | | | (17,385,054 | ) | | | (6,420,901 | ) | | | (63,323,374 | ) |
Administrator Class | | | (128,553 | ) | | | (1,317,779 | ) | | | (671,418 | ) | | | (7,048,173 | ) |
Institutional Class | | | (8,485,719 | ) | | | (84,812,226 | ) | | | (13,982,283 | ) | | | (140,897,557 | ) |
| | | | |
| | | | | | | (159,117,864 | ) | | | | | | | (295,145,703 | ) |
| | | | |
Net increase (decrease) in net assets resulting from capital share transactions | | | | | | | (3,491,352 | ) | | | | | | | 64,135,515 | |
| | | | |
Total increase (decrease) in net assets | | | | | | | (209,090,584 | ) | | | | | | | 57,164,513 | |
| | | | |
| | | | |
Net assets | | | | | | | | | | | | | | | | |
Beginning of period | | | | | | | 1,103,628,938 | | | | | | | | 1,046,464,425 | |
| | | | |
End of period | | | | | | $ | 894,538,354 | | | | | | | $ | 1,103,628,938 | |
| | | | |
The accompanying notes are an integral part of these financial statements.
Wells Fargo Diversified Capital Builder Fund | 15
Financial highlights
(For a share outstanding throughout each period)
| | | | | | | | | | | | | | | | | | | | | | | | |
| | | Six months ended
March 31, 2020
(unaudited) | | | Year ended September 30 | |
| CLASS A | | 2019 | | | 2018 | | | 2017 | | | 2016 | | | 2015 | |
Net asset value, beginning of period | | | $10.71 | | | | $10.88 | | | | $10.30 | | | | $9.96 | | | | $9.12 | | | | $9.31 | |
Net investment income | | | 0.06 | | | | 0.14 | | | | 0.10 | | | | 0.14 | 1 | | | 0.17 | | | | 0.11 | |
Net realized and unrealized gains (losses) on investments | | | (1.47 | ) | | | 0.37 | | | | 1.06 | | | | 1.12 | | | | 1.71 | | | | (0.20 | ) |
| | | | | | | | | | | | | | | | | | | | | | | | |
Total from investment operations | | | (1.41 | ) | | | 0.51 | | | | 1.16 | | | | 1.26 | | | | 1.88 | | | | (0.09 | ) |
Distributions to shareholders from | | | | | | | | | | | | | | | | | | | | | | | | |
Net investment income | | | (0.09 | ) | | | (0.14 | ) | | | (0.09 | ) | | | (0.14 | ) | | | (0.15 | ) | | | (0.10 | ) |
Net realized gains | | | (0.44 | ) | | | (0.54 | ) | | | (0.49 | ) | | | (0.78 | ) | | | (0.89 | ) | | | 0.00 | |
| | | | | | | | | | | | | | | | | | | | | | | | |
Total distributions to shareholders | | | (0.53 | ) | | | (0.68 | ) | | | (0.58 | ) | | | (0.92 | ) | | | (1.04 | ) | | | (0.10 | ) |
Net asset value, end of period | | | $8.77 | | | | $10.71 | | | | $10.88 | | | | $10.30 | | | | $9.96 | | | | $9.12 | |
Total return2 | | | (13.93 | )% | | | 5.60 | % | | | 11.72 | % | | | 13.62 | % | | | 22.85 | % | | | (1.05 | )% |
Ratios to average net assets (annualized) | | | | | | | | | | | | | | | | | | | | | | | | |
Gross expenses | | | 1.11 | % | | | 1.12 | % | | | 1.11 | % | | | 1.12 | % | | | 1.14 | % | | | 1.19 | % |
Net expenses | | | 1.10 | % | | | 1.12 | % | | | 1.11 | % | | | 1.12 | % | | | 1.14 | % | | | 1.19 | % |
Net investment income | | | 1.18 | % | | | 1.38 | % | | | 0.96 | % | | | 1.43 | % | | | 1.77 | % | | | 1.17 | % |
Supplemental data | | | | | | | | | | | | | | | | | | | | | | | | |
Portfolio turnover rate | | | 17 | % | | | 61 | % | | | 31 | % | | | 54 | % | | | 73 | % | | | 69 | % |
Net assets, end of period (000s omitted) | | | $502,899 | | | | $616,346 | | | | $574,760 | | | | $551,272 | | | | $467,503 | | | | $402,303 | |
| 1 | Calculated based upon average shares outstanding |
| 2 | Total return calculations do not include any sales charges. Returns for periods of less than one year are not annualized. |
The accompanying notes are an integral part of these financial statements.
16 | Wells Fargo Diversified Capital Builder Fund
Financial highlights
(For a share outstanding throughout each period)
| | | | | | | | | | | | | | | | | | | | | | | | |
| | | Six months ended
March 31, 2020
(unaudited) | | | Year ended September 30 | |
| CLASS C | | 2019 | | | 2018 | | | 2017 | | | 2016 | | | 2015 | |
Net asset value, beginning of period | | | $10.69 | | | | $10.86 | | | | $10.28 | | | | $9.96 | | | | $9.12 | | | | $9.32 | |
Net investment income | | | 0.02 | | | | 0.06 | | | | 0.02 | | | | 0.08 | | | | 0.10 | | | | 0.05 | |
Net realized and unrealized gains (losses) on investments | | | (1.47 | ) | | | 0.37 | | | | 1.06 | | | | 1.11 | | | | 1.72 | | | | (0.22 | ) |
| | | | | | | | | | | | | | | | | | | | | | | | |
Total from investment operations | | | (1.45 | ) | | | 0.43 | | | | 1.08 | | | | 1.19 | | | | 1.82 | | | | (0.17 | ) |
Distributions to shareholders from | | | | | | | | | | | | | | | | | | | | | | | | |
Net investment income | | | (0.05 | ) | | | (0.06 | ) | | | (0.01 | ) | | | (0.09 | ) | | | (0.09 | ) | | | (0.03 | ) |
Net realized gains | | | (0.44 | ) | | | (0.54 | ) | | | (0.49 | ) | | | (0.78 | ) | | | (0.89 | ) | | | 0.00 | |
| | | | | | | | | | | | | | | | | | | | | | | | |
Total distributions to shareholders | | | (0.49 | ) | | | (0.60 | ) | | | (0.50 | ) | | | (0.87 | ) | | | (0.98 | ) | | | (0.03 | ) |
Net asset value, end of period | | | $8.75 | | | | $10.69 | | | | $10.86 | | | | $10.28 | | | | $9.96 | | | | $9.12 | |
Total return1 | | | (14.30 | )% | | | 4.81 | % | | | 10.88 | % | | | 12.85 | % | | | 21.96 | % | | | (1.88 | )% |
Ratios to average net assets (annualized) | | | | | | | | | | | | | | | | | | | | | | | | |
Gross expenses | | | 1.86 | % | | | 1.87 | % | | | 1.87 | % | | | 1.87 | % | | | 1.89 | % | | | 1.94 | % |
Net expenses | | | 1.86 | % | | | 1.87 | % | | | 1.87 | % | | | 1.87 | % | | | 1.89 | % | | | 1.94 | % |
Net investment income | | | 0.43 | % | | | 0.65 | % | | | 0.21 | % | | | 0.65 | % | | | 1.03 | % | | | 0.41 | % |
Supplemental data | | | | | | | | | | | | | | | | | | | | | | | | |
Portfolio turnover rate | | | 17 | % | | | 61 | % | | | 31 | % | | | 54 | % | | | 73 | % | | | 69 | % |
Net assets, end of period (000s omitted) | | | $104,846 | | | | $118,297 | | | | $131,601 | | | | $117,346 | | | | $67,630 | | | | $53,373 | |
| 1 | Total return calculations do not include any sales charges. Returns for periods of less than one year are not annualized. |
The accompanying notes are an integral part of these financial statements.
Wells Fargo Diversified Capital Builder Fund | 17
Financial highlights
(For a share outstanding throughout each period)
| | | | | | | | | | | | | | | | | | | | | | | | |
| | | Six months ended
March 31, 2020
(unaudited) | | | Year ended September 30 | |
| ADMINISTRATOR CLASS | | 2019 | | | 2018 | | | 2017 | | | 2016 | | | 2015 | |
Net asset value, beginning of period | | | $10.72 | | | | $10.89 | | | | $10.32 | | | | $9.97 | | | | $9.12 | | | | $9.32 | |
Net investment income | | | 0.07 | | | | 0.15 | 1 | | | 0.11 | 1 | | | 0.16 | 1 | | | 0.18 | 1 | | | 0.14 | 1 |
Net realized and unrealized gains (losses) on investments | | | (1.48 | ) | | | 0.37 | | | | 1.06 | | | | 1.12 | | | | 1.73 | | | | (0.22 | ) |
| | | | | | | | | | | | | | | | | | | | | | | | |
Total from investment operations | | | (1.41 | ) | | | 0.52 | | | | 1.17 | | | | 1.28 | | | | 1.91 | | | | (0.08 | ) |
Distributions to shareholders from | | | | | | | | | | | | | | | | | | | | | | | | |
Net investment income | | | (0.09 | ) | | | (0.15 | ) | | | (0.11 | ) | | | (0.15 | ) | | | (0.17 | ) | | | (0.12 | ) |
Net realized gains | | | (0.44 | ) | | | (0.54 | ) | | | (0.49 | ) | | | (0.78 | ) | | | (0.89 | ) | | | 0.00 | |
| | | | | | | | | | | | | | | | | | | | | | | | |
Total distributions to shareholders | | | (0.53 | ) | | | (0.69 | ) | | | (0.60 | ) | | | (0.93 | ) | | | (1.06 | ) | | | (0.12 | ) |
Net asset value, end of period | | | $8.78 | | | | $10.72 | | | | $10.89 | | | | $10.32 | | | | $9.97 | | | | $9.12 | |
Total return2 | | | (13.88 | )% | | | 5.67 | % | | | 11.73 | % | | | 13.75 | % | | | 23.14 | % | | | (0.92 | )% |
Ratios to average net assets (annualized) | | | | | | | | | | | | | | | | | | | | | | | | |
Gross expenses | | | 1.03 | % | | | 1.04 | % | | | 1.03 | % | | | 1.04 | % | | | 1.06 | % | | | 1.05 | % |
Net expenses | | | 1.03 | % | | | 1.04 | % | | | 1.03 | % | | | 1.04 | % | | | 1.03 | % | | | 0.95 | % |
Net investment income | | | 1.26 | % | | | 1.47 | % | | | 1.04 | % | | | 1.58 | % | | | 1.89 | % | | | 1.41 | % |
Supplemental data | | | | | | | | | | | | | | | | | | | | | | | | |
Portfolio turnover rate | | | 17 | % | | | 61 | % | | | 31 | % | | | 54 | % | | | 73 | % | | | 69 | % |
Net assets, end of period (000s omitted) | | | $7,920 | | | | $9,708 | | | | $13,821 | | | | $10,225 | | | | $21,398 | | | | $7,898 | |
| 1 | Calculated based upon average shares outstanding |
| 2 | Returns for periods of less than one year are not annualized. |
The accompanying notes are an integral part of these financial statements.
18 | Wells Fargo Diversified Capital Builder Fund
Financial highlights
(For a share outstanding throughout each period)
| | | | | | | | | | | | | | | | | | | | | | | | |
| | | Six months ended
March 31, 2020
(unaudited) | | | Year ended September 30 | |
| INSTITUTIONAL CLASS | | 2019 | | | 2018 | | | 2017 | | | 2016 | | | 2015 | |
Net asset value, beginning of period | | | $10.64 | | | | $10.81 | | | | $10.25 | | | | $9.90 | | | | $9.07 | | | | $9.27 | |
Net investment income | | | 0.08 | | | | 0.18 | | | | 0.14 | | | | 0.19 | | | | 0.20 | | | | 0.15 | |
Net realized and unrealized gains (losses) on investments | | | (1.48 | ) | | | 0.36 | | | | 1.05 | | | | 1.11 | | | | 1.71 | | | | (0.21 | ) |
| | | | | | | | | | | | | | | | | | | | | | | | |
Total from investment operations | | | (1.40 | ) | | | 0.54 | | | | 1.19 | | | | 1.30 | | | | 1.91 | | | | (0.06 | ) |
Distributions to shareholders from | | | | | | | | | | | | | | | | | | | | | | | | |
Net investment income | | | (0.10 | ) | | | (0.17 | ) | | | (0.14 | ) | | | (0.17 | ) | | | (0.19 | ) | | | (0.14 | ) |
Net realized gains | | | (0.44 | ) | | | (0.54 | ) | | | (0.49 | ) | | | (0.78 | ) | | | (0.89 | ) | | | 0.00 | |
| | | | | | | | | | | | | | | | | | | | | | | | |
Total distributions to shareholders | | | (0.54 | ) | | | (0.71 | ) | | | (0.63 | ) | | | (0.95 | ) | | | (1.08 | ) | | | (0.14 | ) |
Net asset value, end of period | | | $8.70 | | | | $10.64 | | | | $10.81 | | | | $10.25 | | | | $9.90 | | | | $9.07 | |
Total return1 | | | (13.87 | )% | | | 5.98 | % | | | 12.04 | % | | | 14.11 | % | | | 23.28 | % | | | (0.75 | )% |
Ratios to average net assets (annualized) | | | | | | | | | | | | | | | | | | | | | | | | |
Gross expenses | | | 0.78 | % | | | 0.79 | % | | | 0.79 | % | | | 0.79 | % | | | 0.81 | % | | | 0.79 | % |
Net expenses | | | 0.78 | % | | | 0.78 | % | | | 0.78 | % | | | 0.78 | % | | | 0.78 | % | | | 0.77 | % |
Net investment income | | | 1.49 | % | | | 1.73 | % | | | 1.30 | % | | | 1.71 | % | | | 2.14 | % | | | 1.58 | % |
Supplemental data | | | | | | | | | | | | | | | | | | | | | | | | |
Portfolio turnover rate | | | 17 | % | | | 61 | % | | | 31 | % | | | 54 | % | | | 73 | % | | | 69 | % |
Net assets, end of period (000s omitted) | | | $278,873 | | | | $359,278 | | | | $326,283 | | | | $262,754 | | | | $122,769 | | | | $97,251 | |
| 1 | Returns for periods of less than one year are not annualized. |
The accompanying notes are an integral part of these financial statements.
Wells Fargo Diversified Capital Builder Fund | 19
Notes to financial statements (unaudited)
1. ORGANIZATION
Wells Fargo Funds Trust (the “Trust”), a Delaware statutory trust organized on March 10, 1999, is anopen-end management investment company registered under the Investment Company Act of 1940, as amended (the “1940 Act”). As an investment company, the Trust follows the accounting and reporting guidance in Financial Accounting Standards Board (“FASB”)Accounting Standards Codification Topic 946, Financial Services – Investment Companies. These financial statements report on the Wells Fargo Diversified Capital Builder Fund (the “Fund”) which is a diversified series of the Trust.
2. SIGNIFICANT ACCOUNTING POLICIES
The following significant accounting policies, which are consistently followed in the preparation of the financial statements of the Fund, are in conformity with U.S. generally accepted accounting principles which require management to make estimates and assumptions that affect the reported amounts of assets and liabilities, disclosure of contingent assets and liabilities at the date of the financial statements, and the reported amounts of revenues and expenses during the reporting period. Actual results could differ from those estimates.
Securities valuation
All investments are valued each business day as of the close of regular trading on the New York Stock Exchange (generally 4 p.m. Eastern Time), although the Fund may deviate from this calculation time under unusual or unexpected circumstances.
Equity securities that are listed on a foreign or domestic exchange or market are valued at the official closing price or, if none, the last sales price. If no sale occurs on the principal exchange or market that day, a fair value price will be determined in accordance with the Fund’s Valuation Procedures.
Debt securities are valued at the evaluated bid price provided by an independent pricing service (e.g. taking into account various factors, including yields, maturities, or credit ratings) or, if a reliable price is not available, the quoted bid price from an independent broker-dealer.
Investments in registeredopen-end investment companies are valued at net asset value. Interests innon-registered investment companies that are redeemable at net asset value are fair valued normally at net asset value.
Investments which are not valued using any of the methods discussed above are valued at their fair value, as determined in good faith by the Board of Trustees of the Fund. The Board of Trustees has established a Valuation Committee comprised of the Trustees and has delegated to it the authority to take any actions regarding the valuation of portfolio securities that the Valuation Committee deems necessary or appropriate, including determining the fair value of portfolio securities, unless the determination has been delegated to the Wells Fargo Asset Management Pricing Committee at Wells Fargo Funds Management, LLC (“Funds Management”).The Board of Trustees retains the authority to make or ratify any valuation decisions or approve any changes to the Valuation Procedures as it deems appropriate. On a quarterly basis, the Board of Trustees receives reports on any valuation actions taken by the Valuation Committee or the Wells Fargo Asset Management Pricing Committee which may include items for ratification.
Securities lending
The Fund may lend its securities from time to time in order to earn additional income in the form of fees or interest on securities received as collateral or the investment of any cash received as collateral. When securities are on loan, the Fund receives interest or dividends on those securities. Cash collateral received in connection with its securities lending transactions is invested in Securities Lending Cash Investments, LLC (the “Securities Lending Fund”). Investments in Securities Lending Fund are valued at the evaluated bid price provided by an independent pricing service. Income earned from investment in the Securities Lending Fund (net of fees and rebates), if any, is included in income from affiliated securities on the Statement of Operations.
In a securities lending transaction, the net asset value of the Fund is affected by an increase or decrease in the value of the securities loaned and by an increase or decrease in the value of the instrument in which collateral is invested. The amount of securities lending activity undertaken by the Fund fluctuates from time to time. The Fund has the right under the lending agreement to recover the securities from the borrower on demand. In the event of default or bankruptcy by the borrower, the Fund may be prevented from recovering the loaned securities or gaining access to the collateral or may experience delays or costs in doing so. In such an event, the terms of the agreement allows the unaffiliated securities lending agent to use the collateral to purchase replacement securities on behalf of the Fund or pay the Fund the market value of the loaned securities. The Fund bears the risk of loss with respect to depreciation of its investment of the cash collateral.
Security transactions and income recognition
Securities transactions are recorded on a trade date basis. Realized gains or losses are recorded on the basis of identified cost.
20 | Wells Fargo Diversified Capital Builder Fund
Notes to financial statements (unaudited)
Dividend income is recognized on theex-dividend date.
Interest income is accrued daily and bond discounts are accreted and premiums are amortized daily. To the extent debt obligations are placed onnon-accrual status, any related interest income may be reduced by writing off interest receivables when the collection of all or a portion of interest has been determined to be doubtful based on consistently applied procedures and the fair value has decreased. If the issuer subsequently resumes interest payments or when the collectability of interest is reasonably assured, the debt obligation is removed fromnon-accrual status.
Distributions to shareholders
Distributions to shareholders are recorded on theex-dividend date and paid from net investment income quarterly and any net realized gains are paid at least annually. Such distributions are determined in accordance with income tax regulations and may differ from U.S. generally accepted accounting principles. Dividend sources are estimated at the time of declaration. The tax character of distributions is determined as of the Fund’s fiscal year end. Therefore, a portion of the Fund’s distributions made prior to the Fund’s fiscal year end may be categorized as a tax return of capital at year end.
Federal and other taxes
The Fund intends to continue to qualify as a regulated investment company by distributing substantially all of its investment company taxable income and any net realized capital gains (after reduction for capital loss carryforwards) sufficient to relieve it from all, or substantially all, federal income taxes. Accordingly, no provision for federal income taxes was required.
The Fund’s income and federal excise tax returns and all financial records supporting those returns for the prior three fiscal years are subject to examination by the federal and Delaware revenue authorities. Management has analyzed the Fund’s tax positions taken on federal, state, and foreign tax returns for all open tax years and does not believe that there are any uncertain tax positions that require recognition of a tax liability.
As of March 31, 2020, the aggregate cost of all investments for federal income tax purposes was $905,751,406 and the unrealized gains (losses) consisted of:
| | | | |
| |
Gross unrealized gains | | $ | 111,294,933 | |
| |
Gross unrealized losses | | | (124,138,314 | ) |
| |
Net unrealized losses | | $ | (12,843,381 | ) |
Class allocations
The separate classes of shares offered by the Fund differ principally in applicable sales charges, distribution, shareholder servicing, and administration fees. Class specific expenses are charged directly to that share class. Investment income, common fund-level expenses, and realized and unrealized gains (losses) on investments are allocated daily to each class of shares based on the relative proportion of net assets of each class.
3. FAIR VALUATION MEASUREMENTS
Fair value measurements of investments are determined within a framework that has established a fair value hierarchy based upon the various data inputs utilized in determining the value of the Fund’s investments. The three-level hierarchy gives the highest priority to unadjusted quoted prices in active markets for identical assets or liabilities (Level 1) and the lowest priority to unobservable inputs (Level 3). The Fund’s investments are classified within the fair value hierarchy based on the lowest level of input that is significant to the fair value measurement. The inputs are summarized into three broad levels as follows:
| ∎ | | Level 1 – quoted prices in active markets for identical securities |
| ∎ | | Level 2 – other significant observable inputs (including quoted prices for similar securities, interest rates, prepayment speeds, credit risk, etc.) |
| ∎ | | Level 3 – significant unobservable inputs (including the Fund’s own assumptions in determining the fair value of investments) |
The inputs or methodologies used for valuing investments in securities are not necessarily an indication of the risk associated with investing in those securities.
Wells Fargo Diversified Capital Builder Fund | 21
Notes to financial statements (unaudited)
The following is a summary of the inputs used in valuing the Fund’s assets and liabilities as of March 31, 2020:
| | | | | | | | | | | | | | | | |
| | | | |
| | | Quoted prices
(Level 1) | | | Other significant
observable inputs
(Level 2) | | | Significant
unobservable inputs (Level 3) | | | Total | |
| | | | |
Assets | | | | | | | | | | | | | | | | |
Investments in: | | | | | | | | | | | | | | | | |
| | | | |
Common stocks | | | | | | | | | | | | | | | | |
| | | | |
Communications services | | $ | 4,647,800 | | | $ | 0 | | | $ | 0 | | | $ | 4,647,800 | |
| | | | |
Consumer discretionary | | | 5,601,300 | | | | 0 | | | | 0 | | | | 5,601,300 | |
| | | | |
Consumer staples | | | 2,855,057 | | | | 0 | | | | 0 | | | | 2,855,057 | |
| | | | |
Energy | | | 3,380,550 | | | | 0 | | | | 0 | | | | 3,380,550 | |
| | | | |
Health care | | | 159,678,740 | | | | 0 | | | | 0 | | | | 159,678,740 | |
| | | | |
Industrials | | | 101,393,611 | | | | 0 | | | | 0 | | | | 101,393,611 | |
| | | | |
Information technology | | | 304,092,960 | | | | 0 | | | | 0 | | | | 304,092,960 | |
| | | | |
Materials | | | 58,008,800 | | | | 0 | | | | 0 | | | | 58,008,800 | |
| | | | |
Real estate | | | 26,419,680 | | | | 0 | | | | 0 | | | | 26,419,680 | |
| | | | |
Utilities | | | 96,218,021 | | | | 0 | | | | 0 | | | | 96,218,021 | |
| | | | |
Corporate bonds and notes | | | 0 | | | | 106,017,681 | | | | 0 | | | | 106,017,681 | |
| | | | |
Yankee corporate bonds and notes | | | 0 | | | | 20,315,451 | | | | 0 | | | | 20,315,451 | |
| | | | |
Short-term investments | | | | | | | | | | | | | | | | |
| | | | |
Investment companies | | | 4,278,374 | | | | 0 | | | | 0 | | | | 4,278,374 | |
| | | | |
Total assets | | $ | 766,574,893 | | | $ | 126,333,132 | | | $ | 0 | | | $ | 892,908,025 | |
Additional sector, industry or geographic detail is included in the Portfolio of Investments.
For the six months ended March 31, 2020, the Fund did not have any transfers into/out of Level 3.
4. TRANSACTIONS WITH AFFILIATES
Management fee
Funds Management, an indirect wholly owned subsidiary of Wells Fargo & Company (“Wells Fargo”), is the manager of the Fund and provides advisory and fund-level administrative services under an investment management agreement. Under the investment management agreement, Funds Management is responsible for, among other services, implementing the investment objectives and strategies of the Fund, supervising the subadviser and providing fund-level administrative services in connection with the Fund’s operations. As compensation for its services under the investment management agreement, Funds Management is entitled to receive a management fee at the following annual rate based on the Fund’s average daily net assets:
| | |
| |
| Average daily net assets | | Management fee |
| |
First $500 million | | 0.650% |
| |
Next $500 million | | 0.600 |
| |
Next $2 billion | | 0.550 |
| |
Next $2 billion | | 0.525 |
| |
Next $5 billion | | 0.490 |
| |
Over $10 billion | | 0.480 |
For the six months ended March 31, 2020, the management fee was equivalent to an annual rate of 0.62% of the Fund’s average daily net assets.
Funds Management has retained the services of a subadviser to provide daily portfolio management to the Fund. The fee for subadvisory services is borne by Funds Management. Wells Capital Management Incorporated (“WellsCap”), an affiliate of Funds Management and an indirect wholly owned subsidiary of Wells Fargo, is the subadviser to the Fund and is entitled to receive a fee from Funds Management at an annual rate starting at 0.35% and declining to 0.20% as the average daily net assets of the Fund increase.
22 | Wells Fargo Diversified Capital Builder Fund
Notes to financial statements (unaudited)
Administration fees
Under a class-level administration agreement, Funds Management provides class-level administrative services to the Fund, which includes paying fees and expenses for services provided by the transfer agent,sub-transfer agents, omnibus account servicers and record-keepers. As compensation for its services under the class-level administration agreement, Funds Management receives an annual fee which is calculated based on the average daily net assets of each class as follows:
| | |
| |
| | | Class-level
administration fee |
| |
Class A, Class C | | 0.21% |
| |
Administrator Class, Institutional Class | | 0.13 |
Waivers and/or expense reimbursements
Funds Management has contractually waived and/or reimbursed management and administration fees to the extent necessary to maintain certain net operating expense ratios for the Fund. When each class of the Fund has exceeded its expense cap, Funds Management has waived fees and/or reimbursed expenses from fund-level expenses on a proportionate basis and then from class specific expenses. When only certain classes exceed their expense caps, waivers and/or reimbursements are applied against class specific expenses before fund-level expenses. Funds Management has committed through January 31, 2021 to waive fees and/or reimburse expenses to the extent necessary to cap the Fund’s expenses at 1.13% for Class A shares, 1.88% for Class C shares, 1.05% for Administrator Class shares, and 0.78% for Institutional Class shares. Prior to or after the commitment expiration date, the cap may be increased or the commitment to maintain the cap may be terminated only with the approval of the Board of Trustees. Prior to January 31, 2020, the Fund’s expenses were capped at 1.20% for Class A shares, 1.95% for Class C shares.
Distribution fee
The Trust has adopted a distribution plan for Class C shares of the Fund pursuant to Rule12b-1 under the 1940 Act. A distribution fee is charged to Class C shares and paid to Wells Fargo Funds Distributor, LLC (“Funds Distributor”), the principal underwriter, at an annual rate of 0.75% of the average daily net assets of Class C shares.
In addition, Funds Distributor is entitled to receive thefront-end sales charge from the purchase of Class A shares and a contingent deferred sales charge on the redemption of certain Class A shares. Funds Distributor is also entitled to receive the contingent deferred sales charges from redemptions of Class C shares. For the six months ended March 31, 2020, Funds Distributor received $42,875 from the sale of Class A shares and $956 in contingent deferred sales charges from redemptions of Class C shares. No contingent deferred sales charges were incurred by Class A shares for the six months ended March 31, 2020.
Shareholder servicing fees
The Trust has entered into contracts with one or more shareholder servicing agents, whereby Class A, Class C, and Administrator Class of the Fund are charged a fee at an annual rate of 0.25% of the average daily net assets of each respective class. A portion of these total shareholder servicing fees were paid to affiliates of Wells Fargo.
Interfund transactions
The Fund may purchase or sell portfolio investment securities to certain other Wells Fargo affiliates pursuant to Rule17a-7 under the 1940 Act and under procedures adopted by the Board of Trustees. The procedures have been designed to ensure that these interfund transactions, which do not incur broker commissions, are effected at current market prices. Pursuant to these procedures, the Fund had $2,070,000 and $0 in interfund purchases and sales, respectively, during the six months ended March 31, 2020.
5. INVESTMENT PORTFOLIO TRANSACTIONS
Purchases and sales of investments, excluding U.S. government obligations (if any) and short-term securities, for the six months ended March 31, 2020 were $189,718,614 and $237,802,371, respectively.
6. SECURITIES LENDING TRANSACTIONS
The Fund lends its securities through an unaffiliated securities lending agent and receives collateral in the form of cash or securities with a value at least equal to the value of the securities on loan. The value of the loaned securities is determined at the close of each business day and any increases or decreases in the required collateral are exchanged between the Fund and the counterparty on the next business day. Cash collateral received is invested in the Securities Lending Fund which seeks to
Wells Fargo Diversified Capital Builder Fund | 23
Notes to financial statements (unaudited)
provide a positive return compared to the daily Fed Funds Open Rate by investing in high-quality, U.S. dollar-denominated short-term money market instruments and is exempt from registration under Section 3(c)(7) of the 1940 Act. Securities Lending Fund is managed by Funds Management and is subadvised by WellsCap. Funds Management receives an advisory fee starting at 0.05% and declining to 0.01% as the average daily net assets of the Securities Lending Fund increase. All of the fees received by Funds Management are paid to WellsCap for its services as subadviser.
In the event of counterparty default or the failure of a borrower to return a loaned security, the Fund has the right to use the collateral to offset any losses incurred. As of March 31, 2020, the Fund did not have any securities on loan.
7. BANK BORROWINGS
The Trust (excluding the money market funds), Wells Fargo Master Trust and Wells Fargo Variable Trust are parties to a $280,000,000 revolving credit agreement whereby the Fund is permitted to use bank borrowings for temporary or emergency purposes, such as to fund shareholder redemption requests. Interest under the credit agreement is charged to the Fund based on a borrowing rate equal to the higher of the Federal Funds rate in effect on that day plus 1.25% or the overnight LIBOR rate in effect on that day plus 1.25%. In addition, an annual commitment fee equal to 0.25% of the unused balance is allocated to each participating fund.
For the six months ended March 31, 2020, there were no borrowings by the Fund under the agreement.
8. INDEMNIFICATION
Under the Trust’s organizational documents, the officers and Trustees have been granted certain indemnification rights against certain liabilities that may arise out of performance of their duties to the Trust. Additionally, in the normal course of business, the Trust may enter into contracts with service providers that contain a variety of indemnification clauses. The Trust’s maximum exposure under these arrangements is dependent on future claims that may be made against the Fund and, therefore, cannot be estimated.
9. NEW ACCOUNTING PRONOUNCEMENTS
In August 2018, FASB issued Accounting Standards Update (“ASU”) No. 2018-13, Fair Value Measurement (Topic 820)Disclosure Framework—Changes to the Disclosure Requirements for Fair Value Measurement. ASU 2018-13 updates the disclosure requirements for fair value measurements by modifying or removing certain disclosures and adding certain new disclosures. The amendments are effective for fiscal years, and interim periods within those fiscal years, beginning after December 15, 2019. Early adoption is permitted. Management has adopted the removal and modification of disclosures early, as permitted, and will adopt the additional new disclosures at the effective date.
In March 2017, FASB issued ASU No. 2017-08,Premium Amortization on Purchased Callable Debt Securities. ASU 2017-08 shortens the amortization period for certain callable debt securities held at a premium and requires the premium to be amortized to the earliest call date. The amendments do not require an accounting change for securities held at a discount and discounts will continue to be accreted to the maturity date of the security. ASU 2017-08 is effective for fiscal years beginning after December 15, 2018 and for interim periods within those fiscal years. During the current reporting period, management of the Fund adopted the change in accounting policy which did not have a material impact to the Fund’s financial statements.
10. CORONAVIRUS(COVID-19) PANDEMIC
On March 11, 2020, the World Health Organization announced that it had made the assessment that coronavirus disease 2019 (“COVID-19”) is a pandemic. The impacts of COVID-19 are adversely affecting the entire global economy, individual companies and investment products, and the market in general. There is significant uncertainty around the extent and duration of business disruptions related to COVID-19 and the impacts may be short term or may last for an extended period of time. The risk of further spreading of COVID-19 has led to significant uncertainty and volatility in the financial markets. The value of the Fund and the securities in which the Fund invests have generally been adversely affected by impacts caused by COVID-19.
24 | Wells Fargo Diversified Capital Builder Fund
Other information (unaudited)
PROXY VOTING INFORMATION
A description of the policies and procedures used to determine how to vote proxies relating to portfolio securities is available, upon request, by calling1-800-222-8222, visiting our website atwfam.com, or visiting the SEC website at sec.gov. Information regarding how the proxies related to portfolio securities were voted during the most recent12-month period ended June 30 is available on the website atwfam.com or by visiting the SEC website at sec.gov.
QUARTERLY PORTFOLIO HOLDINGS INFORMATION
The Fund files its complete schedule of portfolio holdings with the SEC for the first and third quarters of each fiscal year as an exhibit to its reports on FormN-PORT. Shareholders may view the filed FormN-PORT by visiting the SEC website at sec.gov.
Wells Fargo Diversified Capital Builder Fund | 25
Other information (unaudited)
BOARD OF TRUSTEES AND OFFICERS
Each of the Trustees and Officers1 listed in the table below acts in identical capacities for each fund in the Wells Fargo family of funds, which consists of 147 mutual funds comprising the Wells Fargo Funds Trust, Wells Fargo Variable Trust, Wells Fargo Master Trust and fourclosed-end funds (collectively the “Fund Complex”). This table should be read in conjunction with the Prospectus and the Statement of Additional Information2. The mailing address of each Trustee and Officer is 525 Market Street, 12th Floor, San Francisco, CA 94105. Each Trustee and Officer serves an indefinite term, however, each Trustee serves such term until reaching the mandatory retirement age established by the Trustees.
Independent Trustees
| | | | | | |
Name and year of birth | | Position held and
length of service* | | Principal occupations during past five years or longer | | Current other
public company or
investment
company
directorships |
| | | |
| William R. Ebsworth (Born 1957) | | Trustee, since 2015 | | Retired. From 1984 to 2013, equities analyst, portfolio manager, research director and chief investment officer at Fidelity Management and Research Company in Boston, Tokyo, and Hong Kong, and retired in 2013 as Chief Investment Officer of Fidelity Strategic Advisers, Inc. where he led a team of investment professionals managing client assets. Prior thereto, Board member of Hong Kong Securities Clearing Co., Hong Kong Options Clearing Corp., the Thailand International Fund, Ltd., Fidelity Investments Life Insurance Company, and Empire Fidelity Investments Life Insurance Company. Audit Committee Chair and Investment Committee Chair of the Vincent Memorial Hospital Endowment(non-profit organization). Mr. Ebsworth is a CFA® charterholder. | | N/A |
| | | |
| Jane A. Freeman (Born 1953) | | Trustee, since 2015; Chair Liaison, since 2018 | | Retired. From 2012 to 2014 and 1999 to 2008, Chief Financial Officer of Scientific Learning Corporation. From 2008 to 2012, Ms. Freeman provided consulting services related to strategic business projects. Prior to 1999, Portfolio Manager at Rockefeller & Co. and Scudder, Stevens & Clark. Board member of the Harding Loevner Funds from 1996 to 2014, serving as both Lead Independent Director and chair of the Audit Committee. Board member of the Russell Exchange Traded Funds Trust from 2011 to 2012 and the chair of the Audit Committee. Ms. Freeman is a Board Member of The Ruth Bancroft Garden(non-profit organization). She is also an inactive Chartered Financial Analyst. | | N/A |
| | | |
| Isaiah Harris, Jr. (Born 1952) | | Trustee, since 2009; Audit Committee Chairman, since 2019 | | Retired. Chairman of the Board of CIGNA Corporation since 2009, and Director since 2005. From 2003 to 2011, Director of Deluxe Corporation. Prior thereto, President and CEO of BellSouth Advertising and Publishing Corp. from 2005 to 2007, President and CEO of BellSouth Enterprises from 2004 to 2005 and President of BellSouth Consumer Services from 2000 to 2003. Emeritus member of the Iowa State University Foundation Board of Governors. Emeritus Member of the Advisory Board of Iowa State University School of Business. Advisory Board Member, Palm Harbor Academy (private school). Advisory Board Member, Child Evangelism Fellowship(non-profit). Mr. Harris is a certified public accountant (inactive status). | | CIGNA Corporation |
| | | |
| Judith M. Johnson (Born 1949) | | Trustee, since 2008; Audit Committee Chairman, from 2009 to 2018 | | Retired. Prior thereto, Chief Executive Officer and Chief Investment Officer of Minneapolis Employees Retirement Fund from 1996 to 2008. Ms. Johnson is an attorney, certified public accountant and a certified managerial accountant. | | N/A |
26 | Wells Fargo Diversified Capital Builder Fund
Other information (unaudited)
| | | | | | |
Name and year of birth | | Position held and
length of service* | | Principal occupations during past five years or longer | | Current other
public company or
investment
company
directorships |
| | | |
| David F. Larcker (Born 1950) | | Trustee, since 2009 | | James Irvin Miller Professor of Accounting at the Graduate School of Business, Stanford University, Director of the Corporate Governance Research Initiative and Senior Faculty of The Rock Center for Corporate Governance since 2006. From 2005 to 2008, Professor of Accounting at the Graduate School of Business, Stanford University. Prior thereto, Ernst & Young Professor of Accounting at The Wharton School, University of Pennsylvania from 1985 to 2005. | | N/A |
| | | |
| Olivia S. Mitchell (Born 1953) | | Trustee, since 2006; Nominating and Governance Committee Chair, since 2018 | | International Foundation of Employee Benefit Plans Professor, Wharton School of the University of Pennsylvania since 1993. Director of Wharton’s Pension Research Council and Boettner Center on Pensions & Retirement Research, and Research Associate at the National Bureau of Economic Research. Previously, Cornell University Professor from 1978 to 1993. | | N/A |
| | | |
| Timothy J. Penny (Born 1951) | | Trustee, since 1996; Chairman, since 2018 | | President and Chief Executive Officer of Southern Minnesota Initiative Foundation, anon-profit organization, since 2007. Member of the Board of Trustees of NorthStar Education Finance, Inc., anon-profit organization, since 2007. | | N/A |
| | | |
| James G. Polisson (Born 1959) | | Trustee, since 2018 | | Retired. Chief Marketing Officer, Source (ETF) UK Services, Ltd, from 2015 to 2017. From 2012 to 2015, Principal of The Polisson Group, LLC, a management consulting, corporate advisory and principal investing company. Chief Executive Officer and Managing Director at Russell Investments, Global Exchange Traded Funds from 2010 to 2012. Managing Director of Barclays Global Investors from 1998 to 2010 and Global Chief Marketing Officer for iShares and Barclays Global Investors from 2000 to 2010. Trustee of the San Francisco Mechanics’ Institute, anon-profit organization, from 2013 to 2015. Board member of the Russell Exchange Traded Fund Trust from 2011 to 2012. Director of Barclays Global Investors Holdings Deutschland GmbH from 2006 to 2009. Mr. Polisson is an attorney and has a retired status with the Massachusetts and District of Columbia Bar Associations. | | N/A |
| | | |
| Pamela Wheelock3 (Born 1959) | | Trustee, since January 2020; previously Trustee from January 2018 to July 2019 | | Board member of the Destination Medical Center Economic Development Agency, Rochester, Minnesota since 2019. Acting Commissioner, Minnesota Department of Human Services, July 2019 through September 2019. Human Services Manager (part-time), Minnesota Department of Human Services, October 2019 through December 2019. Chief Operating Officer, Twin Cities Habitat for Humanity from 2017 to 2019. Vice President of University Services, University of Minnesota from 2012 to 2016. Prior thereto, on the Board of Directors, Governance Committee and Finance Committee for the Minnesota Philanthropy Partners (Saint Paul Foundation) from 2012 to 2018, Interim Chief Executive Officer of Blue Cross Blue Shield of Minnesota from 2011 to 2012, Chairman of the Board from 2009 to 2012 and Board Director from 2003 to 2015. Vice President, Leadership and Community Engagement, Bush Foundation, Saint Paul, Minnesota (a private foundation) from 2009 to 2011. Executive Vice President and Chief Financial Officer, Minnesota Sports and Entertainment from 2004 to 2009 and Senior Vice President from 2002 to 2004. Executive Vice President of the Minnesota Wild Foundation from 2004 to 2008. Commissioner of Finance, State of Minnesota, from 1999 to 2002. Currently Board Chair of the Minnesota Wild Foundation since 2010. | | N/A |
| * | Length of service dates reflect the Trustee’s commencement of service with the Trust’s predecessor entities, where applicable. |
Wells Fargo Diversified Capital Builder Fund | 27
Other information (unaudited)
Officers
| | | | |
Name and year of birth | | Position held and
length of service | | Principal occupations during past five years or longer |
| | |
Andrew Owen
(Born 1960) | | President, since 2017 | | Executive Vice President of Wells Fargo & Company and Head of Affiliated Managers, Wells Fargo Asset Management, since 2014. In addition, Mr. Owen is currently President, Chief Executive Officer and Director of Wells Fargo Funds Management, LLC since 2017. Prior thereto, Executive Vice President responsible for marketing, investments and product development for Wells Fargo Funds Management, LLC, from 2009 to 2014. |
| | |
Jeremy DePalma1
(Born 1974) | | Treasurer, since 2012 | | Senior Vice President of Wells Fargo Funds Management, LLC since 2009. Senior Vice President of Evergreen Investment Management Company, LLC from 2008 to 2010 and head of the Fund Reporting and Control Team within Fund Administration from 2005 to 2010. |
| | |
Michelle Rhee
(Born 1966) | | Chief Legal Officer, since 2019 | | Secretary of Wells Fargo Funds Management, LLC, Chief Legal Counsel of Wells Fargo Asset Management and Assistant General Counsel of Wells Fargo Bank, N.A. since 2018. Associate General Counsel and Managing Director of Bank of America Corporation from 2004 to 2018. |
| | |
Catherine Kennedy
(Born 1969) | | Secretary, since 2019 | | Vice President of Wells Fargo Funds Management, LLC and Senior Counsel of the Wells Fargo Legal Department since 2010. Vice President and Senior Counsel of Evergreen Investment Management Company, LLC from 1998 to 2010. |
| | |
Michael H. Whitaker
(Born 1967) | | Chief Compliance Officer, since 2016 | | Chief Compliance Officer of Wells Fargo Asset Management since 2016. Senior Vice President and Chief Compliance Officer for Fidelity Investments from 2007 to 2016. |
| | |
David Berardi
(Born 1975) | | Assistant Treasurer, since 2009 | | Vice President of Wells Fargo Funds Management, LLC since 2009. Vice President of Evergreen Investment Management Company, LLC from 2008 to 2010. Manager of Fund Reporting and Control for Evergreen Investment Management Company, LLC from 2004 to 2010. |
| 1 | Jeremy DePalma acts as Treasurer of 82 funds and Assistant Treasurer of 65 funds in the Fund Complex. |
| 2 | The Statement of Additional Information includes additional information about the Trustees and is available, without charge, upon request, by calling1-800-222-8222 or by visiting the website atwfam.com. |
| 3 | Pamela Wheelock wasre-appointed to the Board effective January 1, 2020. |
28 | Wells Fargo Diversified Capital Builder Fund
Appendix I (unaudited)
Effective on or about May 1, 2020, if you purchase Fund shares through a Janney Montgomery Scott LLC (“Janney”) brokerage account, you will be eligible for the following load waivers(front-end sales charge waivers and contingent deferred sales charge (“CDSC”), orback-end sales charge, waivers) and discounts, which may differ from those disclosed elsewhere in the Fund’s Prospectus or SAI.
|
| Front-end sales charge* waivers on Class A shares available at Janney |
|
| Shares purchased through reinvestment of capital gains distributions and dividend reinvestment when purchasing shares of the same fund (but not any other fund within the fund family). |
|
| Shares purchased by employees and registered representatives of Janney or its affiliates and their family members as designated by Janney. |
|
| Shares purchased from the proceeds of redemptions within the same fund family, provided (1) the repurchase occurs within ninety (90) days following the redemption, (2) the redemption and purchase occur in the same account, and (3) redeemed shares were subject to afront-end or deferred sales load (i.e., right of reinstatement). |
|
| Employer-sponsored retirement plans (e.g., 401(k) plans, 457 plans, employer-sponsored 403(b) plans, profit sharing and money purchase pension plans and defined benefit plans). For purposes of this provision, employer-sponsored retirement plans do not include SEP IRAs, Simple IRAs,SAR-SEPs or Keogh plans. |
|
| Shares acquired through a right of reinstatement. |
|
Class C shares that are no longer subject to a contingent deferred sales charge and are converted to Class A shares of the same fund pursuant to Janney’s policies and procedures. |
| CDSC waivers on Class A and Class C shares available at Janney |
|
| Shares sold upon the death or disability of the shareholder. |
|
| Shares sold as part of a systematic withdrawal plan as described in the Fund’s Prospectus. |
|
| Shares purchased in connection with a return of excess contributions from an IRA account. |
|
| Shares sold as part of a required minimum distribution for IRA and retirement accounts if the redemption is taken in or after the year the shareholder reaches qualified age based on applicable IRS regulations. |
|
| Shares sold to pay Janney fees but only if the transaction is initiated by Janney. |
|
| Shares acquired through a right of reinstatement. |
|
Shares exchanged into the same share class of a different fund. |
| Front-end sales charge* discounts available at Janney; breakpoints, rights of accumulation and/or letters of intent |
|
| Breakpoints as described in the Fund’s Prospectus. |
|
| Rights of accumulation (“ROA”), which entitle shareholders to breakpoint discounts, will be automatically calculated based on the aggregated holding of fund family assets held by accounts within the purchaser’s household at Janney. Eligible fund family assets not held at Janney may be included in the ROA calculation only if the shareholder notifies his or her financial advisor about such assets. |
|
| Letters of intent which allow for breakpoint discounts based on anticipated purchases within a fund family, over a13-month time period. Eligible fund family assets not held at Janney Montgomery Scott may be included in the calculation of letters of intent only if the shareholder notifies his or her financial advisor about such assets. |
| * | Also referred to as an “initial sales charge.” |
Wells Fargo Diversified Capital Builder Fund | 29
Appendix II (unaudited)
Effective on or after May 1, 2020, clients of Edward Jones (also referred to as “shareholders”) purchasing Fund shares on the Edward Jones commission andfee-based platforms are eligible only for the following sales charge discounts (also referred to as “breakpoints”) and waivers, which can differ from breakpoints and waivers described elsewhere in this Prospectus or SAI or through another broker-dealer. In all instances, it is the shareholder’s responsibility to inform Edward Jones at the time of purchase of any relationship, holdings of Wells Fargo Funds or other facts qualifying the purchaser for breakpoints or waivers. Edward Jones can ask for documentation of such circumstance.
|
| Breakpoints available at Edward Jones |
|
| Rights of Accumulation (ROA) |
|
The applicable sales charge on a purchase of Class A shares is determined by taking into account all share classes (except any money market funds and retirement plan share classes) of Wells Fargo Funds held by the shareholder or in an account grouped by Edward Jones with other accounts for the purpose of providing certain pricing considerations (“pricing groups”). This includes all share classes held on the Edward Jones platform and/or held on another platform. The inclusion of eligible fund family assets in the rights of accumulation calculation is dependent on the shareholder notifying his or her financial advisor of such assets at the time of calculation. |
|
ROA is determined by calculating the higher of cost or market value (current shares x NAV). |
|
| Letter of Intent (LOI) |
|
Through a LOI, shareholders can receive the sales charge and breakpoint discounts for purchases shareholders intend to makeover a13-month period from the date Edward Jones receives the LOI. The LOI is determined by calculating the higher of cost or market value of qualifying holdings at LOI initiation in combination with the value that the shareholder intends to buy over a13-month period to calculate thefront-end sales charge and any breakpoint discounts. Each purchase the shareholder makes during that13-month period will receive the sales charge and breakpoint discount that applies to the total amount. The inclusion of eligible fund family assets in the LOI calculation is dependent on the shareholder notifying his or her financial advisor of such assets at the time of calculation. Purchases made before the LOI is received by Edward Jones are not covered under the LOI and will not reduce the sales charge previously paid. Sales charges will be adjusted if LOI is not met. |
| Sales charges are waived for the following shareholders and in the following situations at Edward Jones: |
● Associates of Edward Jones and its affiliates and their family members who are in the same pricing group (as determined by Edward Jones under its policies and procedures) as the associate. This waiver will continue for the remainder of the associate’s life if the associate retires from Edward Jones in good-standing. |
● Shares purchased in an Edward Jonesfee-based program. |
● Shares purchased through reinvestment of capital gains distributions and dividend reinvestment. |
● Shares purchased from the proceeds of redeemed shares of the same fund family so long as the following conditions are met: 1) the proceeds are from the sale of shares within 60 days of the purchase, and 2) the sale and purchase are made in the same share class and the same account or the purchase is made in an individual retirement account with proceeds from liquidations in anon-retirement account. |
● Shares exchanged into Class A shares from another share class so long as the exchange is into the same fund and was initiated at the discretion of Edward Jones. Edward Jones is responsible for any remaining CDSC due to the fund company, if applicable. Any future purchases are subject to the applicable sales charge as disclosed in the prospectus. |
● Exchanges from Class C shares to Class A shares of the same fund, generally, in the 84th month following the anniversary of the purchase date or earlier at the discretion of Edward Jones. |
If the shareholder purchases shares that are subject to a CDSC and those shares are redeemed before the CDSC is expired, the shareholder
is responsible to pay the CDSC except in the following conditions available at Edward Jones: |
● The death or disability of the shareholder. |
● Systematic withdrawals with up to 10% per year of the account value. |
● Return of excess contributions from an Individual Retirement Account (IRA). |
● Shares sold as part of a required minimum distribution for IRA and retirement accounts if the redemption is taken in or after the year the shareholder reaches qualified age based on applicable IRS regulation. |
● Shares sold to pay Edward Jones fees or costs in such cases where the transaction is initiated by Edward Jones. |
● Shares exchanged in an Edward Jonesfee-based program. |
● Shares acquired through NAV reinstatement. |
30 | Wells Fargo Diversified Capital Builder Fund
Appendix II (unaudited)
|
| Other Important Information for accounts at Edward Jones: |
Minimum Purchase Amounts ● $250 initial purchase minimum ● $50 subsequent purchase minimum |
Minimum Balances Edward Jones has the right to redeem at its discretion fund holdings with a balance of $250 or less. The following are examples of accounts that are not included in this policy: ● Afee-based account held on an Edward Jones platform ● A 529 account held on an Edward Jones platform ● An account with an active systematic investment plan or letter of intent (LOI) |
Changing Share Classes At any time it deems necessary, Edward Jones has the authority to exchange at NAV a shareholder’s holdings in a fund to Class A shares. |
Wells Fargo Diversified Capital Builder Fund | 31
This page is intentionally left blank.

For more information
More information about Wells Fargo Funds is available free upon request. To obtain literature, please write, visit the Fund’s website, or call:
Wells Fargo Funds
P.O. Box 219967
Kansas City, MO 64121-9967
Website:wfam.com
Individual investors:1-800-222-8222
Retail investment professionals:1-888-877-9275
Institutional investment professionals:1-866-765-0778

This report and the financial statements contained herein are submitted for the general information of the shareholders of the Fund. If this report is used for promotional purposes, distribution of the report must be accompanied or preceded by a current prospectus. Before investing, please consider the investment objectives, risks, charges, and expenses of the investment. For a current prospectus and, if available, a summary prospectus, containing this information, call1-800-222-8222 or visit the Fund’s website atwfam.com. Read the prospectus carefully before you invest or send money.
Wells Fargo Asset Management (WFAM) is the trade name for certain investment advisory/management firms owned by Wells Fargo & Company. These firms include but are not limited to Wells Capital Management Incorporated and Wells Fargo Funds Management, LLC. Certain products managed by WFAM entities are distributed by Wells Fargo Funds Distributor, LLC (a broker-dealer and Member FINRA).
This material is for general informational and educational purposes only and is NOT intended to provide investment advice or a recommendation of any kind—including a recommendation for any specific investment, strategy, or plan.
INVESTMENT PRODUCTS: NOT FDIC INSURED ◾ NO BANK GUARANTEE ◾ MAY LOSE VALUE
© 2020 Wells Fargo & Company. All rights reserved.
PAR-0420-06220 05-20
SA225/SAR225 03-20
Semi-Annual Report
March 31, 2020
Wells Fargo
Diversified Income Builder Fund
Beginning on January 1, 2021, as permitted by new regulations adopted by the Securities and Exchange Commission, paper copies of the Wells Fargo Funds’ annual and semi-annual shareholder reports issued after this date will no longer be sent by mail, unless you specifically request paper copies of the reports. Instead, the reports will be made available on the Funds’ website, and you will be notified by mail each time a report is posted and provided with a website address to access the report.
If you already elected to receive shareholder reports electronically, you will not be affected by this change and you need not take any action. You may elect to receive shareholder reports and other communications from the Fund electronically at any time by contacting your financial intermediary (such as a broker-dealer or bank) or, if you are a direct investor, by calling1-800-222-8222 or by enrolling at wellsfargo.com/advantagedelivery.
You may elect to receive all future reports in paper free of charge. If you invest through a financial intermediary, you can contact your financial intermediary to request that you continue to receive paper copies of your shareholder reports; if you invest directly with the Fund, you can call 1-800-222-8222. Your election to receive reports in paper will apply to all Wells Fargo Funds held in your account with your financial intermediary or, if you are a direct investor, to all Wells Fargo Funds that you hold.
|
|
|
Reduce clutter. Save trees. |
Sign up for electronic delivery of prospectuses and shareholder reports atwellsfargo.com/advantagedelivery |
The views expressed and any forward-looking statements are as of March 31, 2020, unless otherwise noted, and are those of the Fund managers and/or Wells Fargo Asset Management. Discussions of individual securities, or the markets generally, or any Wells Fargo Fund are not intended as individual recommendations. Future events or results may vary significantly from those expressed in any forward-looking statements. The views expressed are subject to change at any time in response to changing circumstances in the market. Wells Fargo Asset Management and the Fund disclaim any obligation to publicly update or revise any views expressed or forward-looking statements.
INVESTMENT PRODUCTS: NOT FDIC INSURED ◾ NO BANK GUARANTEE ◾ MAY LOSE VALUE
Wells Fargo Diversified Income Builder Fund | 1
Letter to shareholders (unaudited)

Andrew Owen
President
Wells Fargo Funds
“The period began with mixed data, leading to central bank support.”
Dear Shareholder:
We are pleased to offer you this semi-annual report for the Wells Fargo Diversified Income Builder Fund for the six-month period that ended March 31, 2020. Global stock markets saw earlier gains erased in February and March as governments took unprecedented measures to stop the spread of the coronavirus at the expense of short-term economic output. Fixed-income markets were less battered, with U.S. government bonds achieving modest gains as central banks attempted to bolster capital markets and confidence.
For the period, U.S. stocks, based on the S&P 500 Index,1 returned -12.31% and international stocks, as measured by the MSCI ACWI ex USA Index (Net),2 fell 16.52%. The MSCI EM Index (Net)3 lost 14.55%. For bond investors, the Bloomberg Barclays U.S. Aggregate Bond Index4 added 3.33%, the Bloomberg Barclays Global Aggregate ex-USD Index5 returned -2.03%, the Bloomberg Barclays Municipal Bond Index6 gained a modest 0.10%, and the ICE BofA U.S. High Yield Index7 returned -10.86%.
The period began with mixed data, leading to central bank support.
As the fourth quarter of 2019 started, U.S.-China trade tensions were relaxing while optimism grew for a U.K. Brexit deal. The initial estimate of U.S. third-quarter gross domestic product growth was a resilient 1.9% annualized rate, while the U.S. unemployment rate fell to a 50-year low of 3.5% in September. Despite resilience among U.S. consumers, however, business confidence declined while manufacturing activity contracted. Concerned with a potential economic slowdown, the U.S. Federal Reserve (Fed) lowered interest rates a quarter point in late October—its third rate cut in four months. This helped push the S&P 500 Index to an all-time high while emerging market equities rallied and global bonds declined overall, reflecting a broad pickup in risk appetite.
Equity markets rallied in November despite ongoing geopolitical risks. Hopes for aU.S.-China trade deal buoyed investor confidence. U.S. business sentiment edged up, and manufacturing and services activity rose. With that positive backdrop, developed market equities outpaced those in emerging markets, and U.S. stocks outperformed non-U.S. stocks overall. While consumer confidence and purchasing manager activity rose in the eurozone, China reported weakening manufacturing and consumer data. Bond yields rose marginally, leading to slightly negative returns for global government and investment-grade corporate bonds.
Financial markets ended 2019 with a boost from the U.S. and China accord on a Phase One trade deal. That, along with the landslide win by the pro-Brexit U.K. Conservative
| 1 | The S&P 500 Index consists of 500 stocks chosen for market size, liquidity, and industry group representation. It is a market-value-weighted index with each stock’s weight in the index proportionate to its market value. You cannot invest directly in an index. |
| 2 | The Morgan Stanley Capital International (MSCI) All Country World Index (ACWI) ex USA Index (Net) is a free-float-adjusted market-capitalization-weighted index that is designed to measure the equity market performance of developed markets, excluding the United States. Source: MSCI. MSCI makes no express or implied warranties or representations and shall have no liability whatsoever with respect to any MSCI data contained herein. The MSCI data may not be further redistributed or used as a basis for other indices or any securities or financial products. This report is not approved, reviewed, or produced by MSCI. You cannot invest directly in an index. |
| 3 | The MSCI Emerging Markets (EM) Index (Net) is a free-float-adjusted market-capitalization-weighted index that is designed to measure equity market performance of emerging markets. You cannot invest directly in an index. |
| 4 | The Bloomberg Barclays U.S. Aggregate Bond Index is a broad-based benchmark that measures the investment-grade, U.S. dollar-denominated, fixed-rate taxable bond market, including Treasuries, government-related and corporate securities, mortgage-backed securities (agency fixed-rate and hybrid adjustable-rate mortgage pass-throughs), asset-backed securities, and commercial mortgage-backed securities. You cannot invest directly in an index. |
| 5 | The Bloomberg Barclays Global Aggregate ex-USD Index is an unmanaged index that provides a broad-based measure of the global investment-grade fixed-income markets excluding the U.S. dollar-denominated debt market. You cannot invest directly in an index. |
| 6 | The Bloomberg Barclays Municipal Bond Index is an unmanaged index composed of long-term tax-exempt bonds with a minimum credit rating of Baa. You cannot invest directly in an index. |
| 7 | The ICE BofA U.S. High Yield Index is a market-capitalization-weighted index of domestic and Yankee high-yield bonds. The index tracks the performance of high-yield securities traded in the U.S. bond market. You cannot invest directly in an index. Copyright 2020. ICE Data Indices, LLC. All rights reserved. |
2 | Wells Fargo Diversified Income Builder Fund
Letter to shareholders (unaudited)
Party in a national election and ongoing central bank support, gave investors greater confidence. U.S. economic indicators were positive overall, with the exception of manufacturing activity and business confidence. Consumer confidence was resilient, fed by a robust labor market, tame inflation, and lower interest rates, which boosted housing affordability and stimulated homebuyer activity. The impeachment of U.S. President Donald Trump had little impact on markets. Meanwhile, slowing Chinese economic activity, partly attributable to the trade war, led to further government stimulus at year-end through lower reserve ratios, allowing banks to lend more money.
The year-end rally continued in early January 2020. However, capital market volatility spiked in late January on concerns over the potential impact of the coronavirus on the global economy and stock markets. With sentiment somewhat souring, perceived safe havens did well in January. The U.S. dollar and Japanese yen both rose, and government bonds outperformed equities. While the S&P 500 Index held its ground, emerging market equities tumbled, including those in Asia.
In February, the coronavirus became the major market focus. Fears of the virus’s impact on global growth led to expectations of increased global central bank monetary policy support. That led the 10-year U.S. Treasury yield to fall to an all-time low of 1.1% by the end of the month. Although equity markets initially shrugged off concerns about the outbreak, focusing instead on strong fourth-quarter earnings and improving business confidence in January, market sentiment turned sharply lower toward month-end. Oil prices tumbled as Russia and the Organization of the Petroleum Exporting Countries compounded a major decline in oil demand with a brutal price war, causing the price of West Texas Intermediate crude oil to fall 13% in February alone.
The global spread of the coronavirus led many countries to clamp down on social and business-related activity in order to contain the virus from causing even greater devastation and overwhelming the health care system. This abrupt stoppage of economic activity led to the sharp deceleration of global output, sending economies into a deep contraction. Central bank responses were swift, as they slashed interest rates and expanded quantitative easing programs to restore liquidity and confidence to the markets. In the U.S., the Fed launched several lending programs, funding investment-grade bonds, money market mutual funds, and commercial paper while purchasing Treasuries, mortgage-backed securities, and overnight repos. Meanwhile, stock markets tumbled quickly into a bear market, ending the longest bull stock market in U.S. history.
Don’t let short-term uncertainty derail long-term investment goals.
Periods of investment uncertainty can present challenges, but experience has taught us that maintaining long-term investment goals can be an effective way to plan for the future. To help you create a sound strategy based on your personal goals and risk tolerance, Wells Fargo Funds offers more than 100 mutual funds spanning a wide range of asset classes and investment styles. Although diversification cannot guarantee an investment profit or prevent losses, we believe it can be an effective way to manage investment risk and potentially smooth out overall portfolio performance. We encourage investors to know their investments and to understand that appropriate levels of risk-taking may unlock opportunities.
Thank you for choosing to invest with Wells Fargo Funds. We appreciate your confidence in us and remain committed to helping you meet your financial needs.
Sincerely,

Andrew Owen
President
Wells Fargo Funds
“Capital market volatility spiked in late January on concerns over the potential impact of the coronavirus on the global economy and stock markets.”
|
|
|
For further information about your Fund, contact your investment professional, visit our website at wfam.com, or call us directly at1-800-222-8222. |
Wells Fargo Diversified Income Builder Fund | 3
Performance highlights (unaudited)
Investment objective
The Fund seeks long-term total return, consisting of current income and capital appreciation.
Manager
Wells Fargo Funds Management, LLC
Subadviser
Wells Capital Management Incorporated
Portfolio managers
Kandarp R. Acharya, CFA®‡, FRM
Margaret Patel
Average annual total returns (%) as of March 31, 20201
| | | | | | | | | | | | | | | | | | | | | | | | | | | | | | | | | | |
| | | | |
| | | | | Including sales charge | | | Excluding sales charge | | | Expense ratios2 (%) | |
| | | | | | | | | |
| | | Inception date | | 1 year | | | 5 year | | | 10 year | | | 1 year | | | 5 year | | | 10 year | | | Gross | | | Net3 | |
| | | | | | | | | | |
| Class A (EKSAX) | | 4-14-1987 | | | -14.10 | | | | 1.39 | | | | 5.15 | | | | -8.81 | | | | 2.62 | | | | 5.78 | | | | 1.06 | | | | 0.86 | |
| | | | | | | | | | |
| Class C (EKSCX) | | 2-1-1993 | | | -10.32 | | | | 1.89 | | | | 5.00 | | | | -9.32 | | | | 1.89 | | | | 5.00 | | | | 1.81 | | | | 1.61 | |
| | | | | | | | | | |
| Class R6 (EKSRX)4 | | 7-31-2018 | | | – | | | | – | | | | – | | | | -8.32 | | | | 3.02 | | | | 6.17 | | | | 0.63 | | | | 0.43 | |
| | | | | | | | | | |
| Administrator Class (EKSDX)5 | | 7-30-2010 | | | – | | | | – | | | | – | | | | -8.77 | | | | 2.72 | | | | 5.93 | | | | 0.98 | | | | 0.78 | |
| | | | | | | | | | |
| Institutional Class (EKSYX) | | 1-13-1997 | | | – | | | | – | | | | – | | | | -8.54 | | | | 2.99 | | | | 6.15 | | | | 0.73 | | | | 0.53 | |
| | | | | | | | | | |
| Diversified Income Builder Blended Index6 | | – | | | – | | | | – | | | | – | | | | -4.47 | | | | 4.37 | | | | 7.16 | | | | – | | | | – | |
| | | | | | | | | | |
| ICE BofA U.S. Cash Pay High Yield Index7 | | – | | | – | | | | – | | | | – | | | | -7.40 | | | | 2.68 | | | | 5.49 | | | | – | | | | – | |
| | | | | | | | | | |
| Russell 1000® Index8 | | – | | | – | | | | – | | | | – | | | | -8.03 | | | | 6.22 | | | | 10.39 | | | | – | | | | – | |
Figures quoted represent past performance, which is no guarantee of future results, and do not reflect taxes that a shareholder may pay on an investment in a fund. Investment return and principal value of an investment will fluctuate so that an investor’s shares, when redeemed, may be worth more or less than their original cost. Performance shown without sales charges would be lower if sales charges were reflected. Current performance may be lower or higher than the performance data quoted, which assumes the reinvestment of dividends and capital gains. Currentmonth-end performance is available on the Fund’s website,wfam.com.
Index returns do not include transaction costs associated with buying and selling securities, any mutual fund fees or expenses, or any taxes. It is not possible to invest directly in an index.
For Class A shares, the maximumfront-end sales charge is 5.75%. For Class C shares, the maximum contingent deferred sales charge is 1.00%. Performance including a contingent deferred sales charge assumes the sales charge for the corresponding time period. Class R6, Administrator Class, and Institutional Class shares are sold without afront-end sales charge or contingent deferred sales charge.
Balanced funds may invest in stocks and bonds. Stock values fluctuate in response to the activities of individual companies and general market and economic conditions. Bond values fluctuate in response to the financial condition of individual issuers, general market and economic conditions, and changes in interest rates. Changes in market conditions and government policies may lead to periods of heightened volatility in the bond market and reduced liquidity for certain bonds held by the Fund. In general, when interest rates rise, bond values fall and investors may lose principal value. Interest rate changes and their impact on the Fund and its share price can be sudden and unpredictable. Certain investment strategies tend to increase the total risk of an investment (relative to the broader market). The Fund is exposed to foreign investment risk, high-yield securities risk, and smaller-company securities risk. Consult the Fund’s prospectus for additional information on these and other risks.
Please see footnotes on page 5.
4 | Wells Fargo Diversified Income Builder Fund
Performance highlights (unaudited)
| | | | |
| |
| Ten largest holdings (%) as of March 31, 20209 | | | |
| | |
TTM Technologies Incorporated, 5.63%,10-1-2025 | | | 2.30 | |
| | |
Valvoline Incorporated, 4.38%,8-15-2025 | | | 2.05 | |
| | |
Iron Mountain Incorporated, 4.88%,9-15-2027 | | | 1.93 | |
| | |
Installed Building Company, 5.75%,2-1-2028 | | | 1.92 | |
| | |
Tronox Finance plc, 5.75%,10-1-2025 | | | 1.78 | |
| | |
Koppers Incorporated, 6.00%,2-15-2025 | | | 1.74 | |
| | |
HCA Incorporated, 5.38%,2-1-2025 | | | 1.60 | |
| | |
Davita Incorporated, 5.00%,5-1-2025 | | | 1.49 | |
| | |
AMN Healthcare Incorporated, 5.13%,10-1-2024 | | | 1.49 | |
| | |
Lamb Weston Holdings Incorporated, 4.63%,11-1-2024 | | | 1.47 | |
|
|
| Portfolio composition as of March 31, 202010 |
|
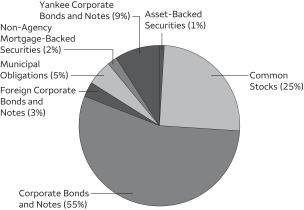 |
| ‡ | CFA® and Chartered Financial Analyst®are trademarks owned by CFA Institute. |
| 1 | Historical performance prior to July 12, 2010, is based on the Fund’s predecessor, Evergreen Diversified Income Builder Fund. |
| 2 | Reflects the expense ratios as stated in the most recent prospectuses, which include the impact of 0.01% in acquired fund fees and expenses. The expense ratios shown are subject to change and may differ from the annualized expense ratios shown in the financial highlights of this report, which do not include acquired fund fees and expenses. |
| 3 | The manager has contractually committed through January 31, 2021, to waive fees and/or reimburse expenses to the extent necessary to cap total annual fund operating expenses after fee waivers at 0.85% for Class A, 1.60% for Class C, 0.42% for Class R6, 0.77% for Administrator Class, and 0.52% for Institutional Class. Brokerage commissions, stamp duty fees, interest, taxes, acquired fund fees and expenses (if any), and extraordinary expenses are excluded from the expense cap. Prior to or after the commitment expiration date, the cap may be increased or the commitment to maintain the cap may be terminated only with the approval of the Board of Trustees. Without this cap, the Fund’s returns would have been lower. The expense ratio paid by an investor is the net expense ratio (the total annual fund operating expenses after fee waivers) as stated in the prospectuses. |
| 4 | Historical performance shown for the Class R6 shares prior to their inception reflects the performance of the Institutional Class shares, and is not adjusted to reflect Class R6 expenses. If these expenses had been included, returns for the Class R6 would be higher. |
| 5 | Historical performance shown for the Administrator Class shares prior to their inception reflects the performance of the Institutional Class shares, adjusted to reflect the higher expenses applicable to the Administrator Class shares. |
| 6 | Source: Wells Fargo Funds Management, LLC. The Diversified Income Builder Blended Index is composed 60% of the ICE BofA U.S. Cash Pay High Yield Index, 25% of the Morgan Stanley Capital International (MSCI) All Country World Index (ACWI) and 15% of the Bloomberg Barclays U.S. Aggregate Bond Index. |
| | The MSCI ACWI is a free-float-adjusted market-capitalization-weighted index that is designed to measure the equity market performance of developed and emerging markets. |
| | The Bloomberg Barclays U.S. Aggregate Bond Index is a broad-based benchmark that measures the investment-grade, U.S. dollar—denominated, fixed-rate taxable bond market, including Treasuries, government-related and corporate securities, mortgage-backed securities (agency fixed-rate and hybrid adjustable-rate mortgage pass-throughs), asset-backed securities, and commercial mortgage-backed securities. |
| | Prior to February 1, 2020, the Diversified Income Builder Blended Index was composed 65% of the ICE BofA U.S. Cash Pay High Yield Index, and 35% of the Russell 1000® Index. Prior to January 2, 2018, the Diversified Income Builder Blended Index was composed 75% of the ICE BofA U.S. Cash Pay High Yield Index, and 25% the Russell 1000® Index. You cannot invest directly in an index. |
| 7 | The ICE BofA U.S. Cash Pay High Yield Index is an unmanaged market index that provides a broad-based performance measure of the noninvestment grade U.S. domestic bond index. You cannot invest directly in an index. Copyright 2020. ICE Data Indices, LLC. All rights reserved. |
| 8 | The Russell 1000® Index measures the performance of the 1,000 largest companies in the Russell 3000® Index, which represents approximately 92% of the total market capitalization of the Russell 3000® Index. You cannot invest directly in an index. |
| 9 | The ten largest holdings, excluding cash, cash equivalents and any money market funds, are calculated based on the value of the investments divided by total net assets of the Fund. Holdings are subject to change and may have changed since the date specified. |
| 10 | Amounts are calculated based on the total long-term investments of the Fund. These amounts are subject to change and may have changed since the date specified. |
Wells Fargo Diversified Income Builder Fund | 5
Fund expenses (unaudited)
As a shareholder of the Fund, you incur two types of costs: (1) transaction costs, including sales charges (loads) on purchase payments and contingent deferred sales charges (if any) on redemptions and (2) ongoing costs, including management fees, distribution(12b-1) and/or shareholder servicing fees, and other Fund expenses. This example is intended to help you understand your ongoing costs (in dollars) of investing in the Fund and to compare these costs with the ongoing costs of investing in other mutual funds.
The example is based on an investment of $1,000 invested at the beginning of thesix-month period and held for the entire period from October 1, 2019 to March 31, 2020.
Actual expenses
The “Actual” line of the table below provides information about actual account values and actual expenses. You may use the information in this line, together with the amount you invested, to estimate the expenses that you paid over the period. Simply divide your account value by $1,000 (for example, an $8,600 account value divided by $1,000 = 8.6), then multiply the result by the number in the “Actual” line under the heading entitled “Expenses paid during period” for your applicable class of shares to estimate the expenses you paid on your account during this period.
Hypothetical example for comparison purposes
The “Hypothetical” line of the table below provides information about hypothetical account values and hypothetical expenses based on the Fund’s actual expense ratio and an assumed rate of return of 5% per year before expenses, which is not the Fund’s actual return. The hypothetical account values and expenses may not be used to estimate the actual ending account balance or expenses you paid for the period. You may use this information to compare the ongoing costs of investing in the Fund and other funds. To do so, compare this 5% hypothetical example with the 5% hypothetical examples that appear in the shareholder reports of the other funds.
Please note that the expenses shown in the table are meant to highlight your ongoing costs only and do not reflect any transactional costs, such as sales charges (loads) and contingent deferred sales charges. Therefore, the “Hypothetical” line of the table is useful in comparing ongoing costs only and will not help you determine the relative total costs of owning different funds. In addition, if these transactional costs were included, your costs would have been higher.
| | | | | | | | | | | | | | | | |
| | | Beginning
account value
10-1-2019 | | | Ending
account value
3-31-2020 | | | Expenses
paid during
the period¹ | | | Annualized net
expense ratio | |
| | | | | |
Class A | | | | | | | | | | | | | | | | |
| | | | |
Actual | | $ | 1,000.00 | | | $ | 886.97 | | | $ | 4.01 | | | | 0.85 | % |
| | | | |
Hypothetical (5% return before expenses) | | $ | 1,000.00 | | | $ | 1,020.75 | | | $ | 4.29 | | | | 0.85 | % |
| | | | | |
Class C | | | | | | | | | | | | | | | | |
| | | | |
Actual | | $ | 1,000.00 | | | $ | 885.36 | | | $ | 7.54 | | | | 1.60 | % |
| | | | |
Hypothetical (5% return before expenses) | | $ | 1,000.00 | | | $ | 1,017.00 | | | $ | 8.07 | | | | 1.60 | % |
| | | | | |
Class R6 | | | | | | | | | | | | | | | | |
| | | | |
Actual | | $ | 1,000.00 | | | $ | 889.21 | | | $ | 1.98 | | | | 0.42 | % |
| | | | |
Hypothetical (5% return before expenses) | | $ | 1,000.00 | | | $ | 1,022.90 | | | $ | 2.12 | | | | 0.42 | % |
| | | | | |
Administrator Class | | | | | | | | | | | | | | | | |
| | | | |
Actual | | $ | 1,000.00 | | | $ | 887.88 | | | $ | 3.63 | | | | 0.77 | % |
| | | | |
Hypothetical (5% return before expenses) | | $ | 1,000.00 | | | $ | 1,021.15 | | | $ | 3.89 | | | | 0.77 | % |
| | | | | |
Institutional Class | | | | | | | | | | | | | | | | |
| | | | |
Actual | | $ | 1,000.00 | | | $ | 889.04 | | | $ | 2.46 | | | | 0.52 | % |
| | | | |
Hypothetical (5% return before expenses) | | $ | 1,000.00 | | | $ | 1,022.40 | | | $ | 2.63 | | | | 0.52 | % |
| 1 | Expenses paid is equal to the annualized net expense ratio of each class multiplied by the average account value over the period, multiplied by the number of days in the most recent fiscal half-year divided by the number of days in the fiscal year (to reflect theone-half-year period). |
6 | Wells Fargo Diversified Income Builder Fund
Portfolio of investments—March 31, 2020 (unaudited)
| | | | | | | | | | | | | | | | |
| | | Interest
rate | | | Maturity
date | | | Principal | | | Value | |
| Asset-Backed Securities: 1.19% | |
Avis Budget Rental Car Funding Series2019-2A Class C 144A | | | 4.24 | % | | | 9-22-2025 | | | $ | 2,000,000 | | | $ | 1,910,144 | |
Chesapeake Funding II LLC Series2018-1A Class D 144A | | | 3.92 | | | | 4-15-2030 | | | | 1,980,000 | | | | 1,997,993 | |
Hertz Vehicle Financing LLC Series2019-1A Class B 144A | | | 4.10 | | | | 3-25-2023 | | | | 1,380,000 | | | | 1,227,783 | |
Santander Retail Auto Lease Trust Series2019-A Class D 144A | | | 3.66 | | | | 5-20-2024 | | | | 2,000,000 | | | | 2,030,422 | |
| |
Total Asset-Backed Securities (Cost $7,393,026) | | | | 7,166,342 | |
| | | | | |
| | | | |
| | | | | | | | | | | | | | | | |
| | | | | | | | | Shares | | | | |
| Common Stocks: 24.10% | |
|
Communication Services: 1.00% | |
|
| Diversified Telecommunication Services: 0.49% | |
AT&T Incorporated # | | | | | | | | | | | 43,274 | | | | 1,261,437 | |
Hellenic Telecommunications Organization SA | | | | | | | | | | | 16,547 | | | | 200,029 | |
PT Telekomunikasi Indonesia Persero Tbk | | | | | | | | | | | 1,382,100 | | | | 268,427 | |
Verizon Communications Incorporated # | | | | | | | | | | | 23,364 | | | | 1,255,348 | |
| | | | |
| | | | | | | | | | | | | | | 2,985,241 | |
| | | | | | | | | | | | | | | | |
| | | | |
| Entertainment: 0.03% | | | | | | | | | | | | |
NetEase Incorporated ADR | | | | | | | | | | | 621 | | | | 199,316 | |
| | | | | | | | | | | | | | | | |
| | | | |
| Media: 0.10% | | | | | | | | | | | | |
Naspers Limited | | | | | | | | | | | 2,879 | | | | 409,147 | |
RTL Group SA | | | | | | | | | | | 4,958 | | | | 166,033 | |
| | | | |
| | | | | | | | | | | | | | | 575,180 | |
| | | | | | | | | | | | | | | | |
| | | | |
| Wireless Telecommunication Services: 0.38% | | | | | | | | | | | | |
Advanced Info Service PCL | | | | | | | | | | | 31,200 | | | | 192,596 | |
China Mobile Limited | | | | | | | | | | | 73,500 | | | | 550,830 | |
KDDI Corporation | | | | | | | | | | | 40,416 | | | | 1,193,831 | |
Mobile TeleSystems PJSC ADR | | | | | | | | | | | 19,017 | | | | 144,529 | |
SK Telecom Company Limited | | | | | | | | | | | 1,470 | | | | 213,806 | |
| | | | |
| | | | | | | | | | | | | | | 2,295,592 | |
| | | | | | | | | | | | | | | | |
| | | | |
Consumer Discretionary: 1.15% | | | | | | | | | | | | | | | | |
| | | | |
| Automobiles: 0.25% | | | | | | | | | | | | |
Geely Automobile Holdings Limited | | | | | | | | | | | 79,000 | | | | 114,647 | |
General Motors Company # | | | | | | | | | | | 28,578 | | | | 593,851 | |
Guangzhou Automobile Group Company Limited H Shares | | | | | | | | | | | 138,000 | | | | 137,269 | |
Hero Honda Motors Limited | | | | | | | | | | | 6,954 | | | | 146,639 | |
Peugeot SA | | | | | | | | | | | 41,487 | | | | 540,131 | |
| | | | |
| | | | | | | | | | | | | | | 1,532,537 | |
| | | | | | | | | | | | | | | | |
| | | | |
| Hotels, Restaurants & Leisure: 0.02% | | | | | | | | | | | | |
Sands China Limited | | | | | | | | | | | 32,800 | | | | 119,329 | |
| | | | | | | | | | | | | | | | |
| | | | |
| Household Durables: 0.44% | | | | | | | | | | | | |
Coway Company Limited | | | | | | | | | | | 2,154 | | | | 101,892 | |
Haier Smart Home Company Limited Class A | | | | | | | | | | | 126,299 | | | | 254,029 | |
Hangzhou Robam Appliances Company Limited | | | | | | | | | | | 36,699 | | | | 145,781 | |
Man Wah Holdings Limited | | | | | | | | | | | 233,600 | | | | 126,630 | |
Midea Group Company Limited Class A | | | | | | | | | | | 43,999 | | | | 297,744 | |
Persimmon plc | | | | | | | | | | | 42,426 | | | | 1,002,893 | |
The accompanying notes are an integral part of these financial statements.
Wells Fargo Diversified Income Builder Fund | 7
Portfolio of investments—March 31, 2020 (unaudited)
| | | | | | | | | | | | | | | | |
| | | | | | | | | Shares | | | Value | |
| | | | |
| Household Durables (continued) | | | | | | | | | | | | |
Pulte Group Incorporated # | | | | | | | | | | | 19,692 | | | $ | 439,525 | |
Suzhou Gold Mantis Construction Decoration Company Limited | | | | | | | | | | | 243,500 | | | | 278,232 | |
| | | | |
| | | | | | | | | | | | | | | 2,646,726 | |
| | | | | |
| Internet & Direct Marketing Retail: 0.10% | |
eBay Incorporated | | | | | | | | | | | 19,632 | | | | 590,138 | |
| | | | | | | | | | | | | | | | |
|
| Multiline Retail: 0.11% | |
Target Corporation # | | | | | | | | | | | 7,344 | | | | 682,772 | |
| | | | | | | | | | | | | | | | |
|
| Specialty Retail: 0.21% | |
China Yongda Automobile Service Holding Company | | | | | | | | | | | 195,000 | | | | 156,978 | |
Petrobras Distribuidora SA | | | | | | | | | | | 32,400 | | | | 96,712 | |
The TJX Companies Incorporated # | | | | | | | | | | | 21,283 | | | | 1,017,540 | |
| |
| | | | 1,271,230 | |
| | | | | |
|
| Textiles, Apparel & Luxury Goods: 0.02% | |
Topsports International Holdings Limited | | | | | | | | | | | 125,000 | | | | 129,559 | |
| | | | | | | | | | | | | | | | |
|
Consumer Staples: 1.01% | |
|
| Food & Staples Retailing: 0.20% | |
Walmart de Mexico SAB de CV | | | | | | | | | | | 77,500 | | | | 182,589 | |
Walmart Incorporated # | | | | | | | | | | | 7,184 | | | | 816,246 | |
X5 Retail Group NV GDR | | | | | | | | | | | 7,102 | | | | 189,765 | |
| |
| | | | 1,188,600 | |
| | | | | |
|
| Food Products: 0.58% | |
Dali Foods Group Company Limited 144A | | | | | | | | | | | 239,500 | | | | 166,100 | |
Lamb Weston Holdings Incorporated | | | | | | | | | | | 20,000 | | | | 1,142,000 | |
Nestle SA | | | | | | | | | | | 13,390 | | | | 1,370,705 | |
Tingyi Holding Corporation | | | | | | | | | | | 146,000 | | | | 237,372 | |
Uni-President China Holdings Limited | | | | | | | | | | | 156,000 | | | | 150,773 | |
Uni-President Enterprises Corporation | | | | | | | | | | | 59,000 | | | | 127,701 | |
WH Group Limited 144A | | | | | | | | | | | 325,000 | | | | 299,978 | |
| |
| | | | 3,494,629 | |
| | | | | |
|
| Household Products: 0.19% | |
Kimberly-Clark de Mexico SAB de CV Class A | | | | | | | | | | | 46,796 | | | | 71,133 | |
The Procter & Gamble Company # | | | | | | | | | | | 9,851 | | | | 1,083,610 | |
| |
| | | | 1,154,743 | |
| | | | | |
|
| Personal Products: 0.04% | |
Hengan International Group Company Limited | | | | | | | | | | | 37,600 | | | | 280,841 | |
| | | | | | | | | | | | | | | | |
|
Energy: 2.42% | |
|
| Energy Equipment & Services: 0.01% | |
USA Compression Partners LP | | | | | | | | | | | 8,558 | | | | 48,438 | |
| | | | | | | | | | | | | | | | |
|
| Oil, Gas & Consumable Fuels: 2.41% | |
Alliance Resource Partners LP | | | | | | | | | | | 17,805 | | | | 55,196 | |
Bharat Petroleum Corporation Limited | | | | | | | | | | | 75,519 | | | | 316,050 | |
Black Stone Minerals LP | | | | | | | | | | | 28,979 | | | | 135,622 | |
BP Midstream Partners LP | | | | | | | | | | | 8,281 | | | | 77,096 | |
Calumet Specialty Products LP † | | | | | | | | | | | 10,777 | | | | 11,316 | |
Canadian Natural Resources Limited | | | | | | | | | | | 27,734 | | | | 379,364 | |
The accompanying notes are an integral part of these financial statements.
8 | Wells Fargo Diversified Income Builder Fund
Portfolio of investments—March 31, 2020 (unaudited)
| | | | | | | | | | | | | | | | |
| | | | | | | | | Shares | | | Value | |
|
| Oil, Gas & Consumable Fuels (continued) | |
Capital Product Partners LP | | | | | | | | | | | 2,430 | | | $ | 17,788 | |
Cheniere Energy Partners LP | | | | | | | | | | | 7,266 | | | | 196,255 | |
CNOOC Limited | | | | | | | | | | | 522,297 | | | | 542,757 | |
CNX Midstream Partners LP | | | | | | | | | | | 7,326 | | | | 59,341 | |
ConocoPhillips # | | | | | | | | | | | 16,500 | | | | 508,200 | |
Consol Coal Resources LP | | | | | | | | | | | 911 | | | | 5,193 | |
Crestwood Equity Partners LP | | | | | | | | | | | 8,539 | | | | 36,120 | |
CrossAmerica Partners LP | | | | | | | | | | | 1,854 | | | | 14,943 | |
DCP Midstream LP | | | | | | | | | | | 15,561 | | | | 63,333 | |
Delek Logistics Partners LP | | | | | | | | | | | 1,526 | | | | 13,887 | |
Dorchester Minerals LP | | | | | | | | | | | 5,060 | | | | 47,109 | |
Enable Midstream Partners LP | | | | | | | | | | | 9,826 | | | | 25,253 | |
Energy Transfer Equity LP | | | | | | | | | | | 400,529 | | | | 1,842,433 | |
Enterprise Products Partners | | | | | | | | | | | 258,123 | | | | 3,691,159 | |
Enviva Partners LP | | | | | | | | | | | 3,660 | | | | 97,795 | |
EQT Midstream Partners LP | | | | | | | | | | | 14,277 | | | | 168,469 | |
Gazprom PAO ADR | | | | | | | | | | | 22,213 | | | | 100,730 | |
Genesis Energy LP | | | | | | | | | | | 19,156 | | | | 75,092 | |
Global Partners LP | | | | | | | | | | | 4,842 | | | | 42,706 | |
Golar LNG Partners LP | | | | | | | | | | | 8,355 | | | | 28,073 | |
Green Plains Partners LP | | | | | | | | | | | 1,970 | | | | 13,081 | |
Hindustan Petroleum Corporation Limited | | | | | | | | | | | 88,872 | | | | 222,837 | |
Holly Energy Partners LP | | | | | | | | | | | 7,875 | | | | 110,486 | |
KNOT Offshore Partners LP | | | | | | | | | | | 3,804 | | | | 38,801 | |
Lukoil PJSC ADR | | | | | | | | | | | 2,200 | | | | 129,650 | |
Magellan Midstream Partners LP | | | | | | | | | | | 39,675 | | | | 1,447,741 | |
MPLX LP | | | | | | | | | | | 66,183 | | | | 769,046 | |
Natural Resource Partners LP | | | | | | | | | | | 1,405 | | | | 17,141 | |
NGL Energy Partners LP | | | | | | | | | | | 22,241 | | | | 57,827 | |
Noble Midstream Partners LP | | | | | | | | | | | 5,799 | | | | 20,297 | |
NuStar Energy LP | | | | | | | | | | | 17,038 | | | | 146,356 | |
Oasis Midstream Partners LP | | | | | | | | | | | 1,879 | | | | 9,301 | |
ONEOK Incorporated | | | | | | | | | | | 24,000 | | | | 523,440 | |
PBF Logistics LP | | | | | | | | | | | 4,747 | | | | 32,090 | |
PetroChina Company Limited H Shares | | | | | | | | | | | 348,000 | | | | 126,129 | |
Phillips 66 Partners LP | | | | | | | | | | | 9,865 | | | | 359,382 | |
Plains All American Pipeline LP | | | | | | | | | | | 75,878 | | | | 400,636 | |
Shell Midstream Partners LP | | | | | | | | | | | 22,288 | | | | 222,434 | |
Sprague Resources LP | | | | | | | | | | | 1,737 | | | | 22,720 | |
Summit Midstream Partners LP | | | | | | | | | | | 7,185 | | | | 4,383 | |
Sunoco LP | | | | | | | | | | | 9,343 | | | | 146,125 | |
TC Pipelines LP | | | | | | | | | | | 9,413 | | | | 258,669 | |
USD Partners LP | | | | | | | | | | | 1,696 | | | | 4,884 | |
Valero Energy Corporation # | | | | | | | | | | | 17,489 | | | | 793,301 | |
Western Midstream Partners LP | | | | | | | | | | | 34,623 | | | | 112,179 | |
| |
| | | | 14,540,216 | |
| | | | | |
|
Financials: 2.61% | |
|
| Banks: 1.05% | |
Banco de Brasil SA | | | | | | | | | | | 68,584 | | | | 368,124 | |
Bangkok Bank PCL | | | | | | | | | | | 36,100 | | | | 111,808 | |
Bank of the Philippine Islands | | | | | | | | | | | 91,310 | | | | 111,083 | |
BNP Paribas SA | | | | | | | | | | | 14,238 | | | | 415,682 | |
China Construction Bank H Shares | | | | | | | | | | | 995,000 | | | | 808,782 | |
China Merchants Bank Company Limited H Shares | | | | | | | | | | | 49,500 | | | | 221,452 | |
CIMB Group Holdings Bhd | | | | | | | | | | | 154,838 | | | | 128,848 | |
The accompanying notes are an integral part of these financial statements.
Wells Fargo Diversified Income Builder Fund | 9
Portfolio of investments—March 31, 2020 (unaudited)
| | | | | | | | | | | | | | | | |
| | | | | | | | | Shares | | | Value | |
|
| Banks (continued) | |
Citigroup Incorporated # | | | | | | | | | | | 16,731 | | | $ | 704,710 | |
Credicorp Limited | | | | | | | | | | | 711 | | | | 101,723 | |
CTBC Financial Holding Company Limited | | | | | | | | | | | 397,000 | | | | 233,769 | |
Industrial & Commercial Bank of China Limited H Shares | | | | | | | | | | | 904,000 | | | | 616,689 | |
ING Groep NV | | | | | | | | | | | 76,141 | | | | 390,154 | |
JPMorgan Chase & Company # | | | | | | | | | | | 11,947 | | | | 1,075,588 | |
KB Financial Group Incorporated | | | | | | | | | | | 7,635 | | | | 214,727 | |
National Commercial Bank | | | | | | | | | | | 23,347 | | | | 215,204 | |
PT Bank Rakyat Indonesia Tbk | | | | | | | | | | | 777,600 | | | | 142,616 | |
Qatar National Bank | | | | | | | | | | | 31,155 | | | | 142,370 | |
RHB Capital Bhd | | | | | | | | | | | 112,100 | | | | 121,976 | |
Sberbank PJSC of Russia ADR | | | | | | | | | | | 13,753 | | | | 129,551 | |
Standard Bank Group Limited | | | | | | | | | | | 18,048 | | | | 103,291 | |
| |
| | | | 6,358,147 | |
| | | | | |
|
| Capital Markets: 0.64% | |
Ares Capital Corporation # | | | | | | | | | | | 87,753 | | | | 945,977 | |
B3 Brasil Bolsa Balcao SA | | | | | | | | | | | 26,700 | | | | 184,471 | |
Banco BTG Pactual SA | | | | | | | | | | | 17,600 | | | | 112,589 | |
BlackRock Incorporated | | | | | | | | | | | 1,357 | | | | 597,039 | |
Hercules Capital Incorporated # | | | | | | | | | | | 44,924 | | | | 343,219 | |
Intermediate Capital Group | | | | | | | | | | | 75,428 | | | | 832,511 | |
Morgan Stanley # | | | | | | | | | | | 20,452 | | | | 695,368 | |
NH Investment & Securities Company Limited | | | | | | | | | | | 21,994 | | | | 160,958 | |
| |
| | | | 3,872,132 | |
| | | | | |
|
| Diversified Financial Services: 0.10% | |
ORIX Corporation | | | | | | | | | | | 47,800 | | | | 570,286 | |
| | | | | | | | | | | | | | | | |
|
| Insurance: 0.77% | |
China Life Insurance Company H Shares | | | | | | | | | | | 95,000 | | | | 183,450 | |
Chubb Limited | | | | | | | | | | | 20,000 | | | | 2,233,800 | |
Legal & General Group plc | | | | | | | | | | | 238,128 | | | | 562,625 | |
PICC Property & Casualty Company Limited H Shares | | | | | | | | | | | 150,000 | | | | 143,637 | |
Ping An Insurance Group Company H Shares | | | | | | | | | | | 138,400 | | | | 1,351,650 | |
Powszechny Zaklad Ubezpieczen SA | | | | | | | | | | | 20,586 | | | | 154,642 | |
| |
| | | | 4,629,804 | |
| | | | | |
|
| Mortgage REITs: 0.05% | |
New Residential Investment Corporation # | | | | | | | | | | | 55,640 | | | | 278,756 | |
| | | | | | | | | | | | | | | | |
|
Health Care: 3.15% | |
|
| Biotechnology: 0.50% | |
AbbVie Incorporated # | | | | | | | | | | | 15,318 | | | | 1,167,078 | |
Amgen Incorporated # | | | | | | | | | | | 4,100 | | | | 831,193 | |
Gilead Sciences Incorporated # | | | | | | | | | | | 13,546 | | | | 1,012,699 | |
| |
| | | | 3,010,970 | |
| | | | | |
|
| Health Care Equipment & Supplies: 0.79% | |
Abbott Laboratories | | | | | | | | | | | 25,000 | | | | 1,972,750 | |
Becton Dickinson & Company | | | | | | | | | | | 8,000 | | | | 1,838,160 | |
Danaher Corporation | | | | | | | | | | | 7,000 | | | | 968,870 | |
| |
| | | | 4,779,780 | |
| | | | | |
The accompanying notes are an integral part of these financial statements.
10 | Wells Fargo Diversified Income Builder Fund
Portfolio of investments—March 31, 2020 (unaudited)
| | | | | | | | | | | | | | | | |
| | | | | | | | | Shares | | | Value | |
| Health Care Providers & Services: 0.46% | |
CVS Health Corporation # | | | | | | | | | | | 14,209 | | | $ | 843,020 | |
HCA Healthcare Incorporated # | | | | | | | | | | | 7,023 | | | | 631,017 | |
Sinopharm Group Company Limited H Shares | | | | | | | | | | | 88,800 | | | | 196,754 | |
UnitedHealth Group Incorporated # | | | | | | | | | | | 4,477 | | | | 1,116,474 | |
| |
| | | | 2,787,265 | |
| | | | | |
|
| Life Sciences Tools & Services: 0.24% | |
Thermo Fisher Scientific Incorporated | | | | | | | | | | | 5,000 | | | | 1,418,000 | |
| | | | | | | | | | | | | | | | |
|
| Pharmaceuticals: 1.16% | |
Astellas Pharma Incorporated | | | | | | | | | | | 73,762 | | | | 1,136,478 | |
Bristol-Myers Squibb Company # | | | | | | | | | | | 30,589 | | | | 1,705,031 | |
Johnson & Johnson # | | | | | | | | | | | 7,282 | | | | 954,889 | |
Novartis AG | | | | | | | | | | | 13,842 | | | | 1,141,948 | |
Roche Holding AG | | | | | | | | | | | 3,767 | | | | 1,212,002 | |
Sanofi SA | | | | | | | | | | | 9,632 | | | | 833,888 | |
| |
| | | | 6,984,236 | |
| | | | | |
|
Industrials: 2.11% | |
|
| Aerospace & Defense: 0.63% | |
Curtiss-Wright Corporation | | | | | | | | | | | 12,647 | | | | 1,168,709 | |
Huntington Ingalls Industries Incorporated | | | | | | | | | | | 8,000 | | | | 1,457,680 | |
Raytheon Company | | | | | | | | | | | 9,000 | | | | 1,180,350 | |
| |
| | | | 3,806,739 | |
| | | | | |
|
| Construction & Engineering: 0.25% | |
Bouygues SA | | | | | | | | | | | 28,961 | | | | 840,482 | |
China Communications Services Corporation Limited H Shares | | | | | | | | | | | 370,000 | | | | 266,050 | |
China State Construction Engineering Corporation Limited Class A | | | | | | | | | | | 233,800 | | | | 171,929 | |
China State Construction International Holdings | | | | | | | | | | | 292,000 | | | | 214,143 | |
| |
| | | | 1,492,604 | |
| | | | | |
|
| Electrical Equipment: 0.35% | |
AMETEK Incorporated | | | | | | | | | | | 15,000 | | | | 1,080,300 | |
Nari Technology Company Limited | | | | | | | | | | | 79,400 | | | | 217,946 | |
Schneider Electric SE | | | | | | | | | | | 9,987 | | | | 844,130 | |
| |
| | | | 2,142,376 | |
| | | | | |
|
| Industrial Conglomerates: 0.14% | |
Honeywell International Incorporated # | | | | | | | | | | | 5,025 | | | | 672,295 | |
The Bidvest Group Limited | | | | | | | | | | | 20,558 | | | | 167,602 | |
| |
| | | | 839,897 | |
| | | | | |
|
| Machinery: 0.52% | |
IDEX Corporation | | | | | | | | | | | 9,000 | | | | 1,242,990 | |
John Bean Technologies Corporation | | | | | | | | | | | 20,000 | | | | 1,485,400 | |
Weichai Power Company Limited H Shares | | | | | | | | | | | 115,000 | | | | 183,183 | |
Zhengzhou Yutong Bus Company Limited Class A | | | | | | | | | | | 107,100 | | | | 204,758 | |
| |
| | | | 3,116,331 | |
| | | | | |
|
| Trading Companies & Distributors: 0.18% | |
Itochu Corporation | | | | | | | | | | | 52,753 | | | | 1,091,703 | |
| | | | | | | | | | | | | | | | |
The accompanying notes are an integral part of these financial statements.
Wells Fargo Diversified Income Builder Fund | 11
Portfolio of investments—March 31, 2020 (unaudited)
| | | | | | | | | | | | | | | | |
| | | | | | | | | Shares | | | Value | |
| Transportation Infrastructure: 0.04% | |
China Merchants Port Holdings Company Limited | | | | | | | | | | | 204,000 | | | $ | 231,745 | |
| | | | | | | | | | | | | | | | |
|
Information Technology: 6.46% | |
|
| Communications Equipment: 0.38% | |
Accton Technology Corporation | | | | | | | | | | | 26,000 | | | | 139,115 | |
Cisco Systems Incorporated # | | | | | | | | | | | 55,380 | | | | 2,176,988 | |
| |
| | | | 2,316,103 | |
| | | | | |
|
| Electronic Equipment, Instruments & Components: 0.88% | |
Amphenol Corporation Class A | | | | | | | | | | | 25,000 | | | | 1,822,000 | |
Corning Incorporated | | | | | | | | | | | 80,000 | | | | 1,643,200 | |
Delta Electronics Incorporated | | | | | | | | | | | 34,000 | | | | 134,566 | |
FLIR Systems Incorporated | | | | | | | | | | | 22,000 | | | | 701,580 | |
Hon Hai Precision Industry Company Limited | | | | | | | | | | | 57,600 | | | | 132,611 | |
Keysight Technologies Incorporated †# | | | | | | | | | | | 8,609 | | | | 720,401 | |
Largan Precision Company Limited | | | | | | | | | | | 970 | | | | 122,481 | |
| |
| | | | 5,276,839 | |
| | | | | |
|
| IT Services: 1.17% | |
Amdocs Limited # | | | | | | | | | | | 12,418 | | | | 682,617 | |
Infosys Limited ADR | | | | | | | | | | | 48,386 | | | | 397,249 | |
International Business Machines Corporation # | | | | | | | | | | | 8,814 | | | | 977,737 | |
Leidos Holdings Incorporated # | | | | | | | | | | | 39,057 | | | | 3,579,574 | |
Tech Mahindra Limited | | | | | | | | | | | 45,536 | | | | 339,195 | |
Visa Incorporated Class A # | | | | | | | | | | | 6,523 | | | | 1,050,986 | |
| |
| | | | 7,027,358 | |
| | | | | |
|
| Semiconductors & Semiconductor Equipment: 1.72% | |
ASE Technology Holding Company Limited | | | | | | | | | | | 66,000 | | | | 127,843 | |
ASM Pacific Technology | | | | | | | | | | | 18,400 | | | | 170,611 | |
Broadcom Incorporated | | | | | | | | | | | 10,000 | | | | 2,371,000 | |
Cypress Semiconductor Corporation | | | | | | | | | | | 100,000 | | | | 2,332,000 | |
KLA-Tencor Corporation # | | | | | | | | | | | 5,350 | | | | 769,009 | |
Mediatek Incorporated | | | | | | | | | | | 11,600 | | | | 124,505 | |
Microchip Technology Incorporated | | | | | | | | | | | 9,000 | | | | 610,200 | |
SK Hynix Incorporated | | | | | | | | | | | 5,780 | | | | 390,751 | |
Taiwan Semiconductor Manufacturing Company Limited | | | | | | | | | | | 145,000 | | | | 1,305,335 | |
Taiwan Semiconductor Manufacturing Company Limited ADR # | | | | | | | | | | | 14,500 | | | | 692,955 | |
Texas Instruments Incorporated # | | | | | | | | | | | 15,089 | | | | 1,507,844 | |
| |
| | | | 10,402,053 | |
| | | | | |
|
| Software: 1.24% | |
Adobe Incorporated † | | | | | | | | | | | 7,000 | | | | 2,227,680 | |
Microsoft Corporation # | | | | | | | | | | | 15,307 | | | | 2,414,067 | |
SAP SE | | | | | | | | | | | 8,180 | | | | 913,280 | |
Synopsys Incorporated † | | | | | | | | | | | 15,000 | | | | 1,931,850 | |
| |
| | | | 7,486,877 | |
| | | | | |
|
| Technology Hardware, Storage & Peripherals: 1.07% | |
Apple Incorporated # | | | | | | | | | | | 6,280 | | | | 1,596,941 | |
Lenovo Group Limited | | | | | | | | | | | 2,241,494 | | | | 1,187,414 | |
Quanta Computer Incorporated | | | | | | | | | | | 127,000 | | | | 251,478 | |
Samsung Electronics Company Limited | | | | | | | | | | | 34,476 | | | | 1,340,478 | |
Samsung Electronics Company Limited GDR 144A | | | | | | | | | | | 1,122 | | | | 1,109,812 | |
The accompanying notes are an integral part of these financial statements.
12 | Wells Fargo Diversified Income Builder Fund
Portfolio of investments—March 31, 2020 (unaudited)
| | | | | | | | | | | | | | | | |
| | | | | | | | | Shares | | | Value | |
|
| Technology Hardware, Storage & Peripherals (continued) | |
Western Digital Corporation | | | | | | | | | | | 20,000 | | | $ | 832,400 | |
Wiwynn Corporation | | | | | | | | | | | 6,400 | | | | 147,157 | |
| |
| | | | 6,465,680 | |
| | | | | |
|
Materials: 1.00% | |
|
| Chemicals: 0.33% | |
Celanese Corporation Series A | | | | | | | | | | | 6,000 | | | | 440,340 | |
Ciner Resources LP | | | | | | | | | | | 857 | | | | 8,879 | |
CVR Partners LP | | | | | | | | | | | 12,987 | | | | 13,377 | |
LyondellBasell Industries NV Class A | | | | | | | | | | | 24,125 | | | | 1,197,324 | |
Sociedad Quimica Minera de Chile | | | | | | | | | | | 5,791 | | | | 130,587 | |
Wanhua Chemical Group Company Limited Class A | | | | | | | | | | | 22,100 | | | | 127,326 | |
Westlake Chemical Partners LP | | | | | | | | | | | 3,362 | | | | 49,690 | |
| |
| | | | 1,967,523 | |
| | | | | |
|
| Metals & Mining: 0.64% | |
Barrick Gold Corporation | | | | | | | | | | | 50,357 | | | | 925,341 | |
Fortescue Metals Group Limited | | | | | | | | | | | 187,370 | | | | 1,148,245 | |
Kumba Iron Ore Limited | | | | | | | | | | | 16,077 | | | | 250,685 | |
Magnitogorsk Iron & Steel Works PJSC | | | | | | | | | | | 262,100 | | | | 125,862 | |
Polymetal International plc | | | | | | | | | | | 17,684 | | | | 302,669 | |
Rio Tinto plc | | | | | | | | | | | 15,107 | | | | 692,539 | |
Southern Copper Corporation | | | | | | | | | | | 6,321 | | | | 177,999 | |
Vale SA | | | | | | | | | | | 30,100 | | | | 250,365 | |
| |
| | | | 3,873,705 | |
| | | | | |
|
| Paper & Forest Products: 0.03% | |
Mondi plc | | | | | | | | | | | 8,291 | | | | 139,916 | |
Pope Resources LP | | | | | | | | | | | 560 | | | | 48,042 | |
| |
| | | | 187,958 | |
| | | | | |
|
Real Estate: 1.35% | |
|
| Equity REITs: 1.00% | |
Crown Castle International Corporation | | | | | | | | | | | 20,000 | | | | 2,888,000 | |
Embassy Office Parks REIT | | | | | | | | | | | 39,800 | | | | 183,931 | |
Fibra Uno Administracion SAB de CV | | | | | | | | | | | 154,916 | | | | 121,595 | |
Gaming and Leisure Properties Incorporated # | | | | | | | | | | | 38,730 | | | | 1,073,208 | |
Life Storage Incorporated # | | | | | | | | | | | 6,512 | | | | 615,710 | |
Saul Centers Incorporated | | | | | | | | | | | 35,000 | | | | 1,145,900 | |
| |
| | | | 6,028,344 | |
| | | | | |
|
| Real Estate Management & Development: 0.35% | |
China Merchants Shekou Industrial Zone Holdings Company Limited Class A | | | | | | | | | | | 70,300 | | | | 161,929 | |
China Overseas Land & Investment Limited | | | | | | | | | | | 73,400 | | | | 225,039 | |
China Resources Land Limited | | | | | | | | | | | 71,350 | | | | 291,214 | |
China Vanke Company Limited Class A | | | | | | | | | | | 66,694 | | | | 238,685 | |
Logan Property Holdings Company Limited | | | | | | | | | | | 662,442 | | | | 1,007,696 | |
Shimao Property Holding Limited | | | | | | | | | | | 47,000 | | | | 162,884 | |
| |
| | | | 2,087,447 | |
| | | | | |
The accompanying notes are an integral part of these financial statements.
Wells Fargo Diversified Income Builder Fund | 13
Portfolio of investments—March 31, 2020 (unaudited)
| | | | | | | | | | | | | | | | |
| | | | | | | | | Shares | | | Value | |
| Utilities: 1.84% | |
|
| Electric Utilities: 0.48% | |
American Electric Power Company Incorporated | | | | | | | | | | | 34,000 | | | $ | 2,719,320 | |
Red Eléctrica de Espana SA | | | | | | | | | | | 10,658 | | | | 191,519 | |
| |
| | | | 2,910,839 | |
| | | | | |
|
| Gas Utilities: 0.49% | |
Atmos Energy Corporation | | | | | | | | | | | 20,000 | | | | 1,984,600 | |
ENN Energy Holdings Limited | | | | | | | | | | | 13,400 | | | | 129,809 | |
Gail India Limited | | | | | | | | | | | 150,025 | | | | 150,610 | |
Infraestructura Energetica Nova SAB de CV | | | | | | | | | | | 68,000 | | | | 208,708 | |
Kunlun Energy Company Limited | | | | | | | | | | | 236,000 | | | | 136,387 | |
Mahanagar Gas Limited | | | | | | | | | | | 14,905 | | | | 161,340 | |
Suburban Propane Partners LP | | | | | | | | | | | 10,782 | | | | 152,457 | |
| | | | |
| | | | | | | | | | | | | | | 2,923,911 | |
| | | | | | | | | | | | | | | | |
| | | | |
| Independent Power & Renewable Electricity Producers: 0.13% | | | | | | | | | | | | |
Drax Group plc | | | | | | | | | | | 239,949 | | | | 453,790 | |
Vistra Energy Corporation | | | | | | | | | | | 20,000 | | | | 319,200 | |
| | | | |
| | | | | | | | | | | | | | | 772,990 | |
| | | | | | | | | | | | | | | | |
| | | | |
| Multi-Utilities: 0.72% | | | | | | | | | | | | |
CMS Energy Corporation | | | | | | | | | | | 37,000 | | | | 2,173,750 | |
DTE Energy Company | | | | | | | | | | | 16,000 | | | | 1,519,520 | |
Engie SA | | | | | | | | | | | 65,775 | | | | 673,565 | |
| | | | |
| | | | | | | | | | | | | | | 4,366,835 | |
| | | | | | | | | | | | | | | | |
| | | | |
| Water Utilities: 0.02% | | | | | | | | | | | | |
Beijing Enterprises Water Group Limited | | | | | | | | | | | 326,000 | | | | 126,386 | |
| | | | | | | | | | | | | | | | |
| | | | |
Total Common Stocks (Cost $167,716,671) | | | | | | | | | | | | | | | 145,366,706 | |
| | | | | |
| | | | |
| | | | | | | | | | | | | | | | |
| | | Interest
rate | | | Maturity
date | | | Principal | | | | |
| Corporate Bonds and Notes: 53.40% | |
|
Communication Services: 0.20% | |
|
| Media: 0.20% | |
McGraw-Hill Global Education Holdings LLC 144A | | | 7.88 | % | | | 5-15-2024 | | | $ | 1,598,000 | | | | 1,190,510 | |
| | | | | | | | | | | | | | | | |
|
Consumer Discretionary: 4.77% | |
|
| Auto Components: 1.77% | |
Dana Holding Corporation | | | 5.50 | | | | 12-15-2024 | | | | 3,925,000 | | | | 3,424,602 | |
Speedway Motors Incorporated 144A | | | 4.88 | | | | 11-1-2027 | | | | 3,000,000 | | | | 2,700,000 | |
Tenneco Incorporated | | | 5.00 | | | | 7-15-2026 | | | | 7,250,000 | | | | 4,549,375 | |
| |
| | | | 10,673,977 | |
| | | | | |
|
| Hotels, Restaurants & Leisure: 0.40% | |
1929 Fieldhouse LLC / West Ward Street Development Corporation 144A | | | 5.25 | | | | 6-1-2020 | | | | 2,410,000 | | | | 2,419,272 | |
| | | | | | | | | | | | | | | | |
|
| Household Durables: 1.92% | |
Installed Building Company 144A | | | 5.75 | | | | 2-1-2028 | | | | 12,140,000 | | | | 11,563,350 | |
| | | | | | | | | | | | | | | | |
|
| Specialty Retail: 0.68% | |
Group 1 Automotive Incorporated | | | 5.00 | | | | 6-1-2022 | | | | 4,453,000 | | | | 4,096,760 | |
| | | | | | | | | | | | | | | | |
The accompanying notes are an integral part of these financial statements.
14 | Wells Fargo Diversified Income Builder Fund
Portfolio of investments—March 31, 2020 (unaudited)
| | | | | | | | | | | | | | | | |
| | | Interest
rate | | | Maturity
date | | | Principal | | | Value | |
| Consumer Staples: 2.32% | |
|
| Food Products: 2.32% | |
Lamb Weston Holdings Incorporated 144A | | | 4.63 | % | | | 11-1-2024 | | | $ | 9,000,000 | | | $ | 8,865,000 | |
Post Holdings Incorporated 144A | | | 5.00 | | | | 8-15-2026 | | | | 5,000,000 | | | | 5,145,750 | |
| |
| | | | 14,010,750 | |
| | | | | |
|
Energy: 1.41% | |
|
| Oil, Gas & Consumable Fuels: 1.41% | |
Cheniere Corpus Christi Holdings LLC | | | 5.13 | | | | 6-30-2027 | | | | 9,500,000 | | | | 8,503,677 | |
| | | | | | | | | | | | | | | | |
|
Financials: 0.79% | |
|
| Banks: 0.56% | |
Allied Irish Banks plc (5 Year EUR Swap +7.34%)± | | | 7.38 | | | | 12-29-2049 | | | | 1,500,000 | | | | 1,605,463 | |
Citigroup Incorporated (U.S. SOFR +3.23%)±(s) | | | 4.70 | | | | 1-30-2025 | | | | 1,000,000 | | | | 865,000 | |
JPMorgan Chase & Company (U.S. SOFR +3.13%)±(s) | | | 4.60 | | | | 2-1-2025 | | | | 1,000,000 | | | | 875,200 | |
| |
| | | | 3,345,663 | |
| | | | | |
|
| Diversified Financial Services: 0.23% | |
Toll Road Investors Partnership II LP 144A¤ | | | 0.00 | | | | 2-15-2030 | | | | 2,000,000 | | | | 1,402,323 | |
| | | | | | | | | | | | | | | | |
|
Health Care: 14.47% | |
|
| Health Care Equipment & Supplies: 2.77% | |
Hologic Incorporated 144A | | | 4.38 | | | | 10-15-2025 | | | | 7,000,000 | | | | 6,932,030 | |
Teleflex Incorporated | | | 4.63 | | | | 11-15-2027 | | | | 1,984,000 | | | | 1,981,818 | |
Teleflex Incorporated | | | 4.88 | | | | 6-1-2026 | | | | 8,000,000 | | | | 7,800,000 | |
| |
| | | | 16,713,848 | |
| | | | | |
|
| Health Care Providers & Services: 7.94% | |
AMN Healthcare Incorporated 144A | | | 5.13 | | | | 10-1-2024 | | | | 9,335,000 | | | | 8,961,600 | |
Centene Corporation 144A | | | 3.38 | | | | 2-15-2030 | | | | 3,000,000 | | | | 2,790,000 | |
Centene Corporation 144A | | | 4.63 | | | | 12-15-2029 | | | | 7,000,000 | | | | 7,035,000 | |
Davita Incorporated | | | 5.00 | | | | 5-1-2025 | | | | 9,000,000 | | | | 8,988,210 | |
HCA Incorporated | | | 5.38 | | | | 2-1-2025 | | | | 9,500,000 | | | | 9,666,155 | |
HealthSouth Corporation | | | 5.13 | | | | 3-15-2023 | | | | 2,000,000 | | | | 1,980,000 | |
Montefiore Obligated Group | | | 4.29 | | | | 9-1-2050 | | | | 1,670,000 | | | | 1,437,934 | |
St. Joseph’s Hospital & Medical Center | | | 3.93 | | | | 7-1-2022 | | | | 2,000,000 | | | | 2,058,741 | |
West Street Merger Sub Incorporated 144A | | | 6.38 | | | | 9-1-2025 | | | | 5,700,000 | | | | 4,968,690 | |
| |
| | | | 47,886,330 | |
| | | | | |
|
| Health Care Technology: 0.85% | |
Quintiles IMS Holdings Incorporated 144A | | | 5.00 | | | | 10-15-2026 | | | | 5,000,000 | | | | 5,100,000 | |
| | | | | | | | | | | | | | | | |
|
| Life Sciences Tools & Services: 1.34% | |
Charles River Laboratories Incorporated 144A | | | 5.50 | | | | 4-1-2026 | | | | 5,075,000 | | | | 5,176,500 | |
Charles River Laboratories Incorporated 144A | | | 4.25 | | | | 5-1-2028 | | | | 3,000,000 | | | | 2,891,700 | |
| |
| | | | 8,068,200 | |
| | | | | |
|
| Pharmaceuticals: 1.57% | |
Bausch Health Companies Incorporated 144A | | | 5.25 | | | | 1-30-2030 | | | | 1,550,000 | | | | 1,449,250 | |
Catalent Pharma Solutions Incorporated 144A | | | 4.88 | | | | 1-15-2026 | | | | 8,300,000 | | | | 8,051,000 | |
| |
| | | | 9,500,250 | |
| | | | | |
The accompanying notes are an integral part of these financial statements.
Wells Fargo Diversified Income Builder Fund | 15
Portfolio of investments—March 31, 2020 (unaudited)
| | | | | | | | | | | | | | | | |
| | | Interest
rate | | | Maturity
date | | | Principal | | | Value | |
| Industrials: 8.97% | |
|
| Aerospace & Defense: 1.50% | |
Moog Incorporated 144A | | | 4.25 | % | | | 12-15-2027 | | | $ | 700,000 | | | $ | 631,750 | |
TransDigm Group Incorporated | | | 6.38 | | | | 6-15-2026 | | | | 8,800,000 | | | | 8,426,000 | |
| |
| | | | 9,057,750 | |
| | | | | |
|
| Commercial Services & Supplies: 2.41% | |
ACCO Brands Corporation 144A | | | 5.25 | | | | 12-15-2024 | | | | 5,000,000 | | | | 4,800,000 | |
Clean Harbors Incorporated 144A | | | 5.13 | | | | 7-15-2029 | | | | 2,000,000 | | | | 1,860,000 | |
Northern Light Health | | | 5.02 | | | | 7-1-2036 | | | | 1,000,000 | | | | 1,019,519 | |
South Nassau Communities Hospital Incorporated | | | 4.65 | | | | 8-1-2048 | | | | 2,000,000 | | | | 1,925,164 | |
Stericycle Incorporated 144A | | | 5.38 | | | | 7-15-2024 | | | | 5,000,000 | | | | 4,950,000 | |
| |
| | | | 14,554,683 | |
| | | | | |
|
| Construction & Engineering: 0.30% | |
Aecom Company | | | 5.13 | | | | 3-15-2027 | | | | 2,000,000 | | | | 1,800,000 | |
| | | | | | | | | | | | | | | | |
|
| Electrical Equipment: 0.43% | |
Resideo Funding Incorporated 144A | | | 6.13 | | | | 11-1-2026 | | | | 3,000,000 | | | | 2,617,500 | |
| | | | | | | | | | | | | | | | |
|
| Machinery: 3.06% | |
Actuant Corporation | | | 5.63 | | | | 6-15-2022 | | | | 1,165,000 | | | | 1,077,625 | |
HD Supply Incorporated 144A | | | 5.38 | | | | 10-15-2026 | | | | 8,100,000 | | | | 7,874,172 | |
SPX FLOW Incorporated 144A | | | 5.63 | | | | 8-15-2024 | | | | 4,500,000 | | | | 4,365,000 | |
SPX FLOW Incorporated 144A | | | 5.88 | | | | 8-15-2026 | | | | 5,328,000 | | | | 5,114,880 | |
| |
| | | | 18,431,677 | |
| | | | | |
|
| Trading Companies & Distributors: 1.27% | |
WESCO Distribution Incorporated | | | 5.38 | | | | 6-15-2024 | | | | 8,974,000 | | | | 7,627,900 | |
| | | | | | | | | | | | | | | | |
|
Information Technology: 6.30% | |
|
| Communications Equipment: 0.94% | |
CommScope Technologies Finance LLC 144A | | | 5.00 | | | | 3-15-2027 | | | | 6,500,000 | | | | 5,638,750 | |
| | | | | | | | | | | | | | | | |
|
| Electronic Equipment, Instruments & Components: 3.62% | |
Anixter International Incorporated | | | 5.13 | | | | 10-1-2021 | | | | 3,000,000 | | | | 3,020,280 | |
MTS Systems Corporation 144A | | | 5.75 | | | | 8-15-2027 | | | | 5,340,000 | | | | 4,952,850 | |
TTM Technologies Incorporated 144A | | | 5.63 | | | | 10-1-2025 | | | | 16,495,000 | | | | 13,855,800 | |
| |
| | | | 21,828,930 | |
| | | | | |
|
| IT Services: 0.32% | |
Gartner Incorporated 144A | | | 5.13 | | | | 4-1-2025 | | | | 2,000,000 | | | | 1,955,000 | |
| | | | | | | | | | | | | | | | |
|
| Technology Hardware, Storage & Peripherals: 1.42% | |
Diebold Nixdorf Incorporated | | | 8.50 | | | | 4-15-2024 | | | | 8,500,000 | | | | 5,525,085 | |
Western Digital Corporation | | | 4.75 | | | | 2-15-2026 | | | | 3,000,000 | | | | 3,049,500 | |
| |
| | | | 8,574,585 | |
| | | | | |
|
Materials: 9.69% | |
|
| Chemicals: 6.47% | |
Koppers Incorporated 144A | | | 6.00 | | | | 2-15-2025 | | | | 13,150,000 | | | | 10,520,000 | |
Olin Corporation | | | 5.13 | | | | 9-15-2027 | | | | 5,000,000 | | | | 4,467,825 | |
Olin Corporation | | | 5.50 | | | | 8-15-2022 | | | | 5,500,000 | | | | 5,060,000 | |
Rayonier Advanced Materials Products Incorporated 144A | | | 5.50 | | | | 6-1-2024 | | | | 6,117,000 | | | | 2,783,235 | |
The accompanying notes are an integral part of these financial statements.
16 | Wells Fargo Diversified Income Builder Fund
Portfolio of investments—March 31, 2020 (unaudited)
| | | | | | | | | | | | | | | | |
| | | Interest
rate | | | Maturity
date | | | Principal | | | Value | |
|
| Chemicals (continued) | |
ScottsMiracle-Gro Company | | | 5.25 | % | | | 12-15-2026 | | | $ | 4,000,000 | | | $ | 3,800,000 | |
Valvoline Incorporated | | | 4.38 | | | | 8-15-2025 | | | | 13,000,000 | | | | 12,382,500 | |
| |
| | | | 39,013,560 | |
| | | | | |
|
| Containers & Packaging: 2.88% | |
Ball Corporation | | | 4.00 | | | | 11-15-2023 | | | | 1,000,000 | | | | 1,007,500 | |
Ball Corporation | | | 5.00 | | | | 3-15-2022 | | | | 2,500,000 | | | | 2,573,300 | |
Berry Global Incorporated | | | 5.13 | | | | 7-15-2023 | | | | 6,500,000 | | | | 6,514,300 | |
Sealed Air Corporation 144A | | | 5.25 | | | | 4-1-2023 | | | | 4,650,000 | | | | 4,773,737 | |
Sealed Air Corporation 144A | | | 5.50 | | | | 9-15-2025 | | | | 2,500,000 | | | | 2,531,275 | |
| |
| | | | 17,400,112 | |
| | | | | |
|
| Metals & Mining: 0.34% | |
Commercial Metals Company | | | 4.88 | | | | 5-15-2023 | | | | 2,150,000 | | | | 2,026,375 | |
| | | | | | | | | | | | | | | | |
|
Real Estate: 4.48% | |
|
| Equity REITs: 4.48% | |
Equinix Incorporated | | | 5.38 | | | | 5-15-2027 | | | | 5,000,000 | | | | 4,988,900 | |
Iron Mountain Incorporated 144A | | | 4.88 | | | | 9-15-2027 | | | | 12,000,000 | | | | 11,640,000 | |
Sabra Health Care LP/Sabra Capital Corporation | | | 3.90 | | | | 10-15-2029 | | | | 4,175,000 | | | | 3,734,988 | |
SBA Communications Corporation 144A | | | 3.88 | | | | 2-15-2027 | | | | 6,650,000 | | | | 6,666,625 | |
| |
| | | | 27,030,513 | |
| | | | | |
| |
Total Corporate Bonds and Notes (Cost $351,258,394) | | | | 322,032,245 | |
| | | | | |
|
Foreign Corporate Bonds and Notes: 2.31% | |
|
Financials: 2.31% | |
|
| Banks: 2.31% | |
ABN AMRO Bank NV (5 Year EUR Swap +3.90%)±(s) | | | 4.75 | | | | 9-22-2027 | | | EUR | 3,000,000 | | | | 2,779,307 | |
Banco Santander SA (5 Year EUR Swap +4.53%)±(s) | | | 4.38 | | | | 1-14-2026 | | | EUR | 3,000,000 | | | | 2,465,913 | |
Bankia SA (5 Year EUR Swap +6.22%)±(s) | | | 6.38 | | | | 9-19-2023 | | | EUR | 3,000,000 | | | | 2,580,242 | |
Cooperatieve Rabobank UA (5 Year EUR Swap +6.70%)± | | | 6.63 | | | | 12-29-2049 | | | EUR | 2,800,000 | | | | 2,941,433 | |
Governor & Company of The Bank of Ireland (5 Year EUR Swap +6.96%)± | | | 7.38 | | | | 12-29-2049 | | | EUR | 3,000,000 | | | | 3,174,180 | |
| |
Total Foreign Corporate Bonds and Notes (Cost $16,842,271) | | | | 13,941,075 | |
| | | | | |
| | | | |
Municipal Obligations: 5.03% | | | | | | | | | | | | | | | | |
| | | | |
California: 0.51% | | | | | | | | | | | | | | | | |
| | | | |
| Education Revenue: 0.36% | | | | | | | | | | | | |
California School Finance Authority Charter School 144A | | | 4.25 | | | | 7-1-2025 | | | $ | 935,000 | | | | 906,052 | |
California School Finance Authority Charter School 144A | | | 5.00 | | | | 6-15-2031 | | | | 1,350,000 | | | | 1,253,934 | |
| | | | |
| | | | | | | | | | | | | | | 2,159,986 | |
| | | | | | | | | | | | | | | | |
| | | | |
| Health Revenue: 0.15% | | | | | | | | | | | | |
California Municipal Finance Authority Series 2019B 144A | | | 4.25 | | | | 11-1-2023 | | | | 900,000 | | | | 887,958 | |
| | | | | | | | | | | | | | | | |
| | | | |
| | | | | | | | | | | | | | | 3,047,944 | |
| | | | | | | | | | | | | | | | |
| | | | |
Colorado: 0.38% | | | | | | | | | | | | | | | | |
| | | | |
| Health Revenue: 0.38% | | | | | | | | | | | | |
Denver CO Health & Hospital Authority Series B | | | 4.65 | | | | 12-1-2023 | | | | 1,205,000 | | | | 1,262,286 | |
Denver CO Health & Hospital Authority Series B | | | 4.90 | | | | 12-1-2024 | | | | 250,000 | | | | 262,780 | |
The accompanying notes are an integral part of these financial statements.
Wells Fargo Diversified Income Builder Fund | 17
Portfolio of investments—March 31, 2020 (unaudited)
| | | | | | | | | | | | | | | | |
| | | Interest
rate | | | Maturity
date | | | Principal | | | Value | |
| | | | |
| Health Revenue (continued) | | | | | | | | | | | | |
Denver CO Health & Hospital Authority Series B | | | 5.00 | % | | | 12-1-2025 | | | $ | 275,000 | | | $ | 289,765 | |
Denver CO Health & Hospital Authority Series B | | | 5.15 | | | | 12-1-2026 | | | | 445,000 | | | | 468,300 | |
| |
| | | | 2,283,131 | |
| | | | | |
|
Florida: 0.26% | |
|
| Education Revenue: 0.26% | |
Capital Trust Agency Renaissance Charter School Project Series B 144A | | | 5.63 | | | | 6-15-2023 | | | | 590,000 | | | | 603,930 | |
Florida HEFAR Jacksonville University Project Series A2 144A | | | 5.43 | | | | 6-1-2027 | | | | 1,000,000 | | | | 991,140 | |
| |
| | | | 1,595,070 | |
| | | | | |
|
Georgia: 0.08% | |
|
| Health Revenue: 0.08% | |
Cobb County Development Authority Presbyterian Village Austell Project Series 2019B 144A | | | 5.75 | | | | 12-1-2028 | | | | 500,000 | | | | 478,485 | |
| | | | | | | | | | | | | | | | |
|
Guam: 0.11% | |
|
| Airport Revenue: 0.11% | |
Guam Port Authority Series C | | | 3.78 | | | | 7-1-2021 | | | | 635,000 | | | | 645,224 | |
| | | | | | | | | | | | | | | | |
|
Illinois: 0.51% | |
|
| Miscellaneous Revenue: 0.51% | |
Chicago IL Board of Education Taxable Build America Bonds Series E | | | 6.04 | | | | 12-1-2029 | | | | 1,255,000 | | | | 1,252,402 | |
Chicago IL Certificate of Participation River Point Plaza Redevelopment Project Series A 144A | | | 4.84 | | | | 4-15-2028 | | | | 1,825,000 | | | | 1,806,276 | |
| |
| | | | 3,058,678 | |
| | | | | |
|
Indiana: 0.08% | |
|
| Health Revenue: 0.08% | |
Knox County IN Good Samaritian Hospital Project Industry Economic Development Series B | | | 5.90 | | | | 4-1-2034 | | | | 480,000 | | | | 453,125 | |
| | | | | | | | | | | | | | | | |
|
Iowa: 0.18% | |
|
| GO Revenue: 0.18% | |
Coralville IA Series C | | | 5.00 | | | | 5-1-2030 | | | | 1,200,000 | | | | 1,103,592 | |
| | | | | | | | | | | | | | | | |
|
Louisiana: 0.16% | |
|
| Health Revenue: 0.16% | |
Louisiana Local Government Environmental Facilities and Community Development Authority | | | 5.75 | | | | 1-1-2029 | | | | 1,000,000 | | | | 980,340 | |
| | | | | | | | | | | | | | | | |
|
Michigan: 0.50% | |
|
| Miscellaneous Revenue: 0.50% | |
Wayne County MI Recovery Zone Economic Development Build America Bonds | | | 10.00 | | | | 12-1-2040 | | | | 3,000,000 | | | | 3,043,770 | |
| | | | | | | | | | | | | | | | |
|
New Jersey: 0.36% | |
|
| Education Revenue: 0.18% | |
New Jersey Educational Facilities Authority Georgian Court University Series H | | | 4.25 | | | | 7-1-2028 | | | | 1,000,000 | | | | 1,047,760 | |
| | | | | | | | | | | | | | | | |
|
| Utilities Revenue: 0.18% | |
Newark NJ Redevelopment Area Public Service Electric & Gas Project 144A | | | 4.49 | | | | 12-1-2047 | | | | 1,000,000 | | | | 1,104,810 | |
| | | | | | | | | | | | | | | | |
| |
| | | | 2,152,570 | |
| | | | | |
The accompanying notes are an integral part of these financial statements.
18 | Wells Fargo Diversified Income Builder Fund
Portfolio of investments—March 31, 2020 (unaudited)
| | | | | | | | | | | | | | | | |
| | | Interest
rate | | | Maturity
date | | | Principal | | | Value | |
| New York: 0.22% | |
|
| Education Revenue: 0.09% | |
Yonkers Economic Development Corporation Series 2019B | | | 4.50 | % | | | 10-15-2024 | | | $ | 545,000 | | | $ | 527,020 | |
| | | | | | | | | | | | | | | | |
|
| Health Revenue: 0.05% | |
Jefferson County NY Civic Facility Development Corporation Refunding Bond Series B Samaritan Medical Center Obligated Group | | | 4.25 | | | | 11-1-2028 | | | | 305,000 | | | | 318,591 | |
| | | | | | | | | | | | | | | | |
|
| Utilities Revenue: 0.08% | |
New York Energy Research & Development Authority Green Bond Series A | | | 4.81 | | | | 4-1-2034 | | | | 500,000 | | | | 500,150 | |
| | | | | | | | | | | | | | | | |
| |
| | | | 1,345,761 | |
| | | | | |
|
Ohio: 0.13% | |
|
| Tobacco Revenue: 0.13% | |
Buckeye OH Tobacco Settlement Financing Authority ¤ | | | 0.00 | | | | 6-1-2057 | | | | 7,000,000 | | | | 772,310 | |
| | | | | | | | | | | | | | | | |
|
Oklahoma: 0.31% | |
|
| Health Revenue: 0.09% | |
Oklahoma Development Finance Authority | | | 5.45 | | | | 8-15-2028 | | | | 500,000 | | | | 578,710 | |
| | | | | | | | | | | | | | | | |
|
| Miscellaneous Revenue: 0.22% | |
Woodward County OK Educational Facilities Authority Mooreland Public Schools Project Series B | | | 4.63 | | | | 9-15-2025 | | | | 1,310,000 | | | | 1,321,332 | |
| | | | | | | | | | | | | | | | |
| |
| | | | 1,900,042 | |
| | | | | |
|
Pennsylvania: 0.33% | |
|
| Housing Revenue: 0.33% | |
Philadelphia PA IDA MFHR University Square Apartments Low Income Housing Project 144A | | | 5.00 | | | | 12-1-2020 | | | | 2,000,000 | | | | 2,003,500 | |
| | | | | | | | | | | | | | | | |
|
Tennessee: 0.15% | |
|
| Tax Revenue: 0.15% | |
Bristol TN Industrial Development Board The Pinnacle Project Series A 144A | | | 5.13 | | | | 12-1-2042 | | | | 1,000,000 | | | | 876,580 | |
| | | | | | | | | | | | | | | | |
|
Texas: 0.08% | |
|
| Education Revenue: 0.08% | |
Clifton TX Higher Education Finance Corporation International Leadership | | | 6.13 | | | | 8-15-2023 | | | | 500,000 | | | | 500,085 | |
| | | | | | | | | | | | | | | | |
|
Virginia: 0.34% | |
|
| Tax Revenue: 0.34% | |
Mosaic District VA CDA SeriesA-T | | | 7.25 | | | | 3-1-2036 | | | | 2,000,000 | | | | 2,050,700 | |
| | | | | | | | | | | | | | | | |
|
Wisconsin: 0.34% | |
|
| Education Revenue: 0.34% | |
PFA Burrell College of Osteopathic Medicine Project 144A | | | 5.13 | | | | 6-1-2028 | | | | 1,360,000 | | | | 1,506,758 | |
Public Finance Authority WI Educational Facility Ikaho College 144A | | | 6.75 | | | | 6-1-2031 | | | | 500,000 | | | | 556,050 | |
| |
| | | | 2,062,808 | |
| | | | | |
| |
Total Municipal Obligations (Cost $30,698,967) | | | | 30,353,715 | |
| | | | | |
|
| Non-Agency Mortgage-Backed Securities: 1.97% | |
AFN LLC Series2019-1A Class A2 144A | | | 4.46 | | | | 5-20-2049 | | | | 1,000,000 | | | | 630,865 | |
Aqua Finance Trust Series2019-A Class A 144A | | | 3.14 | | | | 7-16-2040 | | | | 508,299 | | | | 506,239 | |
The accompanying notes are an integral part of these financial statements.
Wells Fargo Diversified Income Builder Fund | 19
Portfolio of investments—March 31, 2020 (unaudited)
| | | | | | | | | | | | | | | | |
| | | Interest
rate | | | Maturity
date | | | Principal | | | Value | |
|
| Non-Agency Mortgage-Backed Securities (continued) | |
BCC Funding Corporation Series2019-1A Class D 144A | | | 3.94 | % | | | 7-20-2027 | | | $ | 450,000 | | | $ | 436,473 | |
Capital Automotive Real Estate Services Series 1A Class A6 144A | | | 3.81 | | | | 2-15-2050 | | | | 500,000 | | | | 465,000 | |
Citigroup Commercial Mortgage Trust Series 2015-GC27 Class B | | | 3.77 | | | | 2-10-2048 | | | | 2,524,616 | | | | 2,424,231 | |
CLI Funding LLC Series2018-1A Class A 144A | | | 4.03 | | | | 4-18-2043 | | | | 598,340 | | | | 568,374 | |
CLI Funding LLC Series2019-1A Class A 144A | | | 3.71 | | | | 5-18-2044 | | | | 918,773 | | | | 854,066 | |
CLI Funding LLC Series2019-1A Class B 144A | | | 4.64 | | | | 5-18-2044 | | | | 503,494 | | | | 477,180 | |
Conn Funding II LP Series A Class A 144A | | | 3.40 | | | | 10-16-2023 | | | | 407,065 | | | | 395,419 | |
Driven Brands Funding LLC Series2019-2A Class A2 144A | | | 3.98 | | | | 10-20-2049 | | | | 798,000 | | | | 737,384 | |
JPMorgan Mortgage Trust Series2019-2 Class A3 144A±± | | | 4.00 | | | | 8-25-2049 | | | | 693,286 | | | | 703,725 | |
Longtrain Leasing III LLC Series2015-1A Class A2 144A | | | 4.06 | | | | 1-15-2045 | | | | 980,190 | | | | 905,894 | |
Mosaic Solar Loans LLC Series2019-2A Class A 144A | | | 2.88 | | | | 9-20-2040 | | | | 270,321 | | | | 260,607 | |
Sequoia Mortgage Trust Series2018-6 Class A19 144A±± | | | 4.00 | | | | 7-25-2048 | | | | 960,367 | | | | 973,868 | |
SoFi Consumer Loan Program Trust Series2019-2 Class C 144A | | | 3.46 | | | | 4-25-2028 | | | | 2,000,000 | | | | 1,542,110 | |
| |
TotalNon-Agency Mortgage-Backed Securities (Cost $13,165,233) | | | | 11,881,435 | |
| | | | | |
| | | | |
| | | | | | | | | | | | | | | | |
| | | Dividend
yield | | | | | | Shares | | | | |
| Preferred Stocks: 0.15% | |
|
Energy: 0.02% | |
|
| Oil, Gas & Consumable Fuels: 0.02% | |
Petroleo Brasil SP ADR | | | 7.09 | | | | | | | | 20,934 | | | | 112,834 | |
| | | | | | | | | | | | | | | | |
|
Financials: 0.05% | |
|
| Banks: 0.05% | |
Banco Bradesco SA | | | 11.25 | | | | | | | | 29,040 | | | | 116,080 | |
Itaúsa Investimentos Itaú SA | | | 6.21 | | | | | | | | 103,700 | | | | 175,025 | |
| |
| | | | 291,105 | |
| | | | | |
|
Information Technology: 0.06% | |
|
| Technology Hardware, Storage & Peripherals: 0.06% | |
Samsung Electronics Company Limited | | | 2.79 | | | | | | | | 10,946 | | | | 356,704 | |
| | | | | | | | | | | | | | | | |
|
Materials: 0.02% | |
|
| Metals & Mining: 0.02% | |
Gerdau SA | | | 18.63 | | | | | | | | 62,200 | | | | 120,304 | |
| | | | | | | | | | | | | | | | |
| |
Total Preferred Stocks (Cost $1,255,786) | | | | 880,947 | |
| | | | | |
| | | | |
| | | | | | | | | | | | | | | | |
| | | Interest
rate | | | | | | Principal | | | | |
| Yankee Corporate Bonds and Notes: 9.06% | |
|
Financials: 7.88% | |
|
| Banks: 5.03% | |
Barclays plc (5 Year USD Swap +4.84%)±(s) | | | 7.75 | | | | 9-15-2023 | | | $ | 2,160,000 | | | | 1,894,320 | |
BNP Paribas SA (5 Year USD Swap +6.31%)± | | | 7.63 | | | | 12-29-2049 | | | | 4,000,000 | | | | 3,905,000 | |
Credit Agricole SA (5 Year USD Swap +4.90%) 144A± | | | 7.88 | | | | 12-29-2049 | | | | 1,750,000 | | | | 1,688,750 | |
Credit Agricole SA (5 Year USD Swap +6.19%) 144A± | | | 8.13 | | | | 12-29-2049 | | | | 1,750,000 | | | | 1,802,500 | |
Danske Bank AS (7 Year Treasury Constant Maturity +4.13%)±(s) | | | 7.00 | | | | 6-26-2025 | | | | 2,300,000 | | | | 1,932,000 | |
DNB Bank ASA (5 Year USD Swap +5.08%)± | | | 6.50 | | | | 12-29-2049 | | | | 3,690,000 | | | | 3,312,690 | |
HSBC Holdings plc (USD ICE Swap Rate 11:00am NY 5Y +4.37%)± | | | 6.38 | | | | 12-29-2049 | | | | 3,690,000 | | | | 3,450,150 | |
The accompanying notes are an integral part of these financial statements.
20 | Wells Fargo Diversified Income Builder Fund
Portfolio of investments—March 31, 2020 (unaudited)
| | | | | | | | | | | | | | | | |
| | | Interest
rate | | | Maturity
date | | | Principal | | | Value | |
|
| Banks (continued) | |
ING Groep NV (USD ICE Swap Rate 11:00am NY 5Y +4.20%)±(s) | | | 6.75 | % | | | 4-16-2024 | | | $ | 3,800,000 | | | $ | 3,258,500 | |
Lloyds Banking Group plc (5 Year USD Swap +4.76%)± | | | 7.50 | | | | 4-30-2049 | | | | 3,665,000 | | | | 3,147,136 | |
Skandinaviska Enskilda Banken AB (5 Year Treasury Constant Maturity +3.46%) ±(s) | | | 5.13 | | | | 5-13-2025 | | | | 2,000,000 | | | | 1,723,000 | |
Societe Generale SA (USD ICE Swap Rate 11:00am NY 5Y +5.87%) 144A± | | | 8.00 | | | | 12-29-2049 | | | | 3,535,000 | | | | 3,234,525 | |
Standard Chartered plc (5 Year USD Swap +5.72%) 144A± | | | 7.75 | | | | 12-29-2049 | | | | 1,000,000 | | | | 982,500 | |
| |
| | | | 30,331,071 | |
| | | | | |
|
| Capital Markets: 0.54% | |
Credit Suisse Group AG (5 Year USD Swap +4.60%) 144A± | | | 7.50 | | | | 12-29-2049 | | | | 3,395,000 | | | | 3,267,688 | |
| | | | | | | | | | | | | | | | |
|
| Diversified Financial Services: 2.31% | |
Tronox Finance plc 144A | | | 5.75 | | | | 10-1-2025 | | | | 12,000,000 | | | | 10,710,000 | |
UBS Group Funding Switzerland AG (5 Year USD Swap +4.87%)± | | | 7.00 | | | | 12-29-2049 | | | | 3,330,000 | | | | 3,208,455 | |
| |
| | | | 13,918,455 | |
| | | | | |
|
Industrials: 0.61% | |
|
| Electrical Equipment: 0.61% | |
Sensata Technologies BV 144A | | | 5.63 | | | | 11-1-2024 | | | | 3,750,000 | | | | 3,656,250 | |
| | | | | | | | | | | | | | | | |
|
Information Technology: 0.57% | |
|
| Technology Hardware, Storage & Peripherals: 0.57% | |
Seagate HDD | | | 4.88 | | | | 6-1-2027 | | | | 3,500,000 | | | | 3,469,175 | |
| | | | | | | | | | | | | | | | |
| |
Total Yankee Corporate Bonds and Notes (Cost $60,119,293) | | | | 54,642,639 | |
| | | | | |
| | | | |
| | | | | | | | | | | | | | | | |
| | | Yield | | | | | | Shares | | | | |
| Short-Term Investments: 1.53% | |
|
| Investment Companies: 0.95% | |
Wells Fargo Government Money Market Fund Select Class (l)(u) | | | 0.35 | | | | | | | | 5,744,946 | | | | 5,744,946 | |
| | | | | |
| | | | |
| | | | | | | | | | | | | | | | |
| | | | | | | | | Principal | | | | |
|
| U.S. Treasury Securities: 0.58% | |
U.S. Treasury Bill (z)# | | | 0.40 | | | | 6-11-2020 | | | $ | 3,498,000 | | | | 3,497,205 | |
| | | | | | | | | | | | | | | | |
| |
Total Short-Term Investments (Cost $9,240,126) | | | | 9,242,151 | |
| | | | | |
| | | | | | |
| Total investments in securities (Cost $657,689,767) | | | 98.74 | % | | 595,507,255 |
| | |
Other assets and liabilities, net | | | 1.26 | | | 7,626,584 |
| | | | | | |
| Total net assets | | | 100.00 | % | | $603,133,839 |
| | | | | | |
| 144A | The security may be resold in transactions exempt from registration, normally to qualified institutional buyers, pursuant to Rule 144A under the Securities Act of 1933. |
| # | All or a portion of this security is segregated as collateral for investments in derivative instruments. |
| † | Non-income-earning security |
| ± | Variable rate investment. The rate shown is the rate in effect at period end. |
| (s) | Security is perpetual in nature and has no stated maturity date. The date shown reflects the next call date. |
| ¤ | The security is issued in zero coupon form with no periodic interest payments. |
| ±± | The coupon of the security is adjusted based on the principal and interest payments received from the underlying pool of mortgages as well as the credit quality and the actual prepayment speed of the underlying mortgages. |
| (l) | The issuer of the security is an affiliated person of the Fund as defined in the Investment Company Act of 1940. |
| (u) | The rate represents the7-day annualized yield at period end. |
| (z) | Zero coupon security. The rate represents the current yield to maturity. |
The accompanying notes are an integral part of these financial statements.
Wells Fargo Diversified Income Builder Fund | 21
Portfolio of investments—March 31, 2020 (unaudited)
Abbreviations:
| ADR | American depositary receipt |
| CDA | Community Development Authority |
| GDR | Global depositary receipt |
| HEFAR | Higher Education Facilities Authority Revenue |
| IDA | Industrial Development Authority |
| MFHR | Multifamily housing revenue |
| PFA | Public Finance Authority |
| REIT | Real estate investment trust |
Futures Contracts
| | | | | | | | | | | | | | | | | | | | | | | | |
| Description | | Number of
contracts | | | Expiration
date | | | Notional
cost | | | Notional
value | | | Unrealized
gains | | | Unrealized
losses | |
| | | | | | |
Long | | | | | | | | | | | | | | | | | | | | | | | | |
| | | | | | |
NASDAQ 100E-Mini Index | | | 190 | | | | 6-19-2020 | | | $ | 26,879,188 | | | $ | 29,587,750 | | | $ | 2,708,562 | | | $ | 0 | |
| | | | | | |
S&P 500E-Mini Index | | | 46 | | | | 6-19-2020 | | | | 5,453,749 | | | | 5,910,310 | | | | 456,561 | | | | 0 | |
| | | | | | |
Short | | | | | | | | | | | | | | | | | | | | | | | | |
| | | | | | |
Russell 2000E-Mini Index | | | (302) | | | | 6-19-2020 | | | | (15,105,366 | ) | | | (17,328,760 | ) | | | 0 | | | | (2,223,394 | ) |
| | | | | | | | | | | | | | | | | | | | | | | | |
| | | | | | |
| | | | | | | | | | | | | | | | | | $ | 3,165,123 | | | $ | (2,223,394 | ) |
| | | | | | | | | | | | | | | | | | | | | | | | |
Forward Foreign Currency Contracts
| | | | | | | | | | | | | | |
Currency to be
received | | Currency to be
delivered | | Counterparty | | Settlement
date | | Unrealized
gains | | | Unrealized
losses | |
| | | | | |
| 25,953,010 USD | | 23,900,000 EUR | | Citibank | | 6-30-2020 | | $ | 0 | | | $ | (493,760 | ) |
| | | | | |
| 1,444,000 EUR | | 1,566,364 USD | | Citibank | | 6-30-2020 | | | 31,508 | | | | 0 | |
| | | | | | | | | | | | | | |
| | | | | |
| | | | | | | | $ | 31,508 | | | $ | (493,760 | ) |
| | | | | | | | | | | | | | |
Written Options
| | | | | | | | | | | | | | | | | | | | | | | | |
| Description | | Counterparty | | | Number of
contracts | | | Notional
amount | | | Exercise
price | | | Expiration
date | | | Value | |
| | | | | | |
Call | | | | | | | | | | | | | | | | | | | | | | | | |
iShares MSCI EAFE ETF | | | Morgan Stanley | | | | (158 | ) | | $ | (1,003,300 | ) | | $ | 63.50 | | | | 4-3-2020 | | | $ | (1 | ) |
iShares MSCI Emerging Markets ETF | | | Morgan Stanley | | | | (3,723 | ) | | | (14,892,000 | ) | | | 40.00 | | | | 4-3-2020 | | | | (332 | ) |
iShares MSCI Emerging Markets ETF | | | Morgan Stanley | | | | (293 | ) | | | (1,157,350 | ) | | | 39.50 | | | | 4-3-2020 | | | | (57 | ) |
Russell 2000 Index | | | Morgan Stanley | | | | (35 | ) | | | (4,917,500 | ) | | | 1,405.00 | | | | 4-3-2020 | | | | (8 | ) |
S&P 100 Index | | | Morgan Stanley | | | | (29 | ) | | | (3,813,500 | ) | | | 1,315.00 | | | | 4-3-2020 | | | | (1,116 | ) |
SPDR Euro STOXX 50 ETF | | | Morgan Stanley | | | | (791 | ) | | | (2,728,950 | ) | | | 34.50 | | | | 4-3-2020 | | | | (11 | ) |
iShares MSCI Emerging Markets ETF | | | Morgan Stanley | | | | (850 | ) | | | (3,272,500 | ) | | | 38.50 | | | | 4-9-2020 | | | | (2,655 | ) |
iShares MSCI Emerging Markets ETF | | | Morgan Stanley | | | | (2,141 | ) | | | (8,992,200 | ) | | | 42.00 | | | | 4-9-2020 | | | | (118 | ) |
S&P 100 Index | | | Morgan Stanley | | | | (72 | ) | | | (9,000,000 | ) | | | 1,250.00 | | | | 4-9-2020 | | | | (79,200 | ) |
Dow Jones Industrial Average | | | Morgan Stanley | | | | (7 | ) | | | (150,500 | ) | | | 215.00 | | | | 4-17-2020 | | | | (10,780 | ) |
iShares MSCI Emerging Markets ETF | | | Morgan Stanley | | | | (693 | ) | | | (2,356,200 | ) | | | 34.00 | | | | 4-17-2020 | | | | (99,792 | ) |
S&P 500 Index | | | Morgan Stanley | | | | (13 | ) | | | (3,243,500 | ) | | | 2,495.00 | | | | 4-17-2020 | | | | (213,764 | ) |
| | | | | | | | | | | | | | | | | | | | | | | | |
| | | | | | |
| | | | | | | | | | | | | | | | | | | | | | $ | (407,834 | ) |
| | | | | | | | | | | | | | | | | | | | | | | | |
The accompanying notes are an integral part of these financial statements.
22 | Wells Fargo Diversified Income Builder Fund
Portfolio of investments—March 31, 2020 (unaudited)
Investments in Affiliates
An affiliated investment is an investment in which the Fund owns at least 5% of the outstanding voting shares of the issuer or as a result of other relationships, such as the Fund and the issuer having the same investment manager. Transactions with issuers that were either affiliated persons of the Fund at the beginning of the period or the end of the period were as follows:
| | | | | | | | | | | | | | | | | | | | | | | | | | | | | | | | | | | | |
| | | Shares,
beginning of
period | | | Shares
purchased | | | Shares
sold | | | Shares,
end of
period | | | Net
realized
gains
(losses) | | | Net
change in
unrealized
gains
(losses) | | | Income
from
affiliated
securities | | | Value,
end of
period | | | % of
net
assets | |
| | | | | | | | | |
| Short-Term Investments | | | | | | | | | | | | | | | | | | | | | | | | | | | |
Investment Companies | | | | | | | | | | | | | | | | | | | | | | | | | | | | | | | | | | | | |
Wells Fargo Government Money Market Fund Select Class | | | 19,875,845 | | | | 107,656,270 | | | | (121,787,169 | ) | | | 5,744,946 | | | $ | 0 | | | $ | 0 | | | $ | 226,860 | | | $ | 5,744,946 | | | | 0.95 | % |
The accompanying notes are an integral part of these financial statements.
Wells Fargo Diversified Income Builder Fund | 23
Statement of assets and liabilities—March 31, 2020 (unaudited)
| | | | |
| | | | |
| |
Assets | | | | |
Investments in unaffiliated securities, at value (cost $651,944,821) | | $ | 589,762,309 | |
Investments in affiliated securities, at value (cost $5,744,946) | | | 5,744,946 | |
Cash | | | 2,235,675 | |
Cash at broker segregated for futures contracts | | | 640,000 | |
Receivable for investments sold | | | 1,928,951 | |
Receivable for Fund shares sold | | | 2,007,568 | |
Receivable for dividends and interest | | | 7,107,223 | |
Unrealized gains on forward foreign currency contracts | | | 31,508 | |
Prepaid expenses and other assets | | | 293,654 | |
| | | | |
Total assets | | | 609,751,834 | |
| | | | |
| |
Liabilities | | | | |
Payable for investments purchased | | | 1,371,921 | |
Payable for Fund shares redeemed | | | 1,101,079 | |
Payable for daily variation margin on open futures contracts | | | 253,070 | |
Overdraft due to custodian bank, foreign currency, at value (cost $2,431,532) | | | 2,431,726 | |
Written options, at value (premiums received $1,223,092) | | | 407,834 | |
Unrealized losses on forward foreign currency contracts | | | 493,760 | |
Cash collateral due to broker for forward foreign currency contracts | | | 190,000 | |
Management fee payable | | | 187,644 | |
Administration fees payable | | | 96,006 | |
Distribution fee payable | | | 80,894 | |
Trustees’ fees and expenses payable | | | 4,061 | |
| | | | |
Total liabilities | | | 6,617,995 | |
| | | | |
Total net assets | | $ | 603,133,839 | |
| | | | |
| |
Net assets consist of | | | | |
Paid-in capital | | $ | 693,912,010 | |
Total distributable loss | | | (90,778,171 | ) |
| | | | |
Total net assets | | $ | 603,133,839 | |
| | | | |
| |
Computation of net asset value and offering price per share | | | | |
Net assets – Class A | | $ | 209,021,531 | |
Shares outstanding – Class A1 | | | 39,572,199 | |
Net asset value per share – Class A | | | $5.28 | |
Maximum offering price per share – Class A2 | | | $5.60 | |
Net assets – Class C | | $ | 119,467,473 | |
Shares outstanding – Class C1 | | | 22,560,404 | |
Net asset value per share – Class C | | | $5.30 | |
Net assets – Class R6 | | $ | 2,574,303 | |
Shares outstanding – Class R61 | | | 499,906 | |
Net asset value per share – Class R6 | | | $5.15 | |
Net assets – Administrator Class | | $ | 9,255,101 | |
Shares outstanding – Administrator Class1 | | | 1,796,799 | |
Net asset value per share – Administrator Class | | | $5.15 | |
Net assets – Institutional Class | | $ | 262,815,431 | |
Shares outstanding – Institutional Class1 | | | 51,027,187 | |
Net asset value per share – Institutional Class | | | $5.15 | |
| 1 | The Fund has an unlimited number of authorized shares. |
| 2 | Maximum offering price is computed as 100/94.25 of net asset value. On investments of $50,000 or more, the offering price is reduced. |
The accompanying notes are an integral part of these financial statements.
24 | Wells Fargo Diversified Income Builder Fund
Statement of operations—six months ended March 31, 2020 (unaudited)
| | | | |
| | | | |
| |
Investment income | | | | |
Interest | | $ | 12,704,208 | |
Dividends (net of foreign withholding taxes of $88,628) | | | 3,389,801 | |
Income from affiliated securities | | | 226,860 | |
| | | | |
Total investment income | | | 16,320,869 | |
| | | | |
| |
Expenses | | | | |
Management fee | | | 1,969,573 | |
Administration fees | |
Class A | | | 267,496 | |
Class C | | | 147,185 | |
Class R6 | | | 235 | |
Administrator Class | | | 7,300 | |
Institutional Class | | | 207,201 | |
Shareholder servicing fees | |
Class A | | | 318,447 | |
Class C | | | 175,220 | |
Administrator Class | | | 14,039 | |
Distribution fee | |
Class C | | | 525,646 | |
Custody and accounting fees | | | 18,349 | |
Professional fees | | | 32,722 | |
Registration fees | | | 50,137 | |
Shareholder report expenses | | | 50,137 | |
Trustees’ fees and expenses | | | 11,029 | |
Interest expense | | | 259 | |
Other fees and expenses | | | 9,340 | |
| | | | |
Total expenses | | | 3,804,315 | |
Less: Fee waivers and/or expense reimbursements | |
Fund-level | | | (729,967 | ) |
| | | | |
Net expenses | | | 3,074,348 | |
| | | | |
Net investment income | | | 13,246,521 | |
| | | | |
| |
Realized and unrealized gains (losses) on investments | | | | |
Net realized gains (losses) on | |
Unaffiliated securities | | | (6,134,431 | ) |
Futures contracts | | | (4,387,826 | ) |
Forward foreign currency contracts | | | 958,152 | |
Written options | | | 1,201,531 | |
| | | | |
Net realized losses on investments | | | (8,362,574 | ) |
| | | | |
|
Net change in unrealized gains (losses) on | |
Unaffiliated securities | | | (89,261,575 | ) |
Futures contracts | | | 843,038 | |
Forward foreign currency contracts | | | (381,476 | ) |
Written options | | | 815,258 | |
| | | | |
Net change in unrealized gains (losses) on investments | | | (87,984,755 | ) |
| | | | |
Net realized and unrealized gains (losses) on investments | | | (96,347,329 | ) |
| | | | |
Net decrease in net assets resulting from operations | | $ | (83,100,808 | ) |
| | | | |
The accompanying notes are an integral part of these financial statements.
Wells Fargo Diversified Income Builder Fund | 25
Statement of changes in net assets
| | | | | | | | | | | | | | | | |
| | | Six months ended
March 31, 2020
(unaudited) | | | Year ended
September 30, 2019 | |
| |
Operations | | | | | |
Net investment income | | | | | | $ | 13,246,521 | | | | | | | $ | 25,931,305 | |
Net realized losses on investments | | | | | | | (8,362,574 | ) | | | | | | | (23,328,410 | ) |
Net change in unrealized gains (losses) on investments | | | | | | | (87,984,755 | ) | | | | | | | 22,911,044 | |
| | | | |
Net increase (decrease) in net assets resulting from operations | | | | | | | (83,100,808 | ) | | | | | | | 25,513,939 | |
| | | | |
| | | | |
Distributions to shareholders from net investment income and net realized gains | | | | | | | | | | | | | | | | |
Class A | | | | | | | (4,475,198 | ) | | | | | | | (19,291,628 | ) |
Class C | | | | | | | (1,924,707 | ) | | | | | | | (11,757,683 | ) |
Class R6 | | | | | | | (33,417 | ) | | | | | | | (2,192 | ) |
Administrator Class | | | | | | | (207,916 | ) | | | | | | | (2,015,528 | ) |
Institutional Class | | | | | | | (6,248,451 | ) | | | | | | | (26,837,985 | ) |
| | | | |
Total distributions to shareholders | | | | | | | (12,889,689 | ) | | | | | | | (59,905,016 | ) |
| | | | |
| | | | |
Capital share transactions | | | Shares | | | | | | | | Shares | | | | | |
Proceeds from shares sold | |
Class A | | | 5,708,789 | | | | 34,764,733 | | | | 15,741,839 | | | | 94,086,277 | |
Class C | | | 3,026,697 | | | | 18,368,376 | | | | 6,522,568 | | | | 38,947,259 | |
Class R6 | | | 493,921 | | | | 2,911,613 | | | | 0 | | | | 0 | |
Administrator Class | | | 240,825 | | | | 1,411,812 | | | | 729,093 | | | | 4,244,341 | |
Institutional Class | | | 10,092,624 | | | | 59,645,030 | | | | 22,831,336 | | | | 132,583,652 | |
| | | | |
| | | | | | | 117,101,564 | | | | | | | | 269,861,529 | |
| | | | |
Reinvestment of distributions | |
Class A | | | 704,850 | | | | 4,209,699 | | | | 3,135,334 | | | | 18,209,570 | |
Class C | | | 288,346 | | | | 1,728,869 | | | | 1,853,575 | | | | 10,728,732 | |
Class R6 | | | 5,769 | | | | 32,940 | | | | 0 | | | | 0 | |
Administrator Class | | | 29,488 | | | | 171,793 | | | | 322,489 | | | | 1,815,085 | |
Institutional Class | | | 871,373 | | | | 5,066,788 | | | | 3,849,831 | | | | 21,832,218 | |
| | | | |
| | | | | | | 11,210,089 | | | | | | | | 52,585,605 | |
| | | | |
Payment for shares redeemed | |
Class A | | | (8,393,950 | ) | | | (48,915,411 | ) | | | (13,852,338 | ) | | | (82,279,885 | ) |
Class C | | | (3,933,863 | ) | | | (23,083,595 | ) | | | (11,490,423 | ) | | | (68,292,199 | ) |
Class R6 | | | (3,836 | ) | | | (20,256 | ) | | | 0 | | | | 0 | |
Administrator Class | | | (490,050 | ) | | | (2,866,937 | ) | | | (4,353,482 | ) | | | (24,635,205 | ) |
Institutional Class | | | (12,752,090 | ) | | | (70,728,809 | ) | | | (28,099,288 | ) | | | (162,899,174 | ) |
| | | | |
| | | | | | | (145,615,008 | ) | | | | | | | (338,106,463 | ) |
| | | | |
Net decrease in net assets resulting from capital share transactions | | | | | | | (17,303,355 | ) | | | | | | | (15,659,329 | ) |
| | | | |
Total decrease in net assets | | | | | | | (113,293,852 | ) | | | | | | | (50,050,406 | ) |
| | | | |
| | |
Net assets | | | | | | | | |
Beginning of period | | | | | | | 716,427,691 | | | | | | | | 766,478,097 | |
| | | | |
End of period | | | | | | $ | 603,133,839 | | | | | | | $ | 716,427,691 | |
| | | | |
The accompanying notes are an integral part of these financial statements.
26 | Wells Fargo Diversified Income Builder Fund
Financial highlights
(For a share outstanding throughout each period)
| | | | | | | | | | | | | | | | | | | | | | | | |
| | | Six months ended
March 31, 2020 (unaudited) | | | Year ended September 30 | |
| CLASS A | | 2019 | | | 2018 | | | 2017 | | | 2016 | | | 2015 | |
Net asset value, beginning of period | | | $6.06 | | | | $6.33 | | | | $6.42 | | | | $6.13 | | | | $5.71 | | | | $6.37 | |
Net investment income | | | 0.11 | 1 | | | 0.22 | | | | 0.21 | | | | 0.20 | | | | 0.20 | | | | 0.21 | |
Net realized and unrealized gains (losses) on investments | | | (0.78 | ) | | | 0.02 | | | | (0.01 | ) | | | 0.35 | | | | 0.64 | | | | (0.31 | ) |
| | | | | | | | | | | | | | | | | | | | | | | | |
Total from investment operations | | | (0.67 | ) | | | 0.24 | | | | 0.20 | | | | 0.55 | | | | 0.84 | | | | (0.10 | ) |
Distributions to shareholders from | | | | | | | | | | | | | | | | | | | | | | | | |
Net investment income | | | (0.11 | ) | | | (0.23 | ) | | | (0.19 | ) | | | (0.22 | ) | | | (0.21 | ) | | | (0.21 | ) |
Net realized gains | | | 0.00 | | | | (0.28 | ) | | | (0.10 | ) | | | (0.04 | ) | | | (0.21 | ) | | | (0.35 | ) |
| | | | | | | | | | | | | | | | | | | | | | | | |
Total distributions to shareholders | | | (0.11 | ) | | | (0.51 | ) | | | (0.29 | ) | | | (0.26 | ) | | | (0.42 | ) | | | (0.56 | ) |
Net asset value, end of period | | | $5.28 | | | | $6.06 | | | | $6.33 | | | | $6.42 | | | | $6.13 | | | | $5.71 | |
Total return1 | | | (11.30 | )% | | | 4.51 | % | | | 3.23 | % | | | 9.16 | % | | | 15.39 | % | | | (1.92 | )% |
Ratios to average net assets (annualized) | | | | | | | | | | | | | | | | | | | | | | | | |
Gross expenses | | | 1.05 | % | | | 1.05 | % | | | 1.04 | % | | | 1.05 | % | | | 1.08 | % | | | 1.11 | % |
Net expenses | | | 0.85 | % | | | 0.85 | % | | | 0.90 | % | | | 1.05 | % | | | 1.08 | % | | | 1.08 | % |
Net investment income | | | 3.74 | % | | | 3.75 | % | | | 3.34 | % | | | 3.29 | % | | | 3.55 | % | | | 3.38 | % |
Supplemental data | | | | | | | | | | | | | | | | | | | | | | | | |
Portfolio turnover rate | | | 19 | % | | | 43 | % | | | 50 | % | | | 29 | % | | | 38 | % | | | 63 | % |
Net assets, end of period (000s omitted) | | | $209,022 | | | | $251,673 | | | | $231,176 | | | | $220,977 | | | | $154,496 | | | | $127,242 | |
| 1 | Total return calculations do not include any sales charges. Returns for periods of less than one year are not annualized. |
The accompanying notes are an integral part of these financial statements.
Wells Fargo Diversified Income Builder Fund | 27
Financial highlights
(For a share outstanding throughout each period)
| | | | | | | | | | | | | | | | | | | | | | | | |
| | | Six months ended
March 31, 2020 (unaudited) | | | Year ended September 30 | |
| CLASS C | | 2019 | | | 2018 | | | 2017 | | | 2016 | | | 2015 | |
Net asset value, beginning of period | | | $6.07 | | | | $6.34 | | | | $6.44 | | | | $6.14 | | | | $5.72 | | | | $6.39 | |
Net investment income | | | 0.09 | | | | 0.18 | | | | 0.17 | | | | 0.16 | | | | 0.16 | 1 | | | 0.16 | 1 |
Net realized and unrealized gains (losses) on investments | | | (0.78 | ) | | | 0.02 | | | | (0.02 | ) | | | 0.35 | | | | 0.63 | | | | (0.32 | ) |
| | | | | | | | | | | | | | | | | | | | | | | | |
Total from investment operations | | | (0.69 | ) | | | 0.20 | | | | 0.15 | | | | 0.51 | | | | 0.79 | | | | (0.16 | ) |
Distributions to shareholders from | | | | | | | | | | | | | | | | | | | | | | | | |
Net investment income | | | (0.08 | ) | | | (0.19 | ) | | | (0.15 | ) | | | (0.17 | ) | | | (0.16 | ) | | | (0.16 | ) |
Net realized gains | | | 0.00 | | | | (0.28 | ) | | | (0.10 | ) | | | (0.04 | ) | | | (0.21 | ) | | | (0.35 | ) |
| | | | | | | | | | | | | | | | | | | | | | | | |
Total distributions to shareholders | | | (0.08 | ) | | | (0.47 | ) | | | (0.25 | ) | | | (0.21 | ) | | | (0.37 | ) | | | (0.51 | ) |
Net asset value, end of period | | | $5.30 | | | | $6.07 | | | | $6.34 | | | | $6.44 | | | | $6.14 | | | | $5.72 | |
Total return2 | | | (11.46 | )% | | | 3.71 | % | | | 2.32 | % | | | 8.51 | % | | | 14.51 | % | | | (2.81 | )% |
Ratios to average net assets (annualized) | | | | | | | | | | | | | | | | | | | | | | | | |
Gross expenses | | | 1.80 | % | | | 1.80 | % | | | 1.79 | % | | | 1.80 | % | | | 1.83 | % | | | 1.86 | % |
Net expenses | | | 1.60 | % | | | 1.60 | % | | | 1.65 | % | | | 1.80 | % | | | 1.83 | % | | | 1.83 | % |
Net investment income | | | 2.99 | % | | | 2.99 | % | | | 2.59 | % | | | 2.54 | % | | | 2.80 | % | | | 2.62 | % |
Supplemental data | | | | | | | | | | | | | | | | | | | | | | | | |
Portfolio turnover rate | | | 19 | % | | | 43 | % | | | 50 | % | | | 29 | % | | | 38 | % | | | 63 | % |
Net assets, end of period (000s omitted) | | | $119,467 | | | | $140,722 | | | | $166,750 | | | | $165,513 | | | | $129,856 | | | | $110,457 | |
| 1 | Calculated based upon average shares outstanding |
| 2 | Total return calculations do not include any sales charges. Returns for periods of less than one year are not annualized. |
The accompanying notes are an integral part of these financial statements.
28 | Wells Fargo Diversified Income Builder Fund
Financial highlights
(For a share outstanding throughout each period)
| | | | | | | | | | | | |
| | | Six months ended
March 31, 2020 (unaudited) | | | Year ended September 30 | |
| CLASS R6 | | 2019 | | | 20181 | |
Net asset value, beginning of period | | | $5.91 | | | | $6.18 | | | | $6.17 | |
Net investment income | | | 0.12 | 1 | | | 0.24 | 2 | | | 0.02 | 2 |
Net realized and unrealized gains (losses) on investments | | | (0.76 | ) | | | 0.03 | | | | 0.02 | |
| | | | | | | | | | | | |
Total from investment operations | | | (0.64 | ) | | | 0.27 | | | | 0.04 | |
Distributions to shareholders from | | | | | | | | | | | | |
Net investment income | | | (0.12 | ) | | | (0.26 | ) | | | (0.03 | ) |
Net realized gains | | | 0.00 | | | | (0.28 | ) | | | 0.00 | |
| | | | | | | | | | | | |
Total distributions to shareholders | | | (0.12 | ) | | | (0.54 | ) | | | (0.03 | ) |
Net asset value, end of period | | | $5.15 | | | | $5.91 | | | | $6.18 | |
Total return3 | | | (11.08 | )% | | | 5.07 | % | | | 0.71 | % |
Ratios to average net assets (annualized) | | | | | | | | | | | | |
Gross expenses | | | 0.62 | % | | | 0.61 | % | | | 0.64 | % |
Net expenses | | | 0.42 | % | | | 0.42 | % | | | 0.41 | % |
Net investment income | | | 4.19 | % | | | 4.17 | % | | | 2.31 | % |
Supplemental data | | | | | | | | | | | | |
Portfolio turnover rate | | | 19 | % | | | 43 | % | | | 50 | % |
Net assets, end of period (000s omitted) | | | $2,574 | | | | $24 | | | | $25 | |
| 1 | For the period from July 31, 2018 (commencement of class operations) to September 30, 2018 |
| 2 | Calculated based upon average shares outstanding |
| 3 | Returns for periods of less than one year are not annualized. |
The accompanying notes are an integral part of these financial statements.
Wells Fargo Diversified Income Builder Fund | 29
Financial highlights
(For a share outstanding throughout each period)
| | | | | | | | | | | | | | | | | | | | | | | | |
| | | Six months ended
March 31, 2020 (unaudited) | | | Year ended September 30 | |
| ADMINISTRATOR CLASS | | 2019 | | | 2018 | | | 2017 | | | 2016 | | | 2015 | |
Net asset value, beginning of period | | | $5.91 | | | | $6.19 | | | | $6.29 | | | | $6.00 | | | | $5.60 | | | | $6.25 | |
Net investment income | | | 0.11 | | | | 0.22 | 1 | | | 0.21 | 1 | | | 0.21 | 1 | | | 0.21 | 1 | | | 0.21 | 1 |
Net realized and unrealized gains (losses) on investments | | | (0.76 | ) | | | 0.02 | | | | (0.01 | ) | | | 0.34 | | | | 0.61 | | | | (0.30 | ) |
| | | | | | | | | | | | | | | | | | | | | | | | |
Total from investment operations | | | (0.65 | ) | | | 0.24 | | | | 0.20 | | | | 0.55 | | | | 0.82 | | | | (0.09 | ) |
Distributions to shareholders from | | | | | | | | | | | | | | | | | | | | | | | | |
Net investment income | | | (0.11 | ) | | | (0.24 | ) | | | (0.20 | ) | | | (0.22 | ) | | | (0.21 | ) | | | (0.21 | ) |
Net realized gains | | | 0.00 | | | | (0.28 | ) | | | (0.10 | ) | | | (0.04 | ) | | | (0.21 | ) | | | (0.35 | ) |
| | | | | | | | | | | | | | | | | | | | | | | | |
Total distributions to shareholders | | | (0.11 | ) | | | (0.52 | ) | | | (0.30 | ) | | | (0.26 | ) | | | (0.42 | ) | | | (0.56 | ) |
Net asset value, end of period | | | $5.15 | | | | $5.91 | | | | $6.19 | | | | $6.29 | | | | $6.00 | | | | $5.60 | |
Total return2 | | | (11.21 | )% | | | 4.52 | % | | | 3.21 | % | | | 9.45 | % | | | 15.45 | % | | | (1.69 | )% |
Ratios to average net assets (annualized) | | | | | | | | | | | | | | | | | | | | | | | | |
Gross expenses | | | 0.97 | % | | | 0.97 | % | | | 0.96 | % | | | 0.97 | % | | | 1.00 | % | | | 0.97 | % |
Net expenses | | | 0.77 | % | | | 0.77 | % | | | 0.81 | % | | | 0.90 | % | | | 0.90 | % | | | 0.90 | % |
Net investment income | | | 3.81 | % | | | 3.77 | % | | | 3.40 | % | | | 3.51 | % | | | 3.72 | % | | | 3.56 | % |
Supplemental data | | | | | | | | | | | | | | | | | | | | | | | | |
Portfolio turnover rate | | | 19 | % | | | 43 | % | | | 50 | % | | | 29 | % | | | 38 | % | | | 63 | % |
Net assets, end of period (000s omitted) | | | $9,255 | | | | $11,916 | | | | $32,938 | | | | $41,975 | | | | $70,051 | | | | $31,367 | |
| 1 | Calculated based upon average shares outstanding |
| 2 | Returns for periods of less than one year are not annualized. |
The accompanying notes are an integral part of these financial statements.
30 | Wells Fargo Diversified Income Builder Fund
Financial highlights
(For a share outstanding throughout each period)
| | | | | | | | | | | | | | | | | | | | | | | | |
| | | Six months ended
March 31, 2020 (unaudited) | | | Year ended September 30 | |
| INSTITUTIONAL CLASS | | 2019 | | | 2018 | | | 2017 | | | 2016 | | | 2015 | |
Net asset value, beginning of period | | | $5.91 | | | | $6.19 | | | | $6.28 | | | | $6.00 | | | | $5.59 | | | | $6.25 | |
Net investment income | | | 0.12 | | | | 0.24 | | | | 0.23 | | | | 0.24 | | | | 0.23 | | | | 0.24 | |
Net realized and unrealized gains (losses) on investments | | | (0.76 | ) | | | 0.01 | | | | (0.01 | ) | | | 0.31 | | | | 0.61 | | | | (0.32 | ) |
| | | | | | | | | | | | | | | | | | | | | | | | |
Total from investment operations | | | (0.64 | ) | | | 0.25 | | | | 0.22 | | | | 0.55 | | | | 0.84 | | | | (0.08 | ) |
Distributions to shareholders from | | | | | | | | | | | | | | | | | | | | | | | | |
Net investment income | | | (0.12 | ) | | | (0.25 | ) | | | (0.21 | ) | | | (0.23 | ) | | | (0.22 | ) | | | (0.23 | ) |
Net realized gains | | | 0.00 | | | | (0.28 | ) | | | (0.10 | ) | | | (0.04 | ) | | | (0.21 | ) | | | (0.35 | ) |
| | | | | | | | | | | | | | | | | | | | | | | | |
Total distributions to shareholders | | | (0.12 | ) | | | (0.53 | ) | | | (0.31 | ) | | | (0.27 | ) | | | (0.43 | ) | | | (0.58 | ) |
Net asset value, end of period | | | $5.15 | | | | $5.91 | | | | $6.19 | | | | $6.28 | | | | $6.00 | | | | $5.59 | |
Total return1 | | | (11.10 | )% | | | 4.80 | % | | | 3.62 | % | | | 9.49 | % | | | 15.88 | % | | | (1.65 | )% |
Ratios to average net assets (annualized) | | | | | | | | | | | | | | | | | | | | | | | | |
Gross expenses | | | 0.72 | % | | | 0.72 | % | | | 0.71 | % | | | 0.72 | % | | | 0.75 | % | | | 0.71 | % |
Net expenses | | | 0.52 | % | | | 0.52 | % | | | 0.57 | % | | | 0.71 | % | | | 0.71 | % | | | 0.69 | % |
Net investment income | | | 4.07 | % | | | 4.07 | % | | | 3.67 | % | | | 3.60 | % | | | 3.92 | % | | | 3.76 | % |
Supplemental data | | | | | | | | | | | | | | | | | | | | | | | | |
Portfolio turnover rate | | | 19 | % | | | 43 | % | | | 50 | % | | | 29 | % | | | 38 | % | | | 63 | % |
Net assets, end of period (000s omitted) | | | $262,815 | | | | $312,093 | | | | $335,589 | | | | $315,413 | | | | $124,116 | | | | $77,558 | |
| 1 | Returns for periods of less than one year are not annualized. |
The accompanying notes are an integral part of these financial statements.
Wells Fargo Diversified Income Builder Fund | 31
Notes to financial statements (unaudited)
1. ORGANIZATION
Wells Fargo Funds Trust (the “Trust”), a Delaware statutory trust organized on March 10, 1999, is anopen-end management investment company registered under the Investment Company Act of 1940, as amended (the “1940 Act”). As an investment company, the Trust follows the accounting and reporting guidance in Financial Accounting Standards Board (“FASB”)Accounting Standards Codification Topic 946, Financial Services – Investment Companies. These financial statements report on the Wells Fargo Diversified Income Builder Fund (the “Fund”) which is a diversified series of the Trust.
2. SIGNIFICANT ACCOUNTING POLICIES
The following significant accounting policies, which are consistently followed in the preparation of the financial statements of the Fund, are in conformity with U.S. generally accepted accounting principles which require management to make estimates and assumptions that affect the reported amounts of assets and liabilities, disclosure of contingent assets and liabilities at the date of the financial statements, and the reported amounts of revenues and expenses during the reporting period. Actual results could differ from those estimates.
Securities valuation
All investments are valued each business day as of the close of regular trading on the New York Stock Exchange (generally 4 p.m. Eastern Time), although the Fund may deviate from this calculation time under unusual or unexpected circumstances.
Debt securities are valued at the evaluated bid price provided by an independent pricing service (e.g. taking into account various factors, including yields, maturities, or credit ratings) or, if a reliable price is not available, the quoted bid price from an independent broker-dealer.
Equity securities, options, and futures contracts that are listed on a foreign or domestic exchange or market are valued at the official closing price or, if none, the last sales price. If no sale occurs on the principal exchange or market that day, a fair value price will be determined in accordance with the Fund’s Valuation Procedures.
Forward foreign currency contracts are recorded at the forward rate provided by an independent foreign currency pricing source at a time each business day specified by the Wells Fargo Asset Management Pricing Committee at Wells Fargo Funds Management, LLC (“Funds Management”).
The values of securities denominated in foreign currencies are translated into U.S. dollars at rates provided by an independent foreign currency pricing source at a time each business day specified by the Wells Fargo Asset Management Pricing Committee.
Many securities markets and exchanges outside the U.S. close prior to the close of the New York Stock Exchange and therefore may not fully reflect trading or events that occur after the close of the principal exchange in which the foreign securities are traded, but before the close of the New York Stock Exchange. If such trading or events are expected to materially affect the value of such securities, then fair value pricing procedures approved by the Board of Trustees of the Fund are applied. These procedures take into account multiple factors including movements in U.S. securities markets after foreign exchanges close. Foreign securities that are fair valued under these procedures are categorized as Level 2 and the application of these procedures may result in transfers between Level 1 and Level 2. Depending on market activity, such fair valuations may be frequent. Such fair value pricing may result in net asset values that are higher or lower than net asset values based on the last reported sales price or latest quoted bid price. On March 31, 2020, such fair value pricing was used in pricing certain foreign securities.
Investments in registeredopen-end investment companies are valued at net asset value.
Investments which are not valued using any of the methods discussed above are valued at their fair value, as determined in good faith by the Board of Trustees. The Board of Trustees has established a Valuation Committee comprised of the Trustees and has delegated to it the authority to take any actions regarding the valuation of portfolio securities that the Valuation Committee deems necessary or appropriate, including determining the fair value of portfolio securities, unless the determination has been delegated to the Wells Fargo Asset Management Pricing Committee.The Board of Trustees retains the authority to make or ratify any valuation decisions or approve any changes to the Valuation Procedures as it deems appropriate. On a quarterly basis, the Board of Trustees receives reports on any valuation actions taken by the Valuation Committee or the Wells Fargo Asset Management Pricing Committee which may include items for ratification.
Foreign currency translation
The accounting records of the Fund are maintained in U.S. dollars. The values of other assets and liabilities denominated in foreign currencies are translated into U.S. dollars at rates provided by an independent foreign currency pricing source at a time each business day specified by the Wells Fargo Asset Management Pricing Committee. Purchases and sales of securities, and income and expenses are converted at the rate of exchange on the respective dates of such transactions. Net realized foreign
32 | Wells Fargo Diversified Income Builder Fund
Notes to financial statements (unaudited)
exchange gains or losses arise from sales of foreign currencies, currency gains or losses realized between the trade and settlement dates on securities transactions, and the difference between the amounts of dividends, interest and foreign withholding taxes recorded and the U.S. dollar equivalent of the amounts actually paid or received. Net unrealized foreign exchange gains and losses arise from changes in the fair value of assets and liabilities other than investments in securities resulting from changes in exchange rates. The changes in net assets arising from changes in exchange rates of securities and the changes in net assets resulting from changes in market prices of securities are not separately presented. Such changes are included in net realized and unrealized gains or losses from investments.
Forward foreign currency contracts
A forward foreign currency contract is an agreement between two parties to purchase or sell a specific currency for an agreed-upon price at a future date. The Fund enters into forward foreign currency contracts to facilitate transactions in foreign-denominated securities and to attempt to minimize the risk to the Fund from adverse changes in the relationship between currencies. Forward foreign currency contracts are recorded at the forward rate andmarked-to-market daily. When the contracts are closed, realized gains and losses arising from such transactions are recorded as realized gains or losses on forward foreign currency contracts. The Fund is subject to foreign currency risk and may be exposed to risks if the counterparties to the contracts are unable to meet the terms of their contracts or if the value of the foreign currency changes unfavorably. The Fund’s maximum risk of loss from counterparty credit risk is the unrealized gains on the contracts. This risk may be mitigated if there is a master netting arrangement between the Fund and the counterparty.
Futures contracts
Futures contracts are agreements between the Fund and a counterparty to buy or sell a specific amount of a commodity, financial instrument or currency at a specified price and on a specified date. The Fund may buy and sell futures contracts in order to gain exposure to, or protect against, changes in interest rates, security values, and foreign exchange rates and is subject to interest rate risk, equity price risk, and foreign currency risk. The primary risks associated with the use of futures contracts are the imperfect correlation between changes in market values of securities held by the Fund and the prices of futures contracts, and the possibility of an illiquid market. Futures contracts are generally entered into on a regulated futures exchange and cleared through a clearinghouse associated with the exchange. With futures contracts, there is minimal counterparty risk to the Fund since futures contracts are exchange traded and the exchange’s clearinghouse, as the counterparty to all exchange traded futures, guarantees the futures contracts against default.
Upon entering into a futures contracts, the Fund is required to deposit either cash or securities (initial margin) with the broker in an amount equal to a certain percentage of the contract value. Subsequent payments (variation margin) are paid to or from the broker each day equal to the daily changes in the contract value. Such payments are recorded as unrealized gains or losses and, if any, shown as variation margin receivable (payable) in the Statement of Assets and Liabilities. Should the Fund fail to make requested variation margin payments, the broker can gain access to the initial margin to satisfy the Fund’s payment obligations. When the contracts are closed, a realized gain or loss is recorded in the Statement of Operations.
Options
The Fund may write covered call options or secured put options on individual securities and/or indexes. When the Fund writes an option, an amount equal to the premium received is recorded as a liability and is subsequently adjusted to the current market value of the written option. Premiums received from written options that expire unexercised are recognized as realized gains on the expiration date. For exercised options, the difference between the premium received and the amount paid on effecting a closing purchase transaction, including brokerage commissions, is treated as a realized gain or loss. If a call option is exercised, the premium is added to the proceeds from the sale of the underlying security in calculating the realized gain or loss on the sale. If a put option is exercised, the premium reduces the cost of the security purchased. The Fund, as a writer of an option, bears the market risk of an unfavorable change in the price of the security and/or index underlying the written option.
The Fund may also purchase call or put options. Premiums paid are included in the Statement of Assets and Liabilities as investments, the values of which are subsequently adjusted based on the current market values of the options. Premiums paid for purchased options that expire are recognized as realized losses on the expiration date. Premiums paid for purchased options that are exercised or closed are added to the amount paid or offset against the proceeds received for the underlying security to determine the realized gain or loss. The risk of loss associated with purchased options is limited to the premium paid.
Options traded on an exchange are regulated and terms of the options are standardized. The Fund is subject to equity price risk. Purchased options tradedover-the-counter expose the Fund to counterparty risk in the event the counterparty does not perform. This risk can be mitigated by having a master netting arrangement between the Fund and the counterparty and by having the counterparty post collateral to cover the Fund’s exposure to the counterparty.
Wells Fargo Diversified Income Builder Fund | 33
Notes to financial statements (unaudited)
Security transactions and income recognition
Securities transactions are recorded on a trade date basis. Realized gains or losses are recorded on the basis of identified cost.
Interest income is accrued daily and bond discounts are accreted and premiums are amortized daily. To the extent debt obligations are placed onnon-accrual status, any related interest income may be reduced by writing off interest receivables when the collection of all or a portion of interest has been determined to be doubtful based on consistently applied procedures and the fair value has decreased. If the issuer subsequently resumes interest payments or when the collectability of interest is reasonably assured, the debt obligation is removed fromnon-accrual status.
Dividend income is recognized on theex-dividend date, except for certain dividends from foreign securities, which are recorded as soon as the custodian verifies theex-dividend date. Dividend income from foreign securities is recorded net of foreign taxes withheld where recovery of such taxes is not assured.
Income dividends and capital gain distributions from investment companies are recorded on the ex-dividend date. Capital gain distributions from investment companies are treated as realized gains.
Distributions to shareholders
Distributions to shareholders are recorded on theex-dividend date and paid from net investment income monthly and any net realized gains are paid at least annually. Such distributions are determined in accordance with income tax regulations and may differ from U.S. generally accepted accounting principles. Dividend sources are estimated at the time of declaration. The tax character of distributions is determined as of the Fund’s fiscal year end. Therefore, a portion of the Fund’s distributions made prior to the Fund’s fiscal year end may be categorized as a tax return of capital at year end.
Federal and other taxes
The Fund intends to continue to qualify as a regulated investment company by distributing substantially all of its investment company taxable income and any net realized capital gains (after reduction for capital loss carryforwards) sufficient to relieve it from all, or substantially all, federal income taxes. Accordingly, no provision for federal income taxes was required.
The Fund’s income and federal excise tax returns and all financial records supporting those returns for the prior three fiscal years are subject to examination by the federal and Delaware revenue authorities. Management has analyzed the Fund’s tax positions taken on federal, state, and foreign tax returns for all open tax years and does not believe that there are any uncertain tax positions that require recognition of a tax liability.
As of March 31, 2020, the aggregate cost of all investments for federal income tax purposes was $657,984,919 and the unrealized gains (losses) consisted of:
| | | | |
| |
Gross unrealized gains | | $ | 21,412,233 | |
| |
Gross unrealized losses | | | (83,818,254 | ) |
| |
Net unrealized losses | | $ | (62,406,021 | ) |
As of September 30, 2019, the Fund had capital loss carryforwards which consisted of $8,937,939 in short-term capital losses and $15,236,081 in long-term capital losses.
Class allocations
The separate classes of shares offered by the Fund differ principally in applicable sales charges, distribution, shareholder servicing, and administration fees. Class specific expenses are charged directly to that share class. Investment income, common fund-level expenses, and realized and unrealized gains (losses) on investments are allocated daily to each class of shares based on the relative proportion of net assets of each class.
3. FAIR VALUATION MEASUREMENTS
Fair value measurements of investments are determined within a framework that has established a fair value hierarchy based upon the various data inputs utilized in determining the value of the Fund’s investments. The three-level hierarchy gives the highest priority to unadjusted quoted prices in active markets for identical assets or liabilities (Level 1) and the lowest priority to unobservable inputs (Level 3). The Fund’s investments are classified within the fair value hierarchy based on the lowest level of input that is significant to the fair value measurement. The inputs are summarized into three broad levels as follows:
| ∎ | | Level 1 – quoted prices in active markets for identical securities |
| ∎ | | Level 2 – other significant observable inputs (including quoted prices for similar securities, interest rates, prepayment speeds, credit risk, etc.) |
| ∎ | | Level 3 – significant unobservable inputs (including the Fund’s own assumptions in determining the fair value of investments) |
34 | Wells Fargo Diversified Income Builder Fund
Notes to financial statements (unaudited)
The inputs or methodologies used for valuing investments in securities are not necessarily an indication of the risk associated with investing in those securities.
The following is a summary of the inputs used in valuing the Fund’s assets and liabilities as of March 31, 2020:
| | | | | | | | | | | | | | | | |
| | | | |
| | | Quoted prices
(Level 1) | | | Other significant
observable inputs
(Level 2) | | | Significant
unobservable inputs (Level 3) | | | Total | |
| | | | |
Assets | | | | | | | | | | | | | | | | |
Investments in: | | | | | | | | | | | | | | | | |
| | | | |
Asset-backed securities | | $ | 0 | | | $ | 7,166,342 | | | $ | 0 | | | $ | 7,166,342 | |
| | | | |
Common stocks | | | | | | | | | | | | | | | | |
| | | | |
Communication services | | | 2,860,630 | | | | 3,194,699 | | | | 0 | | | | 6,055,329 | |
| | | | |
Consumer discretionary | | | 3,420,538 | | | | 3,551,753 | | | | 0 | | | | 6,972,291 | |
| | | | |
Consumer staples | | | 3,295,578 | | | | 2,823,235 | | | | 0 | | | | 6,118,813 | |
| | | | |
Energy | | | 13,150,501 | | | | 1,438,153 | | | | 0 | | | | 14,588,654 | |
| | | | |
Financials | | | 7,641,364 | | | | 8,067,761 | | | | 0 | | | | 15,709,125 | |
| | | | |
Health care | | | 14,459,181 | | | | 4,521,070 | | | | 0 | | | | 18,980,251 | |
| | | | |
Industrials | | | 8,287,724 | | | | 4,433,671 | | | | 0 | | | | 12,721,395 | |
| | | | |
Information technology | | | 31,038,278 | | | | 7,936,632 | | | | 0 | | | | 38,974,910 | |
| | | | |
Materials | | | 3,241,944 | | | | 2,787,242 | | | | 0 | | | | 6,029,186 | |
| | | | |
Real estate | | | 5,844,413 | | | | 2,271,378 | | | | 0 | | | | 8,115,791 | |
| | | | |
Utilities | | | 9,077,555 | | | | 2,023,406 | | | | 0 | | | | 11,100,961 | |
| | | | |
Corporate bonds and notes | | | 0 | | | | 322,032,245 | | | | 0 | | | | 322,032,245 | |
| | | | |
Foreign corporate bonds and notes | | | 0 | | | | 13,941,075 | | | | 0 | | | | 13,941,075 | |
| | | | |
Municipal obligations | | | 0 | | | | 30,353,715 | | | | 0 | | | | 30,353,715 | |
| | | | |
Non-agency mortgage-backed securities | | | 0 | | | | 11,881,435 | | | | 0 | | | | 11,881,435 | |
| | | | |
Preferred stocks | | | | | | | | | | | | | | | | |
| | | | |
Energy | | | 112,834 | | | | 0 | | | | 0 | | | | 112,834 | |
| | | | |
Financials | | | 291,105 | | | | 0 | | | | 0 | | | | 291,105 | |
| | | | |
Information technology | | | 0 | | | | 356,704 | | | | 0 | | | | 356,704 | |
| | | | |
Materials | | | 120,304 | | | | 0 | | | | 0 | | | | 120,304 | |
| | | | |
Yankee corporate bonds and notes | | | 0 | | | | 54,642,639 | | | | 0 | | | | 54,642,639 | |
| | | | |
Short-term investments | | | | | | | | | | | 0 | | | | | |
| | | | |
Investment companies | | | 5,744,946 | | | | 0 | | | | 0 | | | | 5,744,946 | |
| | | | |
U.S. Treasury securities | | | 3,497,205 | | | | 0 | | | | 0 | | | | 3,497,205 | |
| | | | |
| | | 112,084,100 | | | | 483,423,155 | | | | 0 | | | | 595,507,255 | |
Futures contracts | | | 3,165,123 | | | | 0 | | | | 0 | | | | 3,165,123 | |
| | | | |
| Forward foreign currency contracts | | | 0 | | | | 31,508 | | | | 0 | | | | 31,508 | |
| | | | |
Total assets | | $ | 115,249,223 | | | $ | 483,454,663 | | | $ | 0 | | | $ | 598,703,886 | |
| | | | |
Liabilities | | | | | | | | | | | | | | | | |
Futures contracts | | $ | 2,223,394 | | | $ | 0 | | | $ | 0 | | | $ | 2,223,394 | |
| | | | |
Forward foreign currency contracts | | | 0 | | | | 493,760 | | | | 0 | | | | 493,760 | |
| | | | |
Written options | | | 0 | | | | 407,834 | | | | 0 | | | | 407,834 | |
| | | | |
Total liabilities | | $ | 2,223,394 | | | $ | 901,594 | | | $ | 0 | | | $ | 3,124,988 | |
Wells Fargo Diversified Income Builder Fund | 35
Notes to financial statements (unaudited)
Additional sector, industry or geographic detail is included in the Portfolio of Investments.
Futures contracts and forward foreign currency contracts are reported at their cumulative unrealized gains (losses) at measurement date as reported in the tables following the Portfolio of Investments. For futures contracts, the current day’s variation margin is reported on the Statement of Assets and Liabilities. All other assets and liabilities are reported at their market value at measurement date.
For the six months ended March 31, 2020, the Fund did not have any transfers into/out of Level 3.
4. TRANSACTIONS WITH AFFILIATES
Management fee
Funds Management, an indirect wholly owned subsidiary of Wells Fargo & Company (“Wells Fargo”), is the manager of the Fund and provides advisory and fund-level administrative services under an investment management agreement. Under the investment management agreement, Funds Management is responsible for, among other services, implementing the investment objectives and strategies of the Fund, supervising the subadviser and providing fund-level administrative services in connection with the Fund’s operations. As compensation for its services under the investment management agreement, Funds Management is entitled to receive a management fee at the following annual rate based on the Fund’s average daily net assets:
| | | | |
| |
| Average daily net assets | | Management fee | |
| |
First $500 million | | | 0.550 | % |
| |
Next $500 million | | | 0.525 | |
| |
Next $2 billion | | | 0.500 | |
| |
Next $2 billion | | | 0.475 | |
| |
Next $5 billion | | | 0.440 | |
| |
Over $10 billion | | | 0.430 | |
For the six months ended March 31, 2020, the management fee was equivalent to an annual rate of 0.54% of the Fund’s average daily net assets.
Funds Management has retained the services of a subadviser to provide daily portfolio management to the Fund. The fee for subadvisory services is borne by Funds Management. Wells Capital Management Incorporated (“WellsCap”), an affiliate of Funds Management and an indirect wholly owned subsidiary of Wells Fargo, is the subadviser to the Fund and is entitled to receive a fee from Funds Management at an annual rate starting at 0.35% and declining to 0.20% as the average daily net assets of the Fund increase.
Administration fees
Under a class-level administration agreement, Funds Management provides class-level administrative services to the Fund, which includes paying fees and expenses for services provided by the transfer agent,sub-transfer agents, omnibus account servicers and record-keepers. As compensation for its services under the class-level administration agreement, Funds Management receives an annual fee which is calculated based on the average daily net assets of each class as follows:
| | | | |
| |
| | | Class-level
administration fee | |
| |
Class A, Class C | | | 0.21 | % |
| |
Class R6 | | | 0.03 | |
| |
Administrator Class, Institutional Class | | | 0.13 | |
Waivers and/or expense reimbursements
Funds Management has contractually waived and/or reimbursed management and administration fees to the extent necessary to maintain certain net operating expense ratios for the Fund. When each class of the Fund has exceeded its expense cap, Funds Management has waived fees and/or reimbursed expenses from fund level expenses on a proportionate basis and then from class specific expenses. When only certain classes exceed their expense caps, waivers and/or reimbursements are applied against class specific expenses before fund level expenses. Funds Management has committed through January 31, 2021 to waive fees and/or reimburse expenses to the extent necessary to cap the Fund’s expenses at 0.85% for Class A shares, 1.60% for Class C shares, 0.42% for Class R6 shares, 0.77% for Administrator Class shares, and 0.52% for Institutional Class shares. Prior to or after the commitment expiration date, the cap may be increased or the commitment to maintain the cap may be terminated only with the approval of the Board of Trustees.
36 | Wells Fargo Diversified Income Builder Fund
Notes to financial statements (unaudited)
Distribution fee
The Trust has adopted a distribution plan for Class C shares of the Fund pursuant to Rule12b-1 under the 1940 Act. A distribution fee is charged to Class C shares and paid to Wells Fargo Funds Distributor, LLC (“Funds Distributor”), the principal underwriter, at an annual rate of 0.75% of the average daily net assets of Class C shares.
In addition, Funds Distributor is entitled to receive thefront-end sales charge from the purchase of Class A shares and a contingent deferred sales charge on the redemption of certain Class A shares. Funds Distributor is also entitled to receive the contingent deferred sales charges from redemptions of Class C shares. For the six months ended March 31, 2020, Funds Distributor received $28,955 from the sale of Class A shares and $483 in contingent deferred sales charges from redemptions of Class C shares. No contingent deferred sales charges were incurred by Class A for the six months ended March 31, 2020.
Shareholder servicing fees
The Trust has entered into contracts with one or more shareholder servicing agents, whereby Class A, Class C, and Administrator Class of the Fund are charged a fee at an annual rate of 0.25% of the average daily net assets of each respective class. A portion of these total shareholder servicing fees were paid to affiliates of Wells Fargo.
Interfund transactions
The Fund may purchase or sell portfolio investment securities to certain other Wells Fargo affiliates pursuant to Rule17a-7 under the 1940 Act and under procedures adopted by the Board of Trustees. The procedures have been designed to ensure that these interfund transactions, which do not incur broker commissions, are effected at current market prices. Pursuant to these procedures, the Fund had $7,343,750 and $0 in interfund purchases and sales, respectively, during the six months ended March 31, 2020.
5. INVESTMENT PORTFOLIO TRANSACTIONS
Purchases and sales of investments, excluding U.S. government obligations (if any) and short-term securities, for the six months ended March 31, 2020 were $134,385,245 and $129,619,958, respectively.
6. DERIVATIVE TRANSACTIONS
During the six months ended March 31, 2020, the Fund entered into futures contracts, forward foreign currency contracts, and written options for economic hedging purposes.
The volume of the Fund’s futures contracts, forward foreign currency contracts, and written options during the six months ended March 31, 2020 was as follows:
| | | | |
Options | | | | |
| |
Average number of contracts written | | | 2,004 | |
Futures contracts | | | | |
| |
Average notional balance on long futures | | $ | 54,756,042 | |
| |
Average notional balance on short futures | | | 45,358,726 | |
Forward foreign currency contracts | | | | |
| |
Average contract amounts to buy | | $ | 3,935,411 | |
| |
Average contract amounts to sell | | | 30,519,769 | |
A summary of the location of derivative instruments on the financial statements by primary risk exposure is outlined in the following tables.
The fair value of derivative instruments as of March 31, 2020 by risk type was as follows for the Fund:
| | | | | | | | | | | | |
| | | Asset derivatives | | | Liability derivatives | |
| | | | |
| | | Statement of Assets and
Liabilities location | | Fair value | | | Statement of Assets and
Liabilities location | | Fair value | |
| | | | |
Equity risk | | Unrealized gains on futures contracts | | $ | 3,165,123 | * | | Unrealized losses on futures contracts | | $ | 2,223,394 | * |
| | | | |
Foreign currency risk | | Unrealized gains on forward foreign currency contracts | | | 31,508 | | | Unrealized losses on forward foreign currency contracts | | | 493,760 | |
| | | | |
Equity risk | | | | | | | | Written options, at value | | | 407,834 | |
| | | | |
| | | | | $ | 3,196,631 | | | | | $ | 3,124,988 | |
| * | Amount represents cumulative unrealized gains (losses) as reported in the table following the Portfolio of Investments. Only the current day’s variation margin as of March 31, 2020 is reported separately on the Statement of Assets and Liabilities. |
Wells Fargo Diversified Income Builder Fund | 37
Notes to financial statements (unaudited)
The effect of derivative instruments on the Statement of Operations for the six months ended March 31, 2020 was as follows for the Fund:
| | | | | | | | | | | | | | | | |
| | | Amount of realized gains (losses) on derivatives | |
| | | | |
| | | Futures
contracts | | | Forward
foreign
currency
contracts | | | Written
options | | | Total | |
| | | | |
Interest rate risk | | $ | (1,549,310 | ) | | $ | 0 | | | $ | 0 | | | $ | (1,549,310 | ) |
| | | | |
Equity risk | | | (2,248,253 | ) | | | 0 | | | | 1,201,531 | | | | (1,046,722 | ) |
| | | | |
Foreign currency risk | | | (590,263 | ) | | | 958,152 | | | | 0 | | | | 367,889 | |
| | | | |
| | | $ | (4,387,826 | ) | | $ | 958,152 | | | $ | 1,201,531 | | | $ | (2,228,143 | ) |
| |
| | | Change in unrealized gains (losses) on derivatives | |
| | | | |
| | | Futures
contracts | | | Forward
foreign
currency
contracts | | | Written
options | | | Total | |
| | | | |
Interest rate risk | | $ | 496,274 | | | $ | 0 | | | $ | 0 | | | $ | 496,274 | |
| | | | |
Equity risk | | | 814,300 | | | | 0 | | | | 815,258 | | | | 1,629,558 | |
| | | | |
Foreign currency risk | | | (467,536 | ) | | | (381,476 | ) | | | 0 | | | | (849,012 | ) |
| | | | |
| | | $ | 843,038 | | | $ | (381,476 | ) | | $ | 815,258 | | | $ | 1,276,820 | |
For certain types of derivative transactions, the Fund has entered into International Swaps and Derivatives Association, Inc. master agreements (“ISDA Master Agreements”) or similar agreements with approved counterparties. The ISDA Master Agreements or similar agreements may have requirements to deliver/deposit securities or cash to/with an exchange or broker-dealer as collateral and allows the Fund to offset, with each counterparty, certain derivative financial instrument’s assets and/or liabilities with collateral held or pledged. Collateral requirements differ by type of derivative. Collateral or margin requirements are set by the broker or exchange clearinghouse for exchange traded derivatives while collateral terms are contract specific forover-the-counter traded derivatives. Cash collateral that has been pledged to cover obligations of the Fund under ISDA Master Agreements or similar agreements, if any, are reported separately in the Statement of Assets and Liabilities. Securities pledged as collateral, if any, are noted in the Portfolio of Investments. With respect to balance sheet offsetting, absent an event of default by the counterparty or a termination of the agreement, the reported amounts of financial assets and financial liabilities in the Statement of Assets and Liabilities are not offset across transactions between the Fund and the applicable counterparty. A reconciliation of the gross amounts on the Statement of Assets and Liabilities to the net amounts by counterparty, including any collateral exposure, for OTC derivatives is as follows:
| | | | | | | | | | | | |
| | | | |
| Counterparty | | Gross amounts
of assets in the
Statement of
Assets and
Liabilities | | Amounts
subject to
netting
agreements | | Collateral
received | | | Net amount
of assets | |
| | | | |
Citibank | | $31,508 | | $(31,508) | | $ | 0 | | | $ | 0 | |
| | | | | | | | | | | | |
| | | | |
| Counterparty | | Gross amounts
of liabilities in the
Statement of
Assets and
Liabilities | | Amounts
subject to
netting
agreements | | Collateral
pledged1 | | | Net amount
of liabilities | |
| | | | |
Citibank | | $493,760 | | $(31,508) | | $ | (190,000 | ) | | $ | 272,252 | |
| 1 | Collateral pledged within this table is limited to the collateral for the net transaction with the counterparty. |
7. BANK BORROWINGS
The Trust (excluding the money market funds), Wells Fargo Master Trust and Wells Fargo Variable Trust are parties to a $280,000,000 revolving credit agreement whereby the Fund is permitted to use bank borrowings for temporary or emergency purposes, such as to fund shareholder redemption requests. Interest under the credit agreement is charged to the Fund based
38 | Wells Fargo Diversified Income Builder Fund
Notes to financial statements (unaudited)
on a borrowing rate equal to the higher of the Federal Funds rate in effect on that day plus 1.25% or the overnight LIBOR rate in effect on that day plus 1.25%. In addition, an annual commitment fee equal to 0.25% of the unused balance is allocated to each participating fund.
During the six months ended March 31, 2020, the Fund had average borrowings outstanding of $15,988 (on an annualized basis) at an average rate of 1.62% and paid interest in the amount of $259.
8. INDEMNIFICATION
Under the Trust’s organizational documents, the officers and Trustees have been granted certain indemnification rights against certain liabilities that may arise out of performance of their duties to the Trust. Additionally, in the normal course of business, the Trust may enter into contracts with service providers that contain a variety of indemnification clauses. The Trust’s maximum exposure under these arrangements is dependent on future claims that may be made against the Fund and, therefore, cannot be estimated.
9. NEW ACCOUNTING PRONOUNCEMENTS
In August 2018, FASB issued Accounting Standards Update (“ASU”)No. 2018-13, Fair Value Measurement (Topic 820)Disclosure Framework—Changes to the Disclosure Requirements for Fair Value Measurement. ASU2018-13 updates the disclosure requirements for fair value measurements by modifying or removing certain disclosures and adding certain new disclosures. The amendments are effective for fiscal years, and interim periods within those fiscal years, beginning after December 15, 2019. Early adoption is permitted. Management has adopted the removal and modification of disclosures early, as permitted, and will adopt the additional new disclosures at the effective date.
In March 2017, FASB issued ASUNo. 2017-08,Premium Amortization on Purchased Callable Debt Securities. ASU2017-08 shortens the amortization period for certain callable debt securities held at a premium and requires the premium to be amortized to the earliest call date. The amendments do not require an accounting change for securities held at a discount and discounts will continue to be accreted to the maturity date of the security. ASU2017-08 is effective for fiscal years beginning after December 15, 2018 and for interim periods within those fiscal years. During the current reporting period, management of the Fund adopted the change in accounting policy which did not have a material impact to the Fund’s financial statements.
10. CORONAVIRUS(COVID-19) PANDEMIC
On March 11, 2020, the World Health Organization announced that it had made the assessment that coronavirus disease 2019(“COVID-19”) is a pandemic. The impacts ofCOVID-19 are adversely affecting the entire global economy, individual companies and investment products, and the market in general. There is significant uncertainty around the extent and duration of business disruptions related toCOVID-19 and the impacts may be short term or may last for an extended period of time. The risk of further spreading ofCOVID-19 has led to significant uncertainty and volatility in the financial markets. The value of the Fund and the securities in which the Fund invests have generally been adversely affected by impacts caused byCOVID-19.
Wells Fargo Diversified Income Builder Fund | 39
Other information (unaudited)
PROXY VOTING INFORMATION
A description of the policies and procedures used to determine how to vote proxies relating to portfolio securities is available, upon request, by calling1-800-222-8222, visiting our website atwfam.com, or visiting the SEC website at sec.gov. Information regarding how the proxies related to portfolio securities were voted during the most recent12-month period ended June 30 is available on the website atwfam.comor by visiting the SEC website at sec.gov.
QUARTERLY PORTFOLIO HOLDINGS INFORMATION
The Fund files its complete schedule of portfolio holdings with the SEC for the first and third quarters of each fiscal year as an exhibit to its reports on FormN-PORT. Shareholders may view the filed FormN-PORT by visiting the SEC website at sec.gov.
40 | Wells Fargo Diversified Income Builder Fund
Other information (unaudited)
BOARD OF TRUSTEES AND OFFICERS
Each of the Trustees and Officers1 listed in the table below acts in identical capacities for each fund in the Wells Fargo family of funds, which consists of 147 mutual funds comprising the Wells Fargo Funds Trust, Wells Fargo Variable Trust, Wells Fargo Master Trust and fourclosed-end funds (collectively the “Fund Complex”). This table should be read in conjunction with the Prospectus and the Statement of Additional Information2. The mailing address of each Trustee and Officer is 525 Market Street, 12th Floor, San Francisco, CA 94105. Each Trustee and Officer serves an indefinite term, however, each Trustee serves such term until reaching the mandatory retirement age established by the Trustees.
Independent Trustees
| | | | | | |
Name and year of birth | | Position held and
length of service* | | Principal occupations during past five years or longer | | Current other
public company or
investment
company
directorships |
| | | |
William R. Ebsworth (Born 1957) | | Trustee, since 2015 | | Retired. From 1984 to 2013, equities analyst, portfolio manager, research director and chief investment officer at Fidelity Management and Research Company in Boston, Tokyo, and Hong Kong, and retired in 2013 as Chief Investment Officer of Fidelity Strategic Advisers, Inc. where he led a team of investment professionals managing client assets. Prior thereto, Board member of Hong Kong Securities Clearing Co., Hong Kong Options Clearing Corp., the Thailand International Fund, Ltd., Fidelity Investments Life Insurance Company, and Empire Fidelity Investments Life Insurance Company. Audit Committee Chair and Investment Committee Chair of the Vincent Memorial Hospital Endowment(non-profit organization). Mr. Ebsworth is a CFA® charterholder. | | N/A |
| | | |
Jane A. Freeman (Born 1953) | | Trustee, since 2015; Chair Liaison, since 2018 | | Retired. From 2012 to 2014 and 1999 to 2008, Chief Financial Officer of Scientific Learning Corporation. From 2008 to 2012, Ms. Freeman provided consulting services related to strategic business projects. Prior to 1999, Portfolio Manager at Rockefeller & Co. and Scudder, Stevens & Clark. Board member of the Harding Loevner Funds from 1996 to 2014, serving as both Lead Independent Director and chair of the Audit Committee. Board member of the Russell Exchange Traded Funds Trust from 2011 to 2012 and the chair of the Audit Committee. Ms. Freeman is a Board Member of The Ruth Bancroft Garden(non-profit organization). She is also an inactive Chartered Financial Analyst. | | N/A |
| | | |
Isaiah Harris, Jr. (Born 1952) | | Trustee, since 2009; Audit Committee Chairman, since 2019 | | Retired. Chairman of the Board of CIGNA Corporation since 2009, and Director since 2005. From 2003 to 2011, Director of Deluxe Corporation. Prior thereto, President and CEO of BellSouth Advertising and Publishing Corp. from 2005 to 2007, President and CEO of BellSouth Enterprises from 2004 to 2005 and President of BellSouth Consumer Services from 2000 to 2003. Emeritus member of the Iowa State University Foundation Board of Governors. Emeritus Member of the Advisory Board of Iowa State University School of Business. Advisory Board Member, Palm Harbor Academy (private school). Advisory Board Member, Child Evangelism Fellowship(non-profit). Mr. Harris is a certified public accountant (inactive status). | | CIGNA Corporation |
| | | |
Judith M. Johnson (Born 1949) | | Trustee, since 2008; Audit Committee Chairman, from 2009 to 2018 | | Retired. Prior thereto, Chief Executive Officer and Chief Investment Officer of Minneapolis Employees Retirement Fund from 1996 to 2008. Ms. Johnson is an attorney, certified public accountant and a certified managerial accountant. | | N/A |
Wells Fargo Diversified Income Builder Fund | 41
Other information (unaudited)
| | | | | | |
Name and year of birth | | Position held and
length of service* | | Principal occupations during past five years or longer | | Current other
public company or
investment
company
directorships |
| | | |
David F. Larcker (Born 1950) | | Trustee, since 2009 | | James Irvin Miller Professor of Accounting at the Graduate School of Business, Stanford University, Director of the Corporate Governance Research Initiative and Senior Faculty of The Rock Center for Corporate Governance since 2006. From 2005 to 2008, Professor of Accounting at the Graduate School of Business, Stanford University. Prior thereto, Ernst & Young Professor of Accounting at The Wharton School, University of Pennsylvania from 1985 to 2005. | | N/A |
| | | |
Olivia S. Mitchell (Born 1953) | | Trustee, since 2006; Nominating and Governance Committee Chair, since 2018 | | International Foundation of Employee Benefit Plans Professor, Wharton School of the University of Pennsylvania since 1993. Director of Wharton’s Pension Research Council and Boettner Center on Pensions & Retirement Research, and Research Associate at the National Bureau of Economic Research. Previously, Cornell University Professor from 1978 to 1993. | | N/A |
| | | |
Timothy J. Penny (Born 1951) | | Trustee, since 1996; Chairman, since 2018 | | President and Chief Executive Officer of Southern Minnesota Initiative Foundation, anon-profit organization, since 2007. Member of the Board of Trustees of NorthStar Education Finance, Inc., anon-profit organization, since 2007. | | N/A |
| | | |
James G. Polisson (Born 1959) | | Trustee, since 2018 | | Retired. Chief Marketing Officer, Source (ETF) UK Services, Ltd, from 2015 to 2017. From 2012 to 2015, Principal of The Polisson Group, LLC, a management consulting, corporate advisory and principal investing company. Chief Executive Officer and Managing Director at Russell Investments, Global Exchange Traded Funds from 2010 to 2012. Managing Director of Barclays Global Investors from 1998 to 2010 and Global Chief Marketing Officer for iShares and Barclays Global Investors from 2000 to 2010. Trustee of the San Francisco Mechanics’ Institute, anon-profit organization, from 2013 to 2015. Board member of the Russell Exchange Traded Fund Trust from 2011 to 2012. Director of Barclays Global Investors Holdings Deutschland GmbH from 2006 to 2009. Mr. Polisson is an attorney and has a retired status with the Massachusetts and District of Columbia Bar Associations. | | N/A |
| | | |
Pamela Wheelock3 (Born 1959) | | Trustee, since January 2020; previously Trustee from January 2018 to July 2019 | | Board member of the Destination Medical Center Economic Development Agency, Rochester, Minnesota since 2019. Acting Commissioner, Minnesota Department of Human Services, July 2019 through September 2019. Human Services Manager (part-time), Minnesota Department of Human Services, October 2019 through December 2019. Chief Operating Officer, Twin Cities Habitat for Humanity from 2017 to 2019. Vice President of University Services, University of Minnesota from 2012 to 2016. Prior thereto, on the Board of Directors, Governance Committee and Finance Committee for the Minnesota Philanthropy Partners (Saint Paul Foundation) from 2012 to 2018, Interim Chief Executive Officer of Blue Cross Blue Shield of Minnesota from 2011 to 2012, Chairman of the Board from 2009 to 2012 and Board Director from 2003 to 2015. Vice President, Leadership and Community Engagement, Bush Foundation, Saint Paul, Minnesota (a private foundation) from 2009 to 2011. Executive Vice President and Chief Financial Officer, Minnesota Sports and Entertainment from 2004 to 2009 and Senior Vice President from 2002 to 2004. Executive Vice President of the Minnesota Wild Foundation from 2004 to 2008. Commissioner of Finance, State of Minnesota, from 1999 to 2002. Currently Board Chair of the Minnesota Wild Foundation since 2010. | | N/A |
| * | Length of service dates reflect the Trustee’s commencement of service with the Trust’s predecessor entities, where applicable. |
42 | Wells Fargo Diversified Income Builder Fund
Other information (unaudited)
Officers
| | | | |
Name and year of birth | | Position held and
length of service | | Principal occupations during past five years or longer |
| | |
Andrew Owen (Born 1960) | | President, since 2017 | | Executive Vice President of Wells Fargo & Company and Head of Affiliated Managers, Wells Fargo Asset Management, since 2014. In addition, Mr. Owen is currently President, Chief Executive Officer and Director of Wells Fargo Funds Management, LLC since 2017. Prior thereto, Executive Vice President responsible for marketing, investments and product development for Wells Fargo Funds Management, LLC, from 2009 to 2014. |
| | |
Jeremy DePalma1 (Born 1974) | | Treasurer, since 2012 | | Senior Vice President of Wells Fargo Funds Management, LLC since 2009. Senior Vice President of Evergreen Investment Management Company, LLC from 2008 to 2010 and head of the Fund Reporting and Control Team within Fund Administration from 2005 to 2010. |
| | |
Michelle Rhee (Born 1966) | | Chief Legal Officer, since 2019 | | Secretary of Wells Fargo Funds Management, LLC, Chief Legal Counsel of Wells Fargo Asset Management and Assistant General Counsel of Wells Fargo Bank, N.A. since 2018. Associate General Counsel and Managing Director of Bank of America Corporation from 2004 to 2018. |
| | |
Catherine Kennedy (Born 1969) | | Secretary, since 2019 | | Vice President of Wells Fargo Funds Management, LLC and Senior Counsel of the Wells Fargo Legal Department since 2010. Vice President and Senior Counsel of Evergreen Investment Management Company, LLC from 1998 to 2010. |
| | |
Michael H. Whitaker (Born 1967) | | Chief Compliance Officer, since 2016 | | Chief Compliance Officer of Wells Fargo Asset Management since 2016. Senior Vice President and Chief Compliance Officer for Fidelity Investments from 2007 to 2016. |
| | |
David Berardi (Born 1975) | | Assistant Treasurer, since 2009 | | Vice President of Wells Fargo Funds Management, LLC since 2009. Vice President of Evergreen Investment Management Company, LLC from 2008 to 2010. Manager of Fund Reporting and Control for Evergreen Investment Management Company, LLC from 2004 to 2010. |
| 1 | Jeremy DePalma acts as Treasurer of 82 funds and Assistant Treasurer of 65 funds in the Fund Complex. |
| 2 | The Statement of Additional Information includes additional information about the Trustees and is available, without charge, upon request, by calling1-800-222-8222 or by visiting the website atwfam.com. |
| 3 | Pamela Wheelock wasre-appointed to the Board effective January 1, 2020. |
Wells Fargo Diversified Income Builder Fund | 43
Appendix I (unaudited)
Effective on or about May 1, 2020, if you purchase Fund shares through a Janney Montgomery Scott LLC (“Janney”) brokerage account, you will be eligible for the following load waivers(front-end sales charge waivers and contingent deferred sales charge (“CDSC”), orback-end sales charge, waivers) and discounts, which may differ from those disclosed elsewhere in the Fund’s Prospectus or SAI.
|
|
| Front-end sales charge* waivers on Class A shares available at Janney |
|
| Shares purchased through reinvestment of capital gains distributions and dividend reinvestment when purchasing shares of the same fund (but not any other fund within the fund family). |
|
| Shares purchased by employees and registered representatives of Janney or its affiliates and their family members as designated by Janney. |
|
| Shares purchased from the proceeds of redemptions within the same fund family, provided (1) the repurchase occurs within ninety (90) days following the redemption, (2) the redemption and purchase occur in the same account, and (3) redeemed shares were subject to afront-end or deferred sales load (i.e., right of reinstatement). |
|
| Employer-sponsored retirement plans (e.g., 401(k) plans, 457 plans, employer-sponsored 403(b) plans, profit sharing and money purchase pension plans and defined benefit plans). For purposes of this provision, employer-sponsored retirement plans do not include SEP IRAs, Simple IRAs,SAR-SEPs or Keogh plans. |
|
| Shares acquired through a right of reinstatement. |
|
| Class C shares that are no longer subject to a contingent deferred sales charge and are converted to Class A shares of the same fund pursuant to Janney’s policies and procedures. |
|
| CDSC waivers on Class A and Class C shares available at Janney |
|
| Shares sold upon the death or disability of the shareholder. |
|
| Shares sold as part of a systematic withdrawal plan as described in the Fund’s Prospectus. |
|
| Shares purchased in connection with a return of excess contributions from an IRA account. |
|
| Shares sold as part of a required minimum distribution for IRA and retirement accounts if the redemption is taken in or after the year the shareholder reaches qualified age based on applicable IRS regulations. |
|
| Shares sold to pay Janney fees but only if the transaction is initiated by Janney. |
|
| Shares acquired through a right of reinstatement. |
|
| Shares exchanged into the same share class of a different fund. |
|
| Front-end sales charge* discounts available at Janney; breakpoints, rights of accumulation and/or letters of intent |
|
| Breakpoints as described in the Fund’s Prospectus. |
|
| Rights of accumulation (“ROA”), which entitle shareholders to breakpoint discounts, will be automatically calculated based on the aggregated holding of fund family assets held by accounts within the purchaser’s household at Janney. Eligible fund family assets not held at Janney may be included in the ROA calculation only if the shareholder notifies his or her financial advisor about such assets. |
|
| Letters of intent which allow for breakpoint discounts based on anticipated purchases within a fund family, over a13-month time period. Eligible fund family assets not held at Janney Montgomery Scott may be included in the calculation of letters of intent only if the shareholder notifies his or her financial advisor about such assets. |
| * | Also referred to as an “initial sales charge.” |
44 | Wells Fargo Diversified Income Builder Fund
Appendix II (unaudited)
Effective on or after May 1, 2020, clients of Edward Jones (also referred to as “shareholders”) purchasing Fund shares on the Edward Jones commission andfee-based platforms are eligible only for the following sales charge discounts (also referred to as “breakpoints”) and waivers, which can differ from breakpoints and waivers described elsewhere in this Prospectus or SAI or through another broker-dealer. In all instances, it is the shareholder’s responsibility to inform Edward Jones at the time of purchase of any relationship, holdings of Wells Fargo Funds or other facts qualifying the purchaser for breakpoints or waivers. Edward Jones can ask for documentation of such circumstance.
|
| Breakpoints available at Edward Jones |
|
| Rights of Accumulation (ROA) |
|
The applicable sales charge on a purchase of Class A shares is determined by taking into account all share classes (except any money market funds and retirement plan share classes) of Wells Fargo Funds held by the shareholder or in an account grouped by Edward Jones with other accounts for the purpose of providing certain pricing considerations (“pricing groups”). This includes all share classes held on the Edward Jones platform and/or held on another platform. The inclusion of eligible fund family assets in the rights of accumulation calculation is dependent on the shareholder notifying his or her financial advisor of such assets at the time of calculation. |
|
ROA is determined by calculating the higher of cost or market value (current shares x NAV). |
|
| Letter of Intent (LOI) |
|
Through a LOI, shareholders can receive the sales charge and breakpoint discounts for purchases shareholders intend to makeover a13-month period from the date Edward Jones receives the LOI. The LOI is determined by calculating the higher of cost or market value of qualifying holdings at LOI initiation in combination with the value that the shareholder intends to buy over a13-month period to calculate thefront-end sales charge and any breakpoint discounts. Each purchase the shareholder makes during that13-month period will receive the sales charge and breakpoint discount that applies to the total amount. The inclusion of eligible fund family assets in the LOI calculation is dependent on the shareholder notifying his or her financial advisor of such assets at the time of calculation. Purchases made before the LOI is received by Edward Jones are not covered under the LOI and will not reduce the sales charge previously paid. Sales charges will be adjusted if LOI is not met. |
| Sales charges are waived for the following shareholders and in the following situations at Edward Jones: |
● Associates of Edward Jones and its affiliates and their family members who are in the same pricing group (as determined by Edward Jones under its policies and procedures) as the associate. This waiver will continue for the remainder of the associate’s life if the associate retires from Edward Jones in good-standing. |
● Shares purchased in an Edward Jonesfee-based program. |
● Shares purchased through reinvestment of capital gains distributions and dividend reinvestment. |
● Shares purchased from the proceeds of redeemed shares of the same fund family so long as the following conditions are met: 1) the proceeds are from the sale of shares within 60 days of the purchase, and 2) the sale and purchase are made in the same share class and the same account or the purchase is made in an individual retirement account with proceeds from liquidations in anon-retirement account. |
● Shares exchanged into Class A shares from another share class so long as the exchange is into the same fund and was initiated at the discretion of Edward Jones. Edward Jones is responsible for any remaining CDSC due to the fund company, if applicable. Any future purchases are subject to the applicable sales charge as disclosed in the prospectus. |
● Exchanges from Class C shares to Class A shares of the same fund, generally, in the 84th month following the anniversary of the purchase date or earlier at the discretion of Edward Jones. |
If the shareholder purchases shares that are subject to a CDSC and those shares are redeemed before the CDSC is expired, the shareholder is
responsible to pay the CDSC except in the following conditions available at Edward Jones: |
● The death or disability of the shareholder. |
● Systematic withdrawals with up to 10% per year of the account value. |
● Return of excess contributions from an Individual Retirement Account (IRA). |
● Shares sold as part of a required minimum distribution for IRA and retirement accounts if the redemption is taken in or after the year the shareholder reaches qualified age based on applicable IRS regulation. |
● Shares sold to pay Edward Jones fees or costs in such cases where the transaction is initiated by Edward Jones. |
● Shares exchanged in an Edward Jonesfee-based program. |
● Shares acquired through NAV reinstatement. |
Wells Fargo Diversified Income Builder Fund | 45
Appendix II (unaudited)
|
| Other Important Information for accounts at Edward Jones: |
Minimum Purchase Amounts ● $250 initial purchase minimum ● $50 subsequent purchase minimum |
Minimum Balances Edward Jones has the right to redeem at its discretion fund holdings with a balance of $250 or less. The following are examples of accounts that are not included in this policy: ● Afee-based account held on an Edward Jones platform ● A 529 account held on an Edward Jones platform ● An account with an active systematic investment plan or letter of intent (LOI) |
Changing Share Classes At any time it deems necessary, Edward Jones has the authority to exchange at NAV a shareholder’s holdings in a fund to Class A shares. |
46 | Wells Fargo Diversified Income Builder Fund
This page is intentionally left blank.
This page is intentionally left blank.

For more information
More information about Wells Fargo Funds is available free upon request. To obtain literature, please write, visit the Fund’s website, or call:
Wells Fargo Funds
P.O. Box 219967
Kansas City, MO 64121-9967
Website:wfam.com
Individual investors:1-800-222-8222
Retail investment professionals:1-888-877-9275
Institutional investment professionals:1-866-765-0778

This report and the financial statements contained herein are submitted for the general information of the shareholders of the Fund. If this report is used for promotional purposes, distribution of the report must be accompanied or preceded by a current prospectus. Before investing, please consider the investment objectives, risks, charges, and expenses of the investment. For a current prospectus and, if available, a summary prospectus, containing this information, call1-800-222-8222 or visit the Fund’s website atwfam.com. Read the prospectus carefully before you invest or send money.
Wells Fargo Asset Management (WFAM) is the trade name for certain investment advisory/management firms owned by Wells Fargo & Company. These firms include but are not limited to Wells Capital Management Incorporated and Wells Fargo Funds Management, LLC. Certain products managed by WFAM entities are distributed by Wells Fargo Funds Distributor, LLC (a broker-dealer and Member FINRA).
This material is for general informational and educational purposes only and is NOT intended to provide investment advice or a recommendation of any kind—including a recommendation for any specific investment, strategy, or plan.
INVESTMENT PRODUCTS: NOT FDIC INSURED ◾ NO BANK GUARANTEE ◾ MAY LOSE VALUE
© 2020 Wells Fargo & Company. All rights reserved.
PAR-0420-06221 05-20
SA226/SAR226 03-20
Semi-Annual Report
March 31, 2020
Wells Fargo
Index Asset Allocation Fund
Beginning on January 1, 2021, as permitted by new regulations adopted by the Securities and Exchange Commission, paper copies of the Wells Fargo Funds’ annual and semi-annual shareholder reports issued after this date will no longer be sent by mail, unless you specifically request paper copies of the reports. Instead, the reports will be made available on the Funds’ website, and you will be notified by mail each time a report is posted and provided with a website address to access the report.
If you already elected to receive shareholder reports electronically, you will not be affected by this change and you need not take any action. You may elect to receive shareholder reports and other communications from the Fund electronically at any time by contacting your financial intermediary (such as a broker-dealer or bank) or, if you are a direct investor, by calling1-800-222-8222 or by enrolling at wellsfargo.com/advantagedelivery.
You may elect to receive all future reports in paper free of charge. If you invest through a financial intermediary, you can contact your financial intermediary to request that you continue to receive paper copies of your shareholder reports; if you invest directly with the Fund, you can call 1-800-222-8222. Your election to receive reports in paper will apply to all Wells Fargo Funds held in your account with your financial intermediary or, if you are a direct investor, to all Wells Fargo Funds that you hold.
|
|
|
Reduce clutter. Save trees. |
Sign up for electronic delivery of prospectuses and
shareholder reports atwellsfargo.com/
advantagedelivery |
The views expressed and any forward-looking statements are as of March 31, 2020, unless otherwise noted, and are those of the Fund managers and/or Wells Fargo Asset Management. Discussions of individual securities, or the markets generally, or any Wells Fargo Fund are not intended as individual recommendations. Future events or results may vary significantly from those expressed in any forward-looking statements. The views expressed are subject to change at any time in response to changing circumstances in the market. Wells Fargo Asset Management and the Fund disclaim any obligation to publicly update or revise any views expressed or forward-looking statements.
INVESTMENT PRODUCTS: NOT FDIC INSURED ◾ NO BANK GUARANTEE ◾ MAY LOSE VALUE
Wells Fargo Index Asset Allocation Fund | 1
Letter to shareholders (unaudited)

Andrew Owen
President
Wells Fargo Funds
“The period began with mixed data, leading to central bank support.”
Dear Shareholder:
We are pleased to offer you this semi-annual report for the Wells Fargo Index Asset Allocation Fund for the six-month period that ended March 31, 2020. Global stock markets saw earlier gains erased in February and March as governments took unprecedented measures to stop the spread of the coronavirus at the expense of short-term economic output. Fixed-income markets were less battered, with U.S. government bonds achieving modest gains as central banks attempted to bolster capital markets and confidence.
For the period, U.S. stocks, based on the S&P 500 Index,1 returned -12.31% and international stocks, as measured by the MSCI ACWI ex USA Index (Net),2 fell 16.52%. The MSCI EM Index (Net)3 lost 14.55%. For bond investors, the Bloomberg Barclays U.S. Aggregate Bond Index4 added 3.33%, the Bloomberg Barclays Global Aggregate ex-USD Index5 returned -2.03%, the Bloomberg Barclays Municipal Bond Index6 gained a modest 0.10%, and the ICE BofA U.S. High Yield Index7 returned -10.86%.
The period began with mixed data, leading to central bank support.
As the fourth quarter of 2019 started, U.S.-China trade tensions were relaxing while optimism grew for a U.K. Brexit deal. The initial estimate of U.S. third-quarter gross domestic product growth was a resilient 1.9% annualized rate, while the U.S. unemployment rate fell to a 50-year low of 3.5% in September. Despite resilience among U.S. consumers, however, business confidence declined while manufacturing activity contracted. Concerned with a potential economic slowdown, the U.S. Federal Reserve (Fed) lowered interest rates a quarter point in late October—its third rate cut in four months. This helped push the S&P 500 Index to an all-time high while emerging market equities rallied and global bonds declined overall, reflecting a broad pickup in risk appetite.
Equity markets rallied in November despite ongoing geopolitical risks. Hopes for aU.S.-China trade deal buoyed investor confidence. U.S. business sentiment edged up, and manufacturing and services activity rose. With that positive backdrop, developed market equities outpaced those in emerging markets, and U.S. stocks outperformed non-U.S. stocks overall. While consumer confidence and purchasing manager activity rose in the eurozone, China reported weakening manufacturing and consumer data. Bond yields rose marginally, leading to slightly negative returns for global government and investment-grade corporate bonds.
Financial markets ended 2019 with a boost from the U.S. and China accord on a Phase One trade deal. That, along with the landslide win by the pro-Brexit U.K. Conservative
| 1 | The S&P 500 Index consists of 500 stocks chosen for market size, liquidity, and industry group representation. It is a market-value-weighted index with each stock’s weight in the index proportionate to its market value. You cannot invest directly in an index. |
| 2 | The Morgan Stanley Capital International (MSCI) All Country World Index (ACWI) ex USA Index (Net) is a free-float-adjusted market-capitalization-weighted index that is designed to measure the equity market performance of developed markets, excluding the United States. Source: MSCI. MSCI makes no express or implied warranties or representations and shall have no liability whatsoever with respect to any MSCI data contained herein. The MSCI data may not be further redistributed or used as a basis for other indices or any securities or financial products. This report is not approved, reviewed, or produced by MSCI. You cannot invest directly in an index. |
| 3 | The MSCI Emerging Markets (EM) Index (Net) is a free-float-adjusted market-capitalization-weighted index that is designed to measure equity market performance of emerging markets. You cannot invest directly in an index. |
| 4 | The Bloomberg Barclays U.S. Aggregate Bond Index is a broad-based benchmark that measures the investment-grade, U.S. dollar-denominated, fixed-rate taxable bond market, including Treasuries, government-related and corporate securities, mortgage-backed securities (agency fixed-rate and hybrid adjustable-rate mortgage pass-throughs), asset-backed securities, and commercial mortgage-backed securities. You cannot invest directly in an index. |
| 5 | The Bloomberg Barclays Global Aggregate ex-USD Index is an unmanaged index that provides a broad-based measure of the global investment-grade fixed-income markets excluding the U.S. dollar-denominated debt market. You cannot invest directly in an index. |
| 6 | The Bloomberg Barclays Municipal Bond Index is an unmanaged index composed of long-term tax-exempt bonds with a minimum credit rating of Baa. You cannot invest directly in an index. |
| 7 | The ICE BofA U.S. High Yield Index is a market-capitalization-weighted index of domestic and Yankee high-yield bonds. The index tracks the performance of high-yield securities traded in the U.S. bond market. You cannot invest directly in an index. Copyright 2020. ICE Data Indices, LLC. All rights reserved. |
2 | Wells Fargo Index Asset Allocation Fund
Letter to shareholders (unaudited)
Party in a national election and ongoing central bank support, gave investors greater confidence. U.S. economic indicators were positive overall, with the exception of manufacturing activity and business confidence. Consumer confidence was resilient, fed by a robust labor market, tame inflation, and lower interest rates, which boosted housing affordability and stimulated homebuyer activity. The impeachment of U.S. President Donald Trump had little impact on markets. Meanwhile, slowing Chinese economic activity, partly attributable to the trade war, led to further government stimulus at year-end through lower reserve ratios, allowing banks to lend more money.
The year-end rally continued in early January 2020. However, capital market volatility spiked in late January on concerns over the potential impact of the coronavirus on the global economy and stock markets. With sentiment somewhat souring, perceived safe havens did well in January. The U.S. dollar and Japanese yen both rose, and government bonds outperformed equities. While the S&P 500 Index held its ground, emerging market equities tumbled, including those in Asia.
In February, the coronavirus became the major market focus. Fears of the virus’s impact on global growth led to expectations of increased global central bank monetary policy support. That led the 10-year U.S. Treasury yield to fall to an all-time low of 1.1% by the end of the month. Although equity markets initially shrugged off concerns about the outbreak, focusing instead on strong fourth-quarter earnings and improving business confidence in January, market sentiment turned sharply lower toward month-end. Oil prices tumbled as Russia and the Organization of the Petroleum Exporting Countries compounded a major decline in oil demand with a brutal price war, causing the price of West Texas Intermediate crude oil to fall 13% in February alone.
The global spread of the coronavirus led many countries to clamp down on social and business-related activity in order to contain the virus from causing even greater devastation and overwhelming the health care system. This abrupt stoppage of economic activity led to the sharp deceleration of global output, sending economies into a deep contraction. Central bank responses were swift, as they slashed interest rates and expanded quantitative easing programs to restore liquidity and confidence to the markets. In the U.S., the Fed launched several lending programs, funding investment-grade bonds, money market mutual funds, and commercial paper while purchasing Treasuries, mortgage-backed securities, and overnight repos. Meanwhile, stock markets tumbled quickly into a bear market, ending the longest bull stock market in U.S. history.
Don’t let short-term uncertainty derail long-term investment goals.
Periods of investment uncertainty can present challenges, but experience has taught us that maintaining long-term investment goals can be an effective way to plan for the future. To help you create a sound strategy based on your personal goals and risk tolerance, Wells Fargo Funds offers more than 100 mutual funds spanning a wide range of asset classes and investment styles. Although diversification cannot guarantee an investment profit or prevent losses, we believe it can be an effective way to manage investment risk and potentially smooth out overall portfolio performance. We encourage investors to know their investments and to understand that appropriate levels of risk-taking may unlock opportunities.
Thank you for choosing to invest with Wells Fargo Funds. We appreciate your confidence in us and remain committed to helping you meet your financial needs.
Sincerely,

Andrew Owen
President
Wells Fargo Funds
“Capital market volatility spiked in late January on concerns over the potential impact of the coronavirus on the global economy and stock markets.”
|
|
|
For further information about your Fund, contact your investment professional, visit our website at wfam.com, or call us directly at1-800-222-8222. |
Wells Fargo Index Asset Allocation Fund | 3
Performance highlights (unaudited)
Investment objective
The Fund seeks long-term total return, consisting of capital appreciation and current income.
Manager
Wells Fargo Funds Management, LLC
Subadviser
Wells Capital Management Incorporated
Portfolio managers
Kandarp R. Acharya, CFA®‡, FRM
Petros N. Bocray, CFA®‡, FRM
Christian L. Chan, CFA®‡
Average annual total returns (%) as of March 31, 2020
| | | | | | | | | | | | | | | | | | | | | | | | | | | | | | | | | | |
| | | | |
| | | | | Including sales charge | | | Excluding sales charge | | | Expense ratios1 (%) | |
| | | | | | | | | |
| | | Inception date | | 1 year | | | 5 year | | | 10 year | | | 1 year | | | 5 year | | | 10 year | | | Gross | | | Net2 | |
| | | | | | | | | | |
| Class A (SFAAX) | | 11-13-1986 | | | -5.38 | | | | 3.88 | | | | 8.47 | | | | 0.39 | | | | 5.12 | | | | 9.11 | | | | 1.11 | | | | 1.08 | |
| | | | | | | | | | |
| Class C (WFALX) | | 4-1-1998 | | | -1.38 | | | | 4.33 | | | | 8.30 | | | | -0.38 | | | | 4.33 | | | | 8.30 | | | | 1.86 | | | | 1.83 | |
| | | | | | | | | | |
| Administrator Class (WFAIX) | | 11-8-1999 | | | – | | | | – | | | | – | | | | 0.55 | | | | 5.32 | | | | 9.35 | | | | 1.03 | | | | 0.90 | |
| | | | | | | | | | |
| Institutional Class (WFATX)3 | | 10-31-2016 | | | – | | | | – | | | | – | | | | 0.70 | | | | 5.43 | | | | 9.41 | | | | 0.78 | | | | 0.75 | |
| | | | | | | | | | |
| Index Asset Allocation Blended Index4 | | – | | | – | | | | – | | | | – | | | | 1.35 | | | | 5.80 | | | | 9.87 | | | | – | | | | – | |
| | | | | | | | | | |
| Bloomberg Barclays U.S. Treasury Index5 | | – | | | – | | | | – | | | | – | | | | 13.23 | | | | 3.64 | | | | 3.83 | | | | – | | | | – | |
| | | | | | | | | | |
| S&P 500 Index6 | | – | | | – | | | | – | | | | – | | | | -6.98 | | | | 6.73 | | | | 10.53 | | | | – | | | | – | |
Figures quoted represent past performance, which is no guarantee of future results, and do not reflect taxes that a shareholder may pay on an investment in a fund. Investment return and principal value of an investment will fluctuate so that an investor’s shares, when redeemed, may be worth more or less than their original cost. Performance shown without sales charges would be lower if sales charges were reflected. Current performance may be lower or higher than the performance data quoted, which assumes the reinvestment of dividends and capital gains. Currentmonth-end performance is available on the Fund’s website,wfam.com.
Index returns do not include transaction costs associated with buying and selling securities, any mutual fund fees or expenses, or any taxes. It is not possible to invest directly in an index.
For Class A shares, the maximumfront-end sales charge is 5.75%. For Class C shares, the maximum contingent deferred sales charge is 1.00%. Performance including a contingent deferred sales charge assumes the sales charge for the corresponding time period. Administrator Class and Institutional Class shares are sold without afront-end sales charge or contingent deferred sales charge.
Balanced funds may invest in stocks and bonds. Stock values fluctuate in response to the activities of individual companies and general market and economic conditions. Bond values fluctuate in response to the financial condition of individual issuers, general market and economic conditions, and changes in interest rates. Changes in market conditions and government policies may lead to periods of heightened volatility in the bond market and reduced liquidity for certain bonds held by the Fund. In general, when interest rates rise, bond values fall and investors may lose principal value. Interest-rate changes and their impact on the Fund and its share price can be sudden and unpredictable. The use of derivatives may reduce returns and/or increase volatility. Consult the Fund’s prospectus for additional information on these and other risks.
Please see footnotes on page 5.
4 | Wells Fargo Index Asset Allocation Fund
Performance highlights (unaudited)
| | | | |
| |
| Ten largest holdings (%) as of March 31, 20207 | | | |
| | |
Microsoft Corporation | | | 3.11 | |
| | |
Apple Incorporated | | | 2.75 | |
| | |
Amazon.com Incorporated | | | 2.10 | |
| | |
Facebook Incorporated Class A | | | 1.04 | |
| | |
Berkshire Hathaway Incorporated Class B | | | 0.93 | |
| | |
Alphabet Incorporated Class A | | | 0.90 | |
| | |
Alphabet Incorporated Class C | | | 0.90 | |
| | |
Johnson & Johnson | | | 0.89 | |
| | |
JPMorgan Chase & Company | | | 0.73 | |
| | |
Visa Incorporated Class A | | | 0.71 | |
| | | | | | | | |
|
| Allocations as of March 31, 2020 | |
| | |
| | | Neutral
Allocation | | | Effective
Allocation8 | |
| | | |
Bonds | | | 40 | % | | | 40 | % |
| | | |
Stocks | | | 60 | % | | | 65 | % |
| | | |
Effective Cash | | | 0 | % | | | (5) | % |
| ‡ | CFA® and Chartered Financial Analyst® are trademarks owned by CFA Institute. |
| 1 | Reflects the expense ratios as stated in the most recent prospectuses. The expense ratios shown are subject to change and may differ from the annualized expense ratios shown in the financial highlights of this report. |
| 2 | The manager has contractually committed through January 31, 2021, to waive fees and/or reimburse expenses to the extent necessary to cap total annual fund operating expenses after fee waivers at 1.08% for Class A, 1.83% for Class C, 0.90% for Administrator Class, and 0.75% for Institutional Class. Brokerage commissions, stamp duty fees, interest, taxes, acquired fund fees and expenses (if any), and extraordinary expenses are excluded from the expense cap. Prior to or after the commitment expiration date, the cap may be increased or the commitment to maintain the cap may be terminated only with the approval of the Board of Trustees. Without this cap, the Fund’s returns would have been lower. The expense ratio paid by an investor is the net expense ratio (the total annual fund operating expenses after fee waivers) as stated in the prospectuses. |
| 3 | Historical performance shown for the Institutional Class shares prior to their inception reflects the performance of the Administrator Class shares, and is not adjusted to reflect the expenses of the Institutional Class shares. If these expenses had been included, returns for the Institutional Class shares would be higher. |
| 4 | Source: Wells Fargo Funds Management, LLC. Index Asset Allocation Blended Index is composed 60% of the S&P 500 Index and 40% of the Bloomberg Barclays U.S. Treasury Index. Prior to April 1, 2015, the Index Asset Allocation Blended Index was composed 60% of the S&P 500 Index and 40% of the Bloomberg Barclays U.S. Treasury 20+ Year Index. You cannot invest directly in an index. |
| 5 | The Bloomberg Barclays U.S. Treasury Index is an unmanaged index of prices of U.S. Treasury bonds with maturities of 1 to 30 years. You cannot invest directly in an index. |
| 6 | The S&P 500 Index consists of 500 stocks chosen for market size, liquidity, and industry group representation. It is a market-value weighted index with each stock’s weight in the index proportionate to its market value. You cannot invest directly in an index. |
| 7 | The ten largest holdings, excluding cash and cash equivalents, are calculated based on the value of the investments divided by total net assets of the Fund. Holdings are subject to change and may have changed since the date specified. |
| 8 | The effective allocation includes the effect of any tactical futures overlay that may be in place. Effective cash represents the net offset to such futures positions. These amounts are subject to change and may have changed since the date specified. |
Wells Fargo Index Asset Allocation Fund | 5
Fund expenses (unaudited)
As a shareholder of the Fund, you incur two types of costs: (1) transaction costs, including sales charges (loads) on purchase payments and contingent deferred sales charges (if any) on redemptions and (2) ongoing costs, including management fees, distribution(12b-1) and/or shareholder servicing fees, and other Fund expenses. This example is intended to help you understand your ongoing costs (in dollars) of investing in the Fund and to compare these costs with the ongoing costs of investing in other mutual funds.
The example is based on an investment of $1,000 invested at the beginning of thesix-month period and held for the entire period from October 1, 2019 to March 31, 2020.
Actual expenses
The “Actual” line of the table below provides information about actual account values and actual expenses. You may use the information in this line, together with the amount you invested, to estimate the expenses that you paid over the period. Simply divide your account value by $1,000 (for example, an $8,600 account value divided by $1,000 = 8.6), then multiply the result by the number in the “Actual” line under the heading entitled “Expenses paid during period” for your applicable class of shares to estimate the expenses you paid on your account during this period.
Hypothetical example for comparison purposes
The “Hypothetical” line of the table below provides information about hypothetical account values and hypothetical expenses based on the Fund’s actual expense ratio and an assumed rate of return of 5% per year before expenses, which is not the Fund’s actual return. The hypothetical account values and expenses may not be used to estimate the actual ending account balance or expenses you paid for the period. You may use this information to compare the ongoing costs of investing in the Fund and other funds. To do so, compare this 5% hypothetical example with the 5% hypothetical examples that appear in the shareholder reports of the other funds.
Please note that the expenses shown in the table are meant to highlight your ongoing costs only and do not reflect any transactional costs, such as sales charges (loads) and contingent deferred sales charges. Therefore, the “Hypothetical” line of the table is useful in comparing ongoing costs only and will not help you determine the relative total costs of owning different funds. In addition, if these transactional costs were included, your costs would have been higher.
| | | | | | | | | | | | | | | | |
| | | Beginning
account value
10-1-2019 | | | Ending
account value
3-31-2020 | | | Expenses
paid during
the period¹ | | | Annualized net
expense ratio | |
| | | | | |
Class A | | | | | | | | | | | | | | | | |
| | | | |
Actual | | $ | 1,000.00 | | | $ | 955.23 | | | $ | 5.23 | | | | 1.07 | % |
| | | | |
Hypothetical (5% return before expenses) | | $ | 1,000.00 | | | $ | 1,019.65 | | | $ | 5.40 | | | | 1.07 | % |
| | | | | |
Class C | | | | | | | | | | | | | | | | |
| | | | |
Actual | | $ | 1,000.00 | | | $ | 951.53 | | | $ | 8.93 | | | | 1.83 | % |
| | | | |
Hypothetical (5% return before expenses) | | $ | 1,000.00 | | | $ | 1,015.85 | | | $ | 9.22 | | | | 1.83 | % |
| | | | | |
Administrator Class | | | | | | | | | | | | | | | | |
| | | | |
Actual | | $ | 1,000.00 | | | $ | 955.85 | | | $ | 4.40 | | | | 0.90 | % |
| | | | |
Hypothetical (5% return before expenses) | | $ | 1,000.00 | | | $ | 1,020.50 | | | $ | 4.55 | | | | 0.90 | % |
| | | | | |
Institutional Class | | | | | | | | | | | | | | | | |
| | | | |
Actual | | $ | 1,000.00 | | | $ | 956.79 | | | $ | 3.67 | | | | 0.75 | % |
| | | | |
Hypothetical (5% return before expenses) | | $ | 1,000.00 | | | $ | 1,021.25 | | | $ | 3.79 | | | | 0.75 | % |
| 1 | Expenses paid is equal to the annualized net expense ratio of each class multiplied by the average account value over the period, multiplied by the number of days in the most recent fiscal half-year divided by the number of days in the fiscal year (to reflect theone-half-year period). |
6 | Wells Fargo Index Asset Allocation Fund
Portfolio of investments—March 31, 2020 (unaudited)
| | | | | | | | | | | | | | | | |
| | | Interest
rate | | | Maturity
date | | | Principal | | | Value | |
| Agency Securities: 0.00% | | | | | | | | | | | | |
FNMA Series2002-T1 Class A4 | | | 9.50 | % | | | 11-25-2031 | | | $ | 32,391 | | | $ | 39,821 | |
| | | | | | | | | | | | | | | | |
| | | | |
Total Agency Securities (Cost $32,391) | | | | | | | | | | | | | | | 39,821 | |
| | | | | | | | | | | | | | | | |
| | | | |
| | | | | | | | | | | | | | | | |
| | | | | | | | | Shares | | | | |
| Common Stocks: 55.42% | | | | | | | | | | | | | | | | |
| | | | |
Communication Services: 5.95% | | | | | | | | | | | | | | | | |
| | | | |
| Diversified Telecommunication Services: 1.15% | | | | | | | | | | | | |
AT&T Incorporated | | | | | | | | | | | 231,852 | | | | 6,758,486 | |
CenturyLink Incorporated | | | | | | | | | | | 31,142 | | | | 294,603 | |
Verizon Communications Incorporated | | | | | | | | | | | 131,265 | | | | 7,052,868 | |
| | | | |
| | | | | | | | | | | | | | | 14,105,957 | |
| | | | | | | | | | | | | | | | |
| | | | |
| Entertainment: 1.12% | | | | | | | | | | | | |
Activision Blizzard Incorporated | | | | | | | | | | | 24,383 | | | | 1,450,301 | |
Electronic Arts Incorporated † | | | | | | | | | | | 9,266 | | | | 928,175 | |
Live Nation Entertainment Incorporated † | | | | | | | | | | | 4,472 | | | | 203,297 | |
Netflix Incorporated † | | | | | | | | | | | 13,909 | | | | 5,222,830 | |
Take-Two Interactive Software Incorporated † | | | | | | | | | | | 3,591 | | | | 425,929 | |
The Walt Disney Company | | | | | | | | | | | 57,205 | | | | 5,526,003 | |
| | | | |
| | | | | | | | | | | | | | | 13,756,535 | |
| | | | | | | | | | | | | | | | |
| | | | |
| Interactive Media & Services: 2.89% | | | | | | | | | | | | |
Alphabet Incorporated Class A † | | | | | | | | | | | 9,510 | | | | 11,050,145 | |
Alphabet Incorporated Class C † | | | | | | | | | | | 9,486 | | | | 11,030,416 | |
Facebook Incorporated Class A † | | | | | | | | | | | 76,378 | | | | 12,739,850 | |
Twitter Incorporated † | | | | | | | | | | | 24,640 | | | | 605,158 | |
| | | | |
| | | | | | | | | | | | | | | 35,425,569 | |
| | | | | | | | | | | | | | | | |
| | | | |
| Media: 0.72% | | | | | | | | | | | | |
Charter Communications Incorporated Class A † | | | | | | | | | | | 4,976 | | | | 2,171,079 | |
Comcast Corporation Class A | | | | | | | | | | | 144,088 | | | | 4,953,745 | |
Discovery Communications Incorporated Class A † | | | | | | | | | | | 5,019 | | | | 97,569 | |
Discovery Communications Incorporated Class C † | | | | | | | | | | | 10,646 | | | | 186,731 | |
DISH Network Corporation Class A † | | | | | | | | | | | 8,125 | | | | 162,419 | |
Fox Corporation Class A | | | | | | | | | | | 11,250 | | | | 265,838 | |
Fox Corporation Class B | | | | | | | | | | | 5,152 | | | | 117,878 | |
Interpublic Group of Companies Incorporated | | | | | | | | | | | 12,305 | | | | 199,218 | |
News Corporation Class A | | | | | | | | | | | 12,332 | | | | 110,680 | |
News Corporation Class B | | | | | | | | | | | 3,865 | | | | 34,746 | |
Omnicom Group Incorporated | | | | | | | | | | | 6,910 | | | | 379,359 | |
ViacomCBS Incorporated Class B | | | | | | | | | | | 17,150 | | | | 240,272 | |
| | | | |
| | | | | | | | | | | | | | | 8,919,534 | |
| | | | | | | | | | | | | | | | |
| | | | |
| Wireless Telecommunication Services: 0.07% | | | | | | | | | | | | |
T-Mobile US Incorporated † | | | | | | | | | | | 10,046 | | | | 842,859 | |
| | | | | | | | | | | | | | | | |
| | | | |
Consumer Discretionary: 5.43% | | | | | | | | | | | | | | | | |
| | | | |
| Auto Components: 0.05% | | | | | | | | | | | | |
Aptiv plc | | | | | | | | | | | 8,101 | | | | 398,893 | |
BorgWarner Incorporated | | | | | | | | | | | 6,554 | | | | 159,721 | |
| | | | |
| | | | | | | | | | | | | | | 558,614 | |
| | | | | | | | | | | | | | | | |
The accompanying notes are an integral part of these financial statements.
Wells Fargo Index Asset Allocation Fund | 7
Portfolio of investments—March 31, 2020 (unaudited)
| | | | | | | | | | | | | | | | |
| | | | | | | | | Shares | | | Value | |
| Automobiles: 0.12% | |
Ford Motor Company | | | | | | | | | | | 123,591 | | | $ | 596,945 | |
General Motors Company | | | | | | | | | | | 39,905 | | | | 829,226 | |
Harley-Davidson Incorporated | | | | | | | | | | | 4,897 | | | | 92,700 | |
| | | | |
| | | | | | | | | | | | | | | 1,518,871 | |
| | | | | | | | | | | | | | | | |
|
| Distributors: 0.04% | |
Genuine Parts Company | | | | | | | | | | | 4,611 | | | | 310,459 | |
LKQ Corporation † | | | | | | | | | | | 9,726 | | | | 199,480 | |
| | | | |
| | | | | | | | | | | | | | | 509,939 | |
| | | | | | | | | | | | | | | | |
|
| Diversified Consumer Services: 0.01% | |
H&R Block Incorporated | | | | | | | | | | | 6,197 | | | | 87,254 | |
| | | | | | | | | | | | | | | | |
|
| Hotels, Restaurants & Leisure: 0.84% | |
Carnival Corporation | | | | | | | | | | | 12,713 | | | | 167,430 | |
Chipotle Mexican Grill Incorporated † | | | | | | | | | | | 811 | | | | 530,718 | |
Darden Restaurants Incorporated | | | | | | | | | | | 3,891 | | | | 211,904 | |
Hilton Worldwide Holdings Incorporated | | | | | | | | | | | 8,955 | | | | 611,089 | |
Las Vegas Sands Corporation | | | | | | | | | | | 10,725 | | | | 455,491 | |
Marriott International Incorporated Class A | | | | | | | | | | | 8,612 | | | | 644,264 | |
McDonald’s Corporation | | | | | | | | | | | 23,902 | | | | 3,952,196 | |
MGM Resorts International | | | | | | | | | | | 16,344 | | | | 192,859 | |
Norwegian Cruise Line Holdings Limited † | | | | | | | | | | | 6,751 | | | | 73,991 | |
Royal Caribbean Cruises Limited | | | | | | | | | | | 5,456 | | | | 175,520 | |
Starbucks Corporation | | | | | | | | | | | 37,482 | | | | 2,464,067 | |
Wynn Resorts Limited | | | | | | | | | | | 3,066 | | | | 184,543 | |
Yum! Brands Incorporated | | | | | | | | | | | 9,600 | | | | 657,888 | |
| | | | |
| | | | | | | | | | | | | | | 10,321,960 | |
| | | | | | | | | | | | | | | | |
|
| Household Durables: 0.17% | |
D.R. Horton Incorporated | | | | | | | | | | | 10,642 | | | | 361,828 | |
Garmin Limited | | | | | | | | | | | 4,585 | | | | 343,692 | |
Leggett & Platt Incorporated | | | | | | | | | | | 4,177 | | | | 111,442 | |
Lennar Corporation Class A | | | | | | | | | | | 8,882 | | | | 339,292 | |
Mohawk Industries Incorporated † | | | | | | | | | | | 1,887 | | | | 143,865 | |
Newell Rubbermaid Incorporated | | | | | | | | | | | 12,093 | | | | 160,595 | |
NVR Incorporated † | | | | | | | | | | | 110 | | | | 282,602 | |
Pulte Group Incorporated | | | | | | | | | | | 8,084 | | | | 180,435 | |
Whirlpool Corporation | | | | | | | | | | | 2,005 | | | | 172,029 | |
| | | | |
| | | | | | | | | | | | | | | 2,095,780 | |
| | | | | | | | | | | | | | | | |
|
| Internet & Direct Marketing Retail: 2.33% | |
Amazon.com Incorporated † | | | | | | | | | | | 13,217 | | | | 25,769,449 | |
Booking Holdings Incorporated † | | | | | | | | | | | 1,329 | | | | 1,787,930 | |
eBay Incorporated | | | | | | | | | | | 24,271 | | | | 729,586 | |
Expedia Group Incorporated | | | | | | | | | | | 4,435 | | | | 249,557 | |
| | | | |
| | | | | | | | | | | | | | | 28,536,522 | |
| | | | | | | | | | | | | | | | |
|
| Leisure Products: 0.02% | |
Hasbro Incorporated | | | | | | | | | | | 4,038 | | | | 288,919 | |
| | | | | | | | | | | | | | | | |
|
| Multiline Retail: 0.28% | |
Dollar General Corporation | | | | | | | | | | | 8,080 | | | | 1,220,161 | |
Dollar Tree Incorporated † | | | | | | | | | | | 7,511 | | | | 551,833 | |
Kohl’s Corporation | | | | | | | | | | | 4,969 | | | | 72,498 | |
The accompanying notes are an integral part of these financial statements.
8 | Wells Fargo Index Asset Allocation Fund
Portfolio of investments—March 31, 2020 (unaudited)
| | | | | | | | | | | | | | | | |
| | | | | | | | | Shares | | | Value | |
|
| Multiline Retail (continued) | |
Macy’s Incorporated | | | | | | | | | | | 9,807 | | | $ | 48,152 | |
Nordstrom Incorporated | | | | | | | | | | | 3,401 | | | | 52,171 | |
Target Corporation | | | | | | | | | | | 16,082 | | | | 1,495,144 | |
| | | | |
| | | | | | | | | | | | | | | 3,439,959 | |
| | | | | | | | | | | | | | | | |
|
| Specialty Retail: 1.21% | |
Advance Auto Parts Incorporated | | | | | | | | | | | 2,197 | | | | 205,024 | |
AutoZone Incorporated † | | | | | | | | | | | 756 | | | | 639,576 | |
Best Buy Company Incorporated | | | | | | | | | | | 7,227 | | | | 411,939 | |
CarMax Incorporated † | | | | | | | | | | | 5,218 | | | | 280,885 | |
L Brands Incorporated | | | | | | | | | | | 7,371 | | | | 85,209 | |
Lowe’s Companies Incorporated | | | | | | | | | | | 24,326 | | | | 2,093,252 | |
O’Reilly Automotive Incorporated † | | | | | | | | | | | 2,401 | | | | 722,821 | |
Ross Stores Incorporated | | | | | | | | | | | 11,480 | | | | 998,416 | |
The Gap Incorporated | | | | | | | | | | | 6,752 | | | | 47,534 | |
The Home Depot Incorporated | | | | | | | | | | | 34,620 | | | | 6,463,900 | |
The TJX Companies Incorporated | | | | | | | | | | | 38,488 | | | | 1,840,111 | |
Tiffany & Company | | | | | | | | | | | 3,426 | | | | 443,667 | |
Tractor Supply Company | | | | | | | | | | | 3,757 | | | | 317,654 | |
Ulta Beauty Incorporated † | | | | | | | | | | | 1,814 | | | | 318,720 | |
| | | | |
| | | | | | | | | | | | | | | 14,868,708 | |
| | | | | | | | | | | | | | | | |
|
| Textiles, Apparel & Luxury Goods: 0.36% | |
Capri Holdings Limited † | | | | | | | | | | | 4,812 | | | | 51,921 | |
HanesBrands Incorporated | | | | | | | | | | | 11,479 | | | | 90,340 | |
Nike Incorporated Class B | | | | | | | | | | | 39,546 | | | | 3,272,036 | |
PVH Corporation | | | | | | | | | | | 2,353 | | | | 88,567 | |
Ralph Lauren Corporation | | | | | | | | | | | 1,578 | | | | 105,458 | |
Tapestry Incorporated | | | | | | | | | | | 8,757 | | | | 113,403 | |
Under Armour Incorporated Class A † | | | | | | | | | | | 5,972 | | | | 55,002 | |
Under Armour Incorporated Class C † | | | | | | | | | | | 6,175 | | | | 49,771 | |
VF Corporation | | | | | | | | | | | 10,393 | | | | 562,053 | |
| | | | |
| | | | | | | | | | | | | | | 4,388,551 | |
| | | | | | | | | | | | | | | | |
|
Consumer Staples: 4.32% | |
|
| Beverages: 1.04% | |
Brown-Forman Corporation Class B | | | | | | | | | | | 5,783 | | | | 321,014 | |
Constellation Brands Incorporated Class A | | | | | | | | | | | 5,316 | | | | 762,102 | |
Molson Coors Brewing Company Class B | | | | | | | | | | | 5,961 | | | | 232,539 | |
Monster Beverage Corporation † | | | | | | | | | | | 12,115 | | | | 681,590 | |
PepsiCo Incorporated | | | | | | | | | | | 44,257 | | | | 5,315,266 | |
The Coca-Cola Company | | | | | | | | | | | 122,387 | | | | 5,415,625 | |
| | | | |
| | | | | | | | | | | | | | | 12,728,136 | |
| | | | | | | | | | | | | | | | |
|
| Food & Staples Retailing: 0.95% | |
Costco Wholesale Corporation | | | | | | | | | | | 14,021 | | | | 3,997,808 | |
Sysco Corporation | | | | | | | | | | | 16,193 | | | | 738,887 | |
The Kroger Company | | | | | | | | | | | 25,454 | | | | 766,674 | |
Walgreens Boots Alliance Incorporated | | | | | | | | | | | 23,795 | | | | 1,088,621 | |
Walmart Incorporated | | | | | | | | | | | 45,024 | | | | 5,115,627 | |
| | | | |
| | | | | | | | | | | | | | | 11,707,617 | |
| | | | | | | | | | | | | | | | |
|
| Food Products: 0.68% | |
Archer Daniels Midland Company | | | | | | | | | | | 17,668 | | | | 621,560 | |
Campbell Soup Company | | | | | | | | | | | 5,361 | | | | 247,464 | |
The accompanying notes are an integral part of these financial statements.
Wells Fargo Index Asset Allocation Fund | 9
Portfolio of investments—March 31, 2020 (unaudited)
| | | | | | | | | | | | | | | | |
| | | | | | | | | Shares | | | Value | |
|
| Food Products (continued) | |
ConAgra Foods Incorporated | | | | | | | | | | | 15,445 | | | $ | 453,156 | |
General Mills Incorporated | | | | | | | | | | | 19,182 | | | | 1,012,234 | |
Hormel Foods Corporation | | | | | | | | | | | 8,824 | | | | 411,551 | |
Kellogg Company | | | | | | | | | | | 7,903 | | | | 474,101 | |
Lamb Weston Holdings Incorporated | | | | | | | | | | | 4,636 | | | | 264,716 | |
McCormick & Company Incorporated | | | | | | | | | | | 3,921 | | | | 553,684 | |
Mondelez International Incorporated Class A | | | | | | | | | | | 45,698 | | | | 2,288,556 | |
The Hershey Company | | | | | | | | | | | 4,706 | | | | 623,545 | |
The J.M. Smucker Company | | | | | | | | | | | 3,620 | | | | 401,820 | |
The Kraft Heinz Company | | | | | | | | | | | 19,767 | | | | 489,036 | |
Tyson Foods Incorporated Class A | | | | | | | | | | | 9,368 | | | | 542,126 | |
| | | | |
| | | | | | | | | | | | | | | 8,383,549 | |
| | | | | | | | | | | | | | | | |
|
| Household Products: 1.07% | |
Church & Dwight Company Incorporated | | | | | | | | | | | 7,789 | | | | 499,898 | |
Colgate-Palmolive Company | | | | | | | | | | | 27,202 | | | | 1,805,125 | |
Kimberly-Clark Corporation | | | | | | | | | | | 10,879 | | | | 1,391,098 | |
The Clorox Company | | | | | | | | | | | 3,983 | | | | 690,055 | |
The Procter & Gamble Company | | | | | | | | | | | 79,151 | | | | 8,706,610 | |
| | | | |
| | | | | | | | | | | | | | | 13,092,786 | |
| | | | | | | | | | | | | | | | |
|
| Personal Products: 0.10% | |
Coty Incorporated Class A | | | | | | | | | | | 9,381 | | | | 48,406 | |
The Estee Lauder Companies Incorporated Class A | | | | | | | | | | | 7,063 | | | | 1,125,418 | |
| | | | |
| | | | | | | | | | | | | | | 1,173,824 | |
| | | | | | | | | | | | | | | | |
|
| Tobacco: 0.48% | |
Altria Group Incorporated | | | | | | | | | | | 59,291 | | | | 2,292,783 | |
Philip Morris International Incorporated | | | | | | | | | | | 49,381 | | | | 3,602,838 | |
| | | | |
| | | | | | | | | | | | | | | 5,895,621 | |
| | | | | | | | | | | | | | | | |
|
Energy: 1.47% | |
|
| Energy Equipment & Services: 0.10% | |
Baker Hughes Incorporated | | | | | | | | | | | 20,626 | | | | 216,573 | |
Halliburton Company | | | | | | | | | | | 27,860 | | | | 190,841 | |
Helmerich & Payne Incorporated | | | | | | | | | | | 3,442 | | | | 53,867 | |
National Oilwell Varco Incorporated | | | | | | | | | | | 12,245 | | | | 120,368 | |
Schlumberger Limited | | | | | | | | | | | 43,938 | | | | 592,724 | |
TechnipFMC plc | | | | | | | | | | | 13,337 | | | | 89,891 | |
| | | | |
| | | | | | | | | | | | | | | 1,264,264 | |
| | | | | | | | | | | | | | | | |
|
| Oil, Gas & Consumable Fuels: 1.37% | |
Apache Corporation | | | | | | | | | | | 11,934 | | | | 49,884 | |
Cabot Oil & Gas Corporation | | | | | | | | | | | 12,946 | | | | 222,542 | |
Chevron Corporation | | | | | | | | | | | 60,013 | | | | 4,348,542 | |
Concho Resources Incorporated | | | | | | | | | | | 6,379 | | | | 273,340 | |
ConocoPhillips | | | | | | | | | | | 34,825 | | | | 1,072,610 | |
Devon Energy Corporation | | | | | | | | | | | 12,283 | | | | 84,876 | |
Diamondback Energy Incorporated | | | | | | | | | | | 5,114 | | | | 133,987 | |
EOG Resources Incorporated | | | | | | | | | | | 18,464 | | | | 663,227 | |
Exxon Mobil Corporation | | | | | | | | | | | 134,290 | | | | 5,098,991 | |
Hess Corporation | | | | | | | | | | | 8,220 | | | | 273,726 | |
HollyFrontier Corporation | | | | | | | | | | | 4,712 | | | | 115,491 | |
Kinder Morgan Incorporated | | | | | | | | | | | 61,822 | | | | 860,562 | |
The accompanying notes are an integral part of these financial statements.
10 | Wells Fargo Index Asset Allocation Fund
Portfolio of investments—March 31, 2020 (unaudited)
| | | | | | | | | | | | | | | | |
| | | | | | | | | Shares | | | Value | |
|
| Oil, Gas & Consumable Fuels (continued) | |
Marathon Oil Corporation | | | | | | | | | | | 25,387 | | | $ | 83,523 | |
Marathon Petroleum Corporation | | | | | | | | | | | 20,608 | | | | 486,761 | |
Noble Energy Incorporated | | | | | | | | | | | 15,180 | | | | 91,687 | |
Occidental Petroleum Corporation | | | | | | | | | | | 28,353 | | | | 328,328 | |
ONEOK Incorporated | | | | | | | | | | | 13,110 | | | | 285,929 | |
Phillips 66 | | | | | | | | | | | 14,103 | | | | 756,626 | |
Pioneer Natural Resources Company | | | | | | | | | | | 5,257 | | | | 368,779 | |
The Williams Companies Incorporated | | | | | | | | | | | 38,469 | | | | 544,336 | |
Valero Energy Corporation | | | | | | | | | | | 13,033 | | | | 591,177 | |
| | | | |
| | | | | | | | | | | | | | | 16,734,924 | |
| | | | | | | | | | | | | | | | |
|
Financials: 6.07% | |
|
| Banks: 2.29% | |
Bank of America Corporation | | | | | | | | | | | 256,946 | | | | 5,454,964 | |
Citigroup Incorporated | | | | | | | | | | | 69,291 | | | | 2,918,537 | |
Citizens Financial Group Incorporated | | | | | | | | | | | 13,797 | | | | 259,522 | |
Comerica Incorporated | | | | | | | | | | | 4,575 | | | | 134,231 | |
Fifth Third Bancorp | | | | | | | | | | | 22,523 | | | | 334,467 | |
First Republic Bank | | | | | | | | | | | 5,348 | | | | 440,033 | |
Huntington Bancshares Incorporated | | | | | | | | | | | 32,778 | | | | 269,107 | |
JPMorgan Chase & Company | | | | | | | | | | | 99,548 | | | | 8,962,306 | |
KeyCorp | | | | | | | | | | | 31,261 | | | | 324,177 | |
M&T Bank Corporation | | | | | | | | | | | 4,188 | | | | 433,165 | |
People’s United Financial Incorporated | | | | | | | | | | | 14,096 | | | | 155,761 | |
PNC Financial Services Group Incorporated | | | | | | | | | | | 13,906 | | | | 1,331,082 | |
Regions Financial Corporation | | | | | | | | | | | 30,615 | | | | 274,617 | |
SVB Financial Group † | | | | | | | | | | | 1,636 | | | | 247,167 | |
Truist Financial Corporation | | | | | | | | | | | 42,563 | | | | 1,312,643 | |
US Bancorp | | | | | | | | | | | 45,110 | | | | 1,554,040 | |
Wells Fargo & Company (l) | | | | | | | | | | | 122,153 | | | | 3,505,791 | |
Zions Bancorporation | | | | | | | | | | | 5,411 | | | | 144,798 | |
| | | | |
| | | | | | | | | | | | | | | 28,056,408 | |
| | | | | | | | | | | | | | | | |
|
| Capital Markets: 1.46% | |
Ameriprise Financial Incorporated | | | | | | | | | | | 4,021 | | | | 412,072 | |
Bank of New York Mellon Corporation | | | | | | | | | | | 26,635 | | | | 897,067 | |
BlackRock Incorporated | | | | | | | | | | | 3,743 | | | | 1,646,808 | |
Cboe Holdings Incorporated | | | | | | | | | | | 3,518 | | | | 313,982 | |
CME Group Incorporated | | | | | | | | | | | 11,373 | | | | 1,966,505 | |
E*TRADE Financial Corporation | | | | | | | | | | | 7,170 | | | | 246,074 | |
Franklin Resources Incorporated | | | | | | | | | | | 8,852 | | | | 147,740 | |
Intercontinental Exchange Incorporated | | | | | | | | | | | 17,673 | | | | 1,427,095 | |
Invesco Limited | | | | | | | | | | | 11,812 | | | | 107,253 | |
MarketAxess Holdings Incorporated | | | | | | | | | | | 1,204 | | | | 400,414 | |
Moody’s Corporation | | | | | | | | | | | 5,152 | | | | 1,089,648 | |
Morgan Stanley | | | | | | | | | | | 39,043 | | | | 1,327,462 | |
MSCI Incorporated | | | | | | | | | | | 2,688 | | | | 776,724 | |
Northern Trust Corporation | | | | | | | | | | | 6,725 | | | | 507,469 | |
Raymond James Financial Incorporated | | | | | | | | | | | 3,918 | | | | 247,618 | |
S&P Global Incorporated | | | | | | | | | | | 7,757 | | | | 1,900,853 | |
State Street Corporation | | | | | | | | | | | 11,540 | | | | 614,736 | |
T. Rowe Price Group Incorporated | | | | | | | | | | | 7,417 | | | | 724,270 | |
The Charles Schwab Corporation | | | | | | | | | | | 36,285 | | | | 1,219,902 | |
The Goldman Sachs Group Incorporated | | | | | | | | | | | 10,114 | | | | 1,563,523 | |
The NASDAQ OMX Group Incorporated | | | | | | | | | | | 3,641 | | | | 345,713 | |
| | | | |
| | | | | | | | | | | | | | | 17,882,928 | |
| | | | | | | | | | | | | | | | |
The accompanying notes are an integral part of these financial statements.
Wells Fargo Index Asset Allocation Fund | 11
Portfolio of investments—March 31, 2020 (unaudited)
| | | | | | | | | | | | | | | | |
| | | | | | | | | Shares | | | Value | |
| Consumer Finance: 0.26% | |
American Express Company | | | | | | | | | | | 21,295 | | | $ | 1,823,065 | |
Capital One Financial Corporation | | | | | | | | | | | 14,781 | | | | 745,258 | |
Discover Financial Services | | | | | | | | | | | 9,948 | | | | 354,845 | |
Synchrony Financial | | | | | | | | | | | 17,913 | | | | 288,220 | |
| | | | |
| | | | | | | | | | | | | | | 3,211,388 | |
| | | | | | | | | | | | | | | | |
|
| Diversified Financial Services: 0.93% | |
Berkshire Hathaway Incorporated Class B † | | | | | | | | | | | 62,082 | | | | 11,350,437 | |
| | | | | | | | | | | | | | | | |
|
| Insurance: 1.13% | |
AFLAC Incorporated | | | | | | | | | | | 23,296 | | | | 797,655 | |
American International Group Incorporated | | | | | | | | | | | 27,611 | | | | 669,567 | |
Aon plc | | | | | | | | | | | 7,431 | | | | 1,226,412 | |
Arthur J. Gallagher & Company | | | | | | | | | | | 5,920 | | | | 482,539 | |
Assurant Incorporated | | | | | | | | | | | 1,925 | | | | 200,373 | |
Chubb Limited | | | | | | | | | | | 14,384 | | | | 1,606,549 | |
Cincinnati Financial Corporation | | | | | | | | | | | 4,822 | | | | 363,820 | |
Everest Reinsurance Group Limited | | | | | | | | | | | 1,294 | | | | 248,991 | |
Globe Life Incorporated | | | | | | | | | | | 3,162 | | | | 227,569 | |
Lincoln National Corporation | | | | | | | | | | | 6,295 | | | | 165,684 | |
Loews Corporation | | | | | | | | | | | 8,118 | | | | 282,750 | |
Marsh & McLennan Companies Incorporated | | | | | | | | | | | 16,017 | | | | 1,384,830 | |
MetLife Incorporated | | | | | | | | | | | 24,809 | | | | 758,411 | |
Principal Financial Group Incorporated | | | | | | | | | | | 8,196 | | | | 256,863 | |
Prudential Financial Incorporated | | | | | | | | | | | 12,758 | | | | 665,202 | |
The Allstate Corporation | | | | | | | | | | | 10,282 | | | | 943,168 | |
The Hartford Financial Services Group Incorporated | | | | | | | | | | | 11,439 | | | | 403,110 | |
The Progressive Corporation | | | | | | | | | | | 18,555 | | | | 1,370,101 | |
The Travelers Companies Incorporated | | | | | | | | | | | 8,192 | | | | 813,875 | |
Unum Group | | | | | | | | | | | 6,546 | | | | 98,255 | |
W.R. Berkley Corporation | | | | | | | | | | | 4,605 | | | | 240,243 | |
Willis Towers Watson plc | | | | | | | | | | | 4,080 | | | | 692,988 | |
| | | | |
| | | | | | | | | | | | | | | 13,898,955 | |
| | | | | | | | | | | | | | | | |
|
Health Care: 8.53% | |
|
| Biotechnology: 1.34% | |
AbbVie Incorporated | | | | | | | | | | | 46,935 | | | | 3,575,978 | |
Alexion Pharmaceuticals Incorporated † | | | | | | | | | | | 7,023 | | | | 630,595 | |
Amgen Incorporated | | | | | | | | | | | 18,858 | | | | 3,823,082 | |
Biogen Incorporated † | | | | | | | | | | | 5,726 | | | | 1,811,592 | |
Gilead Sciences Incorporated | | | | | | | | | | | 40,154 | | | | 3,001,913 | |
Incyte Corporation † | | | | | | | | | | | 5,674 | | | | 415,507 | |
Regeneron Pharmaceuticals Incorporated † | | | | | | | | | | | 2,535 | | | | 1,237,815 | |
Vertex Pharmaceuticals Incorporated † | | | | | | | | | | | 8,161 | | | | 1,941,910 | |
| | | | |
| | | | | | | | | | | | | | | 16,438,392 | |
| | | | | | | | | | | | | | | | |
|
| Health Care Equipment & Supplies: 2.06% | |
Abbott Laboratories | | | | | | | | | | | 56,094 | | | | 4,426,378 | |
ABIOMED Incorporated † | | | | | | | | | | | 1,432 | | | | 207,869 | |
Align Technology Incorporated † | | | | | | | | | | | 2,276 | | | | 395,910 | |
Baxter International Incorporated | | | | | | | | | | | 16,203 | | | | 1,315,522 | |
Becton Dickinson & Company | | | | | | | | | | | 8,583 | | | | 1,972,116 | |
Boston Scientific Corporation † | | | | | | | | | | | 44,238 | | | | 1,443,486 | |
Danaher Corporation | | | | | | | | | | | 20,288 | | | | 2,808,062 | |
Dentsply Sirona Incorporated | | | | | | | | | | | 7,059 | | | | 274,101 | |
The accompanying notes are an integral part of these financial statements.
12 | Wells Fargo Index Asset Allocation Fund
Portfolio of investments—March 31, 2020 (unaudited)
| | | | | | | | | | | | | | | | |
| | | | | | | | | Shares | | | Value | |
|
| Health Care Equipment & Supplies (continued) | |
Edwards Lifesciences Corporation † | | | | | | | | | | | 6,619 | | | $ | 1,248,476 | |
Hologic Incorporated † | | | | | | | | | | | 8,510 | | | | 298,701 | |
IDEXX Laboratories Incorporated † | | | | | | | | | | | 2,722 | | | | 659,377 | |
Intuitive Surgical Incorporated † | | | | | | | | | | | 3,668 | | | | 1,816,430 | |
Medtronic plc | | | | | | | | | | | 42,541 | | | | 3,836,347 | |
ResMed Incorporated | | | | | | | | | | | 4,564 | | | | 672,232 | |
STERIS plc | | | | | | | | | | | 2,690 | | | | 376,519 | |
Stryker Corporation | | | | | | | | | | | 10,219 | | | | 1,701,361 | |
Teleflex Incorporated | | | | | | | | | | | 1,468 | | | | 429,918 | |
The Cooper Companies Incorporated | | | | | | | | | | | 1,573 | | | | 433,629 | |
Varian Medical Systems Incorporated † | | | | | | | | | | | 2,885 | | | | 296,174 | |
Zimmer Biomet Holdings Incorporated | | | | | | | | | | | 6,528 | | | | 659,850 | |
| | | | |
| | | | | | | | | | | | | | | 25,272,458 | |
| | | | | | | | | | | | | | | | |
|
| Health Care Providers & Services: 1.64% | |
AmerisourceBergen Corporation | | | | | | | | | | | 4,770 | | | | 422,145 | |
Anthem Incorporated | | | | | | | | | | | 8,047 | | | | 1,826,991 | |
Cardinal Health Incorporated | | | | | | | | | | | 9,282 | | | | 444,979 | |
Centene Corporation † | | | | | | | | | | | 18,529 | | | | 1,100,808 | |
Cigna Corporation | | | | | | | | | | | 11,851 | | | | 2,099,760 | |
CVS Health Corporation | | | | | | | | | | | 41,291 | | | | 2,449,795 | |
DaVita HealthCare Partners Incorporated † | | | | | | | | | | | 2,846 | | | | 216,467 | |
HCA Healthcare Incorporated | | | | | | | | | | | 8,396 | | | | 754,381 | |
Henry Schein Incorporated † | | | | | | | | | | | 4,657 | | | | 235,272 | |
Humana Incorporated | | | | | | | | | | | 4,203 | | | | 1,319,826 | |
Laboratory Corporation of America Holdings † | | | | | | | | | | | 3,015 | | | | 381,066 | |
McKesson Corporation | | | | | | | | | | | 5,718 | | | | 773,417 | |
Quest Diagnostics Incorporated | | | | | | | | | | | 4,275 | | | | 343,283 | |
UnitedHealth Group Incorporated | | | | | | | | | | | 30,069 | | | | 7,498,607 | |
Universal Health Services Incorporated Class B | | | | | | | | | | | 2,550 | | | | 252,654 | |
| | | | |
| | | | | | | | | | | | | | | 20,119,451 | |
| | | | | | | | | | | | | | | | |
|
| Health Care Technology: 0.05% | |
Cerner Corporation | | | | | | | | | | | 9,969 | | | | 627,947 | |
| | | | | | | | | | | | | | | | |
|
| Life Sciences Tools & Services: 0.60% | |
Agilent Technologies Incorporated | | | | | | | | | | | 9,821 | | | | 703,380 | |
Illumina Incorporated † | | | | | | | | | | | 4,665 | | | | 1,274,105 | |
IQVIA Holdings Incorporated † | | | | | | | | | | | 5,727 | | | | 617,714 | |
Mettler-Toledo International Incorporated † | | | | | | | | | | | 772 | | | | 533,074 | |
PerkinElmer Incorporated | | | | | | | | | | | 3,526 | | | | 265,437 | |
Thermo Fisher Scientific Incorporated | | | | | | | | | | | 12,726 | | | | 3,609,094 | |
Waters Corporation † | | | | | | | | | | | 2,044 | | | | 372,110 | |
| | | | |
| | | | | | | | | | | | | | | 7,374,914 | |
| | | | | | | | | | | | | | | | |
|
| Pharmaceuticals: 2.84% | |
Allergan plc | | | | | | | | | | | 10,419 | | | | 1,845,205 | |
Bristol-Myers Squibb Company | | | | | | | | | | | 74,401 | | | | 4,147,112 | |
Eli Lilly & Company | | | | | | | | | | | 26,815 | | | | 3,719,777 | |
Johnson & Johnson | | | | | | | | | | | 83,532 | | | | 10,953,551 | |
Merck & Company Incorporated | | | | | | | | | | | 80,805 | | | | 6,217,137 | |
Mylan NV † | | | | | | | | | | | 16,381 | | | | 244,241 | |
Perrigo Company plc | | | | | | | | | | | 4,319 | | | | 207,701 | |
Pfizer Incorporated | | | | | | | | | | | 175,647 | | | | 5,733,118 | |
Zoetis Incorporated | | | | | | | | | | | 15,117 | | | | 1,779,120 | |
| | | | |
| | | | | | | | | | | | | | | 34,846,962 | |
| | | | | | | | | | | | | | | | |
The accompanying notes are an integral part of these financial statements.
Wells Fargo Index Asset Allocation Fund | 13
Portfolio of investments—March 31, 2020 (unaudited)
| | | | | | | | | | | | | | | | |
| | | | | | | | | Shares | | | Value | |
Industrials: 4.56% | |
|
| Aerospace & Defense: 1.12% | |
General Dynamics Corporation | | | | | | | | | | | 7,437 | | | $ | 983,989 | |
Howmet Aerospace Inc Common Stock | | | | | | | | | | | 12,294 | | | | 197,442 | |
Huntington Ingalls Industries Incorporated | | | | | | | | | | | 1,297 | | | | 236,326 | |
L3Harris Technologies | | | | | | | | | | | 7,016 | | | | 1,263,722 | |
Lockheed Martin Corporation | | | | | | | | | | | 7,878 | | | | 2,670,248 | |
Northrop Grumman Corporation | | | | | | | | | | | 4,974 | | | | 1,504,884 | |
Raytheon Company | | | | | | | | | | | 8,837 | | | | 1,158,973 | |
Textron Incorporated | | | | | | | | | | | 7,244 | | | | 193,197 | |
The Boeing Company | | | | | | | | | | | 16,969 | | | | 2,530,757 | |
TransDigm Group Incorporated | | | | | | | | | | | 1,580 | | | | 505,900 | |
United Technologies Corporation | | | | | | | | | | | 25,749 | | | | 2,428,903 | |
| | | | |
| | | | | | | | | | | | | | | 13,674,341 | |
| | | | | | | | | | | | | | | | |
|
| Air Freight & Logistics: 0.30% | |
C.H. Robinson Worldwide Incorporated | | | | | | | | | | | 4,293 | | | | 284,197 | |
Expeditors International of Washington Incorporated | | | | | | | | | | | 5,406 | | | | 360,688 | |
FedEx Corporation | | | | | | | | | | | 7,618 | | | | 923,759 | |
United Parcel Service Incorporated Class B | | | | | | | | | | | 22,241 | | | | 2,077,754 | |
| | | | |
| | | | | | | | | | | | | | | 3,646,398 | |
| | | | | | | | | | | | | | | | |
|
| Airlines: 0.13% | |
Alaska Air Group Incorporated | | | | | | | | | | | 3,909 | | | | 111,289 | |
American Airlines Group Incorporated | | | | | | | | | | | 12,374 | | | | 150,839 | |
Delta Air Lines Incorporated | | | | | | | | | | | 18,268 | | | | 521,186 | |
Southwest Airlines Company | | | | | | | | | | | 15,032 | | | | 535,290 | |
United Airlines Holdings Incorporated † | | | | | | | | | | | 6,906 | | | | 217,884 | |
| | | | |
| | | | | | | | | | | | | | | 1,536,488 | |
| | | | | | | | | | | | | | | | |
|
| Building Products: 0.13% | |
A.O. Smith Corporation | | | | | | | | | | | 4,350 | | | | 164,474 | |
Allegion plc | | | | | | | | | | | 2,950 | | | | 271,459 | |
Fortune Brands Home & Security Incorporated | | | | | | | | | | | 4,416 | | | | 190,992 | |
Johnson Controls International plc | | | | | | | | | | | 24,483 | | | | 660,062 | |
Masco Corporation | | | | | | | | | | | 9,017 | | | | 311,718 | |
| | | | |
| | | | | | | | | | | | | | | 1,598,705 | |
| | | | | | | | | | | | | | | | |
|
| Commercial Services & Supplies: 0.22% | |
Cintas Corporation | | | | | | | | | | | 2,660 | | | | 460,765 | |
Copart Incorporated † | | | | | | | | | | | 6,492 | | | | 444,832 | |
Republic Services Incorporated | | | | | | | | | | | 6,686 | | | | 501,851 | |
Rollins Incorporated | | | | | | | | | | | 4,469 | | | | 161,510 | |
Waste Management Incorporated | | | | | | | | | | | 12,387 | | | | 1,146,541 | |
| | | | |
| | | | | | | | | | | | | | | 2,715,499 | |
| | | | | | | | | | | | | | | | |
|
| Construction & Engineering: 0.04% | |
Jacobs Engineering Group Incorporated | | | | | | | | | | | 4,300 | | | | 340,861 | |
Quanta Services Incorporated | | | | | | | | | | | 4,516 | | | | 143,293 | |
| | | | |
| | | | | | | | | | | | | | | 484,154 | |
| | | | | | | | | | | | | | | | |
|
| Electrical Equipment: 0.25% | |
AMETEK Incorporated | | | | | | | | | | | 7,255 | | | | 522,505 | |
Eaton Corporation plc | | | | | | | | | | | 13,120 | | | | 1,019,293 | |
The accompanying notes are an integral part of these financial statements.
14 | Wells Fargo Index Asset Allocation Fund
Portfolio of investments—March 31, 2020 (unaudited)
| | | | | | | | | | | | | | | | |
| | | | | | | | | Shares | | | Value | |
|
| Electrical Equipment (continued) | |
Emerson Electric Company | | | | | | | | | | | 19,333 | | | $ | 921,217 | |
Rockwell Automation Incorporated | | | | | | | | | | | 3,667 | | | | 553,387 | |
| | | | |
| | | | | | | | | | | | | | | 3,016,402 | |
| | | | | | | | | | | | | | | | |
| | | | |
| Industrial Conglomerates: 0.71% | | | | | | | | | | | | |
3M Company | | | | | | | | | | | 18,250 | | | | 2,491,308 | |
General Electric Company | | | | | | | | | | | 277,192 | | | | 2,200,904 | |
Honeywell International Incorporated | | | | | | | | | | | 22,678 | | | | 3,034,090 | |
Roper Technologies Incorporated | | | | | | | | | | | 3,302 | | | | 1,029,597 | |
| | | | |
| | | | | | | | | | | | | | | 8,755,899 | |
| | | | | | | | | | | | | | | | |
|
| Machinery: 0.84% | |
Caterpillar Incorporated | | | | | | | | | | | 17,540 | | | | 2,035,342 | |
Cummins Incorporated | | | | | | | | | | | 4,862 | | | | 657,926 | |
Deere & Company | | | | | | | | | | | 9,994 | | | | 1,380,771 | |
Dover Corporation | | | | | | | | | | | 4,610 | | | | 386,963 | |
Flowserve Corporation | | | | | | | | | | | 4,153 | | | | 99,215 | |
Fortive Corporation | | | | | | | | | | | 9,379 | | | | 517,627 | |
IDEX Corporation | | | | | | | | | | | 2,413 | | | | 333,259 | |
Illinois Tool Works Incorporated | | | | | | | | | | | 9,282 | | | | 1,319,158 | |
Ingersoll Rand Incorporated † | | | | | | | | | | | 10,983 | | | | 272,378 | |
PACCAR Incorporated | | | | | | | | | | | 10,977 | | | | 671,024 | |
Parker-Hannifin Corporation | | | | | | | | | | | 4,077 | | | | 528,909 | |
Pentair plc | | | | | | | | | | | 5,335 | | | | 158,770 | |
Snap-on Incorporated | | | | | | | | | | | 1,740 | | | | 189,347 | |
Stanley Black & Decker Incorporated | | | | | | | | | | | 4,824 | | | | 482,400 | |
Trane Technologies plc | | | | | | | | | | | 7,603 | | | | 627,932 | |
Wabtec Corporation | | | | | | | | | | | 5,780 | | | | 278,191 | |
Xylem Incorporated | | | | | | | | | | | 5,715 | | | | 372,218 | |
| | | | |
| | | | | | | | | | | | | | | 10,311,430 | |
| | | | | | | | | | | | | | | | |
|
| Professional Services: 0.18% | |
Equifax Incorporated | | | | | | | | | | | 3,843 | | | | 459,046 | |
IHS Markit Limited | | | | | | | | | | | 12,726 | | | | 763,560 | |
Nielsen Holdings plc | | | | | | | | | | | 11,292 | | | | 141,602 | |
Robert Half International Incorporated | | | | | | | | | | | 3,732 | | | | 140,883 | |
Verisk Analytics Incorporated | | | | | | | | | | | 5,201 | | | | 724,915 | |
| | | | |
| | | | | | | | | | | | | | | 2,230,006 | |
| | | | | | | | | | | | | | | | |
|
| Road & Rail: 0.55% | |
CSX Corporation | | | | | | | | | | | 24,681 | | | | 1,414,221 | |
J.B. Hunt Transport Services Incorporated | | | | | | | | | | | 2,706 | | | | 249,574 | |
Kansas City Southern | | | | | | | | | | | 3,145 | | | | 399,981 | |
Norfolk Southern Corporation | | | | | | | | | | | 8,276 | | | | 1,208,296 | |
Old Dominion Freight Line Incorporated | | | | | | | | | | | 3,041 | | | | 399,096 | |
Union Pacific Corporation | | | | | | | | | | | 22,032 | | | | 3,107,393 | |
| | | | |
| | | | | | | | | | | | | | | 6,778,561 | |
| | | | | | | | | | | | | | | | |
|
| Trading Companies & Distributors: 0.09% | |
Fastenal Company | | | | | | | | | | | 18,202 | | | | 568,813 | |
United Rentals Incorporated † | | | | | | | | | | | 2,385 | | | | 245,417 | |
W.W. Grainger Incorporated | | | | | | | | | | | 1,384 | | | | 343,924 | |
| | | | |
| | | | | | | | | | | | | | | 1,158,154 | |
| | | | | | | | | | | | | | | | |
The accompanying notes are an integral part of these financial statements.
Wells Fargo Index Asset Allocation Fund | 15
Portfolio of investments—March 31, 2020 (unaudited)
| | | | | | | | | | | | | | | | |
| | | | | | | | | Shares | | | Value | |
Information Technology: 14.12% | |
|
| Communications Equipment: 0.55% | |
Arista Networks Incorporated † | | | | | | | | | | | 1,722 | | | $ | 348,791 | |
Cisco Systems Incorporated | | | | | | | | | | | 134,645 | | | | 5,292,895 | |
F5 Networks Incorporated † | | | | | | | | | | | 1,930 | | | | 205,796 | |
Juniper Networks Incorporated | | | | | | | | | | | 10,623 | | | | 203,324 | |
Motorola Solutions Incorporated | | | | | | | | | | | 5,438 | | | | 722,819 | |
| | | | |
| | | | | | | | | | | | | | | 6,773,625 | |
| | | | | | | | | | | | | | | | |
|
| Electronic Equipment, Instruments & Components: 0.27% | |
Amphenol Corporation Class A | | | | | | | | | | | 9,409 | | | | 685,728 | |
CDW Corporation of Delaware | | | | | | | | | | | 4,560 | | | | 425,311 | |
Corning Incorporated | | | | | | | | | | | 24,409 | | | | 501,361 | |
FLIR Systems Incorporated | | | | | | | | | | | 4,259 | | | | 135,820 | |
IPG Photonics Corporation † | | | | | | | | | | | 1,128 | | | | 124,396 | |
Keysight Technologies Incorporated † | | | | | | | | | | | 5,953 | | | | 498,147 | |
TE Connectivity Limited | | | | | | | | | | | 10,615 | | | | 668,533 | |
Zebra Technologies Corporation Class A † | | | | | | | | | | | 1,711 | | | | 314,140 | |
| | | | |
| | | | | | | | | | | | | | | 3,353,436 | |
| | | | | | | | | | | | | | | | |
|
| IT Services: 3.07% | |
Accenture plc Class A | | | | | | | | | | | 20,155 | | | | 3,290,505 | |
Akamai Technologies Incorporated † | | | | | | | | | | | 5,128 | | | | 469,161 | |
Alliance Data Systems Corporation | | | | | | | | | | | 1,300 | | | | 43,745 | |
Automatic Data Processing Incorporated | | | | | | | | | | | 13,732 | | | | 1,876,890 | |
Broadridge Financial Solutions Incorporated | | | | | | | | | | | 3,638 | | | | 344,992 | |
Cognizant Technology Solutions Corporation Class A | | | | | | | | | | | 17,379 | | | | 807,602 | |
DXC Technology Company | | | | | | | | | | | 8,125 | | | | 106,031 | |
Fidelity National Information Services Incorporated | | | | | | | | | | | 19,505 | | | | 2,372,588 | |
Fiserv Incorporated † | | | | | | | | | | | 18,125 | | | | 1,721,694 | |
FleetCor Technologies Incorporated † | | | | | | | | | | | 2,754 | | | | 513,731 | |
Gartner Incorporated † | | | | | | | | | | | 2,839 | | | | 282,679 | |
Global Payments Incorporated | | | | | | | | | | | 9,538 | | | | 1,375,666 | |
International Business Machines Corporation | | | | | | | | | | | 28,108 | | | | 3,118,020 | |
Jack Henry & Associates Incorporated | | | | | | | | | | | 2,442 | | | | 379,096 | |
Leidos Holdings Incorporated | | | | | | | | | | | 4,224 | | | | 387,130 | |
MasterCard Incorporated Class A | | | | | | | | | | | 28,174 | | | | 6,805,711 | |
Paychex Incorporated | | | | | | | | | | | 10,110 | | | | 636,121 | |
PayPal Holdings Incorporated † | | | | | | | | | | | 37,267 | | | | 3,567,943 | |
The Western Union Company | | | | | | | | | | | 13,306 | | | | 241,238 | |
VeriSign Incorporated † | | | | | | | | | | | 3,279 | | | | 590,515 | |
Visa Incorporated Class A | | | | | | | | | | | 54,331 | | | | 8,753,811 | |
| | | | |
| | | | | | | | | | | | | | | 37,684,869 | |
| | | | | | | | | | | | | | | | |
|
| Semiconductors & Semiconductor Equipment: 2.51% | |
Advanced Micro Devices Incorporated † | | | | | | | | | | | 37,123 | | | | 1,688,354 | |
Analog Devices Incorporated | | | | | | | | | | | 11,688 | | | | 1,047,829 | |
Applied Materials Incorporated | | | | | | | | | | | 29,317 | | | | 1,343,305 | |
Broadcom Incorporated | | | | | | | | | | | 12,589 | | | | 2,984,852 | |
Intel Corporation | | | | | | | | | | | 138,064 | | | | 7,472,024 | |
KLA-Tencor Corporation | | | | | | | | | | | 5,008 | | | | 719,850 | |
Lam Research Corporation | | | | | | | | | | | 4,605 | | | | 1,105,200 | |
Maxim Integrated Products Incorporated | | | | | | | | | | | 8,588 | | | | 417,463 | |
Microchip Technology Incorporated | | | | | | | | | | | 7,584 | | | | 514,195 | |
Micron Technology Incorporated † | | | | | | | | | | | 35,136 | | | | 1,477,820 | |
The accompanying notes are an integral part of these financial statements.
16 | Wells Fargo Index Asset Allocation Fund
Portfolio of investments—March 31, 2020 (unaudited)
| | | | | | | | | | | | | | | | |
| | | | | | | | | Shares | | | Value | |
|
| Semiconductors & Semiconductor Equipment (continued) | |
NVIDIA Corporation | | | | | | | | | | | 19,424 | | | $ | 5,120,166 | |
Qorvo Incorporated † | | | | | | | | | | | 3,687 | | | | 297,283 | |
QUALCOMM Incorporated | | | | | | | | | | | 36,240 | | | | 2,451,636 | |
Skyworks Solutions Incorporated | | | | | | | | | | | 5,408 | | | | 483,367 | |
Texas Instruments Incorporated | | | | | | | | | | | 29,667 | | | | 2,964,623 | |
Xilinx Incorporated | | | | | | | | | | | 7,980 | | | | 621,961 | |
| | | | |
| | | | | | | | | | | | | | | 30,709,928 | |
| | | | | | | | | | | | | | | | |
|
| Software: 4.78% | |
Adobe Incorporated † | | | | | | | | | | | 15,363 | | | | 4,889,121 | |
ANSYS Incorporated † | | | | | | | | | | | 2,716 | | | | 631,389 | |
Autodesk Incorporated † | | | | | | | | | | | 6,983 | | | | 1,090,046 | |
Cadence Design Systems Incorporated † | | | | | | | | | | | 8,905 | | | | 588,086 | |
Citrix Systems Incorporated | | | | | | | | | | | 3,651 | | | | 516,799 | |
Fortinet Incorporated † | | | | | | | | | | | 4,506 | | | | 455,872 | |
Intuit Incorporated | | | | | | | | | | | 8,261 | | | | 1,900,030 | |
Microsoft Corporation | | | | | | | | | | | 242,131 | | | | 38,186,480 | |
NortonLifeLock Incorporated | | | | | | | | | | | 18,198 | | | | 340,485 | |
Oracle Corporation | | | | | | | | | | | 68,760 | | | | 3,323,171 | |
Paycom Software Incorporated † | | | | | | | | | | | 1,557 | | | | 314,530 | |
Salesforce.com Incorporated † | | | | | | | | | | | 28,151 | | | | 4,053,181 | |
ServiceNow Incorporated † | | | | | | | | | | | 5,986 | | | | 1,715,468 | |
Synopsys Incorporated † | | | | | | | | | | | 4,771 | | | | 614,457 | |
| | | | |
| | | | | | | | | | | | | | | 58,619,115 | |
| | | | | | | | | | | | | | | | |
|
| Technology Hardware, Storage & Peripherals: 2.94% | |
Apple Incorporated | | | | | | | | | | | 132,563 | | | | 33,709,445 | |
Hewlett Packard Enterprise Company | | | | | | | | | | | 41,069 | | | | 398,780 | |
HP Incorporated | | | | | | | | | | | 47,033 | | | | 816,493 | |
NetApp Incorporated | | | | | | | | | | | 7,242 | | | | 301,919 | |
Seagate Technology plc | | | | | | | | | | | 7,337 | | | | 358,046 | |
Western Digital Corporation | | | | | | | | | | | 9,439 | | | | 392,851 | |
Xerox Holdings Corporation | | | | | | | | | | | 5,901 | | | | 111,765 | |
| | | | |
| | | | | | | | | | | | | | | 36,089,299 | |
| | | | | | | | | | | | | | | | |
|
Materials: 1.35% | |
|
| Chemicals: 0.94% | |
Air Products & Chemicals Incorporated | | | | | | | | | | | 6,996 | | | | 1,396,472 | |
Albemarle Corporation | | | | | | | | | | | 3,366 | | | | 189,741 | |
Celanese Corporation Series A | | | | | | | | | | | 3,836 | | | | 281,524 | |
CF Industries Holdings Incorporated | | | | | | | | | | | 6,900 | | | | 187,680 | |
Corteva Incorporated | | | | | | | | | | | 23,752 | | | | 558,172 | |
Dow Incorporated | | | | | | | | | | | 23,533 | | | | 688,105 | |
DuPont de Nemours Incorporated | | | | | | | | | | | 23,512 | | | | 801,759 | |
Eastman Chemical Company | | | | | | | | | | | 4,315 | | | | 200,993 | |
Ecolab Incorporated | | | | | | | | | | | 7,959 | | | | 1,240,251 | |
FMC Corporation | | | | | | | | | | | 4,114 | | | | 336,073 | |
International Flavors & Fragrances Incorporated « | | | | | | | | | | | 3,389 | | | | 345,949 | |
Linde plc | | | | | | | | | | | 17,048 | | | | 2,949,304 | |
LyondellBasell Industries NV Class A | | | | | | | | | | | 8,148 | | | | 404,385 | |
PPG Industries Incorporated | | | | | | | | | | | 7,505 | | | | 627,418 | |
The Mosaic Company | | | | | | | | | | | 11,097 | | | | 120,070 | |
The Sherwin-Williams Company | | | | | | | | | | | 2,608 | | | | 1,198,428 | |
| | | | |
| | | | | | | | | | | | | | | 11,526,324 | |
| | | | | | | | | | | | | | | | |
The accompanying notes are an integral part of these financial statements.
Wells Fargo Index Asset Allocation Fund | 17
Portfolio of investments—March 31, 2020 (unaudited)
| | | | | | | | | | | | | | | | |
| | | �� | | | | | | Shares | | | Value | |
| Construction Materials: 0.07% | |
Martin Marietta Materials Incorporated | | | | | | | | | | | 1,983 | | | $ | 375,243 | |
Vulcan Materials Company | | | | | | | | | | | 4,201 | | | | 454,002 | |
| | | | |
| | | | | | | | | | | | | | | 829,245 | |
| | | | | | | | | | | | | | | | |
|
| Containers & Packaging: 0.19% | |
Amcor plc | | | | | | | | | | | 51,421 | | | | 417,539 | |
Avery Dennison Corporation | | | | | | | | | | | 2,649 | | | | 269,854 | |
Ball Corporation | | | | | | | | | | | 10,382 | | | | 671,300 | |
International Paper Company | | | | | | | | | | | 12,445 | | | | 387,413 | |
Packaging Corporation of America | | | | | | | | | | | 3,005 | | | | 260,924 | |
Sealed Air Corporation | | | | | | | | | | | 4,904 | | | | 121,178 | |
WestRock Company | | | | | | | | | | | 8,184 | | | | 231,280 | |
| | | | |
| | | | | | | | | | | | | | | 2,359,488 | |
| | | | | | | | | | | | | | | | |
|
| Metals & Mining: 0.15% | |
Freeport-McMoRan Incorporated | | | | | | | | | | | 46,049 | | | | 310,831 | |
Newmont Goldcorp Corporation | | | | | | | | | | | 26,020 | | | | 1,178,186 | |
Nucor Corporation | | | | | | | | | | | 9,623 | | | | 346,620 | |
| | | | |
| | | | | | | | | | | | | | | 1,835,637 | |
| | | | | | | | | | | | | | | | |
|
Real Estate: 1.64% | |
|
| Equity REITs: 1.61% | |
Alexandria Real Estate Equities Incorporated | | | | | | | | | | | 3,891 | | | | 533,300 | |
American Tower Corporation | | | | | | | | | | | 14,058 | | | | 3,061,130 | |
Apartment Investment & Management Company Class A | | | | | | | | | | | 4,725 | | | | 166,084 | |
AvalonBay Communities Incorporated | | | | | | | | | | | 4,433 | | | | 652,405 | |
Boston Properties Incorporated | | | | | | | | | | | 4,564 | | | | 420,938 | |
Crown Castle International Corporation | | | | | | | | | | | 13,196 | | | | 1,905,502 | |
Digital Realty Trust Incorporated | | | | | | | | | | | 6,624 | | | | 920,140 | |
Duke Realty Corporation | | | | | | | | | | | 11,665 | | | | 377,713 | |
Equinix Incorporated | | | | | | | | | | | 2,707 | | | | 1,690,711 | |
Equity Residential | | | | | | | | | | | 11,079 | | | | 683,685 | |
Essex Property Trust Incorporated | | | | | | | | | | | 2,098 | | | | 462,064 | |
Extra Space Storage Incorporated | | | | | | | | | | | 4,110 | | | | 393,574 | |
Federal Realty Investment Trust | | | | | | | | | | | 2,229 | | | | 166,306 | |
Healthpeak Properties Incorporated | | | | | | | | | | | 15,709 | | | | 374,660 | |
Host Hotels & Resorts Incorporated | | | | | | | | | | | 22,761 | | | | 251,281 | |
Iron Mountain Incorporated | | | | | | | | | | | 9,113 | | | | 216,889 | |
Kimco Realty Corporation | | | | | | | | | | | 13,400 | | | | 129,578 | |
Mid-America Apartment Communities Incorporated | | | | | | | | | | | 3,620 | | | | 372,969 | |
Prologis Incorporated | | | | | | | | | | | 23,431 | | | | 1,883,149 | |
Public Storage Incorporated | | | | | | | | | | | 4,767 | | | | 946,774 | |
Realty Income Corporation | | | | | | | | | | | 10,344 | | | | 515,752 | |
Regency Centers Corporation | | | | | | | | | | | 5,318 | | | | 204,371 | |
SBA Communications Corporation | | | | | | | | | | | 3,574 | | | | 964,873 | |
Simon Property Group Incorporated | | | | | | | | | | | 9,738 | | | | 534,227 | |
SL Green Realty Corporation | | | | | | | | | | | 2,587 | | | | 111,500 | |
UDR Incorporated | | | | | | | | | | | 9,301 | | | | 339,859 | |
Ventas Incorporated | | | | | | | | | | | 11,829 | | | | 317,017 | |
Vornado Realty Trust | | | | | | | | | | | 5,027 | | | | 182,028 | |
Welltower Incorporated | | | | | | | | | | | 12,878 | | | | 589,555 | |
Weyerhaeuser Company | | | | | | | | | | | 23,649 | | | | 400,851 | |
| | | | |
| | | | | | | | | | | | | | | 19,768,885 | |
| | | | | | | | | | | | | | | | |
The accompanying notes are an integral part of these financial statements.
18 | Wells Fargo Index Asset Allocation Fund
Portfolio of investments—March 31, 2020 (unaudited)
| | | | | | | | | | | | | | | | |
| | | | | | | | | Shares | | | Value | |
| Real Estate Management & Development: 0.03% | |
CBRE Group Incorporated Class A † | | | | | | | | | | | 10,624 | | | $ | 400,631 | |
| | | | | | | | | | | | | | | | |
|
Utilities: 1.98% | |
|
| Electric Utilities: 1.23% | |
Alliant Energy Corporation | | | | | | | | | | | 7,628 | | | | 368,356 | |
American Electric Power Company Incorporated | | | | | | | | | | | 15,676 | | | | 1,253,766 | |
Duke Energy Corporation | | | | | | | | | | | 23,137 | | | | 1,871,321 | |
Edison International | | | | | | | | | | | 11,380 | | | | 623,510 | |
Entergy Corporation | | | | | | | | | | | 6,320 | | | | 593,890 | |
Evergy Incorporated | | | | | | | | | | | 7,232 | | | | 398,122 | |
Eversource Energy | | | | | | | | | | | 10,275 | | | | 803,608 | |
Exelon Corporation | | | | | | | | | | | 30,853 | | | | 1,135,699 | |
FirstEnergy Corporation | | | | | | | | | | | 17,147 | | | | 687,080 | |
NextEra Energy Incorporated | | | | | | | | | | | 15,512 | | | | 3,732,497 | |
Pinnacle West Capital Corporation | | | | | | | | | | | 3,568 | | | | 270,419 | |
PPL Corporation | | | | | | | | | | | 24,369 | | | | 601,427 | |
The Southern Company | | | | | | | | | | | 33,286 | | | | 1,802,104 | |
Xcel Energy Incorporated | | | | | | | | | | | 16,642 | | | | 1,003,513 | |
| | | | |
| | | | | | | | | | | | | | | 15,145,312 | |
| | | | | | | | | | | | | | | | |
| | | | |
| Gas Utilities: 0.03% | | | | | | | | | | | | |
Atmos Energy Corporation | | | | | | | | | | | 3,788 | | | | 375,883 | |
| | | | | | | | | | | | | | | | |
| | | | |
| Independent Power & Renewable Electricity Producers: 0.04% | | | | | | | | | | | | |
AES Corporation | | | | | | | | | | | 21,069 | | | | 286,538 | |
NRG Energy Incorporated | | | | | | | | | | | 7,985 | | | | 217,671 | |
| | | | |
| | | | | | | | | | | | | | | 504,209 | |
| | | | | | | | | | | | | | | | |
| | | | |
| Multi-Utilities: 0.62% | | | | | | | | | | | | |
Ameren Corporation | | | | | | | | | | | 7,808 | | | | 568,657 | |
CenterPoint Energy Incorporated | | | | | | | | | | | 15,940 | | | | 246,273 | |
CMS Energy Corporation | | | | | | | | | | | 9,009 | | | | 529,279 | |
Consolidated Edison Incorporated | | | | | | | | | | | 10,550 | | | | 822,900 | |
Dominion Energy Incorporated | | | | | | | | | | | 26,123 | | | | 1,885,819 | |
DTE Energy Company | | | | | | | | | | | 6,096 | | | | 578,937 | |
NiSource Incorporated | | | | | | | | | | | 11,855 | | | | 296,019 | |
Public Service Enterprise Group Incorporated | | | | | | | | | | | 16,051 | | | | 720,850 | |
Sempra Energy | | | | | | | | | | | 8,946 | | | | 1,010,809 | |
WEC Energy Group Incorporated | | | | | | | | | | | 10,011 | | | | 882,269 | |
| | | | |
| | | | | | | | | | | | | | | 7,541,812 | |
| | | | | | | | | | | | | | | | |
| | | | |
| Water Utilities: 0.06% | | | | | | | | | | | | |
American Water Works Company Incorporated | | | | | | | | | | | 5,738 | | | | 686,035 | |
| | | | | | | | | | | | | | | | |
| | | | |
Total Common Stocks (Cost $338,610,983) | | | | | | | | | | | | | | | 679,836,262 | |
| | | | | | | | | | | | | | | | |
| | | | |
| | | | | | | | | | | | | | | | |
| | | Interest
rate | | | Maturity
date | | | Principal | | | | |
| Non-Agency Mortgage-Backed Securities: 0.00% | | | | | | | | | | | | |
Citigroup Mortgage Loan Trust Incorporated Series 2004-HYB4 Class AA (1 Month LIBOR +0.33%)± | | | 1.28 | % | | | 12-25-2034 | | | $ | 6,512 | | | | 5,856 | |
| | | | | | | | | | | | | | | | |
| | | | |
TotalNon-Agency Mortgage-Backed Securities (Cost $6,512) | | | | | | | | | | | | | | | 5,856 | |
| | | | | | | | | | | | | | | | |
The accompanying notes are an integral part of these financial statements.
Wells Fargo Index Asset Allocation Fund | 19
Portfolio of investments—March 31, 2020 (unaudited)
| | | | | | | | | | | | | | | | |
| | | Interest
rate | | | Maturity
date | | | Principal | | | Value | |
| U.S. Treasury Securities: 40.17% | | | | | | | | | | | | |
U.S. Treasury Bond | | | 1.50 | % | | | 1-31-2027 | | | $ | 1,873,000 | | | $ | 1,993,209 | |
U.S. Treasury Bond | | | 2.13 | | | | 9-30-2024 | | | | 1,844,000 | | | | 1,989,215 | |
U.S. Treasury Bond | | | 2.13 | | | | 11-30-2024 | | | | 1,852,000 | | | | 2,002,258 | |
U.S. Treasury Bond | | | 2.25 | | | | 8-15-2046 | | | | 1,961,000 | | | | 2,360,554 | |
U.S. Treasury Bond | | | 2.25 | | | | 8-15-2049 | | | | 1,955,000 | | | | 2,378,532 | |
U.S. Treasury Bond | | | 2.38 | | | | 11-15-2049 | | | | 2,096,000 | | | | 2,616,070 | |
U.S. Treasury Bond | | | 2.50 | | | | 2-15-2045 | | | | 2,144,000 | | | | 2,677,571 | |
U.S. Treasury Bond | | | 2.50 | | | | 2-15-2046 | | | | 1,960,000 | | | | 2,463,628 | |
U.S. Treasury Bond | | | 2.50 | | | | 5-15-2046 | | | | 1,949,000 | | | | 2,451,857 | |
U.S. Treasury Bond | | | 2.75 | | | | 8-15-2042 | | | | 1,218,000 | | | | 1,572,838 | |
U.S. Treasury Bond | | | 2.75 | | | | 11-15-2042 | | | | 1,453,000 | | | | 1,876,981 | |
U.S. Treasury Bond | | | 2.75 | | | | 8-15-2047 | | | | 1,864,000 | | | | 2,463,902 | |
U.S. Treasury Bond | | | 2.75 | | | | 11-15-2047 | | | | 1,853,000 | | | | 2,452,692 | |
U.S. Treasury Bond | | | 2.88 | | | | 5-15-2028 | | | | 4,464,000 | | | | 5,265,428 | |
U.S. Treasury Bond | | | 2.88 | | | | 5-15-2043 | | | | 2,055,000 | | | | 2,707,944 | |
U.S. Treasury Bond | | | 2.88 | | | | 8-15-2045 | | | | 2,121,000 | | | | 2,835,926 | |
U.S. Treasury Bond | | | 2.88 | | | | 11-15-2046 | | | | 1,928,000 | | | | 2,602,875 | |
U.S. Treasury Bond | | | 2.88 | | | | 5-15-2049 | | | | 2,856,000 | | | | 3,900,113 | |
U.S. Treasury Bond | | | 3.00 | | | | 5-15-2042 | | | | 776,000 | | | | 1,041,750 | |
U.S. Treasury Bond | | | 3.00 | | | | 11-15-2044 | | | | 2,119,000 | | | | 2,868,762 | |
U.S. Treasury Bond | | | 3.00 | | | | 5-15-2045 | | | | 2,148,000 | | | | 2,921,783 | |
U.S. Treasury Bond | | | 3.00 | | | | 11-15-2045 | | | | 2,136,000 | | | | 2,922,482 | |
U.S. Treasury Bond | | | 3.00 | | | | 2-15-2047 | | | | 1,967,000 | | | | 2,718,993 | |
U.S. Treasury Bond | | | 3.00 | | | | 5-15-2047 | | | | 1,921,000 | | | | 2,655,632 | |
U.S. Treasury Bond | | | 3.00 | | | | 2-15-2048 | | | | 2,119,000 | | | | 2,933,242 | |
U.S. Treasury Bond | | | 3.00 | | | | 8-15-2048 | | | | 2,099,000 | | | | 2,918,430 | |
U.S. Treasury Bond | | | 3.00 | | | | 2-15-2049 | | | | 3,006,000 | | | | 4,191,844 | |
U.S. Treasury Bond | | | 3.13 | | | | 11-15-2041 | | | | 846,000 | | | | 1,155,286 | |
U.S. Treasury Bond | | | 3.13 | | | | 2-15-2042 | | | | 919,000 | | | | 1,256,122 | |
U.S. Treasury Bond | | | 3.13 | | | | 2-15-2043 | | | | 1,455,000 | | | | 1,989,940 | |
U.S. Treasury Bond | | | 3.13 | | | | 8-15-2044 | | | | 2,131,000 | | | | 2,937,700 | |
U.S. Treasury Bond | | | 3.13 | | | | 5-15-2048 | | | | 2,283,000 | | | | 3,237,044 | |
U.S. Treasury Bond | | | 3.38 | | | | 5-15-2044 | | | | 2,039,000 | | | | 2,914,974 | |
U.S. Treasury Bond | | | 3.38 | | | | 11-15-2048 | | | | 3,002,000 | | | | 4,457,032 | |
U.S. Treasury Bond | | | 3.50 | | | | 2-15-2039 | | | | 731,000 | | | | 1,040,676 | |
U.S. Treasury Bond | | | 3.63 | | | | 8-15-2043 | | | | 1,633,000 | | | | 2,407,910 | |
U.S. Treasury Bond | | | 3.63 | | | | 2-15-2044 | | | | 2,088,000 | | | | 3,089,424 | |
U.S. Treasury Bond | | | 3.75 | | | | 8-15-2041 | | | | 929,000 | | | | 1,380,037 | |
U.S. Treasury Bond | | | 3.75 | | | | 11-15-2043 | | | | 2,041,000 | | | | 3,068,835 | |
U.S. Treasury Bond | | | 3.88 | | | | 8-15-2040 | | | | 946,000 | | | | 1,419,443 | |
U.S. Treasury Bond | | | 4.25 | | | | 5-15-2039 | | | | 681,000 | | | | 1,058,636 | |
U.S. Treasury Bond | | | 4.25 | | | | 11-15-2040 | | | | 977,000 | | | | 1,535,646 | |
U.S. Treasury Bond | | | 4.38 | | | | 2-15-2038 | | | | 381,000 | | | | 594,405 | |
U.S. Treasury Bond | | | 4.38 | | | | 11-15-2039 | | | | 757,000 | | | | 1,197,746 | |
U.S. Treasury Bond | | | 4.38 | | | | 5-15-2040 | | | | 1,078,000 | | | | 1,713,978 | |
U.S. Treasury Bond | | | 4.38 | | | | 5-15-2041 | | | | 842,000 | | | | 1,350,588 | |
U.S. Treasury Bond | | | 4.50 | | | | 2-15-2036 | | | | 837,000 | | | | 1,286,397 | |
U.S. Treasury Bond | | | 4.50 | | | | 5-15-2038 | | | | 428,000 | | | | 677,979 | |
U.S. Treasury Bond | | | 4.50 | | | | 8-15-2039 | | | | 721,000 | | | | 1,154,558 | |
U.S. Treasury Bond | | | 4.63 | | | | 2-15-2040 | | | | 1,276,000 | | | | 2,084,067 | |
U.S. Treasury Bond | | | 4.75 | | | | 2-15-2037 | | | | 264,000 | | | | 421,668 | |
U.S. Treasury Bond | | | 4.75 | | | | 2-15-2041 | | | | 1,084,000 | | | | 1,811,550 | |
U.S. Treasury Bond | | | 5.00 | | | | 5-15-2037 | | | | 375,000 | | | | 615,996 | |
U.S. Treasury Bond | | | 5.25 | | | | 11-15-2028 | | | | 479,000 | | | | 665,436 | |
U.S. Treasury Bond | | | 5.25 | | | | 2-15-2029 | | | | 349,000 | | | | 487,509 | |
The accompanying notes are an integral part of these financial statements.
20 | Wells Fargo Index Asset Allocation Fund
Portfolio of investments—March 31, 2020 (unaudited)
| | | | | | | | | | | | | | | | |
| | | Interest
rate | | | Maturity
date | | | Principal | | | Value | |
| | | | |
| U.S. Treasury Securities (continued) | | | | | | | | | | | | |
U.S. Treasury Bond | | | 5.38 | % | | | 2-15-2031 | | | $ | 752,000 | | | $ | 1,118,159 | |
U.S. Treasury Bond | | | 5.50 | | | | 8-15-2028 | | | | 369,000 | | | | 516,441 | |
U.S. Treasury Bond | | | 6.13 | | | | 11-15-2027 | | | | 525,000 | | | | 743,777 | |
U.S. Treasury Bond | | | 6.13 | | | | 8-15-2029 | | | | 293,000 | | | | 438,584 | |
U.S. Treasury Bond | | | 6.25 | | | | 5-15-2030 | | | | 478,000 | | | | 737,969 | |
U.S. Treasury Bond | | | 6.38 | | | | 8-15-2027 | | | | 224,000 | | | | 318,421 | |
U.S. Treasury Bond | | | 6.88 | | | | 8-15-2025 | | | | 224,000 | | | | 300,370 | |
U.S. Treasury Note | | | 1.13 | | | | 8-31-2021 | | | | 1,807,000 | | | | 1,830,576 | |
U.S. Treasury Note | | | 1.13 | | | | 9-30-2021 | | | | 2,188,000 | | | | 2,218,085 | |
U.S. Treasury Note | | | 1.25 | | | | 10-31-2021 | | | | 2,188,000 | | | | 2,223,555 | |
U.S. Treasury Note | | | 1.25 | | | | 7-31-2023 | | | | 1,829,000 | | | | 1,885,299 | |
U.S. Treasury Note | | | 1.25 | | | | 8-31-2024 | | | | 1,400,000 | | | | 1,455,453 | |
U.S. Treasury Note | | | 1.38 | | | | 1-31-2022 | | | | 2,315,000 | | | | 2,363,651 | |
U.S. Treasury Note | | | 1.38 | | | | 10-15-2022 | | | | 2,223,000 | | | | 2,285,609 | |
U.S. Treasury Note | | | 1.38 | | | | 6-30-2023 | | | | 1,733,000 | | | | 1,792,910 | |
U.S. Treasury Note | | | 1.38 | | | | 8-31-2023 | | | | 1,817,000 | | | | 1,882,582 | |
U.S. Treasury Note | | | 1.38 | | | | 9-30-2023 | | | | 1,778,000 | | | | 1,843,078 | |
U.S. Treasury Note | | | 1.38 | | | | 1-31-2025 | | | | 2,372,000 | | | | 2,485,226 | |
U.S. Treasury Note | | | 1.38 | | | | 8-31-2026 | | | | 1,787,000 | | | | 1,882,981 | |
U.S. Treasury Note | | | 1.50 | | | | 10-31-2021 | | | | 2,358,000 | | | | 2,405,621 | |
U.S. Treasury Note | | | 1.50 | | | | 11-30-2021 | | | | 2,360,000 | | | | 2,410,150 | |
U.S. Treasury Note | | | 1.50 | | | | 1-31-2022 | | | | 1,625,000 | | | | 1,662,261 | |
U.S. Treasury Note | | | 1.50 | | | | 8-15-2022 | | | | 2,254,000 | | | | 2,322,589 | |
U.S. Treasury Note | | | 1.50 | | | | 9-15-2022 | | | | 2,264,000 | | | | 2,332,804 | |
U.S. Treasury Note | | | 1.50 | | | | 1-15-2023 | | | | 2,250,000 | | | | 2,327,080 | |
U.S. Treasury Note | | | 1.50 | | | | 2-28-2023 | | | | 1,635,000 | | | | 1,693,375 | |
U.S. Treasury Note | | | 1.50 | | | | 3-31-2023 | | | | 1,679,000 | | | | 1,739,929 | |
U.S. Treasury Note | | | 1.50 | | | | 9-30-2024 | | | | 2,442,000 | | | | 2,566,199 | |
U.S. Treasury Note | | | 1.50 | | | | 10-31-2024 | | | | 2,391,000 | | | | 2,514,753 | |
U.S. Treasury Note | | | 1.50 | | | | 11-30-2024 | | | | 2,394,000 | | | | 2,521,275 | |
U.S. Treasury Note | | | 1.50 | | | | 8-15-2026 | | | | 3,430,000 | | | | 3,638,078 | |
U.S. Treasury Note | | | 1.63 | | | | 12-31-2021 | | | | 2,357,000 | | | | 2,414,544 | |
U.S. Treasury Note | | | 1.63 | | | | 8-15-2022 | | | | 1,250,000 | | | | 1,290,625 | |
U.S. Treasury Note | | | 1.63 | | | | 8-31-2022 | | | | 1,827,000 | | | | 1,887,020 | |
U.S. Treasury Note | | | 1.63 | | | | 11-15-2022 | | | | 2,108,000 | | | | 2,182,603 | |
U.S. Treasury Note | | | 1.63 | | | | 12-15-2022 | | | | 2,239,000 | | | | 2,321,301 | |
U.S. Treasury Note | | | 1.63 | | | | 4-30-2023 | | | | 1,711,000 | | | | 1,781,044 | |
U.S. Treasury Note | | | 1.63 | | | | 5-31-2023 | | | | 1,714,000 | | | | 1,785,171 | |
U.S. Treasury Note | | | 1.63 | | | | 10-31-2023 | | | | 1,824,000 | | | | 1,908,075 | |
U.S. Treasury Note | | | 1.63 | | | | 2-15-2026 | | | | 3,342,000 | | | | 3,560,535 | |
U.S. Treasury Note | | | 1.63 | | | | 5-15-2026 | | | | 3,385,000 | | | | 3,612,694 | |
U.S. Treasury Note | | | 1.63 | | | | 9-30-2026 | | | | 1,851,000 | | | | 1,981,293 | |
U.S. Treasury Note | | | 1.63 | | | | 10-31-2026 | | | | 1,800,000 | | | | 1,927,055 | |
U.S. Treasury Note | | | 1.63 | | | | 11-30-2026 | | | | 1,912,000 | | | | 2,048,454 | |
U.S. Treasury Note | | | 1.63 | | | | 8-15-2029 | | | | 2,854,000 | | | | 3,098,931 | |
U.S. Treasury Note | | | 1.75 | | | | 11-30-2021 | | | | 2,003,000 | | | | 2,054,092 | |
U.S. Treasury Note | | | 1.75 | | | | 2-28-2022 | | | | 1,637,000 | | | | 1,684,511 | |
U.S. Treasury Note | | | 1.75 | | | | 3-31-2022 | | | | 1,640,000 | | | | 1,689,841 | |
U.S. Treasury Note | | | 1.75 | | | | 4-30-2022 | | | | 1,612,000 | | | | 1,662,942 | |
U.S. Treasury Note | | | 1.75 | | | | 5-15-2022 | | | | 1,448,000 | | | | 1,495,060 | |
U.S. Treasury Note | | | 1.75 | | | | 5-31-2022 | | | | 1,819,000 | | | | 1,877,975 | |
U.S. Treasury Note | | | 1.75 | | | | 6-15-2022 | | | | 2,235,000 | | | | 2,309,995 | |
U.S. Treasury Note | | | 1.75 | | | | 6-30-2022 | | | | 1,819,000 | | | | 1,881,315 | |
U.S. Treasury Note | | | 1.75 | | | | 7-15-2022 | | | | 2,129,000 | | | | 2,202,517 | |
U.S. Treasury Note | | | 1.75 | | | | 9-30-2022 | | | | 1,771,000 | | | | 1,837,551 | |
U.S. Treasury Note | | | 1.75 | | | | 1-31-2023 | | | | 1,684,000 | | | | 1,753,925 | |
The accompanying notes are an integral part of these financial statements.
Wells Fargo Index Asset Allocation Fund | 21
Portfolio of investments—March 31, 2020 (unaudited)
| | | | | | | | | | | | | | | | |
| | | Interest
rate | | | Maturity
date | | | Principal | | | Value | |
| | | | |
| U.S. Treasury Securities (continued) | | | | | | | | | | | | |
U.S. Treasury Note | | | 1.75 | % | | | 5-15-2023 | | | $ | 3,117,000 | | | $ | 3,257,874 | |
U.S. Treasury Note | | | 1.75 | | | | 6-30-2024 | | | | 2,424,000 | | | | 2,567,168 | |
U.S. Treasury Note | | | 1.75 | | | | 7-31-2024 | | | | 2,406,000 | | | | 2,549,702 | |
U.S. Treasury Note | | | 1.75 | | | | 12-31-2024 | | | | 2,381,000 | | | | 2,535,486 | |
U.S. Treasury Note | | | 1.75 | | | | 12-31-2026 | | | | 1,893,000 | | | | 2,045,032 | |
U.S. Treasury Note | | | 1.75 | | | | 11-15-2029 | | | | 3,007,000 | | | | 3,305,351 | |
U.S. Treasury Note | | | 1.88 | | | | 11-30-2021 | | | | 1,649,000 | | | | 1,694,605 | |
U.S. Treasury Note | | | 1.88 | | | | 1-31-2022 | | | | 1,826,000 | | | | 1,880,994 | |
U.S. Treasury Note | | | 1.88 | | | | 2-28-2022 | | | | 1,725,000 | | | | 1,779,311 | |
U.S. Treasury Note | | | 1.88 | | | | 3-31-2022 | | | | 1,810,000 | | | | 1,869,391 | |
U.S. Treasury Note | | | 1.88 | | | | 4-30-2022 | | | | 1,812,000 | | | | 1,873,509 | |
U.S. Treasury Note | | | 1.88 | | | | 5-31-2022 | | | | 1,795,000 | | | | 1,858,596 | |
U.S. Treasury Note | | | 1.88 | | | | 7-31-2022 | | | | 1,815,000 | | | | 1,882,566 | |
U.S. Treasury Note | | | 1.88 | | | | 8-31-2022 | | | | 1,754,000 | | | | 1,822,447 | |
U.S. Treasury Note | | | 1.88 | | | | 9-30-2022 | | | | 2,248,000 | | | | 2,339,062 | |
U.S. Treasury Note | | | 1.88 | | | | 10-31-2022 | | | | 1,650,000 | | | | 1,718,385 | |
U.S. Treasury Note | | | 1.88 | | | | 8-31-2024 | | | | 1,345,000 | | | | 1,433,686 | |
U.S. Treasury Note | | | 1.88 | | | | 6-30-2026 | | | | 1,825,000 | | | | 1,976,561 | |
U.S. Treasury Note | | | 1.88 | | | | 7-31-2026 | | | | 1,828,000 | | | | 1,983,094 | |
U.S. Treasury Note | | | 2.00 | | | | 8-31-2021 | | | | 1,641,000 | | | | 1,682,538 | |
U.S. Treasury Note | | | 2.00 | | | | 10-31-2021 | | | | 1,649,000 | | | | 1,694,992 | |
U.S. Treasury Note | | | 2.00 | | | | 11-15-2021 | | | | 2,485,000 | | | | 2,557,609 | |
U.S. Treasury Note | | | 2.00 | | | | 12-31-2021 | | | | 1,821,000 | | | | 1,877,195 | |
U.S. Treasury Note | | | 2.00 | | | | 2-15-2022 | | | | 1,679,000 | | | | 1,734,682 | |
U.S. Treasury Note | | | 2.00 | | | | 7-31-2022 | | | | 1,778,000 | | | | 1,851,065 | |
U.S. Treasury Note | | | 2.00 | | | | 10-31-2022 | | | | 2,238,000 | | | | 2,338,011 | |
U.S. Treasury Note | | | 2.00 | | | | 11-30-2022 | | | | 3,346,000 | | | | 3,498,923 | |
U.S. Treasury Note | | | 2.00 | | | | 2-15-2023 | | | | 3,077,000 | | | | 3,228,807 | |
U.S. Treasury Note | | | 2.00 | | | | 4-30-2024 | | | | 1,930,000 | | | | 2,059,596 | |
U.S. Treasury Note | | | 2.00 | | | | 5-31-2024 | | | | 1,934,000 | | | | 2,066,358 | |
U.S. Treasury Note | | | 2.00 | | | | 6-30-2024 | | | | 1,939,000 | | | | 2,073,367 | |
U.S. Treasury Note | | | 2.00 | | | | 2-15-2025 | | | | 3,537,000 | | | | 3,812,085 | |
U.S. Treasury Note | | | 2.00 | | | | 8-15-2025 | | | | 3,491,000 | | | | 3,778,189 | |
U.S. Treasury Note | | | 2.00 | | | | 11-15-2026 | | | | 3,370,000 | | | | 3,689,623 | |
U.S. Treasury Note | | | 2.13 | | | | 8-15-2021 | | | | 2,440,000 | | | | 2,504,622 | |
U.S. Treasury Note | | | 2.13 | | | | 9-30-2021 | | | | 1,633,000 | | | | 1,679,757 | |
U.S. Treasury Note | | | 2.13 | | | | 12-31-2021 | | | | 1,626,000 | | | | 1,679,671 | |
U.S. Treasury Note | | | 2.13 | | | | 5-15-2022 | | | | 2,105,000 | | | | 2,188,953 | |
U.S. Treasury Note | | | 2.13 | | | | 6-30-2022 | | | | 1,615,000 | | | | 1,684,079 | |
U.S. Treasury Note | | | 2.13 | | | | 12-31-2022 | | | | 3,385,000 | | | | 3,556,498 | |
U.S. Treasury Note | | | 2.13 | | | | 11-30-2023 | | | | 1,638,000 | | | | 1,745,558 | |
U.S. Treasury Note | | | 2.13 | | | | 2-29-2024 | | | | 1,298,000 | | | | 1,389,215 | |
U.S. Treasury Note | | | 2.13 | | | | 3-31-2024 | | | | 1,961,000 | | | | 2,100,262 | |
U.S. Treasury Note | | | 2.13 | | | | 7-31-2024 | | | | 1,927,000 | | | | 2,072,729 | |
U.S. Treasury Note | | | 2.13 | | | | 5-15-2025 | | | | 3,005,000 | | | | 3,263,947 | |
U.S. Treasury Note | | | 2.13 | | | | 5-31-2026 | | | | 1,793,000 | | | | 1,968,238 | |
U.S. Treasury Note | | | 2.25 | | | | 7-31-2021 | | | | 1,573,000 | | | | 1,615,889 | |
U.S. Treasury Note | | | 2.25 | | | | 4-15-2022 | | | | 2,204,000 | | | | 2,294,140 | |
U.S. Treasury Note | | | 2.25 | | | | 12-31-2023 | | | | 1,247,000 | | | | 1,336,531 | |
U.S. Treasury Note | | | 2.25 | | | | 1-31-2024 | | | | 1,334,000 | | | | 1,432,070 | |
U.S. Treasury Note | | | 2.25 | | | | 4-30-2024 | | | | 2,418,000 | | | | 2,605,017 | |
U.S. Treasury Note | | | 2.25 | | | | 10-31-2024 | | | | 1,882,000 | | | | 2,042,852 | |
U.S. Treasury Note | | | 2.25 | | | | 11-15-2024 | | | | 3,535,000 | | | | 3,839,065 | |
U.S. Treasury Note | | | 2.25 | | | | 12-31-2024 | | | | 1,911,000 | | | | 2,079,108 | |
U.S. Treasury Note | | | 2.25 | | | | 11-15-2025 | | | | 3,473,000 | | | | 3,814,873 | |
U.S. Treasury Note | | | 2.25 | | | | 3-31-2026 | | | | 1,872,000 | | | | 2,066,366 | |
The accompanying notes are an integral part of these financial statements.
22 | Wells Fargo Index Asset Allocation Fund
Portfolio of investments—March 31, 2020 (unaudited)
| | | | | | | | | | | | | | | | |
| | | Interest
rate | | | Maturity
date | | | Principal | | | Value | |
| | | | |
| U.S. Treasury Securities (continued) | | | | | | | | | | | | |
U.S. Treasury Note | | | 2.25 | % | | | 2-15-2027 | | | $ | 3,350,000 | | | $ | 3,737,867 | |
U.S. Treasury Note | | | 2.25 | | | | 8-15-2027 | | | | 3,338,000 | | | | 3,746,905 | |
U.S. Treasury Note | | | 2.25 | | | | 11-15-2027 | | | | 3,248,000 | | | | 3,653,873 | |
U.S. Treasury Note | | | 2.38 | | | | 3-15-2022 | | | | 2,243,000 | | | | 2,337,101 | |
U.S. Treasury Note | | | 2.38 | | | | 1-31-2023 | | | | 2,325,000 | | | | 2,462,774 | |
U.S. Treasury Note | | | 2.38 | | | | 2-29-2024 | | | | 1,671,000 | | | | 1,805,267 | |
U.S. Treasury Note | | | 2.38 | | | | 8-15-2024 | | | | 3,101,000 | | | | 3,372,338 | |
U.S. Treasury Note | | | 2.38 | | | | 4-30-2026 | | | | 1,812,000 | | | | 2,015,001 | |
U.S. Treasury Note | | | 2.38 | | | | 5-15-2027 | | | | 3,375,000 | | | | 3,808,213 | |
U.S. Treasury Note | | | 2.38 | | | | 5-15-2029 | | | | 4,253,000 | | | | 4,894,273 | |
U.S. Treasury Note | | | 2.50 | | | | 1-15-2022 | | | | 2,241,000 | | | | 2,331,690 | |
U.S. Treasury Note | | | 2.50 | | | | 2-15-2022 | | | | 2,245,000 | | | | 2,340,237 | |
U.S. Treasury Note | | | 2.50 | | | | 3-31-2023 | | | | 2,278,000 | | | | 2,428,562 | |
U.S. Treasury Note | | | 2.50 | | | | 8-15-2023 | | | | 2,662,000 | | | | 2,858,530 | |
U.S. Treasury Note | | | 2.50 | | | | 1-31-2024 | | | | 1,876,000 | | | | 2,031,283 | |
U.S. Treasury Note | | | 2.50 | | | | 5-15-2024 | | | | 3,424,000 | | | | 3,725,740 | |
U.S. Treasury Note | | | 2.50 | | | | 1-31-2025 | | | | 1,936,000 | | | | 2,133,457 | |
U.S. Treasury Note | | | 2.50 | | | | 2-28-2026 | | | | 1,888,000 | | | | 2,109,176 | |
U.S. Treasury Note | | | 2.63 | | | | 12-15-2021 | | | | 2,277,000 | | | | 2,370,215 | |
U.S. Treasury Note | | | 2.63 | | | | 2-28-2023 | | | | 2,359,000 | | | | 2,519,523 | |
U.S. Treasury Note | | | 2.63 | | | | 6-30-2023 | | | | 2,304,000 | | | | 2,477,250 | |
U.S. Treasury Note | | | 2.63 | | | | 12-31-2023 | | | | 2,404,000 | | | | 2,611,157 | |
U.S. Treasury Note | | | 2.63 | | | | 3-31-2025 | | | | 1,884,000 | | | | 2,091,682 | |
U.S. Treasury Note | | | 2.63 | | | | 12-31-2025 | | | | 1,914,000 | | | | 2,148,016 | |
U.S. Treasury Note | | | 2.63 | | | | 1-31-2026 | | | | 1,869,000 | | | | 2,099,924 | |
U.S. Treasury Note | | | 2.63 | | | | 2-15-2029 | | | | 4,451,000 | | | | 5,204,540 | |
U.S. Treasury Note | | | 2.75 | | | | 4-30-2023 | | | | 2,279,000 | | | | 2,451,349 | |
U.S. Treasury Note | | | 2.75 | | | | 5-31-2023 | | | | 2,334,000 | | | | 2,514,703 | |
U.S. Treasury Note | | | 2.75 | | | | 7-31-2023 | | | | 2,347,000 | | | | 2,537,510 | |
U.S. Treasury Note | | | 2.75 | | | | 8-31-2023 | | | | 2,402,000 | | | | 2,600,540 | |
U.S. Treasury Note | | | 2.75 | | | | 11-15-2023 | | | | 3,078,000 | | | | 3,346,604 | |
U.S. Treasury Note | | | 2.75 | | | | 2-15-2024 | | | | 2,325,000 | | | | 2,542,151 | |
U.S. Treasury Note | | | 2.75 | | | | 2-28-2025 | | | | 1,955,000 | | | | 2,179,825 | |
U.S. Treasury Note | | | 2.75 | | | | 6-30-2025 | | | | 1,959,000 | | | | 2,195,457 | |
U.S. Treasury Note | | | 2.75 | | | | 8-31-2025 | | | | 2,020,000 | | | | 2,269,028 | |
U.S. Treasury Note | | | 2.75 | | | | 2-15-2028 | | | | 3,068,000 | | | | 3,578,175 | |
U.S. Treasury Note | | | 2.88 | | | | 10-15-2021 | | | | 2,081,000 | | | | 2,165,785 | |
U.S. Treasury Note | | | 2.88 | | | | 11-15-2021 | | | | 2,137,000 | | | | 2,228,991 | |
U.S. Treasury Note | | | 2.88 | | | | 9-30-2023 | | | | 2,444,000 | | | | 2,663,101 | |
U.S. Treasury Note | | | 2.88 | | | | 10-31-2023 | | | | 2,318,000 | | | | 2,528,159 | |
U.S. Treasury Note | | | 2.88 | | | | 11-30-2023 | | | | 2,370,000 | | | | 2,591,539 | |
U.S. Treasury Note | | | 2.88 | | | | 4-30-2025 | | | | 1,884,000 | | | | 2,117,512 | |
U.S. Treasury Note | | | 2.88 | | | | 5-31-2025 | | | | 1,939,000 | | | | 2,182,360 | |
U.S. Treasury Note | | | 2.88 | | | | 7-31-2025 | | | | 1,949,000 | | | | 2,200,086 | |
U.S. Treasury Note | | | 2.88 | | | | 11-30-2025 | | | | 1,880,000 | | | | 2,132,992 | |
U.S. Treasury Note | | | 2.88 | | | | 8-15-2028 | | | | 3,133,000 | | | | 3,705,996 | |
U.S. Treasury Note | | | 3.00 | | | | 9-30-2025 | | | | 1,994,000 | | | | 2,268,954 | |
U.S. Treasury Note | | | 3.00 | | | | 10-31-2025 | | | | 1,814,000 | | | | 2,068,031 | |
U.S. Treasury Note | | | 3.13 | | | | 11-15-2028 | | | | 4,425,000 | | | | 5,343,879 | |
U.S. Treasury Note | | | 6.00 | | | | 2-15-2026 | | | | 445,000 | | | | 588,008 | |
U.S. Treasury Note | | | 6.25 | | | | 8-15-2023 | | | | 378,000 | | | | 453,718 | |
U.S. Treasury Note | | | 6.50 | | | | 11-15-2026 | | | | 296,000 | | | | 411,694 | |
U.S. Treasury Note | | | 6.63 | | | | 2-15-2027 | | | | 215,000 | | | | 303,864 | |
U.S. Treasury Note | | | 6.75 | | | | 8-15-2026 | | | | 221,000 | | | | 307,717 | |
U.S. Treasury Note | | | 7.13 | | | | 2-15-2023 | | | | 260,000 | | | | 311,066 | |
U.S. Treasury Note | | | 7.25 | | | | 8-15-2022 | | | | 261,000 | | | | 304,330 | |
The accompanying notes are an integral part of these financial statements.
Wells Fargo Index Asset Allocation Fund | 23
Portfolio of investments—March 31, 2020 (unaudited)
| | | | | | | | | | | | | | | | |
| | | Interest
rate | | | Maturity
date | | | Principal | | | Value | |
| | | | |
| U.S. Treasury Securities (continued) | | | | | | | | | | | | |
U.S. Treasury Note | | | 7.50 | % | | | 11-15-2024 | | | $ | 240,000 | | | $ | 318,281 | |
U.S. Treasury Note | | | 7.63 | | | | 11-15-2022 | | | | 140,000 | | | | 166,999 | |
U.S. Treasury Note | | | 7.63 | | | | 2-15-2025 | | | | 216,000 | | | | 291,364 | |
U.S. Treasury Note | | | 8.00 | | | | 11-15-2021 | | | | 511,000 | | | | 575,574 | |
U.S. Treasury Note | | | 8.13 | | | | 8-15-2021 | | | | 175,000 | | | | 194,031 | |
| | | | |
Total U.S. Treasury Securities (Cost $437,273,193) | | | | | | | | | | | | | | | 492,730,269 | |
| | | | | | | | | | | | | | | | |
| | | | |
| | | | | | | | | | | | | | | | |
| | | Yield | | | | | | Shares | | | | |
| Short-Term Investments: 4.37% | | | | | | | | | | | | |
| | | | |
| Investment Companies: 2.98% | | | | | | | | | | | | |
Securities Lending Cash Investments LLC (l)(r)(u) | | | 2.11 | | | | | | | | 341,764 | | | | 341,799 | |
Wells Fargo Government Money Market Fund Select Class (l)(u) | | | 0.35 | | | | | | | | 36,239,663 | | | | 36,239,663 | |
| | | | |
| | | | | | | | | | | | | | | 36,581,462 | |
| | | | | | | | | | | | | | | | |
| | | | |
| | | | | | | | | | | | | | | | |
| | | | | | | | | Principal | | | | |
| U.S. Treasury Securities: 1.39% | | | | | | | | | | | | |
U.S. Treasury Bill (z)# | | | 0.11 | | | | 6-11-2020 | | | $ | 16,976,000 | | | | 16,972,141 | |
| | | | | | | | | | | | | | | | |
| | | | |
Total Short-Term Investments (Cost $53,553,589) | | | | | | | | | | | | | | | 53,553,603 | |
| | | | | | | | | | | | | | | | |
| | | | | | | | |
| Total investments in securities (Cost $829,476,668) | | | 99.96 | % | | | 1,226,165,811 | |
| | |
Other assets and liabilities, net | | | 0.04 | | | | 511,743 | |
| | | | | | | | |
| Total net assets | | | 100.00 | % | | $ | 1,226,677,554 | |
| | | | | | | | |
| † | Non-income-earning security |
| (l) | The issuer of the security is an affiliated person of the Fund as defined in the Investment Company Act of 1940. |
| « | All or a portion of this security is on loan. |
| ± | Variable rate investment. The rate shown is the rate in effect at period end. |
| (r) | The investment is anon-registered investment company purchased with cash collateral received from securities on loan. |
| (u) | The rate represents the7-day annualized yield at period end. |
| (z) | Zero coupon security. The rate represents the current yield to maturity. |
| # | All or a portion of this security is segregated as collateral for investments in derivative instruments. |
Abbreviations:
| FNMA | Federal National Mortgage Association |
| LIBOR | London Interbank Offered Rate |
| REIT | Real estate investment trust |
The accompanying notes are an integral part of these financial statements.
24 | Wells Fargo Index Asset Allocation Fund
Portfolio of investments—March 31, 2020 (unaudited)
Futures Contracts
| | | | | | | | | | | | | | | | | | | | | | | | |
| Description | | Number of
contracts | | | Expiration
date | | | Notional
cost | | | Notional
value | | | Unrealized
gains | | | Unrealized
losses | |
| | | | |
Long | | | | | | | | | | | | | | | | |
| | | | | | |
S&P 500E-Mini Index | | | 738 | | | | 6-19-2020 | | | $ | 88,539,693 | | | $ | 94,821,930 | | | $ | 6,282,237 | | | $ | 0 | |
| | | | | | |
5-Year U.S. Treasury Notes | | | 27 | | | | 6-30-2020 | | | | 3,382,877 | | | | 3,384,703 | | | | 1,826 | | | | 0 | |
| | | | | | | | | | | | | | | | | | | | | | | | |
| | | | | | |
| | | | | | | | | | | | | | | | | | $ | 6,284,063 | | | $ | 0 | |
| | | | | | | | | | | | | | | | | | | | | | | | |
Investments in Affiliates
An affiliated investment is an investment in which the Fund owns at least 5% of the outstanding voting shares of the issuer or as a result of other relationships, such as the Fund and the issuer having the same investment manager. Transactions with issuers that were either affiliated persons of the Fund at the beginning of the period or the end of the period were as follows:
| | | | | | | | | | | | | | | | | | | | | | | | | | | | | | | | | | | | |
| | | Shares,
beginning
of period | | | Shares
purchased | | | Shares
sold | | | Shares,
end of
period | | | Net
realized
gains
(losses) | | | Net
change in
unrealized
gains
(losses) | | | Income
from
affiliated
securities | | | Value,
end of
period | | | % of
net
assets | |
| | | | | | | | | |
| Common Stocks | | | | | | | | | | | | | | | | | | | | | | | | | | | |
Financials | | | | | | | | | | | | | | | | | | | | | | | | | | | | | | | | | | | | |
Banks | | | | | | | | | | | | | | | | | | | | | | | | | | | | | | | | | | | | |
Wells Fargo & Company | | | 129,521 | | | | 2,603 | | | | (9,971 | ) | | | 122,153 | | | $ | 142,561 | | | $ | (2,739,382 | ) | | $ | 126,362 | | | $ | 3,505,791 | | | | 0.29 | % |
| | | | | | | | | | | | | | | | | | | | | | | | | | | | | | | | | | | | |
Short-Term Investments | | | | | | | | | | | | | | | | | | | | | | | | | | | | | | | | | | | | |
Investment Companies | | | | | | | | | | | | | | | | | | | | | | | | | | | | | | | | | | | | |
Securities Lending Cash Investments LLC | | | 819,291 | | | | 16,352,788 | | | | (16,830,315 | ) | | | 341,764 | | | | 172 | | | | 11 | | | | 8,069 | # | | | 341,799 | | | | | |
Wells Fargo Government Money Market Fund Select Class | | | 12,325,531 | | | | 173,314,271 | | | | (149,400,139 | ) | | | 36,239,663 | | | | 0 | | | | 0 | | | | 86,916 | | | | 36,239,663 | | | | | |
| | | | | | | | | |
| | | | | | | | | | | | | | | | | | | | | | | | | | | | | | | 36,581,462 | | | | 2.98 | |
| | | | | | | | | | | | | | | | | | | | | | | | | | | | | | | | | | | | |
| | | | | | | | | | | | | | | | | | $ | 142,733 | | | $ | (2,739,371 | ) | | $ | 221,347 | | | $ | 40,087,253 | | | | 3.27 | % |
| | | | | | | | | | | | | | | | | | | | | | | | | | | | | | | | | | | | |
| # | Amount shown represents income before fees and rebates. |
The accompanying notes are an integral part of these financial statements.
Wells Fargo Index Asset Allocation Fund | 25
Statement of assets and liabilities—March 31, 2020 (unaudited)
| | | | |
| | | | |
| |
Assets | | | | |
Investments in unaffiliated securities (including $334,831 of securities loaned), at value (cost $789,380,798) | | $ | 1,186,078,558 | |
Investments in affiliated securities, at value (cost $40,095,870) | | | 40,087,253 | |
Cash | | | 4,030 | |
Segregated cash for futures contracts | | | 1,072,000 | |
Receivable for investments sold | | | 8,384,640 | |
Receivable for Fund shares sold | | | 1,103,039 | |
Receivable for dividends and interest | | | 3,205,098 | |
Receivable for securities lending income, net | | | 779 | |
Prepaid expenses and other assets | | | 488,878 | |
| | | | |
Total assets | | | 1,240,424,275 | |
| | | | |
| |
Liabilities | | | | |
Payable upon receipt of securities loaned | | | 341,119 | |
Payable for Fund shares redeemed | | | 1,693,004 | |
Payable for daily variation margin on open futures contracts | | | 10,673,106 | |
Management fee payable | | | 592,743 | |
Administration fees payable | | | 199,490 | |
Distribution fee payable | | | 86,214 | |
Trustees’ fees and expenses payable | | | 3,923 | |
Accrued expenses and other liabilities | | | 157,122 | |
| | | | |
Total liabilities | | | 13,746,721 | |
| | | | |
Total net assets | | $ | 1,226,677,554 | |
| | | | |
| |
Net assets consist of | | | | |
Paid-in capital | | $ | 838,090,531 | |
Total distributable earnings | | | 388,587,023 | |
| | | | |
Total net assets | | $ | 1,226,677,554 | |
| | | | |
| |
Computation of net asset value and offering price per share | | | | |
Net assets – Class A | | $ | 765,181,155 | |
Shares outstanding – Class A1 | | | 23,211,031 | |
Net asset value per share – Class A | | | $32.97 | |
Maximum offering price per share – Class A2 | | | $34.98 | |
Net assets – Class C | | $ | 131,365,914 | |
Shares outstanding – Class C1 | | | 6,552,410 | |
Net asset value per share – Class C | | | $20.05 | |
Net assets – Administrator Class | | $ | 219,072,581 | |
Shares outstanding – Administrator Class1 | | | 6,644,517 | |
Net asset value per share – Administrator Class | | | $32.97 | |
Net assets – Institutional Class | | $ | 111,057,904 | |
Shares outstanding – Institutional Class1 | | | 3,372,757 | |
Net asset value per share – Institutional Class | | | $32.93 | |
| 1 | The Fund has an unlimited number of authorized shares. |
| 2 | Maximum offering price is computed as 100/94.25 of net asset value. On investments of $50,000 or more, the offering price is reduced. |
The accompanying notes are an integral part of these financial statements.
26 | Wells Fargo Index Asset Allocation Fund
Statement of operations—six months ended March 31, 2020 (unaudited)
| | | | |
| | | | |
| |
Investment income | | | | |
Dividends | | $ | 8,156,989 | |
Interest | | | 5,536,393 | |
Income from affiliated securities | | | 216,912 | |
| | | | |
Total investment income | | | 13,910,294 | |
| | | | |
| |
Expenses | | | | |
Management fee | | | 4,088,407 | |
Administration fees | | | | |
Class A | | | 881,615 | |
Class C | | | 154,476 | |
Administrator Class | | | 155,138 | |
Institutional Class | | | 81,186 | |
Shareholder servicing fees | | | | |
Class A | | | 1,049,542 | |
Class C | | | 183,901 | |
Administrator Class | | | 298,343 | |
Distribution fee | | | | |
Class C | | | 551,651 | |
Custody and accounting fees | | | 50,136 | |
Professional fees | | | 25,571 | |
Registration fees | | | 50,136 | |
Shareholder report expenses | | | 57,658 | |
Trustees’ fees and expenses | | | 11,029 | |
Other fees and expenses | | | 70,697 | |
| | | | |
Total expenses | | | 7,709,486 | |
Less: Fee waivers and/or expense reimbursements | | | | |
Fund-level | | | (211,576 | ) |
Class A | | | (29,778 | ) |
Administrator Class | | | (74,607 | ) |
| | | | |
Net expenses | | | 7,393,525 | |
| | | | |
Net investment income | | | 6,516,769 | |
| | | | |
| |
Realized and unrealized gains (losses) on investments | | | | |
Net realized gains (losses) on | | | | |
Unaffiliated securities | | | 20,390,054 | |
Affiliated securities | | | 142,733 | |
Futures contracts | | | (7,227,088 | ) |
| | | | |
Net realized gains on investments | | | 13,305,699 | |
| | | | |
| |
Net change in unrealized gains (losses) on | | | | |
Unaffiliated securities | | | (83,772,877 | ) |
Affiiliated securities | | | (2,739,371 | ) |
Futures contracts | | | 7,316,833 | |
| | | | |
Net change in unrealized gains (losses) on investments | | | (79,195,415 | ) |
| | | | |
Net realized and unrealized gains (losses) on investments | | | (65,889,716 | ) |
| | | | |
Net decrease in net assets resulting from operations | | $ | (59,372,947 | ) |
| | | | |
The accompanying notes are an integral part of these financial statements.
Wells Fargo Index Asset Allocation Fund | 27
Statement of changes in net assets
| | | | | | | | | | | | | | | | |
| | | Six months ended
March 31, 2020
(unaudited) | | | Year ended
September 30, 2019 | |
| | | | |
Operations | | | | | | | | | | | | | | | | |
Net investment income | | | | | | $ | 6,516,769 | | | | | | | $ | 12,377,035 | |
Net realized gains on investments | | | | | | | 13,305,699 | | | | | | | | 12,893,012 | |
Net change in unrealized gains (losses) on investments | | | | | | | (79,195,415 | ) | | | | | | | 43,905,080 | |
| | | | |
Net increase (decrease) in net assets resulting from operations | | | | | | | (59,372,947 | ) | | | | | | | 69,175,127 | |
| | | | |
| | | | |
Distributions to shareholders from net investment income and net realized gains | | | | | | | | | | | | | | | | |
Class A | | | | | | | (14,620,886 | ) | | | | | | | (30,578,240 | ) |
Class C | | | | | | | (1,975,075 | ) | | | | | | | (4,678,185 | ) |
Administrator Class | | | | | | | (4,360,867 | ) | | | | | | | (8,535,707 | ) |
Institutional Class | | | | | | | (2,387,883 | ) | | | | | | | (4,671,806 | ) |
| | | | |
Total distributions to shareholders | | | | | | | (23,344,711 | ) | | | | | | | (48,463,938 | ) |
| | | | |
| | | | |
Capital share transactions | | | Shares | | | | | | | | Shares | | | | | |
Proceeds from shares sold | | | | | | | | | | | | | | | | |
Class A | | | 604,994 | | | | 21,492,337 | | | | 1,611,898 | | | | 53,557,954 | |
Class C | | | 633,627 | | | | 13,678,317 | | | | 1,502,173 | | | | 30,141,540 | |
Administrator Class | | | 890,712 | | | | 31,638,818 | | | | 1,697,812 | | | | 56,951,283 | |
Institutional Class | | | 308,876 | | | | 10,811,231 | | | | 1,028,853 | | | | 34,231,892 | |
| | | | |
| | | | | | | 77,620,703 | | | | | | | | 174,882,669 | |
| | | | |
Reinvestment of distributions | | | | | | | | | | | | | | | | |
Class A | | | 405,636 | | | | 14,255,743 | | | | 923,477 | | | | 29,806,219 | |
Class C | | | 81,474 | | | | 1,754,533 | | | | 218,202 | | | | 4,231,633 | |
Administrator Class | | | 123,573 | | | | 4,337,274 | | | | 262,175 | | | | 8,483,181 | |
Institutional Class | | | 46,631 | | | | 1,634,037 | | | | 94,639 | | | | 3,065,617 | |
| | | | |
| | | | | | | 21,981,587 | | | | | | | | 45,586,650 | |
| | | | |
Payment for shares redeemed | | | | | | | | | | | | | | | | |
Class A | | | (1,547,999 | ) | | | (53,997,029 | ) | | | (2,768,227 | ) | | | (92,564,816 | ) |
Class C | | | (916,980 | ) | | | (19,225,393 | ) | | | (2,243,406 | ) | | | (45,218,687 | ) |
Administrator Class | | | (898,232 | ) | | | (31,119,296 | ) | | | (1,685,138 | ) | | | (56,224,079 | ) |
Institutional Class | | | (502,126 | ) | | | (17,312,479 | ) | | | (800,255 | ) | | | (26,710,901 | ) |
| | | | |
| | | | | | | (121,654,197 | ) | | | | | | | (220,718,483 | ) |
| | | | |
Net decrease in net assets resulting from capital share transactions | | | | | | | (22,051,907 | ) | | | | | | | (249,164 | ) |
| | | | |
Total increase (decrease) in net assets | | | | | | | (104,769,565 | ) | | | | | | | 20,462,025 | |
| | | | |
| | | | |
Net assets | | | | | | | | | | | | | | | | |
Beginning of period | | | | | | | 1,331,447,119 | | | | | | | | 1,310,985,094 | |
| | | | |
End of period | | | | | | $ | 1,226,677,554 | | | | | | | $ | 1,331,447,119 | |
| | | | |
The accompanying notes are an integral part of these financial statements.
28 | Wells Fargo Index Asset Allocation Fund
Financial highlights
(For a share outstanding throughout each period)
| | | | | | | | | | | | | | | | | | | | | | | | |
| | | Six months ended
March 31, 2020
(unaudited) | | | Year ended September 30 | |
| CLASS A | | 2019 | | | 2018 | | | 2017 | | | 2016 | | | 2015 | |
Net asset value, beginning of period | | | $35.13 | | | | $34.63 | | | | $31.99 | | | | $29.61 | | | | $28.72 | | | | $28.20 | |
Net investment income | | | 0.18 | | | | 0.33 | | | | 0.27 | | | | 0.25 | | | | 0.22 | | | | 0.27 | |
Net realized and unrealized gains (losses) on investments | | | (1.72 | ) | | | 1.46 | | | | 2.83 | | | | 2.67 | | | | 2.45 | | | | 0.76 | |
| | | | | | | | | | | | | | | | | | | | | | | | |
Total from investment operations | | | (1.54 | ) | | | 1.79 | | | | 3.10 | | | | 2.92 | | | | 2.67 | | | | 1.03 | |
Distributions to shareholders from | | | | | | | | | | | | | | | | | | | | | | | | |
Net investment income | | | (0.16 | ) | | | (0.33 | ) | | | (0.27 | ) | | | (0.27 | ) | | | (0.21 | ) | | | (0.22 | ) |
Net realized gains | | | (0.46 | ) | | | (0.96 | ) | | | (0.19 | ) | | | (0.27 | ) | | | (1.57 | ) | | | (0.29 | ) |
| | | | | | | | | | | | | | | | | | | | | | | | |
Total distributions to shareholders | | | (0.62 | ) | | | (1.29 | ) | | | (0.46 | ) | | | (0.54 | ) | | | (1.78 | ) | | | (0.51 | ) |
Net asset value, end of period | | | $32.97 | | | | $35.13 | | | | $34.63 | | | | $31.99 | | | | $29.61 | | | | $28.72 | |
Total return1 | | | (4.48 | )% | | | 5.54 | % | | | 9.76 | % | | | 9.99 | % | | | 9.68 | % | | | 3.62 | % |
Ratios to average net assets (annualized) | | | | | | | | | | | | | | | | | | | | | | | | |
Gross expenses | | | 1.10 | % | | | 1.11 | % | | | 1.08 | % | | | 1.09 | % | | | 1.10 | % | | | 1.22 | % |
Net expenses | | | 1.07 | % | | | 1.08 | % | | | 1.07 | % | | | 1.09 | % | | | 1.10 | % | | | 1.15 | % |
Net investment income | | | 0.99 | % | | | 0.99 | % | | | 0.80 | % | | | 0.79 | % | | | 0.79 | % | | | 0.90 | % |
Supplemental data | | | | | | | | | | | | | | | | | | | | | | | | |
Portfolio turnover rate | | | 9 | % | | | 14 | % | | | 9 | % | | | 9 | % | | | 8 | % | | | 43 | % |
Net assets, end of period (000s omitted) | | | $765,181 | | | | $834,289 | | | | $830,487 | | | | $822,769 | | | | $828,421 | | | | $736,276 | |
| 1 | Total return calculations do not include any sales charges. Returns for periods of less than one year are not annualized. |
The accompanying notes are an integral part of these financial statements.
Wells Fargo Index Asset Allocation Fund | 29
Financial highlights
(For a share outstanding throughout each period)
| | | | | | | | | | | | | | | | | | | | | | | | |
| | | Six months ended
March 31, 2020
(unaudited) | | | Year ended September 30 | |
| CLASS C | | 2019 | | | 2018 | | | 2017 | | | 2016 | | | 2015 | |
Net asset value, beginning of period | | | $21.36 | | | | $21.07 | | | | $19.45 | | | | $17.99 | | | | $17.47 | | | | $17.20 | |
Net investment income | | | 0.02 | | | | 0.05 | | | | 0.01 | | | | 0.01 | | | | 0.01 | 1 | | | 0.05 | |
Net realized and unrealized gains (losses) on investments | | | (1.03 | ) | | | 0.88 | | | | 1.73 | | | | 1.62 | | | | 1.48 | | | | 0.45 | |
| | | | | | | | | | | | | | | | | | | | | | | | |
Total from investment operations | | | (1.01 | ) | | | 0.93 | | | | 1.74 | | | | 1.63 | | | | 1.49 | | | | 0.50 | |
Distributions to shareholders from | | | | | | | | | | | | | | | | | | | | | | | | |
Net investment income | | | (0.02 | ) | | | (0.06 | ) | | | (0.00 | )2 | | | (0.01 | ) | | | (0.02 | ) | | | (0.05 | ) |
Net realized gains | | | (0.28 | ) | | | (0.58 | ) | | | (0.12 | ) | | | (0.16 | ) | | | (0.95 | ) | | | (0.18 | ) |
| | | | | | | | | | | | | | | | | | | | | | | | |
Total distributions to shareholders | | | (0.30 | ) | | | (0.64 | ) | | | (0.12 | ) | | | (0.17 | ) | | | (0.97 | ) | | | (0.23 | ) |
Net asset value, end of period | | | $20.05 | | | | $21.36 | | | | $21.07 | | | | $19.45 | | | | $17.99 | | | | $17.47 | |
Total return3 | | | (4.85 | )% | | | 4.75 | % | | | 8.97 | % | | | 9.14 | % | | | 8.86 | % | | | 2.86 | % |
Ratios to average net assets (annualized) | | | | | | | | | | | | | | | | | | | | | | | | |
Gross expenses | | | 1.85 | % | | | 1.86 | % | | | 1.83 | % | | | 1.84 | % | | | 1.85 | % | | | 1.98 | % |
Net expenses | | | 1.83 | % | | | 1.83 | % | | | 1.82 | % | | | 1.84 | % | | | 1.85 | % | | | 1.90 | % |
Net investment income | | | 0.23 | % | | | 0.24 | % | | | 0.05 | % | | | 0.04 | % | | | 0.03 | % | | | 0.10 | % |
Supplemental data | | | | | | | | | | | | | | | | | | | | | | | | |
Portfolio turnover rate | | | 9 | % | | | 14 | % | | | 9 | % | | | 9 | % | | | 8 | % | | | 43 | % |
Net assets, end of period (000s omitted) | | | $131,366 | | | | $144,264 | | | | $153,322 | | | | $152,820 | | | | $136,881 | | | | $62,019 | |
| 1 | Calculated based upon average shares outstanding |
| 2 | Amount is less than $0.005. |
| 3 | Total return calculations do not include any sales charges. Returns for periods of less than one year are not annualized. |
The accompanying notes are an integral part of these financial statements.
30 | Wells Fargo Index Asset Allocation Fund
Financial highlights
(For a share outstanding throughout each period)
| | | | | | | | | | | | | | | | | | | | | | | | |
| | | Six months ended
March 31, 2020
(unaudited) | | | Year ended September 30 | |
| ADMINISTRATOR CLASS | | 2019 | | | 2018 | | | 2017 | | | 2016 | | | 2015 | |
Net asset value, beginning of period | | | $35.14 | | | | $34.64 | | | | $31.99 | | | | $29.63 | | | | $28.75 | | | | $28.21 | |
Net investment income | | | 0.21 | | | | 0.39 | | | | 0.32 | | | | 0.30 | | | | 0.28 | | | | 0.35 | |
Net realized and unrealized gains (losses) on investments | | | (1.72 | ) | | | 1.46 | | | | 2.84 | | | | 2.68 | | | | 2.45 | | | | 0.76 | |
| | | | | | | | | | | | | | | | | | | | | | | | |
Total from investment operations | | | (1.51 | ) | | | 1.85 | | | | 3.16 | | | | 2.98 | | | | 2.73 | | | | 1.11 | |
Distributions to shareholders from | | | | | | | | | | | | | | | | | | | | | | | | |
Net investment income | | | (0.20 | ) | | | (0.39 | ) | | | (0.32 | ) | | | (0.35 | ) | | | (0.28 | ) | | | (0.28 | ) |
Net realized gains | | | (0.46 | ) | | | (0.96 | ) | | | (0.19 | ) | | | (0.27 | ) | | | (1.57 | ) | | | (0.29 | ) |
| | | | | | | | | | | | | | | | | | | | | | | | |
Total distributions to shareholders | | | (0.66 | ) | | | (1.35 | ) | | | (0.51 | ) | | | (0.62 | ) | | | (1.85 | ) | | | (0.57 | ) |
Net asset value, end of period | | | $32.97 | | | | $35.14 | | | | $34.64 | | | | $31.99 | | | | $29.63 | | | | $28.75 | |
Total return1 | | | (4.42 | )% | | | 5.73 | % | | | 9.94 | % | | | 10.20 | % | | | 9.91 | % | | | 3.89 | % |
Ratios to average net assets (annualized) | | | | | | | | | | | | | | | | | | | | | | | | |
Gross expenses | | | 1.03 | % | | | 1.03 | % | | | 1.00 | % | | | 0.99 | % | | | 1.02 | % | | | 1.09 | % |
Net expenses | | | 0.90 | % | | | 0.90 | % | | | 0.90 | % | | | 0.90 | % | | | 0.90 | % | | | 0.90 | % |
Net investment income | | | 1.16 | % | | | 1.17 | % | | | 0.97 | % | | | 0.96 | % | | | 0.98 | % | | | 1.12 | % |
Supplemental data | | | | | | | | | | | | | | | | | | | | | | | | |
Portfolio turnover rate | | | 9 | % | | | 14 | % | | | 9 | % | | | 9 | % | | | 8 | % | | | 43 | % |
Net assets, end of period (000s omitted) | | | $219,073 | | | | $229,390 | | | | $216,611 | | | | $268,512 | | | | $206,908 | | | | $85,380 | |
| 1 | Returns for periods of less than one year are not annualized. |
The accompanying notes are an integral part of these financial statements.
Wells Fargo Index Asset Allocation Fund | 31
Financial highlights
(For a share outstanding throughout each period)
| | | | | | | | | | | | | | | | |
| | | Six months ended
March 31, 2020
(unaudited) | | | Year ended September 30 | |
| INSTITUTIONAL CLASS | | 2019 | | | 2018 | | | 20171 | |
Net asset value, beginning of period | | | $35.09 | | | | $34.59 | | | | $31.96 | | | | $29.27 | |
Net investment income | | | 0.23 | | | | 0.44 | | | | 0.39 | | | | 0.35 | |
Net realized and unrealized gains (losses) on investments | | | (1.71 | ) | | | 1.46 | | | | 2.81 | | | | 3.03 | |
| | | | | | | | | | | | | | | | |
Total from investment operations | | | (1.48 | ) | | | 1.90 | | | | 3.20 | | | | 3.38 | |
Distributions to shareholders from | | | | | | | | | | | | | | | | |
Net investment income | | | (0.22 | ) | | | (0.44 | ) | | | (0.38 | ) | | | (0.42 | ) |
Net realized gains | | | (0.46 | ) | | | (0.96 | ) | | | (0.19 | ) | | | (0.27 | ) |
| | | | | | | | | | | | | | | | |
Total distributions to shareholders | | | (0.68 | ) | | | (1.40 | ) | | | (0.57 | ) | | | (0.69 | ) |
Net asset value, end of period | | | $32.93 | | | | $35.09 | | | | $34.59 | | | | $31.96 | |
Total return2 | | | (4.32 | )% | | | 5.89 | % | | | 10.11 | % | | | 11.70 | % |
Ratios to average net assets (annualized) | | | | | | | | | | | | | | | | |
Gross expenses | | | 0.77 | % | | | 0.78 | % | | | 0.75 | % | | | 0.74 | % |
Net expenses | | | 0.75 | % | | | 0.75 | % | | | 0.74 | % | | | 0.74 | % |
Net investment income | | | 1.31 | % | | | 1.32 | % | | | 1.13 | % | | | 1.08 | % |
Supplemental data | | | | | | | | | | | | | | | | |
Portfolio turnover rate | | | 9 | % | | | 14 | % | | | 9 | % | | | 9 | % |
Net assets, end of period (000s omitted) | | | $111,058 | | | | $123,504 | | | | $110,566 | | | | $61,060 | |
| 1 | For the period from October 31, 2016 (commencement of class operations) to September 30, 2017 |
| 2 | Returns for periods of less than one year are not annualized. |
The accompanying notes are an integral part of these financial statements.
32 | Wells Fargo Index Asset Allocation Fund
Notes to financial statements (unaudited)
1. ORGANIZATION
Wells Fargo Funds Trust (the “Trust”), a Delaware statutory trust organized on March 10, 1999, is anopen-end management investment company registered under the Investment Company Act of 1940, as amended (the “1940 Act”). As an investment company, the Trust follows the accounting and reporting guidance in Financial Accounting Standards Board (“FASB”)Accounting Standards Codification Topic 946, Financial Services – Investment Companies. These financial statements report on the Wells Fargo Index Asset Allocation Fund (the “Fund”) which is a diversified series of the Trust.
2. SIGNIFICANT ACCOUNTING POLICIES
The following significant accounting policies, which are consistently followed in the preparation of the financial statements of the Fund, are in conformity with U.S. generally accepted accounting principles which require management to make estimates and assumptions that affect the reported amounts of assets and liabilities, disclosure of contingent assets and liabilities at the date of the financial statements, and the reported amounts of revenues and expenses during the reporting period. Actual results could differ from those estimates.
Securities valuation
All investments are valued each business day as of the close of regular trading on the New York Stock Exchange (generally 4 p.m. Eastern Time), although the Fund may deviate from this calculation time under unusual or unexpected circumstances.
Equity securities and futures contracts that are listed on a foreign or domestic exchange or market are valued at the official closing price or, if none, the last sales price. If no sale occurs on the principal exchange or market that day, a fair value price will be determined in accordance with the Fund’s Valuation Procedures.
Debt securities are valued at the evaluated bid price provided by an independent pricing service (e.g. taking into account various factors, including yields, maturities, or credit ratings) or, if a reliable price is not available, the quoted bid price from an independent broker-dealer.
Investments in registeredopen-end investment companies are valued at net asset value. Interests innon-registered investment companies that are redeemable at net asset value are fair valued normally at net asset value.
Investments which are not valued using any of the methods discussed above are valued at their fair value, as determined in good faith by the Board of Trustees of the Fund. The Board of Trustees has established a Valuation Committee comprised of the Trustees and has delegated to it the authority to take any actions regarding the valuation of portfolio securities that the Valuation Committee deems necessary or appropriate, including determining the fair value of portfolio securities, unless the determination has been delegated to the Wells Fargo Asset Management Pricing Committee at Wells Fargo Funds Management, LLC (“Funds Management”). The Board of Trustees retains the authority to make or ratify any valuation decisions or approve any changes to the Valuation Procedures as it deems appropriate. On a quarterly basis, the Board of Trustees receives reports on any valuation actions taken by the Valuation Committee or the Wells Fargo Asset Management Pricing Committee which may include items for ratification.
Securities lending
The Fund may lend its securities from time to time in order to earn additional income in the form of fees or interest on securities received as collateral or the investment of any cash received as collateral. When securities are on loan, the Fund receives interest or dividends on those securities. Cash collateral received in connection with its securities lending transactions is invested in Securities Lending Cash Investments, LLC (the “Securities Lending Fund”). Investments in Securities Lending Fund are valued at the evaluated bid price provided by an independent pricing service. Income earned from investment in the Securities Lending Fund (net of fees and rebates), if any, is included in income from affiliated securities on the Statement of Operations.
In a securities lending transaction, the net asset value of the Fund is affected by an increase or decrease in the value of the securities loaned and by an increase or decrease in the value of the instrument in which collateral is invested. The amount of securities lending activity undertaken by the Fund fluctuates from time to time. The Fund has the right under the lending agreement to recover the securities from the borrower on demand. In the event of default or bankruptcy by the borrower, the Fund may be prevented from recovering the loaned securities or gaining access to the collateral or may experience delays or costs in doing so. In such an event, the terms of the agreement allow the unaffiliated securities lending agent to use the collateral to purchase replacement securities on behalf of the Fund or pay the Fund the market value of the loaned securities. The Fund bears the risk of loss with respect to depreciation of its investment of the cash collateral.
Wells Fargo Index Asset Allocation Fund | 33
Notes to financial statements (unaudited)
Futures contracts
Futures contracts are agreements between the Fund and a counterparty to buy or sell a specific amount of a commodity, financial instrument or currency at a specified price and on a specified date. The Fund may buy and sell futures contracts in order to gain exposure to, or protect against, changes in interest rates and security values and is subject to interest rate risk and equity price risk. The primary risks associated with the use of futures contracts are the imperfect correlation between changes in market values of securities held by the Fund and the prices of futures contracts, and the possibility of an illiquid market. Futures contracts are generally entered into on a regulated futures exchange and cleared through a clearinghouse associated with the exchange. With futures contracts, there is minimal counterparty risk to the Fund since futures contracts are exchange traded and the exchange’s clearinghouse, as the counterparty to all exchange traded futures, guarantees the futures contracts against default.
Upon entering into a futures contracts, the Fund is required to deposit either cash or securities (initial margin) with the broker in an amount equal to a certain percentage of the contract value. Subsequent payments (variation margin) are paid to or from the broker each day equal to the daily changes in the contract value. Such payments are recorded as unrealized gains or losses and, if any, shown as variation margin receivable (payable) in the Statement of Assets and Liabilities. Should the Fund fail to make requested variation margin payments, the broker can gain access to the initial margin to satisfy the Fund’s payment obligations. When the contracts are closed, a realized gain or loss is recorded in the Statement of Operations.
Security transactions and income recognition
Securities transactions are recorded on a trade date basis. Realized gains or losses are recorded on the basis of identified cost.
Dividend income is recognized on theex-dividend date.
Interest income is accrued daily and bond discounts are accreted and premiums are amortized daily. To the extent debt obligations are placed onnon-accrual status, any related interest income may be reduced by writing off interest receivables when the collection of all or a portion of interest has been determined to be doubtful based on consistently applied procedures and the fair value has decreased. If the issuer subsequently resumes interest payments or when the collectability of interest is reasonably assured, the debt obligation is removed fromnon-accrual status.
Distributions to shareholders
Distributions to shareholders are recorded on theex-dividend date and paid from net investment income quarterly and any net realized gains are paid at least annually. Such distributions are determined in accordance with income tax regulations and may differ from U.S. generally accepted accounting principles. Dividend sources are estimated at the time of declaration. The tax character of distributions is determined as of the Fund’s fiscal year end. Therefore, a portion of the Fund’s distributions made prior to the Fund’s fiscal year end may be categorized as a tax return of capital at year end.
Federal and other taxes
The Fund intends to continue to qualify as a regulated investment company by distributing substantially all of its investment company taxable income and any net realized capital gains (after reduction for capital loss carryforwards) sufficient to relieve it from all, or substantially all, federal income taxes. Accordingly, no provision for federal income taxes was required.
The Fund’s income and federal excise tax returns and all financial records supporting those returns for the prior three fiscal years are subject to examination by the federal and Delaware revenue authorities. Management has analyzed the Fund’s tax positions taken on federal, state, and foreign tax returns for all open tax years and does not believe that there are any uncertain tax positions that require recognition of a tax liability.
As of March 31, 2020, the aggregate cost of all investments for federal income tax purposes was $830,702,384 and the unrealized gains (losses) consisted of:
| | | | |
| |
Gross unrealized gains | | $ | 409,665,885 | |
| |
Gross unrealized losses | | | (7,918,395 | ) |
| |
Net unrealized gains | | $ | 401,747,490 | |
Class allocations
The separate classes of shares offered by the Fund differ principally in applicable sales charges, distribution, shareholder servicing, and administration fees. Class specific expenses are charged directly to that share class. Investment income, common fund-level expenses, and realized and unrealized gains (losses) on investments are allocated daily to each class of shares based on the relative proportion of net assets of each class.
34 | Wells Fargo Index Asset Allocation Fund
Notes to financial statements (unaudited)
3. FAIR VALUATION MEASUREMENTS
Fair value measurements of investments are determined within a framework that has established a fair value hierarchy based upon the various data inputs utilized in determining the value of the Fund’s investments. The three-level hierarchy gives the highest priority to unadjusted quoted prices in active markets for identical assets or liabilities (Level 1) and the lowest priority to unobservable inputs (Level 3). The Fund’s investments are classified within the fair value hierarchy based on the lowest level of input that is significant to the fair value measurement. The inputs are summarized into three broad levels as follows:
| ∎ | | Level 1 – quoted prices in active markets for identical securities |
| ∎ | | Level 2 – other significant observable inputs (including quoted prices for similar securities, interest rates, prepayment speeds, credit risk, etc.) |
| ∎ | | Level 3 – significant unobservable inputs (including the Fund’s own assumptions in determining the fair value of investments) |
The inputs or methodologies used for valuing investments in securities are not necessarily an indication of the risk associated with investing in those securities.
The following is a summary of the inputs used in valuing the Fund’s assets and liabilities as of March 31, 2020:
| | | | | | | | | | | | | | | | |
| | | | |
| | | Quoted prices
(Level 1) | | | Other significant
observable inputs
(Level 2) | | | Significant
unobservable inputs
(Level 3) | | | Total | |
| | | | |
Assets | | | | | | | | | | | | | | | | |
Investments in: | | | | | | | | | | | | | | | | |
| | | | |
Agency securities | | $ | 0 | | | $ | 39,821 | | | $ | 0 | | | $ | 39,821 | |
| | | | |
Common stocks | | | | | | | | | | | | | | | | |
| | | | |
Communication services | | | 73,050,454 | | | | 0 | | | | 0 | | | | 73,050,454 | |
| | | | |
Consumer discretionary | | | 66,615,077 | | | | 0 | | | | 0 | | | | 66,615,077 | |
| | | | |
Consumer staples | | | 52,981,533 | | | | 0 | | | | 0 | | | | 52,981,533 | |
| | | | |
Energy | | | 17,999,188 | | | | 0 | | | | 0 | | | | 17,999,188 | |
| | | | |
Financials | | | 74,400,116 | | | | 0 | | | | 0 | | | | 74,400,116 | |
| | | | |
Health care | | | 104,680,124 | | | | 0 | | | | 0 | | | | 104,680,124 | |
| | | | |
Industrials | | | 55,906,037 | | | | 0 | | | | 0 | | | | 55,906,037 | |
| | | | |
Information technology | | | 173,230,272 | | | | 0 | | | | 0 | | | | 173,230,272 | |
| | | | |
Materials | | | 16,550,694 | | | | 0 | | | | 0 | | | | 16,550,694 | |
| | | | |
Real estate | | | 20,169,516 | | | | 0 | | | | 0 | | | | 20,169,516 | |
| | | | |
Utilities | | | 24,253,251 | | | | 0 | | | | 0 | | | | 24,253,251 | |
| | | | |
Non-agency mortgage-backed securities | | | 0 | | | | 5,856 | | | | 0 | | | | 5,856 | |
| | | | |
U.S. Treasury securities | | | 492,730,269 | | | | 0 | | | | 0 | | | | 492,730,269 | |
| | | | |
Short-term investments | | | | | | | | | | | | | | | | |
| | | | |
Investment companies | | | 36,581,462 | | | | 0 | | | | 0 | | | | 36,581,462 | |
| | | | |
U.S. Treasury securities | | | 16,972,141 | | | | 0 | | | | | | | | 16,972,141 | |
| | | | |
| | | 1,226,120,134 | | | | 45,677 | | | | 0 | | | | 1,226,165,811 | |
| | | | |
Futures contracts | | | 6,284,063 | | | | 0 | | | | 0 | | | | 6,284,063 | |
| | | | |
Total assets | | $ | 1,232,404,197 | | | $ | 45,677 | | | $ | 0 | | | $ | 1,232,449,874 | |
Additional sector, industry or geographic detail is included in the Portfolio of Investments.
Futures contracts are reported at their cumulative unrealized gains (losses) at measurement date as reported in the table following the Portfolio of Investments. For futures contracts, the current day’s variation margin is reported on the Statement of Assets and Liabilities. All other assets and liabilities are reported at their market value at measurement date.
For the six months ended March 31, 2020, the Fund did not have any transfers into/out of Level 3.
Wells Fargo Index Asset Allocation Fund | 35
Notes to financial statements (unaudited)
4. TRANSACTIONS WITH AFFILIATES
Management fee
Funds Management, an indirect wholly owned subsidiary of Wells Fargo & Company (“Wells Fargo”), is the manager of the Fund and provides advisory and fund-level administrative services under an investment management agreement. Under the investment management agreement, Funds Management is responsible for, among other services, implementing the investment objectives and strategies of the Fund, supervising the subadviser and providing fund-level administrative services in connection with the Fund’s operations. As compensation for its services under the investment management agreement, Funds Management is entitled to receive a management fee at the following annual rate based on the Fund’s average daily net assets:
| | | | |
| |
| Average daily net assets | | Management fee | |
| |
First $500 million | | | 0.650 | % |
| |
Next $500 million | | | 0.600 | |
| |
Next $2 billion | | | 0.550 | |
| |
Next $2 billion | | | 0.525 | |
| |
Next $5 billion | | | 0.490 | |
| |
Over $10 billion | | | 0.480 | |
For the six months ended March 31, 2020, the management fee was equivalent to an annual rate of 0.61% of the Fund’s average daily net assets.
Funds Management has retained the services of a subadviser to provide daily portfolio management to the Fund. The fee for subadvisory services is borne by Funds Management. Wells Capital Management Incorporated (“WellsCap”), an affiliate of Funds Management and an indirect wholly owned subsidiary of Wells Fargo, is the subadviser to the Fund and is entitled to receive a fee from Funds Management at an annual rate starting at 0.15% and declining to 0.10% as the average daily net assets of the Fund increase.
Administration fees
Under a class-level administration agreement, Funds Management provides class-level administrative services to the Fund, which includes paying fees and expenses for services provided by the transfer agent,sub-transfer agents, omnibus account servicers and record-keepers. As compensation for its services under the class-level administration agreement, Funds Management receives an annual fee which is calculated based on the average daily net assets of each class as follows:
| | | | |
| |
| | | Class-level
administration fee | |
| |
Class A, Class C | | | 0.21 | % |
| |
Administrator Class, Institutional Class | | | 0.13 | |
Waivers and/or expense reimbursements
Funds Management has contractually waived and/or reimbursed management and administration fees to the extent necessary to maintain certain net operating expense ratios for the Fund. When each class of the Fund has exceeded its expense cap, Funds Management has waived fees and/or reimbursed expenses from fund-level expenses on a proportionate basis and then from class specific expenses. When only certain classes exceed their expense caps, waivers and/or reimbursements are applied against class specific expenses before fund-level expenses. Funds Management has committed through January 31, 2021 to waive fees and/or reimburse expenses to the extent necessary to cap the Fund’s expenses at 1.08% for Class A shares, 1.83% for Class C shares, 0.90% for Administrator Class shares, and 0.75% for Institutional Class shares. Prior to or after the commitment expiration date, the cap may be increased or the commitment to maintain the cap may be terminated only with the approval of the Board of Trustees.
Distribution fee
The Trust has adopted a distribution plan for Class C shares of the Fund pursuant to Rule12b-1 under the 1940 Act. A distribution fee is charged to Class C shares and paid to Wells Fargo Funds Distributor, LLC (“Funds Distributor”), the principal underwriter, at an annual rate of 0.75% of the average daily net assets of Class C shares.
36 | Wells Fargo Index Asset Allocation Fund
Notes to financial statements (unaudited)
In addition, Funds Distributor is entitled to receive thefront-end sales charge from the purchase of Class A shares and a contingent deferred sales charge on the redemption of certain Class A shares. Funds Distributor is also entitled to receive the contingent deferred sales charges from redemptions of Class C shares. For the six months ended March 31, 2020, Funds Distributor received $40,906 from the sale of Class A shares. No contingent deferred sales charges were incurred by Class A and Class C shares for the six months ended March 31, 2020.
Shareholder servicing fees
The Trust has entered into contracts with one or more shareholder servicing agents, whereby Class A, Class C, and Administrator Class of the Fund are charged a fee at an annual rate of 0.25% of the average daily net assets of each respective class. A portion of these total shareholder servicing fees were paid to affiliates of Wells Fargo.
Interfund transactions
The Fund may purchase or sell portfolio investment securities to certain other Wells Fargo affiliates pursuant to Rule17a-7 under the 1940 Act and under procedures adopted by the Board of Trustees. The procedures have been designed to ensure that these interfund transactions, which do not incur broker commissions, are effected at current market prices.
5. INVESTMENT PORTFOLIO TRANSACTIONS
Purchases and sales of investments, excluding short-term securities, for the six months ended March 31, 2020 were as follows:
| | | | | | |
Purchases at cost | | Sales proceeds |
U.S.
government | | Non-U.S.
government | | U.S.
government | | Non-U.S.
government |
| $67,350,826 | | $49,508,814 | | $125,946,898 | | $65,795,163 |
6. SECURITIES LENDING TRANSACTIONS
The Fund lends its securities through an unaffiliated securities lending agent and receives collateral in the form of cash or securities with a value at least equal to the value of the securities on loan. The value of the loaned securities is determined at the close of each business day and any increases or decreases in the required collateral are exchanged between the Fund and the counterparty on the next business day. Cash collateral received is invested in the Securities Lending Fund which seeks to provide a positive return compared to the daily Fed Funds Open Rate by investing in high-quality, U.S. dollar-denominated short-term money market instruments and is exempt from registration under Section 3(c)(7) of the 1940 Act. Securities Lending Fund is managed by Funds Management and is subadvised by WellsCap. Funds Management receives an advisory fee starting at 0.05% and declining to 0.01% as the average daily net assets of the Securities Lending Fund increase. All of the fees received by Funds Management are paid to WellsCap for its services as subadviser.
In the event of counterparty default or the failure of a borrower to return a loaned security, the Fund has the right to use the collateral to offset any losses incurred. As of March 31, 2020, the Fund had securities lending transaction with the following counterparty which is subject to offset:
| | | | | | | | |
| | | |
| Counterparty | | Value of
securities on
loan | | Collateral
received1 | | Net amount | |
| | | |
Barclays Capital Incorporated | | $334,831 | | $(334,831) | | $ | 0 | |
| 1 | Collateral received within this table is limited to the collateral for the net transaction with the counterparty. |
7. DERIVATIVE TRANSACTIONS
During the six months ended March 31, 2020, the Fund entered into futures contracts to manage the duration of the portfolio and to gain market exposure to certain asset classes by implementing tactical asset allocation shifts. The Fund had an average notional amount of $114,479,696 in long futures contracts and $15,503,450 in short futures contracts during the six months ended March 31, 2020.
A summary of the location of derivative instruments on the financial statements by primary risk exposure is outlined following tables.
Wells Fargo Index Asset Allocation Fund | 37
Notes to financial statements (unaudited)
The fair value of derivative instruments as of March 31, 2020 by risk type was as follows for the Fund:
| | | | | | | | | | | | |
| | | Asset derivatives | | | Liability derivatives | |
| | | | |
| | | Statement of Assets and
Liabilities location | | Fair value | | | Statement of Assets and
Liabilities location | | Fair value | |
| | | | |
Equity risk | | Unrealized gains on futures contracts | | $ | 6,282,237 | * | | Unrealized losses on futures contracts | | $ | 0 | * |
| | | | |
Interest rate risk | | Unrealized gains on futures contracts | | | 1,826 | * | | Unrealized losses on futures contracts | | | 0 | * |
| | | | |
| | | | | $ | 6,284,063 | | | | | $ | 0 | |
| * | Amount represents cumulative unrealized gains (losses) as reported in the table following the Portfolio of Investments. Only the current day’s variation margin as of March 31, 2020 is reported separately on the Statement of Assets and Liabilities. |
The effect of derivative instruments on the Statement of Operations for the six months ended March 31, 2020 was as follows for the Fund:
| | | | | | | | |
| | |
| | | Amount of realized
losses on
derivatives | | | Change in unrealized
gains on derivatives | |
| | |
Equity risk | | $ | (5,921,270 | ) | | $ | 5,922,957 | |
| | |
Interest rate risk | | | (1,305,818 | ) | | | 1,393,876 | |
| | |
| | | $ | (7,227,088 | ) | | $ | 7,316,833 | |
8. BANK BORROWINGS
The Trust (excluding the money market funds), Wells Fargo Master Trust and Wells Fargo Variable Trust are parties to a $280,000,000 revolving credit agreement whereby the Fund is permitted to use bank borrowings for temporary or emergency purposes, such as to fund shareholder redemption requests. Interest under the credit agreement is charged to the Fund based on a borrowing rate equal to the higher of the Federal Funds rate in effect on that day plus 1.25% or the overnight LIBOR rate in effect on that day plus 1.25%. In addition, an annual commitment fee equal to 0.25% of the unused balance is allocated to each participating fund.
For the six months ended March 31, 2020, there were no borrowings by the Fund under the agreement.
9. INDEMNIFICATION
Under the Trust’s organizational documents, the officers and Trustees have been granted certain indemnification rights against certain liabilities that may arise out of performance of their duties to the Trust. Additionally, in the normal course of business, the Trust may enter into contracts with service providers that contain a variety of indemnification clauses. The Trust’s maximum exposure under these arrangements is dependent on future claims that may be made against the Fund and, therefore, cannot be estimated.
10. NEW ACCOUNTING PRONOUNCEMENTS
In August 2018, FASB issued Accounting Standards Update (“ASU”)No. 2018-13, Fair Value Measurement (Topic 820)Disclosure Framework—Changes to the Disclosure Requirements for Fair Value Measurement. ASU2018-13 updates the disclosure requirements for fair value measurements by modifying or removing certain disclosures and adding certain new disclosures. The amendments are effective for fiscal years, and interim periods within those fiscal years, beginning after December 15, 2019. Early adoption is permitted. Management has adopted the removal and modification of disclosures early, as permitted, and will adopt the additional new disclosures at the effective date.
In March 2017, FASB issued ASUNo. 2017-08,Premium Amortization on Purchased Callable Debt Securities. ASU2017-08 shortens the amortization period for certain callable debt securities held at a premium and requires the premium to be amortized to the earliest call date. The amendments do not require an accounting change for securities held at a discount and discounts will continue to be accreted to the maturity date of the security. ASU2017-08 is effective for fiscal years beginning after December 15, 2018 and for interim periods within those fiscal years. During the current reporting period, management of the Fund adopted the change in accounting policy which did not have a material impact to the Fund’s financial statements.
38 | Wells Fargo Index Asset Allocation Fund
Notes to financial statements (unaudited)
11. CORONAVIRUS(COVID-19) PANDEMIC
On March 11, 2020, the World Health Organization announced that it had made the assessment that coronavirus disease 2019(“COVID-19”) is a pandemic. The impacts ofCOVID-19 are adversely affecting the entire global economy, individual companies and investment products, and the market in general. There is significant uncertainty around the extent and duration of business disruptions related toCOVID-19 and the impacts may be short term or may last for an extended period of time. The risk of further spreading ofCOVID-19 has led to significant uncertainty and volatility in the financial markets. The value of the Fund and the securities in which the Fund invests have generally been adversely affected by impacts caused byCOVID-19.
Wells Fargo Index Asset Allocation Fund | 39
Other information (unaudited)
PROXY VOTING INFORMATION
A description of the policies and procedures used to determine how to vote proxies relating to portfolio securities is available, upon request, by calling1-800-222-8222, visiting our website atwfam.com, or visiting the SEC website at sec.gov. Information regarding how the proxies related to portfolio securities were voted during the most recent12-month period ended June 30 is available on the website atwfam.comor by visiting the SEC website at sec.gov.
QUARTERLY PORTFOLIO HOLDINGS INFORMATION
The Fund files its complete schedule of portfolio holdings with the SEC for the first and third quarters of each fiscal year as an exhibit to its reports on FormN-PORT. Shareholders may view the filed FormN-PORT by visiting the SEC website at sec.gov.
40 | Wells Fargo Index Asset Allocation Fund
Other information (unaudited)
BOARD OF TRUSTEES AND OFFICERS
Each of the Trustees and Officers1 listed in the table below acts in identical capacities for each fund in the Wells Fargo family of funds, which consists of 147 mutual funds comprising the Wells Fargo Funds Trust, Wells Fargo Variable Trust, Wells Fargo Master Trust and fourclosed-end funds (collectively the “Fund Complex”). This table should be read in conjunction with the Prospectus and the Statement of Additional Information2. The mailing address of each Trustee and Officer is 525 Market Street, 12th Floor, San Francisco, CA 94105. Each Trustee and Officer serves an indefinite term, however, each Trustee serves such term until reaching the mandatory retirement age established by the Trustees.
Independent Trustees
| | | | | | |
Name and year of birth | | Position held and
length of service* | | Principal occupations during past five years or longer | | Current other
public company or
investment
company
directorships |
| | | |
William R. Ebsworth (Born 1957) | | Trustee, since 2015 | | Retired. From 1984 to 2013, equities analyst, portfolio manager, research director and chief investment officer at Fidelity Management and Research Company in Boston, Tokyo, and Hong Kong, and retired in 2013 as Chief Investment Officer of Fidelity Strategic Advisers, Inc. where he led a team of investment professionals managing client assets. Prior thereto, Board member of Hong Kong Securities Clearing Co., Hong Kong Options Clearing Corp., the Thailand International Fund, Ltd., Fidelity Investments Life Insurance Company, and Empire Fidelity Investments Life Insurance Company. Audit Committee Chair and Investment Committee Chair of the Vincent Memorial Hospital Endowment(non-profit organization). Mr. Ebsworth is a CFA® charterholder. | | N/A |
| | | |
Jane A. Freeman (Born 1953) | | Trustee, since 2015; Chair Liaison, since 2018 | | Retired. From 2012 to 2014 and 1999 to 2008, Chief Financial Officer of Scientific Learning Corporation. From 2008 to 2012, Ms. Freeman provided consulting services related to strategic business projects. Prior to 1999, Portfolio Manager at Rockefeller & Co. and Scudder, Stevens & Clark. Board member of the Harding Loevner Funds from 1996 to 2014, serving as both Lead Independent Director and chair of the Audit Committee. Board member of the Russell Exchange Traded Funds Trust from 2011 to 2012 and the chair of the Audit Committee. Ms. Freeman is a Board Member of The Ruth Bancroft Garden(non-profit organization). She is also an inactive Chartered Financial Analyst. | | N/A |
| | | |
Isaiah Harris, Jr. (Born 1952) | | Trustee, since 2009; Audit Committee Chairman, since 2019 | | Retired. Chairman of the Board of CIGNA Corporation since 2009, and Director since 2005. From 2003 to 2011, Director of Deluxe Corporation. Prior thereto, President and CEO of BellSouth Advertising and Publishing Corp. from 2005 to 2007, President and CEO of BellSouth Enterprises from 2004 to 2005 and President of BellSouth Consumer Services from 2000 to 2003. Emeritus member of the Iowa State University Foundation Board of Governors. Emeritus Member of the Advisory Board of Iowa State University School of Business. Advisory Board Member, Palm Harbor Academy (private school). Advisory Board Member, Child Evangelism Fellowship(non-profit). Mr. Harris is a certified public accountant (inactive status). | | CIGNA Corporation |
| | | |
Judith M. Johnson (Born 1949) | | Trustee, since 2008; Audit Committee Chairman, from 2009 to 2018 | | Retired. Prior thereto, Chief Executive Officer and Chief Investment Officer of Minneapolis Employees Retirement Fund from 1996 to 2008. Ms. Johnson is an attorney, certified public accountant and a certified managerial accountant. | | N/A |
Wells Fargo Index Asset Allocation Fund | 41
Other information (unaudited)
| | | | | | |
Name and year of birth | | Position held and
length of service* | | Principal occupations during past five years or longer | | Current other
public company or
investment
company
directorships |
| | | |
David F. Larcker (Born 1950) | | Trustee, since 2009 | | James Irvin Miller Professor of Accounting at the Graduate School of Business, Stanford University, Director of the Corporate Governance Research Initiative and Senior Faculty of The Rock Center for Corporate Governance since 2006. From 2005 to 2008, Professor of Accounting at the Graduate School of Business, Stanford University. Prior thereto, Ernst & Young Professor of Accounting at The Wharton School, University of Pennsylvania from 1985 to 2005. | | N/A |
| | | |
Olivia S. Mitchell (Born 1953) | | Trustee, since 2006; Nominating and Governance Committee Chair, since 2018 | | International Foundation of Employee Benefit Plans Professor, Wharton School of the University of Pennsylvania since 1993. Director of Wharton’s Pension Research Council and Boettner Center on Pensions & Retirement Research, and Research Associate at the National Bureau of Economic Research. Previously, Cornell University Professor from 1978 to 1993. | | N/A |
| | | |
Timothy J. Penny (Born 1951) | | Trustee, since 1996; Chairman, since 2018 | | President and Chief Executive Officer of Southern Minnesota Initiative Foundation, anon-profit organization, since 2007. Member of the Board of Trustees of NorthStar Education Finance, Inc., anon-profit organization, since 2007. | | N/A |
| | | |
James G. Polisson (Born 1959) | | Trustee, since 2018 | | Retired. Chief Marketing Officer, Source (ETF) UK Services, Ltd, from 2015 to 2017. From 2012 to 2015, Principal of The Polisson Group, LLC, a management consulting, corporate advisory and principal investing company. Chief Executive Officer and Managing Director at Russell Investments, Global Exchange Traded Funds from 2010 to 2012. Managing Director of Barclays Global Investors from 1998 to 2010 and Global Chief Marketing Officer for iShares and Barclays Global Investors from 2000 to 2010. Trustee of the San Francisco Mechanics’ Institute, anon-profit organization, from 2013 to 2015. Board member of the Russell Exchange Traded Fund Trust from 2011 to 2012. Director of Barclays Global Investors Holdings Deutschland GmbH from 2006 to 2009. Mr. Polisson is an attorney and has a retired status with the Massachusetts and District of Columbia Bar Associations. | | N/A |
| | | |
Pamela Wheelock3 (Born 1959) | | Trustee, since January 2020; previously Trustee from January 2018 to July 2019 | | Board member of the Destination Medical Center Economic Development Agency, Rochester, Minnesota since 2019. Acting Commissioner, Minnesota Department of Human Services, July 2019 through September 2019. Human Services Manager (part-time), Minnesota Department of Human Services, October 2019 through December 2019. Chief Operating Officer, Twin Cities Habitat for Humanity from 2017 to 2019. Vice President of University Services, University of Minnesota from 2012 to 2016. Prior thereto, on the Board of Directors, Governance Committee and Finance Committee for the Minnesota Philanthropy Partners (Saint Paul Foundation) from 2012 to 2018, Interim Chief Executive Officer of Blue Cross Blue Shield of Minnesota from 2011 to 2012, Chairman of the Board from 2009 to 2012 and Board Director from 2003 to 2015. Vice President, Leadership and Community Engagement, Bush Foundation, Saint Paul, Minnesota (a private foundation) from 2009 to 2011. Executive Vice President and Chief Financial Officer, Minnesota Sports and Entertainment from 2004 to 2009 and Senior Vice President from 2002 to 2004. Executive Vice President of the Minnesota Wild Foundation from 2004 to 2008. Commissioner of Finance, State of Minnesota, from 1999 to 2002. Currently Board Chair of the Minnesota Wild Foundation since 2010. | | N/A |
| * | Length of service dates reflect the Trustee’s commencement of service with the Trust’s predecessor entities, where applicable. |
42 | Wells Fargo Index Asset Allocation Fund
Other information (unaudited)
Officers
| | | | |
Name and year of birth | | Position held and
length of service | | Principal occupations during past five years or longer |
| | |
Andrew Owen (Born 1960) | | President, since 2017 | | Executive Vice President of Wells Fargo & Company and Head of Affiliated Managers, Wells Fargo Asset Management, since 2014. In addition, Mr. Owen is currently President, Chief Executive Officer and Director of Wells Fargo Funds Management, LLC since 2017. Prior thereto, Executive Vice President responsible for marketing, investments and product development for Wells Fargo Funds Management, LLC, from 2009 to 2014. |
| | |
Jeremy DePalma1 (Born 1974) | | Treasurer, since 2012 | | Senior Vice President of Wells Fargo Funds Management, LLC since 2009. Senior Vice President of Evergreen Investment Management Company, LLC from 2008 to 2010 and head of the Fund Reporting and Control Team within Fund Administration from 2005 to 2010. |
| | |
Michelle Rhee (Born 1966) | | Chief Legal Officer, since 2019 | | Secretary of Wells Fargo Funds Management, LLC, Chief Legal Counsel of Wells Fargo Asset Management and Assistant General Counsel of Wells Fargo Bank, N.A. since 2018. Associate General Counsel and Managing Director of Bank of America Corporation from 2004 to 2018. |
| | |
Catherine Kennedy (Born 1969) | | Secretary, since 2019 | | Vice President of Wells Fargo Funds Management, LLC and Senior Counsel of the Wells Fargo Legal Department since 2010. Vice President and Senior Counsel of Evergreen Investment Management Company, LLC from 1998 to 2010. |
| | |
Michael H. Whitaker (Born 1967) | | Chief Compliance Officer, since 2016 | | Chief Compliance Officer of Wells Fargo Asset Management since 2016. Senior Vice President and Chief Compliance Officer for Fidelity Investments from 2007 to 2016. |
| | |
David Berardi (Born 1975) | | Assistant Treasurer, since 2009 | | Vice President of Wells Fargo Funds Management, LLC since 2009. Vice President of Evergreen Investment Management Company, LLC from 2008 to 2010. Manager of Fund Reporting and Control for Evergreen Investment Management Company, LLC from 2004 to 2010. |
| 1 | Jeremy DePalma acts as Treasurer of 82 funds and Assistant Treasurer of 65 funds in the Fund Complex. |
| 2 | The Statement of Additional Information includes additional information about the Trustees and is available, without charge, upon request, by calling1-800-222-8222 or by visiting the website atwfam.com. |
| 3 | Pamela Wheelock wasre-appointed to the Board effective January 1, 2020. |
Wells Fargo Index Asset Allocation Fund | 43
Appendix I (unaudited)
Effective on or about May 1, 2020, if you purchase Fund shares through a Janney Montgomery Scott LLC (“Janney”) brokerage account, you will be eligible for the following load waivers (front-end sales charge waivers and contingent deferred sales charge (“CDSC”), or back-end sales charge, waivers) and discounts, which may differ from those disclosed elsewhere in the Fund’s Prospectus or SAI.
|
|
| Front-end sales charge* waivers on Class A shares available at Janney |
|
| Shares purchased through reinvestment of capital gains distributions and dividend reinvestment when purchasing shares of the same fund (but not any other fund within the fund family). |
|
| Shares purchased by employees and registered representatives of Janney or its affiliates and their family members as designated by Janney. |
|
| Shares purchased from the proceeds of redemptions within the same fund family, provided (1) the repurchase occurs within ninety (90) days following the redemption, (2) the redemption and purchase occur in the same account, and (3) redeemed shares were subject to a front-end or deferred sales load (i.e., right of reinstatement). |
|
| Employer-sponsored retirement plans (e.g., 401(k) plans, 457 plans, employer-sponsored 403(b) plans, profit sharing and money purchase pension plans and defined benefit plans). For purposes of this provision, employer-sponsored retirement plans do not include SEP IRAs, Simple IRAs, SAR-SEPs or Keogh plans. |
|
| Shares acquired through a right of reinstatement. |
|
| Class C shares that are no longer subject to a contingent deferred sales charge and are converted to Class A shares of the same fund pursuant to Janney’s policies and procedures. |
|
| CDSC waivers on Class A and Class C shares available at Janney |
|
| Shares sold upon the death or disability of the shareholder. |
|
| Shares sold as part of a systematic withdrawal plan as described in the Fund’s Prospectus. |
|
| Shares purchased in connection with a return of excess contributions from an IRA account. |
|
| Shares sold as part of a required minimum distribution for IRA and retirement accounts if the redemption is taken in or after the year the shareholder reaches qualified age based on applicable IRS regulations. |
|
| Shares sold to pay Janney fees but only if the transaction is initiated by Janney. |
|
| Shares acquired through a right of reinstatement. |
|
| Shares exchanged into the same share class of a different fund. |
|
| Front-end sales charge* discounts available at Janney; breakpoints, rights of accumulation and/or letters of intent |
|
| Breakpoints as described in the Fund’s Prospectus. |
|
| Rights of accumulation (“ROA”), which entitle shareholders to breakpoint discounts, will be automatically calculated based on the aggregated holding of fund family assets held by accounts within the purchaser’s household at Janney. Eligible fund family assets not held at Janney may be included in the ROA calculation only if the shareholder notifies his or her financial advisor about such assets. |
|
| Letters of intent which allow for breakpoint discounts based on anticipated purchases within a fund family, over a 13-month time period. Eligible fund family assets not held at Janney Montgomery Scott may be included in the calculation of letters of intent only if the shareholder notifies his or her financial advisor about such assets. |
| * | Also referred to as an “initial sales charge.” |
44 | Wells Fargo Index Asset Allocation Fund
Appendix II (unaudited)
Effective on or after May 1, 2020, clients of Edward Jones (also referred to as “shareholders”) purchasing Fund shares on the Edward Jones commission and fee-based platforms are eligible only for the following sales charge discounts (also referred to as “breakpoints”) and waivers, which can differ from breakpoints and waivers described elsewhere in this Prospectus or SAI or through another broker-dealer. In all instances, it is the shareholder’s responsibility to inform Edward Jones at the time of purchase of any relationship, holdings of Wells Fargo Funds or other facts qualifying the purchaser for breakpoints or waivers. Edward Jones can ask for documentation of such circumstance.
|
| Breakpoints available at Edward Jones |
|
| Rights of Accumulation (ROA) |
|
The applicable sales charge on a purchase of Class A shares is determined by taking into account all share classes (except any money market funds and retirement plan share classes) of Wells Fargo Funds held by the shareholder or in an account grouped by Edward Jones with other accounts for the purpose of providing certain pricing considerations (“pricing groups”). This includes all share classes held on the Edward Jones platform and/or held on another platform. The inclusion of eligible fund family assets in the rights of accumulation calculation is dependent on the shareholder notifying his or her financial advisor of such assets at the time of calculation. |
|
ROA is determined by calculating the higher of cost or market value (current shares x NAV). |
|
| Letter of Intent (LOI) |
|
Through a LOI, shareholders can receive the sales charge and breakpoint discounts for purchases shareholders intend to makeover a 13-month period from the date Edward Jones receives the LOI. The LOI is determined by calculating the higher of cost or market value of qualifying holdings at LOI initiation in combination with the value that the shareholder intends to buy over a 13-month period to calculate the front-end sales charge and any breakpoint discounts. Each purchase the shareholder makes during that 13-month period will receive the sales charge and breakpoint discount that applies to the total amount. The inclusion of eligible fund family assets in the LOI calculation is dependent on the shareholder notifying his or her financial advisor of such assets at the time of calculation. Purchases made before the LOI is received by Edward Jones are not covered under the LOI and will not reduce the sales charge previously paid. Sales charges will be adjusted if LOI is not met. |
| Sales charges are waived for the following shareholders and in the following situations at Edward Jones: |
● Associates of Edward Jones and its affiliates and their family members who are in the same pricing group (as determined by Edward Jones under its policies and procedures) as the associate. This waiver will continue for the remainder of the associate’s life if the associate retires from Edward Jones in good-standing. |
● Shares purchased in an Edward Jones fee-based program. |
● Shares purchased through reinvestment of capital gains distributions and dividend reinvestment. |
● Shares purchased from the proceeds of redeemed shares of the same fund family so long as the following conditions are met: 1)the proceeds are from the sale of shares within 60 days of the purchase, and 2) the sale and purchase are made in the same share class and the same account or the purchase is made in an individual retirement account with proceeds from liquidations in anon-retirement account. |
● Shares exchanged into Class A shares from another share class so long as the exchange is into the same fund and was initiated at the discretion of Edward Jones. Edward Jones is responsible for any remaining CDSC due to the fund company, if applicable. Any future purchases are subject to the applicable sales charge as disclosed in the prospectus. |
● Exchanges from Class C shares to Class A shares of the same fund, generally, in the 84th month following the anniversary of the purchase date or earlier at the discretion of Edward Jones. |
If the shareholder purchases shares that are subject to a CDSC and those shares are redeemed before the CDSC is expired, the shareholder is
responsible to pay the CDSC except in the following conditions available at Edward Jones: |
● The death or disability of the shareholder. |
● Systematic withdrawals with up to 10% per year of the account value. |
● Return of excess contributions from an Individual Retirement Account (IRA). |
● Shares sold as part of a required minimum distribution for IRA and retirement accounts if the redemption is taken in or after the year the shareholder reaches qualified age based on applicable IRS regulation. |
● Shares sold to pay Edward Jones fees or costs in such cases where the transaction is initiated by Edward Jones. |
● Shares exchanged in an Edward Jones fee-based program. |
● Shares acquired through NAV reinstatement. |
Wells Fargo Index Asset Allocation Fund | 45
Appendix II (unaudited)
|
| Other Important Information for accounts at Edward Jones: |
Minimum Purchase Amounts ● $250 initial purchase minimum ● $50 subsequent purchase minimum |
Minimum Balances Edward Jones has the right to redeem at its discretion fund holdings with a balance of $250 or less. The following are examples of accounts that are not included in this policy: ● A fee-based account held on an Edward Jones platform ● A 529 account held on an Edward Jones platform ● An account with an active systematic investment plan or letter of intent (LOI) |
Changing Share Classes At any time it deems necessary, Edward Jones has the authority to exchange at NAV a shareholder’s holdings in a fund to Class A shares. |
46 | Wells Fargo Index Asset Allocation Fund
This page is intentionally left blank.
This page is intentionally left blank.

For more information
More information about Wells Fargo Funds is available free upon request. To obtain literature, please write, visit the Fund’s website, or call:
Wells Fargo Funds
P.O. Box 219967
Kansas City, MO 64121-9967
Website:wfam.com
Individual investors:1-800-222-8222
Retail investment professionals:1-888-877-9275
Institutional investment professionals:1-866-765-0778

This report and the financial statements contained herein are submitted for the general information of the shareholders of the Fund. If this report is used for promotional purposes, distribution of the report must be accompanied or preceded by a current prospectus. Before investing, please consider the investment objectives, risks, charges, and expenses of the investment. For a current prospectus and, if available, a summary prospectus, containing this information, call1-800-222-8222 or visit the Fund’s website atwfam.com. Read the prospectus carefully before you invest or send money.
Wells Fargo Asset Management (WFAM) is the trade name for certain investment advisory/management firms owned by Wells Fargo & Company. These firms include but are not limited to Wells Capital Management Incorporated and Wells Fargo Funds Management, LLC. Certain products managed by WFAM entities are distributed by Wells Fargo Funds Distributor, LLC (a broker-dealer and Member FINRA).
This material is for general informational and educational purposes only and is NOT intended to provide investment advice or a recommendation of any kind—including a recommendation for any specific investment, strategy, or plan.
INVESTMENT PRODUCTS: NOT FDIC INSURED ◾ NO BANK GUARANTEE ◾ MAY LOSE VALUE
© 2020 Wells Fargo & Company. All rights reserved.
PAR-0420-06223 05-20
SA227/SAR227 03-20
Semi-Annual Report
March 31, 2020
Wells Fargo C&B Mid Cap Value Fund
Beginning on January 1, 2021, as permitted by new regulations adopted by the Securities and Exchange Commission, paper copies of the Wells Fargo Funds’ annual and semi-annual shareholder reports issued after this date will no longer be sent by mail, unless you specifically request paper copies of the reports. Instead, the reports will be made available on the Funds’ website, and you will be notified by mail each time a report is posted and provided with a website address to access the report.
If you already elected to receive shareholder reports electronically, you will not be affected by this change and you need not take any action. You may elect to receive shareholder reports and other communications from the Fund electronically at any time by contacting your financial intermediary (such as a broker-dealer or bank) or, if you are a direct investor, by calling1-800-222-8222 or by enrolling at wellsfargo.com/advantagedelivery.
You may elect to receive all future reports in paper free of charge. If you invest through a financial intermediary, you can contact your financial intermediary to request that you continue to receive paper copies of your shareholder reports; if you invest directly with the Fund, you can call 1-800-222-8222. Your election to receive reports in paper will apply to all Wells Fargo Funds held in your account with your financial intermediary or, if you are a direct investor, to all Wells Fargo Funds that you hold.
|
|
|
Reduce clutter. Save trees. |
Sign up for electronic delivery of prospectuses and shareholder reports atwellsfargo.com/advantagedelivery |
The views expressed and any forward-looking statements are as of March 31, 2020, unless otherwise noted, and are those of the Fund managers and/or Wells Fargo Asset Management. Discussions of individual securities, or the markets generally, or any Wells Fargo Fund are not intended as individual recommendations. Future events or results may vary significantly from those expressed in any forward-looking statements. The views expressed are subject to change at any time in response to changing circumstances in the market. Wells Fargo Asset Management and the Fund disclaim any obligation to publicly update or revise any views expressed or forward-looking statements.
INVESTMENT PRODUCTS: NOT FDIC INSURED ◾ NO BANK GUARANTEE ◾ MAY LOSE VALUE
Wells Fargo C&B Mid Cap Value Fund | 1
Letter to shareholders (unaudited)

Andrew Owen
President
Wells Fargo Funds
“The period began with mixed data, leading to central bank support. ”
Dear Shareholder:
We are pleased to offer you this semi-annual report for the Wells Fargo C&B Mid Cap Value Fund for thesix-month period that ended March 31, 2020. Global stock markets saw earlier gains erased in February and March as governments took unprecedented measures to stop the spread of the coronavirus at the expense of short-term economic output.Fixed-income markets were less battered, with U.S. government bonds achieving modest gains as central banks attempted to bolster capital markets and confidence.
For the period, U.S. stocks, based on the S&P 500 Index,1 returned-12.31% and international stocks, as measured by the MSCI ACWI ex USA Index (Net),2 fell 16.52%. The MSCI EM Index (Net)3 lost 14.55%. For bond investors, the Bloomberg Barclays U.S. Aggregate Bond Index4 added 3.33%, the Bloomberg Barclays Global Aggregateex-USD Index5 returned-2.03%, the Bloomberg Barclays Municipal Bond Index6 gained a modest 0.10%, and the ICE BofA U.S. High Yield Index7 returned-10.86%.
The period began with mixed data, leading to central bank support.
As the fourth quarter of 2019 started, U.S.-China trade tensions were relaxing while optimism grew for a U.K. Brexit deal. The initial estimate of U.S. third-quarter gross domestic product growth was a resilient 1.9% annualized rate, while the U.S. unemployment rate fell to a50-year low of 3.5% in September. Despite resilience among U.S. consumers, however, business confidence declined while manufacturing activity contracted. Concerned with a potential economic slowdown, the U.S. Federal Reserve (Fed) lowered interest rates a quarter point in late October—its third rate cut in four months. This helped push the S&P 500 Index to anall-time high while emerging market equities rallied and global bonds declined overall, reflecting a broad pickup in risk appetite.
Equity markets rallied in November despite ongoing geopolitical risks. Hopes for aU.S.-China trade deal buoyed investor confidence. U.S. business sentiment edged up, and manufacturing and services activity rose. With that positive backdrop, developed market equities outpaced those in emerging markets, and U.S. stocks outperformednon-U.S. stocks overall. While consumer confidence and purchasing manager activity rose in the eurozone, China reported weakening manufacturing and consumer data. Bond yields rose marginally, leading to slightly negative returns for global government and investment-grade corporate bonds.
Financial markets ended 2019 with a boost from the U.S. and China accord on a Phase One trade deal. That, along with the landslide win by thepro-Brexit U.K. Conservative
| 1 | The S&P 500 Index consists of 500 stocks chosen for market size, liquidity, and industry group representation. It is a market-value-weighted index with each stock’s weight in the index proportionate to its market value. You cannot invest directly in an index. |
| 2 | The Morgan Stanley Capital International (MSCI) All Country World Index (ACWI) ex USA Index (Net) is a free-float-adjustedmarket-capitalization-weighted index that is designed to measure the equity market performance of developed markets, excluding the United States. Source: MSCI. MSCI makes no express or implied warranties or representations and shall have no liability whatsoever with respect to any MSCI data contained herein. The MSCI data may not be further redistributed or used as a basis for other indices or any securities or financial products. This report is not approved, reviewed, or produced by MSCI. You cannot invest directly in an index. |
| 3 | The MSCI Emerging Markets (EM) Index (Net) is a free-float-adjusted market-capitalization-weighted index that is designed to measure equity market performance of emerging markets. You cannot invest directly in an index. |
| 4 | The Bloomberg Barclays U.S. Aggregate Bond Index is a broad-based benchmark that measures the investment-grade, U.S. dollar-denominated, fixed-rate taxable bond market, including Treasuries, government-related and corporate securities, mortgage-backed securities (agency fixed-rate and hybrid adjustable-rate mortgage pass-throughs), asset-backed securities, and commercialmortgage-backed securities. You cannot invest directly in an index. |
| 5 | The Bloomberg Barclays Global Aggregateex-USD Index is an unmanaged index that provides a broad-based measure of the global investment-grade fixed-income markets excluding the U.S. dollar-denominated debt market. You cannot invest directly in an index. |
| 6 | The Bloomberg Barclays Municipal Bond Index is an unmanaged index composed of long-termtax-exempt bonds with a minimum credit rating of Baa. You cannot invest directly in an index. |
| 7 | The ICE BofA U.S. High Yield Index is a market-capitalization-weighted index of domestic and Yankee high-yield bonds. The index tracks the performance of high-yield securities traded in the U.S. bond market. You cannot invest directly in an index. Copyright 2020. ICE Data Indices, LLC. All rights reserved. |
2 | Wells Fargo C&B Mid Cap Value Fund
Letter to shareholders (unaudited)
Party in a national election and ongoing central bank support, gave investors greater confidence. U.S. economic indicators were positive overall, with the exception of manufacturing activity and business confidence. Consumer confidence was resilient, fed by a robust labor market, tame inflation, and lower interest rates, which boosted housing affordability and stimulated homebuyer activity. The impeachment of U.S. President Donald Trump had little impact on markets. Meanwhile, slowing Chinese economic activity, partly attributable to the trade war, led to further government stimulus atyear-end through lower reserve ratios, allowing banks to lend more money.
Theyear-end rally continued in early January 2020. However, capital market volatility spiked in late January on concerns over the potential impact of the coronavirus on the global economy and stock markets. With sentiment somewhat souring, perceived safe havens did well in January. The U.S. dollar and Japanese yen both rose, and government bonds outperformed equities. While the S&P 500 Index held its ground, emerging market equities tumbled, including those in Asia.
In February, the coronavirus became the major market focus. Fears of the virus’s impact on global growth led to expectations of increased global central bank monetary policy support. That led the10-year U.S. Treasury yield to fall to anall-time low of 1.1% by the end of the month. Although equity markets initially shrugged off concerns about the outbreak, focusing instead on strong fourth-quarter earnings and improving business confidence in January, market sentiment turned sharply lower towardmonth- end. Oil prices tumbled as Russia and the Organization of the Petroleum Exporting Countries compounded a major decline in oil demand with a brutal price war, causing the price of West Texas Intermediate crude oil to fall 13% in February alone.
The global spread of the coronavirus led many countries to clamp down on social and business-related activity in order to contain the virus from causing even greater devastation and overwhelming the health care system. This abrupt stoppage of economic activity led to the sharp deceleration of global output, sending economies into a deep contraction. Central bank responses were swift, as they slashed interest rates and expanded quantitative easing programs to restore liquidity and confidence to the markets. In the U.S., the Fed launched several lending programs, funding investment-grade bonds, money market mutual funds, and commercial paper while purchasing Treasuries, mortgage-backed securities, and overnight repos. Meanwhile, stock markets tumbled quickly into a bear market, ending the longest bull stock market in U.S. history.
Don’t let short-term uncertainty derail long-term investment goals.
Periods of investment uncertainty can present challenges, but experience has taught us that maintaining long-term investment goals can be an effective way to plan for the future. To help you create a sound strategy based on your personal goals and risk tolerance, Wells Fargo Funds offers more than 100 mutual funds spanning a wide range of asset classes and investment styles. Although diversification cannot guarantee an investment profit or prevent losses, we believe it can be an effective way to manage investment risk and potentially smooth out overall portfolio performance. We encourage investors to know their investments and to understand that appropriate levels of risk-taking may unlock opportunities.
Thank you for choosing to invest with Wells Fargo Funds. We appreciate your confidence in us and remain committed to helping you meet your financial needs.
Sincerely,

Andrew Owen
President
Wells Fargo Funds
“Capital market volatility spiked in late January on concerns over the potential impact of the coronavirus on the global economy and stock markets.”
|
|
|
For further information about your Fund, contact your investment professional, visit our website at wfam.com, or call us directly at1-800-222-8222. |
Wells Fargo C&B Mid Cap Value Fund | 3
Performance highlights (unaudited)
Investment objective
The Fund seeks long-term total return (current income and capital appreciation), consistent with minimizing risk to principal.
Manager
Wells Fargo Funds Management, LLC
Subadviser
Cooke and Bieler, L.P.
Portfolio managers
Andrew B. Armstrong, CFA®‡
Wesley Lim, CFA®‡
Steve Lyons, CFA®‡
Michael M. Meyer, CFA®‡
Edward W. O’Connor, CFA®‡
R. James O’Neil, CFA®‡
Mehul Trivedi, CFA®‡
William Weber, CFA®‡
Average annual total returns (%) as of March 31, 2020
| | | | | | | | | | | | | | | | | | | | | | | | | | | | | | | | | | |
| | | | |
| | | | | Including sales charge | | | Excluding sales charge | | | Expense ratios1 (%) | |
| | | | | | | | | |
| | | Inception date | | 1 year | | | 5 year | | | 10 year | | | 1 year | | | 5 year | | | 10 year | | | Gross | | | Net2 | |
| | | | | | | | | | |
| Class A (CBMAX) | | 7-26-2004 | | | -27.14 | | | | -0.73 | | | | 6.63 | | | | -22.71 | | | | 0.46 | | | | 7.26 | | | | 1.30 | | | | 1.26 | |
| | | | | | | | | | |
| Class C (CBMCX) | | 7-26-2004 | | | -24.28 | | | | -0.29 | | | | 6.46 | | | | -23.28 | | | | -0.29 | | | | 6.46 | | | | 2.05 | | | | 2.01 | |
| | | | | | | | | | |
| Class R6 (CBMYX)3 | | 7-31-2018 | | | – | | | | – | | | | – | | | | -22.36 | | | | 0.84 | | | | 7.62 | | | | 0.87 | | | | 0.81 | |
| | | | | | | | | | |
| Administrator Class (CBMIX) | | 7-26-2004 | | | – | | | | – | | | | – | | | | -22.62 | | | | 0.56 | | | | 7.33 | | | | 1.22 | | | | 1.16 | |
| | | | | | | | | | |
| Institutional Class (CBMSX) | | 7-26-2004 | | | – | | | | – | | | | – | | | | -22.42 | | | | 0.81 | | | | 7.60 | | | | 0.97 | | | | 0.91 | |
| | | | | | | | | | |
| Russell Midcap® Value Index4 | | – | | | – | | | | – | | | | – | | | | -24.13 | | | | -0.76 | | | | 7.22 | | | | – | | | | – | |
Figures quoted represent past performance, which is no guarantee of future results, and do not reflect taxes that a shareholder may pay on an investment in a fund. Investment return and principal value of an investment will fluctuate so that an investor’s shares, when redeemed, may be worth more or less than their original cost. Performance shown without sales charges would be lower if sales charges were reflected. Current performance may be lower or higher than the performance data quoted, which assumes the reinvestment of dividends and capital gains. Currentmonth-end performance is available on the Fund’s website, wfam.com.
Index returns do not include transaction costs associated with buying and selling securities, any mutual fund fees or expenses, or any taxes. It is not possible to invest directly in an index.
For Class A shares, the maximumfront-end sales charge is 5.75%. For Class C shares, the maximum contingent deferred sales charge is 1.00%. Performance including a contingent deferred sales charge assumes the sales charge for the corresponding time period. Class R6, Administrator Class, and Institutional Class shares are sold without afront-end sales charge or contingent deferred sales charge.
Stock values fluctuate in response to the activities of individual companies and general market and economic conditions. Smaller-company stocks tend to be more volatile and less liquid than those of larger companies. Consult the Fund’s prospectus for additional information on these and other risks.
Please see footnotes on page 5.
4 | Wells Fargo C&B Mid Cap Value Fund
Performance highlights (unaudited)
| | | | |
| |
| Ten largest holdings (%) as of March 31, 20205 | | | |
| | |
Helen of Troy Limited | | | 3.35 | |
| | |
Hill-Rom Holdings Incorporated | | | 3.13 | |
| | |
Arrow Electronics Incorporated | | | 3.05 | |
| | |
Colfax Corporation | | | 3.01 | |
| | |
FirstCash Financial Services Incorporated | | | 2.94 | |
| | |
Perrigo Company plc | | | 2.82 | |
| | |
The Progressive Corporation | | | 2.71 | |
| | |
TCF Financial Corporation | | | 2.70 | |
| | |
Integra LifeSciences Holdings Corporation | | | 2.66 | |
| | |
TE Connectivity Limited | | | 2.57 | |
|
|
| Sector distribution as of March 31, 20206 |
|
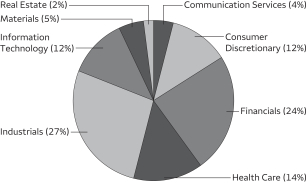 |
| ‡ | CFA® and Chartered Financial Analyst®are trademarks owned by CFA Institute. |
| 1 | Reflects the expense ratios as stated in the most recent prospectuses, which include the impact of 0.01% in acquired fund fees and expenses. The expense ratios shown are subject to change and may differ from the annualized expense ratios shown in the financial highlights of this report, which do not include acquired fund fees and expenses. |
| 2 | The manager has contractually committed through January 31, 2021, to waive fees and/or reimburse expenses to the extent necessary to cap total annual fund operating expenses after fee waivers at 1.25% for Class A, 2.00% for Class C, 0.80% for Class R6, 1.15% for Administrator Class, and 0.90% for Institutional Class. Brokerage commissions, stamp duty fees, interest, taxes, acquired fund fees and expenses (if any), and extraordinary expenses are excluded from the expense cap. Prior to or after the commitment expiration date, the cap may be increased or the commitment to maintain the cap may be terminated only with the approval of the Board of Trustees. Without this cap, the Fund’s returns would have been lower. The expense ratio paid by an investor is the net expense ratio (the total annual fund operating expenses after fee waivers) as stated in the prospectuses. |
| 3 | Historical performance shown for the Class R6 shares prior to their inception reflects the performance of the Institutional Class shares, and includes the higher expenses applicable to Institutional Class shares. If these expenses had not been included, returns for the Class R6 would be higher. |
| 4 | The Russell Midcap®Value Index measures the performance of those Russell Midcap companies with lower price/book ratios and lower forecasted growth values. The stocks are also members of the Russell 1000® Value Index. You cannot invest directly in an index. |
| 5 | The ten largest holdings, excluding cash, cash equivalents and any money market funds, are calculated based on the value of the investments divided by total net assets of the Fund. Holdings are subject to change and may have changed since the date specified. |
| 6 | Amounts are calculated based on the total long-term investments of the Fund. These amounts are subject to change and may have changed since the date specified. |
Wells Fargo C&B Mid Cap Value Fund | 5
Fund expenses (unaudited)
As a shareholder of the Fund, you incur two types of costs: (1) transaction costs, including sales charges (loads) on purchase payments and contingent deferred sales charges (if any) on redemptions and (2) ongoing costs, including management fees, distribution(12b-1) and/or shareholder servicing fees, and other Fund expenses. This example is intended to help you understand your ongoing costs (in dollars) of investing in the Fund and to compare these costs with the ongoing costs of investing in other mutual funds.
The example is based on an investment of $1,000 invested at the beginning of thesix-month period and held for the entire period from October 1, 2019 to March 31, 2020.
Actual expenses
The “Actual” line of the table below provides information about actual account values and actual expenses. You may use the information in this line, together with the amount you invested, to estimate the expenses that you paid over the period. Simply divide your account value by $1,000 (for example, an $8,600 account value divided by $1,000 = 8.6), then multiply the result by the number in the “Actual” line under the heading entitled “Expenses paid during period” for your applicable class of shares to estimate the expenses you paid on your account during this period.
Hypothetical example for comparison purposes
The “Hypothetical” line of the table below provides information about hypothetical account values and hypothetical expenses based on the Fund’s actual expense ratio and an assumed rate of return of 5% per year before expenses, which is not the Fund’s actual return. The hypothetical account values and expenses may not be used to estimate the actual ending account balance or expenses you paid for the period. You may use this information to compare the ongoing costs of investing in the Fund and other funds. To do so, compare this 5% hypothetical example with the 5% hypothetical examples that appear in the shareholder reports of the other funds.
Please note that the expenses shown in the table are meant to highlight your ongoing costs only and do not reflect any transactional costs, such as sales charges (loads) and contingent deferred sales charges. Therefore, the “Hypothetical” line of the table is useful in comparing ongoing costs only and will not help you determine the relative total costs of owning different funds. In addition, if these transactional costs were included, your costs would have been higher.
| | | | | | | | | | | | | | | | |
| | | Beginning
account value
10-1-2019 | | | Ending
account value
3-31-2020 | | | Expenses
paid during
the period¹ | | | Annualized net
expense ratio | |
| | | | | |
Class A | | | | | | | | | | | | | | | | |
| | | | |
Actual | | $ | 1,000.00 | | | $ | 710.37 | | | $ | 5.30 | | | | 1.24 | % |
| | | | |
Hypothetical (5% return before expenses) | | $ | 1,000.00 | | | $ | 1,018.80 | | | $ | 6.26 | | | | 1.24 | % |
| | | | | |
Class C | | | | | | | | | | | | | | | | |
| | | | |
Actual | | $ | 1,000.00 | | | $ | 707.69 | | | $ | 8.54 | | | | 2.00 | % |
| | | | |
Hypothetical (5% return before expenses) | | $ | 1,000.00 | | | $ | 1,015.00 | | | $ | 10.08 | | | | 2.00 | % |
| | | | | |
Class R6 | | | | | | | | | | | | | | | | |
| | | | |
Actual | | $ | 1,000.00 | | | $ | 711.83 | | | $ | 3.42 | | | | 0.80 | % |
| | | | |
Hypothetical (5% return before expenses) | | $ | 1,000.00 | | | $ | 1,021.00 | | | $ | 4.04 | | | | 0.80 | % |
| | | | | |
Administrator Class | | | | | | | | | | | | | | | | |
| | | | |
Actual | | $ | 1,000.00 | | | $ | 710.72 | | | $ | 4.92 | | | | 1.15 | % |
| | | | |
Hypothetical (5% return before expenses) | | $ | 1,000.00 | | | $ | 1,019.25 | | | $ | 5.81 | | | | 1.15 | % |
| | | | | |
Institutional Class | | | | | | | | | | | | | | | | |
| | | | |
Actual | | $ | 1,000.00 | | | $ | 711.64 | | | $ | 3.85 | | | | 0.90 | % |
| | | | |
Hypothetical (5% return before expenses) | | $ | 1,000.00 | | | $ | 1,020.50 | | | $ | 4.55 | | | | 0.90 | % |
| 1 | Expenses paid is equal to the annualized net expense ratio of each class multiplied by the average account value over the period, multiplied by the number of days in the most recent fiscal half-year divided by the number of days in the fiscal year (to reflect theone-half-year period). |
6 | Wells Fargo C&B Mid Cap Value Fund
Portfolio of investments—March 31, 2020 (unaudited)
| | | | | | | | | | | | | | | | |
| | | | | | | | | Shares | | | Value | |
| Common Stocks: 94.84% | | | | | | | | | | | | | | | | |
| | | | |
Communication Services: 3.53% | | | | | | | | | | | | | | | | |
| | | | |
| Entertainment: 1.18% | | | | | | | | | | | | |
Activision Blizzard Incorporated | | | | | | | | | | | 67,500 | | | $ | 4,014,900 | |
| | | | | | | | | | | | | | | | |
| | | | |
| Media: 2.35% | | | | | | | | | | | | |
Omnicom Group Incorporated | | | | | | | | | | | 144,700 | | | | 7,944,030 | |
| | | | | | | | | | | | | | | | |
| | | | |
| Consumer Discretionary: 11.97% | | | | | | | | | | | | |
| | | | |
| Hotels, Restaurants & Leisure: 1.50% | | | | | | | | | | | | |
Extended Stay America Incorporated | | | | | | | | | | | 270,300 | | | | 1,975,893 | |
Norwegian Cruise Line Holdings Limited † | | | | | | | | | | | 282,200 | | | | 3,092,912 | |
| | | | |
| | | | | | | | | | | | | | | 5,068,805 | |
| | | | | | | | | | | | | | | | |
| | | | |
| Household Durables: 4.98% | | | | | | | | | | | | |
Helen of Troy Limited † | | | | | | | | | | | 78,700 | | | | 11,335,160 | |
Whirlpool Corporation | | | | | | | | | | | 64,600 | | | | 5,542,680 | |
| | | | |
| | | | | | | | | | | | | | | 16,877,840 | |
| | | | | | | | | | | | | | | | |
| | | | |
| Specialty Retail: 2.41% | | | | | | | | | | | | |
American Eagle Outfitters Incorporated | | | | | | | | | | | 1,027,500 | | | | 8,168,625 | |
| | | | | | | | | | | | | | | | |
| | | | |
| Textiles, Apparel & Luxury Goods: 3.08% | | | | | | | | | | | | |
Gildan Activewear Incorporated | | | | | | | | | | | 493,300 | | | | 6,294,508 | |
HanesBrands Incorporated | | | | | | | | | | | 524,000 | | | | 4,123,880 | |
| | | | |
| | | | | | | | | | | | | | | 10,418,388 | |
| | | | | | | | | | | | | | | | |
| | | | |
| Financials: 23.35% | | | | | | | | | | | | |
| | | | |
| Banks: 4.29% | | | | | | | | | | | | |
Commerce Bancshares Incorporated | | | | | | | | | | | 106,906 | | | | 5,382,717 | |
TCF Financial Corporation | | | | | | | | | | | 403,713 | | | | 9,148,137 | |
| | | | |
| | | | | | | | | | | | | | | 14,530,854 | |
| | | | | | | | | | | | | | | | |
| | | | |
| Capital Markets: 2.56% | | | | | | | | | | | | |
State Street Corporation | | | | | | | | | | | 162,400 | | | | 8,651,048 | |
| | | | | | | | | | | | | | | | |
| | | | |
| Consumer Finance: 4.89% | | | | | | | | | | | | |
FirstCash Financial Services Incorporated | | | | | | | | | | | 138,800 | | | | 9,957,512 | |
Synchrony Financial | | | | | | | | | | | 411,100 | | | | 6,614,599 | |
| | | | |
| | | | | | | | | | | | | | | 16,572,111 | |
| | | | | | | | | | | | | | | | |
| | | | |
| Insurance: 9.42% | | | | | | | | | | | | |
Alleghany Corporation Alleghany Corp | | | | | | | | | | | 9,530 | | | | 5,263,896 | |
Arch Capital Group Limited † | | | | | | | | | | | 183,600 | | | | 5,225,256 | |
Fidelity National Financial Incorporated | | | | | | | | | | | 148,620 | | | | 3,697,666 | |
Globe Life Incorporated | | | | | | | | | | | 118,700 | | | | 8,542,839 | |
The Progressive Corporation | | | | | | | | | | | 124,200 | | | | 9,170,928 | |
| | | | |
| | | | | | | | | | | | | | | 31,900,585 | |
| | | | | | | | | | | | | | | | |
| | | | |
| Thrifts & Mortgage Finance: 2.19% | | | | | | | | | | | | |
Essent Group Limited | | | | | | | | | | | 282,100 | | | | 7,430,514 | |
| | | | | | | | | | | | | | | | |
| | | | |
Health Care: 12.93% | | | | | | | | | | | | | | | | |
| | | | |
| Health Care Equipment & Supplies: 5.78% | | | | | | | | | | | | |
Hill-Rom Holdings Incorporated | | | | | | | | | | | 105,270 | | | | 10,590,162 | |
The accompanying notes are an integral part of these financial statements.
Wells Fargo C&B Mid Cap Value Fund | 7
Portfolio of investments—March 31, 2020 (unaudited)
| | | | | | | | | | | | | | | | |
| | | | | | | | | Shares | | | Value | |
| | | | |
| Health Care Equipment & Supplies (continued) | | | | | | | | | | | | |
Integra LifeSciences Holdings Corporation † | | | | | | | | | | | 201,422 | | | $ | 8,997,521 | |
| | | | |
| | | | | | | | | | | | | | | 19,587,683 | |
| | | | | | | | | | | | | | | | |
| | | | |
| Health Care Providers & Services: 2.04% | | | | | | | | | | | | |
Laboratory Corporation of America Holdings † | | | | | | | | | | | 54,700 | | | | 6,913,533 | |
| | | | | | | | | | | | | | | | |
| | | | |
| Life Sciences Tools & Services: 2.28% | | | | | | | | | | | | |
Syneos Health Incorporated † | | | | | | | | | | | 196,000 | | | | 7,726,320 | |
| | | | | | | | | | | | | | | | |
| | | | |
| Pharmaceuticals: 2.83% | | | | | | | | | | | | |
Perrigo Company plc | | | | | | | | | | | 198,900 | | | | 9,565,101 | |
| | | | | | | | | | | | | | | | |
| | | | |
Industrials: 25.49% | | | | | | | | | | | | | | | | |
| | | | |
| Aerospace & Defense: 5.47% | | | | | | | | | | | | |
BWX Technologies Incorporated | | | | | | | | | | | 162,200 | | | | 7,900,762 | |
Hexcel Corporation | | | | | | | | | | | 154,700 | | | | 5,753,293 | |
Huntington Ingalls Industries Incorporated | | | | | | | | | | | 26,800 | | | | 4,883,228 | |
| | | | |
| | | | | | | | | | | | | | | 18,537,283 | |
| | | | | | | | | | | | | | | | |
| | | | |
| Building Products: 1.26% | | | | | | | | | | | | |
Johnson Controls International plc | | | | | | | | | | | 157,600 | | | | 4,248,896 | |
| | | | | | | | | | | | | | | | |
| | | | |
| Commercial Services & Supplies: 1.11% | | | | | | | | | | | | |
Steelcase Incorporated Class A | | | | | | | | | | | 379,700 | | | | 3,747,639 | |
| | | | | | | | | | | | | | | | |
| | | | |
| Electrical Equipment: 6.47% | | | | | | | | | | | | |
Acuity Brands Incorporated | | | | | | | | | | | 78,300 | | | | 6,707,178 | |
AMETEK Incorporated | | | | | | | | | | | 101,400 | | | | 7,302,828 | |
Eaton Corporation plc | | | | | | | | | | | 101,700 | | | | 7,901,073 | |
| | | | |
| | | | | | | | | | | | | | | 21,911,079 | |
| | | | | | | | | | | | | | | | |
| | | | | | | | | | | | | | | | |
| | | | |
| Machinery: 9.04% | | | | | | | | | | | | |
Colfax Corporation † | | | | | | | | | | | 514,199 | | | | 10,181,140 | |
Donaldson Company Incorporated | | | | | | | | | | | 110,900 | | | | 4,284,067 | |
Gates Industrial Corporation plc † | | | | | | | | | | | 414,852 | | | | 3,061,608 | |
Snap-on Incorporated | | | | | | | | | | | 61,500 | | | | 6,692,430 | |
Woodward Governor Company | | | | | | | | | | | 107,500 | | | | 6,389,800 | |
| | | | |
| | | | | | | | | | | | | | | 30,609,045 | |
| | | | | | | | | | | | | | | | |
| | | | |
| Trading Companies & Distributors: 2.14% | | | | | | | | | | | | |
AerCap Holdings NV † | | | | | | | | | | | 318,100 | | | | 7,249,499 | |
| | | | | | | | | | | | | | | | |
| | | | |
Information Technology: 11.12% | | | | | | | | | | | | | | | | |
| | | | |
| Electronic Equipment, Instruments & Components: 5.62% | | | | | | | | | | | | |
Arrow Electronics Incorporated † | | | | | | | | | | | 199,100 | | | | 10,327,317 | |
TE Connectivity Limited | | | | | | | | | | | 138,040 | | | | 8,693,759 | |
| | | | |
| | | | | | | | | | | | | | | 19,021,076 | |
| | | | | | | | | | | | | | | | |
| | | | |
| IT Services: 3.66% | | | | | | | | | | | | |
Amdocs Limited | | | | | | | | | | | 150,900 | | | | 8,294,973 | |
Leidos Holdings Incorporated | | | | | | | | | | | 44,600 | | | | 4,087,590 | |
| | | | |
| | | | | | | | | | | | | | | 12,382,563 | |
| | | | | | | | | | | | | | | | |
The accompanying notes are an integral part of these financial statements.
8 | Wells Fargo C&B Mid Cap Value Fund
Portfolio of investments—March 31, 2020 (unaudited)
| | | | | | | | | | | | | | | | |
| | | | | | | | | Shares | | | Value | |
| Semiconductors & Semiconductor Equipment: 1.84% | | | | | | �� | | | | | | |
MKS Instruments Incorporated | | | | | | | | | | | 76,600 | | | $ | 6,239,070 | |
| | | | | | | | | | | | | | | | |
| | | | |
Materials: 4.73% | | | | | | | | | | | | | | | | |
| | | | |
| Chemicals: 1.47% | | | | | | | | | | | | |
Axalta Coating Systems Limited † | | | | | | | | | | | 289,200 | | | | 4,994,484 | |
| | | | | | | | | | | | | | | | |
| | | | |
| Metals & Mining: 2.10% | | | | | | | | | | | | |
Reliance Steel & Aluminum Company | | | | | | | | | | | 81,100 | | | | 7,103,549 | |
| | | | | | | | | | | | | | | | |
| | | | |
| Paper & Forest Products: 1.16% | | | | | | | | | | | | |
Schweitzer-Mauduit International Incorporated | | | | | | | | | | | 141,390 | | | | 3,933,470 | |
| | | | | | | | | | | | | | | | |
| | | | |
Real Estate: 1.72% | | | | | | | | | | | | | | | | |
| | | | |
| Real Estate Management & Development: 1.72% | | | | | | | | | | | | |
CBRE Group Incorporated Class A † | | | | | | | | | | | 154,000 | | | | 5,807,340 | |
| | | | | | | | | | | | | | | | |
| | | | |
Total Common Stocks (Cost $399,590,643) | | | | | | | | | | | | | | | 321,155,330 | |
| | | | | | | | | | | | | | | | |
| | | | |
| | | | | | | | | | | | | | | | |
| | | Yield | | | | | | | | | | |
| Short-Term Investments: 4.83% | | | | | | | | | | | | |
| | | | |
| Investment Companies: 4.83% | | | | | | | | | | | | |
Wells Fargo Government Money Market Fund Select Class (l)(u) | | | 0.35 | % | | | | | | | 16,371,170 | | | | 16,371,170 | |
| | | | | | | | | | | | | | | | |
| | | | |
Total Short-Term Investments (Cost $16,371,170) | | | | | | | | | | | | | | | 16,371,170 | |
| | | | | | | | | | | | | | | | |
| | | | | | | | |
| Total investments in securities (Cost $415,961,813) | | | 99.67 | % | | | 337,526,500 | |
| | |
Other assets and liabilities, net | | | 0.33 | | | | 1,107,536 | |
| | | | | | | | |
| Total net assets | | | 100.00 | % | | $ | 338,634,036 | |
| | | | | | | | |
| † | Non-income-earning security |
| (l) | The issuer of the security is an affiliated person of the Fund as defined in the Investment Company Act of 1940. |
| (u) | The rate represents the7-day annualized yield at period end. |
Investments in Affiliates
An affiliated investment is an investment in which the Fund owns at least 5% of the outstanding voting shares of the issuer or as a result of other relationships, such as the Fund and the issuer having the same investment manager. Transactions with issuers that were either affiliated persons of the Fund at the beginning of the period or the end of the period were as follows:
| | | | | | | | | | | | | | | | | | | | | | | | | | | | | | | | | | | | |
| | | Shares,
beginning of
period | | | Shares
purchased | | | Shares
sold | | | Shares,
end of
period | | | Net
realized
gains
(losses) | | | Net
change in
unrealized
gains
(losses) | | | Income
from
affiliated
securities | | | Value,
end of
period | | | % of
net
assets | |
| | | | | | | | | |
| Short-Term Investments | | | | | | | | | | | | | | | | | | | | | | | | | | | |
Investment Companies | | | | | | | | | | | | | | | | | | | | | | | | | | | | | | | | | | | | |
Securities Lending Cash Investments LLC * | | | 5,733,177 | | | | 18,975,007 | | | | (24,708,184 | ) | | | 0 | | | $ | (145 | ) | | $ | 0 | | | $ | 3,957 | # | | $ | 0 | | | | | |
Wells Fargo Government Money Market Fund Select Class | | | 17,446,499 | | | | 130,808,248 | | | | (131,883,577 | ) | | | 16,371,170 | | | | 0 | | | | 0 | | | | 202,688 | | | | 16,371,170 | | | | | |
| | | | | | | | | | | | | | | | | | | | | | | | | | | | | | | | | | | | |
| | | | | | | | | | | | | | | | | | $ | (145 | ) | | $ | 0 | | | $ | 206,645 | | | $ | 16,371,170 | | | | 4.83 | % |
| | | | | | | | | | | | | | | | | | | | | | | | | | | | | | | | | | | | |
| * | No longer held at the end of the period. |
| # | Amount shown represents income before fees and rebates. |
The accompanying notes are an integral part of these financial statements.
Wells Fargo C&B Mid Cap Value Fund | 9
Statement of assets and liabilities—March 31, 2020 (unaudited)
| | | | |
| | | | |
| |
Assets | | | | |
Investments in unaffiliated securities, at value (cost $399,590,643) | | $ | 321,155,330 | |
Investments in affiliated securities, at value (cost $16,371,170) | | | 16,371,170 | |
Receivable for investments sold | | | 683,036 | |
Receivable for Fund shares sold | | | 1,493,923 | |
Receivable for dividends | | | 354,361 | |
Receivable for securities lending income, net | | | 1,056 | |
Prepaid expenses and other assets | | | 78,229 | |
| | | | |
Total assets | | | 340,137,105 | |
| | | | |
| |
Liabilities | | | | |
Payable for investments purchased | | | 763,033 | |
Payable for Fund shares redeemed | | | 434,351 | |
Management fee payable | | | 218,069 | |
Administration fees payable | | | 45,679 | |
Distribution fee payable | | | 2,159 | |
Trustees’ fees and expenses payable | | | 4,055 | |
Accrued expenses and other liabilities | | | 35,723 | |
| | | | |
Total liabilities | | | 1,503,069 | |
| | | | |
Total net assets | | $ | 338,634,036 | |
| | | | |
| |
Net assets consist of | | | | |
Paid-in capital | | $ | 418,376,765 | |
Total distributable loss | | | (79,742,729 | ) |
| | | | |
Total net assets | | $ | 338,634,036 | |
| | | | |
| |
Computation of net asset value and offering price per share | | | | |
Net assets – Class A | | $ | 80,992,696 | |
Shares outstanding – Class A1 | | | 2,955,606 | |
Net asset value per share – Class A | | | $27.40 | |
Maximum offering price per share – Class A2 | | | $29.07 | |
Net assets – Class C | | $ | 2,979,676 | |
Shares outstanding – Class C1 | | | 116,906 | |
Net asset value per share – Class C | | | $25.49 | |
Net assets – Class R6 | | $ | 11,086,288 | |
Shares outstanding – Class R61 | | | 401,184 | |
Net asset value per share – Class R6 | | | $27.63 | |
Net assets – Administrator Class | | $ | 21,547,458 | |
Shares outstanding – Administrator Class1 | | | 777,552 | |
Net asset value per share – Administrator Class | | | $27.71 | |
Net assets – Institutional Class | | $ | 222,027,918 | |
Shares outstanding – Institutional Class1 | | | 8,036,862 | |
Net asset value per share – Institutional Class | | | $27.63 | |
| 1 | The Fund has an unlimited number of authorized shares. |
| 2 | Maximum offering price is computed as 100/94.25 of net asset value. On investments of $50,000 or more, the offering price is reduced. |
The accompanying notes are an integral part of these financial statements.
10 | Wells Fargo C&B Mid Cap Value Fund
Statement of operations—six months ended March 31, 2020 (unaudited)
| | | | |
| | | | |
| |
Investment income | | | | |
Dividends (net of foreign withholding taxes of $18,778) | | $ | 3,414,957 | |
Income from affiliated securities | | | 203,486 | |
| | | | |
Total investment income | | | 3,618,443 | |
| | | | |
| |
Expenses | | | | |
Management fee | | | 1,660,679 | |
Administration fees | |
Class A | | | 119,436 | |
Class C | | | 4,558 | |
Class R6 | | | 2,231 | |
Administrator Class | | | 19,166 | |
Institutional Class | | | 182,279 | |
Shareholder servicing fees | | | | |
Class A | | | 142,186 | |
Class C | | | 5,426 | |
Administrator Class | | | 36,858 | |
Distribution fee | | | | |
Class C | | | 16,280 | |
Custody and accounting fees | | | 10,797 | |
Professional fees | | | 20,025 | |
Registration fees | | | 50,137 | |
Shareholder report expenses | | | 30,082 | |
Trustees’ fees and expenses | | | 11,029 | |
Other fees and expenses | | | 8,536 | |
| | | | |
Total expenses | | | 2,319,705 | |
Less: Fee waivers and/or expense reimbursements | | | | |
Fund-level | | | (42,223 | ) |
Class A | | | (4,377 | ) |
Class R6 | | | (1,437 | ) |
Administrator Class | | | (2,805 | ) |
Institutional Class | | | (27,551 | ) |
| | | | |
Net expenses | | | 2,241,312 | |
| | | | |
Net investment income | | | 1,377,131 | |
| | | | |
| |
Realized and unrealized gains (losses) on investments | | | | |
Net realized gains (losses) on | | | | |
Unaffiliated securities | | | 686,440 | |
Affiliated securities | | | (145 | ) |
| | | | |
Net realized gains on investments | | | 686,295 | |
Net change in unrealized gains (losses) on investments | | | (136,555,664 | ) |
| | | | |
Net realized and unrealized gains (losses) on investments | | | (135,869,369 | ) |
| | | | |
Net decrease in net assets resulting from operations | | $ | (134,492,238 | ) |
| | | | |
The accompanying notes are an integral part of these financial statements.
Wells Fargo C&B Mid Cap Value Fund | 11
Statement of changes in net assets
| | | | | | | | | | | | | | | | |
| | | Six months ended
March 31, 2020 (unaudited) | | | Year ended
September 30, 2019 | |
| | | | |
Operations | | | | | | | | | | | | | | | | |
Net investment income | | | | | | $ | 1,377,131 | | | | | | | $ | 2,205,049 | |
Net realized gains on investments | | | | | | | 686,295 | | | | | | | | 10,275,898 | |
Net change in unrealized gains (losses) on investments | | | | | | | (136,555,664 | ) | | | | | | | 6,365,733 | |
| | | | |
Net increase (decrease) in net assets resulting from operations | | | | | | | (134,492,238 | ) | | | | | | | 18,846,680 | |
| | | | |
| | | | |
Distributions to shareholders from net investment income and net realized gains | | | | | | | | | | | | | | | | |
Class A | | | | | | | (3,368,775 | ) | | | | | | | (159,086 | ) |
Class C | | | | | | | (116,894 | ) | | | | | | | 0 | |
Class R6 | | | | | | | (485,361 | ) | | | | | | | (76,727 | ) |
Administrator Class | | | | | | | (945,399 | ) | | | | | | | (60,977 | ) |
Institutional Class | | | | | | | (8,727,328 | ) | | | | | | | (1,010,122 | ) |
| | | | |
Total distributions to shareholders | | | | | | | (13,643,757 | ) | | | | | | | (1,306,912 | ) |
| | | | |
| | | | |
Capital share transactions | | | Shares | | | | | | | | Shares | | | | | |
Proceeds from shares sold | | | | | | | | | | | | | | | | |
Class A | | | 494,896 | | | | 19,192,977 | | | | 316,284 | | | | 11,568,529 | |
Class C | | | 17,406 | | | | 624,975 | | | | 28,128 | | | | 897,999 | |
Class R6 | | | 59,998 | | | | 2,197,408 | | | | 475,263 | | | | 17,075,950 | |
Administrator Class | | | 260,723 | | | | 10,420,653 | | | | 200,859 | | | | 7,561,359 | |
Institutional Class | | | 3,292,297 | | | | 120,603,387 | | | | 3,096,014 | | | | 113,109,321 | |
| | | | |
| | | | | | | 153,039,400 | | | | | | | | 150,213,158 | |
| | | | |
Reinvestment of distributions | | | | | | | | | | | | | | | | |
Class A | | | 79,402 | | | | 3,248,552 | | | | 4,720 | | | | 154,816 | |
Class C | | | 2,989 | | | | 113,505 | | | | 0 | | | | 0 | |
Class R6 | | | 6,229 | | | | 257,557 | | | | 995 | | | | 32,841 | |
Administrator Class | | | 22,658 | | | | 938,447 | | | | 1,590 | | | | 52,718 | |
Institutional Class | | | 210,740 | | | | 8,708,954 | | | | 30,350 | | | | 1,001,844 | |
| | | | |
| | | | | | | 13,267,015 | | | | | | | | 1,242,219 | |
| | | | |
Payment for shares redeemed | | | | | | | | | | | | | | | | |
Class A | | | (315,073 | ) | | | (11,091,465 | ) | | | (564,439 | ) | | | (20,529,618 | ) |
Class C | | | (27,668 | ) | | | (950,211 | ) | | | (139,702 | ) | | | (4,695,256 | ) |
Class R6 | | | (42,296 | ) | | | (1,697,352 | ) | | | (99,674 | ) | | | (3,641,646 | ) |
Administrator Class | | | (104,615 | ) | | | (3,838,356 | ) | | | (150,211 | ) | | | (5,462,836 | ) |
Institutional Class | | | (1,628,141 | ) | | | (59,376,136 | ) | | | (2,201,065 | ) | | | (78,294,383 | ) |
| | | | |
| | | | | | | (76,953,520 | ) | | | | | | | (112,623,739 | ) |
| | | | |
Net increase in net assets resulting from capital share transactions | | | | | | | 89,352,895 | | | | | | | | 38,831,638 | |
| | | | |
Total increase (decrease) in net assets | | | | | | | (58,783,100 | ) | | | | | | | 56,371,406 | |
| | | | |
| | | | |
Net assets | | | | | | | | | | | | | | | | |
Beginning of period | | | | | | | 397,417,136 | | | | | | | | 341,045,730 | |
| | | | |
End of period | | | | | | $ | 338,634,036 | | | | | | | $ | 397,417,136 | |
| | | | |
The accompanying notes are an integral part of these financial statements.
12 | Wells Fargo C&B Mid Cap Value Fund
Financial highlights
(For a share outstanding throughout each period)
| | | | | | | | | | | | | | | | | | | | | | | | |
| | | Six months ended
March 31, 2020
(unaudited) | | | Year ended September 30 | |
| CLASS A | | 2019 | | | 2018 | | | 2017 | | | 2016 | | | 2015 | |
Net asset value, beginning of period | | | $39.67 | | | | $37.88 | | | | $35.07 | | | | $29.27 | | | | $25.12 | | | | $25.26 | |
Net investment income (loss) | | | 0.06 | | | | 0.16 | | | | 0.06 | | | | (0.00 | )1,2 | | | 0.07 | 1 | | | 0.05 | 1 |
Net realized and unrealized gains (losses) on investments | | | (11.17 | ) | | | 1.69 | | | | 2.75 | | | | 5.82 | | | | 4.13 | | | | (0.14 | ) |
| | | | | | | | | | | | | | | | | | | | | | | | |
Total from investment operations | | | (11.11 | ) | | | 1.85 | | | | 2.81 | | | | 5.82 | | | | 4.20 | | | | (0.09 | ) |
Distributions to shareholders from | | | | | | | | | | | | | | | | | | | | | | | | |
Net investment income | | | (0.15 | ) | | | (0.06 | ) | | | (0.00 | )3 | | | (0.02 | ) | | | (0.05 | ) | | | (0.05 | ) |
Net realized gains | | | (1.01 | ) | | | 0.00 | | | | 0.00 | | | | 0.00 | | | | 0.00 | | | | 0.00 | |
| | | | | | | | | | | | | | | | | | | | | | | | |
Total distributions to shareholders | | | (1.16 | ) | | | (0.06 | ) | | | (0.00 | ) | | | (0.02 | ) | | | (0.05 | ) | | | (0.05 | ) |
Net asset value, end of period | | | $27.40 | | | | $39.67 | | | | $37.88 | | | | $35.07 | | | | $29.27 | | | | $25.12 | |
Total return4 | | | (28.96 | )% | | | 4.91 | % | | | 8.02 | % | | | 19.89 | % | | | 16.73 | % | | | (0.36 | )% |
Ratios to average net assets (annualized) | | | | | | | | | | | | | | | | | | | | | | | | |
Gross expenses | | | 1.27 | % | | | 1.29 | % | | | 1.29 | % | | | 1.30 | % | | | 1.33 | % | | | 1.35 | % |
Net expenses | | | 1.24 | % | | | 1.25 | % | | | 1.25 | % | | | 1.25 | % | | | 1.24 | % | | | 1.20 | % |
Net investment income (loss) | | | 0.39 | % | | | 0.43 | % | | | 0.16 | % | | | (0.00 | )%2 | | | 0.27 | % | | | 0.18 | % |
Supplemental data | | | | | | | | | | | | | | | | | | | | | | | | |
Portfolio turnover rate | | | 26 | % | | | 42 | % | | | 39 | % | | | 54 | % | | | 35 | % | | | 41 | % |
Net assets, end of period (000s omitted) | | | $80,993 | | | | $106,975 | | | | $111,354 | | | | $115,258 | | | | $120,020 | | | | $19,862 | |
| 1 | Calculated based upon average shares outstanding |
| 2 | Amount is more than $(0.005). |
| 3 | Amount is less than $0.005. |
| 4 | Total return calculations do not include any sales charges. Returns for periods of less than one year are not annualized. |
The accompanying notes are an integral part of these financial statements.
Wells Fargo C&B Mid Cap Value Fund | 13
Financial highlights
(For a share outstanding throughout each period)
| | | | | | | | | | | | | | | | | | | | | | | | |
| | | Six months ended
March 31, 2020
(unaudited) | | | Year ended September 30 | |
| CLASS C | | 2019 | | | 2018 | | | 2017 | | | 2016 | | | 2015 | |
Net asset value, beginning of period | | | $36.98 | | | | $35.51 | | | | $33.12 | | | | $27.83 | | | | $24.02 | | | | $24.29 | |
Net investment loss | | | (0.07 | )1 | | | (0.12 | )1 | | | (0.20 | )1 | | | (0.26 | )1 | | | (0.14 | )1 | | | (0.15 | )1 |
Net realized and unrealized gains (losses) on investments | | | (10.41 | ) | | | 1.59 | | | | 2.59 | | | | 5.55 | | | | 3.95 | | | | (0.12 | ) |
| | | | | | | | | | | | | | | | | | | | | | | | |
Total from investment operations | | | (10.48 | ) | | | 1.47 | | | | 2.39 | | | | 5.29 | | | | 3.81 | | | | (0.27 | ) |
Distributions to shareholders from | | | | | | | | | | | | | | | | | | | | | | | | |
Net realized gains | | | (1.01 | ) | | | 0.00 | | | | 0.00 | | | | 0.00 | | | | 0.00 | | | | 0.00 | |
Net asset value, end of period | | | $25.49 | | | | $36.98 | | | | $35.51 | | | | $33.12 | | | | $27.83 | | | | $24.02 | |
Total return2 | | | (29.23 | )% | | | 4.14 | % | | | 7.22 | % | | | 19.01 | % | | | 15.86 | % | | | (1.11 | )% |
Ratios to average net assets (annualized) | | | | | | | | | | | | | | | | | | | | | | | | |
Gross expenses | | | 2.02 | % | | | 2.04 | % | | | 2.04 | % | | | 2.05 | % | | | 2.08 | % | | | 2.10 | % |
Net expenses | | | 2.00 | % | | | 2.00 | % | | | 2.00 | % | | | 2.00 | % | | | 1.98 | % | | | 1.95 | % |
Net investment loss | | | (0.38 | )% | | | (0.36 | )% | | | (0.59 | )% | | | (0.74 | )% | | | (0.55 | )% | | | (0.57 | )% |
Supplemental data | | | | | | | | | | | | | | | | | | | | | | | | |
Portfolio turnover rate | | | 26 | % | | | 42 | % | | | 39 | % | | | 54 | % | | | 35 | % | | | 41 | % |
Net assets, end of period (000s omitted) | | | $2,980 | | | | $4,592 | | | | $8,371 | | | | $8,567 | | | | $7,314 | | | | $6,737 | |
| 1 | Calculated based upon average shares outstanding |
| 2 | Total return calculations do not include any sales charges. Returns for periods of less than one year are not annualized. |
The accompanying notes are an integral part of these financial statements.
14 | Wells Fargo C&B Mid Cap Value Fund
Financial highlights
(For a share outstanding throughout each period)
| | | | | | | | | | | | |
| | | Six months ended
March 31, 2020
(unaudited) | | | Year ended September 30 | |
| CLASS R6 | | 2019 | | | 20181 | |
Net asset value, beginning of period | | | $40.06 | | | | $38.27 | | | | $37.39 | |
Net investment income | | | 0.17 | | | | 0.35 | 2 | | | 0.08 | 2 |
Net realized and unrealized gains (losses) on investments | | | (11.29 | ) | | | 1.67 | | | | 0.80 | |
| | | | | | | | | | | | |
Total from investment operations | | | (11.12 | ) | | | 2.02 | | | | 0.88 | |
Distributions to shareholders from | | | | | | | | | | | | |
Net investment income | | | (0.30 | ) | | | (0.23 | ) | | | 0.00 | |
Net realized gains | | | (1.01 | ) | | | 0.00 | | | | 0.00 | |
| | | | | | | | | | | | |
Total distributions to shareholders | | | (1.31 | ) | | | 0.00 | | | | 0.00 | |
Net asset value, end of period | | | $27.63 | | | | $40.06 | | | | $38.27 | |
Total return3 | | | (28.82 | )% | | | 5.39 | % | | | 2.35 | % |
Ratios to average net assets (annualized) | | | | | | | | | | | | |
Gross expenses | | | 0.84 | % | | | 0.86 | % | | | 0.86 | % |
Net expenses | | | 0.80 | % | | | 0.80 | % | | | 0.80 | % |
Net investment income | | | 0.83 | % | | | 0.95 | % | | | 1.24 | % |
Supplemental data | | | | | | | | | | | | |
Portfolio turnover rate | | | 26 | % | | | 42 | % | | | 39 | % |
Net assets, end of period (000s omitted) | | | $11,086 | | | | $15,112 | | | | $26 | |
| 1 | For the period from July 31, 2018 (commencement of class operations) to September 30, 2018 |
| 2 | Calculated based upon average shares outstanding |
| 3 | Returns for periods of less than one year are not annualized. |
The accompanying notes are an integral part of these financial statements.
Wells Fargo C&B Mid Cap Value Fund | 15
Financial highlights
(For a share outstanding throughout each period)
| | | | | | | | | | | | | | | | | | | | | | | | |
| | | Six months ended
March 31, 2020
(unaudited) | | | Year ended September 30 | |
| ADMINISTRATOR CLASS | | 2019 | | | 2018 | | | 2017 | | | 2016 | | | 2015 | |
Net asset value, beginning of period | | | $40.14 | | | | $38.35 | | | | $35.52 | | | | $29.63 | | | | $25.42 | | | | $25.54 | |
Net investment income | | | 0.10 | 1 | | | 0.20 | 1 | | | 0.10 | 1 | | | 0.04 | 1 | | | 0.08 | 1 | | | 0.06 | 1 |
Net realized and unrealized gains (losses) on investments | | | (11.32 | ) | | | 1.70 | | | | 2.78 | | | | 5.89 | | | | 4.19 | | | | (0.13 | ) |
| | | | | | | | | | | | | | | | | | | | | | | | |
Total from investment operations | | | (11.22 | ) | | | 1.90 | | | | 2.88 | | | | 5.93 | | | | 4.27 | | | | (0.07 | ) |
Distributions to shareholders from | | | | | | | | | | | | | | | | | | | | | | | | |
Net investment income | | | (0.20 | ) | | | (0.11 | ) | | | (0.05 | ) | | | (0.04 | ) | | | (0.06 | ) | | | (0.05 | ) |
Net realized gains | | | (1.01 | ) | | | 0.00 | | | | 0.00 | | | | 0.00 | | | | 0.00 | | | | 0.00 | |
| | | | | | | | | | | | | | | | | | | | | | | | |
Total distributions to shareholders | | | (1.21 | ) | | | (0.11 | ) | | | (0.05 | ) | | | (0.04 | ) | | | (0.06 | ) | | | (0.05 | ) |
Net asset value, end of period | | | $27.71 | | | | $40.14 | | | | $38.35 | | | | $35.52 | | | | $29.63 | | | | $25.42 | |
Total return2 | | | (28.93 | )% | | | 5.03 | % | | | 8.13 | % | | | 20.02 | % | | | 16.82 | % | | | (0.30 | )% |
Ratios to average net assets (annualized) | | | | | | | | | | | | | | | | | | | | | | | | |
Gross expenses | | | 1.19 | % | | | 1.21 | % | | | 1.21 | % | | | 1.22 | % | | | 1.25 | % | | | 1.21 | % |
Net expenses | | | 1.15 | % | | | 1.15 | % | | | 1.15 | % | | | 1.15 | % | | | 1.15 | % | | | 1.15 | % |
Net investment income | | | 0.48 | % | | | 0.53 | % | | | 0.26 | % | | | 0.12 | % | | | 0.28 | % | | | 0.22 | % |
Supplemental data | | | | | | | | | | | | | | | | | | | | | | | | |
Portfolio turnover rate | | | 26 | % | | | 42 | % | | | 39 | % | | | 54 | % | | | 35 | % | | | 41 | % |
Net assets, end of period (000s omitted) | | | $21,547 | | | | $24,036 | | | | $20,960 | | | | $21,267 | | | | $8,302 | | | | $9,725 | |
| 1 | Calculated based upon average shares outstanding |
| 2 | Returns for periods of less than one year are not annualized. |
The accompanying notes are an integral part of these financial statements.
16 | Wells Fargo C&B Mid Cap Value Fund
Financial highlights
(For a share outstanding throughout each period)
| | | | | | | | | | | | | | | | | | | | | | | | |
| | | Six months ended
March 31, 2020
(unaudited) | | | Year ended September 30 | |
| INSTITUTIONAL CLASS | | 2019 | | | 2018 | | | 2017 | | | 2016 | | | 2015 | |
Net asset value, beginning of period | | | $40.04 | | | | $38.26 | | | | $35.41 | | | | $29.53 | | | | $25.34 | | | | $25.49 | |
Net investment income | | | 0.12 | | | | 0.28 | | | | 0.19 | | | | 0.16 | | | | 0.16 | | | | 0.10 | |
Net realized and unrealized gains (losses) on investments | | | (11.25 | ) | | | 1.70 | | | | 2.78 | | | | 5.82 | | �� | | 4.17 | | | | (0.12 | ) |
| | | | | | | | | | | | | | | | | | | | | | | | |
Total from investment operations | | | (11.13 | ) | | | 1.98 | | | | 2.97 | | | | 5.98 | | | | 4.33 | | | | (0.02 | ) |
Distributions to shareholders from | | | | | | | | | | | | | | | | | | | | | | | | |
Net investment income | | | (0.27 | ) | | | (0.20 | ) | | | (0.12 | ) | | | (0.10 | ) | | | (0.14 | ) | | | (0.13 | ) |
Net realized gains | | | (1.01 | ) | | | 0.00 | | | | 0.00 | | | | 0.00 | | | | 0.00 | | | | 0.00 | |
| | | | | | | | | | | | | | | | | | | | | | | | |
Total distributions to shareholders | | | (1.28 | ) | | | (0.20 | ) | | | (0.12 | ) | | | (0.10 | ) | | | (0.14 | ) | | | (0.13 | ) |
Net asset value, end of period | | | $27.63 | | | | $40.04 | | | | $38.26 | | | | $35.41 | | | | $29.53 | | | | $25.34 | |
Total return2 | | | (28.84 | )% | | | 5.29 | % | | | 8.41 | % | | | 20.30 | % | | | 17.11 | % | | | (0.09 | )%1 |
Ratios to average net assets (annualized) | | | | | | | | | | | | | | | | | | | | | | | | |
Gross expenses | | | 0.94 | % | | | 0.96 | % | | | 0.96 | % | | | 0.97 | % | | | 1.00 | % | | | 0.94 | % |
Net expenses | | | 0.90 | % | | | 0.90 | % | | | 0.90 | % | | | 0.90 | % | | | 0.90 | % | | | 0.90 | % |
Net investment income | | | 0.74 | % | | | 0.79 | % | | | 0.56 | % | | | 0.37 | % | | | 0.54 | % | | | 0.47 | % |
Supplemental data | | | | | | | | | | | | | | | | | | | | | | | | |
Portfolio turnover rate | | | 26 | % | | | 42 | % | | | 39 | % | | | 54 | % | | | 35 | % | | | 41 | % |
Net assets, end of period (000s omitted) | | | $222,028 | | | | $246,702 | | | | $200,335 | | | | $105,550 | | | | $38,161 | | | | $18,229 | |
| 1 | Total return reflects adjustments to conform with generally accepted accounting principles. |
| 2 | Returns for periods of less than one year are not annualized. |
The accompanying notes are an integral part of these financial statements.
Wells Fargo C&B Mid Cap Value Fund | 17
Notes to financial statements (unaudited)
1. ORGANIZATION
Wells Fargo Funds Trust (the “Trust”), a Delaware statutory trust organized on March 10, 1999, is anopen-end management investment company registered under the Investment Company Act of 1940, as amended (the “1940 Act”). As an investment company, the Trust follows the accounting and reporting guidance in Financial Accounting Standards Board (“FASB”)Accounting Standards Codification Topic 946, Financial Services – Investment Companies. These financial statements report on the Wells Fargo C&B Mid Cap Value Fund (the “Fund”) which is a diversified series of the Trust.
2. SIGNIFICANT ACCOUNTING POLICIES
The following significant accounting policies, which are consistently followed in the preparation of the financial statements of the Fund, are in conformity with U.S. generally accepted accounting principles which require management to make estimates and assumptions that affect the reported amounts of assets and liabilities, disclosure of contingent assets and liabilities at the date of the financial statements, and the reported amounts of revenues and expenses during the reporting period. Actual results could differ from those estimates.
Securities valuation
All investments are valued each business day as of the close of regular trading on the New York Stock Exchange (generally 4 p.m. Eastern Time), although the Fund may deviate from this calculation time under unusual or unexpected circumstances.
Equity securities that are listed on a foreign or domestic exchange or market are valued at the official closing price or, if none, the last sales price. If no sale occurs on the principal exchange or market that day, a fair value price will be determined in accordance with the Fund’s Valuation Procedures.
Investments in registeredopen-end investment companies are valued at net asset value. Interests innon-registered investment companies that are redeemable at net asset value are fair valued normally at net asset value.
Investments which are not valued using any of the methods discussed above are valued at their fair value, as determined in good faith by the Board of Trustees of the Fund. The Board of Trustees has established a Valuation Committee comprised of the Trustees and has delegated to it the authority to take any actions regarding the valuation of portfolio securities that the Valuation Committee deems necessary or appropriate, including determining the fair value of portfolio securities, unless the determination has been delegated to the Wells Fargo Asset Management Pricing Committee at Wells Fargo Funds Management, LLC (“Funds Management”). The Board of Trustees retains the authority to make or ratify any valuation decisions or approve any changes to the Valuation Procedures as it deems appropriate. On a quarterly basis, the Board of Trustees receives reports on any valuation actions taken by the Valuation Committee or the Wells Fargo Asset Management Pricing Committee which may include items for ratification.
Securities lending
The Fund may lend its securities from time to time in order to earn additional income in the form of fees or interest on securities received as collateral or the investment of any cash received as collateral. When securities are on loan, the Fund receives interest or dividends on those securities. Cash collateral received in connection with its securities lending transactions is invested in Securities Lending Cash Investments, LLC (the “Securities Lending Fund”). Investments in Securities Lending Fund are valued at the evaluated bid price provided by an independent pricing service. Income earned from investment in the Securities Lending Fund (net of fees and rebates), if any, is included in income from affiliated securities on the Statement of Operations.
In a securities lending transaction, the net asset value of the Fund is affected by an increase or decrease in the value of the securities loaned and by an increase or decrease in the value of the instrument in which collateral is invested. The amount of securities lending activity undertaken by the Fund fluctuates from time to time. The Fund has the right under the lending agreement to recover the securities from the borrower on demand. In the event of default or bankruptcy by the borrower, the Fund may be prevented from recovering the loaned securities or gaining access to the collateral or may experience delays or costs in doing so. In such an event, the terms of the agreement allows the unaffiliated securities lending agent to use the collateral to purchase replacement securities on behalf of the Fund or pay the Fund the market value of the loaned securities. The Fund bears the risk of loss with respect to depreciation of its investment of the cash collateral.
Security transactions and income recognition
Securities transactions are recorded on a trade date basis. Realized gains or losses are recorded on the basis of identified cost.
Dividend income is recognized on theex-dividend date. Dividend income is recorded net of foreign taxes withheld where recovery of such taxes is not assured.
18 | Wells Fargo C&B Mid Cap Value Fund
Notes to financial statements (unaudited)
Distributions to shareholders
Distributions to shareholders from net investment income and any net realized gains are recorded on theex-dividend date and paid at least annually. Such distributions are determined in accordance with income tax regulations and may differ from U.S. generally accepted accounting principles. Dividend sources are estimated at the time of declaration. The tax character of distributions is determined as of the Fund’s fiscal year end. Therefore, a portion of the Fund’s distributions made prior to the Fund’s fiscal year end may be categorized as a tax return of capital at year end.
Federal and other taxes
The Fund intends to continue to qualify as a regulated investment company by distributing substantially all of its investment company taxable income and any net realized capital gains (after reduction for capital loss carryforwards) sufficient to relieve it from all, or substantially all, federal income taxes. Accordingly, no provision for federal income taxes was required.
The Fund’s income and federal excise tax returns and all financial records supporting those returns for the prior three fiscal years are subject to examination by the federal and Delaware revenue authorities. Management has analyzed the Fund’s tax positions taken on federal, state, and foreign tax returns for all open tax years and does not believe that there are any uncertain tax positions that require recognition of a tax liability.
As of March 31, 2020, the aggregate cost of all investments for federal income tax purposes was $409,903,804 and the unrealized gains (losses) consisted of:
| | | | |
| |
Gross unrealized gains | | $ | 16,043,009 | |
| |
Gross unrealized losses | | | (88,420,313 | ) |
| |
Net unrealized losses | | $ | (72,377,304 | ) |
Class allocations
The separate classes of shares offered by the Fund differ principally in applicable sales charges, distribution, shareholder servicing, and administration fees. Class specific expenses are charged directly to that share class. Investment income, common fund-level expenses, and realized and unrealized gains (losses) on investments are allocated daily to each class of shares based on the relative proportion of net assets of each class.
3. FAIR VALUATION MEASUREMENTS
Fair value measurements of investments are determined within a framework that has established a fair value hierarchy based upon the various data inputs utilized in determining the value of the Fund’s investments. The three-level hierarchy gives the highest priority to unadjusted quoted prices in active markets for identical assets or liabilities (Level 1) and the lowest priority to unobservable inputs (Level 3). The Fund’s investments are classified within the fair value hierarchy based on the lowest level of input that is significant to the fair value measurement. The inputs are summarized into three broad levels as follows:
| ∎ | | Level 1 – quoted prices in active markets for identical securities |
| ∎ | | Level 2 – other significant observable inputs (including quoted prices for similar securities, interest rates, prepayment speeds, credit risk, etc.) |
| ∎ | | Level 3 – significant unobservable inputs (including the Fund’s own assumptions in determining the fair value of investments) |
The inputs or methodologies used for valuing investments in securities are not necessarily an indication of the risk associated with investing in those securities.
Wells Fargo C&B Mid Cap Value Fund | 19
Notes to financial statements (unaudited)
The following is a summary of the inputs used in valuing the Fund’s assets and liabilities as of March 31, 2020:
| | | | | | | | | | | | | | | | |
| | | | |
| | | Quoted prices
(Level 1) | | | Other significant
observable inputs
(Level 2) | | | Significant
unobservable inputs (Level 3) | | | Total | |
| | | | |
Assets | | | | | | | | | | | | | | | | |
Investments in : | | | | | | | | | | | | | | | | |
| | | | |
Common stocks | | | | | | | | | | | | | | | | |
| | | | |
Communication services | | $ | 11,958,930 | | | $ | 0 | | | $ | 0 | | | $ | 11,958,930 | |
| | | | |
Consumer discretionary | | | 40,533,658 | | | | 0 | | | | 0 | | | | 40,533,658 | |
| | | | |
Financials | | | 79,085,112 | | | | 0 | | | | 0 | | | | 79,085,112 | |
| | | | |
Health care | | | 43,792,637 | | | | 0 | | | | 0 | | | | 43,792,637 | |
| | | | |
Industrials | | | 86,303,441 | | | | 0 | | | | 0 | | | | 86,303,441 | |
| | | | |
Information technology | | | 37,642,709 | | | | 0 | | | | 0 | | | | 37,642,709 | |
| | | | |
Materials | | | 16,031,503 | | | | 0 | | | | 0 | | | | 16,031,503 | |
| | | | |
Real estate | | | 5,807,340 | | | | 0 | | | | 0 | | | | 5,807,340 | |
| | | | |
Short-term investments | | | | | | | | | | | | | | | | |
| | | | |
Investment companies | | | 16,371,170 | | | | 0 | | | | 0 | | | | 16,371,170 | |
| | | | |
Total assets | | $ | 337,526,500 | | | $ | 0 | | | $ | 0 | | | $ | 337,526,500 | |
Additional sector, industry or geographic detail is included in the Portfolio of Investments.
For the six months ended March 31, 2020, the Fund did not have any transfers into/out of Level 3.
4. TRANSACTIONS WITH AFFILIATES AND OTHER EXPENSES
Management fee
Funds Management, an indirect wholly owned subsidiary of Wells Fargo & Company (“Wells Fargo”), is the manager of the Fund and provides advisory and fund-level administrative services under an investment management agreement. Under the investment management agreement, Funds Management is responsible for, among other services, implementing the investment objectives and strategies of the Fund, supervising the subadviser and providing fund-level administrative services in connection with the Fund’s operations. As compensation for its services under the investment management agreement, Funds Management is entitled to receive a management fee at the following annual rate based on the Fund’s average daily net assets:
| | |
| |
| Average daily net assets | | Management fee |
| |
First $500 million | | 0.750% |
| |
Next $500 million | | 0.725 |
| |
Next $1 billion | | 0.700 |
| |
Next $2 billion | | 0.675 |
| |
Next $1 billion | | 0.650 |
| |
Next $5 billion | | 0.640 |
| |
Next $2 billion | | 0.630 |
| |
Next $4 billion | | 0.620 |
| |
Over $16 billion | | 0.610 |
For the six months ended March 31, 2020, the management fee was equivalent to an annual rate of 0.75% of the Fund’s average daily net assets.
Funds Management has retained the services of a subadviser to provide daily portfolio management to the Fund. The fee for subadvisory services is borne by Funds Management. Cooke & Bieler, L.P., which is not an affiliate of Funds Management, is the subadviser to the Fund and is entitled to receive a fee from Funds Management at an annual rate starting at 0.45% and declining to 0.35% as the average daily net assets of the Fund increase.
20 | Wells Fargo C&B Mid Cap Value Fund
Notes to financial statements (unaudited)
Administration fees
Under a class-level administration agreement, Funds Management provides class-level administrative services to the Fund, which includes paying fees and expenses for services provided by the transfer agent,sub-transfer agents, omnibus account servicers and record-keepers. As compensation for its services under the class-level administration agreement, Funds Management receives an annual fee which is calculated based on the average daily net assets of each class as follows:
| | |
| |
| | | Class-level
administration fee |
| |
Class A, Class C | | 0.21% |
| |
Class R6 | | 0.03 |
| |
Administrator Class, Institutional Class | | 0.13 |
Waivers and/or expense reimbursements
Funds Management has contractually waived and/or reimbursed management and administration fees to the extent necessary to maintain certain net operating expense ratios for the Fund. When each class of the Fund has exceeded its expense cap, Funds Management has waived fees and/or reimbursed expenses from fund-level expenses on a proportionate basis and then from class specific expenses. When only certain classes exceed their expense caps, waivers and/or reimbursements are applied against class specific expenses before fund-level expenses. Funds Management has committed through January 31, 2021 to waive fees and/or reimburse expenses to the extent necessary to cap the Fund’s expenses at 1.25% for Class A shares, 2.00% for Class C shares, 0.80% for Class R6 shares, 1.15% for Administrator Class shares, and 0.90% for Institutional Class shares. Prior to or after the commitment expiration date, the cap may be increased or the commitment to maintain the cap may be terminated only with the approval of the Board of Trustees.
Distribution fee
The Trust has adopted a distribution plan for Class C shares of the Fund pursuant to Rule12b-1 under the 1940 Act. A distribution fee is charged to Class C shares and paid to Wells Fargo Funds Distributor, LLC (“Funds Distributor”), the principal underwriter, at an annual rate of 0.75% of the average daily net assets of Class C shares.
In addition, Funds Distributor is entitled to receive thefront-end sales charge from the purchase of Class A shares and a contingent deferred sales charge on the redemption of certain Class A shares. Funds Distributor is also entitled to receive the contingent deferred sales charges from redemptions of Class C shares. For the six months ended March 31, 2020, Funds Distributor received $4,283 from the sale of Class A shares. No contingent deferred sales charges were incurred by Class A and Class C shares for the six months ended March 31, 2020.
Shareholder servicing fees
The Trust has entered into contracts with one or more shareholder servicing agents, whereby Class A, Class C, and Administrator Class of the Fund are charged a fee at an annual rate of 0.25% of the average daily net assets of each respective class. A portion of these total shareholder servicing fees were paid to affiliates of Wells Fargo.
Interfund transactions
The Fund may purchase or sell portfolio investment securities to certain other Wells Fargo affiliates pursuant to Rule17a-7 under the 1940 Act and under procedures adopted by the Board of Trustees. The procedures have been designed to ensure that these interfund transactions, which do not incur broker commissions, are effected at current market prices.
5. INVESTMENT PORTFOLIO TRANSACTIONS
Purchases and sales of investments, excluding U.S. government obligations (if any) and short-term securities, for the six months ended March 31, 2020 were $182,200,630 and $106,169,565, respectively.
6. SECURITIES LENDING TRANSACTIONS
The Fund lends its securities through an unaffiliated securities lending agent and receives collateral in the form of cash or securities with a value at least equal to the value of the securities on loan. The value of the loaned securities is determined at the close of each business day and any increases or decreases in the required collateral are exchanged between the Fund and the counterparty on the next business day. Cash collateral received is invested in the Securities Lending Fund which seeks to provide a positive return compared to the daily Fed Funds Open Rate by investing in high-quality, U.S. dollar-denominated short-term money market instruments and is exempt from registration under Section 3(c)(7) of the 1940 Act. Securities Lending Fund is managed by Funds Management and is subadvised by Wells Capital Management Incorporated (“WellsCap”), an
Wells Fargo C&B Mid Cap Value Fund | 21
Notes to financial statements (unaudited)
affiliate of Funds Management and an indirect wholly owned subsidiary of Wells Fargo. Funds Management receives an advisory fee starting at 0.05% and declining to 0.01% as the average daily net assets of the Securities Lending Fund increase. All of the fees received by Funds Management are paid to WellsCap for its services as subadviser.
In the event of counterparty default or the failure of a borrower to return a loaned security, the Fund has the right to use the collateral to offset any losses incurred. As of March 31, 2020, the Fund did not have any securities on loan.
7. BANK BORROWINGS
The Trust (excluding the money market funds), Wells Fargo Master Trust and Wells Fargo Variable Trust are parties to a $280,000,000 revolving credit agreement whereby the Fund is permitted to use bank borrowings for temporary or emergency purposes, such as to fund shareholder redemption requests. Interest under the credit agreement is charged to the Fund based on a borrowing rate equal to the higher of the Federal Funds rate in effect on that day plus 1.25% or the overnight LIBOR rate in effect on that day plus 1.25%. In addition, an annual commitment fee equal to 0.25% of the unused balance is allocated to each participating fund.
For the six months ended March 31, 2020, there were no borrowings by the Fund under the agreement.
8. CONCENTRATION RISK
Concentration risks result from exposure to a limited number of sectors. As of the end of the period, the Fund invests a concentration of its portfolio in the industrials sector. A fund that invests a substantial portion of its assets in any sector may be more affected by changes in that sector than would be a fund whose investments are not heavily weighted in any sector.
9. INDEMNIFICATION
Under the Trust’s organizational documents, the officers and Trustees have been granted certain indemnification rights against certain liabilities that may arise out of performance of their duties to the Trust. Additionally, in the normal course of business, the Trust may enter into contracts with service providers that contain a variety of indemnification clauses. The Trust’s maximum exposure under these arrangements is dependent on future claims that may be made against the Fund and, therefore, cannot be estimated.
10. NEW ACCOUNTING PRONOUNCEMENT
In August 2018, FASB issued Accounting Standards Update (“ASU”)No. 2018-13, Fair Value Measurement (Topic 820)Disclosure Framework – Changes to the Disclosure Requirements for Fair Value Measurement. ASU2018-13 updates the disclosure requirements for fair value measurements by modifying or removing certain disclosures and adding certain new disclosures. The amendments are effective for fiscal years, and interim periods within those fiscal years, beginning after December 15, 2019. Early adoption is permitted. Management has adopted the removal and modification of disclosures early, as permitted, and will adopt the additional new disclosures at the effective date.
11. CORONAVIRUS(COVID-19) PANDEMIC
On March 11, 2020, the World Health Organization announced that it had made the assessment that coronavirus disease 2019(“COVID-19”) is a pandemic. The impacts ofCOVID-19 are adversely affecting the entire global economy, individual companies and investment products, and the market in general. There is significant uncertainty around the extent and duration of business disruptions related toCOVID-19 and the impacts may be short term or may last for an extended period of time. The risk of further spreading ofCOVID-19 has led to significant uncertainty and volatility in the financial markets. The value of the Fund and the securities in which the Fund invests have generally been adversely affected by impacts caused byCOVID-19.
22 | Wells Fargo C&B Mid Cap Value Fund
Other information (unaudited)
PROXY VOTING INFORMATION
A description of the policies and procedures used to determine how to vote proxies relating to portfolio securities is available, upon request, by calling1-800-222-8222, visiting our website atwfam.com, or visiting the SEC website at sec.gov. Information regarding how the proxies related to portfolio securities were voted during the most recent12-month period ended June 30 is available on the website atwfam.comor by visiting the SEC website at sec.gov.
QUARTERLY PORTFOLIO HOLDINGS INFORMATION
The Fund files its complete schedule of portfolio holdings with the SEC for the first and third quarters of each fiscal year as an exhibit to its reports on FormN-PORT. Shareholders may view the filed FormN-PORT by visiting the SEC website at sec.gov.
Wells Fargo C&B Mid Cap Value Fund | 23
Other information (unaudited)
BOARD OF TRUSTEES AND OFFICERS
Each of the Trustees and Officers1 listed in the table below acts in identical capacities for each fund in the Wells Fargo family of funds, which consists of 147 mutual funds comprising the Wells Fargo Funds Trust, Wells Fargo Variable Trust, Wells Fargo Master Trust and fourclosed-end funds (collectively the “Fund Complex”). This table should be read in conjunction with the Prospectus and the Statement of Additional Information2. The mailing address of each Trustee and Officer is 525 Market Street, 12th Floor, San Francisco, CA 94105. Each Trustee and Officer serves an indefinite term, however, each Trustee serves such term until reaching the mandatory retirement age established by the Trustees.
Independent Trustees
| | | | | | |
Name and year of birth | | Position held and
length of service* | | Principal occupations during past five years or longer | | Current other
public company or
investment
company
directorships |
| | | |
William R. Ebsworth
(Born 1957) | | Trustee, since 2015 | | Retired. From 1984 to 2013, equities analyst, portfolio manager, research director and chief investment officer at Fidelity Management and Research Company in Boston, Tokyo, and Hong Kong, and retired in 2013 as Chief Investment Officer of Fidelity Strategic Advisers, Inc. where he led a team of investment professionals managing client assets. Prior thereto, Board member of Hong Kong Securities Clearing Co., Hong Kong Options Clearing Corp., the Thailand International Fund, Ltd., Fidelity Investments Life Insurance Company, and Empire Fidelity Investments Life Insurance Company. Audit Committee Chair and Investment Committee Chair of the Vincent Memorial Hospital Endowment(non-profit organization). Mr. Ebsworth is a CFA® charterholder. | | N/A |
| | | |
Jane A. Freeman
(Born 1953) | | Trustee, since 2015; Chair Liaison, since 2018 | | Retired. From 2012 to 2014 and 1999 to 2008, Chief Financial Officer of Scientific Learning Corporation. From 2008 to 2012, Ms. Freeman provided consulting services related to strategic business projects. Prior to 1999, Portfolio Manager at Rockefeller & Co. and Scudder, Stevens & Clark. Board member of the Harding Loevner Funds from 1996 to 2014, serving as both Lead Independent Director and chair of the Audit Committee. Board member of the Russell Exchange Traded Funds Trust from 2011 to 2012 and the chair of the Audit Committee. Ms. Freeman is a Board Member of The Ruth Bancroft Garden(non-profit organization). She is also an inactive Chartered Financial Analyst. | | N/A |
| | | |
| Isaiah Harris, Jr. (Born 1952) | | Trustee, since 2009; Audit Committee Chairman, since 2019 | | Retired. Chairman of the Board of CIGNA Corporation since 2009, and Director since 2005. From 2003 to 2011, Director of Deluxe Corporation. Prior thereto, President and CEO of BellSouth Advertising and Publishing Corp. from 2005 to 2007, President and CEO of BellSouth Enterprises from 2004 to 2005 and President of BellSouth Consumer Services from 2000 to 2003. Emeritus member of the Iowa State University Foundation Board of Governors. Emeritus Member of the Advisory Board of Iowa State University School of Business. Advisory Board Member, Palm Harbor Academy (private school). Advisory Board Member, Child Evangelism Fellowship(non-profit). Mr. Harris is a certified public accountant (inactive status). | | CIGNA Corporation |
| | | |
| Judith M. Johnson (Born 1949) | | Trustee, since 2008; Audit Committee Chairman, from 2009 to 2018 | | Retired. Prior thereto, Chief Executive Officer and Chief Investment Officer of Minneapolis Employees Retirement Fund from 1996 to 2008. Ms. Johnson is an attorney, certified public accountant and a certified managerial accountant. | | N/A |
24 | Wells Fargo C&B Mid Cap Value Fund
Other information (unaudited)
| | | | | | |
Name and year of birth | | Position held and
length of service* | | Principal occupations during past five years or longer | | Current other
public company or
investment
company
directorships |
| | | |
| David F. Larcker (Born 1950) | | Trustee, since 2009 | | James Irvin Miller Professor of Accounting at the Graduate School of Business, Stanford University, Director of the Corporate Governance Research Initiative and Senior Faculty of The Rock Center for Corporate Governance since 2006. From 2005 to 2008, Professor of Accounting at the Graduate School of Business, Stanford University. Prior thereto, Ernst & Young Professor of Accounting at The Wharton School, University of Pennsylvania from 1985 to 2005. | | N/A |
| | | |
| Olivia S. Mitchell (Born 1953) | | Trustee, since 2006; Nominating and Governance Committee Chair, since 2018 | | International Foundation of Employee Benefit Plans Professor, Wharton School of the University of Pennsylvania since 1993. Director of Wharton’s Pension Research Council and Boettner Center on Pensions & Retirement Research, and Research Associate at the National Bureau of Economic Research. Previously, Cornell University Professor from 1978 to 1993. | | N/A |
| | | |
| Timothy J. Penny (Born 1951) | | Trustee, since 1996; Chairman, since 2018 | | President and Chief Executive Officer of Southern Minnesota Initiative Foundation, anon-profit organization, since 2007. Member of the Board of Trustees of NorthStar Education Finance, Inc., anon-profit organization, since 2007. | | N/A |
| | | |
| James G. Polisson (Born 1959) | | Trustee, since 2018 | | Retired. Chief Marketing Officer, Source (ETF) UK Services, Ltd, from 2015 to 2017. From 2012 to 2015, Principal of The Polisson Group, LLC, a management consulting, corporate advisory and principal investing company. Chief Executive Officer and Managing Director at Russell Investments, Global Exchange Traded Funds from 2010 to 2012. Managing Director of Barclays Global Investors from 1998 to 2010 and Global Chief Marketing Officer for iShares and Barclays Global Investors from 2000 to 2010. Trustee of the San Francisco Mechanics’ Institute, anon-profit organization, from 2013 to 2015. Board member of the Russell Exchange Traded Fund Trust from 2011 to 2012. Director of Barclays Global Investors Holdings Deutschland GmbH from 2006 to 2009. Mr. Polisson is an attorney and has a retired status with the Massachusetts and District of Columbia Bar Associations. | | N/A |
| | | |
| Pamela Wheelock3 (Born 1959) | | Trustee, since January 2020; previously Trustee from January 2018 to July 2019 | | Board member of the Destination Medical Center Economic Development Agency, Rochester, Minnesota since 2019. Acting Commissioner, Minnesota Department of Human Services, July 2019 through September 2019. Human Services Manager (part-time), Minnesota Department of Human Services, October 2019 through December 2019. Chief Operating Officer, Twin Cities Habitat for Humanity from 2017 to 2019. Vice President of University Services, University of Minnesota from 2012 to 2016. Prior thereto, on the Board of Directors, Governance Committee and Finance Committee for the Minnesota Philanthropy Partners (Saint Paul Foundation) from 2012 to 2018, Interim Chief Executive Officer of Blue Cross Blue Shield of Minnesota from 2011 to 2012, Chairman of the Board from 2009 to 2012 and Board Director from 2003 to 2015. Vice President, Leadership and Community Engagement, Bush Foundation, Saint Paul, Minnesota (a private foundation) from 2009 to 2011. Executive Vice President and Chief Financial Officer, Minnesota Sports and Entertainment from 2004 to 2009 and Senior Vice President from 2002 to 2004. Executive Vice President of the Minnesota Wild Foundation from 2004 to 2008. Commissioner of Finance, State of Minnesota, from 1999 to 2002. Currently Board Chair of the Minnesota Wild Foundation since 2010. | | N/A |
| * | Length of service dates reflect the Trustee’s commencement of service with the Trust’s predecessor entities, where applicable. |
Wells Fargo C&B Mid Cap Value Fund | 25
Other information (unaudited)
Officers
| | | | |
Name and
year of birth | | Position held and
length of service | | Principal occupations during past five years or longer |
| | |
Andrew Owen
(Born 1960) | | President, since 2017 | | Executive Vice President of Wells Fargo & Company and Head of Affiliated Managers, Wells Fargo Asset Management, since 2014. In addition, Mr. Owen is currently President, Chief Executive Officer and Director of Wells Fargo Funds Management, LLC since 2017. Prior thereto, Executive Vice President responsible for marketing, investments and product development for Wells Fargo Funds Management, LLC, from 2009 to 2014. |
| | |
Nancy Wiser1
(Born 1967) | | Treasurer, since 2012 | | Executive Vice President of Wells Fargo Funds Management, LLC since 2011. Chief Operating Officer and Chief Compliance Officer at LightBox Capital Management LLC, from 2008 to 2011. |
| | |
Michelle Rhee
(Born 1966) | | Chief Legal Officer, since 2019 | | Secretary of Wells Fargo Funds Management, LLC, Chief Legal Counsel of Wells Fargo Asset Management and Assistant General Counsel of Wells Fargo Bank, N.A. since 2018. Associate General Counsel and Managing Director of Bank of America Corporation from 2004 to 2018. |
| | |
Catherine Kennedy
(Born 1969) | | Secretary, since 2019 | | Vice President of Wells Fargo Funds Management, LLC and Senior Counsel of the Wells Fargo Legal Department since 2010. Vice President and Senior Counsel of Evergreen Investment Management Company, LLC from 1998 to 2010. |
| | |
Michael H. Whitaker (Born 1967) | | Chief Compliance Officer, since 2016 | | Chief Compliance Officer of Wells Fargo Asset Management since 2016. Senior Vice President and Chief Compliance Officer for Fidelity Investments from 2007 to 2016. |
| | |
David Berardi
(Born 1975) | | Assistant Treasurer, since 2009 | | Vice President of Wells Fargo Funds Management, LLC since 2009. Vice President of Evergreen Investment Management Company, LLC from 2008 to 2010. Manager of Fund Reporting and Control for Evergreen Investment Management Company, LLC from 2004 to 2010. |
| | |
Jeremy DePalma1
(Born 1974) | | Assistant Treasurer, since 2009 | | Senior Vice President of Wells Fargo Funds Management, LLC since 2009. Senior Vice President of Evergreen Investment Management Company, LLC from 2008 to 2010 and head of the Fund Reporting and Control Team within Fund Administration from 2005 to 2010. |
| 1 | Nancy Wiser acts as Treasurer of 65 funds in the Fund Complex. Jeremy DePalma acts as Treasurer of 82 funds and Assistant Treasurer of 65 funds in the Fund Complex. |
| 2 | The Statement of Additional Information includes additional information about the Trustees and is available, without charge, upon request, by calling1-800-222-8222 or by visiting the website atwfam.com. |
| 3 | Pamela Wheelock wasre-appointed to the Board effective January 1, 2020. |
26 | Wells Fargo C&B Mid Cap Value Fund
Appendix I (unaudited)
Effective on or about May 1, 2020, if you purchase Fund shares through a Janney Montgomery Scott LLC (“Janney”) brokerage account, you will be eligible for the following load waivers(front-end sales charge waivers and contingent deferred sales charge (“CDSC”), orback-end sales charge, waivers) and discounts, which may differ from those disclosed elsewhere in the Fund’s Prospectus or SAI.
|
| Front-end sales charge* waivers on Class A shares available at Janney |
|
| Shares purchased through reinvestment of capital gains distributions and dividend reinvestment when purchasing shares of the same fund (but not any other fund within the fund family). |
|
| Shares purchased by employees and registered representatives of Janney or its affiliates and their family members as designated by Janney. |
|
| Shares purchased from the proceeds of redemptions within the same fund family, provided (1) the repurchase occurs within ninety (90) days following the redemption, (2) the redemption and purchase occur in the same account, and (3) redeemed shares were subject to afront-end or deferred sales load (i.e., right of reinstatement). |
|
| Employer-sponsored retirement plans (e.g., 401(k) plans, 457 plans, employer-sponsored 403(b) plans, profit sharing and money purchase pension plans and defined benefit plans). For purposes of this provision, employer-sponsored retirement plans do not include SEP IRAs, Simple IRAs,SAR-SEPs or Keogh plans. |
|
| Shares acquired through a right of reinstatement. |
|
Class C shares that are no longer subject to a contingent deferred sales charge and are converted to Class A shares of the same fund pursuant to Janney’s policies and procedures. |
| CDSC waivers on Class A and Class C shares available at Janney |
|
| Shares sold upon the death or disability of the shareholder. |
|
| Shares sold as part of a systematic withdrawal plan as described in the Fund’s Prospectus. |
|
| Shares purchased in connection with a return of excess contributions from an IRA account. |
|
| Shares sold as part of a required minimum distribution for IRA and retirement accounts if the redemption is taken in or after the year the shareholder reaches qualified age based on applicable IRS regulations. |
|
| Shares sold to pay Janney fees but only if the transaction is initiated by Janney. |
|
| Shares acquired through a right of reinstatement. |
|
Shares exchanged into the same share class of a different fund. |
| Front-end sales charge* discounts available at Janney; breakpoints, rights of accumulation and/or letters of intent |
|
| Breakpoints as described in the Fund’s Prospectus. |
|
| Rights of accumulation (“ROA”), which entitle shareholders to breakpoint discounts, will be automatically calculated based on the aggregated holding of fund family assets held by accounts within the purchaser’s household at Janney. Eligible fund family assets not held at Janney may be included in the ROA calculation only if the shareholder notifies his or her financial advisor about such assets. |
|
| Letters of intent which allow for breakpoint discounts based on anticipated purchases within a fund family, over a13-month time period. Eligible fund family assets not held at Janney Montgomery Scott may be included in the calculation of letters of intent only if the shareholder notifies his or her financial advisor about such assets. |
| * | Also referred to as an “initial sales charge.” |
Wells Fargo C&B Mid Cap Value Fund | 27
Appendix II (unaudited)
Effective on or after May 1, 2020, clients of Edward Jones (also referred to as “shareholders”) purchasing Fund shares on the Edward Jones commission andfee-based platforms are eligible only for the following sales charge discounts (also referred to as “breakpoints”) and waivers, which can differ from breakpoints and waivers described elsewhere in this Prospectus or SAI or through another broker-dealer. In all instances, it is the shareholder’s responsibility to inform Edward Jones at the time of purchase of any relationship, holdings of Wells Fargo Funds or other facts qualifying the purchaser for breakpoints or waivers. Edward Jones can ask for documentation of such circumstance.
|
| Breakpoints available at Edward Jones |
|
| Rights of Accumulation (ROA) |
|
The applicable sales charge on a purchase of Class A shares is determined by taking into account all share classes (except any money market funds and retirement plan share classes) of Wells Fargo Funds held by the shareholder or in an account grouped by Edward Jones with other accounts for the purpose of providing certain pricing considerations (“pricing groups”). This includes all share classes held on the Edward Jones platform and/or held on another platform. The inclusion of eligible fund family assets in the rights of accumulation calculation is dependent on the shareholder notifying his or her financial advisor of such assets at the time of calculation. |
|
ROA is determined by calculating the higher of cost or market value (current shares x NAV). |
|
| Letter of Intent (LOI) |
|
Through a LOI, shareholders can receive the sales charge and breakpoint discounts for purchases shareholders intend to makeover a13-month period from the date Edward Jones receives the LOI. The LOI is determined by calculating the higher of cost or market value of qualifying holdings at LOI initiation in combination with the value that the shareholder intends to buy over a13-month period to calculate thefront-end sales charge and any breakpoint discounts. Each purchase the shareholder makes during that13-month period will receive the sales charge and breakpoint discount that applies to the total amount. The inclusion of eligible fund family assets in the LOI calculation is dependent on the shareholder notifying his or her financial advisor of such assets at the time of calculation. Purchases made before the LOI is received by Edward Jones are not covered under the LOI and will not reduce the sales charge previously paid. Sales charges will be adjusted if LOI is not met. |
| Sales charges are waived for the following shareholders and in the following situations at Edward Jones: |
● Associates of Edward Jones and its affiliates and their family members who are in the same pricing group (as determined by Edward Jones under its policies and procedures) as the associate. This waiver will continue for the remainder of the associate’s life if the associate retires from Edward Jones in good-standing. |
● Shares purchased in an Edward Jonesfee-based program. |
● Shares purchased through reinvestment of capital gains distributions and dividend reinvestment. |
● Shares purchased from the proceeds of redeemed shares of the same fund family so long as the following conditions are met: 1) the proceeds are from the sale of shares within 60 days of the purchase, and 2) the sale and purchase are made in the same share class and the same account or the purchase is made in an individual retirement account with proceeds from liquidations in anon-retirement account. |
● Shares exchanged into Class A shares from another share class so long as the exchange is into the same fund and was initiated at the discretion of Edward Jones. Edward Jones is responsible for any remaining CDSC due to the fund company, if applicable. Any future purchases are subject to the applicable sales charge as disclosed in the prospectus. |
● Exchanges from Class C shares to Class A shares of the same fund, generally, in the 84th month following the anniversary of the purchase date or earlier at the discretion of Edward Jones. |
If the shareholder purchases shares that are subject to a CDSC and those shares are redeemed before the CDSC is expired, the shareholder
is responsible to pay the CDSC except in the following conditions available at Edward Jones: |
● The death or disability of the shareholder. |
● Systematic withdrawals with up to 10% per year of the account value. |
● Return of excess contributions from an Individual Retirement Account (IRA). |
● Shares sold as part of a required minimum distribution for IRA and retirement accounts if the redemption is taken in or after the year the shareholder reaches qualified age based on applicable IRS regulation. |
● Shares sold to pay Edward Jones fees or costs in such cases where the transaction is initiated by Edward Jones. |
● Shares exchanged in an Edward Jonesfee-based program. |
● Shares acquired through NAV reinstatement. |
28 | Wells Fargo C&B Mid Cap Value Fund
Appendix II (unaudited)
|
| Other Important Information for accounts at Edward Jones: |
Minimum Purchase Amounts ● $250 initial purchase minimum ● $50 subsequent purchase minimum |
Minimum Balances Edward Jones has the right to redeem at its discretion fund holdings with a balance of $250 or less. The following are examples of accounts that are not included in this policy: ● Afee-based account held on an Edward Jones platform ● A 529 account held on an Edward Jones platform ● An account with an active systematic investment plan or letter of intent (LOI) |
Changing Share Classes At any time it deems necessary, Edward Jones has the authority to exchange at NAV a shareholder’s holdings in a fund to Class A shares. |
Wells Fargo C&B Mid Cap Value Fund | 29
This page is intentionally left blank.
This page is intentionally left blank.
This page is intentionally left blank.

For more information
More information about Wells Fargo Funds is available free upon request. To obtain literature, please write, visit the Fund’s website, or call:
Wells Fargo Funds
P.O. Box 219967
Kansas City, MO 64121-9967
Website:wfam.com
Individual investors:1-800-222-8222
Retail investment professionals:1-888-877-9275
Institutional investment professionals:1-866-765-0778

This report and the financial statements contained herein are submitted for the general information of the shareholders of the Fund. If this report is used for promotional purposes, distribution of the report must be accompanied or preceded by a current prospectus. Before investing, please consider the investment objectives, risks, charges, and expenses of the investment. For a current prospectus and, if available, a summary prospectus, containing this information, call1-800-222-8222or visit the Fund’s website atwfam.com. Read the prospectus carefully before you invest or send money.
Wells Fargo Asset Management (WFAM) is the trade name for certain investment advisory/management firms owned by Wells Fargo & Company. These firms include but are not limited to Wells Capital Management Incorporated and Wells Fargo Funds Management, LLC. Certain products managed by WFAM entities are distributed by Wells Fargo Funds Distributor, LLC (a broker-dealer and Member FINRA).
This material is for general informational and educational purposes only and is NOT intended to provide investment advice or a recommendation of any kind—including a recommendation for any specific investment, strategy, or plan.
INVESTMENT PRODUCTS: NOT FDIC INSURED ◾ NO BANK GUARANTEE ◾ MAY LOSE VALUE
© 2020 Wells Fargo & Company. All rights reserved.
PAR-0420-06227 05-20
SA228/SAR228 03-20
Semi-Annual Report
March 31, 2020
Wells Fargo Common Stock Fund
Beginning on January 1, 2021, as permitted by new regulations adopted by the Securities and Exchange Commission, paper copies of the Wells Fargo Funds’ annual and semi-annual shareholder reports issued after this date will no longer be sent by mail, unless you specifically request paper copies of the reports. Instead, the reports will be made available on the Funds’ website, and you will be notified by mail each time a report is posted and provided with a website address to access the report.
If you already elected to receive shareholder reports electronically, you will not be affected by this change and you need not take any action. You may elect to receive shareholder reports and other communications from the Fund electronically at any time by contacting your financial intermediary (such as a broker-dealer or bank) or, if you are a direct investor, by calling1-800-222-8222 or by enrolling at wellsfargo.com/advantagedelivery.
You may elect to receive all future reports in paper free of charge. If you invest through a financial intermediary, you can contact your financial intermediary to request that you continue to receive paper copies of your shareholder reports; if you invest directly with the Fund, you can call 1-800-222-8222. Your election to receive reports in paper will apply to all Wells Fargo Funds held in your account with your financial intermediary or, if you are a direct investor, to all Wells Fargo Funds that you hold.
|
|
|
Reduce clutter. Save trees. |
Sign up for electronic delivery of prospectuses and
shareholder reports atwellsfargo.com/
advantagedelivery |
The views expressed and any forward-looking statements are as of March 31, 2020, unless otherwise noted, and are those of the Fund managers and/or Wells Fargo Asset Management. Discussions of individual securities, or the markets generally, or any Wells Fargo Fund are not intended as individual recommendations. Future events or results may vary significantly from those expressed in any forward-looking statements. The views expressed are subject to change at any time in response to changing circumstances in the market. Wells Fargo Asset Management and the Fund disclaim any obligation to publicly update or revise any views expressed or forward-looking statements.
INVESTMENT PRODUCTS: NOT FDIC INSURED ◾ NO BANK GUARANTEE ◾ MAY LOSE VALUE
Wells Fargo Common Stock Fund | 1
Letter to shareholders (unaudited)

Andrew Owen
President
Wells Fargo Funds
“The period began with mixed data, leading to central bank support.”
Dear Shareholder:
We are pleased to offer you this semi-annual report for the Wells Fargo Common Stock Fund for the six-month period that ended March 31, 2020. Global stock markets saw earlier gains erased in February and March as governments took unprecedented measures to stop the spread of the coronavirus at the expense of short-term economic output. Fixed-income markets were less battered, with U.S. government bonds achieving modest gains as central banks attempted to bolster capital markets and confidence.
For the period, U.S. stocks, based on the S&P 500 Index,1 returned -12.31% and international stocks, as measured by the MSCI ACWI ex USA Index (Net),2 fell 16.52%. The MSCI EM Index (Net)3 lost 14.55%. For bond investors, the Bloomberg Barclays U.S. Aggregate Bond Index4 added 3.33%, the Bloomberg Barclays Global Aggregate ex-USD Index5 returned -2.03%, the Bloomberg Barclays Municipal Bond Index6 gained a modest 0.10%, and the ICE BofA U.S. High Yield Index7 returned -10.86%.
The period began with mixed data, leading to central bank support.
As the fourth quarter of 2019 started, U.S.-China trade tensions were relaxing while optimism grew for a U.K. Brexit deal. The initial estimate of U.S. third-quarter gross domestic product growth was a resilient 1.9% annualized rate, while the U.S. unemployment rate fell to a 50-year low of 3.5% in September. Despite resilience among U.S. consumers, however, business confidence declined while manufacturing activity contracted. Concerned with a potential economic slowdown, the U.S. Federal Reserve (Fed) lowered interest rates a quarter point in late October—its third rate cut in four months. This helped push the S&P 500 Index to an all-time high while emerging market equities rallied and global bonds declined overall, reflecting a broad pickup in risk appetite.
Equity markets rallied in November despite ongoing geopolitical risks. Hopes for aU.S.-China trade deal buoyed investor confidence. U.S. business sentiment edged up, and manufacturing and services activity rose. With that positive backdrop, developed market equities outpaced those in emerging markets, and U.S. stocks outperformed non-U.S. stocks overall. While consumer confidence and purchasing manager activity rose in the eurozone, China reported weakening manufacturing and consumer data. Bond yields rose marginally, leading to slightly negative returns for global government and investment-grade corporate bonds.
Financial markets ended 2019 with a boost from the U.S. and China accord on a Phase One trade deal. That, along with the landslide win by the pro-Brexit U.K. Conservative
| 1 | The S&P 500 Index consists of 500 stocks chosen for market size, liquidity, and industry group representation. It is a market-value-weighted index with each stock’s weight in the index proportionate to its market value. You cannot invest directly in an index. |
| 2 | The Morgan Stanley Capital International (MSCI) All Country World Index (ACWI) ex USA Index (Net) is a free-float-adjusted market-capitalization-weighted index that is designed to measure the equity market performance of developed markets, excluding the United States. Source: MSCI. MSCI makes no express or implied warranties or representations and shall have no liability whatsoever with respect to any MSCI data contained herein. The MSCI data may not be further redistributed or used as a basis for other indices or any securities or financial products. This report is not approved, reviewed, or produced by MSCI. You cannot invest directly in an index. |
| 3 | The MSCI Emerging Markets (EM) Index (Net) is a free-float-adjusted market-capitalization-weighted index that is designed to measure equity market performance of emerging markets. You cannot invest directly in an index. |
| 4 | The Bloomberg Barclays U.S. Aggregate Bond Index is a broad-based benchmark that measures the investment-grade, U.S. dollar-denominated, fixed-rate taxable bond market, including Treasuries, government-related and corporate securities, mortgage-backed securities (agency fixed-rate and hybrid adjustable-rate mortgage pass-throughs), asset-backed securities, and commercial mortgage-backed securities. You cannot invest directly in an index. |
| 5 | The Bloomberg Barclays Global Aggregate ex-USD Index is an unmanaged index that provides a broad-based measure of the global investment-grade fixed-income markets excluding the U.S. dollar-denominated debt market. You cannot invest directly in an index. |
| 6 | The Bloomberg Barclays Municipal Bond Index is an unmanaged index composed of long-term tax-exempt bonds with a minimum credit rating of Baa. You cannot invest directly in an index. |
| 7 | The ICE BofA U.S. High Yield Index is a market-capitalization-weighted index of domestic and Yankee high-yield bonds. The index tracks the performance of high-yield securities traded in the U.S. bond market. You cannot invest directly in an index. Copyright 2020. ICE Data Indices, LLC. All rights reserved. |
2 | Wells Fargo Common Stock Fund
Letter to shareholders (unaudited)
Party in a national election and ongoing central bank support, gave investors greater confidence. U.S. economic indicators were positive overall, with the exception of manufacturing activity and business confidence. Consumer confidence was resilient, fed by a robust labor market, tame inflation, and lower interest rates, which boosted housing affordability and stimulated homebuyer activity. The impeachment of U.S. President Donald Trump had little impact on markets. Meanwhile, slowing Chinese economic activity, partly attributable to the trade war, led to further government stimulus at year-end through lower reserve ratios, allowing banks to lend more money.
The year-end rally continued in early January 2020. However, capital market volatility spiked in late January on concerns over the potential impact of the coronavirus on the global economy and stock markets. With sentiment somewhat souring, perceived safe havens did well in January. The U.S. dollar and Japanese yen both rose, and government bonds outperformed equities. While the S&P 500 Index held its ground, emerging market equities tumbled, including those in Asia.
In February, the coronavirus became the major market focus. Fears of the virus’s impact on global growth led to expectations of increased global central bank monetary policy support. That led the 10-year U.S. Treasury yield to fall to an all-time low of 1.1% by the end of the month. Although equity markets initially shrugged off concerns about the outbreak, focusing instead on strong fourth-quarter earnings and improving business confidence in January, market sentiment turned sharply lower toward month-end. Oil prices tumbled as Russia and the Organization of the Petroleum Exporting Countries compounded a major decline in oil demand with a brutal price war, causing the price of West Texas Intermediate crude oil to fall 13% in February alone.
The global spread of the coronavirus led many countries to clamp down on social and business-related activity in order to contain the virus from causing even greater devastation and overwhelming the health care system. This abrupt stoppage of economic activity led to the sharp deceleration of global output, sending economies into a deep contraction. Central bank responses were swift, as they slashed interest rates and expanded quantitative easing programs to restore liquidity and confidence to the markets. In the U.S., the Fed launched several lending programs, funding investment-grade bonds, money market mutual funds, and commercial paper while purchasing Treasuries, mortgage-backed securities, and overnight repos. Meanwhile, stock markets tumbled quickly into a bear market, ending the longest bull stock market in U.S. history.
Don’t let short-term uncertainty derail long-term investment goals.
Periods of investment uncertainty can present challenges, but experience has taught us that maintaining long-term investment goals can be an effective way to plan for the future. To help you create a sound strategy based on your personal goals and risk tolerance, Wells Fargo Funds offers more than 100 mutual funds spanning a wide range of asset classes and investment styles. Although diversification cannot guarantee an investment profit or prevent losses, we believe it can be an effective way to manage investment risk and potentially smooth out overall portfolio performance. We encourage investors to know their investments and to understand that appropriate levels of risk-taking may unlock opportunities.
Thank you for choosing to invest with Wells Fargo Funds. We appreciate your confidence in us and remain committed to helping you meet your financial needs.
Sincerely,

Andrew Owen
President
Wells Fargo Funds
“Capital market volatility spiked in late January on concerns over the potential impact of the coronavirus on the global economy and stock markets.”
|
|
|
For further information about your Fund, contact your investment professional, visit our website at wfam.com, or call us directly at1-800-222-8222. |
Wells Fargo Common Stock Fund | 3
Performance highlights (unaudited)
Investment objective
The Fund seeks long-term capital appreciation.
Manager
Wells Fargo Funds Management, LLC
Subadviser
Wells Capital Management Incorporated
Portfolio managers
Christopher G. Miller, CFA®‡
Garth B. Newport, CFA®‡†
Average annual total returns (%) as of March 31, 2020
| | | | | | | | | | | | | | | | | | | | | | | | | | | | | | | | | | |
| | | | |
| | | | | Including sales charge | | | Excluding sales charge | | | Expense ratios1 (%) | |
| | | | | | | | | |
| | | Inception date | | 1 year | | | 5 year | | | 10 year | | | 1 year | | | 5 year | | | 10 year | | | Gross | | | Net2 | |
| | | | | | | | | | |
| Class A (SCSAX) | | 11-30-2000 | | | -29.05 | | | | -1.66 | | | | 5.61 | | | | -24.70 | | | | -0.49 | | | | 6.24 | | | | 1.27 | | | | 1.27 | |
| | | | | | | | | | |
| Class C (STSAX) | | 11-30-2000 | | | -26.33 | | | | -1.24 | | | | 5.43 | | | | -25.33 | | | | -1.24 | | | | 5.43 | | | | 2.02 | | | | 2.02 | |
| | | | | | | | | | |
| Class R6 (SCSRX)3 | | 6-28-2013 | | | – | | | | – | | | | – | | | | -24.40 | | | | -0.07 | | | | 6.66 | | | | 0.84 | | | | 0.84 | |
| | | | | | | | | | |
| Administrator Class (SCSDX)4 | | 7-30-2010 | | | – | | | | – | | | | – | | | | -24.60 | | | | -0.35 | | | | 6.39 | | | | 1.19 | | | | 1.11 | |
| | | | | | | | | | |
| Institutional Class (SCNSX)5 | | 7-30-2010 | | | – | | | | – | | | | – | | | | -24.44 | | | | -0.09 | | | | 6.64 | | | | 0.94 | | | | 0.86 | |
| | | | | | | | | | |
| Russell 2500TM Index6 | | – | | | – | | | | – | | | | – | | | | -22.47 | | | | 0.49 | | | | 7.73 | | | | – | | | | – | |
Figures quoted represent past performance, which is no guarantee of future results, and do not reflect taxes that a shareholder may pay on an investment in a fund. Investment return and principal value of an investment will fluctuate so that an investor’s shares, when redeemed, may be worth more or less than their original cost. Performance shown without sales charges would be lower if sales charges were reflected. Current performance may be lower or higher than the performance data quoted, which assumes the reinvestment of dividends and capital gains. Current month-end performance is available on the Fund’s website,wfam.com.
Index returns do not include transaction costs associated with buying and selling securities, any mutual fund fees or expenses, or any taxes. It is not possible to invest directly in an index.
For Class A shares, the maximum front-end sales charge is 5.75%. For Class C shares, the maximum contingent deferred sales charge is 1.00%. Performance including a contingent deferred sales charge assumes the sales charge for the corresponding time period. Class R6, Administrator Class, and Institutional Class shares are sold without a front-end sales charge or contingent deferred sales charge.
Stock values fluctuate in response to the activities of individual companies and general market and economic conditions. Smaller-company stocks tend to be more volatile and less liquid than those of larger companies. Certain investment strategies tend to increase the total risk of an investment (relative to the broader market). The Fund is exposed to foreign investment risk. Consult the Fund’s prospectus for additional information on these and other risks.
Please see footnotes on page 5.
4 | Wells Fargo Common Stock Fund
Performance highlights (unaudited)
| | | | |
|
| Ten largest holdings (%) as of March 31, 20207 | |
| | |
Bio-Rad Laboratories Incorporated Class A | | | 2.38 | |
| | |
CoreSite Realty Corporation | | | 2.26 | |
| | |
Sun Communities Incorporated | | | 2.21 | |
| | |
LivaNova plc | | | 2.04 | |
| | |
Carlisle Companies Incorporated | | | 1.99 | |
| | |
SBA Communications Corporation | | | 1.96 | |
| | |
AMETEK Incorporated | | | 1.94 | |
| | |
United Rentals Incorporated | | | 1.83 | |
| | |
VICI Properties Incorporated | | | 1.83 | |
| | |
Haemonetics Corporation | | | 1.82 | |
|
|
| Sector distribution as of March 31, 20208 |
|
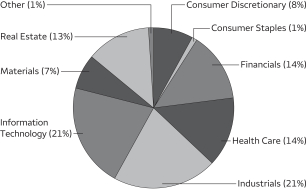 |
| ‡ | CFA® and Chartered Financial Analyst® are trademarks owned by CFA Institute. |
| † | Mr. Newport became a portfolio manager of the Fund on February 1, 2020. |
| 1 | Reflects the expense ratios as stated in the most recent prospectuses, which include the impact of 0.01% in acquired fund fees and expenses. The expense ratios shown are subject to change and may differ from the annualized expense ratios shown in the financial highlights of this report, which do not include acquired fund fees and expenses. |
| 2 | The manager has contractually committed through January 31, 2021, to waive fees and/or reimburse expenses to the extent necessary to cap total annual fund operating expenses after fee waivers at 1.26% for Class A, 2.01% for Class C, 0.83% for Class R6, 1.10% for Administrator Class, and 0.85% for Institutional Class. Brokerage commissions, stamp duty fees, interest, taxes, acquired fund fees and expenses (if any), and extraordinary expenses are excluded from the expense cap. Prior to or after the commitment expiration date, the cap may be increased or the commitment to maintain the cap may be terminated only with the approval of the Board of Trustees. Without this cap, the Fund’s returns would have been lower. The expense ratio paid by an investor is the net expense ratio (the total annual fund operating expenses after fee waivers) as stated in the prospectuses. |
| 3 | Historical performance shown for the Class R6 shares prior to their inception reflects the performance of the Institutional Class shares, and includes the higher expenses applicable to the Institutional Class shares. If these expenses had not been included, the returns for the Class R6 shares would be higher. |
| 4 | Historical performance shown for Administrator Class shares prior to their inception reflects the performance of the Class A shares, and includes the higher expenses applicable to the Class A shares. If these expenses had not been included, the returns for the Administrator Class shares would be higher. |
| 5 | Historical performance shown for the Institutional Class shares prior to their inception reflects the performance of the Class A shares, and includes the higher expenses applicable to the Class A shares. If these expenses had not been included, the returns for the Institutional Class shares would be higher. |
| 6 | The Russell 2500TM Index measures the performance of the 2,500 smallest companies in the Russell 3000® Index, which represents approximately 16% of the total market capitalization of the Russell 3000® Index. You cannot invest directly in an index. |
| 7 | The ten largest holdings, excluding cash, cash equivalents and any money market funds, are calculated based on the value of the investments divided by total net assets of the Fund. Holdings are subject to change and may have changed since the date specified. |
| 8 | Amounts are calculated based on the total long-term investments of the Fund. These amounts are subject to change and may have changed since the date specified. |
Wells Fargo Common Stock Fund | 5
Fund expenses (unaudited)
As a shareholder of the Fund, you incur two types of costs: (1) transaction costs, including sales charges (loads) on purchase payments and contingent deferred sales charges (if any) on redemptions and (2) ongoing costs, including management fees, distribution (12b-1) and/or shareholder servicing fees, and other Fund expenses. This example is intended to help you understand your ongoing costs (in dollars) of investing in the Fund and to compare these costs with the ongoing costs of investing in other mutual funds.
The example is based on an investment of $1,000 invested at the beginning of the six-month period and held for the entire period from October 1, 2019 to March 31, 2020.
Actual expenses
The “Actual” line of the table below provides information about actual account values and actual expenses. You may use the information in this line, together with the amount you invested, to estimate the expenses that you paid over the period. Simply divide your account value by $1,000 (for example, an $8,600 account value divided by $1,000 = 8.6), then multiply the result by the number in the “Actual” line under the heading entitled “Expenses paid during period” for your applicable class of shares to estimate the expenses you paid on your account during this period.
Hypothetical example for comparison purposes
The “Hypothetical” line of the table below provides information about hypothetical account values and hypothetical expenses based on the Fund’s actual expense ratio and an assumed rate of return of 5% per year before expenses, which is not the Fund’s actual return. The hypothetical account values and expenses may not be used to estimate the actual ending account balance or expenses you paid for the period. You may use this information to compare the ongoing costs of investing in the Fund and other funds. To do so, compare this 5% hypothetical example with the 5% hypothetical examples that appear in the shareholder reports of the other funds.
Please note that the expenses shown in the table are meant to highlight your ongoing costs only and do not reflect any transactional costs, such as sales charges (loads) and contingent deferred sales charges. Therefore, the “Hypothetical” line of the table is useful in comparing ongoing costs only and will not help you determine the relative total costs of owning different funds. In addition, if these transactional costs were included, your costs would have been higher.
| | | | | | | | | | | | | | | | |
| | | Beginning account value 10-1-2019 | | | Ending account value 3-31-2020 | | | Expenses paid during the period¹ | | | Annualized net expense ratio | |
| | | | | |
Class A | | | | | | | | | | | | | | | | |
| | | | |
Actual | | $ | 1,000.00 | | | $ | 717.94 | | | $ | 5.24 | | | | 1.22 | % |
| | | | |
Hypothetical (5% return before expenses) | | $ | 1,000.00 | | | $ | 1,018.90 | | | $ | 6.16 | | | | 1.22 | % |
| | | | | |
Class C | | | | | | | | | | | | | | | | |
| | | | |
Actual | | $ | 1,000.00 | | | $ | 714.74 | | | $ | 8.62 | | | | 2.01 | % |
| | | | |
Hypothetical (5% return before expenses) | | $ | 1,000.00 | | | $ | 1,014.95 | | | $ | 10.13 | | | | 2.01 | % |
| | | | | |
Class R6 | | | | | | | | | | | | | | | | |
| | | | |
Actual | | $ | 1,000.00 | | | $ | 719.20 | | | $ | 3.57 | | | | 0.83 | % |
| | | | |
Hypothetical (5% return before expenses) | | $ | 1,000.00 | | | $ | 1,020.85 | | | $ | 4.19 | | | | 0.83 | % |
| | | | | |
Administrator Class | | | | | | | | | | | | | | | | |
| | | | |
Actual | | $ | 1,000.00 | | | $ | 718.28 | | | $ | 4.73 | | | | 1.10 | % |
| | | | |
Hypothetical (5% return before expenses) | | $ | 1,000.00 | | | $ | 1,019.50 | | | $ | 5.55 | | | | 1.10 | % |
| | | | | |
Institutional Class | | | | | | | | | | | | | | | | |
| | | | |
Actual | | $ | 1,000.00 | | | $ | 719.07 | | | $ | 3.65 | | | | 0.85 | % |
| | | | |
Hypothetical (5% return before expenses) | | $ | 1,000.00 | | | $ | 1,020.75 | | | $ | 4.29 | | | | 0.85 | % |
| 1 | Expenses paid is equal to the annualized net expense ratio of each class multiplied by the average account value over the period, multiplied by the number of days in the most recent fiscal half-year divided by the number of days in the fiscal year (to reflect the one-half-year period). |
6 | Wells Fargo Common Stock Fund
Portfolio of investments—March 31, 2020 (unaudited)
| | | | | | | | | | | | | | | | |
| | | | | | | | | Shares | | | Value | |
| Common Stocks: 97.74% | | | | | | | | | | | | | | | | |
| | | | |
Consumer Discretionary: 7.70% | | | | | | | | | | | | | | | | |
| | | | |
| Auto Components: 1.22% | | | | | | | | | | | | |
Dana Incorporated | | | | | | | | | | | 1,108,908 | | | $ | 8,660,571 | |
| | | | | | | | | | | | | | | | |
| | | | |
| Diversified Consumer Services: 0.19% | | | | | | | | | | | | |
Houghton Mifflin Harcourt Company † | | | | | | | | | | | 709,296 | | | | 1,333,476 | |
| | | | | | | | | | | | | | | | |
| | | | |
| Hotels, Restaurants & Leisure: 1.28% | | | | | | | | | | | | |
Jack in the Box Incorporated | | | | | | | | | | | 179,936 | | | | 6,306,758 | |
Norwegian Cruise Line Holdings Limited † | | | | | | | | | | | 249,544 | | | | 2,735,002 | |
| | | | |
| | | | | | | | | | | | | | | 9,041,760 | |
| | | | | | | | | | | | | | | | |
| | | | |
| Household Durables: 1.02% | | | | | | | | | | | | |
Mohawk Industries Incorporated † | | | | | | | | | | | 94,561 | | | | 7,209,331 | |
| | | | | | | | | | | | | | | | |
| | | | |
| Multiline Retail: 0.43% | | | | | | | | | | | | |
Nordstrom Incorporated | | | | | | | | | | | 200,316 | | | | 3,072,847 | |
| | | | | | | | | | | | | | | | |
| | | | |
| Specialty Retail: 2.51% | | | | | | | | | | | | |
Tractor Supply Company | | | | | | | | | | | 78,604 | | | | 6,645,968 | |
Ulta Beauty Incorporated † | | | | | | | | | | | 48,264 | | | | 8,479,985 | |
Urban Outfitters Incorporated † | | | | | | | | | | | 186,511 | | | | 2,655,917 | |
| | | | |
| | | | | | | | | | | | | | | 17,781,870 | |
| | | | | | | | | | | | | | | | |
| | | | |
| Textiles, Apparel & Luxury Goods: 1.05% | | | | | | | | | | | | |
Levi Strauss & Company Class A « | | | | | | | | | | | 599,441 | | | | 7,451,052 | |
| | | | | | | | | | | | | | | | |
| | | | |
Consumer Staples: 0.95% | | | | | | | | | | | | | | | | |
| | | | |
| Household Products: 0.95% | | | | | | | | | | | | |
Church & Dwight Company Incorporated | | | | | | | | | | | 105,025 | | | | 6,740,505 | |
| | | | | | | | | | | | | | | | |
| | | | |
Financials: 13.95% | | | | | | | | | | | | | | | | |
| | | | |
| Banks: 4.10% | | | | | | | | | | | | |
Pinnacle Financial Partners Incorporated | | | | | | | | | | | 196,299 | | | | 7,369,064 | |
Sterling Bancorp | | | | | | | | | | | 757,245 | | | | 7,913,210 | |
Webster Financial Corporation | | | | | | | | | | | 290,792 | | | | 6,659,137 | |
Wintrust Financial Corporation | | | | | | | | | | | 216,988 | | | | 7,130,226 | |
| | | | |
| | | | | | | | | | | | | | | 29,071,637 | |
| | | | | | | | | | | | | | | | |
| | | | |
| Capital Markets: 2.33% | | | | | | | | | | | | |
Cboe Holdings Incorporated | | | | | | | | | | | 110,812 | | | | 9,889,971 | |
Raymond James Financial Incorporated | | | | | | | | | | | 105,202 | | | | 6,648,766 | |
| | | | |
| | | | | | | | | | | | | | | 16,538,737 | |
| | | | | | | | | | | | | | | | |
| | | | |
| Insurance: 6.45% | | | | | | | | | | | | |
Arch Capital Group Limited † | | | | | | | | | | | 194,393 | | | | 5,532,425 | |
Axis Capital Holdings Limited | | | | | | | | | | | 187,911 | | | | 7,262,760 | |
CNO Financial Group Incorporated | | | | | | | | | | | 936,155 | | | | 11,598,960 | |
Reinsurance Group of America Incorporated | | | | | | | | | | | 105,316 | | | | 8,861,288 | |
Willis Towers Watson plc | | | | | | | | | | | 73,300 | | | | 12,450,005 | |
| | | | |
| | | | | | | | | | | | | | | 45,705,438 | |
| | | | | | | | | | | | | | | | |
| | | | |
| Thrifts & Mortgage Finance: 1.07% | | | | | | | | | | | | |
Essent Group Limited | | | | | | | | | | | 287,253 | | | | 7,566,244 | |
| | | | | | | | | | | | | | | | |
The accompanying notes are an integral part of these financial statements.
Wells Fargo Common Stock Fund | 7
Portfolio of investments—March 31, 2020 (unaudited)
| | | | | | | | | | | | | | | | |
| | | | | | | | | Shares | | | Value | |
Health Care: 14.22% | | | | | | | | | | | | | | | | |
| | | | |
| Biotechnology: 1.97% | | | | | | | | | | | | |
Agios Pharmaceuticals Incorporated † | | | | | | | | | | | 64,658 | | | $ | 2,294,066 | |
BioMarin Pharmaceutical Incorporated † | | | | | | | | | | | 54,869 | | | | 4,636,431 | |
Neurocrine Biosciences Incorporated † | | | | | | | | | | | 66,693 | | | | 5,772,279 | |
Sage Therapeutics Incorporated † | | | | | | | | | | | 44,818 | | | | 1,287,173 | |
| | | | |
| | | | | | | | | | | | | | | 13,989,949 | |
| | | | | | | | | | | | | | | | |
| | | | |
| Health Care Equipment & Supplies: 5.41% | | | | | | | | | | | | |
Haemonetics Corporation † | | | | | | | | | | | 129,473 | | | | 12,903,279 | |
Hologic Incorporated † | | | | | | | | | | | 313,190 | | | | 10,992,969 | |
LivaNova plc † | | | | | | | | | | | 319,594 | | | | 14,461,629 | |
| | | | |
| | | | | | | | | | | | | | | 38,357,877 | |
| | | | | | | | | | | | | | | | |
| | | | |
| Health Care Providers & Services: 4.46% | | | | | | | | | | | | |
Humana Incorporated | | | | | | | | | | | 38,088 | | | | 11,960,394 | |
Laboratory Corporation of America Holdings † | | | | | | | | | | | 83,532 | | | | 10,557,609 | |
Universal Health Services Incorporated Class B | | | | | | | | | | | 91,467 | | | | 9,062,550 | |
| | | | |
| | | | | | | | | | | | | | | 31,580,553 | |
| | | | | | | | | | | | | | | | |
| | | | |
| Life Sciences Tools & Services: 2.38% | | | | | | | | | | | | |
Bio-Rad Laboratories Incorporated Class A † | | | | | | | | | | | 48,095 | | | | 16,860,183 | |
| | | | | | | | | | | | | | | | |
| | | | |
Industrials: 20.75% | | | | | | | | | | | | | | | | |
| | | | |
| Aerospace & Defense: 2.99% | | | | | | | | | | | | |
Hexcel Corporation | | | | | | | | | | | 296,234 | | | | 11,016,942 | |
MTU Aero Engines AG | | | | | | | | | | | 70,477 | | | | 10,190,743 | |
| | | | |
| | | | | | | | | | | | | | | 21,207,685 | |
| | | | | | | | | | | | | | | | |
| | | | |
| Building Products: 3.49% | | | | | | | | | | | | |
Armstrong World Industries Incorporated | | | | | | | | | | | 154,281 | | | | 12,252,997 | |
Masonite International Corporation † | | | | | | | | | | | 263,144 | | | | 12,486,183 | |
| | | | |
| | | | | | | | | | | | | | | 24,739,180 | |
| | | | | | | | | | | | | | | | |
| | | | |
| Commercial Services & Supplies: 2.37% | | | | | | | | | | | | |
Republic Services Incorporated | | | | | | | | | | | 90,350 | | | | 6,781,671 | |
Stericycle Incorporated † | | | | | | | | | | | 205,928 | | | | 10,003,982 | |
| | | | |
| | | | | | | | | | | | | | | 16,785,653 | |
| | | | | | | | | | | | | | | | |
| | | | |
| Electrical Equipment: 3.26% | | | | | | | | | | | | |
AMETEK Incorporated | | | | | | | | | | | 191,132 | | | | 13,765,327 | |
Sensata Technologies Holding plc † | | | | | | | | | | | 322,366 | | | | 9,326,048 | |
| | | | |
| | | | | | | | | | | | | | | 23,091,375 | |
| | | | | | | | | | | | | | | | |
| | | | |
| Industrial Conglomerates: 1.99% | | | | | | | | | | | | |
Carlisle Companies Incorporated | | | | | | | | | | | 112,549 | | | | 14,100,139 | |
| | | | | | | | | | | | | | | | |
| | | | |
| Machinery: 2.42% | | | | | | | | | | | | |
Altra Industrial Motion Corporation | | | | | | | | | | | 391,365 | | | | 6,844,974 | |
ITT Incorporated | | | | | | | | | | | 226,740 | | | | 10,284,926 | |
| | | | |
| | | | | | | | | | | | | | | 17,129,900 | |
| | | | | | | | | | | | | | | | |
| | | | |
| Road & Rail: 1.05% | | | | | | | | | | | | |
Saia Incorporated † | | | | | | | | | | | 100,891 | | | | 7,419,524 | |
| | | | | | | | | | | | | | | | |
The accompanying notes are an integral part of these financial statements.
8 | Wells Fargo Common Stock Fund
Portfolio of investments—March 31, 2020 (unaudited)
| | | | | | | | | | | | | | | | |
| | | | | | | | | Shares | | | Value | |
| Trading Companies & Distributors: 3.18% | | | | | | | | | | | | |
Air Lease Corporation | | | | | | | | | | | 433,190 | | | $ | 9,590,827 | |
United Rentals Incorporated † | | | | | | | | | | | 126,246 | | | | 12,990,713 | |
| | | | |
| | | | | | | | | | | | | | | 22,581,540 | |
| | | | | | | | | | | | | | | | |
| | | | |
Information Technology: 20.83% | | | | | | | | | | | | | | | | |
| | | | |
| IT Services: 4.05% | | | | | | | | | | | | |
Black Knight Incorporated † | | | | | | | | | | | 171,174 | | | | 9,938,362 | |
EVO Payments Incorporated Class A † | | | | | | | | | | | 432,810 | | | | 6,621,993 | |
Genpact Limited | | | | | | | | | | | 324,032 | | | | 9,461,734 | |
WEX Incorporated † | | | | | | | | | | | 25,788 | | | | 2,696,135 | |
| | | | |
| | | | | | | | | | | | | | | 28,718,224 | |
| | | | | | | | | | | | | | | | |
| | | | |
| Semiconductors & Semiconductor Equipment: 5.59% | | | | | | | | | | | | |
Brooks Automation Incorporated | | | | | | | | | | | 412,759 | | | | 12,589,150 | |
Marvell Technology Group Limited | | | | | | | | | | | 503,256 | | | | 11,388,683 | |
Maxim Integrated Products Incorporated | | | | | | | | | | | 163,674 | | | | 7,956,193 | |
ON Semiconductor Corporation † | | | | | | | | | | | 617,874 | | | | 7,686,353 | |
| | | | |
| | | | | | | | | | | | | | | 39,620,379 | |
| | | | | | | | | | | | | | | | |
| | | | |
| Software: 11.19% | | | | | | | | | | | | |
8x8 Incorporated † | | | | | | | | | | | 802,259 | | | | 11,119,310 | |
Fair Isaac Corporation † | | | | | | | | | | | 38,178 | | | | 11,746,989 | |
Medallia Incorporated † | | | | | | | | | | | 153,498 | | | | 3,076,100 | |
Nuance Communications Incorporated | | | | | | | | | | | 598,149 | | | | 10,036,940 | |
Proofpoint Incorporated † | | | | | | | | | | | 104,266 | | | | 10,696,649 | |
RealPage Incorporated † | | | | | | | | | | | 218,924 | | | | 11,587,647 | |
SPS Commerce Incorporated † | | | | | | | | | | | 211,208 | | | | 9,823,284 | |
Zendesk Incorporated † | | | | | | | | | | | 175,293 | | | | 11,220,505 | |
| | | | |
| | | | | | | | | | | | | | | 79,307,424 | |
| | | | | | | | | | | | | | | | |
| | | | |
Materials: 6.62% | | | | | | | | | | | | | | | | |
| | | | |
| Chemicals: 2.38% | | | | | | | | | | | | |
Axalta Coating Systems Limited † | | | | | | | | | | | 402,454 | | | | 6,950,381 | |
Westlake Chemical Corporation | | | | | | | | | | | 259,938 | | | | 9,921,833 | |
| | | | |
| | | | | | | | | | | | | | | 16,872,214 | |
| | | | | | | | | | | | | | | | |
| | | | |
| Containers & Packaging: 1.68% | | | | | | | | | | | | |
Crown Holdings Incorporated † | | | | | | | | | | | 204,980 | | | | 11,897,039 | |
| | | | | | | | | | | | | | | | |
| | | | |
| Metals & Mining: 2.56% | | | | | | | | | | | | |
Royal Gold Incorporated | | | | | | | | | | | 77,501 | | | | 6,797,613 | |
Steel Dynamics Incorporated | | | | | | | | | | | 502,340 | | | | 11,322,744 | |
| | | | |
| | | | | | | | | | | | | | | 18,120,357 | |
| | | | | | | | | | | | | | | | |
| | | | |
Real Estate: 12.72% | | | | | | | | | | | | | | | | |
| | | | |
| Equity REITs: 12.72% | | | | | | | | | | | | |
Camden Property Trust | | | | | | | | | | | 96,234 | | | | 7,625,582 | |
CoreSite Realty Corporation | | | | | | | | | | | 138,114 | | | | 16,007,413 | |
Four Corners Property Trust Incorporated | | | | | | | | | | | 491,112 | | | | 9,188,706 | |
Healthcare Realty Trust Incorporated | | | | | | | | | | | 279,041 | | | | 7,793,615 | |
SBA Communications Corporation | | | | | | | | | | | 51,411 | | | | 13,879,428 | |
STAG Industrial Incorporated | | | | | | | | | | | 311,320 | | | | 7,010,926 | |
The accompanying notes are an integral part of these financial statements.
Wells Fargo Common Stock Fund | 9
Portfolio of investments—March 31, 2020 (unaudited)
| | | | | | | | | | | | | | | | |
| | | | | | | | | Shares | | | Value | |
| | | | |
| Equity REITs (continued) | | | | | | | | | | | | |
Sun Communities Incorporated | | | | | | | | | | | 125,484 | | | $ | 15,666,677 | |
VICI Properties Incorporated | | | | | | | | | | | 778,098 | | | | 12,947,551 | |
| | | | |
| | | | | | | | | | | | | | | 90,119,898 | |
| | | | | | | | | | | | | | | | |
| | | | |
Total Common Stocks (Cost $744,718,710) | | | | | | | | | | | | | | | 692,672,561 | |
| | | | | | | | | | | | | | | | |
| | | | |
| Exchange-Traded Funds: 0.94% | | | | | | | | | | | | |
SPDR S&P Biotech ETF « | | | | | | | | | | | 86,171 | | | | 6,673,082 | |
| | | | | | | | | | | | | | | | |
| | | | |
Total Exchange-Traded Funds (Cost $4,423,790) | | | | | | | | | | | | | | | 6,673,082 | |
| | | | | | | | | | | | | | | | |
| | | | |
| | | | | | | | | | | | | | | | |
| | | Yield | | | | | | | | | | |
| Short-Term Investments: 2.69% | | | | | | | | | | | | | | | | |
| | | | |
| Investment Companies: 2.69% | | | | | | | | | | | | |
Securities Lending Cash Investments LLC (l)(r)(u) | | | 2.11 | % | | | | | | | 9,748,494 | | | | 9,749,470 | |
Wells Fargo Government Money Market Fund Select Class (l)(u) | | | 0.35 | | | | | | | | 9,324,809 | | | | 9,324,809 | |
| | | | |
Total Short-Term Investments (Cost $19,073,586) | | | | | | | | | | | | | | | 19,074,279 | |
| | | | | | | | | | | | | | | | |
| | | | | | | | |
| Total investments in securities (Cost $768,216,086) | | | 101.37 | % | | | 718,419,922 | |
| | |
Other assets and liabilities, net | | | (1.37 | ) | | | (9,714,895 | ) |
| | | | | | | | |
| Total net assets | | | 100.00 | % | | $ | 708,705,027 | |
| | | | | | | | |
| † | Non-income-earning security |
| « | All or a portion of this security is on loan. |
| (l) | The issuer of the security is an affiliated person of the Fund as defined in the Investment Company Act of 1940. |
| (r) | The investment is a non-registered investment company purchased with cash collateral received from securities on loan. |
| (u) | The rate represents the 7-day annualized yield at period end. |
Abbreviations:
| REIT | Real estate investment trust |
Investments in Affiliates
An affiliated investment is an investment in which the Fund owns at least 5% of the outstanding voting shares of the issuer or as a result of other relationships, such as the Fund and the issuer having the same investment manager. Transactions with issuers that were either affiliated persons of the Fund at the beginning of the period or the end of the period were as follows:
| | | | | | | | | | | | | | | | | | | | | | | | | | | | | | | | | | | | |
| | | Shares, beginning of
period | | | Shares purchased | | | Shares sold | | | Shares, end of period | | | Net realized gains (losses) | | | Net change in unrealized gains (losses) | | | Income from affiliated securities | | | Value, end of period | | | % of net assets | |
| | | | | | | | | |
| Short-Term Investments | | | | | | | | | | | | | | | | | | | | | | | | | | | |
Investment Companies | | | | | | | | | | | | | | | | | | | | | | | | | | | | | | | | | | | | |
Securities Lending Cash Investments LLC | | | 9,518,064 | | | | 71,068,809 | | | | (70,838,379 | ) | | | 9,748,494 | | | $ | (503 | ) | | $ | 457 | | | $ | 85,380 | # | | $ | 9,749,470 | | | | | |
Wells Fargo Government Money Market Fund Select Class | | | 15,119,436 | | | | 161,948,584 | | | | (167,743,211 | ) | | | 9,324,809 | | | | 0 | | | | 0 | | | | 105,145 | | | | 9,324,809 | | | | | |
| | | | | | | | | | | | | | | | | | | | | | | | | | | | | | | | | | | | |
| | | | | | | | | | | | | | | | | | $ | (503 | ) | | $ | 457 | | | $ | 190,525 | | | $ | 19,074,279 | | | | 2.69 | % |
| | | | | | | | | | | | | | | | | | | | | | | | | | | | | | | | | | | | |
| # | Amount shown represents income before fees and rebates. |
The accompanying notes are an integral part of these financial statements.
10 | Wells Fargo Common Stock Fund
Statement of assets and liabilities—March 31, 2020 (unaudited)
| | | | |
| | | | |
| |
Assets | | | | |
Investments in unaffiliated securities (including $9,472,935 of securities loaned), at value (cost $749,142,500) | | $ | 699,345,643 | |
Investments in affiliated securities, at value (cost $19,073,586) | | | 19,074,279 | |
Receivable for investments sold | | | 596,551 | |
Receivable for Fund shares sold | | | 171,628 | |
Receivable for dividends | | | 1,281,266 | |
Receivable for securities lending income, net | | | 11,014 | |
| | | | |
Total assets | | | 720,480,381 | |
| | | | |
| |
Liabilities | | | | |
Payable upon receipt of securities loaned | | | 9,747,775 | |
Payable for investments purchased | | | 718,568 | |
Payable for Fund shares redeemed | | | 317,886 | |
Management fee payable | | | 495,367 | |
Administration fees payable | | | 127,282 | |
Distribution fee payable | | | 2,533 | |
Trustees’ fees and expenses payable | | | 4,107 | |
Accrued expenses and other liabilities | | | 361,836 | |
| | | | |
Total liabilities | | | 11,775,354 | |
| | | | |
Total net assets | | $ | 708,705,027 | |
| | | | |
| |
Net assets consist of | | | | |
Paid-in capital | | $ | 752,911,178 | |
Total distributable loss | | | (44,206,151 | ) |
| | | | |
Total net assets | | $ | 708,705,027 | |
| | | | |
| |
Computation of net asset value and offering price per share | | | | |
Net assets – Class A | | $ | 576,346,247 | |
Shares outstanding – Class A1 | | | 43,326,509 | |
Net asset value per share – Class A | | | $13.30 | |
Maximum offering price per share – Class A2 | | | $14.11 | |
Net assets – Class C | | $ | 3,555,913 | |
Shares outstanding – Class C1 | | | 408,533 | |
Net asset value per share – Class C | | | $8.70 | |
Net assets – Class R6 | | $ | 25,943,814 | |
Shares outstanding – Class R61 | | | 1,823,847 | |
Net asset value per share – Class R6 | | | $14.22 | |
Net assets – Administrator Class | | $ | 1,619,387 | |
Shares outstanding – Administrator Class1 | | | 118,686 | |
Net asset value per share – Administrator Class | | | $13.64 | |
Net assets – Institutional Class | | $ | 101,239,666 | |
Shares outstanding – Institutional Class1 | | | 7,142,385 | |
Net asset value per share – Institutional Class | | | $14.17 | |
| 1 | The Fund has an unlimited number of authorized shares. |
| 2 | Maximum offering price is computed as 100/94.25 of net asset value. On investments of $50,000 or more, the offering price is reduced. |
The accompanying notes are an integral part of these financial statements.
Wells Fargo Common Stock Fund | 11
Statement of operations—six months ended March 31, 2020 (unaudited)
| | | | |
| | | | |
| |
Investment income | | | | |
Dividends | | $ | 6,722,865 | |
Income from affiliated securities | | | 130,553 | |
| | | | |
Total investment income | | | 6,853,418 | |
| | | | |
| |
Expenses | | | | |
Management fee | | | 4,001,509 | |
Administration fees | | | | |
Class A | | | 880,549 | |
Class C | | | 6,145 | |
Class R6 | | | 5,585 | |
Administrator Class | | | 2,054 | |
Institutional Class | | | 100,042 | |
Shareholder servicing fees | | | | |
Class A | | | 1,048,255 | |
Class C | | | 7,315 | |
Administrator Class | | | 3,937 | |
Distribution fee | | | | |
Class C | | | 21,877 | |
Custody and accounting fees | | | 35,096 | |
Professional fees | | | 25,968 | |
Registration fees | | | 40,108 | |
Shareholder report expenses | | | 35,096 | |
Trustees’ fees and expenses | | | 11,029 | |
Other fees and expenses | | | 19,526 | |
| | | | |
Total expenses | | | 6,244,091 | |
Less: Fee waivers and/or expense reimbursements | | | | |
Fund-level | | | (131,655 | ) |
Class A | | | (98,607 | ) |
Administrator Class | | | (654 | ) |
Institutional Class | | | (31,676 | ) |
| | | | |
Net expenses | | | 5,981,499 | |
| | | | |
Net investment income | | | 871,919 | |
| | | | |
| |
Realized and unrealized gains (losses) on investments | | | | |
Net realized gains (losses) on | | | | |
Unaffiliated securities | | | 29,521,755 | |
Affiliated securities | | | (503 | ) |
| | | | |
Net realized gains on investments | | | 29,521,252 | |
| | | | |
| |
Net change in unrealized gains (losses) on | | | | |
Unaffiliated securities | | | (313,164,426 | ) |
Affiliated securities | | | 457 | |
| | | | |
Net change in unrealized gains (losses) on investments | | | (313,163,969 | ) |
| | | | |
Net realized and unrealized gains (losses) on investments | | | (283,642,717 | ) |
| | | | |
Net decrease in net assets resulting from operations | | $ | (282,770,798 | ) |
| | | | |
The accompanying notes are an integral part of these financial statements.
12 | Wells Fargo Common Stock Fund
Statement of changes in net assets
| | | | | | | | | | | | | | | | |
| | | Six months ended
March 31, 2020
(unaudited) | | | Year ended
September 30, 2019 | |
| | | |
Operations | | | | | | | | | | | | |
Net investment income | | | | | | $ | 871,919 | | | | | | | $ | 399,291 | |
Net realized gains on investments | | | | | | | 29,521,252 | | | | | | | | 120,517,533 | |
Net change in unrealized gains (losses) on investments | | | | | | | (313,163,969 | ) | | | | | | | (119,779,061 | ) |
| | | | |
Net increase (decrease) in net assets resulting from operations | | | | | | | (282,770,798 | ) | | | | | | | 1,137,763 | |
| | | | |
| | | | |
Distributions to shareholders from net investment income and net realized gains | | | | | | | | | | | | | | | | |
Class A | | | | | | | (106,772,268 | ) | | | | | | | (128,198,379 | ) |
Class C | | | | | | | (1,096,288 | ) | | | | | | | (2,840,840 | ) |
Class R6 | | | | | | | (4,612,059 | ) | | | | | | | (4,757,555 | ) |
Administrator Class | | | | | | | (452,132 | ) | | | | | | | (749,896 | ) |
Institutional Class | | | | | | | (18,968,188 | ) | | | | | | | (20,825,630 | ) |
| | | | |
Total distributions to shareholders | | | | | | | (131,900,935 | ) | | | | | | | (157,372,300 | ) |
| | | | |
| | | | |
Capital share transactions | | | Shares | | | | | | | | Shares | | | | | |
Proceeds from shares sold | | | | | | | | | | | | | | | | |
Class A | | | 440,170 | | | | 8,253,812 | | | | 957,344 | | | | 19,146,985 | |
Class C | | | 19,225 | | | | 243,926 | | | | 120,120 | | | | 1,584,422 | |
Class R6 | | | 307,275 | | | | 6,433,640 | | | | 410,149 | | | | 9,044,599 | |
Administrator Class | | | 26,636 | | | | 543,177 | | | | 7,616 | | | | 156,460 | |
Institutional Class | | | 584,525 | | | | 11,995,032 | | | | 958,488 | | | | 21,044,807 | |
| | | | |
| | | | | | | 27,469,587 | | | | | | | | 50,977,273 | |
| | | | |
Reinvestment of distributions | | | | | | | | | | | | | | | | |
Class A | | | 5,292,160 | | | | 101,875,797 | | | | 6,577,466 | | | | 122,340,875 | |
Class C | | | 74,887 | | | | 945,077 | | | | 202,645 | | | | 2,648,573 | |
Class R6 | | | 222,029 | | | | 4,582,449 | | | | 240,179 | | | | 4,729,116 | |
Administrator Class | | | 20,980 | | | | 414,636 | | | | 36,844 | | | | 700,411 | |
Institutional Class | | | 903,544 | | | | 18,584,525 | | | | 1,038,739 | | | | 20,390,438 | |
| | | | |
| | | | | | | 126,402,484 | | | | | | | | 150,809,413 | |
| | | | |
Payment for shares redeemed | | | | | | | | | | | | | | | | |
Class A | | | (3,711,026 | ) | | | (68,751,933 | ) | | | (5,755,346 | ) | | | (115,611,722 | ) |
Class C | | | (224,032 | ) | | | (3,027,451 | ) | | | (683,062 | ) | | | (9,629,160 | ) |
Class R6 | | | (316,345 | ) | | | (6,263,596 | ) | | | (453,488 | ) | | | (10,013,010 | ) |
Administrator Class | | | (94,607 | ) | | | (1,756,927 | ) | | | (124,075 | ) | | | (2,358,961 | ) |
Institutional Class | | | (1,488,805 | ) | | | (28,056,993 | ) | | | (1,546,702 | ) | | | (33,665,647 | ) |
| | | | |
| | | | | | | (107,856,900 | ) | | | | | | | (171,278,500 | ) |
| | | | |
Net increase in net assets resulting from capital share transactions | | | | | | | 46,015,171 | | | | | | | | 30,508,186 | |
| | | | |
Total decrease in net assets | | | | | | | (368,656,562 | ) | | | | | | | (125,726,351 | ) |
| | | | |
| | |
Net assets | | | | | | | | |
Beginning of period | | | | | | | 1,077,361,589 | | | | | | | | 1,203,087,940 | |
| | | | |
End of period | | | | | | $ | 708,705,027 | | | | | | | $ | 1,077,361,589 | |
| | | | |
The accompanying notes are an integral part of these financial statements.
Wells Fargo Common Stock Fund | 13
Financial highlights
(For a share outstanding throughout each period)
| | | | | | | | | | | | | | | | | | | | | | | | |
| | | Six months ended
March 31, 2020
(unaudited) | | | Year ended September 30 | |
| CLASS A | | 2019 | | | 2018 | | | 2017 | | | 2016 | | | 2015 | |
Net asset value, beginning of period | | | $21.07 | | | | $24.58 | | | | $24.06 | | | | $21.50 | | | | $21.62 | | | | $24.79 | |
Net investment income (loss) | | | 0.01 | | | | (0.01 | ) | | | (0.04 | ) | | | (0.09 | ) | | | (0.01 | )1 | | | (0.04 | )1 |
Net realized and unrealized gains (losses) on investments | | | (5.14 | ) | | | (0.20 | ) | | | 3.10 | | | | 3.48 | | | | 2.45 | | | | (0.32 | ) |
| | | | | | | | | | | | | | | | | | | | | | | | |
Total from investment operations | | | (5.13 | ) | | | (0.21 | ) | | | 3.06 | | | | 3.39 | | | | 2.44 | | | | (0.36 | ) |
Distributions to shareholders from | | | | | | | | | | | | | | | | | | | | | | | | |
Net investment income | | | (0.00 | )2 | | | 0.00 | | | | 0.00 | | | | 0.00 | | | | 0.00 | | | | 0.00 | |
Net realized gains | | | (2.64 | ) | | | (3.30 | ) | | | (2.54 | ) | | | (0.83 | ) | | | (2.56 | ) | | | (2.81 | ) |
| | | | | | | | | | | | | | | | | | | | | | | | |
Total distributions to shareholders | | | (2.64 | ) | | | (3.30 | ) | | | (2.54 | ) | | | (0.83 | ) | | | (2.56 | ) | | | (2.81 | ) |
Net asset value, end of period | | | $13.30 | | | | $21.07 | | | | $24.58 | | | | $24.06 | | | | $21.50 | | | | $21.62 | |
Total return3 | | | (28.21 | )% | | | 0.91 | % | | | 13.62 | % | | | 16.10 | % | | | 12.43 | % | | | (1.76 | )% |
Ratios to average net assets (annualized) | | | | | | | | | | | | | | | | | | | | | | | | |
Gross expenses | | | 1.26 | % | | | 1.26 | % | | | 1.25 | % | | | 1.25 | % | | | 1.25 | % | | | 1.27 | % |
Net expenses | | | 1.22 | % | | | 1.26 | % | | | 1.25 | % | | | 1.25 | % | | | 1.25 | % | | | 1.26 | % |
Net investment income (loss) | | | 0.11 | % | | | (0.03 | )% | | | (0.18 | )% | | | (0.38 | )% | | | (0.05 | )% | | | (0.19 | )% |
Supplemental data | | | | | | | | | | | | | | | | | | | | | | | | |
Portfolio turnover rate | | | 37 | % | | | 40 | % | | | 33 | % | | | 35 | % | | | 32 | % | | | 51 | % |
Net assets, end of period (000s omitted) | | | $576,346 | | | | $870,369 | | | | $971,731 | | | | $942,596 | | | | $924,864 | | | | $127,732 | |
| 1 | Calculated based upon average shares outstanding |
| 2 | Amount is less than $0.005. |
| 3 | Total return calculations do not include any sales charges. Returns for periods of less than one year are not annualized. |
The accompanying notes are an integral part of these financial statements.
14 | Wells Fargo Common Stock Fund
Financial highlights
(For a share outstanding throughout each period)
| | | | | | | | | | | | | | | | | | | | | | | | |
| | | Six months ended
March 31, 2020
(unaudited) | | | Year ended September 30 | |
| CLASS C | | 2019 | | | 2018 | | | 2017 | | | 2016 | | | 2015 | |
Net asset value, beginning of period | | | $14.72 | | | | $18.40 | | | | $18.75 | | | | $17.04 | | | | $17.77 | | | | $21.02 | |
Net investment loss | | | (0.05 | )1 | | | (0.11 | )1 | | | (0.17 | )1 | | | (0.20 | )1 | | | (0.14 | )1 | | | (0.18 | ) |
Net realized and unrealized gains (losses) on investments | | | (3.33 | ) | | | (0.27 | ) | | | 2.36 | | | | 2.74 | | | | 1.97 | | | | (0.26 | ) |
| | | | | | | | | | | | | | | | | | | | | | | | |
Total from investment operations | | | (3.38 | ) | | | (0.38 | ) | | | 2.19 | | | | 2.54 | | | | 1.83 | | | | (0.44 | ) |
Distributions to shareholders from | | | | | | | | | | | | | | | | | | | | | | | | |
Net realized gains | | | (2.64 | ) | | | (3.30 | ) | | | (2.54 | ) | | | (0.83 | ) | | | (2.56 | ) | | | (2.81 | ) |
Net asset value, end of period | | | $8.70 | | | | $14.72 | | | | $18.40 | | | | $18.75 | | | | $17.04 | | | | $17.77 | |
Total return2 | | | (28.53 | )% | | | 0.17 | % | | | 12.74 | % | | | 15.29 | % | | | 11.52 | % | | | (2.49 | )% |
Ratios to average net assets (annualized) | | | | | | | | | | | | | | | | | | | | | | | | |
Gross expenses | | | 2.01 | % | | | 2.01 | % | | | 2.00 | % | | | 2.00 | % | | | 2.00 | % | | | 2.02 | % |
Net expenses | | | 2.01 | % | | | 2.01 | % | | | 2.00 | % | | | 2.00 | % | | | 2.00 | % | | | 2.00 | % |
Net investment loss | | | (0.71 | )% | | | (0.78 | )% | | | (0.94 | )% | | | (1.14 | )% | | | (0.87 | )% | | | (0.93 | )% |
Supplemental data | | | | | | | | | | | | | | | | | | | | | | | | |
Portfolio turnover rate | | | 37 | % | | | 40 | % | | | 33 | % | | | 35 | % | | | 32 | % | | | 51 | % |
Net assets, end of period (000s omitted) | | | $3,556 | | | | $7,925 | | | | $16,541 | | | | $18,978 | | | | $22,902 | | | | $25,668 | |
| 1 | Calculated based upon average shares outstanding |
| 2 | Total return calculations do not include any sales charges. Returns for periods of less than one year are not annualized. |
The accompanying notes are an integral part of these financial statements.
Wells Fargo Common Stock Fund | 15
Financial highlights
(For a share outstanding throughout each period)
| | | | | | | | | | | | | | | | | | | | | | | | |
| | | Six months ended
March 31, 2020
(unaudited) | | | Year ended September 30 | |
| CLASS R6 | | 2019 | | | 2018 | | | 2017 | | | 2016 | | | 2015 | |
Net asset value, beginning of period | | | $22.39 | | | | $25.80 | | | | $25.03 | | | | $22.25 | | | | $22.20 | | | | $25.27 | |
Net investment income | | | 0.05 | 1 | | | 0.09 | 1 | | | 0.05 | 1 | | | 0.01 | | | | 0.07 | 1 | | | 0.05 | |
Net realized and unrealized gains (losses) on investments | | | (5.50 | ) | | | (0.20 | ) | | | 3.26 | | | | 3.60 | | | | 2.54 | | | | (0.31 | ) |
| | | | | | | | | | | | | | | | | | | | | | | | |
Total from investment operations | | | (5.45 | ) | | | (0.11 | ) | | | 3.31 | | | | 3.61 | | | | 2.61 | | | | (0.26 | ) |
Distributions to shareholders from | | | | | | | | | | | | | | | | | | | | | | | | |
Net investment income | | | (0.08 | ) | | | 0.00 | | | | 0.00 | | | | 0.00 | | | | 0.00 | | | | 0.00 | |
Net realized gains | | | (2.64 | ) | | | (3.30 | ) | | | (2.54 | ) | | | (0.83 | ) | | | (2.56 | ) | | | (2.81 | ) |
| | | | | | | | | | | | | | | | | | | | | | | | |
Total distributions to shareholders | | | (2.72 | ) | | | (3.30 | ) | | | (2.54 | ) | | | (0.83 | ) | | | (2.56 | ) | | | (2.81 | ) |
Net asset value, end of period | | | $14.22 | | | | $22.39 | | | | $25.80 | | | | $25.03 | | | | $22.25 | | | | $22.20 | |
Total return2 | | | (28.08 | )% | | | 1.31 | % | | | 14.12 | % | | | 16.56 | % | | | 12.91 | % | | | (1.29 | )% |
Ratios to average net assets (annualized) | | | | | | | | | | | | | | | | | | | | | | | | |
Gross expenses | | | 0.83 | % | | | 0.83 | % | | | 0.82 | % | | | 0.82 | % | | | 0.82 | % | | | 0.80 | % |
Net expenses | | | 0.83 | % | | | 0.83 | % | | | 0.82 | % | | | 0.82 | % | | | 0.82 | % | | | 0.80 | % |
Net investment income | | | 0.50 | % | | | 0.40 | % | | | 0.20 | % | | | 0.05 | % | | | 0.32 | % | | | 0.28 | % |
Supplemental data | | | | | | | | | | | | | | | | | | | | | | | | |
Portfolio turnover rate | | | 37 | % | | | 40 | % | | | 33 | % | | | 35 | % | | | 32 | % | | | 51 | % |
Net assets, end of period (000s omitted) | | | $25,944 | | | | $36,069 | | | | $36,477 | | | | $115,641 | | | | $101,436 | | | | $95,037 | |
| 1 | Calculated based upon average shares outstanding |
| 2 | Returns for periods of less than one year are not annualized. |
The accompanying notes are an integral part of these financial statements.
16 | Wells Fargo Common Stock Fund
Financial highlights
(For a share outstanding throughout each period)
| | | | | | | | | | | | | | | | | | | | | | | | |
| | | Six months ended
March 31, 2020
(unaudited) | | | Year ended September 30 | |
| ADMINISTRATOR CLASS | | 2019 | | | 2018 | | | 2017 | | | 2016 | | | 2015 | |
Net asset value, beginning of period | | | $21.56 | | | | $25.04 | | | | $24.42 | | | | $21.78 | | | | $21.84 | | | | $24.98 | |
Net investment income (loss) | | | 0.02 | 1 | | | 0.03 | | | | (0.01 | )1 | | | (0.06 | )1 | | | 0.02 | | | | (0.01 | )1 |
Net realized and unrealized gains (losses) on investments | | | (5.27 | ) | | | (0.21 | ) | | | 3.17 | | | | 3.53 | | | | 2.48 | | | | (0.32 | ) |
| | | | | | | | | | | | | | | | | | | | | | | | |
Total from investment operations | | | (5.25 | ) | | | (0.18 | ) | | | 3.16 | | | | 3.47 | | | | 2.50 | | | | (0.33 | ) |
Distributions to shareholders from | | | | | | | | | | | | | | | | | | | | | | | | |
Net investment income | | | (0.03 | ) | | | 0.00 | | | | 0.00 | | | | 0.00 | | | | 0.00 | | | | 0.00 | |
Net realized gains | | | (2.64 | ) | | | (3.30 | ) | | | (2.54 | ) | | | (0.83 | ) | | | (2.56 | ) | | | (2.81 | ) |
| | | | | | | | | | | | | | | | | | | | | | | | |
Total distributions to shareholders | | | (2.67 | ) | | | (3.30 | ) | | | (2.54 | ) | | | (0.83 | ) | | | (2.56 | ) | | | (2.81 | ) |
Net asset value, end of period | | | $13.64 | | | | $21.56 | | | | $25.04 | | | | $24.42 | | | | $21.78 | | | | $21.84 | |
Total return2 | | | (28.17 | )% | | | 1.03 | % | | | 13.84 | % | | | 16.26 | % | | | 12.59 | % | | | (1.62 | )% |
Ratios to average net assets (annualized) | | | | | | | | | | | | | | | | | | | | | | | | |
Gross expenses | | | 1.18 | % | | | 1.18 | % | | | 1.17 | % | | | 1.17 | % | | | 1.17 | % | | | 1.12 | % |
Net expenses | | | 1.10 | % | | | 1.10 | % | | | 1.10 | % | | | 1.10 | % | | | 1.10 | % | | | 1.10 | % |
Net investment income (loss) | | | 0.17 | % | | | 0.14 | % | | | (0.04 | )% | | | (0.27 | )% | | | 0.03 | % | | | (0.03 | )% |
Supplemental data | | | | | | | | | | | | | | | | | | | | | | | | |
Portfolio turnover rate | | | 37 | % | | | 40 | % | | | 33 | % | | | 35 | % | | | 32 | % | | | 51 | % |
Net assets, end of period (000s omitted) | | | $1,619 | | | | $3,572 | | | | $6,141 | | | | $6,336 | | | | $16,720 | | | | $18,050 | |
| 1 | Calculated based upon average shares outstanding |
| 2 | Returns for periods of less than one year are not annualized. |
The accompanying notes are an integral part of these financial statements.
Wells Fargo Common Stock Fund | 17
Financial highlights
(For a share outstanding throughout each period)
| | | | | | | | | | | | | | | | | | | | | | | | |
| | | Six months ended
March 31, 2020
(unaudited) | | | Year ended September 30 | |
| INSTITUTIONAL CLASS | | 2019 | | | 2018 | | | 2017 | | | 2016 | | | 2015 | |
Net asset value, beginning of period | | | $22.32 | | | | $25.73 | | | | $24.97 | | | | $22.20 | | | | $22.16 | | | | $25.25 | |
Net investment income | | | 0.04 | | | | 0.08 | 1 | | | 0.05 | 1 | | | 0.00 | 1,2 | | | 0.06 | 1 | | | 0.03 | |
Net realized and unrealized gains (losses) on investments | | | (5.47 | ) | | | (0.19 | ) | | | 3.25 | | | | 3.60 | | | | 2.54 | | | | (0.31 | ) |
| | | | | | | | | | | | | | | | | | | | | | | | |
Total from investment operations | | | (5.43 | ) | | | (0.11 | ) | | | 3.30 | | | | 3.60 | | | | 2.60 | | | | (0.28 | ) |
Distributions to shareholders from | | | | | | | | | | | | | | | | | | | | | | | | |
Net investment income | | | (0.08 | ) | | | 0.00 | | | | 0.00 | | | | 0.00 | | | | 0.00 | | | | 0.00 | |
Net realized gains | | | (2.64 | ) | | | (3.30 | ) | | | (2.54 | ) | | | (0.83 | ) | | | (2.56 | ) | | | (2.81 | ) |
| | | | | | | | | | | | | | | | | | | | | | | | |
Total distributions to shareholders | | | (2.72 | ) | | | (3.30 | ) | | | (2.54 | ) | | | (0.83 | ) | | | (2.56 | ) | | | (2.81 | ) |
Net asset value, end of period | | | $14.17 | | | | $22.32 | | | | $25.73 | | | | $24.97 | | | | $22.20 | | | | $22.16 | |
Total return3 | | | (28.09 | )% | | | 1.31 | % | | | 14.12 | % | | | 16.55 | % | | | 12.88 | % | | | (1.38 | )% |
Ratios to average net assets (annualized) | | | | | | | | | | | | | | | | | | | | | | | | |
Gross expenses | | | 0.93 | % | | | 0.93 | % | | | 0.92 | % | | | 0.92 | % | | | 0.92 | % | | | 0.86 | % |
Net expenses | | | 0.85 | % | | | 0.85 | % | | | 0.85 | % | | | 0.85 | % | | | 0.85 | % | | | 0.85 | % |
Net investment income | | | 0.46 | % | | | 0.37 | % | | | 0.21 | % | | | 0.02 | % | | | 0.28 | % | | | 0.24 | % |
Supplemental data | | | | | | | | | | | | | | | | | | | | | | | | |
Portfolio turnover rate | | | 37 | % | | | 40 | % | | | 33 | % | | | 35 | % | | | 32 | % | | | 51 | % |
Net assets, end of period (000s omitted) | | | $101,240 | | | | $159,426 | | | | $172,197 | | | | $167,552 | | | | $173,175 | | | | $226,729 | |
| 1 | Calculated based upon average shares outstanding |
| 2 | Amount is less than $0.005. |
| 3 | Returns for periods of less than one year are not annualized. |
The accompanying notes are an integral part of these financial statements.
18 | Wells Fargo Common Stock Fund
Notes to financial statements (unaudited)
1. ORGANIZATION
Wells Fargo Funds Trust (the “Trust”), a Delaware statutory trust organized on March 10, 1999, is an open-end management investment company registered under the Investment Company Act of 1940, as amended (the “1940 Act”). As an investment company, the Trust follows the accounting and reporting guidance in Financial Accounting Standards Board (“FASB”) Accounting Standards Codification Topic 946, Financial Services – Investment Companies. These financial statements report on the Wells Fargo Common Stock Fund (the “Fund”) which is a diversified series of the Trust.
2. SIGNIFICANT ACCOUNTING POLICIES
The following significant accounting policies, which are consistently followed in the preparation of the financial statements of the Fund, are in conformity with U.S. generally accepted accounting principles which require management to make estimates and assumptions that affect the reported amounts of assets and liabilities, disclosure of contingent assets and liabilities at the date of the financial statements, and the reported amounts of revenues and expenses during the reporting period. Actual results could differ from those estimates.
Securities valuation
All investments are valued each business day as of the close of regular trading on the New York Stock Exchange (generally 4 p.m. Eastern Time), although the Fund may deviate from this calculation time under unusual or unexpected circumstances.
Equity securities that are listed on a foreign or domestic exchange or market are valued at the official closing price or, if none, the last sales price. If no sale occurs on the principal exchange or market that day, a fair value price will be determined in accordance with the Fund’s Valuation Procedures.
The values of securities denominated in foreign currencies are translated into U.S. dollars at rates provided by an independent foreign currency pricing source at a time each business day specified by the Wells Fargo Asset Management Pricing Committee at Wells Fargo Funds Management, LLC (“Funds Management”).
Many securities markets and exchanges outside the U.S. close prior to the close of the New York Stock Exchange and therefore may not fully reflect trading or events that occur after the close of the principal exchange in which the foreign securities are traded, but before the close of the New York Stock Exchange. If such trading or events are expected to materially affect the value of such securities, then fair value pricing procedures approved by the Board of Trustees of the Fund are applied. These procedures take into account multiple factors including movements in U.S. securities markets after foreign exchanges close. Foreign securities that are fair valued under these procedures are categorized as Level 2 and the application of these procedures may result in transfers between Level 1 and Level 2. Depending on market activity, such fair valuations may be frequent. Such fair value pricing may result in net asset values that are higher or lower than net asset values based on the last reported sales price or latest quoted bid price. On March 31, 2020, such fair value pricing was used in pricing certain foreign securities.
Investments in registered open-end investment companies are valued at net asset value. Interests in non-registered investment companies that are redeemable at net asset value are fair valued normally at net asset value.
Investments which are not valued using any of the methods discussed above are valued at their fair value, as determined in good faith by the Board of Trustees. The Board of Trustees has established a Valuation Committee comprised of the Trustees and has delegated to it the authority to take any actions regarding the valuation of portfolio securities that the Valuation Committee deems necessary or appropriate, including determining the fair value of portfolio securities, unless the determination has been delegated to the Wells Fargo Asset Management Pricing Committee. The Board of Trustees retains the authority to make or ratify any valuation decisions or approve any changes to the Valuation Procedures as it deems appropriate. On a quarterly basis, the Board of Trustees receives reports on any valuation actions taken by the Valuation Committee or the Wells Fargo Asset Management Pricing Committee which may include items for ratification.
Foreign currency translation
The accounting records of the Fund are maintained in U.S. dollars. The values of other assets and liabilities denominated in foreign currencies are translated into U.S. dollars at rates provided by an independent foreign currency pricing source at a time each business day specified by the Wells Fargo Asset Management Pricing Committee. Purchases and sales of securities, and income and expenses are converted at the rate of exchange on the respective dates of such transactions. Net realized foreign exchange gains or losses arise from sales of foreign currencies, currency gains or losses realized between the trade and settlement dates on securities transactions, and the difference between the amounts of dividends, interest and foreign withholding taxes recorded and the U.S. dollar equivalent of the amounts actually paid or received. Net unrealized foreign exchange gains and losses arise from changes in the fair value of assets and liabilities other than investments in securities resulting from changes in exchange rates. The changes in net assets arising from changes in exchange rates of securities and the changes in net assets resulting from changes in market prices of securities are not separately presented. Such changes are included in net realized and unrealized gains or losses from investments.
Wells Fargo Common Stock Fund | 19
Notes to financial statements (unaudited)
Securities lending
The Fund may lend its securities from time to time in order to earn additional income in the form of fees or interest on securities received as collateral or the investment of any cash received as collateral. When securities are on loan, the Fund receives interest or dividends on those securities. Cash collateral received in connection with its securities lending transactions is invested in Securities Lending Cash Investments, LLC (the “Securities Lending Fund”). Investments in Securities Lending Fund are valued at the evaluated bid price provided by an independent pricing service. Income earned from investment in the Securities Lending Fund (net of fees and rebates), if any, is included in income from affiliated securities on the Statement of Operations.
In a securities lending transaction, the net asset value of the Fund is affected by an increase or decrease in the value of the securities loaned and by an increase or decrease in the value of the instrument in which collateral is invested. The amount of securities lending activity undertaken by the Fund fluctuates from time to time. The Fund has the right under the lending agreement to recover the securities from the borrower on demand. In the event of default or bankruptcy by the borrower, the Fund may be prevented from recovering the loaned securities or gaining access to the collateral or may experience delays or costs in doing so. In such an event, the terms of the agreement allows the unaffiliated securities lending agent to use the collateral to purchase replacement securities on behalf of the Fund or pay the Fund the market value of the loaned securities. The Fund bears the risk of loss with respect to depreciation of its investment of the cash collateral.
Security transactions and income recognition
Securities transactions are recorded on a trade date basis. Realized gains or losses are recorded on the basis of identified cost.
Dividend income is recognized on the ex-dividend date.
Income dividends and capital gain distributions from investment companies are recorded on the ex-dividend date. Capital gain distributions from investment companies are treated as realized gains.
Distributions to shareholders
Distributions to shareholders from net investment income and any net realized gains are recorded on the ex-dividend date and paid at least annually. Such distributions are determined in accordance with income tax regulations and may differ from U.S. generally accepted accounting principles. Dividend sources are estimated at the time of declaration. The tax character of distributions is determined as of the Fund’s fiscal year end. Therefore, a portion of the Fund’s distributions made prior to the Fund’s fiscal year end may be categorized as a tax return of capital at year end.
Federal and other taxes
The Fund intends to continue to qualify as a regulated investment company by distributing substantially all of its investment company taxable income and any net realized capital gains (after reduction for capital loss carryforwards) sufficient to relieve it from all, or substantially all, federal income taxes. Accordingly, no provision for federal income taxes was required.
The Fund’s income and federal excise tax returns and all financial records supporting those returns for the prior three fiscal years are subject to examination by the federal and Delaware revenue authorities. Management has analyzed the Fund’s tax positions taken on federal, state, and foreign tax returns for all open tax years and does not believe that there are any uncertain tax positions that require recognition of a tax liability.
As of March 31, 2020, the aggregate cost of all investments for federal income tax purposes was $758,705,233 and the unrealized gains (losses) consisted of:
| | | | |
| |
Gross unrealized gains | | $ | 109,987,728 | |
| |
Gross unrealized losses | | | (150,273,039 | ) |
| |
Net unrealized losses | | $ | (40,285,311 | ) |
Class allocations
The separate classes of shares offered by the Fund differ principally in applicable sales charges, distribution, shareholder servicing, and administration fees. Class specific expenses are charged directly to that share class. Investment income, common fund-level expenses, and realized and unrealized gains (losses) on investments are allocated daily to each class of shares based on the relative proportion of net assets of each class.
3. FAIR VALUATION MEASUREMENTS
Fair value measurements of investments are determined within a framework that has established a fair value hierarchy based upon the various data inputs utilized in determining the value of the Fund’s investments. The three-level hierarchy gives the
20 | Wells Fargo Common Stock Fund
Notes to financial statements (unaudited)
highest priority to unadjusted quoted prices in active markets for identical assets or liabilities (Level 1) and the lowest priority to unobservable inputs (Level 3). The Fund’s investments are classified within the fair value hierarchy based on the lowest level of input that is significant to the fair value measurement. The inputs are summarized into three broad levels as follows:
| ∎ | | Level 1 – quoted prices in active markets for identical securities |
| ∎ | | Level 2 – other significant observable inputs (including quoted prices for similar securities, interest rates, prepayment speeds, credit risk, etc.) |
| ∎ | | Level 3 – significant unobservable inputs (including the Fund’s own assumptions in determining the fair value of investments) |
The inputs or methodologies used for valuing investments in securities are not necessarily an indication of the risk associated with investing in those securities.
The following is a summary of the inputs used in valuing the Fund’s assets and liabilities as of March 31, 2020:
| | | | | | | | | | | | | | | | |
| | | | |
| | | Quoted prices (Level 1) | | | Other significant observable inputs (Level 2) | | | Significant unobservable inputs (Level 3) | | | Total | |
| | | | |
Assets | | | | | | | | | | | | | | | | |
Investments in: | | | | | | | | | | | | | | | | |
| | | | |
Common stocks | | | | | | | | | | | | | | | | |
| | | | |
Consumer discretionary | | $ | 54,550,907 | | | $ | 0 | | | $ | 0 | | | $ | 54,550,907 | |
| | | | |
Consumer staples | | | 6,740,505 | | | | 0 | | | | 0 | | | | 6,740,505 | |
| | | | |
Financials | | | 98,882,056 | | | | 0 | | | | 0 | | | | 98,882,056 | |
| | | | |
Health care | | | 100,788,562 | | | | 0 | | | | 0 | | | | 100,788,562 | |
| | | | |
Industrials | | | 136,864,253 | | | | 10,190,743 | | | | 0 | | | | 147,054,996 | |
| | | | |
Information technology | | | 147,646,027 | | | | 0 | | | | 0 | | | | 147,646,027 | |
| | | | |
Materials | | | 46,889,610 | | | | 0 | | | | 0 | | | | 46,889,610 | |
| | | | |
Real estate | | | 90,119,898 | | | | 0 | | | | 0 | | | | 90,119,898 | |
| | | | |
Exchange-traded funds | | | 6,673,082 | | | | 0 | | | | 0 | | | | 6,673,082 | |
| | | | |
Short-term investments | | | | | | | | | | | | | | | | |
| | | | |
Investment companies | | | 19,074,279 | | | | 0 | | | | 0 | | | | 19,074,279 | |
| | | | |
Total assets | | $ | 708,229,179 | | | $ | 10,190,743 | | | $ | 0 | | | $ | 718,419,922 | |
Additional sector, industry or geographic detail is included in the Portfolio of Investments.
For the six months ended March 31, 2020, the Fund did not have any transfers into/out of Level 3.
4. TRANSACTIONS WITH AFFILIATES
Management fee
Funds Management, an indirect wholly owned subsidiary of Wells Fargo & Company (“Wells Fargo”), is the manager of the Fund and provides advisory and fund-level administrative services under an investment management agreement. Under the investment management agreement, Funds Management is responsible for, among other services, implementing the investment objectives and strategies of the Fund, supervising the subadviser and providing fund-level administrative services in connection with the Fund’s operations. As compensation for its services under the investment management agreement, Funds Management is entitled to receive a management fee at the following annual rate based on the Fund’s average daily net assets:
| | | | |
| |
| Average daily net assets | | Management fee | |
| |
First $500 million | | | 0.800 | % |
| |
Next $500 million | | | 0.750 | |
| |
Next $1 billion | | | 0.700 | |
| |
Next $2 billion | | | 0.675 | |
| |
Next $1 billion | | | 0.650 | |
| |
Next $5 billion | | | 0.640 | |
| |
Over $10 billion | | | 0.630 | |
Wells Fargo Common Stock Fund | 21
Notes to financial statements (unaudited)
For the six months ended March 31, 2020, the management fee was equivalent to an annual rate of 0.77% of the Fund’s average daily net assets.
Funds Management has retained the services of a subadviser to provide daily portfolio management to the Fund. The fee for subadvisory services is borne by Funds Management. Wells Capital Management Incorporated (“WellsCap”), an affiliate of Funds Management and an indirect wholly owned subsidiary of Wells Fargo, is the subadviser to the Fund and is entitled to receive a fee from Funds Management at an annual rate starting at 0.45% and declining to 0.30% as the average daily net assets of the Fund increase.
Administration fees
Under a class-level administration agreement, Funds Management provides class-level administrative services to the Fund, which includes paying fees and expenses for services provided by the transfer agent, sub-transfer agents, omnibus account servicers and record-keepers. As compensation for its services under the class-level administration agreement, Funds Management receives an annual fee which is calculated based on the average daily net assets of each class as follows:
| | | | |
| |
| | | Class-level administration fee | |
| |
Class A, Class C | | | 0.21 | % |
| |
Class R6 | | | 0.03 | |
| |
Administrator Class, Institutional Class | | | 0.13 | |
Waivers and/or expense reimbursements
Funds Management has contractually waived and/or reimbursed management and administration fees to the extent necessary to maintain certain net operating expense ratios for the Fund. When each class of the Fund has exceeded its expense cap, Funds Management has waived fees and/or reimbursed expenses from fund-level expenses on a proportionate basis and then from class specific expenses. When only certain classes exceed their expense caps, waivers and/or reimbursements are applied against class specific expenses before fund-level expenses. Funds Management has committed through January 31, 2021 to waive fees and/or reimburse expenses to the extent necessary to cap the Fund’s expenses at 1.26% for Class A shares, 2.01% for Class C shares, 0.83% for Class R6 shares, 1.10% for Administrator Class shares, and 0.85% for Institutional Class shares. Prior to or after the commitment expiration date, the cap may be increased or the commitment to maintain the cap may be terminated only with the approval of the Board of Trustees. Prior to February 1, 2020, the Fund’s expenses were capped at 0.85% for Class R6 shares.
Distribution fee
The Trust has adopted a distribution plan for Class C shares of the Fund pursuant to Rule 12b-1 under the 1940 Act. A distribution fee is charged to Class C shares and paid to Wells Fargo Funds Distributor, LLC (“Funds Distributor”), the principal underwriter, at an annual rate of 0.75% of the average daily net assets of Class C shares.
In addition, Funds Distributor is entitled to receive the front-end sales charge from the purchase of Class A shares and a contingent deferred sales charge on the redemption of certain Class A shares. Funds Distributor is also entitled to receive the contingent deferred sales charges from redemptions of Class C shares. For the six months ended March 31, 2020, Funds Distributor received $1,530 from the sale of Class A shares. No contingent deferred sales charges were incurred by Class A and Class C shares for the six months ended March 31, 2020.
Shareholder servicing fees
The Trust has entered into contracts with one or more shareholder servicing agents, whereby Class A, Class C, and Administrator Class of the Fund are charged a fee at an annual rate of 0.25% of the average daily net assets of each respective class. A portion of these total shareholder servicing fees were paid to affiliates of Wells Fargo.
Interfund transactions
The Fund may purchase or sell portfolio investment securities to certain other Wells Fargo affiliates pursuant to Rule 17a-7 under the 1940 Act and under procedures adopted by the Board of Trustees. The procedures have been designed to ensure that these interfund transactions, which do not incur broker commissions, are effected at current market prices.
5. INVESTMENT PORTFOLIO TRANSACTIONS
Purchases and sales of investments, excluding U.S. government obligations (if any) and short-term securities, for the six months ended March 31, 2020 were $368,127,757 and $450,278,890, respectively.
22 | Wells Fargo Common Stock Fund
Notes to financial statements (unaudited)
6. SECURITIES LENDING TRANSACTIONS
The Fund lends its securities through an unaffiliated securities lending agent and receives collateral in the form of cash or securities with a value at least equal to the value of the securities on loan. The value of the loaned securities is determined at the close of each business day and any increases or decreases in the required collateral are exchanged between the Fund and the counterparty on the next business day. Cash collateral received is invested in the Securities Lending Fund which seeks to provide a positive return compared to the daily Fed Funds Open Rate by investing in high-quality, U.S. dollar-denominated short-term money market instruments and is exempt from registration under Section 3(c)(7) of the 1940 Act. Securities Lending Fund is managed by Funds Management and is subadvised by WellsCap. Funds Management receives an advisory fee starting at 0.05% and declining to 0.01% as the average daily net assets of the Securities Lending Fund increase. All of the fees received by Funds Management are paid to WellsCap for its services as subadviser.
In the event of counterparty default or the failure of a borrower to return a loaned security, the Fund has the right to use the collateral to offset any losses incurred. As of March 31, 2020, the Fund had securities lending transactions with the following counterparties which are subject to offset:
| | | | | | | | | | | | |
| | | |
| Counterparty | | Value of securities on loan | | | Collateral received1 | | | Net amount | |
| | | |
Citigroup Global Markets Inc. | | $ | 1,092,420 | | | $ | (1,092,420 | ) | | $ | 0 | |
| | | |
Credit Suisse Securities (USA) LLC | | | 4,596,060 | | | | (4,596,060 | ) | | | 0 | |
| | | |
JPMorgan Securities LLC | | | 3,784,455 | | | | (3,784,455 | ) | | | 0 | |
| 1 | Collateral received within this table is limited to the collateral for the net transaction with the counterparty. |
7. BANK BORROWINGS
The Trust (excluding the money market funds), Wells Fargo Master Trust and Wells Fargo Variable Trust are parties to a $280,000,000 revolving credit agreement whereby the Fund is permitted to use bank borrowings for temporary or emergency purposes, such as to fund shareholder redemption requests. Interest under the credit agreement is charged to the Fund based on a borrowing rate equal to the higher of the Federal Funds rate in effect on that day plus 1.25% or the overnight LIBOR rate in effect on that day plus 1.25%. In addition, an annual commitment fee equal to 0.25% of the unused balance is allocated to each participating fund.
For the year ended March 31, 2020, there were no borrowings by the Fund under the agreement.
8. INDEMNIFICATION
Under the Trust’s organizational documents, the officers and Trustees have been granted certain indemnification rights against certain liabilities that may arise out of performance of their duties to the Trust. Additionally, in the normal course of business, the Trust may enter into contracts with service providers that contain a variety of indemnification clauses. The Trust’s maximum exposure under these arrangements is dependent on future claims that may be made against the Fund and, therefore, cannot be estimated.
9. NEW ACCOUNTING PRONOUNCEMENT
In August 2018, FASB issued Accounting Standards Update (“ASU”) No. 2018-13, Fair Value Measurement (Topic 820)Disclosure Framework—Changes to the Disclosure Requirements for Fair Value Measurement. ASU 2018-13 updates the disclosure requirements for fair value measurements by modifying or removing certain disclosures and adding certain new disclosures. The amendments are effective for fiscal years, and interim periods within those fiscal years, beginning after December 15, 2019. Early adoption is permitted. Management has adopted the removal and modification of disclosures early, as permitted, and will adopt the additional new disclosures at the effective date.
10. CORONAVIRUS (COVID-19) PANDEMIC
On March 11, 2020, the World Health Organization announced that it had made the assessment that coronavirus disease 2019 (“COVID-19”) is a pandemic. The impacts of COVID-19 are adversely affecting the entire global economy, individual companies and investment products, and the market in general. There is significant uncertainty around the extent and duration of business disruptions related to COVID-19 and the impacts may be short term or may last for an extended period of time. The risk of further spreading of COVID-19 has led to significant uncertainty and volatility in the financial markets. The value of the Fund and the securities in which the Fund invests have generally been adversely affected by impacts caused by COVID-19.
Wells Fargo Common Stock Fund | 23
Other information (unaudited)
PROXY VOTING INFORMATION
A description of the policies and procedures used to determine how to vote proxies relating to portfolio securities is available, upon request, by calling1-800-222-8222, visiting our website atwfam.com, or visiting the SEC website at sec.gov. Information regarding how the proxies related to portfolio securities were voted during the most recent 12-month period ended June 30 is available on the website atwfam.comor by visiting the SEC website at sec.gov.
QUARTERLY PORTFOLIO HOLDINGS INFORMATION
The Fund files its complete schedule of portfolio holdings with the SEC for the first and third quarters of each fiscal year as an exhibit to its reports on Form N-PORT. Shareholders may view the filed Form N-PORT by visiting the SEC website at sec.gov.
24 | Wells Fargo Common Stock Fund
Other information (unaudited)
BOARD OF TRUSTEES AND OFFICERS
Each of the Trustees and Officers1 listed in the table below acts in identical capacities for each fund in the Wells Fargo family of funds, which consists of 147 mutual funds comprising the Wells Fargo Funds Trust, Wells Fargo Variable Trust, Wells Fargo Master Trust and four closed-end funds (collectively the “Fund Complex”). This table should be read in conjunction with the Prospectus and the Statement of Additional Information2. The mailing address of each Trustee and Officer is 525 Market Street, 12th Floor, San Francisco, CA 94105. Each Trustee and Officer serves an indefinite term, however, each Trustee serves such term until reaching the mandatory retirement age established by the Trustees.
Independent Trustees
| | | | | | |
Name and year of birth | | Position held and length of service* | | Principal occupations during past five years or longer | | Current other
public company or investment company directorships |
| | | |
William R. Ebsworth (Born 1957) | | Trustee, since 2015 | | Retired. From 1984 to 2013, equities analyst, portfolio manager, research director and chief investment officer at Fidelity Management and Research Company in Boston, Tokyo, and Hong Kong, and retired in 2013 as Chief Investment Officer of Fidelity Strategic Advisers, Inc. where he led a team of investment professionals managing client assets. Prior thereto, Board member of Hong Kong Securities Clearing Co., Hong Kong Options Clearing Corp., the Thailand International Fund, Ltd., Fidelity Investments Life Insurance Company, and Empire Fidelity Investments Life Insurance Company. Audit Committee Chair and Investment Committee Chair of the Vincent Memorial Hospital Endowment (non-profit organization). Mr. Ebsworth is a CFA® charterholder. | | N/A |
| | | |
Jane A. Freeman (Born 1953) | | Trustee, since 2015; Chair Liaison, since 2018 | | Retired. From 2012 to 2014 and 1999 to 2008, Chief Financial Officer of Scientific Learning Corporation. From 2008 to 2012, Ms. Freeman provided consulting services related to strategic business projects. Prior to 1999, Portfolio Manager at Rockefeller & Co. and Scudder, Stevens & Clark. Board member of the Harding Loevner Funds from 1996 to 2014, serving as both Lead Independent Director and chair of the Audit Committee. Board member of the Russell Exchange Traded Funds Trust from 2011 to 2012 and the chair of the Audit Committee. Ms. Freeman is a Board Member of The Ruth Bancroft Garden (non-profit organization). She is also an inactive Chartered Financial Analyst. | | N/A |
| | | |
Isaiah Harris, Jr. (Born 1952) | | Trustee, since 2009; Audit Committee Chairman, since 2019 | | Retired. Chairman of the Board of CIGNA Corporation since 2009, and Director since 2005. From 2003 to 2011, Director of Deluxe Corporation. Prior thereto, President and CEO of BellSouth Advertising and Publishing Corp. from 2005 to 2007, President and CEO of BellSouth Enterprises from 2004 to 2005 and President of BellSouth Consumer Services from 2000 to 2003. Emeritus member of the Iowa State University Foundation Board of Governors. Emeritus Member of the Advisory Board of Iowa State University School of Business. Advisory Board Member, Palm Harbor Academy (private school). Advisory Board Member, Child Evangelism Fellowship (non-profit). Mr. Harris is a certified public accountant (inactive status). | | CIGNA Corporation |
| | | |
Judith M. Johnson (Born 1949) | | Trustee, since 2008; Audit Committee Chairman, from 2009 to 2018 | | Retired. Prior thereto, Chief Executive Officer and Chief Investment Officer of Minneapolis Employees Retirement Fund from 1996 to 2008. Ms. Johnson is an attorney, certified public accountant and a certified managerial accountant. | | N/A |
Wells Fargo Common Stock Fund | 25
Other information (unaudited)
| | | | | | |
Name and year of birth | | Position held and length of service* | | Principal occupations during past five years or longer | | Current other
public company or investment company directorships |
| | | |
David F. Larcker (Born 1950) | | Trustee, since 2009 | | James Irvin Miller Professor of Accounting at the Graduate School of Business, Stanford University, Director of the Corporate Governance Research Initiative and Senior Faculty of The Rock Center for Corporate Governance since 2006. From 2005 to 2008, Professor of Accounting at the Graduate School of Business, Stanford University. Prior thereto, Ernst & Young Professor of Accounting at The Wharton School, University of Pennsylvania from 1985 to 2005. | | N/A |
| | | |
Olivia S. Mitchell (Born 1953) | | Trustee, since 2006; Nominating and Governance Committee Chair, since 2018 | | International Foundation of Employee Benefit Plans Professor, Wharton School of the University of Pennsylvania since 1993. Director of Wharton’s Pension Research Council and Boettner Center on Pensions & Retirement Research, and Research Associate at the National Bureau of Economic Research. Previously, Cornell University Professor from 1978 to 1993. | | N/A |
| | | |
Timothy J. Penny (Born 1951) | | Trustee, since 1996; Chairman, since 2018 | | President and Chief Executive Officer of Southern Minnesota Initiative Foundation, a non-profit organization, since 2007. Member of the Board of Trustees of NorthStar Education Finance, Inc., a non-profit organization, since 2007. | | N/A |
| | | |
James G. Polisson (Born 1959) | | Trustee, since 2018 | | Retired. Chief Marketing Officer, Source (ETF) UK Services, Ltd, from 2015 to 2017. From 2012 to 2015, Principal of The Polisson Group, LLC, a management consulting, corporate advisory and principal investing company. Chief Executive Officer and Managing Director at Russell Investments, Global Exchange Traded Funds from 2010 to 2012. Managing Director of Barclays Global Investors from 1998 to 2010 and Global Chief Marketing Officer for iShares and Barclays Global Investors from 2000 to 2010. Trustee of the San Francisco Mechanics’ Institute, a non-profit organization, from 2013 to 2015. Board member of the Russell Exchange Traded Fund Trust from 2011 to 2012. Director of Barclays Global Investors Holdings Deutschland GmbH from 2006 to 2009. Mr. Polisson is an attorney and has a retired status with the Massachusetts and District of Columbia Bar Associations. | | N/A |
| | | |
Pamela Wheelock3 (Born 1959) | | Trustee, since January 2020; previously Trustee from January 2018 to July 2019 | | Board member of the Destination Medical Center Economic Development Agency, Rochester, Minnesota since 2019. Acting Commissioner, Minnesota Department of Human Services, July 2019 through September 2019. Human Services Manager (part-time), Minnesota Department of Human Services, October 2019 through December 2019. Chief Operating Officer, Twin Cities Habitat for Humanity from 2017 to 2019. Vice President of University Services, University of Minnesota from 2012 to 2016. Prior thereto, on the Board of Directors, Governance Committee and Finance Committee for the Minnesota Philanthropy Partners (Saint Paul Foundation) from 2012 to 2018, Interim Chief Executive Officer of Blue Cross Blue Shield of Minnesota from 2011 to 2012, Chairman of the Board from 2009 to 2012 and Board Director from 2003 to 2015. Vice President, Leadership and Community Engagement, Bush Foundation, Saint Paul, Minnesota (a private foundation) from 2009 to 2011. Executive Vice President and Chief Financial Officer, Minnesota Sports and Entertainment from 2004 to 2009 and Senior Vice President from 2002 to 2004. Executive Vice President of the Minnesota Wild Foundation from 2004 to 2008. Commissioner of Finance, State of Minnesota, from 1999 to 2002. Currently Board Chair of the Minnesota Wild Foundation since 2010. | | N/A |
| * | Length of service dates reflect the Trustee’s commencement of service with the Trust’s predecessor entities, where applicable. |
26 | Wells Fargo Common Stock Fund
Other information (unaudited)
Officers
| | | | |
Name and year of birth | | Position held and length of service | | Principal occupations during past five years or longer |
| | |
Andrew Owen (Born 1960) | | President, since 2017 | | Executive Vice President of Wells Fargo & Company and Head of Affiliated Managers, Wells Fargo Asset Management, since 2014. In addition, Mr. Owen is currently President, Chief Executive Officer and Director of Wells Fargo Funds Management, LLC since 2017. Prior thereto, Executive Vice President responsible for marketing, investments and product development for Wells Fargo Funds Management, LLC, from 2009 to 2014. |
| | |
Nancy Wiser1 (Born 1967) | | Treasurer, since 2012 | | Executive Vice President of Wells Fargo Funds Management, LLC since 2011. Chief Operating Officer and Chief Compliance Officer at LightBox Capital Management LLC, from 2008 to 2011. |
| | |
Michelle Rhee (Born 1966) | | Chief Legal Officer, since 2019 | | Secretary of Wells Fargo Funds Management, LLC, Chief Legal Counsel of Wells Fargo Asset Management and Assistant General Counsel of Wells Fargo Bank, N.A. since 2018. Associate General Counsel and Managing Director of Bank of America Corporation from 2004 to 2018. |
| | |
Catherine Kennedy (Born 1969) | | Secretary, since 2019 | | Vice President of Wells Fargo Funds Management, LLC and Senior Counsel of the Wells Fargo Legal Department since 2010. Vice President and Senior Counsel of Evergreen Investment Management Company, LLC from 1998 to 2010. |
| | |
Michael H. Whitaker (Born 1967) | | Chief Compliance Officer, since 2016 | | Chief Compliance Officer of Wells Fargo Asset Management since 2016. Senior Vice President and Chief Compliance Officer for Fidelity Investments from 2007 to 2016. |
| | |
David Berardi (Born 1975) | | Assistant Treasurer, since 2009 | | Vice President of Wells Fargo Funds Management, LLC since 2009. Vice President of Evergreen Investment Management Company, LLC from 2008 to 2010. Manager of Fund Reporting and Control for Evergreen Investment Management Company, LLC from 2004 to 2010. |
| | |
Jeremy DePalma1 (Born 1974) | | Assistant Treasurer, since 2009 | | Senior Vice President of Wells Fargo Funds Management, LLC since 2009. Senior Vice President of Evergreen Investment Management Company, LLC from 2008 to 2010 and head of the Fund Reporting and Control Team within Fund Administration from 2005 to 2010. |
| 1 | Nancy Wiser acts as Treasurer of 65 funds in the Fund Complex. Jeremy DePalma acts as Treasurer of 82 funds and Assistant Treasurer of 65 funds in the Fund Complex. |
| 2 | The Statement of Additional Information includes additional information about the Trustees and is available, without charge, upon request, by calling1-800-222-8222 or by visiting the website atwfam.com. |
| 3 | Pamela Wheelock was re-appointed to the Board effective January 1, 2020. |
Wells Fargo Common Stock Fund | 27
Appendix I (unaudited)
Effective on or about May 1, 2020, if you purchase Fund shares through a Janney Montgomery Scott LLC (“Janney”) brokerage account, you will be eligible for the following load waivers (front-end sales charge waivers and contingent deferred sales charge (“CDSC”), or back-end sales charge, waivers) and discounts, which may differ from those disclosed elsewhere in the Fund’s Prospectus or SAI.
|
|
| Front-end sales charge* waivers on Class A shares available at Janney |
|
| Shares purchased through reinvestment of capital gains distributions and dividend reinvestment when purchasing shares of the same fund (but not any other fund within the fund family). |
|
| Shares purchased by employees and registered representatives of Janney or its affiliates and their family members as designated by Janney. |
|
| Shares purchased from the proceeds of redemptions within the same fund family, provided (1) the repurchase occurs within ninety (90) days following the redemption, (2) the redemption and purchase occur in the same account, and (3) redeemed shares were subject to a front-end or deferred sales load (i.e., right of reinstatement). |
|
| Employer-sponsored retirement plans (e.g., 401(k) plans, 457 plans, employer-sponsored 403(b) plans, profit sharing and money purchase pension plans and defined benefit plans). For purposes of this provision, employer-sponsored retirement plans do not include SEP IRAs, Simple IRAs, SAR-SEPs or Keogh plans. |
|
| Shares acquired through a right of reinstatement. |
|
| Class C shares that are no longer subject to a contingent deferred sales charge and are converted to Class A shares of the same fund pursuant to Janney’s policies and procedures. |
|
| CDSC waivers on Class A and Class C shares available at Janney |
|
| Shares sold upon the death or disability of the shareholder. |
|
| Shares sold as part of a systematic withdrawal plan as described in the Fund’s Prospectus. |
|
| Shares purchased in connection with a return of excess contributions from an IRA account. |
|
| Shares sold as part of a required minimum distribution for IRA and retirement accounts if the redemption is taken in or after the year the shareholder reaches qualified age based on applicable IRS regulations. |
|
| Shares sold to pay Janney fees but only if the transaction is initiated by Janney. |
|
| Shares acquired through a right of reinstatement. |
|
| Shares exchanged into the same share class of a different fund. |
|
| Front-end sales charge* discounts available at Janney; breakpoints, rights of accumulation and/or letters of intent |
|
| Breakpoints as described in the Fund’s Prospectus. |
|
| Rights of accumulation (“ROA”), which entitle shareholders to breakpoint discounts, will be automatically calculated based on the aggregated holding of fund family assets held by accounts within the purchaser’s household at Janney. Eligible fund family assets not held at Janney may be included in the ROA calculation only if the shareholder notifies his or her financial advisor about such assets. |
|
| Letters of intent which allow for breakpoint discounts based on anticipated purchases within a fund family, over a 13-month time period. Eligible fund family assets not held at Janney Montgomery Scott may be included in the calculation of letters of intent only if the shareholder notifies his or her financial advisor about such assets. |
| * | Also referred to as an “initial sales charge.” |
28 | Wells Fargo Common Stock Fund
Appendix II (unaudited)
Effective on or after May 1, 2020, clients of Edward Jones (also referred to as “shareholders”) purchasing Fund shares on the Edward Jones commission and fee-based platforms are eligible only for the following sales charge discounts (also referred to as “breakpoints”) and waivers, which can differ from breakpoints and waivers described elsewhere in this Prospectus or SAI or through another broker-dealer. In all instances, it is the shareholder’s responsibility to inform Edward Jones at the time of purchase of any relationship, holdings of Wells Fargo Funds or other facts qualifying the purchaser for breakpoints or waivers. Edward Jones can ask for documentation of such circumstance.
|
| Breakpoints available at Edward Jones |
|
| Rights of Accumulation (ROA) |
|
The applicable sales charge on a purchase of Class A shares is determined by taking into account all share classes (except any money market funds and retirement plan share classes) of Wells Fargo Funds held by the shareholder or in an account grouped by Edward Jones with other accounts for the purpose of providing certain pricing considerations (“pricing groups”). This includes all share classes held on the Edward Jones platform and/or held on another platform. The inclusion of eligible fund family assets in the rights of accumulation calculation is dependent on the shareholder notifying his or her financial advisor of such assets at the time of calculation. |
|
ROA is determined by calculating the higher of cost or market value (current shares x NAV). |
|
| Letter of Intent (LOI) |
|
Through a LOI, shareholders can receive the sales charge and breakpoint discounts for purchases shareholders intend to makeover a 13-month period from the date Edward Jones receives the LOI. The LOI is determined by calculating the higher of cost or market value of qualifying holdings at LOI initiation in combination with the value that the shareholder intends to buy over a 13-month period to calculate the front-end sales charge and any breakpoint discounts. Each purchase the shareholder makes during that 13-month period will receive the sales charge and breakpoint discount that applies to the total amount. The inclusion of eligible fund family assets in the LOI calculation is dependent on the shareholder notifying his or her financial advisor of such assets at the time of calculation. Purchases made before the LOI is received by Edward Jones are not covered under the LOI and will not reduce the sales charge previously paid. Sales charges will be adjusted if LOI is not met. |
| Sales charges are waived for the following shareholders and in the following situations at Edward Jones: |
● Associates of Edward Jones and its affiliates and their family members who are in the same pricing group (as determined by Edward Jones under its policies and procedures) as the associate. This waiver will continue for the remainder of the associate’s life if the associate retires from Edward Jones in good-standing. |
● Shares purchased in an Edward Jones fee-based program. |
● Shares purchased through reinvestment of capital gains distributions and dividend reinvestment. |
● Shares purchased from the proceeds of redeemed shares of the same fund family so long as the following conditions are met: 1)the proceeds are from the sale of shares within 60 days of the purchase, and 2) the sale and purchase are made in the same share class and the same account or the purchase is made in an individual retirement account with proceeds from liquidations in anon-retirement account. |
● Shares exchanged into Class A shares from another share class so long as the exchange is into the same fund and was initiated at the discretion of Edward Jones. Edward Jones is responsible for any remaining CDSC due to the fund company, if applicable. Any future purchases are subject to the applicable sales charge as disclosed in the prospectus. |
● Exchanges from Class C shares to Class A shares of the same fund, generally, in the 84th month following the anniversary of the purchase date or earlier at the discretion of Edward Jones. |
If the shareholder purchases shares that are subject to a CDSC and those shares are redeemed before the CDSC is expired, the shareholder is
responsible to pay the CDSC except in the following conditions available at Edward Jones: |
● The death or disability of the shareholder. |
● Systematic withdrawals with up to 10% per year of the account value. |
● Return of excess contributions from an Individual Retirement Account (IRA). |
● Shares sold as part of a required minimum distribution for IRA and retirement accounts if the redemption is taken in or after the year the shareholder reaches qualified age based on applicable IRS regulation. |
● Shares sold to pay Edward Jones fees or costs in such cases where the transaction is initiated by Edward Jones. |
● Shares exchanged in an Edward Jones fee-based program. |
● Shares acquired through NAV reinstatement. |
Wells Fargo Common Stock Fund | 29
Appendix II (unaudited)
|
| Other Important Information for accounts at Edward Jones: |
Minimum Purchase Amounts ● $250 initial purchase minimum ● $50 subsequent purchase minimum |
Minimum Balances Edward Jones has the right to redeem at its discretion fund holdings with a balance of $250 or less. The following are examples of accounts that are not included in this policy: ● A fee-based account held on an Edward Jones platform ● A 529 account held on an Edward Jones platform ● An account with an active systematic investment plan or letter of intent (LOI) |
Changing Share Classes At any time it deems necessary, Edward Jones has the authority to exchange at NAV a shareholder’s holdings in a fund to Class A shares. |
30 | Wells Fargo Common Stock Fund
This page is intentionally left blank.
This page is intentionally left blank.

For more information
More information about Wells Fargo Funds is available free upon request. To obtain literature, please write, visit the Fund’s website, or call:
Wells Fargo Funds
P.O. Box 219967
Kansas City, MO 64121-9967
Website:wfam.com
Individual investors:1-800-222-8222
Retail investment professionals:1-888-877-9275
Institutional investment professionals:1-866-765-0778

This report and the financial statements contained herein are submitted for the general information of the shareholders of the Fund. If this report is used for promotional purposes, distribution of the report must be accompanied or preceded by a current prospectus. Before investing, please consider the investment objectives, risks, charges, and expenses of the investment. For a current prospectus and, if available, a summary prospectus, containing this information, call1-800-222-8222 or visit the Fund’s website atwfam.com. Read the prospectus carefully before you invest or send money.
Wells Fargo Asset Management (WFAM) is the trade name for certain investment advisory/management firms owned by Wells Fargo & Company. These firms include but are not limited to Wells Capital Management Incorporated and Wells Fargo Funds Management, LLC. Certain products managed by WFAM entities are distributed by Wells Fargo Funds Distributor, LLC (a broker-dealer and Member FINRA).
This material is for general informational and educational purposes only and is NOT intended to provide investment advice or a recommendation of any kind—including a recommendation for any specific investment, strategy, or plan.
INVESTMENT PRODUCTS: NOT FDIC INSURED ◾ NO BANK GUARANTEE ◾ MAY LOSE VALUE
© 2020 Wells Fargo & Company. All rights reserved.
PAR-0420-06231 05-20
SA229/SAR229 03-20
Semi-Annual Report
March 31, 2020
Wells Fargo Discovery Fund
Beginning on January 1, 2021, as permitted by new regulations adopted by the Securities and Exchange Commission, paper copies of the Wells Fargo Funds’ annual and semi-annual shareholder reports issued after this date will no longer be sent by mail, unless you specifically request paper copies of the reports. Instead, the reports will be made available on the Funds’ website, and you will be notified by mail each time a report is posted and provided with a website address to access the report.
If you already elected to receive shareholder reports electronically, you will not be affected by this change and you need not take any action. You may elect to receive shareholder reports and other communications from the Fund electronically at any time by contacting your financial intermediary (such as a broker-dealer or bank) or, if you are a direct investor, by calling1-800-222-8222 or by enrolling at wellsfargo.com/advantagedelivery.
You may elect to receive all future reports in paper free of charge. If you invest through a financial intermediary, you can contact your financial intermediary to request that you continue to receive paper copies of your shareholder reports; if you invest directly with the Fund, you can call 1-800-222-8222. Your election to receive reports in paper will apply to all Wells Fargo Funds held in your account with your financial intermediary or, if you are a direct investor, to all Wells Fargo Funds that you hold.
|
|
|
Reduce clutter. Save trees. |
Sign up for electronic delivery of prospectuses and
shareholder reports atwellsfargo.com/
advantagedelivery |
The views expressed and any forward-looking statements are as of March 31, 2020, unless otherwise noted, and are those of the Fund managers and/or Wells Fargo Asset Management. Discussions of individual securities, or the markets generally, or any Wells Fargo Fund are not intended as individual recommendations. Future events or results may vary significantly from those expressed in any forward-looking statements. The views expressed are subject to change at any time in response to changing circumstances in the market. Wells Fargo Asset Management and the Fund disclaim any obligation to publicly update or revise any views expressed or forward-looking statements.
INVESTMENT PRODUCTS: NOT FDIC INSURED ◾ NO BANK GUARANTEE ◾ MAY LOSE VALUE
Wells Fargo Discovery Fund | 1
Letter to shareholders (unaudited)

Andrew Owen
President
Wells Fargo Funds
“The period began with mixed data, leading to central bank support.”
Dear Shareholder:
We are pleased to offer you this semi-annual report for the Wells Fargo Discovery Fund for the six-month period that ended March 31, 2020. Global stock markets saw earlier gains erased in February and March as governments took unprecedented measures to stop the spread of the coronavirus at the expense of short-term economic output. Fixed-income markets were less battered, with U.S. government bonds achieving modest gains as central banks attempted to bolster capital markets and confidence.
For the period, U.S. stocks, based on the S&P 500 Index,1 returned -12.31% and international stocks, as measured by the MSCI ACWI ex USA Index (Net),2 fell 16.52%. The MSCI EM Index (Net)3 lost 14.55%. For bond investors, the Bloomberg Barclays U.S. Aggregate Bond Index4 added 3.33%, the Bloomberg Barclays Global Aggregate ex-USD Index5 returned -2.03%, the Bloomberg Barclays Municipal Bond Index6 gained a modest 0.10%, and the ICE BofA U.S. High Yield Index7 returned -10.86%.
The period began with mixed data, leading to central bank support.
As the fourth quarter of 2019 started, U.S.-China trade tensions were relaxing while optimism grew for a U.K. Brexit deal. The initial estimate of U.S. third-quarter gross domestic product growth was a resilient 1.9% annualized rate, while the U.S. unemployment rate fell to a 50-year low of 3.5% in September. Despite resilience among U.S. consumers, however, business confidence declined while manufacturing activity contracted. Concerned with a potential economic slowdown, the U.S. Federal Reserve (Fed) lowered interest rates a quarter point in late October—its third rate cut in four months. This helped push the S&P 500 Index to an all-time high while emerging market equities rallied and global bonds declined overall, reflecting a broad pickup in risk appetite.
Equity markets rallied in November despite ongoing geopolitical risks. Hopes for aU.S.-China trade deal buoyed investor confidence. U.S. business sentiment edged up, and manufacturing and services activity rose. With that positive backdrop, developed market equities outpaced those in emerging markets, and U.S. stocks outperformed non-U.S. stocks overall. While consumer confidence and purchasing manager activity rose in the eurozone, China reported weakening manufacturing and consumer data. Bond yields rose marginally, leading to slightly negative returns for global government and investment-grade corporate bonds.
Financial markets ended 2019 with a boost from the U.S. and China accord on a Phase One trade deal. That, along with the landslide win by the pro-Brexit U.K. Conservative
| 1 | The S&P 500 Index consists of 500 stocks chosen for market size, liquidity, and industry group representation. It is a market-value-weighted index with each stock’s weight in the index proportionate to its market value. You cannot invest directly in an index. |
| 2 | The Morgan Stanley Capital International (MSCI) All Country World Index (ACWI) ex USA Index (Net) is a free-float-adjusted market-capitalization-weighted index that is designed to measure the equity market performance of developed markets, excluding the United States. Source: MSCI. MSCI makes no express or implied warranties or representations and shall have no liability whatsoever with respect to any MSCI data contained herein. The MSCI data may not be further redistributed or used as a basis for other indices or any securities or financial products. This report is not approved, reviewed, or produced by MSCI. You cannot invest directly in an index. |
| 3 | The MSCI Emerging Markets (EM) Index (Net) is a free-float-adjusted market-capitalization-weighted index that is designed to measure equity market performance of emerging markets. You cannot invest directly in an index. |
| 4 | The Bloomberg Barclays U.S. Aggregate Bond Index is a broad-based benchmark that measures the investment-grade, U.S. dollar-denominated, fixed-rate taxable bond market, including Treasuries, government-related and corporate securities, mortgage-backed securities (agency fixed-rate and hybrid adjustable-rate mortgage pass-throughs), asset-backed securities, and commercial mortgage-backed securities. You cannot invest directly in an index. |
| 5 | The Bloomberg Barclays Global Aggregate ex-USD Index is an unmanaged index that provides a broad-based measure of the global investment-grade fixed-income markets excluding the U.S. dollar-denominated debt market. You cannot invest directly in an index. |
| 6 | The Bloomberg Barclays Municipal Bond Index is an unmanaged index composed of long-term tax-exempt bonds with a minimum credit rating of Baa. You cannot invest directly in an index. |
| 7 | The ICE BofA U.S. High Yield Index is a market-capitalization-weighted index of domestic and Yankee high-yield bonds. The index tracks the performance of high-yield securities traded in the U.S. bond market. You cannot invest directly in an index. Copyright 2020. ICE Data Indices, LLC. All rights reserved. |
2 | Wells Fargo Discovery Fund
Letter to shareholders (unaudited)
Party in a national election and ongoing central bank support, gave investors greater confidence. U.S. economic indicators were positive overall, with the exception of manufacturing activity and business confidence. Consumer confidence was resilient, fed by a robust labor market, tame inflation, and lower interest rates, which boosted housing affordability and stimulated homebuyer activity. The impeachment of U.S. President Donald Trump had little impact on markets. Meanwhile, slowing Chinese economic activity, partly attributable to the trade war, led to further government stimulus at year-end through lower reserve ratios, allowing banks to lend more money.
The year-end rally continued in early January 2020. However, capital market volatility spiked in late January on concerns over the potential impact of the coronavirus on the global economy and stock markets. With sentiment somewhat souring, perceived safe havens did well in January. The U.S. dollar and Japanese yen both rose, and government bonds outperformed equities. While the S&P 500 Index held its ground, emerging market equities tumbled, including those in Asia.
In February, the coronavirus became the major market focus. Fears of the virus’s impact on global growth led to expectations of increased global central bank monetary policy support. That led the 10-year U.S. Treasury yield to fall to an all-time low of 1.1% by the end of the month. Although equity markets initially shrugged off concerns about the outbreak, focusing instead on strong fourth-quarter earnings and improving business confidence in January, market sentiment turned sharply lower toward month-end. Oil prices tumbled as Russia and the Organization of the Petroleum Exporting Countries compounded a major decline in oil demand with a brutal price war, causing the price of West Texas Intermediate crude oil to fall 13% in February alone.
The global spread of the coronavirus led many countries to clamp down on social and business-related activity in order to contain the virus from causing even greater devastation and overwhelming the health care system. This abrupt stoppage of economic activity led to the sharp deceleration of global output, sending economies into a deep contraction. Central bank responses were swift, as they slashed interest rates and expanded quantitative easing programs to restore liquidity and confidence to the markets. In the U.S., the Fed launched several lending programs, funding investment-grade bonds, money market mutual funds, and commercial paper while purchasing Treasuries, mortgage-backed securities, and overnight repos. Meanwhile, stock markets tumbled quickly into a bear market, ending the longest bull stock market in U.S. history.
Don’t let short-term uncertainty derail long-term investment goals.
Periods of investment uncertainty can present challenges, but experience has taught us that maintaining long-term investment goals can be an effective way to plan for the future. To help you create a sound strategy based on your personal goals and risk tolerance, Wells Fargo Funds offers more than 100 mutual funds spanning a wide range of asset classes and investment styles. Although diversification cannot guarantee an investment profit or prevent losses, we believe it can be an effective way to manage investment risk and potentially smooth out overall portfolio performance. We encourage investors to know their investments and to understand that appropriate levels of risk-taking may unlock opportunities.
Thank you for choosing to invest with Wells Fargo Funds. We appreciate your confidence in us and remain committed to helping you meet your financial needs.
Sincerely,

Andrew Owen
President
Wells Fargo Funds
“Capital market volatility spiked in late January on concerns over the potential impact of the coronavirus on the global economy and stock markets.”
|
|
|
For further information about your Fund, contact your investment professional, visit our website at wfam.com, or call us directly at1-800-222-8222. |
Wells Fargo Discovery Fund | 3
Performance highlights (unaudited)
Investment objective
The Fund seeks long-term capital appreciation.
Manager
Wells Fargo Funds Management, LLC
Subadviser
Wells Capital Management Incorporated
Portfolio managers
Michael T. Smith, CFA®‡
Christopher J. Warner, CFA®‡
Average annual total returns (%) as of March 31, 2020
| | | | | | | | | | | | | | | | | | | | | | | | | | | | | | | | | | |
| | | | |
| | | | | Including sales charge | | | Excluding sales charge | | | Expense ratios1 (%) | |
| | | | | | | | | |
| | | Inception date | | 1 year | | | 5 year | | | 10 year | | | 1 year | | | 5 year | | | 10 year | | | Gross | | | Net2 | |
| | | | | | | | | | |
| Class A (WFDAX) | | 7-31-2007 | | | -12.48 | | | | 5.08 | | | | 10.96 | | | | -7.16 | | | | 6.33 | | | | 11.62 | | | | 1.21 | | | | 1.21 | |
| | | | | | | | | | |
| Class C (WDSCX) | | 7-31-2007 | | | -8.86 | | | | 5.53 | | | | 10.78 | | | | -7.86 | | | | 5.53 | | | | 10.78 | | | | 1.96 | | | | 1.96 | |
| | | | | | | | | | |
| Class R6 (WFDRX)3 | | 6-28-2013 | | | – | | | | – | | | | – | | | | -6.76 | | | | 6.78 | | | | 12.09 | | | | 0.78 | | | | 0.78 | |
| | | | | | | | | | |
| Administrator Class (WFDDX) | | 4-8-2005 | | | – | | | | – | | | | – | | | | -7.10 | | | | 6.42 | | | | 11.74 | | | | 1.13 | | | | 1.13 | |
| | | | | | | | | | |
| Institutional Class (WFDSX) | | 8-31-2006 | | | – | | | | – | | | | – | | | | -6.87 | | | | 6.68 | | | | 12.02 | | | | 0.88 | | | | 0.88 | |
| | | | | | | | | | |
| Russell 2500TM Growth Index4 | | – | | | – | | | | – | | | | – | | | | -14.40 | | | | 3.64 | | | | 10.10 | | | | – | | | | – | |
Figures quoted represent past performance, which is no guarantee of future results, and do not reflect taxes that a shareholder may pay on an investment in a fund. Investment return and principal value of an investment will fluctuate so that an investor’s shares, when redeemed, may be worth more or less than their original cost. Performance shown without sales charges would be lower if sales charges were reflected. Current performance may be lower or higher than the performance data quoted, which assumes the reinvestment of dividends and capital gains. Currentmonth-end performance is available on the Fund’s website, wfam.com.
Index returns do not include transaction costs associated with buying and selling securities, any mutual fund fees or expenses, or any taxes. It is not possible to invest directly in an index.
For Class A shares, the maximumfront-end sales charge is 5.75%. For Class C shares, the maximum contingent deferred sales charge is 1.00%. Performance including a contingent deferred sales charge assumes the sales charge for the corresponding time period. Class R6, Administrator Class, and Institutional Class shares are sold without afront-end sales charge or contingent deferred sales charge.
Stock values fluctuate in response to the activities of individual companies and general market and economic conditions. Smaller-company stocks tend to be more volatile and less liquid than those of larger companies. Certain investment strategies tend to increase the total risk of an investment (relative to the broader market). The Fund is exposed to foreign investment risk. Consult the Fund’s prospectus for additional information on these and other risks.
Please see footnotes on page 5.
4 | Wells Fargo Discovery Fund
Performance highlights (unaudited)
| | | | |
|
| Ten largest holdings (%) as of March 31, 20205 | |
| | |
DexCom Incorporated | | | 3.36 | |
| | |
Booz Allen Hamilton Holding Corporation | | | 2.33 | |
| | |
Black Knight Incorporated | | | 2.20 | |
| | |
EPAM Systems Incorporated | | | 2.04 | |
| | |
Chipotle Mexican Grill Incorporated | | | 1.91 | |
| | |
Veeva Systems Incorporated Class A | | | 1.88 | |
| | |
Exact Sciences Corporation | | | 1.83 | |
| | |
Clarivate Analytics plc | | | 1.81 | |
| | |
MongoDB Incorporated | | | 1.81 | |
| | |
QTS Realty Trust Incorporated Class A | | | 1.79 | |
|
|
| Sector distribution as of March 31, 20206 |
|
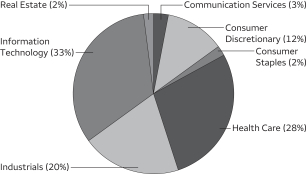 |
| ‡ | CFA® and Chartered Financial Analyst®are trademarks owned by CFA Institute. |
| 1 | Reflects the expense ratios as stated in the most recent prospectuses, which include the impact of 0.01% in acquired fund fees and expenses. The expense ratios shown are subject to change and may differ from the annualized expense ratios shown in the financial highlights of this report, which do not include acquired fund fees and expenses. |
| 2 | The manager has contractually committed through January 31, 2021, to waive fees and/or reimburse expenses to the extent necessary to cap total annual fund operating expenses after fee waivers at 1.22% for Class A, 1.97% for Class C, 0.79% for Class R6, 1.14% for Administrator Class, and 0.89% for Institutional Class. Brokerage commissions, stamp duty fees, interest, taxes, acquired fund fees and expenses (if any), and extraordinary expenses are excluded from the expense cap. Prior to or after the commitment expiration date, the cap may be increased or the commitment to maintain the cap may be terminated only with the approval of the Board of Trustees. Without this cap, the Fund’s returns would have been lower. The expense ratio paid by an investor is the net expense ratio (the total annual fund operating expenses after fee waivers) as stated in the prospectuses. |
| 3 | Historical performance shown for the Class R6 shares prior to their inception reflects the performance of the Institutional Class shares, and includes the higher expenses applicable to the Institutional Class shares. If these expenses had not been included, the returns for the Class R6 shares would be higher. |
| 4 | The Russell 2500™ Growth Index measures the performance of those Russell 2500companies with higher price/book ratios and higher forecasted growth values. You cannot invest directly in an index. |
| 5 | The ten largest holdings, excluding cash, cash equivalents and any money market funds, are calculated based on the value of the investments divided by total net assets of the Fund. Holdings are subject to change and may have changed since the date specified. |
| 6 | Amounts are calculated based on the total long-term investments of the Fund. These amounts are subject to change and may have changed since the date specified. |
Wells Fargo Discovery Fund | 5
Fund expenses (unaudited)
As a shareholder of the Fund, you incur two types of costs: (1) transaction costs, including sales charges (loads) on purchase payments and contingent deferred sales charges (if any) on redemptions and (2) ongoing costs, including management fees, distribution(12b-1) and/or shareholder servicing fees, and other Fund expenses. This example is intended to help you understand your ongoing costs (in dollars) of investing in the Fund and to compare these costs with the ongoing costs of investing in other mutual funds.
The example is based on an investment of $1,000 invested at the beginning of thesix-month period and held for the entire period from October 1, 2019 to March 31, 2020.
Actual expenses
The “Actual” line of the table below provides information about actual account values and actual expenses. You may use the information in this line, together with the amount you invested, to estimate the expenses that you paid over the period. Simply divide your account value by $1,000 (for example, an $8,600 account value divided by $1,000 = 8.6), then multiply the result by the number in the “Actual” line under the heading entitled “Expenses paid during period” for your applicable class of shares to estimate the expenses you paid on your account during this period.
Hypothetical example for comparison purposes
The “Hypothetical” line of the table below provides information about hypothetical account values and hypothetical expenses based on the Fund’s actual expense ratio and an assumed rate of return of 5% per year before expenses, which is not the Fund’s actual return. The hypothetical account values and expenses may not be used to estimate the actual ending account balance or expenses you paid for the period. You may use this information to compare the ongoing costs of investing in the Fund and other funds. To do so, compare this 5% hypothetical example with the 5% hypothetical examples that appear in the shareholder reports of the other funds.
Please note that the expenses shown in the table are meant to highlight your ongoing costs only and do not reflect any transactional costs, such as sales charges (loads) and contingent deferred sales charges. Therefore, the “Hypothetical” line of the table is useful in comparing ongoing costs only and will not help you determine the relative total costs of owning different funds. In addition, if these transactional costs were included, your costs would have been higher.
| | | | | | | | | | | | | | | | |
| | | Beginning
account value
10-1-2019 | | | Ending
account value
3-31-2020 | | | Expenses
paid during
the period¹ | | | Annualized net
expense ratio | |
| | | | | |
Class A | | | | | | | | | | | | | | | | |
| | | | |
Actual | | $ | 1,000.00 | | | $ | 876.21 | | | $ | 5.58 | | | | 1.19 | % |
| | | | |
Hypothetical (5% return before expenses) | | $ | 1,000.00 | | | $ | 1,019.05 | | | $ | 6.01 | | | | 1.19 | % |
| | | | | |
Class C | | | | | | | | | | | | | | | | |
| | | | |
Actual | | $ | 1,000.00 | | | $ | 872.87 | | | $ | 9.18 | | | | 1.96 | % |
| | | | |
Hypothetical (5% return before expenses) | | $ | 1,000.00 | | | $ | 1,015.20 | | | $ | 9.87 | | | | 1.96 | % |
| | | | | |
Class R6 | | | | | | | | | | | | | | | | |
| | | | |
Actual | | $ | 1,000.00 | | | $ | 877.84 | | | $ | 3.66 | | | | 0.78 | % |
| | | | |
Hypothetical (5% return before expenses) | | $ | 1,000.00 | | | $ | 1,021.10 | | | $ | 3.94 | | | | 0.78 | % |
| | | | | |
Administrator Class | | | | | | | | | | | | | | | | |
| | | | |
Actual | | $ | 1,000.00 | | | $ | 876.59 | | | $ | 5.30 | | | | 1.13 | % |
| | | | |
Hypothetical (5% return before expenses) | | $ | 1,000.00 | | | $ | 1,019.35 | | | $ | 5.70 | | | | 1.13 | % |
| | | | | |
Institutional Class | | | | | | | | | | | | | | | | |
| | | | |
Actual | | $ | 1,000.00 | | | $ | 877.51 | | | $ | 4.13 | | | | 0.88 | % |
| | | | |
Hypothetical (5% return before expenses) | | $ | 1,000.00 | | | $ | 1,020.60 | | | $ | 4.45 | | | | 0.88 | % |
| 1 | Expenses paid is equal to the annualized net expense ratio of each class multiplied by the average account value over the period, multiplied by the number of days in the most recent fiscal half-year divided by the number of days in the fiscal year (to reflect theone-half-year period). |
6 | Wells Fargo Discovery Fund
Portfolio of investments—March 31, 2020 (unaudited)
| | | | | | | | | | | | | | | | |
| | | | | | | | | Shares | | | Value | |
| Common Stocks: 99.12% | | | | | | | | | | | | | | | | |
| | | | |
Communication Services: 2.69% | | | | | | | | | | | | | | | | |
| | | | |
| Entertainment: 1.33% | | | | | | | | | | | | |
Take-Two Interactive Software Incorporated † | | | | | | | | | | | 200,800 | | | $ | 23,816,888 | |
| | | | | | | | | | | | | | | | |
| | | | |
| Interactive Media & Services: 1.36% | | | | | | | | | | | | |
Match Group Incorporated †« | | | | | | | | | | | 366,700 | | | | 24,216,868 | |
| | | | | | | | | | | | | | | | |
| | | | |
Consumer Discretionary: 11.98% | | | | | | | | | | | | | | | | |
| | | | |
| Diversified Consumer Services: 1.63% | | | | | | | | | | | | |
Bright Horizons Family Solutions Incorporated † | | | | | | | | | | | 285,940 | | | | 29,165,880 | |
| | | | | | | | | | | | | | | | |
| | | | |
| Hotels, Restaurants & Leisure: 4.31% | | | | | | | | | | | | |
Chipotle Mexican Grill Incorporated † | | | | | | | | | | | 52,200 | | | | 34,159,680 | |
Domino’s Pizza Incorporated | | | | | | | | | | | 91,200 | | | | 29,555,184 | |
Vail Resorts Incorporated | | | | | | | | | | | 89,214 | | | | 13,177,800 | |
| |
| | | | 76,892,664 | |
| | | | | | | | | | | | | | | | |
| | | | |
| Internet & Direct Marketing Retail: 3.75% | | | | | | | | | | | | |
Chewy Incorporated Class A † | | | | | | | | | | | 577,700 | | | | 21,657,973 | |
Etsy Incorporated † | | | | | | | | | | | 355,700 | | | | 13,673,108 | |
MercadoLibre Incorporated † | | | | | | | | | | | 64,611 | | | | 31,567,642 | |
| |
| | | | 66,898,723 | |
| | | | | | | | | | | | | | | | |
| | | | |
| Specialty Retail: 2.29% | | | | | | | | | | | | |
Burlington Stores Incorporated † | | | | | | | | | | | 184,065 | | | | 29,166,940 | |
Carvana Company †« | | | | | | | | | | | 212,700 | | | | 11,717,643 | |
| |
| | | | 40,884,583 | |
| | | | | | | | | | | | | | | | |
| | | | |
Consumer Staples: 2.16% | | | | | | | | | | | | | | | | |
| | | | |
| Food & Staples Retailing: 0.67% | | | | | | | | | | | | |
US Foods Holding Corporation † | | | | | | | | | | | 670,100 | | | | 11,867,471 | |
| | | | | | | | | | | | | | | | |
| | | | |
| Food Products: 1.49% | | | | | | | | | | | | |
Lamb Weston Holdings Incorporated | | | | | | | | | | | 466,600 | | | | 26,642,860 | |
| | | | | | | | | | | | | | | | |
| | | | |
Health Care: 28.16% | | | | | | | | | | | | | | | | |
| | | | |
| Biotechnology: 7.50% | | | | | | | | | | | | |
CRISPR Therapeutics AG † | | | | | | | | | | | 202,471 | | | | 8,586,795 | |
Deciphera Pharmaceuticals Incorporated † | | | | | | | | | | | 221,879 | | | | 9,134,758 | |
Exact Sciences Corporation † | | | | | | | | | | | 564,500 | | | | 32,741,000 | |
Immunomedics Incorporated † | | | | | | | | | | | 817,500 | | | | 11,019,900 | |
Natera Incorporated † | | | | | | | | | | | 379,561 | | | | 11,333,691 | |
Sarepta Therapeutics Incorporated † | | | | | | | | | | | 151,935 | | | | 14,862,282 | |
Turning Point Therapeutics Incorporated † | | | | | | | | | | | 261,364 | | | | 11,672,516 | |
Twist Bioscience Corporation † | | | | | | | | | | | 438,200 | | | | 13,400,156 | |
Zai Lab Limited ADR † | | | | | | | | | | | 315,144 | | | | 16,223,613 | |
Zymeworks Incorporated † | | | | | | | | | | | 135,200 | | | | 4,795,544 | |
| |
| | | | 133,770,255 | |
| | | | | | | | | | | | | | | | |
| | | | |
| Health Care Equipment & Supplies: 11.36% | | | | | | | | | | | | |
Align Technology Incorporated † | | | | | | | | | | | 72,500 | | | | 12,611,375 | |
DexCom Incorporated † | | | | | | | | | | | 222,600 | | | | 59,939,502 | |
Haemonetics Corporation † | | | | | | | | | | | 255,500 | | | | 25,463,130 | |
The accompanying notes are an integral part of these financial statements.
Wells Fargo Discovery Fund | 7
Portfolio of investments—March 31, 2020 (unaudited)
| | | | | | | | | | | | | | | | |
| | | | | | | | | Shares | | | Value | |
| | | | |
| Health Care Equipment & Supplies (continued) | | | | | | | | | | | | |
ICU Medical Incorporated † | | | | | | | | | | | 155,261 | | | $ | 31,327,012 | |
Insulet Corporation † | | | | | | | | | | | 186,495 | | | | 30,898,492 | |
iRhythm Technologies Incorporated † | | | | | | | | | | | 355,700 | | | | 28,936,195 | |
Shockwave Medical Incorporated † | | | | | | | | | | | 408,300 | | | | 13,547,394 | |
| |
| | | | 202,723,100 | |
| | | | | | | | | | | | | | | | |
| | | | |
| Health Care Providers & Services: 3.16% | | | | | | | | | | | | |
Amedisys Incorporated † | | | | | | | | | | | 163,500 | | | | 30,008,790 | |
HealthEquity Incorporated † | | | | | | | | | | | 520,100 | | | | 26,311,859 | |
| |
| | | | 56,320,649 | |
| | | | | | | | | | | | | | | | |
| | | | |
| Health Care Technology: 1.88% | | | | | | | | | | | | |
Veeva Systems Incorporated Class A † | | | | | | | | | | | 214,400 | | | | 33,525,728 | |
| | | | | | | | | | | | | | | | |
| | | | |
| Life Sciences Tools & Services: 1.53% | | | | | | | | | | | | |
Bio-Rad Laboratories Incorporated Class A † | | | | | | | | | | | 78,000 | | | | 27,343,680 | |
| | | | | | | | | | | | | | | | |
| | | | |
| Pharmaceuticals: 2.73% | | | | | | | | | | | | |
Catalent Incorporated † | | | | | | | | | | | 551,300 | | | | 28,640,035 | |
Elanco Animal Health Incorporated † | | | | | | | | | | | 895,516 | | | | 20,050,603 | |
| |
| | | | 48,690,638 | |
| | | | | | | | | | | | | | | | |
|
Industrials: 19.54% | |
|
| Aerospace & Defense: 3.87% | |
HEICO Corporation | | | | | | | | | | | 219,600 | | | | 16,384,356 | |
Mercury Computer Systems Incorporated † | | | | | | | | | | | 436,319 | | | | 31,126,997 | |
Teledyne Technologies Incorporated † | | | | | | | | | | | 72,300 | | | | 21,492,621 | |
| |
| | | | 69,003,974 | |
| | | | | | | | | | | | | | | | |
|
| Building Products: 1.28% | |
Trex Company Incorporated † | | | | | | | | | | | 284,900 | | | | 22,831,886 | |
| | | | | | | | | | | | | | | | |
|
| Commercial Services & Supplies: 7.35% | |
Casella Waste Systems Incorporated Class A † | | | | | | | | | | | 816,457 | | | | 31,890,810 | |
IAA Incorporated † | | | | | | | | | | | 697,500 | | | | 20,897,100 | |
MSA Safety Incorporated | | | | | | | | | | | 206,624 | | | | 20,910,349 | |
Tetra Tech Incorporated | | | | | | | | | | | 433,800 | | | | 30,634,956 | |
Waste Connections Incorporated | | | | | | | | | | | 346,829 | | | | 26,879,248 | |
| |
| | | | 131,212,463 | |
| | | | | | | | | | | | | | | | |
|
| Construction & Engineering: 1.07% | |
WillScot Corporation † | | | | | | | | | | | 1,887,550 | | | | 19,120,882 | |
| | | | | | | | | | | | | | | | |
|
| Industrial Conglomerates: 1.43% | |
Carlisle Companies Incorporated | | | | | | | | | | | 204,100 | | | | 25,569,648 | |
| | | | | | | | | | | | | | | | |
|
| Machinery: 0.43% | |
Woodward Governor Company | | | | | | | | | | | 129,900 | | | | 7,721,256 | |
| | | | | | | | | | | | | | | | |
|
| Professional Services: 1.81% | |
Clarivate Analytics plc † | | | | | | | | | | | 1,557,130 | | | | 32,310,448 | |
| | | | | | | | | | | | | | | | |
|
| Road & Rail: 1.13% | |
Saia Incorporated † | | | | | | | | | | | 272,700 | | | | 20,054,358 | |
| | | | | | | | | | | | | | | | |
| | | | |
| Trading Companies & Distributors: 1.17% | | | | | | | | | | | | |
SiteOne Landscape Supply Incorporated † | | | | | | | | | | | 283,543 | | | | 20,874,436 | |
| | | | | | | | | | | | | | | | |
The accompanying notes are an integral part of these financial statements.
8 | Wells Fargo Discovery Fund
Portfolio of investments—March 31, 2020 (unaudited)
| | | | | | | | | | | | | | | | |
| | | | | | | | | Shares | | | Value | |
Information Technology: 32.80% | | | | | | | | | | | | | | | | |
| | | | |
| Communications Equipment: 1.25% | | | | | | | | | | | | |
Motorola Solutions Incorporated | | | | | | | | | | | 167,700 | | | $ | 22,290,684 | |
| | | | | | | | | | | | | | | | |
| | | | |
| Electronic Equipment, Instruments & Components: 1.33% | | | | | | | | | | | | |
Novanta Incorporated † | | | | | | | | | | | 296,570 | | | | 23,690,012 | |
| | | | | | | | | | | | | | | | |
| | | | |
| IT Services: 16.77% | | | | | | | | | | | | |
Black Knight Incorporated † | | | | | | | | | | | 676,919 | | | | 39,301,917 | |
Booz Allen Hamilton Holding Corporation | | | | | | | | | | | 604,800 | | | | 41,513,472 | |
Broadridge Financial Solutions Incorporated | | | | | | | | | | | 242,500 | | | | 22,996,275 | |
EPAM Systems Incorporated † | | | | | | | | | | | 195,879 | | | | 36,366,895 | |
Euronet Worldwide Incorporated † | | | | | | | | | | | 202,172 | | | | 17,330,184 | |
MongoDB Incorporated † | | | | | | | | | | | 236,600 | | | | 32,305,364 | |
Okta Incorporated † | | | | | | | | | | | 244,800 | | | | 29,929,248 | |
Square Incorporated Class A † | | | | | | | | | | | 248,300 | | | | 13,005,954 | |
Twilio Incorporated Class A † | | | | | | | | | | | 292,500 | | | | 26,175,825 | |
WEX Incorporated † | | | | | | | | | | | 188,400 | | | | 19,697,220 | |
WNS Holdings Limited ADR † | | | | | | | | | | | 479,052 | | | | 20,589,655 | |
| |
| | | | 299,212,009 | |
| | | | | | | | | | | | | | | | |
| | | | |
| Semiconductors & Semiconductor Equipment: 3.31% | | | | | | | | | | | | |
Lattice Semiconductor Corporation † | | | | | | | | | | | 1,112,400 | | | | 19,822,968 | |
MKS Instruments Incorporated | | | | | | | | | | | 262,800 | | | | 21,405,060 | |
Universal Display Corporation | | | | | | | | | | | 135,500 | | | | 17,856,190 | |
| |
| | | | 59,084,218 | |
| | | | | | | | | | | | | | | | |
| | | | |
| Software: 9.29% | | | | | | | | | | | | |
Avalara Incorporated † | | | | | | | | | | | 410,800 | | | | 30,645,680 | |
Elastic NV † | | | | | | | | | | | 407,500 | | | | 22,742,575 | |
Envestnet Incorporated † | | | | | | | | | | | 336,325 | | | | 18,087,559 | |
Fair Isaac Corporation † | | | | | | | | | | | 87,100 | | | | 26,799,799 | |
Five9 Incorporated † | | | | | | | | | | | 245,135 | | | | 18,743,022 | |
Globant SA † | | | | | | | | | | | 228,062 | | | | 20,042,089 | |
Zendesk Incorporated † | | | | | | | | | | | 447,000 | | | | 28,612,470 | |
| |
| | | | 165,673,194 | |
| | | | | | | | | | | | | | | | |
| | | | |
| Technology Hardware, Storage & Peripherals: 0.85% | | | | | | | | | | | | |
NCR Corporation † | | | | | | | | | | | 859,483 | | | | 15,212,849 | |
| | | | | | | | | | | | | | | | |
| | | | |
Real Estate: 1.79% | | | | | | | | | | | | | | | | |
| | | | |
| Equity REITs: 1.79% | | | | | | | | | | | | |
QTS Realty Trust Incorporated Class A | | | | | | | | | | | 551,300 | | | | 31,980,912 | |
| | | | | | | | | | | | | | | | |
| |
Total Common Stocks (Cost $1,526,887,531) | | | | 1,768,603,216 | |
| | | | | | | | | | | | | | | | |
| | | | |
| | | | | | | | | | | | | | | | |
| | | Yield | | | | | | | | | | |
| Short-Term Investments: 2.93% | | | | | | | | | | | | | | | | |
| | | | |
| Investment Companies: 2.93% | | | | | | | | | | | | |
Securities Lending Cash Investments LLC (l)(r)(u) | | | 2.11 | % | | | | | | | 24,323,209 | | | | 24,325,641 | |
Wells Fargo Government Money Market Fund Select Class (l)(u) | | | 0.35 | | | | | | | | 27,921,771 | | | | 27,921,771 | |
| | | | |
Total Short-Term Investments (Cost $52,247,258) | | | | | | | | | | | | | | | 52,247,412 | |
| | | | | | | | | | | | | | | | |
| | | | | | | | |
| Total investments in securities (Cost $1,579,134,789) | | | 102.05 | % | | | 1,820,850,628 | |
| | |
Other assets and liabilities, net | | | (2.05 | ) | | | (36,574,328 | ) |
| | | | | | | | |
| Total net assets | | | 100.00 | % | | $ | 1,784,276,300 | |
| | | | | | | | |
The accompanying notes are an integral part of these financial statements.
Wells Fargo Discovery Fund | 9
Portfolio of investments—March 31, 2020 (unaudited)
| † | Non-income-earning security |
| « | All or a portion of this security is on loan. |
| (l) | The issuer of the security is an affiliated person of the Fund as defined in the Investment Company Act of 1940. |
| (r) | The investment is anon-registered investment company purchased with cash collateral received from securities on loan. |
| (u) | The rate represents the7-day annualized yield at period end. |
Abbreviations:
| ADR | American depositary receipt |
| REIT | Real estate investment trust |
Investments in Affiliates
An affiliated investment is an investment in which the Fund owns at least 5% of the outstanding voting shares of the issuer or as a result of other relationships, such as the Fund and the issuer having the same investment manager. Transactions with issuers that were either affiliated persons of the Fund at the beginning of the period or the end of the period were as follows:
| | | | | | | | | | | | | | | | | | | | | | | | | | | | | | | | | | | | |
| | | Shares,
beginning of
period | | | Shares
purchased | | | Shares
sold | | | Shares,
end of
period | | | Net
realized
gains
(losses) | | | Net
change in
unrealized
gains
(losses) | | | Income
from
affiliated
securities | | | Value,
end of
period | | | % of
net
assets | |
| | | | | | | | | |
| Short-Term Investments | | | | | | | | | | | | | | | | | | | | | | | | | | | |
Investment Companies | | | | | | | | | | | | | | | | | | | | | | | | | | | | | | | | | | | | |
Securities Lending Cash Investments LLC | | | 125,444,271 | | | | 328,163,161 | | | | (429,284,223 | ) | | | 24,323,209 | | | $ | (2,883 | ) | | $ | (142 | ) | | $ | 673,021 | # | | $ | 24,325,641 | | | | | |
Wells Fargo Government Money Market Fund Select Class | | | 34,896,690 | | | | 360,397,945 | | | | (367,372,864 | ) | | | 27,921,771 | | | | 0 | | | | 0 | | | | 213,774 | | | | 27,921,771 | | | | | |
| | | | | | | | | | | | | | | | | | | | | | | | | | | | | | | | | | | | |
| | | | | | | | | | | | | | | | | | $ | (2,883 | ) | | $ | (142 | ) | | $ | 886,795 | | | $ | 52,247,412 | | | | 2.93 | % |
| | | | | | | | | | | | | | | | | | | | | | | | | | | | | | | | | | | | |
| # | Amount shown represents income before fees and rebates. |
The accompanying notes are an integral part of these financial statements.
10 | Wells Fargo Discovery Fund
Statement of assets and liabilities—March 31, 2020 (unaudited)
| | | | |
| | | | |
| |
Assets | | | | |
Investments in unaffiliated securities (including $23,771,167 of securities loaned), at value (cost $1,526,887,531) | | $ | 1,768,603,216 | |
Investments in affiliated securities, at value (cost $52,247,258) | | | 52,247,412 | |
Receivable for investments sold | | | 24,474,851 | |
Receivable for Fund shares sold | | | 2,923,963 | |
Receivable for dividends | | | 685,968 | |
Receivable for securities lending income, net | | | 96,761 | |
| | | | |
Total assets | | | 1,849,032,171 | |
| | | | |
| |
Liabilities | | | | |
Payable upon receipt of securities loaned | | | 24,330,495 | |
Payable for investments purchased | | | 31,566,324 | |
Payable for Fund shares redeemed | | | 6,787,211 | |
Management fee payable | | | 1,164,362 | |
Administration fees payable | | | 213,065 | |
Distribution fee payable | | | 14,371 | |
Trustees’ fees and expenses payable | | | 4,311 | |
Accrued expenses and other liabilities | | | 675,732 | |
| | | | |
Total liabilities | | | 64,755,871 | |
| | | | |
Total net assets | | $ | 1,784,276,300 | |
| | | | |
| |
Net assets consist of | | | | |
Paid-in capital | | $ | 1,536,904,061 | |
Total distributable earnings | | | 247,372,239 | |
| | | | |
Total net assets | | $ | 1,784,276,300 | |
| | | | |
| |
Computation of net asset value and offering price per share | | | | |
Net assets – Class A | | $ | 506,281,153 | |
Shares outstanding – Class A1 | | | 19,889,653 | |
Net asset value per share – Class A | | | $25.45 | |
Maximum offering price per share – Class A2 | | | $27.00 | |
Net assets – Class C | | $ | 21,346,076 | |
Shares outstanding – Class C1 | | | 1,015,662 | |
Net asset value per share – Class C | | | $21.02 | |
Net assets – Class R6 | | $ | 354,599,868 | |
Shares outstanding – Class R61 | | | 12,399,603 | |
Net asset value per share – Class R6 | | | $28.60 | |
Net assets – Administrator Class | | $ | 258,118,677 | |
Shares outstanding – Administrator Class1 | | | 9,699,082 | |
Net asset value per share – Administrator Class | | | $26.61 | |
Net assets – Institutional Class | | $ | 643,930,526 | |
Shares outstanding – Institutional Class1 | | | 22,711,600 | |
Net asset value per share – Institutional Class | | | $28.35 | |
| 1 | The Fund has an unlimited number of authorized shares. |
| 2 | Maximum offering price is computed as 100/94.25 of net asset value. On investments of $50,000 or more, the offering price is reduced. |
The accompanying notes are an integral part of these financial statements.
Wells Fargo Discovery Fund | 11
Statement of operations—six months ended March 31, 2020 (unaudited)
| | | | |
| | | | |
| |
Investment income | | | | |
Dividends (net of foreign withholding taxes of $30,120) | | $ | 3,562,917 | |
Securities lending income from affiliates, net | | | 721,475 | |
Income from affiliated securities | | | 213,774 | |
| | | | |
Total investment income | | | 4,498,166 | |
| | | | |
| |
Expenses | | | | |
Management fee | | | 8,302,274 | |
Administration fees | | | | |
Class A | | | 664,028 | |
Class C | | | 29,440 | |
Class R6 | | | 64,385 | |
Administrator Class | | | 214,316 | |
Institutional Class | | | 556,721 | |
Shareholder servicing fees | | | | |
Class A | | | 790,503 | |
Class C | | | 35,046 | |
Administrator Class | | | 412,075 | |
Distribution fee | | | | |
Class C | | | 104,912 | |
Custody and accounting fees | | | 77,211 | |
Professional fees | | | 22,520 | |
Registration fees | | | 30,082 | |
Shareholder report expenses | | | 97,173 | |
Trustees’ fees and expenses | | | 11,029 | |
Interest expense | | | 3,081 | |
Other fees and expenses | | | 26,513 | |
| | | | |
Total expenses | | | 11,441,309 | |
Less: Fee waivers and/or expense reimbursements | | | | |
Fund-level | | | (46,321 | ) |
Class A | | | (36,211 | ) |
| | | | |
Net expenses | | | 11,358,777 | |
| | | | |
Net investment loss | | | (6,860,611 | ) |
| | | | |
| |
Realized and unrealized gains (losses) on investments | | | | |
Net realized gains (losses) on | | | | |
Unaffiliated securities | | | 60,310,046 | |
Affiliated securities | | | (2,883 | ) |
| | | | |
Net realized gains on investments | | | 60,307,163 | |
| | | | |
| |
Net change in unrealized gains (losses) on | | | | |
Unaffiliated securities | | | (304,443,352 | ) |
Affiiliated securities | | | (142 | ) |
| | | | |
Net change in unrealized gains (losses) on investments | | | (304,443,494 | ) |
| | | | |
Net realized and unrealized gains (losses) on investments | | | (244,136,331 | ) |
| | | | |
Net decrease in net assets resulting from operations | | $ | (250,996,942 | ) |
| | | | |
The accompanying notes are an integral part of these financial statements.
12 | Wells Fargo Discovery Fund
Statement of changes in net assets
| | | | | | | | | | | | | | | | |
| | | Six months ended
March 31, 2020
(unaudited) | | | Year ended
September 30, 2019 | |
| | | | |
Operations | | | | | | | | | | | | | | | | |
Net investment loss | | | | | | $ | (6,860,611 | ) | | | | | | $ | (13,725,416 | ) |
Net realized gains on investments | | | | | | | 60,307,163 | | | | | | | | 288,857,556 | |
Net change in unrealized gains (losses) on investments | | | | | | | (304,443,494 | ) | | | | | | | (222,176,352 | ) |
| | | | |
Net increase (decrease) in net assets resulting from operations | | | | | | | (250,996,942 | ) | | | | | | | 52,955,788 | |
| | | | |
| | | | |
Distributions to shareholders from net investment income and realized gains | | | | | | | | | | | | | | | | |
Class A | | | | | | | (80,675,264 | ) | | | | | | | (88,695,435 | ) |
Class C | | | | | | | (4,218,619 | ) | | | | | | | (5,933,378 | ) |
Class R6 | | | | | | | (47,628,599 | ) | | | | | | | (63,357,174 | ) |
Administrator Class | | | | | | | (40,537,083 | ) | | | | | | | (44,501,716 | ) |
Institutional Class | | | | | | | (104,185,623 | ) | | | | | | | (163,733,298 | ) |
| | | | |
Total distributions to shareholders | | | | | | | (277,245,188 | ) | | | | | | | (366,221,001 | ) |
| | | | |
| | | | |
Capital share transactions | | | Shares | | | | | | | | Shares | | | | | |
Proceeds from shares sold | | | | | | | | | | | | | | | | |
Class A | | | 977,109 | | | | 30,791,621 | | | | 1,673,589 | | | | 53,100,356 | |
Class C | | | 66,736 | | | | 1,688,041 | | | | 124,395 | | | | 3,331,641 | |
Class R6 | | | 2,319,621 | | | | 81,309,730 | | | | 3,358,382 | | | | 119,049,338 | |
Administrator Class | | | 1,022,188 | | | | 29,496,740 | | | | 1,093,053 | | | | 36,588,024 | |
Institutional Class | | | 3,747,465 | | | | 129,413,985 | | | | 7,459,402 | | | | 263,872,998 | |
| | | | |
| | | | | | | 272,700,117 | | | | | | | | 475,942,357 | |
| | | | |
Reinvestment of distributions | | | | | | | | | | | | | | | | |
Class A | | | 2,585,318 | | | | 78,180,006 | | | | 3,194,495 | | | | 86,155,536 | |
Class C | | | 155,290 | | | | 3,886,910 | | | | 234,117 | | | | 5,403,420 | |
Class R6 | | | 1,396,303 | | | | 47,376,552 | | | | 2,119,233 | | | | 62,983,596 | |
Administrator Class | | | 1,269,437 | | | | 40,126,892 | | | | 1,575,742 | | | | 44,136,530 | |
Institutional Class | | | 2,676,859 | | | | 90,076,315 | | | | 5,074,483 | | | | 149,849,493 | |
| | | | |
| | | | | | | 259,646,675 | | | | | | | | 348,528,575 | |
| | | | |
Payment for shares redeemed | | | | | | | | | | | | | | | | |
Class A | | | (2,545,309 | ) | | | (76,960,636 | ) | | | (3,794,967 | ) | | | (119,681,413 | ) |
Class C | | | (302,154 | ) | | | (7,939,737 | ) | | | (483,874 | ) | | | (12,595,548 | ) |
Class R6 | | | (2,350,634 | ) | | | (79,330,236 | ) | | | (7,308,955 | ) | | | (259,235,727 | ) |
Administrator Class | | | (2,253,340 | ) | | | (68,991,314 | ) | | | (1,998,197 | ) | | | (66,501,847 | ) |
Institutional Class | | | (13,766,934 | ) | | | (481,236,379 | ) | | | (15,416,303 | ) | | | (512,299,731 | ) |
| | | | |
| | | | | | | (714,458,302 | ) | | | | | | | (970,314,266 | ) |
| | | | |
Net decrease in net assets resulting from capital share transactions | | | | | | | (182,111,510 | ) | | | | | | | (145,843,334 | ) |
| | | | |
Total decrease in net assets | | | | | | | (710,353,640 | ) | | | | | | | (459,108,547 | ) |
| | | | |
| | | | |
Net assets | | | | | | | | | | | | | | | | |
Beginning of period | | | | | | | 2,494,629,940 | | | | | | | | 2,953,738,487 | |
| | | | |
End of period | | | | | | $ | 1,784,276,300 | | | | | | | $ | 2,494,629,940 | |
| | | | |
The accompanying notes are an integral part of these financial statements.
Wells Fargo Discovery Fund | 13
Financial highlights
(For a share outstanding throughout each period)
| | | | | | | | | | | | | | | | | | | | | | | | |
| | | Six months ended
March 31, 2020
(unaudited) | | | Year ended September 30 | |
| CLASS A | | 2019 | | | 2018 | | | 2017 | | | 2016 | | | 2015 | |
Net asset value, beginning of period | | | $33.24 | | | | $38.03 | | | | $36.47 | | | | $29.94 | | | | $30.48 | | | | $32.35 | |
Net investment loss | | | (0.13 | )1 | | | (0.26 | ) | | | (0.26 | ) | | | (0.23 | ) | | | (0.18 | )1 | | | (0.24 | ) |
Net realized and unrealized gains (losses) on investments | | | (3.31 | ) | | | 0.53 | | | | 7.85 | | | | 7.17 | | | | 2.23 | | | | 0.96 | |
| | | | | | | | | | | | | | | | | | | | | | | | |
Total from investment operations | | | (3.44 | ) | | | 0.27 | | | | 7.59 | | | | 6.94 | | | | 2.05 | | | | 0.72 | |
Distributions to shareholders from | | | | | | | | | | | | | | | | | | | | | | | | |
Net realized gains | | | (4.35 | ) | | | (5.06 | ) | | | (6.03 | ) | | | (0.41 | ) | | | (2.59 | ) | | | (2.59 | ) |
Net asset value, end of period | | | $25.45 | | | | $33.24 | | | | $38.03 | | | | $36.47 | | | | $29.94 | | | | $30.48 | |
Total return2 | | | (12.38 | )% | | | 3.81 | % | | | 23.86 | % | | | 23.42 | % | | | 7.33 | % | | | 2.09 | % |
Ratios to average net assets (annualized) | | | | | | | | | | | | | | | | | | | | | | | | |
Gross expenses | | | 1.21 | % | | | 1.21 | % | | | 1.20 | % | | | 1.21 | % | | | 1.20 | % | | | 1.23 | % |
Net expenses | | | 1.19 | % | | | 1.20 | % | | | 1.20 | % | | | 1.21 | % | | | 1.20 | % | | | 1.21 | % |
Net investment loss | | | (0.80 | )% | | | (0.77 | )% | | | (0.69 | )% | | | (0.70 | )% | | | (0.64 | )% | | | (0.64 | )% |
Supplemental data | | | | | | | | | | | | | | | | | | | | | | | | |
Portfolio turnover rate | | | 27 | % | | | 71 | % | | | 67 | % | | | 73 | % | | | 78 | % | | | 87 | % |
Net assets, end of period (000s omitted) | | | $506,281 | | | | $627,336 | | | | $676,930 | | | | $607,318 | | | | $641,786 | | | | $294,661 | |
| 1 | Calculated based upon average shares outstanding |
| 2 | Total return calculations do not include any sales charges. Returns for periods of less than one year are not annualized. |
The accompanying notes are an integral part of these financial statements.
14 | Wells Fargo Discovery Fund
Financial highlights
(For a share outstanding throughout each period)
| | | | | | | | | | | | | | | | | | | | | | | | |
| | | Six months ended
March 31, 2020
(unaudited) | | | Year ended September 30 | |
| CLASS C | | 2019 | | | 2018 | | | 2017 | | | 2016 | | | 2015 | |
Net asset value, beginning of period | | | $28.27 | | | | $33.46 | | | | $32.99 | | | | $27.32 | | | | $28.24 | | | | $30.37 | |
Net investment loss | | | (0.21 | )1 | | | (0.41 | )1 | | | (0.46 | ) | | | (0.42 | )1 | | | (0.37 | )1 | | | (0.43 | )1 |
Net realized and unrealized gains (losses) on investments | | | (2.69 | ) | | | 0.28 | | | | 6.96 | | | | 6.50 | | | | 2.04 | | | | 0.89 | |
| | | | | | | | | | | | | | | | | | | | | | | | |
Total from investment operations | | | (2.90 | ) | | | (0.13 | ) | | | 6.50 | | | | 6.08 | | | | 1.67 | | | | 0.46 | |
Distributions to shareholders from | | | | | | | | | | | | | | | | | | | | | | | | |
Net realized gains | | | (4.35 | ) | | | (5.06 | ) | | | (6.03 | ) | | | (0.41 | ) | | | (2.59 | ) | | | (2.59 | ) |
Net asset value, end of period | | | $21.02 | | | | $28.27 | | | | $33.46 | | | | $32.99 | | | | $27.32 | | | | $28.24 | |
Total return2 | | | (12.71 | )% | | | 3.01 | % | | | 22.94 | % | | | 22.51 | % | | | 6.51 | % | | | 1.35 | % |
Ratios to average net assets (annualized) | | | | | | | | | | | | | | | | | | | | | | | | |
Gross expenses | | | 1.96 | % | | | 1.95 | % | | | 1.95 | % | | | 1.96 | % | | | 1.95 | % | | | 1.98 | % |
Net expenses | | | 1.96 | % | | | 1.95 | % | | | 1.95 | % | | | 1.96 | % | | | 1.95 | % | | | 1.96 | % |
Net investment loss | | | (1.57 | )% | | | (1.51 | )% | | | (1.45 | )% | | | (1.45 | )% | | | (1.41 | )% | | | (1.39 | )% |
Supplemental data | | | | | | | | | | | | | | | | | | | | | | | | |
Portfolio turnover rate | | | 27 | % | | | 71 | % | | | 67 | % | | | 73 | % | | | 78 | % | | | 87 | % |
Net assets, end of period (000s omitted) | | | $21,346 | | | | $30,982 | | | | $40,860 | | | | $40,070 | | | | $49,538 | | | | $66,772 | |
| 1 | Calculated based upon average shares outstanding |
| 2 | Total return calculations do not include any sales charges. Returns for periods of less than one year are not annualized. |
The accompanying notes are an integral part of these financial statements.
Wells Fargo Discovery Fund | 15
Financial highlights
(For a share outstanding throughout each period)
| | | | | | | | | | | | | | | | | | | | | | | | |
| | | Six months ended
March 31, 2020
(unaudited) | | | Year ended September 30 | |
| CLASS R6 | | 2019 | | | 2018 | | | 2017 | | | 2016 | | | 2015 | |
Net asset value, beginning of period | | | $36.76 | | | | $41.26 | | | | $38.93 | | | | $31.80 | | | | $32.08 | | | | $33.78 | |
Net investment loss | | | (0.07 | )1 | | | (0.12 | )1 | | | (0.10 | )1 | | | (0.08 | ) | | | (0.07 | ) | | | (0.07 | ) |
Net realized and unrealized gains (losses) on investments | | | (3.74 | ) | | | 0.68 | | | | 8.46 | | | | 7.62 | | | | 2.38 | | | | 0.96 | |
| | | | | | | | | | | | | | | | | | | | | | | | |
Total from investment operations | | | (3.81 | ) | | | 0.56 | | | | 8.36 | | | | 7.54 | | | | 2.31 | | | | 0.89 | |
Distributions to shareholders from | | | | | | | | | | | | | | | | | | | | | | | | |
Net realized gains | | | (4.35 | ) | | | (5.06 | ) | | | (6.03 | ) | | | (0.41 | ) | | | (2.59 | ) | | | (2.59 | ) |
Net asset value, end of period | | | $28.60 | | | | $36.76 | | | | $41.26 | | | | $38.93 | | | | $31.80 | | | | $32.08 | |
Total return2 | | | (12.22 | )% | | | 4.26 | % | | | 24.39 | % | | | 23.98 | % | | | 7.77 | % | | | 2.53 | % |
Ratios to average net assets (annualized) | | | | | | | | | | | | | | | | | | | | | | | | |
Gross expenses | | | 0.78 | % | | | 0.77 | % | | | 0.78 | % | | | 0.78 | % | | | 0.77 | % | | | 0.76 | % |
Net expenses | | | 0.78 | % | | | 0.77 | % | | | 0.78 | % | | | 0.78 | % | | | 0.77 | % | | | 0.76 | % |
Net investment loss | | | (0.39 | )% | | | (0.33 | )% | | | (0.26 | )% | | | (0.27 | )% | | | (0.22 | )% | | | (0.21 | )% |
Supplemental data | | | | | | | | | | | | | | | | | | | | | | | | |
Portfolio turnover rate | | | 27 | % | | | 71 | % | | | 67 | % | | | 73 | % | | | 78 | % | | | 87 | % |
Net assets, end of period (000s omitted) | | | $354,600 | | | | $405,610 | | | | $530,879 | | | | $351,268 | | | | $300,118 | | | | $273,941 | |
| 1 | Calculated based upon average shares outstanding |
| 2 | Returns for periods of less than one year are not annualized. |
The accompanying notes are an integral part of these financial statements.
16 | Wells Fargo Discovery Fund
Financial highlights
(For a share outstanding throughout each period)
| | | | | | | | | | | | | | | | | | | | | | | | |
| | | Six months ended
March 31, 2020
(unaudited) | | | Year ended September 30 | |
| ADMINISTRATOR CLASS | | 2019 | | | 2018 | | | 2017 | | | 2016 | | | 2015 | |
Net asset value, beginning of period | | | $34.55 | | | | $39.27 | | | | $37.44 | | | | $30.70 | | | | $31.17 | | | | $32.99 | |
Net investment loss | | | (0.12 | ) | | | (0.23 | )1 | | | (0.23 | ) | | | (0.20 | )1 | | | (0.17 | )1 | | | (0.20 | ) |
Net realized and unrealized gains (losses) on investments | | | (3.47 | ) | | | 0.57 | | | | 8.09 | | | | 7.35 | | | | 2.29 | | | | 0.97 | |
| | | | | | | | | | | | | | | | | | | | | | | | |
Total from investment operations | | | (3.59 | ) | | | 0.34 | | | | 7.86 | | | | 7.15 | | | | 2.12 | | | | 0.77 | |
Distributions to shareholders from | | | | | | | | | | | | | | | | | | | | | | | | |
Net realized gains | | | (4.35 | ) | | | (5.06 | ) | | | (6.03 | ) | | | (0.41 | ) | | | (2.59 | ) | | | (2.59 | ) |
Net asset value, end of period | | | $26.61 | | | | $34.55 | | | | $39.27 | | | | $37.44 | | | | $30.70 | | | | $31.17 | |
Total return2 | | | (12.34 | )% | | | 3.88 | % | | | 23.97 | % | | | 23.52 | % | | | 7.40 | % | | | 2.24 | % |
Ratios to average net assets (annualized) | | | | | | | | | | | | | | | | | | | | | | | | |
Gross expenses | | | 1.13 | % | | | 1.13 | % | | | 1.12 | % | | | 1.13 | % | | | 1.12 | % | | | 1.09 | % |
Net expenses | | | 1.13 | % | | | 1.13 | % | | | 1.12 | % | | | 1.13 | % | | | 1.12 | % | | | 1.09 | % |
Net investment loss | | | (0.74 | )% | | | (0.70 | )% | | | (0.62 | )% | | | (0.62 | )% | | | (0.58 | )% | | | (0.52 | )% |
Supplemental data | | | | | | | | | | | | | | | | | | | | | | | | |
Portfolio turnover rate | | | 27 | % | | | 71 | % | | | 67 | % | | | 73 | % | | | 78 | % | | | 87 | % |
Net assets, end of period (000s omitted) | | | $258,119 | | | | $333,814 | | | | $353,042 | | | | $335,898 | | | | $400,997 | | | | $575,568 | |
| 1 | Calculated based upon average shares outstanding |
| 2 | Returns for periods of less than one year are not annualized. |
The accompanying notes are an integral part of these financial statements.
Wells Fargo Discovery Fund | 17
Financial highlights
(For a share outstanding throughout each period)
| | | | | | | | | | | | | | | | | | | | | | | | |
| | | Six months ended
March 31, 2020
(unaudited) | | | Year ended September 30 | |
| INSTITUTIONAL CLASS | | 2019 | | | 2018 | | | 2017 | | | 2016 | | | 2015 | |
Net asset value, beginning of period | | | $36.50 | | | | $41.05 | | | | $38.79 | | | | $31.72 | | | | $32.04 | | | | $33.76 | |
Net investment loss | | | (0.09 | )1 | | | (0.15 | )1 | | | (0.18 | ) | | | (0.13 | )1 | | | (0.10 | ) | | | (0.09 | ) |
Net realized and unrealized gains (losses) on investments | | | (3.71 | ) | | | 0.66 | | | | 8.47 | | | | 7.61 | | | | 2.37 | | | | 0.96 | |
| | | | | | | | | | | | | | | | | | | | | | | | |
Total from investment operations | | | (3.80 | ) | | | 0.51 | | | | 8.29 | | | | 7.48 | | | | 2.27 | | | | 0.87 | |
Distributions to shareholders from | | | | | | | | | | | | | | | | | | | | | | | | |
Net realized gains | | | (4.35 | ) | | | (5.06 | ) | | | (6.03 | ) | | | (0.41 | ) | | | (2.59 | ) | | | (2.59 | ) |
Net asset value, end of period | | | $28.35 | | | | $36.50 | | | | $41.05 | | | | $38.79 | | | | $31.72 | | | | $32.04 | |
Total return2 | | | (12.25 | )% | | | 4.15 | % | | | 24.25 | % | | | 23.88 | % | | | 7.68 | % | | | 2.47 | % |
Ratios to average net assets (annualized) | | | | | | | | | | | | | | | | | | | | | | | | |
Gross expenses | | | 0.88 | % | | | 0.87 | % | | | 0.87 | % | | | 0.88 | % | | | 0.87 | % | | | 0.82 | % |
Net expenses | | | 0.88 | % | | | 0.87 | % | | | 0.87 | % | | | 0.88 | % | | | 0.87 | % | | | 0.82 | % |
Net investment loss | | | (0.48 | )% | | | (0.42 | )% | | | (0.36 | )% | | | (0.37 | )% | | | (0.32 | )% | | | (0.26 | )% |
Supplemental data | | | | | | | | | | | | | | | | | | | | | | | | |
Portfolio turnover rate | | | 27 | % | | | 71 | % | | | 67 | % | | | 73 | % | | | 78 | % | | | 87 | % |
Net assets, end of period (000s omitted) | | | $643,931 | | | | $1,096,888 | | | | $1,352,027 | | | | $1,157,148 | | | | $1,316,107 | | | | $1,436,125 | |
| 1 | Calculated based upon average shares outstanding |
| 2 | Returns for periods of less than one year are not annualized. |
The accompanying notes are an integral part of these financial statements.
18 | Wells Fargo Discovery Fund
Notes to financial statements (unaudited)
1. ORGANIZATION
Wells Fargo Funds Trust (the “Trust”), a Delaware statutory trust organized on March 10, 1999, is anopen-end management investment company registered under the Investment Company Act of 1940, as amended (the “1940 Act”). As an investment company, the Trust follows the accounting and reporting guidance in Financial Accounting Standards Board (“FASB”)Accounting Standards Codification Topic 946, Financial Services – Investment Companies. These financial statements report on the Wells Fargo Discovery Fund (the “Fund”) which is a diversified series of the Trust.
2. SIGNIFICANT ACCOUNTING POLICIES
The following significant accounting policies, which are consistently followed in the preparation of the financial statements of the Fund, are in conformity with U.S. generally accepted accounting principles which require management to make estimates and assumptions that affect the reported amounts of assets and liabilities, disclosure of contingent assets and liabilities at the date of the financial statements, and the reported amounts of revenues and expenses during the reporting period. Actual results could differ from those estimates.
Securities valuation
All investments are valued each business day as of the close of regular trading on the New York Stock Exchange (generally 4 p.m. Eastern Time), although the Fund may deviate from this calculation time under unusual or unexpected circumstances.
Equity securities that are listed on a foreign or domestic exchange or market are valued at the official closing price or, if none, the last sales price. If no sale occurs on the principal exchange or market that day, a fair value price will be determined in accordance with the Fund’s Valuation Procedures.
Investments in registeredopen-end investment companies are valued at net asset value. Interests innon-registered investment companies that are redeemable at net asset value are fair valued normally at net asset value.
Investments which are not valued using any of the methods discussed above are valued at their fair value, as determined in good faith by the Board of Trustees of the Fund. The Board of Trustees has established a Valuation Committee comprised of the Trustees and has delegated to it the authority to take any actions regarding the valuation of portfolio securities that the Valuation Committee deems necessary or appropriate, including determining the fair value of portfolio securities, unless the determination has been delegated to the Wells Fargo Asset Management Pricing Committee at Wells Fargo Funds Management, LLC (“Funds Management”). The Board of Trustees retains the authority to make or ratify any valuation decisions or approve any changes to the Valuation Procedures as it deems appropriate. On a quarterly basis, the Board of Trustees receives reports on any valuation actions taken by the Valuation Committee or the Wells Fargo Asset Management Pricing Committee which may include items for ratification.
Foreign currency translation
The accounting records of the Fund are maintained in U.S. dollars. The values of other assets and liabilities denominated in foreign currencies are translated into U.S. dollars at rates provided by an independent foreign currency pricing source at a time each business day specified by the Wells Fargo Asset Management Pricing Committee. Purchases and sales of securities, and income and expenses are converted at the rate of exchange on the respective dates of such transactions. Net realized foreign exchange gains or losses arise from sales of foreign currencies, currency gains or losses realized between the trade and settlement dates on securities transactions, and the difference between the amounts of dividends, interest and foreign withholding taxes recorded and the U.S. dollar equivalent of the amounts actually paid or received. Net unrealized foreign exchange gains and losses arise from changes in the fair value of assets and liabilities other than investments in securities resulting from changes in exchange rates. The changes in net assets arising from changes in exchange rates of securities and the changes in net assets resulting from changes in market prices of securities are not separately presented. Such changes are included in net realized and unrealized gains or losses from investments.
Securities lending
The Fund may lend its securities from time to time in order to earn additional income in the form of fees or interest on securities received as collateral or the investment of any cash received as collateral. When securities are on loan, the Fund receives interest or dividends on those securities. Cash collateral received in connection with its securities lending transactions is invested in Securities Lending Cash Investments, LLC (the “Securities Lending Fund”). Investments in Securities Lending Fund are valued at the evaluated bid price provided by an independent pricing service. Income earned from investment in the Securities Lending Fund, if any, is included in securities lending income from affiliates (net of fees and rebates) on the Statement of Operations.
In a securities lending transaction, the net asset value of the Fund is affected by an increase or decrease in the value of the securities loaned and by an increase or decrease in the value of the instrument in which collateral is invested. The amount of
Wells Fargo Discovery Fund | 19
Notes to financial statements (unaudited)
securities lending activity undertaken by the Fund fluctuates from time to time. The Fund has the right under the lending agreement to recover the securities from the borrower on demand. In the event of default or bankruptcy by the borrower, the Fund may be prevented from recovering the loaned securities or gaining access to the collateral or may experience delays or costs in doing so. In such an event, the terms of the agreement allows the unaffiliated securities lending agent to use the collateral to purchase replacement securities on behalf of the Fund or pay the Fund the market value of the loaned securities. The Fund bears the risk of loss with respect to depreciation of its investment of the cash collateral.
Security transactions and income recognition
Securities transactions are recorded on a trade date basis. Realized gains or losses are recorded on the basis of identified cost.
Dividend income is recognized on theex-dividend date. Dividend income is recorded net of foreign taxes withheld where recovery of such taxes is not assured.
Distributions to shareholders
Distributions to shareholders from net investment income and any net realized gains are recorded on theex-dividend date and paid at least annually. Such distributions are determined in accordance with income tax regulations and may differ from U.S. generally accepted accounting principles. Dividend sources are estimated at the time of declaration. The tax character of distributions is determined as of the Fund’s fiscal year end. Therefore, a portion of the Fund’s distributions made prior to the Fund’s fiscal year end may be categorized as a tax return of capital at year end.
Federal and other taxes
The Fund intends to continue to qualify as a regulated investment company by distributing substantially all of its investment company taxable income and any net realized capital gains (after reduction for capital loss carryforwards) sufficient to relieve it from all, or substantially all, federal income taxes. Accordingly, no provision for federal income taxes was required.
The Fund’s income and federal excise tax returns and all financial records supporting those returns for the prior three fiscal years are subject to examination by the federal and Delaware revenue authorities. Management has analyzed the Fund’s tax positions taken on federal, state, and foreign tax returns for all open tax years and does not believe that there are any uncertain tax positions that require recognition of a tax liability.
As of March 31, 2020, the aggregate cost of all investments for federal income tax purposes was $1,571,953,986 and the unrealized gains (losses) consisted of:
| | | | |
| |
Gross unrealized gains | | $ | 369,844,632 | |
| |
Gross unrealized losses | | | (120,947,990 | ) |
| |
Net unrealized gains | | $ | 248,896,642 | |
Class allocations
The separate classes of shares offered by the Fund differ principally in applicable sales charges, distribution, shareholder servicing, and administration fees. Class specific expenses are charged directly to that share class. Investment income, common fund-level expenses, and realized and unrealized gains (losses) on investments are allocated daily to each class of shares based on the relative proportion of net assets of each class.
3. FAIR VALUATION MEASUREMENTS
Fair value measurements of investments are determined within a framework that has established a fair value hierarchy based upon the various data inputs utilized in determining the value of the Fund’s investments. The three-level hierarchy gives the highest priority to unadjusted quoted prices in active markets for identical assets or liabilities (Level 1) and the lowest priority to unobservable inputs (Level 3). The Fund’s investments are classified within the fair value hierarchy based on the lowest level of input that is significant to the fair value measurement. The inputs are summarized into three broad levels as follows:
| ∎ | | Level 1 – quoted prices in active markets for identical securities |
| ∎ | | Level 2 – other significant observable inputs (including quoted prices for similar securities, interest rates, prepayment speeds, credit risk, etc.) |
| ∎ | | Level 3 – significant unobservable inputs (including the Fund’s own assumptions in determining the fair value of investments) |
The inputs or methodologies used for valuing investments in securities are not necessarily an indication of the risk associated with investing in those securities.
20 | Wells Fargo Discovery Fund
Notes to financial statements (unaudited)
The following is a summary of the inputs used in valuing the Fund’s assets and liabilities as of March 31, 2020:
| | | | | | | | | | | | | | | | |
| | | | |
| | | Quoted prices
(Level 1) | | | Other significant
observable inputs
(Level 2) | | | Significant
unobservable inputs (Level 3) | | | Total | |
| | | | |
Assets | | | | | | | | | | | | | | | | |
Investments in: | | | | | | | | | | | | | | | | |
| | | | |
Common stocks | | | | | | | | | | | | | | | | |
| | | | |
Communication services | | $ | 48,033,756 | | | $ | 0 | | | $ | 0 | | | $ | 48,033,756 | |
| | | | |
Communication discretionary | | | 213,841,850 | | | | 0 | | | | 0 | | | | 213,841,850 | |
| | | | |
Consumer staples | | | 38,510,331 | | | | 0 | | | | 0 | | | | 38,510,331 | |
| | | | |
Health care | | | 502,374,050 | | | | 0 | | | | 0 | | | | 502,374,050 | |
| | | | |
Industrials | | | 348,699,351 | | | | 0 | | | | 0 | | | | 348,699,351 | |
| | | | |
Information technology | | | 585,162,966 | | | | 0 | | | | 0 | | | | 585,162,966 | |
| | | | |
Real estate | | | 31,980,912 | | | | 0 | | | | 0 | | | | 31,980,912 | |
| | | | |
Short-term investments | | | | | | | 0 | | | | 0 | | | | | |
| | | | |
Investment companies | | | 52,247,412 | | | | 0 | | | | 0 | | | | 52,247,412 | |
| | | | |
Total assets | | $ | 1,820,850,628 | | | $ | 0 | | | $ | 0 | | | $ | 1,820,850,628 | |
Additional sector, industry or geographic detail is included in the Portfolio of Investments.
For the six months ended March 31, 2020, the Fund did not have any transfers into/out of Level 3.
4. TRANSACTIONS WITH AFFILIATES
Management fee
Funds Management, an indirect wholly owned subsidiary of Wells Fargo & Company (“Wells Fargo”), is the manager of the Fund and provides advisory and fund-level administrative services under an investment management agreement. Under the investment management agreement, Funds Management is responsible for, among other services, implementing the investment objectives and strategies of the Fund, supervising the subadviser and providing fund-level administrative services in connection with the Fund’s operations. As compensation for its services under the investment management agreement, Funds Management is entitled to receive a management fee at the following annual rate based on the Fund’s average daily net assets:
| | | | |
| |
| Average daily net assets | | Management fee | |
| |
First $500 million | | | 0.800 | % |
| |
Next $500 million | | | 0.750 | |
| |
Next $1 billion | | | 0.700 | |
| |
Next $2 billion | | | 0.675 | |
| |
Next $1 billion | | | 0.650 | |
| |
Next $5 billion | | | 0.640 | |
| |
Over $10 billion | | | 0.630 | |
For the six months ended March 31, 2020, the management fee was equivalent to an annual rate of 0.73% of the Fund’s average daily net assets.
Funds Management has retained the services of a subadviser to provide daily portfolio management to the Fund. The fee for subadvisory services is borne by Funds Management. Wells Capital Management Incorporated (“WellsCap”), an affiliate of Funds Management and an indirect wholly owned subsidiary of Wells Fargo, is the subadviser to the Fund and is entitled to receive a fee from Funds Management at an annual rate starting at 0.45% and declining to 0.35% as the average daily net assets of the Fund increase.
Administration fees
Under a class-level administration agreement, Funds Management provides class-level administrative services to the Fund, which includes paying fees and expenses for services provided by the transfer agent,sub-transfer agents, omnibus account
Wells Fargo Discovery Fund | 21
Notes to financial statements (unaudited)
servicers and record-keepers. As compensation for its services under the class-level administration agreement, Funds Management receives an annual fee which is calculated based on the average daily net assets of each class as follows:
| | |
| |
| | | Class-level
administration fee |
| |
Class A, Class C | | 0.21% |
| |
Class R6 | | 0.03 |
| |
Administrator Class, Institutional Class | | 0.13 |
Waivers and/or expense reimbursements
Funds Management has contractually waived and/or reimbursed management and administration fees to the extent necessary to maintain certain net operating expense ratios for the Fund. When each class of the Fund has exceeded its expense cap, Funds Management has waived fees and/or reimbursed expenses from fund-level expenses on a proportionate basis and then from class specific expenses. When only certain classes exceed their expense caps, waivers and/or reimbursements are applied against class specific expenses before fund-level expenses. Funds Management has committed through January 31, 2021 to waive fees and/or reimburse expenses to the extent necessary to cap the Fund’s expenses at 1.22% for Class A shares, 1.97% for Class C shares, 0.79% for Class R6 shares, 1.14% for Administrator Class shares, and 0.89% for Institutional Class shares. Prior to or after the commitment expiration date, the cap may be increased or the commitment to maintain the cap may be terminated only with the approval of the Board of Trustees. Prior to February 1, 2020, the Fund’s expenses were capped at 0.84% for Class R6 shares and 1.15% for Administrator Class shares.
Distribution fee
The Trust has adopted a distribution plan for Class C shares of the Fund pursuant to Rule12b-1 under the 1940 Act. A distribution fee is charged to Class C shares and paid to Wells Fargo Funds Distributor, LLC (“Funds Distributor”), the principal underwriter, at an annual rate of 0.75% of the average daily net assets of Class C shares.
In addition, Funds Distributor is entitled to receive thefront-end sales charge from the purchase of Class A shares and a contingent deferred sales charge on the redemption of certain Class A shares. Funds Distributor is also entitled to receive the contingent deferred sales charges from redemptions of Class C shares. For the six months ended March 31, 2020, Funds Distributor received $4,689 from the sale of Class A shares. No contingent deferred sales charges were incurred by Class A and Class C shares for the six months ended March 31, 2020.
Shareholder servicing fees
The Trust has entered into contracts with one or more shareholder servicing agents, whereby Class A, Class C, and Administrator Class of the Fund are charged a fee at an annual rate of 0.25% of the average daily net assets of each respective class. A portion of these total shareholder servicing fees were paid to affiliates of Wells Fargo.
Interfund transactions
The Fund may purchase or sell portfolio investment securities to certain other Wells Fargo affiliates pursuant to Rule17a-7 under the 1940 Act and under procedures adopted by the Board of Trustees. The procedures have been designed to ensure that these interfund transactions, which do not incur broker commissions, are effected at current market prices.
5. INVESTMENT PORTFOLIO TRANSACTIONS
Purchases and sales of investments, excluding U.S. government obligations (if any) and short-term securities, for the six months ended March 31, 2020 were $603,176,572 and $752,952,632, respectively.
6. SECURITIES LENDING TRANSACTIONS
The Fund lends its securities through an unaffiliated securities lending agent and receives collateral in the form of cash or securities with a value at least equal to the value of the securities on loan. The value of the loaned securities is determined at the close of each business day and any increases or decreases in the required collateral are exchanged between the Fund and the counterparty on the next business day. Cash collateral received is invested in the Securities Lending Fund which seeks to provide a positive return compared to the daily Fed Funds Open Rate by investing in high-quality, U.S. dollar-denominated short-term money market instruments and is exempt from registration under Section 3(c)(7) of the 1940 Act. Securities Lending Fund is managed by Funds Management and is subadvised by WellsCap. Funds Management receives an advisory fee starting at 0.05% and declining to 0.01% as the average daily net assets of the Securities Lending Fund increase. All of the fees received by Funds Management are paid to WellsCap for its services as subadviser.
22 | Wells Fargo Discovery Fund
Notes to financial statements (unaudited)
In the event of counterparty default or the failure of a borrower to return a loaned security, the Fund has the right to use the collateral to offset any losses incurred. As of March 31, 2020, the Fund had securities lending transactions with the following counterparties which are subject to offset:
| | | | | | | | | | | | |
| | | |
| Counterparty | | Value of
securities on loan | | | Collateral
received1 | | | Net amount | |
| | | |
Bank of America Securities Inc. | | $ | 1,000,050 | | | $ | (1,000,050 | ) | | $ | 0 | |
| | | |
Citigroup Global Markets Inc. | | | 41,904 | | | | (41,904 | ) | | | 0 | |
| | | |
JPMorgan Securities LLC | | | 1,406,737 | | | | (1,406,737 | ) | | | 0 | |
| | | |
Morgan Stanley & Co. LLC | | | 19,646,316 | | | | (19,646,316 | ) | | | 0 | |
| | | |
Scotia Capital (USA) Inc. | | | 1,676,160 | | | | (1,676,160 | ) | | | 0 | |
| 1 | Collateral received within this table is limited to the collateral for the net transaction with the counterparty. |
7. BANK BORROWINGS
The Trust (excluding the money market funds), Wells Fargo Master Trust and Wells Fargo Variable Trust are parties to a $280,000,000 revolving credit agreement whereby the Fund is permitted to use bank borrowings for temporary or emergency purposes, such as to fund shareholder redemption requests. Interest under the credit agreement is charged to the Fund based on a borrowing rate equal to the higher of the Federal Funds rate in effect on that day plus 1.25% or the overnight LIBOR rate in effect on that day plus 1.25%. In addition, an annual commitment fee equal to 0.25% of the unused balance is allocated to each participating fund.
During the six months ended March 31, 2020, the Fund had average borrowings outstanding of $107,352 (on an annualized basis) at an average rate of 2.87% and paid interest in the amount of $3,081.
8. CONCENTRATION RISK
Concentration risks result from exposure to a limited number of sectors. As of the end of the period, the Fund invests a concentration of its portfolio in the information technology and health care sectors. A fund that invests a substantial portion of its assets in any sector may be more affected by changes in that sector than would be a fund whose investments are not heavily weighted in any sector.
9. INDEMNIFICATION
Under the Trust’s organizational documents, the officers and Trustees have been granted certain indemnification rights against certain liabilities that may arise out of performance of their duties to the Trust. Additionally, in the normal course of business, the Trust may enter into contracts with service providers that contain a variety of indemnification clauses. The Trust’s maximum exposure under these arrangements is dependent on future claims that may be made against the Fund and, therefore, cannot be estimated.
10. REDEMPTIONSIN-KIND
During the six months ended March 31, 2020, the Fund redeemed assets throughin-kind redemptions for shareholders in Institutional Class. The realized gains (losses) recognized by the Fund are reflected on the Statement of Operations and these redemption transactions are reflected on the Statement of Changes in Net Assets. The date of each redemption transaction, value of securities issued from the redemption, cash paid, realized gains (losses), the shareholder class and the percentage of the Fund redeemed by the shareholder was as follows:
| | | | | | | | | | | | | | |
| Date | | Value of securities issued | | | Cash | | | Realized gains (losses) | | | % of the Fund |
| | | | |
| 10-2-2019 | | $ | 102,113,126 | | | $ | 2,769,688 | | | $ | (1,236,201 | ) | | 4.32% |
| | | | |
| 12-20-2019 | | | 32,614,848 | | | | 412,769 | | | | 5,934,047 | | | 1.39 |
11. NEW ACCOUNTING PRONOUNCEMENT
In August 2018, FASB issued Accounting Standards Update (“ASU”)No. 2018-13, Fair Value Measurement (Topic 820)Disclosure Framework—Changes to the Disclosure Requirements for Fair Value Measurement. ASU2018-13 updates the disclosure requirements for fair value measurements by modifying or removing certain disclosures and adding certain new disclosures. The
Wells Fargo Discovery Fund | 23
Notes to financial statements (unaudited)
amendments are effective for fiscal years, and interim periods within those fiscal years, beginning after December 15, 2019. Early adoption is permitted. Management has adopted the removal and modification of disclosures early, as permitted, and will adopt the additional new disclosures at the effective date.
12. CORONAVIRUS(COVID-19) PANDEMIC
On March 11, 2020, the World Health Organization announced that it had made the assessment that coronavirus disease 2019(“COVID-19”) is a pandemic. The impacts ofCOVID-19 are adversely affecting the entire global economy, individual companies and investment products, and the market in general. There is significant uncertainty around the extent and duration of business disruptions related toCOVID-19 and the impacts may be short term or may last for an extended period of time. The risk of further spreading ofCOVID-19 has led to significant uncertainty and volatility in the financial markets. The value of the Fund and the securities in which the Fund invests have generally been adversely affected by impacts caused byCOVID-19.
24 | Wells Fargo Discovery Fund
Other information (unaudited)
PROXY VOTING INFORMATION
A description of the policies and procedures used to determine how to vote proxies relating to portfolio securities is available, upon request, by calling1-800-222-8222, visiting our website atwfam.com, or visiting the SEC website at sec.gov. Information regarding how the proxies related to portfolio securities were voted during the most recent12-month period ended June 30 is available on the website atwfam.comor by visiting the SEC website at sec.gov.
QUARTERLY PORTFOLIO HOLDINGS INFORMATION
The Fund files its complete schedule of portfolio holdings with the SEC for the first and third quarters of each fiscal year as an exhibit to its reports on FormN-PORT. Shareholders may view the filed FormN-PORT by visiting the SEC website at sec.gov.
Wells Fargo Discovery Fund | 25
Other information (unaudited)
BOARD OF TRUSTEES AND OFFICERS
Each of the Trustees and Officers1 listed in the table below acts in identical capacities for each fund in the Wells Fargo family of funds, which consists of 147 mutual funds comprising the Wells Fargo Funds Trust, Wells Fargo Variable Trust, Wells Fargo Master Trust and fourclosed-end funds (collectively the “Fund Complex”). This table should be read in conjunction with the Prospectus and the Statement of Additional Information2. The mailing address of each Trustee and Officer is 525 Market Street, 12th Floor, San Francisco, CA 94105. Each Trustee and Officer serves an indefinite term, however, each Trustee serves such term until reaching the mandatory retirement age established by the Trustees.
Independent Trustees
| | | | | | |
Name and year of birth | | Position held and
length of service* | | Principal occupations during past five years or longer | | Current other
public company or
investment
company
directorships |
| | | |
| William R. Ebsworth (Born 1957) | | Trustee, since 2015 | | Retired. From 1984 to 2013, equities analyst, portfolio manager, research director and chief investment officer at Fidelity Management and Research Company in Boston, Tokyo, and Hong Kong, and retired in 2013 as Chief Investment Officer of Fidelity Strategic Advisers, Inc. where he led a team of investment professionals managing client assets. Prior thereto, Board member of Hong Kong Securities Clearing Co., Hong Kong Options Clearing Corp., the Thailand International Fund, Ltd., Fidelity Investments Life Insurance Company, and Empire Fidelity Investments Life Insurance Company. Audit Committee Chair and Investment Committee Chair of the Vincent Memorial Hospital Endowment(non-profit organization). Mr. Ebsworth is a CFA® charterholder. | | N/A |
| | | |
| Jane A. Freeman (Born 1953) | | Trustee, since 2015; Chair Liaison, since 2018 | | Retired. From 2012 to 2014 and 1999 to 2008, Chief Financial Officer of Scientific Learning Corporation. From 2008 to 2012, Ms. Freeman provided consulting services related to strategic business projects. Prior to 1999, Portfolio Manager at Rockefeller & Co. and Scudder, Stevens & Clark. Board member of the Harding Loevner Funds from 1996 to 2014, serving as both Lead Independent Director and chair of the Audit Committee. Board member of the Russell Exchange Traded Funds Trust from 2011 to 2012 and the chair of the Audit Committee. Ms. Freeman is a Board Member of The Ruth Bancroft Garden(non-profit organization). She is also an inactive Chartered Financial Analyst. | | N/A |
| | | |
| Isaiah Harris, Jr. (Born 1952) | | Trustee, since 2009; Audit Committee Chairman, since 2019 | | Retired. Chairman of the Board of CIGNA Corporation since 2009, and Director since 2005. From 2003 to 2011, Director of Deluxe Corporation. Prior thereto, President and CEO of BellSouth Advertising and Publishing Corp. from 2005 to 2007, President and CEO of BellSouth Enterprises from 2004 to 2005 and President of BellSouth Consumer Services from 2000 to 2003. Emeritus member of the Iowa State University Foundation Board of Governors. Emeritus Member of the Advisory Board of Iowa State University School of Business. Advisory Board Member, Palm Harbor Academy (private school). Advisory Board Member, Child Evangelism Fellowship(non-profit). Mr. Harris is a certified public accountant (inactive status). | | CIGNA Corporation |
| | | |
| Judith M. Johnson (Born 1949) | | Trustee, since 2008; Audit Committee Chairman, from 2009 to 2018 | | Retired. Prior thereto, Chief Executive Officer and Chief Investment Officer of Minneapolis Employees Retirement Fund from 1996 to 2008. Ms. Johnson is an attorney, certified public accountant and a certified managerial accountant. | | N/A |
26 | Wells Fargo Discovery Fund
Other information (unaudited)
| | | | | | |
Name and year of birth | | Position held and
length of service* | | Principal occupations during past five years or longer | | Current other
public company or
investment
company
directorships |
| | | |
| David F. Larcker (Born 1950) | | Trustee, since 2009 | | James Irvin Miller Professor of Accounting at the Graduate School of Business, Stanford University, Director of the Corporate Governance Research Initiative and Senior Faculty of The Rock Center for Corporate Governance since 2006. From 2005 to 2008, Professor of Accounting at the Graduate School of Business, Stanford University. Prior thereto, Ernst & Young Professor of Accounting at The Wharton School, University of Pennsylvania from 1985 to 2005. | | N/A |
| | | |
| Olivia S. Mitchell (Born 1953) | | Trustee, since 2006; Nominating and Governance Committee Chair, since 2018 | | International Foundation of Employee Benefit Plans Professor, Wharton School of the University of Pennsylvania since 1993. Director of Wharton’s Pension Research Council and Boettner Center on Pensions & Retirement Research, and Research Associate at the National Bureau of Economic Research. Previously, Cornell University Professor from 1978 to 1993. | | N/A |
| | | |
| Timothy J. Penny (Born 1951) | | Trustee, since 1996; Chairman, since 2018 | | President and Chief Executive Officer of Southern Minnesota Initiative Foundation, anon-profit organization, since 2007. Member of the Board of Trustees of NorthStar Education Finance, Inc., anon-profit organization, since 2007. | | N/A |
| | | |
| James G. Polisson (Born 1959) | | Trustee, since 2018 | | Retired. Chief Marketing Officer, Source (ETF) UK Services, Ltd, from 2015 to 2017. From 2012 to 2015, Principal of The Polisson Group, LLC, a management consulting, corporate advisory and principal investing company. Chief Executive Officer and Managing Director at Russell Investments, Global Exchange Traded Funds from 2010 to 2012. Managing Director of Barclays Global Investors from 1998 to 2010 and Global Chief Marketing Officer for iShares and Barclays Global Investors from 2000 to 2010. Trustee of the San Francisco Mechanics’ Institute, anon-profit organization, from 2013 to 2015. Board member of the Russell Exchange Traded Fund Trust from 2011 to 2012. Director of Barclays Global Investors Holdings Deutschland GmbH from 2006 to 2009. Mr. Polisson is an attorney and has a retired status with the Massachusetts and District of Columbia Bar Associations. | | N/A |
| | | |
| Pamela Wheelock3 (Born 1959) | | Trustee, since January 2020; previously Trustee from January 2018 to July 2019 | | Board member of the Destination Medical Center Economic Development Agency, Rochester, Minnesota since 2019. Acting Commissioner, Minnesota Department of Human Services, July 2019 through September 2019. Human Services Manager (part-time), Minnesota Department of Human Services, October 2019 through December 2019. Chief Operating Officer, Twin Cities Habitat for Humanity from 2017 to 2019. Vice President of University Services, University of Minnesota from 2012 to 2016. Prior thereto, on the Board of Directors, Governance Committee and Finance Committee for the Minnesota Philanthropy Partners (Saint Paul Foundation) from 2012 to 2018, Interim Chief Executive Officer of Blue Cross Blue Shield of Minnesota from 2011 to 2012, Chairman of the Board from 2009 to 2012 and Board Director from 2003 to 2015. Vice President, Leadership and Community Engagement, Bush Foundation, Saint Paul, Minnesota (a private foundation) from 2009 to 2011. Executive Vice President and Chief Financial Officer, Minnesota Sports and Entertainment from 2004 to 2009 and Senior Vice President from 2002 to 2004. Executive Vice President of the Minnesota Wild Foundation from 2004 to 2008. Commissioner of Finance, State of Minnesota, from 1999 to 2002. Currently Board Chair of the Minnesota Wild Foundation since 2010. | | N/A |
| * | Length of service dates reflect the Trustee’s commencement of service with the Trust’s predecessor entities, where applicable. |
Wells Fargo Discovery Fund | 27
Other information (unaudited)
Officers
| | | | |
Name and year of birth | | Position held and
length of service | | Principal occupations during past five years or longer |
| | |
| Andrew Owen (Born 1960) | | President, since 2017 | | Executive Vice President of Wells Fargo & Company and Head of Affiliated Managers, Wells Fargo Asset Management, since 2014. In addition, Mr. Owen is currently President, Chief Executive Officer and Director of Wells Fargo Funds Management, LLC since 2017. Prior thereto, Executive Vice President responsible for marketing, investments and product development for Wells Fargo Funds Management, LLC, from 2009 to 2014. |
| | |
| Nancy Wiser1 (Born 1967) | | Treasurer, since 2012 | | Executive Vice President of Wells Fargo Funds Management, LLC since 2011. Chief Operating Officer and Chief Compliance Officer at LightBox Capital Management LLC, from 2008 to 2011. |
| | |
| Michelle Rhee (Born 1966) | | Chief Legal Officer, since 2019 | | Secretary of Wells Fargo Funds Management, LLC, Chief Legal Counsel of Wells Fargo Asset Management and Assistant General Counsel of Wells Fargo Bank, N.A. since 2018. Associate General Counsel and Managing Director of Bank of America Corporation from 2004 to 2018. |
| | |
| Catherine Kennedy (Born 1969) | | Secretary, since 2019 | | Vice President of Wells Fargo Funds Management, LLC and Senior Counsel of the Wells Fargo Legal Department since 2010. Vice President and Senior Counsel of Evergreen Investment Management Company, LLC from 1998 to 2010. |
| | |
| Michael H. Whitaker(Born 1967) | | Chief
Compliance Officer, since 2016 | | Chief Compliance Officer of Wells Fargo Asset Management since 2016. Senior Vice President and Chief Compliance Officer for Fidelity Investments from 2007 to 2016. |
| | |
| David Berardi (Born 1975) | | Assistant Treasurer, since 2009 | | Vice President of Wells Fargo Funds Management, LLC since 2009. Vice President of Evergreen Investment Management Company, LLC from 2008 to 2010. Manager of Fund Reporting and Control for Evergreen Investment Management Company, LLC from 2004 to 2010. |
| | |
| Jeremy DePalma1 (Born 1974) | | Assistant Treasurer, since 2009 | | Senior Vice President of Wells Fargo Funds Management, LLC since 2009. Senior Vice President of Evergreen Investment Management Company, LLC from 2008 to 2010 and head of the Fund Reporting and Control Team within Fund Administration from 2005 to 2010. |
| 1 | Nancy Wiser acts as Treasurer of 65 funds in the Fund Complex. Jeremy DePalma acts as Treasurer of 82 funds and Assistant Treasurer of 65 funds in the Fund Complex. |
| 2 | The Statement of Additional Information includes additional information about the Trustees and is available, without charge, upon request, by calling1-800-222-8222 or by visiting the website atwfam.com. |
| 3 | Pamela Wheelock wasre-appointed to the Board effective January 1, 2020. |
28 | Wells Fargo Discovery Fund
Appendix I (unaudited)
Effective on or about May 1, 2020, if you purchase Fund shares through a Janney Montgomery Scott LLC (“Janney”) brokerage account, you will be eligible for the following load waivers(front-end sales charge waivers and contingent deferred sales charge (“CDSC”), orback-end sales charge, waivers) and discounts, which may differ from those disclosed elsewhere in the Fund’s Prospectus or SAI.
|
|
| Front-end sales charge* waivers on Class A shares available at Janney |
|
| Shares purchased through reinvestment of capital gains distributions and dividend reinvestment when purchasing shares of the same fund (but not any other fund within the fund family). |
|
| Shares purchased by employees and registered representatives of Janney or its affiliates and their family members as designated by Janney. |
|
| Shares purchased from the proceeds of redemptions within the same fund family, provided (1) the repurchase occurs within ninety (90) days following the redemption, (2) the redemption and purchase occur in the same account, and (3) redeemed shares were subject to afront-end or deferred sales load (i.e., right of reinstatement). |
|
| Employer-sponsored retirement plans (e.g., 401(k) plans, 457 plans, employer-sponsored 403(b) plans, profit sharing and money purchase pension plans and defined benefit plans). For purposes of this provision, employer-sponsored retirement plans do not include SEP IRAs, Simple IRAs,SAR-SEPs or Keogh plans. |
|
| Shares acquired through a right of reinstatement. |
|
| Class C shares that are no longer subject to a contingent deferred sales charge and are converted to Class A shares of the same fund pursuant to Janney’s policies and procedures. |
|
| CDSC waivers on Class A and Class C shares available at Janney |
|
| Shares sold upon the death or disability of the shareholder. |
|
| Shares sold as part of a systematic withdrawal plan as described in the Fund’s Prospectus. |
|
| Shares purchased in connection with a return of excess contributions from an IRA account. |
|
| Shares sold as part of a required minimum distribution for IRA and retirement accounts if the redemption is taken in or after the year the shareholder reaches qualified age based on applicable IRS regulations. |
|
| Shares sold to pay Janney fees but only if the transaction is initiated by Janney. |
|
| Shares acquired through a right of reinstatement. |
|
| Shares exchanged into the same share class of a different fund. |
|
| Front-end sales charge* discounts available at Janney; breakpoints, rights of accumulation and/or letters of intent |
|
| Breakpoints as described in the Fund’s Prospectus. |
|
| Rights of accumulation (“ROA”), which entitle shareholders to breakpoint discounts, will be automatically calculated based on the aggregated holding of fund family assets held by accounts within the purchaser’s household at Janney. Eligible fund family assets not held at Janney may be included in the ROA calculation only if the shareholder notifies his or her financial advisor about such assets. |
|
| Letters of intent which allow for breakpoint discounts based on anticipated purchases within a fund family, over a13-month time period. Eligible fund family assets not held at Janney Montgomery Scott may be included in the calculation of letters of intent only if the shareholder notifies his or her financial advisor about such assets. |
| * | Also referred to as an “initial sales charge.” |
Wells Fargo Discovery Fund | 29
Appendix II (unaudited)
Effective on or after May 1, 2020, clients of Edward Jones (also referred to as “shareholders”) purchasing Fund shares on the Edward Jones commission andfee-based platforms are eligible only for the following sales charge discounts (also referred to as “breakpoints”) and waivers, which can differ from breakpoints and waivers described elsewhere in this Prospectus or SAI or through another broker-dealer. In all instances, it is the shareholder’s responsibility to inform Edward Jones at the time of purchase of any relationship, holdings of Wells Fargo Funds or other facts qualifying the purchaser for breakpoints or waivers. Edward Jones can ask for documentation of such circumstance.
|
| Breakpoints available at Edward Jones |
|
| Rights of Accumulation (ROA) |
|
The applicable sales charge on a purchase of Class A shares is determined by taking into account all share classes (except any money market funds and retirement plan share classes) of Wells Fargo Funds held by the shareholder or in an account grouped by Edward Jones with other accounts for the purpose of providing certain pricing considerations (“pricing groups”). This includes all share classes held on the Edward Jones platform and/or held on another platform. The inclusion of eligible fund family assets in the rights of accumulation calculation is dependent on the shareholder notifying his or her financial advisor of such assets at the time of calculation. |
|
ROA is determined by calculating the higher of cost or market value (current shares x NAV). |
|
| Letter of Intent (LOI) |
|
Through a LOI, shareholders can receive the sales charge and breakpoint discounts for purchases shareholders intend to makeover a13-month period from the date Edward Jones receives the LOI. The LOI is determined by calculating the higher of cost or market value of qualifying holdings at LOI initiation in combination with the value that the shareholder intends to buy over a13-month period to calculate thefront-end sales charge and any breakpoint discounts. Each purchase the shareholder makes during that13-month period will receive the sales charge and breakpoint discount that applies to the total amount. The inclusion of eligible fund family assets in the LOI calculation is dependent on the shareholder notifying his or her financial advisor of such assets at the time of calculation. Purchases made before the LOI is received by Edward Jones are not covered under the LOI and will not reduce the sales charge previously paid. Sales charges will be adjusted if LOI is not met. |
| Sales charges are waived for the following shareholders and in the following situations at Edward Jones: |
● Associates of Edward Jones and its affiliates and their family members who are in the same pricing group (as determined by Edward Jones under its policies and procedures) as the associate. This waiver will continue for the remainder of the associate’s life if the associate retires from Edward Jones in good-standing. |
● Shares purchased in an Edward Jonesfee-based program. |
● Shares purchased through reinvestment of capital gains distributions and dividend reinvestment. |
● Shares purchased from the proceeds of redeemed shares of the same fund family so long as the following conditions are met: 1)the proceeds are from the sale of shares within 60 days of the purchase, and 2) the sale and purchase are made in the same share class and the same account or the purchase is made in an individual retirement account with proceeds from liquidations in anon-retirement account. |
● Shares exchanged into Class A shares from another share class so long as the exchange is into the same fund and was initiated at the discretion of Edward Jones. Edward Jones is responsible for any remaining CDSC due to the fund company, if applicable. Any future purchases are subject to the applicable sales charge as disclosed in the prospectus. |
● Exchanges from Class C shares to Class A shares of the same fund, generally, in the 84th month following the anniversary of the purchase date or earlier at the discretion of Edward Jones. |
If the shareholder purchases shares that are subject to a CDSC and those shares are redeemed before the CDSC is expired, the shareholder is
responsible to pay the CDSC except in the following conditions available at Edward Jones: |
● The death or disability of the shareholder. |
● Systematic withdrawals with up to 10% per year of the account value. |
● Return of excess contributions from an Individual Retirement Account (IRA). |
● Shares sold as part of a required minimum distribution for IRA and retirement accounts if the redemption is taken in or after the year the shareholder reaches qualified age based on applicable IRS regulation. |
● Shares sold to pay Edward Jones fees or costs in such cases where the transaction is initiated by Edward Jones. |
● Shares exchanged in an Edward Jonesfee-based program. |
● Shares acquired through NAV reinstatement. |
30 | Wells Fargo Discovery Fund
Appendix II (unaudited)
|
| Other Important Information for accounts at Edward Jones: |
Minimum Purchase Amounts ● $250 initial purchase minimum ● $50 subsequent purchase minimum |
Minimum Balances Edward Jones has the right to redeem at its discretion fund holdings with a balance of $250 or less. The following are examples of accounts that are not included in this policy: ● Afee-based account held on an Edward Jones platform ● A 529 account held on an Edward Jones platform ● An account with an active systematic investment plan or letter of intent (LOI) |
Changing Share Classes At any time it deems necessary, Edward Jones has the authority to exchange at NAV a shareholder’s holdings in a fund to Class A shares. |
Wells Fargo Discovery Fund | 31
This page is intentionally left blank.

For more information
More information about Wells Fargo Funds is available free upon request. To obtain literature, please write, visit the Fund’s website, or call:
Wells Fargo Funds
P.O. Box 219967
Kansas City, MO 64121-9967
Website:wfam.com
Individual investors:1-800-222-8222
Retail investment professionals:1-888-877-9275
Institutional investment professionals:1-866-765-0778

This report and the financial statements contained herein are submitted for the general information of the shareholders of the Fund. If this report is used for promotional purposes, distribution of the report must be accompanied or preceded by a current prospectus. Before investing, please consider the investment objectives, risks, charges, and expenses of the investment. For a current prospectus and, if available, a summary prospectus, containing this information, call1-800-222-8222 or visit the Fund’s website atwfam.com. Read the prospectus carefully before you invest or send money.
Wells Fargo Asset Management (WFAM) is the trade name for certain investment advisory/management firms owned by Wells Fargo & Company. These firms include but are not limited to Wells Capital Management Incorporated and Wells Fargo Funds Management, LLC. Certain products managed by WFAM entities are distributed by Wells Fargo Funds Distributor, LLC (a broker-dealer and Member FINRA).
This material is for general informational and educational purposes only and is NOT intended to provide investment advice or a recommendation of any kind—including a recommendation for any specific investment, strategy, or plan.
INVESTMENT PRODUCTS: NOT FDIC INSURED ◾ NO BANK GUARANTEE ◾ MAY LOSE VALUE
© 2020 Wells Fargo & Company. All rights reserved.
PAR-0420-06262 05-20
SA230/SAR230 03-20
Semi-Annual Report
March 31, 2020
Wells Fargo Enterprise Fund
Beginning on January 1, 2021, as permitted by new regulations adopted by the Securities and Exchange Commission, paper copies of the Wells Fargo Funds’ annual and semi-annual shareholder reports issued after this date will no longer be sent by mail, unless you specifically request paper copies of the reports. Instead, the reports will be made available on the Funds’ website, and you will be notified by mail each time a report is posted and provided with a website address to access the report.
If you already elected to receive shareholder reports electronically, you will not be affected by this change and you need not take any action. You may elect to receive shareholder reports and other communications from the Fund electronically at any time by contacting your financial intermediary (such as a broker-dealer or bank) or, if you are a direct investor, by calling1-800-222-8222 or by enrolling at wellsfargo.com/advantagedelivery.
You may elect to receive all future reports in paper free of charge. If you invest through a financial intermediary, you can contact your financial intermediary to request that you continue to receive paper copies of your shareholder reports; if you invest directly with the Fund, you can call 1-800-222-8222. Your election to receive reports in paper will apply to all Wells Fargo Funds held in your account with your financial intermediary or, if you are a direct investor, to all Wells Fargo Funds that you hold.
|
|
|
Reduce clutter. Save trees. |
Sign up for electronic delivery of prospectuses and
shareholder reports atwellsfargo.com/
advantagedelivery |
The views expressed and any forward-looking statements are as of March 31, 2020, unless otherwise noted, and are those of the Fund managers and/or Wells Fargo Asset Management. Discussions of individual securities, or the markets generally, or any Wells Fargo Fund are not intended as individual recommendations. Future events or results may vary significantly from those expressed in any forward-looking statements. The views expressed are subject to change at any time in response to changing circumstances in the market. Wells Fargo Asset Management and the Fund disclaim any obligation to publicly update or revise any views expressed or forward-looking statements.
INVESTMENT PRODUCTS: NOT FDIC INSURED ◾ NO BANK GUARANTEE ◾ MAY LOSE VALUE
Wells Fargo Enterprise Fund | 1
Letter to shareholders (unaudited)

Andrew Owen
President
Wells Fargo Funds
“The period began with mixed data, leading to central bank support.”
Dear Shareholder:
We are pleased to offer you this semi-annual report for the Wells Fargo Enterprise Fund for the six-month period that ended March 31, 2020. Global stock markets saw earlier gains erased in February and March as governments took unprecedented measures to stop the spread of the coronavirus at the expense of short-term economic output. Fixed-income markets were less battered, with U.S. government bonds achieving modest gains as central banks attempted to bolster capital markets and confidence.
For the period, U.S. stocks, based on the S&P 500 Index,1 returned -12.31% and international stocks, as measured by the MSCI ACWI ex USA Index (Net),2 fell 16.52%. The MSCI EM Index (Net)3 lost 14.55%. For bond investors, the Bloomberg Barclays U.S. Aggregate Bond Index4 added 3.33%, the Bloomberg Barclays Global Aggregate ex-USD Index5 returned -2.03%, the Bloomberg Barclays Municipal Bond Index6 gained a modest 0.10%, and the ICE BofA U.S. High Yield Index7 returned -10.86%.
The period began with mixed data, leading to central bank support.
As the fourth quarter of 2019 started, U.S.-China trade tensions were relaxing while optimism grew for a U.K. Brexit deal. The initial estimate of U.S. third-quarter gross domestic product growth was a resilient 1.9% annualized rate, while the U.S. unemployment rate fell to a 50-year low of 3.5% in September. Despite resilience among U.S. consumers, however, business confidence declined while manufacturing activity contracted. Concerned with a potential economic slowdown, the U.S. Federal Reserve (Fed) lowered interest rates a quarter point in late October—its third rate cut in four months. This helped push the S&P 500 Index to an all-time high while emerging market equities rallied and global bonds declined overall, reflecting a broad pickup in risk appetite.
Equity markets rallied in November despite ongoing geopolitical risks. Hopes for aU.S.-China trade deal buoyed investor confidence. U.S. business sentiment edged up, and manufacturing and services activity rose. With that positive backdrop, developed market equities outpaced those in emerging markets, and U.S. stocks outperformed non-U.S. stocks overall. While consumer confidence and purchasing manager activity rose in the eurozone, China reported weakening manufacturing and consumer data. Bond yields rose marginally, leading to slightly negative returns for global government and investment-grade corporate bonds.
Financial markets ended 2019 with a boost from the U.S. and China accord on a Phase One trade deal. That, along with the landslide win by the pro-Brexit U.K. Conservative
| 1 | The S&P 500 Index consists of 500 stocks chosen for market size, liquidity, and industry group representation. It is a market-value-weighted index with each stock’s weight in the index proportionate to its market value. You cannot invest directly in an index. |
| 2 | The Morgan Stanley Capital International (MSCI) All Country World Index (ACWI) ex USA Index (Net) is a free-float-adjusted market-capitalization-weighted index that is designed to measure the equity market performance of developed markets, excluding the United States. Source: MSCI. MSCI makes no express or implied warranties or representations and shall have no liability whatsoever with respect to any MSCI data contained herein. The MSCI data may not be further redistributed or used as a basis for other indices or any securities or financial products. This report is not approved, reviewed, or produced by MSCI. You cannot invest directly in an index. |
| 3 | The MSCI Emerging Markets (EM) Index (Net) is a free-float-adjusted market-capitalization-weighted index that is designed to measure equity market performance of emerging markets. You cannot invest directly in an index. |
| 4 | The Bloomberg Barclays U.S. Aggregate Bond Index is a broad-based benchmark that measures the investment-grade, U.S. dollar-denominated, fixed-rate taxable bond market, including Treasuries, government-related and corporate securities, mortgage-backed securities (agency fixed-rate and hybrid adjustable-rate mortgage pass-throughs), asset-backed securities, and commercial mortgage-backed securities. You cannot invest directly in an index. |
| 5 | The Bloomberg Barclays Global Aggregate ex-USD Index is an unmanaged index that provides a broad-based measure of the global investment-grade fixed-income markets excluding the U.S. dollar-denominated debt market. You cannot invest directly in an index. |
| 6 | The Bloomberg Barclays Municipal Bond Index is an unmanaged index composed of long-term tax-exempt bonds with a minimum credit rating of Baa. You cannot invest directly in an index. |
| 7 | The ICE BofA U.S. High Yield Index is a market-capitalization-weighted index of domestic and Yankee high-yield bonds. The index tracks the performance of high-yield securities traded in the U.S. bond market. You cannot invest directly in an index. Copyright 2020. ICE Data Indices, LLC. All rights reserved. |
2 | Wells Fargo Enterprise Fund
Letter to shareholders (unaudited)
Party in a national election and ongoing central bank support, gave investors greater confidence. U.S. economic indicators were positive overall, with the exception of manufacturing activity and business confidence. Consumer confidence was resilient, fed by a robust labor market, tame inflation, and lower interest rates, which boosted housing affordability and stimulated homebuyer activity. The impeachment of U.S. President Donald Trump had little impact on markets. Meanwhile, slowing Chinese economic activity, partly attributable to the trade war, led to further government stimulus at year-end through lower reserve ratios, allowing banks to lend more money.
The year-end rally continued in early January 2020. However, capital market volatility spiked in late January on concerns over the potential impact of the coronavirus on the global economy and stock markets. With sentiment somewhat souring, perceived safe havens did well in January. The U.S. dollar and Japanese yen both rose, and government bonds outperformed equities. While the S&P 500 Index held its ground, emerging market equities tumbled, including those in Asia.
In February, the coronavirus became the major market focus. Fears of the virus’s impact on global growth led to expectations of increased global central bank monetary policy support. That led the 10-year U.S. Treasury yield to fall to an all-time low of 1.1% by the end of the month. Although equity markets initially shrugged off concerns about the outbreak, focusing instead on strong fourth-quarter earnings and improving business confidence in January, market sentiment turned sharply lower toward month-end. Oil prices tumbled as Russia and the Organization of the Petroleum Exporting Countries compounded a major decline in oil demand with a brutal price war, causing the price of West Texas Intermediate crude oil to fall 13% in February alone.
The global spread of the coronavirus led many countries to clamp down on social and business-related activity in order to contain the virus from causing even greater devastation and overwhelming the health care system. This abrupt stoppage of economic activity led to the sharp deceleration of global output, sending economies into a deep contraction. Central bank responses were swift, as they slashed interest rates and expanded quantitative easing programs to restore liquidity and confidence to the markets. In the U.S., the Fed launched several lending programs, funding investment-grade bonds, money market mutual funds, and commercial paper while purchasing Treasuries, mortgage-backed securities, and overnight repos. Meanwhile, stock markets tumbled quickly into a bear market, ending the longest bull stock market in U.S. history.
Don’t let short-term uncertainty derail long-term investment goals.
Periods of investment uncertainty can present challenges, but experience has taught us that maintaining long-term investment goals can be an effective way to plan for the future. To help you create a sound strategy based on your personal goals and risk tolerance, Wells Fargo Funds offers more than 100 mutual funds spanning a wide range of asset classes and investment styles. Although diversification cannot guarantee an investment profit or prevent losses, we believe it can be an effective way to manage investment risk and potentially smooth out overall portfolio performance. We encourage investors to know their investments and to understand that appropriate levels of risk-taking may unlock opportunities.
Thank you for choosing to invest with Wells Fargo Funds. We appreciate your confidence in us and remain committed to helping you meet your financial needs.
Sincerely,

Andrew Owen
President
Wells Fargo Funds
“Capital market volatility spiked in late January on concerns over the potential impact of the coronavirus on the global economy and stock markets.”
|
|
|
For further information about your Fund, contact your investment professional, visit our website at wfam.com, or call us directly at1-800-222-8222. |
Wells Fargo Enterprise Fund | 3
Performance highlights (unaudited)
Investment objective
The Fund seeks long-term capital appreciation.
Manager
Wells Fargo Funds Management, LLC
Subadviser
Wells Capital Management Incorporated
Portfolio managers
Michael T. Smith, CFA®‡
Christopher J. Warner, CFA®‡
Average annual total returns (%) as of March 31, 2020
| | | | | | | | | | | | | | | | | | | | | | | | | | | | | | | | | | |
| | | | |
| | | | | Including sales charge | | | Excluding sales charge | | | Expense ratios1 (%) | |
| | | | | | | | | |
| | | Inception date | | 1 year | | | 5 year | | | 10 year | | | 1 year | | | 5 year | | | 10 year | | | Gross | | | Net2 | |
| | | | | | | | | | |
| Class A (SENAX) | | 2-24-2000 | | | -10.68 | | | | 5.14 | | | | 9.84 | | | | -5.22 | | | | 6.39 | | | | 10.49 | | | | 1.25 | | | | 1.18 | |
| | | | | | | | | | |
| Class C (WENCX) | | 3-31-2008 | | | -6.95 | | | | 5.59 | | | | 9.67 | | | | -5.95 | | | | 5.59 | | | | 9.67 | | | | 2.00 | | | | 1.93 | |
| | | | | | | | | | |
| Class R6 (WENRX)3 | | 10-31-2014 | | | – | | | | – | | | | – | | | | -4.88 | | | | 6.79 | | | | 10.90 | | | | 0.82 | | | | 0.80 | |
| | | | | | | | | | |
| Administrator Class (SEPKX) | | 8-30-2002 | | | – | | | | – | | | | – | | | | -5.16 | | | | 6.50 | | | | 10.60 | | | | 1.17 | | | | 1.10 | |
| | | | | | | | | | |
| Institutional Class (WFEIX) | | 6-30-2003 | | | – | | | | – | | | | – | | | | -4.94 | | | | 6.74 | | | | 10.87 | | | | 0.92 | | | | 0.85 | |
| | | | | | | | | | |
| Russell Midcap® Growth Index4 | | – | | | – | | | | – | | | | – | | | | -9.45 | | | | 5.61 | | | | 10.89 | | | | – | | | | – | |
Figures quoted represent past performance, which is no guarantee of future results, and do not reflect taxes that a shareholder may pay on an investment in a fund. Investment return and principal value of an investment will fluctuate so that an investor’s shares, when redeemed, may be worth more or less than their original cost. Performance shown without sales charges would be lower if sales charges were reflected. Current performance may be lower or higher than the performance data quoted, which assumes the reinvestment of dividends and capital gains. Current month-end performance is available on the Fund’s website,wfam.com.
Index returns do not include transaction costs associated with buying and selling securities, any mutual fund fees or expenses, or any taxes. It is not possible to invest directly in an index.
For Class A shares, the maximum front-end sales charge is 5.75%. For Class C shares, the maximum contingent deferred sales charge is 1.00%. Performance including a contingent deferred sales charge assumes the sales charge for the corresponding time period. Class R6, Administrator Class, and Institutional Class shares are sold without a front-end sales charge or contingent deferred sales charge.
Stock values fluctuate in response to the activities of individual companies and general market and economic conditions. Smaller-company stocks tend to be more volatile and less liquid than those of larger companies. Certain investment strategies tend to increase the total risk of an investment (relative to the broader market). The Fund is exposed to foreign investment risk. Consult the Fund’s prospectus for additional information on these and other risks.
Please see footnotes on page 5.
4 | Wells Fargo Enterprise Fund
Performance highlights (unaudited)
| | | | |
|
| Ten largest holdings (%) as of March 31, 20205 | |
| | |
Fiserv Incorporated | | | 3.59 | |
| | |
Advanced Micro Devices Incorporated | | | 3.01 | |
| | |
Global Payments Incorporated | | | 2.76 | |
| | |
DexCom Incorporated | | | 2.75 | |
| | |
Veeva Systems Incorporated Class A | | | 2.66 | |
| | |
Waste Connections Incorporated | | | 2.59 | |
| | |
Chipotle Mexican Grill Incorporated | | | 2.37 | |
| | |
Centene Corporation | | | 2.35 | |
| | |
Cadence Design Systems Incorporated | | | 2.24 | |
| | |
Booz Allen Hamilton Holding Corporation | | | 2.17 | |
|
|
| Sector distribution as of March 31, 20206 |
|
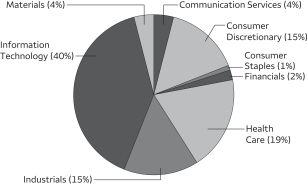 |
| ‡ | CFA® and Chartered Financial Analyst® are trademarks owned by CFA Institute. |
| 1 | Reflects the expense ratios as stated in the most recent prospectuses. The expense ratios shown are subject to change and may differ from the annualized expense ratios shown in the financial highlights of this report. |
| 2 | The manager has contractually committed through January 31, 2021, to waive fees and/or reimburse expenses to the extent necessary to cap total annual fund operating expenses after fee waivers at 1.18% for Class A, 1.93% for Class C, 0.80% for Class R6, 1.10% for Administrator Class, and 0.85% for Institutional Class. Brokerage commissions, stamp duty fees, interest, taxes, acquired fund fees and expenses (if any), and extraordinary expenses are excluded from the expense cap. Prior to or after the commitment expiration date, the cap may be increased or the commitment to maintain the cap may be terminated only with the approval of the Board of Trustees. Without this cap, the Fund’s returns would have been lower. The expense ratio paid by an investor is the net expense ratio (the total annual fund operating expenses after fee waivers) as stated in the prospectuses. |
| 3 | Historical performance shown for the Class R6 shares prior to their inception reflects the performance of the Institutional Class shares, and includes the higher expenses applicable to Institutional Class shares. If these expenses had not been included, returns for the Class R6 shares would be higher. |
| 4 | The Russell Midcap® Growth Index measures the performance of those Russell Midcap companies with higher price/book ratios and higher forecasted growth values. The stocks are also members of the Russell 1000® Growth index. You cannot invest directly in an index. |
| 5 | The ten largest holdings, excluding cash, cash equivalents and any money market funds, are calculated based on the value of the investments divided by total net assets of the Fund. Holdings are subject to change and may have changed since the date specified. |
| 6 | Amounts are calculated based on the total long-term investments of the Fund. These amounts are subject to change and may have changed since the date specified. |
Wells Fargo Enterprise Fund | 5
Fund expenses (unaudited)
As a shareholder of the Fund, you incur two types of costs: (1) transaction costs, including sales charges (loads) on purchase payments and contingent deferred sales charges (if any) on redemptions and (2) ongoing costs, including management fees, distribution (12b-1) and/or shareholder servicing fees, and other Fund expenses. This example is intended to help you understand your ongoing costs (in dollars) of investing in the Fund and to compare these costs with the ongoing costs of investing in other mutual funds.
The example is based on an investment of $1,000 invested at the beginning of the six-month period and held for the entire period from October 1, 2019 to March 31, 2020.
Actual expenses
The “Actual” line of the table below provides information about actual account values and actual expenses. You may use the information in this line, together with the amount you invested, to estimate the expenses that you paid over the period. Simply divide your account value by $1,000 (for example, an $8,600 account value divided by $1,000 = 8.6), then multiply the result by the number in the “Actual” line under the heading entitled “Expenses paid during period” for your applicable class of shares to estimate the expenses you paid on your account during this period.
Hypothetical example for comparison purposes
The “Hypothetical” line of the table below provides information about hypothetical account values and hypothetical expenses based on the Fund’s actual expense ratio and an assumed rate of return of 5% per year before expenses, which is not the Fund’s actual return. The hypothetical account values and expenses may not be used to estimate the actual ending account balance or expenses you paid for the period. You may use this information to compare the ongoing costs of investing in the Fund and other funds. To do so, compare this 5% hypothetical example with the 5% hypothetical examples that appear in the shareholder reports of the other funds.
Please note that the expenses shown in the table are meant to highlight your ongoing costs only and do not reflect any transactional costs, such as sales charges (loads) and contingent deferred sales charges. Therefore, the “Hypothetical” line of the table is useful in comparing ongoing costs only and will not help you determine the relative total costs of owning different funds. In addition, if these transactional costs were included, your costs would have been higher.
| | | | | | | | | | | | | | | | |
| | | Beginning account value 10-1-2019 | | | Ending account value 3-31-2020 | | | Expenses paid during the period¹ | | | Annualized net expense ratio | |
| | | | | |
Class A | | | | | | | | | | | | | | | | |
| | | | |
Actual | | $ | 1,000.00 | | | $ | 881.77 | | | $ | 5.41 | | | | 1.15 | % |
| | | | |
Hypothetical (5% return before expenses) | | $ | 1,000.00 | | | $ | 1,019.25 | | | $ | 5.81 | | | | 1.15 | % |
| | | | | |
Class C | | | | | | | | | | | | | | | | |
| | | | |
Actual | | $ | 1,000.00 | | | $ | 878.26 | | | $ | 9.06 | | | | 1.93 | % |
| | | | |
Hypothetical (5% return before expenses) | | $ | 1,000.00 | | | $ | 1,015.35 | | | $ | 9.72 | | | | 1.93 | % |
| | | | | |
Class R6 | | | | | | | | | | | | | | | | |
| | | | |
Actual | | $ | 1,000.00 | | | $ | 883.23 | | | $ | 3.77 | | | | 0.80 | % |
| | | | |
Hypothetical (5% return before expenses) | | $ | 1,000.00 | | | $ | 1,021.00 | | | $ | 4.04 | | | | 0.80 | % |
| | | | | |
Administrator Class | | | | | | | | | | | | | | | | |
| | | | |
Actual | | $ | 1,000.00 | | | $ | 882.13 | | | $ | 5.18 | | | | 1.10 | % |
| | | | |
Hypothetical (5% return before expenses) | | $ | 1,000.00 | | | $ | 1,019.50 | | | $ | 5.55 | | | | 1.10 | % |
| | | | | |
Institutional Class | | | | | | | | | | | | | | | | |
| | | | |
Actual | | $ | 1,000.00 | | | $ | 883.03 | | | $ | 4.00 | | | | 0.85 | % |
| | | | |
Hypothetical (5% return before expenses) | | $ | 1,000.00 | | | $ | 1,020.75 | | | $ | 4.29 | | | | 0.85 | % |
| 1 | Expenses paid is equal to the annualized net expense ratio of each class multiplied by the average account value over the period, multiplied by the number of days in the most recent fiscal half-year divided by the number of days in the fiscal year (to reflect the one-half-year period). |
6 | Wells Fargo Enterprise Fund
Portfolio of investments—March 31, 2020 (unaudited)
| | | | | | | | | | | | | | | | |
| | | | | | | | | Shares | | | Value | |
| Common Stocks: 99.19% | | | | | | | | | | | | | | | | |
| | | | |
Communication Services: 4.29% | | | | | | | | | | | | | | | | |
| | | | |
| Entertainment: 2.83% | | | | | | | | | | | | |
Nintendo Company Limited ADR | | | | | | | | | | | 210,500 | | | $ | 10,162,940 | |
Take-Two Interactive Software Incorporated † | | | | | | | | | | | 66,700 | | | | 7,911,287 | |
| | | | |
| | | | | | | | | | | | | | | 18,074,227 | |
| | | | | | | | | | | | | | | | |
| | | | |
| Interactive Media & Services: 1.46% | | | | | | | | | | | | |
Match Group Incorporated †« | | | | | | | | | | | 141,600 | | | | 9,351,264 | |
| | | | | | | | | | | | | | | | |
| | | | |
Consumer Discretionary: 14.80% | | | | | | | | | | | | | | | | |
| | | | |
| Auto Components: 0.78% | | | | | | | | | | | | |
Aptiv plc | | | | | | | | | | | 100,785 | | | | 4,962,653 | |
| | | | | | | | | | | | | | | | |
| | | | |
| Automobiles: 1.22% | | | | | | | | | | | | |
Ferrari NV | | | | | | | | | | | 51,100 | | | | 7,796,327 | |
| | | | | | | | | | | | | | | | |
| | | | |
| Diversified Consumer Services: 1.11% | | | | | | | | | | | | |
Bright Horizons Family Solutions Incorporated † | | | | | | | | | | | 69,800 | | | | 7,119,600 | |
| | | | | | | | | | | | | | | | |
| | | | |
| Hotels, Restaurants & Leisure: 4.40% | | | | | | | | | | | | |
Chipotle Mexican Grill Incorporated † | | | | | | | | | | | 23,200 | | | | 15,182,080 | |
Domino’s Pizza Incorporated | | | | | | | | | | | 27,100 | | | | 8,782,297 | |
Vail Resorts Incorporated | | | | | | | | | | | 28,155 | | | | 4,158,775 | |
| | | | |
| | | | | | | | | | | | | | | 28,123,152 | |
| | | | | | | | | | | | | | | | |
| | | | |
| Internet & Direct Marketing Retail: 3.01% | | | | | | | | | | | | |
Chewy Incorporated Class A † | | | | | | | | | | | 204,300 | | | | 7,659,207 | |
MercadoLibre Incorporated † | | | | | | | | | | | 23,784 | | | | 11,620,387 | |
| | | | |
| | | | | | | | | | | | | | | 19,279,594 | |
| | | | | | | | | | | | | | | | |
| | | | |
| Specialty Retail: 2.39% | | | | | | | | | | | | |
Burlington Stores Incorporated † | | | | | | | | | | | 68,900 | | | | 10,917,894 | |
Carvana Company †« | | | | | | | | | | | 79,500 | | | | 4,379,655 | |
| | | | |
| | | | | | | | | | | | | | | 15,297,549 | |
| | | | | | | | | | | | | | | | |
| | | | |
| Textiles, Apparel & Luxury Goods: 1.89% | | | | | | | | | | | | |
lululemon athletica Incorporated † | | | | | | | | | | | 63,800 | | | | 12,093,290 | |
| | | | | | | | | | | | | | | | |
| | | | |
Consumer Staples: 1.36% | | | | | | | | | | | | | | | | |
| | | | |
| Food Products: 1.36% | | | | | | | | | | | | |
Lamb Weston Holdings Incorporated | | | | | | | | | | | 152,000 | | | | 8,679,200 | |
| | | | | | | | | | | | | | | | |
| | | | |
Financials: 1.54% | | | | | | | | | | | | | | | | |
| | | | |
| Capital Markets: 1.54% | | | | | | | | | | | | |
Intercontinental Exchange Incorporated | | | | | | | | | | | 122,325 | | | | 9,877,744 | |
| | | | | | | | | | | | | | | | |
| | | | |
Health Care: 18.29% | | | | | | | | | | | | | | | | |
| | | | |
| Biotechnology: 2.33% | | | | | | | | | | | | |
Exact Sciences Corporation † | | | | | | | | | | | 174,000 | | | | 10,092,000 | |
Sarepta Therapeutics Incorporated † | | | | | | | | | | | 49,500 | | | | 4,842,090 | |
| | | | |
| | | | | | | | | | | | | | | 14,934,090 | |
| | | | | | | | | | | | | | | | |
The accompanying notes are an integral part of these financial statements.
Wells Fargo Enterprise Fund | 7
Portfolio of investments—March 31, 2020 (unaudited)
| | | | | | | | | | | | | | | | |
| | | | | | | | | Shares | | | Value | |
| Health Care Equipment & Supplies: 7.15% | | | | | | | | | | | | |
Alcon Incorporated † | | | | | | | | | | | 158,500 | | | $ | 8,054,970 | |
Align Technology Incorporated † | | | | | | | | | | | 58,300 | | | | 10,141,285 | |
DexCom Incorporated † | | | | | | | | | | | 65,400 | | | | 17,610,258 | |
Insulet Corporation † | | | | | | | | | | | 59,800 | | | | 9,907,664 | |
| | | | |
| | | | | | | | | | | | | | | 45,714,177 | |
| | | | | | | | | | | | | | | | |
| | | | |
| Health Care Providers & Services: 3.54% | | | | | | | | | | | | |
Centene Corporation † | | | | | | | | | | | 252,500 | | | | 15,001,025 | |
HealthEquity Incorporated † | | | | | | | | | | | 150,600 | | | | 7,618,854 | |
| | | | |
| | | | | | | | | | | | | | | 22,619,879 | |
| | | | | | | | | | | | | | | | |
| | | | |
| Health Care Technology: 2.65% | | | | | | | | | | | | |
Veeva Systems Incorporated Class A † | | | | | | | | | | | 108,600 | | | | 16,981,782 | |
| | | | | | | | | | | | | | | | |
| | | | |
| Life Sciences Tools & Services: 1.52% | | | | | | | | | | | | |
Bio-Rad Laboratories Incorporated Class A † | | | | | | | | | | | 27,800 | | | | 9,745,568 | |
| | | | | | | | | | | | | | | | |
| | | | |
| Pharmaceuticals: 1.10% | | | | | | | | | | | | |
Elanco Animal Health Incorporated † | | | | | | | | | | | 312,818 | | | | 7,003,995 | |
| | | | | | | | | | | | | | | | |
| | | | |
Industrials: 15.19% | | | | | | | | | | | | | | | | |
| | | | |
| Aerospace & Defense: 4.06% | | | | | | | | | | | | |
HEICO Corporation | | | | | | | | | | | 94,600 | | | | 7,058,106 | |
L3Harris Technologies | | | | | | | | | | | 64,200 | | | | 11,563,704 | |
Teledyne Technologies Incorporated † | | | | | | | | | | | 24,700 | | | | 7,342,569 | |
| | | | |
| | | | | | | | | | | | | | | 25,964,379 | |
| | | | | | | | | | | | | | | | |
| | | | |
| Commercial Services & Supplies: 5.26% | | | | | | | | | | | | |
Cintas Corporation | | | | | | | | | | | 61,800 | | | | 10,704,996 | |
IAA Incorporated † | | | | | | | | | | | 212,000 | | | | 6,351,520 | |
Waste Connections Incorporated | | | | | | | | | | | 213,739 | | | | 16,564,773 | |
| | | | |
| | | | | | | | | | | | | | | 33,621,289 | |
| | | | | | | | | | | | | | | | |
| | | | |
| Construction & Engineering: 1.06% | | | | | | | | | | | | |
Jacobs Engineering Group Incorporated | | | | | | | | | | | 85,500 | | | | 6,777,585 | |
| | | | | | | | | | | | | | | | |
| | | | |
| Machinery: 0.37% | | | | | | | | | | | | |
Woodward Governor Company | | | | | | | | | | | 39,800 | | | | 2,365,712 | |
| | | | | | | | | | | | | | | | |
| | | | |
| Professional Services: 3.38% | | | | | | | | | | | | |
Clarivate Analytics plc † | | | | | | | | | | | 500,370 | | | | 10,382,678 | |
IHS Markit Limited | | | | | | | | | | | 187,500 | | | | 11,250,000 | |
| | | | |
| | | | | | | | | | | | | | | 21,632,678 | |
| | | | | | | | | | | | | | | | |
| | | | |
| Road & Rail: 1.06% | | | | | | | | | | | | |
Saia Incorporated † | | | | | | | | | | | 91,900 | | | | 6,758,326 | |
| | | | | | | | | | | | | | | | |
| | | | |
Information Technology: 39.50% | | | | | | | | | | | | | | | | |
| | | | |
| Communications Equipment: 1.98% | | | | | | | | | | | | |
Motorola Solutions Incorporated | | | | | | | | | | | 95,100 | | | | 12,640,692 | |
| | | | | | | | | | | | | | | | |
| | | | |
| Electronic Equipment, Instruments & Components: 1.25% | | | | | | | | | | | | |
Zebra Technologies Corporation Class A † | | | | | | | | | | | 43,500 | | | | 7,986,600 | |
| | | | | | | | | | | | | | | | |
The accompanying notes are an integral part of these financial statements.
8 | Wells Fargo Enterprise Fund
Portfolio of investments—March 31, 2020 (unaudited)
| | | | | | | | | | | | | | | | |
| | | | | | | | | Shares | | | Value | |
| IT Services: 21.45% | | | | | | | | | | | | |
Black Knight Incorporated † | | | | | | | | | | | 210,500 | | | $ | 12,221,630 | |
Booz Allen Hamilton Holding Corporation | | | | | | | | | | | 202,300 | | | | 13,885,872 | |
Broadridge Financial Solutions Incorporated | | | | | | | | | | | 93,000 | | | | 8,819,190 | |
EPAM Systems Incorporated † | | | | | | | | | | | 67,254 | | | | 12,486,378 | |
Fiserv Incorporated † | | | | | | | | | | | 241,813 | | | | 22,969,817 | |
FleetCor Technologies Incorporated † | | | | | | | | | | | 42,200 | | | | 7,871,988 | |
Global Payments Incorporated | | | | | | | | | | | 122,181 | | | | 17,622,166 | |
MongoDB Incorporated † | | | | | | | | | | | 59,000 | | | | 8,055,860 | |
Shopify Incorporated Class A † | | | | | | | | | | | 14,200 | | | | 5,920,406 | |
Square Incorporated Class A † | | | | | | | | | | | 205,200 | | | | 10,748,376 | |
Twilio Incorporated Class A † | | | | | | | | | | | 119,700 | | | | 10,711,953 | |
WEX Incorporated † | | | | | | | | | | | 56,500 | | | | 5,907,075 | |
| | | | |
| | | | | | | | | | | | | | | 137,220,711 | |
| | | | | | | | | | | | | | | | |
| | | | |
| Semiconductors & Semiconductor Equipment: 5.47% | | | | | | | | | | | | |
Advanced Micro Devices Incorporated † | | | | | | | | | | | 423,100 | | | | 19,242,587 | |
Micron Technology Incorporated † | | | | | | | | | | | 237,600 | | | | 9,993,456 | |
Universal Display Corporation | | | | | | | | | | | 43,900 | | | | 5,785,142 | |
| | | | |
| | | | | | | | | | | | | | | 35,021,185 | |
| | | | | | | | | | | | | | | | |
| | | | |
Software: 9.35% | | | | | | | | | | | | | | | | |
Atlassian Corporation plc Class A † | | | | | | | | | | | 81,100 | | | | 11,131,786 | |
Autodesk Incorporated † | | | | | | | | | | | 57,600 | | | | 8,991,360 | |
Cadence Design Systems Incorporated † | | | | | | | | | | | 217,400 | | | | 14,357,096 | |
ServiceNow Incorporated † | | | | | | | | | | | 46,250 | | | | 13,254,325 | |
Zoom Video Communications Incorporated †« | | | | | | | | | | | 82,400 | | | | 12,040,288 | |
| | | | |
| | | | | | | | | | | | | | | 59,774,855 | |
| | | | | | | | | | | | | | | | |
| | | | |
Materials: 4.22% | | | | | | | | | | | | | | | | |
| | | | |
| Chemicals: 2.57% | | | | | | | | | | | | |
Air Products & Chemicals Incorporated | | | | | | | | | | | 40,800 | | | | 8,144,087 | |
The Sherwin-Williams Company | | | | | | | | | | | 18,100 | | | | 8,317,312 | |
| | | | |
| | | | | | | | | | | | | | | 16,461,399 | |
| | | | | | | | | | | | | | | | |
| | | | |
| Construction Materials: 1.65% | | | | | | | | | | | | |
Vulcan Materials Company | | | | | | | | | | | 97,700 | | | | 10,558,439 | |
| | | | | | | | | | | | | | | | |
| | | | |
Total Common Stocks (Cost $512,249,358) | | | | | | | | | | | | | | | 634,437,941 | |
| | | | | | | | | | | | | | | | |
| | | | |
| | | | | | | | | | | | | | | | |
| | | Yield | | | | | | | | | | |
| Short-Term Investments: 2.86% | | | | | | | | | | | | |
| | | | |
| Investment Companies: 2.86% | | | | | | | | | | | | |
Securities Lending Cash Investments LLC (l)(r)(u) | | | 2.11 | % | | | | | | | 13,523,616 | | | | 13,524,969 | |
Wells Fargo Government Money Market Fund Select Class (I)(u) | | | 0.35 | | | | | | | | 4,741,106 | | | | 4,741,106 | |
| |
Total Short-Term Investments (Cost $18,266,122) | | | | 18,266,075 | |
| | | | | | | | | | | | | | | | |
| | | | | | | | |
| Total investments in securities (Cost $530,515,480) | | | 102.05 | % | | | 652,704,016 | |
| | |
Other assets and liabilities, net | | | (2.05 | ) | | | (13,118,921 | ) |
| | | | | | | | |
| Total net assets | | | 100.00 | % | | $ | 639,585,095 | |
| | | | | | | | |
The accompanying notes are an integral part of these financial statements.
Wells Fargo Enterprise Fund | 9
Portfolio of investments—March 31, 2020 (unaudited)
| † | Non-income-earning security |
| « | All or a portion of this security is on loan. |
| (l) | The issuer of the security is an affiliated person of the Fund as defined in the Investment Company Act of 1940. |
| (r) | The investment is a non-registered investment company purchased with cash collateral received from securities on loan. |
| (u) | The rate represents the 7-day annualized yield at period end. |
Abbreviations:
| ADR | American depositary receipt |
Investments in Affiliates
An affiliated investment is an investment in which the Fund owns at least 5% of the outstanding voting shares of the issuer or as a result of other relationships, such as the Fund and the issuer having the same investment manager. Transactions with issuers that were either affiliated persons of the Fund at the beginning of the period or the end of the period were as follows:
| | | | | | | | | | | | | | | | | | | | | | | | | | | | | | | | | | | | |
| | | Shares, beginning of period | | | Shares purchased | | | Shares sold | | | Shares, end of period | | | Net realized gains (losses) | | | Net change in unrealized gains (losses) | | | Income from affiliated securities | | | Value, end of period | | | % of
net
assets | |
| | | | | | | | | |
| Short-Term Investments | | | | | | | | | | | | | | | | | | | | | | | | | | | |
Investment Companies | | | | | | | | | | | | | | | | | | | | | | | | | | | | | | | | | | | | |
Securities Lending Cash Investments LLC | | | 25,578,810 | | | | 191,871,372 | | | | (203,926,566 | ) | | | 13,523,616 | | | $ | (3,857 | ) | | $ | (47 | ) | | $ | 220,458 | # | | $ | 13,524,969 | | | | | |
Wells Fargo Government Money Market Fund Select Class | | | 2,635,132 | | | | 81,562,137 | | | | (79,456,163 | ) | | | 4,741,106 | | | | 0 | | | | 0 | | | | 40,094 | | | | 4,741,106 | | | | | |
| | | | | | | | | | | | | | | | | | | | | | | | | | | | | | | | | | | | |
| | | | | | | | | | | | | | | | | | $ | (3,857 | ) | | $ | (47 | ) | | $ | 260,552 | | | $ | 18,266,075 | | | | 2.86 | % |
| | | | | | | | | | | | | | | | | | | | | | | | | | | | | | | | | | | | |
| # | Amount shown represents income before fees and rebates. |
The accompanying notes are an integral part of these financial statements.
10 | Wells Fargo Enterprise Fund
Statement of assets and liabilities—March 31, 2020 (unaudited)
| | | | |
| | | | |
| |
Assets | | | | |
Investments in unaffiliated securities (including $13,247,564 of securities loaned), at value (cost $512,249,358) | | $ | 634,437,941 | |
Investments in affiliated securities, at value (cost $18,266,122) | | | 18,266,075 | |
Receivable for investments sold | | | 3,445,498 | |
Receivable for Fund shares sold | | | 1,333,208 | |
Receivable for dividends | | | 282,887 | |
Receivable for securities lending income, net | | | 45,998 | |
| | | | |
Total assets | | | 657,811,607 | |
| | | | |
| |
Liabilities | | | | |
Payable upon receipt of securities loaned | | | 13,528,070 | |
Payable for investments purchased | | | 3,594,770 | |
Management fee payable | | | 378,972 | |
Payable for Fund shares redeemed | | | 276,729 | |
Administration fees payable | | | 107,259 | |
Distribution fee payable | | | 1,172 | |
Trustees’ fees and expenses payable | | | 3,847 | |
Accrued expenses and other liabilities | | | 335,693 | |
| | | | |
Total liabilities | | | 18,226,512 | |
| | | | |
Total net assets | | $ | 639,585,095 | |
| | | | |
| |
Net assets consist of | | | | |
Paid-in capital | | $ | 523,543,317 | |
Total distributable earnings | | | 116,041,778 | |
| | | | |
Total net assets | | $ | 639,585,095 | |
| | | | |
| |
Computation of net asset value and offering price per share | | | | |
Net assets – Class A | | $ | 540,043,951 | |
Shares outstanding – Class A1 | | | 13,086,329 | |
Net asset value per share – Class A | | | $41.27 | |
Maximum offering price per share – Class A2 | | | $43.79 | |
Net assets – Class C | | $ | 1,782,452 | |
Shares outstanding – Class C1 | | | 51,060 | |
Net asset value per share – Class C | | | $34.91 | |
Net assets – Class R6 | | $ | 45,309,007 | |
Shares outstanding – Class R61 | | | 968,323 | |
Net asset value per share – Class R6 | | | $46.79 | |
Net assets – Administrator Class | | $ | 2,816,063 | |
Shares outstanding – Administrator Class1 | | | 63,948 | |
Net asset value per share – Administrator Class | | | $44.04 | |
Net assets – Institutional Class | | $ | 49,633,622 | |
Shares outstanding – Institutional Class1 | | | 1,064,637 | |
Net asset value per share – Institutional Class | | | $46.62 | |
| 1 | The Fund has an unlimited number of authorized shares. |
| 2 | Maximum offering price is computed as 100/94.25 of net asset value. On investments of $50,000 or more, the offering price is reduced. |
The accompanying notes are an integral part of these financial statements.
Wells Fargo Enterprise Fund | 11
Statement of operations—six months ended March 31, 2020 (unaudited)
| | | | |
| | | | |
| |
Investment income | | | | |
Dividends (net of foreign withholding taxes of $28,267) | | $ | 1,603,042 | |
Securities lending income from affiliates, net | | | 194,758 | |
Income from affiliated securities | | | 40,094 | |
| | | | |
Total investment income | | | 1,837,894 | |
| | | | |
| |
Expenses | | | | |
Management fee | | | 2,853,795 | |
Administration fees | | | | |
Class A | | | 686,151 | |
Class C | | | 2,337 | |
Class R6 | | | 8,117 | |
Administrator Class | | | 2,508 | |
Institutional Class | | | 36,617 | |
Shareholder servicing fees | | | | |
Class A | | | 816,844 | |
Class C | | | 2,782 | |
Administrator Class | | | 4,818 | |
Distribution fee | | | | |
Class C | | | 8,329 | |
Custody and accounting fees | | | 31,427 | |
Professional fees | | | 21,193 | |
Registration fees | | | 53,786 | |
Shareholder report expenses | | | 40,110 | |
Trustees’ fees and expenses | | | 11,029 | |
Other fees and expenses | | | 7,174 | |
| | | | |
Total expenses | | | 4,587,017 | |
Less: Fee waivers and/or expense reimbursements | | | | |
Fund-level | | | (160,689 | ) |
Class A | | | (146,710 | ) |
Class C | | | (351 | ) |
Administrator Class | | | (608 | ) |
Institutional Class | | | (9,185 | ) |
| | | | |
Net expenses | | | 4,269,474 | |
| | | | |
Net investment loss | | | (2,431,580 | ) |
| | | | |
| |
Realized and unrealized gains (losses) on investments | | | | |
Net realized gains (losses) on | | | | |
Unaffiliated securities | | | 8,408,297 | |
Affiliated securities | | | (3,857 | ) |
| | | | |
Net realized gains on investments | | | 8,404,440 | |
| | | | |
| |
Net change in unrealized gains (losses) on | | | | |
Unaffiliated securities | | | (91,194,766 | ) |
Affiliated securities | | | (47 | ) |
| | | | |
Net change in unrealized gains (losses) on investments | | | (91,194,813 | ) |
| | | | |
Net realized and unrealized gains (losses) on investments | | | (82,790,373 | ) |
| | | | |
Net decrease in net assets resulting from operations | | $ | (85,221,953 | ) |
| | | | |
The accompanying notes are an integral part of these financial statements.
12 | Wells Fargo Enterprise Fund
Statement of changes in net assets
| | | | | | | | | | | | | | | | |
| | | Six months ended
March 31, 2020
(unaudited) | | | Year ended
September 30, 2019 | |
| | | |
Operations | | | | | | | | | | | | |
Net investment loss | | | | | | $ | (2,431,580 | ) | | | | | | $ | (3,924,916 | ) |
Net realized gains on investments | | | | | | | 8,404,440 | | | | | | | | 40,830,879 | |
Net change in unrealized gains (losses) on investments | | | | | | | (91,194,813 | ) | | | | | | | 16,452,262 | |
| | | | |
Net increase (decrease) in net assets resulting from operations | | | | | | | (85,221,953 | ) | | | | | | | 53,358,224 | |
| | | | |
| | | | |
Distributions to shareholders from net investment income and net realized gains | | | | | | | | | | | | | | | | |
Class A | | | | | | | (41,991,432 | ) | | | | | | | (70,134,961 | ) |
Class C | | | | | | | (169,192 | ) | | | | | | | (816,461 | ) |
Class R6 | | | | | | | (3,065,210 | ) | | | | | | | (4,758,790 | ) |
Administrator Class | | | | | | | (233,637 | ) | | | | | | | (354,535 | ) |
Institutional Class | | | | | | | (3,042,253 | ) | | | | | | | (4,789,875 | ) |
| | | | |
Total distributions to shareholders | | | | | | | (48,501,724 | ) | | | | | | | (80,854,622 | ) |
| | | | |
| | | | |
Capital share transactions | | | Shares | | | | | | | | Shares | | | | | |
Proceeds from shares sold | | | | | | | | | | | | | | | | |
Class A | | | 128,978 | | | | 6,425,905 | | | | 314,721 | | | | 14,539,690 | |
Class C | | | 7,424 | | | | 321,041 | | | | 6,455 | | | | 248,651 | |
Class R6 | | | 53,245 | | | | 3,015,964 | | | | 95,098 | | | | 5,042,506 | |
Administrator Class | | | 12,105 | | | | 646,768 | | | | 7,854 | | | | 408,606 | |
Institutional Class | | | 328,698 | | | | 17,849,044 | | | | 329,158 | | | | 17,257,242 | |
| | | | |
| | | | | | | 28,258,722 | | | | | | | | 37,496,695 | |
| | | | |
Reinvestment of distributions | | | | | | | | | | | | | | | | |
Class A | | | 824,198 | | | | 40,006,548 | | | | 1,674,293 | | | | 66,553,135 | |
Class C | | | 4,042 | | | | 166,374 | | | | 23,541 | | | | 808,616 | |
Class R6 | | | 54,701 | | | | 3,007,434 | | | | 106,814 | | | | 4,755,337 | |
Administrator Class | | | 4,402 | | | | 228,012 | | | | 8,166 | | | | 344,706 | |
Institutional Class | | | 52,410 | | | | 2,871,023 | | | | 102,726 | | | | 4,559,989 | |
| | | | |
| | | | | | | 46,279,391 | | | | | | | | 77,021,783 | |
| | | | |
Payment for shares redeemed | | | | | | | | | | | | | | | | |
Class A | | | (854,855 | ) | | | (41,810,450 | ) | | | (1,374,541 | ) | | | (63,202,802 | ) |
Class C | | | (18,949 | ) | | | (817,993 | ) | | | (134,665 | ) | | | (5,157,166 | ) |
Class R6 | | | (79,733 | ) | | | (4,233,299 | ) | | | (88,918 | ) | | | (4,650,355 | ) |
Administrator Class | | | (21,996 | ) | | | (1,116,448 | ) | | | (12,643 | ) | | | (610,976 | ) |
Institutional Class | | | (250,906 | ) | | | (13,635,999 | ) | | | (327,960 | ) | | | (16,479,135 | ) |
| | | | |
| | | | | | | (61,614,189 | ) | | | | | | | (90,100,434 | ) |
| | | | |
Net increase in net assets resulting from capital share transactions | | | | | | | 12,923,924 | | | | | | | | 24,418,044 | |
| | | | |
Total decrease in net assets | | | | | | | (120,799,753 | ) | | | | | | | (3,078,354 | ) |
| | | | |
| | |
Net assets | | | | | | | | |
Beginning of period | | | | | | | 760,384,848 | | | | | | | | 763,463,202 | |
| | | | |
End of period | | | | | | $ | 639,585,095 | | | | | | | $ | 760,384,848 | |
| | | | |
The accompanying notes are an integral part of these financial statements.
Wells Fargo Enterprise Fund | 13
Financial highlights
(For a share outstanding throughout each period)
| | | | | | | | | | | | | | | | | | | | | | | | |
| | | Six months ended
March 31, 2020
(unaudited) | | | Year ended September 30 | |
| CLASS A | | 2019 | | | 2018 | | | 2017 | | | 2016 | | | 2015 | |
Net asset value, beginning of period | | | $49.98 | | | | $52.96 | | | | $48.80 | | | | $41.94 | | | | $41.90 | | | | $47.93 | |
Net investment loss | | | (0.17 | ) | | | (0.29 | ) | | | (0.31 | ) | | | (0.25 | ) | | | (0.21 | )1 | | | (0.29 | ) |
Net realized and unrealized gains (losses) on investments | | | (5.25 | ) | | | 3.05 | | | | 9.66 | | | | 8.94 | | | | 3.61 | | | | 0.18 | |
| | | | | | | | | | | | | | | | | | | | | | | | |
Total from investment operations | | | (5.42 | ) | | | 2.76 | | | | 9.35 | | | | 8.69 | | | | 3.40 | | | | (0.11 | ) |
Distributions to shareholders from | | | | | | | | | | | | | | | | | | | | | | | | |
Net realized gains | | | (3.29 | ) | | | (5.74 | ) | | | (5.19 | ) | | | (1.83 | ) | | | (3.36 | ) | | | (5.92 | ) |
Net asset value, end of period | | | $41.27 | | | | $49.98 | | | | $52.96 | | | | $48.80 | | | | $41.94 | | | | $41.90 | |
Total return2 | | | (11.82 | )% | | | 8.00 | % | | | 20.83 | % | | | 21.55 | % | | | 8.63 | % | | | (0.67 | )% |
Ratios to average net assets (annualized) | | | | | | | | | | | | | | | | | | | | | | | | |
Gross expenses | | | 1.24 | % | | | 1.25 | % | | | 1.25 | % | | | 1.26 | % | | | 1.26 | % | | | 1.29 | % |
Net expenses | | | 1.15 | % | | | 1.18 | % | | | 1.18 | % | | | 1.18 | % | | | 1.18 | % | | | 1.18 | % |
Net investment loss | | | (0.68 | )% | | | (0.59 | )% | | | (0.61 | )% | | | (0.55 | )% | | | (0.52 | )% | | | (0.60 | )% |
Supplemental data | | | | | | | | | | | | | | | | | | | | | | | | |
Portfolio turnover rate | | | 29 | % | | | 50 | % | | | 62 | % | | | 75 | % | | | 99 | % | | | 101 | % |
Net assets, end of period (000s omitted) | | | $540,044 | | | | $649,106 | | | | $655,338 | | | | $591,002 | | | | $542,077 | | | | $370,743 | |
| 1 | Calculated based upon average shares outstanding |
| 2 | Total return calculations do not include any sales charges. Returns for periods of less than one year are not annualized. |
The accompanying notes are an integral part of these financial statements.
14 | Wells Fargo Enterprise Fund
Financial highlights
(For a share outstanding throughout each period)
| | | | | | | | | | | | | | | | | | | | | | | | |
| | | Six months ended
March 31, 2020
(unaudited) | | | Year ended September 30 | |
| CLASS C | | 2019 | | | 2018 | | | 2017 | | | 2016 | | | 2015 | |
Net asset value, beginning of period | | | $42.93 | | | | $46.74 | | | | $43.95 | | | | $38.23 | | | | $38.75 | | | | $45.07 | |
Net investment loss | | | (0.31 | )1 | | | (0.52 | )1 | | | (0.60 | )1 | | | (0.85 | ) | | | (0.47 | )1 | | | (0.59 | )1 |
Net realized and unrealized gains (losses) on investments | | | (4.42 | ) | | | 2.45 | | | | 8.58 | | | | 8.40 | | | | 3.31 | | | | 0.19 | |
| | | | | | | | | | | | | | | | | | | | | | | | |
Total from investment operations | | | (4.73 | ) | | | 1.93 | | | | 7.98 | | | | 7.55 | | | | 2.84 | | | | (0.40 | ) |
Distributions to shareholders from | | | | | | | | | | | | | | | | | | | | | | | | |
Net realized gains | | | (3.29 | ) | | | (5.74 | ) | | | (5.19 | ) | | | (1.83 | ) | | | (3.36 | ) | | | (5.92 | ) |
Net asset value, end of period | | | $34.91 | | | | $42.93 | | | | $46.74 | | | | $43.95 | | | | $38.23 | | | | $38.75 | |
Total return2 | | | (12.17 | )% | | | 7.20 | % | | | 19.93 | % | | | 20.66 | % | | | 7.80 | % | | | (1.41 | )% |
Ratios to average net assets (annualized) | | | | | | | | | | | | | | | | | | | | | | | | |
Gross expenses | | | 1.99 | % | | | 2.00 | % | | | 2.00 | % | | | 2.01 | % | | | 2.01 | % | | | 2.04 | % |
Net expenses | | | 1.93 | % | | | 1.93 | % | | | 1.93 | % | | | 1.93 | % | | | 1.93 | % | | | 1.93 | % |
Net investment loss | | | (1.45 | )% | | | (1.29 | )% | | | (1.37 | )% | | | (1.13 | )% | | | (1.28 | )% | | | (1.36 | )% |
Supplemental data | | | | | | | | | | | | | | | | | | | | | | | | |
Portfolio turnover rate | | | 29 | % | | | 50 | % | | | 62 | % | | | 75 | % | | | 99 | % | | | 101 | % |
Net assets, end of period (000s omitted) | | | $1,782 | | | | $2,513 | | | | $7,629 | | | | $8,898 | | | | $9,181 | | | | $9,399 | |
| 1 | Calculated based upon average shares outstanding |
| 2 | Total return calculations do not include any sales charges. Returns for periods of less than one year are not annualized. |
The accompanying notes are an integral part of these financial statements.
Wells Fargo Enterprise Fund | 15
Financial highlights
(For a share outstanding throughout each period)
| | | | | | | | | | | | | | | | | | | | | | | | |
| | | Six months ended
March 31, 2020
(unaudited) | | | Year ended September 30 | |
| CLASS R6 | | 2019 | | | 2018 | | | 2017 | | | 2016 | | | 20151 | |
Net asset value, beginning of period | | | $56.15 | | | | $58.47 | | | | $53.17 | | | | $45.37 | | | | $44.89 | | | | $52.65 | |
Net investment loss | | | (0.09 | )2 | | | (0.11 | )2 | | | (0.13 | )2 | | | (0.08 | ) | | | (0.06 | )2 | | | (0.08 | ) |
Net realized and unrealized gains (losses) on investments | | | (5.98 | ) | | | 3.53 | | | | 10.62 | | | | 9.71 | | | | 3.90 | | | | (1.76 | ) |
| | | | | | | | | | | | | | | | | | | | | | | | |
Total from investment operations | | | (6.07 | ) | | | 3.42 | | | | 10.49 | | | | 9.63 | | | | 3.84 | | | | (1.84 | ) |
Distributions to shareholders from | | | | | | | | | | | | | | | | | | | | | | | | |
Net realized gains | | | (3.29 | ) | | | (5.74 | ) | | | (5.19 | ) | | | (1.83 | ) | | | (3.36 | ) | | | (5.92 | ) |
Net asset value, end of period | | | $46.79 | | | | $56.15 | | | | $58.47 | | | | $53.17 | | | | $45.37 | | | | $44.89 | |
Total return3 | | | (11.68 | )% | | | 8.41 | % | | | 21.30 | % | | | 22.01 | % | | | 9.06 | % | | | (3.84 | )% |
Ratios to average net assets (annualized) | | | | | | | | | | | | | | | | | | | | | | | | |
Gross expenses | | | 0.81 | % | | | 0.82 | % | | | 0.82 | % | | | 0.82 | % | | | 0.83 | % | | | 0.81 | % |
Net expenses | | | 0.80 | % | | | 0.80 | % | | | 0.80 | % | | | 0.80 | % | | | 0.80 | % | | | 0.80 | % |
Net investment loss | | | (0.32 | )% | | | (0.21 | )% | | | (0.23 | )% | | | (0.17 | )% | | | (0.14 | )% | | | (0.19 | )% |
Supplemental data | | | | | | | | | | | | | | | | | | | | | | | | |
Portfolio turnover rate | | | 29 | % | | | 50 | % | | | 62 | % | | | 75 | % | | | 99 | % | | | 101 | % |
Net assets, end of period (000s omitted) | | | $45,309 | | | | $52,783 | | | | $48,363 | | | | $35,923 | | | | $29,861 | | | | $24 | |
| 1 | For the period from October 31, 2014 (commencement of class operations) to April 30, 2015 |
| 2 | Calculated based upon average shares outstanding |
| 3 | Returns for periods of less than one year are not annualized. |
The accompanying notes are an integral part of these financial statements.
16 | Wells Fargo Enterprise Fund
Financial highlights
(For a share outstanding throughout each period)
| | | | | | | | | | | | | | | | | | | | | | | | |
| | | Six months ended
March 31, 2020
(unaudited) | | | Year ended September 30 | |
| ADMINISTRATOR CLASS | | 2019 | | | 2018 | | | 2017 | | | 2016 | | | 2015 | |
Net asset value, beginning of period | | | $53.10 | | | | $55.82 | | | | $51.12 | | | | $43.81 | | | | $43.58 | | | | $49.54 | |
Net investment loss | | | (0.17 | )1 | | | (0.25 | )1 | | | (0.28 | )1 | | | (0.20 | )1 | | | (0.18 | )1 | | | (0.23 | )1 |
Net realized and unrealized gains (losses) on investments | | | (5.60 | ) | | | 3.27 | | | | 10.17 | | | | 9.34 | | | | 3.77 | | | | 0.19 | |
| | | | | | | | | | | | | | | | | | | | | | | | |
Total from investment operations | | | (5.77 | ) | | | 3.02 | | | | 9.89 | | | | 9.14 | | | | 3.59 | | | | (0.04 | ) |
Distributions to shareholders from | | | | | | | | | | | | | | | | | | | | | | | | |
Net realized gains | | | (3.29 | ) | | | (5.74 | ) | | | (5.19 | ) | | | (1.83 | ) | | | (3.36 | ) | | | (5.92 | ) |
Net asset value, end of period | | | $44.04 | | | | $53.10 | | | | $55.82 | | | | $51.12 | | | | $43.81 | | | | $43.58 | |
Total return2 | | | (11.79 | )% | | | 8.06 | % | | | 20.95 | % | | | 21.66 | % | | | 8.74 | % | | | (0.46 | )% |
Ratios to average net assets (annualized) | | | | | | | | | | | | | | | | | | | | | | | | |
Gross expenses | | | 1.16 | % | | | 1.16 | % | | | 1.16 | % | | | 1.18 | % | | | 1.15 | % | | | 1.09 | % |
Net expenses | | | 1.10 | % | | | 1.10 | % | | | 1.10 | % | | | 1.10 | % | | | 1.07 | % | | | 1.07 | % |
Net investment loss | | | (0.63 | )% | | | (0.51 | )% | | | (0.53 | )% | | | (0.44 | )% | | | (0.41 | )% | | | (0.47 | )% |
Supplemental data | | | | | | | | | | | | | | | | | | | | | | | | |
Portfolio turnover rate | | | 29 | % | | | 50 | % | | | 62 | % | | | 75 | % | | | 99 | % | | | 101 | % |
Net assets, end of period (000s omitted) | | | $2,816 | | | | $3,687 | | | | $3,687 | | | | $3,705 | | | | $4,693 | | | | $3,542 | |
| 1 | Calculated based upon average shares outstanding |
| 2 | Returns for periods of less than one year are not annualized. |
The accompanying notes are an integral part of these financial statements.
Wells Fargo Enterprise Fund | 17
Financial highlights
(For a share outstanding throughout each period)
| | | | | | | | | | | | | | | | | | | | | | | | |
| | | Six months ended
March 31, 2020
(unaudited) | | | Year ended September 30 | |
| INSTITUTIONAL CLASS | | 2019 | | | 2018 | | | 2017 | | | 2016 | | | 2015 | |
Net asset value, beginning of period | | | $55.97 | | | | $58.33 | | | | $53.08 | | | | $45.32 | | | | $44.87 | | | | $50.77 | |
Net investment loss | | | (0.10 | )1 | | | (0.14 | )1 | | | (0.15 | )1 | | | (0.09 | )1 | | | (0.09 | )1 | | | (0.13 | )1 |
Net realized and unrealized gains (losses) on investments | | | (5.96 | ) | | | 3.52 | | | | 10.59 | | | | 9.68 | | | | 3.90 | | | | 0.15 | |
| | | | | | | | | | | | | | | | | | | | | | | | |
Total from investment operations | | | (6.06 | ) | | | 3.38 | | | | 10.44 | | | | 9.59 | | | | 3.81 | | | | 0.02 | |
Distributions to shareholders from | | | | | | | | | | | | | | | | | | | | | | | | |
Net realized gains | | | (3.29 | ) | | | (5.74 | ) | | | (5.19 | ) | | | (1.83 | ) | | | (3.36 | ) | | | (5.92 | ) |
Net asset value, end of period | | | $46.62 | | | | $55.97 | | | | $58.33 | | | | $53.08 | | | | $45.32 | | | | $44.87 | |
Total return2 | | | (11.70 | )% | | | 8.36 | % | | | 21.24 | % | | | 21.97 | % | | | 8.97 | % | | | (0.32 | )% |
Ratios to average net assets (annualized) | | | | | | | | | | | | | | | | | | | | | | | | |
Gross expenses | | | 0.92 | % | | | 0.92 | % | | | 0.92 | % | | | 0.93 | % | | | 0.93 | % | | | 0.88 | % |
Net expenses | | | 0.85 | % | | | 0.85 | % | | | 0.85 | % | | | 0.85 | % | | | 0.85 | % | | | 0.85 | % |
Net investment loss | | | (0.38 | )% | | | (0.26 | )% | | | (0.29 | )% | | | (0.19 | )% | | | (0.21 | )% | | | (0.27 | )% |
Supplemental data | | | | | | | | | | | | | | | | | | | | | | | | |
Portfolio turnover rate | | | 29 | % | | | 50 | % | | | 62 | % | | | 75 | % | | | 99 | % | | | 101 | % |
Net assets, end of period (000s omitted) | | | $49,634 | | | | $52,296 | | | | $48,446 | | | | $54,877 | | | | $61,563 | | | | $87,279 | |
| 1 | Calculated based upon average shares outstanding |
| 2 | Returns for periods of less than one year are not annualized. |
The accompanying notes are an integral part of these financial statements.
18 | Wells Fargo Enterprise Fund
Notes to financial statements (unaudited)
1. ORGANIZATION
Wells Fargo Funds Trust (the “Trust”), a Delaware statutory trust organized on March 10, 1999, is an open-end management investment company registered under the Investment Company Act of 1940, as amended (the “1940 Act”). As an investment company, the Trust follows the accounting and reporting guidance in Financial Accounting Standards Board (“FASB”) Accounting Standards Codification Topic 946, Financial Services – Investment Companies. These financial statements report on the Wells Fargo Enterprise Fund (the “Fund”) which is a diversified series of the Trust.
2. SIGNIFICANT ACCOUNTING POLICIES
The following significant accounting policies, which are consistently followed in the preparation of the financial statements of the Fund, are in conformity with U.S. generally accepted accounting principles which require management to make estimates and assumptions that affect the reported amounts of assets and liabilities, disclosure of contingent assets and liabilities at the date of the financial statements, and the reported amounts of revenues and expenses during the reporting period. Actual results could differ from those estimates.
Securities valuation
All investments are valued each business day as of the close of regular trading on the New York Stock Exchange (generally 4 p.m. Eastern Time), although the Fund may deviate from this calculation time under unusual or unexpected circumstances.
Equity securities that are listed on a foreign or domestic exchange or market are valued at the official closing price or, if none, the last sales price. If no sale occurs on the principal exchange or market that day, a fair value price will be determined in accordance with the Fund’s Valuation Procedures.
Investments in registered open-end investment companies are valued at net asset value. Interests in non-registered investment companies that are redeemable at net asset value are fair valued normally at net asset value.
Investments which are not valued using any of the methods discussed above are valued at their fair value, as determined in good faith by the Board of Trustees of the Fund. The Board of Trustees has established a Valuation Committee comprised of the Trustees and has delegated to it the authority to take any actions regarding the valuation of portfolio securities that the Valuation Committee deems necessary or appropriate, including determining the fair value of portfolio securities, unless the determination has been delegated to the Wells Fargo Asset Management Pricing Committee at Wells Fargo Funds Management, LLC (“Funds Management”). The Board of Trustees retains the authority to make or ratify any valuation decisions or approve any changes to the Valuation Procedures as it deems appropriate. On a quarterly basis, the Board of Trustees receives reports on any valuation actions taken by the Valuation Committee or the Wells Fargo Asset Management Pricing Committee which may include items for ratification.
Securities lending
The Fund may lend its securities from time to time in order to earn additional income in the form of fees or interest on securities received as collateral or the investment of any cash received as collateral. When securities are on loan, the Fund receives interest or dividends on those securities. Cash collateral received in connection with its securities lending transactions is invested in Securities Lending Cash Investments, LLC (the “Securities Lending Fund”). Investments in Securities Lending Fund are valued at the evaluated bid price provided by an independent pricing service. Income earned from investment in the Securities Lending Fund, if any, is included in securities lending income from affiliates (net of fees and rebates) on the Statement of Operations.
In a securities lending transaction, the net asset value of the Fund is affected by an increase or decrease in the value of the securities loaned and by an increase or decrease in the value of the instrument in which collateral is invested. The amount of securities lending activity undertaken by the Fund fluctuates from time to time. The Fund has the right under the lending agreement to recover the securities from the borrower on demand. In the event of default or bankruptcy by the borrower, the Fund may be prevented from recovering the loaned securities or gaining access to the collateral or may experience delays or costs in doing so. In such an event, the terms of the agreement allows the unaffiliated securities lending agent to use the collateral to purchase replacement securities on behalf of the Fund or pay the Fund the market value of the loaned securities. The Fund bears the risk of loss with respect to depreciation of its investment of the cash collateral.
Security transactions and income recognition
Securities transactions are recorded on a trade date basis. Realized gains or losses are recorded on the basis of identified cost.
Dividend income is recognized on the ex-dividend date. Dividend income is recorded net of foreign taxes withheld where recovery of such taxes is not assured.
Wells Fargo Enterprise Fund | 19
Notes to financial statements (unaudited)
Distributions to shareholders
Distributions to shareholders from net investment income and any net realized gains are recorded on the ex-dividend date and paid at least annually. Such distributions are determined in accordance with income tax regulations and may differ from U.S. generally accepted accounting principles. Dividend sources are estimated at the time of declaration. The tax character of distributions is determined as of the Fund’s fiscal year end. Therefore, a portion of the Fund’s distributions made prior to the Fund’s fiscal year end may be categorized as a tax return of capital at year end.
Federal and other taxes
The Fund intends to continue to qualify as a regulated investment company by distributing substantially all of its investment company taxable income and any net realized capital gains (after reduction for capital loss carryforwards) sufficient to relieve it from all, or substantially all, federal income taxes. Accordingly, no provision for federal income taxes was required.
The Fund’s income and federal excise tax returns and all financial records supporting those returns for the prior three fiscal years are subject to examination by the federal and Delaware revenue authorities. Management has analyzed the Fund’s tax positions taken on federal, state, and foreign tax returns for all open tax years and does not believe that there are any uncertain tax positions that require recognition of a tax liability.
As of March 31, 2020, the aggregate cost of all investments for federal income tax purposes was $530,193,061 and the unrealized gains (losses) consisted of:
| | | | |
| |
Gross unrealized gains | | $ | 161,671,817 | |
| |
Gross unrealized losses | | | (39,160,862 | ) |
| |
Net unrealized gains | | $ | 122,510,955 | |
Class allocations
The separate classes of shares offered by the Fund differ principally in applicable sales charges, distribution, shareholder servicing, and administration fees. Class specific expenses are charged directly to that share class. Investment income, common fund-level expenses, and realized and unrealized gains (losses) on investments are allocated daily to each class of shares based on the relative proportion of net assets of each class.
3. FAIR VALUATION MEASUREMENTS
Fair value measurements of investments are determined within a framework that has established a fair value hierarchy based upon the various data inputs utilized in determining the value of the Fund’s investments. The three-level hierarchy gives the highest priority to unadjusted quoted prices in active markets for identical assets or liabilities (Level 1) and the lowest priority to unobservable inputs (Level 3). The Fund’s investments are classified within the fair value hierarchy based on the lowest level of input that is significant to the fair value measurement. The inputs are summarized into three broad levels as follows:
| ∎ | | Level 1 – quoted prices in active markets for identical securities |
| ∎ | | Level 2 – other significant observable inputs (including quoted prices for similar securities, interest rates, prepayment speeds, credit risk, etc.) |
| ∎ | | Level 3 – significant unobservable inputs (including the Fund’s own assumptions in determining the fair value of investments) |
The inputs or methodologies used for valuing investments in securities are not necessarily an indication of the risk associated with investing in those securities.
20 | Wells Fargo Enterprise Fund
Notes to financial statements (unaudited)
The following is a summary of the inputs used in valuing the Fund’s assets and liabilities as of March 31, 2020:
| | | | | | | | | | | | | | | | |
| | | | |
| | | Quoted prices (Level 1) | | | Other significant observable inputs (Level 2) | | | Significant unobservable inputs (Level 3) | | | Total | |
| | | | |
Assets | | | | | | | | | | | | | | | | |
Investments in: | | | | | | | | | | | | | | | | |
| | | | |
Common stocks | | | | | | | | | | | | | | | | |
| | | | |
Communication services | | $ | 27,425,491 | | | $ | 0 | | | $ | 0 | | | $ | 27,425,491 | |
| | | | |
Consumer discretionary | | | 94,672,165 | | | | 0 | | | | 0 | | | | 94,672,165 | |
| | | | |
Consumer staple | | | 8,679,200 | | | | 0 | | | | 0 | | | | 8,679,200 | |
| | | | |
Financials | | | 9,877,744 | | | | 0 | | | | 0 | | | | 9,877,744 | |
| | | | |
Health care | | | 116,999,491 | | | | 0 | | | | 0 | | | | 116,999,491 | |
| | | | |
Industrials | | | 97,119,969 | | | | 0 | | | | 0 | | | | 97,119,969 | |
| | | | |
Information technology | | | 252,644,043 | | | | 0 | | | | 0 | | | | 252,644,043 | |
| | | | |
Materials | | | 27,019,838 | | | | 0 | | | | 0 | | | | 27,019,838 | |
| | | | |
Short-term investments | | | | | | | | | | | | | | | | |
| | | | |
Investment companies | | | 18,266,075 | | | | 0 | | | | 0 | | | | 18,266,075 | |
| | | | |
Total assets | | $ | 652,704,016 | | | $ | 0 | | | $ | 0 | | | $ | 652,704,016 | |
Additional sector, industry or geographic detail is included in the Portfolio of Investments.
For the six months ended March 31, 2020, the Fund did not have any transfers into/out of Level 3.
4. TRANSACTIONS WITH AFFILIATES
Management fee
Funds Management, an indirect wholly owned subsidiary of Wells Fargo & Company (“Wells Fargo”), is the manager of the Fund and provides advisory and fund-level administrative services under an investment management agreement. Under the investment management agreement, Funds Management is responsible for, among other services, implementing the investment objectives and strategies of the Fund, supervising the subadviser and providing fund-level administrative services in connection with the Fund’s operations. As compensation for its services under the investment management agreement, Funds Management is entitled to receive a management fee at the following annual rate based on the Fund’s average daily net assets:
| | | | |
| |
| Average daily net assets | | Management fee | |
| |
First $500 million | | | 0.750 | % |
| |
Next $500 million | | | 0.725 | |
| |
Next $1 billion | | | 0.700 | |
| |
Next $2 billion | | | 0.675 | |
| |
Next $1 billion | | | 0.650 | |
| |
Next $5 billion | | | 0.640 | |
| |
Next $2 billion | | | 0.630 | |
| |
Next $4 billion | | | 0.620 | |
| |
Over $16 billion | | | 0.610 | |
For the six months ended March 31, 2020, the management fee was equivalent to an annual rate of 0.74% of the Fund’s average daily net assets.
Funds Management has retained the services of a subadviser to provide daily portfolio management to the Fund. The fee for subadvisory services is borne by Funds Management. Wells Capital Management Incorporated (“WellsCap”), an affiliate of Funds Management and an indirect wholly owned subsidiary of Wells Fargo, is the subadviser to the Fund and is entitled to receive a fee from Funds Management at an annual rate starting at 0.45% and declining to 0.30% as the average daily net assets of the Fund increase.
Wells Fargo Enterprise Fund | 21
Notes to financial statements (unaudited)
Administration fees
Under a class-level administration agreement, Funds Management provides class-level administrative services to the Fund, which includes paying fees and expenses for services provided by the transfer agent, sub-transfer agents, omnibus account servicers and record-keepers. As compensation for its services under the class-level administration agreement, Funds Management receives an annual fee which is calculated based on the average daily net assets of each class as follows:
| | | | |
| |
| | | Class-level administration fee | |
| |
Class A, Class C | | | 0.21 | % |
| |
Class R6 | | | 0.03 | |
| |
Administrator Class, Institutional Class | | | 0.13 | |
Waivers and/or expense reimbursements
Funds Management has contractually waived and/or reimbursed management and administration fees to the extent necessary to maintain certain net operating expense ratios for the Fund. When each class of the Fund has exceeded its expense cap, Funds Management has waived fees and/or reimbursed expenses from fund-level expenses on a proportionate basis and then from class specific expenses. When only certain classes exceed their expense caps, waivers and/or reimbursements are applied against class specific expenses before fund-level expenses. Funds Management has committed through January 31, 2021 to waive fees and/or reimburse expenses to the extent necessary to cap the Fund’s expenses at 1.18% for Class A shares, 1.93% for Class C shares, 0.80% for Class R6 shares, 1.10% for Administrator Class shares, and 0.85% for Institutional Class shares. Prior to or after the commitment expiration date, the cap may be increased or the commitment to maintain the cap may be terminated only with the approval of the Board of Trustees.
Distribution fee
The Trust has adopted a distribution plan for Class C shares of the Fund pursuant to Rule 12b-1 under the 1940 Act. A distribution fee is charged to Class C shares and paid to Wells Fargo Funds Distributor, LLC (“Funds Distributor”), the principal underwriter, at an annual rate of 0.75% of the average daily net assets of Class C shares.
In addition, Funds Distributor is entitled to receive the front-end sales charge from the purchase of Class A shares and a contingent deferred sales charge on the redemption of certain Class A shares. Funds Distributor is also entitled to receive the contingent deferred sales charges from redemptions of Class C shares. For the six months ended March 31, 2020, Funds Distributor received $2,756 from the sale of Class A shares. No contingent deferred sales charges were incurred by Class A and Class C shares for the six months ended March 31, 2020.
Shareholder servicing fees
The Trust has entered into contracts with one or more shareholder servicing agents, whereby Class A, Class C, and Administrator Class of the Fund are charged a fee at an annual rate of 0.25% of the average daily net assets of each respective class. A portion of these total shareholder servicing fees were paid to affiliates of Wells Fargo.
Interfund transactions
The Fund may purchase or sell portfolio investment securities to certain other Wells Fargo affiliates pursuant to Rule 17a-7 under the 1940 Act and under procedures adopted by the Board of Trustees. The procedures have been designed to ensure that these interfund transactions, which do not incur broker commissions, are effected at current market prices.
5. INVESTMENT PORTFOLIO TRANSACTIONS
Purchases and sales of investments, excluding U.S. government obligations (if any) and short-term securities, for the six months ended March 31, 2020 were $219,775,150 and $257,152,535, respectively.
6. SECURITIES LENDING TRANSACTIONS
The Fund lends its securities through an unaffiliated securities lending agent and receives collateral in the form of cash or securities with a value at least equal to the value of the securities on loan. The value of the loaned securities is determined at the close of each business day and any increases or decreases in the required collateral are exchanged between the Fund and the counterparty on the next business day. Cash collateral received is invested in the Securities Lending Fund which seeks to provide a positive return compared to the daily Fed Funds Open Rate by investing in high-quality, U.S. dollar-denominated short-term money market instruments and is exempt from registration under Section 3(c)(7) of the 1940 Act. Securities Lending Fund is managed by Funds Management and is subadvised by WellsCap. Funds Management receives an advisory fee starting at 0.05% and declining to 0.01% as the average daily net assets of the Securities Lending Fund increase. All of the fees received by Funds Management are paid to WellsCap for its services as subadviser.
22 | Wells Fargo Enterprise Fund
Notes to financial statements (unaudited)
In the event of counterparty default or the failure of a borrower to return a loaned security, the Fund has the right to use the collateral to offset any losses incurred. As of March 31, 2020, the Fund had securities lending transactions with the following counterparties which are subject to offset:
| | | | | | | | | | | | |
| | | |
| Counterparty | | Value of securities on loan | | | Collateral received1 | | | Net amount | |
| | | |
Bank of America Securities Inc. | | $ | 330,200 | | | $ | (330,200 | ) | | $ | 0 | |
| | | |
Barclays Capital Inc. | | | 488,696 | | | | (488,696 | ) | | | 0 | |
| | | |
Citigroup Global Markets Inc. | | | 8,458,499 | | | | (8,458,499 | ) | | | 0 | |
| | | |
JPMorgan Securities LLC | | | 3,303,321 | | | | (3,303,321 | ) | | | 0 | |
| | | |
Morgan Stanley & Co. LLC | | | 462,280 | | | | (462,280 | ) | | | 0 | |
| | | |
Scotia Capital Inc. | | | 204,568 | | | | (204,568 | ) | | | 0 | |
| 1 | Collateral received within this table is limited to the collateral for the net transaction with the counterparty. |
7. BANK BORROWINGS
The Trust (excluding the money market funds), Wells Fargo Master Trust and Wells Fargo Variable Trust are parties to a $280,000,000 revolving credit agreement whereby the Fund is permitted to use bank borrowings for temporary or emergency purposes, such as to fund shareholder redemption requests. Interest under the credit agreement is charged to the Fund based on a borrowing rate equal to the higher of the Federal Funds rate in effect on that day plus 1.25% or the overnight LIBOR rate in effect on that day plus 1.25%. In addition, an annual commitment fee equal to 0.25% of the unused balance is allocated to each participating fund.
For the six months ended March 31, 2020, there were no borrowings by the Fund under the agreement.
8. CONCENTRATION RISK
Concentration risks result from exposure to a limited number of sectors. As of the end of the period, the Fund invests a concentration of its portfolio in the information technology sector. A fund that invests a substantial portion of its assets in any sector may be more affected by changes in that sector than would be a fund whose investments are not heavily weighted in any sector.
9. INDEMNIFICATION
Under the Trust’s organizational documents, the officers and Trustees have been granted certain indemnification rights against certain liabilities that may arise out of performance of their duties to the Trust. Additionally, in the normal course of business, the Trust may enter into contracts with service providers that contain a variety of indemnification clauses. The Trust’s maximum exposure under these arrangements is dependent on future claims that may be made against the Fund and, therefore, cannot be estimated.
10. NEW ACCOUNTING PRONOUNCEMENT
In August 2018, FASB issued Accounting Standards Update (“ASU”) No. 2018-13, Fair Value Measurement (Topic 820)Disclosure Framework—Changes to the Disclosure Requirements for Fair Value Measurement. ASU 2018-13 updates the disclosure requirements for fair value measurements by modifying or removing certain disclosures and adding certain new disclosures. The amendments are effective for fiscal years, and interim periods within those fiscal years, beginning after December 15, 2019. Early adoption is permitted. Management has adopted the removal and modification of disclosures early, as permitted, and will adopt the additional new disclosures at the effective date.
11. CORONAVIRUS (COVID-19) PANDEMIC
On March 11, 2020, the World Health Organization announced that it had made the assessment that coronavirus disease 2019 (“COVID-19”) is a pandemic. The impacts of COVID-19 are adversely affecting the entire global economy, individual companies and investment products, and the market in general. There is significant uncertainty around the extent and duration of business disruptions related to COVID-19 and the impacts may be short term or may last for an extended period of time. The risk of further spreading of COVID-19 has led to significant uncertainty and volatility in the financial markets. The value of the Fund and the securities in which the Fund invests have generally been adversely affected by impacts caused by COVID-19.
Wells Fargo Enterprise Fund | 23
Other information (unaudited)
PROXY VOTING INFORMATION
A description of the policies and procedures used to determine how to vote proxies relating to portfolio securities is available, upon request, by calling1-800-222-8222, visiting our website at wfam.com, or visiting the SEC website at sec.gov. Information regarding how the proxies related to portfolio securities were voted during the most recent 12-month period ended June 30 is available on the website atwfam.comor by visiting the SEC website at sec.gov.
QUARTERLY PORTFOLIO HOLDINGS INFORMATION
The Fund files its complete schedule of portfolio holdings with the SEC for the first and third quarters of each fiscal year as an exhibit to its reports on Form N-PORT. Shareholders may view the filed Form N-PORT by visiting the SEC website at sec.gov.
24 | Wells Fargo Enterprise Fund
Other information (unaudited)
BOARD OF TRUSTEES AND OFFICERS
Each of the Trustees and Officers1 listed in the table below acts in identical capacities for each fund in the Wells Fargo family of funds, which consists of 147 mutual funds comprising the Wells Fargo Funds Trust, Wells Fargo Variable Trust, Wells Fargo Master Trust and four closed-end funds (collectively the “Fund Complex”). This table should be read in conjunction with the Prospectus and the Statement of Additional Information2. The mailing address of each Trustee and Officer is 525 Market Street, 12th Floor, San Francisco, CA 94105. Each Trustee and Officer serves an indefinite term, however, each Trustee serves such term until reaching the mandatory retirement age established by the Trustees.
Independent Trustees
| | | | | | |
Name and year of birth | | Position held and length of service* | | Principal occupations during past five years or longer | | Current other public company or investment company directorships |
| | | |
William R. Ebsworth (Born 1957) | | Trustee, since 2015 | | Retired. From 1984 to 2013, equities analyst, portfolio manager, research director and chief investment officer at Fidelity Management and Research Company in Boston, Tokyo, and Hong Kong, and retired in 2013 as Chief Investment Officer of Fidelity Strategic Advisers, Inc. where he led a team of investment professionals managing client assets. Prior thereto, Board member of Hong Kong Securities Clearing Co., Hong Kong Options Clearing Corp., the Thailand International Fund, Ltd., Fidelity Investments Life Insurance Company, and Empire Fidelity Investments Life Insurance Company. Audit Committee Chair and Investment Committee Chair of the Vincent Memorial Hospital Endowment (non-profit organization). Mr. Ebsworth is a CFA® charterholder. | | N/A |
| | | |
Jane A. Freeman (Born 1953) | | Trustee, since 2015; Chair Liaison, since 2018 | | Retired. From 2012 to 2014 and 1999 to 2008, Chief Financial Officer of Scientific Learning Corporation. From 2008 to 2012, Ms. Freeman provided consulting services related to strategic business projects. Prior to 1999, Portfolio Manager at Rockefeller & Co. and Scudder, Stevens & Clark. Board member of the Harding Loevner Funds from 1996 to 2014, serving as both Lead Independent Director and chair of the Audit Committee. Board member of the Russell Exchange Traded Funds Trust from 2011 to 2012 and the chair of the Audit Committee. Ms. Freeman is a Board Member of The Ruth Bancroft Garden (non-profit organization). She is also an inactive Chartered Financial Analyst. | | N/A |
| | | |
Isaiah Harris, Jr. (Born 1952) | | Trustee, since 2009; Audit Committee Chairman, since 2019 | | Retired. Chairman of the Board of CIGNA Corporation since 2009, and Director since 2005. From 2003 to 2011, Director of Deluxe Corporation. Prior thereto, President and CEO of BellSouth Advertising and Publishing Corp. from 2005 to 2007, President and CEO of BellSouth Enterprises from 2004 to 2005 and President of BellSouth Consumer Services from 2000 to 2003. Emeritus member of the Iowa State University Foundation Board of Governors. Emeritus Member of the Advisory Board of Iowa State University School of Business. Advisory Board Member, Palm Harbor Academy (private school). Advisory Board Member, Child Evangelism Fellowship (non-profit). Mr. Harris is a certified public accountant (inactive status). | | CIGNA Corporation |
| | | |
Judith M. Johnson (Born 1949) | | Trustee, since 2008; Audit Committee Chairman, from 2009 to 2018 | | Retired. Prior thereto, Chief Executive Officer and Chief Investment Officer of Minneapolis Employees Retirement Fund from 1996 to 2008. Ms. Johnson is an attorney, certified public accountant and a certified managerial accountant. | | N/A |
Wells Fargo Enterprise Fund | 25
Other information (unaudited)
| | | | | | |
Name and year of birth | | Position held and length of service* | | Principal occupations during past five years or longer | | Current other public company or investment company directorships |
| | | |
David F. Larcker (Born 1950) | | Trustee, since 2009 | | James Irvin Miller Professor of Accounting at the Graduate School of Business, Stanford University, Director of the Corporate Governance Research Initiative and Senior Faculty of The Rock Center for Corporate Governance since 2006. From 2005 to 2008, Professor of Accounting at the Graduate School of Business, Stanford University. Prior thereto, Ernst & Young Professor of Accounting at The Wharton School, University of Pennsylvania from 1985 to 2005. | | N/A |
| | | |
Olivia S. Mitchell (Born 1953) | | Trustee, since 2006; Nominating and Governance Committee Chair, since 2018 | | International Foundation of Employee Benefit Plans Professor, Wharton School of the University of Pennsylvania since 1993. Director of Wharton’s Pension Research Council and Boettner Center on Pensions & Retirement Research, and Research Associate at the National Bureau of Economic Research. Previously, Cornell University Professor from 1978 to 1993. | | N/A |
| | | |
Timothy J. Penny (Born 1951) | | Trustee, since 1996; Chairman, since 2018 | | President and Chief Executive Officer of Southern Minnesota Initiative Foundation, a non-profit organization, since 2007. Member of the Board of Trustees of NorthStar Education Finance, Inc., a non-profit organization, since 2007. | | N/A |
| | | |
James G. Polisson (Born 1959) | | Trustee, since 2018 | | Retired. Chief Marketing Officer, Source (ETF) UK Services, Ltd, from 2015 to 2017. From 2012 to 2015, Principal of The Polisson Group, LLC, a management consulting, corporate advisory and principal investing company. Chief Executive Officer and Managing Director at Russell Investments, Global Exchange Traded Funds from 2010 to 2012. Managing Director of Barclays Global Investors from 1998 to 2010 and Global Chief Marketing Officer for iShares and Barclays Global Investors from 2000 to 2010. Trustee of the San Francisco Mechanics’ Institute, a non-profit organization, from 2013 to 2015. Board member of the Russell Exchange Traded Fund Trust from 2011 to 2012. Director of Barclays Global Investors Holdings Deutschland GmbH from 2006 to 2009. Mr. Polisson is an attorney and has a retired status with the Massachusetts and District of Columbia Bar Associations. | | N/A |
| | | |
Pamela Wheelock3 (Born 1959) | | Trustee, since January 2020; previously Trustee from January 2018 to July 2019 | | Board member of the Destination Medical Center Economic Development Agency, Rochester, Minnesota since 2019. Acting Commissioner, Minnesota Department of Human Services, July 2019 through September 2019. Human Services Manager (part-time), Minnesota Department of Human Services, October 2019 through December 2019. Chief Operating Officer, Twin Cities Habitat for Humanity from 2017 to 2019. Vice President of University Services, University of Minnesota from 2012 to 2016. Prior thereto, on the Board of Directors, Governance Committee and Finance Committee for the Minnesota Philanthropy Partners (Saint Paul Foundation) from 2012 to 2018, Interim Chief Executive Officer of Blue Cross Blue Shield of Minnesota from 2011 to 2012, Chairman of the Board from 2009 to 2012 and Board Director from 2003 to 2015. Vice President, Leadership and Community Engagement, Bush Foundation, Saint Paul, Minnesota (a private foundation) from 2009 to 2011. Executive Vice President and Chief Financial Officer, Minnesota Sports and Entertainment from 2004 to 2009 and Senior Vice President from 2002 to 2004. Executive Vice President of the Minnesota Wild Foundation from 2004 to 2008. Commissioner of Finance, State of Minnesota, from 1999 to 2002. Currently Board Chair of the Minnesota Wild Foundation since 2010. | | N/A |
| * | Length of service dates reflect the Trustee’s commencement of service with the Trust’s predecessor entities, where applicable. |
26 | Wells Fargo Enterprise Fund
Other information (unaudited)
Officers
| | | | |
Name and year of birth | | Position held and length of service | | Principal occupations during past five years or longer |
| | |
Andrew Owen (Born 1960) | | President, since 2017 | | Executive Vice President of Wells Fargo & Company and Head of Affiliated Managers, Wells Fargo Asset Management, since 2014. In addition, Mr. Owen is currently President, Chief Executive Officer and Director of Wells Fargo Funds Management, LLC since 2017. Prior thereto, Executive Vice President responsible for marketing, investments and product development for Wells Fargo Funds Management, LLC, from 2009 to 2014. |
| | |
Nancy Wiser1 (Born 1967) | | Treasurer, since 2012 | | Executive Vice President of Wells Fargo Funds Management, LLC since 2011. Chief Operating Officer and Chief Compliance Officer at LightBox Capital Management LLC, from 2008 to 2011. |
| | |
Michelle Rhee (Born 1966) | | Chief Legal Officer, since 2019 | | Secretary of Wells Fargo Funds Management, LLC, Chief Legal Counsel of Wells Fargo Asset Management and Assistant General Counsel of Wells Fargo Bank, N.A. since 2018. Associate General Counsel and Managing Director of Bank of America Corporation from 2004 to 2018. |
| | |
Catherine Kennedy (Born 1969) | | Secretary, since 2019 | | Vice President of Wells Fargo Funds Management, LLC and Senior Counsel of the Wells Fargo Legal Department since 2010. Vice President and Senior Counsel of Evergreen Investment Management Company, LLC from 1998 to 2010. |
| | |
Michael H. Whitaker (Born 1967) | | Chief Compliance Officer, since 2016 | | Chief Compliance Officer of Wells Fargo Asset Management since 2016. Senior Vice President and Chief Compliance Officer for Fidelity Investments from 2007 to 2016. |
| | |
David Berardi (Born 1975) | | Assistant Treasurer, since 2009 | | Vice President of Wells Fargo Funds Management, LLC since 2009. Vice President of Evergreen Investment Management Company, LLC from 2008 to 2010. Manager of Fund Reporting and Control for Evergreen Investment Management Company, LLC from 2004 to 2010. |
| | |
Jeremy DePalma1 (Born 1974) | | Assistant Treasurer, since 2009 | | Senior Vice President of Wells Fargo Funds Management, LLC since 2009. Senior Vice President of Evergreen Investment Management Company, LLC from 2008 to 2010 and head of the Fund Reporting and Control Team within Fund Administration from 2005 to 2010. |
| 1 | Nancy Wiser acts as Treasurer of 65 funds in the Fund Complex. Jeremy DePalma acts as Treasurer of 82 funds and Assistant Treasurer of 65 funds in the Fund Complex. |
| 2 | The Statement of Additional Information includes additional information about the Trustees and is available, without charge, upon request, by calling1-800-222-8222 or by visiting the website atwfam.com. |
| 3 | Pamela Wheelock was re-appointed to the Board effective January 1, 2020. |
Wells Fargo Enterprise Fund | 27
Appendix I (unaudited)
Effective on or about May 1, 2020, if you purchase Fund shares through a Janney Montgomery Scott LLC (“Janney”) brokerage account, you will be eligible for the following load waivers (front-end sales charge waivers and contingent deferred sales charge (“CDSC”), or back-end sales charge, waivers) and discounts, which may differ from those disclosed elsewhere in the Fund’s Prospectus or SAI.
|
|
| Front-end sales charge* waivers on Class A shares available at Janney |
|
| Shares purchased through reinvestment of capital gains distributions and dividend reinvestment when purchasing shares of the same fund (but not any other fund within the fund family). |
|
| Shares purchased by employees and registered representatives of Janney or its affiliates and their family members as designated by Janney. |
|
| Shares purchased from the proceeds of redemptions within the same fund family, provided (1) the repurchase occurs within ninety (90) days following the redemption, (2) the redemption and purchase occur in the same account, and (3) redeemed shares were subject to a front-end or deferred sales load (i.e., right of reinstatement). |
|
| Employer-sponsored retirement plans (e.g., 401(k) plans, 457 plans, employer-sponsored 403(b) plans, profit sharing and money purchase pension plans and defined benefit plans). For purposes of this provision, employer-sponsored retirement plans do not include SEP IRAs, Simple IRAs, SAR-SEPs or Keogh plans. |
|
| Shares acquired through a right of reinstatement. |
|
| Class C shares that are no longer subject to a contingent deferred sales charge and are converted to Class A shares of the same fund pursuant to Janney’s policies and procedures. |
|
| CDSC waivers on Class A and Class C shares available at Janney |
|
| Shares sold upon the death or disability of the shareholder. |
|
| Shares sold as part of a systematic withdrawal plan as described in the Fund’s Prospectus. |
|
| Shares purchased in connection with a return of excess contributions from an IRA account. |
|
| Shares sold as part of a required minimum distribution for IRA and retirement accounts if the redemption is taken in or after the year the shareholder reaches qualified age based on applicable IRS regulations. |
|
| Shares sold to pay Janney fees but only if the transaction is initiated by Janney. |
|
| Shares acquired through a right of reinstatement. |
|
| Shares exchanged into the same share class of a different fund. |
|
| Front-end sales charge* discounts available at Janney; breakpoints, rights of accumulation and/or letters of intent |
|
| Breakpoints as described in the Fund’s Prospectus. |
|
| Rights of accumulation (“ROA”), which entitle shareholders to breakpoint discounts, will be automatically calculated based on the aggregated holding of fund family assets held by accounts within the purchaser’s household at Janney. Eligible fund family assets not held at Janney may be included in the ROA calculation only if the shareholder notifies his or her financial advisor about such assets. |
|
| Letters of intent which allow for breakpoint discounts based on anticipated purchases within a fund family, over a 13-month time period. Eligible fund family assets not held at Janney Montgomery Scott may be included in the calculation of letters of intent only if the shareholder notifies his or her financial advisor about such assets. |
| * | Also referred to as an “initial sales charge.” |
28 | Wells Fargo Enterprise Fund
Appendix II (unaudited)
Effective on or after May 1, 2020, clients of Edward Jones (also referred to as “shareholders”) purchasing Fund shares on the Edward Jones commission and fee-based platforms are eligible only for the following sales charge discounts (also referred to as “breakpoints”) and waivers, which can differ from breakpoints and waivers described elsewhere in this Prospectus or SAI or through another broker-dealer. In all instances, it is the shareholder’s responsibility to inform Edward Jones at the time of purchase of any relationship, holdings of Wells Fargo Funds or other facts qualifying the purchaser for breakpoints or waivers. Edward Jones can ask for documentation of such circumstance.
|
| Breakpoints available at Edward Jones |
|
| Rights of Accumulation (ROA) |
|
The applicable sales charge on a purchase of Class A shares is determined by taking into account all share classes (except any money market funds and retirement plan share classes) of Wells Fargo Funds held by the shareholder or in an account grouped by Edward Jones with other accounts for the purpose of providing certain pricing considerations (“pricing groups”). This includes all share classes held on the Edward Jones platform and/or held on another platform. The inclusion of eligible fund family assets in the rights of accumulation calculation is dependent on the shareholder notifying his or her financial advisor of such assets at the time of calculation. |
|
ROA is determined by calculating the higher of cost or market value (current shares x NAV). |
|
| Letter of Intent (LOI) |
|
Through a LOI, shareholders can receive the sales charge and breakpoint discounts for purchases shareholders intend to makeover a 13-month period from the date Edward Jones receives the LOI. The LOI is determined by calculating the higher of cost or market value of qualifying holdings at LOI initiation in combination with the value that the shareholder intends to buy over a 13-month period to calculate the front-end sales charge and any breakpoint discounts. Each purchase the shareholder makes during that 13-month period will receive the sales charge and breakpoint discount that applies to the total amount. The inclusion of eligible fund family assets in the LOI calculation is dependent on the shareholder notifying his or her financial advisor of such assets at the time of calculation. Purchases made before the LOI is received by Edward Jones are not covered under the LOI and will not reduce the sales charge previously paid. Sales charges will be adjusted if LOI is not met. |
| Sales charges are waived for the following shareholders and in the following situations at Edward Jones: |
● Associates of Edward Jones and its affiliates and their family members who are in the same pricing group (as determined by Edward Jones under its policies and procedures) as the associate. This waiver will continue for the remainder of the associate’s life if the associate retires from Edward Jones in good-standing. |
● Shares purchased in an Edward Jones fee-based program. |
● Shares purchased through reinvestment of capital gains distributions and dividend reinvestment. |
● Shares purchased from the proceeds of redeemed shares of the same fund family so long as the following conditions are met: 1)the proceeds are from the sale of shares within 60 days of the purchase, and 2) the sale and purchase are made in the same share class and the same account or the purchase is made in an individual retirement account with proceeds from liquidations in anon-retirement account. |
● Shares exchanged into Class A shares from another share class so long as the exchange is into the same fund and was initiated at the discretion of Edward Jones. Edward Jones is responsible for any remaining CDSC due to the fund company, if applicable. Any future purchases are subject to the applicable sales charge as disclosed in the prospectus. |
● Exchanges from Class C shares to Class A shares of the same fund, generally, in the 84th month following the anniversary of the purchase date or earlier at the discretion of Edward Jones. |
If the shareholder purchases shares that are subject to a CDSC and those shares are redeemed before the CDSC is expired, the shareholder is
responsible to pay the CDSC except in the following conditions available at Edward Jones: |
● The death or disability of the shareholder. |
● Systematic withdrawals with up to 10% per year of the account value. |
● Return of excess contributions from an Individual Retirement Account (IRA). |
● Shares sold as part of a required minimum distribution for IRA and retirement accounts if the redemption is taken in or after the year the shareholder reaches qualified age based on applicable IRS regulation. |
● Shares sold to pay Edward Jones fees or costs in such cases where the transaction is initiated by Edward Jones. |
● Shares exchanged in an Edward Jones fee-based program. |
● Shares acquired through NAV reinstatement. |
Wells Fargo Enterprise Fund | 29
Appendix II (unaudited)
|
| Other Important Information for accounts at Edward Jones: |
Minimum Purchase Amounts ● $250 initial purchase minimum ● $50 subsequent purchase minimum |
Minimum Balances Edward Jones has the right to redeem at its discretion fund holdings with a balance of $250 or less. The following are examples of accounts that are not included in this policy: ● A fee-based account held on an Edward Jones platform ● A 529 account held on an Edward Jones platform ● An account with an active systematic investment plan or letter of intent (LOI) |
Changing Share Classes At any time it deems necessary, Edward Jones has the authority to exchange at NAV a shareholder’s holdings in a fund to Class A shares. |
30 | Wells Fargo Enterprise Fund
This page is intentionally left blank.
This page is intentionally left blank.

For more information
More information about Wells Fargo Funds is available free upon request. To obtain literature, please write, visit the Fund’s website, or call:
Wells Fargo Funds
P.O. Box 219967
Kansas City, MO 64121-9967
Website:wfam.com
Individual investors:1-800-222-8222
Retail investment professionals:1-888-877-9275
Institutional investment professionals:1-866-765-0778

This report and the financial statements contained herein are submitted for the general information of the shareholders of the Fund. If this report is used for promotional purposes, distribution of the report must be accompanied or preceded by a current prospectus. Before investing, please consider the investment objectives, risks, charges, and expenses of the investment. For a current prospectus and, if available, a summary prospectus, containing this information, call1-800-222-8222 or visit the Fund’s website atwfam.com. Read the prospectus carefully before you invest or send money.
Wells Fargo Asset Management (WFAM) is the trade name for certain investment advisory/management firms owned by Wells Fargo & Company. These firms include but are not limited to Wells Capital Management Incorporated and Wells Fargo Funds Management, LLC. Certain products managed by WFAM entities are distributed by Wells Fargo Funds Distributor, LLC (a broker-dealer and Member FINRA).
This material is for general informational and educational purposes only and is NOT intended to provide investment advice or a recommendation of any kind—including a recommendation for any specific investment, strategy, or plan.
INVESTMENT PRODUCTS: NOT FDIC INSURED ◾ NO BANK GUARANTEE ◾ MAY LOSE VALUE
© 2020 Wells Fargo & Company. All rights reserved.
PAR-0420-06263 05-20
SA231/SAR231 03-20
Semi-Annual Report
March 31, 2020
Wells Fargo Opportunity Fund
Beginning on January 1, 2021, as permitted by new regulations adopted by the Securities and Exchange Commission, paper copies of the Wells Fargo Funds’ annual and semi-annual shareholder reports issued after this date will no longer be sent by mail, unless you specifically request paper copies of the reports. Instead, the reports will be made available on the Funds’ website, and you will be notified by mail each time a report is posted and provided with a website address to access the report.
If you already elected to receive shareholder reports electronically, you will not be affected by this change and you need not take any action. You may elect to receive shareholder reports and other communications from the Fund electronically at any time by contacting your financial intermediary (such as a broker-dealer or bank) or, if you are a direct investor, by calling1-800-222-8222 or by enrolling at wellsfargo.com/advantagedelivery.
You may elect to receive all future reports in paper free of charge. If you invest through a financial intermediary, you can contact your financial intermediary to request that you continue to receive paper copies of your shareholder reports; if you invest directly with the Fund, you can call 1-800-222-8222. Your election to receive reports in paper will apply to all Wells Fargo Funds held in your account with your financial intermediary or, if you are a direct investor, to all Wells Fargo Funds that you hold.
|
|
|
Reduce clutter. Save trees. |
Sign up for electronic delivery of prospectuses and
shareholder reports atwellsfargo.com/
advantagedelivery |
The views expressed and any forward-looking statements are as of March 31, 2020, unless otherwise noted, and are those of the Fund managers and/or Wells Fargo Asset Management. Discussions of individual securities, or the markets generally, or any Wells Fargo Fund are not intended as individual recommendations. Future events or results may vary significantly from those expressed in any forward-looking statements. The views expressed are subject to change at any time in response to changing circumstances in the market. Wells Fargo Asset Management and the Fund disclaim any obligation to publicly update or revise any views expressed or forward-looking statements.
INVESTMENT PRODUCTS: NOT FDIC INSURED ◾ NO BANK GUARANTEE ◾ MAY LOSE VALUE
Wells Fargo Opportunity Fund | 1
Letter to shareholders (unaudited)

Andrew Owen
President
Wells Fargo Funds
“The period began with mixed data, leading to central bank support.”
Dear Shareholder:
We are pleased to offer you this semi-annual report for the Wells Fargo Opportunity Fund for the six-month period that ended March 31, 2020. Global stock markets saw earlier gains erased in February and March as governments took unprecedented measures to stop the spread of the coronavirus at the expense of short-term economic output. Fixed-income markets were less battered, with U.S. government bonds achieving modest gains as central banks attempted to bolster capital markets and confidence.
For the period, U.S. stocks, based on the S&P 500 Index,1 returned -12.31% and international stocks, as measured by the MSCI ACWI ex USA Index (Net),2 fell 16.52%. The MSCI EM Index (Net)3 lost 14.55%. For bond investors, the Bloomberg Barclays U.S. Aggregate Bond Index4 added 3.33%, the Bloomberg Barclays Global Aggregate ex-USD Index5 returned -2.03%, the Bloomberg Barclays Municipal Bond Index6 gained a modest 0.10%, and the ICE BofA U.S. High Yield Index7 returned -10.86%.
The period began with mixed data, leading to central bank support.
As the fourth quarter of 2019 started, U.S.-China trade tensions were relaxing while optimism grew for a U.K. Brexit deal. The initial estimate of U.S. third-quarter gross domestic product growth was a resilient 1.9% annualized rate, while the U.S. unemployment rate fell to a 50-year low of 3.5% in September. Despite resilience among U.S. consumers, however, business confidence declined while manufacturing activity contracted. Concerned with a potential economic slowdown, the U.S. Federal Reserve (Fed) lowered interest rates a quarter point in late October—its third rate cut in four months. This helped push the S&P 500 Index to an all-time high while emerging market equities rallied and global bonds declined overall, reflecting a broad pickup in risk appetite.
Equity markets rallied in November despite ongoing geopolitical risks. Hopes for aU.S.-China trade deal buoyed investor confidence. U.S. business sentiment edged up, and manufacturing and services activity rose. With that positive backdrop, developed market equities outpaced those in emerging markets, and U.S. stocks outperformed non-U.S. stocks overall. While consumer confidence and purchasing manager activity rose in the eurozone, China reported weakening manufacturing and consumer data. Bond yields rose marginally, leading to slightly negative returns for global government and investment-grade corporate bonds.
Financial markets ended 2019 with a boost from the U.S. and China accord on a Phase One trade deal. That, along with the landslide win by the pro-Brexit U.K. Conservative
| 1 | The S&P 500 Index consists of 500 stocks chosen for market size, liquidity, and industry group representation. It is a market-value-weighted index with each stock’s weight in the index proportionate to its market value. You cannot invest directly in an index. |
| 2 | The Morgan Stanley Capital International (MSCI) All Country World Index (ACWI) ex USA Index (Net) is a free-float-adjusted market-capitalization-weighted index that is designed to measure the equity market performance of developed markets, excluding the United States. Source: MSCI. MSCI makes no express or implied warranties or representations and shall have no liability whatsoever with respect to any MSCI data contained herein. The MSCI data may not be further redistributed or used as a basis for other indices or any securities or financial products. This report is not approved, reviewed, or produced by MSCI. You cannot invest directly in an index. |
| 3 | The MSCI Emerging Markets (EM) Index (Net) is a free-float-adjusted market-capitalization-weighted index that is designed to measure equity market performance of emerging markets. You cannot invest directly in an index. |
| 4 | The Bloomberg Barclays U.S. Aggregate Bond Index is a broad-based benchmark that measures the investment-grade, U.S. dollar-denominated, fixed-rate taxable bond market, including Treasuries, government-related and corporate securities, mortgage-backed securities (agency fixed-rate and hybrid adjustable-rate mortgage pass-throughs), asset-backed securities, and commercial mortgage-backed securities. You cannot invest directly in an index. |
| 5 | The Bloomberg Barclays Global Aggregate ex-USD Index is an unmanaged index that provides a broad-based measure of the global investment-grade fixed-income markets excluding the U.S. dollar-denominated debt market. You cannot invest directly in an index. |
| 6 | The Bloomberg Barclays Municipal Bond Index is an unmanaged index composed of long-term tax-exempt bonds with a minimum credit rating of Baa. You cannot invest directly in an index. |
| 7 | The ICE BofA U.S. High Yield Index is a market-capitalization-weighted index of domestic and Yankee high-yield bonds. The index tracks the performance of high-yield securities traded in the U.S. bond market. You cannot invest directly in an index. Copyright 2020. ICE Data Indices, LLC. All rights reserved. |
2 | Wells Fargo Opportunity Fund
Letter to shareholders (unaudited)
Party in a national election and ongoing central bank support, gave investors greater confidence. U.S. economic indicators were positive overall, with the exception of manufacturing activity and business confidence. Consumer confidence was resilient, fed by a robust labor market, tame inflation, and lower interest rates, which boosted housing affordability and stimulated homebuyer activity. The impeachment of U.S. President Donald Trump had little impact on markets. Meanwhile, slowing Chinese economic activity, partly attributable to the trade war, led to further government stimulus at year-end through lower reserve ratios, allowing banks to lend more money.
The year-end rally continued in early January 2020. However, capital market volatility spiked in late January on concerns over the potential impact of the coronavirus on the global economy and stock markets. With sentiment somewhat souring, perceived safe havens did well in January. The U.S. dollar and Japanese yen both rose, and government bonds outperformed equities. While the S&P 500 Index held its ground, emerging market equities tumbled, including those in Asia.
In February, the coronavirus became the major market focus. Fears of the virus’s impact on global growth led to expectations of increased global central bank monetary policy support. That led the 10-year U.S. Treasury yield to fall to an all-time low of 1.1% by the end of the month. Although equity markets initially shrugged off concerns about the outbreak, focusing instead on strong fourth-quarter earnings and improving business confidence in January, market sentiment turned sharply lower toward month-end. Oil prices tumbled as Russia and the Organization of the Petroleum Exporting Countries compounded a major decline in oil demand with a brutal price war, causing the price of West Texas Intermediate crude oil to fall 13% in February alone.
The global spread of the coronavirus led many countries to clamp down on social and business-related activity in order to contain the virus from causing even greater devastation and overwhelming the health care system. This abrupt stoppage of economic activity led to the sharp deceleration of global output, sending economies into a deep contraction. Central bank responses were swift, as they slashed interest rates and expanded quantitative easing programs to restore liquidity and confidence to the markets. In the U.S., the Fed launched several lending programs, funding investment-grade bonds, money market mutual funds, and commercial paper while purchasing Treasuries, mortgage-backed securities, and overnight repos. Meanwhile, stock markets tumbled quickly into a bear market, ending the longest bull stock market in U.S. history.
Don’t let short-term uncertainty derail long-term investment goals.
Periods of investment uncertainty can present challenges, but experience has taught us that maintaining long-term investment goals can be an effective way to plan for the future. To help you create a sound strategy based on your personal goals and risk tolerance, Wells Fargo Funds offers more than 100 mutual funds spanning a wide range of asset classes and investment styles. Although diversification cannot guarantee an investment profit or prevent losses, we believe it can be an effective way to manage investment risk and potentially smooth out overall portfolio performance. We encourage investors to know their investments and to understand that appropriate levels of risk-taking may unlock opportunities.
Thank you for choosing to invest with Wells Fargo Funds. We appreciate your confidence in us and remain committed to helping you meet your financial needs.
Sincerely,

Andrew Owen
President
Wells Fargo Funds
“Capital market volatility spiked in late January on concerns over the potential impact of the coronavirus on the global economy and stock markets.”
|
|
|
For further information about your Fund, contact your investment professional, visit our website at wfam.com, or call us directly at1-800-222-8222. |
Wells Fargo Opportunity Fund | 3
Performance highlights (unaudited)
Investment objective
The Fund seeks long-term capital appreciation.
Manager
Wells Fargo Funds Management, LLC
Subadviser
Wells Capital Management Incorporated
Portfolio managers
Kurt Gunderson†
Christopher G. Miller, CFA®‡
Average annual total returns (%) as of March 31, 2020
| | | | | | | | | | | | | | | | | | | | | | | | | | | | | | | | | | |
| | | | |
| | | | | Including sales charge | | | Excluding sales charge | | | Expense ratios1 (%) | |
| | | | | | | | | |
| | | Inception date | | 1 year | | | 5 year | | | 10 year | | | 1 year | | | 5 year | | | 10 year | | | Gross | | | Net2 | |
| | | | | | | | | | |
| Class A (SOPVX) | | 2-24-2000 | | | -15.75 | | | | 2.44 | | | | 7.21 | | | | -10.61 | | | | 3.66 | | | | 7.85 | | | | 1.21 | | | | 1.18 | |
| | | | | | | | | | |
| Class C (WFOPX) | | 3-31-2008 | | | -12.33 | | | | 2.88 | | | | 7.04 | | | | -11.33 | | | | 2.88 | | | | 7.04 | | | | 1.96 | | | | 1.93 | |
| | | | | | | | | | |
| Administrator Class (WOFDX) | | 8-30-2002 | | | – | | | | – | | | | – | | | | -10.45 | | | | 3.87 | | | | 8.08 | | | | 1.13 | | | | 1.00 | |
| | | | | | | | | | |
| Institutional Class (WOFNX)3 | | 7-30-2010 | | | – | | | | – | | | | – | | | | -10.25 | | | | 4.12 | | | | 8.34 | | | | 0.88 | | | | 0.75 | |
| | | | | | | | | | |
| Russell 3000® Index4 | | – | | | – | | | | – | | | | – | | | | -9.13 | | | | 5.77 | | | | 10.15 | | | | – | | | | – | |
Figures quoted represent past performance, which is no guarantee of future results, and do not reflect taxes that a shareholder may pay on an investment in a fund. Investment return and principal value of an investment will fluctuate so that an investor’s shares, when redeemed, may be worth more or less than their original cost. Performance shown without sales charges would be lower if sales charges were reflected. Current performance may be lower or higher than the performance data quoted, which assumes the reinvestment of dividends and capital gains. Currentmonth-end performance is available on the Fund’s website,wfam.com.
Index returns do not include transaction costs associated with buying and selling securities, any mutual fund fees or expenses, or any taxes. It is not possible to invest directly in an index.
For Class A shares, the maximumfront-end sales charge is 5.75%. For Class C shares, the maximum contingent deferred sales charge is 1.00%. Performance including a contingent deferred sales charge assumes the sales charge for the corresponding time period. Administrator Class and Institutional Class shares are sold without afront-end sales charge or contingent deferred sales charge.
Stock values fluctuate in response to the activities of individual companies and general market and economic conditions. Smaller-company stocks tend to be more volatile and less liquid than those of larger companies. Certain investment strategies tend to increase the total risk of an investment (relative to the broader market). The Fund is exposed to foreign investment risk. Consult the Fund’s prospectus for additional information on these and other risks.
Please see footnotes on page 5.
4 | Wells Fargo Opportunity Fund
Performance highlights (unaudited)
| | | | |
| |
| Ten largest holdings (%) as of March 31, 20205 | | | |
| | |
Alphabet Incorporated Class C | | | 4.40 | |
| | |
Apple Incorporated | | | 3.23 | |
| | |
Amazon.com Incorporated | | | 3.21 | |
| | |
Salesforce.com Incorporated | | | 2.87 | |
| | |
MasterCard Incorporated Class A | | | 2.67 | |
| | |
Texas Instruments Incorporated | | | 2.58 | |
| | |
Facebook Incorporated Class A | | | 2.53 | |
| | |
Equinix Incorporated | | | 2.52 | |
| | |
Novartis AG ADR | | | 2.52 | |
| | |
Bio-Rad Laboratories Incorporated Class A | | | 2.46 | |
|
|
| Sector distribution as of March 31, 20206 |
|
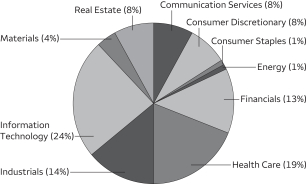 |
| † | Mr. Gunderson became a portfolio manager of the Fund on February 1, 2020. |
| ‡ | CFA® and Chartered Financial Analyst®are trademarks owned by CFA Institute. |
| 1 | Reflects the expense ratios as stated in the most recent prospectuses. The expense ratios shown are subject to change and may differ from the annualized expense ratios shown in the financial highlights of this report. |
| 2 | The manager has contractually committed through January 31, 2021, to waive fees and/or reimburse expenses to the extent necessary to cap total annual fund operating expenses after fee waivers at 1.18% for Class A, 1.93% for Class C, 1.00% for Administrator Class, and 0.75% for Institutional Class. Brokerage commissions, stamp duty fees, interest, taxes, acquired fund fees and expenses (if any), and extraordinary expenses are excluded from the expense cap. Prior to or after the commitment expiration date, the cap may be increased or the commitment to maintain the cap may be terminated only with the approval of the Board of Trustees. Without this cap, the Fund’s returns would have been lower. The expense ratio paid by an investor is the net expense ratio (the total annual fund operating expenses after fee waivers) as stated in the prospectuses. |
| 3 | Historical performance shown for the Institutional Class shares prior to their inception reflects the performance of the Administrator Class shares, and includes the higher expenses applicable to the Administrator Class shares. If these expenses had not been included, returns for the Institutional Class shares would be higher. |
| 4 | The Russell 3000® Index measures the performance of the 3,000 largest U.S. companies based on total market capitalization, which represents approximately 98% of the investable U.S. equity market. You cannot invest directly in an index. |
| 5 | The ten largest holdings, excluding cash, cash equivalents and any money market funds, are calculated based on the value of the investments divided by total net assets of the Fund. Holdings are subject to change and may have changed since the date specified. |
| 6 | Amounts are calculated based on the total long-term investments of the Fund. These amounts are subject to change and may have changed since the date specified. |
Wells Fargo Opportunity Fund | 5
Fund expenses (unaudited)
As a shareholder of the Fund, you incur two types of costs: (1) transaction costs, including sales charges (loads) on purchase payments and contingent deferred sales charges (if any) on redemptions and (2) ongoing costs, including management fees, distribution(12b-1) and/or shareholder servicing fees, and other Fund expenses. This example is intended to help you understand your ongoing costs (in dollars) of investing in the Fund and to compare these costs with the ongoing costs of investing in other mutual funds.
The example is based on an investment of $1,000 invested at the beginning of thesix-month period and held for the entire period from October 1, 2019 to March 31, 2020.
Actual expenses
The “Actual” line of the table below provides information about actual account values and actual expenses. You may use the information in this line, together with the amount you invested, to estimate the expenses that you paid over the period. Simply divide your account value by $1,000 (for example, an $8,600 account value divided by $1,000 = 8.6), then multiply the result by the number in the “Actual” line under the heading entitled “Expenses paid during period” for your applicable class of shares to estimate the expenses you paid on your account during this period.
Hypothetical example for comparison purposes
The “Hypothetical” line of the table below provides information about hypothetical account values and hypothetical expenses based on the Fund’s actual expense ratio and an assumed rate of return of 5% per year before expenses, which is not the Fund’s actual return. The hypothetical account values and expenses may not be used to estimate the actual ending account balance or expenses you paid for the period. You may use this information to compare the ongoing costs of investing in the Fund and other funds. To do so, compare this 5% hypothetical example with the 5% hypothetical examples that appear in the shareholder reports of the other funds.
Please note that the expenses shown in the table are meant to highlight your ongoing costs only and do not reflect any transactional costs, such as sales charges (loads) and contingent deferred sales charges. Therefore, the “Hypothetical” line of the table is useful in comparing ongoing costs only and will not help you determine the relative total costs of owning different funds. In addition, if these transactional costs were included, your costs would have been higher.
| | | | | | | | | | | | | | | | |
| | | Beginning
account value
10-1-2019 | | | Ending
account value
3-31-2020 | | | Expenses
paid during
the period¹ | | | Annualized net
expense ratio | |
| | | | | |
Class A | | | | | | | | | | | | | | | | |
| | | | |
Actual | | $ | 1,000.00 | | | $ | 838.63 | | | $ | 5.29 | | | | 1.15 | % |
| | | | |
Hypothetical (5% return before expenses) | | $ | 1,000.00 | | | $ | 1,019.25 | | | $ | 5.81 | | | | 1.15 | % |
| | | | | |
Class C | | | | | | | | | | | | | | | | |
| | | | |
Actual | | $ | 1,000.00 | | | $ | 835.34 | | | $ | 8.81 | | | | 1.92 | % |
| | | | |
Hypothetical (5% return before expenses) | | $ | 1,000.00 | | | $ | 1,015.40 | | | $ | 9.67 | | | | 1.92 | % |
| | | | | |
Administrator Class | | | | | | | | | | | | | | | | |
| | | | |
Actual | | $ | 1,000.00 | | | $ | 839.53 | | | $ | 4.41 | | | | 0.96 | % |
| | | | |
Hypothetical (5% return before expenses) | | $ | 1,000.00 | | | $ | 1,020.20 | | | $ | 4.85 | | | | 0.96 | % |
| | | | | |
Institutional Class | | | | | | | | | | | | | | | | |
| | | | |
Actual | | $ | 1,000.00 | | | $ | 840.40 | | | $ | 3.45 | | | | 0.75 | % |
| | | | |
Hypothetical (5% return before expenses) | | $ | 1,000.00 | | | $ | 1,021.25 | | | $ | 3.79 | | | | 0.75 | % |
| 1 | Expenses paid is equal to the annualized net expense ratio of each class multiplied by the average account value over the period, multiplied by the number of days in the most recent fiscal half-year divided by the number of days in the fiscal year (to reflect theone-half-year period). |
6 | Wells Fargo Opportunity Fund
Portfolio of investments—March 31, 2020 (unaudited)
| | | | | | | | | | | | | | | | |
| | | | | | | | | Shares | | | Value | |
| Common Stocks: 98.66% | |
|
Communication Services: 8.63% | |
|
| Interactive Media & Services: 6.93% | |
Alphabet Incorporated Class C † | | | | | | | | | | | 51,238 | | | $ | 59,580,057 | |
Facebook Incorporated Class A † | | | | | | | | | | | 205,362 | | | | 34,254,382 | |
| | | | |
| | | | | | | | | | | | | | | 93,834,439 | |
| | | | | | | | | | | | | | | | |
|
| Media: 1.70% | |
Comcast Corporation Class A | | | | | | | | | | | 670,966 | | | | 23,067,811 | |
| | | | | | | | | | | | | | | | |
|
Consumer Discretionary: 7.88% | |
|
| Automobiles: 1.46% | |
General Motors Company | | | | | | | | | | | 955,362 | | | | 19,852,422 | |
| | | | | | | | | | | | | | | | |
|
| Hotels, Restaurants & Leisure: 0.96% | |
Starbucks Corporation | | | | | | | | | | | 197,351 | | | | 12,973,855 | |
| | | | | | | | | | | | | | | | |
|
| Internet & Direct Marketing Retail: 3.21% | |
Amazon.com Incorporated † | | | | | | | | | | | 22,306 | | | | 43,490,454 | |
| | | | | | | | | | | | | | | | |
|
| Multiline Retail: 1.26% | |
Dollar General Corporation | | | | | | | | | | | 113,065 | | | | 17,073,946 | |
| | | | | | | | | | | | | | | | |
|
| Specialty Retail: 0.99% | |
Ulta Beauty Incorporated † | | | | | | | | | | | 76,440 | | | | 13,430,508 | |
| | | | | | | | | | | | | | | | |
|
Consumer Staples: 1.23% | |
|
| Household Products: 1.23% | |
Church & Dwight Company Incorporated | | | | | | | | | | | 259,609 | | | | 16,661,706 | |
| | | | | | | | | | | | | | | | |
|
Energy: 1.02% | |
|
| Oil, Gas & Consumable Fuels: 1.02% | |
BP plc | | | | | | | | | | | 567,391 | | | | 13,838,666 | |
| | | | | | | | | | | | | | | | |
|
Financials: 12.83% | |
|
| Banks: 2.14% | |
PNC Financial Services Group Incorporated | | | | | | | | | | | 161,214 | | | | 15,431,404 | |
Webster Financial Corporation | | | | | | | | | | | 591,488 | | | | 13,545,075 | |
| | | | |
| | | | | | | | | | | | | | | 28,976,479 | |
| | | | | | | | | | | | | | | | |
|
| Capital Markets: 5.53% | |
CME Group Incorporated | | | | | | | | | | | 98,489 | | | | 17,029,733 | |
Intercontinental Exchange Incorporated | | | | | | | | | | | 345,800 | | | | 27,923,350 | |
S&P Global Incorporated | | | | | | | | | | | 122,683 | | | | 30,063,469 | |
| | | | |
| | | | | | | | | | | | | | | 75,016,552 | |
| | | | | | | | | | | | | | | | |
|
| Insurance: 5.16% | |
Chubb Limited | | | | | | | | | | | 219,385 | | | | 24,503,111 | |
Marsh & McLennan Companies Incorporated | | | | | | | | | | | 271,939 | | | | 23,511,846 | |
Willis Towers Watson plc | | | | | | | | | | | 128,918 | | | | 21,896,722 | |
| | | | |
| | | | | | | | | | | | | | | 69,911,679 | |
| | | | | | | | | | | | | | | | |
The accompanying notes are an integral part of these financial statements.
Wells Fargo Opportunity Fund | 7
Portfolio of investments—March 31, 2020 (unaudited)
| | | | | | | | | | | | | | | | |
| | | | | | | | | Shares | | | Value | |
| Health Care: 18.52% | |
|
| Biotechnology: 1.06% | |
Alexion Pharmaceuticals Incorporated † | | | | | | | | | | | 159,883 | | | $ | 14,355,895 | |
| | | | | | | | | | | | | | | | |
|
| Health Care Equipment & Supplies: 5.21% | |
Boston Scientific Corporation † | | | | | | | | | | | 508,355 | | | | 16,587,624 | |
LivaNova plc † | | | | | | | | | | | 558,592 | | | | 25,276,288 | |
Medtronic plc | | | | | | | | | | | 318,781 | | | | 28,747,671 | |
| | | | |
| | | | | | | | | | | | | | | 70,611,583 | |
| | | | | | | | | | | | | | | | |
|
| Health Care Providers & Services: 2.78% | |
Cigna Corporation | | | | | | | | | | | 113,494 | | | | 20,108,867 | |
UnitedHealth Group Incorporated | | | | | | | | | | | 70,425 | | | | 17,562,587 | |
| | | | |
| | | | | | | | | | | | | | | 37,671,454 | |
| | | | | | | | | | | | | | | | |
|
| Life Sciences Tools & Services: 6.15% | |
Agilent Technologies Incorporated | | | | | | | | | | | 317,587 | | | | 22,745,581 | |
Bio-Rad Laboratories Incorporated Class A † | | | | | | | | | | | 95,070 | | | | 33,327,739 | |
Thermo Fisher Scientific Incorporated | | | | | | | | | | | 96,155 | | | | 27,269,558 | |
| | | | |
| | | | | | | | | | | | | | | 83,342,878 | |
| | | | | | | | | | | | | | | | |
|
| Pharmaceuticals: 3.32% | |
Mylan NV † | | | | | | | | | | | 729,609 | | | | 10,878,470 | |
Novartis AG ADR | | | | | | | | | | | 413,842 | | | | 34,121,273 | |
| | | | |
| | | | | | | | | | | | | | | 44,999,743 | |
| | | | | | | | | | | | | | | | |
|
Industrials: 13.39% | |
|
| Aerospace & Defense: 3.81% | |
Hexcel Corporation | | | | | | | | | | | 483,646 | | | | 17,986,795 | |
MTU Aero Engines AG | | | | | | | | | | | 129,633 | | | | 18,744,506 | |
Safran SA | | | | | | | | | | | 168,292 | | | | 14,910,178 | |
| | | | |
| | | | | | | | | | | | | | | 51,641,479 | |
| | | | | | | | | | | | | | | | |
|
| Building Products: 1.65% | |
Armstrong World Industries Incorporated | | | | | | | | | | | 281,361 | | | | 22,345,691 | |
| | | | | | | | | | | | | | | | |
|
| Commercial Services & Supplies: 1.35% | |
Republic Services Incorporated | | | | | | | | | | | 244,333 | | | | 18,339,635 | |
| | | | | | | | | | | | | | | | |
|
| Industrial Conglomerates: 1.36% | |
Carlisle Companies Incorporated | | | | | | | | | | | 147,270 | | | | 18,449,986 | |
| | | | | | | | | | | | | | | | |
|
| Machinery: 3.88% | |
Fortive Corporation | | | | | | | | | | | 466,833 | | | | 25,764,513 | |
ITT Incorporated | | | | | | | | | | | 379,844 | | | | 17,229,724 | |
SPX Corporation † | | | | | | | | | | | 293,090 | | | | 9,566,458 | |
| | | | |
| | | | | | | | | | | | | | | 52,560,695 | |
| | | | | | | | | | | | | | | | |
|
| Trading Companies & Distributors: 1.34% | |
United Rentals Incorporated † | | | | | | | | | | | 176,392 | | | | 18,150,737 | |
| | | | | | | | | | | | | | | | |
|
Information Technology: 23.77% | |
|
| Electronic Equipment, Instruments & Components: 1.57% | |
Amphenol Corporation Class A | | | | | | | | | | | 292,135 | | | | 21,290,799 | |
| | | | | | | | | | | | | | | | |
The accompanying notes are an integral part of these financial statements.
8 | Wells Fargo Opportunity Fund
Portfolio of investments—March 31, 2020 (unaudited)
| | | | | | | | | | | | | | | | |
| | | | | | | | | Shares | | | Value | |
| IT Services: 4.23% | |
Fidelity National Information Services Incorporated | | | | | | | | 173,886 | | | $ | 21,151,493 | |
MasterCard Incorporated Class A | | | | | | | | 149,881 | | | | 36,205,254 | |
| | | | |
| | | | | | | | | | | | | | | 57,356,747 | |
| | | | | | | | | | | | | | | | |
|
| Semiconductors & Semiconductor Equipment: 4.36% | |
Marvell Technology Group Limited | | | | | | | | 1,063,920 | | | | 24,076,510 | |
Texas Instruments Incorporated | | | | | | | | 350,136 | | | | 34,989,090 | |
| | | | |
| | | | | | | | | | | | | | | 59,065,600 | |
| | | | | | | | | | | | | | | | |
|
| Software: 10.38% | |
Fair Isaac Corporation † | | | | | | | | 59,788 | | | | 18,396,170 | |
Palo Alto Networks Incorporated † | | | | | | | | 103,575 | | | | 16,982,157 | |
Proofpoint Incorporated † | | | | | | | | 176,132 | | | | 18,069,382 | |
RealPage Incorporated † | | | | | | | | 362,626 | | | | 19,193,794 | |
Salesforce.com Incorporated † | | | | | | | | 270,075 | | | | 38,885,399 | |
ServiceNow Incorporated † | | | | | | | | 41,821 | | | | 11,985,062 | |
Workday Incorporated Class A † | | | | | | | | 131,611 | | | | 17,138,384 | |
| | | | |
| | | | | | | | | | | | | | | 140,650,348 | |
| | | | | | | | | | | | | | | | |
|
| Technology Hardware, Storage & Peripherals: 3.23% | |
Apple Incorporated | | | | | | | | 172,008 | | | | 43,739,914 | |
| | | | | | | | | | | | | | | | |
|
Materials: 3.42% | |
|
| Chemicals: 2.34% | |
The Sherwin-Williams Company | | | | | | | | 50,157 | | | | 23,048,145 | |
Westlake Chemical Corporation | | | | | | | | 227,306 | | | | 8,676,270 | |
| | | | |
| | | | | | | | | | | | | | | 31,724,415 | |
| | | | | | | | | | | | | | | | |
|
| Metals & Mining: 1.08% | |
Steel Dynamics Incorporated | | | | | | | | 651,249 | | | | 14,679,152 | |
| | | | | | | | | | | | | | | | |
|
Real Estate: 7.97% | |
|
| Equity REITs: 7.97% | |
American Tower Corporation | | | | | | | | 116,489 | | | | 25,365,480 | |
Equinix Incorporated | | | | | | | | 54,776 | | | | 34,211,446 | |
Sun Communities Incorporated | | | | | | | | 207,500 | | | | 25,906,375 | |
VICI Properties Incorporated | | | | | | | | 1,353,274 | | | | 22,518,479 | |
| |
| | | | 108,001,780 | |
| | | | | |
| |
Total Common Stocks (Cost $1,110,773,562) | | | | 1,337,107,048 | |
| | | | | |
| | | | |
| | | | | | | | | | | | | | | | |
| | | Yield | | | | | | | | | | |
| Short-Term Investments: 1.45% | |
|
| Investment Companies: 1.45% | |
Wells Fargo Government Money Market Fund Select Class (l)(u) | | | 0.35 | % | | | | | | | 19,577,145 | | | | 19,577,145 | |
| | | | | | | | | | | | | | | | |
| |
Total Short-Term Investments (Cost $19,577,145) | | | | 19,577,145 | |
| | | | | |
| | | | | | | | |
| Total investments in securities (Cost $1,130,350,707) | | | 100.11 | % | | | 1,356,684,193 | |
| | |
Other assets and liabilities, net | | | (0.11 | ) | | | (1,442,174 | ) |
| | | | | | | | |
| Total net assets | | | 100.00 | % | | $ | 1,355,242,019 | |
| | | | | | | | |
The accompanying notes are an integral part of these financial statements.
Wells Fargo Opportunity Fund | 9
Portfolio of investments—March 31, 2020 (unaudited)
| † | Non-income-earning security |
| (l) | The issuer of the security is an affiliated person of the Fund as defined in the Investment Company Act of 1940. |
| (u) | The rate represents the7-day annualized yield at period end. |
Abbreviations:
| ADR | American depositary receipt |
| REIT | Real estate investment trust |
Investments in Affiliates
An affiliated investment is an investment in which the Fund owns at least 5% of the outstanding voting shares of the issuer or as a result of other relationships, such as the Fund and the issuer having the same investment manager. Transactions with issuers that were either affiliated persons of the Fund at the beginning of the period or the end of the period were as follows:
| | | | | | | | | | | | | | | | | | | | | | | | | | | | | | | | | | | | |
| | | Shares,
beginning of
period | | | Shares
purchased | | | Shares
sold | | | Shares,
end of
period | | | Net
realized
gains
(losses) | | | Net
change in
unrealized
gains
(losses) | | | Income
from
affiliated
securities | | | Value,
end of
period | | | % of
net
assets | |
| | | | | | | | | |
| Short-Term Investments | | | | | | | | | | | | | | | | | | | | | | | | | | | |
Investment Companies | | | | | | | | | | | | | | | | | | | | | | | | | | | | | | | | | | | | |
Securities Lending Cash Investments LLC * | | | 25,481,452 | | | | 25,877,637 | | | | (51,359,089 | ) | | | 0 | | | $ | 0 | | | $ | 0 | | | $ | 10,809 | # | | $ | 0 | | | | | |
Wells Fargo Government Money Market Fund Select Class | | | 18,124,846 | | | | 218,593,605 | | | | (217,141,306 | ) | | | 19,577,145 | | | | 0 | | | | 0 | | | | 160,713 | | | | 19,577,145 | | | | | |
| | | | | | | | | | | | | | | | | | | | | | | | | | | | | | | | | | | | |
| | | | | | | | | | | | | | | | | | $ | 0 | | | $ | 0 | | | $ | 171,522 | | | $ | 19,577,145 | | | | 1.45 | % |
| | | | | | | | | | | | | | | | | | | | | | | | | | | | | | | | | | | | |
| * | No longer held at the end of the period. |
| # | Amount shown represents income before fees and rebates. |
The accompanying notes are an integral part of these financial statements.
10 | Wells Fargo Opportunity Fund
Statement of assets and liabilities—March 31, 2020 (unaudited)
| | | | |
| | | | |
| |
Assets | | | | |
Investments in unaffiliated securities, at value (cost $1,110,773,562) | | $ | 1,337,107,048 | |
Investments in affiliated securities, at value (cost $19,577,145) | | | 19,577,145 | |
Receivable for Fund shares sold | | | 72,725 | |
Receivable for dividends | | | 2,626,544 | |
Prepaid expenses and other assets | | | 28,248 | |
| | | | |
Total assets | | | 1,359,411,710 | |
| | | | |
| |
Liabilities | | | | |
Payable for investments purchased | | | 1,653,305 | |
Payable for Fund shares redeemed | | | 823,589 | |
Management fee payable | | | 811,448 | |
Administration fees payable | | | 238,992 | |
Distribution fee payable | | | 1,449 | |
Shareholder servicing fees payable | | | 296,442 | |
Trustees’ fees and expenses payable | | | 3,888 | |
Accrued expenses and other liabilities | | | 340,578 | |
| | | | |
Total liabilities | | | 4,169,691 | |
| | | | |
Total net assets | | $ | 1,355,242,019 | |
| | | | |
| |
Net assets consist of | | | | |
Paid-in capital | | $ | 1,089,143,450 | |
Total distributable earnings | | | 266,098,569 | |
| | | | |
Total net assets | | $ | 1,355,242,019 | |
| | | | |
| |
Computation of net asset value and offering price per share | | | | |
Net assets – Class A | | $ | 1,154,068,209 | |
Shares outstanding – Class A1 | | | 33,660,164 | |
Net asset value per share – Class A | | | $34.29 | |
Maximum offering price per share – Class A2 | | | $36.38 | |
Net assets – Class C | | $ | 2,168,936 | |
Shares outstanding – Class C1 | | | 69,006 | |
Net asset value per share – Class C | | | $31.43 | |
Net assets – Administrator Class | | $ | 177,465,095 | |
Shares outstanding – Administrator Class1 | | | 4,665,782 | |
Net asset value per share – Administrator Class | | | $38.04 | |
Net assets – Institutional Class | | $ | 21,539,779 | |
Shares outstanding – Institutional Class1 | | | 554,370 | |
Net asset value per share – Institutional Class | | | $38.85 | |
| 1 | The Fund has an unlimited number of authorized shares. |
| 2 | Maximum offering price is computed as 100/94.25 of net asset value. On investments of $50,000 or more, the offering price is reduced. |
The accompanying notes are an integral part of these financial statements.
Wells Fargo Opportunity Fund | 11
Statement of operations—six months ended March 31, 2020 (unaudited)
| | | | |
| | | | |
| |
Investment income | | | | |
Dividends (net of foreign withholding taxes of $193,438) | | $ | 12,157,378 | |
Income from affiliated securities | | | 162,689 | |
| | | | |
Total investment income | | | 12,320,067 | |
| | | | |
| |
Expenses | | | | |
Management fee | | | 6,166,257 | |
Administration fees | |
Class A | | | 1,528,120 | |
Class C | | | 3,031 | |
Administrator Class | | | 144,939 | |
Institutional Class | | | 17,546 | |
Shareholder servicing fees | |
Class A | | | 1,819,191 | |
Class C | | | 3,608 | |
Administrator Class | | | 278,705 | |
Distribution fee | |
Class C | | | 10,814 | |
Custody and accounting fees | | | 47,681 | |
Professional fees | | | 25,981 | |
Registration fees | | | 44,972 | |
Shareholder report expenses | | | 78,855 | |
Trustees’ fees and expenses | | | 11,029 | |
Other fees and expenses | | | 20,077 | |
| | | | |
Total expenses | | | 10,200,806 | |
Less: Fee waivers and/or expense reimbursements | |
Fund-level | | | (383,884 | ) |
Class A | | | (153,844 | ) |
Administrator Class | | | (94,242 | ) |
Institutional Class | | | (8,696 | ) |
| | | | |
Net expenses | | | 9,560,140 | |
| | | | |
Net investment income | | | 2,759,927 | |
| | | | |
| |
Realized and unrealized gains (losses) on investments | | | | |
Net realized gains on investments | | | 40,732,984 | |
Net change in unrealized gains (losses) on investments | | | (304,119,754 | ) |
| | | | |
Net realized and unrealized gains (losses) on investments | | | (263,386,770 | ) |
| | | | |
Net decrease in net assets resulting from operations | | $ | (260,626,843 | ) |
| | | | |
The accompanying notes are an integral part of these financial statements.
12 | Wells Fargo Opportunity Fund
Statement of changes in net assets
| | | | | | | | | | | | | | | | |
| | | Six months ended
March 31, 2020
(unaudited) | | | Year ended
September 30, 2019 | |
| |
Operations | | | | | |
Net investment income | | | | | | $ | 2,759,927 | | | | | | | $ | 4,276,187 | |
Net realized gains on investments | | | | | | | 40,732,984 | | | | | | | | 94,543,210 | |
Net change in unrealized gains (losses) on investments | | | | | | | (304,119,754 | ) | | | | | | | (20,640,995 | ) |
| | | | |
Net increase (decrease) in net assets resulting from operations | | | | | | | (260,626,843 | ) | | | | | | | 78,178,402 | |
| | | | |
| | | | |
Distributions to shareholders from net investment income and net realized gains | | | | | | | | | | | | | | | | |
Class A | | | | | | | (85,913,524 | ) | | | | | | | (148,689,321 | ) |
Class C | | | | | | | (177,607 | ) | | | | | | | (3,194,912 | ) |
Administrator Class | | | | | | | (12,052,779 | ) | | | | | | | (21,792,735 | ) |
Institutional Class | | | | | | | (1,499,585 | ) | | | | | | | (2,724,775 | ) |
| | | | |
Total distributions to shareholders | | | | | | | (99,643,495 | ) | | | | | | | (176,401,743 | ) |
| | | | |
| | | | |
Capital share transactions | | | Shares | | | | | | | | Shares | | | | | |
Proceeds from shares sold | |
Class A | | | 219,532 | | | | 9,270,462 | | | | 930,098 | | | | 37,142,175 | |
Class C | | | 5,520 | | | | 215,513 | | | | 12,229 | | | | 460,797 | |
Administrator Class | | | 20,588 | | | | 950,005 | | | | 46,303 | | | | 2,094,423 | |
Institutional Class | | | 91,163 | | | | 4,463,423 | | | | 228,906 | | | | 10,662,670 | |
| | | | |
| | | | | | | 14,899,403 | | | | | | | | 50,360,065 | |
| | | | |
Reinvestment of distributions | |
Class A | | | 1,957,543 | | | | 83,556,394 | | | | 3,891,150 | | | | 144,750,768 | |
Class C | | | 4,247 | | | | 166,102 | | | | 91,007 | | | | 3,143,382 | |
Administrator Class | | | 242,678 | | | | 11,500,332 | | | | 504,265 | | | | 20,669,150 | |
Institutional Class | | | 27,588 | | | | 1,337,917 | | | | 58,962 | | | | 2,469,867 | |
| | | | |
| | | | | | | 96,560,745 | | | | | | | | 171,033,167 | |
| | | | |
Payment for shares redeemed | |
Class A | | | (2,215,071 | ) | | | (91,863,861 | ) | | | (4,134,053 | ) | | | (168,457,293 | ) |
Class C | | | (34,200 | ) | | | (1,345,711 | ) | | | (732,350 | ) | | | (26,708,914 | ) |
Administrator Class | | | (361,513 | ) | | | (17,295,953 | ) | | | (620,318 | ) | | | (27,798,000 | ) |
Institutional Class | | | (105,340 | ) | | | (4,936,819 | ) | | | (320,957 | ) | | | (14,616,198 | ) |
| | | | |
| | | | | | | (115,442,344 | ) | | | | | | | (237,580,405 | ) |
| | | | |
Net decrease in net assets resulting from capital share transactions | | | | | | | (3,982,196 | ) | | | | | | | (16,187,173 | ) |
| | | | |
Total decrease in net assets | | | | | | | (364,252,534 | ) | | | | | | | (114,410,514 | ) |
| | | | |
| | |
Net assets | | | | | | | | |
Beginning of period | | | | | | | 1,719,494,553 | | | | | | | | 1,833,905,067 | |
| | | | |
End of period | | | | | | $ | 1,355,242,019 | | | | | | | $ | 1,719,494,553 | |
| | | | |
The accompanying notes are an integral part of these financial statements.
Wells Fargo Opportunity Fund | 13
Financial highlights
(For a share outstanding throughout each period)
| | | | | | | | | | | | | | | | | | | | | | | | |
| | | Six months ended
March 31, 2020
(unaudited) | | | Year ended September 30 | |
| CLASS A | | 2019 | | | 2018 | | | 2017 | | | 2016 | | | 2015 | |
Net asset value, beginning of period | | | $43.37 | | | | $46.31 | | | | $45.83 | | | | $41.86 | | | | $43.35 | | | | $49.56 | |
Net investment income (loss) | | | 0.06 | | | | 0.10 | | | | (0.01 | )1 | | | 0.04 | | | | 0.13 | 1 | | | 0.64 | |
Net realized and unrealized gains (losses) on investments | | | (6.55 | ) | | | 1.54 | | | | 6.41 | | | | 6.60 | | | | 4.72 | | | | (1.52 | ) |
| | | | | | | | | | | | | | | | | | | | | | | | |
Total from investment operations | | | (6.49 | ) | | | 1.64 | | | | 6.40 | | | | 6.64 | | | | 4.85 | | | | (0.88 | ) |
Distributions to shareholders from | | | | | | | | | | | | | | | | | | | | | | | | |
Net investment income | | | (0.10 | ) | | | 0.00 | | | | (0.17 | ) | | | (0.13 | ) | | | (0.57 | ) | | | 0.00 | |
Net realized gains | | | (2.49 | ) | | | (4.58 | ) | | | (5.75 | ) | | | (2.54 | ) | | | (5.77 | ) | | | (5.33 | ) |
| | | | | | | | | | | | | | | | | | | | | | | | |
Total distributions to shareholders | | | (2.59 | ) | | | (4.58 | ) | | | (5.92 | ) | | | (2.67 | ) | | | (6.34 | ) | | | (5.33 | ) |
Net asset value, end of period | | | $34.29 | | | | $43.37 | | | | $46.31 | | | | $45.83 | | | | $41.86 | | | | $43.35 | |
Total return2 | | | (16.14 | )% | | | 5.18 | % | | | 15.16 | % | | | 16.49 | % | | | 12.46 | % | | | (2.27 | )% |
Ratios to average net assets (annualized) | | | | | | | | | | | | | | | | | | | | | | | | |
Gross expenses | | | 1.21 | % | | | 1.21 | % | | | 1.20 | % | | | 1.21 | % | | | 1.21 | % | | | 1.24 | % |
Net expenses | | | 1.15 | % | | | 1.19 | % | | | 1.20 | % | | | 1.21 | % | | | 1.21 | % | | | 1.22 | % |
Net investment income (loss) | | | 0.29 | % | | | 0.23 | % | | | (0.01 | )% | | | 0.11 | % | | | 0.33 | % | | | 1.30 | % |
Supplemental data | | | | | | | | | | | | | | | | | | | | | | | | |
Portfolio turnover rate | | | 23 | % | | | 28 | % | | | 30 | % | | | 43 | % | | | 34 | % | | | 42 | % |
Net assets, end of period (000s omitted) | | | $1,154,068 | | | | $1,461,345 | | | | $1,528,852 | | | | $1,479,457 | | | | $1,418,614 | | | | $390,154 | |
| 1 | Calculated based upon average shares outstanding |
| 2 | Total return calculations do not include any sales charges. Returns for periods of less than one year are not annualized. |
The accompanying notes are an integral part of these financial statements.
14 | Wells Fargo Opportunity Fund
Financial highlights
(For a share outstanding throughout each period)
| | | | | | | | | | | | | | | | | | | | | | | | |
| | | Six months ended
March 31, 2020
(unaudited) | | | Year ended September 30 | |
| CLASS C | | 2019 | | | 2018 | | | 2017 | | | 2016 | | | 2015 | |
Net asset value, beginning of period | | | $40.02 | | | | $43.43 | | | | $43.46 | | | | $39.99 | | | | $41.60 | | | | $48.10 | |
Net investment income (loss) | | | (0.10 | )1 | | | (0.26 | )1 | | | (0.43 | ) | | | (0.26 | )1 | | | (0.16 | )1 | | | 0.26 | |
Net realized and unrealized gains (losses) on investments | | | (6.00 | ) | | | 1.43 | | | | 6.15 | | | | 6.27 | | | | 4.51 | | | | (1.43 | ) |
| | | | | | | | | | | | | | | | | | | | | | | | |
Total from investment operations | | | (6.10 | ) | | | 1.17 | | | | 5.72 | | | | 6.01 | | | | 4.35 | | | | (1.17 | ) |
Distributions to shareholders from | | | | | | | | | | | | | | | | | | | | | | | | |
Net investment income | | | 0.00 | | | | 0.00 | | | | 0.00 | | | | 0.00 | | | | (0.19 | ) | | | 0.00 | |
Net realized gains | | | (2.49 | ) | | | (4.58 | ) | | | (5.75 | ) | | | (2.54 | ) | | | (5.77 | ) | | | (5.33 | ) |
| | | | | | | | | | | | | | | | | | | | | | | | |
Total distributions to shareholders | | | (2.49 | ) | | | (4.58 | ) | | | (5.75 | ) | | | (2.54 | ) | | | (5.96 | ) | | | (5.33 | ) |
Net asset value, end of period | | | $31.43 | | | | $40.02 | | | | $43.43 | | | | $43.46 | | | | $39.99 | | | | $41.60 | |
Total return2 | | | (16.47 | )% | | | 4.37 | % | | | 14.31 | % | | | 15.62 | % | | | 11.62 | % | | | (3.01 | )% |
Ratios to average net assets (annualized) | | | | | | | | | | | | | | | | | | | | | | | | |
Gross expenses | | | 1.96 | % | | | 1.96 | % | | | 1.95 | % | | | 1.96 | % | | | 1.96 | % | | | 1.99 | % |
Net expenses | | | 1.92 | % | | | 1.95 | % | | | 1.95 | % | | | 1.96 | % | | | 1.96 | % | | | 1.97 | % |
Net investment income (loss) | | | (0.49 | )% | | | (0.69 | )% | | | (0.76 | )% | | | (0.64 | )% | | | (0.40 | )% | | | 0.55 | % |
Supplemental data | | | | | | | | | | | | | | | | | | | | | | | | |
Portfolio turnover rate | | | 23 | % | | | 28 | % | | | 30 | % | | | 43 | % | | | 34 | % | | | 42 | % |
Net assets, end of period (000s omitted) | | | $2,169 | | | | $3,739 | | | | $31,381 | | | | $33,057 | | | | $34,721 | | | | $37,196 | |
| 1 | Calculated based upon average shares outstanding |
| 2 | Total return calculations do not include any sales charges. Returns for periods of less than one year are not annualized. |
The accompanying notes are an integral part of these financial statements.
Wells Fargo Opportunity Fund | 15
Financial highlights
(For a share outstanding throughout each period)
| | | | | | | | | | | | | | | | | | | | | | | | |
| | | Six months ended
March 31, 2020
(unaudited) | | | Year ended September 30 | |
| ADMINISTRATOR CLASS | | 2019 | | | 2018 | | | 2017 | | | 2016 | | | 2015 | |
Net asset value, beginning of period | | | $47.85 | | | | $50.50 | | | | $49.45 | | | | $44.93 | | | | $46.11 | | | | $52.27 | |
Net investment income | | | 0.11 | 1 | | | 0.21 | | | | 0.07 | | | | 0.15 | 1 | | | 0.24 | 1 | | | 0.79 | |
Net realized and unrealized gains (losses) on investments | | | (7.27 | ) | | | 1.73 | | | | 6.97 | | | | 7.09 | | | | 5.04 | | | | (1.62 | ) |
| | | | | | | | | | | | | | | | | | | | | | | | |
Total from investment operations | | | (7.16 | ) | | | 1.94 | | | | 7.04 | | | | 7.24 | | | | 5.28 | | | | (0.83 | ) |
Distributions to shareholders from | | | | | | | | | | | | | | | | | | | | | | | | |
Net investment income | | | (0.16 | ) | | | (0.01 | ) | | | (0.24 | ) | | | (0.18 | ) | | | (0.69 | ) | | | 0.00 | |
Net realized gains | | | (2.49 | ) | | | (4.58 | ) | | | (5.75 | ) | | | (2.54 | ) | | | (5.77 | ) | | | (5.33 | ) |
| | | | | | | | | | | | | | | | | | | | | | | | |
Total distributions to shareholders | | | (2.65 | ) | | | (4.59 | ) | | | (5.99 | ) | | | (2.72 | ) | | | (6.46 | ) | | | (5.33 | ) |
Net asset value, end of period | | | $38.04 | | | | $47.85 | | | | $50.50 | | | | $49.45 | | | | $44.93 | | | | $46.11 | |
Total return2 | | | (16.05 | )% | | | 5.37 | % | | | 15.38 | % | | | 16.74 | % | | | 12.68 | % | | | (2.04 | )% |
Ratios to average net assets (annualized) | | | | | | | | | | | | | | | | | | | | | | | | |
Gross expenses | | | 1.13 | % | | | 1.13 | % | | | 1.12 | % | | | 1.13 | % | | | 1.13 | % | | | 1.10 | % |
Net expenses | | | 0.96 | % | | | 1.00 | % | | | 1.00 | % | | | 1.00 | % | | | 1.00 | % | | | 1.00 | % |
Net investment income | | | 0.48 | % | | | 0.42 | % | | | 0.19 | % | | | 0.31 | % | | | 0.56 | % | | | 1.52 | % |
Supplemental data | | | | | | | | | | | | | | | | | | | | | | | | |
Portfolio turnover rate | | | 23 | % | | | 28 | % | | | 30 | % | | | 43 | % | | | 34 | % | | | 42 | % |
Net assets, end of period (000s omitted) | | | $177,465 | | | | $227,963 | | | | $244,110 | | | | $237,315 | | | | $226,140 | | | | $223,281 | |
| 1 | Calculated based upon average shares outstanding |
| 2 | Returns for periods of less than one year are not annualized. |
The accompanying notes are an integral part of these financial statements.
16 | Wells Fargo Opportunity Fund
Financial highlights
(For a share outstanding throughout each period)
| | | | | | | | | | | | | | | | | | | | | | | | |
| | | Six months ended
March 31, 2020
(unaudited) | | | Year ended September 30 | |
| INSTITUTIONAL CLASS | | 2019 | | | 2018 | | | 2017 | | | 2016 | | | 2015 | |
Net asset value, beginning of period | | | $48.89 | | | | $51.50 | | | | $50.30 | | | | $45.63 | | | | $46.76 | | | | $52.82 | |
Net investment income | | | 0.14 | | | | 0.35 | | | | 0.22 | | | | 0.22 | 1 | | | 0.35 | 1 | | | 0.92 | 1 |
Net realized and unrealized gains (losses) on investments | | | (7.41 | ) | | | 1.74 | | | | 7.08 | | | | 7.25 | | | | 5.12 | | | | (1.65 | ) |
| | | | | | | | | | | | | | | | | | | | | | | | |
Total from investment operations | | | (7.27 | ) | | | 2.09 | | | | 7.30 | | | | 7.47 | | | | 5.47 | | | | (0.73 | ) |
Distributions to shareholders from | | | | | | | | | | | | | | | | | | | | | | | | |
Net investment income | | | (0.28 | ) | | | (0.12 | ) | | | (0.35 | ) | | | (0.26 | ) | | | (0.83 | ) | | | 0.00 | |
Net realized gains | | | (2.49 | ) | | | (4.58 | ) | | | (5.75 | ) | | | (2.54 | ) | | | (5.77 | ) | | | (5.33 | ) |
| | | | | | | | | | | | | | | | | | | | | | | | |
Total distributions to shareholders | | | (2.77 | ) | | | (4.70 | ) | | | (6.10 | ) | | | (2.80 | ) | | | (6.60 | ) | | | (5.33 | ) |
Net asset value, end of period | | | $38.85 | | | | $48.89 | | | | $51.50 | | | | $50.30 | | | | $45.63 | | | | $46.76 | |
Total return2 | | | (15.96 | )% | | | 5.63 | % | | | 15.69 | % | | | 17.02 | % | | | 12.97 | % | | | (1.81 | )% |
Ratios to average net assets (annualized) | | | | | | | | | | | | | | | | | | | | | | | | |
Gross expenses | | | 0.88 | % | | | 0.88 | % | | | 0.87 | % | | | 0.88 | % | | | 0.88 | % | | | 0.83 | % |
Net expenses | | | 0.75 | % | | | 0.75 | % | | | 0.75 | % | | | 0.75 | % | | | 0.75 | % | | | 0.75 | % |
Net investment income | | | 0.70 | % | | | 0.66 | % | | | 0.44 | % | | | 0.47 | % | | | 0.79 | % | | | 1.79 | % |
Supplemental data | | | | | | | | | | | | | | | | | | | | | | | | |
Portfolio turnover rate | | | 23 | % | | | 28 | % | | | 30 | % | | | 43 | % | | | 34 | % | | | 42 | % |
Net assets, end of period (000s omitted) | | | $21,540 | | | | $26,447 | | | | $29,562 | | | | $29,709 | | | | $17,222 | | | | $11,906 | |
| 1 | Calculated based upon average shares outstanding |
| 2 | Returns for periods of less than one year are not annualized. |
The accompanying notes are an integral part of these financial statements.
Wells Fargo Opportunity Fund | 17
Notes to financial statements (unaudited)
1. ORGANIZATION
Wells Fargo Funds Trust (the “Trust”), a Delaware statutory trust organized on March 10, 1999, is anopen-end management investment company registered under the Investment Company Act of 1940, as amended (the “1940 Act”). As an investment company, the Trust follows the accounting and reporting guidance in Financial Accounting Standards Board (“FASB”)Accounting Standards Codification Topic 946, Financial Services – Investment Companies. These financial statements report on the Wells Fargo Opportunity Fund (the “Fund”) which is a diversified series of the Trust.
2. SIGNIFICANT ACCOUNTING POLICIES
The following significant accounting policies, which are consistently followed in the preparation of the financial statements of the Fund, are in conformity with U.S. generally accepted accounting principles which require management to make estimates and assumptions that affect the reported amounts of assets and liabilities, disclosure of contingent assets and liabilities at the date of the financial statements, and the reported amounts of revenues and expenses during the reporting period. Actual results could differ from those estimates.
Securities valuation
All investments are valued each business day as of the close of regular trading on the New York Stock Exchange (generally 4 p.m. Eastern Time), although the Fund may deviate from this calculation time under unusual or unexpected circumstances.
Equity securities that are listed on a foreign or domestic exchange or market are valued at the official closing price or, if none, the last sales price. If no sale occurs on the principal exchange or market that day, a fair value price will be determined in accordance with the Fund’s Valuation Procedures.
The values of securities denominated in foreign currencies are translated into U.S. dollars at rates provided by an independent foreign currency pricing source at a time each business day specified by the Wells Fargo Asset Management Pricing Committee at Wells Fargo Funds Management, LLC (“Funds Management”).
Many securities markets and exchanges outside the U.S. close prior to the close of the New York Stock Exchange and therefore may not fully reflect trading or events that occur after the close of the principal exchange in which the foreign securities are traded, but before the close of the New York Stock Exchange. If such trading or events are expected to materially affect the value of such securities, then fair value pricing procedures approved by the Board of Trustees of the Fund are applied. These procedures take into account multiple factors including movements in U.S. securities markets after foreign exchanges close. Foreign securities that are fair valued under these procedures are categorized as Level 2 and the application of these procedures may result in transfers between Level 1 and Level 2. Depending on market activity, such fair valuations may be frequent. Such fair value pricing may result in net asset values that are higher or lower than net asset values based on the last reported sales price or latest quoted bid price. On March 31, 2020, such fair value pricing was used in pricing certain foreign securities.
Investments in registeredopen-end investment companies are valued at net asset value. Interests innon-registered investment companies that are redeemable at net asset value are fair valued normally at net asset value.
Investments which are not valued using any of the methods discussed above are valued at their fair value, as determined in good faith by the Board of Trustees. The Board of Trustees has established a Valuation Committee comprised of the Trustees and has delegated to it the authority to take any actions regarding the valuation of portfolio securities that the Valuation Committee deems necessary or appropriate, including determining the fair value of portfolio securities, unless the determination has been delegated to the Wells Fargo Asset Management Pricing Committee.The Board of Trustees retains the authority to make or ratify any valuation decisions or approve any changes to the Valuation Procedures as it deems appropriate. On a quarterly basis, the Board of Trustees receives reports on any valuation actions taken by the Valuation Committee or the Wells Fargo Asset Management Pricing Committee which may include items for ratification.
Foreign currency translation
The accounting records of the Fund are maintained in U.S. dollars. The values of other assets and liabilities denominated in foreign currencies are translated into U.S. dollars at rates provided by an independent foreign currency pricing source at a time each business day specified by the Wells Fargo Asset Management Pricing Committee. Purchases and sales of securities, and income and expenses are converted at the rate of exchange on the respective dates of such transactions. Net realized foreign exchange gains or losses arise from sales of foreign currencies, currency gains or losses realized between the trade and settlement dates on securities transactions, and the difference between the amounts of dividends, interest and foreign withholding taxes recorded and the U.S. dollar equivalent of the amounts actually paid or received. Net unrealized foreign exchange gains and losses arise from changes in the fair value of assets and liabilities other than investments in securities resulting from changes in exchange rates. The changes in net assets arising from changes in exchange rates of securities and the changes in net assets resulting from changes in market prices of securities are not separately presented. Such changes are included in net realized and unrealized gains or losses from investments.
18 | Wells Fargo Opportunity Fund
Notes to financial statements (unaudited)
Securities lending
The Fund may lend its securities from time to time in order to earn additional income in the form of fees or interest on securities received as collateral or the investment of any cash received as collateral. When securities are on loan, the Fund receives interest or dividends on those securities. Cash collateral received in connection with its securities lending transactions is invested in Securities Lending Cash Investments, LLC (the “Securities Lending Fund”). Investments in Securities Lending Fund are valued at the evaluated bid price provided by an independent pricing service. Income earned from investment in the Securities Lending Fund (net of fees and rebates), if any, is included in income from affiliated securities on the Statement of Operations.
In a securities lending transaction, the net asset value of the Fund is affected by an increase or decrease in the value of the securities loaned and by an increase or decrease in the value of the instrument in which collateral is invested. The amount of securities lending activity undertaken by the Fund fluctuates from time to time. The Fund has the right under the lending agreement to recover the securities from the borrower on demand. In the event of default or bankruptcy by the borrower, the Fund may be prevented from recovering the loaned securities or gaining access to the collateral or may experience delays or costs in doing so. In such an event, the terms of the agreement allow the unaffiliated securities lending agent to use the collateral to purchase replacement securities on behalf of the Fund or pay the Fund the market value of the loaned securities. The Fund bears the risk of loss with respect to depreciation of its investment of the cash collateral.
Security transactions and income recognition
Securities transactions are recorded on a trade date basis. Realized gains or losses are recorded on the basis of identified cost.
Dividend income is recognized on theex-dividend date, except for certain dividends from foreign securities, which are recorded as soon as the custodian verifies theex-dividend date. Dividend income from foreign securities is recorded net of foreign taxes withheld where recovery of such taxes is not assured.
Distributions to shareholders
Distributions to shareholders from net investment income and any net realized gains are recorded on theex-dividend date and paid at least annually. Such distributions are determined in accordance with income tax regulations and may differ from U.S. generally accepted accounting principles. Dividend sources are estimated at the time of declaration. The tax character of distributions is determined as of the Fund’s fiscal year end. Therefore, a portion of the Fund’s distributions made prior to the Fund’s fiscal year end may be categorized as a tax return of capital at year end.
Federal and other taxes
The Fund intends to continue to qualify as a regulated investment company by distributing substantially all of its investment company taxable income and any net realized capital gains (after reduction for capital loss carryforwards) sufficient to relieve it from all, or substantially all, federal income taxes. Accordingly, no provision for federal income taxes was required.
The Fund’s income and federal excise tax returns and all financial records supporting those returns for the prior three fiscal years are subject to examination by the federal and Delaware revenue authorities. Management has analyzed the Fund’s tax positions taken on federal, state, and foreign tax returns for all open tax years and does not believe that there are any uncertain tax positions that require recognition of a tax liability.
As of March 31, 2020, the aggregate cost of all investments for federal income tax purposes was $1,127,797,145 and the unrealized gains (losses) consisted of:
| | | | |
| |
Gross unrealized gains | | $ | 384,469,413 | |
| |
Gross unrealized losses | | | (155,582,365 | ) |
| |
Net unrealized gains | | $ | 228,887,048 | |
Class allocations
The separate classes of shares offered by the Fund differ principally in applicable sales charges, distribution, shareholder servicing, and administration fees. Class specific expenses are charged directly to that share class. Investment income, common fund-level expenses, and realized and unrealized gains (losses) on investments are allocated daily to each class of shares based on the relative proportion of net assets of each class.
3. FAIR VALUATION MEASUREMENTS
Fair value measurements of investments are determined within a framework that has established a fair value hierarchy based upon the various data inputs utilized in determining the value of the Fund’s investments. The three-level hierarchy gives the highest priority to unadjusted quoted prices in active markets for identical assets or liabilities (Level 1) and the lowest priority to
Wells Fargo Opportunity Fund | 19
Notes to financial statements (unaudited)
unobservable inputs (Level 3). The Fund’s investments are classified within the fair value hierarchy based on the lowest level of input that is significant to the fair value measurement. The inputs are summarized into three broad levels as follows:
| ∎ | | Level 1 – quoted prices in active markets for identical securities |
| ∎ | | Level 2 – other significant observable inputs (including quoted prices for similar securities, interest rates, prepayment speeds, credit risk, etc.) |
| ∎ | | Level 3 – significant unobservable inputs (including the Fund’s own assumptions in determining the fair value of investments) |
The inputs or methodologies used for valuing investments in securities are not necessarily an indication of the risk associated with investing in those securities.
The following is a summary of the inputs used in valuing the Fund’s assets and liabilities as of March 31, 2020:
| | | | | | | | | | | | | | | | |
| | | | |
| | | Quoted prices
(Level 1) | | | Other significant
observable inputs
(Level 2) | | | Significant
unobservable inputs
(Level 3) | | | Total | |
| | | | |
Assets | | | | | | | | | | | | | | | | |
Investments in: | | | | | | | | | | | | | | | | |
| | | | |
Common stocks | | | | | | | | | | | | | | | | |
| | | | |
Communication services | | $ | 116,902,250 | | | $ | 0 | | | $ | 0 | | | $ | 116,902,250 | |
| | | | |
Consumer discretionary | | | 106,821,185 | | | | 0 | | | | 0 | | | | 106,821,185 | |
| | | | |
Consumer staples | | | 16,661,706 | | | | 0 | | | | 0 | | | | 16,661,706 | |
| | | | |
Energy | | | 13,838,666 | | | | 0 | | | | 0 | | | | 13,838,666 | |
| | | | |
Financials | | | 173,904,710 | | | | 0 | | | | 0 | | | | 173,904,710 | |
| | | | |
Health care | | | 250,981,553 | | | | 0 | | | | 0 | | | | 250,981,553 | |
| | | | |
Industrials | | | 147,833,539 | | | | 33,654,684 | | | | 0 | | | | 181,488,223 | |
| | | | |
Information technology | | | 322,103,408 | | | | 0 | | | | 0 | | | | 322,103,408 | |
| | | | |
Materials | | | 46,403,567 | | | | 0 | | | | 0 | | | | 46,403,567 | |
| | | | |
Real estate | | | 108,001,780 | | | | 0 | | | | 0 | | | | 108,001,780 | |
| | | | |
Short-term investments | | | | | | | | | | | | | | | | |
| | | | |
Investment companies | | | 19,577,145 | | | | 0 | | | | 0 | | | | 19,577,145 | |
| | | | |
Total assets | | $ | 1,323,029,509 | | | $ | 33,654,684 | | | $ | 0 | | | $ | 1,356,684,193 | |
Additional sector, industry or geographic detail is included in the Portfolio of Investments.
For the six months ended March 31, 2020, the Fund did not have any transfers into/out of Level 3.
4. TRANSACTIONS WITH AFFILIATES
Management fee
Funds Management, an indirect wholly owned subsidiary of Wells Fargo & Company (“Wells Fargo”), is the manager of the Fund and provides advisory and fund-level administrative services under an investment management agreement. Under the investment management agreement, Funds Management is responsible for, among other services, implementing the investment objectives and strategies of the Fund, supervising the subadviser and providing fund-level administrative services in connection with the Fund’s operations. As compensation for its services under the investment management agreement, Funds Management is entitled to receive a management fee at the following annual rate based on the Fund’s average daily net assets:
| | | | |
| |
| Average daily net assets | | Management fee | |
| |
First $500 million | | | 0.750 | % |
| |
Next $500 million | | | 0.725 | |
| |
Next $1 billion | | | 0.700 | |
| |
Next $2 billion | | | 0.675 | |
| |
Next $1 billion | | | 0.650 | |
| |
Next $5 billion | | | 0.640 | |
| |
Next $2 billion | | | 0.630 | |
| |
Next $4 billion | | | 0.620 | |
| |
Over $16 billion | | | 0.610 | |
20 | Wells Fargo Opportunity Fund
Notes to financial statements (unaudited)
For the six months ended March 31, 2020, the management fee was equivalent to an annual rate of 0.72% of the Fund’s average daily net assets.
Funds Management has retained the services of a subadviser to provide daily portfolio management to the Fund. The fee for subadvisory services is borne by Funds Management. Wells Capital Management Incorporated (“WellsCap”), an affiliate of Funds Management and an indirect wholly owned subsidiary of Wells Fargo, is the subadviser to the Fund and is entitled to receive a fee from Funds Management at an annual rate starting at 0.45% and declining to 0.30% as the average daily net assets of the Fund increase.
Administration fees
Under a class-level administration agreement, Funds Management provides class-level administrative services to the Fund, which includes paying fees and expenses for services provided by the transfer agent,sub-transfer agents, omnibus account servicers and record-keepers. As compensation for its services under the class-level administration agreement, Funds Management receives an annual fee which is calculated based on the average daily net assets of each class as follows:
| | | | |
| |
| | | Class-level
administration fee | |
| |
Class A, Class C | | | 0.21 | % |
| |
Administrator Class, Institutional Class | | | 0.13 | |
Waivers and/or expense reimbursements
Funds Management has contractually waived and/or reimbursed management and administration fees to the extent necessary to maintain certain net operating expense ratios for the Fund. When each class of the Fund has exceeded its expense cap, Funds Management has waived fees and/or reimbursed expenses from fund-level expenses on a proportionate basis and then from class specific expenses. When only certain classes exceed their expense caps, waivers and/or reimbursements are applied against class specific expenses before fund-level expenses. Funds Management has committed through January 31, 2021 to waive fees and/or reimburse expenses to the extent necessary to cap the Fund’s expenses at 1.18% for Class A shares, 1.93% for Class C shares, 1.00% for Administrator Class, and 0.75% for Institutional Class shares. Prior to or after the commitment expiration date, the cap may be increased or the commitment to maintain the cap may be terminated only with the approval of the Board of Trustees
Distribution fee
The Trust has adopted a distribution plan for Class C shares of the Fund pursuant to Rule12b-1 under the 1940 Act. A distribution fee is charged to Class C shares and paid to Wells Fargo Funds Distributor, LLC (“Funds Distributor”), the principal underwriter, at an annual rate of 0.75% of the average daily net assets of Class C shares.
In addition, Funds Distributor is entitled to receive thefront-end sales charge from the purchase of Class A shares and a contingent deferred sales charge on the redemption of certain Class A shares. Funds Distributor is also entitled to receive the contingent deferred sales charges from redemptions of Class C shares. For the six months ended March 31, 2020, Funds Distributor received $2,667 from the sale of Class A shares and $53 in contingent deferred sales charges from redemptions of Class C shares. No contingent deferred sales charges were incurred by Class A shares for the six months ended March 31, 2020.
Shareholder servicing fees
The Trust has entered into contracts with one or more shareholder servicing agents, whereby Class A, Class C, and Administrator Class of the Fund are charged a fee at an annual rate of 0.25% of the average daily net assets of each respective class. A portion of these total shareholder servicing fees were paid to affiliates of Wells Fargo.
Interfund transactions
The Fund may purchase or sell portfolio investment securities to certain other Wells Fargo affiliates pursuant to Rule17a-7 under the 1940 Act and under procedures adopted by the Board of Trustees. The procedures have been designed to ensure that these interfund transactions, which do not incur broker commissions, are effected at current market prices.
5. INVESTMENT PORTFOLIO TRANSACTIONS
Purchases and sales of investments, excluding U.S. government obligations (if any) and short-term securities, for the six months ended March 31, 2020 were $385,066,731 and $487,854,549, respectively.
Wells Fargo Opportunity Fund | 21
Notes to financial statements (unaudited)
6. SECURITIES LENDING TRANSACTIONS
The Fund lends its securities through an unaffiliated securities lending agent and receives collateral in the form of cash or securities with a value at least equal to the value of the securities on loan. The value of the loaned securities is determined at the close of each business day and any increases or decreases in the required collateral are exchanged between the Fund and the counterparty on the next business day. Cash collateral received is invested in the Securities Lending Fund which seeks to provide a positive return compared to the daily Fed Funds Open Rate by investing in high-quality, U.S. dollar-denominated short-term money market instruments and is exempt from registration under Section 3(c)(7) of the 1940 Act. Securities Lending Fund is managed by Funds Management and is subadvised by WellsCap. Funds Management receives an advisory fee starting at 0.05% and declining to 0.01% as the average daily net assets of the Securities Lending Fund increase. All of the fees received by Funds Management are paid to WellsCap for its services as subadviser.
In the event of counterparty default or the failure of a borrower to return a loaned security, the Fund has the right to use the collateral to offset any losses incurred. As of March 31, 2020, the Fund did not have any securities on loan.
7. BANK BORROWINGS
The Trust (excluding the money market funds), Wells Fargo Master Trust and Wells Fargo Variable Trust are parties to a $280,000,000 revolving credit agreement whereby the Fund is permitted to use bank borrowings for temporary or emergency purposes, such as to fund shareholder redemption requests. Interest under the credit agreement is charged to the Fund based on a borrowing rate equal to the higher of the Federal Funds rate in effect on that day plus 1.25% or the overnight LIBOR rate in effect on that day plus 1.25%. In addition, an annual commitment fee equal to 0.25% of the unused balance is allocated to each participating fund.
For the six months ended March 31, 2020, there were no borrowings by the Fund under the agreement.
8. INDEMNIFICATION
Under the Trust’s organizational documents, the officers and Trustees have been granted certain indemnification rights against certain liabilities that may arise out of performance of their duties to the Trust. Additionally, in the normal course of business, the Trust may enter into contracts with service providers that contain a variety of indemnification clauses. The Trust’s maximum exposure under these arrangements is dependent on future claims that may be made against the Fund and, therefore, cannot be estimated.
9. NEW ACCOUNTING PRONOUNCEMENT
In August 2018, FASB issued Accounting Standards Update (“ASU”)No. 2018-13, Fair Value Measurement (Topic 820)Disclosure Framework—Changes to the Disclosure Requirements for Fair Value Measurement. ASU2018-13 updates the disclosure requirements for fair value measurements by modifying or removing certain disclosures and adding certain new disclosures. The amendments are effective for fiscal years, and interim periods within those fiscal years, beginning after December 15, 2019. Early adoption is permitted. Management has adopted the removal and modification of disclosures early, as permitted, and will adopt the additional new disclosures at the effective date.
10. CORONAVIRUS(COVID-19) PANDEMIC
On March 11, 2020, the World Health Organization announced that it had made the assessment that coronavirus disease 2019(“COVID-19”) is a pandemic. The impacts ofCOVID-19 are adversely affecting the entire global economy, individual companies and investment products, and the market in general. There is significant uncertainty around the extent and duration of business disruptions related toCOVID-19 and the impacts may be short term or may last for an extended period of time. The risk of further spreading ofCOVID-19 has led to significant uncertainty and volatility in the financial markets. The value of the Fund and the securities in which the Fund invests have generally been adversely affected by impacts caused byCOVID-19.
22 | Wells Fargo Opportunity Fund
Other information (unaudited)
PROXY VOTING INFORMATION
A description of the policies and procedures used to determine how to vote proxies relating to portfolio securities is available, upon request, by calling1-800-222-8222, visiting our website atwfam.com, or visiting the SEC website at sec.gov. Information regarding how the proxies related to portfolio securities were voted during the most recent12-month period ended June 30 is available on the website atwfam.comor by visiting the SEC website at sec.gov.
QUARTERLY PORTFOLIO HOLDINGS INFORMATION
The Fund files its complete schedule of portfolio holdings with the SEC for the first and third quarters of each fiscal year as an exhibit to its reports on FormN-PORT. Shareholders may view the filed FormN-PORT by visiting the SEC website at sec.gov.
Wells Fargo Opportunity Fund | 23
Other information (unaudited)
BOARD OF TRUSTEES AND OFFICERS
Each of the Trustees and Officers1 listed in the table below acts in identical capacities for each fund in the Wells Fargo family of funds, which consists of 147 mutual funds comprising the Wells Fargo Funds Trust, Wells Fargo Variable Trust, Wells Fargo Master Trust and fourclosed-end funds (collectively the “Fund Complex”). This table should be read in conjunction with the Prospectus and the Statement of Additional Information2. The mailing address of each Trustee and Officer is 525 Market Street, 12th Floor, San Francisco, CA 94105. Each Trustee and Officer serves an indefinite term, however, each Trustee serves such term until reaching the mandatory retirement age established by the Trustees.
Independent Trustees
| | | | | | |
Name and year of birth | | Position held and
length of service* | | Principal occupations during past five years or longer | | Current other
public company or
investment company directorships |
| | | |
William R. Ebsworth (Born 1957) | | Trustee, since 2015 | | Retired. From 1984 to 2013, equities analyst, portfolio manager, research director and chief investment officer at Fidelity Management and Research Company in Boston, Tokyo, and Hong Kong, and retired in 2013 as Chief Investment Officer of Fidelity Strategic Advisers, Inc. where he led a team of investment professionals managing client assets. Prior thereto, Board member of Hong Kong Securities Clearing Co., Hong Kong Options Clearing Corp., the Empire Fidelity Investments Life Insurance Company. Audit Committee Chair and Investment Committee Chair of the Vincent Memorial Hospital Endowment(non-profit organization). Mr. Ebsworth is a CFA® charterholder. | | N/A |
| | | |
Jane A. Freeman (Born 1953) | | Trustee, since 2015; Chair Liaison, since 2018 | | Retired. From 2012 to 2014 and 1999 to 2008, Chief Financial Officer of Scientific Learning Corporation. From 2008 to 2012, Ms. Freeman provided consulting services related to strategic business projects. Prior to 1999, Portfolio Manager at Rockefeller & Co. and Scudder, Stevens & Clark. Board member of the Harding Loevner Funds from 1996 to 2014, serving as both Lead Independent Director and chair of the Audit Committee. Board member of the Russell Exchange Traded Funds Trust from 2011 to 2012 and the chair of the Audit Committee. Ms. Freeman is a Board Member of The Ruth Bancroft Garden(non-profit organization). She is also an inactive Chartered Financial Analyst. | | N/A |
| | | |
Isaiah Harris, Jr. (Born 1952) | | Trustee, since 2009; Audit Committee Chairman, since 2019 | | Retired. Chairman of the Board of CIGNA Corporation since 2009, and Director since 2005. From 2003 to 2011, Director of Deluxe Corporation. Prior thereto, President and CEO of BellSouth Advertising and Publishing Corp. from 2005 to 2007, President and CEO of BellSouth Enterprises from 2004 to 2005 and President of BellSouth Consumer Services from 2000 to 2003. Emeritus member of the Iowa State University Foundation Board of Governors. Emeritus Member of the Advisory Board of Iowa State University School of Business. Advisory Board Member, Palm Harbor Academy (private school). Advisory Board Member, Child Evangelism Fellowship(non-profit). Mr. Harris is a certified public accountant (inactive status). | | CIGNA Corporation |
| | | |
Judith M. Johnson (Born 1949) | | Trustee, since 2008; Audit Committee Chairman, from 2009 to 2018 | | Retired. Prior thereto, Chief Executive Officer and Chief Investment Officer of Minneapolis Employees Retirement Fund from 1996 to 2008. Ms. Johnson is an attorney, certified public accountant and a certified managerial accountant. | | N/A |
24 | Wells Fargo Opportunity Fund
Other information (unaudited)
| | | | | | |
Name and year of birth | | Position held and
length of service* | | Principal occupations during past five years or longer | | Current other
public company or
investment company directorships |
| | | |
David F. Larcker (Born 1950) | | Trustee, since 2009 | | James Irvin Miller Professor of Accounting at the Graduate School of Business, Stanford University, Director of the Corporate Governance Research Initiative and Senior Faculty of The Rock Center for Corporate Governance since 2006. From 2005 to 2008, Professor of Accounting at the Graduate School of Business, Stanford University. Prior thereto, Ernst & Young Professor of Accounting at The Wharton School, University of Pennsylvania from 1985 to 2005. | | N/A |
| | | |
Olivia S. Mitchell (Born 1953) | | Trustee, since 2006; Nominating and Governance Committee Chair, since 2018 | | International Foundation of Employee Benefit Plans Professor, Wharton School of the University of Pennsylvania since 1993. Director of Wharton’s Pension Research Council and Boettner Center on Pensions & Retirement Research, and Research Associate at the National Bureau of Economic Research. Previously, Cornell University Professor from 1978 to 1993. | | N/A |
| | | |
Timothy J. Penny (Born 1951) | | Trustee, since 1996; Chairman, since 2018 | | President and Chief Executive Officer of Southern Minnesota Initiative Foundation, anon-profit organization, since 2007. Member of the Board of Trustees of NorthStar Education Finance, Inc., anon-profit organization, since 2007. | | N/A |
| | | |
James G. Polisson (Born 1959) | | Trustee, since 2018 | | Retired. Chief Marketing Officer, Source (ETF) UK Services, Ltd, from 2015 to 2017. From 2012 to 2015, Principal of The Polisson Group, LLC, a management consulting, corporate advisory and principal investing company. Chief Executive Officer and Managing Director at Russell Investments, Global Exchange Traded Funds from 2010 to 2012. Managing Director of Barclays Global Investors from 1998 to 2010 and Global Chief Marketing Officer for iShares and Barclays Global Investors from 2000 to 2010. Trustee of the San Francisco Mechanics’ Institute, anon-profit organization, from 2013 to 2015. Board member of the Russell Exchange Traded Fund Trust from 2011 to 2012. Director of Barclays Global Investors Holdings Deutschland GmbH from 2006 to 2009. Mr. Polisson is an attorney and has a retired status with the Massachusetts and District of Columbia Bar Associations. | | N/A |
| | | |
Pamela Wheelock3 (Born 1959) | | Trustee, since January 2020; previously Trustee from January 2018 to July 2019 | | Board member of the Destination Medical Center Economic Development Agency, Rochester, Minnesota since 2019. Acting Commissioner, Minnesota Department of Human Services, July 2019 through September 2019. Human Services Manager (part-time), Minnesota Department of Human Services, October 2019 through December 2019. Chief Operating Officer, Twin Cities Habitat for Humanity from 2017 to 2019. Vice President of University Services, University of Minnesota from 2012 to 2016. Prior thereto, on the Board of Directors, Governance Committee and Finance Committee for the Minnesota Philanthropy Partners (Saint Paul Foundation) from 2012 to 2018, Interim Chief Executive Officer of Blue Cross Blue Shield of Minnesota from 2011 to 2012, Chairman of the Board from 2009 to 2012 and Board Director from 2003 to 2015. Vice President, Leadership and Community Engagement, Bush Foundation, Saint Paul, Minnesota (a private foundation) from 2009 to 2011. Executive Vice President and Chief Financial Officer, Minnesota Sports and Entertainment from 2004 to 2009 and Senior Vice President from 2002 to 2004. Executive Vice President of the Minnesota Wild Foundation from 2004 to 2008. Commissioner of Finance, State of Minnesota, from 1999 to 2002. Currently Board Chair of the Minnesota Wild Foundation since 2010. | | N/A |
| * | Length of service dates reflect the Trustee’s commencement of service with the Trust’s predecessor entities, where applicable. |
Wells Fargo Opportunity Fund | 25
Other information (unaudited)
Officers
| | | | |
Name and year of birth | | Position held and
length of service | | Principal occupations during past five years or longer |
| | |
Andrew Owen (Born 1960) | | President, since 2017 | | Executive Vice President of Wells Fargo & Company and Head of Affiliated Managers, Wells Fargo Asset Management, since 2014. In addition, Mr. Owen is currently President, Chief Executive Officer and Director of Wells Fargo Funds Management, LLC since 2017. Prior thereto, Executive Vice President responsible for marketing, investments and product development for Wells Fargo Funds Management, LLC, from 2009 to 2014. |
| | |
Nancy Wiser1 (Born 1967) | | Treasurer, since 2012 | | Executive Vice President of Wells Fargo Funds Management, LLC since 2011. Chief Operating Officer and Chief Compliance Officer at LightBox Capital Management LLC, from 2008 to 2011. |
| | |
Michelle Rhee (Born 1966) | | Chief Legal Officer, since 2019 | | Secretary of Wells Fargo Funds Management, LLC, Chief Legal Counsel of Wells Fargo Asset Management and Assistant General Counsel of Wells Fargo Bank, N.A. since 2018. Associate General Counsel and Managing Director of Bank of America Corporation from 2004 to 2018. |
| | |
Catherine Kennedy (Born 1969) | | Secretary, since 2019 | | Vice President of Wells Fargo Funds Management, LLC and Senior Counsel of the Wells Fargo Legal Department since 2010. Vice President and Senior Counsel of Evergreen Investment Management Company, LLC from 1998 to 2010. |
| | |
Michael H. Whitaker (Born 1967) | | Chief Compliance Officer, since 2016 | | Chief Compliance Officer of Wells Fargo Asset Management since 2016. Senior Vice President and Chief Compliance Officer for Fidelity Investments from 2007 to 2016. |
| | |
David Berardi (Born 1975) | | Assistant Treasurer, since 2009 | | Vice President of Wells Fargo Funds Management, LLC since 2009. Vice President of Evergreen Investment Management Company, LLC from 2008 to 2010. Manager of Fund Reporting and Control for Evergreen Investment Management Company, LLC from 2004 to 2010. |
| | |
Jeremy DePalma1 (Born 1974) | | Assistant Treasurer, since 2009 | | Senior Vice President of Wells Fargo Funds Management, LLC since 2009. Senior Vice President of Evergreen Investment Management Company, LLC from 2008 to 2010 and head of the Fund Reporting and Control Team within Fund Administration from 2005 to 2010. |
| 1 | Nancy Wiser acts as Treasurer of 65 funds in the Fund Complex. Jeremy DePalma acts as Treasurer of 82 funds and Assistant Treasurer of 65 funds in the Fund Complex. |
| 2 | The Statement of Additional Information includes additional information about the Trustees and is available, without charge, upon request, by calling1-800-222-8222 or by visiting the website atwfam.com. |
| 3 | Pamela Wheelock wasre-appointed to the Board effective January 1, 2020. |
26 | Wells Fargo Opportunity Fund
Appendix I (unaudited)
Effective on or about May 1, 2020, if you purchase Fund shares through a Janney Montgomery Scott LLC (“Janney”) brokerage account, you will be eligible for the following load waivers (front-end sales charge waivers and contingent deferred sales charge (“CDSC”), or back-end sales charge, waivers) and discounts, which may differ from those disclosed elsewhere in the Fund’s Prospectus or SAI.
|
|
| Front-end sales charge* waivers on Class A shares available at Janney |
|
| Shares purchased through reinvestment of capital gains distributions and dividend reinvestment when purchasing shares of the same fund (but not any other fund within the fund family). |
|
| Shares purchased by employees and registered representatives of Janney or its affiliates and their family members as designated by Janney. |
|
| Shares purchased from the proceeds of redemptions within the same fund family, provided (1) the repurchase occurs within ninety (90) days following the redemption, (2) the redemption and purchase occur in the same account, and (3) redeemed shares were subject to a front-end or deferred sales load (i.e., right of reinstatement). |
|
| Employer-sponsored retirement plans (e.g., 401(k) plans, 457 plans, employer-sponsored 403(b) plans, profit sharing and money purchase pension plans and defined benefit plans). For purposes of this provision, employer-sponsored retirement plans do not include SEP IRAs, Simple IRAs, SAR-SEPs or Keogh plans. |
|
| Shares acquired through a right of reinstatement. |
|
| Class C shares that are no longer subject to a contingent deferred sales charge and are converted to Class A shares of the same fund pursuant to Janney’s policies and procedures. |
|
| CDSC waivers on Class A and Class C shares available at Janney |
|
| Shares sold upon the death or disability of the shareholder. |
|
| Shares sold as part of a systematic withdrawal plan as described in the Fund’s Prospectus. |
|
| Shares purchased in connection with a return of excess contributions from an IRA account. |
|
| Shares sold as part of a required minimum distribution for IRA and retirement accounts if the redemption is taken in or after the year the shareholder reaches qualified age based on applicable IRS regulations. |
|
| Shares sold to pay Janney fees but only if the transaction is initiated by Janney. |
|
| Shares acquired through a right of reinstatement. |
|
| Shares exchanged into the same share class of a different fund. |
|
| Front-end sales charge* discounts available at Janney; breakpoints, rights of accumulation and/or letters of intent |
|
| Breakpoints as described in the Fund’s Prospectus. |
|
| Rights of accumulation (“ROA”), which entitle shareholders to breakpoint discounts, will be automatically calculated based on the aggregated holding of fund family assets held by accounts within the purchaser’s household at Janney. Eligible fund family assets not held at Janney may be included in the ROA calculation only if the shareholder notifies his or her financial advisor about such assets. |
|
| Letters of intent which allow for breakpoint discounts based on anticipated purchases within a fund family, over a 13-month time period. Eligible fund family assets not held at Janney Montgomery Scott may be included in the calculation of letters of intent only if the shareholder notifies his or her financial advisor about such assets. |
| * | Also referred to as an “initial sales charge.” |
Wells Fargo Opportunity Fund | 27
Appendix II (unaudited)
Effective on or after May 1, 2020, clients of Edward Jones (also referred to as “shareholders”) purchasing Fund shares on the Edward Jones commission and fee-based platforms are eligible only for the following sales charge discounts (also referred to as “breakpoints”) and waivers, which can differ from breakpoints and waivers described elsewhere in this Prospectus or SAI or through another broker-dealer. In all instances, it is the shareholder’s responsibility to inform Edward Jones at the time of purchase of any relationship, holdings of Wells Fargo Funds or other facts qualifying the purchaser for breakpoints or waivers. Edward Jones can ask for documentation of such circumstance.
|
| Breakpoints available at Edward Jones |
|
| Rights of Accumulation (ROA) |
|
The applicable sales charge on a purchase of Class A shares is determined by taking into account all share classes (except any money market funds and retirement plan share classes) of Wells Fargo Funds held by the shareholder or in an account grouped by Edward Jones with other accounts for the purpose of providing certain pricing considerations (“pricing groups”). This includes all share classes held on the Edward Jones platform and/or held on another platform. The inclusion of eligible fund family assets in the rights of accumulation calculation is dependent on the shareholder notifying his or her financial advisor of such assets at the time of calculation. |
|
ROA is determined by calculating the higher of cost or market value (current shares x NAV). |
|
| Letter of Intent (LOI) |
|
Through a LOI, shareholders can receive the sales charge and breakpoint discounts for purchases shareholders intend to makeover a 13-month period from the date Edward Jones receives the LOI. The LOI is determined by calculating the higher of cost or market value of qualifying holdings at LOI initiation in combination with the value that the shareholder intends to buy over a 13-month period to calculate the front-end sales charge and any breakpoint discounts. Each purchase the shareholder makes during that 13-month period will receive the sales charge and breakpoint discount that applies to the total amount. The inclusion of eligible fund family assets in the LOI calculation is dependent on the shareholder notifying his or her financial advisor of such assets at the time of calculation. Purchases made before the LOI is received by Edward Jones are not covered under the LOI and will not reduce the sales charge previously paid. Sales charges will be adjusted if LOI is not met. |
| Sales charges are waived for the following shareholders and in the following situations at Edward Jones: |
● Associates of Edward Jones and its affiliates and their family members who are in the same pricing group (as determined by Edward Jones under its policies and procedures) as the associate. This waiver will continue for the remainder of the associate’s life if the associate retires from Edward Jones in good-standing. |
● Shares purchased in an Edward Jones fee-based program. |
● Shares purchased through reinvestment of capital gains distributions and dividend reinvestment. |
● Shares purchased from the proceeds of redeemed shares of the same fund family so long as the following conditions are met: 1)the proceeds are from the sale of shares within 60 days of the purchase, and 2) the sale and purchase are made in the same share class and the same account or the purchase is made in an individual retirement account with proceeds from liquidations in anon-retirement account. |
● Shares exchanged into Class A shares from another share class so long as the exchange is into the same fund and was initiated at the discretion of Edward Jones. Edward Jones is responsible for any remaining CDSC due to the fund company, if applicable. Any future purchases are subject to the applicable sales charge as disclosed in the prospectus. |
● Exchanges from Class C shares to Class A shares of the same fund, generally, in the 84th month following the anniversary of the purchase date or earlier at the discretion of Edward Jones. |
If the shareholder purchases shares that are subject to a CDSC and those shares are redeemed before the CDSC is expired, the shareholder is
responsible to pay the CDSC except in the following conditions available at Edward Jones: |
● The death or disability of the shareholder. |
● Systematic withdrawals with up to 10% per year of the account value. |
● Return of excess contributions from an Individual Retirement Account (IRA). |
● Shares sold as part of a required minimum distribution for IRA and retirement accounts if the redemption is taken in or after the year the shareholder reaches qualified age based on applicable IRS regulation. |
● Shares sold to pay Edward Jones fees or costs in such cases where the transaction is initiated by Edward Jones. |
● Shares exchanged in an Edward Jones fee-based program. |
● Shares acquired through NAV reinstatement. |
28 | Wells Fargo Opportunity Fund
Appendix II (unaudited)
|
| Other Important Information for accounts at Edward Jones: |
Minimum Purchase Amounts ● $250 initial purchase minimum ● $50 subsequent purchase minimum |
Minimum Balances Edward Jones has the right to redeem at its discretion fund holdings with a balance of $250 or less. The following are examples of accounts that are not included in this policy: ● A fee-based account held on an Edward Jones platform ● A 529 account held on an Edward Jones platform ● An account with an active systematic investment plan or letter of intent (LOI) |
Changing Share Classes At any time it deems necessary, Edward Jones has the authority to exchange at NAV a shareholder’s holdings in a fund to Class A shares. |
Wells Fargo Opportunity Fund | 29
This page is intentionally left blank.
This page is intentionally left blank.
This page is intentionally left blank.

For more information
More information about Wells Fargo Funds is available free upon request. To obtain literature, please write, visit the Fund’s website, or call:
Wells Fargo Funds
P.O. Box 219967
Kansas City, MO 64121-9967
Website:wfam.com
Individual investors:1-800-222-8222
Retail investment professionals:1-888-877-9275
Institutional investment professionals:1-866-765-0778

This report and the financial statements contained herein are submitted for the general information of the shareholders of the Fund. If this report is used for promotional purposes, distribution of the report must be accompanied or preceded by a current prospectus. Before investing, please consider the investment objectives, risks, charges, and expenses of the investment. For a current prospectus and, if available, a summary prospectus, containing this information, call1-800-222-8222 or visit the Fund’s website atwfam.com. Read the prospectus carefully before you invest or send money.
Wells Fargo Asset Management (WFAM) is the trade name for certain investment advisory/management firms owned by Wells Fargo & Company. These firms include but are not limited to Wells Capital Management Incorporated and Wells Fargo Funds Management, LLC. Certain products managed by WFAM entities are distributed by Wells Fargo Funds Distributor, LLC (a broker-dealer and Member FINRA).
This material is for general informational and educational purposes only and is NOT intended to provide investment advice or a recommendation of any kind—including a recommendation for any specific investment, strategy, or plan.
INVESTMENT PRODUCTS: NOT FDIC INSURED ◾ NO BANK GUARANTEE ◾ MAY LOSE VALUE
© 2020 Wells Fargo & Company. All rights reserved.
PAR-0420-06264 05-20
SA232/SAR232 03-20
Semi-Annual Report
March 31, 2020
Wells Fargo
Special Mid Cap Value Fund
Beginning on January 1, 2021, as permitted by new regulations adopted by the Securities and Exchange Commission, paper copies of the Wells Fargo Funds’ annual and semi-annual shareholder reports issued after this date will no longer be sent by mail, unless you specifically request paper copies of the reports. Instead, the reports will be made available on the Funds’ website, and you will be notified by mail each time a report is posted and provided with a website address to access the report.
If you already elected to receive shareholder reports electronically, you will not be affected by this change and you need not take any action. You may elect to receive shareholder reports and other communications from the Fund electronically at any time by contacting your financial intermediary (such as a broker-dealer or bank) or, if you are a direct investor, by calling1-800-222-8222 or by enrolling at wellsfargo.com/advantagedelivery.
You may elect to receive all future reports in paper free of charge. If you invest through a financial intermediary, you can contact your financial intermediary to request that you continue to receive paper copies of your shareholder reports; if you invest directly with the Fund, you can call 1-800-222-8222. Your election to receive reports in paper will apply to all Wells Fargo Funds held in your account with your financial intermediary or, if you are a direct investor, to all Wells Fargo Funds that you hold.
|
|
|
Reduce clutter. Save trees. |
Sign up for electronic delivery of prospectuses and shareholder reports atwellsfargo.com/advantagedelivery |
The views expressed and any forward-looking statements are as of March 31, 2020, unless otherwise noted, and are those of the Fund managers and/or Wells Fargo Asset Management. Discussions of individual securities, or the markets generally, or any Wells Fargo Fund are not intended as individual recommendations. Future events or results may vary significantly from those expressed in any forward-looking statements. The views expressed are subject to change at any time in response to changing circumstances in the market. Wells Fargo Asset Management and the Fund disclaim any obligation to publicly update or revise any views expressed or forward-looking statements.
INVESTMENT PRODUCTS: NOT FDIC INSURED ◾ NO BANK GUARANTEE ◾ MAY LOSE VALUE
Wells Fargo Special Mid Cap Value Fund | 1
Letter to shareholders (unaudited)

Andrew Owen
President
Wells Fargo Funds
“The period began with mixed data, leading to central bank support.”
Dear Shareholder:
We are pleased to offer you this semi-annual report for the Wells Fargo Special Mid Cap Value Fund for thesix-month period that ended March 31, 2020. Global stock markets saw earlier gains erased in February and March as governments took unprecedented measures to stop the spread of the coronavirus at the expense of short-term economic output. Fixed-income markets were less battered, with U.S. government bonds achieving modest gains as central banks attempted to bolster capital markets and confidence.
For the period, U.S. stocks, based on the S&P 500 Index,1 returned-12.31% and international stocks, as measured by the MSCI ACWI ex USA Index (Net),2 fell 16.52%. The MSCI EM Index (Net)3 lost 14.55%. For bond investors, the Bloomberg Barclays U.S. Aggregate Bond Index4 added 3.33%, the Bloomberg Barclays Global Aggregateex-USD Index5 returned-2.03%, the Bloomberg Barclays Municipal Bond Index6 gained a modest 0.10%, and the ICE BofA U.S. High Yield Index7 returned-10.86%.
The period began with mixed data, leading to central bank support.
As the fourth quarter of 2019 started, U.S.-China trade tensions were relaxing while optimism grew for a U.K. Brexit deal. The initial estimate of U.S. third-quarter gross domestic product growth was a resilient 1.9% annualized rate, while the U.S. unemployment rate fell to a50-year low of 3.5% in September. Despite resilience among U.S. consumers, however, business confidence declined while manufacturing activity contracted. Concerned with a potential economic slowdown, the U.S. Federal Reserve (Fed) lowered interest rates a quarter point in late October—its third rate cut in four months. This helped push the S&P 500 Index to anall-time high while emerging market equities rallied and global bonds declined overall, reflecting a broad pickup in risk appetite.
Equity markets rallied in November despite ongoing geopolitical risks. Hopes for a U.S.-China trade deal buoyed investor confidence. U.S. business sentiment edged up, and manufacturing and services activity rose. With that positive backdrop, developed market equities outpaced those in emerging markets, and U.S. stocks outperformednon-U.S. stocks overall. While consumer confidence and purchasing manager activity rose in the eurozone, China reported weakening manufacturing and consumer data. Bond yields rose marginally, leading to slightly negative returns for global government and investment-grade corporate bonds.
Financial markets ended 2019 with a boost from the U.S. and China accord on a Phase One trade deal. That, along with the landslide win by thepro-Brexit U.K. Conservative
| 1 | The S&P 500 Index consists of 500 stocks chosen for market size, liquidity, and industry group representation. It is a market-value-weighted index with each stock’s weight in the index proportionate to its market value. You cannot invest directly in an index. |
| 2 | The Morgan Stanley Capital International (MSCI) All Country World Index (ACWI) ex USA Index (Net) is a free-float-adjusted market-capitalization-weighted index that is designed to measure the equity market performance of developed markets, excluding the United States. Source: MSCI. MSCI makes no express or implied warranties or representations and shall have no liability whatsoever with respect to any MSCI data contained herein. The MSCI data may not be further redistributed or used as a basis for other indices or any securities or financial products. This report is not approved, reviewed, or produced by MSCI. You cannot invest directly in an index. |
| 3 | The MSCI Emerging Markets (EM) Index (Net) is a free-float-adjusted market-capitalization-weighted index that is designed to measure equity market performance of emerging markets. You cannot invest directly in an index. |
| 4 | The Bloomberg Barclays U.S. Aggregate Bond Index is a broad-based benchmark that measures the investment-grade, U.S. dollar-denominated, fixed-rate taxable bond market, including Treasuries, government-related and corporate securities, mortgage-backed securities (agency fixed-rate and hybrid adjustable-rate mortgage pass-throughs), asset-backed securities, and commercial mortgage-backed securities. You cannot invest directly in an index. |
| 5 | The Bloomberg Barclays Global Aggregateex-USD Index is an unmanaged index that provides a broad-based measure of the global investment-grade fixed-income markets excluding the U.S. dollar-denominated debt market. You cannot invest directly in an index. |
| 6 | The Bloomberg Barclays Municipal Bond Index is an unmanaged index composed of long-termtax-exempt bonds with a minimum credit rating of Baa. You cannot invest directly in an index. |
| 7 | The ICE BofA U.S. High Yield Index is a market-capitalization-weighted index of domestic and Yankee high-yield bonds. The index tracks the performance of high-yield securities traded in the U.S. bond market. You cannot invest directly in an index. Copyright 2020. ICE Data Indices, LLC. All rights reserved. |
2 | Wells Fargo Special Mid Cap Value Fund
Letter to shareholders (unaudited)
Party in a national election and ongoing central bank support, gave investors greater confidence. U.S. economic indicators were positive overall, with the exception of manufacturing activity and business confidence. Consumer confidence was resilient, fed by a robust labor market, tame inflation, and lower interest rates, which boosted housing affordability and stimulated homebuyer activity. The impeachment of U.S. President Donald Trump had little impact on markets. Meanwhile, slowing Chinese economic activity, partly attributable to the trade war, led to further government stimulus atyear-end through lower reserve ratios, allowing banks to lend more money.
Theyear-end rally continued in early January 2020. However, capital market volatility spiked in late January on concerns over the potential impact of the coronavirus on the global economy and stock markets. With sentiment somewhat souring, perceived safe havens did well in January. The U.S. dollar and Japanese yen both rose, and government bonds outperformed equities. While the S&P 500 Index held its ground, emerging market equities tumbled, including those in Asia.
In February, the coronavirus became the major market focus. Fears of the virus’s impact on global growth led to expectations of increased global central bank monetary policy support. That led the10-year U.S. Treasury yield to fall to anall-time low of 1.1% by the end of the month. Although equity markets initially shrugged off concerns about the outbreak, focusing instead on strong fourth-quarter earnings and improving business confidence in January, market sentiment turned sharply lower towardmonth-end. Oil prices tumbled as Russia and the Organization of the Petroleum Exporting Countries compounded a major decline in oil demand with a brutal price war, causing the price of West Texas Intermediate crude oil to fall 13% in February alone.
The global spread of the coronavirus led many countries to clamp down on social and business-related activity in order to contain the virus from causing even greater devastation and overwhelming the health care system. This abrupt stoppage of economic activity led to the sharp deceleration of global output, sending economies into a deep contraction. Central bank responses were swift, as they slashed interest rates and expanded quantitative easing programs to restore liquidity and confidence to the markets. In the U.S., the Fed launched several lending programs, funding investment-grade bonds, money market mutual funds, and commercial paper while purchasing Treasuries, mortgage-backed securities, and overnight repos. Meanwhile, stock markets tumbled quickly into a bear market, ending the longest bull stock market in U.S. history.
Don’t let short-term uncertainty derail long-term investment goals.
Periods of investment uncertainty can present challenges, but experience has taught us that maintaining long-term investment goals can be an effective way to plan for the future. To help you create a sound strategy based on your personal goals and risk tolerance, Wells Fargo Funds offers more than 100 mutual funds spanning a wide range of asset classes and investment styles. Although diversification cannot guarantee an investment profit or prevent losses, we believe it can be an effective way to manage investment risk and potentially smooth out overall portfolio performance. We encourage investors to know their investments and to understand that appropriate levels of risk-taking may unlock opportunities.
Thank you for choosing to invest with Wells Fargo Funds. We appreciate your confidence in us and remain committed to helping you meet your financial needs.
Sincerely,

Andrew Owen
President
Wells Fargo Funds
“Capital market volatility spiked in late January on concerns over the potential impact of the coronavirus on the global economy and stock markets.”
|
|
|
For further information about your Fund, contact your investment professional, visit our website at wfam.com, or call us directly at1-800-222-8222. |
Wells Fargo Special Mid Cap Value Fund | 3
Performance highlights (unaudited)
Investment objective
The Fund seeks long-term capital appreciation.
Manager
Wells Fargo Funds Management, LLC
Subadviser
Wells Capital Management Incorporated
Portfolio managers
James M. Tringas, CFA®‡
Bryant VanCronkhite, CFA®‡, CPA
Shane Zweck, CFA®‡
Average annual total returns (%) as of March 31, 2020
| | | | | | | | | | | | | | | | | | | | | | | | | | | | | | | | | | |
| | | | |
| | | | | Including sales charge | | | Excluding sales charge | | | Expense ratios1 (%) | |
| | | | | | | | | |
| | | Inception date | | 1 year | | | 5 year | | | 10 year | | | 1 year | | | 5 year | | | 10 year | | | Gross | | | Net2 | |
| | | | | | | | | | |
| Class A (WFPAX) | | 7-31-2007 | | | -25.10 | | | | -1.14 | | | | 7.07 | | | | -20.53 | | | | 0.04 | | | | 7.71 | | | | 1.15 | | | | 1.15 | |
| | | | | | | | | | |
| Class C (WFPCX) | | 7-31-2007 | | | -22.10 | | | | -0.71 | | | | 6.90 | | | | -21.10 | | | | -0.71 | | | | 6.90 | | | | 1.90 | | | | 1.90 | |
| | | | | | | | | | |
| Class R (WFHHX)3 | | 9-30-2015 | | | – | | | | – | | | | – | | | | -20.72 | | | | -0.21 | | | | 7.45 | | | | 1.40 | | | | 1.40 | |
| | | | | | | | | | |
| Class R6 (WFPRX)4 | | 6-28-2013 | | | – | | | | – | | | | – | | | | -20.16 | | | | 0.47 | | | | 8.17 | | | | 0.72 | | | | 0.72 | |
| | | | | | | | | | |
| Administrator Class (WFMDX) | | 4-8-2005 | | | – | | | | – | | | | – | | | | -20.45 | | | | 0.12 | | | | 7.82 | | | | 1.07 | | | | 1.07 | |
| | | | | | | | | | |
| Institutional Class (WFMIX) | | 4-8-2005 | | | – | | | | – | | | | – | | | | -20.27 | | | | 0.37 | | | | 8.10 | | | | 0.82 | | | | 0.82 | |
| | | | | | | | | | |
| Russell Midcap® Value Index5 | | – | | | – | | | | – | | | | – | | | | -24.13 | | | | -0.76 | | | | 7.22 | | | | – | | | | – | |
Figures quoted represent past performance, which is no guarantee of future results, and do not reflect taxes that a shareholder may pay on an investment in a fund. Investment return and principal value of an investment will fluctuate so that an investor’s shares, when redeemed, may be worth more or less than their original cost. Performance shown without sales charges would be lower if sales charges were reflected. Current performance may be lower or higher than the performance data quoted, which assumes the reinvestment of dividends and capital gains. Currentmonth-end performance is available on the Fund’s website, wfam.com.
Index returns do not include transaction costs associated with buying and selling securities, any mutual fund fees or expenses, or any taxes. It is not possible to invest directly in an index.
For Class A shares, the maximumfront-end sales charge is 5.75%. For Class C shares, the maximum contingent deferred sales charge is 1.00%. Performance including a contingent deferred salescharge assumes the sales charge for the corresponding time period. Class R, Class R6, Administrator Class, and Institutional Class shares are sold without afront-end sales charge or contingent deferred sales charge.
Stock values fluctuate in response to the activities of individual companies and general market and economic conditions. Smaller-company stocks tend to be more volatile and less liquid than those of larger companies. Consult the Fund’s prospectus for additional information on these and other risks.
Please see footnotes on page 5.
4 | Wells Fargo Special Mid Cap Value Fund
Performance highlights (unaudited)
| | | | |
| |
| Ten largest holdings (%) as of March 31, 20206 | | | |
| | |
Alcon Incorporated | | | 3.16 | |
| | |
Amdocs Limited | | | 3.02 | |
| | |
Brown & Brown Incorporated | | | 2.90 | |
| | |
Reynolds Consumer Products Incorporated | | | 2.88 | |
| | |
Varian Medical Systems Incorporated | | | 2.50 | |
| | |
Kansas City Southern | | | 2.47 | |
| | |
Humana Incorporated | | | 2.44 | |
| | |
Republic Services Incorporated | | | 2.42 | |
| | |
Stanley Black & Decker Incorporated | | | 2.32 | |
| | |
CBRE Group Incorporated Class A | | | 2.29 | |
| | |
|
| Sector distribution as of March 31, 20207 |
|
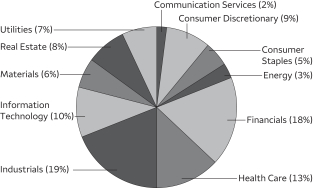 |
| ‡ | CFA® and Chartered Financial Analyst®are trademarks owned by CFA Institute. |
| 1 | Reflects the expense ratios as stated in the most recent prospectuses. The expense ratios shown are subject to change and may differ from the annualized expense ratios shown in the financial highlights of this report. |
| 2 | The manager has contractually committed through January 31, 2021, to waive fees and/or reimburse expenses to the extent necessary to cap total annual fund operating expenses after fee waivers at 1.16% for Class A, 1.91% for Class C, 1.41% for Class R, 0.73% for Class R6, 1.08% for Administrator Class, and 0.83% for Institutional Class. Brokerage commissions, stamp duty fees, interest, taxes, acquired fund fees and expenses (if any), and extraordinary expenses are excluded from the expense cap. Prior to or after the commitment expiration date, the cap may be increased or the commitment to maintain the cap may be terminated only with the approval of the Board of Trustees. Without this cap, the Fund’s returns would have been lower. The expense ratio paid by an investor is the net expense ratio (the total annual fund operating expenses after fee waivers) as stated in the prospectuses. |
| 3 | Historical performance shown for the Class R shares prior to their inception reflects the performance of the Institutional Class shares, adjusted to reflect the higher expenses applicable to the Class R shares. |
| 4 | Historical performance shown for the Class R6 shares prior to their inception reflects the performance of the Institutional Class shares, and includes the higher expenses applicable to the Institutional Class shares. If these expenses had not been included, the returns for the Class R6 shares would be higher. |
| 5 | The Russell Midcap® Value Index measures the performance of those Russell Midcap companies with lower price/book ratios and lower forecasted growth values. The stocks are also members of the Russell 1000® Value Index. You cannot invest directly in an index. |
| 6 | The ten largest holdings, excluding cash, cash equivalents and any money market funds, are calculated based on the value of the investments divided by total net assets of the Fund. Holdings are subject to change and may have changed since the date specified. |
| 7 | Amounts are calculated based on the total long-term investments of the Fund. These amounts are subject to change and may have changed since the date specified. |
Wells Fargo Special Mid Cap Value Fund | 5
Fund expenses (unaudited)
As a shareholder of the Fund, you incur two types of costs: (1) transaction costs, including sales charges (loads) on purchase payments and contingent deferred sales charges (if any) on redemptions and (2) ongoing costs, including management fees, distribution(12b-1) and/or shareholder servicing fees, and other Fund expenses. This example is intended to help you understand your ongoing costs (in dollars) of investing in the Fund and to compare these costs with the ongoing costs of investing in other mutual funds.
The example is based on an investment of $1,000 invested at the beginning of thesix-month period and held for the entire period from October 1, 2019 to March 31, 2020.
Actual Expenses
The “Actual” line of the table below provides information about actual account values and actual expenses. You may use the information in this line, together with the amount you invested, to estimate the expenses that you paid over the period. Simply divide your account value by $1,000 (for example, an $8,600 account value divided by $1,000 = 8.6), then multiply the result by the number in the “Actual” line under the heading entitled “Expenses paid during period” for your applicable class of shares to estimate the expenses you paid on your account during this period.
Hypothetical Example for Comparison Purposes
The “Hypothetical” line of the table below provides information about hypothetical account values and hypothetical expenses based on the Fund’s actual expense ratio and an assumed rate of return of 5% per year before expenses, which is not the Fund’s actual return. The hypothetical account values and expenses may not be used to estimate the actual ending account balance or expenses you paid for the period. You may use this information to compare the ongoing costs of investing in the Fund and other funds. To do so, compare this 5% hypothetical example with the 5% hypothetical examples that appear in the shareholder reports of the other funds.
Please note that the expenses shown in the table are meant to highlight your ongoing costs only and do not reflect any transactional costs, such as sales charges (loads) and contingent deferred sales charges. Therefore, the “Hypothetical” line of the table is useful in comparing ongoing costs only and will not help you determine the relative total costs of owning different funds. In addition, if these transactional costs were included, your costs would have been higher.
| | | | | | | | | | | | | | | | |
| | | Beginning
account value
10-1-2019 | | | Ending
account value
3-31-2020 | | | Expenses
paid during
the period¹ | | | Annualized net
expense ratio | |
| | | | | |
Class A | | | | | | | | | | | | | | | | |
| | | | |
Actual | | $ | 1,000.00 | | | $ | 736.38 | | | $ | 4.95 | | | | 1.14 | % |
| | | | |
Hypothetical (5% return before expenses) | | $ | 1,000.00 | | | $ | 1,019.30 | | | $ | 5.76 | | | | 1.14 | % |
| | | | | |
Class C | | | | | | | | | | | | | | | | |
| | | | |
Actual | | $ | 1,000.00 | | | $ | 733.72 | | | $ | 8.19 | | | | 1.89 | % |
| | | | |
Hypothetical (5% return before expenses) | | $ | 1,000.00 | | | $ | 1,015.55 | | | $ | 9.52 | | | | 1.89 | % |
| | | | | |
Class R | | | | | | | | | | | | | | | | |
| | | | |
Actual | | $ | 1,000.00 | | | $ | 735.67 | | | $ | 6.03 | | | | 1.39 | % |
| | | | |
Hypothetical (5% return before expenses) | | $ | 1,000.00 | | | $ | 1,018.05 | | | $ | 7.01 | | | | 1.39 | % |
| | | | | |
Class R6 | | | | | | | | | | | | | | | | |
| | | | |
Actual | | $ | 1,000.00 | | | $ | 738.07 | | | $ | 3.09 | | | | 0.71 | % |
| | | | |
Hypothetical (5% return before expenses) | | $ | 1,000.00 | | | $ | 1,021.45 | | | $ | 3.59 | | | | 0.71 | % |
| | | | | |
Administrator Class | | | | | | | | | | | | | | | | |
| | | | |
Actual | | $ | 1,000.00 | | | $ | 736.75 | | | $ | 4.60 | | | | 1.06 | % |
| | | | |
Hypothetical (5% return before expenses) | | $ | 1,000.00 | | | $ | 1,019.70 | | | $ | 5.35 | | | | 1.06 | % |
| | | | | |
Institutional Class | | | | | | | | | | | | | | | | |
| | | | |
Actual | | $ | 1,000.00 | | | $ | 737.55 | | | $ | 3.52 | | | | 0.81 | % |
| | | | |
Hypothetical (5% return before expenses) | | $ | 1,000.00 | | | $ | 1,020.95 | | | $ | 4.09 | | | | 0.81 | % |
| 1 | Expenses paid is equal to the annualized net expense ratio of each class multiplied by the average account value over the period, multiplied by the number of days in the most recent fiscal half-year divided by the number of days in the fiscal year (to reflect theone-half-year period). |
6 | Wells Fargo Special Mid Cap Value Fund
Portfolio of investments—March 31, 2020 (unaudited)
| | | | | | | | | | | | | | | | |
| | | | | | | | | Shares | | | Value | |
| Common Stocks : 94.56% | |
|
Communication Services : 1.97% | |
|
| Media : 1.97% | |
Discovery Communications Incorporated Class C † | | | | | | | | | | | 8,313,200 | | | $ | 145,813,528 | |
| | | | | | | | | | | | | | | | |
|
Consumer Discretionary : 8.01% | |
|
| Auto Components : 1.64% | |
Aptiv plc | | | | | | | | | | | 1,407,400 | | | | 69,300,376 | |
Lear Corporation | | | | | | | | | | | 644,800 | | | | 52,390,000 | |
| | | | |
| | | | | | | | | | | | | | | 121,690,376 | |
| | | | | | | | | | | | | | | | |
|
| Hotels, Restaurants & Leisure : 3.72% | |
Norwegian Cruise Line Holdings Limited † | | | | | | | | | | | 2,253,970 | | | | 24,703,511 | |
Vail Resorts Incorporated | | | | | | | | | | | 606,800 | | | | 89,630,428 | |
Yum China Holdings Incorporated | | | | | | | | | | | 3,785,885 | | | | 161,392,278 | |
| | | | |
| | | | | | | | | | | | | | | 275,726,217 | |
| | | | | | | | | | | | | | | | |
|
| Household Durables : 2.14% | |
D.R. Horton Incorporated | | | | | | | | | | | 2,028,200 | | | | 68,958,800 | |
Mohawk Industries Incorporated † | | | | | | | | | | | 1,178,800 | | | | 89,871,712 | |
| | | | |
| | | | | | | | | | | | | | | 158,830,512 | |
| | | | | | | | | | | | | | | | |
|
| Textiles, Apparel & Luxury Goods : 0.51% | |
PVH Corporation | | | | | | | | | | | 998,900 | | | | 37,598,596 | |
| | | | | | | | | | | | | | | | |
|
Consumer Staples : 4.73% | |
|
| Beverages : 1.86% | |
Molson Coors Brewing Company Class B | | | | | | | | | | | 3,532,176 | | | | 137,790,186 | |
| | | | | | | | | | | | | | | | |
|
| Household Products : 2.87% | |
Reynolds Consumer Products Incorporated | | | | | | | | | | | 7,310,500 | | | | 213,247,285 | |
| | | | | | | | | | | | | | | | |
|
Energy : 2.94% | |
|
| Energy Equipment & Services : 1.04% | |
Baker Hughes Incorporated | | | | | | | | | | | 3,348,434 | | | | 35,158,557 | |
National Oilwell Varco Incorporated | | | | | | | | | | | 4,256,600 | | | | 41,842,378 | |
| | | | |
| | | | | | | | | | | | | | | 77,000,935 | |
| | | | | | | | | | | | | | | | |
|
| Oil, Gas & Consumable Fuels : 1.90% | |
Cimarex Energy Company | | | | | | | | | | | 1,278,200 | | | | 21,512,106 | |
Devon Energy Corporation | | | | | | | | | | | 2,313,800 | | | | 15,988,358 | |
Hess Corporation | | | | | | | | | | | 1,333,700 | | | | 44,412,210 | |
Valero Energy Corporation | | | | | | | | | | | 907,200 | | | | 41,150,592 | |
WPX Energy Incorporated † | | | | | | | | | | | 5,906,700 | | | | 18,015,435 | |
| | | | |
| | | | | | | | | | | | | | | 141,078,701 | |
| | | | | | | | | | | | | | | | |
|
Financials : 17.36% | |
|
| Banks : 4.59% | |
Fifth Third Bancorp | | | | | | | | | | | 6,547,600 | | | | 97,231,860 | |
PacWest Bancorp | | | | | | | | | | | 3,542,400 | | | | 63,479,808 | |
Regions Financial Corporation | | | | | | | | | | | 12,440,100 | | | | 111,587,697 | |
Zions Bancorporation | | | | | | | | | | | 2,531,400 | | | | 67,740,264 | |
| | | | |
| | | | | | | | | | | | | | | 340,039,629 | |
| | | | | | | | | | | | | | | | |
The accompanying notes are an integral part of these financial statements.
Wells Fargo Special Mid Cap Value Fund | 7
Portfolio of investments—March 31, 2020 (unaudited)
| | | | | | | | | | | | | | | | |
| | | | | | | | | Shares | | | Value | |
| Capital Markets : 0.69% | |
Cboe Global Markets Incorporated | | | | | | | | | | | 575,600 | | | $ | 51,372,300 | |
| | | | | | | | | | | | | | | | |
|
| Insurance : 10.79% | |
Arch Capital Group Limited † | | | | | | | | | | | 5,404,808 | | | | 153,820,836 | |
Brown & Brown Incorporated | | | | | | | | | | | 5,935,206 | | | | 214,973,162 | |
Fidelity National Financial Incorporated | | | | | | | | | | | 3,375,914 | | | | 83,992,740 | |
Loews Corporation | | | | | | | | | | | 3,674,000 | | | | 127,965,420 | |
The Allstate Corporation | | | | | | | | | | | 1,698,000 | | | | 155,757,540 | |
Willis Towers Watson plc | | | | | | | | | | | 374,000 | | | | 63,523,900 | |
| | | | |
| | | | | | | | | | | | | | | 800,033,598 | |
| | | | | | | | | | | | | | | | |
|
| Mortgage REITs : 1.29% | |
Annaly Capital Management Incorporated | | | | | | | | | | | 18,851,800 | | | | 95,578,626 | |
| | | | | | | | | | | | | | | | |
|
Health Care : 12.56% | |
|
| Health Care Equipment & Supplies : 7.35% | |
Alcon Incorporated †« | | | | | | | | | | | 4,608,500 | | | | 234,203,970 | |
Varian Medical Systems Incorporated † | | | | | | | | | | | 1,803,400 | | | | 185,137,044 | |
Zimmer Biomet Holdings Incorporated | | | | | | | | | | | 1,241,700 | | | | 125,511,036 | |
| | | | |
| | | | | | | | | | | | | | | 544,852,050 | |
| | | | | | | | | | | | | | | | |
|
| Health Care Providers & Services : 4.02% | |
Humana Incorporated | | | | | | | | | | | 575,900 | | | | 180,844,118 | |
Universal Health Services Incorporated Class B | | | | | | | | | | | 1,181,700 | | | | 117,082,836 | |
| | | | |
| | | | | | | | | | | | | | | 297,926,954 | |
| | | | | | | | | | | | | | | | |
|
| Life Sciences Tools & Services : 1.19% | |
Charles River Laboratories International Incorporated †# | | | | | | | | | | | 699,800 | | | | 88,321,758 | |
| | | | | | | | | | | | | | | | |
|
Industrials : 17.40% | |
|
| Building Products : 1.73% | |
Masco Corporation | | | | | | | | | | | 3,717,800 | | | | 128,524,346 | |
| | | | | | | | | | | | | | | | |
|
| Commercial Services & Supplies : 2.42% | |
Republic Services Incorporated | | | | | | | | | | | 2,387,375 | | | | 179,196,368 | |
| | | | | | | | | | | | | | | | |
|
| Construction & Engineering : 2.13% | |
Jacobs Engineering Group Incorporated | | | | | | | | | | | 1,991,343 | | | | 157,853,760 | |
| | | | | | | | | | | | | | | | |
|
| Industrial Conglomerates : 2.12% | |
Carlisle Companies Incorporated | | | | | | | | | | | 1,253,042 | | | | 156,981,102 | |
| | | | | | | | | | | | | | | | |
|
| Machinery : 3.67% | |
Cummins Incorporated | | | | | | | | | | | 738,800 | | | | 99,974,416 | |
Stanley Black & Decker Incorporated | | | | | | | | | | | 1,722,700 | | | | 172,270,000 | |
| | | | |
| | | | | | | | | | | | | | | 272,244,416 | |
| | | | | | | | | | | | | | | | |
|
| Road & Rail : 2.47% | |
Kansas City Southern | | | | | | | | | | | 1,441,900 | | | | 183,380,842 | |
| | | | | | | | | | | | | | | | |
|
| Trading Companies & Distributors : 2.86% | |
AerCap Holdings NV † | | | | | | | | | | | 4,617,900 | | | | 105,241,941 | |
United Rentals Incorporated † | | | | | | | | | | | 1,037,100 | | | | 106,717,590 | |
| | | | |
| | | | | | | | | | | | | | | 211,959,531 | |
| | | | | | | | | | | | | | | | |
The accompanying notes are an integral part of these financial statements.
8 | Wells Fargo Special Mid Cap Value Fund
Portfolio of investments—March 31, 2020 (unaudited)
| | | | | | | | | | | | | | | | |
| | | | | | | | | Shares | | | Value | |
Information Technology : 9.46% | |
|
| Communications Equipment : 1.27% | |
Juniper Networks Incorporated | | | | | | | | | | | 4,923,100 | | | $ | 94,228,134 | |
| | | | | | | | | | | | | | | | |
|
| Electronic Equipment, Instruments & Components : 0.81% | |
FLIR Systems Incorporated | | | | | | | | | | | 1,887,200 | | | | 60,182,808 | |
| | | | | | | | | | | | | | | | |
|
| IT Services : 4.20% | |
Amdocs Limited | | | | | | | | | | | 4,069,300 | | | | 223,689,421 | |
Euronet Worldwide Incorporated † | | | | | | | | | | | 1,026,600 | | | | 88,000,152 | |
| | | | |
| | | | | | | | | | | | | | | 311,689,573 | |
| | | | | | | | | | | | | | | | |
|
| Semiconductors & Semiconductor Equipment : 1.51% | |
Analog Devices Incorporated | | | | | | | | | | | 1,247,900 | | | | 111,874,235 | |
| | | | | | | | | | | | | | | | |
|
| Software : 0.38% | |
Synopsys Incorporated † | | | | | | | | | | | 215,300 | | | | 27,728,487 | |
| | | | | | | | | | | | | | | | |
|
| Technology Hardware, Storage & Peripherals : 1.29% | |
NCR Corporation † | | | | | | | | | | | 5,404,120 | | | | 95,652,924 | |
| | | | | | | | | | | | | | | | |
|
Materials : 5.70% | |
|
| Chemicals : 2.23% | |
Celanese Corporation Series A | | | | | | | | | | | 437,784 | | | | 32,128,968 | |
PPG Industries Incorporated | | | | | | | | | | | 1,590,000 | | | | 132,924,000 | |
| | | | |
| | | | | | | | | | | | | | | 165,052,968 | |
| | | | | | | | | | | | | | | | |
|
| Containers & Packaging : 2.33% | |
AptarGroup Incorporated | | | | | | | | | | | 654,800 | | | | 65,178,792 | |
International Paper Company | | | | | | | | | | | 11,514 | | | | 358,431 | |
Packaging Corporation of America | | | | | | | | | | | 1,239,513 | | | | 107,626,914 | |
| | | | |
| | | | | | | | | | | | | | | 173,164,137 | |
| | | | | | | | | | | | | | | | |
|
| Metals & Mining : 1.14% | |
Barrick Gold Corporation | | | | | | | | | | | 4,618,400 | | | | 84,609,088 | |
| | | | | | | | | | | | | | | | |
|
Real Estate : 7.91% | |
|
| Equity REITs : 5.63% | |
American Campus Communities Incorporated | | | | | | | | | | | 3,547,705 | | | | 98,448,814 | |
Invitation Homes Incorporated | | | | | | | | | | | 7,223,128 | | | | 154,358,245 | |
Mid-America Apartment Communities Incorporated | | | | | | | | | | | 1,106,600 | | | | 114,012,995 | |
Park Hotels & Resorts Incorporated | | | | | | | | | | | 2,419,000 | | | | 19,134,290 | |
VEREIT Incorporated | | | | | | | | | | | 6,434,100 | | | | 31,462,749 | |
| | | | |
| | | | | | | | | | | | | | | 417,417,093 | |
| | | | | | | | | | | | | | | | |
|
| Real Estate Management & Development : 2.28% | |
CBRE Group Incorporated Class A † | | | | | | | | | | | 4,494,800 | | | | 169,498,908 | |
| | | | | | | | | | | | | | | | |
| | | | |
Utilities : 6.52% | | | | | | | | | | | | | | | | |
| | | | |
| Electric Utilities : 4.27% | | | | | | | | | | | | |
American Electric Power Company Incorporated | | | | | | | | | | | 1,962,660 | | | | 156,973,547 | |
FirstEnergy Corporation | | | | | | | | | | | 3,973,800 | | | | 159,230,166 | |
| | | | |
| | | | | | | | | | | | | | | 316,203,713 | |
| | | | | | | | | | | | | | | | |
The accompanying notes are an integral part of these financial statements.
Wells Fargo Special Mid Cap Value Fund | 9
Portfolio of investments—March 31, 2020 (unaudited)
| | | | | | | | | | | | | | | | |
| | | | | | | | | Shares | | | Value | |
| Water Utilities : 2.25% | | | | | | | | | | | | |
American Water Works Company Incorporated | | | | | | | | | | | 1,398,200 | | | $ | 167,168,792 | |
| | | | | | | | | | | | | | | | |
| | | | |
Total Common Stocks (Cost $8,226,782,329) | | | | | | | | | | | | | | | 7,011,512,476 | |
| | | | | | | | | | | | | | | | |
| | | Yield | | | | | | | | | | |
| Short-Term Investments : 3.30% | | | | | | | | | | | | |
| | | | |
| Investment Companies : 3.30% | | | | | | | | | | | | |
Securities Lending Cash Investments LLC (l)(r)(u) | | | 2.11 | % | | | | | | | 16,292,234 | | | | 16,293,864 | |
Wells Fargo Government Money Market Fund Select Class (l)(u) | | | 0.35 | | | | | | | | 228,242,972 | | | | 228,242,972 | |
| | | | |
Total Short-Term Investments (Cost $244,535,332) | | | | | | | | | | | | | | | 244,536,836 | |
| | | | | | | | | | | | | | | | |
| | | | | | | | |
| Total investments in securities (Cost $8,471,317,661) | | | 97.86 | % | | | 7,256,049,312 | |
| | |
Other assets and liabilities, net | | | 2.14 | | | | 158,812,593 | |
| | | | | | | | |
| Total net assets | | | 100.00 | % | | $ | 7,414,861,905 | |
| | | | | | | | |
| † | Non-income-earning security |
| « | All or a portion of this security is on loan. |
| # | All or a portion of this security is segregated as collateral for investments in derivative instruments. |
| (l) | The issuer of the security is an affiliated person of the Fund as defined in the Investment Company Act of 1940. |
| (r) | The investment is anon-registered investment company purchased with cash collateral received from securities on loan. |
| (u) | The rate represents the7-day annualized yield at period end. |
Abbreviations:
| REIT | Real estate investment trust |
Written Options
| | | | | | | | | | | | | | | | | | | | | | | | |
| Description | | Counterparty | | | Number of
contracts | | | Notional
amount | | | Exercise
price | | | Expiration
date | | | Value | |
| | | | | | |
Call | | | | | | | | | | | | | | | | | | | | | | | | |
| | | | | | |
Charles River Laboratories International Incorporated | | | Bank of America | | | | (1,000) | | | $ | (17,000,000 | ) | | $ | 170.00 | | | | 5-15-2020 | | | $ | (140,787 | ) |
| | | | | | |
Put | | | | | | | | | | | | | | | | | | | | | | | | |
| | | | | | |
AerCap Holdings NV | | | Bank of America | | | | 4,997 | | | | 26,234,250 | | | | 52.50 | | | | 4-17-2020 | | | | (14,846,261 | ) |
| | | | | | |
Cboe Global Markets Incorporated | | | Bank of America | | | | 4,500 | | | | 49,500,000 | | | | 110.00 | | | | 6-19-2020 | | | | (9,000,000 | ) |
| | | | | | | | | | | | | | | | | | | | | | | | |
| | | | | | |
| | | | | | | | | | | | | | | | | | | | | | $ | (23,987,048 | ) |
| | | | | | | | | | | | | | | | | | | | | | | | |
The accompanying notes are an integral part of these financial statements.
10 | Wells Fargo Special Mid Cap Value Fund
Portfolio of investments—March 31, 2020 (unaudited)
Investments in Affiliates
An affiliated investment is an investment in which the Fund owns at least 5% of the outstanding voting shares of the issuer or as a result of other relationships, such as the Fund and the issuer having the same investment manager. Transactions with issuers that were either affiliates of the Fund at the beginning of the period or the end of the period were as follows:
| | | | | | | | | | | | | | | | | | | | | | | | | | | | | | | | | | | | |
| | | Shares,
beginning of
period | | | Shares
purchased | | | Shares
sold | | | Shares,
end of
period | | | Net
realized
gains
(losses) | | | Net
change in
unrealized
gains
(losses) | | | Income
from
affiliated
securities | | | Value,
end of
period | | | % of
net
assets | |
| | | | | | | | | |
| Short-Term Investments | | | | | | | | | | | | | | | | | | | | | | | | | | | |
Investment Companies | |
Securities Lending Cash Investments LLC | | | 0 | | | | 43,065,929 | | | | (26,773,695 | ) | | | 16,292,234 | | | $ | 1,697 | | | $ | 1,504 | | | $ | 21,555 | # | | $ | 16,293,864 | | | | | |
Wells Fargo Government Money Market Fund Select Class | | | 528,149,536 | | | | 1,359,624,463 | | | | (1,659,531,027 | ) | | | 228,242,972 | | | | 0 | | | | 0 | | | | 3,257,475 | | | | 228,242,972 | | | | | |
| | | | | | | | | | | | | | | | | | | | | | | | | | | | | | | | | | | | |
| | | | | | | | | | | | | | | | | | $ | 1,697 | | | $ | 1,504 | | | $ | 3,279,030 | | | $ | 244,536,836 | | | | 3.30 | % |
| | | | | | | | | | | | | | | | | | | | | | | | | | | | | | | | | | | | |
| # | Amount shown represents income before fees and rebate. |
The accompanying notes are an integral part of these financial statements.
Wells Fargo Special Mid Cap Value Fund | 11
Statement of assets and liabilities—March 31, 2020 (unaudited)
| | | | |
| | | | |
| |
Assets | | | | |
Investments in unaffiliated securities (including $15,940,704 of securities loaned), at value (cost $8,226,782,329) | | $ | 7,011,512,476 | |
Investments in affiliated securities, at value (cost $244,535,332) | | | 244,536,836 | |
Cash | | | 30,500,000 | |
Segregated cash for written options | | | 75,750,000 | |
Receivable for investments sold | | | 87,445,584 | |
Receivable for Fund shares sold | | | 44,814,234 | |
Receivable for dividends | | | 20,094,635 | |
Receivable for securities lending income, net | | | 18,355 | |
| | | | |
Total assets | | | 7,514,672,120 | |
| | | | |
| |
Liabilities | | | | |
Payable upon receipt of securities loaned | | | 16,290,662 | |
Payable for investments purchased | | | 38,992,432 | |
Payable for Fund shares redeemed | | | 13,449,506 | |
Written options, at value (premiums received $5,300,616) | | | 23,987,048 | |
Management fee payable | | | 4,487,728 | |
Administration fees payable | | | 773,031 | |
Distribution fees payable | | | 76,803 | |
Trustees’ fees and expenses payable | | | 3,781 | |
Accrued expenses and other liabilities | | | 1,749,224 | |
| | | | |
Total liabilities | | | 99,810,215 | |
| | | | |
Total net assets | | $ | 7,414,861,905 | |
| | | | |
| |
Net assets consist of | | | | |
Paid-in capital | | $ | 8,600,481,496 | |
Total distributable loss | | | (1,185,619,591 | ) |
| | | | |
Total net assets | | $ | 7,414,861,905 | |
| | | | |
| |
Computation of net asset value and offering price per share | | | | |
Net assets – Class A | | $ | 761,906,640 | |
Shares outstanding – Class A1 | | | 27,169,365 | |
Net asset value per share – Class A | | | $28.04 | |
Maximum offering price per share – Class A2 | | | $29.75 | |
Net assets – Class C | | $ | 100,329,036 | |
Shares outstanding – Class C1 | | | 3,744,989 | |
Net asset value per share – Class C | | | $26.79 | |
Net assets – Class R | | $ | 22,139,527 | |
Shares outstanding – Class R1 | | | 779,279 | |
Net asset value per share – Class R | | | $28.41 | |
Net assets – Class R6 | | $ | 1,793,213,590 | |
Shares outstanding – Class R61 | | | 62,204,501 | |
Net asset value per share – Class R6 | | | $28.83 | |
Net assets – Administrator Class | | $ | 327,672,149 | |
Shares outstanding – Administrator Class1 | | | 11,463,936 | |
Net asset value per share – Administrator Class | | | $28.58 | |
Net assets – Institutional Class | | $ | 4,409,600,963 | |
Shares outstanding – Institutional Class1 | | | 153,134,438 | |
Net asset value per share – Institutional Class | | | $28.80 | |
| 1 | The Fund has an unlimited number of authorized shares. |
| 2 | Maximum offering price is computed as 100/94.25 of net asset value. On investments of $50,000 or more, the offering price is reduced. |
The accompanying notes are an integral part of these financial statements.
12 | Wells Fargo Special Mid Cap Value Fund
Statement of operations—six months ended March 31, 2020 (unaudited)
| | | | |
| | | | |
| |
Investment income | | | | |
Dividends (net of foreign withholding taxes of $107,091) | | $ | 90,128,948 | |
Income from affiliated securities | | | 3,276,072 | |
| | | | |
Total investment income | | | 93,405,020 | |
| | | | |
| |
Expenses | | | | |
Management fee | | | 32,169,727 | |
Administration fees | | | | |
Class A | | | 1,088,165 | |
Class C | | | 151,647 | |
Class R | | | 33,596 | |
Class R6 | | | 345,436 | |
Administrator Class | | | 381,038 | |
Institutional Class | | | 3,629,137 | |
Shareholder servicing fees | | | | |
Class A | | | 1,295,435 | |
Class C | | | 180,532 | |
Class R | | | 39,994 | |
Administrator Class | | | 732,757 | |
Distribution fees | | | | |
Class C | | | 541,325 | |
Class R | | | 39,967 | |
Custody and accounting fees | | | 133,418 | |
Professional fees | | | 22,557 | |
Registration fees | | | 250,684 | |
Shareholder report expenses | | | 494,100 | |
Trustees’ fees and expenses | | | 11,029 | |
Other fees and expenses | | | 45,123 | |
| | | | |
Total expenses | | | 41,585,667 | |
Less: Fee waivers and/or expense reimbursements | | | | |
Fund-level | | | (21,791 | ) |
Class A | | | (17,580 | ) |
Class R | | | (3 | ) |
Class R6 | | | (648 | ) |
Institutional Class | | | (4,248 | ) |
| | | | |
Net expenses | | | 41,541,397 | |
| | | | |
Net investment income | | | 51,863,623 | |
| | | | |
| |
Realized and unrealized gains (losses) on investments | | | | |
Net realized gains on | | | | |
Unaffiliated securities | | | 66,251,001 | |
Affiliated securities | | | 1,697 | |
Written options | | | 1,181,594 | |
| | | | |
Net realized gains on investments | | | 67,434,292 | |
| | | | |
Net change in unrealized gains (losses) on | | | | |
Unaffiliated securities | | | (2,655,740,369 | ) |
Affiiliated securities | | | 1,504 | |
Written options | | | (18,686,432 | ) |
| | | | |
Net change in unrealized gains (losses) on investments | | | (2,674,425,297 | ) |
| | | | |
Net realized and unrealized gains (losses) on investments | | | (2,606,991,005 | ) |
| | | | |
Net decrease in net assets resulting from operations | | $ | (2,555,127,382 | ) |
| | | | |
The accompanying notes are an integral part of these financial statements.
Wells Fargo Special Mid Cap Value Fund | 13
Statement of changes in net assets
| | | | | | | | | | | | | | | | |
| | | Six months ended
March 31, 2020
(unaudited) | | | Year ended
September 30, 2019 | |
| | | | |
Operations | | | | | | | | | | | | | | | | |
Net investment income | | | | | | $ | 51,863,623 | | | | | | | $ | 77,380,134 | |
Net realized gains on investments | | | | | | | 67,434,292 | | | | | | | | 303,691,561 | |
Net change in unrealized gains (losses) on investments | | | | | | | (2,674,425,297 | ) | | | | | | | 233,760,522 | |
| | | | |
Net increase (decrease) in net assets resulting from operations | | | | | | | (2,555,127,382 | ) | | | | | | | 614,832,217 | |
| | | | |
| | | | |
Distributions to shareholders from net investment income and net realized gains | | | | | | | | | | | | | | | | |
Class A | | | | | | | (42,557,946 | ) | | | | | | | (20,592,515 | ) |
Class C | | | | | | | (5,334,641 | ) | | | | | | | (2,703,167 | ) |
Class R | | | | | | | (1,279,526 | ) | | | | | | | (562,316 | ) |
Class R6 | | | | | | | (100,004,255 | ) | | | | | | | (36,838,837 | ) |
Administrator Class | | | | | | | (24,372,266 | ) | | | | | | | (17,454,931 | ) |
Institutional Class | | | | | | | (243,751,453 | ) | | | | | | | (114,026,310 | ) |
| | | | |
Total distributions to shareholders | | | | | | | (417,300,087 | ) | | | | | | | (192,178,076 | ) |
| | | | |
| | | | |
Capital share transactions | | | Shares | | | | | | | | Shares | | | | | |
Proceeds from shares sold | | | | | | | | | | | | | | | | |
Class A | | | 4,883,215 | | | | 184,235,513 | | | | 5,327,538 | | | | 192,757,937 | |
Class C | | | 278,349 | | | | 10,425,924 | | | | 395,515 | | | | 13,743,148 | |
Class R | | | 145,797 | | | | 5,508,045 | | | | 312,326 | | | | 11,470,210 | |
Class R6 | | | 16,411,557 | | | | 642,660,416 | | | | 19,811,243 | | | | 753,877,254 | |
Administrator Class | | | 1,349,103 | | | | 51,875,537 | | | | 2,524,441 | | | | 92,078,365 | |
Institutional Class | | | 41,675,876 | | | | 1,488,262,489 | | | | 49,318,478 | | | | 1,865,932,723 | |
| | | | |
| | | | | | | 2,382,967,924 | | | | | | | | 2,929,859,637 | |
| | | | |
Reinvestment of distributions | | | | | | | | | | | | | | | | |
Class A | | | 982,408 | | | | 39,537,339 | | | | 578,559 | | | | 19,307,072 | |
Class C | | | 131,467 | | | | 5,025,996 | | | | 79,940 | | | | 2,563,693 | |
Class R | | | 31,409 | | | | 1,278,194 | | | | 16,602 | | | | 561,690 | |
Class R6 | | | 2,282,372 | | | | 94,677,008 | | | | 1,023,710 | | | | 35,011,870 | |
Administrator Class | | | 592,191 | | | | 24,283,965 | | | | 512,565 | | | | 17,408,508 | |
Institutional Class | | | 5,501,267 | | | | 227,806,608 | | | | 3,085,272 | | | | 105,464,480 | |
| | | | |
| | | | | | | 392,609,110 | | | | | | | | 180,317,313 | |
| | | | |
Payment for shares redeemed | | | | | | | | | | | | | | | | |
Class A | | | (4,022,104 | ) | | | (149,836,039 | ) | | | (8,214,077 | ) | | | (295,833,462 | ) |
Class C | | | (550,926 | ) | | | (19,364,672 | ) | | | (1,443,715 | ) | | | (49,286,556 | ) |
Class R | | | (195,065 | ) | | | (7,560,328 | ) | | | (177,050 | ) | | | (6,492,936 | ) |
Class R6 | | | (7,890,157 | ) | | | (296,600,817 | ) | | | (8,066,799 | ) | | | (299,782,094 | ) |
Administrator Class | | | (5,448,895 | ) | | | (177,676,899 | ) | | | (13,653,775 | ) | | | (493,668,005 | ) |
Institutional Class | | | (25,495,803 | ) | | | (968,795,885 | ) | | | (48,844,550 | ) | | | (1,804,574,146 | ) |
| | | | |
| | | | | | | (1,619,834,640 | ) | | | | | | | (2,949,637,199 | ) |
| | | | |
Net increase in net assets resulting from capital share transactions | | | | | | | 1,155,742,394 | | | | | | | | 160,539,751 | |
| | | | |
Total increase (decrease) in net assets | | | | | | | (1,816,685,075 | ) | | | | | | | 583,193,892 | |
| | | | |
| | | | |
Net assets | | | | | | | | | | | | | | | | |
Beginning of period | | | | | | | 9,231,546,980 | | | | | | | | 8,648,353,088 | |
| | | | |
End of period | | | | | | $ | 7,414,861,905 | | | | | | | $ | 9,231,546,980 | |
| | | | |
The accompanying notes are an integral part of these financial statements.
14 | Wells Fargo Special Mid Cap Value Fund
Financial highlights
(For a share outstanding throughout each period)
| | | | | | | | | | | | | | | | | | | | | | | | |
| | | Six months ended
March 31, 2020
(unaudited) | | | Year ended September 30 | |
| CLASS A | | 2019 | | | 2018 | | | 2017 | | | 2016 | | | 2015 | |
Net asset value, beginning of period | | | $39.63 | | | | $37.59 | | | | $37.49 | | | | $33.12 | | | | $29.91 | | | | $32.68 | |
Net investment income | | | 0.13 | | | | 0.26 | | | | 0.15 | | | | 0.33 | | | | 0.19 | | | | 0.25 | |
Net realized and unrealized gains (losses) on investments | | | (10.09 | ) | | | 2.54 | | | | 1.50 | | | | 4.42 | | | | 4.23 | | | | 0.07 | |
| | | | | | | | | | | | | | | | | | | | | | | | |
Total from investment operations | | | (9.96 | ) | | | 2.80 | | | | 1.65 | | | | 4.75 | | | | 4.42 | | | | 0.32 | |
Distributions to shareholders from | | | | | | | | | | | | | | | | | | | | | | | | |
Net investment income | | | (0.23 | ) | | | (0.17 | ) | | | (0.23 | ) | | | (0.19 | ) | | | (0.08 | ) | | | (0.18 | ) |
Net realized gains | | | (1.40 | ) | | | (0.59 | ) | | | (1.32 | ) | | | (0.19 | ) | | | (1.13 | ) | | | (2.91 | ) |
| | | | | | | | | | | | | | | | | | | | | | | | |
Total distributions to shareholders | | | (1.63 | ) | | | (0.76 | ) | | | (1.55 | ) | | | (0.38 | ) | | | (1.21 | ) | | | (3.09 | ) |
Net asset value, end of period | | | $28.04 | | | | $39.63 | | | | $37.59 | | | | $37.49 | | | | $33.12 | | | | $29.91 | |
Total return1 | | | (26.36 | )% | | | 7.81 | % | | | 4.50 | % | | | 14.41 | % | | | 15.34 | % | | | 0.69 | % |
Ratios to average net assets (annualized) | | | | | | | | | | | | | | | | | | | | | | | | |
Gross expenses | | | 1.14 | % | | | 1.15 | % | | | 1.15 | % | | | 1.18 | % | | | 1.19 | % | | | 1.25 | % |
Net expenses | | | 1.14 | % | | | 1.15 | % | | | 1.15 | % | | | 1.18 | % | | | 1.19 | % | | | 1.24 | % |
Net investment income | | | 0.78 | % | | | 0.67 | % | | | 0.40 | % | | | 0.78 | % | | | 0.82 | % | | | 0.85 | % |
Supplemental data | | | | | | | | | | | | | | | | | | | | | | | | |
Portfolio turnover rate | | | 23 | % | | | 37 | % | | | 37 | % | | | 46 | % | | | 30 | % | | | 58 | % |
Net assets, end of period (000s omitted) | | | $761,907 | | | | $1,003,560 | | | | $1,038,883 | | | | $1,070,690 | | | | $1,363,213 | | | | $509,386 | |
| 1 | Total return calculations do not include any sales charges. Returns for periods of less than one year are not annualized. |
The accompanying notes are an integral part of these financial statements.
Wells Fargo Special Mid Cap Value Fund | 15
Financial highlights
(For a share outstanding throughout each period)
| | | | | | | | | | | | | | | | | | | | | | | | |
| | | Six months ended
March 31, 2020
(unaudited) | | | Year ended September 30 | |
| CLASS C | | 2019 | | | 2018 | | | 2017 | | | 2016 | | | 2015 | |
Net asset value, beginning of period | | | $37.85 | | | | $36.02 | | | | $36.03 | | | | $31.91 | | | | $29.00 | | | | $31.82 | |
Net investment income (loss) | | | 0.00 | 1,2 | | | (0.07 | ) | | | (0.14 | ) | | | 0.06 | | | | 0.03 | | | | 0.02 | 1 |
Net realized and unrealized gains (losses) on investments | | | (9.66 | ) | | | 2.49 | | | | 1.46 | | | | 4.26 | | | | 4.02 | | | | 0.07 | |
| | | | | | | | | | | | | | | | | | | | | | | | |
Total from investment operations | | | (9.66 | ) | | | 2.42 | | | | 1.32 | | | | 4.32 | | | | 4.05 | | | | 0.09 | |
Distributions to shareholders from | | | | | | | | | | | | | | | | | | | | | | | | |
Net investment income | | | 0.00 | | | | 0.00 | | | | (0.01 | ) | | | (0.01 | ) | | | (0.01 | ) | | | 0.00 | |
Net realized gains | | | (1.40 | ) | | | (0.59 | ) | | | (1.32 | ) | | | (0.19 | ) | | | (1.13 | ) | | | (2.91 | ) |
| | | | | | | | | | | | | | | | | | | | | | | | |
Total distributions to shareholders | | | (1.40 | ) | | | (0.59 | ) | | | (1.33 | ) | | | (0.20 | ) | | | (1.14 | ) | | | (2.91 | ) |
Net asset value, end of period | | | $26.79 | | | | $37.85 | | | | $36.02 | | | | $36.03 | | | | $31.91 | | | | $29.00 | |
Total return3 | | | (26.63 | )% | | | 7.00 | % | | | 3.72 | % | | | 13.56 | % | | | 14.47 | % | | | (0.05 | )% |
Ratios to average net assets (annualized) | | | | | | | | | | | | | | | | | | | | | | | | |
Gross expenses | | | 1.89 | % | | | 1.90 | % | | | 1.90 | % | | | 1.92 | % | | | 1.94 | % | | | 2.00 | % |
Net expenses | | | 1.89 | % | | | 1.90 | % | | | 1.90 | % | | | 1.92 | % | | | 1.94 | % | | | 1.99 | % |
Net investment income (loss) | | | 0.01 | % | | | (0.09 | )% | | | (0.35 | )% | | | 0.14 | % | | | 0.03 | % | | | 0.08 | % |
Supplemental data | | | | | | | | | | | | | | | | | | | | | | | | |
Portfolio turnover rate | | | 23 | % | | | 37 | % | | | 37 | % | | | 46 | % | | | 30 | % | | | 58 | % |
Net assets, end of period (000s omitted) | | | $100,329 | | | | $147,086 | | | | $174,839 | | | | $191,954 | | | | $116,022 | | | | $63,431 | |
| 1 | Calculated based upon average shares outstanding |
| 2 | Amount is less than $0.005. |
| 3 | Total return calculations do not include any sales charges. Returns for periods of less than one year are not annualized. |
The accompanying notes are an integral part of these financial statements.
16 | Wells Fargo Special Mid Cap Value Fund
Financial highlights
(For a share outstanding throughout each period)
| | | | | | | | | | | | | | | | | | | | | | | | |
| | | Six months ended
March 31, 2020
(unaudited) | | | Year ended September 30 | |
| CLASS R | | 2019 | | | 2018 | | | 2017 | | | 2016 | | | 20151 | |
Net asset value, beginning of period | | | $40.10 | | | | $38.09 | | | | $38.08 | | | | $33.78 | | | | $30.70 | | | | $30.70 | |
Net investment income | | | 0.09 | | | | 0.17 | | | | 0.09 | | | | 0.32 | | | | 0.12 | 2 | | | 0.00 | |
Net realized and unrealized gains (losses) on investments | | | (10.23 | ) | | | 2.57 | | | | 1.49 | | | | 4.43 | | | | 4.32 | | | | 0.00 | |
| | | | | | | | | | | | | | | | | | | | | | | | |
Total from investment operations | | | (10.14 | ) | | | 2.74 | | | | 1.58 | | | | 4.75 | | | | 4.44 | | | | 0.00 | |
Distributions to shareholders from | | | | | | | | | | | | | | | | | | | | | | | | |
Net investment income | | | (0.15 | ) | | | (0.14 | ) | | | (0.25 | ) | | | (0.26 | ) | | | (0.23 | ) | | | 0.00 | |
Net realized gains | | | (1.40 | ) | | | (0.59 | ) | | | (1.32 | ) | | | (0.19 | ) | | | (1.13 | ) | | | 0.00 | |
| | | | | | | | | | | | | | | | | | | | | | | | |
Total distributions to shareholders | | | (1.55 | ) | | | (0.73 | ) | | | (1.57 | ) | | | (0.45 | ) | | | (1.36 | ) | | | 0.00 | |
Net asset value, end of period | | | $28.41 | | | | $40.10 | | | | $38.09 | | | | $38.08 | | | | $33.78 | | | | $30.70 | |
Total return3 | | | (26.43 | )% | | | 7.52 | % | | | 4.23 | % | | | 14.13 | % | | | 15.05 | % | | | 0.00 | % |
Ratios to average net assets (annualized) | | | | | | | | | | | | | | | | | | | | | | | | |
Gross expenses | | | 1.39 | % | | | 1.40 | % | | | 1.40 | % | | | 1.42 | % | | | 1.44 | % | | | 0.00 | % |
Net expenses | | | 1.39 | % | | | 1.40 | % | | | 1.40 | % | | | 1.42 | % | | | 1.44 | % | | | 0.00 | % |
Net investment income | | | 0.51 | % | | | 0.43 | % | | | 0.18 | % | | | 0.77 | % | | | 0.37 | % | | | 0.00 | % |
Supplemental data | | | | | | | | | | | | | | | | | | | | | | | | |
Portfolio turnover rate | | | 23 | % | | | 37 | % | | | 37 | % | | | 46 | % | | | 30 | % | | | 58 | % |
Net assets, end of period (000s omitted) | | | $22,140 | | | | $31,961 | | | | $24,575 | | | | $14,505 | | | | $1,778 | | | | $25 | |
| 1 | The class commenced operations on September 30, 2015. Information represents activity for the one day of operation. |
| 2 | Calculated based upon average shares outstanding |
| 3 | Returns for periods of less than one year are not annualized. |
The accompanying notes are an integral part of these financial statements.
Wells Fargo Special Mid Cap Value Fund | 17
Financial highlights
(For a share outstanding throughout each period)
| | | | | | | | | | | | | | | | | | | | | | | | |
| | | Six months ended
March 31, 2020
(unaudited) | | | Year ended September 30 | |
| CLASS R6 | | 2019 | | | 2018 | | | 2017 | | | 2016 | | | 2015 | |
Net asset value, beginning of period | | | $40.76 | | | | $38.67 | | | | $38.52 | | | | $34.03 | | | | $30.71 | | | | $33.39 | |
Net investment income | | | 0.25 | 1 | | | 0.40 | | | | 0.32 | 1 | | | 0.50 | 1 | | | 0.38 | 1 | | | 0.41 | 1 |
Net realized and unrealized gains (losses) on investments | | | (10.39 | ) | | | 2.62 | | | | 1.55 | | | �� | 4.53 | | | | 4.30 | | | | 0.05 | |
| | | | | | | | | | | | | | | | | | | | | | | | |
Total from investment operations | | | (10.14 | ) | | | 3.02 | | | | 1.87 | | | | 5.03 | | | | 4.68 | | | | 0.46 | |
Distributions to shareholders from | | | | | | | | | | | | | | | | | | | | | | | | |
Net investment income | | | (0.39 | ) | | | (0.34 | ) | | | (0.40 | ) | | | (0.35 | ) | | | (0.23 | ) | | | (0.23 | ) |
Net realized gains | | | (1.40 | ) | | | (0.59 | ) | | | (1.32 | ) | | | (0.19 | ) | | | (1.13 | ) | | | (2.91 | ) |
| | | | | | | | | | | | | | | | | | | | | | | | |
Total distributions to shareholders | | | (1.79 | ) | | | (0.93 | ) | | | (1.72 | ) | | | (0.54 | ) | | | (1.36 | ) | | | (3.14 | ) |
Net asset value, end of period | | | $28.83 | | | | $40.76 | | | | $38.67 | | | | $38.52 | | | | $34.03 | | | | $30.71 | |
Total return2 | | | (26.19 | )% | | | 8.28 | % | | | 4.95 | % | | | 14.88 | % | | | 15.84 | % | | | 1.14 | % |
Ratios to average net assets (annualized) | | | | | | | | | | | | | | | | | | | | | | | | |
Gross expenses | | | 0.71 | % | | | 0.72 | % | | | 0.72 | % | | | 0.74 | % | | | 0.76 | % | | | 0.79 | % |
Net expenses | | | 0.71 | % | | | 0.72 | % | | | 0.72 | % | | | 0.74 | % | | | 0.76 | % | | | 0.79 | % |
Net investment income | | | 1.23 | % | | | 1.12 | % | | | 0.85 | % | | | 1.37 | % | | | 1.21 | % | | | 1.26 | % |
Supplemental data | | | | | | | | | | | | | | | | | | | | | | | | |
Portfolio turnover rate | | | 23 | % | | | 37 | % | | | 37 | % | | | 46 | % | | | 30 | % | | | 58 | % |
Net assets, end of period (000s omitted) | | | $1,793,214 | | | | $2,094,860 | | | | $1,493,787 | | | | $906,784 | | | | $374,557 | | | | $105,973 | |
| 1 | Calculated based upon average shares outstanding |
| 2 | Returns for periods of less than one year are not annualized. |
The accompanying notes are an integral part of these financial statements.
18 | Wells Fargo Special Mid Cap Value Fund
Financial highlights
(For a share outstanding throughout each period)
| | | | | | | | | | | | | | | | | | | | | | | | |
| | | Six months ended
March 31, 2020
(unaudited) | | | Year ended September 30 | |
| ADMINISTRATOR CLASS | | 2019 | | | 2018 | | | 2017 | | | 2016 | | | 2015 | |
Net asset value, beginning of period | | | $40.35 | | | | $38.23 | | | | $38.12 | | | | $33.67 | | | | $30.45 | | | | $33.14 | |
Net investment income | | | 0.16 | 1 | | | 0.27 | 1 | | | 0.18 | 1 | | | 0.34 | 1 | | | 0.26 | | | | 0.31 | 1 |
Net realized and unrealized gains (losses) on investments | | | (10.29 | ) | | | 2.61 | | | | 1.52 | | | | 4.52 | | | | 4.26 | | | | 0.05 | |
| | | | | | | | | | | | | | | | | | | | | | | | |
Total from investment operations | | | (10.13 | ) | | | 2.88 | | | | 1.70 | | | | 4.86 | | | | 4.52 | | | | 0.36 | |
Distributions to shareholders from | | | | | | | | | | | | | | | | | | | | | | | | |
Net investment income | | | (0.24 | ) | | | (0.17 | ) | | | (0.27 | ) | | | (0.22 | ) | | | (0.17 | ) | | | (0.14 | ) |
Net realized gains | | | (1.40 | ) | | | (0.59 | ) | | | (1.32 | ) | | | (0.19 | ) | | | (1.13 | ) | | | (2.91 | ) |
| | | | | | | | | | | | | | | | | | | | | | | | |
Total distributions to shareholders | | | (1.64 | ) | | | (0.76 | ) | | | (1.59 | ) | | | (0.41 | ) | | | (1.30 | ) | | | (3.05 | ) |
Net asset value, end of period | | | $28.58 | | | | $40.35 | | | | $38.23 | | | | $38.12 | | | | $33.67 | | | | $30.45 | |
Total return2 | | | (26.33 | )% | | | 7.88 | % | | | 4.58 | % | | | 14.50 | % | | | 15.42 | % | | | 0.84 | % |
Ratios to average net assets (annualized) | | | | | | | | | | | | | | | | | | | | | | | | |
Gross expenses | | | 1.06 | % | | | 1.07 | % | | | 1.07 | % | | | 1.09 | % | | | 1.10 | % | | | 1.12 | % |
Net expenses | | | 1.06 | % | | | 1.07 | % | | | 1.07 | % | | | 1.09 | % | | | 1.10 | % | | | 1.11 | % |
Net investment income | | | 0.80 | % | | | 0.72 | % | | | 0.47 | % | | | 0.95 | % | | | 0.88 | % | | | 0.95 | % |
Supplemental data | | | | | | | | | | | | | | | | | | | | | | | | |
Portfolio turnover rate | | | 23 | % | | | 37 | % | | | 37 | % | | | 46 | % | | | 30 | % | | | 58 | % |
Net assets, end of period (000s omitted) | | | $327,672 | | | | $604,126 | | | | $978,368 | | | | $1,156,796 | | | | $834,134 | | | | $394,188 | |
| 1 | Calculated based upon average shares outstanding |
| 2 | Returns for periods of less than one year are not annualized. |
The accompanying notes are an integral part of these financial statements.
Wells Fargo Special Mid Cap Value Fund | 19
Financial highlights
(For a share outstanding throughout each period)
| | | | | | | | | | | | | | | | | | | | | | | | |
| | | Six months ended
March 31, 2020
(unaudited) | | | Year ended September 30 | |
| INSTITUTIONAL CLASS | | 2019 | | | 2018 | | | 2017 | | | 2016 | | | 2015 | |
Net asset value, beginning of period | | | $40.70 | | | | $38.61 | | | | $38.47 | | | | $34.00 | | | | $30.70 | | | | $33.38 | |
Net investment income | | | 0.22 | 1 | | | 0.38 | 1 | | | 0.26 | | | | 0.41 | | | | 0.35 | 1 | | | 0.41 | 1 |
Net realized and unrealized gains (losses) on investments | | | (10.37 | ) | | | 2.60 | | | | 1.56 | | | | 4.58 | | | | 4.29 | | | | 0.04 | |
| | | | | | | | | | | | | | | | | | | | | | | | |
Total from investment operations | | | (10.15 | ) | | | 2.98 | | | | 1.82 | | | | 4.99 | | | | 4.64 | | | | 0.45 | |
Distributions to shareholders from | | | | | | | | | | | | | | | | | | | | | | | | |
Net investment income | | | (0.35 | ) | | | (0.30 | ) | | | (0.36 | ) | | | (0.33 | ) | | | (0.21 | ) | | | (0.22 | ) |
Net realized gains | | | (1.40 | ) | | | (0.59 | ) | | | (1.32 | ) | | | (0.19 | ) | | | (1.13 | ) | | | (2.91 | ) |
| | | | | | | | | | | | | | | | | | | | | | | | |
Total distributions to shareholders | | | (1.75 | ) | | | (0.89 | ) | | | (1.68 | ) | | | (0.52 | ) | | | (1.34 | ) | | | (3.13 | ) |
Net asset value, end of period | | | $28.80 | | | | $40.70 | | | | $38.61 | | | | $38.47 | | | | $34.00 | | | | $30.70 | |
Total return2 | | | (26.24 | )% | | | 8.17 | % | | | 4.84 | % | | | 14.76 | % | | | 15.73 | % | | | 1.10 | % |
Ratios to average net assets (annualized) | | | | | | | | | | | | | | | | | | | | | | | | |
Gross expenses | | | 0.81 | % | | | 0.82 | % | | | 0.82 | % | | | 0.84 | % | | | 0.86 | % | | | 0.85 | % |
Net expenses | | | 0.81 | % | | | 0.82 | % | | | 0.82 | % | | | 0.84 | % | | | 0.86 | % | | | 0.85 | % |
Net investment income | | | 1.12 | % | | | 1.00 | % | | | 0.73 | % | | | 1.24 | % | | | 1.07 | % | | | 1.23 | % |
Supplemental data | | | | | | | | | | | | | | | | | | | | | | | | |
Portfolio turnover rate | | | 23 | % | | | 37 | % | | | 37 | % | | | 46 | % | | | 30 | % | | | 58 | % |
Net assets, end of period (000s omitted) | | | $4,409,601 | | | | $5,349,953 | | | | $4,937,901 | | | | $4,595,274 | | | | $2,325,777 | | | | $411,919 | |
| 1 | Calculated based upon average shares outstanding |
| 2 | Returns for periods of less than one year are not annualized. |
The accompanying notes are an integral part of these financial statements.
20 | Wells Fargo Special Mid Cap Value Fund
Notes to financial statements (unaudited)
1. ORGANIZATION
Wells Fargo Funds Trust (the “Trust”), a Delaware statutory trust organized on March 10, 1999, is anopen-end management investment company registered under the Investment Company Act of 1940, as amended (the “1940 Act”). As an investment company, the Trust follows the accounting and reporting guidance in Financial Accounting Standards Board (“FASB”)Accounting Standards Codification Topic 946, Financial Services – Investment Companies. These financial statements report on the Wells Fargo Special Mid Cap Value Fund (the “Fund”) which is a diversified series of the Trust.
2. SIGNIFICANT ACCOUNTING POLICIES
The following significant accounting policies, which are consistently followed in the preparation of the financial statements of the Fund, are in conformity with U.S. generally accepted accounting principles which require management to make estimates and assumptions that affect the reported amounts of assets and liabilities, disclosure of contingent assets and liabilities at the date of the financial statements, and the reported amounts of revenues and expenses during the reporting period. Actual results could differ from those estimates.
Securities valuation
All investments are valued each business day as of the close of regular trading on the New York Stock Exchange (generally 4 p.m. Eastern Time), although the Fund may deviate from this calculation time under unusual or unexpected circumstances.
Equity securities and options that are listed on a foreign or domestic exchange or market are valued at the official closing price or, if none, the last sales price. If no sale occurs on the principal exchange or market that day, a fair value price will be determined in accordance with the Fund’s Valuation Procedures.
Investments in registeredopen-end investment companies are valued at net asset value. Interests innon-registered investment companies that are redeemable at net asset value are fair valued normally at net asset value.
Investments which are not valued using any of the methods discussed above are valued at their fair value, as determined in good faith by the Board of Trustees of the Fund. The Board of Trustees has established a Valuation Committee comprised of the Trustees and has delegated to it the authority to take any actions regarding the valuation of portfolio securities that the Valuation Committee deems necessary or appropriate, including determining the fair value of portfolio securities, unless the determination has been delegated to the Wells Fargo Asset Management Pricing Committee at Wells Fargo Funds Management, LLC (“Funds Management”). The Board of Trustees retains the authority to make or ratify any valuation decisions or approve any changes to the Valuation Procedures as it deems appropriate. On a quarterly basis, the Board of Trustees receives reports on any valuation actions taken by the Valuation Committee or the Wells Fargo Asset Management Pricing Committee which may include items for ratification.
Securities lending
The Fund may lend its securities from time to time in order to earn additional income in the form of fees or interest on securities received as collateral or the investment of any cash received as collateral. When securities are on loan, the Fund receives interest or dividends on those securities. Cash collateral received in connection with its securities lending transactions is invested in Securities Lending Cash Investments, LLC (the “Securities Lending Fund”). Investments in Securities Lending Fund are valued at the evaluated bid price provided by an independent pricing service. Income earned from investment in the Securities Lending Fund (net of fees and rebates), if any, is included in income from affiliated securities on the Statement of Operations.
In a securities lending transaction, the net asset value of the Fund is affected by an increase or decrease in the value of the securities loaned and by an increase or decrease in the value of the instrument in which collateral is invested. The amount of securities lending activity undertaken by the Fund fluctuates from time to time. The Fund has the right under the lending agreement to recover the securities from the borrower on demand. In the event of default or bankruptcy by the borrower, the Fund may be prevented from recovering the loaned securities or gaining access to the collateral or may experience delays or costs in doing so. In such an event, the terms of the agreement allow the unaffiliated securities lending agent to use the collateral to purchase replacement securities on behalf of the Fund or pay the Fund the market value of the loaned securities. The Fund bears the risk of loss with respect to depreciation of its investment of the cash collateral.
Options
The Fund may write covered call options or secured put options on individual securities and/or indexes. When the Fund writes an option, an amount equal to the premium received is recorded as a liability and is subsequently adjusted to the current market value of the written option. Premiums received from written options that expire unexercised are recognized as realized gains on the expiration date. For exercised options, the difference between the premium received and the amount paid on effecting a
Wells Fargo Special Mid Cap Value Fund | 21
Notes to financial statements (unaudited)
closing purchase transaction, including brokerage commissions, is treated as a realized gain or loss. If a call option is exercised, the premium is added to the proceeds from the sale of the underlying security in calculating the realized gain or loss on the sale. If a put option is exercised, the premium reduces the cost of the security purchased. The Fund, as a writer of an option, bears the market risk of an unfavorable change in the price of the security and/or index underlying the written option.
The Fund may also purchase call or put options. Premiums paid are included in the Statement of Assets and Liabilities as investments, the values of which are subsequently adjusted based on the current market values of the options. Premiums paid for purchased options that expire are recognized as realized losses on the expiration date. Premiums paid for purchased options that are exercised or closed are added to the amount paid or offset against the proceeds received for the underlying security to determine the realized gain or loss. The risk of loss associated with purchased options is limited to the premium paid.
Options traded on an exchange are regulated and terms of the options are standardized. The Fund is subject to equity price risk. Purchased options tradedover-the-counter expose the Fund to counterparty risk in the event the counterparty does not perform. This risk can be mitigated by having a master netting arrangement between the Fund and the counterparty and by having the counterparty post collateral to cover the Fund’s exposure to the counterparty.
Security transactions and income recognition
Securities transactions are recorded on a trade date basis. Realized gains or losses are recorded on the basis of identified cost.
Dividend income is recognized on theex-dividend date. Dividend income is recorded net of foreign taxes withheld where recovery of such taxes is not assured.
Distributions to shareholders
Distributions to shareholders from net investment income and any net realized gains are recorded on theex-dividend date and paid at least annually. Such distributions are determined in accordance with income tax regulations and may differ from U.S. generally accepted accounting principles. Dividend sources are estimated at the time of declaration. The tax character of distributions is determined as of the Fund’s fiscal year end. Therefore, a portion of the Fund’s distributions made prior to the Fund’s fiscal year end may be categorized as a tax return of capital at year end.
Federal and other taxes
The Fund intends to continue to qualify as a regulated investment company by distributing substantially all of its investment company taxable income and any net realized capital gains (after reduction for capital loss carryforwards) sufficient to relieve it from all, or substantially all, federal income taxes. Accordingly, no provision for federal income taxes was required.
The Fund’s income and federal excise tax returns and all financial records supporting those returns for the prior three fiscal years are subject to examination by the federal and Delaware revenue authorities. Management has analyzed the Fund’s tax positions taken on federal, state, and foreign tax returns for all open tax years and does not believe that there are any uncertain tax positions that require recognition of a tax liability.
As of March 31, 2020, the aggregate cost of all investments for federal income tax purposes was $8,446,429,724 and the unrealized gains (losses) consisted of:
| | | | |
| |
Gross unrealized gains | | $ | 670,836,509 | |
| |
Gross unrealized losses | | | (1,879,903,353 | ) |
| |
Net unrealized losses | | $ | (1,209,066,844 | ) |
Class allocations
The separate classes of shares offered by the Fund differ principally in applicable sales charges, distribution, shareholder servicing, and administration fees. Class specific expenses are charged directly to that share class. Investment income, common fund-level expenses, and realized and unrealized gains (losses) on investments are allocated daily to each class of shares based on the relative proportion of net assets of each class.
3. FAIR VALUATION MEASUREMENTS
Fair value measurements of investments are determined within a framework that has established a fair value hierarchy based upon the various data inputs utilized in determining the value of the Fund’s investments. The three-level hierarchy gives the highest priority to unadjusted quoted prices in active markets for identical assets or liabilities (Level 1) and the lowest priority to unobservable inputs (Level 3). The Fund’s investments are classified within the fair value hierarchy based on the lowest level of input that is significant to the fair value measurement. The inputs are summarized into three broad levels as follows:
22 | Wells Fargo Special Mid Cap Value Fund
Notes to financial statements (unaudited)
| ∎ | | Level 1 – quoted prices in active markets for identical securities |
| ∎ | | Level 2 – other significant observable inputs (including quoted prices for similar securities, interest rates, prepayment speeds, credit risk, etc.) |
| ∎ | | Level 3 – significant unobservable inputs (including the Fund’s own assumptions in determining the fair value of investments) |
The inputs or methodologies used for valuing investments in securities are not necessarily an indication of the risk associated with investing in those securities.
The following is a summary of the inputs used in valuing the Fund’s assets and liabilities as of March 31, 2020:
| | | | | | | | | | | | | | | | |
| | | | |
| | | Quoted prices
(Level 1) | | | Other significant
observable inputs
(Level 2) | | | Significant
unobservable inputs (Level 3) | | | Total | |
| | | | |
Assets | | | | | | | | | | | | | | | | |
Investments in: | | | | | | | | | | | | | | | | |
| | | | |
Common stocks | | | | | | | | | | | | | | | | |
| | | | |
Communication services | | $ | 145,813,528 | | | $ | 0 | | | $ | 0 | | | $ | 145,813,528 | |
| | | | |
Consumer discretionary | | | 593,845,701 | | | | 0 | | | | 0 | | | | 593,845,701 | |
| | | | |
Consumer staples | | | 351,037,471 | | | | 0 | | | | 0 | | | | 351,037,471 | |
| | | | |
Energy | | | 218,079,636 | | | | 0 | | | | 0 | | | | 218,079,636 | |
| | | | |
Financials | | | 1,287,024,153 | | | | 0 | | | | 0 | | | | 1,287,024,153 | |
| | | | |
Health care | | | 931,100,762 | | | | 0 | | | | 0 | | | | 931,100,762 | |
| | | | |
Industrials | | | 1,290,140,365 | | | | 0 | | | | 0 | | | | 1,290,140,365 | |
| | | | |
Information technology | | | 701,356,161 | | | | 0 | | | | 0 | | | | 701,356,161 | |
| | | | |
Materials | | | 422,826,193 | | | | 0 | | | | 0 | | | | 422,826,193 | |
| | | | |
Real estate | | | 586,916,001 | | | | 0 | | | | 0 | | | | 586,916,001 | |
| | | | |
Utilities | | | 483,372,505 | | | | 0 | | | | 0 | | | | 483,372,505 | |
| | | | |
Short-term investments | | | | | | | | | | | | | | | | |
| | | | |
Investment companies | | | 244,536,836 | | | | 0 | | | | 0 | | | | 244,536,836 | |
| | | | |
Total assets | | $ | 7,256,049,312 | | | $ | 0 | | | $ | 0 | | | $ | 7,256,049,312 | |
| | | | |
Liabilities | | | | | | | | | | | | | | | | |
| | | | |
Written options | | $ | 0 | | | $ | 23,987,048 | | | $ | 0 | | | $ | 23,987,048 | |
| | | | |
Total liabilities | | $ | 0 | | | $ | 23,987,048 | | | $ | 0 | | | $ | 23,987,048 | |
Additional sector, industry or geographic detail is included in the Portfolio of Investments.
For the six months ended March 31, 2020, the Fund did not have any transfers into/out of Level 3.
4. TRANSACTIONS WITH AFFILIATES
Management fee
Funds Management, an indirect wholly owned subsidiary of Wells Fargo & Company (“Wells Fargo”), is the manager of the Fund and provides advisory and fund-level administrative services under an investment management agreement. Under the investment management agreement, Funds Management is responsible for, among other services, implementing the investment objectives and strategies of the Fund, supervising the subadviser and providing fund-level administrative services in
Wells Fargo Special Mid Cap Value Fund | 23
Notes to financial statements (unaudited)
connection with the Fund’s operations. As compensation for its services under the investment management agreement, Funds Management is entitled to receive a management fee at the following annual rate based on the Fund’s average daily net assets:
| | |
| |
| Average daily net assets | | Management fee |
| |
First $500 million | | 0.750% |
| |
Next $500 million | | 0.725 |
| |
Next $1 billion | | 0.700 |
| |
Next $2 billion | | 0.675 |
| |
Next $1 billion | | 0.650 |
| |
Next $5 billion | | 0.640 |
| |
Next $2 billion | | 0.630 |
| |
Next $4 billion | | 0.620 |
| |
Over $16 billion | | 0.610 |
For the six months ended March 31, 2020, the management fee was equivalent to an annual rate of 0.66% of the Fund’s average daily net assets.
Funds Management has retained the services of a subadviser to provide daily portfolio management to the Fund. The fee for subadvisory services is borne by Funds Management. Wells Capital Management Incorporated (“WellsCap”), an affiliate of Funds Management and an indirect wholly owned subsidiary of Wells Fargo, is the subadviser to the Fund and is entitled to receive a fee from Funds Management at an annual rate starting at 0.45% and declining to 0.30% as the average daily net assets of the Fund increase.
Administration fees
Under a class-level administration agreement, Funds Management provides class-level administrative services to the Fund, which includes paying fees and expenses for services provided by the transfer agent,sub-transfer agents, omnibus account servicers and record-keepers. As compensation for its services under the class-level administration agreement, Funds Management receives an annual fee which is calculated based on the average daily net assets of each class as follows:
| | |
| |
| | | Class-level
administration fee |
| |
Class A, Class C, Class R | | 0.21% |
| |
Class R6 | | 0.03 |
| |
Administrator Class, Institutional Class | | 0.13 |
Waivers and/or expense reimbursements
Funds Management has contractually waived and/or reimbursed management and administration fees to the extent necessary to maintain certain net operating expense ratios for the Fund. When each class of the Fund has exceeded its expense cap, Funds Management has waived fees and/or reimbursed expenses from fund-level expenses on a proportionate basis and then from class specific expenses. When only certain classes exceed their expense caps, waivers and/or reimbursements are applied against class specific expenses before fund-level expenses. Funds Management has committed through January 31, 2021 to waive fees and/or reimburse expenses to the extent necessary to cap the Fund’s expenses at 1.16% for Class A shares, 1.91% for Class C shares, 1.41% for Class R shares, 0.73% for Class R6 shares, 1.08% for Administrator Class shares, and 0.83% for Institutional Class shares. Prior to or after the commitment expiration date, the cap may be increased or the commitment to maintain the cap may be terminated only with the approval of the Board of Trustees.
Distribution fees
The Trust has adopted a distribution plan for Class C and Class R shares of the Fund pursuant to Rule12b-1 under the 1940 Act. Distribution fees are charged to Class C and Class R shares and paid to Wells Fargo Funds Distributor, LLC (“Funds Distributor”), the principal underwriter, at an annual rate of 0.75% of the average daily net assets of Class C shares and 0.25% of the average daily net assets of Class R shares.
In addition, Funds Distributor is entitled to receive thefront-end sales charge from the purchase of Class A shares and a contingent deferred sales charge on the redemption of certain Class A shares. Funds Distributor is also entitled to receive the
24 | Wells Fargo Special Mid Cap Value Fund
Notes to financial statements (unaudited)
contingent deferred sales charges from redemptions of Class C shares. For the six months ended March 31, 2020, Funds Distributor received $38,382 from the sale of Class A shares and $125 in contingent deferred sales charges from redemptions of Class C shares. No contingent deferred sales charges were incurred by Class A shares for the six months ended March 31, 2020.
Shareholder servicing fees
The Trust has entered into contracts with one or more shareholder servicing agents, whereby Class A, Class C, Class R, and Administrator Class of the Fund are charged a fee at an annual rate of 0.25% of the average daily net assets of each respective class. A portion of these total shareholder servicing fees were paid to affiliates of Wells Fargo.
Interfund transactions
The Fund may purchase or sell portfolio investment securities to certain other Wells Fargo affiliates pursuant to Rule17a-7 under the 1940 Act and under procedures adopted by the Board of Trustees. The procedures have been designed to ensure that these interfund transactions, which do not incur broker commissions, are effected at current market prices.
5. INVESTMENT PORTFOLIO TRANSACTIONS
Purchases and sales of investments, excluding U.S. government obligations (if any) and short-term securities, for the six months ended March 31, 2020 were $2,975,424,965 and $2,037,244,421, respectively.
6. SECURITIES LENDING TRANSACTIONS
The Fund lends its securities through an unaffiliated securities lending agent and receives collateral in the form of cash or securities with a value at least equal to the value of the securities on loan. The value of the loaned securities is determined at the close of each business day and any increases or decreases in the required collateral are exchanged between the Fund and the counterparty on the next business day. Cash collateral received is invested in the Securities Lending Fund which seeks to provide a positive return compared to the daily Fed Funds Open Rate by investing in high-quality, U.S. dollar-denominated short-term money market instruments and is exempt from registration under Section 3(c)(7) of the 1940 Act. Securities Lending Fund is managed by Funds Management and is subadvised by WellsCap. Funds Management receives an advisory fee starting at 0.05% and declining to 0.01% as the average daily net assets of the Securities Lending Fund increase. All of the fees received by Funds Management are paid to WellsCap for its services as subadviser.
In the event of counterparty default or the failure of a borrower to return a loaned security, the Fund has the right to use the collateral to offset any losses incurred. As of March 31, 2020, the Fund had securities lending transactions with the following counterparties which are subject to offset:
| | | | | | | | |
| | | |
| Counterparty | | Value of
securities on
loan | | Collateral
received1 | | Net amount | |
| | | |
Bank of America Securities Inc. | | $15,940,704 | | $(15,940,704) | | $ | 0 | |
| 1 | Collateral received within this table is limited to the collateral for the net transaction with the counterparty. |
7. DERIVATIVE TRANSACTIONS
During the six months ended March 31, 2020, the Fund entered into written options for hedging purposes. The Fund had an average of 15,355 written option contracts during the six months ended March 31, 2020.
The fair value, realized gains or losses and change in unrealized gains or losses, if any, on derivative instruments are reflected in the appropriate financial statements.
8. BANK BORROWINGS
The Trust (excluding the money market funds), Wells Fargo Master Trust and Wells Fargo Variable Trust are parties to a $280,000,000 revolving credit agreement whereby the Fund is permitted to use bank borrowings for temporary or emergency purposes, such as to fund shareholder redemption requests. Interest under the credit agreement is charged to the Fund based on a borrowing rate equal to the higher of the Federal Funds rate in effect on that day plus 1.25% or the overnight LIBOR rate in effect on that day plus 1.25%. In addition, an annual commitment fee equal to 0.25% of the unused balance is allocated to each participating fund.
For the six months ended March 31, 2020, there were no borrowings by the Fund under the agreement.
Wells Fargo Special Mid Cap Value Fund | 25
Notes to financial statements (unaudited)
9. INDEMNIFICATION
Under the Trust’s organizational documents, the officers and Trustees have been granted certain indemnification rights against certain liabilities that may arise out of performance of their duties to the Trust. Additionally, in the normal course of business, the Trust may enter into contracts with service providers that contain a variety of indemnification clauses. The Trust’s maximum exposure under these arrangements is dependent on future claims that may be made against the Fund and, therefore, cannot be estimated.
10. REDEMPTIONIN-KIND
After the close of business on January 31, 2020, the Fund redeemed assets through anin-kind redemption. In the redemption transaction, the Fund issued securities with a value of $11,005,873 and cash in the amount of $943,556. The Fund recognized gains in the amount of $59,791 which is reflected on the Statement of Operations. The redemptionin-kind by a shareholder of the Class R6 represented 0.11% of the Fund and is reflected on the Statement of Changes in Net Assets.
11. NEW ACCOUNTING PRONOUNCEMENT
In August 2018, FASB issued Accounting Standards Update (“ASU”)No. 2018-13, Fair Value Measurement (Topic 820)Disclosure Framework—Changes to the Disclosure Requirements for Fair Value Measurement.ASU2018-13 updates the disclosure requirements for fair value measurements by modifying or removing certain disclosures and adding certain new disclosures. The amendments are effective for fiscal years, and interim periods within those fiscal years, beginning after December 15, 2019. Early adoption is permitted. Management has adopted the removal and modification of disclosures early, as permitted, and will adopt the additional new disclosures at the effective date.
12. CORONAVIRUS(COVID-19) PANDEMIC
On March 11, 2020, the World Health Organization announced that it had made the assessment that coronavirus disease 2019 ("COVID-19") is a pandemic. The impacts of COVID-19 are adversely affecting the entire global economy, individual companies and investment products, and the market in general. There is significant uncertainty around the extent and duration of business disruptions related to COVID-19 and the impacts may be short term or may last for an extended period of time. The risk of further spreading of COVID-19 has led to significant uncertainty and volatility in the financial markets. The value of the Fund and the securities in which the Fund invests have generally been adversely affected by impacts caused by COVID-19.
26 | Wells Fargo Special Mid Cap Value Fund
Other information (unaudited)
PROXY VOTING INFORMATION
A description of the policies and procedures used to determine how to vote proxies relating to portfolio securities is available, upon request, by calling1-800-222-8222, visiting our website atwfam.com, or visiting the SEC website at sec.gov. Information regarding how the proxies related to portfolio securities were voted during the most recent12-month period ended June 30 is available on the website atwfam.comor by visiting the SEC website at sec.gov.
QUARTERLY PORTFOLIO HOLDINGS INFORMATION
The Fund files its complete schedule of portfolio holdings with the SEC for the first and third quarters of each fiscal year as an exhibit to its reports on FormN-PORT. Shareholders may view the filed FormN-PORT by visiting the SEC website at sec.gov.
Wells Fargo Special Mid Cap Value Fund | 27
Other information (unaudited)
BOARD OF TRUSTEES AND OFFICERS
Each of the Trustees and Officers1 listed in the table below acts in identical capacities for each fund in the Wells Fargo family of funds, which consists of 147 mutual funds comprising the Wells Fargo Funds Trust, Wells Fargo Variable Trust, Wells Fargo Master Trust and fourclosed-end funds (collectively the “Fund Complex”). This table should be read in conjunction with the Prospectus and the Statement of Additional Information2. The mailing address of each Trustee and Officer is 525 Market Street, 12th Floor, San Francisco, CA 94105. Each Trustee and Officer serves an indefinite term, however, each Trustee serves such term until reaching the mandatory retirement age established by the Trustees.
Independent Trustees
| | | | | | |
Name and
year of birth | | Position held and
length of service* | | Principal occupations during past five years or longer | | Current other
public company or
investment
company
directorships |
| | | |
| William R. Ebsworth (Born 1957) | | Trustee,
since 2015 | | Retired. From 1984 to 2013, equities analyst, portfolio manager, research director and chief investment officer at Fidelity Management and Research Company in Boston, Tokyo, and Hong Kong, and retired in 2013 as Chief Investment Officer of Fidelity Strategic Advisers, Inc. where he led a team of investment professionals managing client assets. Prior thereto, Board member of Hong Kong Securities Clearing Co., Hong Kong Options Clearing Corp., the Thailand International Fund, Ltd., Fidelity Investments Life Insurance Company, and Empire Fidelity Investments Life Insurance Company. Audit Committee Chair and Investment Committee Chair of the Vincent Memorial Hospital Endowment(non-profit organization). Mr. Ebsworth is a CFA® charterholder. | | N/A |
| | | |
| Jane A. Freeman (Born 1953) | | Trustee,
since 2015;
Chair Liaison,
since 2018 | | Retired. From 2012 to 2014 and 1999 to 2008, Chief Financial Officer of Scientific Learning Corporation. From 2008 to 2012, Ms. Freeman provided consulting services related to strategic business projects. Prior to 1999, Portfolio Manager at Rockefeller & Co. and Scudder, Stevens & Clark. Board member of the Harding Loevner Funds from 1996 to 2014, serving as both Lead Independent Director and chair of the Audit Committee. Board member of the Russell Exchange Traded Funds Trust from 2011 to 2012 and the chair of the Audit Committee. Ms. Freeman is a Board Member of The Ruth Bancroft Garden(non-profit organization). She is also an inactive Chartered Financial Analyst. | | N/A |
| | | |
| Isaiah Harris, Jr. (Born 1952) | | Trustee,
since 2009;
Audit Committee Chairman,
since 2019 | | Retired. Chairman of the Board of CIGNA Corporation since 2009, and Director since 2005. From 2003 to 2011, Director of Deluxe Corporation. Prior thereto, President and CEO of BellSouth Advertising and Publishing Corp. from 2005 to 2007, President and CEO of BellSouth Enterprises from 2004 to 2005 and President of BellSouth Consumer Services from 2000 to 2003. Emeritus member of the Iowa State University Foundation Board of Governors. Emeritus Member of the Advisory Board of Iowa State University School of Business. Advisory Board Member, Palm Harbor Academy (private school). Advisory Board Member, Child Evangelism Fellowship(non-profit). Mr. Harris is a certified public accountant (inactive status). | | CIGNA Corporation |
| | | |
| Judith M. Johnson (Born 1949) | | Trustee,
since 2008;
Audit Committee Chairman, from 2009 to 2018 | | Retired. Prior thereto, Chief Executive Officer and Chief Investment Officer of Minneapolis Employees Retirement Fund from 1996 to 2008. Ms. Johnson is an attorney, certified public accountant and a certified managerial accountant. | | N/A |
28 | Wells Fargo Special Mid Cap Value Fund
Other information (unaudited)
| | | | | | |
Name and
year of birth | | Position held and
length of service* | | Principal occupations during past five years or longer | | Current other
public company or
investment
company
directorships |
| | | |
| David F. Larcker (Born 1950) | | Trustee,
since 2009 | | James Irvin Miller Professor of Accounting at the Graduate School of Business, Stanford University, Director of the Corporate Governance Research Initiative and Senior Faculty of The Rock Center for Corporate Governance since 2006. From 2005 to 2008, Professor of Accounting at the Graduate School of Business, Stanford University. Prior thereto, Ernst & Young Professor of Accounting at The Wharton School, University of Pennsylvania from 1985 to 2005. | | N/A |
| | | |
| Olivia S. Mitchell (Born 1953) | | Trustee,
since 2006;
Nominating and Governance Committee Chair, since 2018 | | International Foundation of Employee Benefit Plans Professor, Wharton School of the University of Pennsylvania since 1993. Director of Wharton’s Pension Research Council and Boettner Center on Pensions & Retirement Research, and Research Associate at the National Bureau of Economic Research. Previously, Cornell University Professor from 1978 to 1993. | | N/A |
| | | |
| Timothy J. Penny (Born 1951) | | Trustee,
since 1996;
Chairman,
since 2018 | | President and Chief Executive Officer of Southern Minnesota Initiative Foundation, anon-profit organization, since 2007. Member of the Board of Trustees of NorthStar Education Finance, Inc., anon-profit organization, since 2007. | | N/A |
| | | |
| James G. Polisson (Born 1959) | | Trustee,
since 2018 | | Retired. Chief Marketing Officer, Source (ETF) UK Services, Ltd, from 2015 to 2017. From 2012 to 2015, Principal of The Polisson Group, LLC, a management consulting, corporate advisory and principal investing company. Chief Executive Officer and Managing Director at Russell Investments, Global Exchange Traded Funds from 2010 to 2012. Managing Director of Barclays Global Investors from 1998 to 2010 and Global Chief Marketing Officer for iShares and Barclays Global Investors from 2000 to 2010. Trustee of the San Francisco Mechanics’ Institute, anon-profit organization, from 2013 to 2015. Board member of the Russell Exchange Traded Fund Trust from 2011 to 2012. Director of Barclays Global Investors Holdings Deutschland GmbH from 2006 to 2009. Mr. Polisson is an attorney and has a retired status with the Massachusetts and District of Columbia Bar Associations. | | N/A |
| | | |
| Pamela Wheelock3 (Born 1959) | | Trustee,
since January 2020; previously Trustee from January 2018 to July 2019 | | Board member of the Destination Medical Center Economic Development Agency, Rochester, Minnesota since 2019. Acting Commissioner, Minnesota Department of Human Services, July 2019 through September 2019. Human Services Manager (part-time), Minnesota Department of Human Services, October 2019 through December 2019. Chief Operating Officer, Twin Cities Habitat for Humanity from 2017 to 2019. Vice President of University Services, University of Minnesota from 2012 to 2016. Prior thereto, on the Board of Directors, Governance Committee and Finance Committee for the Minnesota Philanthropy Partners (Saint Paul Foundation) from 2012 to 2018, Interim Chief Executive Officer of Blue Cross Blue Shield of Minnesota from 2011 to 2012, Chairman of the Board from 2009 to 2012 and Board Director from 2003 to 2015. Vice President, Leadership and Community Engagement, Bush Foundation, Saint Paul, Minnesota (a private foundation) from 2009 to 2011. Executive Vice President and Chief Financial Officer, Minnesota Sports and Entertainment from 2004 to 2009 and Senior Vice President from 2002 to 2004. Executive Vice President of the Minnesota Wild Foundation from 2004 to 2008. Commissioner of Finance, State of Minnesota, from 1999 to 2002. Currently Board Chair of the Minnesota Wild Foundation since 2010. | | N/A |
| * | Length of service dates reflect the Trustee’s commencement of service with the Trust’s predecessor entities, where applicable. |
Wells Fargo Special Mid Cap Value Fund | 29
Other information (unaudited)
Officers
| | | | |
Name and
year of birth | | Position held and
length of service | | Principal occupations during past five years or longer |
| | |
| Andrew Owen (Born 1960) | | President, since 2017 | | Executive Vice President of Wells Fargo & Company and Head of Affiliated Managers, Wells Fargo Asset Management, since 2014. In addition, Mr. Owen is currently President, Chief Executive Officer and Director of Wells Fargo Funds Management, LLC since 2017. Prior thereto, Executive Vice President responsible for marketing, investments and product development for Wells Fargo Funds Management, LLC, from 2009 to 2014. |
| | |
| Nancy Wiser1 (Born 1967) | | Treasurer, since 2012 | | Executive Vice President of Wells Fargo Funds Management, LLC since 2011. Chief Operating Officer and Chief Compliance Officer at LightBox Capital Management LLC, from 2008 to 2011. |
| | |
| Michelle Rhee (Born 1966) | | Chief Legal Officer, since 2019 | | Secretary of Wells Fargo Funds Management, LLC, Chief Legal Counsel of Wells Fargo Asset Management and Assistant General Counsel of Wells Fargo Bank, N.A. since 2018. Associate General Counsel and Managing Director of Bank of America Corporation from 2004 to 2018. |
| | |
| Catherine Kennedy (Born 1969) | | Secretary, since 2019 | | Vice President of Wells Fargo Funds Management, LLC and Senior Counsel of the Wells Fargo Legal Department since 2010. Vice President and Senior Counsel of Evergreen Investment Management Company, LLC from 1998 to 2010. |
| | |
| Michael H. Whitaker(Born 1967) | | Chief Compliance Officer, since 2016 | | Chief Compliance Officer of Wells Fargo Asset Management since 2016. Senior Vice President and Chief Compliance Officer for Fidelity Investments from 2007 to 2016. |
| | |
| David Berardi (Born 1975) | | Assistant Treasurer, since 2009 | | Vice President of Wells Fargo Funds Management, LLC since 2009. Vice President of Evergreen Investment Management Company, LLC from 2008 to 2010. Manager of Fund Reporting and Control for Evergreen Investment Management Company, LLC from 2004 to 2010. |
| | |
| Jeremy DePalma1 (Born 1974) | | Assistant Treasurer, since 2009 | | Senior Vice President of Wells Fargo Funds Management, LLC since 2009. Senior Vice President of Evergreen Investment Management Company, LLC from 2008 to 2010 and head of the Fund Reporting and Control Team within Fund Administration from 2005 to 2010. |
| 1 | Nancy Wiser acts as Treasurer of 65 funds in the Fund Complex. Jeremy DePalma acts as Treasurer of 82 funds and Assistant Treasurer of 65 funds in the Fund Complex. |
| 2 | The Statement of Additional Information includes additional information about the Trustees and is available, without charge, upon request, by calling1-800-222-8222 or by visiting the website atwfam.com. |
| 3 | Pamela Wheelock wasre-appointed to the Board effective January 1, 2020. |
30 | Wells Fargo Special Mid Cap Value Fund
Appendix I (unaudited)
Effective on or about May 1, 2020, if you purchase Fund shares through a Janney Montgomery Scott LLC (“Janney”) brokerage account, you will be eligible for the following load waivers(front-end sales charge waivers and contingent deferred sales charge (“CDSC”), orback-end sales charge, waivers) and discounts, which may differ from those disclosed elsewhere in the Fund’s Prospectus or SAI.
|
|
| Front-end sales charge* waivers on Class A shares available at Janney |
|
| Shares purchased through reinvestment of capital gains distributions and dividend reinvestment when purchasing shares of the same fund (but not any other fund within the fund family). |
|
| Shares purchased by employees and registered representatives of Janney or its affiliates and their family members as designated by Janney. |
|
| Shares purchased from the proceeds of redemptions within the same fund family, provided (1) the repurchase occurs within ninety (90) days following the redemption, (2) the redemption and purchase occur in the same account, and (3) redeemed shares were subject to afront-end or deferred sales load (i.e., right of reinstatement). |
|
| Employer-sponsored retirement plans (e.g., 401(k) plans, 457 plans, employer-sponsored 403(b) plans, profit sharing and money purchase pension plans and defined benefit plans). For purposes of this provision, employer-sponsored retirement plans do not include SEP IRAs, Simple IRAs,SAR-SEPs or Keogh plans. |
|
| Shares acquired through a right of reinstatement. |
|
| Class C shares that are no longer subject to a contingent deferred sales charge and are converted to Class A shares of the same fund pursuant to Janney’s policies and procedures. |
|
| CDSC waivers on Class A and Class C shares available at Janney |
|
| Shares sold upon the death or disability of the shareholder. |
|
| Shares sold as part of a systematic withdrawal plan as described in the Fund’s Prospectus. |
|
| Shares purchased in connection with a return of excess contributions from an IRA account. |
|
| Shares sold as part of a required minimum distribution for IRA and retirement accounts if the redemption is taken in or after the year the shareholder reaches qualified age based on applicable IRS regulations. |
|
| Shares sold to pay Janney fees but only if the transaction is initiated by Janney. |
|
| Shares acquired through a right of reinstatement. |
|
| Shares exchanged into the same share class of a different fund. |
|
| Front-end sales charge* discounts available at Janney; breakpoints, rights of accumulation and/or letters of intent |
|
| Breakpoints as described in the Fund’s Prospectus. |
|
| Rights of accumulation (“ROA”), which entitle shareholders to breakpoint discounts, will be automatically calculated based on the aggregated holding of fund family assets held by accounts within the purchaser’s household at Janney. Eligible fund family assets not held at Janney may be included in the ROA calculation only if the shareholder notifies his or her financial advisor about such assets. |
|
| Letters of intent which allow for breakpoint discounts based on anticipated purchases within a fund family, over a13-month time period. Eligible fund family assets not held at Janney Montgomery Scott may be included in the calculation of letters of intent only if the shareholder notifies his or her financial advisor about such assets. |
| *Also | referred to as an “initial sales charge.” |
Wells Fargo Special Mid Cap Value Fund | 31
Appendix II (unaudited)
Effective on or after May 1, 2020, clients of Edward Jones (also referred to as “shareholders”) purchasing Fund shares on the Edward Jones commission andfee-based platforms are eligible only for the following sales charge discounts (also referred to as “breakpoints”) and waivers, which can differ from breakpoints and waivers described elsewhere in this Prospectus or SAI or through another broker-dealer. In all instances, it is the shareholder’s responsibility to inform Edward Jones at the time of purchase of any relationship, holdings of Wells Fargo Funds or other facts qualifying the purchaser for breakpoints or waivers. Edward Jones can ask for documentation of such circumstance.
|
| Breakpoints available at Edward Jones |
|
| Rights of Accumulation (ROA) |
|
The applicable sales charge on a purchase of Class A shares is determined by taking into account all share classes (except any money market funds and retirement plan share classes) of Wells Fargo Funds held by the shareholder or in an account grouped by Edward Jones with other accounts for the purpose of providing certain pricing considerations (“pricing groups”). This includes all share classes held on the Edward Jones platform and/or held on another platform. The inclusion of eligible fund family assets in the rights of accumulation calculation is dependent on the shareholder notifying his or her financial advisor of such assets at the time of calculation. |
|
ROA is determined by calculating the higher of cost or market value (current shares x NAV). |
|
| Letter of Intent (LOI) |
|
Through a LOI, shareholders can receive the sales charge and breakpoint discounts for purchases shareholders intend to makeover a13-month period from the date Edward Jones receives the LOI. The LOI is determined by calculating the higher of cost or market value of qualifying holdings at LOI initiation in combination with the value that the shareholder intends to buy over a13-month period to calculate thefront-end sales charge and any breakpoint discounts. Each purchase the shareholder makes during that13-month period will receive the sales charge and breakpoint discount that applies to the total amount. The inclusion of eligible fund family assets in the LOI calculation is dependent on the shareholder notifying his or her financial advisor of such assets at the time of calculation. Purchases made before the LOI is received by Edward Jones are not covered under the LOI and will not reduce the sales charge previously paid. Sales charges will be adjusted if LOI is not met. |
| Sales charges are waived for the following shareholders and in the following situations at Edward Jones: |
● Associates of Edward Jones and its affiliates and their family members who are in the same pricing group (as determined by Edward Jones under its policies and procedures) as the associate. This waiver will continue for the remainder of the associate’s life if the associate retires from Edward Jones in good-standing. |
● Shares purchased in an Edward Jonesfee-based program. |
● Shares purchased through reinvestment of capital gains distributions and dividend reinvestment. |
● Shares purchased from the proceeds of redeemed shares of the same fund family so long as the following conditions are met: 1)the proceeds are from the sale of shares within 60 days of the purchase, and 2) the sale and purchase are made in the same share class and the same account or the purchase is made in an individual retirement account with proceeds from liquidations in anon-retirement account. |
● Shares exchanged into Class A shares from another share class so long as the exchange is into the same fund and was initiated at the discretion of Edward Jones. Edward Jones is responsible for any remaining CDSC due to the fund company, if applicable. Any future purchases are subject to the applicable sales charge as disclosed in the prospectus. |
● Exchanges from Class C shares to Class A shares of the same fund, generally, in the 84th month following the anniversary of the purchase date or earlier at the discretion of Edward Jones. |
If the shareholder purchases shares that are subject to a CDSC and those shares are redeemed before the CDSC is expired, the shareholder is
responsible to pay the CDSC except in the following conditions available at Edward Jones: |
● The death or disability of the shareholder. |
● Systematic withdrawals with up to 10% per year of the account value. |
● Return of excess contributions from an Individual Retirement Account (IRA). |
● Shares sold as part of a required minimum distribution for IRA and retirement accounts if the redemption is taken in or after the year the shareholder reaches qualified age based on applicable IRS regulation. |
● Shares sold to pay Edward Jones fees or costs in such cases where the transaction is initiated by Edward Jones. |
● Shares exchanged in an Edward Jonesfee-based program. |
● Shares acquired through NAV reinstatement. |
32 | Wells Fargo Special Mid Cap Value Fund
Appendix II (unaudited)
|
| Other Important Information for accounts at Edward Jones: |
Minimum Purchase Amounts ● $250 initial purchase minimum ● $50 subsequent purchase minimum |
Minimum Balances Edward Jones has the right to redeem at its discretion fund holdings with a balance of $250 or less. The following are examples of accounts that are not included in this policy: ● Afee-based account held on an Edward Jones platform ● A 529 account held on an Edward Jones platform ● An account with an active systematic investment plan or letter of intent (LOI) |
Changing Share Classes At any time it deems necessary, Edward Jones has the authority to exchange at NAV a shareholder’s holdings in a fund to Class A shares. |
Wells Fargo Special Mid Cap Value Fund | 33
This page is intentionally left blank.
This page is intentionally left blank.
This page is intentionally left blank.

For more information
More information about Wells Fargo Funds is available free upon request. To obtain literature, please write, visit the Fund’s website, or call:
Wells Fargo Funds
P.O. Box 219967
Kansas City, MO 64121-9967
Website:wfam.com
Individual investors:1-800-222-8222
Retail investment professionals:1-888-877-9275
Institutional investment professionals:1-866-765-0778

This report and the financial statements contained herein are submitted for the general information of the shareholders of the Fund. If this report is used for promotional purposes, distribution of the report must be accompanied or preceded by a current prospectus. Before investing, please consider the investment objectives, risks, charges, and expenses of the investment. For a current prospectus and, if available, a summary prospectus, containing this information, call1-800-222-8222 or visit the Fund’s website atwfam.com. Read the prospectus carefully before you invest or send money.
Wells Fargo Asset Management (WFAM) is the trade name for certain investment advisory/management firms owned by Wells Fargo & Company. These firms include but are not limited to Wells Capital Management Incorporated and Wells Fargo Funds Management, LLC. Certain products managed by WFAM entities are distributed by Wells Fargo Funds Distributor, LLC (a broker-dealer and Member FINRA).
This material is for general informational and educational purposes only and is NOT intended to provide investment advice or a recommendation of any kind—including a recommendation for any specific investment, strategy, or plan.
INVESTMENT PRODUCTS: NOT FDIC INSURED ◾ NO BANK GUARANTEE ◾ MAY LOSE VALUE
© 2020 Wells Fargo & Company. All rights reserved.
PAR-0420-06265 05-20
SA234/SAR234 03-20
Semi-Annual Report
March 31, 2020
Wells Fargo
International Bond Fund
Beginning on January 1, 2021, as permitted by new regulations adopted by the Securities and Exchange Commission, paper copies of the Wells Fargo Funds’ annual and semi-annual shareholder reports issued after this date will no longer be sent by mail, unless you specifically request paper copies of the reports. Instead, the reports will be made available on the Funds’ website, and you will be notified by mail each time a report is posted and provided with a website address to access the report.
If you already elected to receive shareholder reports electronically, you will not be affected by this change and you need not take any action. You may elect to receive shareholder reports and other communications from the Fund electronically at any time by contacting your financial intermediary (such as a broker-dealer or bank) or, if you are a direct investor, by calling1-800-222-8222 or by enrolling at wellsfargo.com/advantagedelivery.
You may elect to receive all future reports in paper free of charge. If you invest through a financial intermediary, you can contact your financial intermediary to request that you continue to receive paper copies of your shareholder reports; if you invest directly with the Fund, you can call 1-800-222-8222. Your election to receive reports in paper will apply to all Wells Fargo Funds held in your account with your financial intermediary or, if you are a direct investor, to all Wells Fargo Funds that you hold.
|
|
|
Reduce clutter. Save trees. |
Sign up for electronic delivery of prospectuses and
shareholder reports atwellsfargo.com/
advantagedelivery |
The views expressed and any forward-looking statements are as of March 31, 2020, unless otherwise noted, and are those of the Fund managers and/or Wells Fargo Asset Management. Discussions of individual securities, or the markets generally, or any Wells Fargo Fund are not intended as individual recommendations. Future events or results may vary significantly from those expressed in any forward-looking statements. The views expressed are subject to change at any time in response to changing circumstances in the market. Wells Fargo Asset Management and the Fund disclaim any obligation to publicly update or revise any views expressed or forward-looking statements.
INVESTMENT PRODUCTS: NOT FDIC INSURED ◾ NO BANK GUARANTEE ◾ MAY LOSE VALUE
Wells Fargo International Bond Fund | 1
Letter to shareholders (unaudited)

Andrew Owen
President
Wells Fargo Funds
“The period began with mixed data, leading to central bank support.”
Dear Shareholder:
We are pleased to offer you this semi-annual report for the Wells Fargo International Bond Fund for the six-month period that ended March 31, 2020. Global stock markets saw earlier gains erased in February and March as governments took unprecedented measures to stop the spread of the coronavirus at the expense of short-term economic output. Fixed-income markets were less battered, with U.S. government bonds achieving modest gains as central banks attempted to bolster capital markets and confidence.
For the period, U.S. stocks, based on the S&P 500 Index,1 returned -12.31% and international stocks, as measured by the MSCI ACWI ex USA Index (Net),2 fell 16.52%. The MSCI EM Index (Net)3 lost 14.55%. For bond investors, the Bloomberg Barclays U.S. Aggregate Bond Index4 added 3.33%, the Bloomberg Barclays Global Aggregate ex-USD Index5 returned -2.03%, the Bloomberg Barclays Municipal Bond Index6 gained a modest 0.10%, and the ICE BofA U.S. High Yield Index7 returned -10.86%.
The period began with mixed data, leading to central bank support.
As the fourth quarter of 2019 started, U.S.-China trade tensions were relaxing while optimism grew for a U.K. Brexit deal. The initial estimate of U.S. third-quarter gross domestic product growth was a resilient 1.9% annualized rate, while the U.S. unemployment rate fell to a 50-year low of 3.5% in September. Despite resilience among U.S. consumers, however, business confidence declined while manufacturing activity contracted. Concerned with a potential economic slowdown, the U.S. Federal Reserve (Fed) lowered interest rates a quarter point in late October—its third rate cut in four months. This helped push the S&P 500 Index to an all-time high while emerging market equities rallied and global bonds declined overall, reflecting a broad pickup in risk appetite.
Equity markets rallied in November despite ongoing geopolitical risks. Hopes for aU.S.-China trade deal buoyed investor confidence. U.S. business sentiment edged up, and manufacturing and services activity rose. With that positive backdrop, developed market equities outpaced those in emerging markets, and U.S. stocks outperformed non-U.S. stocks overall. While consumer confidence and purchasing manager activity rose in the eurozone, China reported weakening manufacturing and consumer data. Bond yields rose marginally, leading to slightly negative returns for global government and investment-grade corporate bonds.
Financial markets ended 2019 with a boost from the U.S. and China accord on a Phase One trade deal. That, along with the landslide win by the pro-Brexit U.K. Conservative
| 1 | The S&P 500 Index consists of 500 stocks chosen for market size, liquidity, and industry group representation. It is a market-value-weighted index with each stock’s weight in the index proportionate to its market value. You cannot invest directly in an index. |
| 2 | The Morgan Stanley Capital International (MSCI) All Country World Index (ACWI) ex USA Index (Net) is a free-float-adjusted market-capitalization-weighted index that is designed to measure the equity market performance of developed markets, excluding the United States. Source: MSCI. MSCI makes no express or implied warranties or representations and shall have no liability whatsoever with respect to any MSCI data contained herein. The MSCI data may not be further redistributed or used as a basis for other indices or any securities or financial products. This report is not approved, reviewed, or produced by MSCI. You cannot invest directly in an index. |
| 3 | The MSCI Emerging Markets (EM) Index (Net) is a free-float-adjusted market-capitalization-weighted index that is designed to measure equity market performance of emerging markets. You cannot invest directly in an index. |
| 4 | The Bloomberg Barclays U.S. Aggregate Bond Index is a broad-based benchmark that measures the investment-grade, U.S. dollar-denominated, fixed-rate taxable bond market, including Treasuries, government-related and corporate securities, mortgage-backed securities (agency fixed-rate and hybrid adjustable-rate mortgage pass-throughs), asset-backed securities, and commercial mortgage-backed securities. You cannot invest directly in an index. |
| 5 | The Bloomberg Barclays Global Aggregate ex-USD Index is an unmanaged index that provides a broad-based measure of the global investment-grade fixed-income markets excluding the U.S. dollar-denominated debt market. You cannot invest directly in an index. |
| 6 | The Bloomberg Barclays Municipal Bond Index is an unmanaged index composed of long-term tax-exempt bonds with a minimum credit rating of Baa. You cannot invest directly in an index. |
| 7 | The ICE BofA U.S. High Yield Index is a market-capitalization-weighted index of domestic and Yankee high-yield bonds. The index tracks the performance of high-yield securities traded in the U.S. bond market. You cannot invest directly in an index. Copyright 2020. ICE Data Indices, LLC. All rights reserved. |
2 | Wells Fargo International Bond Fund
Letter to shareholders (unaudited)
Party in a national election and ongoing central bank support, gave investors greater confidence. U.S. economic indicators were positive overall, with the exception of manufacturing activity and business confidence. Consumer confidence was resilient, fed by a robust labor market, tame inflation, and lower interest rates, which boosted housing affordability and stimulated homebuyer activity. The impeachment of U.S. President Donald Trump had little impact on markets. Meanwhile, slowing Chinese economic activity, partly attributable to the trade war, led to further government stimulus at year-end through lower reserve ratios, allowing banks to lend more money.
The year-end rally continued in early January 2020. However, capital market volatility spiked in late January on concerns over the potential impact of the coronavirus on the global economy and stock markets. With sentiment somewhat souring, perceived safe havens did well in January. The U.S. dollar and Japanese yen both rose, and government bonds outperformed equities. While the S&P 500 Index held its ground, emerging market equities tumbled, including those in Asia.
In February, the coronavirus became the major market focus. Fears of the virus’s impact on global growth led to expectations of increased global central bank monetary policy support. That led the 10-year U.S. Treasury yield to fall to an all-time low of 1.1% by the end of the month. Although equity markets initially shrugged off concerns about the outbreak, focusing instead on strong fourth-quarter earnings and improving business confidence in January, market sentiment turned sharply lower toward month-end. Oil prices tumbled as Russia and the Organization of the Petroleum Exporting Countries compounded a major decline in oil demand with a brutal price war, causing the price of West Texas Intermediate crude oil to fall 13% in February alone.
The global spread of the coronavirus led many countries to clamp down on social and business-related activity in order to contain the virus from causing even greater devastation and overwhelming the health care system. This abrupt stoppage of economic activity led to the sharp deceleration of global output, sending economies into a deep contraction. Central bank responses were swift, as they slashed interest rates and expanded quantitative easing programs to restore liquidity and confidence to the markets. In the U.S., the Fed launched several lending programs, funding investment-grade bonds, money market mutual funds, and commercial paper while purchasing Treasuries, mortgage-backed securities, and overnight repos. Meanwhile, stock markets tumbled quickly into a bear market, ending the longest bull stock market in U.S. history.
Don’t let short-term uncertainty derail long-term investment goals.
Periods of investment uncertainty can present challenges, but experience has taught us that maintaining long-term investment goals can be an effective way to plan for the future. To help you create a sound strategy based on your personal goals and risk tolerance, Wells Fargo Funds offers more than 100 mutual funds spanning a wide range of asset classes and investment styles. Although diversification cannot guarantee an investment profit or prevent losses, we believe it can be an effective way to manage investment risk and potentially smooth out overall portfolio performance. We encourage investors to know their investments and to understand that appropriate levels of risk-taking may unlock opportunities.
Thank you for choosing to invest with Wells Fargo Funds. We appreciate your confidence in us and remain committed to helping you meet your financial needs.
Sincerely,

Andrew Owen
President
Wells Fargo Funds
“Capital market volatility spiked in late January on concerns over the potential impact of the coronavirus on the global economy and stock markets.”
|
|
|
For further information about your Fund, contact your investment professional, visit our website at wfam.com, or call us directly at1-800-222-8222. |
Wells Fargo International Bond Fund | 3
Performance highlights (unaudited)
Investment objective
The Fund seeks total return, consisting of income and capital appreciation.
Manager
Wells Fargo Funds Management, LLC
Subadviser
Wells Fargo Asset Management (International) Limited
Portfolio managers
Michael Lee
Alex Perrin
Lauren van Biljon, CFA®‡
Peter Wilson
Average annual total returns (%) as of March 31, 20201
| | | | | | | | | | | | | | | | | | | | | | | | | | | | | | | | | | |
| | | | |
| | | | | Including sales charge | | | Excluding sales charge | | | Expense ratios2 (%) | |
| | | | | | | | | |
| | | Inception date | | 1 year | | | 5 year | | | 10 year | | | 1 year | | | 5 year | | | 10 year | | | Gross | | | Net3 | |
| | | | | | | | | | |
| Class A (ESIYX) | | 9-30-2003 | | | -3.97 | | | | -0.53 | | | | 0.44 | | | | 0.59 | | | | 0.39 | | | | 0.91 | | | | 1.28 | | | | 1.03 | |
| | | | | | | | | | |
| Class C (ESIVX) | | 9-30-2003 | | | -1.10 | | | | -0.35 | | | | 0.16 | | | | -0.10 | | | | -0.35 | | | | 0.16 | | | | 2.03 | | | | 1.78 | |
| | | | | | | | | | |
| Class R6 (ESIRX)4 | | 11-30-2012 | | | – | | | | – | | | | – | | | | 0.97 | | | | 0.78 | | | | 1.28 | | | | 0.90 | | | | 0.65 | |
| | | | | | | | | | |
| Administrator Class (ESIDX)5 | | 7-30-2010 | | | – | | | | – | | | | – | | | | 0.89 | | | | 0.59 | | | | 1.10 | | | | 1.22 | | | | 0.85 | |
| | | | | | | | | | |
| Institutional Class (ESICX) | | 12-15-1993 | | | – | | | | – | | | | – | | | | 0.98 | | | | 0.72 | | | | 1.24 | | | | 0.95 | | | | 0.70 | |
| | | | | | | | | | |
| Bloomberg Barclays Global Aggregateex-USD Index6 | | – | | | – | | | | – | | | | – | | | | 0.74 | | | | 2.04 | | | | 1.39 | | | | – | | | | – | |
Figures quoted represent past performance, which is no guarantee of future results, and do not reflect taxes that a shareholder may pay on an investment in a fund. Investment return and principal value of an investment will fluctuate so that an investor’s shares, when redeemed, may be worth more or less than their original cost. Performance shown without sales charges would be lower if sales charges were reflected. Current performance may be lower or higher than the performance data quoted, which assumes the reinvestment of dividends and capital gains. Currentmonth-end performance is available on the Fund’s website, wfam.com.
Index returns do not include transaction costs associated with buying and selling securities, any mutual fund fees or expenses, or any taxes. It is not possible to invest directly in an index.
For Class A shares, the maximumfront-end sales charge is 4.50%. For Class C shares, the maximum contingent deferred sales charge is 1.00%. Performance including a contingent deferred sales charge assumes the sales charge for the corresponding time period. Class R6, Administrator Class, and Institutional Class shares are sold without afront-end sales charge or contingent deferred sales charge.
Bond values fluctuate in response to the financial condition of individual issuers, general market and economic conditions, and changes in interest rates. Changes in market conditions and government policies may lead to periods of heightened volatility in the bond market and reduced liquidity for certain bonds held by the Fund. In general, when interest rates rise, bond values fall and investors may lose principal value. Interest rate changes and their impact on the fund and its share price can be sudden and unpredictable. Foreign investments are especially volatile and can rise or fall dramatically due to differences in the political and economic conditions of the host country. These risks are generally intensified in emerging markets. The use of derivatives may reduce returns and/or increase volatility. Securities issued by U.S. government agencies or government-sponsored entities may not be guaranteed by the U.S. Treasury. Certain investment strategies tend to increase the total risk of an investment (relative to the broader market). The Fund is exposed to high-yield securities risk and geographic risk. Consult the Fund’s prospectus for additional information on these and other risks.
Please see footnotes on page 5.
4 | Wells Fargo International Bond Fund
Performance highlights (unaudited)
| | | | |
|
| Ten largest holdings (%) as of March 31, 20207 | |
| | |
Japan, 0.10%,6-20-2029 | | | 7.16 | |
| | |
Japan, 0.10%,12-20-2029 | | | 4.40 | |
| | |
Japan, 0.10%,3-20-2027 | | | 4.29 | |
| | |
Spain Bonos y Obligaciones del Estado,0.60%, 10-31-2029 | | | 4.27 | |
| | |
Nykredit Realkredit AS, 1.00%,10-1-2050 | | | 3.53 | |
| | |
Realkredit Danmark AS, 1.00%,10-1-2050 | | | 3.53 | |
| | |
Mexico, 8.50%,5-31-2029 | | | 3.17 | |
| | |
Canada, 2.65%,12-15-2028 | | | 2.81 | |
| | |
Italy Buoni Poliennali del Tesoro, 0.35%,2-1-2025 | | | 2.69 | |
| | |
Province of Ontario, 2.70%,6-2-2029 | | | 2.54 | |
|
|
| Portfolio composition as of March 31, 20208 |
|
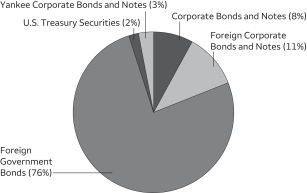
|
| ‡ | CFA® and Chartered Financial Analyst®are trademarks owned by CFA Institute. |
| 1 | Historical performance prior to July 12, 2010, is based on the performance of the Fund’s predecessor, Evergreen International Bond Fund. |
| 2 | Reflects the expense ratios as stated in the most recent prospectuses. The expense ratios shown are subject to change and may differ from the annualized expense ratios shown in the financial highlights of this report. |
| 3 | The manager has contractually committed through January 31, 2021, to waive fees and/or reimburse expenses to the extent necessary to cap total annual fund operating expenses after fee waivers at 1.03% for Class A, 1.78% for Class C, 0.65% for Class R6, 0.85% for Administrator Class, and 0.70% for Institutional Class. Brokerage commissions, stamp duty fees, interest, taxes, acquired fund fees and expenses (if any), and extraordinary expenses are excluded from the expense cap. Prior to or after the commitment expiration date, the cap may be increased or the commitment to maintain the cap may be terminated only with the approval of the Board of Trustees. Without this cap, the Fund’s returns would have been lower. The expense ratio paid by an investor is the net expense ratio (the total annual fund operating expenses after fee waivers) as stated in the prospectuses. |
| 4 | Historical performance shown for the Class R6 shares prior to their inception reflects the performance of the Institutional Class shares and includes the higher expenses applicable to the Institutional Class shares. If these expenses had not been included, returns for the Class R6 shares would be higher. |
| 5 | Historical performance shown for the Administrator Class shares prior to their inception reflects the performance of the Institutional Class shares and has been adjusted to reflect the higher expenses applicable to the Administrator Class shares. |
| 6 | The Bloomberg Barclays Global Aggregateex-USD Index is an unmanaged index that provides a broad-based measure of the global investment grade fixed income markets excluding the U.S. dollar-denominated debt market. You cannot invest directly in an index. |
| 7 | The ten largest holdings, excluding cash, cash equivalents and any money market funds, are calculated based on the value of the investments divided by total net assets of the Fund. Holdings are subject to change and may have changed since the date specified. |
| 8 | Amounts are calculated based on the total long-term investments of the Fund. These amounts are subject to change and may have changed since the date specified. |
Wells Fargo International Bond Fund | 5
Fund expenses (unaudited)
As a shareholder of the Fund, you incur two types of costs: (1) transaction costs, including sales charges (loads) on purchase payments and contingent deferred sales charges (if any) on redemptions and (2) ongoing costs, including management fees, distribution(12b-1) and/or shareholder servicing fees, and other Fund expenses. This example is intended to help you understand your ongoing costs (in dollars) of investing in the Fund and to compare these costs with the ongoing costs of investing in other mutual funds.
The example is based on an investment of $1,000 invested at the beginning of thesix-month period and held for the entire period from October 1, 2019 to March 31, 2020.
Actual expenses
The “Actual” line of the table below provides information about actual account values and actual expenses. You may use the information in this line, together with the amount you invested, to estimate the expenses that you paid over the period. Simply divide your account value by $1,000 (for example, an $8,600 account value divided by $1,000 = 8.6), then multiply the result by the number in the “Actual” line under the heading entitled “Expenses paid during period” for your applicable class of shares to estimate the expenses you paid on your account during this period.
Hypothetical example for comparison purposes
The “Hypothetical” line of the table below provides information about hypothetical account values and hypothetical expenses based on the Fund’s actual expense ratio and an assumed rate of return of 5% per year before expenses, which is not the Fund’s actual return. The hypothetical account values and expenses may not be used to estimate the actual ending account balance or expenses you paid for the period. You may use this information to compare the ongoing costs of investing in the Fund and other funds. To do so, compare this 5% hypothetical example with the 5% hypothetical examples that appear in the shareholder reports of the other funds.
Please note that the expenses shown in the table are meant to highlight your ongoing costs only and do not reflect any transactional costs, such as sales charges (loads) and contingent deferred sales charges. Therefore, the “Hypothetical” line of the table is useful in comparing ongoing costs only and will not help you determine the relative total costs of owning different funds. In addition, if these transactional costs were included, your costs would have been higher.
| | | | | | | | | | | | | | | | |
| | | Beginning
account value
10-1-2019 | | | Ending
account value
3-31-2020 | | | Expenses
paid during
the period¹ | | | Annualized net
expense ratio | |
| | | | | |
Class A | | | | | | | | | | | | | | | | |
| | | | |
Actual | | $ | 1,000.00 | | | $ | 971.29 | | | $ | 5.08 | | | | 1.03 | % |
| | | | |
Hypothetical (5% return before expenses) | | $ | 1,000.00 | | | $ | 1,019.85 | | | $ | 5.20 | | | | 1.03 | % |
| | | | | |
Class C | | | | | | | | | | | | | | | | |
| | | | |
Actual | | $ | 1,000.00 | | | $ | 967.94 | | | $ | 8.76 | | | | 1.78 | % |
| | | | |
Hypothetical (5% return before expenses) | | $ | 1,000.00 | | | $ | 1,016.10 | | | $ | 8.97 | | | | 1.78 | % |
| | | | | |
Class R6 | | | | | | | | | | | | | | | | |
| | | | |
Actual | | $ | 1,000.00 | | | $ | 972.85 | | | $ | 3.21 | | | | 0.65 | % |
| | | | |
Hypothetical (5% return before expenses) | | $ | 1,000.00 | | | $ | 1,021.75 | | | $ | 3.29 | | | | 0.65 | % |
| | | | | |
Administrator Class | | | | | | | | | | | | | | | | |
| | | | |
Actual | | $ | 1,000.00 | | | $ | 973.41 | | | $ | 4.19 | | | | 0.85 | % |
| | | | |
Hypothetical (5% return before expenses) | | $ | 1,000.00 | | | $ | 1,020.75 | | | $ | 4.29 | | | | 0.85 | % |
| | | | | |
Institutional Class | | | | | | | | | | | | | | | | |
| | | | |
Actual | | $ | 1,000.00 | | | $ | 972.74 | | | $ | 3.45 | | | | 0.70 | % |
| | | | |
Hypothetical (5% return before expenses) | | $ | 1,000.00 | | | $ | 1,021.50 | | | $ | 3.54 | | | | 0.70 | % |
| 1 | Expenses paid is equal to the annualized net expense ratio of each class multiplied by the average account value over the period, multiplied by the number of days in the most recent fiscal half-year divided by the number of days in the fiscal year (to reflect theone-half-year period). |
6 | Wells Fargo International Bond Fund
Portfolio of investments—March 31, 2020 (unaudited)
| | | | | | | | | | | | | | | | |
| | | Interest rate | | | Maturity date | | | Principal | | | Value | |
| Corporate Bonds and Notes: 7.95% | |
|
| United States: 7.95% | |
Amazon.com Incorporated (Consumer Discretionary, Internet & Direct Marketing Retail) | | | 3.15 | % | | | 8-22-2027 | | | $ | 500,000 | | | $ | 547,643 | |
Anheuser-Busch InBev Worldwide Incorporated (Consumer Staples, Beverages) | | | 4.15 | | | | 1-23-2025 | | | | 400,000 | | | | 431,472 | |
Apple Incorporated (Information Technology, Technology Hardware, Storage & Peripherals) | | | 2.90 | | | | 9-12-2027 | | | | 500,000 | | | | 533,968 | |
AT&T Incorporated (Communication Services, Diversified Telecommunication Services) | | | 4.35 | | | | 3-1-2029 | | | | 250,000 | | | | 268,807 | |
Bank of America Corporation (3 Month LIBOR +1.21%) (Financials, Banks) ± | | | 3.97 | | | | 2-7-2030 | | | | 500,000 | | | | 539,894 | |
BP Capital Markets America Incorporated (Energy, Oil, Gas & Consumable Fuels) | | | 3.22 | | | | 4-14-2024 | | | | 425,000 | | | | 434,701 | |
Campbell Soup Company (Consumer Staples, Food Products) | | | 3.65 | | | | 3-15-2023 | | | | 72,000 | | | | 73,336 | |
Comcast Corporation (Communication Services, Media) | | | 3.70 | | | | 4-15-2024 | | | | 400,000 | | | | 429,323 | |
CVS Health Corporation (Health Care, Health Care Providers & Services) | | | 4.10 | | | | 3-25-2025 | | | | 300,000 | | | | 315,725 | |
Discovery Communications LLC (Communication Services, Media) | | | 3.95 | | | | 3-20-2028 | | | | 300,000 | | | | 291,776 | |
Global Payments Incorporated (Information Technology, IT Services) | | | 3.20 | | | | 8-15-2029 | | | | 350,000 | | | | 341,926 | |
IBM Corporation (Information Technology, IT Services) | | | 3.30 | | | | 5-15-2026 | | | | 400,000 | | | | 429,006 | |
JPMorgan Chase & Company (Financials, Banks) | | | 3.30 | | | | 4-1-2026 | | | | 200,000 | | | | 209,879 | |
Mastercard Incorporated (Information Technology, IT Services) | | | 2.95 | | | | 6-1-2029 | | | | 400,000 | | | | 426,205 | |
Microsoft Corporation (Information Technology, Software) | | | 2.40 | | | | 8-8-2026 | | | | 500,000 | | | | 528,774 | |
Morgan Stanley (Financials, Capital Markets) | | | 3.88 | | | | 4-29-2024 | | | | 450,000 | | | | 472,165 | |
Oracle Corporation (Information Technology, Software) %% | | | 2.80 | | | | 4-1-2027 | | | | 250,000 | | | | 254,831 | |
Verizon Communications Incorporated (Communication Services, Diversified Telecommunication Services) | | | 4.33 | | | | 9-21-2028 | | | | 250,000 | | | | 288,100 | |
Visa Incorporated (Information Technology, IT Services) %% | | | 1.90 | | | | 4-15-2027 | | | | 75,000 | | | | 74,789 | |
Walmart Incorporated (Consumer Staples, Food & Staples Retailing) | | | 3.70 | | | | 6-26-2028 | | | | 500,000 | | | | 562,118 | |
Walt Disney Company (Communication Services, Entertainment) | | | 3.80 | | | | 3-22-2030 | | | | 150,000 | | | | 167,159 | |
| |
Total Corporate Bonds and Notes (Cost $7,262,287) | | | | 7,621,597 | |
| | | | | |
|
Foreign Corporate Bonds and Notes: 10.16% | |
|
| Denmark: 8.82% | |
Nordea Kredit Realkredit AS (Financials, Thrifts & Mortgage Finance) | | | 1.00 | | | | 10-1-2050 | | | DKK | 11,875,000 | | | | 1,686,579 | |
Nykredit Realkredit AS (Financials, Thrifts & Mortgage Finance) | | | 1.00 | | | | 10-1-2050 | | | DKK | 23,800,000 | | | | 3,385,851 | |
Realkredit Danmark AS (Financials, Thrifts & Mortgage Finance) | | | 1.00 | | | | 10-1-2050 | | | DKK | 23,850,000 | | | | 3,381,372 | |
| | | | |
| | | | | | | | | | | | | | | 8,453,802 | |
| | | | | | | | | | | | | | | | |
|
| Netherlands: 0.61% | |
Selecta Group BV (Consumer Discretionary, Internet & Direct Marketing Retail) | | | 5.88 | | | | 2-1-2024 | | | EUR | 300,000 | | | | 173,707 | |
Sigma Holdco BV (Consumer Staples, Food Products) | | | 5.75 | | | | 5-15-2026 | | | EUR | 200,000 | | | | 199,845 | |
United Group BV (Communication Services, Media) 144A | | | 3.13 | | | | 2-15-2026 | | | EUR | 125,000 | | | | 116,203 | |
Ziggo Bond Company BV (Communication Services, Media) 144A | | | 3.38 | | | | 2-28-2030 | | | EUR | 100,000 | | | | 98,812 | |
| | | | |
| | | | | | | | | | | | | | | 588,567 | |
| | | | | | | | | | | | | | | | |
|
| United Kingdom: 0.73% | |
Galaxy Bidco Limited (Financials, Insurance) | | | 6.50 | | | | 7-31-2026 | | | GBP | 200,000 | | | | 224,075 | |
Pinewood Finance Company Limited (Financials, Diversified Financial Services) | | | 3.25 | | | | 9-30-2025 | | | GBP | 100,000 | | | | 115,515 | |
Victoria plc (Consumer Discretionary, Household Durables) | | | 5.25 | | | | 7-15-2024 | | | EUR | 100,000 | | | | 81,615 | |
The accompanying notes are an integral part of these financial statements.
Wells Fargo International Bond Fund | 7
Portfolio of investments—March 31, 2020 (unaudited)
| | | | | | | | | | | | | | | | |
| | | Interest rate | | | Maturity date | | | Principal | | | Value | |
|
| United Kingdom (continued) | |
Virgin Media Secured Finance plc (Communication Services, Media) 144A | | | 4.25 | % | | | 1-15-2030 | | | GBP | 250,000 | | | $ | 279,628 | |
| | | | |
| | | | | | | | | | | | | | | 700,833 | |
| | | | | | | | | | | | | | | | |
| |
Total Foreign Corporate Bonds and Notes (Cost $10,666,127) | | | | 9,743,202 | |
| | | | | | | | | | | | | | | | |
|
| Foreign Government Bonds: 72.77% | |
Brazil | | | 10.00 | | | | 1-1-2023 | | | BRL | 2,675,000 | | | | 569,890 | |
Brazil | | | 10.00 | | | | 1-1-2025 | | | BRL | 685,000 | | | | 148,239 | |
Canada 144A | | | 2.10 | | | | 9-15-2029 | | | CAD | 700,000 | | | | 530,151 | |
Canada | | | 2.25 | | | | 6-1-2029 | | | CAD | 1,895,000 | | | | 1,530,179 | |
Canada 144A | | | 2.65 | | | | 12-15-2028 | | | CAD | 3,415,000 | | | | 2,695,261 | |
Colombia | | | 6.00 | | | | 4-28-2028 | | | COP | 2,435,000,000 | | | | 553,057 | |
France ¤ | | | 0.00 | | | | 3-25-2025 | | | EUR | 2,100,000 | | | | 2,355,554 | |
Hungary | | | 1.50 | | | | 8-24-2022 | | | HUF | 170,000,000 | | | | 522,890 | |
India | | | 7.32 | | | | 1-28-2024 | | | INR | 54,000,000 | | | | 755,916 | |
Indonesia | | | 6.50 | | | | 6-15-2025 | | | IDR | 9,500,000,000 | | | | 564,408 | |
Indonesia | | | 7.50 | | | | 8-15-2032 | | | IDR | 35,500,000,000 | | | | 2,007,133 | |
Indonesia | | | 8.25 | | | | 5-15-2029 | | | IDR | 20,250,000,000 | | | | 1,259,540 | |
Italy Buoni Poliennali del Tesoro | | | 0.35 | | | | 2-1-2025 | | | EUR | 2,400,000 | | | | 2,575,724 | |
Italy Buoni Poliennali del Tesoro | | | 1.35 | | | | 4-1-2030 | | | EUR | 1,350,000 | | | | 1,465,846 | |
Italy Buoni Poliennali del Tesoro | | | 3.00 | | | | 8-1-2029 | | | EUR | 1,550,000 | | | | 1,937,438 | |
Japan | | | 0.10 | | | | 3-20-2027 | | | JPY | 435,000,000 | | | | 4,108,034 | |
Japan | | | 0.10 | | | | 6-20-2029 | | | JPY | 730,000,000 | | | | 6,866,854 | |
Japan | | | 0.10 | | | | 12-20-2029 | | | JPY | 450,000,000 | | | | 4,218,763 | |
Korea Treasury Bond | | | 1.88 | | | | 6-10-2029 | | | KRW | 1,600,000,000 | | | | 1,347,686 | |
Korea Treasury Bond | | | 2.38 | | | | 3-10-2023 | | | KRW | 1,600,000,000 | | | | 1,361,066 | |
Malaysia | | | 3.90 | | | | 11-30-2026 | | | MYR | 1,100,000 | | | | 263,202 | |
Malaysia | | | 3.96 | | | | 9-15-2025 | | | MYR | 2,550,000 | | | | 613,913 | |
Mexico | | | 5.75 | | | | 3-5-2026 | | | MXN | 7,850,000 | | | | 312,676 | |
Mexico | | | 8.00 | | | | 11-7-2047 | | | MXN | 14,300,000 | | | | 601,911 | |
Mexico | | | 8.50 | | | | 5-31-2029 | | | MXN | 66,710,000 | | | | 3,035,013 | |
New South Wales | | | 5.00 | | | | 8-20-2024 | | | AUD | 750,000 | | | | 544,607 | |
New Zealand | | | 2.75 | | | | 4-15-2037 | | | NZD | 2,075,000 | | | | 1,430,920 | |
Poland | | | 2.50 | | | | 1-25-2023 | | | PLN | 2,275,000 | | | | 573,624 | |
Poland | | | 2.75 | | | | 10-25-2029 | | | PLN | 2,175,000 | | | | 573,859 | |
Province of British Columbia | | | 2.95 | | | | 12-18-2028 | | | CAD | 1,225,000 | | | | 950,517 | |
Province of Ontario | | | 2.70 | | | | 6-2-2029 | | | CAD | 3,200,000 | | | | 2,434,892 | |
Queensland Treasury Corporation 144A | | | 4.75 | | | | 7-21-2025 | | | AUD | 2,350,000 | | | | 1,732,114 | |
Republic of Peru | | | 5.70 | | | | 8-12-2024 | | | PEN | 850,000 | | | | 280,758 | |
Republic of South Africa | | | 8.75 | | | | 2-28-2048 | | | ZAR | 33,500,000 | | | | 1,403,926 | |
Republic of South Africa | | | 8.75 | | | | 2-28-2048 | | | ZAR | 500,000 | | | | 20,954 | |
Republic of South Africa | | | 10.50 | | | | 12-21-2026 | | | ZAR | 21,700,000 | | | | 1,237,866 | |
Romania | | | 3.25 | | | | 4-29-2024 | | | RON | 3,350,000 | | | | 741,189 | |
Romania | | | 3.40 | | | | 3-8-2022 | | | RON | 1,200,000 | | | | 272,022 | |
Romania | | | 4.85 | | | | 4-22-2026 | | | RON | 3,800,000 | | | | 888,220 | |
Romania | | | 5.00 | | | | 2-12-2029 | | | RON | 3,300,000 | | | | 758,119 | |
Russia | | | 6.50 | | | | 2-28-2024 | | | RUB | 93,300,000 | | | | 1,190,317 | |
Russia | | | 7.00 | | | | 12-15-2021 | | | RUB | 26,000,000 | | | | 335,693 | |
Singapore | | | 2.63 | | | | 5-1-2028 | | | SGD | 1,650,000 | | | | 1,285,081 | |
Singapore | | | 2.00 | | | | 2-1-2024 | | | SGD | 2,065,000 | | | | 1,511,103 | |
Spain Bonos y Obligaciones del Estado 144A | | | 0.60 | | | | 10-31-2029 | | | EUR | 3,730,000 | | | | 4,097,689 | |
Thailand | | | 1.45 | | | | 12-17-2024 | | | THB | 23,000,000 | | | | 713,480 | |
Turkey | | | 10.70 | | | | 2-17-2021 | | | TRY | 2,000,000 | | | | 302,196 | |
Turkey | | | 11.00 | | | | 2-24-2027 | | | TRY | 900,000 | | | | 123,842 | |
Turkey | | | 12.20 | | | | 1-18-2023 | | | TRY | 700,000 | | | | 105,583 | |
The accompanying notes are an integral part of these financial statements.
8 | Wells Fargo International Bond Fund
Portfolio of investments—March 31, 2020 (unaudited)
| | | | | | | | | | | | | | | | |
| | | Interest rate | | | Maturity date | | | Principal | | | Value | |
|
| Foreign Government Bonds (continued) | |
United Kingdom Gilt Bond | | | 0.63 | % | | | 6-7-2025 | | | GBP | 1,600,000 | | | $ | 2,030,467 | |
United Kingdom Gilt Bond | | | 0.88 | | | | 10-22-2029 | | | GBP | 850,000 | | | | 1,113,078 | |
United Kingdom Gilt Bond | | | 1.25 | | | | 7-22-2027 | | | GBP | 675,000 | | | | 903,541 | |
| | | | |
Total Foreign Government Bonds (Cost $74,636,809) | | | | | | | | | | | | | | | 69,756,001 | |
| | | | | | | | | | | | | | | | |
| | | | |
| U.S. Treasury Securities: 1.82% | | | | | | | | | | | | |
U.S. Treasury Bond | | | 2.00 | | | | 2-15-2050 | | | $ | 1,500,000 | | | | 1,742,168 | |
| | | | |
Total U.S. Treasury Securities (Cost $1,730,841) | | | | | | | | | | | | | | | 1,742,168 | |
| | | | | | | | | | | | | | | | |
| | | | |
| Yankee Corporate Bonds and Notes: 3.10% | | | | | | | | | | | | |
| | | | |
| Cayman Islands: 0.54% | | | | | | | | | | | | |
Tencent Holdings Limited (Communication Services, Interactive Media & Services) 144A | | | 3.28 | | | | 4-11-2024 | | | | 500,000 | | | | 517,775 | |
| | | | | | | | | | | | | | | | |
| | | | |
| France: 1.09% | | | | | | | | | | | | |
Danone SA (Consumer Staples, Food Products) | | | 2.95 | | | | 11-2-2026 | | | | 500,000 | | | | 499,288 | |
Electricite de France SA (Utilities, Electric Utilities) | | | 4.50 | | | | 9-21-2028 | | | | 500,000 | | | | 551,038 | |
| | | | |
| | | | | | | | | | | | | | | 1,050,326 | |
| | | | | | | | | | | | | | | | |
| | | | |
| Spain: 0.30% | | | | | | | | | | | | |
Telefonica Emisiones SAU (Communication Services, Diversified Telecommunication Services) | | | 4.10 | | | | 3-8-2027 | | | | 275,000 | | | | 285,208 | |
| | | | | | | | | | | | | | | | |
| | | | |
| United Kingdom: 1.17% | | | | | | | | | | | | |
International Game Technology plc (Consumer Discretionary, Hotels, Restaurants & Leisure) | | | 6.25 | | | | 2-15-2022 | | | | 300,000 | | | | 275,853 | |
State Grid Overseas Investment Limited (Utilities, Multi-Utilities) | | | 3.50 | | | | 5-4-2027 | | | | 275,000 | | | | 293,192 | |
Vodafone Group plc (Communication Services, Wireless Telecommunication Services) | | | 4.38 | | | | 5-30-2028 | | | | 525,000 | | | | 551,968 | |
| | | | |
| | | | | | | | | | | | | | | 1,121,013 | |
| | | | | | | | | | | | | | | | |
| | | | |
Total Yankee Corporate Bonds and Notes (Cost $2,879,822) | | | | | | | | | | | | | | | 2,974,322 | |
| | | | | | | | | | | | | | | | |
| | | | |
| | | | | | | | | | | | | | | | |
| | | Yield | | | | | | Shares | | | | |
| Short-Term Investments: 1.46% | | | | | | | | | | | | | | | | |
| | | | |
| Investment Companies: 1.46% | | | | | | | | | | | | |
Wells Fargo Government Money Market Fund Select Class (l)(u)## | | | 0.35 | | | | | | | | 1,403,201 | | | | 1,403,201 | |
| | | | | | | | | | | | | | | | |
| | | | |
Total Short-Term Investments (Cost $1,403,201) | | | | | | | | | | | | | | | 1,403,201 | |
| | | | | | | | | | | | | | | | |
| | | | | | | | |
| Total investments in securities (Cost $98,579,087) | | | 97.26 | % | | | 93,240,491 | |
| | |
Other assets and liabilities, net | | | 2.74 | | | | 2,622,313 | |
| | | | | | | | |
| Total net assets | | | 100.00 | % | | $ | 95,862,804 | |
| | | | | | | | |
| ± | Variable rate investment. The rate shown is the rate in effect at period end. |
| %% | The security is purchased on a when-issued basis. |
| 144A | The security may be resold in transactions exempt from registration, normally to qualified institutional buyers, pursuant to Rule 144A under the Securities Act of 1933. |
| ¤ | The security is issued in zero coupon form with no periodic interest payments. |
| (l) | The issuer of the security is an affiliated person of the Fund as defined in the Investment Company Act of 1940. |
| (u) | The rate represents the7-day annualized yield at period end. |
| ## | All or a portion of this security is segregated for when-issued securities. |
The accompanying notes are an integral part of these financial statements.
Wells Fargo International Bond Fund | 9
Portfolio of investments—March 31, 2020 (unaudited)
Abbreviations:
Forward Foreign Currency Contracts
| | | | | | | | | | | | | | |
Currency to be received | | Currency to be
delivered | | Counterparty | | Settlement
date | | Unrealized
gains | | | Unrealized
losses | |
| | | | | |
| 4,325,000 MXN | | 181,326 USD | | State Street Bank | | 4-7-2020 | | $ | 861 | | | $ | 0 | |
| | | | | |
| 52,385,000 MXN | | 2,756,758 USD | | State Street Bank | | 4-7-2020 | | | 0 | | | | (550,094 | ) |
| | | | | |
| 2,790,000 MXN | | 147,216 USD | | State Street Bank | | 4-7-2020 | | | 0 | | | | (29,690 | ) |
| | | | | |
| 2,869,827 USD | | 55,175,000 MXN | | State Street Bank | | 4-7-2020 | | | 545,637 | | | | 0 | |
| | | | | |
| 117,408 USD | | 2,750,000 MXN | | State Street Bank | | 4-7-2020 | | | 1,568 | | | | 0 | |
| | | | | |
| 62,227 USD | | 50,000 GBP | | State Street Bank | | 4-9-2020 | | | 117 | | | | 0 | |
| | | | | |
| 4,075,000 GBP | | 5,370,707 USD | | State Street Bank | | 4-9-2020 | | | 0 | | | | (308,701 | ) |
| | | | | |
| 2,794,073 USD | | 2,150,000 GBP | | State Street Bank | | 4-9-2020 | | | 123,321 | | | | 0 | |
| | | | | |
| 41,825,000 NOK | | 3,784,143 USD | | State Street Bank | | 4-27-2020 | | | 239,508 | | | | 0 | |
| | | | | |
| 4,000,000 NOK | | 423,141 USD | | State Street Bank | | 4-27-2020 | | | 0 | | | | (38,333 | ) |
| | | | | |
| 4,935,699 USD | | 44,325,000 NOK | | State Street Bank | | 4-27-2020 | | | 671,543 | | | | 0 | |
| | | | | |
| 161,349 USD | | 1,500,000 NOK | | State Street Bank | | 4-27-2020 | | | 17,046 | | | | 0 | |
| | | | | |
| 600,000 NZD | | 346,446 USD | | State Street Bank | | 4-28-2020 | | | 11,497 | | | | 0 | |
| | | | | |
| 2,700,000 NZD | | 1,576,341 USD | | State Street Bank | | 4-28-2020 | | | 34,402 | | | | 0 | |
| | | | | |
| 9,500,000 PLN | | 2,442,850 USD | | State Street Bank | | 4-28-2020 | | | 0 | | | | (146,762 | ) |
| | | | | |
| 2,463,547 USD | | 9,500,000 PLN | | State Street Bank | | 4-28-2020 | | | 167,459 | | | | 0 | |
| | | | | |
| 2,281,294 USD | | 3,490,000 NZD | | State Street Bank | | 4-28-2020 | | | 199,259 | | | | 0 | |
| | | | | |
| 1,104,025 USD | | 1,680,000 NZD | | State Street Bank | | 4-29-2020 | | | 101,791 | | | | 0 | |
| | | | | |
| 345,100 USD | | 580,000 NZD | | State Street Bank | | 4-29-2020 | | | 0 | | | | (909 | ) |
| | | | | |
| 19,185,000 CNY | | 2,762,896 USD | | State Street Bank | | 5-6-2020 | | | 0 | | | | (56,795 | ) |
| | | | | |
| 3,999,930 EUR | | 29,875,000 DKK | | State Street Bank | | 5-11-2020 | | | 0 | | | | (1,621 | ) |
The accompanying notes are an integral part of these financial statements.
10 | Wells Fargo International Bond Fund
Portfolio of investments—March 31, 2020 (unaudited)
| | | | | | | | | | | | | | |
Currency to be received | | Currency to be
delivered | | Counterparty | | Settlement
date | | Unrealized
gains | | | Unrealized
losses | |
| | | | | |
| 4,375,000 ZAR | | 250,343 USD | | State Street Bank | | 5-11-2020 | | $ | 0 | | | $ | (7,117 | ) |
| | | | | |
| 4,200,000 DKK | | 562,656 EUR | | State Street Bank | | 5-11-2020 | | | 0 | | | | (128 | ) |
| | | | | |
| 374,815 USD | | 5,850,000 ZAR | | State Street Bank | | 5-11-2020 | | | 49,586 | | | | 0 | |
| | | | | |
| 1,817,118 USD | | 28,150,000 ZAR | | State Street Bank | | 5-11-2020 | | | 252,129 | | | | 0 | |
| | | | | |
| 1,235,000 CAD | | 912,318 USD | | State Street Bank | | 5-26-2020 | | | 0 | | | | (34,285 | ) |
| | | | | |
| 6,060,000 CAD | | 4,516,456 USD | | State Street Bank | | 5-26-2020 | | | 0 | | | | (208,049 | ) |
| | | | | |
| 250,000 SGD | | 180,307 USD | | State Street Bank | | 5-26-2020 | | | 0 | | | | (4,271 | ) |
| | | | | |
| 1,711,867 USD | | 2,400,000 SGD | | State Street Bank | | 5-26-2020 | | | 21,917 | | | | 0 | |
| | | | | |
| 2,742,650 USD | | 53,200,000 MXN | | State Street Bank | | 5-26-2020 | | | 517,853 | | | | 0 | |
| | | | | |
| 9,611,160 USD | | 12,775,000 CAD | | State Street Bank | | 5-26-2020 | | | 528,668 | | | | 0 | |
| | | | | |
| 1,051,062 USD | | 21,000,000 MXN | | State Street Bank | | 5-26-2020 | | | 172,852 | | | | 0 | |
| | | | | |
| 1,426,952 USD | | 20,140,000,000 IDR | | State Street Bank | | 5-28-2020 | | | 198,199 | | | | 0 | |
| | | | | |
| 21,450,000 CZK | | 945,225 USD | | State Street Bank | | 6-8-2020 | | | 0 | | | | (81,449 | ) |
| | | | | |
| 468,248 USD | | 31,500,000 RUB | | State Street Bank | | 6-8-2020 | | | 71,308 | | | | 0 | |
| | | | | |
| 415,000 EUR | | 476,701 USD | | State Street Bank | | 6-9-2020 | | | 0 | | | | (17,802 | ) |
| | | | | |
| 31,000,000 THB | | 981,914 USD | | State Street Bank | | 6-9-2020 | | | 0 | | | | (37,029 | ) |
| | | | | |
| 9,440,000 EUR | | 10,594,890 USD | | State Street Bank | | 6-9-2020 | | | 0 | | | | (156,312 | ) |
| | | | | |
| 4,579,007 USD | | 30,435,000 DKK | | State Street Bank | | 6-9-2020 | | | 71,509 | | | | 0 | |
| | | | | |
| 2,451,758 USD | | 2,175,000 EUR | | State Street Bank | | 6-9-2020 | | | 46,683 | | | | 0 | |
| | | | | |
| 10,000,000 EUR | | 11,172,000 USD | | State Street Bank | | 6-16-2020 | | | 0 | | | | (111,363 | ) |
| | | | | |
| 1,460,000,000 JPY | | 13,872,063 USD | | State Street Bank | | 6-16-2020 | | | 0 | | | | (250,294 | ) |
| | | | | |
| 608,614 USD | | 65,000,000 JPY | | State Street Bank | | 6-16-2020 | | | 2,166 | | | | 0 | |
| | | | | |
| 825,083 USD | | 90,000,000 JPY | | State Street Bank | | 6-16-2020 | | | 0 | | | | (14,616 | ) |
| | | | | |
| 1,616,400 USD | | 1,500,000 EUR | | State Street Bank | | 6-16-2020 | | | 0 | | | | (42,696 | ) |
| | | | | |
| 2,406,571 USD | | 265,000,000 JPY | | State Street Bank | | 6-16-2020 | | | 0 | | | | (65,874 | ) |
| | | | | |
| 1,601,453 USD | | 177,325,000 JPY | | State Street Bank | | 6-16-2020 | | | 0 | | | | (52,986 | ) |
| | | | | | | | | | | | | | |
| | | | | |
| | | | | | | | $ | 4,046,879 | | | $ | (2,217,176 | ) |
| | | | | | | | | | | | | | |
Investments in Affiliates
An affiliated investment is an investment in which the Fund owns at least 5% of the outstanding voting shares of the issuer or as a result of other relationships, such as the Fund and the issuer having the same investment manager. Transactions with issuers that were either affiliated persons of the Fund at the beginning of the period or the end of the period were as follows:
| | | | | | | | | | | | | | | | | | | | | | | | | | | | | | | | | | | | |
| | | Shares,
beginning of
period | | | Shares
purchased | | | Shares
sold | | | Shares,
end of
period | | | Net
realized
gains
(losses) | | | Net
change in
unrealized
gains
(losses) | | | Income
from
affiliated
securities | | | Value,
end of
period | | | % of
net
assets | |
| | | | | | | | | |
| Short-Term Investments | | | | | | | | | | | | | | | | | | | | | | | | | | | |
Investment Companies | | | | | | | | | | | | | | | | | | | | | | | | | | | | | | | | | | | | |
Wells Fargo Government Money Market Fund Select Class | | | 446,052 | | | | 23,122,648 | | | | (22,165,499 | ) | | | 1,403,201 | | | $ | 0 | | | $ | 0 | | | $ | 11,806 | | | $ | 1,403,201 | | | | 1.46 | % |
The accompanying notes are an integral part of these financial statements.
Wells Fargo International Bond Fund | 11
Statement of assets and liabilities—March 31, 2020 (unaudited)
| | | | |
| | | | |
| |
Assets | | | | |
Investments in unaffiliated securities, at value (cost $97,175,886) | | $ | 91,837,290 | |
Investments in affiliated securities, at value (cost $1,403,201) | | | 1,403,201 | |
Foreign currency, at value (cost $164,763) | | | 165,412 | |
Receivable for investments sold | | | 407,967 | |
Receivable for Fund shares sold | | | 23,494 | |
Receivable for interest | | | 670,740 | |
Unrealized gains on forward foreign currency contracts | | | 4,046,879 | |
Prepaid expenses and other assets | | | 226,230 | |
| | | | |
Total assets | | | 98,781,213 | |
| | | | |
| |
Liabilities | | | | |
Payable for investments purchased | | | 491,552 | |
Payable for Fund shares redeemed | | | 112,975 | |
Unrealized losses on forward foreign currency contracts | | | 2,217,176 | |
Management fee payable | | | 4,723 | |
Administration fees payable | | | 7,421 | |
Distribution fee payable | | | 461 | |
Trustees’ fees and expenses payable | | | 4,099 | |
Accrued expenses and other liabilities | | | 80,002 | |
| | | | |
Total liabilities | | | 2,918,409 | |
| | | | |
Total net assets | | $ | 95,862,804 | |
| | | | |
| |
Net assets consist of | | | | |
Paid-in capital | | $ | 114,864,006 | |
Total distributable loss | | | (19,001,202 | ) |
| | | | |
Total net assets | | $ | 95,862,804 | |
| | | | |
| |
Computation of net asset value and offering price per share | | | | |
Net assets – Class A | | $ | 10,917,225 | |
Shares outstanding – Class A1 | | | 1,075,105 | |
Net asset value per share – Class A | | | $10.15 | |
Maximum offering price per share – Class A2 | | | $10.63 | |
Net assets – Class C | | $ | 767,501 | |
Shares outstanding – Class C1 | | | 79,443 | |
Net asset value per share – Class C | | | $9.66 | |
Net assets – Class R6 | | $ | 7,650,652 | |
Shares outstanding – Class R61 | | | 736,015 | |
Net asset value per share – Class R6 | | | $10.39 | |
Net assets – Administrator Class | | $ | 11,282,503 | |
Shares outstanding – Administrator Class1 | | | 1,101,234 | |
Net asset value per share – Administrator Class | | | $10.25 | |
Net assets – Institutional Class | | $ | 65,244,923 | |
Shares outstanding – Institutional Class1 | | | 6,301,389 | |
Net asset value per share – Institutional Class | | | $10.35 | |
| 1 | The Fund has an unlimited number of authorized shares. |
| 2 | Maximum offering price is computed as 100/95.50 of net asset value. On investments of $50,000 or more, the offering price is reduced. |
The accompanying notes are an integral part of these financial statements.
12 | Wells Fargo International Bond Fund
Statement of operations—six months ended March 31, 2020 (unaudited)
| | | | |
| | | | |
| |
Investment income | | | | |
Interest (net of foreign withholding taxes of $37,057) | | $ | 1,622,669 | |
Income from affiliated securities | | | 11,806 | |
| | | | |
Total investment income | | | 1,634,475 | |
| | | | |
| |
Expenses | | | | |
Management fee | | | 328,407 | |
Administration fees | | | | |
Class A | | | 9,560 | |
Class C | | | 653 | |
Class R6 | | | 1,260 | |
Administrator Class | | | 8,062 | |
Institutional Class | | | 28,871 | |
Shareholder servicing fees | | | | |
Class A | | | 14,938 | |
Class C | | | 1,021 | |
Administrator Class | | | 20,156 | |
Distribution fee | | | | |
Class C | | | 3,047 | |
Custody and accounting fees | | | 150,411 | |
Professional fees | | | 28,579 | |
Registration fees | | | 30,082 | |
Shareholder report expenses | | | 45,124 | |
Trustees’ fees and expenses | | | 11,029 | |
Other fees and expenses | | | 8,519 | |
| | | | |
Total expenses | | | 689,719 | |
Less: Fee waivers and/or expense reimbursements | | | | |
Fund-level | | | (258,543 | ) |
Class A | | | (575 | ) |
Class R6 | | | (329 | ) |
Administrator Class | | | (10,170 | ) |
Institutional Class | | | (2,884 | ) |
| | | | |
Net expenses | | | 417,218 | |
| | | | |
Net investment income | | | 1,217,257 | |
| | | | |
| |
Realized and unrealized gains (losses) on investments | | | | |
Net realized losses on | | | | |
Unaffiliated securities | | | (975,708 | ) |
Forward foreign currency contracts | | | (229,767 | ) |
| | | | |
Net realized losses on investments | | | (1,205,475 | ) |
| | | | |
| |
Net change in unrealized gains (losses) on | | | | |
Unaffiliated securities | | | (5,122,300 | ) |
Forward foreign currency contracts | | | 2,537,531 | |
| | | | |
Net change in unrealized gains (losses) on investments | | | (2,584,769 | ) |
| | | | |
Net realized and unrealized gains (losses) on investments | | | (3,790,244 | ) |
| | | | |
Net decrease in net assets resulting from operations | | $ | (2,572,987 | ) |
| | | | |
The accompanying notes are an integral part of these financial statements.
Wells Fargo International Bond Fund | 13
Statement of changes in net assets
| | | | | | | | | | | | | | | | |
| | | Six months ended
March 31, 2020
(unaudited) | | | Year ended
September 30, 2019 | |
| | | | |
Operations | | | | | | | | | | | | | | | | |
Net investment income | | | | | | $ | 1,217,257 | | | | | | | $ | 7,564,786 | |
Net realized losses on investments | | | | | | | (1,205,475 | ) | | | | | | | (17,627,770 | ) |
Net change in unrealized gains (losses) on investments | | | | | | | (2,584,769 | ) | | | | | | | 25,851,494 | |
| | | | |
Net increase (decrease) in net assets resulting from operations | | | | | | | (2,572,987 | ) | | | | | | | 15,788,510 | |
| | | | |
| | | | |
Capital share transactions | | | Shares | | | | | | | | Shares | | | | | |
Proceeds from shares sold | | | | | | | | | | | | | | | | |
Class A | | | 72,216 | | | | 761,232 | | | | 382,864 | | | | 3,845,786 | |
Class C | | | 17,463 | | | | 162,310 | | | | 4,716 | | | | 45,352 | |
Class R6 | | | 470 | | | | 5,059 | | | | 240,845 | | | | 2,428,431 | |
Administrator Class | | | 366,060 | | | | 3,877,305 | | | | 326,113 | | | | 3,274,172 | |
Institutional Class | | | 1,327,660 | | | | 14,285,971 | | | | 1,734,775 | | | | 17,401,980 | |
| | | | |
| | | | | | | 19,091,877 | | | | | | | | 26,995,721 | |
| | | | |
Payment for shares redeemed | | | | | | | | | | | | | | | | |
Class A | | | (176,971 | ) | | | (1,856,595 | ) | | | (3,796,911 | ) | | | (36,769,127 | ) |
Class C | | | (40,909 | ) | | | (409,246 | ) | | | (186,284 | ) | | | (1,790,879 | ) |
Class R6 | | | (105,548 | ) | | | (1,133,567 | ) | | | (4,444,880 | ) | | | (44,590,677 | ) |
Administrator Class | | | (994,226 | ) | | | (10,593,144 | ) | | | (1,459,494 | ) | | | (14,446,041 | ) |
Institutional Class | | | (2,333,269 | ) | | | (24,938,040 | ) | | | (19,409,739 | ) | | | (197,377,886 | ) |
| | | | |
| | | | | | | (38,930,592 | ) | | | | | | | (294,974,610 | ) |
| | | | |
Net decrease in net assets resulting from capital share transactions | | | | | | | (19,838,715 | ) | | | | | | | (267,978,889 | ) |
| | | | |
Total decrease in net assets | | | | | | | (22,411,702 | ) | | | | | | | (252,190,379 | ) |
| | | | |
| | | | |
Net assets | | | | | | | | | | | | | | | | |
Beginning of period | | | | | | | 118,274,506 | | | | | | | | 370,464,885 | |
| | | | |
End of period | | | | | | $ | 95,862,804 | | | | | | | $ | 118,274,506 | |
| | | | |
The accompanying notes are an integral part of these financial statements.
14 | Wells Fargo International Bond Fund
Financial highlights
(For a share outstanding throughout each period)
| | | | | | | | | | | | | | | | | | | | | | | | | | | | |
| | | Six months ended
March 31, 2020
(unaudited) | | | Year ended September 30 | | | Year ended October 31 | |
| CLASS A | | 2019 | | | 2018 | | | 2017 | | | 20161 | | | 2015 | | | 2014 | |
Net asset value, beginning of period | | | $10.45 | | | | $9.69 | | | | $10.31 | | | | $10.77 | | | | $9.74 | | | | $10.84 | | | | $11.32 | |
Net investment income | | | 0.10 | 2 | | | 0.32 | 2 | | | 0.27 | 2 | | | 0.26 | 2 | | | 0.24 | 2 | | | 0.31 | 2 | | | 0.37 | 2 |
Net realized and unrealized gains (losses) on investments | | | (0.40 | ) | | | 0.44 | | | | (0.89 | ) | | | (0.57 | ) | | | 0.85 | | | | (1.33 | ) | | | (0.34 | ) |
| | | | | | | | | | | | | | | | | | | | | | | | | | | | |
Total from investment operations | | | (0.30 | ) | | | 0.76 | | | | (0.62 | ) | | | (0.31 | ) | | | 1.09 | | | | (1.02 | ) | | | 0.03 | |
Distributions to shareholders from | | | | | | | | | | | | | | | | | | | | | | | | | | | | |
Net investment income | | | 0.00 | | | | 0.00 | | | | 0.00 | | | | 0.00 | | | | 0.00 | | | | (0.05 | ) | | | (0.12 | ) |
Net realized gains | | | 0.00 | | | | 0.00 | | | | 0.00 | | | | (0.15 | ) | | | (0.06 | ) | | | (0.03 | ) | | | (0.39 | ) |
| | | | | | | | | | | | | | | | | | | | | | | | | | | | |
Total distributions to shareholders | | | 0.00 | | | | 0.00 | | | | 0.00 | | | | (0.15 | ) | | | (0.06 | ) | | | (0.08 | ) | | | (0.51 | ) |
Net asset value, end of period | | | $10.15 | | | | $10.45 | | | | $9.69 | | | | $10.31 | | | | $10.77 | | | | $9.74 | | | | $10.84 | |
Total return3 | | | (2.87 | )% | | | 7.84 | % | | | (6.01 | )% | | | (2.78 | )% | | | 11.24 | % | | | (9.50 | )% | | | 0.26 | % |
Ratios to average net assets (annualized) | | | | | | | | | | | | | | | | | | | | | | | | | | | | |
Gross expenses | | | 1.51 | % | | | 1.30 | % | | | 1.08 | % | | | 1.03 | % | | | 1.08 | % | | | 1.06 | % | | | 1.05 | % |
Net expenses | | | 1.03 | % | | | 1.03 | % | | | 1.03 | % | | | 1.03 | % | | | 1.03 | % | | | 1.03 | % | | | 1.03 | % |
Net investment income | | | 1.95 | % | | | 3.21 | % | | | 2.75 | % | | | 2.61 | % | | | 2.64 | % | | | 3.07 | % | | | 3.29 | % |
Supplemental data | | | | | | | | | | | | | | | | | | | | | | | | | | | | |
Portfolio turnover rate | | | 81 | % | | | 129 | % | | | 99 | % | | | 68 | % | | | 96 | % | | | 136 | % | | | 103 | % |
Net assets, end of period (000s omitted) | | | $10,917 | | | | $12,329 | | | | $44,519 | | | | $69,885 | | | | $54,399 | | | | $79,727 | | | | $102,624 | |
| 1 | For the eleven months ended September 30, 2016. The Fund changed its fiscal year end from October 31 to September 30, effective September 30, 2016. |
| 2 | Calculated based upon average shares outstanding |
| 3 | Total return calculations do not include any sales charges. Returns for periods of less than one year are not annualized. |
The accompanying notes are an integral part of these financial statements.
Wells Fargo International Bond Fund | 15
Financial highlights
(For a share outstanding throughout each period)
| | | | | | | | | | | | | | | | | | | | | | | | | | | | |
| | | Six months ended
March 31, 2020
(unaudited) | | | Year ended September 30 | | | Year ended October 31 | |
| CLASS C | | 2019 | | | 2018 | | | 2017 | | | 20161 | | | 2015 | | | 2014 | |
Net asset value, beginning of period | | | $9.98 | | | | $9.32 | | | | $10.00 | | | | $10.52 | | | | $9.58 | | | | $10.70 | | | | $11.19 | |
Net investment income | | | 0.06 | 2 | | | 0.24 | 2 | | | 0.19 | 2 | | | 0.18 | 2 | | | 0.17 | 2 | | | 0.23 | 2 | | | 0.28 | 2 |
Net realized and unrealized gains (losses) on investments | | | (0.38 | ) | | | 0.42 | | | | (0.87 | ) | | | (0.55 | ) | | | 0.83 | | | | (1.32 | ) | | | (0.34 | ) |
| | | | | | | | | | | | | | | | | | | | | | | | | | | | |
Total from investment operations | | | (0.32 | ) | | | 0.66 | | | | (0.68 | ) | | | (0.37 | ) | | | 1.00 | | | | (1.09 | ) | | | (0.06 | ) |
Distributions to shareholders from | | | | | | | | | | | | | | | | | | | | | | | | | | | | |
Net investment income | | | 0.00 | | | | 0.00 | | | | 0.00 | | | | 0.00 | | | | 0.00 | | | | 0.00 | | | | (0.04 | ) |
Net realized gains | | | 0.00 | | | | 0.00 | | | | 0.00 | | | | (0.15 | ) | | | (0.06 | ) | | | (0.03 | ) | | | (0.39 | ) |
| | | | | | | | | | | | | | | | | | | | | | | | | | | | |
Total distributions to shareholders | | | 0.00 | | | | 0.00 | | | | 0.00 | | | | (0.15 | ) | | | (0.06 | ) | | | (0.03 | ) | | | (0.43 | ) |
Net asset value, end of period | | | $9.66 | | | | $9.98 | | | | $9.32 | | | | $10.00 | | | | $10.52 | | | | $9.58 | | | | $10.70 | |
Total return3 | | | (3.21 | )% | | | 7.08 | % | | | (6.80 | )% | | | (3.43 | )% | | | 10.49 | % | | | (10.21 | )% | | | (0.52 | )% |
Ratios to average net assets (annualized) | | | | | | | | | | | | | | | | | | | | | | | | | | | | |
Gross expenses | | | 2.25 | % | | | 2.04 | % | | | 1.83 | % | | | 1.78 | % | | | 1.83 | % | | | 1.81 | % | | | 1.80 | % |
Net expenses | | | 1.78 | % | | | 1.78 | % | | | 1.78 | % | | | 1.78 | % | | | 1.78 | % | | | 1.78 | % | | | 1.78 | % |
Net investment income | | | 1.20 | % | | | 2.51 | % | | | 2.00 | % | | | 1.88 | % | | | 1.86 | % | | | 2.33 | % | | | 2.54 | % |
Supplemental data | | | | | | | | | | | | | | | | | | | | | | | | | | | | |
Portfolio turnover rate | | | 81 | % | | | 129 | % | | | 99 | % | | | 68 | % | | | 96 | % | | | 136 | % | | | 103 | % |
Net assets, end of period (000s omitted) | | | $768 | | | | $1,027 | | | | $2,652 | | | | $3,493 | | | | $5,520 | | | | $6,895 | | | | $11,597 | |
| 1 | For the eleven months ended September 30, 2016. The Fund changed its fiscal year end from October 31 to September 30, effective September 30, 2016. |
| 2 | Calculated based upon average shares outstanding |
| 3 | Total return calculations do not include any sales charges. Returns for periods of less than one year are not annualized. |
The accompanying notes are an integral part of these financial statements.
16 | Wells Fargo International Bond Fund
Financial highlights
(For a share outstanding throughout each period)
| | | | | | | | | | | | | | | | | | | | | | | | | | | | |
| | | Six months ended
March 31, 2020
(unaudited) | | | Year ended September 30 | | | Year ended October 31 | |
| CLASS R6 | | 2019 | | | 2018 | | | 2017 | | | 20161 | | | 2015 | | | 2014 | |
Net asset value, beginning of period | | | $10.68 | | | | $9.86 | | | | $10.45 | | | | $10.88 | | | | $9.80 | | | | $10.88 | | | | $11.36 | |
Net investment income | | | 0.13 | 2 | | | 0.37 | 2 | | | 0.31 | 2 | | | 0.30 | 2 | | | 0.28 | 2 | | | 0.35 | 2 | | | 0.42 | 2 |
Net realized and unrealized gains (losses) on investments | | | (0.42 | ) | | | 0.45 | | | | (0.90 | ) | | | (0.58 | ) | | | 0.86 | | | | (1.34 | ) | | | (0.35 | ) |
| | | | | | | | | | | | | | | | | | | | | | | | | | | | |
Total from investment operations | | | (0.29 | ) | | | 0.82 | | | | (0.59 | ) | | | (0.28 | ) | | | 1.14 | | | | (0.99 | ) | | | 0.07 | |
Distributions to shareholders from | | | | | | | | | | | | | | | | | | | | | | | | | | | | |
Net investment income | | | 0.00 | | | | 0.00 | | | | 0.00 | | | | 0.00 | | | | 0.00 | | | | (0.06 | ) | | | (0.16 | ) |
Net realized gains | | | 0.00 | | | | 0.00 | | | | 0.00 | | | | (0.15 | ) | | | (0.06 | ) | | | (0.03 | ) | | | (0.39 | ) |
| | | | | | | | | | | | | | | | | | | | | | | | | | | | |
Total distributions to shareholders | | | 0.00 | | | | 0.00 | | | | 0.00 | | | | (0.15 | ) | | | (0.06 | ) | | | (0.09 | ) | | | (0.55 | ) |
Net asset value, end of period | | | $10.39 | | | | $10.68 | | | | $9.86 | | | | $10.45 | | | | $10.88 | | | | $9.80 | | | | $10.88 | |
Total return3 | | | (2.72 | )% | | | 8.32 | % | | | (5.65 | )% | | | (2.48 | )% | | | 11.69 | % | | | (9.18 | )% | | | 0.60 | % |
Ratios to average net assets (annualized) | | | | | | | | | | | | | | | | | | | | | | | | | | | | |
Gross expenses | | | 1.13 | % | | | 0.90 | % | | | 0.72 | % | | | 0.65 | % | | | 0.70 | % | | | 0.68 | % | | | 0.67 | % |
Net expenses | | | 0.65 | % | | | 0.65 | % | | | 0.65 | % | | | 0.65 | % | | | 0.65 | % | | | 0.65 | % | | | 0.65 | % |
Net investment income | | | 2.33 | % | | | 3.68 | % | | | 3.18 | % | | | 3.01 | % | | | 3.00 | % | | | 3.46 | % | | | 3.64 | % |
Supplemental data | | | | | | | | | | | | | | | | | | | | | | | | | | | | |
Portfolio turnover rate | | | 81 | % | | | 129 | % | | | 99 | % | | | 68 | % | | | 96 | % | | | 136 | % | | | 103 | % |
Net assets, end of period (000s omitted) | | | $7,651 | | | | $8,979 | | | | $49,749 | | | | $30,876 | | | | $12,501 | | | | $13,152 | | | | $5,729 | |
| 1 | For the eleven months ended September 30, 2016. The Fund changed its fiscal year end from October 31 to September 30, effective September 30, 2016. |
| 2 | Calculated based upon average shares outstanding |
| 3 | Returns for periods of less than one year are not annualized. |
The accompanying notes are an integral part of these financial statements.
Wells Fargo International Bond Fund | 17
Financial highlights
(For a share outstanding throughout each period)
| | | | | | | | | | | | | | | | | | | | | | | | | | | | |
| | | Six months ended
March 31, 2020
(unaudited) | | | Year ended September 30 | | | Year ended October 31 | |
| ADMINISTRATOR C LASS | | 2019 | | | 2018 | | | 2017 | | | 20161 | | | 2015 | | | 2014 | |
Net asset value, beginning of period | | | $10.53 | | | | $9.75 | | | | $10.36 | | | | $10.80 | | | | $9.75 | | | | $10.84 | | | | $11.32 | |
Net investment income | | | 0.11 | 2 | | | 0.34 | 2 | | | 0.29 | 2 | | | 0.28 | 2 | | | 0.26 | 2 | | | 0.33 | 2 | | | 0.39 | 2 |
Net realized and unrealized gains (losses) on investments | | | (0.39 | ) | | | 0.44 | | | | (0.90 | ) | | | (0.57 | ) | | | 0.85 | | | | (1.34 | ) | | | (0.34 | ) |
| | | | | | | | | | | | | | | | | | | | | | | | | | | | |
Total from investment operations | | | (0.28 | ) | | | 0.78 | | | | (0.61 | ) | | | (0.29 | ) | | | 1.11 | | | | (1.01 | ) | | | 0.05 | |
Distributions to shareholders from | | | | | | | | | | | | | | | | | | | | | | | | | | | | |
Net investment income | | | 0.00 | | | | 0.00 | | | | 0.00 | | | | 0.00 | | | | 0.00 | | | | (0.05 | ) | | | (0.14 | ) |
Net realized gains | | | 0.00 | | | | 0.00 | | | | 0.00 | | | | (0.15 | ) | | | (0.06 | ) | | | (0.03 | ) | | | (0.39 | ) |
| | | | | | | | | | | | | | | | | | | | | | | | | | | | |
Total distributions to shareholders | | | 0.00 | | | | 0.00 | | | | 0.00 | | | | (0.15 | ) | | | (0.06 | ) | | | (0.08 | ) | | | (0.53 | ) |
Net asset value, end of period | | | $10.25 | | | | $10.53 | | | | $9.75 | | | | $10.36 | | | | $10.80 | | | | $9.75 | | | | $10.84 | |
Total return3 | | | (2.66 | )% | | | 8.00 | % | | | (5.89 | )% | | | (2.59 | )% | | | 11.44 | % | | | (9.36 | )% | | | 0.43 | % |
Ratios to average net assets (annualized) | | | | | | | | | | | | | | | | | | | | | | | | | | | | |
Gross expenses | | | 1.45 | % | | | 1.24 | % | | | 1.01 | % | | | 0.97 | % | | | 1.02 | % | | | 0.99 | % | | | 0.99 | % |
Net expenses | | | 0.85 | % | | | 0.85 | % | | | 0.85 | % | | | 0.85 | % | | | 0.85 | % | | | 0.85 | % | | | 0.85 | % |
Net investment income | | | 2.15 | % | | | 3.37 | % | | | 2.93 | % | | | 2.80 | % | | | 2.85 | % | | | 3.26 | % | | | 3.47 | % |
Supplemental data | | | | | | | | | | | | | | | | | | | | | | | | | | | | |
Portfolio turnover rate | | | 81 | % | | | 129 | % | | | 99 | % | | | 68 | % | | | 96 | % | | | 136 | % | | | 103 | % |
Net assets, end of period (000s omitted) | | | $11,283 | | | | $18,213 | | | | $27,911 | | | | $41,045 | | | | $50,825 | | | | $266,849 | | | | $359,383 | |
| 1 | For the eleven months ended September 30, 2016. The Fund changed its fiscal year end from October 31 to September 30, effective September 30, 2016. |
| 2 | Calculated based upon average shares outstanding |
| 3 | Returns for periods of less than one year are not annualized. |
The accompanying notes are an integral part of these financial statements.
18 | Wells Fargo International Bond Fund
Financial highlights
(For a share outstanding throughout each period)
| | | | | | | | | | | | | | | | | | | | | | | | | | | | |
| | | Six months ended
March 31, 2020
(unaudited) | | | Year ended September 30 | | | Year ended October 31 | |
| INSTITUTIONAL CLASS | | 2019 | | | 2018 | | | 2017 | | | 20161 | | | 2015 | | | 2014 | |
Net asset value, beginning of period | | | $10.64 | | | | $9.83 | | | | $10.43 | | | | $10.86 | | | | $9.79 | | | | $10.87 | | | | $11.35 | |
Net investment income | | | 0.12 | 2 | | | 0.37 | 2 | | | 0.31 | 2 | | | 0.29 | 2 | | | 0.27 | 2 | | | 0.35 | 2 | | | 0.41 | 2 |
Net realized and unrealized gains (losses) on investments | | | (0.41 | ) | | | 0.44 | | | | (0.91 | ) | | | (0.57 | ) | | | 0.86 | | | | (1.34 | ) | | | (0.35 | ) |
| | | | | | | | | | | | | | | | | | | | | | | | | | | | |
Total from investment operations | | | (0.29 | ) | | | 0.81 | | | | (0.60 | ) | | | (0.28 | ) | | | 1.13 | | | | (0.99 | ) | | | 0.06 | |
Distributions to shareholders from | | | | | | | | | | | | | | | | | | | | | | | | | | | | |
Net investment income | | | 0.00 | | | | 0.00 | | | | 0.00 | | | | 0.00 | | | | 0.00 | | | | (0.06 | ) | | | (0.15 | ) |
Net realized gains | | | 0.00 | | | | 0.00 | | | | 0.00 | | | | (0.15 | ) | | | (0.06 | ) | | | (0.03 | ) | | | (0.39 | ) |
| | | | | | | | | | | | | | | | | | | | | | | | | | | | |
Total distributions to shareholders | | | 0.00 | | | | 0.00 | | | | 0.00 | | | | (0.15 | ) | | | (0.06 | ) | | | (0.09 | ) | | | (0.54 | ) |
Net asset value, end of period | | | $10.35 | | | | $10.64 | | | | $9.83 | | | | $10.43 | | | | $10.86 | | | | $9.79 | | | | $10.87 | |
Total return3 | | | (2.73 | )% | | | 8.24 | % | | | (5.75 | )% | | | (2.48 | )% | | | 11.60 | % | | | (9.20 | )% | | | 0.55 | % |
Ratios to average net assets (annualized) | | | | | | | | | | | | | | | | | | | | | | | | | | | | |
Gross expenses | | | 1.18 | % | | | 0.95 | % | | | 0.74 | % | | | 0.70 | % | | | 0.75 | % | | | 0.73 | % | | | 0.72 | % |
Net expenses | | | 0.70 | % | | | 0.70 | % | | | 0.70 | % | | | 0.70 | % | | | 0.70 | % | | | 0.70 | % | | | 0.70 | % |
Net investment income | | | 2.28 | % | | | 3.61 | % | | | 3.06 | % | | | 2.96 | % | | | 2.95 | % | | | 3.41 | % | | | 3.62 | % |
Supplemental data | | | | | | | | | | | | | | | | | | | | | | | | | | | | |
Portfolio turnover rate | | | 81 | % | | | 129 | % | | | 99 | % | | | 68 | % | | | 96 | % | | | 136 | % | | | 103 | % |
Net assets, end of period (000s omitted) | | | $65,245 | | | | $77,727 | | | | $245,633 | | | | $443,888 | | | | $553,208 | | | | $689,964 | | | | $832,072 | |
| 1 | For the eleven months ended September 30, 2016. The Fund changed its fiscal year end from October 31 to September 30, effective September 30, 2016. |
| 2 | Calculated based upon average shares outstanding |
| 3 | Returns for periods of less than one year are not annualized. |
The accompanying notes are an integral part of these financial statements.
Wells Fargo International Bond Fund | 19
Notes to financial statements (unaudited)
1. ORGANIZATION
Wells Fargo Funds Trust (the “Trust”), a Delaware statutory trust organized on March 10, 1999, is anopen-end management investment company registered under the Investment Company Act of 1940, as amended (the “1940 Act”). As an investment company, the Trust follows the accounting and reporting guidance in Financial Accounting Standards Board (“FASB”)Accounting Standards Codification Topic 946, Financial Services – Investment Companies. These financial statements report on the Wells Fargo International Bond Fund (the “Fund”) which is a diversified series of the Trust.
2. SIGNIFICANT ACCOUNTING POLICIES
The following significant accounting policies, which are consistently followed in the preparation of the financial statements of the Fund, are in conformity with U.S. generally accepted accounting principles which require management to make estimates and assumptions that affect the reported amounts of assets and liabilities, disclosure of contingent assets and liabilities at the date of the financial statements, and the reported amounts of revenues and expenses during the reporting period. Actual results could differ from those estimates.
Securities valuation
All investments are valued each business day as of the close of regular trading on the New York Stock Exchange (generally 4 p.m. Eastern Time), although the Fund may deviate from this calculation time under unusual or unexpected circumstances.
Debt securities are valued at the evaluated bid price provided by an independent pricing service (e.g. taking into account various factors, including yields, maturities, or credit ratings) or, if a reliable price is not available, the quoted bid price from an independent broker-dealer.
Forward foreign currency contracts are recorded at the forward rate provided by an independent foreign currency pricing source at a time each business day specified by the Wells Fargo Asset Management Pricing Committee at Wells Fargo Funds Management, LLC (“Funds Management”).
The values of securities denominated in foreign currencies are translated into U.S. dollars at rates provided by an independent foreign currency pricing source at a time each business day specified by the Wells Fargo Asset Management Pricing Committee.
Investments in registeredopen-end investment companies are valued at net asset value.
Investments which are not valued using any of the methods discussed above are valued at their fair value, as determined in good faith by the Board of Trustees of the Fund. The Board of Trustees has established a Valuation Committee comprised of the Trustees and has delegated to it the authority to take any actions regarding the valuation of portfolio securities that the Valuation Committee deems necessary or appropriate, including determining the fair value of portfolio securities, unless the determination has been delegated to the Wells Fargo Asset Management Pricing Committee.The Board of Trustees retains the authority to make or ratify any valuation decisions or approve any changes to the Valuation Procedures as it deems appropriate. On a quarterly basis, the Board of Trustees receives reports on any valuation actions taken by the Valuation Committee or the Wells Fargo Asset Management Pricing Committee which may include items for ratification.
Foreign currency translation
The accounting records of the Fund are maintained in U.S. dollars. The values of other assets and liabilities denominated in foreign currencies are translated into U.S. dollars at rates provided by an independent foreign currency pricing source at a time each business day specified by the Wells Fargo Asset Management Pricing Committee. Purchases and sales of securities, and income and expenses are converted at the rate of exchange on the respective dates of such transactions. Net realized foreign exchange gains or losses arise from sales of foreign currencies, currency gains or losses realized between the trade and settlement dates on securities transactions, and the difference between the amounts of dividends, interest and foreign withholding taxes recorded and the U.S. dollar equivalent of the amounts actually paid or received. Net unrealized foreign exchange gains and losses arise from changes in the fair value of assets and liabilities other than investments in securities resulting from changes in exchange rates. The changes in net assets arising from changes in exchange rates of securities and the changes in net assets resulting from changes in market prices of securities are not separately presented. Such changes are included in net realized and unrealized gains or losses from investments.
Forward foreign currency contracts
A forward foreign currency contract is an agreement between two parties to purchase or sell a specific currency for an agreed-upon price at a future date. The Fund enters into forward foreign currency contracts to facilitate transactions in foreign-denominated securities and to attempt to minimize the risk to the Fund from adverse changes in the relationship between currencies. Forward foreign currency contracts are recorded at the forward rate andmarked-to-market daily. When the contracts are closed, realized gains and losses arising from such transactions are recorded as realized gains or losses on forward foreign currency contracts. The
20 | Wells Fargo International Bond Fund
Notes to financial statements (unaudited)
Fund is subject to foreign currency risk and may be exposed to risks if the counterparties to the contracts are unable to meet the terms of their contracts or if the value of the foreign currency changes unfavorably. The Fund’s maximum risk of loss from counterparty credit risk is the unrealized gains on the contracts. This risk may be mitigated if there is a master netting arrangement between the Fund and the counterparty.
When-issued transactions
The Fund may purchase securities on a forward commitment or when-issued basis. The Fund records a when-issued transaction on the trade date and will segregate assets in an amount at least equal in value to the Fund’s commitment to purchase when-issued securities. Securities purchased on a when-issued basis aremarked-to-market daily and the Fund begins earning interest on the settlement date. Losses may arise due to changes in the market value of the underlying securities or if the counterparty does not perform under the contract.
Security transactions and income recognition
Securities transactions are recorded on a trade date basis. Realized gains or losses are recorded on the basis of identified cost.
Interest income is accrued daily and bond discounts are accreted and premiums are amortized daily. To the extent debt obligations are placed onnon-accrual status, any related interest income may be reduced by writing off interest receivables when the collection of all or a portion of interest has been determined to be doubtful based on consistently applied procedures and the fair value has decreased. If the issuer subsequently resumes interest payments or when the collectability of interest is reasonably assured, the debt obligation is removed fromnon-accrual status.
Income from foreign securities is recorded net of foreign taxes withheld where recovery of such taxes is not assured.
Distributions to shareholders
Distributions to shareholders are recorded on theex-dividend date and paid from net investment income quarterly and any net realized gains are paid at least annually. Such distributions are determined in accordance with income tax regulations and may differ from U.S. generally accepted accounting principles. Dividend sources are estimated at the time of declaration. The tax character of distributions is determined as of the Fund’s fiscal year end. Therefore, a portion of the Fund’s distributions made prior to the Fund’s fiscal year end may be categorized as a tax return of capital at year end.
Federal and other taxes
The Fund intends to continue to qualify as a regulated investment company by distributing substantially all of its investment company taxable income and any net realized capital gains (after reduction for capital loss carryforwards) sufficient to relieve it from all, or substantially all, federal income taxes. Accordingly, no provision for federal income taxes was required.
The Fund’s income and federal excise tax returns and all financial records supporting those returns for the prior three fiscal years are subject to examination by the federal and Delaware revenue authorities. Management has analyzed the Fund’s tax positions taken on federal, state, and foreign tax returns for all open tax years and does not believe that there are any uncertain tax positions that require recognition of a tax liability.
As of March 31, 2020, the aggregate cost of all investments for federal income tax purposes was $97,678,872 and the unrealized gains (losses) consisted of:
| | | | |
| |
Gross unrealized gains | | $ | 6,049,397 | |
| |
Gross unrealized losses | | | (8,658,075 | ) |
| |
Net unrealized losses | | $ | (2,608,678 | ) |
As of September 30, 2019, the Fund had capital loss carryforwards which consisted of $2,154,566 in short-term capital losses and $2,816,693 in long-term capital losses.
As of September 30, 2019, the Fund had fiscal year net deferred post-October capital losses consisting of $1,296,764 inlong-term losses which was recognized on the first day of the current fiscal year.
As of September 30, 2019, the Fund had a qualified late-year ordinary loss of $10,000,814 which was recognized on the first day of the current fiscal year.
Class allocations
The separate classes of shares offered by the Fund differ principally in applicable sales charges, distribution, shareholder servicing, and administration fees. Class specific expenses are charged directly to that share class. Investment income, common fund-level expenses, and realized and unrealized gains (losses) on investments are allocated daily to each class of shares based on the relative proportion of net assets of each class.
Wells Fargo International Bond Fund | 21
Notes to financial statements (unaudited)
3. FAIR VALUATION MEASUREMENTS
Fair value measurements of investments are determined within a framework that has established a fair value hierarchy based upon the various data inputs utilized in determining the value of the Fund’s investments. The three-level hierarchy gives the highest priority to unadjusted quoted prices in active markets for identical assets or liabilities (Level 1) and the lowest priority to unobservable inputs (Level 3). The Fund’s investments are classified within the fair value hierarchy based on the lowest level of input that is significant to the fair value measurement. The inputs are summarized into three broad levels as follows:
| ∎ | | Level 1 – quoted prices in active markets for identical securities |
| ∎ | | Level 2 – other significant observable inputs (including quoted prices for similar securities, interest rates, prepayment speeds, credit risk, etc.) |
| ∎ | | Level 3 – significant unobservable inputs (including the Fund’s own assumptions in determining the fair value of investments) |
The inputs or methodologies used for valuing investments in securities are not necessarily an indication of the risk associated with investing in those securities.
The following is a summary of the inputs used in valuing the Fund’s assets and liabilities as of March 31, 2020:
| | | | | | | | | | | | | | | | |
| | | | |
| | | Quoted prices
(Level 1) | | | Other significant
observable inputs
(Level 2) | | | Significant
unobservable inputs (Level 3) | | | Total | |
| | | | |
Assets | | | | | | | | | | | | | | | | |
Investments in: | | | | | | | | | | | | | | | | |
| | | | |
Corporate bonds and notes | | $ | 0 | | | $ | 7,621,597 | | | $ | 0 | | | $ | 7,621,597 | |
| | | | |
Foreign corporate bonds and notes | | | 0 | | | | 9,743,202 | | | | 0 | | | | 9,743,202 | |
| | | | |
Foreign government bonds | | | 0 | | | | 69,756,001 | | | | 0 | | | | 69,756,001 | |
| | | | |
U.S. Treasury securities | | | 1,742,168 | | | | 0 | | | | 0 | | | | 1,742,168 | |
| | | | |
Yankee corporate bonds and notes | | | 0 | | | | 2,974,322 | | | | 0 | | | | 2,974,322 | |
| | | | |
Short-term investments | | | | | | | | | | | | | | | | |
| | | | |
Investment companies | | | 1,403,201 | | | | 0 | | | | 0 | | | | 1,403,201 | |
| | | | |
| | | 3,145,369 | | | | 90,095,122 | | | | 0 | | | | 93,240,491 | |
| | | | |
Forward foreign currency contracts | | | 0 | | | | 4,046,879 | | | | 0 | | | | 4,046,879 | |
| | | | |
Total assets | | $ | 3,145,369 | | | $ | 94,142,001 | | | $ | 0 | | | $ | 97,287,370 | |
| | | | |
Liabilities | | | | | | | | | | | | | | | | |
| | | | |
Forward foreign currency contracts | | $ | 0 | | | $ | 2,217,176 | | | $ | 0 | | | $ | 2,217,176 | |
| | | | |
Total liabilities | | $ | 0 | | | $ | 2,217,176 | | | $ | 0 | | | $ | 2,217,176 | |
Additional sector, industry or geographic detail is included in the Portfolio of Investments.
Forward foreign currency contracts are reported at their cumulative unrealized gains (losses) at measurement date as reported in the table following the Portfolio of Investments. All other assets and liabilities are reported at their market value at measurement date.
For the six months ended March 31, 2020, the Fund did not have any transfers into/out of Level 3.
4. TRANSACTIONS WITH AFFILIATES
Management fee
Funds Management, an indirect wholly owned subsidiary of Wells Fargo & Company (“Wells Fargo”), is the manager of the Fund and provides advisory and fund-level administrative services under an investment management agreement. Under the investment management agreement, Funds Management is responsible for, among other services, implementing the investment objectives and strategies of the Fund, supervising the subadviser and providing fund-level administrative services in connection with the Fund’s
22 | Wells Fargo International Bond Fund
Notes to financial statements (unaudited)
operations. As compensation for its services under the investment management agreement, Funds Management is entitled to receive a management fee at the following annual rate based on the Fund’s average daily net assets:
| | | | |
| |
| Average daily net assets | | Management fee | |
| |
First $500 million | | | 0.600 | % |
| |
Next $500 million | | | 0.575 | |
| |
Next $2 billion | | | 0.550 | |
| |
Next $2 billion | | | 0.525 | |
| |
Next $5 billion | | | 0.490 | |
| |
Over $10 billion | | | 0.480 | |
For the six months ended March 31, 2020, the management fee was equivalent to an annual rate of 0.60% of the Fund’s average daily net assets.
Funds Management has retained the services of a subadviser to provide daily portfolio management to the Fund. The fee for subadvisory services is borne by Funds Management. Wells Fargo Asset Management (International) Limited, an affiliate of Funds Management and an indirect wholly owned subsidiary of Wells Fargo, is the subadviser to the Fund and is entitled to receive a fee from Funds Management at an annual rate starting at 0.35% and declining to 0.20% as the average daily net assets of the Fund increase.
Administration fees
Under a class-level administration agreement, Funds Management provides class-level administrative services to the Fund, which includes paying fees and expenses for services provided by the transfer agent,sub-transfer agents, omnibus account servicers and record-keepers. As compensation for its services under the class-level administration agreement, Funds Management receives an annual fee which is calculated based on the average daily net assets of each class as follows:
| | | | |
| |
| | | Class-level
administration fee | |
| |
Class A, Class C | | | 0.16 | % |
| |
Class R6 | | | 0.03 | |
| |
Administrator Class | | | 0.10 | |
| |
Institutional Class | | | 0.08 | |
Waivers and/or expense reimbursements
Funds Management has contractually waived and/or reimbursed management and administration fees to the extent necessary to maintain certain net operating expense ratios for the Fund. When each class of the Fund has exceeded its expense cap, Funds Management has waived fees and/or reimbursed expenses from fund-level expenses on a proportionate basis and then from class specific expenses. When only certain classes exceed their expense caps, waivers and/or reimbursements are applied against class specific expenses before fund-level expenses. Funds Management has committed through January 31, 2021 to waive fees and/or reimburse expenses to the extent necessary to cap the Fund’s expenses at 1.03% for Class A shares, 1.78% for Class C shares, 0.65% for Class R6 shares, 0.85% for Administrator Class shares, and 0.70% for Institutional Class shares. Prior to or after the commitment expiration date, the cap may be increased or the commitment to maintain the cap may be terminated only with the approval of the Board of Trustees.
Distribution fee
The Trust has adopted a distribution plan for Class C shares of the Fund pursuant to Rule12b-1 under the 1940 Act. A distribution fee is charged to Class C shares and paid to Wells Fargo Funds Distributor, LLC (“Funds Distributor”), the principal underwriter, at an annual rate of 0.75% of the average daily net assets of Class C shares.
In addition, Funds Distributor is entitled to receive thefront-end sales charge from the purchase of Class A shares and a contingent deferred sales charge on the redemption of certain Class A shares. Funds Distributor is also entitled to receive the contingent deferred sales charges from redemptions of Class C shares. For the six months ended March 31, 2020, Funds Distributor received $139 from the sale of Class A shares. No contingent deferred sales charges were incurred by Class A and Class C shares for the six months ended March 31, 2020.
Wells Fargo International Bond Fund | 23
Notes to financial statements (unaudited)
Shareholder servicing fees
The Trust has entered into contracts with one or more shareholder servicing agents, whereby Class A, Class C, and Administrator Class of the Fund are charged a fee at an annual rate of 0.25% of the average daily net assets of each respective class. A portion of these total shareholder servicing fees were paid to affiliates of Wells Fargo.
Interfund transactions
The Fund may purchase or sell portfolio investment securities to certain other Wells Fargo affiliates pursuant to Rule17a-7 under the 1940 Act and under procedures adopted by the Board of Trustees. The procedures have been designed to ensure that these interfund transactions, which do not incur broker commissions, are effected at current market prices.
5. INVESTMENT PORTFOLIO TRANSACTIONS
Purchases and sales of investments, excluding short-term securities, for the six months ended March 31, 2020 were as follows:
| | | | | | |
Purchases at cost | | Sales proceeds |
U.S.
government | | Non-U.S.
government | | U.S.
government | | Non-U.S.
government |
| $6,731,610 | | $79,920,288 | | $11,965,713 | | $74,498,931 |
6. DERIVATIVE TRANSACTIONS
During the six months ended March 31, 2020, the Fund entered into forward foreign currency contracts for hedging purposes. The Fund had average contract amounts of $78,707,170 and $58,663,623 in forward foreign currency contracts to buy and forward foreign currency contracts to sell, respectively, during the six months ended March 31, 2020.
The fair value, realized gains or losses and change in unrealized gains or losses, if any, on derivative instruments are reflected in the corresponding financial statement captions.
For certain types of derivative transactions, the Fund has entered into International Swaps and Derivatives Association, Inc. master agreements (“ISDA Master Agreements”) or similar agreements with approved counterparties. The ISDA Master Agreements or similar agreements may have requirements to deliver/deposit securities or cash to/with an exchange or broker-dealer as collateral and allows the Fund to offset, with each counterparty, certain derivative financial instrument’s assets and/or liabilities with collateral held or pledged. Collateral requirements differ by type of derivative. Collateral or margin requirements are set by the broker or exchange clearinghouse for exchange traded derivatives while collateral terms are contract specific forover-the-counter traded derivatives. Cash collateral that has been pledged to cover obligations of the Fund under ISDA Master Agreements or similar agreements, if any, are reported separately in the Statement of Assets and Liabilities. Securities pledged as collateral, if any, are noted in the Portfolio of Investments. With respect to balance sheet offsetting, absent an event of default by the counterparty or a termination of the agreement, the reported amounts of financial assets and financial liabilities in the Statement of Assets and Liabilities are not offset across transactions between the Fund and the applicable counterparty. A reconciliation of the gross amounts on the Statement of Assets and Liabilities to the net amounts by counterparty, including any collateral exposure, for OTC derivatives is as follows:
| | | | | | | | | | | | |
| | | | |
| Counterparty | | Gross amounts
of assets in the
Statement of
Assets and
Liabilities | | Amounts
subject to
netting
agreements | | Collateral
received | | | Net amount
of assets | |
| | | | |
State Street Bank | | $4,046,879 | | $(2,217,176) | | $ | 0 | | | $ | 1,829,703 | |
| | | | | | | | | | | | |
| | | | |
| Counterparty | | Gross amounts
of liabilities in the
Statement of
Assets and
Liabilities | | Amounts
subject to
netting
agreements | | Collateral
pledged | | | Net amount
of liabilities | |
| | | | |
State Street Bank | | $2,217,176 | | $(2,217,176) | | $ | 0 | | | $ | 0 | |
7. BANK BORROWINGS
The Trust (excluding the money market funds), Wells Fargo Master Trust and Wells Fargo Variable Trust are parties to a $280,000,000 revolving credit agreement whereby the Fund is permitted to use bank borrowings for temporary or emergency purposes, such as to fund shareholder redemption requests. Interest under the credit agreement is charged to the Fund based
24 | Wells Fargo International Bond Fund
Notes to financial statements (unaudited)
on a borrowing rate equal to the higher of the Federal Funds rate in effect on that day plus 1.25% or the overnight LIBOR rate in effect on that day plus 1.25%. In addition, an annual commitment fee equal to 0.25% of the unused balance is allocated to each participating fund.
For the six months ended March 31, 2020, there were no borrowings by the Fund under the agreement.
8. INDEMNIFICATION
Under the Trust’s organizational documents, the officers and Trustees have been granted certain indemnification rights against certain liabilities that may arise out of performance of their duties to the Trust. Additionally, in the normal course of business, the Trust may enter into contracts with service providers that contain a variety of indemnification clauses. The Trust’s maximum exposure under these arrangements is dependent on future claims that may be made against the Fund and, therefore, cannot be estimated.
9. NEW ACCOUNTING PRONOUNCEMENTS
In August 2018, FASB issued Accounting Standards Update (“ASU”)No. 2018-13, Fair Value Measurement (Topic 820)Disclosure Framework—Changes to the Disclosure Requirements for Fair Value Measurement. ASU2018-13 updates the disclosure requirements for fair value measurements by modifying or removing certain disclosures and adding certain new disclosures. The amendments are effective for fiscal years, and interim periods within those fiscal years, beginning after December 15, 2019. Early adoption is permitted. Management has adopted the removal and modification of disclosures early, as permitted, and will adopt the additional new disclosures at the effective date.
In March 2017, FASB issued ASUNo. 2017-08,Premium Amortization on Purchased Callable Debt Securities. ASU2017-08 shortens the amortization period for certain callable debt securities held at a premium and requires the premium to be amortized to the earliest call date. The amendments do not require an accounting change for securities held at a discount and discounts will continue to be accreted to the maturity date of the security. ASU2017-08 is effective for fiscal years beginning after December 15, 2018 and for interim periods within those fiscal years. During the current reporting period, management of the Fund adopted the change in accounting policy which did not have a material impact to the Fund’s financial statements.
10. CORONAVIRUS(COVID-19) PANDEMIC
On March 11, 2020, the World Health Organization announced that it had made the assessment that coronavirus disease 2019(“COVID-19”) is a pandemic. The impacts ofCOVID-19 are adversely affecting the entire global economy, individual companies and investment products, and the market in general. There is significant uncertainty around the extent and duration of business disruptions related toCOVID-19 and the impacts may be short term or may last for an extended period of time. The risk of further spreading ofCOVID-19 has led to significant uncertainty and volatility in the financial markets. The value of the Fund and the securities in which the Fund invests have generally been adversely affected by impacts caused byCOVID-19.
Wells Fargo International Bond Fund | 25
Other information (unaudited)
PROXY VOTING INFORMATION
A description of the policies and procedures used to determine how to vote proxies relating to portfolio securities is available, upon request, by calling1-800-222-8222, visiting our website atwfam.com, or visiting the SEC website at sec.gov. Information regarding how the proxies related to portfolio securities were voted during the most recent12-month period ended June 30 is available on the website atwfam.comor by visiting the SEC website at sec.gov.
QUARTERLY PORTFOLIO HOLDINGS INFORMATION
The Fund files its complete schedule of portfolio holdings with the SEC for the first and third quarters of each fiscal year as an exhibit to its reports on FormN-PORT. Shareholders may view the filed FormN-PORT by visiting the SEC website at sec.gov.
26 | Wells Fargo International Bond Fund
Other information (unaudited)
BOARD OF TRUSTEES AND OFFICERS
Each of the Trustees and Officers1 listed in the table below acts in identical capacities for each fund in the Wells Fargo family of funds, which consists of 147 mutual funds comprising the Wells Fargo Funds Trust, Wells Fargo Variable Trust, Wells Fargo Master Trust and four closed-end funds (collectively the “Fund Complex”). This table should be read in conjunction with the Prospectus and the Statement of Additional Information2. The mailing address of each Trustee and Officer is 525 Market Street, 12th Floor, San Francisco, CA 94105. Each Trustee and Officer serves an indefinite term, however, each Trustee serves such term until reaching the mandatory retirement age established by the Trustees.
Independent Trustees
| | | | | | |
Name and year of birth | | Position held and length of service* | | Principal occupations during past five years or longer | | Current other
public company or
investment
company
directorships |
| | | |
| William R. Ebsworth (Born 1957) | | Trustee, since 2015 | | Retired. From 1984 to 2013, equities analyst, portfolio manager, research director and chief investment officer at Fidelity Management and Research Company in Boston, Tokyo, and Hong Kong, and retired in 2013 as Chief Investment Officer of Fidelity Strategic Advisers, Inc. where he led a team of investment professionals managing client assets. Prior thereto, Board member of Hong Kong Securities Clearing Co., Hong Kong Options Clearing Corp., the Thailand International Fund, Ltd., Fidelity Investments Life Insurance Company, and Empire Fidelity Investments Life Insurance Company. Audit Committee Chair and Investment Committee Chair of the Vincent Memorial Hospital Endowment (non-profit organization). Mr. Ebsworth is a CFA® charterholder. | | N/A |
| | | |
Jane A. Freeman (Born 1953) | | Trustee, since 2015; Chair Liaison, since 2018 | | Retired. From 2012 to 2014 and 1999 to 2008, Chief Financial Officer of Scientific Learning Corporation. From 2008 to 2012, Ms. Freeman provided consulting services related to strategic business projects. Prior to 1999, Portfolio Manager at Rockefeller & Co. and Scudder, Stevens & Clark. Board member of the Harding Loevner Funds from 1996 to 2014, serving as both Lead Independent Director and chair of the Audit Committee. Board member of the Russell Exchange Traded Funds Trust from 2011 to 2012 and the chair of the Audit Committee. Ms. Freeman is a Board Member of The Ruth Bancroft Garden (non-profit organization). She is also an inactive Chartered Financial Analyst. | | N/A |
| | | |
Isaiah Harris, Jr. (Born 1952) | | Trustee, since 2009; Audit Committee Chairman, since 2019 | | Retired. Chairman of the Board of CIGNA Corporation since 2009, and Director since 2005. From 2003 to 2011, Director of Deluxe Corporation. Prior thereto, President and CEO of BellSouth Advertising and Publishing Corp. from 2005 to 2007, President and CEO of BellSouth Enterprises from 2004 to 2005 and President of BellSouth Consumer Services from 2000 to 2003. Emeritus member of the Iowa State University Foundation Board of Governors. Emeritus Member of the Advisory Board of Iowa State University School of Business. Advisory Board Member, Palm Harbor Academy (private school). Advisory Board Member, Child Evangelism Fellowship (non-profit). Mr. Harris is a certified public accountant (inactive status). | | CIGNA Corporation |
| | | |
Judith M. Johnson (Born 1949) | | Trustee, since 2008; Audit Committee Chairman, from 2009 to 2018 | | Retired. Prior thereto, Chief Executive Officer and Chief Investment Officer of Minneapolis Employees Retirement Fund from 1996 to 2008. Ms. Johnson is an attorney, certified public accountant and a certified managerial accountant. | | N/A |
Wells Fargo International Bond Fund | 27
Other information (unaudited)
| | | | | | |
Name and year of birth | | Position held and length of service* | | Principal occupations during past five years or longer | | Current other
public company or
investment
company
directorships |
| | | |
David F. Larcker (Born 1950) | | Trustee, since 2009 | | James Irvin Miller Professor of Accounting at the Graduate School of Business, Stanford University, Director of the Corporate Governance Research Initiative and Senior Faculty of The Rock Center for Corporate Governance since 2006. From 2005 to 2008, Professor of Accounting at the Graduate School of Business, Stanford University. Prior thereto, Ernst & Young Professor of Accounting at The Wharton School, University of Pennsylvania from 1985 to 2005. | | N/A |
| | | |
Olivia S. Mitchell (Born 1953) | | Trustee, since 2006; Nominating and Governance Committee Chair, since 2018 | | International Foundation of Employee Benefit Plans Professor, Wharton School of the University of Pennsylvania since 1993. Director of Wharton’s Pension Research Council and Boettner Center on Pensions & Retirement Research, and Research Associate at the National Bureau of Economic Research. Previously, Cornell University Professor from 1978 to 1993. | | N/A |
| | | |
Timothy J. Penny (Born 1951) | | Trustee, since 1996; Chairman, since 2018 | | President and Chief Executive Officer of Southern Minnesota Initiative Foundation, a non-profit organization, since 2007. Member of the Board of Trustees of NorthStar Education Finance, Inc., a non-profit organization, since 2007. | | N/A |
| | | |
James G. Polisson (Born 1959) | | Trustee, since 2018 | | Retired. Chief Marketing Officer, Source (ETF) UK Services, Ltd, from 2015 to 2017. From 2012 to 2015, Principal of The Polisson Group, LLC, a management consulting, corporate advisory and principal investing company. Chief Executive Officer and Managing Director at Russell Investments, Global Exchange Traded Funds from 2010 to 2012. Managing Director of Barclays Global Investors from 1998 to 2010 and Global Chief Marketing Officer for iShares and Barclays Global Investors from 2000 to 2010. Trustee of the San Francisco Mechanics’ Institute, a non-profit organization, from 2013 to 2015. Board member of the Russell Exchange Traded Fund Trust from 2011 to 2012. Director of Barclays Global Investors Holdings Deutschland GmbH from 2006 to 2009. Mr. Polisson is an attorney and has a retired status with the Massachusetts and District of Columbia Bar Associations. | | N/A |
| | | |
| Pamela Wheelock3 (Born 1959) | | Trustee, since January 2020; previously Trustee from January 2018 to July 2019 | | Board member of the Destination Medical Center Economic Development Agency, Rochester, Minnesota since 2019. Acting Commissioner, Minnesota Department of Human Services, July 2019 through September 2019. Human Services Manager (part-time), Minnesota Department of Human Services, October 2019 through December 2019. Chief Operating Officer, Twin Cities Habitat for Humanity from 2017 to 2019. Vice President of University Services, University of Minnesota from 2012 to 2016. Prior thereto, on the Board of Directors, Governance Committee and Finance Committee for the Minnesota Philanthropy Partners (Saint Paul Foundation) from 2012 to 2018, Interim Chief Executive Officer of Blue Cross Blue Shield of Minnesota from 2011 to 2012, Chairman of the Board from 2009 to 2012 and Board Director from 2003 to 2015. Vice President, Leadership and Community Engagement, Bush Foundation, Saint Paul, Minnesota (a private foundation) from 2009 to 2011. Executive Vice President and Chief Financial Officer, Minnesota Sports and Entertainment from 2004 to 2009 and Senior Vice President from 2002 to 2004. Executive Vice President of the Minnesota Wild Foundation from 2004 to 2008. Commissioner of Finance, State of Minnesota, from 1999 to 2002. Currently Board Chair of the Minnesota Wild Foundation since 2010. | | N/A |
| * | Length of service dates reflect the Trustee’s commencement of service with the Trust’s predecessor entities, where applicable. |
28 | Wells Fargo International Bond Fund
Other information (unaudited)
Officers
| | | | |
Name and year of birth | | Position held and length of service | | Principal occupations during past five years or longer |
| | |
Andrew Owen (Born 1960) | | President, since 2017 | | Executive Vice President of Wells Fargo & Company and Head of Affiliated Managers, Wells Fargo Asset Management, since 2014. In addition, Mr. Owen is currently President, Chief Executive Officer and Director of Wells Fargo Funds Management, LLC since 2017. Prior thereto, Executive Vice President responsible for marketing, investments and product development for Wells Fargo Funds Management, LLC, from 2009 to 2014. |
| | |
Nancy Wiser1 (Born 1967) | | Treasurer, since 2012 | | Executive Vice President of Wells Fargo Funds Management, LLC since 2011. Chief Operating Officer and Chief Compliance Officer at LightBox Capital Management LLC, from 2008 to 2011. |
| | |
Michelle Rhee (Born 1966) | | Chief Legal Officer, since 2019 | | Secretary of Wells Fargo Funds Management, LLC, Chief Legal Counsel of Wells Fargo Asset Management and Assistant General Counsel of Wells Fargo Bank, N.A. since 2018. Associate General Counsel and Managing Director of Bank of America Corporation from 2004 to 2018. |
| | |
Catherine Kennedy (Born 1969) | | Secretary, since 2019 | | Vice President of Wells Fargo Funds Management, LLC and Senior Counsel of the Wells Fargo Legal Department since 2010. Vice President and Senior Counsel of Evergreen Investment Management Company, LLC from 1998 to 2010. |
| | |
Michael H. Whitaker (Born 1967) | | Chief Compliance Officer, since 2016 | | Chief Compliance Officer of Wells Fargo Asset Management since 2016. Senior Vice President and Chief Compliance Officer for Fidelity Investments from 2007 to 2016. |
| | |
David Berardi (Born 1975) | | Assistant Treasurer, since 2009 | | Vice President of Wells Fargo Funds Management, LLC since 2009. Vice President of Evergreen Investment Management Company, LLC from 2008 to 2010. Manager of Fund Reporting and Control for Evergreen Investment Management Company, LLC from 2004 to 2010. |
| | |
Jeremy DePalma1 (Born 1974) | | Assistant Treasurer, since 2009 | | Senior Vice President of Wells Fargo Funds Management, LLC since 2009. Senior Vice President of Evergreen Investment Management Company, LLC from 2008 to 2010 and head of the Fund Reporting and Control Team within Fund Administration from 2005 to 2010. |
| 1 | Nancy Wiser acts as Treasurer of 65 funds in the Fund Complex. Jeremy DePalma acts as Treasurer of 82 funds and Assistant Treasurer of 65 funds in the Fund Complex. |
| 2 | The Statement of Additional Information includes additional information about the Trustees and is available, without charge, upon request, by calling1-800-222-8222 or by visiting the website atwfam.com. |
| 3 | Pamela Wheelock was re-appointed to the Board effective January 1, 2020. |
Wells Fargo International Bond Fund | 29
Appendix I (unaudited)
Effective on or about May 1, 2020, if you purchase Fund shares through a Janney Montgomery Scott LLC (“Janney”) brokerage account, you will be eligible for the following load waivers (front-end sales charge waivers and contingent deferred sales charge (“CDSC”), or back-end sales charge, waivers) and discounts, which may differ from those disclosed elsewhere in the Fund’s Prospectus or SAI.
|
|
| Front-end sales charge* waivers on Class A shares available at Janney |
|
| Shares purchased through reinvestment of capital gains distributions and dividend reinvestment when purchasing shares of the same fund (but not any other fund within the fund family). |
|
| Shares purchased by employees and registered representatives of Janney or its affiliates and their family members as designated by Janney. |
|
| Shares purchased from the proceeds of redemptions within the same fund family, provided (1) the repurchase occurs within ninety (90) days following the redemption, (2) the redemption and purchase occur in the same account, and (3) redeemed shares were subject to a front-end or deferred sales load (i.e., right of reinstatement). |
|
| Employer-sponsored retirement plans (e.g., 401(k) plans, 457 plans, employer-sponsored 403(b) plans, profit sharing and money purchase pension plans and defined benefit plans). For purposes of this provision, employer-sponsored retirement plans do not include SEP IRAs, Simple IRAs, SAR-SEPs or Keogh plans. |
|
| Shares acquired through a right of reinstatement. |
|
| Class C shares that are no longer subject to a contingent deferred sales charge and are converted to Class A shares of the same fund pursuant to Janney’s policies and procedures. |
|
| CDSC waivers on Class A and Class C shares available at Janney |
|
| Shares sold upon the death or disability of the shareholder. |
|
| Shares sold as part of a systematic withdrawal plan as described in the Fund’s Prospectus. |
|
| Shares purchased in connection with a return of excess contributions from an IRA account. |
|
| Shares sold as part of a required minimum distribution for IRA and retirement accounts if the redemption is taken in or after the year the shareholder reaches qualified age based on applicable IRS regulations. |
|
| Shares sold to pay Janney fees but only if the transaction is initiated by Janney. |
|
| Shares acquired through a right of reinstatement. |
|
| Shares exchanged into the same share class of a different fund. |
|
| Front-end sales charge* discounts available at Janney; breakpoints, rights of accumulation and/or letters of intent |
|
| Breakpoints as described in the Fund’s Prospectus. |
|
| Rights of accumulation (“ROA”), which entitle shareholders to breakpoint discounts, will be automatically calculated based on the aggregated holding of fund family assets held by accounts within the purchaser’s household at Janney. Eligible fund family assets not held at Janney may be included in the ROA calculation only if the shareholder notifies his or her financial advisor about such assets. |
|
| Letters of intent which allow for breakpoint discounts based on anticipated purchases within a fund family, over a 13-month time period. Eligible fund family assets not held at Janney Montgomery Scott may be included in the calculation of letters of intent only if the shareholder notifies his or her financial advisor about such assets. |
| * | Also referred to as an “initial sales charge.” |
30 | Wells Fargo International Bond Fund
Appendix II (unaudited)
Effective on or after May 1, 2020, clients of Edward Jones (also referred to as “shareholders”) purchasing Fund shares on the Edward Jones commission and fee-based platforms are eligible only for the following sales charge discounts (also referred to as “breakpoints”) and waivers, which can differ from breakpoints and waivers described elsewhere in this Prospectus or SAI or through another broker-dealer. In all instances, it is the shareholder’s responsibility to inform Edward Jones at the time of purchase of any relationship, holdings of Wells Fargo Funds or other facts qualifying the purchaser for breakpoints or waivers. Edward Jones can ask for documentation of such circumstance.
|
| Breakpoints available at Edward Jones |
|
| Rights of Accumulation (ROA) |
|
The applicable sales charge on a purchase of Class A shares is determined by taking into account all share classes (except any money market funds and retirement plan share classes) of Wells Fargo Funds held by the shareholder or in an account grouped by Edward Jones with other accounts for the purpose of providing certain pricing considerations (“pricing groups”). This includes all share classes held on the Edward Jones platform and/or held on another platform. The inclusion of eligible fund family assets in the rights of accumulation calculation is dependent on the shareholder notifying his or her financial advisor of such assets at the time of calculation. |
|
ROA is determined by calculating the higher of cost or market value (current shares x NAV). |
|
| Letter of Intent (LOI) |
|
Through a LOI, shareholders can receive the sales charge and breakpoint discounts for purchases shareholders intend to makeover a 13-month period from the date Edward Jones receives the LOI. The LOI is determined by calculating the higher of cost or market value of qualifying holdings at LOI initiation in combination with the value that the shareholder intends to buy over a 13-month period to calculate the front-end sales charge and any breakpoint discounts. Each purchase the shareholder makes during that 13-month period will receive the sales charge and breakpoint discount that applies to the total amount. The inclusion of eligible fund family assets in the LOI calculation is dependent on the shareholder notifying his or her financial advisor of such assets at the time of calculation. Purchases made before the LOI is received by Edward Jones are not covered under the LOI and will not reduce the sales charge previously paid. Sales charges will be adjusted if LOI is not met. |
| Sales charges are waived for the following shareholders and in the following situations at Edward Jones: |
● Associates of Edward Jones and its affiliates and their family members who are in the same pricing group (as determined by Edward Jones under its policies and procedures) as the associate. This waiver will continue for the remainder of the associate’s life if the associate retires from Edward Jones in good-standing. |
● Shares purchased in an Edward Jones fee-based program. |
● Shares purchased through reinvestment of capital gains distributions and dividend reinvestment. |
● Shares purchased from the proceeds of redeemed shares of the same fund family so long as the following conditions are met: 1)the proceeds are from the sale of shares within 60 days of the purchase, and 2) the sale and purchase are made in the same share class and the same account or the purchase is made in an individual retirement account with proceeds from liquidations in anon-retirement account. |
● Shares exchanged into Class A shares from another share class so long as the exchange is into the same fund and was initiated at the discretion of Edward Jones. Edward Jones is responsible for any remaining CDSC due to the fund company, if applicable. Any future purchases are subject to the applicable sales charge as disclosed in the prospectus. |
● Exchanges from Class C shares to Class A shares of the same fund, generally, in the 84th month following the anniversary of the purchase date or earlier at the discretion of Edward Jones. |
If the shareholder purchases shares that are subject to a CDSC and those shares are redeemed before the CDSC is expired, the shareholder is
responsible to pay the CDSC except in the following conditions available at Edward Jones: |
● The death or disability of the shareholder. |
● Systematic withdrawals with up to 10% per year of the account value. |
● Return of excess contributions from an Individual Retirement Account (IRA). |
● Shares sold as part of a required minimum distribution for IRA and retirement accounts if the redemption is taken in or after the year the shareholder reaches qualified age based on applicable IRS regulation. |
● Shares sold to pay Edward Jones fees or costs in such cases where the transaction is initiated by Edward Jones. |
● Shares exchanged in an Edward Jones fee-based program. |
● Shares acquired through NAV reinstatement. |
Wells Fargo International Bond Fund | 31
Appendix II (unaudited)
|
| Other Important Information for accounts at Edward Jones: |
Minimum Purchase Amounts ● $250 initial purchase minimum ● $50 subsequent purchase minimum |
Minimum Balances Edward Jones has the right to redeem at its discretion fund holdings with a balance of $250 or less. The following are examples of accounts that are not included in this policy: ● A fee-based account held on an Edward Jones platform ● A 529 account held on an Edward Jones platform ● An account with an active systematic investment plan or letter of intent (LOI) |
Changing Share Classes At any time it deems necessary, Edward Jones has the authority to exchange at NAV a shareholder’s holdings in a fund to Class A shares. |
32 | Wells Fargo International Bond Fund

For more information
More information about Wells Fargo Funds is available free upon request. To obtain literature, please write, visit the Fund’s website, or call:
Wells Fargo Funds
P.O. Box 219967
Kansas City, MO 64121-9967
Website:wfam.com
Individual investors:1-800-222-8222
Retail investment professionals:1-888-877-9275
Institutional investment professionals:1-866-765-0778

This report and the financial statements contained herein are submitted for the general information of the shareholders of the Fund. If this report is used for promotional purposes, distribution of the report must be accompanied or preceded by a current prospectus. Before investing, please consider the investment objectives, risks, charges, and expenses of the investment. For a current prospectus and, if available, a summary prospectus, containing this information, call1-800-222-8222 or visit the Fund’s website atwfam.com. Read the prospectus carefully before you invest or send money.
Wells Fargo Asset Management (WFAM) is the trade name for certain investment advisory/management firms owned by Wells Fargo & Company. These firms include but are not limited to Wells Capital Management Incorporated and Wells Fargo Funds Management, LLC. Certain products managed by WFAM entities are distributed by Wells Fargo Funds Distributor, LLC (a broker-dealer and Member FINRA).
This material is for general informational and educational purposes only and is NOT intended to provide investment advice or a recommendation of any kind—including a recommendation for any specific investment, strategy, or plan.
INVESTMENT PRODUCTS: NOT FDIC INSURED ◾ NO BANK GUARANTEE ◾ MAY LOSE VALUE
© 2020 Wells Fargo & Company. All rights reserved.
PAR-0420-06224 05-20
SA235/SAR235 03-20
Semi-Annual Report
March 31, 2020
Wells Fargo Strategic Income Fund
Beginning on January 1, 2021, as permitted by new regulations adopted by the Securities and Exchange Commission, paper copies of the Wells Fargo Funds’ annual and semi-annual shareholder reports issued after this date will no longer be sent by mail, unless you specifically request paper copies of the reports. Instead, the reports will be made available on the Funds’ website, and you will be notified by mail each time a report is posted and provided with a website address to access the report.
If you already elected to receive shareholder reports electronically, you will not be affected by this change and you need not take any action. You may elect to receive shareholder reports and other communications from the Fund electronically at any time by contacting your financial intermediary (such as a broker-dealer or bank) or, if you are a direct investor, by calling1-800-222-8222 or by enrolling at wellsfargo.com/advantagedelivery.
You may elect to receive all future reports in paper free of charge. If you invest through a financial intermediary, you can contact your financial intermediary to request that you continue to receive paper copies of your shareholder reports; if you invest directly with the Fund, you can call 1-800-222-8222. Your election to receive reports in paper will apply to all Wells Fargo Funds held in your account with your financial intermediary or, if you are a direct investor, to all Wells Fargo Funds that you hold.
|
|
|
Reduce clutter. Save trees. |
Sign up for electronic delivery of prospectuses and shareholder reports atwellsfargo.com/advantagedelivery |
The views expressed and any forward-looking statements are as of March 31, 2020, unless otherwise noted, and are those of the Fund managers and/or Wells Fargo Asset Management. Discussions of individual securities, or the markets generally, or any Wells Fargo Fund are not intended as individual recommendations. Future events or results may vary significantly from those expressed in any forward-looking statements. The views expressed are subject to change at any time in response to changing circumstances in the market. Wells Fargo Asset Management and the Fund disclaim any obligation to publicly update or revise any views expressed or forward-looking statements.
INVESTMENT PRODUCTS: NOT FDIC INSURED ◾ NO BANK GUARANTEE ◾ MAY LOSE VALUE
Wells Fargo Strategic Income Fund | 1
Letter to shareholders (unaudited)

Andrew Owen
President
Wells Fargo Funds
“The period began with mixed data, leading to central bank support.”
Dear Shareholder:
We are pleased to offer you this semi-annual report for the Wells Fargo Strategic Income Fund for the six-month period that ended March 31, 2020. Global stock markets saw earlier gains erased in February and March as governments took unprecedented measures to stop the spread of the coronavirus at the expense of short-term economic output. Fixed-income markets were less battered, with U.S. government bonds achieving modest gains as central banks attempted to bolster capital markets and confidence.
For the period, U.S. stocks, based on the S&P 500 Index,1 returned -12.31% and international stocks, as measured by the MSCI ACWI ex USA Index (Net),2 fell 16.52%. The MSCI EM Index (Net)3 lost 14.55%. For bond investors, the Bloomberg Barclays U.S. Aggregate Bond Index4 added 3.33%, the Bloomberg Barclays Global Aggregate ex-USD Index5 returned -2.03%, the Bloomberg Barclays Municipal Bond Index6 gained a modest 0.10%, and the ICE BofA U.S. High Yield Index7 returned -10.86%.
The period began with mixed data, leading to central bank support.
As the fourth quarter of 2019 started, U.S.-China trade tensions were relaxing while optimism grew for a U.K. Brexit deal. The initial estimate of U.S. third-quarter gross domestic product growth was a resilient 1.9% annualized rate, while the U.S. unemployment rate fell to a 50-year low of 3.5% in September. Despite resilience among U.S. consumers, however, business confidence declined while manufacturing activity contracted. Concerned with a potential economic slowdown, the U.S. Federal Reserve (Fed) lowered interest rates a quarter point in late October—its third rate cut in four months. This helped push the S&P 500 Index to an all-time high while emerging market equities rallied and global bonds declined overall, reflecting a broad pickup in risk appetite.
Equity markets rallied in November despite ongoing geopolitical risks. Hopes for aU.S.-China trade deal buoyed investor confidence. U.S. business sentiment edged up, and manufacturing and services activity rose. With that positive backdrop, developed market equities outpaced those in emerging markets, and U.S. stocks outperformed non-U.S. stocks overall. While consumer confidence and purchasing manager activity rose in the eurozone, China reported weakening manufacturing and consumer data. Bond yields rose marginally, leading to slightly negative returns for global government and investment-grade corporate bonds.
Financial markets ended 2019 with a boost from the U.S. and China accord on a Phase One trade deal. That, along with the landslide win by the pro-Brexit U.K. Conservative
| 1 | The S&P 500 Index consists of 500 stocks chosen for market size, liquidity, and industry group representation. It is a market-value-weighted index with each stock’s weight in the index proportionate to its market value. You cannot invest directly in an index. |
| 2 | The Morgan Stanley Capital International (MSCI) All Country World Index (ACWI) ex USA Index (Net) is a free-float-adjusted market-capitalization-weighted index that is designed to measure the equity market performance of developed markets, excluding the United States. Source: MSCI. MSCI makes no express or implied warranties or representations and shall have no liability whatsoever with respect to any MSCI data contained herein. The MSCI data may not be further redistributed or used as a basis for other indices or any securities or financial products. This report is not approved, reviewed, or produced by MSCI. You cannot invest directly in an index. |
| 3 | The MSCI Emerging Markets (EM) Index (Net) is a free-float-adjusted market-capitalization-weighted index that is designed to measure equity market performance of emerging markets. You cannot invest directly in an index. |
| 4 | The Bloomberg Barclays U.S. Aggregate Bond Index is a broad-based benchmark that measures the investment-grade, U.S. dollar-denominated, fixed-rate taxable bond market, including Treasuries, government-related and corporate securities, mortgage-backed securities (agency fixed-rate and hybrid adjustable-rate mortgage pass-throughs), asset-backed securities, and commercial mortgage-backed securities. You cannot invest directly in an index. |
| 5 | The Bloomberg Barclays Global Aggregate ex-USD Index is an unmanaged index that provides a broad-based measure of the global investment-grade fixed-income markets excluding the U.S. dollar-denominated debt market. You cannot invest directly in an index. |
| 6 | The Bloomberg Barclays Municipal Bond Index is an unmanaged index composed of long-term tax-exempt bonds with a minimum credit rating of Baa. You cannot invest directly in an index. |
| 7 | The ICE BofA U.S. High Yield Index is a market-capitalization-weighted index of domestic and Yankee high-yield bonds. The index tracks the performance of high-yield securities traded in the U.S. bond market. You cannot invest directly in an index. Copyright 2020. ICE Data Indices, LLC. All rights reserved. |
2 | Wells Fargo Strategic Income Fund
Letter to shareholders (unaudited)
Party in a national election and ongoing central bank support, gave investors greater confidence. U.S. economic indicators were positive overall, with the exception of manufacturing activity and business confidence. Consumer confidence was resilient, fed by a robust labor market, tame inflation, and lower interest rates, which boosted housing affordability and stimulated homebuyer activity. The impeachment of U.S. President Donald Trump had little impact on markets. Meanwhile, slowing Chinese economic activity, partly attributable to the trade war, led to further government stimulus at year-end through lower reserve ratios, allowing banks to lend more money.
The year-end rally continued in early January 2020. However, capital market volatility spiked in late January on concerns over the potential impact of the coronavirus on the global economy and stock markets. With sentiment somewhat souring, perceived safe havens did well in January. The U.S. dollar and Japanese yen both rose, and government bonds outperformed equities. While the S&P 500 Index held its ground, emerging market equities tumbled, including those in Asia.
In February, the coronavirus became the major market focus. Fears of the virus’s impact on global growth led to expectations of increased global central bank monetary policy support. That led the 10-year U.S. Treasury yield to fall to an all-time low of 1.1% by the end of the month. Although equity markets initially shrugged off concerns about the outbreak, focusing instead on strong fourth-quarter earnings and improving business confidence in January, market sentiment turned sharply lower toward month-end. Oil prices tumbled as Russia and the Organization of the Petroleum Exporting Countries compounded a major decline in oil demand with a brutal price war, causing the price of West Texas Intermediate crude oil to fall 13% in February alone.
The global spread of the coronavirus led many countries to clamp down on social and business-related activity in order to contain the virus from causing even greater devastation and overwhelming the health care system. This abrupt stoppage of economic activity led to the sharp deceleration of global output, sending economies into a deep contraction. Central bank responses were swift, as they slashed interest rates and expanded quantitative easing programs to restore liquidity and confidence to the markets. In the U.S., the Fed launched several lending programs, funding investment-grade bonds, money market mutual funds, and commercial paper while purchasing Treasuries, mortgage-backed securities, and overnight repos. Meanwhile, stock markets tumbled quickly into a bear market, ending the longest bull stock market in U.S. history.
Don’t let short-term uncertainty derail long-term investment goals.
Periods of investment uncertainty can present challenges, but experience has taught us that maintaining long-term investment goals can be an effective way to plan for the future. To help you create a sound strategy based on your personal goals and risk tolerance, Wells Fargo Funds offers more than 100 mutual funds spanning a wide range of asset classes and investment styles. Although diversification cannot guarantee an investment profit or prevent losses, we believe it can be an effective way to manage investment risk and potentially smooth out overall portfolio performance. We encourage investors to know their investments and to understand that appropriate levels of risk-taking may unlock opportunities.
Thank you for choosing to invest with Wells Fargo Funds. We appreciate your confidence in us and remain committed to helping you meet your financial needs.
Sincerely,

Andrew Owen
President
Wells Fargo Funds
“Capital market volatility spiked in late January on concerns over the potential impact of the coronavirus on the global economy and stock markets.”
|
|
|
For further information about your Fund, contact your investment professional, visit our website at wfam.com, or call us directly at1-800-222-8222. |
Wells Fargo Strategic Income Fund | 3
Performance highlights (unaudited)
Investment objective
The Fund seeks total return, consisting of a high level of current income and capital appreciation.
Manager
Wells Fargo Funds Management, LLC
Subadvisers
Wells Capital Management Incorporated
Wells Fargo Asset Management (International) Limited
Portfolio managers
Niklas Nordenfelt, CFA®‡
Alex Perrin
Scott M. Smith, CFA®‡
Lauren van Biljon, CFA®‡
Noah Wise, CFA®‡
Average annual total returns (%) as of March 31, 2020
| | | | | | | | | | | | | | | | | | | | | | | | | | | | | | | | | | |
| | | | |
| | | | | Including sales charge | | | Excluding sales charge | | | Expense ratios1 (%) | |
| | | | | | | | | |
| | | Inception date | | 1 year | | | 5 year | | | Since
inception | | | 1 year | | | 5 year | | | Since
inception | | | Gross | | | Net2 | |
| | | | | | | | | | |
| Class A (WSIAX) | | 1-31-2013 | | | -8.17 | | | | 0.13 | | | | 0.38 | | | | -4.36 | | | | 0.96 | | | | 0.96 | | | | 1.10 | | | | 0.92 | |
| | | | | | | | | | |
| Class C (WSICX) | | 1-31-2013 | | | -6.11 | | | | 0.23 | | | | 0.22 | | | | -5.11 | | | | 0.23 | | | | 0.22 | | | | 1.85 | | | | 1.67 | |
| | | | | | | | | | |
| Administrator Class (WSIDX) | | 1-31-2013 | | | – | | | | – | | | | – | | | | -4.23 | | | | 1.08 | | | | 1.09 | | | | 1.04 | | | | 0.77 | |
| | | | | | | | | | |
| Institutional Class (WSINX) | | 1-31-2013 | | | – | | | | – | | | | – | | | | -3.98 | | | | 1.31 | | | | 1.28 | | | | 0.77 | | | | 0.62 | |
| | | | | | | | | | |
| Bloomberg Barclays U.S. Universal Bond Index3 | | – | | | – | | | | – | | | | – | | | | 7.15 | | | | 3.35 | | | | 3.23 | * | | | – | | | | – | |
| | | | | | | | | | |
| ICE BofA3-Month LIBOR Constant Maturity Index4 | | – | | | – | | | | – | | | | – | | | | 2.38 | | | | 1.42 | | | | 1.07 | * | | | – | | | | – | |
| * | Based on the inception date of the oldest Fund class. |
Figures quoted represent past performance, which is no guarantee of future results, and do not reflect taxes that a shareholder may pay on an investment in a fund. Investment return and principal value of an investment will fluctuate so that an investor’s shares, when redeemed, may be worth more or less than their original cost. Performance shown without sales charges would be lower if sales charges were reflected. Current performance may be lower or higher than the performance data quoted, which assumes the reinvestment of dividends and capital gains. Currentmonth-end performance is available on the Fund’s website,wfam.com.
Index returns do not include transaction costs associated with buying and selling securities, any mutual fund fees or expenses, or any taxes. It is not possible to invest directly in an index.
For Class A shares, the maximumfront-end sales charge is 4.00%. For Class C shares, the maximum contingent deferred sales charge is 1.00%. Performance including a contingent deferred sales charge assumes the sales charge for the corresponding time period. Administrator Class and Institutional Class shares are sold without afront-end sales charge or contingent deferred sales charge.
Bond values fluctuate in response to the financial condition of individual issuers, general market and economic conditions, and changes in interest rates. Changes in market conditions and government policies may lead to periods of heightened volatility in the bond market and reduced liquidity for certain bonds held by the Fund. In general, when interest rates rise, bond values fall and investors may lose principal value. Interest rate changes and their impact on the Fund and its share price can be sudden and unpredictable. High-yield securities have a greater risk of default and tend to be more volatile than higher-rated debt securities. Loans are subject to risks similar to those associated with other below investment- grade bond investments, such as credit risk (for example, risk of issuer default), below-investment-grade bond risk (for example, risk of greater volatility in value), and risk that the loan may become illiquid or difficult to price. Foreign investments are especially volatile and can rise or fall dramatically due to differences in the political and economic conditions of the host country. These risks are generally intensified in emerging markets. The use of derivatives may reduce returns and/or increase volatility. Certain investment strategies tend to increase the total risk of an investment (relative to the broader market). The Fund is exposed to mortgage- and asset-backed securities risk, regulatory risk, and geographic risk. Consult the Fund’s prospectus for additional information on these and other risks.
Please see footnotes on page 5.
4 | Wells Fargo Strategic Income Fund
Performance highlights (unaudited)
| | | | |
| |
| Ten largest holdings (%) as of March 31, 20205 | | | |
| | |
Xtrackers USD High Yield Corporate Bond ETF | | | 1.92 | |
| | |
SPDR Barclays High Yield Bond ETF | | | 1.53 | |
| | |
Mexico, 6.50%,6-9-2022 | | | 1.24 | |
| | |
Hertz Fleet Lease Funding LP Series2019-1 Class E, 4.62%,1-10-2033 | | | 1.18 | |
| | |
Verus Securitization Trust Series2019-3 Class A2, 2.94%,7-25-2059 | | | 1.15 | |
| | |
GS Mortgage Security Trust Series 2014-GC22 Class AS, 4.11%,6-10-2047 | | | 1.13 | |
| | |
Longtrain Leasing III LLC Series2015-1A Class A2 , 4.06%,1-15-2045 | | | 1.11 | |
| | |
Ellington Financial Mortgage Trust Series2019-1 Class M1, 3.59%,6-25-2059 | | | 1.04 | |
| | |
CLI Funding LLC Series2019-1A Class A, 3.71%,5-18-2044 | | | 0.98 | |
| | |
BCC Funding Corporation Series2019-1A Class D, 3.94%,7-20-2027 | | | 0.97 | |
|
|
| Portfolio composition as of March 31, 20206 |
|
 |
| ‡ | CFA® and Chartered Financial Analyst®are trademarks owned by CFA Institute. |
| 1 | Reflects the expense ratios as stated in the most recent prospectuses, which include the impact of 0.02% in acquired fund fees and expenses. The expense ratios shown are subject to change and may differ from the annualized expense ratios shown in the financial highlights of this report, which do not include acquired fund fees and expenses. |
| 2 | The manager has contractually committed through January 31, 2021, to waive fees and/or reimburse expenses to the extent necessary to cap total annual fund operating expenses after fee waivers at 0.90% for Class A, 1.65% for Class C, 0.75% for Administrator Class, and 0.60% for Institutional Class. Brokerage commissions, stamp duty fees, interest, taxes, acquired fund fees and expenses (if any), and extraordinary expenses are excluded from the expense cap. Prior to or after the commitment expiration date, the cap may be increased or the commitment to maintain the cap may be terminated only with the approval of the Board of Trustees. Without this cap, the Fund’s returns would have been lower. The expense ratio paid by an investor is the net expense ratio (the total annual fund operating expenses after fee waivers) as stated in the prospectuses. |
| 3 | The Bloomberg Barclays U.S. Universal Bond Index is an unmanaged market-value-weighted performance benchmark for the U.S. dollar–denominated bond market, which includes investment-grade, high-yield, and emerging markets debt securities with maturities of one year or more. You cannot invest directly in an index. |
| 4 | The ICE BofA3-Month LIBOR Constant Maturity Index is based on the assumed purchase of a synthetic instrument having 3 months to maturity and with a coupon equal to the closing quote for3-Month LIBOR. That issue is sold the following day (priced at a yield equal to the current day closing3-Month LIBOR rate) and is rolled into a new3-month instrument. The index, therefore, will always have a constant maturity equal to exactly 3 months. You cannot invest directly in an index. Copyright 2020. ICE Data Indices, LLC. All rights reserved. |
| 5 | The ten largest holdings, excluding cash, cash equivalents and any money market funds, are calculated based on the value of the investments divided by total net assets of the Fund. Holdings are subject to change and may have changed since the date specified. |
| 6 | Amounts are calculated based on the total long-term investments of the Fund. These amounts are subject to change and may have changed since the date specified. |
Wells Fargo Strategic Income Fund | 5
Fund expenses (unaudited)
As a shareholder of the Fund, you incur two types of costs: (1) transaction costs, including sales charges (loads) on purchase payments and contingent deferred sales charges (if any) on redemptions and (2) ongoing costs, including management fees, distribution(12b-1) and/or shareholder servicing fees, and other Fund expenses. This example is intended to help you understand your ongoing costs (in dollars) of investing in the Fund and to compare these costs with the ongoing costs of investing in other mutual funds.
The example is based on an investment of $1,000 invested at the beginning of thesix-month period and held for the entire period from October 1, 2019 to March 31, 2020.
Actual expenses
The “Actual” line of the table below provides information about actual account values and actual expenses. You may use the information in this line, together with the amount you invested, to estimate the expenses that you paid over the period. Simply divide your account value by $1,000 (for example, an $8,600 account value divided by $1,000 = 8.6), then multiply the result by the number in the “Actual” line under the heading entitled “Expenses paid during period” for your applicable class of shares to estimate the expenses you paid on your account during this period.
Hypothetical example for comparison purposes
The “Hypothetical” line of the table below provides information about hypothetical account values and hypothetical expenses based on the Fund’s actual expense ratio and an assumed rate of return of 5% per year before expenses, which is not the Fund’s actual return. The hypothetical account values and expenses may not be used to estimate the actual ending account balance or expenses you paid for the period. You may use this information to compare the ongoing costs of investing in the Fund and other funds. To do so, compare this 5% hypothetical example with the 5% hypothetical examples that appear in the shareholder reports of the other funds.
Please note that the expenses shown in the table are meant to highlight your ongoing costs only and do not reflect any transactional costs, such as sales charges (loads) and contingent deferred sales charges. Therefore, the “Hypothetical” line of the table is useful in comparing ongoing costs only and will not help you determine the relative total costs of owning different funds. In addition, if these transactional costs were included, your costs would have been higher.
| | | | | | | | | | | | | | | | |
| | | Beginning
account value
10-1-2019 | | | Ending
account value
3-31-2020 | | | Consolidated expenses
paid during the period¹ | | | Annualized net
expense ratio | |
| | | | | |
Class A | | | | | | | | | | | | | | | | |
| | | | |
Actual | | $ | 1,000.00 | | | $ | 930.97 | | | $ | 4.30 | | | | 0.89 | % |
| | | | |
Hypothetical (5% return before expenses) | | $ | 1,000.00 | | | $ | 1,020.55 | | | $ | 4.50 | | | | 0.89 | % |
| | | | | |
Class C | | | | | | | | | | | | | | | | |
| | | | |
Actual | | $ | 1,000.00 | | | $ | 927.09 | | | $ | 7.95 | | | | 1.65 | % |
| | | | |
Hypothetical (5% return before expenses) | | $ | 1,000.00 | | | $ | 1,016.75 | | | $ | 8.32 | | | | 1.65 | % |
| | | | | |
Administrator Class | | | | | | | | | | | | | | | | |
| | | | |
Actual | | $ | 1,000.00 | | | $ | 931.43 | | | $ | 3.62 | | | | 0.75 | % |
| | | | |
Hypothetical (5% return before expenses) | | $ | 1,000.00 | | | $ | 1,021.25 | | | $ | 3.79 | | | | 0.75 | % |
| | | | | |
Institutional Class | | | | | | | | | | | | | | | | |
| | | | |
Actual | | $ | 1,000.00 | | | $ | 933.31 | | | $ | 2.90 | | | | 0.60 | % |
| | | | |
Hypothetical (5% return before expenses) | | $ | 1,000.00 | | | $ | 1,022.00 | | | $ | 3.03 | | | | 0.60 | % |
| 1 | Consolidated expenses paid is equal to the annualized net expense ratio of each class multiplied by the average account value over the period, multiplied by the number of days in the most recent fiscal half-year divided by the number of days in the fiscal year (to reflect theone-half-year period). |
6 | Wells Fargo Strategic Income Fund
Consolidated portfolio of investments—March 31, 2020 (unaudited)
| | | | | | | | | | | | | | | | |
| | | Interest rate | | | Maturity date | | | Principal | | | Value | |
| Agency Securities: 0.77% | |
FNMA | | | 4.04 | % | | | 10-1-2020 | | | $ | 1,000,000 | | | $ | 1,000,194 | |
| | | | | | | | | | | | | | | | |
| |
Total Agency Securities (Cost $999,063) | | | | 1,000,194 | |
| | | | | |
|
| Asset-Backed Securities: 7.90% | |
AmeriCredit Automobile Receivables Trust Series2018-3 Class D | | | 4.04 | | | | 11-18-2024 | | | | 1,100,000 | | | | 1,109,945 | |
Avis Budget Rental Car Funding LLC Series2016-1A Class A 144A | | | 2.99 | | | | 6-20-2022 | | | | 230,000 | | | | 224,628 | |
Avis Budget Rental Car Funding LLC Series2017-1A Class C 144A | | | 4.15 | | | | 9-20-2023 | | | | 650,000 | | | | 637,847 | |
Bank of the West Auto Trust Series2018-1 Class C 144A | | | 3.98 | | | | 5-15-2024 | | | | 1,100,000 | | | | 1,121,977 | |
Capital Auto Receivables Trust Series2018-2 Class C 144A | | | 3.69 | | | | 12-20-2023 | | | | 1,200,000 | | | | 1,201,984 | |
Chesapeake Funding II LLC Series2017-3A Class C 144A | | | 2.78 | | | | 8-15-2029 | | | | 800,000 | | | | 793,624 | |
Chesapeake Funding II LLC Series2017-3A Class D 144A | | | 3.38 | | | | 8-15-2029 | | | | 120,000 | | | | 119,388 | |
Chesapeake Funding II LLC Series2017-4A Class D 144A | | | 3.26 | | | | 11-15-2029 | | | | 400,000 | | | | 383,880 | |
Coinstar Funding LLC Series2017-1A Class A2 144A | | | 5.22 | | | | 4-25-2047 | | | | 1,084,338 | | | | 1,021,175 | |
DRB Prime Student Loan Trust Series2017-C Class C 144A | | | 3.29 | | | | 11-25-2042 | | | | 332,853 | | | | 334,084 | |
Hertz Fleet Lease Funding LP Series2019-1 Class E 144A | | | 4.62 | | | | 1-10-2033 | | | | 1,550,000 | | | | 1,544,815 | |
SMB Private Education Loan Trust Series2015-C Class C 144A | | | 4.50 | | | | 9-17-2046 | | | | 290,000 | | | | 305,709 | |
Tesla Auto Lease Trust Series2018-A Class E 144A | | | 4.94 | | | | 3-22-2021 | | | | 350,000 | | | | 345,246 | |
Tesla Auto Lease Trust Series2018-B Class D 144A | | | 5.29 | | | | 11-22-2021 | | | | 1,200,000 | | | | 1,174,319 | |
| |
Total Asset-Backed Securities (Cost $10,405,640) | | | | 10,318,621 | |
| | | | | |
|
Corporate Bonds and Notes: 24.30% | |
|
Communication Services: 3.32% | |
|
| Diversified Telecommunication Services: 0.16% | |
Level 3 Financing Incorporated | | | 5.13 | | | | 5-1-2023 | | | | 150,000 | | | | 147,374 | |
Level 3 Financing Incorporated | | | 5.38 | | | | 1-15-2024 | | | | 60,000 | | | | 60,000 | |
| |
| | | | 207,374 | |
| | | | | |
|
| Media: 1.93% | |
Block Communications Incorporated 144A | | | 4.88 | | | | 3-1-2028 | | | | 150,000 | | | | 139,500 | |
CCO Holdings LLC 144A | | | 4.50 | | | | 8-15-2030 | | | | 25,000 | | | | 24,500 | |
CCO Holdings LLC 144A | | | 5.38 | | | | 5-1-2025 | | | | 150,000 | | | | 153,780 | |
Cinemark USA Incorporated | | | 4.88 | | | | 6-1-2023 | | | | 50,000 | | | | 37,375 | |
CSC Holdings LLC 144A | | | 6.50 | | | | 2-1-2029 | | | | 450,000 | | | | 485,321 | |
Gray Television Incorporated 144A | | | 5.13 | | | | 10-15-2024 | | | | 100,000 | | | | 96,625 | |
Gray Television Incorporated 144A | | | 5.88 | | | | 7-15-2026 | | | | 150,000 | | | | 144,420 | |
Lamar Media Corporation 144A | | | 4.00 | | | | 2-15-2030 | | | | 200,000 | | | | 186,000 | |
Lamar Media Corporation | | | 5.00 | | | | 5-1-2023 | | | | 50,000 | | | | 49,500 | |
Match Group Incorporated 144A | | | 4.13 | | | | 8-1-2030 | | | | 25,000 | | | | 22,344 | |
Nexstar Broadcasting Incorporated 144A | | | 5.63 | | | | 7-15-2027 | | | | 150,000 | | | | 146,625 | |
Nielsen Finance LLC 144A | | | 5.00 | | | | 4-15-2022 | | | | 275,000 | | | | 253,501 | |
Outfront Media Capital Corporation 144A | | | 4.63 | | | | 3-15-2030 | | | | 175,000 | | | | 155,750 | |
Outfront Media Capital Corporation 144A | | | 5.00 | | | | 8-15-2027 | | | | 25,000 | | | | 23,000 | |
QVC Incorporated | | | 4.75 | | | | 2-15-2027 | | | | 250,000 | | | | 221,304 | |
Salem Media Group Incorporated 144A ‡(a) | | | 6.75 | | | | 6-1-2024 | | | | 175,000 | | | | 137,988 | |
Scripps Escrow Incorporated 144A | | | 5.88 | | | | 7-15-2027 | | | | 125,000 | | | | 110,000 | |
The E.W. Scripps Company 144A | | | 5.13 | | | | 5-15-2025 | | | | 150,000 | | | | 132,000 | |
| |
| | | | 2,519,533 | |
| | | | | |
|
| Wireless Telecommunication Services: 1.23% | |
Connect U.S. Finco LLC 144A | | | 6.75 | | | | 10-1-2026 | | | | 200,000 | | | | 165,250 | |
Sprint Capital Corporation | | | 8.75 | | | | 3-15-2032 | | | | 250,000 | | | | 330,625 | |
Sprint Spectrum Company 144A | | | 4.74 | | | | 9-20-2029 | | | | 700,000 | | | | 714,000 | |
Sprint Spectrum Company 144A | | | 5.15 | | | | 9-20-2029 | | | | 65,000 | | | | 69,225 | |
The accompanying notes are an integral part of these financial statements.
Wells Fargo Strategic Income Fund | 7
Consolidated portfolio of investments—March 31, 2020 (unaudited)
| | | | | | | | | | | | | | | | |
| | | Interest rate | | | Maturity date | | | Principal | | | Value | |
|
| Wireless Telecommunication Services (continued) | |
T-Mobile USA Incorporated | | | 4.75 | % | | | 2-1-2028 | | | $ | 200,000 | | | $ | 206,500 | |
T-Mobile USA Incorporated | | | 6.38 | | | | 3-1-2025 | | | | 120,000 | | | | 122,700 | |
| |
| | | | 1,608,300 | |
| | | | | |
|
Consumer Discretionary: 2.44% | |
|
| Auto Components: 0.72% | |
Adient Global Holdings 144A | | | 3.50 | | | | 8-15-2024 | | | | 515,000 | | | | 369,196 | |
Allison Transmission Incorporated 144A | | | 4.75 | | | | 10-1-2027 | | | | 225,000 | | | | 207,000 | |
Allison Transmission Incorporated 144A | | | 5.00 | | | | 10-1-2024 | | | | 150,000 | | | | 145,500 | |
Allison Transmission Incorporated 144A | | | 5.88 | | | | 6-1-2029 | | | | 25,000 | | | | 24,500 | |
Panther BF Aggregator 2 LP 144A | | | 6.25 | | | | 5-15-2026 | | | | 200,000 | | | | 189,000 | |
| |
| | | | 935,196 | |
| | | | | |
|
| Automobiles: 0.04% | |
Ford Motor Company | | | 7.45 | | | | 7-16-2031 | | | | 80,000 | | | | 57,600 | |
| | | | | | | | | | | | | | | | |
|
| Diversified Consumer Services: 0.13% | |
Carriage Services Incorporated 144A | | | 6.63 | | | | 6-1-2026 | | | | 175,000 | | | | 171,938 | |
| | | | | | | | | | | | | | | | |
|
| Hotels, Restaurants & Leisure: 0.63% | |
KFC Holding Company 144A | | | 5.00 | | | | 6-1-2024 | | | | 250,000 | | | | 245,000 | |
McDonald’s Corporation | | | 4.20 | | | | 4-1-2050 | | | | 500,000 | | | | 553,965 | |
Yum! Brands Incorporated 144A%% | | | 7.75 | | | | 4-1-2025 | | | | 25,000 | | | | 26,250 | |
| |
| | | | 825,215 | |
| | | | | |
|
| Specialty Retail: 0.77% | |
Asbury Automotive Group Incorporated 144A | | | 4.50 | | | | 3-1-2028 | | | | 19,000 | | | | 16,150 | |
Asbury Automotive Group Incorporated 144A | | | 4.75 | | | | 3-1-2030 | | | | 107,000 | | | | 90,950 | |
Group 1 Automotive Incorporated | | | 5.00 | | | | 6-1-2022 | | | | 50,000 | | | | 46,000 | |
Group 1 Automotive Incorporated 144A | | | 5.25 | | | | 12-15-2023 | | | | 100,000 | | | | 102,625 | |
Lithia Motors Incorporated 144A | | | 5.25 | | | | 8-1-2025 | | | | 175,000 | | | | 152,250 | |
Lithia Motors Incorporated 144A | | | 4.63 | | | | 12-15-2027 | | | | 200,000 | | | | 180,020 | |
Penske Auto Group Incorporated | | | 3.75 | | | | 8-15-2020 | | | | 70,000 | | | | 68,075 | |
Penske Auto Group Incorporated | | | 5.38 | | | | 12-1-2024 | | | | 150,000 | | | | 123,557 | |
Penske Auto Group Incorporated | | | 5.75 | | | | 10-1-2022 | | | | 50,000 | | | | 46,250 | |
Sonic Automotive Incorporated | | | 6.13 | | | | 3-15-2027 | | | | 200,000 | | | | 176,000 | |
| |
| | | | 1,001,877 | |
| | | | | |
|
| Textiles, Apparel & Luxury Goods: 0.15% | |
Levi Strauss & Company | | | 5.00 | | | | 5-1-2025 | | | | 200,000 | | | | 189,000 | |
| | | | | | | | | | | | | | | | |
|
Consumer Staples: 0.21% | |
|
| Food Products: 0.21% | |
Kraft Heinz Foods Company 144A | | | 4.88 | | | | 10-1-2049 | | | | 305,000 | | | | 277,662 | |
| | | | | | | | | | | | | | | | |
|
Energy: 3.86% | |
|
| Energy Equipment & Services: 0.34% | |
Diamond Offshore Drilling Incorporated | | | 4.88 | | | | 11-1-2043 | | | | 125,000 | | | | 16,875 | |
Era Group Incorporated ‡(a) | | | 7.75 | | | | 12-15-2022 | | | | 125,000 | | | | 107,578 | |
Hilcorp Energy Company 144A | | | 5.75 | | | | 10-1-2025 | | | | 175,000 | | | | 80,500 | |
NGPL PipeCo LLC 144A | | | 7.77 | | | | 12-15-2037 | | | | 25,000 | | | | 24,907 | |
Oceaneering International Incorporated | | | 6.00 | | | | 2-1-2028 | | | | 150,000 | | | | 57,437 | |
USA Compression Partners LP | | | 6.88 | | | | 4-1-2026 | | | | 250,000 | | | | 156,250 | |
| |
| | | | 443,547 | |
| | | | | |
The accompanying notes are an integral part of these financial statements.
8 | Wells Fargo Strategic Income Fund
Consolidated portfolio of investments—March 31, 2020 (unaudited)
| | | | | | | | | | | | | | | | |
| | | Interest rate | | | Maturity date | | | Principal | | | Value | |
| Oil, Gas & Consumable Fuels: 3.52% | |
Antero Midstream Partners LP 144A | | | 5.75 | % | | | 1-15-2028 | | | $ | 300,000 | | | $ | 192,000 | |
Antero Resources Corporation | | | 5.38 | | | | 11-1-2021 | | | | 25,000 | | | | 18,188 | |
Archrock Partners LP 144A | | | 6.25 | | | | 4-1-2028 | | | | 25,000 | | | | 17,250 | |
Archrock Partners LP 144A | | | 6.88 | | | | 4-1-2027 | | | | 300,000 | | | | 213,030 | |
Buckeye Partners LP | | | 5.85 | | | | 11-15-2043 | | | | 375,000 | | | | 251,138 | |
Callon Petroleum Company | | | 6.13 | | | | 10-1-2024 | | | | 75,000 | | | | 13,313 | |
Carrizo Oil & Gas Incorporated | | | 8.25 | | | | 7-15-2025 | | | | 350,000 | | | | 56,000 | |
Cheniere Energy Partners LP 144A | | | 4.50 | | | | 10-1-2029 | | | | 375,000 | | | | 333,750 | |
Cheniere Energy Partners LP | | | 5.25 | | | | 10-1-2025 | | | | 100,000 | | | | 93,000 | |
Cheniere Energy Partners LP | | | 5.63 | | | | 10-1-2026 | | | | 200,000 | | | | 186,000 | |
Denbury Resources Incorporated 144A | | | 9.00 | | | | 5-15-2021 | | | | 125,000 | | | | 36,563 | |
Denbury Resources Incorporated 144A | | | 9.25 | | | | 3-31-2022 | | | | 275,000 | | | | 66,000 | |
EnLink Midstream Partners LP | | | 4.40 | | | | 4-1-2024 | | | | 50,000 | | | | 25,235 | |
EnLink Midstream Partners LP | | | 4.85 | | | | 7-15-2026 | | | | 225,000 | | | | 110,633 | |
EnLink Midstream Partners LP | | | 5.05 | | | | 4-1-2045 | | | | 50,000 | | | | 18,235 | |
EnLink Midstream Partners LP | | | 5.45 | | | | 6-1-2047 | | | | 237,000 | | | | 78,163 | |
Enviva Partners LP 144A | | | 6.50 | | | | 1-15-2026 | | | | 500,000 | | | | 487,500 | |
EQT Corporation | | | 7.00 | | | | 2-1-2030 | | | | 750,000 | | | | 558,765 | |
Gulfport Energy Corporation | | | 6.00 | | | | 10-15-2024 | | | | 450,000 | | | | 110,250 | |
Indigo Natural Resources LLC 144A | | | 6.88 | | | | 2-15-2026 | | | | 350,000 | | | | 231,000 | |
Murphy Oil Corporation | | | 5.75 | | | | 8-15-2025 | | | | 155,000 | | | | 82,941 | |
Murphy Oil Corporation | | | 5.88 | | | | 12-1-2027 | | | | 200,000 | | | | 104,560 | |
Occidental Petroleum Corporation | | | 4.10 | | | | 2-1-2021 | | | | 5,000 | | | | 4,230 | |
Occidental Petroleum Corporation | | | 6.45 | | | | 9-15-2036 | | | | 325,000 | | | | 155,435 | |
Occidental Petroleum Corporation | | | 6.60 | | | | 3-15-2046 | | | | 25,000 | | | | 11,782 | |
Rockies Express Pipeline LLC 144A | | | 6.88 | | | | 4-15-2040 | | | | 50,000 | | | | 30,068 | |
Southern Star Central Corporation 144A | | | 5.13 | | | | 7-15-2022 | | | | 200,000 | | | | 197,722 | |
Southwestern Energy Company | | | 7.75 | | | | 10-1-2027 | | | | 225,000 | | | | 147,938 | |
Sunoco Logistics Partner LP | | | 5.40 | | | | 10-1-2047 | | | | 750,000 | | | | 595,486 | |
Tallgrass Energy Partners LP 144A | | | 5.50 | | | | 9-15-2024 | | | | 225,000 | | | | 123,750 | |
Ultra Resources Incorporated 144A ‡(a) | | | 7.13 | | | | 4-15-2025 | | | | 75,000 | | | | 1,350 | |
Western Midstream Partners LP | | | 4.05 | | | | 2-1-2030 | | | | 100,000 | | | | 44,013 | |
| |
| | | | 4,595,288 | |
| | | | | |
|
Financials: 4.24% | |
|
| Banks: 1.06% | |
Bank of America Corporation (3 Month LIBOR +4.55%)± | | | 6.30 | | | | 12-29-2049 | | | | 265,000 | | | | 278,250 | |
JPMorgan Chase & Company (3 Month LIBOR +3.13%)±(s) | | | 4.60 | | | | 2-1-2025 | | | | 500,000 | | | | 437,600 | |
JPMorgan Chase & Company (3 Month LIBOR +3.25%)± | | | 5.15 | | | | 12-29-2049 | | | | 350,000 | | | | 332,500 | |
JPMorgan Chase & Company (3 Month LIBOR +3.30%)± | | | 6.00 | | | | 12-31-2049 | | | | 100,000 | | | | 100,000 | |
PNC Financial Services (3 Month LIBOR +3.30%)± | | | 5.00 | | | | 12-29-2049 | | | | 250,000 | | | | 236,250 | |
| |
| | | | 1,384,600 | |
| | | | | |
|
| Capital Markets: 0.41% | |
International Finance Corporation | | | 6.30 | | | | 11-25-2024 | | | | 33,500,000 | | | | 435,205 | |
MSCI Incorporated 144A | | | 5.75 | | | | 8-15-2025 | | | | 100,000 | | | | 103,236 | |
| |
| | | | 538,441 | |
| | | | | |
|
| Consumer Finance: 1.20% | |
FirstCash Incorporated 144A | | | 5.38 | | | | 6-1-2024 | | | | 175,000 | | | | 167,563 | |
Ford Motor Credit Company LLC | | | 3.20 | | | | 1-15-2021 | | | | 1,000,000 | | | | 966,250 | |
General Motors Financial Company Incorporated | | | 5.65 | | | | 1-17-2029 | | | | 170,000 | | | | 152,281 | |
Springleaf Finance Corporation | | | 5.38 | | | | 11-15-2029 | | | | 50,000 | | | | 45,776 | |
The accompanying notes are an integral part of these financial statements.
Wells Fargo Strategic Income Fund | 9
Consolidated portfolio of investments—March 31, 2020 (unaudited)
| | | | | | | | | | | | | | | | |
| | | Interest rate | | | Maturity date | | | Principal | | | Value | |
|
| Consumer Finance (continued) | |
Springleaf Finance Corporation | | | 6.63 | % | | | 1-15-2028 | | | $ | 225,000 | | | $ | 210,690 | |
Springleaf Finance Corporation | | | 7.13 | | | | 3-15-2026 | | | | 25,000 | | | | 24,469 | |
| |
| | | | 1,567,029 | |
| | | | | |
|
| Diversified Financial Services: 0.15% | |
LPL Holdings Incorporated 144A | | | 5.75 | | | | 9-15-2025 | | | | 200,000 | | | | 192,000 | |
| | | | | | | | | | | | | | | | |
|
| Insurance: 1.42% | |
AmWINS Group Incorporated 144A | | | 7.75 | | | | 7-1-2026 | | | | 145,000 | | | | 141,556 | |
Guardian Life Insurance Company 144A | | | 4.85 | | | | 1-24-2077 | | | | 200,000 | | | | 227,774 | |
HUB International Limited 144A | | | 7.00 | | | | 5-1-2026 | | | | 250,000 | | | | 247,500 | |
Lincoln National Corporation | | | 7.00 | | | | 6-15-2040 | | | | 855,000 | | | | 943,025 | |
MetLife Incorporated | | | 6.40 | | | | 12-15-2066 | | | | 200,000 | | | | 208,721 | |
USI Incorporated 144A | | | 6.88 | | | | 5-1-2025 | | | | 100,000 | | | | 93,000 | |
| |
| | | | 1,861,576 | |
| | | | | |
|
Health Care: 1.95% | |
|
| Health Care Equipment & Supplies: 0.17% | |
Hill-Rom Holdings Incorporated 144A | | | 4.38 | | | | 9-15-2027 | | | | 75,000 | | | | 73,875 | |
Hologic Incorporated 144A | | | 4.38 | | | | 10-15-2025 | | | | 150,000 | | | | 148,544 | |
| |
| | | | 222,419 | |
| | | | | |
|
| Health Care Providers & Services: 1.62% | |
Community Health Systems Incorporated 144A | | | 6.63 | | | | 2-15-2025 | | | | 250,000 | | | | 231,250 | |
Encompass Health Corporation | | | 4.50 | | | | 2-1-2028 | | | | 75,000 | | | | 73,556 | |
Highmark Incorporated 144A | | | 6.13 | | | | 5-15-2041 | | | | 850,000 | | | | 1,119,869 | |
MPH Acquisition Holdings LLC 144A | | | 7.13 | | | | 6-1-2024 | | | | 125,000 | | | | 108,758 | |
MPT Operating Partnership LP | | | 4.63 | | | | 8-1-2029 | | | | 250,000 | | | | 230,000 | |
Select Medical Corporation 144A | | | 6.25 | | | | 8-15-2026 | | | | 125,000 | | | | 125,000 | |
Tenet Healthcare Corporation | | | 5.13 | | | | 5-1-2025 | | | | 125,000 | | | | 118,125 | |
Vizient Incorporated 144A | | | 6.25 | | | | 5-15-2027 | | | | 105,000 | | | | 104,781 | |
| |
| | | | 2,111,339 | |
| | | | | |
|
| Health Care Technology: 0.12% | |
Change Healthcare Holdings Incorporated 144A | | | 5.75 | | | | 3-1-2025 | | | | 175,000 | | | | 161,875 | |
| | | | | | | | | | | | | | | | |
|
| Pharmaceuticals: 0.04% | |
Bausch Health Companies Incorporated 144A | | | 5.00 | | | | 1-30-2028 | | | | 25,000 | | | | 23,668 | |
Bausch Health Companies Incorporated 144A | | | 5.25 | | | | 1-30-2030 | | | | 25,000 | | | | 23,375 | |
| |
| | | | 47,043 | |
| | | | | |
|
Industrials: 1.78% | |
|
| Aerospace & Defense: 0.17% | |
BBA US Holdings Incorporated 144A | | | 4.00 | | | | 3-1-2028 | | | | 50,000 | | | | 45,140 | |
BBA US Holdings Incorporated 144A | | | 5.38 | | | | 5-1-2026 | | | | 34,000 | | | | 32,895 | |
RBS Global & Rexnord LLC 144A | | | 4.88 | | | | 12-15-2025 | | | | 150,000 | | | | 140,250 | |
| |
| | | | 218,285 | |
| | | | | |
|
| Air Freight & Logistics: 0.02% | |
Cargo Aircraft Management Company 144A | | | 4.75 | | | | 2-1-2028 | | | | 25,000 | | | | 23,188 | |
| | | | | | | | | | | | | | | | |
|
| Airlines: 0.56% | |
Delta Air Lines Incorporated | | | 2.00 | | | | 12-10-2029 | | | | 800,000 | | | | 727,821 | |
| | | | | | | | | | | | | | | | |
The accompanying notes are an integral part of these financial statements.
10 | Wells Fargo Strategic Income Fund
Consolidated portfolio of investments—March 31, 2020 (unaudited)
| | | | | | | | | | | | | | | | |
| | | Interest rate | | | Maturity date | | | Principal | | | Value | |
| Commercial Services & Supplies: 0.55% | |
Advanced Disposal Services Incorporated 144A | | | 5.63 | % | | | 11-15-2024 | | | $ | 50,000 | | | $ | 50,625 | |
Covanta Holding Corporation | | | 5.88 | | | | 3-1-2024 | | | | 75,000 | | | | 70,688 | |
Covanta Holding Corporation | | | 6.00 | | | | 1-1-2027 | | | | 175,000 | | | | 145,760 | |
IAA Spinco Incorporated 144A | | | 5.50 | | | | 6-15-2027 | | | | 200,000 | | | | 193,500 | |
KAR Auction Services Incorporated 144A | | | 5.13 | | | | 6-1-2025 | | | | 275,000 | | | | 262,625 | |
| |
| | | | 723,198 | |
| | | | | |
|
| Machinery: 0.19% | |
Stevens Holding Company Incorporated 144A | | | 6.13 | | | | 10-1-2026 | | | | 150,000 | | | | 148,187 | |
Trimas Corporation 144A | | | 4.88 | | | | 10-15-2025 | | | | 110,000 | | | | 103,813 | |
| |
| | | | 252,000 | |
| | | | | |
|
| Trading Companies & Distributors: 0.17% | |
Fortress Transportation & Infrastructure Investors LLC 144A | | | 6.50 | | | | 10-1-2025 | | | | 299,000 | | | | 219,018 | |
| | | | | | | | | | | | | | | | |
|
| Transportation Infrastructure: 0.12% | |
Toll Road Investors Partnership II LP 144A¤ | | | 0.00 | | | | 2-15-2027 | | | | 200,000 | | | | 156,854 | |
| | | | | | | | | | | | | | | | |
|
Information Technology: 2.80% | |
|
| Communications Equipment: 0.69% | |
CommScope Technologies Finance LLC 144A | | | 6.00 | | | | 6-15-2025 | | | | 50,000 | | | | 45,760 | |
CommScope Technologies Finance LLC 144A | | | 8.25 | | | | 3-1-2027 | | | | 100,000 | | | | 96,390 | |
Motorola Solutions Incorporated | | | 5.50 | | | | 9-1-2044 | | | | 750,000 | | | | 756,912 | |
| |
| | | | 899,062 | |
| | | | | |
|
| IT Services: 0.46% | |
Cardtronics Incorporated 144A | | | 5.50 | | | | 5-1-2025 | | | | 300,000 | | | | 285,000 | |
Gartner Incorporated 144A | | | 5.13 | | | | 4-1-2025 | | | | 325,000 | | | | 317,688 | |
| |
| | | | 602,688 | |
| | | | | |
|
| Semiconductors & Semiconductor Equipment: 0.95% | |
Broadcom Incorporated 144A | | | 5.00 | | | | 4-15-2025 | | | | 150,000 | | | | 151,452 | |
NVIDIA Corporation | | | 3.50 | | | | 4-1-2050 | | | | 1,000,000 | | | | 1,091,724 | |
| |
| | | | 1,243,176 | |
| | | | | |
|
| Software: 0.48% | |
CDK Global Incorporated | | | 4.88 | | | | 6-1-2027 | | | | 50,000 | | | | 51,250 | |
Fair Isaac Corporation 144A | | | 4.00 | | | | 6-15-2028 | | | | 150,000 | | | | 144,000 | |
Fair Isaac Corporation 144A | | | 5.25 | | | | 5-15-2026 | | | | 50,000 | | | | 49,500 | |
IQVIA Incorporated 144A | | | 5.00 | | | | 5-15-2027 | | | | 200,000 | | | | 204,500 | |
SS&C Technologies Incorporated 144A | | | 5.50 | | | | 9-30-2027 | | | | 175,000 | | | | 180,469 | |
| |
| | | | 629,719 | |
| | | | | |
|
| Technology Hardware, Storage & Peripherals: 0.22% | |
NCR Corporation 144A | | | 5.75 | | | | 9-1-2027 | | | | 150,000 | | | | 136,500 | |
NCR Corporation | | | 5.00 | | | | 7-15-2022 | | | | 50,000 | | | | 47,000 | |
NCR Corporation | | | 6.38 | | | | 12-15-2023 | | | | 100,000 | | | | 98,749 | |
| |
| | | | 282,249 | |
| | | | | |
|
Materials: 0.88% | |
|
| Chemicals: 0.18% | |
Valvoline Incorporated 144A | | | 4.25 | | | | 2-15-2030 | | | | 250,000 | | | | 232,500 | |
| | | | | | | | | | | | | | | | |
The accompanying notes are an integral part of these financial statements.
Wells Fargo Strategic Income Fund | 11
Consolidated portfolio of investments—March 31, 2020 (unaudited)
| | | | | | | | | | | | | | | | |
| | | Interest rate | | | Maturity date | | | Principal | | | Value | |
| Containers & Packaging: 0.50% | |
Berry Global Incorporated 144A | | | 4.88 | % | | | 7-15-2026 | | | $ | 50,000 | | | $ | 50,500 | |
Crown Americas Capital Corporation VI | | | 4.75 | | | | 2-1-2026 | | | | 200,000 | | | | 204,940 | |
Flex Acquisition Company Incorporated 144A | | | 6.88 | | | | 1-15-2025 | | | | 100,000 | | | | 93,500 | |
Flex Acquisition Company Incorporated 144A | | | 7.88 | | | | 7-15-2026 | | | | 200,000 | | | | 184,213 | |
Owens-Brockway Packaging Incorporated 144A | | | 6.38 | | | | 8-15-2025 | | | | 125,000 | | | | 118,750 | |
| |
| | | | 651,903 | |
| | | | | |
|
| Metals & Mining: 0.18% | |
Freeport-McMoRan Incorporated | | | 4.13 | | | | 3-1-2028 | | | | 75,000 | | | | 65,654 | |
Novelis Corporation 144A | | | 5.88 | | | | 9-30-2026 | | | | 175,000 | | | | 171,739 | |
| |
| | | | 237,393 | |
| | | | | |
|
| Paper & Forest Products: 0.02% | |
Clearwater Paper Corporation 144A | | | 5.38 | | | | 2-1-2025 | | | | 25,000 | | | | 22,750 | |
| | | | | | | | | | | | | | | | |
|
Real Estate: 0.65% | |
|
| Equity REITs: 0.65% | |
CoreCivic Incorporated | | | 4.63 | | | | 5-1-2023 | | | | 225,000 | | | | 204,750 | |
ESH Hospitality Incorporated 144A | | | 5.25 | | | | 5-1-2025 | | | | 175,000 | | | | 147,000 | |
SBA Communications Corporation 144A | | | 3.88 | | | | 2-15-2027 | | | | 300,000 | | | | 300,750 | |
The Geo Group Incorporated | | | 5.13 | | | | 4-1-2023 | | | | 225,000 | | | | 168,750 | |
The Geo Group Incorporated | | | 5.88 | | | | 10-15-2024 | | | | 50,000 | | | | 35,000 | |
| |
| | | | 856,250 | |
| | | | | |
|
Utilities: 2.17% | |
|
| Electric Utilities: 1.29% | |
Edison International %% | | | 4.95 | | | | 4-15-2025 | | | | 1,000,000 | | | | 997,690 | |
NextEra Energy Operating Partners LP 144A | | | 4.50 | | | | 9-15-2027 | | | | 275,000 | | | | 268,125 | |
Oglethorpe Power Corporation | | | 4.25 | | | | 4-1-2046 | | | | 400,000 | | | | 417,108 | |
| |
| | | | 1,682,923 | |
| | | | | |
|
| Independent Power & Renewable Electricity Producers: 0.88% | |
NSG Holdings LLC 144A | | | 7.75 | | | | 12-15-2025 | | | | 74,321 | | | | 74,321 | |
Pattern Energy Group Incorporated 144A | | | 5.88 | | | | 2-1-2024 | | | | 600,000 | | | | 595,608 | |
TerraForm Power Operating LLC 144A | | | 4.25 | | | | 1-31-2023 | | | | 100,000 | | | | 99,250 | |
TerraForm Power Operating LLC 144A | | | 4.75 | | | | 1-15-2030 | | | | 100,000 | | | | 97,000 | |
TerraForm Power Operating LLC 144A | | | 5.00 | | | | 1-31-2028 | | | | 275,000 | | | | 288,145 | |
| |
| | | | 1,154,324 | |
| | | | | |
| |
Total Corporate Bonds and Notes (Cost $35,052,808) | | | | 31,734,153 | |
| | | | | |
| | | | |
| | | | | | | | | | | | | | | | |
| | | | | | | | | Shares | | | | |
| Exchange-Traded Funds: 3.45% | | | | | | | | | | | | |
SPDR Barclays High Yield Bond ETF | | | | | | | | | | | 21,108 | | | | 1,999,772 | |
Xtrackers USD High Yield Corporate Bond ETF | | | | | | | | | | | 57,000 | | | | 2,511,990 | |
| | | | |
Total Exchange-Traded Funds (Cost $4,484,802) | | | | | | | | | | | | | | | 4,511,762 | |
| | | | | | | | | | | | | | | | |
| | | | |
| | | | | | | | | | | | | | | | |
| | | | | | | | | Principal | | | | |
| Foreign Corporate Bonds and Notes: 8.85% | | | | | | | | | | | | |
| | | | |
Communication Services: 0.57% | | | | | | | | | | | | | | | | |
| | | | |
| Diversified Telecommunication Services: 0.34% | | | | | | | | | | | | |
Global Switch Holdings Limited | | | 2.25 | | | | 5-31-2027 | | | EUR | 400,000 | | | | 450,564 | |
| | | | | | | | | | | | | | | | |
The accompanying notes are an integral part of these financial statements.
12 | Wells Fargo Strategic Income Fund
Consolidated portfolio of investments—March 31, 2020 (unaudited)
| | | | | | | | | | | | | | | | |
| | | Interest rate | | | Maturity date | | | Principal | | | Value | |
|
| Media: 0.23% | |
Ziggo Bond Company BV 144A | | | 3.38 | % | | | 2-28-2030 | | | EUR | 300,000 | | | $ | 296,436 | |
| | | | | | | | | | | | | | | | |
|
Consumer Discretionary: 1.23% | |
|
| Auto Components: 0.22% | |
HP Pelzer Holding GmbH 144A | | | 4.13 | | | | 4-1-2024 | | | EUR | 450,000 | | | | 292,840 | |
| | | | | | | | | | | | | | | | |
|
| Automobiles: 0.39% | |
Peugeot SA Company | | | 2.00 | | | | 3-20-2025 | | | EUR | 500,000 | | | | 507,602 | |
| | | | | | | | | | | | | | | | |
|
| Diversified Consumer Services: 0.32% | |
Intertrust Group BV 144A | | | 3.38 | | | | 11-15-2025 | | | EUR | 400,000 | | | | 419,984 | |
| | | | | | | | | | | | | | | | |
|
| Hotels, Restaurants & Leisure: 0.30% | |
Accor SA | | | 1.25 | | | | 1-25-2024 | | | EUR | 400,000 | | | | 391,232 | |
| | | | | | | | | | | | | | | | |
|
Consumer Staples: 1.53% | |
|
| Food & Staples Retailing: 0.51% | |
Casino Guichard Perracho SA | | | 3.58 | | | | 2-7-2025 | | | EUR | 400,000 | | | | 352,654 | |
Tasty Bondco 1 SA 144A | | | 6.25 | | | | 5-15-2026 | | | EUR | 400,000 | | | | 317,635 | |
| |
| | | | 670,289 | |
| | | | | |
|
| Food Products: 0.71% | |
Danone SA (s) | | | 1.75 | | | | 3-27-2023 | | | EUR | 400,000 | | | | 423,813 | |
Sigma Holdings Company BV 144A | | | 5.75 | | | | 5-15-2026 | | | EUR | 500,000 | | | | 499,613 | |
| |
| | | | 923,426 | |
| | | | | |
|
| Household Products: 0.31% | |
Energizer Gamma Acquisition BV 144A | | | 4.63 | | | | 7-15-2026 | | | EUR | 400,000 | | | | 397,044 | |
| | | | | | | | | | | | | | | | |
|
Energy: 0.74% | |
|
| Oil, Gas & Consumable Fuels: 0.74% | |
Eni SpA | | | 1.13 | | | | 9-19-2028 | | | EUR | 800,000 | | | | 853,291 | |
Total SA | | | 3.88 | | | | 12-29-2049 | | | EUR | 100,000 | | | | 111,490 | |
| |
| | | | 964,781 | |
| | | | | |
|
Financials: 2.57% | |
|
| Banks: 1.21% | |
Asian Development Bank | | | 6.20 | | | | 10-6-2026 | | | INR | 18,450,000 | | | | 236,834 | |
Bankia SA (s) | | | 6.00 | | | | 7-18-2022 | | | EUR | 600,000 | | | | 504,914 | |
Caixa Geral de Depositos SA « | | | 5.75 | | | | 6-28-2028 | | | EUR | 400,000 | | | | 399,250 | |
Caixa Geral de Depositos SA (s) | | | 10.75 | | | | 3-30-2022 | | | EUR | 400,000 | | | | 434,542 | |
| |
| | | | 1,575,540 | |
| | | | | |
|
| Consumer Finance: 0.33% | |
FCA Bank SpA | | | 1.00 | | | | 11-15-2021 | | | EUR | 400,000 | | | | 435,205 | |
| | | | | | | | | | | | | | | | |
|
| Diversified Financial Services: 0.72% | |
JAB Holdings BV | | | 1.75 | | | | 6-25-2026 | | | EUR | 400,000 | | | | 443,355 | |
LKQ European Holdings BV Company 144A | | | 3.63 | | | | 4-1-2026 | | | EUR | 500,000 | | | | 491,311 | |
| |
| | | | 934,666 | |
| | | | | |
|
| Thrifts & Mortgage Finance: 0.31% | |
Deutsche Pfandbriefbank AG | | | 2.88 | | | | 6-28-2027 | | | EUR | 400,000 | | | | 404,509 | |
| | | | | | | | | | | | | | | | |
The accompanying notes are an integral part of these financial statements.
Wells Fargo Strategic Income Fund | 13
Consolidated portfolio of investments—March 31, 2020 (unaudited)
| | | | | | | | | | | | | | | | |
| | | Interest rate | | | Maturity date | | | Principal | | | Value | |
Industrials: 0.78% | |
|
| Commercial Services & Supplies: 0.59% | |
Paprec Holding SA 144A | | | 4.00 | % | | | 3-31-2025 | | | EUR | 450,000 | | | $ | 339,997 | |
Prosegur Cash SA | | | 1.38 | | | | 2-4-2026 | | | EUR | 400,000 | | | | 428,101 | |
| |
| | | | 768,098 | |
| | | | | |
|
| Road & Rail: 0.19% | |
Europcar Groupe SA 144A | | | 4.13 | | | | 11-15-2024 | | | EUR | 500,000 | | | | 255,586 | |
| | | | | | | | | | | | | | | | |
|
Information Technology: 0.34% | |
|
| IT Services: 0.34% | |
Capgemini SE | | | 1.00 | | | | 10-18-2024 | | | EUR | 400,000 | | | | 438,844 | |
| | | | | | | | | | | | | | | | |
|
Real Estate: 0.76% | |
|
| Equity REITs: 0.30% | |
Unibail Rodamco SE (s) | | | 2.13 | | | | 7-25-2023 | | | EUR | 400,000 | | | | 388,221 | |
| | | | | | | | | | | | | | | | |
|
| Real Estate Management & Development: 0.46% | |
Akelius Residential Property AB | | | 3.88 | | | | 10-5-2078 | | | EUR | 500,000 | | | | 498,043 | |
ATF Netherlands BV | | | 1.50 | | | | 7-15-2024 | | | EUR | 100,000 | | | | 108,794 | |
| |
| | | | 606,837 | |
| | | | | |
|
Utilities: 0.33% | |
|
| Multi-Utilities: 0.33% | |
EP Infrastructure AS | | | 1.66 | | | | 4-26-2024 | | | EUR | 400,000 | | | | 434,327 | |
| | | | | | | | | | | | | | | | |
| |
Total Foreign Corporate Bonds and Notes (Cost $13,616,853) | | | | 11,556,031 | |
| | | | | |
|
| Foreign Government Bonds: 8.59% | |
Argentina ¤ | | | 0.00 | | | | 5-28-2020 | | | ARS | 27,625,000 | | | | 273,828 | |
Brazil | | | 10.00 | | | | 1-1-2021 | | | BRL | 2,440,000 | | | | 489,417 | |
Brazil | | | 10.00 | | | | 1-1-2023 | | | BRL | 2,765,000 | | | | 589,055 | |
Colombia | | | 7.00 | | | | 5-4-2022 | | | COP | 4,500,000,000 | | | | 1,146,224 | |
Dominican Republic 144A | | | 4.50 | | | | 1-30-2030 | | | DOP | 200,000 | | | | 174,000 | |
Indonesia | | �� | 6.50 | | | | 6-15-2025 | | | IDR | 13,500,000,000 | | | | 802,054 | |
Indonesia | | | 7.00 | | | | 5-15-2022 | | | IDR | 16,000,000,000 | | | | 998,063 | |
Malaysia | | | 3.88 | | | | 3-10-2022 | | | MYR | 3,500,000 | | | | 827,209 | |
Malaysia | | | 3.96 | | | | 9-15-2025 | | | MYR | 2,300,000 | | | | 553,725 | |
Mexico | | | 6.50 | | | | 6-9-2022 | | | MXN | 38,260,000 | | | | 1,615,944 | |
Mexico | | | 6.50 | | | | 6-9-2022 | | | MXN | 7,000,000 | | | | 295,651 | |
Republic of South Africa | | | 6.75 | | | | 3-31-2021 | | | ZAR | 20,325,000 | | | | 1,150,009 | |
Republic of South Africa | | | 8.75 | | | | 2-28-2048 | | | ZAR | 9,100,000 | | | | 381,365 | |
Romania | | | 3.40 | | | | 3-8-2022 | | | RON | 4,000,000 | | | | 906,741 | |
Russia | | | 6.50 | | | | 2-28-2024 | | | RUB | 80,000,000 | | | | 1,020,637 | |
| |
Total Foreign Government Bonds (Cost $13,622,946) | | | | 11,223,922 | |
| | | | | |
|
Loans: 2.49% | |
|
Communication Services: 0.74% | |
|
| Media: 0.74% | |
Ancestry.com Incorporated (1 Month LIBOR +4.25%)± | | | 5.24 | | | | 8-27-2026 | | | $ | 396,482 | | | | 313,221 | |
Charter Communications Operating LLC (1 Month LIBOR +1.75%)± | | | 2.74 | | | | 4-30-2025 | | | | 492,443 | | | | 471,308 | |
Gray Television Incorporated (1 Month LIBOR +2.50%)±‡ | | | 4.02 | | | | 1-2-2026 | | | | 84,964 | | | | 78,677 | |
Mission Broadcasting Incorporated (1 Month LIBOR +2.25%)± | | | 3.83 | | | | 1-17-2024 | | | | 21,328 | | | | 19,835 | |
Nexstar Broadcasting Incorporated (1 Month LIBOR +2.25%)± | | | 3.19 | | | | 1-17-2024 | | | | 82,697 | | | | 76,908 | |
| |
| | | | 959,949 | |
| | | | | |
The accompanying notes are an integral part of these financial statements.
14 | Wells Fargo Strategic Income Fund
Consolidated portfolio of investments—March 31, 2020 (unaudited)
| | | | | | | | | | | | | | | | |
| | | Interest rate | | | Maturity date | | | Principal | | | Value | |
Consumer Discretionary: 0.36% | |
|
| Distributors: 0.20% | |
Spin Holdco Incorporated (3 Month LIBOR +3.25%)±‡ | | | 5.09 | % | | | 11-14-2022 | | | $ | 297,939 | | | $ | 264,421 | |
| | | | | | | | | | | | | | | | |
|
| Hotels, Restaurants & Leisure: 0.16% | |
CCM Merger Incorporated (1 Month LIBOR +2.25%)±‡ | | | 3.24 | | | | 8-8-2021 | | | | 235,807 | | | | 208,690 | |
| | | | | | | | | | | | | | | | |
|
Financials: 0.46% | |
|
| Capital Markets: 0.33% | |
Nexus Buyer LLC (1 Month LIBOR +3.75%)±‡ | | | 4.61 | | | | 11-9-2026 | | | | 199,500 | | | | 177,056 | |
Tortoise Borrower LLC (1 Month LIBOR +3.50%)±‡ | | | 5.10 | | | | 1-31-2025 | | | | 99,241 | | | | 74,430 | |
VFH Parent LLC (1 Month LIBOR +3.00%)± | | | 4.01 | | | | 3-1-2026 | | | | 200,000 | | | | 181,500 | |
| |
| | | | 432,986 | |
| | | | | |
|
| Diversified Financial Services: 0.10% | |
Intelsat Jackson Holdings SA (3 Month LIBOR +3.75%)± | | | 5.68 | | | | 11-27-2023 | | | | 140,332 | | | | 127,878 | |
| | | | | | | | | | | | | | | | |
|
| Insurance: 0.03% | |
HUB International Limited (3 Month LIBOR +4.00%)± | | | 5.69 | | | | 4-25-2025 | | | | 24,938 | | | | 23,379 | |
USI Incorporated (1 Month LIBOR +4.00%)± | | | 4.99 | | | | 12-2-2026 | | | | 24,938 | | | | 22,277 | |
| |
| | | | 45,656 | |
| | | | | |
|
Health Care: 0.22% | |
|
| Pharmaceuticals: 0.22% | |
Valeant Pharmaceuticals International Incorporated (1 Month LIBOR +3.00%)± | | | 3.61 | | | | 6-2-2025 | | | | 300,758 | | | | 284,592 | |
| | | | | | | | | | | | | | | | |
|
Industrials: 0.12% | |
|
| Commercial Services & Supplies: 0.02% | |
KAR Auction Services Incorporated (1 Month LIBOR +2.25%)±‡ | | | 3.19 | | | | 9-19-2026 | | | | 22,657 | | | | 20,845 | |
| | | | | | | | | | | | | | | | |
|
| Machinery: 0.10% | |
Columbus McKinnon Corporation (3 Month LIBOR +2.50%)±‡ | | | 3.95 | | | | 1-31-2024 | | | | 148,004 | | | | 130,244 | |
| | | | | | | | | | | | | | | | |
|
Information Technology: 0.46% | |
|
| Electronic Equipment, Instruments & Components: 0.43% | |
Dell International LLC (1 Month LIBOR +2.00%)± | | | 2.99 | | | | 9-19-2025 | | | | 584,675 | | | | 555,810 | |
| | | | | | | | | | | | | | | | |
|
| Software: 0.03% | |
Emerald Topco Incorporated (1 Month LIBOR +3.50%)±‡ | | | 4.49 | | | | 7-24-2026 | | | | 49,750 | | | | 45,273 | |
| | | | | | | | | | | | | | | | |
|
Materials: 0.13% | |
|
| Containers & Packaging: 0.13% | |
RING Container Technologies (1 Month LIBOR +2.75%)±‡ | | | 3.74 | | | | 10-31-2024 | | | | 198,975 | | | | 169,129 | |
| | | | | | | | | | | | | | | | |
| |
Total Loans (Cost $3,601,326) | | | | 3,245,473 | |
| | | | | |
|
Municipal Obligations: 0.26% | |
|
Illinois: 0.10% | |
|
| GO Revenue: 0.10% | |
Chicago IL Refunding Bonds Taxable Project Series E | | | 6.05 | | | | 1-1-2029 | | | | 125,000 | | | | 134,635 | |
| | | | | | | | | | | | | | | | |
The accompanying notes are an integral part of these financial statements.
Wells Fargo Strategic Income Fund | 15
Consolidated portfolio of investments—March 31, 2020 (unaudited)
| | | | | | | | | | | | | | | | |
| | | Interest rate | | | Maturity date | | | Principal | | | Value | |
Maryland: 0.08% | |
|
| Education Revenue: 0.08% | |
Maryland Health & HEFAR Green Street Academy Series B 144A | | | 6.75 | % | | | 7-1-2023 | | | $ | 100,000 | | | $ | 99,155 | |
| | | | | | | | | | | | | | | | |
|
Pennsylvania: 0.08% | |
|
| Health Revenue: 0.08% | |
Quakertown PA General Authority U.S. Department of Agriculture Loan Anticipation Notes Series2017-B | | | 3.80 | | | | 7-1-2021 | | | | 100,000 | | | | 99,342 | |
| | | | | | | | | | | | | | | | |
| |
Total Municipal Obligations (Cost $330,015) | | | | 333,132 | |
| | | | | |
|
| Non-Agency Mortgage-Backed Securities: 25.79% | |
AFN LLC Series2019-1A Class A2 144A | | | 4.46 | | | | 5-20-2049 | | | | 700,000 | | | | 441,606 | |
ALM Loan Funding Series2016-18A Class A2R (3 Month LIBOR +1.65%) 144A± | | | 3.48 | | | | 1-15-2028 | | | | 600,000 | | | | 577,822 | |
Aqua Finance Trust Series2019-A Class A 144A | | | 3.14 | | | | 7-16-2040 | | | | 465,940 | | | | 464,052 | |
Arroyo Mortgage Trust Series2019-2 Class A2 144A±± | | | 3.50 | | | | 4-25-2049 | | | | 1,212,023 | | | | 1,155,225 | |
Avant Loans Funding Trust Series2019-A Class A 144A | | | 3.48 | | | | 7-15-2022 | | | | 303,548 | | | | 295,324 | |
BB-UBS Trust Series2012-TFT Class C 144A±± | | | 3.47 | | | | 6-5-2030 | | | | 150,000 | | | | 148,037 | |
BCC Funding Corporation Series2019-1A Class D 144A | | | 3.94 | | | | 7-20-2027 | | | | 1,300,000 | | | | 1,260,923 | |
BlueMountain CLO Limited Series2015-3A Class A1R (3 Month LIBOR +1.00%) 144A± | | | 2.82 | | | | 4-20-2031 | | | | 700,000 | | | | 657,810 | |
BX Trust Series2019-11 Class D 144A±± | | | 4.08 | | | | 12-9-2041 | | | | 500,000 | | | | 392,205 | |
CFCRE Commercial Mortgage Trust Series2016-C7 Class AM | | | 4.16 | | | | 12-10-2054 | | | | 400,000 | | | | 412,287 | |
CIFC Funding Limited Series2018-1A Class B (3 Month LIBOR +1.40%) 144A± | | | 3.22 | | | | 4-18-2031 | | | | 1,000,000 | | | | 903,016 | |
CLI Funding LLC Series2019-1A Class A 144A | | | 3.71 | | | | 5-18-2044 | | | | 1,378,160 | | | | 1,281,099 | |
CLI Funding LLC Series2019-1A Class B 144A | | | 4.64 | | | | 5-18-2044 | | | | 551,271 | | | | 522,460 | |
CommonBond Student Loan Trust Series2018-CGS Class C 144A | | | 4.35 | | | | 2-25-2046 | | | | 578,695 | | | | 586,820 | |
Consumer Lending Receivables LLC Series2019-A Class A 144A | | | 3.52 | | | | 4-15-2026 | | | | 489,488 | | | | 473,824 | |
Consumer Loan Underlying Bond Credit Trust Series2018-P2 Class B 144A | | | 4.10 | | | | 10-15-2025 | | | | 500,000 | | | | 340,573 | |
Consumer Loan Underlying Bond Credit Trust Series2018-P3 Class A 144A | | | 3.82 | | | | 1-15-2026 | | | | 372,710 | | | | 362,151 | |
Deephaven Residential Mortgage Trust Series2019-1A Class A2 144A±± | | | 3.90 | | | | 1-25-2059 | | | | 807,398 | | | | 786,713 | |
Deephaven Residential Mortgage Trust Series2019-3A Class B1 144A±± | | | 4.26 | | | | 7-25-2059 | | | | 500,000 | | | | 438,439 | |
Driven Brands Funding LLC Series2019-2A Class A2 144A | | | 3.98 | | | | 10-20-2049 | | | | 349,125 | | | | 322,605 | |
Ellington Financial Mortgage Trust Series2019-1 Class M1 144A±± | | | 3.59 | | | | 6-25-2059 | | | | 1,500,000 | | | | 1,354,250 | |
Foundation Finance Trust Series2019-1A Class A 144A | | | 3.86 | | | | 11-15-2034 | | | | 683,084 | | | | 653,135 | |
FREMF Mortgage Trust Series 2017-K724 Class B 144A±± | | | 3.49 | | | | 11-25-2023 | | | | 400,000 | | | | 389,683 | |
GS Mortgage Security Trust Series 2014-GC22 Class AS | | | 4.11 | | | | 6-10-2047 | | | | 1,450,000 | | | | 1,481,670 | |
GS Mortgage Security Trust Series 2018-LUAU Class B (1 Month LIBOR +1.40%) 144A± | | | 2.10 | | | | 11-15-2032 | | | | 1,600,000 | | | | 1,250,497 | |
Harley Marine Financing LLC Barge Series2018-1A Class A2 144A | | | 5.68 | | | | 5-15-2043 | | | | 657,631 | | | | 582,230 | |
Longtrain Leasing III LLC Series2015-1A Class A2 144A | | | 4.06 | | | | 1-15-2045 | | | | 1,568,304 | | | | 1,449,431 | |
Marlette Funding Trust Series2018-3A Class A 144A | | | 3.20 | | | | 9-15-2028 | | | | 67,424 | | | | 66,970 | |
Marlette Funding Trust Series2018-4A Class B 144A | | | 4.21 | | | | 12-15-2028 | | | | 1,100,000 | | | | 1,034,467 | |
Marlette Funding Trust Series2019-1A Class A 144A | | | 3.44 | | | | 4-16-2029 | | | | 521,268 | | | | 503,302 | |
MP CLO VIII Limited Series2015-2A Class AR (3 Month LIBOR +0.91%) 144A± | | | 2.71 | | | | 10-28-2027 | | | | 592,314 | | | | 553,982 | |
Navistar Financial Dealer Note Series2018-1 Class D (1 Month LIBOR +1.55%) 144A± | | | 2.50 | | | | 9-25-2023 | | | | 600,000 | | | | 580,646 | |
New Residential Mortgage Loan Trust Series 2018-NQM1 Class A3 144A±± | | | 4.14 | | | | 11-25-2048 | | | | 415,257 | | | | 396,035 | |
Onemain Financial Issuance Trust Series2019-1A Class D 144A | | | 4.22 | | | | 2-14-2031 | | | | 1,100,000 | | | | 930,535 | |
Oxford Finance Funding Trust Series2019-1A Class A2 144A | | | 4.46 | | | | 2-15-2027 | | | | 800,000 | | | | 807,051 | |
SoFi Consumer Loan Program Trust Series2016-3 Class A 144A | | | 3.05 | | | | 12-26-2025 | | | | 35,451 | | | | 35,108 | |
SoFi Consumer Loan Program Trust Series2017-2 Class A 144A | | | 3.28 | | | | 2-25-2026 | | | | 314,705 | | | | 313,312 | |
SoFi Consumer Loan Program Trust Series2018-1 Class C 144A | | | 3.97 | | | | 2-25-2027 | | | | 700,000 | | | | 573,771 | |
The accompanying notes are an integral part of these financial statements.
16 | Wells Fargo Strategic Income Fund
Consolidated portfolio of investments—March 31, 2020 (unaudited)
| | | | | | | | | | | | | | | | |
| | | Interest rate | | | Maturity date | | | Principal | | | Value | |
|
| Non-Agency Mortgage-Backed Securities (continued) | |
SoFi Consumer Loan Program Trust Series2018-4 Class D 144A | | | 4.76 | % | | | 11-26-2027 | | | $ | 300,000 | | | $ | 262,772 | |
SoFi Professional Loan Program LLC Series2016-A Class A2 144A | | | 2.76 | | | | 12-26-2036 | | | | 115,197 | | | | 116,127 | |
SoFi Professional Loan Program LLC Series2017-E Class B 144A | | | 3.49 | | | | 11-26-2040 | | | | 300,000 | | | | 306,345 | |
Store Master Funding LLC Series2014-1A Class A2 144A | | | 5.00 | | | | 4-20-2044 | | | | 97,083 | | | | 78,717 | |
Store Master Funding LLC Series2015-1A Class A1 144A | | | 3.75 | | | | 4-20-2045 | | | | 1,346,075 | | | | 1,191,103 | |
Taco Bell Funding LLC Series2018-1A Class A21 144A | | | 4.32 | | | | 11-25-2048 | | | | 987,500 | | | | 962,822 | |
Textainer Marine Containers Limited Series2017-1A Class B 144A | | | 4.85 | | | | 5-20-2042 | | | | 125,485 | | | | 113,796 | |
Textainer Marine Containers Limited Series2017-2A Class B 144A | | | 4.75 | | | | 6-20-2042 | | | | 77,678 | | | | 69,788 | |
Venture CDO Limited Series2016-23A Class AR (3 Month LIBOR +1.07%) 144A± | | | 2.89 | | | | 7-19-2028 | | | | 700,000 | | | | 676,609 | |
Venture CDO Limited Series2017-28A Class A2 (3 Month LIBOR +1.11%) 144A± | | | 2.93 | | | | 7-20-2030 | | | | 1,180,000 | | | | 1,109,758 | |
Venture CDO Limited Series2018-35A Class AS (3 Month LIBOR +1.15%) 144A± | | | 2.95 | | | | 10-22-2031 | | | | 1,300,000 | | | | 1,232,260 | |
Verus Securitization Trust Series2019-1 Class M1 144A±± | | | 4.03 | | | | 12-25-2059 | | | | 200,000 | | | | 177,325 | |
Verus Securitization Trust Series2019-3 Class A2 144A | | | 2.94 | | | | 7-25-2059 | | | | 1,563,991 | | | | 1,502,297 | |
Visio Trust Series2019-1 Class A1 144A±± | | | 3.57 | | | | 6-25-2054 | | | | 1,167,426 | | | | 1,102,536 | |
| |
TotalNon-Agency Mortgage-Backed Securities (Cost $36,491,083) | | | | 33,681,321 | |
| | | | | |
| | | | |
| | | | | | | | | | | | | | | | |
| | | | | | Expiration
date | | | Shares | | | | |
| Rights: 0.00% | |
|
Utilities: 0.00% | |
|
| Independent Power & Renewable Electricity Producers: 0.00% | |
Vistra Energy Corporation † | | | | | | | 12-31-2046 | | | | 6,516 | | | | 6,516 | |
| | | | | | | | | | | | | | | | |
| |
Total Rights (Cost $6,757) | | | | 6,516 | |
| | | | | |
| | | | |
| | | | | | | | | | | | | | | | |
| | | | | | Maturity
date | | | Principal | | | | |
| U.S. Treasury Securities: 0.66% | |
U.S. Treasury Bond | | | 2.25 | | | | 8-15-2049 | | | $ | 440,000 | | | | 535,322 | |
U.S. Treasury Bond | | | 2.38 | | | | 11-15-2049 | | | | 260,000 | | | | 324,513 | |
| |
Total U.S. Treasury Securities (Cost $734,174) | | | | 859,835 | |
| | | | | |
|
Yankee Corporate Bonds and Notes: 4.75% | |
|
Communication Services: 0.15% | |
|
| Diversified Telecommunication Services: 0.15% | |
Intelsat Luxembourg SA | | | 8.13 | | | | 6-1-2023 | | | | 50,000 | | | | 10,250 | |
Telesat Canada Incorporated 144A | | | 6.50 | | | | 10-15-2027 | | | | 200,000 | | | | 192,000 | |
| |
| | | | 202,250 | |
| | | | | |
|
Energy: 0.44% | |
|
| Energy Equipment & Services: 0.07% | |
Valaris plc | | | 4.88 | | | | 6-1-2022 | | | | 375,000 | | | | 81,563 | |
Valaris plc | | | 5.75 | | | | 10-1-2044 | | | | 175,000 | | | | 11,706 | |
| |
| | | | 93,269 | |
| | | | | |
The accompanying notes are an integral part of these financial statements.
Wells Fargo Strategic Income Fund | 17
Consolidated portfolio of investments—March 31, 2020 (unaudited)
| | | | | | | | | | | | | | | | |
| | | Interest rate | | | Maturity
date | | | Principal | | | Value | |
| Oil, Gas & Consumable Fuels: 0.37% | |
Baytex Energy Corporation 144A | | | 5.63 | % | | | 6-1-2024 | | | $ | 425,000 | | | $ | 157,250 | |
Comision Federal de Electricidad 144A | | | 4.75 | | | | 2-23-2027 | | | | 250,000 | | | | 231,250 | |
Petroleos Mexicanos Company 144A | | | 6.84 | | | | 1-23-2030 | | | | 120,000 | | | | 86,822 | |
| |
| | | | 475,322 | |
| | | | | |
|
Financials: 3.32% | |
|
| Banks: 1.86% | |
ABN AMRO Bank NV 144A | | | 4.75 | | | | 7-28-2025 | | | | 200,000 | | | | 200,257 | |
Banco Internacional del Peru 144A | | | 3.25 | | | | 10-4-2026 | | | | 525,000 | | | | 462,005 | |
Deutsche Bank AG | | | 4.88 | | | | 12-1-2032 | | | | 500,000 | | | | 410,000 | |
Intesa Sanpaolo SpA 144A | | | 5.71 | | | | 1-15-2026 | | | | 635,000 | | | | 618,785 | |
Itau Unibanco Holding SA 144A | | | 3.25 | | | | 1-24-2025 | | | | 800,000 | | | | 746,160 | |
| |
| | | | 2,437,207 | |
| | | | | |
|
| Diversified Financial Services: 0.14% | |
Intelsat Jackson Holdings SA | | | 5.50 | | | | 8-1-2023 | | | | 260,000 | | | | 159,900 | |
Trivium Packaging Finance BV 144A | | | 5.50 | | | | 8-15-2026 | | | | 25,000 | | | | 24,875 | |
| |
| | | | 184,775 | |
| | | | | |
|
| Insurance: 1.13% | |
Allied World Assurance Company Holdings Limited | | | 4.35 | | | | 10-29-2025 | | | | 810,000 | | | | 827,118 | |
Swiss Re Finance (Luxembourg) SA (5 Year Treasury Constant Maturity +3.58%) 144A± | | | 5.00 | | | | 4-2-2049 | | | | 400,000 | | | | 407,600 | |
Validus Holdings Limited | | | 8.88 | | | | 1-26-2040 | | | | 160,000 | | | | 238,068 | |
| |
| | | | 1,472,786 | |
| | | | | |
|
| Thrifts & Mortgage Finance: 0.19% | |
Nationwide Building Society 144A | | | 4.13 | | | | 10-18-2032 | | | | 250,000 | | | | 244,596 | |
| | | | | | | | | | | | | | | | |
|
Health Care: 0.55% | |
|
| Pharmaceuticals: 0.55% | |
Bausch Health Companies Incorporated 144A | | | 5.50 | | | | 3-1-2023 | | | | 8,000 | | | | 7,840 | |
Bausch Health Companies Incorporated 144A | | | 5.50 | | | | 11-1-2025 | | | | 50,000 | | | | 50,515 | |
Bausch Health Companies Incorporated 144A | | | 6.13 | | | | 4-15-2025 | | | | 225,000 | | | | 221,625 | |
Bausch Health Companies Incorporated 144A | | | 7.00 | | | | 3-15-2024 | | | | 25,000 | | | | 25,625 | |
Teva Pharmaceutical Finance Netherlands I BV | | | 2.20 | | | | 7-21-2021 | | | | 200,000 | | | | 191,036 | |
Teva Pharmaceutical Finance Netherlands III BV | | | 4.10 | | | | 10-1-2046 | | | | 175,000 | | | | 127,750 | |
Teva Pharmaceutical Finance Netherlands III BV | | | 6.75 | | | | 3-1-2028 | | | | 100,000 | | | | 97,000 | |
| |
| | | | 721,391 | |
| | | | | |
|
Industrials: 0.29% | |
|
| Commercial Services & Supplies: 0.16% | |
Ritchie Brothers Auctioneers Incorporated 144A | | | 5.38 | | | | 1-15-2025 | | | | 200,000 | | | | 202,000 | |
| | | | | | | | | | | | | | | | |
|
| Transportation Infrastructure: 0.13% | |
Asciano Finance Limited 144A | | | 4.63 | | | | 9-23-2020 | | | | 170,000 | | | | 171,932 | |
| | | | | | | | | | | | | | | | |
| |
Total Yankee Corporate Bonds and Notes (Cost $6,973,743) | | | | 6,205,528 | |
| | | | | |
|
| Yankee Government Bonds: 1.11% | |
Commonwealth of Bahamas | | | 6.00 | | | | 11-21-2028 | | | | 200,000 | | | | 174,000 | |
Mongolia Government | | | 5.63 | | | | 5-1-2023 | | | | 200,000 | | | | 177,994 | |
Provincia de Cordoba 144A | | | 7.13 | | | | 6-10-2021 | | | | 250,000 | | | | 162,190 | |
The accompanying notes are an integral part of these financial statements.
18 | Wells Fargo Strategic Income Fund
Consolidated portfolio of investments—March 31, 2020 (unaudited)
| | | | | | | | | | | | | | | | |
| | | Interest rate | | | Maturity
date | | | Principal | | | Value | |
|
| Yankee Government Bonds (continued) | |
Provincia de Cordoba 144A | | | 7.13 | % | | | 8-1-2027 | | | $ | 550,000 | | | $ | 246,818 | |
Provincia de Santa Fe | | | 7.00 | | | | 3-23-2023 | | | | 350,000 | | | | 210,000 | |
Republic of Angola | | | 9.50 | | | | 11-12-2025 | | | | 400,000 | | | | 165,200 | |
Republic of Rwanda | | | 6.63 | | | | 5-2-2023 | | | | 200,000 | | | | 178,896 | |
Republic of Sri Lanka | | | 5.75 | | | | 1-18-2022 | | | | 200,000 | | | | 132,000 | |
| |
Total Yankee Government Bonds (Cost $2,335,545) | | | | 1,447,098 | |
| | | | | |
| | | | |
| | | | | | | | | | | | | | | | |
| | | Yield | | | | | | Shares | | | | |
| Short-Term Investments: 9.20% | |
|
| Investment Companies: 9.20% | |
Securities Lending Cash Investments LLC (l)(r)(u) | | | 2.11 | | | | | | | | 329,798 | | | | 329,831 | |
Wells Fargo Government Money Market Fund Select Class (l)(u)##* | | | 0.35 | | | | | | | | 11,679,571 | | | | 11,679,571 | |
| |
Total Short-Term Investments (Cost $12,009,402) | | | | 12,009,402 | |
| | | | | |
| | | | | | | | |
| Total investments in securities (Cost $140,664,157) | | | 98.12 | % | | | 128,132,988 | |
| | |
Other assets and liabilities, net | | | 1.88 | | | | 2,452,208 | |
| | | | | | | | |
| Total net assets | | | 100.00 | % | | $ | 130,585,196 | |
| | | | | | | | |
| 144A | The security may be resold in transactions exempt from registration, normally to qualified institutional buyers, pursuant to Rule 144A under the Securities Act of 1933. |
| ‡ | Security is valued using significant unobservable inputs. |
| (a) | The security is fair valued in accordance with procedures approved by the Board of Trustees. |
| %% | The security is purchased on a when-issued basis. |
| ± | Variable rate investment. The rate shown is the rate in effect at period end. |
| (s) | Security is perpetual in nature and has no stated maturity date. The date shown reflects the next call date. |
| ¤ | The security is issued in zero coupon form with no periodic interest payments. |
| « | All or a portion of this security is on loan. |
| ±± | The coupon of the security is adjusted based on the principal and interest payments received from the underlying pool of mortgages as well as the credit quality and the actual prepayment speed of the underlying mortgages. |
| † | Non-income-earning security |
| (l) | The issuer of the security is an affiliated person of the Fund as defined in the Investment Company Act of 1940. |
| (r) | The investment is anon-registered investment company purchased with cash collateral received from securities on loan. |
| (u) | The rate represents the7-day annualized yield at period end. |
| ## | All or a portion of this security is segregated for when-issued securities. |
| * | A portion of the holding represents an investment held in Strategic Income Special Investment (Cayman) Ltd., the consolidated entity. |
Abbreviations:
| FNMA | Federal National Mortgage Association |
| HEFAR | Higher Education Facilities Authority Revenue |
| LIBOR | London Interbank Offered Rate |
| REIT | Real estate investment trust |
The accompanying notes are an integral part of these financial statements.
Wells Fargo Strategic Income Fund | 19
Consolidated portfolio of investments—March 31, 2020 (unaudited)
Futures Contracts
| | | | | | | | | | | | | | | | | | | | | | | | |
| Description | | Number of
contracts | | | Expiration
date | | | Notional
cost | | | Notional
value | | | Unrealized
gains | | | Unrealized
losses | |
| | | | | | |
Long | | | | | | | | | | | | | | | | | | | | | | | | |
| | | | | | |
U.S. Long Bond | | | 20 | | | | 6-19-2020 | | | $ | 3,324,629 | | | $ | 3,581,250 | | | $ | 256,621 | | | $ | 0 | |
| | | | | | |
10-Year Canadian Treasury Bonds | | | 161 | | | | 6-19-2020 | | | | 16,696,481 | | | | 16,833,326 | | | | 136,845 | | | | 0 | |
| | | | | | |
10-Year Ultra Futures | | | 57 | | | | 6-19-2020 | | | | 8,454,132 | | | | 8,893,781 | | | | 439,649 | | | | 0 | |
| | | | | | |
5-Year U.S. Treasury Notes | | | 9 | | | | 6-30-2020 | | | | 1,122,905 | | | | 1,128,234 | | | | 5,329 | | | | 0 | |
| | | | | | |
Short | | | | | | | | | | | | | | | | | | | | | | | | |
| | | | | | |
Euro-Bund Futures | | | (153) | | | | 6-8-2020 | | | | (29,584,116 | ) | | | (29,109,960 | ) | | | 474,156 | | | | 0 | |
| | | | | | |
Euro-BOBL Futures | | | (83) | | | | 6-8-2020 | | | | (12,458,554 | ) | | | (12,377,211 | ) | | | 81,343 | | | | 0 | |
| | | | | | |
10-Year U.S. Treasury Notes | | | (105) | | | | 6-19-2020 | | | | (13,962,797 | ) | | | (14,562,187 | ) | | | 0 | | | | (599,390 | ) |
| | | | | | |
U.S. Ultra Bond | | | (21) | | | | 6-19-2020 | | | | (4,249,837 | ) | | | (4,659,375 | ) | | | 0 | | | | (409,538 | ) |
| | | | | | | | | | | | | | | | | | | | | | | | |
| | | | | | |
| | | | | | | | | | | | | | | | | | $ | 1,393,943 | | | $ | (1,008,928 | ) |
| | | | | | | | | | | | | | | | | | | | | | | | |
Forward Foreign Currency Contracts
| | | | | | | | | | | | | | |
Currency to be
received | | Currency to be
delivered | | Counterparty | | Settlement
date | | Unrealized
gains | | | Unrealized
losses | |
| | | | | |
| 1,392,137 USD | | 5,000,000,000 COP | | State Street Bank | | 4-13-2020 | | $ | 161,863 | | | $ | 0 | |
| | | | | |
| 1,025,000 ZAR | | 57,478 USD | | State Street Bank | | 5-11-2020 | | | 0 | | | | (493 | ) |
| | | | | |
| 1,871,987 USD | | 29,000,000 ZAR | | State Street Bank | | 5-11-2020 | | | 259,742 | | | | 0 | |
| | | | | |
| 10,400,000 MXN | | 435,075 USD | | State Street Bank | | 5-26-2020 | | | 0 | | | | (153 | ) |
| | | | | |
| 2,852,881 USD | | 57,000,000 MXN | | State Street Bank | | 5-26-2020 | | | 469,170 | | | | 0 | |
| | | | | |
| 1,976,761 USD | | 27,900,000,000 IDR | | State Street Bank | | 5-28-2020 | | | 274,566 | | | | 0 | |
| | | | | |
| 1,298,539 USD | | 5,725,000 BRL | | State Street Bank | | 5-29-2020 | | | 200,971 | | | | 0 | |
| | | | | |
| 9,950,000,000 IDR | | 601,754 USD | | State Street Bank | | 6-4-2020 | | | 4,920 | | | | 0 | |
| | | | | |
| 54,600,000 RUB | | 694,833 USD | | State Street Bank | | 6-8-2020 | | | 0 | | | | (6,804 | ) |
| | | | | |
| 2,029,076 USD | | 136,500,000 RUB | | State Street Bank | | 6-8-2020 | | | 309,002 | | | | 0 | |
| | | | | |
| 1,750,000 EUR | | 1,986,462 USD | | State Street Bank | | 6-9-2020 | | | 0 | | | | (51,344 | ) |
| | | | | |
| 342,024 USD | | 310,000 EUR | | State Street Bank | | 6-9-2020 | | | 0 | | | | (769 | ) |
| | | | | |
| 1,500,000 GBP | | 1,952,045 USD | | State Street Bank | | 6-10-2020 | | | 0 | | | | (86,569 | ) |
| | | | | |
| 1,846,815 USD | | 1,500,000 GBP | | State Street Bank | | 6-10-2020 | | | 0 | | | | (18,660 | ) |
| | | | | |
| 195,000,000 JPY | | 1,850,095 USD | | State Street Bank | | 6-18-2020 | | | 0 | | | | (30,607 | ) |
| | | | | |
| 219,037 USD | | 23,490,000 JPY | | State Street Bank | | 6-18-2020 | | | 0 | | | | (141 | ) |
| | | | | |
| 17,333,136 USD | | 15,962,000 EUR | | Citibank | | 6-30-2020 | | | 0 | | | | (330,870 | ) |
| | | | | |
| 4,070,000 EUR | | 4,414,933 USD | | Citibank | | 6-30-2020 | | | 89,046 | | | | 0 | |
| | | | | |
| 1,550,000 EUR | | 1,682,990 USD | | Citibank | | 6-30-2020 | | | 32,284 | | | | 0 | |
| | | | | | | | | | | | | | |
| | | | | |
| | | | | | | | $ | 1,801,564 | | | $ | (526,410 | ) |
| | | | | | | | | | | | | | |
Centrally Cleared Credit Default Swaps
| | | | | | | | | | | | | | | | | | | | | | | | | | | | | | | | |
| Reference index | | Fixed rate
received | | | Payment
frequency | | | Maturity
date | | | Notional
amount | | | Value | | | Premium
paid | | | Unrealized
gains | | | Unrealized
losses | |
| | | | | | | | |
Sell protection | | | | | | | | | | | | | | | | | | | | | | | | | | | | | | | | |
| | | | | | | | |
| Markit CDX North America High Yield Index* | | | 5.00% | | | | Quarterly | | | | 12-20-2024 | | | | 8,820,000 USD | | | $ | (537,743 | ) | | $ | 41,714 | | | $ | 0 | | | $ | (579,457 | ) |
| * | Represents an investment held in Strategic Income Special Investment (Cayman) Ltd., the consolidated entity. |
The accompanying notes are an integral part of these financial statements.
20 | Wells Fargo Strategic Income Fund
Consolidated portfolio of investments—March 31, 2020 (unaudited)
Investments in Affiliates
An affiliated investment is an investment in which the Fund owns at least 5% of the outstanding voting shares of the issuer or as a result of other relationships, such as the Fund and the issuer having the same investment manager. Transactions with issuers that were either affiliated persons of the Fund at the beginning of the period or the end of the period were as follows:
| | | | | | | | | | | | | | | | | | | | | | | | | | | | | | | | | | | | |
| | | Shares,
beginning of
period | | | Shares
purchased | | | Shares
sold | | | Shares,
end of
period | | | Net
realized
gains
(losses) | | | Net
change in
unrealized
gains
(losses) | | | Income
from
affiliated
securities | | | Value,
end of
period | | | % of
net
assets | |
| | | | | | | | | |
| Short-Term Investments | | | | | | | | | | | | | | | | | | | | | | | | | | | |
Investment Companies | | | | | | | | | | | | | | | | | | | | | | | | | | | | | | | | | | | | |
Securities Lending Cash Investments LLC | | | 1,264,839 | | | | 23,196,351 | | | | (24,131,392 | ) | | | 329,798 | | | $ | (19 | ) | | $ | 0 | | | $ | 18,935 | # | | $ | 329,831 | | | | | |
Wells Fargo Government Money Market Fund Select Class | | | 5,727,766 | | | | 50,083,199 | | | | (44,131,394 | ) | | | 11,679,571 | | | | 0 | | | | 0 | | | | 21,982 | | | | 11,679,571 | | | | | |
| | | | | | | | | | | | | | | | | | | | | | | | | | | | | | | | | | | | |
| | | | | | | | | | | | | | | | | | $ | (19 | ) | | $ | 0 | | | $ | 40,917 | | | $ | 12,009,402 | | | | 9.20 | % |
| | | | | | | | | | | | | | | | | | | | | | | | | | | | | | | | | | | | |
| # | Amount shown represents income before fees and rebates. |
The accompanying notes are an integral part of these financial statements.
Wells Fargo Strategic Income Fund | 21
Consolidated statement of assets and liabilities—March 31, 2020 (unaudited)
| | | | |
| | | | |
| |
Assets | | | | |
Investments in unaffiliated securities (including $314,142 of securities loaned), at value (cost $128,654,755) | | $ | 116,123,586 | |
Investments in affiliated securities, at value (cost $12,009,402) | | | 12,009,402 | |
Cash | | | 395,795 | |
Cash at broker segregated for futures contracts | | | 1,324,113 | |
Cash at broker segregated for centrally cleared swap contracts | | | 945,142 | |
Foreign currency, at value (cost $165,661) | | | 140,280 | |
Receivable for investments sold | | | 403,900 | |
Receivable for Fund shares sold | | | 1,694,508 | |
Receivable for interest | | | 1,280,002 | |
Receivable for daily variation margin on open futures contracts | | | 261,123 | |
Receivable for securities lending income, net | | | 1,994 | |
Unrealized gains on forward foreign currency contracts | | | 1,801,564 | |
Prepaid expenses and other assets | | | 55,791 | |
| | | | |
Total assets | | | 136,437,200 | |
| | | | |
| |
Liabilities | | | | |
Payable for investments purchased | | | 3,242,605 | |
Payable upon receipt of securities loaned | | | 329,503 | |
Cash collateral due to broker for forward foreign currency contracts | | | 1,070,000 | |
Unrealized losses on forward foreign currency contracts | | | 526,410 | |
Payable for daily variation margin on centrally cleared swap contracts | | | 537,743 | |
Management fee payable | | | 42,016 | |
Administration fees payable | | | 9,378 | |
Distribution fee payable | | | 395 | |
Trustees’ fees and expenses payable | | | 4,080 | |
Accrued expenses and other liabilities | | | 89,874 | |
| | | | |
Total liabilities | | | 5,852,004 | |
| | | | |
Total net assets | | $ | 130,585,196 | |
| | | | |
| |
Net assets consist of | | | | |
Paid-in capital | | $ | 141,242,573 | |
Total distributable loss | | | (10,657,377 | ) |
| | | | |
Total net assets | | $ | 130,585,196 | |
| | | | |
| |
Computation of net asset value and offering price per share | | | | |
Net assets – Class A | | $ | 1,129,443 | |
Shares outstanding – Class A1 | | | 129,287 | |
Net asset value per share – Class A | | | $8.74 | |
Maximum offering price per share – Class A2 | | | $9.10 | |
Net assets – Class C | | $ | 587,856 | |
Shares outstanding – Class C1 | | | 67,476 | |
Net asset value per share – Class C | | | $8.71 | |
Net assets – Administrator Class | | $ | 33,909 | |
Shares outstanding – Administrator Class1 | | | 3,857 | |
Net asset value per share – Administrator Class | | | $8.79 | |
Net assets – Institutional Class | | $ | 128,833,988 | |
Shares outstanding – Institutional Class1 | | | 14,761,088 | |
Net asset value per share – Institutional Class | | | $8.73 | |
| 1 | The Fund has an unlimited number of authorized shares. |
| 2 | Maximum offering price is computed as 100/96 of net asset value. On investments of $50,000 or more, the offering price is reduced. |
The accompanying notes are an integral part of these financial statements.
22 | Wells Fargo Strategic Income Fund
Consolidated statement of operations—six months ended March 31, 2020 (unaudited)
| | | | |
| | | | |
| |
Investment income | | | | |
Interest (net of foreign withholding taxes of $22,016) | | $ | 3,291,710 | |
Dividends | | | 135,240 | |
Income from affiliated securities | | | 27,622 | |
| | | | |
Total investment income | | | 3,454,572 | |
| | | | |
| |
Expenses | | | | |
Management fee | | | 396,375 | |
Administration fees | | | | |
Class A | | | 1,034 | |
Class C | | | 442 | |
Administrator Class | | | 23 | |
Institutional Class | | | 59,643 | |
Shareholder servicing fees | | | | |
Class A | | | 1,616 | |
Class C | | | 691 | |
Administrator Class | | | 58 | |
Distribution fee | | | | |
Class C | | | 2,070 | |
Custody and accounting fees | | | 20,130 | |
Professional fees | | | 27,931 | |
Registration fees | | | 29,382 | |
Shareholder report expenses | | | 15,041 | |
Trustees’ fees and expenses | | | 11,029 | |
Other fees and expenses | | | 3,306 | |
| | | | |
Total expenses | | | 568,771 | |
Less: Fee waivers and/or expense reimbursements | | | | |
Fund-level | | | (110,591 | ) |
Class A | | | (244 | ) |
Class C | | | (84 | ) |
Administrator Class | | | (28 | ) |
| | | | |
Net expenses | | | 457,824 | |
| | | | |
Net investment income | | | 2,996,748 | |
| | | | |
| |
Realized and unrealized gains (losses) on investments | | | | |
Net realized gains (losses) on | | | | |
Unaffiliated securities | | | 525,640 | |
Affiliated securities | | | (19 | ) |
Futures contracts | | | 736,533 | |
Forward foreign currency contracts | | | 554,878 | |
Swap contracts | | | (10,412 | ) |
| | | | |
Net realized gains on investments | | | 1,806,620 | |
| | | | |
|
Net change in unrealized gains (losses) on | |
Unaffiliated securities | | | (14,400,911 | ) |
Futures contracts | | | (159,371 | ) |
Forward foreign currency contracts | | | 997,371 | |
Swap contracts | | | (651,612 | ) |
| | | | |
Net change in unrealized gains (losses) on investments | | | (14,214,523 | ) |
| | | | |
Net realized and unrealized gains (losses) on investments | | | (12,407,903 | ) |
| | | | |
Net decrease in net assets resulting from operations | | $ | (9,411,155 | ) |
| | | | |
The accompanying notes are an integral part of these financial statements.
Wells Fargo Strategic Income Fund | 23
Consolidated statement of changes in net assets
| | | | | | | | | | | | | | | | |
| | | Six months ended
March 31, 2020
(unaudited) | | | Year ended
September 30, 2019 | |
| |
Operations | | | | | |
Net investment income | | | | | | $ | 2,996,748 | | | | | | | $ | 5,933,019 | |
Net realized gains (losses) on investments | | | | | | | 1,806,620 | | | | | | | | (1,109,628 | ) |
Net change in unrealized gains (losses) on investments | | | | | | | (14,214,523 | ) | | | | | | | 3,592,086 | |
| | | | |
Net increase (decrease) in net assets resulting from operations | | | | | | | (9,411,155 | ) | | | | | | | 8,415,477 | |
| | | | |
| | | |
Distributions to shareholders from net investment income and net realized gains | | | | | | | | | | | | |
Class A | | | | | | | (16,451 | ) | | | | | | | (49,220 | ) |
Class C | | | | | | | (5,393 | ) | | | | | | | (15,657 | ) |
Administrator Class | | | | | | | (526 | ) | | | | | | | (32,865 | ) |
Institutional Class | | | | | | | (2,187,906 | ) | | | | | | | (5,853,845 | ) |
| | | | |
Total distributions to shareholders | | | | | | | (2,210,276 | ) | | | | | | | (5,951,587 | ) |
| | | | |
| | | | |
Capital share transactions | | | Shares | | | | | | | | Shares | | | | | |
Proceeds from shares sold | |
Class A | | | 83,627 | | | | 802,546 | | | | 348,536 | | | | 3,298,070 | |
Class C | | | 19,110 | | | | 182,825 | | | | 31,806 | | | | 297,418 | |
Administrator Class | | | 402 | | | | 3,822 | | | | 7,156 | | | | 67,124 | |
Institutional Class | | | 711,610 | | | | 6,548,743 | | | | 18,145,872 | | | | 169,524,726 | |
| | | | |
| | | | | | | 7,537,936 | | | | | | | | 173,187,338 | |
| | | | |
Reinvestment of distributions | |
Class A | | | 1,719 | | | | 16,451 | | | | 5,230 | | | | 49,054 | |
Class C | | | 564 | | | | 5,393 | | | | 1,676 | | | | 15,657 | |
Administrator Class | | | 41 | | | | 392 | | | | 3,474 | | | | 32,494 | |
Institutional Class | | | 216,298 | | | | 2,067,365 | | | | 596,321 | | | | 5,581,802 | |
| | | | |
| | | | | | | 2,089,601 | | | | | | | | 5,679,007 | |
| | | | |
Payment for shares redeemed | |
Class A | | | (102,742 | ) | | | (985,015 | ) | | | (341,311 | ) | | | (3,228,609 | ) |
Class C | | | (7,047 | ) | | | (66,116 | ) | | | (33,529 | ) | | | (314,988 | ) |
Administrator Class | | | (4,423 | ) | | | (42,544 | ) | | | (581,301 | ) | | | (5,483,073 | ) |
Institutional Class | | | (2,324,166 | ) | | | (21,730,545 | ) | | | (7,379,074 | ) | | | (69,328,595 | ) |
| | | | |
| | | | | | | (22,824,220 | ) | | | | | | | (78,355,265 | ) |
| | | | |
Net increase (decrease) in net assets resulting from capital share transactions | | | | | | | (13,196,683 | ) | | | | | | | 100,511,080 | |
| | | | |
Total increase (decrease) in net assets | | | | | | | (24,818,114 | ) | | | | | | | 102,974,970 | |
| | | | |
| | |
Net assets | | | | | | | | |
Beginning of period | | | | | | | 155,403,310 | | | | | | | | 52,428,340 | |
| | | | |
End of period | | | | | | $ | 130,585,196 | | | | | | | $ | 155,403,310 | |
| | | | |
The accompanying notes are an integral part of these financial statements.
24 | Wells Fargo Strategic Income Fund
Consolidated financial highlights
(For a share outstanding throughout each period)
| | | | | | | | | | | | | | | | | | | | | | | | | | | | |
| | | Six months ended
March 31, 2020
(unaudited) | | | Year ended September 30 | | | Year ended
October 31 | |
| CLASS A | | 2019 | | | 2018 | | | 2017 | | | 20161 | | | 2015 | | | 2014 | |
Net asset value, beginning of period | | | $9.50 | | | | $9.43 | | | | $9.59 | | | | $9.25 | | | | $9.13 | | | | $9.72 | | | | $9.66 | |
Net investment income | | | 0.17 | 2 | | | 0.34 | 2 | | | 0.31 | 2 | | | 0.33 | 2 | | | 0.31 | | | | 0.34 | | | | 0.37 | |
Net realized and unrealized gains (losses) on investments | | | (0.81 | ) | | | 0.09 | | | | (0.16 | ) | | | 0.22 | | | | (0.01 | ) | | | (0.69 | ) | | | (0.05 | ) |
| | | | | | | | | | | | | | | | | | | | | | | | | | | | |
Total from investment operations | | | (0.64 | ) | | | 0.43 | | | | 0.15 | | | | 0.55 | | | | 0.30 | | | | (0.35 | ) | | | 0.32 | |
Distributions to shareholders from | | | | | | | | | | | | | | | | | | | | | | | | | | | | |
Net investment income | | | (0.12 | ) | | | (0.36 | ) | | | (0.31 | ) | | | (0.21 | ) | | | (0.13 | ) | | | (0.22 | ) | | | (0.26 | ) |
Tax basis return of capital | | | 0.00 | | | | 0.00 | | | | 0.00 | | | | 0.00 | | | | (0.05 | ) | | | (0.02 | ) | | | 0.00 | |
| | | | | | | | | | | | | | | | | | | | | | | | | | | | |
Total distributions to shareholders | | | (0.12 | ) | | | (0.36 | ) | | | (0.31 | ) | | | (0.21 | ) | | | (0.18 | ) | | | (0.24 | ) | | | (0.26 | ) |
Net asset value, end of period | | | $8.74 | | | | $9.50 | | | | $9.43 | | | | $9.59 | | | | $9.25 | | | | $9.13 | | | | $9.72 | |
Total return3 | | | (6.90 | )% | | | 4.66 | % | | | 1.59 | % | | | 6.05 | % | | | 3.34 | % | | | (3.64 | )% | | | 3.36 | % |
Ratios to average net assets (annualized) | | | | | | | | | | | | | | | | | | | | | | | | | | | | |
Gross expenses | | | 1.08 | % | | | 1.09 | % | | | 1.45 | % | | | 1.78 | % | | | 1.80 | % | | | 1.63 | % | | | 1.51 | % |
Net expenses | | | 0.89 | % | | | 0.90 | % | | | 0.90 | % | | | 0.90 | % | | | 0.90 | % | | | 0.90 | % | | | 0.90 | % |
Net investment income | | | 3.69 | % | | | 3.65 | % | | | 3.26 | % | | | 3.47 | % | | | 3.85 | % | | | 3.77 | % | | | 4.02 | % |
Supplemental data | | | | | | | | | | | | | | | | | | | | | | | | | | | | |
Portfolio turnover rate | | | 42 | % | | | 116 | % | | | 50 | % | | | 65 | % | | | 52 | % | | | 53 | % | | | 51 | % |
Net assets, end of period (000s omitted) | | | $1,129 | | | | $1,394 | | | | $1,266 | | | | $896 | | | | $1,047 | | | | $928 | | | | $714 | |
| 1 | For the eleven months ended September 30, 2016. The Fund changed its fiscal year end from October 31 to September 30, effective September 30, 2016. |
| 2 | Calculated based upon average shares outstanding |
| 3 | Total return calculations do not include any sales charges. Returns for periods of less than one year are not annualized. |
The accompanying notes are an integral part of these financial statements.
Wells Fargo Strategic Income Fund | 25
Consolidated financial highlights
(For a share outstanding throughout each period)
| | | | | | | | | | | | | | | | | | | | | | | | | | | | |
| | | Six months ended
March 31, 2020
(unaudited) | | | Year ended September 30 | | | Year ended
October 31 | |
| CLASS C | | 2019 | | | 2018 | | | 2017 | | | 20161 | | | 2015 | | | 2014 | |
Net asset value, beginning of period | | | $9.49 | | | | $9.41 | | | | $9.57 | | | | $9.22 | | | | $9.10 | | | | $9.71 | | | | $9.65 | |
Net investment income | | | 0.11 | | | | 0.27 | | | | 0.23 | | | | 0.29 | | | | 0.25 | | | | 0.28 | | | | 0.31 | |
Net realized and unrealized gains (losses) on investments | | | (0.79 | ) | | | 0.10 | | | | (0.15 | ) | | | 0.18 | | | | (0.02 | ) | | | (0.68 | ) | | | (0.06 | ) |
| | | | | | | | | | | | | | | | | | | | | | | | | | | | |
Total from investment operations | | | (0.68 | ) | | | 0.37 | | | | 0.08 | | | | 0.47 | | | | 0.23 | | | | (0.40 | ) | | | 0.25 | |
Distributions to shareholders from | | | | | | | | | | | | | | | | | | | | | | | | | | | | |
Net investment income | | | (0.10 | ) | | | (0.29 | ) | | | (0.24 | ) | | | (0.12 | ) | | | (0.08 | ) | | | (0.19 | ) | | | (0.19 | ) |
Tax basis return of capital | | | 0.00 | | | | 0.00 | | | | 0.00 | | | | 0.00 | | | | (0.03 | ) | | | (0.02 | ) | | | 0.00 | |
| | | | | | | | | | | | | | | | | | | | | | | | | | | | |
Total distributions to shareholders | | | (0.10 | ) | | | (0.29 | ) | | | (0.24 | ) | | | (0.12 | ) | | | (0.11 | ) | | | (0.21 | ) | | | (0.19 | ) |
Net asset value, end of period | | | $8.71 | | | | $9.49 | | | | $9.41 | | | | $9.57 | | | | $9.22 | | | | $9.10 | | | | $9.71 | |
Total return2 | | | (7.29 | )% | | | 4.00 | % | | | 0.88 | % | | | 5.20 | % | | | 2.67 | % | | | (4.35 | )% | | | 2.61 | % |
Ratios to average net assets (annualized) | | | | | | | | | | | | | | | | | | | | | | | | | | | | |
Gross expenses | | | 1.83 | % | | | 1.84 | % | | | 2.20 | % | | | 2.59 | % | | | 2.54 | % | | | 2.37 | % | | | 2.25 | % |
Net expenses | | | 1.65 | % | | | 1.65 | % | | | 1.65 | % | | | 1.65 | % | | | 1.65 | % | | | 1.65 | % | | | 1.65 | % |
Net investment income | | | 2.95 | % | | | 2.92 | % | | | 2.52 | % | | | 2.80 | % | | | 3.10 | % | | | 3.02 | % | | | 3.25 | % |
Supplemental data | | | | | | | | | | | | | | | | | | | | | | | | | | | | |
Portfolio turnover rate | | | 42 | % | | | 116 | % | | | 50 | % | | | 65 | % | | | 52 | % | | | 53 | % | | | 51 | % |
Net assets, end of period (000s omitted) | | | $588 | | | | $520 | | | | $517 | | | | $403 | | | | $766 | | | | $711 | | | | $835 | |
| 1 | For the eleven months ended September 30, 2016. The Fund changed its fiscal year end from October 31 to September 30, effective September 30, 2016. |
| 2 | Total return calculations do not include any sales charges. Returns for periods of less than one year are not annualized. |
The accompanying notes are an integral part of these financial statements.
26 | Wells Fargo Strategic Income Fund
Consolidated financial highlights
(For a share outstanding throughout each period)
| | | | | | | | | | | | | | | | | | | | | | | | | | | | |
| | | Six months ended
March 31, 2020
(unaudited) | | | Year ended September 30 | | | Year ended
October 31 | |
| ADMINISTRATOR CLASS | | 2019 | | | 2018 | | | 2017 | | | 20161 | | | 2015 | | | 2014 | |
Net asset value, beginning of period | | | $9.56 | | | | $9.46 | | | | $9.61 | | | | $9.29 | | | | $9.16 | | | | $9.74 | | | | $9.66 | |
Net investment income | | | 0.18 | 2 | | | 0.36 | 2 | | | 0.33 | 2 | | | 0.34 | 2 | | | 0.33 | 2 | | | 0.37 | | | | 0.39 | |
Net realized and unrealized gains (losses) on investments | | | (0.83 | ) | | | 0.09 | | | | (0.16 | ) | | | 0.20 | | | | (0.01 | ) | | | (0.70 | ) | | | (0.05 | ) |
| | | | | | | | | | | | | | | | | | | | | | | | | | | | |
Total from investment operations | | | (0.65 | ) | | | 0.45 | | | | 0.17 | | | | 0.54 | | | | 0.32 | | | | (0.33 | ) | | | 0.34 | |
Distributions to shareholders from | | | | | | | | | | | | | | | | | | | | | | | | | | | | |
Net investment income | | | (0.12 | ) | | | (0.35 | ) | | | (0.32 | ) | | | (0.22 | ) | | | (0.14 | ) | | | (0.22 | ) | | | (0.26 | ) |
Tax basis return of capital | | | 0.00 | | | | 0.00 | | | | 0.00 | | | | 0.00 | | | | (0.05 | ) | | | (0.03 | ) | | | 0.00 | |
| | | | | | | | | | | | | | | | | | | | | | | | | | | | |
Total distributions to shareholders | | | (0.12 | ) | | | (0.35 | ) | | | (0.32 | ) | | | (0.22 | ) | | | (0.19 | ) | | | (0.25 | ) | | | (0.26 | ) |
Net asset value, end of period | | | $8.79 | | | | $9.56 | | | | $9.46 | | | | $9.61 | | | | $9.29 | | | | $9.16 | | | | $9.74 | |
Total return3 | | | (6.86 | )% | | | 4.83 | % | | | 1.81 | % | | | 5.91 | % | | | 3.52 | % | | | (3.51 | )% | | | 3.63 | % |
Ratios to average net assets (annualized) | | | | | | | | | | | | | | | | | | | | | | | | | | | | |
Gross expenses | | | 1.02 | % | | | 1.08 | % | | | 1.38 | % | | | 1.72 | % | | | 1.74 | % | | | 1.56 | % | | | 1.46 | % |
Net expenses | | | 0.75 | % | | | 0.75 | % | | | 0.75 | % | | | 0.75 | % | | | 0.75 | % | | | 0.75 | % | | | 0.75 | % |
Net investment income | | | 3.82 | % | | | 3.80 | % | | | 3.48 | % | | | 3.64 | % | | | 4.00 | % | | | 3.92 | % | | | 4.18 | % |
Supplemental data | | | | | | | | | | | | | | | | | | | | | | | | | | | | |
Portfolio turnover rate | | | 42 | % | | | 116 | % | | | 50 | % | | | 65 | % | | | 52 | % | | | 53 | % | | | 51 | % |
Net assets, end of period (000s omitted) | | | $34 | | | | $75 | | | | $5,471 | | | | $562 | | | | $597 | | | | $496 | | | | $554 | |
| 1 | For the eleven months ended September 30, 2016. The Fund changed its fiscal year end from October 31 to September 30, effective September 30, 2016. |
| 2 | Calculated based upon average shares outstanding |
| 3 | Returns for periods of less than one year are not annualized. |
The accompanying notes are an integral part of these financial statements.
Wells Fargo Strategic Income Fund | 27
Consolidated financial highlights
(For a share outstanding throughout each period)
| | | | | | | | | | | | | | | | | | | | | | | | | | | | |
| | | Six months ended
March 31, 2020
(unaudited) | | | Year ended September 30 | | | Year ended
October 31 | |
| INSTITUTIONAL CLASS | | 2019 | | | 2018 | | | 2017 | | | 20161 | | | 2015 | | | 2014 | |
Net asset value, beginning of period | | | $9.49 | | | | $9.42 | | | | $9.58 | | | | $9.24 | | | | $9.14 | | | | $9.71 | | | | $9.66 | |
Net investment income | | | 0.20 | | | | 0.37 | 2 | | | 0.34 | | | | 0.35 | 2 | | | 0.34 | | | | 0.40 | | | | 0.41 | 2 |
Net realized and unrealized gains (losses) on investments | | | (0.82 | ) | | | 0.09 | | | | (0.16 | ) | | | 0.24 | | | | (0.02 | ) | | | (0.71 | ) | | | (0.07 | ) |
| | | | | | | | | | | | | | | | | | | | | | | | | | | | |
Total from investment operations | | | (0.62 | ) | | | 0.46 | | | | 0.18 | | | | 0.59 | | | | 0.32 | | | | (0.31 | ) | | | 0.34 | |
Distributions to shareholders from | | | | | | | | | | | | | | | | | | | | | | | | | | | | |
Net investment income | | | (0.14 | ) | | | (0.39 | ) | | | (0.34 | ) | | | (0.25 | ) | | | (0.16 | ) | | | (0.23 | ) | | | (0.29 | ) |
Tax basis return of capital | | | 0.00 | | | | 0.00 | | | | 0.00 | | | | 0.00 | | | | (0.06 | )�� | | | (0.03 | ) | | | 0.00 | |
| | | | | | | | | | | | | | | | | | | | | | | | | | | | |
Total distributions to shareholders | | | (0.14 | ) | | | (0.39 | ) | | | (0.34 | ) | | | (0.25 | ) | | | (0.22 | ) | | | (0.26 | ) | | | (0.29 | ) |
Net asset value, end of period | | | $8.73 | | | | $9.49 | | | | $9.42 | | | | $9.58 | | | | $9.24 | | | | $9.14 | | | | $9.71 | |
Total return3 | | | (6.67 | )% | | | 5.00 | % | | | 1.93 | % | | | 6.43 | % | | | 3.55 | % | | | (3.28 | )% | | | 3.60 | % |
Ratios to average net assets (annualized) | | | | | | | | | | | | | | | | | | | | | | | | | | | | |
Gross expenses | | | 0.75 | % | | | 0.75 | % | | | 1.12 | % | | | 1.40 | % | | | 1.46 | % | | | 1.19 | % | | | 1.14 | % |
Net expenses | | | 0.60 | % | | | 0.60 | % | | | 0.60 | % | | | 0.60 | % | | | 0.60 | % | | | 0.60 | % | | | 0.60 | % |
Net investment income | | | 3.98 | % | | | 3.97 | % | | | 3.54 | % | | | 3.71 | % | | | 4.16 | % | | | 4.04 | % | | | 4.25 | % |
Supplemental data | | | | | | | | | | | | | | | | | | | | | | | | | | | | |
Portfolio turnover rate | | | 42 | % | | | 116 | % | | | 50 | % | | | 65 | % | | | 52 | % | | | 53 | % | | | 51 | % |
Net assets, end of period (000s omitted) | | | $128,834 | | | | $153,414 | | | | $45,175 | | | | $45,862 | | | | $23,190 | | | | $17,564 | | | | $38,664 | |
| 1 | For the eleven months ended September 30, 2016. The Fund changed its fiscal year end from October 31 to September 30, effective September 30, 2016. |
| 2 | Calculated based upon average shares outstanding |
| 3 | Returns for periods of less than one year are not annualized. |
The accompanying notes are an integral part of these financial statements.
28 | Wells Fargo Strategic Income Fund
Consolidated notes to financial statements (unaudited)
1. ORGANIZATION
Wells Fargo Funds Trust (the “Trust”), a Delaware statutory trust organized on March 10, 1999, is anopen-end management investment company registered under the Investment Company Act of 1940, as amended (the “1940 Act”). As an investment company, the Trust follows the accounting and reporting guidance in Financial Accounting Standards Board(“FASB”)Accounting Standards Codification Topic 946, Financial Services – Investment Companies. These financial statements report on the Wells Fargo Strategic Income Fund (the “Fund”) which is a diversified series of the Trust.
2. INVESTMENT IN SUBSIDIARY
The Fund invests in Strategic Income Special Investment (Cayman) Ltd. (the “Subsidiary”), a wholly-owned subsidiary incorporated on July 11, 2019 under the laws of the Cayman Islands as an exempted segregated portfolio company with limited liability. As of March 31, 2020, the Subsidiary had $1,399,369 invested in swap contracts and cash equivalent representing 49.63% of its net assets. The Fund is the sole shareholder of the Subsidiary. As of March 31, 2020, the Fund held $2,820,631 in the Subsidiary, representing 2.21% of the Fund’s net assets prior to consolidation.
The consolidated financial statements of the Fund include the financial results of its wholly-owned subsidiary. The Consolidated Portfolio of Investments includes positions of the Fund and the Subsidiary and the consolidated financial statements include the accounts of the Fund and the Subsidiary. Accordingly, all interfund balances and transactions between the Fund and the Subsidiary have been eliminated in consolidation.
3. SIGNIFICANT ACCOUNTING POLICIES
The following significant accounting policies, which are consistently followed in the preparation of the consolidated financial statements of the Fund, are in conformity with U.S. generally accepted accounting principles which require management to make estimates and assumptions that affect the reported amounts of assets and liabilities, disclosure of contingent assets and liabilities at the date of the financial statements, and the reported amounts of revenues and expenses during the reporting period. Actual results could differ from those estimates.
Securities valuation
All investments are valued each business day as of the close of regular trading on the New York Stock Exchange (generally 4 p.m. Eastern Time), although the Fund may deviate from this calculation time under unusual or unexpected circumstances.
Debt securities are valued at the evaluated bid price provided by an independent pricing service (e.g. taking into account various factors, including yields, maturities, or credit ratings) or, if a reliable price is not available, the quoted bid price from an independent broker-dealer.
Equity securities and futures that are listed on a foreign or domestic exchange or market are valued at the official closing price or, if none, the last sales price. If no sale occurs on the principal exchange or market that day, a fair value price will be determined in accordance with the Fund’s Valuation Procedures.
Swap contracts are valued at the evaluated price provided by an independent pricing service or, if a reliable price is not available, the quoted bid price from an independent broker-dealer.
Forward foreign currency contracts are recorded at the forward rate provided by an independent foreign currency pricing source at a time each business day specified by the Wells Fargo Asset Management Pricing Committee at Wells Fargo Funds Management, LLC (“Funds Management”).
The values of securities denominated in foreign currencies are translated into U.S. dollars at rates provided by an independent foreign currency pricing source at a time each business day specified by the Wells Fargo Asset Management Pricing Committee.
Investments in registeredopen-end investment companies are valued at net asset value. Interests innon-registered investment companies that are redeemable at net asset value are fair valued normally at net asset value.
Investments which are not valued using any of the methods discussed above are valued at their fair value, as determined in good faith by the Board of Trustees of the Fund. The Board of Trustees has established a Valuation Committee comprised of the Trustees and has delegated to it the authority to take any actions regarding the valuation of portfolio securities that the Valuation Committee deems necessary or appropriate, including determining the fair value of portfolio securities, unless the determination has been delegated to the Wells Fargo Asset Management Pricing Committee.The Board of Trustees retains the authority to make or ratify any valuation decisions or approve any changes to the Valuation Procedures as it deems appropriate. On a quarterly basis, the Board of Trustees receives reports on any valuation actions taken by the Valuation Committee or the Wells Fargo Asset Management Pricing Committee which may include items for ratification.
Wells Fargo Strategic Income Fund | 29
Consolidated notes to financial statements (unaudited)
Foreign currency translation
The accounting records of the Fund are maintained in U.S. dollars. The values of other assets and liabilities denominated in foreign currencies are translated into U.S. dollars at rates provided by an independent foreign currency pricing source at a time each business day specified by the Wells Fargo Asset Management Pricing Committee. Purchases and sales of securities, and income and expenses are converted at the rate of exchange on the respective dates of such transactions. Net realized foreign exchange gains or losses arise from sales of foreign currencies, currency gains or losses realized between the trade and settlement dates on securities transactions, and the difference between the amounts of dividends, interest and foreign withholding taxes recorded and the U.S. dollar equivalent of the amounts actually paid or received. Net unrealized foreign exchange gains and losses arise from changes in the fair value of assets and liabilities other than investments in securities resulting from changes in exchange rates. The changes in net assets arising from changes in exchange rates of securities and the changes in net assets resulting from changes in market prices of securities are not separately presented. Such changes are included in net realized and unrealized gains or losses from investments.
Forward foreign currency contracts
A forward foreign currency contract is an agreement between two parties to purchase or sell a specific currency for an agreed-upon price at a future date. The Fund enters into forward foreign currency contracts to facilitate transactions in foreign-denominated securities and to attempt to minimize the risk to the Fund from adverse changes in the relationship between currencies. Forward foreign currency contracts are recorded at the forward rate andmarked-to-market daily. When the contracts are closed, realized gains and losses arising from such transactions are recorded as realized gains or losses on forward foreign currency contracts. The Fund is subject to foreign currency risk and may be exposed to risks if the counterparties to the contracts are unable to meet the terms of their contracts or if the value of the foreign currency changes unfavorably. The Fund’s maximum risk of loss from counterparty credit risk is the unrealized gains on the contracts. This risk may be mitigated if there is a master netting arrangement between the Fund and the counterparty.
Securities lending
The Fund may lend its securities from time to time in order to earn additional income in the form of fees or interest on securities received as collateral or the investment of any cash received as collateral. When securities are on loan, the Fund receives interest or dividends on those securities. Cash collateral received in connection with its securities lending transactions is invested in Securities Lending Cash Investments, LLC (the “Securities Lending Fund”). Investments in Securities Lending Fund are valued at the evaluated bid price provided by an independent pricing service. Income earned from investment in the Securities Lending Fund (net of fees and rebates), if any, is included in income from affiliated securities on the Statement of Operations.
In a securities lending transaction, the net asset value of the Fund is affected by an increase or decrease in the value of the securities loaned and by an increase or decrease in the value of the instrument in which collateral is invested. The amount of securities lending activity undertaken by the Fund fluctuates from time to time. The Fund has the right under the lending agreement to recover the securities from the borrower on demand. In the event of default or bankruptcy by the borrower, the Fund may be prevented from recovering the loaned securities or gaining access to the collateral or may experience delays or costs in doing so. In such an event, the terms of the agreement allow the unaffiliated securities lending agent to use the collateral to purchase replacement securities on behalf of the Fund or pay the Fund the market value of the loaned securities. The Fund bears the risk of loss with respect to depreciation of its investment of the cash collateral.
When-issued transactions
The Fund may purchase securities on a forward commitment or when-issued basis. The Fund records a when-issued transaction on the trade date and will segregate assets in an amount at least equal in value to the Fund’s commitment to purchase when-issued securities. Securities purchased on a when-issued basis aremarked-to-market daily and the Fund begins earning interest on the settlement date. Losses may arise due to changes in the market value of the underlying securities or if the counterparty does not perform under the contract.
Loans
The Fund may invest in direct debt instruments which are interests in amounts owed to lenders by corporate or other borrowers. The loans pay interest at rates which are periodically reset by reference to a base lending rate plus a spread. Investments in loans may be in the form of participations in loans or assignments of all or a portion of loans from third parties. When the Fund purchases participations, it generally has no rights to enforce compliance with the terms of the loan agreement with the borrower. As a result, the Fund assumes the credit risk of both the borrower and the lender that is selling the participation. When the Fund purchases assignments from lenders, it acquires direct rights against the borrower on the loan and may enforce compliance by the borrower with the terms of the loan agreement. Loans may include fully funded term loans or unfunded loan commitments, which are contractual obligations for future funding.
30 | Wells Fargo Strategic Income Fund
Consolidated notes to financial statements (unaudited)
Futures contracts
Futures contracts are agreements between the Fund and a counterparty to buy or sell a specific amount of a commodity, financial instrument or currency at a specified price and on a specified date. The Fund may buy and sell futures contracts in order to gain exposure to, or protect against, changes in interest rates and is subject to interest rate risk. The primary risks associated with the use of futures contracts are the imperfect correlation between changes in market values of securities held by the Fund and the prices of futures contracts, and the possibility of an illiquid market. Futures contracts are generally entered into on a regulated futures exchange and cleared through a clearinghouse associated with the exchange. With futures contracts, there is minimal counterparty risk to the Fund since futures contracts are exchange traded and the exchange’s clearinghouse, as the counterparty to all exchange traded futures, guarantees the futures contracts against default.
Upon entering into a futures contracts, the Fund is required to deposit either cash or securities (initial margin) with the broker in an amount equal to a certain percentage of the contract value. Subsequent payments (variation margin) are paid to or from the broker each day equal to the daily changes in the contract value. Such payments are recorded as unrealized gains or losses and, if any, shown as variation margin receivable (payable) in the Statement of Assets and Liabilities. Should the Fund fail to make requested variation margin payments, the broker can gain access to the initial margin to satisfy the Fund’s payment obligations. When the contracts are closed, a realized gain or loss is recorded in the Statement of Operations.
Swap contracts
Swap contracts are agreements between the Fund and a counterparty to exchange a series of cash flows over a specified period. Swap agreements are privately negotiated contracts between the Fund that are entered into as bilateral contracts in the OTC market (“OTC swaps”) or centrally cleared (“centrally cleared swaps”) with a central clearinghouse.
The Fund entered into centrally cleared swaps. In a centrally cleared swap, immediately following execution of the swap contract, the swap contract is novated to a central counterparty (the “CCP”) and the Fund’s counterparty on the swap agreement becomes the CCP. Upon entering into a centrally cleared swap, the Fund is required to deposit an initial margin with the broker in the form of cash or securities. Securities deposited as initial margin are designated in the Consolidated Portfolio of Investments and cash deposited is shown as cash segregated for centrally cleared swaps in the Consolidated Statement of Assets and Liabilities. Pursuant to the contract, the Fund agrees to receive from or pay to the broker an amount of cash equal to the daily fluctuation in market value of the contract (“variation margin”). The variation margin is recorded as an unrealized gain (or loss) and shown as variation margin receivable (or payable) on centrally cleared swaps in the Consolidated Statement of Assets and Liabilities. Payments received from (paid to) the counterparty, including at termination, are recorded as realized gains (losses) in the Consolidated Statement of Operations.
Credit default swaps
The Fund may enter into credit default swaps for hedging or speculative purposes to provide or receive a measure of protection against default on a referenced entity, obligation or index or a basket of single-name issuers or traded indexes. An index credit default swap references all the names in the index, and if a credit event is triggered, the credit event is settled based on that name’s weight in the index. Credit default swaps are agreements in which the protection buyer pays fixed periodic payments to the protection seller in consideration for a promise from the protection seller to make a specific payment should a negative credit event take place with respect to the referenced entity (e.g., bankruptcy, failure to pay, obligation acceleration, repudiation, moratorium or restructuring).
The Fund may enter into credit default swaps as either the seller of protection or the buyer of protection. If the Fund is the buyer of protection and a credit event occurs, the Fund will either receive from the seller an amount equal to the notional amount of the swap and deliver the referenced security or underlying securities comprising the index, or receive a net settlement of cash equal to the notional amount of the swap less the recovery value of the security or underlying securities comprising the index. If the Fund is the seller of protection and a credit event occurs, the Fund will either pay the buyer an amount equal to the notional amount of the swap and take delivery of the referenced security or underlying securities comprising the index or pay a net settlement of cash equal to the notional amount of the swap less the recovery value of the security or underlying securities comprising the index.
As the seller of protection, the Fund is subject to investment exposure on the notional amount of the swap and has assumed the risk of default of the underlying security or index. As the buyer of protection, the Fund could be exposed to risks if the seller of the protection defaults on its obligation to perform, or if there are unfavorable changes in the fluctuation of interest rates.
By entering into credit default swap contracts, the Fund is exposed to credit risk. In addition, certain credit default swap contracts entered into by the Fund provide for conditions that result in events of default or termination that enable the counterparty to the agreement to cause an early termination of the transactions under those agreements.
Wells Fargo Strategic Income Fund | 31
Consolidated notes to financial statements (unaudited)
Security transactions and income recognition
Securities transactions are recorded on a trade date basis. Realized gains or losses are recorded on the basis of identified cost.
Interest income is accrued daily and bond discounts are accreted and premiums are amortized daily. To the extent debt obligations are placed onnon-accrual status, any related interest income may be reduced by writing off interest receivables when the collection of all or a portion of interest has been determined to be doubtful based on consistently applied procedures and the fair value has decreased. If the issuer subsequently resumes interest payments or when the collectability of interest is reasonably assured, the debt obligation is removed fromnon-accrual status.
Income from foreign securities is recorded net of foreign taxes withheld where recovery of such taxes is not assured.
Income dividends and capital gain distributions from investment companies are recorded on theex-dividend date. Capital gain distributions from investment companies are treated as realized gains.
Distributions to shareholders
Distributions to shareholders are recorded on theex-dividend date and paid from net investment income monthly and any net realized gains are paid at least annually. Such distributions are determined in accordance with income tax regulations and may differ from U.S. generally accepted accounting principles. Dividend sources are estimated at the time of declaration. The tax character of distributions is determined as of the Fund’s fiscal year end. Therefore, a portion of the Fund’s distributions made prior to the Fund’s fiscal year end may be categorized as a tax return of capital at year end.
Federal and other taxes
The Fund intends to continue to qualify as a regulated investment company by distributing substantially all of its investment company taxable income and any net realized capital gains (after reduction for capital loss carryforwards) sufficient to relieve it from all, or substantially all, federal income taxes. Accordingly, no provision for federal income taxes was required.
The Fund’s income and federal excise tax returns and all financial records supporting those returns for the prior three fiscal years are subject to examination by the federal and Delaware revenue authorities. Management has analyzed the Fund’s tax positions taken on federal, state, and foreign tax returns for all open tax years and does not believe that there are any uncertain tax positions that require recognition of a tax liability.
As of March 31, 2020, the aggregate cost of all investments for federal income tax purposes was $140,123,880 and the unrealized gains (losses) consisted of:
| | | | |
| |
Gross unrealized gains | | $ | 1,749,155 | |
| |
Gross unrealized losses | | | (12,659,335 | ) |
| |
Net unrealized losses | | $ | (10,910,180 | ) |
As of September 30, 2019, the Fund had capital loss carryforwards which consisted of $178,628 in short-term capital losses and $2,228,956 in long-term capital losses.
Class allocations
The separate classes of shares offered by the Fund differ principally in applicable sales charges, distribution, shareholder servicing, and administration fees. Class specific expenses are charged directly to that share class. Investment income, common fund-level expenses, and realized and unrealized gains (losses) on investments are allocated daily to each class of shares based on the relative proportion of net assets of each class.
4. FAIR VALUATION MEASUREMENTS
Fair value measurements of investments are determined within a framework that has established a fair value hierarchy based upon the various data inputs utilized in determining the value of the Fund’s investments. The three-level hierarchy gives the highest priority to unadjusted quoted prices in active markets for identical assets or liabilities (Level 1) and the lowest priority to unobservable inputs (Level 3). The Fund’s investments are classified within the fair value hierarchy based on the lowest level of input that is significant to the fair value measurement. The inputs are summarized into three broad levels as follows:
| ∎ | | Level 1 – quoted prices in active markets for identical securities |
| ∎ | | Level 2 – other significant observable inputs (including quoted prices for similar securities, interest rates, prepayment speeds, credit risk, etc.) |
| ∎ | | Level 3 – significant unobservable inputs (including the Fund’s own assumptions in determining the fair value of investments) |
32 | Wells Fargo Strategic Income Fund
Consolidated notes to financial statements (unaudited)
The inputs or methodologies used for valuing investments in securities are not necessarily an indication of the risk associated with investing in those securities.
The following is a summary of the inputs used in valuing the Fund’s assets and liabilities as of March 31, 2020:
| | | | | | | | | | | | | | | | |
| | | | |
| | | Quoted prices
(Level 1) | | | Other significant
observable inputs
(Level 2) | | | Significant
unobservable inputs (Level 3) | | | Total | |
| | | | |
Assets | | | | | | | | | | | | | | | | |
Investments in: | | | | | | | | | | | | | | | | |
| | | | |
Agency securities | | $ | 0 | | | $ | 1,000,194 | | | $ | 0 | | | $ | 1,000,194 | |
| | | | |
Asset-backed securities | | | 0 | | | | 10,318,621 | | | | 0 | | | | 10,318,621 | |
| | | | |
Corporate bonds and notes | | | 0 | | | | 31,487,237 | | | | 246,916 | | | | 31,734,153 | |
| | | | |
Exchange-traded funds | | | 4,511,762 | | | | 0 | | | | 0 | | | | 4,511,762 | |
| | | | |
Foreign corporate bonds and notes | | | 0 | | | | 11,556,031 | | | | 0 | | | | 11,556,031 | |
| | | | |
Foreign government bonds | | | 0 | | | | 11,223,922 | | | | 0 | | | | 11,223,922 | |
| | | | |
Loans | | | 0 | | | | 2,076,708 | | | | 1,168,765 | | | | 3,245,473 | |
| | | | |
Municipal obligations | | | 0 | | | | 333,132 | | | | 0 | | | | 333,132 | |
| | | | |
Non-agency mortgage-backed securities | | | 0 | | | | 33,681,321 | | | | 0 | | | | 33,681,321 | |
| | | | |
Rights | | | | | | | | | | | | | | | | |
| | | | |
Utilities | | | 0 | | | | 6,516 | | | | 0 | | | | 6,516 | |
| | | | |
U.S. Treasury securities | | | 859,835 | | | | 0 | | | | 0 | | | | 859,835 | |
| | | | |
Yankee corporate bonds and notes | | | 0 | | | | 6,205,528 | | | | 0 | | | | 6,205,528 | |
| | | | |
Yankee government bonds and notes | | | 0 | | | | 1,447,098 | | | | 0 | | | | 1,447,098 | |
| | | | |
Short-term investments | | | | | | | | | | | | | | | | |
| | | | |
Investment companies | | | 12,009,402 | | | | 0 | | | | 0 | | | | 12,009,402 | |
| | | | |
| | | 17,380,999 | | | | 109,336,308 | | | | 1,415,681 | | | | 128,132,988 | |
Futures contracts | | | 1,393,943 | | | | 0 | | | | 0 | | | | 1,393,943 | |
| | | | |
| Forward foreign currency contracts | | | 0 | | | | 1,801,564 | | | | 0 | | | | 1,801,564 | |
| | | | |
Total assets | | $ | 18,774,942 | | | $ | 111,137,872 | | | $ | 1,415,681 | | | $ | 131,328,495 | |
| | | | |
Liabilities | | | | | | | | | | | | | | | | |
Futures contracts | | $ | 1,008,928 | | | $ | 0 | | | $ | 0 | | | $ | 1,008,928 | |
| | | | |
Forward foreign currency contracts | | | 0 | | | | 526,410 | | | | 0 | | | | 526,410 | |
| | | | |
Credit default swap contracts | | | 0 | | | | 579,457 | | | | 0 | | | | 579,457 | |
| | | | |
Total liabilities | | $ | 1,008,928 | | | $ | 1,105,867 | | | $ | 0 | | | $ | 2,114,795 | |
Additional sector, industry or geographic detail is included in the Consolidated Portfolio of Investments.
Futures contracts, forward foreign currency contracts and swap contracts are reported at their cumulative unrealized gains (losses) at measurement date as reported in the tables following the Portfolio of Investments. For futures contracts and centrally cleared swaps, the current day’s variation margin is reported on the Statement of Assets and Liabilities. All other assets and liabilities are reported at their market value at measurement date.
Wells Fargo Strategic Income Fund | 33
Consolidated notes to financial statements (unaudited)
The following is a reconciliation of assets in which significant unobservable inputs (Level 3) were used in determining fair value:
| | | | | | | | | | | | | | | | |
| | | | |
| | | Corporate
bonds
and notes | | | Loans | | | Non-agency
mortgage-backed
securities | | | Totals | |
Balance as of September 30, 2019 | | $ | 0 | | | $ | 475,824 | | | $ | 729,632 | | | $ | 1,205,456 | |
| | | | |
Accrued discounts (premiums) | | | 0 | | | | 150 | | | | 167 | | | | 317 | |
| | | | |
Realized gains (losses) | | | 0 | | | | (6 | ) | | | 0 | | | | (6 | ) |
| | | | |
Change in unrealized gains (losses) | | | 0 | | | | (143,755 | ) | | | (288,193 | ) | | | (431,948 | ) |
| | | | |
Purchases | | | 0 | | | | 398,750 | | | | 0 | | | | 398,750 | |
| | | | |
Sales | | | 0 | | | | (15,166 | ) | | | 0 | | | | (15,166 | ) |
| | | | |
Transfers into Level 3 | | | 246,916 | | | | 766,189 | | | | 0 | | | | 1,013,105 | |
| | | | |
Transfers out of Level 3 | | | 0 | | | | (313,221 | ) | | | (441,606 | ) | | | (754,827 | ) |
| | | | |
Balance as of March 31, 2020 | | $ | 246,916 | | | $ | 1,168,765 | | | $ | 0 | | | $ | 1,415,681 | |
| | | | |
Change in unrealized gains (losses) relating to securities still held at March 31, 2020 | | $ | 0 | | | $ | (67,974 | ) | | $ | 0 | | | $
| (67,974
| )
|
The loan obligations in the Level 3 table were valued using indicative broker quotes. These indicative broker quotes are considered Level 3 inputs. Quantitative unobservable inputs used by the brokers are often proprietary and not provided to the Fund and therefore the disclosure that would address these inputs is not included above.
The following table summarizes quantitative information on Level 3 inputs used to value corporate bonds and notes as of March 31, 2020:
| | | | | | | | | | | | |
| | | |
Fair value at
March 31, 2020 | | | Valuation
technique | | | Significant
unobservable input | | | Range |
| | | |
| $ | 246,916 | | | | Market approach | | | | Liquidity discount | | | 5% - 10% |
5. TRANSACTIONS WITH AFFILIATES
Management fee
Funds Management, an indirect wholly owned subsidiary of Wells Fargo & Company (“Wells Fargo”), is the manager of the Fund and provides advisory and fund-level administrative services under an investment management agreement. Under the investment management agreement, Funds Management is responsible for, among other services, implementing the investment objectives and strategies of the Fund, supervising the subadvisers and providing fund-level administrative services in connection with the Fund’s operations. As compensation for its services under the investment management agreement, Funds Management is entitled to receive a management fee at the following annual rate based on the Fund’s average daily net assets:
| | | | |
| |
| Average daily net assets | | Management fee | |
| |
First $500 million | | | 0.525 | % |
| |
Next $500 million | | | 0.500 | |
| |
Next $2 billion | | | 0.475 | |
| |
Next $2 billion | | | 0.450 | |
| |
Next $5 billion | | | 0.415 | |
| |
Over $10 billion | | | 0.405 | |
For the six months ended March 31, 2020, the management fee was equivalent to an annual rate of 0.525% of the Fund’s average daily net assets.
Funds Management has retained the services of subadvisers to provide daily portfolio management to the Fund. The fee for subadvisory services is borne by Funds Management. Wells Capital Management Incorporated (“WellsCap”) is a subadviser to the Fund and is entitled to receive a fee from Funds Management at an annual rate starting at 0.30% and declining to 0.15% as the average daily net assets of the Fund increase. Wells Fargo Asset Management (International), Limited an affiliate of Funds Management and an indirect wholly owned subsidiary of Wells Fargo, is also a subadviser to the Fund and is entitled to receive a fee from Funds Management at an annual rate starting at 0.35% and declining to 0.20% as the average daily net assets of the Fund increase.
34 | Wells Fargo Strategic Income Fund
Consolidated notes to financial statements (unaudited)
Administration fees
Under a class-level administration agreement, Funds Management provides class-level administrative services to the Fund, which includes paying fees and expenses for services provided by the transfer agent,sub-transfer agents, omnibus account servicers and record-keepers. As compensation for its services under the class-level administration agreement, Funds Management receives an annual fee which is calculated based on the average daily net assets of each class as follows:
| | | | |
| |
| | | Class-level
administration fee | |
| |
Class A, Class C | | | 0.16 | % |
| |
Administrator Class | | | 0.10 | |
| |
Institutional Class | | | 0.08 | |
Waivers and/or expense reimbursements
Funds Management has contractually waived and/or reimbursed management and administration fees to the extent necessary to maintain certain net operating expense ratios for the Fund. When each class of the Fund has exceeded its expense cap, Funds Management has waived fees and/or reimbursed expenses from fund-level expenses on a proportionate basis and then from class specific expenses. When only certain classes exceed their expense caps, waivers and/or reimbursements are applied against class specific expenses before fund-level expenses. Funds Management has committed through January 31, 2021 to waive fees and/or reimburse expenses to the extent necessary to cap the Fund’s expenses at 0.90% for Class A shares, 1.65% for Class C shares, 0.75% for Administrator Class shares, and 0.60% for Institutional Class shares. Prior to or after the commitment expiration date, the cap may be increased or the commitment to maintain the cap may be terminated only with the approval of the Board of Trustees.
Distribution fee
The Trust has adopted a distribution plan for Class C shares of the Fund pursuant to Rule12b-1 under the 1940 Act. A distribution fee is charged to Class C shares and paid to Wells Fargo Funds Distributor, LLC (“Funds Distributor”), the principal underwriter, at an annual rate of 0.75% of the average daily net assets of Class C shares.
In addition, Funds Distributor is entitled to receive thefront-end sales charge from the purchase of Class A shares and a contingent deferred sales charge on the redemption of certain Class A shares. Funds Distributor is also entitled to receive the contingent deferred sales charges from redemptions of Class C shares. Funds Distributor did not receive anyfront-end or contingent deferred sales charges from Class A or Class C shares for the six months ended March 31, 2020.
Shareholder servicing fees
The Trust has entered into contracts with one or more shareholder servicing agents, whereby Class A, Class C, and Administrator Class of the Fund are charged a fee at an annual rate of 0.25% of the average daily net assets of each respective class.
Interfund transactions
The Fund may purchase or sell portfolio investment securities to certain other Wells Fargo affiliates pursuant to Rule17a-7 under the 1940 Act and under procedures adopted by the Board of Trustees. The procedures have been designed to ensure that these interfund transactions, which do not incur broker commissions, are effected at current market prices.
6. INVESTMENT PORTFOLIO TRANSACTIONS
Purchases and sales of investments, excluding short-term securities, for the six months ended March 31, 2020 were as follows:
| | | | | | |
Purchases at cost | | Sales proceeds |
U.S.
government | | Non-U.S.
government | | U.S.
government | | Non-U.S.
government |
| $2,938,678 | | $58,351,616 | | $2,354,378 | | $68,676,529 |
As of March 31, 2020, the Fund had no unfunded term loan commitments.
7. SECURITIES LENDING TRANSACTIONS
The Fund lends its securities through an unaffiliated securities lending agent and receives collateral in the form of cash or securities with a value at least equal to the value of the securities on loan. The value of the loaned securities is determined at the close of each business day and any increases or decreases in the required collateral are exchanged between the Fund and the counterparty on the next business day. Cash collateral received is invested in the Securities Lending Fund which seeks to provide a positive return
Wells Fargo Strategic Income Fund | 35
Consolidated notes to financial statements (unaudited)
compared to the daily Fed Funds Open Rate by investing in high-quality, U.S. dollar-denominated short-term money market instruments and is exempt from registration under Section 3(c)(7) of the 1940 Act. Securities Lending Fund is managed by Funds Management and is subadvised by WellsCap. Funds Management receives an advisory fee starting at 0.05% and declining to 0.01% as the average daily net assets of the Securities Lending Fund increase. All of the fees received by Funds Management are paid to WellsCap for its services as subadviser.
In the event of counterparty default or the failure of a borrower to return a loaned security, the Fund has the right to use the collateral to offset any losses incurred. As of March 31, 2020, the Fund had securities lending transactions with the following counterparties which are subject to offset:
| | | | | | | | | | | | |
| | | |
| Counterparty | | Value of
securities on
loan | | | Collateral
received1 | | | Net amount | |
| | | |
Bank of America Securities Inc. | | $ | 314,142 | | | $ | (314,142 | ) | | $ | 0 | |
| 1 | Collateral received within this table is limited to the collateral for the net transaction with the counterparty. |
8. DERIVATIVE TRANSACTIONS
During the six months ended March 31, 2020, the Fund entered into futures contracts and forward foreign currency contracts for economic hedging purposes and credit default swap contracts as a substitute for taking a position in the underlying security or index to potentially enhance the Fund’s total return.
The volume of the Fund’s derivative activity during the six months ended March 31, 2020 was as follows:
| | | | |
Futures contracts | | | | |
| |
Average notional balance on long futures | | $ | 21,133,163 | |
| |
Average notional balance on short futures | | | 58,461,786 | |
Forward foreign currency contracts | | | | |
| |
Average contract amounts to buy | | $ | 7,583,405 | |
| |
Average contract amounts to sell | | | 31,231,215 | |
Credit default swap contracts | | | | |
| |
Average notional balance | | $ | 4,317,869 | |
The Fund’s credit default swap may contain provisions for early termination in the event the net assets of the Fund declines below specific levels identified by the counterparty. If these levels are triggered, the counterparty may terminate the transaction and seek payment or request full collateralization of the derivative transactions in net liability positions.
A summary of the location of derivative instruments on the financial statements by primary risk exposure is outlined in the following tables.
The fair value of derivative instruments as of March 31, 2020 by risk type was as follows for the Fund:
| | | | | | | | | | | | |
| | | Asset derivatives | | | Liability derivatives | |
| | | | |
| | | Statement of Assets and Liabilities location | | Fair value | | | Statement of Assets and
Liabilities location | | Fair value | |
| | | | |
Interest rate risk | | Unrealized gains on futures contracts | | $ | 1,393,943 | * | | Unrealized losses on futures contracts | | $ | 1,008,928 | * |
| | | | |
Foreign currency risk | | Unrealized gains on forward foreign currency contracts | | | 1,801,564 | | | Unrealized losses on forward foreign currency contracts | | | 526,410 | |
| | | | |
Credit risk | | Net unrealized gains on swap contracts | | | 0 | * | | Net unrealized losses on swap contracts | | | 579,457 | * |
| | | | |
| | | | | $ | 3,195,507 | | | | | $ | 2,114,795 | |
| * | Amount represents cumulative unrealized gains (losses) as reported in the tables following the Consolidated Portfolio of Investments. Only the current day’s variation margin as of March 31, 2020 is reported separately on the Consolidated Statement of Assets and Liabilities. |
36 | Wells Fargo Strategic Income Fund
Consolidated notes to financial statements (unaudited)
The effect of derivative instruments on the Consolidated Statement of Operations for the six months ended March 31, 2020 was as follows for the Fund:
| | | | | | | | | | | | | | | | |
| | | Amount of realized gains (losses) on derivatives | |
| | | | |
| | | Futures
contracts | | | Forward
foreign
currency
contracts | | | Swap
contracts | | | Total | |
| | | | |
Interest rate risk | | $ | 736,533 | | | $ | 0 | | | $ | 0 | | | $ | 736,533 | |
| | | | |
Foreign currency risk | | | 0 | | | | 554,878 | | | | 0 | | | | 554,878 | |
| | | | |
Credit risk | | | 0 | | | | 0 | | | | (10,412 | ) | | | (10,412 | ) |
| | | | |
| | | $ | 736,533 | | | $ | 554,878 | | | $ | (10,412 | ) | | $ | 1,280,999 | |
| |
| | | Change in unrealized gains (losses) on derivatives | |
| | | | |
| | | Futures
contracts | | | Forward
foreign
currency
contracts | | | Swap
contracts | | | Total | |
| | | | |
Interest rate risk | | $ | (159,371 | ) | | $ | 0 | | | $ | 0 | | | $ | (159,371 | ) |
| | | | |
Foreign currency risk | | | 0 | | | | 997,371 | | | | 0 | | | | 997,371 | |
| | | | |
Credit risk | | | 0 | | | | 0 | | | | (651,612 | ) | | | (651,612 | ) |
| | | | |
| | | $ | (159,371 | ) | | $ | 997,371 | | | $ | (651,612 | ) | | $ | 186,388 | |
For certain types of derivative transactions, the Fund has entered into International Swaps and Derivatives Association, Inc. master agreements (“ISDA Master Agreements”) or similar agreements with approved counterparties. The ISDA Master Agreements or similar agreements may have requirements to deliver/deposit securities or cash to/with an exchange or broker-dealer as collateral and allows the Fund to offset, with each counterparty, certain derivative financial instrument’s assets and/or liabilities with collateral held or pledged. Collateral requirements differ by type of derivative. Collateral or margin requirements are set by the broker or exchange clearinghouse for exchange traded derivatives while collateral terms are contract specific forover-the-counter traded derivatives. Cash collateral that has been pledged to cover obligations of the Fund under ISDA Master Agreements or similar agreements, if any, are reported separately in the Consolidated Statement of Assets and Liabilities. Securities pledged as collateral, if any, are noted in the Consolidated Portfolio of Investments. With respect to balance sheet offsetting, absent an event of default by the counterparty or a termination of the agreement, the reported amounts of financial assets and financial liabilities in the Consolidated Statement of Assets and Liabilities are not offset across transactions between the Fund and the applicable counterparty. A reconciliation of the gross amounts on the Consolidated Statement of Assets and Liabilities to the net amounts by counterparty, including any collateral exposure, for OTC derivatives is as follows:
| | | | | | | | | | | | | | | | |
| | | | |
| Counterparty | | Gross amounts of assets in the Statement of Assets and Liabilities | | | Amounts
subject to
netting
agreements | | | Collateral
received | | | Net amount
of assets | |
| | | | |
State Street | | $ | 1,680,234 | | | $ | (195,540 | ) | | $ | 0 | | | $ | 1,484,694 | |
| | | | |
Citibank | | | 121,330 | | | | (121,330 | ) | | | 0 | | | | 0 | |
| | | | |
| | | | | | | | | | | | | | | | |
| | | | |
| Counterparty | | Gross amounts of liabilities in the Statement of Assets and Liabilities | | | Amounts
subject to
netting
agreements | | | Collateral
pledged1 | | | Net amount of liabilities | |
| | | | |
State Street | | $ | 195,540 | | | $ | (195,540 | ) | | $ | 0 | | | $ | 0 | |
| | | | |
Citibank | | | 330,870 | | | | (121,330 | ) | | | (209,540 | ) | | | 0 | |
| 1 | Collateral pledged within this table is limited to the collateral for the net transaction with the counterparty by derivative type. |
Wells Fargo Strategic Income Fund | 37
Consolidated notes to financial statements (unaudited)
9. BANK BORROWINGS
The Trust (excluding the money market funds), Wells Fargo Master Trust and Wells Fargo Variable Trust are parties to a $280,000,000 revolving credit agreement whereby the Fund is permitted to use bank borrowings for temporary or emergency purposes, such as to fund shareholder redemption requests. Interest under the credit agreement is charged to the Fund based on a borrowing rate equal to the higher of the Federal Funds rate in effect on that day plus 1.25% or the overnight LIBOR rate in effect on that day plus 1.25%. In addition, an annual commitment fee equal to 0.25% of the unused balance is allocated to each participating fund.
For the six months ended March 31, 2020, there were no borrowings by the Fund under the agreement.
10. INDEMNIFICATION
Under the Trust’s organizational documents, the officers and Trustees have been granted certain indemnification rights against certain liabilities that may arise out of performance of their duties to the Trust. Additionally, in the normal course of business, the Trust may enter into contracts with service providers that contain a variety of indemnification clauses. The Trust’s maximum exposure under these arrangements is dependent on future claims that may be made against the Fund and, therefore, cannot be estimated.
11. NEW ACCOUNTING PRONOUNCEMENTS
In August 2018, FASB issued Accounting Standards Update (“ASU”)No. 2018-13, Fair Value Measurement (Topic 820)Disclosure Framework—Changes to the Disclosure Requirements for Fair Value Measurement. ASU2018-13 updates the disclosure requirements for fair value measurements by modifying or removing certain disclosures and adding certain new disclosures. The amendments are effective for fiscal years, and interim periods within those fiscal years, beginning after December 15, 2019. Early adoption is permitted. Management has adopted the removal and modification of disclosures early, as permitted, and will adopt the additional new disclosures at the effective date.
In March 2017, FASB issued ASUNo. 2017-08,Premium Amortization on Purchased Callable Debt Securities. ASU2017-08 shortens the amortization period for certain callable debt securities held at a premium and requires the premium to be amortized to the earliest call date. The amendments do not require an accounting change for securities held at a discount and discounts will continue to be accreted to the maturity date of the security. ASU2017-08 is effective for fiscal years beginning after December 15, 2018 and for interim periods within those fiscal years. During the current reporting period, management of the Fund adopted the change in accounting policy which did not have a material impact to the Fund’s financial statements.
12. CORONAVIRUS(COVID-19) PANDEMIC
On March 11, 2020, the World Health Organization announced that it had made the assessment that coronavirus disease 2019(“COVID-19”) is a pandemic. The impacts ofCOVID-19 are adversely affecting the entire global economy, individual companies and investment products, and the market in general. There is significant uncertainty around the extent and duration of business disruptions related toCOVID-19 and the impacts may be short term or may last for an extended period of time. The risk of further spreading ofCOVID-19 has led to significant uncertainty and volatility in the financial markets. The value of the Fund and the securities in which the Fund invests have generally been adversely affected by impacts caused byCOVID-19.
38 | Wells Fargo Strategic Income Fund
Other information (unaudited)
PROXY VOTING INFORMATION
A description of the policies and procedures used to determine how to vote proxies relating to portfolio securities is available, upon request, by calling1-800-222-8222, visiting our website atwfam.com, or visiting the SEC website at sec.gov. Information regarding how the proxies related to portfolio securities were voted during the most recent12-month period ended June 30 is available on the website atwfam.comor by visiting the SEC website at sec.gov.
QUARTERLY PORTFOLIO HOLDINGS INFORMATION
The Fund files its complete schedule of portfolio holdings with the SEC for the first and third quarters of each fiscal year as an exhibit to its reports on FormN-PORT. Shareholders may view the filed FormN-PORT by visiting the SEC website at sec.gov.
Wells Fargo Strategic Income Fund | 39
Other information (unaudited)
BOARD OF TRUSTEES AND OFFICERS
Each of the Trustees and Officers1 listed in the table below acts in identical capacities for each fund in the Wells Fargo family of funds, which consists of 147 mutual funds comprising the Wells Fargo Funds Trust, Wells Fargo Variable Trust, Wells Fargo Master Trust and fourclosed-end funds (collectively the “Fund Complex”). This table should be read in conjunction with the Prospectus and the Statement of Additional Information2. The mailing address of each Trustee and Officer is 525 Market Street, 12th Floor, San Francisco, CA 94105. Each Trustee and Officer serves an indefinite term, however, each Trustee serves such term until reaching the mandatory retirement age established by the Trustees.
Independent Trustees
| | | | | | |
Name and year of birth | | Position held and
length of service* | | Principal occupations during past five years or longer | | Current other
public company or
investment
company
directorships |
| | | |
William R. Ebsworth (Born 1957) | | Trustee, since 2015 | | Retired. From 1984 to 2013, equities analyst, portfolio manager, research director and chief investment officer at Fidelity Management and Research Company in Boston, Tokyo, and Hong Kong, and retired in 2013 as Chief Investment Officer of Fidelity Strategic Advisers, Inc. where he led a team of investment professionals managing client assets. Prior thereto, Board member of Hong Kong Securities Clearing Co., Hong Kong Options Clearing Corp., the Thailand International Fund, Ltd., Fidelity Investments Life Insurance Company, and Empire Fidelity Investments Life Insurance Company. Audit Committee Chair and Investment Committee Chair of the Vincent Memorial Hospital Endowment(non-profit organization). Mr. Ebsworth is a CFA® charterholder. | | N/A |
| | | |
Jane A. Freeman (Born 1953) | | Trustee, since 2015; Chair Liaison, since 2018 | | Retired. From 2012 to 2014 and 1999 to 2008, Chief Financial Officer of Scientific Learning Corporation. From 2008 to 2012, Ms. Freeman provided consulting services related to strategic business projects. Prior to 1999, Portfolio Manager at Rockefeller & Co. and Scudder, Stevens & Clark. Board member of the Harding Loevner Funds from 1996 to 2014, serving as both Lead Independent Director and chair of the Audit Committee. Board member of the Russell Exchange Traded Funds Trust from 2011 to 2012 and the chair of the Audit Committee. Ms. Freeman is a Board Member of The Ruth Bancroft Garden(non-profit organization). She is also an inactive Chartered Financial Analyst. | | N/A |
| | | |
Isaiah Harris, Jr. (Born 1952) | | Trustee, since 2009; Audit Committee Chairman, since 2019 | | Retired. Chairman of the Board of CIGNA Corporation since 2009, and Director since 2005. From 2003 to 2011, Director of Deluxe Corporation. Prior thereto, President and CEO of BellSouth Advertising and Publishing Corp. from 2005 to 2007, President and CEO of BellSouth Enterprises from 2004 to 2005 and President of BellSouth Consumer Services from 2000 to 2003. Emeritus member of the Iowa State University Foundation Board of Governors. Emeritus Member of the Advisory Board of Iowa State University School of Business. Advisory Board Member, Palm Harbor Academy (private school). Advisory Board Member, Child Evangelism Fellowship(non-profit). Mr. Harris is a certified public accountant (inactive status). | | CIGNA Corporation |
| | | |
Judith M. Johnson (Born 1949) | | Trustee, since 2008; Audit Committee Chairman, from 2009 to 2018 | | Retired. Prior thereto, Chief Executive Officer and Chief Investment Officer of Minneapolis Employees Retirement Fund from 1996 to 2008. Ms. Johnson is an attorney, certified public accountant and a certified managerial accountant. | | N/A |
40 | Wells Fargo Strategic Income Fund
Other information (unaudited)
| | | | | | |
Name and year of birth | | Position held and
length of service* | | Principal occupations during past five years or longer | | Current other
public company or
investment
company
directorships |
| | | |
David F. Larcker (Born 1950) | | Trustee, since 2009 | | James Irvin Miller Professor of Accounting at the Graduate School of Business, Stanford University, Director of the Corporate Governance Research Initiative and Senior Faculty of The Rock Center for Corporate Governance since 2006. From 2005 to 2008, Professor of Accounting at the Graduate School of Business, Stanford University. Prior thereto, Ernst & Young Professor of Accounting at The Wharton School, University of Pennsylvania from 1985 to 2005. | | N/A |
| | | |
Olivia S. Mitchell (Born 1953) | | Trustee, since 2006; Nominating and Governance Committee Chair, since 2018 | | International Foundation of Employee Benefit Plans Professor, Wharton School of the University of Pennsylvania since 1993. Director of Wharton’s Pension Research Council and Boettner Center on Pensions & Retirement Research, and Research Associate at the National Bureau of Economic Research. Previously, Cornell University Professor from 1978 to 1993. | | N/A |
| | | |
Timothy J. Penny (Born 1951) | | Trustee, since 1996; Chairman, since 2018 | | President and Chief Executive Officer of Southern Minnesota Initiative Foundation, anon-profit organization, since 2007. Member of the Board of Trustees of NorthStar Education Finance, Inc., anon-profit organization, since 2007. | | N/A |
| | | |
James G. Polisson (Born 1959) | | Trustee, since 2018 | | Retired. Chief Marketing Officer, Source (ETF) UK Services, Ltd, from 2015 to 2017. From 2012 to 2015, Principal of The Polisson Group, LLC, a management consulting, corporate advisory and principal investing company. Chief Executive Officer and Managing Director at Russell Investments, Global Exchange Traded Funds from 2010 to 2012. Managing Director of Barclays Global Investors from 1998 to 2010 and Global Chief Marketing Officer for iShares and Barclays Global Investors from 2000 to 2010. Trustee of the San Francisco Mechanics’ Institute, anon-profit organization, from 2013 to 2015. Board member of the Russell Exchange Traded Fund Trust from 2011 to 2012. Director of Barclays Global Investors Holdings Deutschland GmbH from 2006 to 2009. Mr. Polisson is an attorney and has a retired status with the Massachusetts and District of Columbia Bar Associations. | | N/A |
| | | |
Pamela Wheelock3 (Born 1959) | | Trustee, since January 2020; previously Trustee from January 2018 to July 2019 | | Board member of the Destination Medical Center Economic Development Agency, Rochester, Minnesota since 2019. Acting Commissioner, Minnesota Department of Human Services, July 2019 through September 2019. Human Services Manager (part-time), Minnesota Department of Human Services, October 2019 through December 2019. Chief Operating Officer, Twin Cities Habitat for Humanity from 2017 to 2019. Vice President of University Services, University of Minnesota from 2012 to 2016. Prior thereto, on the Board of Directors, Governance Committee and Finance Committee for the Minnesota Philanthropy Partners (Saint Paul Foundation) from 2012 to 2018, Interim Chief Executive Officer of Blue Cross Blue Shield of Minnesota from 2011 to 2012, Chairman of the Board from 2009 to 2012 and Board Director from 2003 to 2015. Vice President, Leadership and Community Engagement, Bush Foundation, Saint Paul, Minnesota (a private foundation) from 2009 to 2011. Executive Vice President and Chief Financial Officer, Minnesota Sports and Entertainment from 2004 to 2009 and Senior Vice President from 2002 to 2004. Executive Vice President of the Minnesota Wild Foundation from 2004 to 2008. Commissioner of Finance, State of Minnesota, from 1999 to 2002. Currently Board Chair of the Minnesota Wild Foundation since 2010. | | N/A |
| * | Length of service dates reflect the Trustee’s commencement of service with the Trust’s predecessor entities, where applicable. |
Wells Fargo Strategic Income Fund | 41
Other information (unaudited)
Officers
| | | | |
Name and year of birth | | Position held and length of service | | Principal occupations during past five years or longer |
| | |
Andrew Owen (Born 1960) | | President, since 2017 | | Executive Vice President of Wells Fargo & Company and Head of Affiliated Managers, Wells Fargo Asset Management, since 2014. In addition, Mr. Owen is currently President, Chief Executive Officer and Director of Wells Fargo Funds Management, LLC since 2017. Prior thereto, Executive Vice President responsible for marketing, investments and product development for Wells Fargo Funds Management, LLC, from 2009 to 2014. |
| | |
Nancy Wiser1 (Born 1967) | | Treasurer, since 2012 | | Executive Vice President of Wells Fargo Funds Management, LLC since 2011. Chief Operating Officer and Chief Compliance Officer at LightBox Capital Management LLC, from 2008 to 2011. |
| | |
Michelle Rhee (Born 1966) | | Chief Legal Officer, since 2019 | | Secretary of Wells Fargo Funds Management, LLC, Chief Legal Counsel of Wells Fargo Asset Management and Assistant General Counsel of Wells Fargo Bank, N.A. since 2018. Associate General Counsel and Managing Director of Bank of America Corporation from 2004 to 2018. |
| | |
Catherine Kennedy (Born 1969) | | Secretary, since 2019 | | Vice President of Wells Fargo Funds Management, LLC and Senior Counsel of the Wells Fargo Legal Department since 2010. Vice President and Senior Counsel of Evergreen Investment Management Company, LLC from 1998 to 2010. |
| | |
Michael H. Whitaker (Born 1967) | | Chief Compliance Officer, since 2016 | | Chief Compliance Officer of Wells Fargo Asset Management since 2016. Senior Vice President and Chief Compliance Officer for Fidelity Investments from 2007 to 2016. |
| | |
David Berardi (Born 1975) | | Assistant Treasurer, since 2009 | | Vice President of Wells Fargo Funds Management, LLC since 2009. Vice President of Evergreen Investment Management Company, LLC from 2008 to 2010. Manager of Fund Reporting and Control for Evergreen Investment Management Company, LLC from 2004 to 2010. |
| | |
Jeremy DePalma1 (Born 1974) | | Assistant Treasurer, since 2009 | | Senior Vice President of Wells Fargo Funds Management, LLC since 2009. Senior Vice President of Evergreen Investment Management Company, LLC from 2008 to 2010 and head of the Fund Reporting and Control Team within Fund Administration from 2005 to 2010. |
| 1 | Nancy Wiser acts as Treasurer of 65 funds in the Fund Complex. Jeremy DePalma acts as Treasurer of 82 funds and Assistant Treasurer of 65 funds in the Fund Complex. |
| 2 | The Statement of Additional Information includes additional information about the Trustees and is available, without charge, upon request, by calling1-800-222-8222 or by visiting the website atwfam.com. |
| 3 | Pamela Wheelock wasre-appointed to the Board effective January 1, 2020. |
42 | Wells Fargo Strategic Income Fund
Appendix I (unaudited)
Effective on or about May 1, 2020, if you purchase Fund shares through a Janney Montgomery Scott LLC (“Janney”) brokerage account, you will be eligible for the following load waivers(front-end sales charge waivers and contingent deferred sales charge (“CDSC”), orback-end sales charge, waivers) and discounts, which may differ from those disclosed elsewhere in the Fund’s Prospectus or SAI.
|
|
| Front-end sales charge* waivers on Class A shares available at Janney |
|
| Shares purchased through reinvestment of capital gains distributions and dividend reinvestment when purchasing shares of the same fund (but not any other fund within the fund family). |
|
| Shares purchased by employees and registered representatives of Janney or its affiliates and their family members as designated by Janney. |
|
| Shares purchased from the proceeds of redemptions within the same fund family, provided (1) the repurchase occurs within ninety (90) days following the redemption, (2) the redemption and purchase occur in the same account, and (3) redeemed shares were subject to afront-end or deferred sales load (i.e., right of reinstatement). |
|
| Employer-sponsored retirement plans (e.g., 401(k) plans, 457 plans, employer-sponsored 403(b) plans, profit sharing and money purchase pension plans and defined benefit plans). For purposes of this provision, employer-sponsored retirement plans do not include SEP IRAs, Simple IRAs,SAR-SEPs or Keogh plans. |
|
| Shares acquired through a right of reinstatement. |
|
| Class C shares that are no longer subject to a contingent deferred sales charge and are converted to Class A shares of the same fund pursuant to Janney’s policies and procedures. |
|
| CDSC waivers on Class A and Class C shares available at Janney |
|
| Shares sold upon the death or disability of the shareholder. |
|
| Shares sold as part of a systematic withdrawal plan as described in the Fund’s Prospectus. |
|
| Shares purchased in connection with a return of excess contributions from an IRA account. |
|
| Shares sold as part of a required minimum distribution for IRA and retirement accounts if the redemption is taken in or after the year the shareholder reaches qualified age based on applicable IRS regulations. |
|
| Shares sold to pay Janney fees but only if the transaction is initiated by Janney. |
|
| Shares acquired through a right of reinstatement. |
|
| Shares exchanged into the same share class of a different fund. |
|
| Front-end sales charge* discounts available at Janney; breakpoints, rights of accumulation and/or letters of intent |
|
| Breakpoints as described in the Fund’s Prospectus. |
|
| Rights of accumulation (“ROA”), which entitle shareholders to breakpoint discounts, will be automatically calculated based on the aggregated holding of fund family assets held by accounts within the purchaser’s household at Janney. Eligible fund family assets not held at Janney may be included in the ROA calculation only if the shareholder notifies his or her financial advisor about such assets. |
|
| Letters of intent which allow for breakpoint discounts based on anticipated purchases within a fund family, over a13-month time period. Eligible fund family assets not held at Janney Montgomery Scott may be included in the calculation of letters of intent only if the shareholder notifies his or her financial advisor about such assets. |
| * | Also referred to as an “initial sales charge.” |
Wells Fargo Strategic Income Fund | 43
Appendix II (unaudited)
Effective on or after May 1, 2020, clients of Edward Jones (also referred to as “shareholders”) purchasing Fund shares on the Edward Jones commission andfee-based platforms are eligible only for the following sales charge discounts (also referred to as “breakpoints”) and waivers, which can differ from breakpoints and waivers described elsewhere in this Prospectus or SAI or through another broker-dealer. In all instances, it is the shareholder’s responsibility to inform Edward Jones at the time of purchase of any relationship, holdings of Wells Fargo Funds or other facts qualifying the purchaser for breakpoints or waivers. Edward Jones can ask for documentation of such circumstance.
|
| Breakpoints available at Edward Jones |
|
| Rights of Accumulation (ROA) |
|
The applicable sales charge on a purchase of Class A shares is determined by taking into account all share classes (except any money market funds and retirement plan share classes) of Wells Fargo Funds held by the shareholder or in an account grouped by Edward Jones with other accounts for the purpose of providing certain pricing considerations (“pricing groups”). This includes all share classes held on the Edward Jones platform and/or held on another platform. The inclusion of eligible fund family assets in the rights of accumulation calculation is dependent on the shareholder notifying his or her financial advisor of such assets at the time of calculation. |
|
ROA is determined by calculating the higher of cost or market value (current shares x NAV). |
|
| Letter of Intent (LOI) |
|
Through a LOI, shareholders can receive the sales charge and breakpoint discounts for purchases shareholders intend to makeover a13-month period from the date Edward Jones receives the LOI. The LOI is determined by calculating the higher of cost or market value of qualifying holdings at LOI initiation in combination with the value that the shareholder intends to buy over a13-month period to calculate thefront-end sales charge and any breakpoint discounts. Each purchase the shareholder makes during that13-month period will receive the sales charge and breakpoint discount that applies to the total amount. The inclusion of eligible fund family assets in the LOI calculation is dependent on the shareholder notifying his or her financial advisor of such assets at the time of calculation. Purchases made before the LOI is received by Edward Jones are not covered under the LOI and will not reduce the sales charge previously paid. Sales charges will be adjusted if LOI is not met. |
| Sales charges are waived for the following shareholders and in the following situations at Edward Jones: |
● Associates of Edward Jones and its affiliates and their family members who are in the same pricing group (as determined by Edward Jones under its policies and procedures) as the associate. This waiver will continue for the remainder of the associate’s life if the associate retires from Edward Jones in good-standing. |
● Shares purchased in an Edward Jonesfee-based program. |
● Shares purchased through reinvestment of capital gains distributions and dividend reinvestment. |
● Shares purchased from the proceeds of redeemed shares of the same fund family so long as the following conditions are met: 1) the proceeds are from the sale of shares within 60 days of the purchase, and 2) the sale and purchase are made in the same share class and the same account or the purchase is made in an individual retirement account with proceeds from liquidations in anon-retirement account. |
● Shares exchanged into Class A shares from another share class so long as the exchange is into the same fund and was initiated at the discretion of Edward Jones. Edward Jones is responsible for any remaining CDSC due to the fund company, if applicable. Any future purchases are subject to the applicable sales charge as disclosed in the prospectus. |
● Exchanges from Class C shares to Class A shares of the same fund, generally, in the 84th month following the anniversary of the purchase date or earlier at the discretion of Edward Jones. |
If the shareholder purchases shares that are subject to a CDSC and those shares are redeemed before the CDSC is expired, the shareholder is
responsible to pay the CDSC except in the following conditions available at Edward Jones: |
● The death or disability of the shareholder. |
● Systematic withdrawals with up to 10% per year of the account value. |
● Return of excess contributions from an Individual Retirement Account (IRA). |
● Shares sold as part of a required minimum distribution for IRA and retirement accounts if the redemption is taken in or after the year the shareholder reaches qualified age based on applicable IRS regulation. |
● Shares sold to pay Edward Jones fees or costs in such cases where the transaction is initiated by Edward Jones. |
● Shares exchanged in an Edward Jonesfee-based program. |
● Shares acquired through NAV reinstatement. |
44 | Wells Fargo Strategic Income Fund
Appendix II (unaudited)
|
| Other Important Information for accounts at Edward Jones: |
Minimum Purchase Amounts ● $250 initial purchase minimum ● $50 subsequent purchase minimum |
Minimum Balances Edward Jones has the right to redeem at its discretion fund holdings with a balance of $250 or less. The following are examples of accounts that are not included in this policy: ● Afee-based account held on an Edward Jones platform ● A 529 account held on an Edward Jones platform ● An account with an active systematic investment plan or letter of intent (LOI) |
Changing Share Classes At any time it deems necessary, Edward Jones has the authority to exchange at NAV a shareholder’s holdings in a fund to Class A shares. |
Wells Fargo Strategic Income Fund | 45
This page is intentionally left blank.
This page is intentionally left blank.
This page is intentionally left blank.

For more information
More information about Wells Fargo Funds is available free upon request. To obtain literature, please write, visit the Fund’s website, or call:
Wells Fargo Funds
P.O. Box 219967
Kansas City, MO 64121-9967
Website:wfam.com
Individual investors:1-800-222-8222
Retail investment professionals:1-888-877-9275
Institutional investment professionals:1-866-765-0778

This report and the financial statements contained herein are submitted for the general information of the shareholders of the Fund. If this report is used for promotional purposes, distribution of the report must be accompanied or preceded by a current prospectus. Before investing, please consider the investment objectives, risks, charges, and expenses of the investment. For a current prospectus and, if available, a summary prospectus, containing this information, call1-800-222-8222 or visit the Fund’s website atwfam.com. Read the prospectus carefully before you invest or send money.
Wells Fargo Asset Management (WFAM) is the trade name for certain investment advisory/management firms owned by Wells Fargo & Company. These firms include but are not limited to Wells Capital Management Incorporated and Wells Fargo Funds Management, LLC. Certain products managed by WFAM entities are distributed by Wells Fargo Funds Distributor, LLC (a broker-dealer and Member FINRA).
This material is for general informational and educational purposes only and is NOT intended to provide investment advice or a recommendation of any kind—including a recommendation for any specific investment, strategy, or plan.
INVESTMENT PRODUCTS: NOT FDIC INSURED ◾ NO BANK GUARANTEE ◾ MAY LOSE VALUE
© 2020 Wells Fargo & Company. All rights reserved.
PAR-0420-06225 05-20
SA263/SAR263 03-20
Semi-Annual Report
March 31, 2020
Wells Fargo
Global Investment Grade Credit Fund
Beginning on January 1, 2021, as permitted by new regulations adopted by the Securities and Exchange Commission, paper copies of the Wells Fargo Funds’ annual and semi-annual shareholder reports issued after this date will no longer be sent by mail, unless you specifically request paper copies of the reports. Instead, the reports will be made available on the Funds’ website, and you will be notified by mail each time a report is posted and provided with a website address to access the report.
If you already elected to receive shareholder reports electronically, you will not be affected by this change and you need not take any action. You may elect to receive shareholder reports and other communications from the Fund electronically at any time by contacting your financial intermediary (such as a broker-dealer or bank) or, if you are a direct investor, by calling1-800-222-8222 or by enrolling at wellsfargo.com/advantagedelivery.
You may elect to receive all future reports in paper free of charge. If you invest through a financial intermediary, you can contact your financial intermediary to request that you continue to receive paper copies of your shareholder reports; if you invest directly with the Fund, you can call 1-800-222-8222. Your election to receive reports in paper will apply to all Wells Fargo Funds held in your account with your financial intermediary or, if you are a direct investor, to all Wells Fargo Funds that you hold.
|
|
|
Reduce clutter. Save trees. |
Sign up for electronic delivery of prospectuses and shareholder reports atwellsfargo.com/advantagedelivery |
The views expressed and any forward-looking statements are as of March 31, 2020, unless otherwise noted, and are those of the Fund managers and/or Wells Fargo Asset Management. Discussions of individual securities, or the markets generally, or any Wells Fargo Fund are not intended as individual recommendations. Future events or results may vary significantly from those expressed in any forward-looking statements. The views expressed are subject to change at any time in response to changing circumstances in the market. Wells Fargo Asset Management and the Fund disclaim any obligation to publicly update or revise any views expressed or forward-looking statements.
INVESTMENT PRODUCTS: NOT FDIC INSURED ◾ NO BANK GUARANTEE ◾ MAY LOSE VALUE
Wells Fargo Global Investment Grade Credit Fund | 1
Letter to shareholders (unaudited)

Andrew Owen
President
Wells Fargo Funds
“The period began with mixed data, leading to central bank support .”
Dear Shareholder:
We are pleased to offer you this semi-annual report for the Wells Fargo Global Investment Grade Credit Fund for thesix-month period that ended March 31, 2020. Global stock markets saw earlier gains erased in February and March as governments took unprecedented measures to stop the spread of the coronavirus at the expense of short-term economic output. Fixed-income markets were less battered, with U.S. government bonds achieving modest gains as central banks attempted to bolster capital markets and confidence.
For the period, U.S. stocks, based on the S&P 500 Index,1 returned-12.31% and international stocks, as measured by the MSCI ACWI ex USA Index (Net),2 fell 16.52%. The MSCI EM Index (Net)3 lost 14.55%. For bond investors, the Bloomberg Barclays U.S. Aggregate Bond Index4 added 3.33%, the Bloomberg Barclays Global Aggregateex-USD Index5 returned-2.03%, the Bloomberg Barclays Municipal Bond Index6 gained a modest 0.10%, and the ICE BofA U.S. High Yield Index7 returned-10.86%.
The period began with mixed data, leading to central bank support.
As the fourth quarter of 2019 started, U.S.-China trade tensions were relaxing while optimism grew for a U.K. Brexit deal. The initial estimate of U.S. third-quarter gross domestic product growth was a resilient 1.9% annualized rate, while the U.S. unemployment rate fell to a50-year low of 3.5% in September. Despite resilience among U.S. consumers, however, business confidence declined while manufacturing activity contracted. Concerned with a potential economic slowdown, the U.S. Federal Reserve (Fed) lowered interest rates a quarter point in late October—its third rate cut in four months. This helped push the S&P 500 Index to anall-time high while emerging market equities rallied and global bonds declined overall, reflecting a broad pickup in risk appetite.
Equity markets rallied in November despite ongoing geopolitical risks. Hopes for a U.S.-China trade deal buoyed investor confidence. U.S. business sentiment edged up, and manufacturing and services activity rose. With that positive backdrop, developed market equities outpaced those in emerging markets, and U.S. stocks outperformednon-U.S. stocks overall. While consumer confidence and purchasing manager activity rose in the eurozone, China reported weakening manufacturing and consumer data. Bond yields rose marginally, leading to slightly negative returns for global government and investment-grade corporate bonds.
Financial markets ended 2019 with a boost from the U.S. and China accord on a Phase One trade deal. That, along with the landslide win by thepro-Brexit U.K. Conservative Party in a national election and ongoing central bank support, gave investors greater
| 1 | The S&P 500 Index consists of 500 stocks chosen for market size, liquidity, and industry group representation. It is a market-value-weighted index with each stock’s weight in the index proportionate to its market value. You cannot invest directly in an index. |
| 2 | The Morgan Stanley Capital International (MSCI) All Country World Index (ACWI) ex USA Index (Net) is a free-float-adjusted market-capitalization-weighted index that is designed to measure the equity market performance of developed markets, excluding the United States. Source: MSCI. MSCI makes no express or implied warranties or representations and shall have no liability whatsoever with respect to any MSCI data contained herein. The MSCI data may not be further redistributed or used as a basis for other indices or any securities or financial products. This report is not approved, reviewed, or produced by MSCI. You cannot invest directly in an index. |
| 3 | The MSCI Emerging Markets (EM) Index (Net) is a free-float-adjusted market-capitalization-weighted index that is designed to measure equity market performance of emerging markets. You cannot invest directly in an index. |
| 4 | The Bloomberg Barclays U.S. Aggregate Bond Index is a broad-based benchmark that measures the investment-grade, U.S. dollar-denominated, fixed-rate taxable bond market, including Treasuries, government-related and corporate securities, mortgage-backed securities (agency fixed-rate and hybrid adjustable-rate mortgage pass-throughs), asset-backed securities, and commercial mortgage-backed securities. You cannot invest directly in an index. |
| 5 | The Bloomberg Barclays Global Aggregateex-USD Index is an unmanaged index that provides a broad-based measure of the global investment-grade fixed-income markets excluding the U.S. dollar-denominated debt market. You cannot invest directly in an index. |
| 6 | The Bloomberg Barclays Municipal Bond Index is an unmanaged index composed of long-termtax-exempt bonds with a minimum credit rating of Baa. You cannot invest directly in an index. |
| 7 | The ICE BofA U.S. High Yield Index is a market-capitalization-weighted index of domestic and Yankee high-yield bonds. The index tracks the performance of high-yield securities traded in the U.S. bond market. You cannot invest directly in an index. Copyright 2020. ICE Data Indices, LLC. All rights reserved. |
2 | Wells Fargo Global Investment Grade Credit Fund
Letter to shareholders (unaudited)
confidence. U.S. economic indicators were positive overall, with the exception of manufacturing activity and business confidence. Consumer confidence was resilient, fed by a robust labor market, tame inflation, and lower interest rates, which boosted housing affordability and stimulated homebuyer activity. The impeachment of U.S. President Donald Trump had little impact on markets. Meanwhile, slowing Chinese economic activity, partly attributable to the trade war, led to further government stimulus atyear-end through lower reserve ratios, allowing banks to lend more money.
Theyear-end rally continued in early January 2020. However, capital market volatility spiked in late January on concerns over the potential impact of the coronavirus on the global economy and stock markets. With sentiment somewhat souring, perceived safe havens did well in January. The U.S. dollar and Japanese yen both rose, and government bonds outperformed equities. While the S&P 500 Index held its ground, emerging market equities tumbled, including those in Asia.
In February, the coronavirus became the major market focus. Fears of the virus’s impact on global growth led to expectations of increased global central bank monetary policy support. That led the10-year U.S. Treasury yield to fall to anall-time low of 1.1% by the end of the month. Although equity markets initially shrugged off concerns about the outbreak, focusing instead on strong fourth-quarter earnings and improving business confidence in January, market sentiment turned sharply lower towardmonth-end. Oil prices tumbled as Russia and the Organization of the Petroleum Exporting Countries compounded a major decline in oil demand with a brutal price war, causing the price of West Texas Intermediate crude oil to fall 13% in February alone.
The global spread of the coronavirus led many countries to clamp down on social and business-related activity in order to contain the virus from causing even greater devastation and overwhelming the health care system. This abrupt stoppage of economic activity led to the sharp deceleration of global output, sending economies into a deep contraction. Central bank responses were swift, as they slashed interest rates and expanded quantitative easing programs to restore liquidity and confidence to the markets. In the U.S., the Fed launched several lending programs, funding investment-grade bonds, money market mutual funds, and commercial paper while purchasing Treasuries, mortgage-backed securities, and overnight repos. Meanwhile, stock markets tumbled quickly into a bear market, ending the longest bull stock market in U.S. history.
Don’t let short-term uncertainty derail long-term investment goals.
Periods of investment uncertainty can present challenges, but experience has taught us that maintaining long-term investment goals can be an effective way to plan for the future. To help you create a sound strategy based on your personal goals and risk tolerance, Wells Fargo Funds offers more than 100 mutual funds spanning a wide range of asset classes and investment styles. Although diversification cannot guarantee an investment profit or prevent losses, we believe it can be an effective way to manage investment risk and potentially smooth out overall portfolio performance. We encourage investors to know their investments and to understand that appropriate levels of risk-taking may unlock opportunities.
Thank you for choosing to invest with Wells Fargo Funds. We appreciate your confidence in us and remain committed to helping you meet your financial needs.
Sincerely,

Andrew Owen
President
Wells Fargo Funds
“Capital market volatility spiked in late January on concerns over the potential impact of the coronavirus on the global economy and stock markets.”
|
|
|
For further information about your Fund, contact your investment professional, visit our website at wfam.com, or call us directly at1-800-222-8222. |
Wells Fargo Global Investment Grade Credit Fund | 3
Performance highlights (unaudited)
Investment objective
The Fund seeks total return, consisting of income and capital appreciation.
Manager
Wells Fargo Funds Management, LLC
Subadvisers
Wells Capital Management Incorporated
Wells Fargo Asset Management (International) Limited
Portfolio managers
Henrietta Paquement, CFA®‡
Scott M. Smith, CFA®‡
Alex Temple
Jonathan Terry, CFA®‡
Average annual total returns (%) as of March 31, 2020
| | | | | | | | | | | | | | | | | | |
| | | |
| | | | | Including sales charge | | | Expense ratios1 (%) | |
| | | | | |
| | | Inception date | | 1 year | | | Since
inception | | | Gross | | | Net2 | |
| | | | | | |
| Class R6 (WGCRX) | | 2-28-2019 | | | 2.27 | | | | 3.87 | | | | 0.86 | | | | 0.45 | |
| | | | | | |
| Institutional Class (WGCIX) | | 2-28-2019 | | | 2.24 | | | | 3.84 | | | | 0.91 | | | | 0.50 | |
| | | | | | |
| Bloomberg Barclays Global Aggregate Credit Index Hedged (USD)3 | | – | | | 3.70 | | | | 5.40 | * | | | – | | | | – | |
| * | Based on the inception date of the oldest Fund class. |
Figures quoted represent past performance, which is no guarantee of future results, and do not reflect taxes that a shareholder may pay on an investment in a fund. Investment return and principal value of an investment will fluctuate so that an investor’s shares, when redeemed, may be worth more or less than their original cost. Current performance may be lower or higher than the performance data quoted, which assumes the reinvestment of dividends and capital gains. Currentmonth-end performance is available on the Fund’s website,wfam.com.
Index returns do not include transaction costs associated with buying and selling securities, any mutual fund fees or expenses, or any taxes. It is not possible to invest directly in an index.
Class R6 and Institutional Class shares are sold without afront-end sales charge or contingent deferred sales charge.
Bond values fluctuate in response to the financial condition of individual issuers, general market and economic conditions, and changes in interest rates. Changes in market conditions and government policies may lead to periods of heightened volatility in the bond market and reduced liquidity for certain bonds held by the fund. In general, when interest rates rise, bond values fall and investors may lose principal value. Interest rate changes and their impact on the fund and its share price can be sudden and unpredictable. Foreign investments are especially volatile and can rise or fall dramatically due to differences in the political and economic conditions of the host country. These risks are generally intensified in emerging markets. The use of derivatives may reduce returns and/or increase volatility. Securities issued by U.S. government agencies or government-sponsored entities may not be guaranteed by the U.S. Treasury. Certain investment strategies tend to increase the total risk of an investment (relative to the broader market). The Fund is exposed to municipal securities risk, high-yield securities risk, and mortgage- and asset-backed securities risk. Consult the Fund’s prospectus for additional information on these and other risks.
Please see footnotes on page 5.
4 | Wells Fargo Global Investment Grade Credit Fund
Performance highlights (unaudited)
| | | | |
|
| Ten largest holdings (%) as of March 31, 20204 | |
| | |
Goldman Sachs Group Incorporated,3.63%, 1-22-2023 | | | 1.90 | |
| | |
JPMorgan Chase & Company,2.30%, 8-15-2021 | | | 1.66 | |
| | |
Citigroup Incorporated,3.30%, 4-27-2025 | | | 1.64 | |
| | |
Raymond James Financial Services Incorporated,4.95%, 7-15-2046 | | | 1.54 | |
| | |
Bank of America Corporation,4.13%, 1-22-2024 | | | 1.51 | |
| | |
Morgan Stanley,3.13%, 7-27-2026 | | | 1.48 | |
| | |
Intercontinental Exchange Incorporated,3.75%, 12-1-2025 | | | 1.35 | |
| | |
Cantor Fitzgerald LP,4.88%, 5-1-2024 | | | 1.28 | |
| | |
American International Group Incorporated,4.75%, 4-1-2048 | | | 1.19 | |
| | |
Toronto Dominion Bank,3.23%, 7-24-2024 | | | 1.17 | |
|
|
| Portfolio composition as of March 31, 20205 |
|
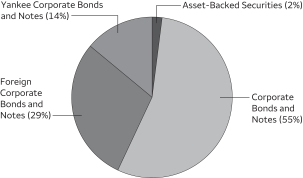 |
|
|
| Effective maturity distribution as of March 31, 20205 |
|
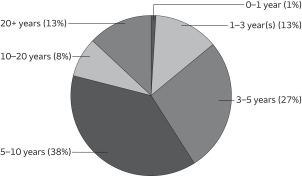 |
|
|
| Credit quality as of March 31, 20206 |
|
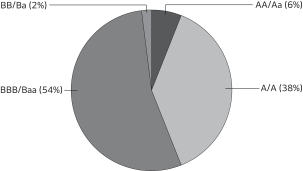 |
| ‡ | CFA® and Chartered Financial Analyst®are trademarks owned by CFA Institute. |
| 1 | Reflects the expense ratios as stated in the most recent prospectuses. The expense ratios shown are subject to change and may differ from the annualized expense ratios shown in the financial highlights of this report. |
| 2 | The manager has contractually committed through January 31, 2021, to waive fees and/or reimburse expenses to the extent necessary to cap total annual fund operating expenses after fee waivers at 0.45% for Class R6 and 0.50% for Institutional Class. Brokerage commissions, stamp duty fees, interest, taxes, acquired fund fees and expenses (if any), and extraordinary expenses are excluded from the expense cap. Prior to or after the commitment expiration date, the cap may be increased or the commitment to maintain the cap may be terminated only with the approval of the Board of Trustees. Without this cap, the Fund’s returns would have been lower. The expense ratio paid by an investor is the net expense ratio (the total annual fund operating expenses after fee waivers) as stated in the prospectuses. |
| 3 | Bloomberg Barclays Global Aggregate Credit Index Hedged (USD) measures the credit sector of the global investment grade fixed-rate bond market, including corporate, government and agency securities, hedged in USD. You cannot invest directly in an index. |
| 4 | The ten largest holdings, excluding cash, cash equivalents and any money market funds, are calculated based on the value of the investments divided by total net assets of the Fund. Holdings are subject to change and may have changed since the date specified. |
| 5 | Amounts are calculated based on the total long-term investments of the Fund. These amounts are subject to change and may have changed since the date specified. |
| 6 | The credit quality distribution of portfolio holdings reflected in the chart is based on ratings from Standard & Poor’s, Moody’s Investors Service, and/or Fitch Ratings Ltd. Credit quality ratings apply to the underlying holdings of the Fund and not to the Fund itself. The percentages of the Fund’s portfolio with the ratings depicted in the chart are calculated based on the total market value of fixed income securities held by the Fund. If a security was rated by all three rating agencies, the middle rating was utilized. If rated by two of three rating agencies, the lower rating was utilized, and if rated by one of the rating agencies, that rating was utilized. Standard & Poor’s rates the creditworthiness of bonds, ranging from AAA (highest) to D (lowest). Ratings from A to CCC may be modified by the addition of a plus (+) or minus (-) sign to show relative standing within the rating categories. Standard & Poor’s rates the creditworthiness of short-term notes fromSP-1 (highest) toSP-3 (lowest). Moody’s rates the creditworthiness of bonds, ranging from Aaa (highest) to C (lowest). Ratings Aa to B may be modified by the addition of a number 1 (highest) to 3 (lowest) to show relative standing within the ratings categories. Moody’s rates the creditworthiness of short-term U.S.tax-exempt municipal securities from MIG 1/VMIG 1 (highest) to SG (lowest). Fitch rates the creditworthiness of bonds, ranging from AAA (highest) to D (lowest). Credit quality distribution is subject to change and may have changed since the date specified. |
Wells Fargo Global Investment Grade Credit Fund | 5
Fund expenses (unaudited)
As a shareholder of the Fund, you incur ongoing costs including management fees and other Fund expenses. This example is intended to help you understand your ongoing costs (in dollars) of investing in the Fund and to compare these costs with the ongoing costs of investing in other mutual funds.
The example is based on an investment of $1,000 invested at the beginning of thesix-month period and held for the entire period from October 1, 2019 to March 31, 2020.
Actual Expenses
The “Actual” line of the table below provides information about actual account values and actual expenses. You may use the information in this line, together with the amount you invested, to estimate the expenses that you paid over the period. Simply divide your account value by $1,000 (for example, an $8,600 account value divided by $1,000 = 8.6), then multiply the result by the number in the “Actual” line under the heading entitled “Expenses paid during period” for your applicable class of shares to estimate the expenses you paid on your account during this period.
Hypothetical Example for Comparison Purposes
The “Hypothetical” line of the table below provides information about hypothetical account values and hypothetical expenses based on the Fund’s actual expense ratio and an assumed rate of return of 5% per year before expenses, which is not the Fund’s actual return. The hypothetical account values and expenses may not be used to estimate the actual ending account balance or expenses you paid for the period. You may use this information to compare the ongoing costs of investing in the Fund and other funds. To do so, compare this 5% hypothetical example with the 5% hypothetical examples that appear in the shareholder reports of the other funds.
Please note that the expenses shown in the table are meant to highlight your ongoing costs only. Therefore, the “Hypothetical” line of the table is useful in comparing ongoing costs only and will not help you determine the relative total costs of owning different funds.
| | | | | | | | | | | | | | | | |
| | | Beginning
account value
10-1-2019 | | | Ending
account value
3-31-2020 | | | Expenses
paid during
the period1 | | | Annualized net
expense ratio | |
| | | | | |
Class R6 | | | | | | | | | | | | | | | | |
| | | | |
Actual | | $ | 1,000.00 | | | $ | 959.19 | | | $ | 2.20 | | | | 0.45 | % |
| | | | |
Hypothetical (5% return before expenses) | | $ | 1,000.00 | | | $ | 1,022.75 | | | $ | 2.28 | | | | 0.45 | % |
| | | | | |
Institutional Class | | | | | | | | | | | | | | | | |
| | | | |
Actual | | $ | 1,000.00 | | | $ | 958.95 | | | $ | 2.45 | | | | 0.50 | % |
| | | | |
Hypothetical (5% return before expenses) | | $ | 1,000.00 | | | $ | 1,022.50 | | | $ | 2.53 | | | | 0.50 | % |
| 1 | Expenses paid is equal to the annualized net expense ratio of each class multiplied by the average account value over the period, multiplied by the number of days in the most recent fiscal half-year divided by the number of days in the fiscal year (to reflect theone-half-year period). |
6 | Wells Fargo Global Investment Grade Credit Fund
Portfolio of investments—March 31, 2020 (unaudited)
| | | | | | | | | | | | | | | | |
| | | Interest
rate | | | Maturity
date | | | Principal | | | Value | |
| Asset-Backed Securities: 2.20% | |
American Airlines Series2014-1 Class A Pass-Through Trust | | | 3.70 | % | | | 4-1-2028 | | | $ | 265,183 | | | $ | 255,506 | |
British Airways Series2019-1 Class AA Pass-Through Trust 144A | | | 3.30 | | | | 6-15-2034 | | | | 764,644 | | | | 718,034 | |
Delta Air Lines Series2019-1 Class AA Pass-Through Trust | | | 3.20 | | | | 10-25-2025 | | | | 440,000 | | | | 429,562 | |
| |
Total Asset-Backed Securities (Cost $1,468,703) | | | | 1,403,102 | |
| | | | | | | | | | | | | | | | |
|
Corporate Bonds and Notes: 54.13% | |
|
Communication Services: 7.31% | |
|
| Diversified Telecommunication Services: 2.60% | |
AT&T Incorporated | | | 4.25 | | | | 3-1-2027 | | | | 540,000 | | | | 577,307 | |
AT&T Incorporated | | | 4.50 | | | | 3-9-2048 | | | | 225,000 | | | | 244,183 | |
Verizon Communications Incorporated | | | 2.88 | | | | 1-15-2038 | | | | 200,000 | | | | 224,050 | |
Verizon Communications Incorporated | | | 4.13 | | | | 8-15-2046 | | | | 525,000 | | | | 607,924 | |
| | | | |
| | | | | | | | | | | | | | | 1,653,464 | |
| | | | | | | | | | | | | | | | |
|
| Entertainment: 0.79% | |
Walt Disney Company | | | 3.80 | | | | 3-22-2030 | | | | 450,000 | | | | 505,971 | |
| | | | | | | | | | | | | | | | |
|
| Media: 3.92% | |
Charter Communications Operating LLC | | | 4.91 | | | | 7-23-2025 | | | | 480,000 | | | | 517,095 | |
Comcast Corporation | | | 3.38 | | | | 8-15-2025 | | | | 645,000 | | | | 684,990 | |
Cox Communications Incorporated 144A | | | 4.60 | | | | 8-15-2047 | | | | 375,000 | | | | 387,735 | |
Discovery Incorporated | | | 5.30 | | | | 5-15-2049 | | | | 190,000 | | | | 192,459 | |
Fox Corporation | | | 4.71 | | | | 1-25-2029 | | | | 560,000 | | | | 614,315 | |
MMS USA Financing Incorporated | | | 1.75 | | | | 6-13-2031 | | | | 100,000 | | | | 103,068 | |
| | | | |
| | | | | | | | | | | | | | | 2,499,662 | |
| | | | | | | | | | | | | | | | |
|
Consumer Discretionary: 0.69% | |
|
| Hotels, Restaurants & Leisure: 0.36% | |
McDonald’s Corporation | | | 1.45 | | | | 9-1-2025 | | | | 245,000 | | | | 232,761 | |
| | | | | | | | | | | | | | | | |
|
| Internet & Direct Marketing Retail: 0.33% | |
Booking Holdings Incorporated | | | 1.80 | | | | 3-3-2027 | | | | 200,000 | | | | 207,882 | |
| | | | | | | | | | | | | | | | |
|
Consumer Staples: 3.51% | |
|
| Beverages: 1.82% | |
Anheuser-Busch InBev Finance Incorporated | | | 3.65 | | | | 2-1-2026 | | | | 690,000 | | | | 717,976 | |
Keurig Dr Pepper Incorporated | | | 4.60 | | | | 5-25-2028 | | | | 405,000 | | | | 443,417 | |
| | | | |
| | | | | | | | | | | | | | | 1,161,393 | |
| | | | | | | | | | | | | | | | |
|
| Food & Staples Retailing: 0.42% | |
Walmart Incorporated | | | 3.70 | | | | 6-26-2028 | | | | 235,000 | | | | 264,195 | |
| | | | | | | | | | | | | | | | |
|
| Food Products: 0.66% | |
Mars Incorporated 144A | | | 3.95 | | | | 4-1-2049 | | | | 390,000 | | | | 423,160 | |
| | | | | | | | | | | | | | | | |
|
| Tobacco: 0.61% | |
BAT Capital Corporation | | | 4.54 | | | | 8-15-2047 | | | | 425,000 | | | | 387,843 | |
| | | | | | | | | | | | | | | | |
|
Energy: 6.51% | |
|
| Energy Equipment & Services: 0.88% | |
Baker Hughes LLC | | | 3.34 | | | | 12-15-2027 | | | | 610,000 | | | | 559,383 | |
| | | | | | | | | | | | | | | | |
The accompanying notes are an integral part of these financial statements.
Wells Fargo Global Investment Grade Credit Fund | 7
Portfolio of investments—March 31, 2020 (unaudited)
| | | | | | | | | | | | | | | | |
| | | Interest
rate | | | Maturity
date | | | Principal | | | Value | |
| Oil, Gas & Consumable Fuels: 5.63% | |
BP Capital Markets America Incorporated | | | 2.75 | % | | | 5-10-2023 | | | $ | 365,000 | | | $ | 366,152 | |
Energy Transfer Operating Partners LP | | | 3.75 | | | | 5-15-2030 | | | | 245,000 | | | | 191,895 | |
Energy Transfer Operating Partners LP | | | 6.25 | | | | 4-15-2049 | | | | 625,000 | | | | 528,944 | |
Kinder Morgan Energy Partners LP | | | 5.40 | | | | 9-1-2044 | | | | 405,000 | | | | 402,524 | |
Marathon Petroleum Corporation | | | 3.80 | | | | 4-1-2028 | | | | 365,000 | | | | 328,907 | |
Midwest Connector Capital Company 144A | | | 3.90 | | | | 4-1-2024 | | | | 650,000 | | | | 606,873 | |
MPLX LP | | | 4.00 | | | | 3-15-2028 | | | | 510,000 | | | | 453,251 | |
Sabine Pass Liquefaction LLC | | | 5.75 | | | | 5-15-2024 | | | | 640,000 | | | | 600,667 | |
Western Midstream Partners LP | | | 4.05 | | | | 2-1-2030 | | | | 245,000 | | | | 107,831 | |
| | | | |
| | | | | | | | | | | | | | | 3,587,044 | |
| | | | | | | | | | | | | | | | |
|
Financials: 19.56% | |
|
| Banks: 6.35% | |
Bank of America Corporation | | | 4.13 | | | | 1-22-2024 | | | | 900,000 | | | | 959,524 | |
Citigroup Incorporated (3 Month EURIBOR +1.07%)± | | | 1.50 | | | | 7-24-2026 | | | | 200,000 | | | | 214,417 | |
Citigroup Incorporated | | | 3.30 | | | | 4-27-2025 | | | | 1,010,000 | | | | 1,045,513 | |
JPMorgan Chase & Company | | | 2.30 | | | | 8-15-2021 | | | | 1,060,000 | | | | 1,057,964 | |
JPMorgan Chase & Company (3 Month LIBOR +1.34%)± | | | 3.78 | | | | 2-1-2028 | | | | 375,000 | | | | 402,684 | |
Santander Holdings USA Incorporated | | | 4.40 | | | | 7-13-2027 | | | | 375,000 | | | | 368,849 | |
| | | | |
| | | | | | | | | | | | | | | 4,048,951 | |
| | | | | | | | | | | | | | | | |
|
| Capital Markets: 8.68% | |
Cantor Fitzgerald LP 144A | | | 4.88 | | | | 5-1-2024 | | | | 815,000 | | | | 812,877 | |
Five Corners Funding Trust 144A | | | 4.42 | | | | 11-15-2023 | | | | 10,000 | | | | 10,757 | |
Goldman Sachs Group Incorporated | | | 3.63 | | | | 1-22-2023 | | | | 1,170,000 | | | | 1,207,816 | |
Goldman Sachs Group Incorporated | | | 4.25 | | | | 1-29-2026 | | | | 100,000 | | | | 127,698 | |
Morgan Stanley | | | 3.13 | | | | 7-27-2026 | | | | 915,000 | | | | 945,828 | |
Morgan Stanley | | | 3.70 | | | | 10-23-2024 | | | | 700,000 | | | | 739,560 | |
Nuveen LLC 144A | | | 4.00 | | | | 11-1-2028 | | | | 445,000 | | | | 465,444 | |
Raymond James Financial Services Incorporated | | | 4.95 | | | | 7-15-2046 | | | | 850,000 | | | | 979,062 | |
State Street Corporation | | | 2.40 | | | | 1-24-2030 | | | | 245,000 | | | | 239,245 | |
| | | | |
| | | | | | | | | | | | | | | 5,528,287 | |
| | | | | | | | | | | | | | | | |
|
| Consumer Finance: 0.91% | |
American Express Credit Corporation | | | 3.30 | | | | 5-3-2027 | | | | 455,000 | | | | 479,475 | |
Capital One Financial Company | | | 0.80 | | | | 6-12-2024 | | | | 100,000 | | | | 97,953 | |
| | | | |
| | | | | | | | | | | | | | | 577,428 | |
| | | | | | | | | | | | | | | | |
|
| Diversified Financial Services: 1.35% | |
Intercontinental Exchange Incorporated | | | 3.75 | | | | 12-1-2025 | | | | 815,000 | | | | 860,958 | |
| | | | | | | | | | | | | | | | |
|
| Insurance: 2.27% | |
American International Group Incorporated | | | 4.75 | | | | 4-1-2048 | | | | 720,000 | | | | 760,825 | |
Berkshire Hathaway Incorporated | | | 2.38 | | | | 6-19-2039 | | | | 100,000 | | | | 123,455 | |
Brighthouse Financial Incorporated | | | 4.70 | | | | 6-22-2047 | | | | 480,000 | | | | 384,892 | |
Unum Group | | | 4.50 | | | | 12-15-2049 | | | | 230,000 | | | | 178,403 | |
| | | | |
| | | | | | | | | | | | | | | 1,447,575 | |
| | | | | | | | | | | | | | | | |
|
Health Care: 3.20% | |
|
| Biotechnology: 1.40% | |
AbbVie Incorporated 144A | | | 2.60 | | | | 11-21-2024 | | | | 490,000 | | | | 497,851 | |
AbbVie Incorporated 144A | | | 4.25 | | | | 11-21-2049 | | | | 365,000 | | | | 393,714 | |
| | | | |
| | | | | | | | | | | | | | | 891,565 | |
| | | | | | | | | | | | | | | | |
The accompanying notes are an integral part of these financial statements.
8 | Wells Fargo Global Investment Grade Credit Fund
Portfolio of investments—March 31, 2020 (unaudited)
| | | | | | | | | | | | | | | | |
| | | Interest
rate | | | Maturity
date | | | Principal | | | Value | |
| Health Care Providers & Services: 1.51% | |
CVS Health Corporation | | | 3.25 | % | | | 8-15-2029 | | | $ | 215,000 | | | $ | 209,403 | |
CVS Health Corporation | | | 3.70 | | | | 3-9-2023 | | | | 540,000 | | | | 562,134 | |
CVS Health Corporation | | | 4.30 | | | | 3-25-2028 | | | | 180,000 | | | | 191,161 | |
| | | | |
| | | | | | | | | | | | | | | 962,698 | |
| | | | | | | | | | | | | | | | |
|
| Life Sciences Tools & Services: 0.29% | |
Thermo Fisher Scientific Incorporated | | | 1.50 | | | | 10-1-2039 | | | | 200,000 | | | | 183,481 | |
| | | | | | | | | | | | | | | | |
|
Industrials: 5.37% | |
|
| Aerospace & Defense: 1.46% | |
General Dynamics Corporation | | | 3.38 | | | | 5-15-2023 | | | | 425,000 | | | | 445,404 | |
United Technologies Corporation | | | 4.13 | | | | 11-16-2028 | | | | 440,000 | | | | 485,718 | |
| | | | |
| | | | | | | | | | | | | | | 931,122 | |
| | | | | | | | | | | | | | | | |
|
| Air Freight & Logistics: 0.44% | |
FedEx Corporation | | | 4.95 | | | | 10-17-2048 | | | | 285,000 | | | | 278,858 | |
| | | | | | | | | | | | | | | | |
|
| Airlines: 1.14% | |
Aviation Capital Group Corporation 144A | | | 2.88 | | | | 1-20-2022 | | | | 430,000 | | | | 388,636 | |
US Airways Group Incorporated | | | 4.63 | | | | 12-3-2026 | | | | 345,208 | | | | 341,680 | |
| | | | |
| | | | | | | | | | | | | | | 730,316 | |
| | | | | | | | | | | | | | | | |
|
| Industrial Conglomerates: 0.27% | |
Carlisle Companies Incorporated | | | 2.75 | | | | 3-1-2030 | | | | 195,000 | | | | 170,409 | |
| | | | | | | | | | | | | | | | |
|
| Professional Services: 0.72% | |
Equifax Incorporated | | | 2.60 | | | | 12-1-2024 | | | | 485,000 | | | | 458,486 | |
| | | | | | | | | | | | | | | | |
|
| Road & Rail: 1.34% | |
Penske Truck Leasing Company LP 144A | | | 3.45 | | | | 7-1-2024 | | | | 490,000 | | | | 490,063 | |
Union Pacific Corporation | | | 2.40 | | | | 2-5-2030 | | | | 375,000 | | | | 364,945 | |
| | | | |
| | | | | | | | | | | | | | | 855,008 | |
| | | | | | | | | | | | | | | | |
|
Information Technology: 5.25% | |
|
| Communications Equipment: 0.91% | |
Motorola Solutions Incorporated | | | 4.60 | | | | 2-23-2028 | | | | 570,000 | | | | 581,400 | |
| | | | | | | | | | | | | | | | |
|
| Electronic Equipment, Instruments & Components: 0.32% | |
Jabil Incorporated | | | 3.60 | | | | 1-15-2030 | | | | 230,000 | | | | 204,568 | |
| | | | | | | | | | | | | | | | |
|
| IT Services: 1.61% | |
Fiserv Incorporated | | | 2.25 | | | | 7-1-2025 | | | | 100,000 | | | | 122,138 | |
Fiserv Incorporated | | | 3.50 | | | | 7-1-2029 | | | | 410,000 | | | | 433,850 | |
Western Union Company | | | 4.25 | | | | 6-9-2023 | | | | 445,000 | | | | 472,747 | |
| | | | |
| | | | | | | | | | | | | | | 1,028,735 | |
| | | | | | | | | | | | | | | | |
|
| Semiconductors & Semiconductor Equipment: 0.85% | |
Qualcomm Incorporated | | | 3.25 | | | | 5-20-2027 | | | | 510,000 | | | | 538,138 | |
| | | | | | | | | | | | | | | | |
|
| Technology Hardware, Storage & Peripherals: 1.56% | |
Apple Incorporated | | | 2.95 | | | | 9-11-2049 | | | | 200,000 | | | | 211,060 | |
Apple Incorporated | | | 3.60 | | | | 7-31-2042 | | | | 100,000 | | | | 154,444 | |
Dell International LLC / EMC Corporation 144A | | | 5.45 | | | | 6-15-2023 | | | | 610,000 | | | | 625,958 | |
| | | | |
| | | | | | | | | | | | | | | 991,462 | |
| | | | | | | | | | | | | | | | |
The accompanying notes are an integral part of these financial statements.
Wells Fargo Global Investment Grade Credit Fund | 9
Portfolio of investments—March 31, 2020 (unaudited)
| | | | | | | | | | | | | | | | |
| | | Interest
rate | | | Maturity
date | | | Principal | | | Value | |
Materials: 0.31% | |
|
| Chemicals: 0.31% | |
Westlake Chemical Corporation | | | 1.63 | % | | | 7-17-2029 | | | $ | 200,000 | | | $ | 195,882 | |
| | | | | | | | | | | | | | | | |
|
Real Estate: 0.92% | |
|
| Equity REITs: 0.25% | |
Sabra Health Care LP / Sabra Capital Corporation | | | 4.80 | | | | 6-1-2024 | | | | 160,000 | | | | 162,400 | |
| | | | | | | | | | | | | | | | |
|
| Real Estate Management & Development: 0.67% | |
Simon Property Group LP | | | 3.25 | | | | 9-13-2049 | | | | 530,000 | | | | 426,957 | |
| | | | | | | | | | | | | | | | |
|
Utilities: 1.50% | |
|
| Electric Utilities: 1.50% | |
Nevada Power Company | | | 2.40 | | | | 5-1-2030 | | | | 195,000 | | | | 186,180 | |
New York State Electric & Gas Corporation 144A | | | 3.25 | | | | 12-1-2026 | | | | 265,000 | | | | 278,210 | |
Pacificorp | | | 3.50 | | | | 6-15-2029 | | | | 480,000 | | | | 488,721 | |
| | | | |
| | | | | | | | | | | | | | | 953,111 | |
| | | | | | | | | | | | | | | | |
| |
Total Corporate Bonds and Notes (Cost $34,719,632) | | | | 34,490,553 | |
| | | | | | | | | | | | | | | | |
|
Foreign Corporate Bonds and Notes: 28.15% | |
|
Communication Services: 1.88% | |
|
| Diversified Telecommunication Services: 1.30% | |
British Telecommunication plc | | | 3.63 | | | | 11-21-2047 | | | GBP | 200,000 | | | | 243,065 | |
Deutsche Telekom International Finance BV | | | 2.25 | | | | 4-13-2029 | | | GBP | 200,000 | | | | 247,147 | |
Orange SA (EURIBOR ICE Swap Rate 11:00am +2.18%)±(s) | | | 1.75 | | | | 12-19-2026 | | | EUR | 200,000 | | | | 192,359 | |
Telefonica Emisiones SAU | | | 5.38 | | | | 2-2-2026 | | | GBP | 100,000 | | | | 142,604 | |
| | | | |
| | | | | | | | | | | | | | | 825,175 | |
| | | | | | | | | | | | | | | | |
|
| Wireless Telecommunication Services: 0.58% | |
Rogers Communications Incorporated | | | 5.34 | | | | 3-22-2021 | | | CAD | 200,000 | | | | 145,263 | |
Tele2 AB | | | 1.13 | | | | 5-15-2024 | | | EUR | 100,000 | | | | 111,557 | |
Tele2 AB | | | 2.13 | | | | 5-15-2028 | | | EUR | 100,000 | | | | 115,761 | |
| | | | |
| | | | | | | | | | | | | | | 372,581 | |
| | | | | | | | | | | | | | | | |
|
Consumer Staples: 0.67% | |
|
| Beverages: 0.34% | |
Coca-Cola European Partners plc | | | 1.50 | | | | 11-8-2027 | | | EUR | 200,000 | | | | 220,208 | |
| | | | | | | | | | | | | | | | |
|
| Food & Staples Retailing: 0.16% | |
Tesco Corporate Treasury Services plc | | | 0.88 | | | | 5-29-2026 | | | EUR | 100,000 | | | | 102,294 | |
| | | | | | | | | | | | | | | | |
|
| Food Products: 0.17% | |
Danone SA | | | 0.57 | | | | 3-17-2027 | | | EUR | 100,000 | | | | 107,748 | |
| | | | | | | | | | | | | | | | |
|
Energy: 0.34% | |
|
| Oil, Gas & Consumable Fuels: 0.34% | |
Total SA (5 Year EUR Swap +2.75%)± | | | 2.71 | | | | 12-29-2049 | | | EUR | 200,000 | | | | 217,276 | |
| | | | | | | | | | | | | | | | |
|
Financials: 16.44% | |
|
| Banks: 9.34% | |
Argenta Spaarbank NV (5 Year EUR Swap +3.95%)± | | | 3.88 | | | | 5-24-2026 | | | EUR | 200,000 | | | | 221,350 | |
Australia and New Zealand Banking Group (5 Year EUR Swap +1.40%)± | | | 1.13 | | | | 11-21-2029 | | | EUR | 100,000 | | | | 98,090 | |
The accompanying notes are an integral part of these financial statements.
10 | Wells Fargo Global Investment Grade Credit Fund
Portfolio of investments—March 31, 2020 (unaudited)
| | | | | | | | | | | | | | | | |
| | | Interest
rate | | | Maturity
date | | | Principal | | | Value | |
| Banks (continued) | |
Banco BPM SpA | | | 1.75 | % | | | 1-28-2025 | | | EUR | 100,000 | | | $ | 98,400 | |
Banco BPM SpA | | | 2.50 | | | | 6-21-2024 | | | EUR | 200,000 | | | | 205,806 | |
Banco de Sabadell SA | | | 1.13 | | | | 3-27-2025 | | | EUR | 100,000 | | | | 97,697 | |
Bankia SA | | | 1.13 | | | | 11-12-2026 | | | EUR | 100,000 | | | | 97,963 | |
Bankinter SA | | | 0.63 | | | | 10-6-2027 | | | EUR | 300,000 | | | | 288,994 | |
Banque Federative du Credit Mutuel | | | 3.00 | | | | 5-21-2024 | | | EUR | 100,000 | | | | 110,957 | |
Barclays plc (GBP Swap Semi Annual (vs. 6 Month LIBOR) 1 Year +1.32%)± | | | 2.38 | | | | 10-6-2023 | | | GBP | 100,000 | | | | 120,415 | |
Bawag Group AG (5 Year EUR Swap +2.30%)± | | | 2.38 | | | | 3-26-2029 | | | EUR | 100,000 | | | | 99,500 | |
BNP Paribas | | | 1.25 | | | | 3-19-2025 | | | EUR | 200,000 | | | | 213,570 | |
Caixabank SA | | | 0.63 | | | | 10-1-2024 | | | EUR | 100,000 | | | | 100,773 | |
Credit Agricole London | | | 1.38 | | | | 3-13-2025 | | | EUR | 200,000 | | | | 214,235 | |
Credit Suisse (5 Year EUR Swap +4.00%)± | | | 5.75 | | | | 9-18-2025 | | | EUR | 200,000 | | | | 216,462 | |
DBS Group Holdings Limited (5 Year EUR Swap +1.20%)± | | | 1.50 | | | | 4-11-2028 | | | EUR | 100,000 | | | | 106,229 | |
FCA Bank SpA | | | 1.63 | | | | 9-29-2021 | | | GBP | 100,000 | | | | 121,764 | |
Hamburg Commercial Bank | | | 0.50 | | | | 5-23-2022 | | | EUR | 100,000 | | | | 106,982 | |
Jyske Bank AS (5 Year EUR Swap +1.90%)± | | | 2.25 | | | | 4-5-2029 | | | EUR | 200,000 | | | | 215,715 | |
Kutxabank SA | | | 0.50 | | | | 9-25-2024 | | | EUR | 100,000 | | | | 102,865 | |
Landesbank Baden-Wurttemberg (5 Year EUR Swap +1.77%)± | | | 2.88 | | | | 5-27-2026 | | | EUR | 100,000 | | | | 108,410 | |
Landsbankinn HF | | | 1.38 | | | | 3-14-2022 | | | EUR | 100,000 | | | | 109,220 | |
Lloyds Banking Group plc (1 Year EUR Swap +0.85%)± | | | 0.50 | | | | 11-12-2025 | | | EUR | 100,000 | | | | 99,858 | |
Lloyds Banking Group plc | | | 2.25 | | | | 10-16-2024 | | | GBP | 100,000 | | | | 119,849 | |
Mizuho Financial Group | | | 0.80 | | | | 4-15-2030 | | | EUR | 600,000 | | | | 563,696 | |
NIBC Bank NV | | | 2.00 | | | | 4-9-2024 | | | EUR | 200,000 | | | | 216,692 | |
Omnicom Finance Holdings plc | | | 1.40 | | | | 7-8-2031 | | | EUR | 100,000 | | | | 100,065 | |
Royal Bank of Canada | | | 1.97 | | | | 3-2-2022 | | | CAD | 200,000 | | | | 141,747 | |
Royal Bank of Canada | | | 2.00 | | | | 3-21-2022 | | | CAD | 400,000 | | | | 283,650 | |
Royal Bank of Scotland Group plc (GBP Swap Semi Annual (vs. 6 Month LIBOR) 1 Year +1.49%)± | | | 2.88 | | | | 9-19-2026 | | | GBP | 200,000 | | | | 241,233 | |
Tesco Personal Finance Group plc | | | 3.50 | | | | 7-25-2025 | | | GBP | 100,000 | | | | 120,637 | |
Toronto Dominion Bank | | | 3.23 | | | | 7-24-2024 | | | CAD | 1,000,000 | | | | 745,172 | |
Unicaja Banco SA (5 Year EUR Swap +3.11%)± | | | 2.88 | | | | 11-13-2029 | | | EUR | 100,000 | | | | 91,312 | |
Unicredit SpA (5 Year EUR Swap +2.80%)± | | | 2.73 | | | | 1-15-2032 | | | EUR | 200,000 | | | | 175,444 | |
| | | | |
| | | | | | | | | | | | | | | 5,954,752 | |
| | | | | | | | | | | | | | | | |
|
| Capital Markets: 0.65% | |
Deutsche Bank AG | | | 0.38 | | | | 1-18-2021 | | | EUR | 200,000 | | | | 214,708 | |
UBS Group AG (1 Year EUR Swap +0.55%)± | | | 0.25 | | | | 1-29-2026 | | | EUR | 200,000 | | | | 200,644 | |
| | | | |
| | | | | | | | | | | | | | | 415,352 | |
| | | | | | | | | | | | | | | | |
|
| Consumer Finance: 1.23% | |
CPUK Finance Limited | | | 7.24 | | | | 2-28-2024 | | | GBP | 100,000 | | | | 138,597 | |
LeasePlan Corporation NV | | | 1.38 | | | | 3-7-2024 | | | EUR | 100,000 | | | | 107,292 | |
PSA Banque France | | | 0.63 | | | | 6-21-2024 | | | EUR | 200,000 | | | | 206,221 | |
Transurban Finance Company | | | 1.75 | | | | 3-29-2028 | | | EUR | 300,000 | | | | 328,924 | |
| | | | |
| | | | | | | | | | | | | | | 781,034 | |
| | | | | | | | | | | | | | | | |
|
| Diversified Financial Services: 1.49% | |
Bevco Lux Sarl | | | 1.75 | | | | 2-9-2023 | | | EUR | 200,000 | | | | 216,335 | |
FCE Bank plc | | | 1.88 | | | | 6-24-2021 | | | EUR | 300,000 | | | | 304,400 | |
Nykredit Realkredit AS | | | 0.88 | | | | 1-17-2024 | | | EUR | 200,000 | | | | 209,921 | |
SELP Finance Sarl | | | 1.50 | | | | 11-20-2025 | | | EUR | 200,000 | | | | 217,132 | |
| | | | |
| | | | | | | | | | | | | | | 947,788 | |
| | | | | | | | | | | | | | | | |
The accompanying notes are an integral part of these financial statements.
Wells Fargo Global Investment Grade Credit Fund | 11
Portfolio of investments—March 31, 2020 (unaudited)
| | | | | | | | | | | | | | | | |
| | | Interest
rate | | | Maturity
date | | | Principal | | | Value | |
| Insurance: 3.03% | |
Aviva plc (5 Year EUR Swap +5.13%)± | | | 6.13 | % | | | 7-5-2043 | | | EUR | 100,000 | | | $ | 120,049 | |
Aviva plc (ICE LIBOR GBP 6 Month +4.14%)± | | | 6.63 | | | | 6-3-2041 | | | GBP | 200,000 | | | | 258,672 | |
Legal & General Group plc (U.S. Treasury 3 Month Bill +9.33%)± | | | 10.00 | | | | 7-23-2041 | | | GBP | 200,000 | | | | 270,340 | |
Liberty Mutual Finance Europe Designated Activity Company | | | 1.75 | | | | 3-27-2024 | | | EUR | 100,000 | | | | 109,252 | |
Mandatum Life Insurance Company Limited (3 Month EURIBOR +2.30%)± | | | 1.88 | | | | 10-4-2049 | | | EUR | 200,000 | | | | 194,121 | |
Munich Re Group (ICE LIBOR GBP 3 Month +4.95%)± | | | 6.63 | | | | 5-26-2042 | | | GBP | 100,000 | | | | 133,762 | |
Sampo Oyj | | | 1.63 | | | | 2-21-2028 | | | EUR | 200,000 | | | | 218,228 | |
Sampo Oyj (3 Month EURIBOR +4.05%)± | | | 3.38 | | | | 5-23-2049 | | | EUR | 200,000 | | | | 218,498 | |
Swiss Re Finance (Luxembourg) SA (EURIBOR ICE Swap Rate 11:00am +2.85%)± | | | 2.53 | | | | 4-30-2050 | | | EUR | 200,000 | | | | 204,814 | |
UMG Groupe VYV | | | 1.63 | | | | 7-2-2029 | | | EUR | 200,000 | | | | 204,707 | |
| | | | |
| | | | | | | | | | | | | | | 1,932,443 | |
| | | | | | | | | | | | | | | | |
|
| Mortgage REITs: 0.36% | |
Digital Euro Finco LLC | | | 2.63 | | | | 4-15-2024 | | | EUR | 200,000 | | | | 227,927 | |
| | | | | | | | | | | | | | | | |
|
| Thrifts & Mortgage Finance: 0.34% | |
Aareal Bank AG (5 Year EUR Swap +2.90%)± | | | 4.25 | | | | 3-18-2026 | | | EUR | 200,000 | | | | 214,741 | |
| | | | | | | | | | | | | | | | |
|
Health Care: 0.91% | |
|
| Health Care Equipment & Supplies: 0.28% | |
Motability Operations Group plc | | | 2.38 | | | | 7-3-2039 | | | GBP | 150,000 | | | | 179,892 | |
| | | | | | | | | | | | | | | | |
|
| Pharmaceuticals: 0.63% | |
Bayer AG (EURIBOR ICE Swap Rate 11:00am +2.65%)± | | | 2.38 | | | | 11-12-2079 | | | EUR | 100,000 | | | | 97,191 | |
Bayer AG (5 Year EUR Swap +3.11%)± | | | 3.13 | | | | 11-12-2079 | | | EUR | 100,000 | | | | 101,301 | |
Merck KGaA (EURIBOR ICE Swap Rate 11:00am +1.95%)± | | | 1.63 | | | | 6-25-2079 | | | EUR | 200,000 | | | | 199,393 | |
| | | | |
| | | | | | | | | | | | | | | 397,885 | |
| | | | | | | | | | | | | | | | |
|
Industrials: 0.88% | |
|
| Containers & Packaging: 0.17% | |
Brambles Finance plc | | | 1.50 | | | | 10-4-2027 | | | EUR | 100,000 | | | | 110,932 | |
| | | | | | | | | | | | | | | | |
|
| Industrial Conglomerates: 0.71% | |
CK Hutchison Group Company | | | 1.50 | | | | 10-17-2031 | | | EUR | 200,000 | | | | 199,872 | |
DH Europe Finance SA | | | 0.20 | | | | 3-18-2026 | | | EUR | 150,000 | | | | 152,826 | |
DH Europe Finance SA | | | 0.45 | | | | 3-18-2028 | | | EUR | 100,000 | | | | 98,618 | |
| | | | |
| | | | | | | | | | | | | | | 451,316 | |
| | | | | | | | | | | | | | | | |
|
Information Technology: 0.51% | |
|
| IT Services: 0.51% | |
Edenred | | | 1.88 | | | | 3-6-2026 | | | EUR | 100,000 | | | | 113,504 | |
Worldline SA | | | 0.25 | | | | 9-18-2024 | | | EUR | 200,000 | | | | 209,286 | |
| | | | |
| | | | | | | | | | | | | | | 322,790 | |
| | | | | | | | | | | | | | | | |
|
Materials: 2.17% | |
|
| Chemicals: 1.83% | |
Arkema SA (5 Year EUR Swap +1.57%)±(s) | | | 1.50 | | | | 10-21-2025 | | | EUR | 500,000 | | | | 456,718 | |
Arkema SA (5 Year EUR Swap +2.87%)±(s) | | | 2.75 | | | | 6-17-2024 | | | EUR | 200,000 | | | | 198,471 | |
Sika Capital BV | | | 0.88 | | | | 4-29-2027 | | | EUR | 200,000 | | | | 203,371 | |
Sika Capital BV | | | 1.50 | | | | 4-29-2031 | | | EUR | 200,000 | | | | 199,356 | |
The accompanying notes are an integral part of these financial statements.
12 | Wells Fargo Global Investment Grade Credit Fund
Portfolio of investments—March 31, 2020 (unaudited)
| | | | | | | | | | | | | | | | |
| | | Interest
rate | | | Maturity
date | | | Principal | | | Value | |
| Chemicals (continued) | |
Solvay SA (5 Year EUR Swap +3.92%)±(s) | | | 4.25 | % | | | 12-4-2023 | | | EUR | 100,000 | | | $ | 109,266 | |
| | | | |
| | | | | | | | | | | | | | | 1,167,182 | |
| | | | | | | | | | | | | | | | |
|
| Paper & Forest Products: 0.34% | |
Mondi Finance plc | | | 1.63 | | | | 4-27-2026 | | | EUR | 200,000 | | | | 213,456 | |
| | | | | | | | | | | | | | | | |
|
Real Estate: 1.61% | |
|
| Equity REITs: 0.68% | |
Inmobiliaria Colonial SA | | | 1.45 | | | | 10-28-2024 | | | EUR | 400,000 | | | | 435,254 | |
| | | | | | | | | | | | | | | | |
|
| Real Estate Management & Development: 0.93% | |
Akelius Residential Property AB (5 Year EUR Swap +2.48%)± | | | 2.25 | | | | 5-17-2081 | | | EUR | 200,000 | | | | 181,351 | |
Akelius Residential Property AB | | | 3.88 | | | | 10-5-2078 | | | EUR | 200,000 | | | | 199,217 | |
Heimstaden Bostad AB | | | 1.13 | | | | 1-21-2026 | | | EUR | 200,000 | | | | 211,485 | |
| | | | |
| | | | | | | | | | | | | | | 592,053 | |
| | | | | | | | | | | | | | | | |
|
Utilities: 2.74% | |
|
| Electric Utilities: 2.57% | |
Electricite de France SA (12 Year EUR Swap +3.79%)± | | | 5.38 | | | | 1-29-2049 | | | EUR | 200,000 | | | | 225,350 | |
Electricite de France SA | | | 5.50 | | | | 10-17-2041 | | | GBP | 200,000 | | | | 335,076 | |
Enel Finance International NV | | | 0.38 | | | | 6-17-2027 | | | EUR | 100,000 | | | | 102,492 | |
Energias De Portugal SA (5 Year EUR Swap +1.84%)± | | | 1.70 | | | | 7-20-2080 | | | EUR | 100,000 | | | | 97,894 | |
ESB Finance Designated Activity Company | | | 1.13 | | | | 6-11-2030 | | | EUR | 200,000 | | | | 215,192 | |
Fortum Oyj | | | 0.88 | | | | 2-27-2023 | | | EUR | 300,000 | | | | 326,281 | |
Orsted A/S (EURIBOR ICE Swap Rate 11:00am +1.95%)±(s) | | | 1.75 | | | | 9-9-2027 | | | EUR | 100,000 | | | | 97,715 | |
Reseau de Transport d’Electricite | | | 1.88 | | | | 10-23-2037 | | | EUR | 200,000 | | | | 234,834 | |
| | | | |
| | | | | | | | | | | | | | | 1,634,834 | |
| | | | | | | | | | | | | | | | |
|
| Water Utilities: 0.17% | |
FCC Aqualia SA | | | 1.41 | | | | 6-8-2022 | | | EUR | 100,000 | | | | 110,114 | |
| | | | | | | | | | | | | | | | |
| |
Total Foreign Corporate Bonds and Notes (Cost $19,542,192) | | | | 17,935,027 | |
| | | | | | | | | | | | | | | | |
|
Municipal Obligations: 0.38% | |
|
New Jersey: 0.38% | |
|
| Transportation Revenue: 0.38% | |
New Jersey State Transportation Trust Fund Authority Transportation System Refunding Bond Series B | | | 4.13 | | | | 6-15-2042 | | | $ | 250,000 | | | | 242,060 | |
| | | | | | | | | | | | | | | | |
| |
Total Municipal Obligations (Cost $250,000) | | | | 242,060 | |
| | | | | | | | | | | | | | | | |
|
Yankee Corporate Bonds and Notes: 13.43% | |
|
Communication Services: 2.73% | |
|
| Diversified Telecommunication Services: 0.73% | |
Telefonica Emisiones SAU | | | 4.10 | | | | 3-8-2027 | | | | 450,000 | | | | 466,704 | |
| | | | | | | | | | | | | | | | |
|
| Interactive Media & Services: 1.14% | |
Tencent Holdings Limited 144A | | | 3.60 | | | | 1-19-2028 | | | | 685,000 | | | | 725,051 | |
| | | | | | | | | | | | | | | | |
|
| Wireless Telecommunication Services: 0.86% | |
Vodafone Group plc | | | 4.38 | | | | 5-30-2028 | | | | 525,000 | | | | 551,968 | |
| | | | | | | | | | | | | | | | |
The accompanying notes are an integral part of these financial statements.
Wells Fargo Global Investment Grade Credit Fund | 13
Portfolio of investments—March 31, 2020 (unaudited)
| | | | | | | | | | | | | | | | |
| | | Interest
rate | | | Maturity
date | | | Principal | | | Value | |
Consumer Staples: 1.01% | |
|
| Household Products: 0.86% | |
Reckitt Benckiser Treasury Services plc 144A | | | 2.75 | % | | | 6-26-2024 | | | $ | 555,000 | | | $ | 549,993 | |
| | | | | | | | | | | | | | | | |
|
| Tobacco: 0.15% | |
Imperial Brands Finance plc 144A | | | 3.50 | | | | 7-26-2026 | | | | 100,000 | | | | 92,317 | |
| | | | | | | | | | | | | | | | |
|
Energy: 0.12% | |
|
| Oil, Gas & Consumable Fuels: 0.12% | |
Saudi Arabian Oil Company 144A | | | 4.38 | | | | 4-16-2049 | | | | 75,000 | | | | 74,521 | |
| | | | | | | | | | | | | | | | |
|
Financials: 8.80% | |
|
| Banks: 5.71% | |
Banco Santander SA (3 Month LIBOR +1.56%)± | | | 3.41 | | | | 4-11-2022 | | | | 600,000 | | | | 574,500 | |
Credit Suisse New York | | | 3.63 | | | | 9-9-2024 | | | | 580,000 | | | | 612,652 | |
HSBC Holdings plc | | | 4.30 | | | | 3-8-2026 | | | | 430,000 | | | | 459,028 | |
ING Groep NV (3 Month LIBOR +1.15%)± | | | 2.52 | | | | 3-29-2022 | | | | 290,000 | | | | 279,625 | |
Royal Bank of Scotland Group plc | | | 3.88 | | | | 9-12-2023 | | | | 490,000 | | | | 494,967 | |
Sumitomo Mitsui Financial Group | | | 2.06 | | | | 7-14-2021 | | | | 375,000 | | | | 371,903 | |
Sumitomo Mitsui Financial Group | | | 3.10 | | | | 1-17-2023 | | | | 445,000 | | | | 445,542 | |
Westpac Banking Corporation | | | 3.65 | | | | 5-15-2023 | | | | 385,000 | | | | 401,461 | |
| | | | |
| | | | | | | | | | | | | | | 3,639,678 | |
| | | | | | | | | | | | | | | | |
|
| Capital Markets: 0.43% | |
Macquarie Group Limited (3 Month LIBOR +1.02%)±144A | | | 3.19 | | | | 11-28-2023 | | | | 265,000 | | | | 271,539 | |
| | | | | | | | | | | | | | | | |
|
| Diversified Financial Services: 2.31% | |
GE Capital International Funding Company | | | 4.42 | | | | 11-15-2035 | | | | 280,000 | | | | 302,504 | |
Invesco Finance plc | | | 3.13 | | | | 11-30-2022 | | | | 505,000 | | | | 504,350 | |
Siemens Financieringsmaatschappij NV 144A | | | 2.35 | | | | 10-15-2026 | | | | 380,000 | | | | 382,951 | |
WPP Finance Limited 2010 | | | 3.75 | | | | 9-19-2024 | | | | 280,000 | | | | 284,618 | |
| | | | |
| | | | | | | | | | | | | | | 1,474,423 | |
| | | | | | | | | | | | | | | | |
|
| Insurance: 0.35% | |
Allied World Assurance Company Holdings Limited | | | 4.35 | | | | 10-29-2025 | | | | 216,000 | | | | 220,565 | |
| | | | | | | | | | | | | | | | |
|
Information Technology: 0.77% | |
|
| Semiconductors & Semiconductor Equipment: 0.77% | |
NXP BV 144A | | | 3.88 | | | | 6-18-2026 | | | | 505,000 | | | | 491,170 | |
| | | | | | | | | | | | | | | | |
| |
Total Yankee Corporate Bonds and Notes (Cost $8,480,637) | | | | 8,557,929 | |
| | | | | | | | | | | | | | | | |
| | | | |
| | | | | | | | | | | | | | | | |
| | | Yield | | | | | | Shares | | | | |
| Short-Term Investments: 0.72% | |
|
| Investment Companies: 0.72% | |
Wells Fargo Government Money Market Fund Select Class (l)(u) | | | 0.35 | | | | | | | | 462,060 | | | | 462,060 | |
| | | | | | | | | | | | | | | | |
| |
Total Short-Term Investments (Cost $462,060) | | | | 462,060 | |
| | | | | | | | | | | | | | | | |
| | | | | | | | |
| Total investments in securities (Cost $64,923,224) | | | 99.01 | % | | | 63,090,731 | |
| | |
Other assets and liabilities, net | | | 0.99 | | | | 631,166 | |
| | | | | | | | |
| Total net assets | | | 100.00 | % | | $ | 63,721,897 | |
| | | | | | | | |
The accompanying notes are an integral part of these financial statements.
14 | Wells Fargo Global Investment Grade Credit Fund
Portfolio of investments—March 31, 2020 (unaudited)
| 144A | The security may be resold in transactions exempt from registration, normally to qualified institutional buyers, pursuant to Rule 144A under the Securities Act of 1933. |
| ± | Variable rate investment. The rate shown is the rate in effect at period end. |
| (s) | Security is perpetual in nature and has no stated maturity date. The date shown reflects the next call date. |
| (l) | The issuer of the security is an affiliated person of the Fund as defined in the Investment Company Act of 1940. |
| (u) | The rate represents the7-day annualized yield at period end. |
Abbreviation:
| EURIBOR | Euro Interbank Offered Rate |
| LIBOR | London Interbank Offered Rate |
| REIT | Real estate investment trust |
Forward Foreign Currency Contracts
| | | | | | | | | | | | | | |
Currency to be
received | | Currency to be
delivered | | Counterparty | | Settlement
date | | Unrealized
gains | | | Unrealized
losses | |
| | | | | |
| 2,830,908 USD | | 2,380,000 GBP | | State Street Bank | | 5-28-2020 | | $ | 0 | | | $ | (128,464 | ) |
| | | | | |
| 210,000 USD | | 175,729 GBP | | State Street Bank | | 5-28-2020 | | | 0 | | | | (8,508 | ) |
| | | | | |
| 14,828,798 USD | | 13,700,000 EUR | | State Street Bank | | 5-28-2020 | | | 0 | | | | (313,612 | ) |
| | | | | |
| 1,266,840 USD | | 1,800,000 CAD | | State Street Bank | | 5-28-2020 | | | 0 | | | | (12,901 | ) |
| | | | | | | | | | | | | | |
| | | | | |
| | | | | | | | $ | 0 | | | $ | (463,485 | ) |
| | | | | | | | | | | | | | |
Investments in Affiliates
An affiliated investment is an investment in which the Fund owns at least 5% of the outstanding voting shares of the issuer or as a result of other relationships, such as the Fund and the issuer having the same investment manager. Transactions with issuers that were either affiliated persons of the Fund at the beginning of the period or the end of the period were as follows:
| | | | | | | | | | | | | | | | | | | | | | | | | | | | | | | | | | | | |
| | | Shares,
beginning of
period | | | Shares
purchased | | | Shares
sold | | | Shares,
end of
period | | | Net
realized
gains
(losses) | | | Net
change in
unrealized
gains
(losses) | | | Income
from
affiliated
securities | | | Value,
end of
period | | | % of
net
assets | |
| | | | | | | | | |
| Short-Term Investments | | | | | | | | | | | | | | | | | | | | | | | | | | | |
Investment Companies | | | | | | | | | | | | | | | | | | | | | | | | | | | | | | | | | | | | |
Wells Fargo Government Money Market Fund Select Class | | | 1,834,198 | | | | 8,596,715 | | | | (9,968,853 | ) | | | 462,060 | | | $ | 0 | | | $ | 0 | | | $ | 5,642 | | | $ | 462,060 | | | | 0.72 | % |
The accompanying notes are an integral part of these financial statements.
Wells Fargo Global Investment Grade Credit Fund | 15
Statement of assets and liabilities—March 31, 2020 (unaudited)
| | | | |
| | | | |
| |
Assets | | | | |
Investments in unaffiliated securities, at value (cost $64,461,164) | | $ | 62,628,671 | |
Investments in affiliated securities, at value (cost $462,060) | | | 462,060 | |
Foreign currency, at value (cost $39,744) | | | 40,964 | |
Receivable for investments sold | | | 522,706 | |
Receivable for interest | | | 610,369 | |
Receivable from manager | | | 323 | |
Prepaid expenses and other assets | | | 5,845 | |
| | | | |
Total assets | | | 64,270,938 | |
| | | | |
| |
Liabilities | | | | |
Unrealized losses on forward foreign currency contracts | | | 463,485 | |
Administration fees payable | | | 1,682 | |
Professional fees payable | | | 28,430 | |
Trustees’ fees and expenses payable | | | 3,770 | |
Accrued expenses and other liabilities | | | 51,674 | |
| | | | |
Total liabilities | | | 549,041 | |
| | | | |
Total net assets | | $ | 63,721,897 | |
| | | | |
| |
Net assets consist of | | | | |
Paid-in capital | | $ | 64,376,035 | |
Total distributable loss | | | (654,138 | ) |
| | | | |
Total net assets | | $ | 63,721,897 | |
| | | | |
| |
Computation of net asset value per share | | | | |
Net assets – Class R6 | | $ | 63,696,932 | |
Shares outstanding – Class R61 | | | 6,377,961 | |
Net asset value per share – Class R6 | | | $9.99 | |
Net assets – Institutional Class | | $ | 24,965 | |
Shares outstanding – Institutional Class1 | | | 2,500 | |
Net asset value per share – Institutional Class | | | $9.99 | |
| 1 | The Fund has an unlimited number of authorized shares. |
The accompanying notes are an integral part of these financial statements.
16 | Wells Fargo Global Investment Grade Credit Fund
Statement of operations—six months ended March 31, 2020 (unaudited)
| | | | |
| | | | |
| |
Investment income | | | | |
Interest | | $ | 1,037,899 | |
Income from affiliated securities | | | 5,642 | |
| | | | |
Total investment income | | | 1,043,541 | |
| | | | |
| |
Expenses | | | | |
Management fee | | | 146,457 | |
Administration fees | | | | |
Class R6 | | | 10,980 | |
Institutional Class | | | 11 | |
Custody and accounting fees | | | 18,049 | |
Professional fees | | | 43,228 | |
Registration fees | | | 31,686 | |
Shareholder report expenses | | | 22,317 | |
Trustees’ fees and expenses | | | 11,028 | |
Other fees and expenses | | | 14,541 | |
| | | | |
Total expenses | | | 298,297 | |
Less: Fee waivers and/or expense reimbursements | | | | |
Fund-level | | | (133,526 | ) |
Institutional Class | | | (1 | ) |
| | | | |
Net expenses | | | 164,770 | |
| | | | |
Net investment income | | | 878,771 | |
| | | | |
| |
Realized and unrealized gains (losses) on investments | | | | |
Net realized gains on | | | | |
Unaffiliated securities | | | 553,357 | |
Forward foreign currency contracts | | | 815,886 | |
| | | | |
Net realized gains on investments | | | 1,369,243 | |
| | | | |
| |
Net change in unrealized gains (losses) on | | | | |
Unaffiliated securities | | | (4,234,383 | ) |
Forward foreign currency contracts | | | (875,050 | ) |
| | | | |
Net change in unrealized gains (losses) on investments | | | (5,109,433 | ) |
| | | | |
Net realized and unrealized gains (losses) on investments | | | (3,740,190 | ) |
| | | | |
Net decrease in net assets resulting from operations | | $ | (2,861,419 | ) |
| | | | |
The accompanying notes are an integral part of these financial statements.
Wells Fargo Global Investment Grade Credit Fund | 17
Statement of changes in net assets
| | | | | | | | | | | | | | | | |
| | | Six months ended
March 31, 2020 (unaudited) | | | Year ended
September 30, 20191 | |
| |
Operations | | | | | |
Net investment income | | | | | | $ | 878,771 | | | | | | | $ | 891,407 | |
Net realized gains on investments | | | | | | | 1,369,243 | | | | | | | | 1,479,319 | |
Net change in unrealized gains (losses) on investments | | | | | | | (5,109,433 | ) | | | | | | | 2,812,716 | |
| | | | |
Net increase (decrease) in net assets resulting from operations | | | | | | | (2,861,419 | ) | | | | | | | 5,183,442 | |
| | | | |
| | | | |
Distributions to shareholders from net investment income and net realized gains | | | | | | | | | | | | | | | | |
Class R6 | | | | | | | (2,247,330 | ) | | | | | | | (727,723 | ) |
Institutional Class | | | | | | | (829 | ) | | | | | | | (279 | ) |
| | | | |
Total distributions to shareholders | | | | | | | (2,248,159 | ) | | | | | | | (728,002 | ) |
| | | | |
| | | | |
Capital share transactions | | | Shares | | | | | | | | Shares | | | | | |
Proceeds from shares sold | | | | | | | | | | | | | | | | |
Class R6 | | | 176,643 | | | | 1,813,591 | | | | 9,630,811 | | | | 99,080,247 | |
Institutional Class | | | 0 | | | | 0 | | | | 2,500 | | | | 25,000 | |
| | | | |
| | | | | | | 1,813,591 | | | | | | | | 99,105,247 | |
| | | | |
Reinvestment of distributions | | | | | | | | | | | | | | | | |
Class R6 | | | 141,763 | | | | 1,492,541 | | | | 20,783 | | | | 222,474 | |
| | | | |
Payment for shares redeemed | | | | | | | | | | | | | | | | |
Class R6 | | | (2,946,367 | ) | | | (31,336,923 | ) | | | (645,672 | ) | | | (6,920,895 | ) |
| | | | |
Net increase (decrease) in net assets resulting from capital share transactions | | | | | | | (28,030,791 | ) | | | | | | | 92,406,826 | |
| | | | |
Total increase (decrease) in net assets | | | | | | | (33,140,369 | ) | | | | | | | 96,862,266 | |
| | | | |
| | |
Net assets | | | | | | | | |
Beginning of period | | | | | | | 96,862,266 | | | | | | | | 0 | |
| | | | |
End of period | | | | | | $ | 63,721,897 | | | | | | | $ | 96,862,266 | |
| | | | |
| 1 | For the period from February 28, 2019 (commencement of operations) to September 30, 2019 |
The accompanying notes are an integral part of these financial statements.
18 | Wells Fargo Global Investment Grade Credit Fund
Financial highlights
(For a share outstanding throughout each period)
| | | | | | | | |
| | | Six months ended
March 31, 2020
(unaudited) | | | Year ended
September 30, 20191 | |
| CLASS R6 |
Net asset value, beginning of period | | | $10.75 | | | | $10.00 | |
Net investment income | | | 0.18 | | | | 0.13 | |
Net realized and unrealized gains (losses) on investments | | | (0.61 | ) | | | 0.73 | |
| | | | | | | | |
Total from investment operations | | | (0.43 | ) | | | 0.86 | |
Distributions to shareholders from | | | | | | | | |
Net investment income | | | (0.20 | ) | | | (0.11 | ) |
Net realized gains | | | (0.13 | ) | | | 0.00 | |
| | | | | | | | |
Total distributions to shareholders | | | (0.33 | ) | | | (0.11 | ) |
Net asset value, end of period | | | $9.99 | | | | $10.75 | |
Total return2 | | | (4.08 | )% | | | 8.64 | % |
Ratios to average net assets (annualized) | | | | | | | | |
Gross expenses | | | 0.81 | % | | | 0.86 | % |
Net expenses | | | 0.45 | % | | | 0.45 | % |
Net investment income | | | 2.40 | % | | | 2.34 | % |
Supplemental data | | | | | | | | |
Portfolio turnover rate | | | 23 | % | | | 36 | % |
Net assets, end of period (000s omitted) | | | $63,697 | | | | $96,835 | |
| 1 | For the period from February 28, 2019 (commencement of class operations) to September 30, 2019 |
| 2 | Total return calculations do not include any sales charges. Returns for periods of less than one year are not annualized. |
The accompanying notes are an integral part of these financial statements.
Wells Fargo Global Investment Grade Credit Fund | 19
Financial highlights
(For a share outstanding throughout each period)
| | | | | | | | |
| | | Six months ended
March 31, 2020
(unaudited) | | | Year ended
September 30, 20191 | |
| INSTITUTIONAL CLASS |
Net asset value, beginning of period | | | $10.75 | | | | $10.00 | |
Net investment income | | | 0.12 | | | | 0.14 | |
Net realized and unrealized gains (losses) on investments | | | (0.55 | ) | | | 0.72 | |
| | | | | | | | |
Total from investment operations | | | (0.43 | ) | | | 0.86 | |
Distributions to shareholders from | | | | | | | | |
Net investment income | | | (0.20 | ) | | | (0.11 | ) |
Net realized gains | | | (0.13 | ) | | | 0.00 | |
| | | | | | | | |
Total distributions to shareholders | | | (0.33 | ) | | | (0.11 | ) |
Net asset value, end of period | | | $9.99 | | | | $10.75 | |
Total return2 | | | (4.11 | )% | | | 8.64 | % |
Ratios to average net assets (annualized) | | | | | | | | |
Gross expenses | | | 0.87 | % | | | 0.97 | % |
Net expenses | | | 0.50 | % | | | 0.50 | % |
Net investment income | | | 2.35 | % | | | 2.34 | % |
Supplemental data | | | | | | | | |
Portfolio turnover rate | | | 23 | % | | | 36 | % |
Net assets, end of period (000s omitted) | | | $25 | | | | $27 | |
| 1 | For the period from February 28, 2019 (commencement of class operations) to September 30, 2019 |
| 2 | Total return calculations do not include any sales charges. Returns for periods of less than one year are not annualized. |
The accompanying notes are an integral part of these financial statements.
20 | Wells Fargo Global Investment Grade Credit Fund
Notes to financial statements
1. ORGANIZATION
Wells Fargo Funds Trust (the “Trust”), a Delaware statutory trust organized on March 10, 1999, is anopen-end management investment company registered under the Investment Company Act of 1940, as amended (the “1940 Act”). As an investment company, the Trust follows the accounting and reporting guidance in Financial Accounting Standards Board (“FASB”)Accounting Standards Codification Topic 946, Financial Services – Investment Companies. These financial statements report on the Wells Fargo Global Investment Grade Credit Fund (the “Fund”) which is a diversified series of the Trust.
2. SIGNIFICANT ACCOUNTING POLICIES
The following significant accounting policies, which are consistently followed in the preparation of the financial statements of the Fund, are in conformity with U.S. generally accepted accounting principles which require management to make estimates and assumptions that affect the reported amounts of assets and liabilities, disclosure of contingent assets and liabilities at the date of the financial statements, and the reported amounts of revenues and expenses during the reporting period. Actual results could differ from those estimates.
Securities valuation
All investments are valued each business day as of the close of regular trading on the New York Stock Exchange (generally 4 p.m. Eastern Time), although the Fund may deviate from this calculation time under unusual or unexpected circumstances.
Debt securities are valued at the evaluated bid price provided by an independent pricing service (e.g. taking into account various factors, including yields, maturities, or credit ratings) or, if a reliable price is not available, the quoted bid price from an independent broker-dealer.
Forward foreign currency contracts are recorded at the forward rate provided by an independent foreign currency pricing source at a time each business day specified by the Wells Fargo Asset Management Pricing Committee at Wells Fargo Funds Management, LLC (“Funds Management”).
The values of securities denominated in foreign currencies are translated into U.S. dollars at rates provided by an independent foreign currency pricing source at a time each business day specified by the Wells Fargo Asset Management Pricing Committee.
Investments in registeredopen-end investment companies are valued at net asset value.
Investments which are not valued using any of the methods discussed above are valued at their fair value, as determined in good faith by the Board of Trustees of the Fund. The Board of Trustees has established a Valuation Committee comprised of the Trustees and has delegated to it the authority to take any actions regarding the valuation of portfolio securities that the Valuation Committee deems necessary or appropriate, including determining the fair value of portfolio securities, unless the determination has been delegated to the Wells Fargo Asset Management Pricing Committee. The Board of Trustees retains the authority to make or ratify any valuation decisions or approve any changes to the Valuation Procedures as it deems appropriate. On a quarterly basis, the Board of Trustees receives reports on any valuation actions taken by the Valuation Committee or the Wells Fargo Asset Management Pricing Committee which may include items for ratification.
Foreign currency translation
The accounting records of the Fund are maintained in U.S. dollars. The values of other assets and liabilities denominated in foreign currencies are translated into U.S. dollars at rates provided by an independent foreign currency pricing source at a time each business day specified by the Wells Fargo Asset Management Pricing Committee. Purchases and sales of securities, and income and expenses are converted at the rate of exchange on the respective dates of such transactions. Net realized foreign exchange gains or losses arise from sales of foreign currencies, currency gains or losses realized between the trade and settlement dates on securities transactions, and the difference between the amounts of dividends, interest and foreign withholding taxes recorded and the U.S. dollar equivalent of the amounts actually paid or received. Net unrealized foreign exchange gains and losses arise from changes in the fair value of assets and liabilities other than investments in securities resulting from changes in exchange rates. The changes in net assets arising from changes in exchange rates of securities and the changes in net assets resulting from changes in market prices of securities are not separately presented. Such changes are included in net realized and unrealized gains or losses from investments.
Forward foreign currency contracts
A forward foreign currency contract is an agreement between two parties to purchase or sell a specific currency for an agreed-upon price at a future date. The Fund enters into forward foreign currency contracts to facilitate transactions in foreign-denominated securities and to attempt to minimize the risk to the Fund from adverse changes in the relationship between currencies. Forward foreign currency contracts are recorded at the forward rate andmarked-to-market daily. When the
Wells Fargo Global Investment Grade Credit Fund | 21
Notes to financial statements
contracts are closed, realized gains and losses arising from such transactions are recorded as realized gains or losses on forward foreign currency contracts. The Fund is subject to foreign currency risk and may be exposed to risks if the counterparties to the contracts are unable to meet the terms of their contracts or if the value of the foreign currency changes unfavorably. The Fund’s maximum risk of loss from counterparty credit risk is the unrealized gains on the contracts. This risk may be mitigated if there is a master netting arrangement between the Fund and the counterparty.
When-issued transactions
The Fund may purchase securities on a forward commitment or when-issued basis. The Fund records a when-issued transaction on the trade date and will segregate assets in an amount at least equal in value to the Fund’s commitment to purchase when-issued securities. Securities purchased on a when-issued basis are marked-to-market daily and the Fund begins earning interest on the settlement date. Losses may arise due to changes in the market value of the underlying securities or if the counterparty does not perform under the contract.
Security transactions and income recognition
Securities transactions are recorded on a trade date basis. Realized gains or losses are recorded on the basis of identified cost.
Interest income is accrued daily and bond discounts are accreted and premiums are amortized daily. To the extent debt obligations are placed onnon-accrual status, any related interest income may be reduced by writing off interest receivables when the collection of all or a portion of interest has been determined to be doubtful based on consistently applied procedures and the fair value has decreased. If the issuer subsequently resumes interest payments or when the collectability of interest is reasonably assured, the debt obligation is removed fromnon-accrual status.
Distributions to shareholders
Distributions to shareholders are recorded on theex-dividend date and paid from net investment income monthly and any net realized gains are paid at least annually. Such distributions are determined in accordance with income tax regulations and may differ from U.S. generally accepted accounting principles. Dividend sources are estimated at the time of declaration. The tax character of distributions is determined as of the Fund’s fiscal year end. Therefore, a portion of the Fund’s distributions made prior to the Fund’s fiscal year end may be categorized as a tax return of capital at year end.
Federal and other taxes
The Fund intends to continue to qualify as a regulated investment company by distributing substantially all of its investment company taxable income and any net realized capital gains (after reduction for capital loss carryforwards) sufficient to relieve it from all, or substantially all, federal income taxes. Accordingly, no provision for federal income taxes was required.
The Fund’s income and federal excise tax returns and all financial records supporting those returns for the fiscal year since commencement of operations will be subject to examination by the federal and Delaware revenue authorities. Management has analyzed the Fund’s tax positions taken on federal, state, and foreign tax returns for all open tax years and does not believe that there are any uncertain tax positions that require recognition of a tax liability.
As of March 31, 2020, the aggregate cost of all investments for federal income tax purposes was $64,466,173 and the unrealized gains (losses) consisted of:
| | | | |
| |
Gross unrealized gains | | $ | 1,646,255 | |
| |
Gross unrealized losses | | | (3,485,182 | ) |
| |
Net unrealized losses | | $ | (1,838,927 | ) |
Class allocations
The separate classes of shares offered by the Fund differ principally in administration fees. Class specific expenses are charged directly to that share class. Investment income, common fund-level expenses, and realized and unrealized gains (losses) on investments are allocated daily to each class of shares based on the relative proportion of net assets of each class.
3. FAIR VALUATION MEASUREMENTS
Fair value measurements of investments are determined within a framework that has established a fair value hierarchy based upon the various data inputs utilized in determining the value of the Fund’s investments. The three-level hierarchy gives the highest priority to unadjusted quoted prices in active markets for identical assets or liabilities (Level 1) and the lowest priority to unobservable inputs (Level 3). The Fund’s investments are classified within the fair value hierarchy based on the lowest level of input that is significant to the fair value measurement. The inputs are summarized into three broad levels as follows:
22 | Wells Fargo Global Investment Grade Credit Fund
Notes to financial statements
| ∎ | | Level 1 – quoted prices in active markets for identical securities |
| ∎ | | Level 2 – other significant observable inputs (including quoted prices for similar securities, interest rates, prepayment speeds, credit risk, etc.) |
| ∎ | | Level 3 – significant unobservable inputs (including the Fund’s own assumptions in determining the fair value of investments) |
The inputs or methodologies used for valuing investments in securities are not necessarily an indication of the risk associated with investing in those securities.
The following is a summary of the inputs used in valuing the Fund’s assets and liabilities as of March 31, 2020:
| | | | | | | | | | | | | | | | |
| | | | |
| | | Quoted prices
(Level 1) | | | Other significant
observable inputs
(Level 2) | | | Significant
unobservable inputs (Level 3) | | | Total | |
| | | | |
Assets | | | | | | | | | | | | | | | | |
Investments in : | | | | | | | | | | | | | | | | |
| | | | |
Asset-backed securities | | $ | 0 | | | $ | 1,403,102 | | | $ | 0 | | | $ | 1,403,102 | |
| | | | |
Corporate bonds and notes | | | 0 | | | | 34,490,553 | | | | 0 | | | | 34,490,553 | |
| | | | |
Foreign corporate bonds and notes | | | 0 | | | | 17,935,027 | | | | 0 | | | | 17,935,027 | |
| | | | |
Municipal obligations | | | 0 | | | | 242,060 | | | | 0 | | | | 242,060 | |
| | | | |
Yankee corporate bonds and notes | | | 0 | | | | 8,557,929 | | | | 0 | | | | 8,557,929 | |
| | | | |
Short-term investments | | | | | | | | | | | | | | | | |
| | | | |
Investment companies | | | 462,060 | | | | 0 | | | | 0 | | | | 462,060 | |
| | | | |
Total assets | | $ | 462,060 | | | $ | 62,628,671 | | | $ | 0 | | | $ | 63,090,731 | |
| | | | |
Liabilities | | | | | | | | | | | | | | | | |
| | | | |
Forward foreign currency contracts | | $ | 0 | | | $ | 463,485 | | | $ | 0 | | | $ | 463,485 | |
| | | | |
Total liabilities | | $ | 0 | | | $ | 463,485 | | | $ | 0 | | | $ | 463,485 | |
Additional sector, industry or geographic detail is included in the Portfolio of Investments.
For the six months ended March 31, 2020, the Fund did not have any transfers into/out of Level 3.
4. TRANSACTIONS WITH AFFILIATES
Management fee
Funds Management, an indirect wholly owned subsidiary of Wells Fargo & Company (“Wells Fargo”), is the manager of the Fund and provides advisory and fund-level administrative services under an investment management agreement. Under the investment management agreement, Funds Management is responsible for, among other services, implementing the investment objectives and strategies of the Fund, supervising the subadviser and providing fund-level administrative services in connection with the Fund’s operations. As compensation for its services under the investment management agreement, Funds Management is entitled to receive a management fee at the following annual rate based on the Fund’s average daily net assets:
| | |
| |
| Average daily net assets | | Management fee |
| |
First $500 million | | 0.400% |
| |
Next $500 million | | 0.375 |
| |
Next $2 billion | | 0.350 |
| |
Next $2 billion | | 0.325 |
| |
Next $5 billion | | 0.290 |
| |
Over $10 billion | | 0.280 |
For the six months ended March 31, 2020, the management fee was equivalent to an annual rate of 0.40% of the Fund’s average daily net assets.
Funds Management has retained the services of subadvisers to provide daily portfolio management to the Fund. The fee for subadvisory services is borne by Funds Management. Wells Capital Management Incorporated and Wells Fargo Asset
Wells Fargo Global Investment Grade Credit Fund | 23
Notes to financial statements
Management (International) Limited, each an affiliate of Funds Management and an indirect wholly owned subsidiary of Wells Fargo, serve as subadvisers to the Fund and are each entitled to receive a fee from Funds Management at an annual rate starting at 0.10% and declining to 0.05% as the average daily net assets of the Fund increase.
Administration fees
Under a class-level administration agreement, Funds Management provides class-level administrative services to the Fund, which includes paying fees and expenses for services provided by the transfer agent,sub-transfer agents, omnibus account servicers and record-keepers. As compensation for its services under the class-level administration agreement, Funds Management receives an annual fee which is calculated based on the average daily net assets of each class as follows:
| | |
| |
| | | Class-level
administration fee |
| |
Class R6 | | 0.03% |
| |
Institutional Class | | 0.08 |
Waivers and/or expense reimbursements
Funds Management has contractually waived and/or reimbursed management and administration fees to the extent necessary to maintain certain net operating expense ratios for the Fund. When each class of the Fund has exceeded its expense cap, Funds Management has waived fees and/or reimbursed expenses from fund-level expenses on a proportionate basis and then from class specific expenses. When only certain classes exceed their expense caps, waivers and/or reimbursements are applied against class specific expenses before fund-level expenses. Funds Management has committed through January 31, 2021 to waive fees and/or reimburse expenses to the extent necessary to cap the Fund’s expenses at 0.45% for Class R6 shares and 0.50% for Institutional Class shares. Prior to or after the commitment expiration date, the cap may be increased or the commitment to maintain the cap may be terminated only with the approval of the Board of Trustees.
Interfund transactions
The Fund may purchase or sell portfolio investment securities to certain other Wells Fargo affiliates pursuant to Rule17a-7 under the 1940 Act and under procedures adopted by the Board of Trustees. The procedures have been designed to ensure that these interfund transactions, which do not incur broker commissions, are effected at current market prices.
5. INVESTMENT PORTFOLIO TRANSACTIONS
Purchases and sales of investments, excluding short-term securities, for the six months ended March 31, 2020 were as follows:
| | | | | | |
Purchases at cost | | Sales proceeds |
U.S.
government | | Non-U.S.
government | | U.S.
government | | Non-U.S.
government |
| $4,848,441 | | $12,188,704 | | $5,075,956 | | $39,013,476 |
6. DERIVATIVE TRANSACTIONS
During the six months ended March 31, 2020, the Fund entered into forward foreign currency contracts for hedging purposes. The Fund had average contract amounts of $502,512 and $25,080,758 in forward foreign currency contracts to buy and forward foreign currency contracts to sell, respectively, during the six months ended March 31, 2020.
The fair value, realized gains or losses and change in unrealized gains or losses, if any, on derivative instruments are reflected in the corresponding financial statement captions.
For certain types of derivative transactions, the Fund has entered into International Swaps and Derivatives Association, Inc. master agreements (“ISDA Master Agreements”) or similar agreements with approved counterparties. The ISDA Master Agreements or similar agreements may have requirements to deliver/deposit securities or cash to/with an exchange or broker-dealer as collateral and allows the Fund to offset, with each counterparty, certain derivative financial instrument’s assets and/or liabilities with collateral held or pledged. Collateral requirements differ by type of derivative. Collateral or margin requirements are set by the broker or exchange clearinghouse for exchange traded derivatives while collateral terms are contract specific forover-the-counter traded derivatives. Cash collateral that has been pledged to cover obligations of the Fund under ISDA Master Agreements or similar agreements, if any, are reported separately in the Statement of Assets and Liabilities. Securities pledged as collateral, if any, are noted in the Portfolio of Investments. With respect to balance sheet offsetting, absent an event of default by the counterparty or a termination of the agreement, the reported amounts of financial assets and financial liabilities
24 | Wells Fargo Global Investment Grade Credit Fund
Notes to financial statements
in the Statement of Assets and Liabilities are not offset across transactions between the Fund and the applicable counterparty. A reconciliation of the gross amounts on the Statement of Assets and Liabilities to the net amounts by counterparty, including any collateral exposure, for OTC derivatives is as follows:
| | | | | | | | | | | | |
| | | | |
| Counterparty | | Gross amounts
of liabilities in the
Statement of
Assets and
Liabilities | | Amounts
subject to
netting
agreements | | Collateral
pledged | | | Net amount
of liabilities | |
| | | | |
State Street Bank | | $463,485 | | $0 | | $ | 0 | | | $ | 463,485 | |
7. BANK BORROWINGS
The Trust (excluding the money market funds), Wells Fargo Master Trust and Wells Fargo Variable Trust are parties to a $280,000,000 revolving credit agreement whereby the Fund is permitted to use bank borrowings for temporary or emergency purposes, such as to fund shareholder redemption requests. Interest under the credit agreement is charged to the Fund based on a borrowing rate equal to the higher of the Federal Funds rate in effect on that day plus 1.25% or the overnight LIBOR rate in effect on that day plus 1.25%. In addition, an annual commitment fee equal to 0.25% of the unused balance is allocated to each participating fund.
For the six months ended March 31, 2020, there were no borrowings by the Fund under the agreement.
8. INDEMNIFICATION
Under the Trust’s organizational documents, the officers and Trustees have been granted certain indemnification rights against certain liabilities that may arise out of performance of their duties to the Trust. Additionally, in the normal course of business, the Trust may enter into contracts with service providers that contain a variety of indemnification clauses. The Trust’s maximum exposure under these arrangements is dependent on future claims that may be made against the Fund and, therefore, cannot be estimated.
9. NEW ACCOUNTING PRONOUNCEMENTS
In August 2018, FASB issued Accounting Standards Update (“ASU”)No. 2018-13, Fair Value Measurement (Topic 820)Disclosure Framework—Changes to the Disclosure Requirements for Fair Value Measurement. ASU2018-13 updates the disclosure requirements for fair value measurements by modifying or removing certain disclosures and adding certain new disclosures. The amendments are effective for fiscal years, and interim periods within those fiscal years, beginning after December 15, 2019. Early adoption is permitted. Management has adopted the removal and modification of disclosures early, as permitted, and will adopt the additional new disclosures at the effective date.
In March 2017, FASB issued ASUNo. 2017-08,Premium Amortization on Purchased Callable Debt Securities. ASU2017-08 shortens the amortization period for certain callable debt securities held at a premium and requires the premium to be amortized to the earliest call date. The amendments do not require an accounting change for securities held at a discount and discounts will continue to be accreted to the maturity date of the security. ASU2017-08 is effective for fiscal years beginning after December 15, 2018 and for interim periods within those fiscal years. During the current reporting period, management of the Fund adopted the change in accounting policy which did not have a material impact to the Fund’s financial statements.
10. CORONAVIRUS(COVID-19) PANDEMIC
On March 11, 2020, the World Health Organization announced that it had made the assessment that coronavirus disease 2019(“COVID-19”) is a pandemic. The impacts ofCOVID-19 are adversely affecting the entire global economy, individual companies and investment products, and the market in general. There is significant uncertainty around the extent and duration of business disruptions related toCOVID-19 and the impacts may be short term or may last for an extended period of time. The risk of further spreading ofCOVID-19 has led to significant uncertainty and volatility in the financial markets. The value of the Fund and the securities in which the Fund invests have generally been adversely affected by impacts caused byCOVID-19.
Wells Fargo Global Investment Grade Credit Fund | 25
Other information (unaudited)
PROXY VOTING INFORMATION
A description of the policies and procedures used to determine how to vote proxies relating to portfolio securities is available, upon request, by calling1-800-222-8222, visiting our website atwfam.com, or visiting the SEC website at sec.gov. Information regarding how the proxies related to portfolio securities were voted during the most recent12-month period ended June 30 is available on the website atwfam.comor by visiting the SEC website at sec.gov.
QUARTERLY PORTFOLIO HOLDINGS INFORMATION
The Fund files its complete schedule of portfolio holdings with the SEC for the first and third quarters of each fiscal year as an exhibit to its reports on FormN-PORT. Shareholders may view the filed FormN-PORT by visiting the SEC website at sec.gov.
26 | Wells Fargo Global Investment Grade Credit Fund
Other information (unaudited)
BOARD OF TRUSTEES AND OFFICERS
Each of the Trustees and Officers1 listed in the table below acts in identical capacities for each fund in the Wells Fargo family of funds, which consists of 147 mutual funds comprising the Wells Fargo Funds Trust, Wells Fargo Variable Trust, Wells Fargo Master Trust and fourclosed-end funds (collectively the “Fund Complex”). This table should be read in conjunction with the Prospectus and the Statement of Additional Information2. The mailing address of each Trustee and Officer is 525 Market Street, 12th Floor, San Francisco, CA 94105. Each Trustee and Officer serves an indefinite term, however, each Trustee serves such term until reaching the mandatory retirement age established by the Trustees.
Independent Trustees
| | | | | | |
Name and
year of birth | | Position held and
length of service* | | Principal occupations during past five years or longer | | Current other
public company or
investment
company
directorships |
| | | |
| William R. Ebsworth (Born 1957) | | Trustee,
since 2015 | | Retired. From 1984 to 2013, equities analyst, portfolio manager, research director and chief investment officer at Fidelity Management and Research Company in Boston, Tokyo, and Hong Kong, and retired in 2013 as Chief Investment Officer of Fidelity Strategic Advisers, Inc. where he led a team of investment professionals managing client assets. Prior thereto, Board member of Hong Kong Securities Clearing Co., Hong Kong Options Clearing Corp., the Thailand International Fund, Ltd., Fidelity Investments Life Insurance Company, and Empire Fidelity Investments Life Insurance Company. Audit Committee Chair and Investment Committee Chair of the Vincent Memorial Hospital Endowment(non-profit organization). Mr. Ebsworth is a CFA® charterholder. | | N/A |
| | | |
| Jane A. Freeman (Born 1953) | | Trustee,
since 2015;
Chair Liaison,
since 2018 | | Retired. From 2012 to 2014 and 1999 to 2008, Chief Financial Officer of Scientific Learning Corporation. From 2008 to 2012, Ms. Freeman provided consulting services related to strategic business projects. Prior to 1999, Portfolio Manager at Rockefeller & Co. and Scudder, Stevens & Clark. Board member of the Harding Loevner Funds from 1996 to 2014, serving as both Lead Independent Director and chair of the Audit Committee. Board member of the Russell Exchange Traded Funds Trust from 2011 to 2012 and the chair of the Audit Committee. Ms. Freeman is a Board Member of The Ruth Bancroft Garden(non-profit organization). She is also an inactive Chartered Financial Analyst. | | N/A |
| | | |
| Isaiah Harris, Jr. (Born 1952) | | Trustee, since 2009;
Audit Committee Chairman,
since 2019 | | Retired. Chairman of the Board of CIGNA Corporation since 2009, and Director since 2005. From 2003 to 2011, Director of Deluxe Corporation. Prior thereto, President and CEO of BellSouth Advertising and Publishing Corp. from 2005 to 2007, President and CEO of BellSouth Enterprises from 2004 to 2005 and President of BellSouth Consumer Services from 2000 to 2003. Emeritus member of the Iowa State University Foundation Board of Governors. Emeritus Member of the Advisory Board of Iowa State University School of Business. Advisory Board Member, Palm Harbor Academy (private school). Advisory Board Member, Child Evangelism Fellowship(non-profit). Mr. Harris is a certified public accountant (inactive status). | | CIGNA Corporation |
| | | |
| Judith M. Johnson (Born 1949) | | Trustee,
since 2008;
Audit Committee Chairman, from 2009 to 2018 | | Retired. Prior thereto, Chief Executive Officer and Chief Investment Officer of Minneapolis Employees Retirement Fund from 1996 to 2008. Ms. Johnson is an attorney, certified public accountant and a certified managerial accountant. | | N/A |
Wells Fargo Global Investment Grade Credit Fund | 27
Other information (unaudited)
| | | | | | |
Name and
year of birth | | Position held and
length of service* | | Principal occupations during past five years or longer | | Current other
public company or
investment
company
directorships |
| | | |
| David F. Larcker (Born 1950) | | Trustee,
since 2009 | | James Irvin Miller Professor of Accounting at the Graduate School of Business, Stanford University, Director of the Corporate Governance Research Initiative and Senior Faculty of The Rock Center for Corporate Governance since 2006. From 2005 to 2008, Professor of Accounting at the Graduate School of Business, Stanford University. Prior thereto, Ernst & Young Professor of Accounting at The Wharton School, University of Pennsylvania from 1985 to 2005. | | N/A |
| | | |
| Olivia S. Mitchell (Born 1953) | | Trustee,
since 2006; Nominating and Governance Committee Chair, since 2018 | | International Foundation of Employee Benefit Plans Professor, Wharton School of the University of Pennsylvania since 1993. Director of Wharton’s Pension Research Council and Boettner Center on Pensions & Retirement Research, and Research Associate at the National Bureau of Economic Research. Previously, Cornell University Professor from 1978 to 1993. | | N/A |
| | | |
| Timothy J. Penny (Born 1951) | | Trustee,
since 1996; Chairman,
since 2018 | | President and Chief Executive Officer of Southern Minnesota Initiative Foundation, anon-profit organization, since 2007. Member of the Board of Trustees of NorthStar Education Finance, Inc., anon-profit organization, since 2007. | | N/A |
| | | |
| James G. Polisson (Born 1959) | | Trustee,
since 2018 | | Retired. Chief Marketing Officer, Source (ETF) UK Services, Ltd, from 2015 to 2017. From 2012 to 2015, Principal of The Polisson Group, LLC, a management consulting, corporate advisory and principal investing company. Chief Executive Officer and Managing Director at Russell Investments, Global Exchange Traded Funds from 2010 to 2012. Managing Director of Barclays Global Investors from 1998 to 2010 and Global Chief Marketing Officer for iShares and Barclays Global Investors from 2000 to 2010. Trustee of the San Francisco Mechanics’ Institute, anon-profit organization, from 2013 to 2015. Board member of the Russell Exchange Traded Fund Trust from 2011 to 2012. Director of Barclays Global Investors Holdings Deutschland GmbH from 2006 to 2009. Mr. Polisson is an attorney and has a retired status with the Massachusetts and District of Columbia Bar Associations. | | N/A |
| | | |
| Pamela Wheelock3 (Born 1959) | | Trustee,
since January 2020; previously Trustee from January 2018 to July 2019 | | Board member of the Destination Medical Center Economic Development Agency, Rochester, Minnesota since 2019. Acting Commissioner, Minnesota Department of Human Services, July 2019 through September 2019. Human Services Manager (part-time), Minnesota Department of Human Services, October 2019 through December 2019. Chief Operating Officer, Twin Cities Habitat for Humanity from 2017 to 2019. Vice President of University Services, University of Minnesota from 2012 to 2016. Prior thereto, on the Board of Directors, Governance Committee and Finance Committee for the Minnesota Philanthropy Partners (Saint Paul Foundation) from 2012 to 2018, Interim Chief Executive Officer of Blue Cross Blue Shield of Minnesota from 2011 to 2012, Chairman of the Board from 2009 to 2012 and Board Director from 2003 to 2015. Vice President, Leadership and Community Engagement, Bush Foundation, Saint Paul, Minnesota (a private foundation) from 2009 to 2011. Executive Vice President and Chief Financial Officer, Minnesota Sports and Entertainment from 2004 to 2009 and Senior Vice President from 2002 to 2004. Executive Vice President of the Minnesota Wild Foundation from 2004 to 2008. Commissioner of Finance, State of Minnesota, from 1999 to 2002. Currently Board Chair of the Minnesota Wild Foundation since 2010. | | N/A |
| * | Length of service dates reflect the Trustee’s commencement of service with the Trust’s predecessor entities, where applicable. |
28 | Wells Fargo Global Investment Grade Credit Fund
Other information (unaudited)
Officers
| | | | |
Name and
year of birth | | Position held and
length of service | | Principal occupations during past five years or longer |
| | |
| Andrew Owen (Born 1960) | | President, since 2017 | | Executive Vice President of Wells Fargo & Company and Head of Affiliated Managers, Wells Fargo Asset Management, since 2014. In addition, Mr. Owen is currently President, Chief Executive Officer and Director of Wells Fargo Funds Management, LLC since 2017. Prior thereto, Executive Vice President responsible for marketing, investments and product development for Wells Fargo Funds Management, LLC, from 2009 to 2014. |
| | |
| Jeremy DePalma1 (Born 1974) | | Treasurer, since 2012 | | Senior Vice President of Wells Fargo Funds Management, LLC since 2009. Senior Vice President of Evergreen Investment Management Company, LLC from 2008 to 2010 and head of the Fund Reporting and Control Team within Fund Administration from 2005 to 2010. |
| | |
| Michelle Rhee (Born 1966) | | Chief Legal Officer, since 2019 | | Secretary of Wells Fargo Funds Management, LLC, Chief Legal Counsel of Wells Fargo Asset Management and Assistant General Counsel of Wells Fargo Bank, N.A. since 2018. Associate General Counsel and Managing Director of Bank of America Corporation from 2004 to 2018. |
| | |
| Catherine Kennedy (Born 1969) | | Secretary, since 2019 | | Vice President of Wells Fargo Funds Management, LLC and Senior Counsel of the Wells Fargo Legal Department since 2010. Vice President and Senior Counsel of Evergreen Investment Management Company, LLC from 1998 to 2010. |
| | |
| Michael H. Whitaker(Born 1967) | | Chief Compliance Officer, since 2016 | | Chief Compliance Officer of Wells Fargo Asset Management since 2016. Senior Vice President and Chief Compliance Officer for Fidelity Investments from 2007 to 2016. |
| | |
| David Berardi (Born 1975) | | Assistant Treasurer, since 2009 | | Vice President of Wells Fargo Funds Management, LLC since 2009. Vice President of Evergreen Investment Management Company, LLC from 2008 to 2010. Manager of Fund Reporting and Control for Evergreen Investment Management Company, LLC from 2004 to 2010. |
| 1 | Jeremy DePalma acts as Treasurer of 82 funds and Assistant Treasurer of 65 funds in the Fund Complex. |
| 2 | The Statement of Additional Information includes additional information about the Trustees and is available, without charge, upon request, by calling1-800-222-8222 or by visiting the website atwfam.com. |
| 3 | Pamela Wheelock wasre-appointed to the Board effective January 1, 2020. |
Wells Fargo Global Investment Grade Credit Fund | 29
This page is intentionally left blank.
This page is intentionally left blank.
This page is intentionally left blank.

For more information
More information about Wells Fargo Funds is available free upon request. To obtain literature, please write, visit the Fund’s website, or call:
Wells Fargo Funds
P.O. Box 219967
Kansas City, MO 64121-9967
Website:wfam.com
Individual investors:1-800-222-8222
Retail investment professionals:1-888-877-9275
Institutional investment professionals:1-866-765-0778

This report and the financial statements contained herein are submitted for the general information of the shareholders of the Fund. If this report is used for promotional purposes, distribution of the report must be accompanied or preceded by a current prospectus. Before investing, please consider the investment objectives, risks, charges, and expenses of the investment. For a current prospectus and, if available, a summary prospectus, containing this information, call1-800-222-8222 or visit the Fund’s website atwfam.com. Read the prospectus carefully before you invest or send money.
Wells Fargo Asset Management (WFAM) is the trade name for certain investment advisory/management firms owned by Wells Fargo & Company. These firms include but are not limited to Wells Capital Management Incorporated and Wells Fargo Funds Management, LLC. Certain products managed by WFAM entities are distributed by Wells Fargo Funds Distributor, LLC (a broker-dealer and Member FINRA).
This material is for general informational and educational purposes only and is NOT intended to provide investment advice or a recommendation of any kind—including a recommendation for any specific investment, strategy, or plan.
INVESTMENT PRODUCTS: NOT FDIC INSURED ◾ NO BANK GUARANTEE ◾ MAY LOSE VALUE
© 2020 Wells Fargo & Company. All rights reserved.
PAR-0420-06226 05-20
SA294/SAR294 03-20
Not applicable.
| ITEM 3. | AUDIT COMMITTEE FINANCIAL EXPERT |
Not applicable.
| ITEM 4. | PRINCIPAL ACCOUNTANT FEES AND SERVICES |
Not applicable.
| ITEM 5. | AUDIT COMMITTEE OF LISTED REGISTRANTS |
Not applicable.
A Portfolio of Investments for each series of Wells Fargo Funds Trust is included as part of the report to shareholders filed under Item 1 of this Form.
| ITEM 7. | DISCLOSURE OF PROXY VOTING POLICIES AND PROCEDURES FORCLOSED-END MANAGEMENT INVESTMENT COMPANIES |
Not applicable.
| ITEM 8. | PORTFOLIO MANAGERS OFCLOSED-END MANAGEMENT INVESTMENT COMPANIES |
Not applicable.
| ITEM 9. | PURCHASES OF EQUITY SECURITIES BYCLOSED-END MANAGEMEENT INVESTMENT COMPANY AND AFFILIATED PURCHASERS |
Not applicable.
ITEM 10. SUBMISSION OF MATTERS TO A VOTE OF SECURITY HOLDERS
There have been no material changes to the procedures by which shareholders may recommend nominees to the registrant’s Board of Trustees that have been implemented since the registrant’s last provided disclosure in response to the requirements of this Item.
| ITEM 11. | CONTROLS AND PROCEDURES |
(a) The President and Treasurer have concluded that the Wells Fargo Funds Trust disclosure controls and procedures (as defined in Rule30a-3(c) under the Investment Company Act of 1940) provide reasonable assurances that material information relating to the registrant is made known to them by the appropriate persons, based on their evaluation of these controls and procedures as of a date within 90 days of the filing of this report.
(b) There were no significant changes in the registrant’s internal controls over financial reporting (as defined in Rule30a-3(d) under the Investment Company Act of 1940) that occurred during the most recent fiscal half-year of the period covered by this report that materially affected, or is reasonably likely to materially affect, the registrant’s internal control over financial reporting.
| ITEM 12. | DISCLOSURES OF SECURITIES LENDING ACTIVITES FORCLOSED-END MANAGEMENT INVESTMENT COMPANIES |
Not applicable.
(a)(1) Not applicable.
(a)(2) Certifications pursuant to Section 302 of the Sarbanes-Oxley Act of 2002.
(b) Certifications pursuant to Section 906 of the Sarbanes-Oxley Act of 2002.
SIGNATURES
Pursuant to the requirements of the Securities Exchange Act of 1934 and the Investment Company Act of 1940, the registrant has duly caused this report to be signed on its behalf by the undersigned, thereunto duly authorized.
| | |
| Wells Fargo Funds Trust |
| |
| By: | | /s/ Andrew Owen |
| Andrew Owen |
| President |
|
| Date: May 28, 2020 |
Pursuant to the requirements of the Securities Exchange Act of 1934 and the Investment Company Act of 1940, this report has been signed below by the following persons on behalf of the registrant and in the capacities and on the date indicated.
| | |
| Wells Fargo Funds Trust |
| |
| By: | | /s/ Andrew Owen |
| Andrew Owen |
| President |
|
| Date: May 28, 2020 |
| |
| By: | | /s/ Nancy Wiser |
| Nancy Wiser |
| Treasurer |
|
| Date: May 28, 2020 |
| |
| By: | | /s/ Jeremy DePalma |
| Jeremy DePalma |
| Treasurer |
|
| Date: May 28, 2020 |