UNITED STATES
SECURITIES AND EXCHANGE COMMISSION
Washington, D.C. 20549
FORM N-CSRS
CERTIFIED SHAREHOLDER REPORT OF REGISTERED
MANAGEMENT INVESTMENT COMPANIES
Investment Company Act file number: 811-09253
Wells Fargo Funds Trust
(Exact name of registrant as specified in charter)
525 Market St., San Francisco, CA 94105
(Address of principal executive offices) (Zip code)
Catherine Kennedy
Wells Fargo Funds Management, LLC
525 Market St., San Francisco, CA 94105
(Name and address of agent for service)
Registrant’s telephone number, including area code: 800-222-8222
Date of fiscal year end: June 30
Registrant is making a filing for 13 of its series:
Wells Fargo Alternative Risk Premia Fund, Wells Fargo California Limited-Term Tax-Free Fund, Wells Fargo California Tax-Free Fund, Wells Fargo High Yield Municipal Bond Fund, Wells Fargo Intermediate Tax/AMT-Free Fund, Wells Fargo Minnesota Tax-Free Fund, Wells Fargo Municipal Bond Fund, Wells Fargo Municipal Sustainability Fund, Wells Fargo Pennsylvania Tax-Free Fund, Wells Fargo Short-Term Municipal Bond Fund, Wells Fargo Strategic Municipal Bond Fund, Wells Fargo Ultra Short-Term Municipal Income Fund, and Wells Fargo Wisconsin Tax-Free Fund.
Date of reporting period: December 31, 2020
ITEM 1. REPORT TO STOCKHOLDERS
Semi-Annual Report
December 31, 2020
Wells Fargo
California Limited-Term Tax-Free Fund
Reduce clutter.
Save trees.
Sign up for electronic delivery of prospectuses and shareholder reports at wellsfargo.com/ advantagedelivery
The views expressed and any forward-looking statements are as of December 31, 2020, unless otherwise noted, and are those of the Fund's portfolio managers and/or Wells Fargo Asset Management. Discussions of individual securities or the markets generally are not intended as individual recommendations. Future events or results may vary significantly from those expressed in any forward-looking statements. The views expressed are subject to change at any time in response to changing circumstances in the market. Wells Fargo Asset Management and the Fund disclaim any obligation to publicly update or revise any views expressed or forward-looking statements.
INVESTMENT PRODUCTS: NOT FDIC INSURED ■ NO BANK GUARANTEE ■ MAY LOSE VALUE
Wells Fargo California Limited-Term Tax-Free Fund | 1
Letter to shareholders (unaudited)
Andrew Owen
President
Wells Fargo Funds
Dear Shareholder:
We are pleased to offer you this semi-annual report for the Wells Fargo California Limited-Term Tax-Free Fund for the six-month period that ended December 31, 2020. Despite a deeply challenging year, dominated by the spread of COVID-19 cases and a sharp drop in economic output throughout much of the world, global stocks performed extremely well, benefiting from ongoing central bank support and rising optimism over the development and distribution of effective COVID-19 vaccines. Bonds also had positive returns, led by global bonds and high-yield bonds.
For the six-month period, U.S. stocks, based on the S&P 500 Index,1 gained 22.16%. International stocks, as measured by the MSCI ACWI ex USA Index (Net),2 returned 24.33%, while the MSCI EM Index (Net),3 had even stronger performance, with a 31.14% gain. Among bond indexes, the Bloomberg Barclays U.S. Aggregate Bond Index,4 returned 1.29%, the Bloomberg Barclays Global Aggregate ex-USD Index (unhedged),5 gained 9.44%, and the Bloomberg Barclays Municipal Bond Index,6 returned 3.07% while the ICE BofA U.S. High Yield Index,7 gained a hefty 11.49%.
The stock market rally continued in July.
After a volatile first half of the year, an existing stock market rally continued in July with strong results for equities and fixed income. However, economic data and a resurgence of COVID-19 cases underscored the urgent need to regain control of the pandemic. Second-quarter gross domestic product (GDP) shrank from the previous quarter by 9.5% and 12.1% in the U.S. and the eurozone, respectively. In contrast, China’s second-quarter GDP grew 3.2% year over year. The U.S. economy added 1.8 million jobs in July, but a double-digit jobless rate persisted.
The stock market continued to rally in August despite concerns over rising numbers of U.S. and European COVID-19 cases as well as the expiration of the $600 weekly bonus unemployment benefit in July. Relatively strong second-quarter earnings boosted investor sentiment along with the U.S. Federal Reserve’s announcement of a monetary policy shift expected to support longer-term low interest rates. U.S. manufacturing and services activity indexes beat expectations, while the U.S. housing market maintained strength. In Europe, retail sales expanded and consumer confidence was steady. China’s economy continued to expand.
“After a volatile first half of the year, an existing stock market rally continued in July with strong results for equities and fixed income.”
| 1 | The S&P 500 Index consists of 500 stocks chosen for market size, liquidity, and industry group representation. It is a market-value-weighted index with each stock's weight in the index proportionate to its market value. You cannot invest directly in an index. |
| 2 | The Morgan Stanley Capital International (MSCI) All Country World Index (ACWI) ex USA Index (Net) is a free-float-adjusted market-capitalization-weighted index that is designed to measure the equity market performance of developed and emerging markets, excluding the United States. Source: MSCI. MSCI makes no express or implied warranties or representations and shall have no liability whatsoever with respect to any MSCI data contained herein. The MSCI data may not be further redistributed or used as a basis for other indices or any securities or financial products. This report is not approved, reviewed, or produced by MSCI. You cannot invest directly in an index. |
| 3 | The MSCI Emerging Markets (EM) Index (Net) is a free-float-adjusted market-capitalization-weighted index that is designed to measure equity market performance of emerging markets. You cannot invest directly in an index. |
| 4 | The Bloomberg Barclays U.S. Aggregate Bond Index is a broad-based benchmark that measures the investment-grade, U.S. dollar-denominated, fixed-rate taxable bond market, including Treasuries, government-related and corporate securities, mortgage-backed securities (agency fixed-rate and hybrid adjustable-rate mortgage pass-throughs), asset-backed securities, and commercial mortgage-backed securities. You cannot invest directly in an index. |
| 5 | The Bloomberg Barclays Global Aggregate ex-USD Index (unhedged) is an unmanaged index that provides a broad-based measure of the global investment-grade fixed-income markets excluding the U.S. dollar-denominated debt market. You cannot invest directly in an index. |
| 6 | The Bloomberg Barclays Municipal Bond Index is an unmanaged index composed of long-term tax-exempt bonds with a minimum credit rating of Baa. You cannot invest directly in an index. |
| 7 | The ICE BofA U.S. High Yield Index is a market-capitalization-weighted index of domestic and Yankee high-yield bonds. The index tracks the performance of high-yield securities traded in the U.S. bond market. You cannot invest directly in an index. Copyright 2021. ICE Data Indices, LLC. All rights reserved. |
2 | Wells Fargo California Limited-Term Tax-Free Fund
Letter to shareholders (unaudited)
Stocks grew more volatile in September on mixed economic data. U.S. economic activity continued to grow. However, U.S. unemployment remained elevated at 7.9% in September. With U.S. Congress delaying further fiscal relief and uncertainties surrounding a possible vaccine, doubts crept back into the financial markets. In the U.K., a lack of progress in Brexit talks weighed on markets. China’s economy picked up steam, fueled by increased global demand.
In October, capital markets stepped back from their six-month rally. Market volatility rose in advance of the U.S. election and amid a global increase in COVID-19 infections. Europe introduced tighter restrictions affecting economic activity. U.S. markets looked favorably at the prospect of Democratic control of the federal purse strings, which could lead to additional fiscal stimulus and a boost to economic activity. Meanwhile, China reported 4.9% third-quarter GDP growth.
Global stocks rallied in November, propelled by optimism over three promising COVID-19 vaccines. Reversing recent trends, value stocks outperformed growth stocks and cyclical stocks outpaced technology stocks. However, U.S. unemployment remained elevated, with a net job loss of 10 million since February. The eurozone services Purchasing Managers’ Index, a monthly survey of purchasing managers, contracted sharply while the region’s manufacturing activity grew. The U.S. election results added to the upbeat mood as investors anticipated more consistent policies in the new administration.
Financial markets ended the year with strength on high expectations for a rapid rollout of the COVID-19 vaccines, the successful passage of a $900 billion stimulus package, and rising expectations of additional economic support from a Democratic-led Congress. U.S. economic data were mixed with still-elevated unemployment and weak retail sales but growth in manufacturing output. In contrast, China’s economic expansion continued in both manufacturing and nonmanufacturing. U.S. COVID-19 infection rates continued to rise even as new state and local lockdown measures were implemented.
Don’t let short-term uncertainty derail long-term investment goals.
Periods of investment uncertainty can present challenges, but experience has taught us that maintaining long-term investment goals can be an effective way to plan for the future. To help you create a sound strategy based on your personal goals and risk tolerance, Wells Fargo Funds offers more than 100 mutual funds spanning a wide range of asset classes and investment styles. Although diversification cannot guarantee an investment profit or prevent losses, we believe it can be an effective way to manage investment risk and potentially smooth out overall portfolio performance. We encourage investors to know their investments and to understand that appropriate levels of risk-taking may unlock opportunities.
Thank you for choosing to invest with Wells Fargo Funds. We appreciate your confidence in us and remain committed to helping you meet your financial needs.
Sincerely,
Andrew Owen
President
Wells Fargo Funds
“Global stocks rallied in November, propelled by optimism over three promising COVID-19 vaccines.”
For further information about your Fund, contact your investment professional, visit our website at wfam.com, or call us directly at 1-800-222-8222.
Wells Fargo California Limited-Term Tax-Free Fund | 3
Letter to shareholders (unaudited)
Preparing for LIBOR Transition
The global financial industry is preparing to transition away from the London Interbank Offered Rate (LIBOR), a key benchmark interest rate, to new alternative rates. LIBOR underpins more than $350 trillion of financial contracts. It is the benchmark rate for a wide spectrum of products ranging from residential mortgages to corporate bonds to derivatives. Regulators have called for a market-wide transition away from LIBOR to successor reference rates by the end of 2021 (expected to be extended through June 30, 2023 for most tenors of the U.S. dollar LIBOR), which requires proactive steps be taken by issuers, counterparties, and asset managers to identify impacted products and adopt new reference rates.
The Fund holds at least one security that uses LIBOR as a floating reference rate and has a maturity date after 12-31-2021.
Although the transition process away from LIBOR has become increasingly well-defined in advance of the anticipated discontinuation date, there remains uncertainty regarding the nature of successor reference rates, and any potential effects of the transition away from LIBOR on investment instruments that use it as a benchmark rate. The transition process may result in, among other things, increased volatility or illiquidity in markets for instruments that currently rely on LIBOR and could negatively impact the value of certain instruments held by the Fund.
Wells Fargo Asset Management is monitoring LIBOR exposure closely and has put resources and controls in place to manage this transition effectively. The Fund’s portfolio management team is evaluating LIBOR holdings to understand what happens to those securities when LIBOR ceases to exist, including examining security documentation to identify the presence or absence of fallback language identifying a replacement rate to LIBOR.
While the pace of transition away from LIBOR will differ by asset class and investment strategy, the portfolio management team will monitor market conditions for those holdings to identify and mitigate deterioration or volatility in pricing and liquidity and ensure appropriate actions are taken in a timely manner.
Further information regarding the potential risks associated with the discontinuation of LIBOR can be found in the Fund’s Statement of Additional Information.
4 | Wells Fargo California Limited-Term Tax-Free Fund
This page is intentionally left blank.
Performance highlights (unaudited)
Investment objective
The Fund seeks current income exempt from federal income tax and California individual income tax, consistent with capital preservation.
Manager
Wells Fargo Funds Management, LLC
Subadviser
Wells Capital Management Incorporated
Portfolio managers
Terry J. Goode
Kim Nakahara*
Brandon Pae
Adrian Van Poppel
Average annual total returns (%) as of December 31, 2020
| | | Including sales charge | | Excluding sales charge | | Expense ratios1 (%) |
| | Inception date | 1 year | 5 year | 10 year | | 1 year | 5 year | 10 year | | Gross | Net 2 |
| Class A (SFCIX) | 11-18-1992 | -0.11 | 1.13 | 1.99 | | 1.93 | 1.53 | 2.19 | | 0.85 | 0.80 |
| Class C (SFCCX) | 8-30-2002 | 0.17 | 0.78 | 1.43 | | 1.17 | 0.78 | 1.43 | | 1.60 | 1.55 |
| Administrator Class (SCTIX) | 9-6-1996 | – | – | – | | 2.04 | 1.73 | 2.39 | | 0.79 | 0.60 |
| Institutional Class (SFCNX)3 | 10-31-2014 | – | – | – | | 2.24 | 1.84 | 2.45 | | 0.52 | 0.50 |
| Bloomberg Barclays Municipal 1-5 Year Blend Index4 | – | – | – | – | | 3.15 | 2.16 | 2.12 | | – | – |
| Bloomberg Barclays California Municipal 1-5 Year Blend Index5 | – | – | – | – | | 2.93 | 1.93 | 2.07 | | – | – |
Figures quoted represent past performance, which is no guarantee of future results, and do not reflect taxes that a shareholder may pay on an investment in a fund. Investment return and principal value of an investment will fluctuate so that an investor’s shares, when redeemed, may be worth more or less than their original cost. Performance shown without sales charges would be lower if sales charges were reflected. Current performance may be lower or higher than the performance data quoted, which assumes the reinvestment of dividends and capital gains. Current month-end performance is available on the Fund’s website, wfam.com.
Index returns do not include transaction costs associated with buying and selling securities, any mutual fund fees or expenses, or any taxes. It is not possible to invest directly in an index.
For Class A shares, the maximum front-end sales charge is 2.00%. For Class C shares, the maximum contingent deferred sales charge is 1.00%. Performance including a contingent deferred sales charge assumes the sales charge for the corresponding time period. shares are sold without a front-end sales charge or contingent deferred sales charge.
Bond values fluctuate in response to the financial condition of individual issuers, general market and economic conditions, and changes in interest rates. Changes in market conditions and government policies may lead to periods of heightened volatility in the bond market and reduced liquidity for certain bonds held by the Fund. In general, when interest rates rise, bond values fall and investors may lose principal value. Interest rate changes and their impact on the fund and its share price can be sudden and unpredictable. The use of derivatives may reduce returns and/or increase volatility. Certain investment strategies tend to increase the total risk of an investment (relative to the broader market). The Fund is exposed to California municipal securities risk and high-yield securities risk. Consult the Fund’s prospectus for additional information on these and other risks. A portion of the Fund’s income may be subject to federal, state, and/or local income taxes or the Alternative Minimum Tax (AMT). Any capital gains distributions may be taxable.
Please see footnotes on page 7.
6 | Wells Fargo California Limited-Term Tax-Free Fund
Performance highlights (unaudited)
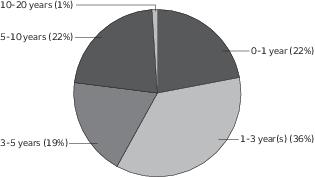
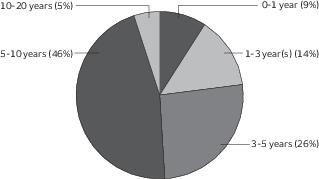
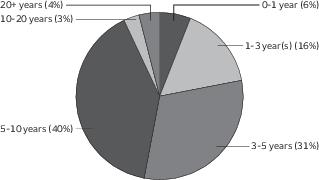
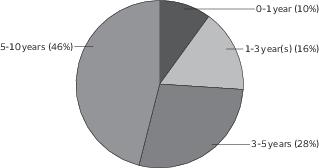
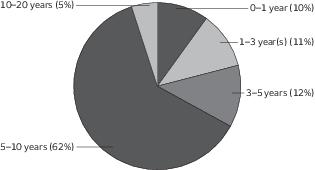
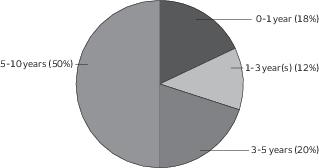
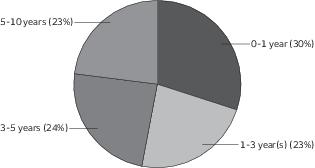
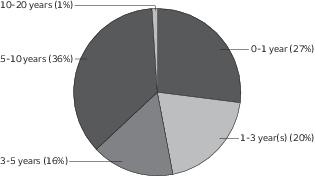
| Effective maturity distribution as of December 31, 20206 |
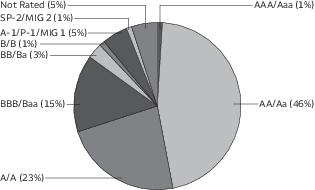
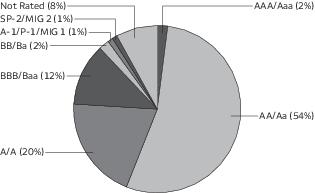
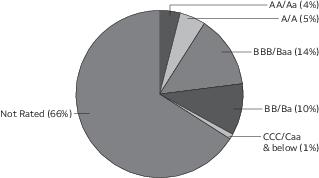
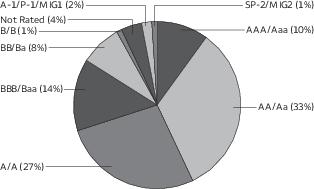
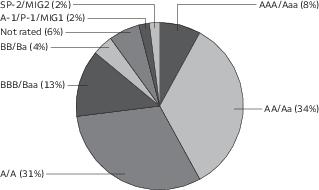
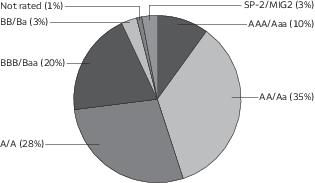
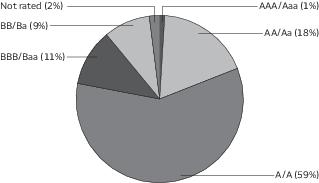
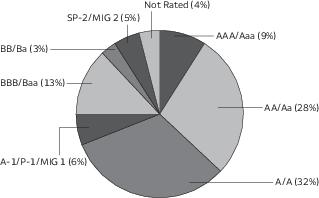
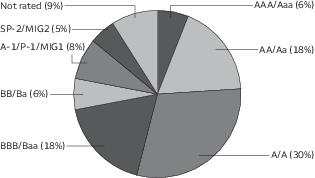
| Credit quality as of December 31, 20207 |
| * | Ms. Nakahara became a portfolio manager of the Fund on September 1, 2020. |
| 1 | Reflects the expense ratios as stated in the most recent prospectuses. The expense ratios shown are subject to change and may differ from the annualized expense ratios shown in the financial highlights of this report. |
| 2 | The manager has contractually committed through October 31, 2021, to waive fees and/or reimburse expenses to the extent necessary to cap total annual fund operating expenses after fee waivers at 0.80% for Class A, 1.55% for Class C, 0.60% for Administrator Class, and 0.50% for Institutional Class. Brokerage commissions, stamp duty fees, interest, taxes, acquired fund fees and expenses (if any), and extraordinary expenses are excluded from the expense caps. Prior to or after the commitment expiration date, the caps may be increased or the commitment to maintain the caps may be terminated only with the approval of the Board of Trustees. Without these caps, the Fund’s returns would have been lower. The expense ratio paid by an investor is the net expense ratio (the total annual fund operating expenses after fee waivers) as stated in the prospectuses. |
| 3 | Historical performance shown for the Institutional Class shares prior to their inception reflects the performance of the Administrator Class shares, and is not adjusted to reflect the Institutional Class share expenses. If these expenses had been included, returns for the Institutional Class shares would be higher. |
| 4 | The Bloomberg Barclays Municipal 1–5 Year Blend Index is the 1–5 Year component of the Bloomberg Barclays Municipal Bond Index. The Bloomberg Barclays Municipal Bond Index is an unmanaged index composed of long-term tax-exempt bonds with a minimum credit rating of Baa. You cannot invest directly in an index. |
| 5 | The Bloomberg Barclays California Municipal 1-5 Year Blend Index is the 1-5 Year component of the Bloomberg Barclays California Municipal Bond Index. You cannot invest directly in an index. |
| 6 | Figures represent the percentage of the Fund's net assets. Holdings are subject to change and may have changed since the date specified. |
| 7 | The credit quality distribution of portfolio holdings reflected in the chart is based on ratings from Standard & Poor’s, Moody’s Investors Service, and/ or Fitch Ratings Ltd. Credit quality ratings apply to the underlying holdings of the Fund and not to the Fund itself. The percentages of the Fund’s portfolio with the ratings depicted in the chart are calculated based on the total market value of fixed income securities held by the Fund. If a security was rated by all three rating agencies, the middle rating was utilized. If rated by two of three rating agencies, the lower rating was utilized, and if rated by one of the rating agencies, that rating was utilized. Standard & Poor’s rates the creditworthiness of bonds, ranging from AAA (highest) to D (lowest). Ratings from A to CCC may be modified by the addition of a plus (+) or minus (-) sign to show relative standing within the rating categories. Standard & Poor’s rates the creditworthiness of short-term notes from SP-1 (highest) to SP-3 (lowest). Moody’s rates the creditworthiness of bonds, ranging from Aaa (highest) to C (lowest). Ratings Aa to B may be modified by the addition of a number 1 (highest) to 3 (lowest) to show relative standing within the ratings categories. Moody’s rates the creditworthiness of short-term U.S. tax-exempt municipal securities from MIG 1/VMIG 1 (highest) to SG (lowest). Fitch rates the creditworthiness of bonds, ranging from AAA (highest) to D (lowest). Credit quality distribution is subject to change and may have changed since the date specified. |
Wells Fargo California Limited-Term Tax-Free Fund | 7
Fund expenses (unaudited)
As a shareholder of the Fund, you incur two types of costs: (1) transaction costs, including sales charges (loads) on purchase payments and contingent deferred sales charges (if any) on redemptions and (2) ongoing costs, including management fees, distribution (12b-1) and/or shareholder servicing fees, and other Fund expenses. This example is intended to help you understand your ongoing costs (in dollars) of investing in the Fund and to compare these costs with the ongoing costs of investing in other mutual funds.
The example is based on an investment of $1,000 invested at the beginning of the six-month period and held for the entire period from July 1, 2020 to December 31, 2020.
Actual expenses
The “Actual” line of the table below provides information about actual account values and actual expenses. You may use the information in this line, together with the amount you invested, to estimate the expenses that you paid over the period. Simply divide your account value by $1,000 (for example, an $8,600 account value divided by $1,000 = 8.6), then multiply the result by the number in the “Actual” line under the heading entitled “Expenses paid during period” for your applicable class of shares to estimate the expenses you paid on your account during this period.
Hypothetical example for comparison purposes
The “Hypothetical” line of the table below provides information about hypothetical account values and hypothetical expenses based on the Fund’s actual expense ratio and an assumed rate of return of 5% per year before expenses, which is not the Fund’s actual return. The hypothetical account values and expenses may not be used to estimate the actual ending account balance or expenses you paid for the period. You may use this information to compare the ongoing costs of investing in the Fund and other funds. To do so, compare this 5% hypothetical example with the 5% hypothetical examples that appear in the shareholder reports of the other funds.
Please note that the expenses shown in the table are meant to highlight your ongoing costs only and do not reflect any transactional costs, such as sales charges (loads) and contingent deferred sales charges. Therefore, the “Hypothetical” line of the table is useful in comparing ongoing costs only and will not help you determine the relative total costs of owning different funds. In addition, if these transactional costs were included, your costs would have been higher.
| | Beginning
account value
7-1-2020 | Ending
account value
12-31-2020 | Expenses
paid during
the period1 | Annualized net
expense ratio |
| Class A | | | | |
| Actual | $1,000.00 | $1,015.95 | $4.07 | 0.80% |
| Hypothetical (5% return before expenses) | $1,000.00 | $1,021.17 | $4.08 | 0.80% |
| Class C | | | | |
| Actual | $1,000.00 | $1,012.12 | $7.86 | 1.55% |
| Hypothetical (5% return before expenses) | $1,000.00 | $1,017.39 | $7.88 | 1.55% |
| Administrator Class | | | | |
| Actual | $1,000.00 | $1,016.14 | $3.05 | 0.60% |
| Hypothetical (5% return before expenses) | $1,000.00 | $1,022.18 | $3.06 | 0.60% |
| Institutional Class | | | | |
| Actual | $1,000.00 | $1,017.62 | $2.54 | 0.50% |
| Hypothetical (5% return before expenses) | $1,000.00 | $1,022.68 | $2.55 | 0.50% |
1 Expenses paid is equal to the annualized net expense ratio of each class multiplied by the average account value over the period, multiplied by the number of days in the most recent fiscal half-year divided by the number of days in the fiscal year (to reflect the one-half-year period).
8 | Wells Fargo California Limited-Term Tax-Free Fund
Portfolio of investments—December 31, 2020 (unaudited)
| | | | | Principal | Value |
| Closed end municipal bond fund obligations: 0.18% | | | | | |
| California: 0.18% | | | | | |
| Nuveen California AMT-Free Quality Municipal Income Fund MuniFund Preferred Shares Series A (10 shares) 0.51% 144Aø | | | | $ 1,000,000 | $ 1,000,000 |
| Total Closed end municipal bond fund obligations (Cost $1,000,000) | | | | | 1,000,000 |
| | | Interest
rate | Maturity
date | | |
| Municipal obligations: 99.40% | | | | | |
| California: 93.72% | | | | | |
| Airport revenue: 11.24% | | | | | |
| California Municipal Finance Authority Revenue Senior Lien Linxs APM Project Series A | | 5.00% | 12-31-2023 | $ 1,100,000 | $ 1,228,898 |
| California Municipal Finance Authority Revenue Senior Lien Linxs APM Project Series A | | 5.00 | 6-30-2024 | 955,000 | 1,084,317 |
| California Municipal Finance Authority Revenue Senior Lien Linxs APM Project Series A | | 5.00 | 12-31-2024 | 750,000 | 865,755 |
| Los Angeles CA Department Airports Airport Revenue Refunding Bond Senior Los Angeles International Airport | | 5.00 | 5-15-2032 | 10,000,000 | 13,618,300 |
| Los Angeles CA Department of Airports AMT Series B | | 5.00 | 5-15-2024 | 5,000,000 | 5,753,700 |
| Los Angeles CA Department of Airports AMT Series B | | 5.00 | 5-15-2025 | 6,000,000 | 7,155,660 |
| Los Angeles CA Department of Airports AMT Series B | | 5.00 | 5-15-2026 | 2,500,000 | 3,076,550 |
| Los Angeles CA Department of Airports AMT Subordinate Bond Series C | | 5.00 | 5-15-2024 | 4,315,000 | 4,971,700 |
| Palm Springs CA Airport Passenger Facility Charge Revenue Palm Springs International Airport (BAM Insured) | | 5.00 | 6-1-2027 | 1,205,000 | 1,401,608 |
| Port of Oakland Revenue Refunding Bond AMT Senior Lien Series P | | 5.00 | 5-1-2026 | 1,000,000 | 1,061,970 |
| Port of Oakland Revenue Refunding Bond Intermediate Lien Series E | | 5.00 | 11-1-2023 | 200,000 | 225,632 |
Port of Oakland Revenue Refunding Bond Intermediate Lien
Series H %% | | 5.00 | 11-1-2029 | 1,875,000 | 2,452,875 |
| Sacramento County CA Airport System Subordinate Refunding Bond AMT Series F ## | | 5.00 | 7-1-2021 | 2,585,000 | 2,639,544 |
| Sacramento County CA Airport System Subordinate Refunding Bond AMT Series F | | 5.00 | 7-1-2022 | 2,590,000 | 2,755,061 |
| Sacramento County CA Airport System Subordinate Refunding Bond AMT Series F | | 5.00 | 7-1-2023 | 2,585,000 | 2,860,897 |
| Sacramento County CA Airport System Subordinate Refunding Bond AMT Series F | | 5.00 | 7-1-2024 | 1,760,000 | 2,018,738 |
| San Diego County CA Regional Airport Authority Airport Revenue Refunding Bond AMT Subordinated Series C | | 5.00 | 7-1-2027 | 750,000 | 940,980 |
| San Diego County CA Regional Airport Authority Airport Revenue Refunding Bond AMT Subordinated Series C | | 5.00 | 7-1-2028 | 1,000,000 | 1,279,550 |
| San Diego County CA Regional Airport Authority Airport Revenue Refunding Bond AMT Subordinated Series C | | 5.00 | 7-1-2029 | 1,000,000 | 1,301,850 |
| San Francisco CA City and Refunding Bond AMT Second Series A | | 5.00 | 5-1-2025 | 740,000 | 786,583 |
The accompanying notes are an integral part of these financial statements.
Wells Fargo California Limited-Term Tax-Free Fund | 9
Portfolio of investments—December 31, 2020 (unaudited)
| | | Interest
rate | Maturity
date | Principal | Value |
| Airport revenue (continued) | | | | | |
| San Francisco CA City and Refunding Bond AMT Second Series A | | 5.00% | 5-1-2030 | $ 3,850,000 | $ 4,064,869 |
| San Francisco CA City and Refunding Bond AMT Second Series A | | 5.50 | 5-1-2028 | 250,000 | 279,038 |
| | | | | | 61,824,075 |
| Education revenue: 7.25% | | | | | |
| California Municipal Finance Authority Revenue Anticipation Notes River Springs 144A | | 4.00 | 6-15-2021 | 2,250,000 | 2,261,003 |
| California Educational Facilities Authority Revenue Loma Linda University Series A | | 5.00 | 4-1-2024 | 550,000 | 621,203 |
| California Educational Facilities Authority Revenue Loma Linda University Series A | | 5.00 | 4-1-2026 | 325,000 | 390,709 |
| California Municipal Finance Authority California Baptist University Series A 144A | | 4.00 | 11-1-2021 | 195,000 | 198,401 |
| California Municipal Finance Authority Charter School Albert Einstein Academies Project Series A | | 6.00 | 8-1-2023 | 445,000 | 475,620 |
| California Municipal Finance Authority Charter School Revenue Palmdale Aerospace Academy Project Series A 144A | | 3.88 | 7-1-2028 | 1,750,000 | 1,851,465 |
| California Municipal Finance Authority Revenue Anticipation Notes Highlands Community 144A | | 4.00 | 11-15-2021 | 1,650,000 | 1,658,415 |
| California Municipal Finance Authority Revenue Refunding Bond Biola University | | 5.00 | 10-1-2027 | 790,000 | 972,111 |
| California Municipal Finance Authority Revenue Refunding Bond California Lutheran University | | 5.00 | 10-1-2021 | 250,000 | 256,530 |
| California Municipal Finance Authority Revenue Refunding Bond California Lutheran University | | 5.00 | 10-1-2022 | 250,000 | 265,003 |
| California Municipal Finance Authority Revenue Refunding Bond California Lutheran University | | 5.00 | 10-1-2023 | 225,000 | 249,224 |
| California Municipal Finance Authority Revenue Refunding Bond California Lutheran University | | 5.00 | 10-1-2024 | 275,000 | 314,529 |
| California Municipal Finance Authority Revenue Refunding Bond California Lutheran University | | 5.00 | 10-1-2025 | 275,000 | 324,060 |
| California Municipal Finance Authority Revenue Refunding Bond California Lutheran University | | 5.00 | 10-1-2026 | 300,000 | 362,634 |
| California Municipal Finance Authority Revenue Refunding Bond University of the Pacific Series A %% | | 5.00 | 11-1-2024 | 600,000 | 679,128 |
| California Municipal Finance Authority Revenue Refunding Bond University of the Pacific Series A %% | | 5.00 | 11-1-2025 | 600,000 | 702,078 |
| California Municipal Finance Authority Revenue Refunding Bond University of the Pacific Series A %% | | 5.00 | 11-1-2026 | 625,000 | 752,381 |
| California Municipal Finance Authority Revenue Refunding Bond University of the Pacific Series A %% | | 5.00 | 11-1-2027 | 650,000 | 799,838 |
| California Municipal Finance Authority Revenue Refunding Bond University of the Pacific Series A %% | | 5.00 | 11-1-2028 | 700,000 | 878,255 |
| California Municipal Finance Authority Revenue Refunding Bond University of the Pacific Series A %% | | 5.00 | 11-1-2029 | 470,000 | 601,031 |
| California Municipal Finance Authority Revenue Refunding Bond University of the Pacific Series A %% | | 5.00 | 11-1-2030 | 500,000 | 649,820 |
| California School Finance Authority Bright Star School Obligation Group 144A | | 5.00 | 6-1-2027 | 1,705,000 | 1,845,986 |
| California School Finance Authority Classical Academies Project Series A 144A | | 3.25 | 10-1-2022 | 1,320,000 | 1,341,833 |
| California School Finance Authority Coastal Academy Project Series A 144A | | 5.00 | 10-1-2022 | 140,000 | 146,038 |
The accompanying notes are an integral part of these financial statements.
10 | Wells Fargo California Limited-Term Tax-Free Fund
Portfolio of investments—December 31, 2020 (unaudited)
| | | Interest
rate | Maturity
date | Principal | Value |
| Education revenue (continued) | | | | | |
| California School Finance Authority Rocket Ship Education Series A 144A | | 5.00% | 6-1-2021 | $ 205,000 | $ 207,306 |
| California School Finance Authority Rocketship Education Series A 144A | | 5.00 | 6-1-2026 | 500,000 | 545,570 |
| California Statewide CDA California Baptist University Series A | | 5.13 | 11-1-2023 | 440,000 | 465,780 |
| California Statewide CDA Refunding Bond California Baptist University Series A 144A | | 3.00 | 11-1-2022 | 895,000 | 906,680 |
| California Statewide CDA School Facilities | | 5.88 | 7-1-2022 | 645,000 | 662,912 |
| University of California Series AK | | 5.00 | 5-15-2048 | 10,000,000 | 11,123,600 |
| University of California Series AR | | 5.00 | 5-15-2032 | 6,000,000 | 7,351,740 |
| | | | | | 39,860,883 |
| GO revenue: 23.12% | | | | | |
| Bassett CA Unified School District Refunding Bond Series B (BAM Insured) | | 5.00 | 8-1-2021 | 550,000 | 565,378 |
| Bassett CA Unified School District Refunding Bond Series B (BAM Insured) | | 5.00 | 8-1-2023 | 725,000 | 809,847 |
| California | | 5.00 | 10-1-2021 | 6,795,000 | 7,040,843 |
| California | | 5.00 | 11-1-2022 | 2,500,000 | 2,721,025 |
| California | | 5.00 | 10-1-2023 | 8,400,000 | 9,499,644 |
| California | | 5.25 | 10-1-2022 | 2,750,000 | 2,993,980 |
| California Refunding Bond Various Purpose Bidding Group C (BAM Insured) | | 5.00 | 9-1-2027 | 8,500,000 | 10,666,820 |
| California Series B | | 5.00 | 9-1-2023 | 10,730,000 | 12,092,603 |
| California Statewide Refunding Bond Various Purpose | | 5.00 | 8-1-2025 | 3,500,000 | 4,255,265 |
| California Statewide Series B (1 Month LIBOR+0.76%)± | | 0.87 | 12-1-2031 | 2,500,000 | 2,502,725 |
| California Statewide Series E (SIFMA Municipal Swap+0.43%)± | | 0.52 | 12-1-2029 | 3,050,000 | 3,050,458 |
| Central California Unified School District Refunding Bond (AGM Insured) | | 5.00 | 7-1-2021 | 400,000 | 409,516 |
| Central California Unified School District Refunding Bond (AGM Insured) | | 5.00 | 7-1-2022 | 750,000 | 801,743 |
| Coachella Valley CA Unified School District (BAM Insured) | | 4.00 | 8-1-2021 | 2,230,000 | 2,277,521 |
| Coachella Valley CA Unified School District (BAM Insured) | | 4.00 | 8-1-2022 | 1,000,000 | 1,058,150 |
| Dixon CA Unified School District (AGM Insured) | | 5.00 | 8-1-2021 | 1,210,000 | 1,243,832 |
| Dixon CA Unified School District (AGM Insured) | | 5.00 | 8-1-2022 | 1,285,000 | 1,383,251 |
| El Cerrito CA Tax and Revenue Anticipation Notes | | 3.00 | 7-1-2021 | 1,000,000 | 1,010,230 |
| El Monte CA City School District CAB BAN ¤ | | 0.00 | 4-1-2023 | 2,000,000 | 1,978,960 |
| El Monte CA Union High School Refunding Bond | | 5.00 | 6-1-2021 | 1,315,000 | 1,340,406 |
| Hayward CA Unified School District Certificate of Participation (AGM Insured) | | 5.00 | 8-1-2022 | 500,000 | 537,325 |
| Hayward CA Unified School District Certificate of Participation (AGM Insured) | | 5.00 | 8-1-2023 | 805,000 | 902,075 |
| Huntington Beach CA City School District Election of 2002 | | 4.00 | 8-1-2021 | 505,000 | 516,236 |
| Inglewood CA Unified School District Election of 2012 Series B (BAM Insured) | | 4.00 | 8-1-2021 | 320,000 | 326,893 |
| Inglewood CA Unified School District Election of 2012 Series B (BAM Insured) | | 4.00 | 8-1-2022 | 200,000 | 211,794 |
| Inglewood CA Unified School District Election of 2012 Series B (BAM Insured) | | 5.00 | 8-1-2023 | 195,000 | 218,408 |
| Inglewood CA Unified School District Election of 2012 Series B (BAM Insured) | | 5.00 | 8-1-2024 | 150,000 | 174,705 |
| Inglewood CA Unified School District Election of 2012 Series B (BAM Insured) | | 5.00 | 8-1-2025 | 170,000 | 205,306 |
The accompanying notes are an integral part of these financial statements.
Wells Fargo California Limited-Term Tax-Free Fund | 11
Portfolio of investments—December 31, 2020 (unaudited)
| | | Interest
rate | Maturity
date | Principal | Value |
| GO revenue (continued) | | | | | |
| Inglewood CA Unified School District Election of 2012 Series B (BAM Insured) | | 5.00% | 8-1-2026 | $ 235,000 | $ 292,704 |
| Kern CA Community College District CAB Anticipation Notes Facilities ¤ | | 0.00 | 8-1-2023 | 2,000,000 | 1,972,420 |
| La Habra CA School District Refunding Bond | | 5.00 | 8-1-2021 | 805,000 | 827,371 |
| Long Beach CA Harbor Revenue AMT Series C | | 5.00 | 5-15-2027 | 500,000 | 588,390 |
| Los Angeles CA Unified School District Measure Q Series C | | 4.00 | 7-1-2032 | 1,000,000 | 1,263,540 |
| Los Angeles CA Unified School District Refunding Bond Series D | | 5.00 | 7-1-2023 | 6,180,000 | 6,913,010 |
| Mount San Antonio Community College District CAB ¤ | | 0.00 | 4-1-2022 | 10,000,000 | 9,972,800 |
| Oak Valley CA Hospital District Refunding Bond Los Angeles County CA RDA | | 5.00 | 7-1-2021 | 950,000 | 971,983 |
| Oak Valley CA Hospital District Refunding Bond Los Angeles County CA RDA | | 5.00 | 7-1-2022 | 750,000 | 796,298 |
| Oak Valley CA Hospital District Refunding Bond Los Angeles County CA RDA | | 5.00 | 7-1-2023 | 755,000 | 837,959 |
| Oakland CA Unified School District Alameda County Election of 2012 Series A | | 5.00 | 8-1-2022 | 750,000 | 800,333 |
| Oakland CA Unified School District Alameda County Election of 2012 Series A | | 5.00 | 8-1-2024 | 600,000 | 692,796 |
| Oakland CA Unified School District Refunding Bond | | 5.00 | 8-1-2025 | 1,540,000 | 1,842,810 |
| Oakland CA Unified School District Refunding Bond Measure B Series B | | 5.00 | 8-1-2026 | 500,000 | 615,970 |
| Oakland CA Unified School District Refunding Bond Measure J Series C | | 5.00 | 8-1-2025 | 795,000 | 951,321 |
| Palomar Pomerado Health CA CAB Electric Series A (National Insured)¤ | | 0.00 | 8-1-2025 | 1,000,000 | 949,770 |
| Redondo Beach CA Unified School Election of 2008 Series B | | 6.38 | 8-1-2034 | 670,000 | 871,335 |
| Sacramento CA City Unified School Election of 2012 Measure Q Series E | | 5.00 | 8-1-2029 | 1,500,000 | 1,837,830 |
| Sacramento CA City Unified School Refunding Bond | | 5.00 | 7-1-2022 | 485,000 | 514,566 |
| Sacramento CA City Unified School Refunding Bond | | 5.00 | 7-1-2026 | 2,430,000 | 2,476,632 |
| San Bernardino CA City Unified School District Refunding Bond Series A (AGM Insured) | | 1.25 | 8-1-2029 | 435,000 | 429,019 |
| San Bernardino CA City Unified School District Refunding Bond Series A (AGM Insured) | | 1.63 | 8-1-2031 | 850,000 | 847,773 |
| San Bernardino CA City Unified School District Refunding Bond Series A (AGM Insured) | | 4.00 | 8-1-2029 | 1,000,000 | 1,234,690 |
| San Bernardino CA City Unified School District Refunding Bond Series A (AGM Insured) | | 4.00 | 8-1-2031 | 875,000 | 1,082,366 |
| San Gorgonio CA Memorial Healthcare Refunding Bond | | 4.00 | 8-1-2027 | 1,090,000 | 1,243,505 |
| San Gorgonio CA Memorial Healthcare Refunding Bond | | 4.00 | 8-1-2030 | 580,000 | 671,895 |
| San Gorgonio CA Memorial Healthcare Refunding Bond | | 5.00 | 8-1-2021 | 275,000 | 281,595 |
| San Gorgonio CA Memorial Healthcare Refunding Bond | | 5.00 | 8-1-2022 | 500,000 | 531,880 |
| San Gorgonio CA Memorial Healthcare Refunding Bond | | 5.00 | 8-1-2023 | 1,000,000 | 1,098,080 |
| Sierra Kings CA Health Care Refunding Bond | | 4.00 | 8-1-2021 | 345,000 | 350,489 |
| Sierra Kings CA Health Care Refunding Bond | | 4.00 | 8-1-2022 | 425,000 | 443,233 |
| Sierra Kings CA Health Care Refunding Bond | | 4.00 | 8-1-2023 | 405,000 | 432,990 |
| Sierra Kings CA Health Care Refunding Bond | | 4.00 | 8-1-2024 | 420,000 | 459,824 |
| Soledad CA Unified School District BAN ¤ | | 0.00 | 8-1-2021 | 3,000,000 | 2,991,960 |
| SouthWestern Community College District Refunding Bond | | 5.00 | 8-1-2021 | 2,710,000 | 2,785,772 |
| Sweetwater CA Union High School District PFA Refunding Bond (BAM Insured) | | 5.00 | 8-1-2021 | 620,000 | 636,356 |
The accompanying notes are an integral part of these financial statements.
12 | Wells Fargo California Limited-Term Tax-Free Fund
Portfolio of investments—December 31, 2020 (unaudited)
| | | Interest
rate | Maturity
date | Principal | Value |
| GO revenue (continued) | | | | | |
| Vacaville CA Unified School District Series C (BAM Insured) | | 5.00% | 8-1-2022 | $ 675,000 | $ 726,611 |
| Vallejo City CA Unified School District Refunding Bond Series A (National Insured) | | 5.90 | 2-1-2022 | 3,905,000 | 4,114,464 |
| | | | | | 127,147,279 |
| Health revenue: 9.96% | | | | | |
| California HFFA Catholic Healthcare West Series A | | 5.25 | 3-1-2023 | 4,000,000 | 4,031,640 |
| California HFFA El Camino Hospital | | 5.00 | 2-1-2025 | 1,000,000 | 1,181,100 |
| California HFFA Memorial Health Services Series A | | 5.00 | 10-1-2023 | 2,475,000 | 2,679,559 |
| California HFFA Revenue Common Spirit Health Series A | | 5.00 | 4-1-2032 | 1,500,000 | 1,984,665 |
| California HFFA Revenue Health Series A | | 5.00 | 6-1-2031 | 3,990,000 | 5,292,456 |
| California HFFA Revenue On Lok Senior Health Services Social | | 3.00 | 8-1-2022 | 325,000 | 336,564 |
| California HFFA Revenue On Lok Senior Health Services Social | | 3.00 | 8-1-2025 | 475,000 | 516,021 |
| California HFFA Revenue On Lok Senior Health Services Social | | 3.00 | 8-1-2028 | 400,000 | 444,004 |
| California HFFA Revenue On Lok Senior Health Services Social | | 3.00 | 8-1-2030 | 210,000 | 234,217 |
| California HFFA Sutter Health Series A | | 5.00 | 11-15-2023 | 2,500,000 | 2,830,850 |
| California Municipal Finance Authority Community Medical Centers Series A | | 5.00 | 2-1-2023 | 735,000 | 800,871 |
| California Municipal Finance Authority Community Medical Centers Series A | | 5.00 | 2-1-2024 | 500,000 | 564,235 |
| California Municipal Finance Authority Revenue Community Medical Centers Series A | | 5.00 | 2-1-2025 | 1,000,000 | 1,167,000 |
| California Municipal Finance Authority Revenue Health Right 360 Series A 144A | | 5.00 | 11-1-2029 | 1,170,000 | 1,375,288 |
| California Municipal Finance Authority Revenue Insured Channing House Project Series A | | 5.00 | 5-15-2023 | 925,000 | 1,026,602 |
| California Municipal Finance Authority Revenue Insured Paradise Valley Estates Project Series B1 | | 2.25 | 7-1-2025 | 2,200,000 | 2,201,650 |
| California Municipal Finance Authority Revenue Insured Paradise Valley Estates Project Series B2 | | 2.00 | 7-1-2024 | 2,500,000 | 2,501,675 |
| California Municipal Finance Authority Revenue Refunding Bond Community Medical Centers Series A | | 5.00 | 2-1-2022 | 1,000,000 | 1,048,280 |
| California Municipal Finance Authority Revenue Refunding Bond Eisenhower Medical Center Series A | | 5.00 | 7-1-2027 | 1,650,000 | 2,024,699 |
| California Municipal Finance Authority Revenue Refunding Bond Eisenhower Medical Center Series A | | 5.00 | 7-1-2029 | 400,000 | 483,440 |
| California Statewide CDA Adventist Health Systems West Series A | | 5.00 | 3-1-2024 | 800,000 | 914,952 |
| California Statewide CDA Health Facilities Catholic Series F (AGM Insured)€ | | 0.17 | 7-1-2040 | 1,000,000 | 1,000,000 |
| California Statewide CDA Henry Mayo Newhall Memorial Hospital Series A (AGM Insured) | | 5.00 | 10-1-2021 | 500,000 | 516,075 |
| California Statewide CDA Henry Mayo Newhall Memorial Hospital Series A (AGM Insured) | | 5.00 | 10-1-2022 | 395,000 | 424,657 |
| California Statewide CDA Henry Mayo Newhall Memorial Hospital Series A (AGM Insured) | | 5.00 | 10-1-2023 | 500,000 | 560,330 |
| California Statewide CDA Huntington Memorial Hospital | | 5.00 | 7-1-2025 | 500,000 | 592,925 |
| California Statewide CDA Huntington Memorial Hospital | | 5.00 | 7-1-2026 | 500,000 | 611,235 |
| California Statewide CDA Loma Linda University Medical Center Series A 144A | | 5.00 | 12-1-2026 | 250,000 | 295,238 |
| California Statewide CDA Loma Linda University Medical Center Series A 144A | | 5.00 | 12-1-2027 | 300,000 | 359,460 |
The accompanying notes are an integral part of these financial statements.
Wells Fargo California Limited-Term Tax-Free Fund | 13
Portfolio of investments—December 31, 2020 (unaudited)
| | | Interest
rate | Maturity
date | Principal | Value |
| Health revenue (continued) | | | | | |
| California Statewide CDA Loma Linda University Medical Center Series A 144A | | 5.00% | 12-1-2028 | $ 250,000 | $ 299,995 |
| California Statewide CDA Revenue Emanate Health Series A | | 5.00 | 4-1-2028 | 755,000 | 980,322 |
| California Statewide CDA Revenue Emanate Health Series A | | 5.00 | 4-1-2029 | 795,000 | 1,054,981 |
| California Statewide CDA Revenue Emanate Health Series A | | 5.00 | 4-1-2031 | 1,465,000 | 1,956,420 |
| California Statewide CDA Viamonte Senior Living Project Series B | | 3.00 | 7-1-2025 | 3,000,000 | 3,005,580 |
| Palomar Health California Certificate of Participation Health & Arch Health Partners Incorporated | | 5.00 | 11-1-2021 | 275,000 | 284,444 |
| Palomar Health California Certificate of Participation Health & Arch Health Partners Incorporated | | 5.00 | 11-1-2022 | 375,000 | 403,553 |
| Palomar Health California Certificate of Participation Health & Arch Health Partners Incorporated | | 5.00 | 11-1-2023 | 300,000 | 335,031 |
| Palomar Health California Certificate of Participation Health & Arch Health Partners Incorporated | | 5.00 | 11-1-2024 | 300,000 | 347,109 |
| Palomar Health California Certificate of Participation Health & Arch Health Partners Incorporated | | 5.00 | 11-1-2025 | 330,000 | 393,106 |
| San Buenaventura CA Community Mental Health System | | 6.50 | 12-1-2021 | 2,585,000 | 2,694,061 |
| Sierra View CA Local Health Care District Revenue Refunding Bond | | 4.00 | 7-1-2023 | 500,000 | 538,595 |
| Sierra View CA Local Health Care District Revenue Refunding Bond | | 4.00 | 7-1-2025 | 580,000 | 654,588 |
| Sierra View CA Local Health Care District Revenue Refunding Bond | | 5.00 | 7-1-2027 | 630,000 | 769,558 |
| Sierra View CA Local Health Care District Revenue Refunding Bond | | 5.00 | 7-1-2029 | 630,000 | 790,165 |
| Washington Township CA Health Care District Refunding Bond Series A | | 4.00 | 7-1-2033 | 275,000 | 322,842 |
| Washington Township CA Health Care District Refunding Bond Series A | | 5.00 | 7-1-2023 | 600,000 | 661,524 |
| Washington Township CA Health Care District Refunding Bond Series A | | 5.00 | 7-1-2029 | 350,000 | 447,542 |
| Washington Township CA Health Care District Refunding Bond Series A | | 5.00 | 7-1-2030 | 300,000 | 389,349 |
| Washington Township CA Health Care District Refunding Bond Series A | | 5.00 | 7-1-2031 | 325,000 | 419,055 |
| | | | | | 54,747,508 |
| Housing revenue: 6.23% | | | | | |
| California Department of Veterans Affairs Home Purchase Series A | | 3.50 | 12-1-2021 | 855,000 | 866,149 |
| California HFA Municipal Certificate of Participation Series 2 Class A | | 4.00 | 3-20-2033 | 5,152,463 | 5,806,722 |
| California Independent Cities Finance Authority Mobile Home Park Revenue Refunding Bond Union City Tropics | | 4.25 | 5-15-2024 | 745,000 | 827,337 |
| California Municipal Finance Authority Housing Revenue Dino Papavero Apartments Project | | 1.50 | 6-1-2022 | 10,000,000 | 10,047,400 |
| California Municipal Finance Authority Peppertree Senior Apartments Series A (FHLMC Insured, FHLMC LIQ) | | 2.80 | 6-1-2023 | 2,500,000 | 2,646,600 |
| California Municipal Finance Authority Student Housing Davis I LLC West Village Student Housing Project | | 5.00 | 5-15-2024 | 1,200,000 | 1,344,696 |
| California Municipal Finance Authority Student Housing Davis I LLC West Village Student Housing Project | | 5.00 | 5-15-2025 | 3,435,000 | 3,957,910 |
| California Municipal Finance Authority Village Grove Apartments Series A (FHLMC Insured, FHLMC LIQ) | | 3.10 | 12-1-2021 | 1,000,000 | 1,025,480 |
The accompanying notes are an integral part of these financial statements.
14 | Wells Fargo California Limited-Term Tax-Free Fund
Portfolio of investments—December 31, 2020 (unaudited)
| | | Interest
rate | Maturity
date | Principal | Value |
| Housing revenue (continued) | | | | | |
| California Statewide CDA Lancer Educational Student Housing Project Series A 144A | | 3.00% | 6-1-2029 | $ 750,000 | $ 759,698 |
| California Statewide Enterprise Development Authority Student Housing Revenue Provident Group | | 5.00 | 8-1-2029 | 200,000 | 248,472 |
| California Statewide Enterprise Development Authority Student Housing Revenue Provident Group | | 5.00 | 8-1-2030 | 225,000 | 283,536 |
| FHLMC Multifamily Variable Rate Certificates Series M 057 Class A | | 2.40 | 10-15-2029 | 5,990,000 | 6,438,771 |
| | | | | | 34,252,771 |
| Industrial development revenue: 0.64% | | | | | |
| San Francisco CA City and County Airports Commission International Airport Revenue AMT Special Facilities Lease SFO Fuel Company Series 2019A | | 5.00 | 1-1-2025 | 3,000,000 | 3,494,970 |
| Miscellaneous revenue: 11.51% | | | | | |
| Alameda County CA Joint Powers Authority Multiple Capital Projects Series A | | 5.00 | 12-1-2021 | 1,000,000 | 1,044,226 |
| Brentwood CA Infrastructure Financing Authority Subordinate Bond Series B | | 4.00 | 9-2-2021 | 1,135,000 | 1,163,591 |
| California | | 5.00 | 9-1-2022 | 2,240,000 | 2,419,962 |
| California HFA Revenue Sanitary Francisco Supportive Housing | | 5.00 | 4-1-2031 | 730,000 | 995,625 |
| California HFA Revenue Sanitary Supportive Housing | | 5.00 | 4-1-2029 | 630,000 | 831,329 |
| California Infrastructure & Economic Development Bank Refunding Bond California Academy of Sciences Project Series C (1 Month LIBOR+0.38%)± | | 0.48 | 8-1-2047 | 4,000,000 | 3,999,600 |
| California Public Works Board Department of Corrections & Rehabilitation Series C | | 5.00 | 10-1-2022 | 1,500,000 | 1,625,460 |
| California Public Works Board Judicial Council Projects Series B | | 5.00 | 10-1-2022 | 500,000 | 541,820 |
| California Statewide CDA Refunding Bond (AGM Insured) | | 5.00 | 11-15-2021 | 200,000 | 208,166 |
| California Statewide CDA Refunding Bond (AGM Insured) | | 5.00 | 11-15-2022 | 200,000 | 217,510 |
| California Statewide Community Monterey County Savers Bond (BAM Insured) | | 5.00 | 8-1-2027 | 2,185,000 | 2,747,506 |
| Chula Vista CA Certificate of Participation Refunding Bond Police Facility Project | | 5.00 | 10-1-2021 | 720,000 | 745,286 |
| Compton CA PFA Lease 144A | | 4.00 | 9-1-2022 | 1,040,000 | 1,056,120 |
| Compton CA PFA Refunding Bond 144A | | 4.00 | 9-1-2027 | 2,000,000 | 2,068,000 |
| Desert Sands CA Unified School District Certificate of Participation (BAM Insured) | | 5.00 | 3-1-2024 | 1,500,000 | 1,719,615 |
| Golden Empire School California Financing Authority Refunding Bond Kern High School District | | 5.00 | 5-1-2021 | 1,000,000 | 1,015,250 |
| Inglewood CA Unified School District School Facilities Authority (AGM Insured) | | 5.25 | 10-15-2023 | 8,670,000 | 9,577,142 |
| Irvine CA Limited Obligation Improvement Bonds Reassessment District #15-2 | | 5.00 | 9-2-2023 | 800,000 | 894,208 |
| Irvine CA Limited Obligation Improvement Bonds Reassessment District #15-2 | | 5.00 | 9-2-2024 | 850,000 | 986,238 |
| Lodi CA PFA Electric Refunding Bond (AGM Insured) | | 5.00 | 9-1-2024 | 1,100,000 | 1,284,888 |
| Los Angeles CA Public Works Series D | | 5.00 | 12-1-2027 | 1,605,000 | 1,952,707 |
| Los Angeles CA Unified School District Certificate of Participation Headquarters Building Projects Series B | | 5.00 | 10-1-2025 | 1,875,000 | 2,019,750 |
| Mountain HFA California Utility System Revenue Refunding Bond Series A | | 5.00 | 12-1-2029 | 520,000 | 677,487 |
The accompanying notes are an integral part of these financial statements.
Wells Fargo California Limited-Term Tax-Free Fund | 15
Portfolio of investments—December 31, 2020 (unaudited)
| | | Interest
rate | Maturity
date | Principal | Value |
| Miscellaneous revenue (continued) | | | | | |
| Mountain HFA California Utility System Revenue Refunding Bond Series A | | 5.00% | 12-1-2030 | $ 710,000 | $ 917,164 |
| Mountain HFA California Utility System Revenue Refunding Bond Series A | | 5.00 | 12-1-2031 | 745,000 | 954,904 |
| Palo Alto CA Improvement Bond Act of 1915 University Area Off-Street Parking Assessment District | | 4.00 | 9-2-2021 | 450,000 | 461,394 |
| Sacramento CA City Financing Refunding Bond Master Lease Program Facilities (BAM Insured) | | 5.00 | 12-1-2022 | 800,000 | 873,640 |
| Sacramento CA City Schools Joint Powers Financing Authority Series A (BAM Insured) | | 5.00 | 3-1-2021 | 830,000 | 836,242 |
| Sacramento CA City Schools Joint Powers Financing Authority Series A (BAM Insured) | | 5.00 | 3-1-2022 | 775,000 | 818,191 |
| Sacramento CA City Schools Joint Powers Financing Authority Series A (BAM Insured) | | 5.00 | 3-1-2023 | 815,000 | 895,172 |
| San Joaquin CA Area Flood Control Agency Smith Canal Area Assessment District Assessment Revenue (AGM Insured) | | 5.00 | 10-1-2025 | 250,000 | 296,125 |
| San Joaquin CA Area Flood Control Agency Smith Canal Area Assessment District Assessment Revenue (AGM Insured) | | 5.00 | 10-1-2027 | 350,000 | 434,497 |
| San Joaquin CA Area Flood Control Agency Smith Canal Area Assessment District Assessment Revenue (AGM Insured) | | 5.00 | 10-1-2029 | 380,000 | 490,056 |
| Santa Clara County CA Financing Capital Projects Series A | | 4.00 | 2-1-2024 | 6,000,000 | 6,240,720 |
| Santa Cruz County CA Capital Financing Public Facilities Project (AGM Insured) | | 5.00 | 8-1-2021 | 125,000 | 128,334 |
| Santa Cruz County CA Capital Financing Public Facilities Project (AGM Insured) | | 5.00 | 8-1-2022 | 165,000 | 176,667 |
| Sutter Butte CA Flood Agency Assessment (BAM Insured) | | 5.00 | 10-1-2023 | 1,280,000 | 1,448,691 |
| Sutter Butte CA Flood Agency Assessment (BAM Insured) | | 5.00 | 10-1-2024 | 715,000 | 841,677 |
| Sutter Butte CA Flood Agency Assessment (BAM Insured) | | 5.00 | 10-1-2025 | 1,575,000 | 1,922,776 |
| Turlock CA PFA Water Revenue BAN | | 4.00 | 3-1-2027 | 5,000,000 | 5,119,100 |
| Visalia CA Certificate of Participation (AGM Insured) | | 4.00 | 12-1-2021 | 250,000 | 258,568 |
| Visalia CA Certificate of Participation (AGM Insured) | | 5.00 | 12-1-2022 | 335,000 | 362,751 |
| | | | | | 63,268,155 |
| Tax revenue: 18.00% | | | | | |
| California School Infrastructure Financing Agency Refunding Bond (AGM Insured) | | 5.00 | 9-1-2021 | 500,000 | 516,015 |
| California Statewide Community Facilities District #2015-01 | | 5.00 | 9-1-2027 | 450,000 | 513,576 |
| Carson CA RDA Project Area #1 Series A (AGM Insured) | | 5.00 | 10-1-2021 | 855,000 | 884,959 |
| Carson CA RDA Project Area #1 Series A (AGM Insured) | | 5.00 | 10-1-2022 | 600,000 | 647,778 |
| Cathedral City CA RDA Refunding Bond Merged Redevelopment Project Series A | | 5.00 | 8-1-2021 | 2,425,000 | 2,489,675 |
| Cathedral City CA RDA Refunding Bond Merged Redevelopment Project Series A | | 5.00 | 8-1-2022 | 2,550,000 | 2,725,721 |
| Cathedral City CA RDA Refunding Bond Merged Redevelopment Project Series A | | 5.00 | 8-1-2023 | 1,735,000 | 1,939,001 |
| Cathedral City CA RDA Refunding Bond Merged Redevelopment Project Series A (AGM Insured) | | 5.00 | 8-1-2024 | 1,770,000 | 2,056,032 |
| Chino CA PFA Local Agency Series A (AGM Insured) | | 5.00 | 9-1-2022 | 1,830,000 | 1,962,437 |
| Chino CA PFA Local Agency Series A (AGM Insured) | | 5.00 | 9-1-2024 | 660,000 | 761,812 |
| Commerce CA RDA CAB Project #1 ¤ | | 0.00 | 8-1-2021 | 290,000 | 289,487 |
| Commerce CA Successor Agency to the Community Development Commission Refunding Bond Series A (AGM Insured) | | 5.00 | 8-1-2023 | 600,000 | 670,218 |
The accompanying notes are an integral part of these financial statements.
16 | Wells Fargo California Limited-Term Tax-Free Fund
Portfolio of investments—December 31, 2020 (unaudited)
| | | Interest
rate | Maturity
date | Principal | Value |
| Tax revenue (continued) | | | | | |
| Dinuba CA RDA Successor Agency to Merged City Project #2 (BAM Insured) | | 5.00% | 9-1-2021 | $ 250,000 | $ 257,975 |
| Dinuba CA RDA Successor Agency to Merged City Project #2 (BAM Insured) | | 5.00 | 9-1-2022 | 250,000 | 268,913 |
| Fairfield CA RDA Successor Agency Tax Allocation Refunding Bond | | 5.00 | 8-1-2021 | 3,170,000 | 3,258,094 |
| Fairfield CA RDA Successor Agency Tax Allocation Refunding Bond | | 5.00 | 8-1-2022 | 2,395,000 | 2,563,967 |
| Fairfield CA RDA Successor Agency Tax Allocation Refunding Bond | | 5.00 | 8-1-2023 | 1,025,000 | 1,144,956 |
| Fremont CA Community Facilities District | | 5.00 | 9-1-2024 | 1,000,000 | 1,146,450 |
| Garden Grove CA Agency Community Refunding Bond Garden Grove Community Project (BAM Insured) | | 4.00 | 10-1-2021 | 770,000 | 792,114 |
| Garden Grove CA Agency Community Refunding Bond Garden Grove Community Project (BAM Insured) | | 5.00 | 10-1-2022 | 3,015,000 | 3,255,084 |
| Hollister CA RDA Refunding Bond Hollister Community Development Project (BAM Insured) | | 5.00 | 10-1-2026 | 700,000 | 815,353 |
| Inglewood CA Redevelopment Refunding Bond Subordinate Lien Merged Redevelopment Project (BAM Insured) | | 5.00 | 5-1-2025 | 1,000,000 | 1,194,730 |
| Irwindale CA CDA City Industrial Development Project (AGM Insured) | | 5.00 | 7-15-2021 | 340,000 | 348,548 |
| Irwindale CA CDA City Industrial Development Project (AGM Insured) | | 5.00 | 7-15-2022 | 365,000 | 390,488 |
| Irwindale CA CDA City Industrial Development Project (AGM Insured) | | 5.00 | 7-15-2023 | 375,000 | 418,144 |
| La Quinta CA RDA Project Areas #1 & 2 Series A | | 5.00 | 9-1-2021 | 565,000 | 583,024 |
| La Quinta CA RDA Project Areas #1 & 2 Series A | | 5.00 | 9-1-2022 | 615,000 | 661,525 |
| Lancaster CA RDA Refunding Bond Combined Redevelopment Project Areas (AGM Insured) | | 5.00 | 8-1-2024 | 870,000 | 1,009,922 |
| Lancaster CA RDA Refunding Bond Combined Redevelopment Project Areas (AGM Insured) | | 5.00 | 8-1-2029 | 400,000 | 484,308 |
| Lincoln CA Special Tax Refunding Bond Community Facilities District #2003-1 Lincoln Crossing Project | | 4.00 | 9-1-2024 | 600,000 | 680,490 |
| Lincoln CA Special Tax Refunding Bond Community Facilities District #2003-1 Lincoln Crossing Project | | 5.00 | 9-1-2025 | 550,000 | 667,090 |
| Menifee CA Union School District Public Series A | | 4.00 | 9-1-2022 | 540,000 | 566,617 |
| Oakdale CA Successor Agency to Oakdale Community RDA Series A (AGM Insured) | | 5.00 | 6-1-2027 | 350,000 | 430,210 |
| Orange County CA Community Facilities #2015-1 Esencia Village Series A | | 5.00 | 8-15-2023 | 365,000 | 404,015 |
| Orange County CA Community Facilities #2015-1 Esencia Village Series A | | 5.00 | 8-15-2025 | 325,000 | 384,709 |
| Pittsburg CA Successor Agency of Los Medanos Community Development (AGM Insured) | | 5.00 | 8-1-2021 | 1,885,000 | 1,937,497 |
| Pittsburg CA Successor Agency of Los Medanos Community Development (AGM Insured) | | 5.00 | 8-1-2022 | 1,305,000 | 1,399,195 |
| Pittsburg CA Successor Agency of Los Medanos Community Development (AGM Insured) | | 5.00 | 8-1-2023 | 780,000 | 871,283 |
| Poway CA Unified School District PFA (BAM Insured) | | 4.00 | 10-1-2021 | 185,000 | 190,313 |
| Poway CA Unified School District PFA Series B (BAM Insured) | | 5.00 | 9-1-2024 | 1,115,000 | 1,299,310 |
| Poway CA Unified School District PFA Series B (BAM Insured) | | 5.00 | 9-1-2025 | 775,000 | 937,200 |
| Rialto CA RDA Successor Agency to Merged Project Area | | 5.00 | 9-1-2022 | 475,000 | 510,112 |
| Riverside CA PFA Local Measure Certificate of Participation Riverside Pavement Rehabilitation Project (AGM Insured) | | 5.00 | 6-1-2023 | 845,000 | 943,003 |
The accompanying notes are an integral part of these financial statements.
Wells Fargo California Limited-Term Tax-Free Fund | 17
Portfolio of investments—December 31, 2020 (unaudited)
| | | Interest
rate | Maturity
date | Principal | Value |
| Tax revenue (continued) | | | | | |
| Roseville CA Finance Authority Special Refunding Bond Series A | | 5.00% | 9-1-2023 | $ 400,000 | $ 451,136 |
| Roseville CA Finance Authority Special Refunding Bond Series A | | 5.00 | 9-1-2029 | 300,000 | 384,879 |
| Roseville CA Special Tax Refunding Bond Community Facilities District | | 5.00 | 9-1-2021 | 500,000 | 513,830 |
| Roseville CA Special Tax Refunding Bond Fiddyment Ranch Community | | 5.00 | 9-1-2024 | 1,905,000 | 2,188,445 |
| Roseville CA Special Tax Refunding Bond Fiddyment Ranch Community | | 5.00 | 9-1-2029 | 1,595,000 | 1,957,591 |
| Sacramento CA Transient Occupancy Tax Revenue Convention Center Complex Senior | | 5.00 | 6-1-2027 | 575,000 | 705,519 |
| Sacramento CA Transportation Authority Sales Tax Refunding Bond Series A (Sumitomo Mitsui Banking Corporation LOC)ø | | 0.05 | 10-1-2038 | 12,000,000 | 12,000,000 |
| San Francisco CA City & County RDA Successor Agency to Community Facilities District #6 Mission Bay South Series A | | 5.00 | 8-1-2025 | 1,600,000 | 1,708,944 |
| San Francisco CA City & County RDA Successor Agency to Mission Bay South Redevelopment Project Series A | | 5.00 | 8-1-2022 | 375,000 | 401,948 |
| San Francisco CA City & County RDA Successor Agency to Mission Bay South Redevelopment Project Subordinate Bond Series D 144A | | 3.00 | 8-1-2021 | 1,020,000 | 1,032,485 |
| San Jose CA Convention Center Expansion & Renovation Project | | 5.25 | 5-1-2023 | 1,465,000 | 1,480,558 |
| San Marcos CA Unified School District Community Facilities District #5 (BAM Insured) | | 5.00 | 9-1-2021 | 270,000 | 278,648 |
| San Marcos CA Unified School District Community Facilities District #5 (BAM Insured) | | 5.00 | 9-1-2022 | 250,000 | 270,128 |
| San Pablo CA RDA Series B (AGM Insured) | | 5.00 | 6-15-2021 | 1,775,000 | 1,810,571 |
| San Pablo CA RDA Series B (AGM Insured) | | 5.00 | 6-15-2022 | 1,865,000 | 1,984,509 |
| San Pablo CA RDA Series B (AGM Insured) | | 5.00 | 6-15-2023 | 1,945,000 | 2,158,503 |
| Stockton CA RDA Refunding Bond Series A (AGM Insured) | | 5.00 | 9-1-2025 | 1,675,000 | 2,025,561 |
| Successor Agency to the Morgan Hill CA RDA Series A | | 5.00 | 9-1-2021 | 1,055,000 | 1,088,581 |
| Successor Agency to the Richmond CA Community RDA Series A (BAM Insured) | | 4.50 | 9-1-2025 | 160,000 | 182,205 |
| Successor Agency to the Richmond CA Community RDA Series A (BAM Insured) | | 5.00 | 9-1-2021 | 310,000 | 319,805 |
| Successor Agency to the Richmond CA Community RDA Series A (BAM Insured) | | 5.00 | 9-1-2022 | 300,000 | 324,048 |
| Successor Agency to the Richmond CA Community RDA Series A (BAM Insured) | | 5.00 | 9-1-2023 | 265,000 | 298,652 |
| Successor Agency to the Richmond CA Community RDA Series A (BAM Insured) | | 5.00 | 9-1-2025 | 150,000 | 174,705 |
| Successor Agency to the Riverside County CA RDA Desert Communities Project Area Series D | | 5.00 | 10-1-2022 | 445,000 | 478,250 |
| Successor Agency to the Riverside County CA RDA Desert Communities Project Area Series D | | 5.00 | 10-1-2023 | 470,000 | 524,802 |
| Successor Agency to the Riverside County CA RDA Project Area #1 Series A | | 5.00 | 10-1-2022 | 240,000 | 257,933 |
| Successor Agency to the Riverside County CA RDA Project Area #1 Series A | | 5.00 | 10-1-2023 | 460,000 | 513,636 |
| Tracy CA Community Facilities District | | 4.00 | 9-1-2021 | 140,000 | 142,708 |
| Tracy CA Community Facilities District | | 4.00 | 9-1-2022 | 180,000 | 188,422 |
| Tracy CA Community Facilities District | | 4.00 | 9-1-2024 | 135,000 | 147,987 |
| Tracy CA Community Facilities District | | 4.00 | 9-1-2025 | 155,000 | 173,457 |
The accompanying notes are an integral part of these financial statements.
18 | Wells Fargo California Limited-Term Tax-Free Fund
Portfolio of investments—December 31, 2020 (unaudited)
| | | Interest
rate | Maturity
date | Principal | Value |
| Tax revenue (continued) | | | | | |
| Tracy CA Community Facilities District | | 5.00% | 9-1-2028 | $ 425,000 | $ 502,945 |
| Transbay Joint Powers Authority Green Subordinated Bond Tax Allocation Bond Series B | | 2.40 | 10-1-2049 | 1,820,000 | 1,850,157 |
| Transbay Joint Powers Authority Green Tax Allocation Bond Senior Series A | | 5.00 | 10-1-2029 | 500,000 | 654,375 |
| Transbay Joint Powers Authority Green Tax Allocation Bond Senior Series A | | 5.00 | 10-1-2030 | 500,000 | 658,565 |
| Transbay Joint Powers Authority Green Tax Allocation Bond Senior Series A | | 5.00 | 10-1-2031 | 400,000 | 524,260 |
| Tustin CA Community Facilities District #6-1 Legacy Columbus Villages Series A | | 5.00 | 9-1-2025 | 1,000,000 | 1,210,830 |
| Upland CA Successor Agency to Merged Project Tax Allocation Bond (AGM Insured) | | 5.00 | 9-1-2023 | 1,000,000 | 1,120,740 |
| Vacaville CA RDA Tax Allocation Subordinate Refunding Bond Redevelopment Projects | | 5.00 | 9-1-2021 | 600,000 | 618,816 |
| Vacaville CA RDA Tax Allocation Subordinate Refunding Bond Redevelopment Projects | | 5.00 | 9-1-2022 | 1,050,000 | 1,126,346 |
| Val Verde CA Unified School District (BAM Insured) | | 4.00 | 10-1-2021 | 375,000 | 385,429 |
| Val Verde CA Unified School District (BAM Insured) | | 5.00 | 10-1-2022 | 665,000 | 717,954 |
| Western Placer CA Unified School District Special Tax BAN Community Facilities | | 2.00 | 6-1-2025 | 2,000,000 | 2,071,280 |
| Western Placer CA Unified School District Special Tax BAN Community Facilities | | 2.00 | 6-1-2025 | 5,000,000 | 5,158,700 |
| Yuba City CA RDA Refunding Bond (AGM Insured) | | 5.00 | 9-1-2025 | 750,000 | 906,968 |
| | | | | | 98,947,161 |
| Tobacco revenue: 1.47% | | | | | |
| California County CA Tobacco Securitization Agency Settlement Senior Refunding Bond Series A | | 5.00 | 6-1-2030 | 450,000 | 616,496 |
| California County CA Tobacco Securitization Agency Settlement Senior Refunding Bond Series A | | 5.00 | 6-1-2031 | 550,000 | 748,407 |
| California County CA Tobacco Securitization Agency Settlement Senior Refunding Bond Series A | | 5.00 | 6-1-2032 | 300,000 | 404,586 |
| California County CA Tobacco Securitization Agency Settlement Subordinate Refunding Bond Series B1 | | 1.75 | 6-1-2030 | 750,000 | 787,238 |
| California County CA Tobacco Securitization Agency Tabacco Settlement Revenue Sonoma County Securitization | | 5.00 | 6-1-2029 | 500,000 | 667,505 |
| California County CA Tobacco Securitization Agency Tabacco Settlement Revenue Sonoma County Securitization | | 5.00 | 6-1-2030 | 200,000 | 271,428 |
| California County CA Tobacco Securitization Agency Tabacco Settlement Revenue Sonoma County Securitization | | 5.00 | 6-1-2031 | 225,000 | 304,875 |
| California County CA Tobacco Securitization Agency Tabacco Settlement Revenue Sonoma County Securitization | | 5.00 | 6-1-2032 | 250,000 | 336,535 |
| Golden State Tobacco Securitization Corporation Tobacco Settlement Refunding Bond Series A1 | | 5.00 | 6-1-2026 | 3,000,000 | 3,663,480 |
| Tobacco Securitization Authority Tobacco Settlement Revenue Refunding Bond Asset Backed Senior Series B1 Class 2 | | 2.25 | 6-1-2029 | 290,000 | 292,868 |
| | | | | | 8,093,418 |
The accompanying notes are an integral part of these financial statements.
Wells Fargo California Limited-Term Tax-Free Fund | 19
Portfolio of investments—December 31, 2020 (unaudited)
| | | Interest
rate | Maturity
date | Principal | Value |
| Utilities revenue: 0.28% | | | | | |
| Southern California Public Power Authority Refunding Bond Canyon Power Project Series A | | 5.00% | 7-1-2027 | $ 1,000,000 | $ 1,023,740 |
| Walnut CA Energy Center Authority Refunding Bond Series A | | 5.00 | 1-1-2021 | 500,000 | 500,000 |
| | | | | | 1,523,740 |
| Water & sewer revenue: 4.02% | | | | | |
| Eastern California Municipal Water District Refunding Bond Series C (SIFMA Municipal Swap+0.25%)± | | 0.34 | 7-1-2046 | 3,000,000 | 3,000,900 |
| Florin CA Resource Conservation District Series A (National Insured) | | 5.00 | 9-1-2021 | 1,250,000 | 1,288,363 |
| Florin CA Resource Conservation District Series A (National Insured) | | 5.00 | 9-1-2022 | 1,250,000 | 1,346,300 |
| Lower Tule River Irrigation District California Revenue Refunding Bond Series A | | 5.00 | 8-1-2031 | 700,000 | 895,286 |
| Middle Fork CA Project Finance Authority Revenue Refunding Bond | | 5.00 | 4-1-2029 | 3,525,000 | 4,441,394 |
| Oxnard CA Financing Authority Refunding Bond (AGM Insured) | | 5.00 | 6-1-2021 | 735,000 | 749,509 |
| San Francisco City & County CA Public Utilities Commission Series C Green Bond | | 2.13 | 10-1-2048 | 10,000,000 | 10,394,800 |
| | | | | | 22,116,552 |
| | | | | | 515,276,512 |
| Guam: 1.00% | | | | | |
| Airport revenue: 0.26% | | | | | |
| Guam Port Authority AMT Series B | | 5.00 | 7-1-2023 | 540,000 | 583,675 |
| Guam Port Authority AMT Series B | | 5.00 | 7-1-2024 | 750,000 | 833,085 |
| | | | | | 1,416,760 |
| Miscellaneous revenue: 0.74% | | | | | |
| Guam Education Financing Foundation Certificate of Participation Refunding Bond Series A | | 5.00 | 10-1-2023 | 3,840,000 | 4,101,466 |
| | | | | | 5,518,226 |
| Illinois: 2.50% | | | | | |
| Miscellaneous revenue: 2.04% | | | | | |
| Illinois Refunding Bond | | 5.00 | 2-1-2025 | 10,000,000 | 11,239,800 |
| Tax revenue: 0.46% | | | | | |
| Metropolitan Pier & Exposition Authority McCormick Place Expansion Project Series B | | 5.00 | 12-15-2025 | 650,000 | 751,056 |
| Sales Tax Securitization Corporation Series 2017A | | 5.00 | 1-1-2026 | 1,500,000 | 1,782,585 |
| | | | | | 2,533,641 |
| | | | | | 13,773,441 |
| Louisiana: 0.18% | | | �� | | |
| Industrial development revenue: 0.18% | | | | | |
| St. James Parish LA Nucor Steel LLC Project Gulf Opportunity Zone Series A-1 ø | | 0.16 | 11-1-2040 | 1,000,000 | 1,000,000 |
The accompanying notes are an integral part of these financial statements.
20 | Wells Fargo California Limited-Term Tax-Free Fund
Portfolio of investments—December 31, 2020 (unaudited)
| | | Interest
rate | Maturity
date | Principal | Value |
| New Jersey: 0.23% | | | | | |
| Tax revenue: 0.23% | | | | | |
| New Jersey Statewide Covid-19 Emergency Series A | | 5.00% | 6-1-2027 | $ 1,000,000 | $ 1,250,700 |
| New York: 1.19% | | | | | |
| Industrial development revenue: 1.19% | | | | | |
| New York Transportation Development Corporation Special Facilities Revenue Delta Air Lines Incorporated LaGuardia Airport Terminals C&D Redevelopment | | 5.00 | 1-1-2029 | 5,000,000 | 6,033,300 |
| New York Transportation Development Corporation Special Facilities Revenue Terminal 4 John F Kennedy International Airport | | 5.00 | 12-1-2032 | 400,000 | 508,704 |
| | | | | | 6,542,004 |
| Texas: 0.58% | | | | | |
| Industrial development revenue: 0.58% | | | | | |
| Houston TX Airport System AMT Revenue Refunding Bond United Airlines Incorporated Terminal E Project | | 5.00 | 7-1-2029 | 3,000,000 | 3,184,950 |
| Total Municipal obligations (Cost $525,168,863) | | | | | 546,545,833 |
| | | Yield | | Shares | |
| Short-term investments: 0.91% | | | | | |
| Investment companies: 0.91% | | | | | |
| Wells Fargo Municipal Cash Management Money Market Fund Institutional Class ♠∞## | | 0.01% | | 4,980,330 | $ 4,981,824 |
| Total Short-term investments (Cost $4,981,632) | | | | | 4,981,824 |
| Total investments in securities (Cost $531,150,495) | 100.49% | | | | 552,527,657 |
| Other assets and liabilities, net | (0.49) | | | | (2,705,783) |
| Total net assets | 100.00% | | | | $549,821,874 |
| 144A | The security may be resold in transactions exempt from registration, normally to qualified institutional buyers, pursuant to Rule 144A under the Securities Act of 1933. |
| ø | Variable rate demand notes are subject to a demand feature which reduces the effective maturity. The maturity date shown represents the final maturity date of the security. The interest rate is determined and reset by the issuer daily, weekly, or monthly depending upon the terms of the security. The rate shown is the rate in effect at period end. |
| ## | All or a portion of this security is segregated for when-issued securities. |
| ± | Variable rate investment. The rate shown is the rate in effect at period end. |
| ¤ | The security is issued in zero coupon form with no periodic interest payments. |
| € | The security is an auction-rate security which has an interest rate that resets at predetermined short-term intervals through a Dutch auction. The rate shown is the rate in effect at period end. |
| ♠ | The issuer of the security is an affiliated person of the Fund as defined in the Investment Company Act of 1940. |
| ∞ | The rate represents the 7-day annualized yield at period end. |
| %% | The security is purchased on a when-issued basis. |
The accompanying notes are an integral part of these financial statements.
Wells Fargo California Limited-Term Tax-Free Fund | 21
Portfolio of investments—December 31, 2020 (unaudited)
| Abbreviations: |
| AGM | Assured Guaranty Municipal |
| AMT | Alternative minimum tax |
| BAM | Build America Mutual Assurance Company |
| BAN | Bond anticipation notes |
| CAB | Capital appreciation bond |
| CDA | Community Development Authority |
| FHLMC | Federal Home Loan Mortgage Corporation |
| GO | General obligation |
| HFA | Housing Finance Authority |
| HFFA | Health Facilities Financing Authority |
| LIBOR | London Interbank Offered Rate |
| LIQ | Liquidity agreement |
| LOC | Letter of credit |
| National | National Public Finance Guarantee Corporation |
| PFA | Public Finance Authority |
| RDA | Redevelopment Authority |
| SIFMA | Securities Industry and Financial Markets Association |
Investments in affiliates
An affiliated investment is an investment in which the Fund owns at least 5% of the outstanding voting shares of the issuer or as a result of other relationships, such as the Fund and the issuer having the same investment manager. Transactions with issuers that were either affiliated persons of the Fund at the beginning of the period or the end of the period were as follows:
| | Value,
beginning of
period | Purchases | Sales
proceeds | Net
realized
gains
(losses) | Net
change in
unrealized
gains
(losses) | Value,
end of
period | % of
net
assets | Shares,
end
of period | Income
from
affiliated
securities |
| Short-term investments | | | | | | | | | |
| Investment companies | | | | | | | | | |
| Wells Fargo Municipal Cash Management Money Market Fund Institutional Class | $0 | $126,651,290 | $(121,671,321) | $1,663 | $192 | $4,981,824 | 0.91% | 4,980,330 | $838 |
The accompanying notes are an integral part of these financial statements.
22 | Wells Fargo California Limited-Term Tax-Free Fund
Statement of assets and liabilities—December 31, 2020 (unaudited)
| | |
| Assets | |
Investments in unaffiliated securities, at value (cost $526,168,863)
| $ 547,545,833 |
Investments in affiliated securites, at value (cost $4,981,632)
| 4,981,824 |
Receivable for interest
| 5,987,082 |
Receivable for Fund shares sold
| 284,072 |
Prepaid expenses and other assets
| 23,274 |
Total assets
| 558,822,085 |
| Liabilities | |
Payable for when-issued transactions
| 7,418,586 |
Payable for Fund shares redeemed
| 567,761 |
Payable for investments purchased
| 388,581 |
Dividends payable
| 321,440 |
Management fee payable
| 187,268 |
Administration fees payable
| 50,423 |
Distribution fee payable
| 4,910 |
Trustees’ fees and expenses payable
| 2,946 |
Accrued expenses and other liabilities
| 58,296 |
Total liabilities
| 9,000,211 |
Total net assets
| $549,821,874 |
| Net assets consist of | |
Paid-in capital
| $ 537,741,931 |
Total distributable earnings
| 12,079,943 |
Total net assets
| $549,821,874 |
| Computation of net asset value and offering price per share | |
Net assets – Class A
| $ 109,728,469 |
Shares outstanding – Class A1
| 10,161,756 |
Net asset value per share – Class A
| $10.80 |
Maximum offering price per share – Class A2
| $11.02 |
Net assets – Class C
| $ 6,830,330 |
Shares outstanding – Class C1
| 632,680 |
Net asset value per share – Class C
| $10.80 |
Net assets – Administrator Class
| $ 33,507,505 |
Shares outstanding – Administrator Class1
| 3,151,052 |
Net asset value per share – Administrator Class
| $10.63 |
Net assets – Institutional Class
| $ 399,755,570 |
Shares outstanding – Institutional Class1
| 37,615,780 |
Net asset value per share – Institutional Class
| $10.63 |
| 1 | The Fund has an unlimited number of authorized shares |
| 2 | Maximum offering price is computed as 100/98 of net asset value. On investments of $50,000 or more, the offering price is reduced. |
The accompanying notes are an integral part of these financial statements.
Wells Fargo California Limited-Term Tax-Free Fund | 23
Statement of operations—six months ended December 31, 2020 (unaudited)
| | |
| Investment income | |
Interest
| $ 6,473,673 |
Income from affiliated securities
| 838 |
Total investment income
| 6,474,511 |
| Expenses | |
Management fee
| 1,129,493 |
| Administration fees | |
Class A
| 88,786 |
Class C
| 8,131 |
Administrator Class
| 17,803 |
Institutional Class
| 164,596 |
| Shareholder servicing fees | |
Class A
| 138,728 |
Class C
| 12,662 |
Administrator Class
| 44,082 |
| Distribution fee | |
Class C
| 37,958 |
Custody and accounting fees
| 14,852 |
Professional fees
| 24,310 |
Registration fees
| 30,165 |
Shareholder report expenses
| 17,888 |
Trustees’ fees and expenses
| 9,874 |
Other fees and expenses
| 10,429 |
Total expenses
| 1,749,757 |
| Less: Fee waivers and/or expense reimbursements | |
Fund-level
| (61,658) |
Class A
| (12,655) |
Class C
| (1,045) |
Administrator Class
| (16,266) |
Net expenses
| 1,658,133 |
Net investment income
| 4,816,378 |
| Realized and unrealized gains (losses) on investments | |
| Net realized gains on | |
Unaffiliated securities
| 1,694 |
Affiliated securities
| 1,663 |
Net realized gains on investments
| 3,357 |
| Net change in unrealized gains (losses) on | |
Unaffiliated securities
| 4,498,709 |
Affiliated securities
| 192 |
Net change in unrealized gains (losses) on investments
| 4,498,901 |
Net realized and unrealized gains (losses) on investments
| 4,502,258 |
Net increase in net assets resulting from operations
| $9,318,636 |
The accompanying notes are an integral part of these financial statements.
24 | Wells Fargo California Limited-Term Tax-Free Fund
Statement of changes in net assets
| | |
| | Six months ended
December 31, 2020
(unaudited) | Year ended
June 30, 2020 |
| Operations | | | | |
Net investment income
| | $ 4,816,378 | | $ 10,591,143 |
Net realized gains (losses) on investments
| | 3,357 | | (2,011,911) |
Net change in unrealized gains (losses) on investments
| | 4,498,901 | | 156,794 |
Net increase in net assets resulting from operations
| | 9,318,636 | | 8,736,026 |
| Distributions to shareholders from | | | | |
| Net investment income and net realized gains | | | | |
Class A
| | (821,241) | | (1,951,518) |
Class C
| | (37,213) | | (155,931) |
Administrator Class
| | (298,982) | | (1,557,961) |
Institutional Class
| | (3,659,676) | | (6,927,187) |
Total distributions to shareholders
| | (4,817,112) | | (10,592,597) |
| Capital share transactions | Shares | | Shares | |
| Proceeds from shares sold | | | | |
Class A
| 1,164,206 | 12,509,440 | 3,369,604 | 36,073,328 |
Class C
| 7,151 | 77,065 | 88,077 | 949,155 |
Administrator Class
| 73,655 | 779,599 | 1,703,444 | 18,088,534 |
Institutional Class
| 9,160,280 | 96,972,111 | 19,764,617 | 207,728,606 |
| | | 110,338,215 | | 262,839,623 |
| Reinvestment of distributions | | | | |
Class A
| 69,755 | 750,610 | 167,382 | 1,796,887 |
Class C
| 3,299 | 35,492 | 13,502 | 145,080 |
Administrator Class
| 27,784 | 294,336 | 146,796 | 1,555,763 |
Institutional Class
| 191,724 | 2,030,378 | 351,574 | 3,712,830 |
| | | 3,110,816 | | 7,210,560 |
| Payment for shares redeemed | | | | |
Class A
| (1,175,538) | (12,646,217) | (2,891,560) | (30,846,221) |
Class C
| (496,827) | (5,336,794) | (834,983) | (8,963,587) |
Administrator Class
| (420,247) | (4,449,292) | (8,618,652) | (91,158,851) |
Institutional Class
| (7,854,597) | (83,106,198) | (14,430,301) | (152,265,703) |
| | | (105,538,501) | | (283,234,362) |
Net increase (decrease) in net assets resulting from capital share transactions
| | 7,910,530 | | (13,184,179) |
Total increase (decrease) in net assets
| | 12,412,054 | | (15,040,750) |
| Net assets | | | | |
Beginning of period
| | 537,409,820 | | 552,450,570 |
End of period
| | $ 549,821,874 | | $ 537,409,820 |
The accompanying notes are an integral part of these financial statements.
Wells Fargo California Limited-Term Tax-Free Fund | 25
Financial highlights
(For a share outstanding throughout each period)
| | | Year ended June 30 |
| Class A | Six months ended
December 31, 2020
(unaudited) | 2020 | 2019 | 2018 | 2017 | 2016 |
Net asset value, beginning of period
| $10.71 | $10.76 | $10.61 | $10.79 | $11.04 | $10.83 |
Net investment income
| 0.08 | 0.19 | 0.20 | 0.19 | 0.18 | 0.17 |
Net realized and unrealized gains (losses) on investments
| 0.09 | (0.05) | 0.15 | (0.18) | (0.25) | 0.21 |
Total from investment operations
| 0.17 | 0.14 | 0.35 | 0.01 | (0.07) | 0.38 |
| Distributions to shareholders from | | | | | | |
Net investment income
| (0.08) | (0.19) | (0.20) | (0.19) | (0.18) | (0.17) |
Net asset value, end of period
| $10.80 | $10.71 | $10.76 | $10.61 | $10.79 | $11.04 |
Total return1
| 1.59% | 1.30% | 3.33% | 0.05% | (0.64)% | 3.54% |
| Ratios to average net assets (annualized) | | | | | | |
Gross expenses
| 0.85% | 0.85% | 0.85% | 0.84% | 0.83% | 0.83% |
Net expenses
| 0.80% | 0.80% | 0.80% | 0.80% | 0.80% | 0.80% |
Net investment income
| 1.48% | 1.76% | 1.87% | 1.73% | 1.65% | 1.56% |
| Supplemental data | | | | | | |
Portfolio turnover rate
| 9% | 27% | 11% | 45% | 21% | 21% |
Net assets, end of period (000s omitted)
| $109,728 | $108,189 | $101,765 | $119,657 | $148,933 | $196,629 |
| 1 | Total return calculations do not include any sales charges. Returns for periods of less than one year are not annualized. |
The accompanying notes are an integral part of these financial statements.
26 | Wells Fargo California Limited-Term Tax-Free Fund
Financial highlights
(For a share outstanding throughout each period)
| | | Year ended June 30 |
| Class C | Six months ended
December 31, 2020
(unaudited) | 2020 | 2019 | 2018 | 2017 | 2016 |
Net asset value, beginning of period
| $10.71 | $10.76 | $10.61 | $10.79 | $11.04 | $10.83 |
Net investment income
| 0.04 1 | 0.11 1 | 0.12 | 0.11 | 0.10 | 0.09 |
Net realized and unrealized gains (losses) on investments
| 0.09 | (0.05) | 0.15 | (0.18) | (0.25) | 0.21 |
Total from investment operations
| 0.13 | 0.06 | 0.27 | (0.07) | (0.15) | 0.30 |
| Distributions to shareholders from | | | | | | |
Net investment income
| (0.04) | (0.11) | (0.12) | (0.11) | (0.10) | (0.09) |
Net asset value, end of period
| $10.80 | $10.71 | $10.76 | $10.61 | $10.79 | $11.04 |
Total return2
| 1.21% | 0.54% | 2.56% | (0.70)% | (1.38)% | 2.76% |
| Ratios to average net assets (annualized) | | | | | | |
Gross expenses
| 1.59% | 1.60% | 1.60% | 1.59% | 1.58% | 1.58% |
Net expenses
| 1.55% | 1.55% | 1.55% | 1.55% | 1.55% | 1.55% |
Net investment income
| 0.73% | 1.01% | 1.12% | 0.98% | 0.90% | 0.81% |
| Supplemental data | | | | | | |
Portfolio turnover rate
| 9% | 27% | 11% | 45% | 21% | 21% |
Net assets, end of period (000s omitted)
| $6,830 | $11,981 | $19,929 | $26,868 | $34,113 | $40,098 |
| 1 | Calculated based upon average shares outstanding |
| 2 | Total return calculations do not include any sales charges. Returns for periods of less than one year are not annualized. |
The accompanying notes are an integral part of these financial statements.
Wells Fargo California Limited-Term Tax-Free Fund | 27
Financial highlights
(For a share outstanding throughout each period)
| | | Year ended June 30 |
| Administrator Class | Six months ended
December 31, 2020
(unaudited) | 2020 | 2019 | 2018 | 2017 | 2016 |
Net asset value, beginning of period
| $10.55 | $10.60 | $10.45 | $10.63 | $10.87 | $10.66 |
Net investment income
| 0.09 1 | 0.21 1 | 0.22 | 0.20 1 | 0.20 | 0.19 |
Net realized and unrealized gains (losses) on investments
| 0.08 | (0.05) | 0.15 | (0.18) | (0.24) | 0.21 |
Total from investment operations
| 0.17 | 0.16 | 0.37 | 0.02 | (0.04) | 0.40 |
| Distributions to shareholders from | | | | | | |
Net investment income
| (0.09) | (0.21) | (0.22) | (0.20) | (0.20) | (0.19) |
Net asset value, end of period
| $10.63 | $10.55 | $10.60 | $10.45 | $10.63 | $10.87 |
Total return2
| 1.61% | 1.50% | 3.56% | 0.23% | (0.38)% | 3.78% |
| Ratios to average net assets (annualized) | | | | | | |
Gross expenses
| 0.78% | 0.78% | 0.79% | 0.78% | 0.77% | 0.77% |
Net expenses
| 0.60% | 0.60% | 0.60% | 0.60% | 0.60% | 0.60% |
Net investment income
| 1.68% | 1.95% | 2.07% | 1.93% | 1.84% | 1.75% |
| Supplemental data | | | | | | |
Portfolio turnover rate
| 9% | 27% | 11% | 45% | 21% | 21% |
Net assets, end of period (000s omitted)
| $33,508 | $36,591 | $108,484 | $133,581 | $162,747 | $226,581 |
| 1 | Calculated based upon average shares outstanding |
| 2 | Returns for periods of less than one year are not annualized. |
The accompanying notes are an integral part of these financial statements.
28 | Wells Fargo California Limited-Term Tax-Free Fund
Financial highlights
(For a share outstanding throughout each period)
| | | Year ended June 30 |
| Institutional Class | Six months ended
December 31, 2020
(unaudited) | 2020 | 2019 | 2018 | 2017 | 2016 |
Net asset value, beginning of period
| $10.54 | $10.59 | $10.44 | $10.62 | $10.86 | $10.66 |
Net investment income
| 0.10 | 0.22 | 0.23 | 0.21 | 0.21 | 0.20 |
Net realized and unrealized gains (losses) on investments
| 0.09 | (0.05) | 0.15 | (0.18) | (0.24) | 0.20 |
Total from investment operations
| 0.19 | 0.17 | 0.38 | 0.03 | (0.03) | 0.40 |
| Distributions to shareholders from | | | | | | |
Net investment income
| (0.10) | (0.22) | (0.23) | (0.21) | (0.21) | (0.20) |
Net asset value, end of period
| $10.63 | $10.54 | $10.59 | $10.44 | $10.62 | $10.86 |
Total return1
| 1.76% | 1.60% | 3.66% | 0.33% | (0.28)% | 3.79% |
| Ratios to average net assets (annualized) | | | | | | |
Gross expenses
| 0.52% | 0.52% | 0.52% | 0.51% | 0.50% | 0.50% |
Net expenses
| 0.50% | 0.50% | 0.50% | 0.50% | 0.50% | 0.50% |
Net investment income
| 1.78% | 2.06% | 2.17% | 2.03% | 1.95% | 1.86% |
| Supplemental data | | | | | | |
Portfolio turnover rate
| 9% | 27% | 11% | 45% | 21% | 21% |
Net assets, end of period (000s omitted)
| $399,756 | $380,649 | $322,273 | $325,973 | $370,824 | $351,080 |
| 1 | Returns for periods of less than one year are not annualized. |
The accompanying notes are an integral part of these financial statements.
Wells Fargo California Limited-Term Tax-Free Fund | 29
Notes to financial statements (unaudited)
1. ORGANIZATION
Wells Fargo Funds Trust (the “Trust”), a Delaware statutory trust organized on March 10, 1999, is an open-end management investment company registered under the Investment Company Act of 1940, as amended (the “1940 Act”). As an investment company, the Trust follows the accounting and reporting guidance in Financial Accounting Standards Board (“FASB”) Accounting Standards Codification Topic 946, Financial Services – Investment Companies. These financial statements report on the Wells Fargo California Limited-Term Tax-Free Fund (the “Fund”) which is a diversified series of the Trust.
2. SIGNIFICANT ACCOUNTING POLICIES
The following significant accounting policies, which are consistently followed in the preparation of the financial statements of the Fund, are in conformity with U.S. generally accepted accounting principles which require management to make estimates and assumptions that affect the reported amounts of assets and liabilities, disclosure of contingent assets and liabilities at the date of the financial statements, and the reported amounts of income and expenses during the reporting period. Actual results could differ from those estimates.
Securities valuation
All investments are valued each business day as of the close of regular trading on the New York Stock Exchange (generally 4 p.m. Eastern Time), although the Fund may deviate from this calculation time under unusual or unexpected circumstances.
Debt securities are valued at the evaluated bid price provided by an independent pricing service (e.g. taking into account various factors, including yields, maturities, or credit ratings) or, if a reliable price is not available, the quoted bid price from an independent broker-dealer.
Investments in registered open-end investment companies are valued at net asset value.
Investments which are not valued using any of the methods discussed above are valued at their fair value, as determined in good faith by the Board of Trustees of the Fund. The Board of Trustees has established a Valuation Committee comprised of the Trustees and has delegated to it the authority to take any actions regarding the valuation of portfolio securities that the Valuation Committee deems necessary or appropriate, including determining the fair value of portfolio securities, unless the determination has been delegated to the Wells Fargo Asset Management Pricing Committee at Wells Fargo Funds Management, LLC ("Funds Management"). The Board of Trustees retains the authority to make or ratify any valuation decisions or approve any changes to the Valuation Procedures as it deems appropriate. On a quarterly basis, the Board of Trustees receives reports on any valuation actions taken by the Valuation Committee or the Wells Fargo Asset Management Pricing Committee which may include items for ratification.
When-issued transactions
The Fund may purchase securities on a forward commitment or when-issued basis. The Fund records a when-issued transaction on the trade date and will segregate assets in an amount at least equal in value to the Fund's commitment to purchase when-issued securities. Securities purchased on a when-issued basis are marked-to-market daily and the Fund begins earning interest on the settlement date. Losses may arise due to changes in the market value of the underlying securities or if the counterparty does not perform under the contract.
Security transactions and income recognition
Securities transactions are recorded on a trade date basis. Realized gains or losses are recorded on the basis of identified cost.
Interest income is accrued daily and bond discounts are accreted and premiums are amortized daily. To the extent debt obligations are placed on non-accrual status, any related interest income may be reduced by writing off interest receivables when the collection of all or a portion of interest has been determined to be doubtful based on consistently applied procedures and the fair value has decreased. If the issuer subsequently resumes interest payments or when the collectability of interest is reasonably assured, the debt obligation is removed from non-accrual status.
Distributions to shareholders
Distributions to shareholders from net investment income are declared daily and paid monthly. Distributions from net realized gains, if any, are recorded on the ex-dividend date and paid at least annually. Such distributions are determined in accordance with income tax regulations and may differ from U.S. generally accepted accounting principles. Dividend sources are estimated at the time of declaration. The tax character of distributions is determined as of the Fund’s fiscal year end. Therefore, a portion of the Fund’s distributions made prior to the Fund’s fiscal year end may be categorized as a tax return of capital at year end.
30 | Wells Fargo California Limited-Term Tax-Free Fund
Notes to financial statements (unaudited)
Federal and other taxes
The Fund intends to continue to qualify as a regulated investment company by distributing substantially all of its investment company taxable and tax-exempt income and any net realized capital gains (after reduction for capital loss carryforwards) sufficient to relieve it from all, or substantially all, federal income taxes. Accordingly, no provision for federal income taxes was required.
The Fund’s income and federal excise tax returns and all financial records supporting those returns for the prior three fiscal years are subject to examination by the federal and Delaware revenue authorities. Management has analyzed the Fund’s tax positions taken on federal, state, and foreign tax returns for all open tax years and does not believe that there are any uncertain tax positions that require recognition of a tax liability.
As of December 31, 2020, the aggregate cost of all investments for federal income tax purposes was $531,150,495 and the unrealized gains (losses) consisted of:
| Gross unrealized gains | $21,850,805 |
| Gross unrealized losses | (473,643) |
| Net unrealized gains | $21,377,162 |
As of June 30, 2020, the Fund had capital loss carryforwards which consisted of $7,970,774 in short-term capital losses and $2,043,017 in long-term capital losses.
Class allocations
The separate classes of shares offered by the Fund differ principally in applicable sales charges, distribution, shareholder servicing, and administration fees. Class specific expenses are charged directly to that share class. Investment income, common fund-level expenses, and realized and unrealized gains (losses) on investments are allocated daily to each class of shares based on the relative proportion of net assets of each class.
3. FAIR VALUATION MEASUREMENTS
Fair value measurements of investments are determined within a framework that has established a fair value hierarchy based upon the various data inputs utilized in determining the value of the Fund’s investments. The three-level hierarchy gives the highest priority to unadjusted quoted prices in active markets for identical assets or liabilities (Level 1) and the lowest priority to unobservable inputs (Level 3). The Fund’s investments are classified within the fair value hierarchy based on the lowest level of input that is significant to the fair value measurement. The inputs are summarized into three broad levels as follows:
| ■ | Level 1 – quoted prices in active markets for identical securities |
| ■ | Level 2 – other significant observable inputs (including quoted prices for similar securities, interest rates, prepayment speeds, credit risk, etc.) |
| ■ | Level 3 – significant unobservable inputs (including the Fund’s own assumptions in determining the fair value of investments) |
The inputs or methodologies used for valuing investments in securities are not necessarily an indication of the risk associated with investing in those securities.
The following is a summary of the inputs used in valuing the Fund’s assets and liabilities as of December 31, 2020:
| | Quoted prices
(Level 1) | Other significant
observable inputs
(Level 2) | Significant
unobservable inputs
(Level 3) | Total |
| Assets | | | | |
| Investments in: | | | | |
| Closed end municipal bond fund obligations | $ 0 | $ 1,000,000 | $0 | $ 1,000,000 |
| Municipal obligations | 0 | 546,545,833 | 0 | 546,545,833 |
| Short-term investments | | | | |
| Investment companies | 4,981,824 | 0 | 0 | 4,981,824 |
| Total assets | $4,981,824 | $547,545,833 | $0 | $552,527,657 |
Wells Fargo California Limited-Term Tax-Free Fund | 31
Notes to financial statements (unaudited)
Additional sector, industry or geographic detail is included in the Portfolio of Investments.
For the six months ended December 31, 2020, the Fund did not have any transfers into/out of Level 3.
4. TRANSACTIONS WITH AFFILIATES
Management fee
Funds Management, an indirect wholly owned subsidiary of Wells Fargo & Company (“Wells Fargo”), is the manager of the Fund and provides advisory and fund-level administrative services under an investment management agreement. Under the investment management agreement, Funds Management is responsible for, among other services, implementing the investment objectives and strategies of the Fund, supervising the subadviser and providing fund-level administrative services in connection with the Fund’s operations. As compensation for its services under the investment management agreement, Funds Management is entitled to receive a management fee at the following annual rate based on the Fund’s average daily net assets:
| Average daily net assets | Management fee |
| First $500 million | 0.400% |
| Next $500 million | 0.375 |
| Next $2 billion | 0.350 |
| Next $2 billion | 0.325 |
| Next $5 billion | 0.290 |
| Over $10 billion | 0.280 |
For the six months ended December 31, 2020, the management fee was equivalent to an annual rate of 0.40% of the Fund’s average daily net assets.
Funds Management has retained the services of a subadviser to provide daily portfolio management to the Fund. The fee for subadvisory services is borne by Funds Management. Wells Capital Management, Incorporated, an affiliate of Funds Management and an indirect wholly owned subsidiary of Wells Fargo, is the subadviser to the Fund and is entitled to receive a fee from Funds Management at an annual rate starting at 0.15% and declining to 0.05% as the average daily net assets of the Fund increase.
Administration fees
Under a class-level administration agreement, Funds Management provides class-level administrative services to the Fund, which includes paying fees and expenses for services provided by the transfer agent, sub-transfer agents, omnibus account servicers and record-keepers. As compensation for its services under the class-level administration agreement, Funds Management receives an annual fee which is calculated based on the average daily net assets of each class as follows:
| | Class-level
administration fee |
| Class A | 0.16% |
| Class C | 0.16 |
| Administrator Class | 0.10 |
| Institutional Class | 0.08 |
Waivers and/or expense reimbursements
Funds Management has contractually waived and/or reimbursed management and administration fees to the extent necessary to maintain certain net operating expense ratios for the Fund. When each class of the Fund has exceeded its expense cap, Funds Management has waived fees and/or reimbursed expenses from fund-level expenses on a proportionate basis and then from class specific expenses. When only certain classes exceed their expense caps, waivers and/or reimbursements are applied against class specific expenses before fund-level expenses. Funds Management has committed through October 31, 2021 to waive fees and/or reimburse expenses to the extent necessary to cap the Fund’s expenses at 0.80% for Class A shares, 1.55% for Class C shares, 0.60% for Administrator Class shares and 0.50% for Institutional Class shares. Prior to or after the commitment expiration date, the cap may be increased or the commitment to maintain the cap may be terminated only with the approval of the Board of Trustees.
32 | Wells Fargo California Limited-Term Tax-Free Fund
Notes to financial statements (unaudited)
Distribution fee
The Trust has adopted a distribution plan for Class C shares of the Fund pursuant to Rule 12b-1 under the 1940 Act. A distribution fee is charged charged to Class C shares and paid to Wells Fargo Funds Distributor, LLC (“Funds Distributor”), the principal underwriter, at an annual rate of 0.75% of the average daily net assets of Class C shares.
In addition, Funds Distributor is entitled to receive the front-end sales charge from the purchase of Class A shares and a contingent deferred sales charge on the redemption of certain Class A shares. Funds Distributor is also entitled to receive the contingent deferred sales charges from redemptions of Class C shares. For the six months ended December 31, 2020, Funds Distributor received $591 from the sale of Class A shares. No contingent deferred sales charges were incurred by Class A and Class C shares for the six months ended December 31, 2020.
Shareholder servicing fees
The Trust has entered into contracts with one or more shareholder servicing agents, whereby Class A, Class C, and Administrator Class of the Fund are charged a fee at an annual rate of 0.25% of the average daily net assets of each respective class. A portion of these total shareholder servicing fees were paid to affiliates of Wells Fargo.
Interfund transactions
The Fund may purchase or sell portfolio investment securities to certain other Wells Fargo affiliates pursuant to Rule 17a-7 under the 1940 Act and under procedures adopted by the Board of Trustees. The procedures have been designed to ensure that these interfund transactions, which do not incur broker commissions, are effected at current market prices. Pursuant to these procedures, the Fund had $40,127,000, $38,010,000 and $0 in interfund purchases, sales and net realized gains (losses), respectively, during the six months ended December 31, 2020.
5. INVESTMENT PORTFOLIO TRANSACTIONS
Purchases and sales of investments, excluding U.S. government obligations (if any) and short-term securities, for the six months ended December 31, 2020 were $62,709,423 and $49,547,027, respectively.
6. BANK BORROWINGS
The Trust (excluding the money market funds), Wells Fargo Master Trust and Wells Fargo Variable Trust are parties to a $350,000,000 revolving credit agreement whereby the Fund is permitted to use bank borrowings for temporary or emergency purposes, such as to fund shareholder redemption requests. Interest under the credit agreement is charged to the Fund based on a borrowing rate equal to the higher of the Federal Funds rate in effect on that day plus 1.25% or the overnight LIBOR rate in effect on that day plus 1.25%. In addition, an annual commitment fee equal to 0.25% of the unused balance is allocated to each participating fund.
For the six months ended December 31, 2020, there were no borrowings by the Fund under the agreement.
7. CONCENTRATION RISK
The Fund invests a substantial portion of its assets in issuers of municipal debt securities located in a single state or territory of the U.S. Therefore, it may be more affected by economic and political developments in that state or region than would be a comparable general tax-exempt fund. As of the end of the period, the Fund invested a concentration of its portfolio in the state of California.
8. INDEMNIFICATION
Under the Fund's organizational documents, the officers and Trustees have been granted certain indemnification rights against certain liabilities that may arise out of performance of their duties to the Fund. The Fund has entered into a separate agreement with each Trustee that converts indemnification rights currently existing under the Fund’s organizational documents into contractual rights that cannot be changed in the future without the consent of the Trustee. Additionally, in the normal course of business, the Fund may enter into contracts with service providers that contain a variety of indemnification clauses. The Fund’s maximum exposure under these arrangements is dependent on future claims that may be made against the Fund and, therefore, cannot be estimated.
9. NEW ACCOUNTING PRONOUNCEMENT
In August 2018, FASB issued Accounting Standards Update (“ASU”) No. 2018-13, Fair Value Measurement (Topic 820) Disclosure Framework - Changes to the Disclosure Requirements for Fair Value Measurement. ASU 2018-13 updates the disclosure requirements on fair value measurements in Topic 820, Fair Value Measurements. The amendments are effective for fiscal years,
Wells Fargo California Limited-Term Tax-Free Fund | 33
Notes to financial statements (unaudited)
and interim periods within those fiscal years, beginning after December 15, 2019. Management has adopted this guidance which did not have a material impact on the financial statements.
10. SUBSEQUENT EVENT
On February 23, 2021, Wells Fargo announced that it has entered into a definitive agreement to sell Wells Fargo Asset Management (“WFAM”) to GTCR LLC and Reverence Capital Partners, L.P. WFAM is the trade name used by the asset management businesses of Wells Fargo and includes Wells Fargo Funds Management, LLC, the investment manager to the Fund, Wells Capital Management Incorporated and Wells Fargo Asset Management (International) Limited, both registered investment advisers providing sub-advisory services to certain funds, and Wells Fargo Funds Distributor, LLC, the Fund’s principal underwriter. As part of the transaction, Wells Fargo will own a 9.9% equity interest and will continue to serve as an important client and distribution partner.
Consummation of the transaction will result in the automatic termination of the Fund’s investment management agreement and sub-advisory agreement(s). The Fund’s Board of Trustees will be asked to approve new investment management arrangements with the new company. If approved by the Board, the new investment management arrangements with the new company will be presented to the shareholders of the Fund for approval, and, if approved by shareholders, would take effect upon the closing of the transaction. The transaction is expected to close in the second half of 2021, subject to customary closing conditions.
11. CORONAVIRUS (COVID-19) PANDEMIC
On March 11, 2020, the World Health Organization announced that it had made the assessment that coronavirus disease 2019 (“COVID-19”) is a pandemic. The impacts of COVID-19 are affecting the entire global economy, individual companies and investment products, and the market in general. There is significant uncertainty around the extent and duration of business disruptions related to COVID-19 and the impacts may be short term or may last for an extended period of time. The risk of further spreading of COVID-19 has led to significant uncertainty and volatility in the financial markets.
34 | Wells Fargo California Limited-Term Tax-Free Fund
Other information (unaudited)
PROXY VOTING INFORMATION
A description of the policies and procedures used to determine how to vote proxies relating to portfolio securities is available without charge, upon request, by calling 1-800-222-8222, visiting our website at wfam.com, or visiting the SEC website at sec.gov. Information regarding how the proxies related to portfolio securities were voted during the most recent 12-month period ended June 30 is available on the website at wfam.com or by visiting the SEC website at sec.gov.
QUARTERLY PORTFOLIO HOLDINGS INFORMATION
The Fund files its complete schedule of portfolio holdings with the SEC for the first and third quarters of each fiscal year as an exhibit to its reports on Form N-PORT. Shareholders may view the filed Form N-PORT by visiting the SEC website at sec.gov.
Wells Fargo California Limited-Term Tax-Free Fund | 35
Other information (unaudited)
BOARD OF TRUSTEES AND OFFICERS
Each of the Trustees and Officers1 listed in the table below acts in identical capacities for each fund in the Wells Fargo family of funds, which consists of 144 mutual funds comprising the Wells Fargo Funds Trust, Wells Fargo Variable Trust, Wells Fargo Master Trust and four closed-end funds (collectively the “Fund Complex”). This table should be read in conjunction with the Prospectus and the Statement of Additional Information2. The mailing address of each Trustee and Officer is 525 Market Street, 12th Floor, San Francisco, CA 94105. Each Trustee and Officer serves an indefinite term, however, each Trustee serves such term until reaching the mandatory retirement age established by the Trustees.
Independent Trustees
Name and
year of birth | Position held and
length of service* | Principal occupations during past five years or longer | Current other
public company or
investment
company
directorships |
William R. Ebsworth
(Born 1957) | Trustee,
since 2015 | Retired. From 1984 to 2013, equities analyst, portfolio manager, research director and chief investment officer at Fidelity Management and Research Company in Boston, Tokyo, and Hong Kong, and retired in 2013 as Chief Investment Officer of Fidelity Strategic Advisers, Inc. where he led a team of investment professionals managing client assets. Prior thereto, Board member of Hong Kong Securities Clearing Co., Hong Kong Options Clearing Corp., the Thailand International Fund, Ltd., Fidelity Investments Life Insurance Company, and Empire Fidelity Investments Life Insurance Company. Audit Committee Chair and Investment Committee Chair of the Vincent Memorial Hospital Endowment (non-profit organization). Mr. Ebsworth is a CFA® charterholder. | N/A |
Jane A. Freeman
(Born 1953) | Trustee,
since 2015;
Chair Liaison,
since 2018 | Retired. From 2012 to 2014 and 1999 to 2008, Chief Financial Officer of Scientific Learning Corporation. From 2008 to 2012, Ms. Freeman provided consulting services related to strategic business projects. Prior to 1999, Portfolio Manager at Rockefeller & Co. and Scudder, Stevens & Clark. Board member of the Harding Loevner Funds from 1996 to 2014, serving as both Lead Independent Director and chair of the Audit Committee. Board member of the Russell Exchange Traded Funds Trust from 2011 to 2012 and the chair of the Audit Committee. Ms. Freeman is also an inactive Chartered Financial Analyst. | N/A |
Isaiah Harris, Jr.
(Born 1952) | Trustee,
since 2009; Audit
Committee
Chair,
since 2019 | Retired. Chairman of the Board of CIGNA Corporation since 2009, and Director since 2005. From 2003 to 2011, Director of Deluxe Corporation. Prior thereto, President and CEO of BellSouth Advertising and Publishing Corp. from 2005 to 2007, President and CEO of BellSouth Enterprises from 2004 to 2005 and President of BellSouth Consumer Services from 2000 to 2003. Emeritus member of the Iowa State University Foundation Board of Governors. Emeritus Member of the Advisory Board of Iowa State University School of Business. Advisory Board Member, Palm Harbor Academy (private school). Mr. Harris is a certified public accountant (inactive status). | CIGNA Corporation |
Judith M. Johnson
(Born 1949) | Trustee,
since 2008 | Retired. Prior thereto, Chief Executive Officer and Chief Investment Officer of Minneapolis Employees Retirement Fund from 1996 to 2008. Ms. Johnson is an attorney, certified public accountant and a certified managerial accountant. | N/A |
David F. Larcker
(Born 1950) | Trustee,
since 2009 | James Irvin Miller Professor of Accounting at the Graduate School of Business (Emeritus), Stanford University, Director of the Corporate Governance Research Initiative and Senior Faculty of The Rock Center for Corporate Governance since 2006. From 2005 to 2008, Professor of Accounting at the Graduate School of Business, Stanford University. Prior thereto, Ernst & Young Professor of Accounting at The Wharton School, University of Pennsylvania from 1985 to 2005. | N/A |
36 | Wells Fargo California Limited-Term Tax-Free Fund
Other information (unaudited)
Name and
year of birth | Position held and
length of service* | Principal occupations during past five years or longer | Current other
public company or
investment
company
directorships |
Olivia S. Mitchell
(Born 1953) | Trustee,
since 2006;
Nominating and
Governance
Committee Chair,
since 2018 | International Foundation of Employee Benefit Plans Professor, Wharton School of the University of Pennsylvania since 1993. Director of Wharton’s Pension Research Council and Boettner Center on Pensions & Retirement Research, and Research Associate at the National Bureau of Economic Research. Previously, Cornell University Professor from 1978 to 1993. | N/A |
Timothy J. Penny
(Born 1951) | Trustee,
since 1996;
Chair,
since 2018 | President and Chief Executive Officer of Southern Minnesota Initiative Foundation, a non-profit organization, since 2007. Member of the Board of Trustees of NorthStar Education Finance, Inc., a non-profit organization, since 2007. | N/A |
James G. Polisson
(Born 1959) | Trustee,
since 2018 | Retired. Chief Marketing Officer, Source (ETF) UK Services, Ltd, from 2015 to 2017. From 2012 to 2015, Principal of The Polisson Group, LLC, a management consulting, corporate advisory and principal investing company. Chief Executive Officer and Managing Director at Russell Investments, Global Exchange Traded Funds from 2010 to 2012. Managing Director of Barclays Global Investors from 1998 to 2010 and Global Chief Marketing Officer for iShares and Barclays Global Investors from 2000 to 2010. Trustee of the San Francisco Mechanics’ Institute, a non-profit organization, from 2013 to 2015. Board member of the Russell Exchange Traded Fund Trust from 2011 to 2012. Director of Barclays Global Investors Holdings Deutschland GmbH from 2006 to 2009. Mr. Polisson is an attorney and has a retired status with the Massachusetts and District of Columbia Bar Associations. | N/A |
Pamela Wheelock
(Born 1959) | Trustee,
since January
2020; previously
Trustee from
January 2018 to
July 2019 | Board member of the Destination Medical Center Economic Development Agency, Rochester, Minnesota since 2019. Interim President of the McKnight Foundation from January to September 2020. Acting Commissioner, Minnesota Department of Human Services, July 2019 through September 2019. Human Services Manager (part-time), Minnesota Department of Human Services, October 2019 through December 2019. Chief Operating Officer, Twin Cities Habitat for Humanity from 2017 to 2019. Vice President of University Services, University of Minnesota from 2012 to 2016. Prior thereto, on the Board of Directors, Governance Committee and Finance Committee for the Minnesota Philanthropy Partners (Saint Paul Foundation) from 2012 to 2018, Interim Chief Executive Officer of Blue Cross Blue Shield of Minnesota from 2011 to 2012, Chairman of the Board from 2009 to 2012 and Board Director from 2003 to 2015. Vice President, Leadership and Community Engagement, Bush Foundation, Saint Paul, Minnesota (a private foundation) from 2009 to 2011. Executive Vice President and Chief Financial Officer, Minnesota Sports and Entertainment from 2004 to 2009 and Senior Vice President from 2002 to 2004. Executive Vice President of the Minnesota Wild Foundation from 2004 to 2008. Commissioner of Finance, State of Minnesota, from 1999 to 2002. Currently Board Chair of the Minnesota Wild Foundation since 2010. | N/A |
* Length of service dates reflect the Trustee’s commencement of service with the Trust’s predecessor entities, where applicable.
Wells Fargo California Limited-Term Tax-Free Fund | 37
Other information (unaudited)
Officers
Name and
year of birth | Position held and
length of service | Principal occupations during past five years or longer |
Andrew Owen
(Born 1960) | President,
since 2017 | Executive Vice President of Wells Fargo & Company and Head of Affiliated Managers, Wells Fargo Asset Management, since 2014. In addition, Mr. Owen is currently President, Chief Executive Officer and Director of Wells Fargo Funds Management, LLC since 2017. Prior thereto, Executive Vice President responsible for marketing, investments and product development for Wells Fargo Funds Management, LLC, from 2009 to 2014. |
Nancy Wiser1
(Born 1967) | Treasurer,
since 2012 | Executive Vice President of Wells Fargo Funds Management, LLC since 2011. Chief Operating Officer and Chief Compliance Officer at LightBox Capital Management LLC, from 2008 to 2011. |
Michelle Rhee
(Born 1966) | Chief Legal Officer,
since 2019 | Secretary of Wells Fargo Funds Management, LLC and Chief Legal Counsel of Wells Fargo Asset Management since 2018. Deputy General Counsel of Wells Fargo Bank N.A. since 2020 and Assistant General Counsel of Wells Fargo Bank, N.A. from 2018 to 2020. Associate General Counsel and Managing Director of Bank of America Corporation from 2004 to 2018. |
Catherine Kennedy
(Born 1969) | Secretary,
since 2019 | Vice President of Wells Fargo Funds Management, LLC and Senior Counsel of the Wells Fargo Legal Department since 2010. Vice President and Senior Counsel of Evergreen Investment Management Company, LLC from 1998 to 2010. |
Michael H. Whitaker
(Born 1967) | Chief Compliance Officer,
since 2016 | Chief Compliance Officer of Wells Fargo Asset Management since 2016. Senior Vice President and Chief Compliance Officer for Fidelity Investments from 2007 to 2016. |
Jeremy DePalma1
(Born 1974) | Assistant Treasurer,
since 2009 | Senior Vice President of Wells Fargo Funds Management, LLC since 2009. Senior Vice President of Evergreen Investment Management Company, LLC from 2008 to 2010 and head of the Fund Reporting and Control Team within Fund Administration from 2005 to 2010. |
1 Nancy Wiser acts as Treasurer of 67 funds in the Fund Complex. Jeremy DePalma acts as the Treasurer of 77 funds and Assistant Treasurer of 67 funds in the Fund Complex.
2 The Statement of Additional Information includes additional information about the Trustees and is available, without charge, upon request, by calling 1-800-222-8222 or by visiting the website at wfam.com.
38 | Wells Fargo California Limited-Term Tax-Free Fund
For more information
More information about Wells Fargo Funds is available free upon request. To obtain literature, please write, visit the Fund's website, or call:
Wells Fargo Funds
P.O. Box 219967
Kansas City, MO 64121-9967
Website: wfam.com
Individual investors: 1-800-222-8222
Retail investment professionals: 1-888-877-9275
Institutional investment professionals: 1-866-765-0778
This report and the financial statements contained herein are submitted for the general information of the shareholders of the Fund. If this report is used for promotional purposes, distribution of the report must be accompanied or preceded by a current prospectus. Before investing, please consider the investment objectives, risks, charges, and expenses of the investment. For a current prospectus and, if available, a summary prospectus, containing this information, call 1-800-222-8222 or visit the Fund’s website at wfam.com. Read the prospectus carefully before you invest or send money.
Wells Fargo Asset Management (WFAM) is the trade name for certain investment advisory/management firms owned by Wells Fargo & Company. These firms include but are not limited to Wells Capital Management Incorporated and Wells Fargo Funds Management, LLC. Certain products managed by WFAM entities are distributed by Wells Fargo Funds Distributor, LLC (a broker-dealer and Member FINRA).
This material is for general informational and educational purposes only and is NOT intended to provide investment advice or a recommendation of any kind— including a recommendation for any specific investment, strategy, or plan.
INVESTMENT PRODUCTS: NOT FDIC INSURED ■ NO BANK GUARANTEE ■ MAY LOSE VALUE
© 2021 Wells Fargo & Company. All rights reserved.
PAR-0121-00272 02-21
SA248/SAR248 12-20
Semi-Annual Report
December 31, 2020
Wells Fargo
California Tax-Free Fund
Reduce clutter.
Save trees.
Sign up for electronic delivery of prospectuses and shareholder reports at wellsfargo.com/ advantagedelivery
The views expressed and any forward-looking statements are as of December 31, 2020, unless otherwise noted, and are those of the Fund's portfolio managers and/or Wells Fargo Asset Management. Discussions of individual securities or the markets generally are not intended as individual recommendations. Future events or results may vary significantly from those expressed in any forward-looking statements. The views expressed are subject to change at any time in response to changing circumstances in the market. Wells Fargo Asset Management and the Fund disclaim any obligation to publicly update or revise any views expressed or forward-looking statements.
INVESTMENT PRODUCTS: NOT FDIC INSURED ■ NO BANK GUARANTEE ■ MAY LOSE VALUE
Wells Fargo California Tax-Free Fund | 1
Letter to shareholders (unaudited)
Dear Shareholder:
We are pleased to offer you this semi-annual report for the Wells Fargo California Tax-Free Fund for the six-month period that ended December 31, 2020. Despite a deeply challenging year, dominated by the spread of COVID-19 cases and a sharp drop in economic output throughout much of the world, global stocks performed extremely well, benefiting from ongoing central bank support and rising optimism over the development and distribution of effective COVID-19 vaccines. Bonds also had positive returns, led by global bonds and high-yield bonds.
For the six-month period, U.S. stocks, based on the S&P 500 Index,1 gained 22.16%. International stocks, as measured by the MSCI ACWI ex USA Index (Net),2 returned 24.33%, while the MSCI EM Index (Net),3 had even stronger performance, with a 31.14% gain. Among bond indexes, the Bloomberg Barclays U.S. Aggregate Bond Index,4 returned 1.29%, the Bloomberg Barclays Global Aggregate ex-USD Index (unhedged),5 gained 9.44%, and the Bloomberg Barclays Municipal Bond Index,6 returned 3.07% while the ICE BofA U.S. High Yield Index,7 gained a hefty 11.49%.
The stock market rally continued in July.
After a volatile first half of the year, an existing stock market rally continued in July with strong results for equities and fixed income. However, economic data and a resurgence of COVID-19 cases underscored the urgent need to regain control of the pandemic. Second-quarter gross domestic product (GDP) shrank from the previous quarter by 9.5% and 12.1% in the U.S. and the eurozone, respectively. In contrast, China’s second-quarter GDP grew 3.2% year over year. The U.S. economy added 1.8 million jobs in July, but a double-digit jobless rate persisted.
The stock market continued to rally in August despite concerns over rising numbers of U.S. and European COVID-19 cases as well as the expiration of the $600 weekly bonus unemployment benefit in July. Relatively strong second-quarter earnings boosted investor sentiment along with the U.S. Federal Reserve’s announcement of a monetary policy shift expected to support longer-term low interest rates. U.S. manufacturing and services activity indexes beat expectations, while the U.S. housing market maintained strength. In Europe, retail sales expanded and consumer confidence was steady. China’s economy continued to expand.
Andrew Owen
President
Wells Fargo Funds
“After a volatile first half of the year, an existing stock market rally continued in July with strong results for equities and fixed income.”
| 1 | The S&P 500 Index consists of 500 stocks chosen for market size, liquidity, and industry group representation. It is a market-value-weighted index with each stock's weight in the index proportionate to its market value. You cannot invest directly in an index. |
| 2 | The Morgan Stanley Capital International (MSCI) All Country World Index (ACWI) ex USA Index (Net) is a free-float-adjusted market-capitalization-weighted index that is designed to measure the equity market performance of developed and emerging markets, excluding the United States. Source: MSCI. MSCI makes no express or implied warranties or representations and shall have no liability whatsoever with respect to any MSCI data contained herein. The MSCI data may not be further redistributed or used as a basis for other indices or any securities or financial products. This report is not approved, reviewed, or produced by MSCI. You cannot invest directly in an index. |
| 3 | The MSCI Emerging Markets (EM) Index (Net) is a free-float-adjusted market-capitalization-weighted index that is designed to measure equity market performance of emerging markets. You cannot invest directly in an index. |
| 4 | The Bloomberg Barclays U.S. Aggregate Bond Index is a broad-based benchmark that measures the investment-grade, U.S. dollar-denominated, fixed-rate taxable bond market, including Treasuries, government-related and corporate securities, mortgage-backed securities (agency fixed-rate and hybrid adjustable-rate mortgage pass-throughs), asset-backed securities, and commercial mortgage-backed securities. You cannot invest directly in an index. |
| 5 | The Bloomberg Barclays Global Aggregate ex-USD Index (unhedged) is an unmanaged index that provides a broad-based measure of the global investment-grade fixed-income markets excluding the U.S. dollar-denominated debt market. You cannot invest directly in an index. |
| 6 | The Bloomberg Barclays Municipal Bond Index is an unmanaged index composed of long-term tax-exempt bonds with a minimum credit rating of Baa. You cannot invest directly in an index. |
| 7 | The ICE BofA U.S. High Yield Index is a market-capitalization-weighted index of domestic and Yankee high-yield bonds. The index tracks the performance of high-yield securities traded in the U.S. bond market. You cannot invest directly in an index. Copyright 2021. ICE Data Indices, LLC. All rights reserved. |
2 | Wells Fargo California Tax-Free Fund
Letter to shareholders (unaudited)
Stocks grew more volatile in September on mixed economic data. U.S. economic activity continued to grow. However, U.S. unemployment remained elevated at 7.9% in September. With U.S. Congress delaying further fiscal relief and uncertainties surrounding a possible vaccine, doubts crept back into the financial markets. In the U.K., a lack of progress in Brexit talks weighed on markets. China’s economy picked up steam, fueled by increased global demand.
In October, capital markets stepped back from their six-month rally. Market volatility rose in advance of the U.S. election and amid a global increase in COVID-19 infections. Europe introduced tighter restrictions affecting economic activity. U.S. markets looked favorably at the prospect of Democratic control of the federal purse strings, which could lead to additional fiscal stimulus and a boost to economic activity. Meanwhile, China reported 4.9% third-quarter GDP growth.
Global stocks rallied in November, propelled by optimism over three promising COVID-19 vaccines. Reversing recent trends, value stocks outperformed growth stocks and cyclical stocks outpaced technology stocks. However, U.S. unemployment remained elevated, with a net job loss of 10 million since February. The eurozone services Purchasing Managers’ Index, a monthly survey of purchasing managers, contracted sharply while the region’s manufacturing activity grew. The U.S. election results added to the upbeat mood as investors anticipated more consistent policies in the new administration.
Financial markets ended the year with strength on high expectations for a rapid rollout of the COVID-19 vaccines, the successful passage of a $900 billion stimulus package, and rising expectations of additional economic support from a Democratic-led Congress. U.S. economic data were mixed with still-elevated unemployment and weak retail sales but growth in manufacturing output. In contrast, China’s economic expansion continued in both manufacturing and nonmanufacturing. U.S. COVID-19 infection rates continued to rise even as new state and local lockdown measures were implemented.
Don’t let short-term uncertainty derail long-term investment goals.
Periods of investment uncertainty can present challenges, but experience has taught us that maintaining long-term investment goals can be an effective way to plan for the future. To help you create a sound strategy based on your personal goals and risk tolerance, Wells Fargo Funds offers more than 100 mutual funds spanning a wide range of asset classes and investment styles. Although diversification cannot guarantee an investment profit or prevent losses, we believe it can be an effective way to manage investment risk and potentially smooth out overall portfolio performance. We encourage investors to know their investments and to understand that appropriate levels of risk-taking may unlock opportunities.
Thank you for choosing to invest with Wells Fargo Funds. We appreciate your confidence in us and remain committed to helping you meet your financial needs.
Sincerely,
Andrew Owen
President
Wells Fargo Funds
“Global stocks rallied in November, propelled by optimism over three promising COVID-19 vaccines.”
For further information about your Fund, contact your investment professional, visit our website at wfam.com, or call us directly at 1-800-222-8222.
Wells Fargo California Tax-Free Fund | 3
Letter to shareholders (unaudited)
Preparing for LIBOR Transition
The global financial industry is preparing to transition away from the London Interbank Offered Rate (LIBOR), a key benchmark interest rate, to new alternative rates. LIBOR underpins more than $350 trillion of financial contracts. It is the benchmark rate for a wide spectrum of products ranging from residential mortgages to corporate bonds to derivatives. Regulators have called for a market-wide transition away from LIBOR to successor reference rates by the end of 2021 (expected to be extended through June 30, 2023 for most tenors of the U.S. dollar LIBOR), which requires proactive steps be taken by issuers, counterparties, and asset managers to identify impacted products and adopt new reference rates.
The Fund holds at least one security that uses LIBOR as a floating reference rate and has a maturity date after 12-31-2021.
Although the transition process away from LIBOR has become increasingly well-defined in advance of the anticipated discontinuation date, there remains uncertainty regarding the nature of successor reference rates, and any potential effects of the transition away from LIBOR on investment instruments that use it as a benchmark rate. The transition process may result in, among other things, increased volatility or illiquidity in markets for instruments that currently rely on LIBOR and could negatively impact the value of certain instruments held by the Fund.
Wells Fargo Asset Management is monitoring LIBOR exposure closely and has put resources and controls in place to manage this transition effectively. The Fund’s portfolio management team is evaluating LIBOR holdings to understand what happens to those securities when LIBOR ceases to exist, including examining security documentation to identify the presence or absence of fallback language identifying a replacement rate to LIBOR.
While the pace of transition away from LIBOR will differ by asset class and investment strategy, the portfolio management team will monitor market conditions for those holdings to identify and mitigate deterioration or volatility in pricing and liquidity and ensure appropriate actions are taken in a timely manner.
Further information regarding the potential risks associated with the discontinuation of LIBOR can be found in the Fund’s Statement of Additional Information.
4 | Wells Fargo California Tax-Free Fund
This page is intentionally left blank.
Performance highlights (unaudited)
Investment objective
The Fund seeks current income exempt from federal income tax and California individual income tax.
Manager
Wells Fargo Funds Management, LLC
Subadviser
Wells Capital Management Incorporated
Portfolio managers
Terry J. Goode
Kim Nakahara*
Brandon Pae
Adrian Van Poppel
Average annual total returns (%) as of December 31, 2020
| | | Including sales charge | | Excluding sales charge | | Expense ratios1 (%) |
| | Inception date | 1 year | 5 year | 10 year | | 1 year | 5 year | 10 year | | Gross | Net 2 |
| Class A (SCTAX) | 10-6-1988 | -0.55 | 2.30 | 4.54 | | 4.10 | 3.25 | 5.02 | | 0.81 | 0.75 |
| Class C (SCTCX) | 7-1-1993 | 2.29 | 2.48 | 4.25 | | 3.29 | 2.48 | 4.25 | | 1.56 | 1.50 |
| Administrator Class (SGCAX) | 12-15-1997 | – | – | – | | 4.22 | 3.44 | 5.23 | | 0.75 | 0.55 |
| Institutional Class (SGTIX)3 | 10-31-2014 | – | – | – | | 4.29 | 3.51 | 5.27 | | 0.48 | 0.48 |
| Bloomberg Barclays Municipal Bond Index4 | – | – | – | – | | 5.21 | 3.91 | 4.63 | | – | – |
| Bloomberg Barclays Municipal Bond: California Index5 | – | – | – | – | | 5.15 | 3.84 | 5.07 | | – | – |
Figures quoted represent past performance, which is no guarantee of future results, and do not reflect taxes that a shareholder may pay on an investment in a fund. Investment return and principal value of an investment will fluctuate so that an investor’s shares, when redeemed, may be worth more or less than their original cost. Performance shown without sales charges would be lower if sales charges were reflected. Current performance may be lower or higher than the performance data quoted, which assumes the reinvestment of dividends and capital gains. Current month-end performance is available on the Fund’s website, wfam.com.
Index returns do not include transaction costs associated with buying and selling securities, any mutual fund fees or expenses, or any taxes. It is not possible to invest directly in an index.
For Class A shares, the maximum front-end sales charge is 4.50%. For Class C shares, the maximum contingent deferred sales charge is 1.00%. Performance including a contingent deferred sales charge assumes the sales charge for the corresponding time period. Administrator Class and Institutional Class shares are sold without a front-end sales charge or contingent deferred sales charge.
Bond values fluctuate in response to the financial condition of individual issuers, general market and economic conditions, and changes in interest rates. Changes in market conditions and government policies may lead to periods of heightened volatility in the bond market and reduced liquidity for certain bonds held by the Fund. In general, when interest rates rise, bond values fall and investors may lose principal value. Interest rate changes and their impact on the fund and its share price can be sudden and unpredictable. The use of derivatives may reduce returns and/or increase volatility. Certain investment strategies tend to increase the total risk of an investment (relative to the broader market). The Fund is exposed to California municipal securities risk, high-yield securities risk, and nondiversification risk. Consult the Fund’s prospectus for additional information on these and other risks. A portion of the Fund’s income may be subject to federal, state, and/or local income taxes or the Alternative Minimum Tax (AMT). Any capital gains distributions may be taxable.
Please see footnotes on page 7.
6 | Wells Fargo California Tax-Free Fund
Performance highlights (unaudited)
| Effective maturity distribution as of December 31, 20206 |
| Credit quality as of December 31, 20207 |
| * | Ms. Nakahara became a portfolio manager of the Fund on September 1, 2020. |
| 1 | Reflects the expense ratios as stated in the most recent prospectuses. The expense ratios shown are subject to change and may differ from the annualized expense ratios shown in the financial highlights of this report. |
| 2 | The manager has contractually committed through October 31, 2021, to waive fees and/or reimburse expenses to the extent necessary to cap total annual fund operating expenses after fee waivers at 0.75% for Class A, 1.50% for Class C, 0.55% for Administrator Class, and 0.48% for Institutional Class. Brokerage commissions, stamp duty fees, interest, taxes, acquired fund fees and expenses (if any), and extraordinary expenses are excluded from the expense caps. Prior to or after the commitment expiration date, the caps may be increased or the commitment to maintain the caps may be terminated only with the approval of the Board of Trustees. Without these caps, the Fund’s returns would have been lower. The expense ratio paid by an investor is the net expense ratio (the total annual fund operating expenses after fee waivers) as stated in the prospectuses. |
| 3 | Historical performance shown for the Institutional Class shares prior to their inception reflects the performance of the Administrator Class shares and includes the higher expenses applicable to the Administrator Class shares. If these expenses had not been included, returns for the Institutional Class shares would be higher. |
| 4 | The Bloomberg Barclays Municipal Bond Index is an unmanaged index composed of long-term tax-exempt bonds with a minimum credit rating of Baa. You cannot invest directly in an index. |
| 5 | The Bloomberg Barclays Municipal Bond: California Index is the California component of the Bloomberg Barclays Municipal Bond Index. You cannot invest directly in an index. |
| 6 | Figures represent the percentage of the Fund's long-term investments. These amounts are subject to change and may have changed since the date specified. |
| 7 | The credit quality distribution of portfolio holdings reflected in the chart is based on ratings from Standard & Poor’s, Moody’s Investors Service, and/ or Fitch Ratings Ltd. Credit quality ratings apply to the underlying holdings of the Fund and not to the Fund itself. The percentages of the Fund’s portfolio with the ratings depicted in the chart are calculated based on the total market value of fixed income securities held by the Fund. If a security was rated by all three rating agencies, the middle rating was utilized. If rated by two of three rating agencies, the lower rating was utilized, and if rated by one of the rating agencies, that rating was utilized. Standard & Poor’s rates the creditworthiness of bonds, ranging from AAA (highest) to D (lowest). Ratings from A to CCC may be modified by the addition of a plus (+) or minus (-) sign to show relative standing within the rating categories. Standard & Poor’s rates the creditworthiness of short-term notes from SP-1 (highest) to SP-3 (lowest). Moody’s rates the creditworthiness of bonds, ranging from Aaa (highest) to C (lowest). Ratings Aa to B may be modified by the addition of a number 1 (highest) to 3 (lowest) to show relative standing within the ratings categories. Moody’s rates the creditworthiness of short-term U.S. tax-exempt municipal securities from MIG 1/VMIG 1 (highest) to SG (lowest). Fitch rates the creditworthiness of bonds, ranging from AAA (highest) to D (lowest). Credit quality distribution is subject to change and may have changed since the date specified. |
Wells Fargo California Tax-Free Fund | 7
Fund expenses (unaudited)
As a shareholder of the Fund, you incur two types of costs: (1) transaction costs, including sales charges (loads) on purchase payments and contingent deferred sales charges (if any) on redemptions and (2) ongoing costs, including management fees, distribution (12b-1) and/or shareholder servicing fees, and other Fund expenses. This example is intended to help you understand your ongoing costs (in dollars) of investing in the Fund and to compare these costs with the ongoing costs of investing in other mutual funds.
The example is based on an investment of $1,000 invested at the beginning of the six-month period and held for the entire period from July 1, 2020 to December 31, 2020.
Actual expenses
The “Actual” line of the table below provides information about actual account values and actual expenses. You may use the information in this line, together with the amount you invested, to estimate the expenses that you paid over the period. Simply divide your account value by $1,000 (for example, an $8,600 account value divided by $1,000 = 8.6), then multiply the result by the number in the “Actual” line under the heading entitled “Expenses paid during period” for your applicable class of shares to estimate the expenses you paid on your account during this period.
Hypothetical example for comparison purposes
The “Hypothetical” line of the table below provides information about hypothetical account values and hypothetical expenses based on the Fund’s actual expense ratio and an assumed rate of return of 5% per year before expenses, which is not the Fund’s actual return. The hypothetical account values and expenses may not be used to estimate the actual ending account balance or expenses you paid for the period. You may use this information to compare the ongoing costs of investing in the Fund and other funds. To do so, compare this 5% hypothetical example with the 5% hypothetical examples that appear in the shareholder reports of the other funds.
Please note that the expenses shown in the table are meant to highlight your ongoing costs only and do not reflect any transactional costs, such as sales charges (loads) and contingent deferred sales charges. Therefore, the “Hypothetical” line of the table is useful in comparing ongoing costs only and will not help you determine the relative total costs of owning different funds. In addition, if these transactional costs were included, your costs would have been higher.
| | Beginning
account value
7-1-2020 | Ending
account value
12-31-2020 | Expenses
paid during
the period1 | Annualized net
expense ratio |
| Class A | | | | |
| Actual | $1,000.00 | $1,032.31 | $3.84 | 0.75% |
| Hypothetical (5% return before expenses) | $1,000.00 | $1,021.42 | $3.82 | 0.75% |
| Class C | | | | |
| Actual | $1,000.00 | $1,028.89 | $7.67 | 1.50% |
| Hypothetical (5% return before expenses) | $1,000.00 | $1,017.64 | $7.63 | 1.50% |
| Administrator Class | | | | |
| Actual | $1,000.00 | $1,033.31 | $2.82 | 0.55% |
| Hypothetical (5% return before expenses) | $1,000.00 | $1,022.43 | $2.80 | 0.55% |
| Institutional Class | | | | |
| Actual | $1,000.00 | $1,033.67 | $2.46 | 0.48% |
| Hypothetical (5% return before expenses) | $1,000.00 | $1,022.79 | $2.45 | 0.48% |
1 Expenses paid is equal to the annualized net expense ratio of each class multiplied by the average account value over the period, multiplied by the number of days in the most recent fiscal half-year divided by the number of days in the fiscal year (to reflect the one-half-year period).
8 | Wells Fargo California Tax-Free Fund
Portfolio of investments—December 31, 2020 (unaudited)
| | | | | Principal | Value |
| Closed end municipal bond fund obligations: 0.39% | | | | | |
| California: 0.39% | | | | | |
| Nuveen California AMT-Free Quality Municipal Income Fund MuniFund Preferred Shares Series A (50 Shares) 0.51% 144Aø | | | | $ 5,000,000 | 5,000,000 |
| Total Closed end municipal bond fund obligations (Cost $5,000,000) | | | | | 5,000,000 |
| | | Interest
rate | Maturity
date | | |
| Municipal obligations: 97.86% | | | | | |
| California: 95.00% | | | | | |
| Airport revenue: 6.99% | | | | | |
| California Municipal Finance Authority AMT Senior Lien Linxs Apartment Project Series A | | 5.00 | 12-31-2043 | 5,730,000 | 6,767,703 |
| Los Angeles CA Department of Airports AMT Subordinated Bond Series A | | 4.00 | 5-15-2044 | 3,500,000 | 3,994,830 |
| Los Angeles CA Department of Airports AMT Subordinated Bond Series A | | 5.00 | 5-15-2047 | 5,000,000 | 5,938,600 |
| Los Angeles CA Department of Airports AMT Subordinated Los Angeles International Airport | | 5.00 | 5-15-2044 | 2,880,000 | 3,498,566 |
| Los Angeles CA Department of Airports Revenue AMT Senior Los Angeles International Airport | | 4.00 | 5-15-2050 | 17,040,000 | 19,884,317 |
| Los Angeles CA Department of Airports Revenue Refunding Senior Los Angeles International Airport | | 5.00 | 5-15-2032 | 2,085,000 | 2,839,416 |
| Los Angeles CA Department of Airports Revenue Refunding Senior Los Angeles International Airport | | 5.00 | 5-15-2034 | 5,000,000 | 6,717,750 |
| Sacramento County CA Airport System Refunding Bond AMT Senior Series C | | 5.00 | 7-1-2037 | 7,300,000 | 8,915,271 |
| Sacramento County CA Airport System Refunding Bond AMT Senior Series C | | 5.00 | 7-1-2038 | 3,000,000 | 3,655,320 |
| San Diego County CA Regional Airport Authority Revenue Refunding Subordinated Series A | | 5.00 | 7-1-2044 | 3,045,000 | 3,817,334 |
| San Francisco City & County Airport Commission San Francisco International Airport Series A | | 5.00 | 5-1-2047 | 7,715,000 | 9,140,115 |
| San Francisco City & County Airport Commission San Francisco International Airport Series E | | 5.00 | 5-1-2050 | 5,000,000 | 6,130,950 |
| San Jose CA Airport AMT Refunding Bond Series A | | 5.00 | 3-1-2047 | 4,000,000 | 4,678,160 |
| San Jose CA Airport Refunding Bond Series B | | 5.00 | 3-1-2042 | 1,750,000 | 2,087,733 |
| | | | | | 88,066,065 |
| Education revenue: 5.86% | | | | | |
| California Educational Facilities Authority Loma Linda University Series A | | 5.00 | 4-1-2042 | 2,645,000 | 3,086,371 |
| California Financial Authority Charter School Palmdale Aerospace Academy Project 144A | | 5.00 | 7-1-2046 | 1,670,000 | 1,816,710 |
| California Municipal Finance Authority California Baptist University Series A 144A | | 4.00 | 11-1-2021 | 195,000 | 198,401 |
| California Municipal Finance Authority California Baptist University Series A 144A | | 5.00 | 11-1-2025 | 1,025,000 | 1,115,856 |
| California Municipal Finance Authority Charter School Albert Einstein Academies Project Series A | | 6.75 | 8-1-2033 | 1,525,000 | 1,692,704 |
| California Municipal Finance Authority Charter School Albert Einstein Academies Project Series A | | 7.13 | 8-1-2043 | 1,000,000 | 1,107,640 |
The accompanying notes are an integral part of these financial statements.
Wells Fargo California Tax-Free Fund | 9
Portfolio of investments—December 31, 2020 (unaudited)
| | | Interest
rate | Maturity
date | Principal | Value |
| Education revenue (continued) | | | | | |
| California Municipal Finance Authority Education Revenue Literacy First Charter Schools | | 5.00% | 12-1-2039 | $ 1,390,000 | $ 1,661,773 |
| California Municipal Finance Authority Education Revenue Stream Charter School Project 144A | | 5.00 | 6-15-2041 | 925,000 | 990,379 |
| California Municipal Finance Authority Education Revenue Stream Charter School Project 144A | | 5.00 | 6-15-2051 | 1,265,000 | 1,335,119 |
| California Municipal Finance Authority Refunding Bond Biola University Incorporated | | 5.00 | 10-1-2035 | 600,000 | 714,198 |
| California Municipal Finance Authority Revenue Refunding University Pacific Series A %% | | 4.00 | 11-1-2042 | 1,600,000 | 1,812,352 |
| California Municipal Financing Authority Charter School Palmdale Aerospace Academy Project 144A | | 5.00 | 7-1-2041 | 1,250,000 | 1,368,363 |
| California School Finance Authority Bright Star Schools Obligation Group 144A | | 5.00 | 6-1-2047 | 1,000,000 | 1,100,440 |
| California School Finance Authority Bright Star Schools Obligation Group 144A | | 5.00 | 6-1-2054 | 1,000,000 | 1,096,190 |
| California School Finance Authority Charter School Revenue Aspire Public Schools 144A | | 5.00 | 8-1-2050 | 1,770,000 | 2,133,558 |
| California School Finance Authority Charter School Revenue Lifeline Education Charter School Project 144A | | 5.00 | 7-1-2045 | 800,000 | 893,520 |
| California School Finance Authority Green Dot Public Schools Projects 144A | | 4.00 | 8-1-2025 | 475,000 | 524,562 |
| California School Finance Authority Green Dot Public Schools Projects 144A | | 5.00 | 8-1-2035 | 2,525,000 | 2,839,994 |
| California School Finance Authority KIPP Louisiana School Projects Series A 144A | | 5.00 | 7-1-2035 | 1,000,000 | 1,155,700 |
| California School Finance Authority Rocketship Education Series A 144A | | 5.00 | 6-1-2036 | 945,000 | 1,028,944 |
| California School Finance Authority Rocketship Education Series A 144A | | 5.00 | 6-1-2046 | 2,100,000 | 2,256,807 |
| California Statewide CDA Refunding Bond California Baptist University Series A 144A | | 5.00 | 11-1-2032 | 1,135,000 | 1,308,076 |
| California Statewide CDA Refunding Bond California Baptist University Series A 144A | | 5.00 | 11-1-2041 | 2,875,000 | 3,242,368 |
| California Statewide CDA School Facility Alliance for College-Ready Public Schools | | 6.75 | 7-1-2031 | 1,625,000 | 1,676,659 |
| California University Systemwide Refunding Bond Series A | | 4.00 | 11-1-2038 | 8,000,000 | 9,110,000 |
| California University Systemwide Refunding Bond Series A | | 5.00 | 11-1-2045 | 6,400,000 | 7,666,560 |
| University of California Series AI | | 5.00 | 5-15-2038 | 2,000,000 | 2,199,240 |
| University of California Series K | | 4.00 | 5-15-2046 | 5,295,000 | 5,971,383 |
| University of California Series M | | 4.00 | 5-15-2047 | 11,155,000 | 12,748,269 |
| | | | | | 73,852,136 |
| GO revenue: 30.37% | | | | | |
| Alhambra CA Unified School District Election of 2008 Series B (AGM Insured) | | 6.00 | 8-1-2029 | 4,100,000 | 4,238,334 |
| Alvord CA Unified School District Election of 2012 Series A (AGM Insured) | | 5.25 | 8-1-2037 | 1,620,000 | 1,832,026 |
| Antelope Valley CA Community College District Election of 2016 Series B | | 3.00 | 8-1-2050 | 4,500,000 | 4,871,205 |
| Bassett CA Unified School District Refunding Bond Series B (BAM Insured) | | 5.00 | 8-1-2027 | 1,050,000 | 1,259,612 |
| Beaumont CA Unified School District Election of 2008 Series D (BAM Insured) | | 5.25 | 8-1-2044 | 2,000,000 | 2,434,680 |
| Cabrillo CA Unified School District CAB Series A (Ambac Insured)¤ | | 0.00 | 8-1-2021 | 1,500,000 | 1,495,125 |
The accompanying notes are an integral part of these financial statements.
10 | Wells Fargo California Tax-Free Fund
Portfolio of investments—December 31, 2020 (unaudited)
| | | Interest
rate | Maturity
date | Principal | Value |
| GO revenue (continued) | | | | | |
| California Statewide Series B (1 Month LIBOR+0.76%)± | | 0.87% | 12-1-2031 | $ 2,500,000 | $ 2,502,725 |
| California Various Purposes | | 4.00 | 11-1-2035 | 2,715,000 | 3,416,366 |
| California Various Purposes | | 4.00 | 3-1-2036 | 2,500,000 | 3,100,625 |
| California Various Purposes | | 4.00 | 3-1-2050 | 6,000,000 | 7,183,020 |
| California Various Purposes | | 4.00 | 11-1-2050 | 5,000,000 | 5,638,600 |
| California Various Purposes | | 5.00 | 9-1-2029 | 1,475,000 | 1,521,758 |
| California Various Purposes | | 5.00 | 9-1-2032 | 5,100,000 | 5,723,016 |
| California Various Purposes (BAM Insured) | | 5.00 | 9-1-2035 | 35,000,000 | 43,150,800 |
| California Various Purposes | | 5.00 | 2-1-2038 | 5,000,000 | 5,459,000 |
| California Various Purposes | | 5.00 | 10-1-2039 | 5,000,000 | 6,062,100 |
| California Various Purposes | | 5.00 | 8-1-2046 | 10,000,000 | 12,209,300 |
| California Various Purposes | | 5.00 | 4-1-2049 | 2,500,000 | 3,168,825 |
| California Various Purposes | | 5.25 | 9-1-2028 | 5,000,000 | 5,167,000 |
| California Various Purposes | | 5.25 | 4-1-2035 | 12,640,000 | 13,395,619 |
| Center Unified School District California CAB Series C (National Insured)¤ | | 0.00 | 9-1-2021 | 5,000,000 | 4,982,050 |
| Centinela Valley CA Union High School District Election of 2008 Series B | | 6.00 | 8-1-2036 | 2,500,000 | 2,865,550 |
| Centinela Valley CA Union High School District Election of 2008 Series C | | 5.00 | 8-1-2035 | 2,000,000 | 2,334,520 |
| Cerritos CA Community College CAB Election of 2004 ¤ | | 0.00 | 8-1-2029 | 1,750,000 | 1,572,585 |
| Cerritos CA Community College CAB Election of 2004 ¤ | | 0.00 | 8-1-2033 | 1,500,000 | 1,217,865 |
| College of the Sequoias Tulare Area Improvement District #3 California CAB Election of 2008 Series A (AGC Insured)¤ | | 0.00 | 8-1-2024 | 1,000,000 | 972,720 |
| Compton CA Community College CAB Election of 2002 Series C ¤ | | 0.00 | 8-1-2035 | 3,445,000 | 2,603,145 |
| Contra Costa County CA Community College District Election of 2006 | | 5.00 | 8-1-2038 | 3,250,000 | 3,654,495 |
| Delano CA Union High School Election of 2010 Series B (AGM Insured) | | 5.75 | 8-1-2035 | 4,510,000 | 4,525,560 |
| Escondido CA Union High School CAB Election of 2008 Series A (AGC Insured)¤ | | 0.00 | 8-1-2027 | 8,385,000 | 7,871,335 |
| Escondido CA Union School District | | 4.00 | 8-1-2043 | 2,150,000 | 2,493,162 |
| Eureka CA City Schools Election 2014 (BAM Insured) | | 4.00 | 8-1-2049 | 3,750,000 | 4,404,750 |
| Garden Grove CA Unified School District Election of 2010 Series C | | 5.25 | 8-1-2037 | 2,000,000 | 2,261,760 |
| Hayward CA Unified School District Refunding Bond | | 5.00 | 8-1-2038 | 6,000,000 | 7,015,260 |
| Inglewood CA Unified School District Election of 2012 GO Bond Series B (BAM Insured) | | 5.00 | 8-1-2036 | 200,000 | 242,008 |
| Inglewood CA Unified School District Election of 2012 GO Bond Series B (BAM Insured) | | 5.00 | 8-1-2038 | 500,000 | 602,920 |
| Lancaster CA School District Election of 2012 Series D (BAM Insured) | | 4.00 | 8-1-2045 | 5,970,000 | 6,946,334 |
| Lancaster CA School District Election of 2012 Series D (BAM Insured) | | 4.00 | 8-1-2047 | 4,305,000 | 4,995,479 |
| Long Beach CA Unified School District CAB Election of 2008 Series B ¤ | | 0.00 | 8-1-2035 | 2,000,000 | 1,520,000 |
| Long Beach CA Unified School District Election of 2008 Series F | | 3.00 | 8-1-2047 | 15,000,000 | 16,335,750 |
| Long Beach CA Unified School District Unrefunded Bond Election of 2008 Series A | | 5.50 | 8-1-2026 | 95,000 | 95,369 |
| Los Angeles CA Community College District Refunding Bond | | 4.00 | 8-1-2038 | 10,000,000 | 11,631,100 |
| Los Angeles CA Unified School District Series C | | 4.00 | 7-1-2044 | 1,000,000 | 1,206,700 |
The accompanying notes are an integral part of these financial statements.
Wells Fargo California Tax-Free Fund | 11
Portfolio of investments—December 31, 2020 (unaudited)
| | | Interest
rate | Maturity
date | Principal | Value |
| GO revenue (continued) | | | | | |
| Lynwood CA Unified School District Election of 2012 Series A (AGM Insured) | | 5.00% | 8-1-2033 | $ 5,000 | $ 5,602 |
| Merced CA City School District Election of 2014 | | 5.00 | 8-1-2045 | 1,000,000 | 1,170,980 |
| Merced CA Union High School District CAB Series C ¤ | | 0.00 | 8-1-2032 | 3,380,000 | 2,807,969 |
| Mount San Antonio CA Community College District CAB Election of 2008 Series A ¤ | | 0.00 | 8-1-2024 | 1,610,000 | 1,580,634 |
| Natomas CA Unified School District Series 1999 (National Insured) | | 5.95 | 9-1-2021 | 125,000 | 127,319 |
| New Haven CA Unified School District Election of 2014 Series C | | 3.00 | 8-1-2049 | 2,750,000 | 2,956,883 |
| Norwalk-La Mirada CA Unified School District CAB Election of 2002 Series D (AGM Insured)¤ | | 0.00 | 8-1-2023 | 1,500,000 | 1,478,550 |
| Oakland CA Unified School District Alameda | | 5.00 | 8-1-2029 | 10,125,000 | 12,326,378 |
| Oakland CA Unified School District Election of 2012 | | 5.50 | 8-1-2023 | 500,000 | 550,570 |
| Oakland CA Unified School District Election of 2012 | | 6.63 | 8-1-2038 | 7,750,000 | 8,035,045 |
| Oakland CA Unified School District Election of 2012 Series A | | 5.00 | 8-1-2040 | 3,600,000 | 4,174,272 |
| Oxnard CA School District Election of 2012 Series D (AGM Insured) | | 5.00 | 8-1-2034 | 1,695,000 | 2,057,340 |
| Pajaro Valley CA Unified School District Election of 2012 Series A | | 5.00 | 8-1-2038 | 1,700,000 | 1,911,582 |
| Paramount CA Unified School District CAB Election of 2006 ¤ | | 0.00 | 8-1-2033 | 2,500,000 | 2,007,150 |
| Piedmont CA Unified School District Election of 2016 | | 3.00 | 8-1-2049 | 10,325,000 | 11,264,369 |
| Pomona CA Unified School District Series A (National Insured) | | 6.55 | 8-1-2029 | 1,480,000 | 1,917,740 |
| Poway CA Unified School District CAB Election of 2008 Improvement District 07-1-A ¤ | | 0.00 | 8-1-2024 | 1,800,000 | 1,759,014 |
| Rialto CA Unified School District CAB Election of 2010 Series A (AGM Insured)¤ | | 0.00 | 8-1-2026 | 3,320,000 | 3,164,458 |
| Sacramento CA Unified School District Election of 2012 Series A (BAM Insured) | | 5.25 | 8-1-2033 | 1,000,000 | 1,109,700 |
| Sacramento CA Unified School District Election of 2012 Series C (AGM Insured) | | 5.00 | 8-1-2033 | 2,735,000 | ��� 3,192,812 |
| San Bernardino County CA Community Election of 2008 Series D | | 5.00 | 8-1-2045 | 2,000,000 | 2,422,480 |
| San Bernardino County CA Unified School District Election of 2012 Series C (AGM Insured) | | 5.00 | 8-1-2040 | 8,000,000 | 9,395,120 |
| San Diego CA Community College Election of 2002 | | 5.00 | 8-1-2031 | 4,000,000 | 4,492,360 |
| San Diego CA Unified School District | | 4.00 | 7-1-2047 | 2,025,000 | 2,336,992 |
| San Francisco CA Community College District Election of 2020 Series A | | 4.00 | 6-15-2045 | 3,400,000 | 4,087,650 |
| San Gorgonio CA Memorial Healthcare Refunding Bond | | 5.00 | 8-1-2032 | 1,750,000 | 1,939,770 |
| San Gorgonio CA Memorial Healthcare Refunding Bond | | 5.50 | 8-1-2028 | 2,525,000 | 2,872,238 |
| San Joaquin CA Delta Community College District Election of 2004 Series C | | 5.00 | 8-1-2033 | 3,195,000 | 3,735,626 |
| San Joaquin CA Delta Community College District Election of 2004 Series C | | 5.00 | 8-1-2034 | 3,315,000 | 3,875,931 |
| San Jose CA Unified School District Santa Clara County | | 4.00 | 8-1-2042 | 4,000,000 | 4,779,600 |
| San Mateo County CA Jefferson Union High School District CAB Election of 2006 Series D ¤ | | 0.00 | 8-1-2033 | 7,000,000 | 2,634,100 |
| San Mateo County CA Jefferson Union High School District CAB Election of 2006 Series D ¤ | | 0.00 | 8-1-2036 | 11,130,000 | 3,267,323 |
| San Mateo County CA Jefferson Union High School District Prerefunded CAB Election of 2006 Series D ¤ | | 0.00 | 8-1-2034 | 6,915,000 | 2,392,867 |
The accompanying notes are an integral part of these financial statements.
12 | Wells Fargo California Tax-Free Fund
Portfolio of investments—December 31, 2020 (unaudited)
| | | Interest
rate | Maturity
date | Principal | Value |
| GO revenue (continued) | | | | | |
| San Mateo County CA Jefferson Union High School District Unrefunded CAB Election of 2006 Series D ¤ | | 0.00% | 8-1-2034 | $ 2,990,000 | $ 1,034,361 |
| San Rafael CA City High School District CAB Election of 2002 Series B (National Insured)¤ | | 0.00 | 8-1-2023 | 1,260,000 | 1,246,770 |
| San Rafael City CA High School District Election of 2015 Series C | | 4.00 | 8-1-2043 | 1,500,000 | 1,787,895 |
| Sanger CA Unified School District Refunding Bond (National Insured) | | 5.60 | 8-1-2023 | 370,000 | 380,941 |
| Santa Ana CA Unified School District CAB Election of 2008 Series B (AGC Insured)¤ | | 0.00 | 8-1-2038 | 15,000,000 | 10,347,000 |
| Santa Rosa CA High School District Prerefunded Bond | | 5.00 | 8-1-2024 | 750,000 | 806,235 |
| Santa Rosa CA High School District Unrefunded Bond | | 5.00 | 8-1-2024 | 255,000 | 274,010 |
| Sierra Kings CA Health Care District | | 5.00 | 8-1-2028 | 1,000,000 | 1,151,740 |
| Sierra Kings CA Health Care District | | 5.00 | 8-1-2032 | 1,500,000 | 1,704,900 |
| Sierra Kings CA Health Care District | | 5.00 | 8-1-2037 | 1,750,000 | 1,962,940 |
| Simi Valley CA Unified School District | | 4.00 | 8-1-2048 | 3,250,000 | 3,739,418 |
| Sonoma Valley CA Unified School District CAB Election of 2010 Series A ¤ | | 0.00 | 8-1-2027 | 1,020,000 | 956,893 |
| Stockton CA Unified School District Election of 2012 Series A (AGM Insured) | | 5.00 | 8-1-2038 | 1,025,000 | 1,155,575 |
| Tulare CA Local Health Care District Refunding Bond (BAM Insured) | | 4.00 | 8-1-2039 | 1,850,000 | 2,182,371 |
| Washington Township CA Health Care District Election of 2004 Series B | | 5.50 | 8-1-2038 | 1,500,000 | 1,704,300 |
| West Contra Costa CA Unified School District (AGM Insured) | | 5.25 | 8-1-2024 | 1,350,000 | 1,389,447 |
| West Contra Costa CA Unified School District CAB Election of 2005 Series B | | 6.00 | 8-1-2027 | 1,080,000 | 1,444,241 |
| West Contra Costa CA Unified School District CAB Election of 2005 Series C-1 (AGC Insured)¤ | | 0.00 | 8-1-2021 | 6,000,000 | 5,991,780 |
| West Contra Costa CA Unified School District Election of 2010 Series F (AGM Insured) | | 4.00 | 8-1-2049 | 1,265,000 | 1,496,799 |
| West Contra Costa CA Unified School District Election of 2012 Series E (AGM Insured) | | 4.00 | 8-1-2049 | 2,060,000 | 2,437,474 |
| Wiseburn CA School District CAB (AGC Insured)¤ | | 0.00 | 8-1-2027 | 1,525,000 | 1,428,773 |
| | | | | | 382,634,440 |
| Health revenue: 14.69% | | | | | |
| Association of Bay Area Governments California Finance Authority for Nonprofit Corporation Insured O'Connor Woods Project | | 5.00 | 1-1-2043 | 5,000,000 | 5,443,150 |
| Association of Bay Area Governments California Finance Authority for Nonprofit Corporation Insured Senior Living Odd Fellows Home of California Series A | | 5.00 | 4-1-2042 | 1,100,000 | 1,197,934 |
| California HFFA Catholic Healthcare West Series A | | 5.25 | 3-1-2023 | 3,000,000 | 3,023,730 |
| California HFFA El Camino Hospital | | 5.00 | 2-1-2035 | 3,000,000 | 3,667,710 |
| California HFFA LA Biomedical Research Institute at Harbor-UCLA Medical Center | | 5.00 | 9-1-2048 | 6,095,000 | 7,099,639 |
| California HFFA Nevada Methodist Homes | | 5.00 | 7-1-2030 | 1,830,000 | 2,183,959 |
| California HFFA Nevada Methodist Homes | | 5.00 | 7-1-2035 | 1,000,000 | 1,182,480 |
| California HFFA Nevada Methodist Homes | | 5.00 | 7-1-2045 | 4,500,000 | 5,239,305 |
| California HFFA Refunding Bond Cedars Sinai Medical Center Series B | | 4.00 | 8-15-2039 | 10,500,000 | 12,025,650 |
| California HFFA Refunding Bond Children's Hospital Series A | | 5.00 | 8-15-2047 | 10,050,000 | 11,744,430 |
| California HFFA Revenue City of Hope | | 5.00 | 11-15-2049 | 8,000,000 | 9,648,560 |
The accompanying notes are an integral part of these financial statements.
Wells Fargo California Tax-Free Fund | 13
Portfolio of investments—December 31, 2020 (unaudited)
| | | Interest
rate | Maturity
date | Principal | Value |
| Health revenue (continued) | | | | | |
| California HFFA Revenue Stanford Health Care Series A | | 4.00% | 8-15-2050 | $11,000,000 | $ 13,172,610 |
| California HFFA Sutter Health Series D | | 5.25 | 8-15-2031 | 3,100,000 | 3,196,720 |
| California Municipal Finance Authority Refunding Bond Channing House Project Series A | | 5.00 | 5-15-2034 | 1,000,000 | 1,233,200 |
| California Municipal Finance Authority Refunding Bond Community Medical Centers Series A | | 5.00 | 2-1-2047 | 6,625,000 | 7,681,224 |
| California Municipal Finance Authority Refunding Bond Eisenhower Medical Center Series A | | 5.00 | 7-1-2047 | 1,400,000 | 1,609,412 |
| California PFA Refunding Bond Henry Mayo Newhall Hospital | | 5.00 | 10-15-2037 | 500,000 | 575,090 |
| California PFA Refunding Bond Henry Mayo Newhall Hospital | | 5.00 | 10-15-2047 | 5,365,000 | 6,022,534 |
| California State Health Facilities Financing Authority | | 4.00 | 11-15-2048 | 5,000,000 | 5,643,550 |
| California State Health Facilities Financing Authority | | 4.00 | 11-1-2051 | 3,000,000 | 3,439,920 |
| California State Health Facilities Financing Authority | | 5.00 | 11-15-2046 | 2,040,000 | 2,595,268 |
| California State Health Facilities Financing Authority | | 5.00 | 11-15-2046 | 2,960,000 | 3,533,914 |
| California State Health Facilities Financing Authority Senior Health Services | | 5.00 | 8-1-2040 | 700,000 | 870,387 |
| California State Health Facilities Financing Authority Senior Health Services | | 5.00 | 8-1-2050 | 1,000,000 | 1,222,120 |
| California State Health Facilities Financing Authority Series A | | 4.00 | 11-1-2040 | 1,375,000 | 1,628,591 |
| California State Health Facilities Financing Authority Series A | | 4.00 | 4-1-2045 | 5,500,000 | 6,339,135 |
| California State Municipal Finance Authority Revenue | | 4.00 | 12-1-2039 | 1,240,000 | 1,517,524 |
| California State Municipal Finance Authority Revenue | | 4.00 | 12-1-2049 | 2,915,000 | 3,449,786 |
| California State Municipal Finance Authority Revenue | | 5.00 | 7-1-2039 | 1,000,000 | 1,260,500 |
| California State Municipal Finance Authority Revenue | | 5.00 | 7-1-2049 | 2,650,000 | 3,259,527 |
| California Statewide CDA Adventist Health System Series A | | 5.00 | 3-1-2045 | 2,500,000 | 2,920,900 |
| California Statewide CDA Enloe Medical Center | | 5.00 | 8-15-2033 | 1,650,000 | 1,976,552 |
| California Statewide CDA Enloe Medical Center | | 5.00 | 8-15-2035 | 1,000,000 | 1,194,190 |
| California Statewide CDA Enloe Medical Center | | 5.00 | 8-15-2038 | 2,000,000 | 2,375,000 |
| California Statewide CDA Loma Linda University Medical Center Refunding Bond Series A | | 5.25 | 12-1-2044 | 5,150,000 | 5,674,425 |
| California Statewide CDA Redwoods Projects | | 5.13 | 11-15-2035 | 1,500,000 | 1,675,635 |
| California Statewide CDA Revenue Refunding Bond Adventist Health System West Series A | | 5.00 | 3-1-2048 | 5,000,000 | 6,054,250 |
| California Statewide Communities Development Authority Revenue Emanate Heath Series A | | 3.00 | 4-1-2050 | 1,000,000 | 1,059,640 |
| California Statewide Communities Development Authority Revenue Emanate Heath Series A | | 4.00 | 4-1-2045 | 2,000,000 | 2,334,280 |
| California Statewide Communities Marin General Hospital Series A | | 5.00 | 8-1-2036 | 700,000 | 851,333 |
| California Statewide Communities Marin General Hospital Series A | | 5.00 | 8-1-2037 | 500,000 | 606,595 |
| California Statewide Communities Marin General Hospital Series A | | 5.00 | 8-1-2038 | 450,000 | 544,734 |
| Palomar Health CA Refunding Bond | | 5.00 | 11-1-2042 | 4,000,000 | 4,604,160 |
| San Buenaventura CA Community Mental Health System | | 8.00 | 12-1-2031 | 1,615,000 | 1,713,079 |
| University of California Regents Medical Center Prerefunded Bond Series J | | 5.25 | 5-15-2038 | 7,790,000 | 8,698,470 |
| University of California Regents Medical Center Series J | | 5.00 | 5-15-2033 | 2,265,000 | 2,518,680 |
| University of California Regents Medical Center Series L | | 4.00 | 5-15-2044 | 4,065,000 | 4,592,434 |
| University of California Regents Medical Center Unrefunded Bond Series J | | 5.25 | 5-15-2038 | 2,210,000 | 2,451,266 |
The accompanying notes are an integral part of these financial statements.
14 | Wells Fargo California Tax-Free Fund
Portfolio of investments—December 31, 2020 (unaudited)
| | | Interest
rate | Maturity
date | Principal | Value |
| Health revenue (continued) | | | | | |
| Washington Township CA Health Care District Series A | | 5.00% | 7-1-2026 | $ 1,190,000 | $ 1,395,358 |
| Washington Township CA Health Care District Series A | | 5.00 | 7-1-2042 | 1,000,000 | 1,162,630 |
| | | | | | 185,111,170 |
| Housing revenue: 3.50% | | | | | |
| California Community Housing Agency Essential Housing Revenue Arbors Series A 144A | | 5.00 | 8-1-2050 | 1,000,000 | 1,150,050 |
| California Community Housing Agency Essential Housing Revenue Serenity at Larkspur Series C 144A | | 5.00 | 2-1-2050 | 3,000,000 | 3,351,540 |
| California Community Housing Agency Workforce Apartments Series A 144A | | 5.00 | 4-1-2049 | 3,000,000 | 3,395,190 |
| California HFA Municipal Certificate of Participation Series 2 Class A | | 4.00 | 3-20-2033 | 8,497,095 | 9,576,056 |
| California Municipal Finance Authority Mobile Senior Caritas Projects Series A | | 5.00 | 8-15-2029 | 500,000 | 610,800 |
| California Municipal Finance Authority Student Housing Revenue CHF Davis I LLC West Village Projects | | 5.00 | 5-15-2051 | 6,700,000 | 7,753,843 |
| California Municipal Finance Authority Student Housing Revenue CHF Riverside I LLC Projects | | 5.00 | 5-15-2029 | 625,000 | 773,575 |
| California Municipal Finance Authority Student Housing Revenue CHF Riverside I LLC Projects | | 5.00 | 5-15-2052 | 5,650,000 | 6,624,117 |
| California State Enterprise Development Authority Student Housing Revenue Provident Group | | 5.00 | 8-1-2050 | 565,000 | 673,435 |
| California Statewide CDA Poway Retirement Housing Foundation Housing Incorporated Series A | | 5.25 | 11-15-2035 | 1,500,000 | 1,680,915 |
| Contra Costa County CA Home Mortgage Revenue Bonds GNMA Mortgage-Backed Securities Program (GNMA Insured) | | 7.75 | 5-1-2022 | 45,000 | 47,619 |
| Independent Cities California Finance Authority Mobile Home Park Revenue | | 5.00 | 5-15-2048 | 2,000,000 | 2,404,360 |
| Independent Cities California Finance Refunding Bond Sanitary Juan Mobile Estates | | 5.00 | 8-15-2030 | 1,000,000 | 1,141,860 |
| Independent Cities California Finance Refunding Bond Santa Rose Leisure Mobile | | 5.00 | 8-15-2046 | 1,570,000 | 1,795,091 |
| Sacramento County CA Housing Authority Multifamily Housing Revenue (FNMA Insured, FNMA LIQ)ø | | 0.09 | 7-15-2029 | 470,000 | 470,000 |
| San Diego CA Housing Revenue Park & Market Apartments Series A (Bank of Tokyo-Mitsubishi LOC)ø | | 0.11 | 6-1-2057 | 2,700,000 | 2,700,000 |
| | | | | | 44,148,451 |
| Miscellaneous revenue: 13.82% | | | | | |
| Alameda CA Joint Powers Authority Multiple Capital Projects Series A | | 5.00 | 12-1-2034 | 1,005,000 | 1,138,595 |
| Anaheim CA PFA CAB Subordinate Lien Bond Public Improvements Project Series C (AGM Insured)¤ | | 0.00 | 9-1-2025 | 10,000,000 | 9,567,500 |
| Anaheim CA PFA Convention Center Expansion Project Series A | | 5.00 | 5-1-2039 | 3,000,000 | 3,324,750 |
| Anaheim CA PFA Convention Center Expansion Project Series A | | 5.00 | 5-1-2046 | 4,200,000 | 4,618,656 |
| California Enterprise Development Authority Lease Revenue Riverside County Library Facilities Project | | 4.00 | 11-1-2049 | 1,900,000 | 2,121,616 |
| California Infrastructure & Economic Development Bank Lease Revenue | | 5.00 | 8-1-2044 | 4,000,000 | 5,069,760 |
| California Infrastructure & Economic Development King City Joint Union High School | | 5.75 | 8-15-2029 | 2,150,000 | 2,153,333 |
The accompanying notes are an integral part of these financial statements.
Wells Fargo California Tax-Free Fund | 15
Portfolio of investments—December 31, 2020 (unaudited)
| | | Interest
rate | Maturity
date | Principal | Value |
| Miscellaneous revenue (continued) | | | | | |
| California Public Works Board California State University Projects Series B-1 | | 5.70% | 3-1-2035 | $ 2,210,000 | $ 2,218,398 |
| California Public Works Board Judicial Council Projects Series A | | 5.00 | 3-1-2038 | 7,000,000 | 7,640,990 |
| California Public Works Board Judicial Council Projects Series D | | 5.25 | 12-1-2025 | 4,000,000 | 4,186,040 |
| California Public Works Board Various Capital Projects Series A | | 5.00 | 4-1-2037 | 4,925,000 | 5,190,310 |
| California Public Works Board Various Capital Projects Series G | | 5.00 | 11-1-2037 | 23,000,000 | 24,808,030 |
| California Public Works Board Various Capital Projects Series I | | 5.50 | 11-1-2033 | 2,000,000 | 2,276,460 |
| California Public Works University of California Board of Regents Series G | | 5.00 | 12-1-2030 | 9,850,000 | 10,285,863 |
| California Statewide CDA Water & Wastewater Pooled Financing Program Series B (AGM Insured) | | 5.25 | 10-1-2027 | 1,040,000 | 1,043,661 |
| California Statewide Communities Series A | | 5.00 | 9-2-2047 | 2,000,000 | 2,333,980 |
| Compton CA PFA Refunding Bond 144A | | 4.00 | 9-1-2027 | 5,620,000 | 5,811,080 |
| Emeryville CA PFA Assessment District Refinancing | | 5.90 | 9-2-2021 | 205,000 | 205,695 |
| Fresno CA Joint Powers Financing Authority Lease Revenue Master Lease Projects Series A (AGM Insured) | | 4.00 | 4-1-2046 | 1,225,000 | 1,417,484 |
| Fullerton CA Joint Union High School Project Certificate of Participation (BAM Insured) | | 5.00 | 9-1-2035 | 1,385,000 | 1,621,503 |
| Irvine CA Improvement Bond Act 1915 Limited Obligation Reassessment District #15-2 | | 5.00 | 9-2-2025 | 725,000 | 871,617 |
| Irvine CA Improvement Bond Act 1915 Limited Obligation Reassessment District #15-2 | | 5.00 | 9-2-2026 | 400,000 | 478,836 |
| Irvine CA Improvement Bond Act 1915 Limited Obligation Reassessment District #15-2 | | 5.00 | 9-2-2042 | 1,500,000 | 1,716,750 |
| Jefferson CA Union High School District Certificate of Participation Teacher and Staff Housing Project (BAM Insured) | | 4.00 | 8-1-2045 | 1,400,000 | 1,630,888 |
| Los Angeles CA Community Redevelopment Vermont Manchester Social Services Project (Ambac Insured) | | 5.00 | 9-1-2025 | 2,310,000 | 2,318,247 |
| Los Angeles CA Public Works Financing Authority Series A | | 5.00 | 12-1-2039 | 2,860,000 | 3,304,330 |
| Madera County CA Public Financing Authority Government Center Refinancing Hall (BAM Insured) | | 4.00 | 10-1-2050 | 8,320,000 | 9,777,747 |
| Modesto CA Irrigation District Financing Authority Series A | | 5.00 | 10-1-2040 | 3,500,000 | 4,097,975 |
| Montclair CA PFA Lease Refunding Bond (AGM Insured) | | 5.00 | 10-1-2035 | 2,400,000 | 2,764,056 |
| Mountain House CA Financing Authority Utility System Revenue Series A | | 5.00 | 12-1-2034 | 535,000 | 671,569 |
| Riverside County CA Asset Leasing Corporation Riverside County Hospital Project (National Insured)¤ | | 0.00 | 6-1-2026 | 10,000,000 | 9,503,400 |
| Sacramento CA City Financing Authority Refunding Bond Master Lease Program Facilities (BAM Insured) | | 5.00 | 12-1-2035 | 1,300,000 | 1,557,530 |
| Sacramento CA City School Joint Refunding Bond Series A (BAM Insured) | | 5.00 | 3-1-2040 | 2,165,000 | 2,398,235 |
| San Jose CA Unified School District CAB (AGM Insured)¤ | | 0.00 | 1-1-2021 | 1,205,000 | 1,205,000 |
| San Jose CA Unified School District CAB (AGM Insured)¤ | | 0.00 | 1-1-2026 | 3,175,000 | 3,084,576 |
| San Marino CA Unified School District Certificate of Participation Los Angeles County Schools Pooled Financing Program Series A | | 5.00 | 12-1-2041 | 500,000 | 500,845 |
| San Mateo Foster City CA Public Financing Authority Revenue Sanitary Mateo Street & Flood Control Projects | | 4.00 | 5-1-2045 | 3,750,000 | 4,408,725 |
The accompanying notes are an integral part of these financial statements.
16 | Wells Fargo California Tax-Free Fund
Portfolio of investments—December 31, 2020 (unaudited)
| | | Interest
rate | Maturity
date | Principal | Value |
| Miscellaneous revenue (continued) | | | | | |
| San Ysidro CA School District Certificate of Participation School Facilities Bridge Funding Program (BAM Insured) | | 5.00% | 9-1-2037 | $ 250,000 | $ 269,738 |
| San Ysidro CA School District Certificate of Participation School Facilities Bridge Funding Program (BAM Insured) | | 5.00 | 9-1-2042 | 625,000 | 674,344 |
| San Ysidro CA School District Certificate of Participation School Facilities Bridge Funding Program (BAM Insured) | | 5.00 | 9-1-2047 | 1,000,000 | 1,078,950 |
| Simi Valley CA Unified School District Capital Improvement Projects (Ambac Insured) | | 5.25 | 8-1-2022 | 930,000 | 955,119 |
| Stockton CA Unified School District Community Improvement Project | | 5.00 | 2-1-2033 | 550,000 | 685,460 |
| Sutter Butte CA Flood Control Agency (BAM Insured) | | 5.00 | 10-1-2040 | 3,545,000 | 4,193,629 |
| Torrance CA Certificate of Participation | | 5.25 | 6-1-2039 | 5,385,000 | 6,140,731 |
| Union Sanitary District CA Financing Authority Revenue Series A | | 3.00 | 9-1-2045 | 2,500,000 | 2,729,450 |
| Union Sanitary District CA Financing Authority Revenue Series A | | 3.00 | 9-1-2050 | 3,000,000 | 3,250,260 |
| Upland CA Certificate of Participation San Antonio Regional Hospital | | 5.00 | 1-1-2047 | 1,955,000 | 2,228,876 |
| Ventura County CA PFA Series A | | 5.00 | 11-1-2038 | 4,250,000 | 4,626,593 |
| | | | | | 174,157,180 |
| Tax revenue: 9.56% | | | | | |
| Beaumont CA Community Facilities District #93-1 Special Tax Improvement Area Number 17C | | 5.00 | 9-1-2043 | 750,000 | 858,480 |
| Beaumont CA Community Facilities District #93-1 Special Tax Improvement Area Number 17C | | 5.00 | 9-1-2048 | 1,100,000 | 1,252,130 |
| Beaumont CA Community Facilities District #93-1 Special Tax Improvement Area Number 8D Series A | | 5.00 | 9-1-2043 | 750,000 | 858,480 |
| Beaumont CA Community Facilities District #93-1 Special Tax Improvement Area Number 8D Series A | | 5.00 | 9-1-2048 | 1,035,000 | 1,178,141 |
| Belmont CA Community Facilities Special Tax District #2000-1 Library Project Series A (Ambac Insured) | | 5.75 | 8-1-2030 | 3,190,000 | 4,253,674 |
| California Statewide CDA Community Facilities District #2015-01 | | 5.00 | 9-1-2047 | 1,420,000 | 1,635,229 |
| California Statewide Communities Development Authority Special Tax Community Facilities District #2017-01 | | 5.00 | 9-1-2048 | 5,000,000 | 5,812,850 |
| Casitas CA Municipal Water District Community Facilities District #2013-1-OJAI Series B (BAM Insured) | | 5.25 | 9-1-2047 | 5,000,000 | 6,083,500 |
| Cathedral City CA RDA Successor Agency to Merged Redevelopment Project Tax Allocation Bond Series A (AGM Insured) | | 5.00 | 8-1-2032 | 1,450,000 | 1,660,250 |
| Cathedral City CA RDA Successor Agency to Merged Redevelopment Project Tax Allocation Bond Series A (AGM Insured) | | 5.00 | 8-1-2033 | 880,000 | 1,007,081 |
| Chino CA Community Facilities District Special Tax #2003-3 Improvement Area #7 | | 5.00 | 9-1-2048 | 2,500,000 | 2,902,650 |
| Chula Vista CA Community Facilities District Special Tax #16-I Improvement Area #1 | | 5.00 | 9-1-2043 | 500,000 | 570,875 |
| Chula Vista CA Community Facilities District Special Tax #16-I Improvement Area #1 | | 5.00 | 9-1-2048 | 1,000,000 | 1,133,530 |
| City of Roseville CA | | 5.00 | 9-1-2045 | 1,280,000 | 1,466,317 |
| Corona CA Community Facilities District #2018-1 Improvement Area #1 2018 Special Tax Bond Series A | | 5.00 | 9-1-2048 | 1,000,000 | 1,111,930 |
| Corona Norco CA Unified School Districts Special Tax Community Facilities District #16-1 | | 5.00 | 9-1-2048 | 1,500,000 | 1,706,010 |
The accompanying notes are an integral part of these financial statements.
Wells Fargo California Tax-Free Fund | 17
Portfolio of investments—December 31, 2020 (unaudited)
| | | Interest
rate | Maturity
date | Principal | Value |
| Tax revenue (continued) | | | | | |
| Dinuba CA RDA Merged City Redevelopment Project (BAM Insured) | | 5.00% | 9-1-2033 | $ 1,500,000 | $ 1,720,155 |
| Elk Grove CA Financing Authority Special Tax Refunding Bond (BAM Insured) | | 5.00 | 9-1-2038 | 1,500,000 | 1,742,400 |
| Fairfield CA Community Facilities District Special Tax Bond Number 2019 One Lake Improvement Area 144A | | 5.00 | 9-1-2050 | 3,000,000 | 3,481,020 |
| Folsom Ranch Financing Authority California Facilities District #20 Russell | | 5.00 | 9-1-2048 | 1,650,000 | 1,872,684 |
| Fremont CA Community Facilities District #1 Refunding Bond | | 5.00 | 9-1-2040 | 2,700,000 | 3,036,555 |
| Inglewood CA Redevelopment Successor Agency to Merged Redevelopment Project Tax Allocation Refunding Bond Subordinate Lien Series A (BAM Insured) | | 5.00 | 5-1-2034 | 500,000 | 606,770 |
| Inglewood CA Redevelopment Successor Agency to Merged Redevelopment Project Tax Allocation Refunding Bond Subordinate Lien Series A (BAM Insured) | | 5.00 | 5-1-2038 | 305,000 | 367,000 |
| Inland Valley CA Development Agency Series A | | 5.25 | 9-1-2037 | 4,000,000 | 4,502,560 |
| Irvine CA Unified School District Special Tax Community Facilities District #09 1 Series A (BAM Insured) | | 4.00 | 9-1-2044 | 1,000,000 | 1,169,820 |
| Irvine CA Unified School District Special Tax Community Facilities District #09 1 Series A (BAM Insured) | | 4.00 | 9-1-2050 | 3,000,000 | 3,484,860 |
| Lafayette CA RDA Refunding Bond Lafayette Redevelopment Project (AGM Insured) | | 5.00 | 8-1-2033 | 1,500,000 | 1,722,900 |
| Lafayette CA RDA Refunding Bond Lafayette Redevelopment Project (AGM Insured) | | 5.00 | 8-1-2038 | 1,635,000 | 1,874,822 |
| Lancaster CA RDA Tax Allocation Refunding Bond Combined Redevelopment Project Areas (AGM Insured) | | 5.00 | 8-1-2033 | 1,200,000 | 1,429,068 |
| Oakland CA Redevelopment Successor Agency Refunding Bond Subordinate Series TE (AGM Insured) | | 5.00 | 9-1-2035 | 2,545,000 | 2,982,104 |
| Oakland CA Redevelopment Successor Agency Refunding Bond Subordinate Series TE (AGM Insured) | | 5.00 | 9-1-2036 | 4,000,000 | 4,677,920 |
| Orange County CA Community Facilities District #2015-1 Esencia Village Series A | | 5.25 | 8-15-2045 | 1,950,000 | 2,216,624 |
| Rancho Cucamonga CA RDA Rancho Redevelopment Project Area (AGM Insured) | | 5.00 | 9-1-2032 | 1,870,000 | 2,157,812 |
| Redwood City CA RDA CAB Redevelopment Project Area Series 2-A (Ambac Insured)¤ | | 0.00 | 7-15-2030 | 3,505,000 | 3,006,624 |
| Rio Vista CA Community Facilities District Special Tax #2018-1 | | 5.00 | 9-1-2048 | 1,185,000 | 1,346,053 |
| Riverside County CA Community Facilities Districts Special Tax #05-8 | | 5.00 | 9-1-2048 | 1,600,000 | 1,821,280 |
| Romoland School District Community Facilities District #2004-1 Heritage Lake Improvement Area #4 Series 2018 Special Tax Bond | | 5.00 | 9-1-2048 | 3,000,000 | 3,424,950 |
| Sacramento CA Transient Occupancy Tax Convention Center Complex Series A | | 5.00 | 6-1-2048 | 3,750,000 | 4,362,038 |
| San Bernardino CA Special Tax Community Facilities District #2006-1 Series 2018 | | 5.00 | 9-1-2048 | 1,200,000 | 1,361,952 |
| San Clemente CA Special Tax Community Facilities District #2006-1 | | 5.00 | 9-1-2040 | 970,000 | 1,098,263 |
| San Clemente CA Special Tax Community Facilities District #2006-1 | | 5.00 | 9-1-2046 | 1,180,000 | 1,322,910 |
| San Diego CA RDA CAB Tax Allocation Centre (AGM Insured)¤ | | 0.00 | 9-1-2023 | 885,000 | 872,583 |
The accompanying notes are an integral part of these financial statements.
18 | Wells Fargo California Tax-Free Fund
Portfolio of investments—December 31, 2020 (unaudited)
| | | Interest
rate | Maturity
date | Principal | Value |
| Tax revenue (continued) | | | | | |
| San Francisco CA City & County RDA Mission Bay South Redevelopment Project Series A | | 5.00% | 8-1-2043 | $ 2,500,000 | $ 2,817,575 |
| San Francisco CA City & County RDA Tax Transbay Infrastructure Project Third Lien Series B (AGM Insured) | | 5.00 | 8-1-2046 | 1,500,000 | 1,817,595 |
| San Francisco City & County CA RDA CAB Mission Bay South Redevelopment Project Subordinate Bond Series D 144A¤ | | 0.00 | 8-1-2026 | 4,000,000 | 3,125,160 |
| San Marcos CA Unified School District Special Tax Community Facilities District #4 (BAM Insured) | | 5.00 | 9-1-2034 | 1,705,000 | 1,983,461 |
| San Marcos CA Unified School District Special Tax Community Facilities District #5 (BAM Insured) | | 5.00 | 9-1-2028 | 1,290,000 | 1,496,103 |
| San Marcos CA Unified School District Special Tax Community Facilities District #5 (BAM Insured) | | 5.00 | 9-1-2029 | 1,325,000 | 1,534,602 |
| Santa Ana CA Community Redevelopment Merged Project Area Series A | | 6.00 | 9-1-2022 | 2,000,000 | 2,018,480 |
| Sonoma CA CDA Successor Agency to Sonoma Redevelopment Project Tax Allocation Bond (National Insured) | | 5.00 | 6-1-2033 | 1,325,000 | 1,575,094 |
| Successor Agency to the Marina Redevelopment Agency Tax Allocation Bonds Series A | | 5.00 | 9-1-2033 | 340,000 | 395,107 |
| Successor Agency to the Marina Redevelopment Agency Tax Allocation Bonds Series A | | 5.00 | 9-1-2038 | 400,000 | 458,632 |
| Successor Agency to the Marina Redevelopment Agency Tax Allocation Bonds Series B | | 5.00 | 9-1-2033 | 250,000 | 288,205 |
| Successor Agency to the Marina Redevelopment Agency Tax Allocation Bonds Series B | | 5.00 | 9-1-2038 | 250,000 | 285,443 |
| Tracy Hills CA Improvement Area #1 Community Facilities District #2016-1 Special Tax Bonds Series 2018 | | 5.00 | 9-1-2048 | 2,750,000 | 3,082,145 |
| Transbay Joint Powers Authority Tax Allocation California Senior Series A Green Bonds | | 5.00 | 10-1-2045 | 2,000,000 | 2,498,900 |
| Transbay Joint Powers Authority Tax Allocation California Senior Series A Green Bonds | | 5.00 | 10-1-2049 | 2,200,000 | 2,733,060 |
| Tustin CA Community Facilities District Special Tax #2014-1 Legacy/Standard Pacific Series A | | 5.00 | 9-1-2040 | 750,000 | 853,470 |
| Tustin CA Community Facilities District Special Tax #2014-1 Legacy/Standard Pacific Series A | | 5.00 | 9-1-2045 | 1,000,000 | 1,129,250 |
| Union City CA Community RDA Successor Agency to Community Redevelopment Project Tax Allocation Refunding Bond Series A | | 5.00 | 10-1-2036 | 1,000,000 | 1,174,750 |
| | | | | | 120,419,886 |
| Tobacco revenue: 0.72% | | | | | |
| California County CA Tobacco Securitization Agency ¤ | | 0.00 | 6-1-2055 | 14,000,000 | 2,629,900 |
| California County CA Tobacco Securitization Agency | | 5.00 | 6-1-2050 | 750,000 | 867,945 |
| Golden State Tobacco Securitization Corporation California Tobacco Settlement Refunding Bond Series A-1 | | 5.00 | 6-1-2028 | 2,000,000 | 2,480,400 |
| Golden State Tobacco Securitization Corporation California Tobacco Settlement Refunding Bond Series A-2 | | 5.00 | 6-1-2047 | 3,000,000 | 3,111,840 |
| | | | | | 9,090,085 |
| Transportation revenue: 1.92% | | | | | |
| Bay Area CA Toll Authority Toll Bridge Series S-4 | | 5.00 | 4-1-2030 | 2,000,000 | 2,217,200 |
| Bay Area CA Toll Authority Toll Bridge Series S-H | | 5.00 | 4-1-2049 | 8,000,000 | 10,027,680 |
The accompanying notes are an integral part of these financial statements.
Wells Fargo California Tax-Free Fund | 19
Portfolio of investments—December 31, 2020 (unaudited)
| | | Interest
rate | Maturity
date | Principal | Value |
| Transportation revenue (continued) | | | | | |
| Foothill-Eastern Corridor CA Transportation Agency Subordinated Bond Series B-3 | | 5.50% | 1-15-2053 | $ 8,000,000 | $ 8,596,560 |
| San Francisco CA Municipal Transportation | | 5.00 | 3-1-2039 | 3,000,000 | 3,371,610 |
| | | | | | 24,213,050 |
| Utilities revenue: 3.67% | | | | | |
| Banning CA Financing Authority Refunding Bond Electric System Project (AGM Insured) | | 5.00 | 6-1-2037 | 5,000,000 | 5,852,200 |
| Imperial CA Irrigation District Electric System Refunding Bond Series A | | 5.00 | 11-1-2040 | 3,715,000 | 4,438,979 |
| Imperial CA Irrigation District Electric System Refunding Bond Series A | | 5.00 | 11-1-2045 | 1,060,000 | 1,263,255 |
| Imperial CA Irrigation District Electric System Refunding Bond Series C | | 5.00 | 11-1-2038 | 2,500,000 | 3,026,375 |
| Los Angeles CA Department of Water and Power Series E | | 5.00 | 7-1-2044 | 12,475,000 | 14,304,334 |
| M-S-R California Energy Authority Gas Series B | | 7.00 | 11-1-2034 | 4,000,000 | 6,409,520 |
| M-S-R California Energy Authority Gas Series C | | 6.13 | 11-1-2029 | 1,035,000 | 1,324,448 |
| Northern California Power Agency Public Power Prerefunded Bond (Ambac Insured) | | 7.50 | 7-1-2023 | 25,000 | 25,876 |
| Redding CA Joint Powers Financing Authority Election System Series A | | 5.00 | 6-1-2032 | 440,000 | 532,347 |
| Roseville CA Natural Gas Financing Authority | | 5.00 | 2-15-2025 | 1,930,000 | 2,274,119 |
| Southern California Public Power Authority Natural Gas Project #1 Series A | | 5.25 | 11-1-2025 | 1,000,000 | 1,218,300 |
| Turlock CA Irrigation District Refunding Bond Subordinate First Priority | | 5.50 | 1-1-2041 | 2,000,000 | 2,000,000 |
| Walnut CA Energy Center Authority Series A | | 5.00 | 1-1-2034 | 3,115,000 | 3,568,295 |
| | | | | | 46,238,048 |
| Water & sewer revenue: 3.90% | | | | | |
| Adelanto CA Public Utility Authority Refunding Bond (AGM Insured) | | 5.00 | 7-1-2039 | 2,000,000 | 2,455,900 |
| Bakersfield CA Wastewater Revenue Refunding Series A | | 5.00 | 9-15-2032 | 1,615,000 | 2,244,802 |
| Bay Area CA Water Supply & Conservation Agency Series A | | 5.00 | 10-1-2034 | 6,000,000 | 6,582,900 |
| Compton CA Sewer Revenue | | 6.00 | 9-1-2039 | 1,775,000 | 1,778,887 |
| El Dorado CA Irrigation District Refunding Bond Series A (AGM Insured) | | 5.25 | 3-1-2039 | 2,000,000 | 2,318,920 |
| Florin CA Resource Conservation Refunding Bond Second Senior Lien Series A (National Insured) | | 5.00 | 9-1-2032 | 2,000,000 | 2,311,660 |
| Los Angeles CA Department of Water and Power Series A | | 5.00 | 7-1-2047 | 4,285,000 | 5,660,442 |
| Los Angeles CA Department of Water and Power Series C %% | | 5.00 | 7-1-2041 | 5,000,000 | 6,696,150 |
| Merced CA Irrigation District Water & Hydroelectric System Series A (AGM Insured) | | 5.00 | 10-1-2038 | 4,000,000 | 4,624,360 |
| Pico Rivera CA Water Authority Series A | | 6.25 | 12-1-2032 | 3,385,000 | 3,418,918 |
| San Buenaventura CA Public Facilities Financing Authority Series B | | 5.00 | 7-1-2042 | 4,000,000 | 4,287,160 |
| San Francisco CA City & County Public Utilities Commission Water Revenue Subordinated Series A | | 4.00 | 11-1-2050 | 1,525,000 | 1,848,483 |
| San Francisco CA City & County Public Utilities Commission Water Revenue Subordinated Series C | | 4.00 | 11-1-2045 | 1,650,000 | 2,012,208 |
The accompanying notes are an integral part of these financial statements.
20 | Wells Fargo California Tax-Free Fund
Portfolio of investments—December 31, 2020 (unaudited)
| | | Interest
rate | Maturity
date | Principal | Value |
| Water & sewer revenue (continued) | | | | | |
| Tulare CA Sewer Refunding Bond (AGM Insured) | | 5.00% | 11-15-2041 | $ 1,500,000 | $ 1,767,135 |
| Vallejo CA Refunding Bond | | 5.25 | 5-1-2031 | 1,000,000 | 1,115,950 |
| | | | | | 49,123,875 |
| | | | | | 1,197,054,386 |
| Guam: 0.59% | | | | | |
| Tax revenue: 0.08% | | | | | |
| Guam Government Business Privilege Tax Series A | | 5.00 | 1-1-2031 | 1,000,000 | 1,031,180 |
| Water & sewer revenue: 0.51% | | | | | |
| Guam Government Waterworks Authority | | 5.25 | 7-1-2033 | 1,500,000 | 1,685,175 |
| Guam Government Waterworks Authority | | 5.50 | 7-1-2043 | 3,125,000 | 3,530,125 |
| Guam Government Waterworks Authority Series A | | 5.00 | 1-1-2050 | 1,000,000 | 1,240,030 |
| | | | | | 6,455,330 |
| | | | | | 7,486,510 |
| Illinois: 0.89% | | | | | |
| Miscellaneous revenue: 0.89% | | | | | |
| Illinois Refunding Bond | | 5.00 | 2-1-2025 | 10,000,000 | 11,239,800 |
| Louisiana: 0.40% | | | | | |
| Industrial development revenue: 0.40% | | | | | |
| St. James Parish LA Nucor Steel LLC Project Gulf Opportunity Zone Series A-1 ø | | 0.16 | 11-1-2040 | 5,000,000 | 5,000,000 |
| New York: 0.48% | | | | | |
| Industrial development revenue: 0.48% | | | | | |
| New York Transportation Development Corporation Special Facilities Revenue Delta Air Lines Incorporated LaGuardia Airport Terminals C&D Redevelopment | | 5.00 | 1-1-2029 | 5,000,000 | 6,033,300 |
| Ohio: 0.06% | | | | | |
| Tobacco revenue: 0.06% | | | | | |
| Buckeye OH Tobacco Settlement Financing Authority CAB ¤ | | 0.00 | 6-1-2057 | 5,000,000 | 761,200 |
| Texas: 0.44% | | | | | |
| Resource recovery revenue: 0.44% | | | | | |
| Port Arthur TX Navigation District Jefferson County Environmental Facilities Motiva Enterprises LLC Project Series C ø | | 0.18 | 4-1-2040 | 500,000 | 500,000 |
| Port Arthur TX Navigation District Jefferson County Environmental Facilities Motiva Enterprises LLC Project Subordinate Bond Series D ø | | 0.23 | 11-1-2040 | 5,000,000 | 5,000,000 |
| | | | | | 5,500,000 |
| Total Municipal obligations (Cost $1,123,537,650) | | | | | 1,233,075,196 |
The accompanying notes are an integral part of these financial statements.
Wells Fargo California Tax-Free Fund | 21
Portfolio of investments—December 31, 2020 (unaudited)
| | | Yield | | Shares | Value |
| Short-term investments: 0.77% | | | | | |
| Investment companies: 0.77% | | | | | |
| Wells Fargo Municipal Cash Management Money Market Fund Institutional Class ♠∞## | | 0.01% | | 9,676,193 | $ 9,679,095 |
| Total Short-term investments (Cost $9,678,801) | | | | | 9,679,095 |
| Total investments in securities (Cost $1,138,216,451) | 99.02% | | | | 1,247,754,291 |
| Other assets and liabilities, net | 0.98 | | | | 12,300,631 |
| Total net assets | 100.00% | | | | $1,260,054,922 |
| 144A | The security may be resold in transactions exempt from registration, normally to qualified institutional buyers, pursuant to Rule 144A under the Securities Act of 1933. |
| ø | Variable rate demand notes are subject to a demand feature which reduces the effective maturity. The maturity date shown represents the final maturity date of the security. The interest rate is determined and reset by the issuer daily, weekly, or monthly depending upon the terms of the security. The rate shown is the rate in effect at period end. |
| ¤ | The security is issued in zero coupon form with no periodic interest payments. |
| ± | Variable rate investment. The rate shown is the rate in effect at period end. |
| ## | All or a portion of this security is segregated for when-issued securities. |
| ♠ | The issuer of the security is an affiliated person of the Fund as defined in the Investment Company Act of 1940. |
| ∞ | The rate represents the 7-day annualized yield at period end. |
| %% | The security is purchased on a when-issued basis. |
| Abbreviations: |
| AGC | Assured Guaranty Corporation |
| AGM | Assured Guaranty Municipal |
| Ambac | Ambac Financial Group Incorporated |
| AMT | Alternative minimum tax |
| BAM | Build America Mutual Assurance Company |
| CAB | Capital appreciation bond |
| CDA | Community Development Authority |
| FNMA | Federal National Mortgage Association |
| GNMA | Government National Mortgage Association |
| GO | General obligation |
| HFA | Housing Finance Authority |
| HFFA | Health Facilities Financing Authority |
| LIBOR | London Interbank Offered Rate |
| LIQ | Liquidity agreement |
| LOC | Letter of credit |
| National | National Public Finance Guarantee Corporation |
| PFA | Public Finance Authority |
| RDA | Redevelopment Authority |
Investments in affiliates
An affiliated investment is an investment in which the Fund owns at least 5% of the outstanding voting shares of the issuer or as a result of other relationships, such as the Fund and the issuer having the same investment manager. Transactions with issuers that were either affiliated persons of the Fund at the beginning of the period or the end of the period were as follows:
| | Value,
beginning of
period | Purchases | Sales
proceeds | Net
realized
gains
(losses) | Net
change in
unrealized
gains
(losses) | Value,
end of
period | % of
net
assets | Shares,
end
of period | Income
from
affiliated
securities |
| Short-term investments | | | | | | | | | |
| Investment companies | | | | | | | | | |
| Wells Fargo Municipal Cash Management Money Market Fund Institutional Class | $1,010,188 | $129,354,225 | $(120,684,102) | $(1,409) | $193 | $9,679,095 | 0.77% | 9,676,193 | $23,165 |
The accompanying notes are an integral part of these financial statements.
22 | Wells Fargo California Tax-Free Fund
Statement of assets and liabilities—December 31, 2020 (unaudited)
| | |
| Assets | |
Investments in unaffiliated securities, at value (cost $1,128,537,650)
| $ 1,238,075,196 |
Investments in affiliated securites, at value (cost $9,678,801)
| 9,679,095 |
Cash
| 143,250 |
Receivable for interest
| 14,557,979 |
Receivable for Fund shares sold
| 12,524,088 |
Prepaid expenses and other assets
| 34,462 |
Total assets
| 1,275,014,070 |
| Liabilities | |
Payable for when-issued transactions
| 8,398,434 |
Payable for investments purchased
| 4,065,647 |
Payable for Fund shares redeemed
| 903,228 |
Dividends payable
| 826,599 |
Management fee payable
| 347,076 |
Administration fees payable
| 138,242 |
Distribution fee payable
| 14,935 |
Trustees’ fees and expenses payable
| 2,858 |
Accrued expenses and other liabilities
| 262,129 |
Total liabilities
| 14,959,148 |
Total net assets
| $1,260,054,922 |
| Net assets consist of | |
Paid-in capital
| $ 1,179,013,096 |
Total distributable earnings
| 81,041,826 |
Total net assets
| $1,260,054,922 |
| Computation of net asset value and offering price per share | |
Net assets – Class A
| $ 511,001,946 |
Shares outstanding – Class A1
| 42,130,460 |
Net asset value per share – Class A
| $12.13 |
Maximum offering price per share – Class A2
| $12.70 |
Net assets – Class C
| $ 21,397,710 |
Shares outstanding – Class C1
| 1,729,943 |
Net asset value per share – Class C
| $12.37 |
Net assets – Administrator Class
| $ 335,281,177 |
Shares outstanding – Administrator Class1
| 27,590,111 |
Net asset value per share – Administrator Class
| $12.15 |
Net assets – Institutional Class
| $ 392,374,089 |
Shares outstanding – Institutional Class1
| 32,288,023 |
Net asset value per share – Institutional Class
| $12.15 |
| 1 | The Fund has an unlimited number of authorized shares |
| 2 | Maximum offering price is computed as 100/95.50 of net asset value. On investments of $50,000 or more, the offering price is reduced. |
The accompanying notes are an integral part of these financial statements.
Wells Fargo California Tax-Free Fund | 23
Statement of operations—six months ended December 31, 2020 (unaudited)
| | |
| Investment income | |
Interest
| $ 21,110,047 |
Income from affiliated securities
| 23,165 |
Total investment income
| 21,133,212 |
| Expenses | |
Management fee
| 2,356,816 |
| Administration fees | |
Class A
| 410,794 |
Class C
| 19,913 |
Administrator Class
| 164,976 |
Institutional Class
| 147,452 |
| Shareholder servicing fees | |
Class A
| 641,485 |
Class C
| 31,073 |
Administrator Class
| 412,329 |
| Distribution fee | |
Class C
| 93,218 |
Custody and accounting fees
| 16,611 |
Professional fees
| 31,508 |
Registration fees
| 31,210 |
Shareholder report expenses
| 21,494 |
Trustees’ fees and expenses
| 9,874 |
Other fees and expenses
| 14,279 |
Total expenses
| 4,403,032 |
| Less: Fee waivers and/or expense reimbursements | |
Fund-level
| (253,675) |
Class A
| (80,546) |
Class C
| (3,711) |
Administrator Class
| (166,359) |
Net expenses
| 3,898,741 |
Net investment income
| 17,234,471 |
| Realized and unrealized gains (losses) on investments | |
| Net realized gains (losses) on | |
Unaffiliated securities
| 348,521 |
Affiliated securities
| (1,409) |
Net realized gains on investments
| 347,112 |
| Net change in unrealized gains (losses) on | |
Unaffiliated securities
| 21,866,975 |
Affiliated securities
| 193 |
Net change in unrealized gains (losses) on investments
| 21,867,168 |
Net realized and unrealized gains (losses) on investments
| 22,214,280 |
Net increase in net assets resulting from operations
| $39,448,751 |
The accompanying notes are an integral part of these financial statements.
24 | Wells Fargo California Tax-Free Fund
Statement of changes in net assets
| | |
| | Six months ended
December 31, 2020
(unaudited) | Year ended
June 30, 2020 |
| Operations | | | | |
Net investment income
| | $ 17,234,471 | | $ 33,386,632 |
Net realized gains (losses) on investments
| | 347,112 | | (5,706,707) |
Net change in unrealized gains (losses) on investments
| | 21,867,168 | | 2,627,052 |
Net increase in net assets resulting from operations
| | 39,448,751 | | 30,306,977 |
| Distributions to shareholders from | | | | |
| Net investment income and net realized gains | | | | |
Class A
| | (6,878,084) | | (14,141,709) |
Class C
| | (240,244) | | (643,653) |
Administrator Class
| | (4,751,813) | | (8,419,907) |
Institutional Class
| | (5,438,659) | | (9,838,880) |
Total distributions to shareholders
| | (17,308,800) | | (33,044,149) |
| Capital share transactions | Shares | | Shares | |
| Proceeds from shares sold | | | | |
Class A
| 3,756,530 | 45,153,216 | 11,036,626 | 131,693,675 |
Class C
| 160,911 | 1,976,490 | 278,006 | 3,385,392 |
Administrator Class
| 3,016,706 | 36,235,685 | 8,864,944 | 106,569,369 |
Institutional Class
| 8,859,914 | 107,066,130 | 10,316,056 | 123,479,416 |
| | | 190,431,521 | | 365,127,852 |
| Reinvestment of distributions | | | | |
Class A
| 536,112 | 6,451,972 | 1,122,167 | 13,411,897 |
Class C
| 18,677 | 229,187 | 49,002 | 597,402 |
Administrator Class
| 382,022 | 4,606,046 | 691,273 | 8,273,557 |
Institutional Class
| 210,440 | 2,537,407 | 356,230 | 4,265,361 |
| | | 13,824,612 | | 26,548,217 |
| Payment for shares redeemed | | | | |
Class A
| (3,693,094) | (44,302,061) | (11,116,036) | (132,686,298) |
Class C
| (707,531) | (8,658,174) | (765,067) | (9,324,238) |
Administrator Class
| (1,120,058) | (13,520,306) | (3,617,140) | (42,474,283) |
Institutional Class
| (4,288,608) | (51,748,894) | (7,724,779) | (92,150,306) |
| | | (118,229,435) | | (276,635,125) |
Net increase in net assets resulting from capital share transactions
| | 86,026,698 | | 115,040,944 |
Total increase in net assets
| | 108,166,649 | | 112,303,772 |
| Net assets | | | | |
Beginning of period
| | 1,151,888,273 | | 1,039,584,501 |
End of period
| | $1,260,054,922 | | $1,151,888,273 |
The accompanying notes are an integral part of these financial statements.
Wells Fargo California Tax-Free Fund | 25
Financial highlights
(For a share outstanding throughout each period)
| | | Year ended June 30 |
| Class A | Six months ended
December 31, 2020
(unaudited) | 2020 | 2019 | 2018 | 2017 | 2016 |
Net asset value, beginning of period
| $11.91 | $11.91 | $11.64 | $11.83 | $12.45 | $11.79 |
Net investment income
| 0.16 | 0.35 | 0.37 | 0.37 | 0.36 | 0.36 |
Net realized and unrealized gains (losses) on investments
| 0.23 | (0.00) 1 | 0.28 | (0.19) | (0.62) | 0.66 |
Total from investment operations
| 0.39 | 0.35 | 0.65 | 0.18 | (0.26) | 1.02 |
| Distributions to shareholders from | | | | | | |
Net investment income
| (0.17) | (0.35) | (0.38) | (0.37) | (0.36) | (0.36) |
Net asset value, end of period
| $12.13 | $11.91 | $11.91 | $11.64 | $11.83 | $12.45 |
Total return2
| 3.23% | 2.93% | 5.70% | 1.55% | (2.09)% | 8.77% |
| Ratios to average net assets (annualized) | | | | | | |
Gross expenses
| 0.81% | 0.81% | 0.83% | 0.83% | 0.82% | 0.82% |
Net expenses
| 0.75% | 0.75% | 0.75% | 0.75% | 0.75% | 0.75% |
Net investment income
| 2.66% | 2.92% | 3.22% | 3.15% | 2.99% | 2.96% |
| Supplemental data | | | | | | |
Portfolio turnover rate
| 4% | 23% | 9% | 33% | 48% | 17% |
Net assets, end of period (000s omitted)
| $511,002 | $494,450 | $482,395 | $443,165 | $472,584 | $528,238 |
| 1 | Amount is more than $(0.005). |
| 2 | Total return calculations do not include any sales charges. Returns for periods of less than one year are not annualized. |
The accompanying notes are an integral part of these financial statements.
26 | Wells Fargo California Tax-Free Fund
Financial highlights
(For a share outstanding throughout each period)
| | | Year ended June 30 |
| Class C | Six months ended
December 31, 2020
(unaudited) | 2020 | 2019 | 2018 | 2017 | 2016 |
Net asset value, beginning of period
| $12.14 | $12.15 | $11.87 | $12.07 | $12.70 | $12.02 |
Net investment income
| 0.12 | 0.27 | 0.29 | 0.29 | 0.27 | 0.27 |
Net realized and unrealized gains (losses) on investments
| 0.23 | (0.02) | 0.29 | (0.20) | (0.63) | 0.68 |
Total from investment operations
| 0.35 | 0.25 | 0.58 | 0.09 | (0.36) | 0.95 |
| Distributions to shareholders from | | | | | | |
Net investment income
| (0.12) | (0.26) | (0.30) | (0.29) | (0.27) | (0.27) |
Net asset value, end of period
| $12.37 | $12.14 | $12.15 | $11.87 | $12.07 | $12.70 |
Total return1
| 2.89% | 2.08% | 4.95% | 0.74% | (2.80)% | 8.02% |
| Ratios to average net assets (annualized) | | | | | | |
Gross expenses
| 1.56% | 1.56% | 1.58% | 1.58% | 1.57% | 1.57% |
Net expenses
| 1.50% | 1.50% | 1.50% | 1.50% | 1.50% | 1.50% |
Net investment income
| 1.92% | 2.18% | 2.47% | 2.40% | 2.24% | 2.21% |
| Supplemental data | | | | | | |
Portfolio turnover rate
| 4% | 23% | 9% | 33% | 48% | 17% |
Net assets, end of period (000s omitted)
| $21,398 | $27,413 | $32,758 | $47,831 | $57,727 | $66,427 |
| 1 | Total return calculations do not include any sales charges. Returns for periods of less than one year are not annualized. |
The accompanying notes are an integral part of these financial statements.
Wells Fargo California Tax-Free Fund | 27
Financial highlights
(For a share outstanding throughout each period)
| | | Year ended June 30 |
| Administrator Class | Six months ended
December 31, 2020
(unaudited) | 2020 | 2019 | 2018 | 2017 | 2016 |
Net asset value, beginning of period
| $11.93 | $11.94 | $11.66 | $11.86 | $12.48 | $11.81 |
Net investment income
| 0.18 | 0.37 | 0.40 | 0.39 | 0.38 | 0.38 |
Net realized and unrealized gains (losses) on investments
| 0.22 | (0.01) | 0.28 | (0.20) | (0.62) | 0.67 |
Total from investment operations
| 0.40 | 0.36 | 0.68 | 0.19 | (0.24) | 1.05 |
| Distributions to shareholders from | | | | | | |
Net investment income
| (0.18) | (0.37) | (0.40) | (0.39) | (0.38) | (0.38) |
Net asset value, end of period
| $12.15 | $11.93 | $11.94 | $11.66 | $11.86 | $12.48 |
Total return1
| 3.33% | 3.05% | 5.99% | 1.67% | (1.88)% | 9.06% |
| Ratios to average net assets (annualized) | | | | | | |
Gross expenses
| 0.75% | 0.75% | 0.77% | 0.77% | 0.76% | 0.76% |
Net expenses
| 0.55% | 0.55% | 0.55% | 0.55% | 0.55% | 0.55% |
Net investment income
| 2.87% | 3.13% | 3.43% | 3.34% | 3.16% | 3.16% |
| Supplemental data | | | | | | |
Portfolio turnover rate
| 4% | 23% | 9% | 33% | 48% | 17% |
Net assets, end of period (000s omitted)
| $335,281 | $301,919 | $231,252 | $186,626 | $210,209 | $344,090 |
| 1 | Returns for periods of less than one year are not annualized. |
The accompanying notes are an integral part of these financial statements.
28 | Wells Fargo California Tax-Free Fund
Financial highlights
(For a share outstanding throughout each period)
| | | Year ended June 30 |
| Institutional Class | Six months ended
December 31, 2020
(unaudited) | 2020 | 2019 | 2018 | 2017 | 2016 |
Net asset value, beginning of period
| $11.93 | $11.94 | $11.66 | $11.86 | $12.48 | $11.81 |
Net investment income
| 0.18 | 0.38 | 0.41 | 0.40 | 0.39 | 0.39 |
Net realized and unrealized gains (losses) on investments
| 0.22 | (0.01) | 0.28 | (0.20) | (0.62) | 0.67 |
Total from investment operations
| 0.40 | 0.37 | 0.69 | 0.20 | (0.23) | 1.06 |
| Distributions to shareholders from | | | | | | |
Net investment income
| (0.18) | (0.38) | (0.41) | (0.40) | (0.39) | (0.39) |
Net asset value, end of period
| $12.15 | $11.93 | $11.94 | $11.66 | $11.86 | $12.48 |
Total return1
| 3.37% | 3.12% | 6.07% | 1.74% | (1.81)% | 9.14% |
| Ratios to average net assets (annualized) | | | | | | |
Gross expenses
| 0.48% | 0.48% | 0.50% | 0.50% | 0.49% | 0.49% |
Net expenses
| 0.48% | 0.48% | 0.48% | 0.48% | 0.48% | 0.48% |
Net investment income
| 2.94% | 3.19% | 3.49% | 3.42% | 3.28% | 3.24% |
| Supplemental data | | | | | | |
Portfolio turnover rate
| 4% | 23% | 9% | 33% | 48% | 17% |
Net assets, end of period (000s omitted)
| $392,374 | $328,107 | $293,180 | $287,616 | $309,253 | $193,154 |
| 1 | Returns for periods of less than one year are not annualized. |
The accompanying notes are an integral part of these financial statements.
Wells Fargo California Tax-Free Fund | 29
Notes to financial statements (unaudited)
1. ORGANIZATION
Wells Fargo Funds Trust (the “Trust”), a Delaware statutory trust organized on March 10, 1999, is an open-end management investment company registered under the Investment Company Act of 1940, as amended (the “1940 Act”). As an investment company, the Trust follows the accounting and reporting guidance in Financial Accounting Standards Board (“FASB”) Accounting Standards Codification Topic 946, Financial Services – Investment Companies. These financial statements report on the Wells Fargo California Tax-Free Fund (the “Fund”) which is a non-diversified series of the Trust.
2. SIGNIFICANT ACCOUNTING POLICIES
The following significant accounting policies, which are consistently followed in the preparation of the financial statements of the Fund, are in conformity with U.S. generally accepted accounting principles which require management to make estimates and assumptions that affect the reported amounts of assets and liabilities, disclosure of contingent assets and liabilities at the date of the financial statements, and the reported amounts of income and expenses during the reporting period. Actual results could differ from those estimates.
Securities valuation
All investments are valued each business day as of the close of regular trading on the New York Stock Exchange (generally 4 p.m. Eastern Time), although the Fund may deviate from this calculation time under unusual or unexpected circumstances.
Debt securities are valued at the evaluated bid price provided by an independent pricing service (e.g. taking into account various factors, including yields, maturities, or credit ratings) or, if a reliable price is not available, the quoted bid price from an independent broker-dealer.
Investments in registered open-end investment companies are valued at net asset value.
Investments which are not valued using any of the methods discussed above are valued at their fair value, as determined in good faith by the Board of Trustees of the Fund. The Board of Trustees has established a Valuation Committee comprised of the Trustees and has delegated to it the authority to take any actions regarding the valuation of portfolio securities that the Valuation Committee deems necessary or appropriate, including determining the fair value of portfolio securities, unless the determination has been delegated to the Wells Fargo Asset Management Pricing Committee at Wells Fargo Funds Management, LLC ("Funds Management"). The Board of Trustees retains the authority to make or ratify any valuation decisions or approve any changes to the Valuation Procedures as it deems appropriate. On a quarterly basis, the Board of Trustees receives reports on any valuation actions taken by the Valuation Committee or the Wells Fargo Asset Management Pricing Committee which may include items for ratification.
When-issued transactions
The Fund may purchase securities on a forward commitment or when-issued basis. The Fund records a when-issued transaction on the trade date and will segregate assets in an amount at least equal in value to the Fund's commitment to purchase when-issued securities. Securities purchased on a when-issued basis are marked-to-market daily and the Fund begins earning interest on the settlement date. Losses may arise due to changes in the market value of the underlying securities or if the counterparty does not perform under the contract.
Security transactions and income recognition
Securities transactions are recorded on a trade date basis. Realized gains or losses are recorded on the basis of identified cost.
Interest income is accrued daily and bond discounts are accreted and premiums are amortized daily. To the extent debt obligations are placed on non-accrual status, any related interest income may be reduced by writing off interest receivables when the collection of all or a portion of interest has been determined to be doubtful based on consistently applied procedures and the fair value has decreased. If the issuer subsequently resumes interest payments or when the collectability of interest is reasonably assured, the debt obligation is removed from non-accrual status.
Distributions to shareholders
Distributions to shareholders from net investment income are declared daily and paid monthly. Distributions from net realized gains, if any, are recorded on the ex-dividend date and paid at least annually. Such distributions are determined in accordance with income tax regulations and may differ from U.S. generally accepted accounting principles. Dividend sources are estimated at the time of declaration. The tax character of distributions is determined as of the Fund’s fiscal year end. Therefore, a portion of the Fund’s distributions made prior to the Fund’s fiscal year end may be categorized as a tax return of capital at year end.
30 | Wells Fargo California Tax-Free Fund
Notes to financial statements (unaudited)
Federal and other taxes
The Fund intends to continue to qualify as a regulated investment company by distributing substantially all of its investment company taxable and tax-exempt income and any net realized capital gains (after reduction for capital loss carryforwards) sufficient to relieve it from all, or substantially all, federal income taxes. Accordingly, no provision for federal income taxes was required.
The Fund’s income and federal excise tax returns and all financial records supporting those returns for the prior three fiscal years are subject to examination by the federal and Delaware revenue authorities. Management has analyzed the Fund’s tax positions taken on federal, state, and foreign tax returns for all open tax years and does not believe that there are any uncertain tax positions that require recognition of a tax liability.
As of December 31, 2020, the aggregate cost of all investments for federal income tax purposes was $1,138,216,451 and the unrealized gains (losses) consisted of:
| Gross unrealized gains | $109,557,896 |
| Gross unrealized losses | (20,056) |
| Net unrealized gains | $109,537,840 |
As of June 30, 2020, the Fund had capital loss carryforwards which consisted of $28,787,467 in short-term capital losses .
Class allocations
The separate classes of shares offered by the Fund differ principally in applicable sales charges, distribution, shareholder servicing, and administration fees. Class specific expenses are charged directly to that share class. Investment income, common fund-level expenses, and realized and unrealized gains (losses) on investments are allocated daily to each class of shares based on the relative proportion of net assets of each class.
3. FAIR VALUATION MEASUREMENTS
Fair value measurements of investments are determined within a framework that has established a fair value hierarchy based upon the various data inputs utilized in determining the value of the Fund’s investments. The three-level hierarchy gives the highest priority to unadjusted quoted prices in active markets for identical assets or liabilities (Level 1) and the lowest priority to unobservable inputs (Level 3). The Fund’s investments are classified within the fair value hierarchy based on the lowest level of input that is significant to the fair value measurement. The inputs are summarized into three broad levels as follows:
| ■ | Level 1 – quoted prices in active markets for identical securities |
| ■ | Level 2 – other significant observable inputs (including quoted prices for similar securities, interest rates, prepayment speeds, credit risk, etc.) |
| ■ | Level 3 – significant unobservable inputs (including the Fund’s own assumptions in determining the fair value of investments) |
The inputs or methodologies used for valuing investments in securities are not necessarily an indication of the risk associated with investing in those securities.
The following is a summary of the inputs used in valuing the Fund’s assets and liabilities as of December 31, 2020:
| | Quoted prices
(Level 1) | Other significant
observable inputs
(Level 2) | Significant
unobservable inputs
(Level 3) | Total |
| Assets | | | | |
| Investments in: | | | | |
| Closed end municipal bond fund obligations | $ 0 | $ 5,000,000 | $0 | $ 5,000,000 |
| Municipal obligations | 0 | 1,233,075,196 | 0 | 1,233,075,196 |
| Short-term investments | | | | |
| Investment companies | 9,679,095 | 0 | 0 | 9,679,095 |
| Total assets | $9,679,095 | $1,238,075,196 | $0 | $1,247,754,291 |
Additional sector, industry or geographic detail is included in the Portfolio of Investments.
Wells Fargo California Tax-Free Fund | 31
Notes to financial statements (unaudited)
For the six months ended December 31, 2020, the Fund did not have any transfers into/out of Level 3.
4. TRANSACTIONS WITH AFFILIATES
Management fee
Funds Management, an indirect wholly owned subsidiary of Wells Fargo & Company (“Wells Fargo”), is the manager of the Fund and provides advisory and fund-level administrative services under an investment management agreement. Under the investment management agreement, Funds Management is responsible for, among other services, implementing the investment objectives and strategies of the Fund, supervising the subadviser and providing fund-level administrative services in connection with the Fund’s operations. As compensation for its services under the investment management agreement, Funds Management is entitled to receive a management fee at the following annual rate based on the Fund’s average daily net assets:
| Average daily net assets | Management fee |
| First $500 million | 0.400% |
| Next $500 million | 0.375 |
| Next $2 billion | 0.350 |
| Next $2 billion | 0.325 |
| Next $5 billion | 0.290 |
| Over $10 billion | 0.280 |
For the six months ended December 31, 2020, the management fee was equivalent to an annual rate of 0.38% of the Fund’s average daily net assets.
Funds Management has retained the services of a subadviser to provide daily portfolio management to the Fund. The fee for subadvisory services is borne by Funds Management. Wells Capital Management, Incorporated, an affiliate of Funds Management and an indirect wholly owned subsidiary of Wells Fargo, is the subadviser to the Fund and is entitled to receive a fee from Funds Management at an annual rate starting at 0.20% and declining to 0.10% as the average daily net assets of the Fund increase.
Administration fees
Under a class-level administration agreement, Funds Management provides class-level administrative services to the Fund, which includes paying fees and expenses for services provided by the transfer agent, sub-transfer agents, omnibus account servicers and record-keepers. As compensation for its services under the class-level administration agreement, Funds Management receives an annual fee which is calculated based on the average daily net assets of each class as follows:
| | Class-level
administration fee |
| Class A | 0.16% |
| Class C | 0.16 |
| Administrator Class | 0.10 |
| Institutional Class | 0.08 |
Waivers and/or expense reimbursements
Funds Management has contractually waived and/or reimbursed management and administration fees to the extent necessary to maintain certain net operating expense ratios for the Fund. When each class of the Fund has exceeded its expense cap, Funds Management has waived fees and/or reimbursed expenses from fund-level expenses on a proportionate basis and then from class specific expenses. When only certain classes exceed their expense caps, waivers and/or reimbursements are applied against class specific expenses before fund-level expenses. Funds Management has committed through October 31, 2021 to waive fees and/or reimburse expenses to the extent necessary to cap the Fund’s expenses at 0.75% for Class A shares, 1.50% for Class C shares, 0.55% for Administrator Class shares and 0.48% for Institutional Class shares. Prior to or after the commitment expiration date, the cap may be increased or the commitment to maintain the cap may be terminated only with the approval of the Board of Trustees.
32 | Wells Fargo California Tax-Free Fund
Notes to financial statements (unaudited)
Distribution fee
The Trust has adopted a distribution plan for Class C shares of the Fund pursuant to Rule 12b-1 under the 1940 Act. A distribution fee is charged charged to Class C shares and paid to Wells Fargo Funds Distributor, LLC (“Funds Distributor”), the principal underwriter, at an annual rate of 0.75% of the average daily net assets of Class C shares.
In addition, Funds Distributor is entitled to receive the front-end sales charge from the purchase of Class A shares and a contingent deferred sales charge on the redemption of certain Class A shares. Funds Distributor is also entitled to receive the contingent deferred sales charges from redemptions of Class C shares. For the six months ended December 31, 2020, Funds Distributor received $11,443 from the sale of Class A shares. No contingent deferred sales charges were incurred by Class A and Class C shares for the six months ended December 31, 2020.
Shareholder servicing fees
The Trust has entered into contracts with one or more shareholder servicing agents, whereby Class A, Class C, and Administrator Class of the Fund are charged a fee at an annual rate of 0.25% of the average daily net assets of each respective class. A portion of these total shareholder servicing fees were paid to affiliates of Wells Fargo.
Interfund transactions
The Fund may purchase or sell portfolio investment securities to certain other Wells Fargo affiliates pursuant to Rule 17a-7 under the 1940 Act and under procedures adopted by the Board of Trustees. The procedures have been designed to ensure that these interfund transactions, which do not incur broker commissions, are effected at current market prices. Pursuant to these procedures, the Fund had $18,180,000, $3,000,000 and $0 in interfund purchases, sales and net realized gains (losses), respectively, during the six months ended December 31, 2020.
5. INVESTMENT PORTFOLIO TRANSACTIONS
Purchases and sales of investments, excluding U.S. government obligations (if any) and short-term securities, for the six months ended December 31, 2020 were $131,144,148 and $45,669,862, respectively.
6. BANK BORROWINGS
The Trust (excluding the money market funds), Wells Fargo Master Trust and Wells Fargo Variable Trust are parties to a $350,000,000 revolving credit agreement whereby the Fund is permitted to use bank borrowings for temporary or emergency purposes, such as to fund shareholder redemption requests. Interest under the credit agreement is charged to the Fund based on a borrowing rate equal to the higher of the Federal Funds rate in effect on that day plus 1.25% or the overnight LIBOR rate in effect on that day plus 1.25%. In addition, an annual commitment fee equal to 0.25% of the unused balance is allocated to each participating fund.
For the six months ended December 31, 2020, there were no borrowings by the Fund under the agreement.
7. CONCENTRATION RISK
The Fund invests a substantial portion of its assets in issuers of municipal debt securities located in a single state or territory of the U.S. Therefore, it may be more affected by economic and political developments in that state or region than would be a comparable general tax-exempt fund. As of the end of the period, the Fund invested a concentration of its portfolio in the state of California.
8. INDEMNIFICATION
Under the Fund's organizational documents, the officers and Trustees have been granted certain indemnification rights against certain liabilities that may arise out of performance of their duties to the Fund. The Fund has entered into a separate agreement with each Trustee that converts indemnification rights currently existing under the Fund’s organizational documents into contractual rights that cannot be changed in the future without the consent of the Trustee. Additionally, in the normal course of business, the Fund may enter into contracts with service providers that contain a variety of indemnification clauses. The Fund’s maximum exposure under these arrangements is dependent on future claims that may be made against the Fund and, therefore, cannot be estimated.
9. NEW ACCOUNTING PRONOUNCEMENT
In August 2018, FASB issued Accounting Standards Update (“ASU”) No. 2018-13, Fair Value Measurement (Topic 820) Disclosure Framework - Changes to the Disclosure Requirements for Fair Value Measurement. ASU 2018-13 updates the disclosure requirements on fair value measurements in Topic 820, Fair Value Measurements. The amendments are effective for fiscal years,
Wells Fargo California Tax-Free Fund | 33
Notes to financial statements (unaudited)
and interim periods within those fiscal years, beginning after December 15, 2019. Management has adopted this guidance which did not have a material impact on the financial statements.
10. SUBSEQUENT EVENT
On February 23, 2021, Wells Fargo announced that it has entered into a definitive agreement to sell Wells Fargo Asset Management (“WFAM”) to GTCR LLC and Reverence Capital Partners, L.P. WFAM is the trade name used by the asset management businesses of Wells Fargo and includes Wells Fargo Funds Management, LLC, the investment manager to the Fund, Wells Capital Management Incorporated and Wells Fargo Asset Management (International) Limited, both registered investment advisers providing sub-advisory services to certain funds, and Wells Fargo Funds Distributor, LLC, the Fund’s principal underwriter. As part of the transaction, Wells Fargo will own a 9.9% equity interest and will continue to serve as an important client and distribution partner.
Consummation of the transaction will result in the automatic termination of the Fund’s investment management agreement and sub-advisory agreement(s). The Fund’s Board of Trustees will be asked to approve new investment management arrangements with the new company. If approved by the Board, the new investment management arrangements with the new company will be presented to the shareholders of the Fund for approval, and, if approved by shareholders, would take effect upon the closing of the transaction. The transaction is expected to close in the second half of 2021, subject to customary closing conditions.
11. CORONAVIRUS (COVID-19) PANDEMIC
On March 11, 2020, the World Health Organization announced that it had made the assessment that coronavirus disease 2019 (“COVID-19”) is a pandemic. The impacts of COVID-19 are affecting the entire global economy, individual companies and investment products, and the market in general. There is significant uncertainty around the extent and duration of business disruptions related to COVID-19 and the impacts may be short term or may last for an extended period of time. The risk of further spreading of COVID-19 has led to significant uncertainty and volatility in the financial markets.
34 | Wells Fargo California Tax-Free Fund
Other information (unaudited)
PROXY VOTING INFORMATION
A description of the policies and procedures used to determine how to vote proxies relating to portfolio securities is available without charge, upon request, by calling 1-800-222-8222, visiting our website at wfam.com, or visiting the SEC website at sec.gov. Information regarding how the proxies related to portfolio securities were voted during the most recent 12-month period ended June 30 is available on the website at wfam.com or by visiting the SEC website at sec.gov.
QUARTERLY PORTFOLIO HOLDINGS INFORMATION
The Fund files its complete schedule of portfolio holdings with the SEC for the first and third quarters of each fiscal year as an exhibit to its reports on Form N-PORT. Shareholders may view the filed Form N-PORT by visiting the SEC website at sec.gov.
Wells Fargo California Tax-Free Fund | 35
Other information (unaudited)
BOARD OF TRUSTEES AND OFFICERS
Each of the Trustees and Officers1 listed in the table below acts in identical capacities for each fund in the Wells Fargo family of funds, which consists of 144 mutual funds comprising the Wells Fargo Funds Trust, Wells Fargo Variable Trust, Wells Fargo Master Trust and four closed-end funds (collectively the “Fund Complex”). This table should be read in conjunction with the Prospectus and the Statement of Additional Information2. The mailing address of each Trustee and Officer is 525 Market Street, 12th Floor, San Francisco, CA 94105. Each Trustee and Officer serves an indefinite term, however, each Trustee serves such term until reaching the mandatory retirement age established by the Trustees.
Independent Trustees
Name and
year of birth | Position held and
length of service* | Principal occupations during past five years or longer | Current other
public company or
investment
company
directorships |
William R. Ebsworth
(Born 1957) | Trustee,
since 2015 | Retired. From 1984 to 2013, equities analyst, portfolio manager, research director and chief investment officer at Fidelity Management and Research Company in Boston, Tokyo, and Hong Kong, and retired in 2013 as Chief Investment Officer of Fidelity Strategic Advisers, Inc. where he led a team of investment professionals managing client assets. Prior thereto, Board member of Hong Kong Securities Clearing Co., Hong Kong Options Clearing Corp., the Thailand International Fund, Ltd., Fidelity Investments Life Insurance Company, and Empire Fidelity Investments Life Insurance Company. Audit Committee Chair and Investment Committee Chair of the Vincent Memorial Hospital Endowment (non-profit organization). Mr. Ebsworth is a CFA® charterholder. | N/A |
Jane A. Freeman
(Born 1953) | Trustee,
since 2015;
Chair Liaison,
since 2018 | Retired. From 2012 to 2014 and 1999 to 2008, Chief Financial Officer of Scientific Learning Corporation. From 2008 to 2012, Ms. Freeman provided consulting services related to strategic business projects. Prior to 1999, Portfolio Manager at Rockefeller & Co. and Scudder, Stevens & Clark. Board member of the Harding Loevner Funds from 1996 to 2014, serving as both Lead Independent Director and chair of the Audit Committee. Board member of the Russell Exchange Traded Funds Trust from 2011 to 2012 and the chair of the Audit Committee. Ms. Freeman is also an inactive Chartered Financial Analyst. | N/A |
Isaiah Harris, Jr.
(Born 1952) | Trustee,
since 2009; Audit
Committee
Chair,
since 2019 | Retired. Chairman of the Board of CIGNA Corporation since 2009, and Director since 2005. From 2003 to 2011, Director of Deluxe Corporation. Prior thereto, President and CEO of BellSouth Advertising and Publishing Corp. from 2005 to 2007, President and CEO of BellSouth Enterprises from 2004 to 2005 and President of BellSouth Consumer Services from 2000 to 2003. Emeritus member of the Iowa State University Foundation Board of Governors. Emeritus Member of the Advisory Board of Iowa State University School of Business. Advisory Board Member, Palm Harbor Academy (private school). Mr. Harris is a certified public accountant (inactive status). | CIGNA Corporation |
Judith M. Johnson
(Born 1949) | Trustee,
since 2008 | Retired. Prior thereto, Chief Executive Officer and Chief Investment Officer of Minneapolis Employees Retirement Fund from 1996 to 2008. Ms. Johnson is an attorney, certified public accountant and a certified managerial accountant. | N/A |
David F. Larcker
(Born 1950) | Trustee,
since 2009 | James Irvin Miller Professor of Accounting at the Graduate School of Business (Emeritus), Stanford University, Director of the Corporate Governance Research Initiative and Senior Faculty of The Rock Center for Corporate Governance since 2006. From 2005 to 2008, Professor of Accounting at the Graduate School of Business, Stanford University. Prior thereto, Ernst & Young Professor of Accounting at The Wharton School, University of Pennsylvania from 1985 to 2005. | N/A |
36 | Wells Fargo California Tax-Free Fund
Other information (unaudited)
Name and
year of birth | Position held and
length of service* | Principal occupations during past five years or longer | Current other
public company or
investment
company
directorships |
Olivia S. Mitchell
(Born 1953) | Trustee,
since 2006;
Nominating and
Governance
Committee Chair,
since 2018 | International Foundation of Employee Benefit Plans Professor, Wharton School of the University of Pennsylvania since 1993. Director of Wharton’s Pension Research Council and Boettner Center on Pensions & Retirement Research, and Research Associate at the National Bureau of Economic Research. Previously, Cornell University Professor from 1978 to 1993. | N/A |
Timothy J. Penny
(Born 1951) | Trustee,
since 1996;
Chair,
since 2018 | President and Chief Executive Officer of Southern Minnesota Initiative Foundation, a non-profit organization, since 2007. Member of the Board of Trustees of NorthStar Education Finance, Inc., a non-profit organization, since 2007. | N/A |
James G. Polisson
(Born 1959) | Trustee,
since 2018 | Retired. Chief Marketing Officer, Source (ETF) UK Services, Ltd, from 2015 to 2017. From 2012 to 2015, Principal of The Polisson Group, LLC, a management consulting, corporate advisory and principal investing company. Chief Executive Officer and Managing Director at Russell Investments, Global Exchange Traded Funds from 2010 to 2012. Managing Director of Barclays Global Investors from 1998 to 2010 and Global Chief Marketing Officer for iShares and Barclays Global Investors from 2000 to 2010. Trustee of the San Francisco Mechanics’ Institute, a non-profit organization, from 2013 to 2015. Board member of the Russell Exchange Traded Fund Trust from 2011 to 2012. Director of Barclays Global Investors Holdings Deutschland GmbH from 2006 to 2009. Mr. Polisson is an attorney and has a retired status with the Massachusetts and District of Columbia Bar Associations. | N/A |
Pamela Wheelock
(Born 1959) | Trustee,
since January
2020; previously
Trustee from
January 2018 to
July 2019 | Board member of the Destination Medical Center Economic Development Agency, Rochester, Minnesota since 2019. Interim President of the McKnight Foundation from January to September 2020. Acting Commissioner, Minnesota Department of Human Services, July 2019 through September 2019. Human Services Manager (part-time), Minnesota Department of Human Services, October 2019 through December 2019. Chief Operating Officer, Twin Cities Habitat for Humanity from 2017 to 2019. Vice President of University Services, University of Minnesota from 2012 to 2016. Prior thereto, on the Board of Directors, Governance Committee and Finance Committee for the Minnesota Philanthropy Partners (Saint Paul Foundation) from 2012 to 2018, Interim Chief Executive Officer of Blue Cross Blue Shield of Minnesota from 2011 to 2012, Chairman of the Board from 2009 to 2012 and Board Director from 2003 to 2015. Vice President, Leadership and Community Engagement, Bush Foundation, Saint Paul, Minnesota (a private foundation) from 2009 to 2011. Executive Vice President and Chief Financial Officer, Minnesota Sports and Entertainment from 2004 to 2009 and Senior Vice President from 2002 to 2004. Executive Vice President of the Minnesota Wild Foundation from 2004 to 2008. Commissioner of Finance, State of Minnesota, from 1999 to 2002. Currently Board Chair of the Minnesota Wild Foundation since 2010. | N/A |
* Length of service dates reflect the Trustee’s commencement of service with the Trust’s predecessor entities, where applicable.
Wells Fargo California Tax-Free Fund | 37
Other information (unaudited)
Officers
Name and
year of birth | Position held and
length of service | Principal occupations during past five years or longer |
Andrew Owen
(Born 1960) | President,
since 2017 | Executive Vice President of Wells Fargo & Company and Head of Affiliated Managers, Wells Fargo Asset Management, since 2014. In addition, Mr. Owen is currently President, Chief Executive Officer and Director of Wells Fargo Funds Management, LLC since 2017. Prior thereto, Executive Vice President responsible for marketing, investments and product development for Wells Fargo Funds Management, LLC, from 2009 to 2014. |
Nancy Wiser1
(Born 1967) | Treasurer,
since 2012 | Executive Vice President of Wells Fargo Funds Management, LLC since 2011. Chief Operating Officer and Chief Compliance Officer at LightBox Capital Management LLC, from 2008 to 2011. |
Michelle Rhee
(Born 1966) | Chief Legal Officer,
since 2019 | Secretary of Wells Fargo Funds Management, LLC and Chief Legal Counsel of Wells Fargo Asset Management since 2018. Deputy General Counsel of Wells Fargo Bank N.A. since 2020 and Assistant General Counsel of Wells Fargo Bank, N.A. from 2018 to 2020. Associate General Counsel and Managing Director of Bank of America Corporation from 2004 to 2018. |
Catherine Kennedy
(Born 1969) | Secretary,
since 2019 | Vice President of Wells Fargo Funds Management, LLC and Senior Counsel of the Wells Fargo Legal Department since 2010. Vice President and Senior Counsel of Evergreen Investment Management Company, LLC from 1998 to 2010. |
Michael H. Whitaker
(Born 1967) | Chief Compliance Officer,
since 2016 | Chief Compliance Officer of Wells Fargo Asset Management since 2016. Senior Vice President and Chief Compliance Officer for Fidelity Investments from 2007 to 2016. |
Jeremy DePalma1
(Born 1974) | Assistant Treasurer,
since 2009 | Senior Vice President of Wells Fargo Funds Management, LLC since 2009. Senior Vice President of Evergreen Investment Management Company, LLC from 2008 to 2010 and head of the Fund Reporting and Control Team within Fund Administration from 2005 to 2010. |
1 Nancy Wiser acts as Treasurer of 67 funds in the Fund Complex. Jeremy DePalma acts as the Treasurer of 77 funds and Assistant Treasurer of 67 funds in the Fund Complex.
2 The Statement of Additional Information includes additional information about the Trustees and is available, without charge, upon request, by calling 1-800-222-8222 or by visiting the website at wfam.com.
38 | Wells Fargo California Tax-Free Fund
For more information
More information about Wells Fargo Funds is available free upon request. To obtain literature, please write, visit the Fund's website, or call:
Wells Fargo Funds
P.O. Box 219967
Kansas City, MO 64121-9967
Website: wfam.com
Individual investors: 1-800-222-8222
Retail investment professionals: 1-888-877-9275
Institutional investment professionals: 1-866-765-0778
This report and the financial statements contained herein are submitted for the general information of the shareholders of the Fund. If this report is used for promotional purposes, distribution of the report must be accompanied or preceded by a current prospectus. Before investing, please consider the investment objectives, risks, charges, and expenses of the investment. For a current prospectus and, if available, a summary prospectus, containing this information, call 1-800-222-8222 or visit the Fund’s website at wfam.com. Read the prospectus carefully before you invest or send money.
Wells Fargo Asset Management (WFAM) is the trade name for certain investment advisory/management firms owned by Wells Fargo & Company. These firms include but are not limited to Wells Capital Management Incorporated and Wells Fargo Funds Management, LLC. Certain products managed by WFAM entities are distributed by Wells Fargo Funds Distributor, LLC (a broker-dealer and Member FINRA).
This material is for general informational and educational purposes only and is NOT intended to provide investment advice or a recommendation of any kind— including a recommendation for any specific investment, strategy, or plan.
INVESTMENT PRODUCTS: NOT FDIC INSURED ■ NO BANK GUARANTEE ■ MAY LOSE VALUE
© 2021 Wells Fargo & Company. All rights reserved.
PAR-0121-00273 02-21
SA249/SAR249 12-20
Semi-Annual Report
December 31, 2020
Wells Fargo
High Yield Municipal Bond Fund
Reduce clutter.
Save trees.
Sign up for electronic delivery of prospectuses and shareholder reports at wellsfargo.com/ advantagedelivery
The views expressed and any forward-looking statements are as of December 31, 2020, unless otherwise noted, and are those of the Fund's portfolio managers and/or Wells Fargo Asset Management. Discussions of individual securities or the markets generally are not intended as individual recommendations. Future events or results may vary significantly from those expressed in any forward-looking statements. The views expressed are subject to change at any time in response to changing circumstances in the market. Wells Fargo Asset Management and the Fund disclaim any obligation to publicly update or revise any views expressed or forward-looking statements.
INVESTMENT PRODUCTS: NOT FDIC INSURED ■ NO BANK GUARANTEE ■ MAY LOSE VALUE
Wells Fargo High Yield Municipal Bond Fund | 1
Letter to shareholders (unaudited)
Dear Shareholder:
We are pleased to offer you this semi-annual report for the Wells Fargo High Yield Municipal Bond Fund for the six-month period that ended December 31, 2020. Despite a deeply challenging year, dominated by the spread of COVID-19 cases and a sharp drop in economic output throughout much of the world, global stocks performed extremely well, benefiting from ongoing central bank support and rising optimism over the development and distribution of effective COVID-19 vaccines. Bonds also had positive returns, led by global bonds and high-yield bonds.
For the six-month period, U.S. stocks, based on the S&P 500 Index,1 gained 22.16%. International stocks, as measured by the MSCI ACWI ex USA Index (Net),2 returned 24.33%, while the MSCI EM Index (Net),3 had even stronger performance, with a 31.14% gain. Among bond indexes, the Bloomberg Barclays U.S. Aggregate Bond Index,4 returned 1.29%, the Bloomberg Barclays Global Aggregate ex-USD Index (unhedged),5 gained 9.44%, and the Bloomberg Barclays Municipal Bond Index,6 returned 3.07% while the ICE BofA U.S. High Yield Index,7 gained a hefty 11.49%.
The stock market rally continued in July.
After a volatile first half of the year, an existing stock market rally continued in July with strong results for equities and fixed income. However, economic data and a resurgence of COVID-19 cases underscored the urgent need to regain control of the pandemic. Second-quarter gross domestic product (GDP) shrank from the previous quarter by 9.5% and 12.1% in the U.S. and the eurozone, respectively. In contrast, China’s second-quarter GDP grew 3.2% year over year. The U.S. economy added 1.8 million jobs in July, but a double-digit jobless rate persisted.
The stock market continued to rally in August despite concerns over rising numbers of U.S. and European COVID-19 cases as well as the expiration of the $600 weekly bonus unemployment benefit in July. Relatively strong second-quarter earnings boosted investor sentiment along with the U.S. Federal Reserve’s announcement of a monetary policy shift expected to support longer-term low interest rates. U.S. manufacturing and services activity indexes beat expectations, while the U.S. housing market maintained strength. In Europe, retail sales expanded and consumer confidence was steady. China’s economy continued to expand.
Andrew Owen
President
Wells Fargo Funds
“After a volatile first half of the year, an existing stock market rally continued in July with strong results for equities and fixed income.”
| 1 | The S&P 500 Index consists of 500 stocks chosen for market size, liquidity, and industry group representation. It is a market-value-weighted index with each stock's weight in the index proportionate to its market value. You cannot invest directly in an index. |
| 2 | The Morgan Stanley Capital International (MSCI) All Country World Index (ACWI) ex USA Index (Net) is a free-float-adjusted market-capitalization-weighted index that is designed to measure the equity market performance of developed and emerging markets, excluding the United States. Source: MSCI. MSCI makes no express or implied warranties or representations and shall have no liability whatsoever with respect to any MSCI data contained herein. The MSCI data may not be further redistributed or used as a basis for other indices or any securities or financial products. This report is not approved, reviewed, or produced by MSCI. You cannot invest directly in an index. |
| 3 | The MSCI Emerging Markets (EM) Index (Net) is a free-float-adjusted market-capitalization-weighted index that is designed to measure equity market performance of emerging markets. You cannot invest directly in an index. |
| 4 | The Bloomberg Barclays U.S. Aggregate Bond Index is a broad-based benchmark that measures the investment-grade, U.S. dollar-denominated, fixed-rate taxable bond market, including Treasuries, government-related and corporate securities, mortgage-backed securities (agency fixed-rate and hybrid adjustable-rate mortgage pass-throughs), asset-backed securities, and commercial mortgage-backed securities. You cannot invest directly in an index. |
| 5 | The Bloomberg Barclays Global Aggregate ex-USD Index (unhedged) is an unmanaged index that provides a broad-based measure of the global investment-grade fixed-income markets excluding the U.S. dollar-denominated debt market. You cannot invest directly in an index. |
| 6 | The Bloomberg Barclays Municipal Bond Index is an unmanaged index composed of long-term tax-exempt bonds with a minimum credit rating of Baa. You cannot invest directly in an index. |
| 7 | The ICE BofA U.S. High Yield Index is a market-capitalization-weighted index of domestic and Yankee high-yield bonds. The index tracks the performance of high-yield securities traded in the U.S. bond market. You cannot invest directly in an index. Copyright 2021. ICE Data Indices, LLC. All rights reserved. |
2 | Wells Fargo High Yield Municipal Bond Fund
Letter to shareholders (unaudited)
Stocks grew more volatile in September on mixed economic data. U.S. economic activity continued to grow. However, U.S. unemployment remained elevated at 7.9% in September. With U.S. Congress delaying further fiscal relief and uncertainties surrounding a possible vaccine, doubts crept back into the financial markets. In the U.K., a lack of progress in Brexit talks weighed on markets. China’s economy picked up steam, fueled by increased global demand.
In October, capital markets stepped back from their six-month rally. Market volatility rose in advance of the U.S. election and amid a global increase in COVID-19 infections. Europe introduced tighter restrictions affecting economic activity. U.S. markets looked favorably at the prospect of Democratic control of the federal purse strings, which could lead to additional fiscal stimulus and a boost to economic activity. Meanwhile, China reported 4.9% third-quarter GDP growth.
Global stocks rallied in November, propelled by optimism over three promising COVID-19 vaccines. Reversing recent trends, value stocks outperformed growth stocks and cyclical stocks outpaced technology stocks. However, U.S. unemployment remained elevated, with a net job loss of 10 million since February. The eurozone services Purchasing Managers’ Index, a monthly survey of purchasing managers, contracted sharply while the region’s manufacturing activity grew. The U.S. election results added to the upbeat mood as investors anticipated more consistent policies in the new administration.
Financial markets ended the year with strength on high expectations for a rapid rollout of the COVID-19 vaccines, the successful passage of a $900 billion stimulus package, and rising expectations of additional economic support from a Democratic-led Congress. U.S. economic data were mixed with still-elevated unemployment and weak retail sales but growth in manufacturing output. In contrast, China’s economic expansion continued in both manufacturing and nonmanufacturing. U.S. COVID-19 infection rates continued to rise even as new state and local lockdown measures were implemented.
Don’t let short-term uncertainty derail long-term investment goals.
Periods of investment uncertainty can present challenges, but experience has taught us that maintaining long-term investment goals can be an effective way to plan for the future. To help you create a sound strategy based on your personal goals and risk tolerance, Wells Fargo Funds offers more than 100 mutual funds spanning a wide range of asset classes and investment styles. Although diversification cannot guarantee an investment profit or prevent losses, we believe it can be an effective way to manage investment risk and potentially smooth out overall portfolio performance. We encourage investors to know their investments and to understand that appropriate levels of risk-taking may unlock opportunities.
Thank you for choosing to invest with Wells Fargo Funds. We appreciate your confidence in us and remain committed to helping you meet your financial needs.
Sincerely,
Andrew Owen
President
Wells Fargo Funds
“Global stocks rallied in November, propelled by optimism over three promising COVID-19 vaccines.”
For further information about your Fund, contact your investment professional, visit our website at wfam.com, or call us directly at 1-800-222-8222.
Wells Fargo High Yield Municipal Bond Fund | 3
Performance highlights (unaudited)
Investment objective
The Fund seeks high current income exempt from federal income tax, and capital appreciation.
Manager
Wells Fargo Funds Management, LLC
Subadviser
Wells Capital Management Incorporated
Portfolio managers
Dennis Derby
Terry J. Goode
Kerry Laurin*
Average annual total returns (%) as of December 31, 2020
| | | Including sales charge | | Excluding sales charge | | Expense ratios1 (%) |
| | Inception date | 1 year | 5 year | Since
Inception | | 1 year | 5 year | Since
Inception | | Gross | Net 2 |
| Class A (WHYMX) | 1-31-2013 | -2.63 | 3.57 | 4.49 | | 1.93 | 4.54 | 5.10 | | 1.11 | 0.80 |
| Class C (WHYCX) | 1-31-2013 | 0.26 | 3.77 | 4.33 | | 1.26 | 3.77 | 4.33 | | 1.86 | 1.55 |
| Class R6 (EKHRX)3 | 7-31-2018 | – | – | – | | 2.33 | 4.84 | 5.39 | | 0.73 | 0.50 |
| Administrator Class (WHYDX) | 1-31-2013 | – | – | – | | 2.13 | 4.66 | 5.22 | | 1.05 | 0.70 |
| Institutional Class (WHYIX) | 1-31-2013 | – | – | – | | 2.18 | 4.79 | 5.36 | | 0.78 | 0.55 |
| High Yield Municipal Bond Blended Index4 | – | – | – | – | | 5.12 | 5.52 | 4.56 * | | – | – |
| Bloomberg Barclays Municipal Bond Index5 | – | – | – | – | | 5.21 | 3.91 | 3.61 * | | – | – |
| Bloomberg Barclays High Yield Municipal Bond Index6 | – | – | – | – | | 4.89 | 6.56 | 5.15 * | | – | – |
* Based on the inception date of the oldest Fund class.
Figures quoted represent past performance, which is no guarantee of future results, and do not reflect taxes that a shareholder may pay on an investment in a fund. Investment return and principal value of an investment will fluctuate so that an investor’s shares, when redeemed, may be worth more or less than their original cost. Performance shown without sales charges would be lower if sales charges were reflected. Current performance may be lower or higher than the performance data quoted, which assumes the reinvestment of dividends and capital gains. Current month-end performance is available on the Fund’s website, wfam.com.
Index returns do not include transaction costs associated with buying and selling securities, any mutual fund fees or expenses, or any taxes. It is not possible to invest directly in an index.
For Class A shares, the maximum front-end sales charge is 4.50%. For Class C shares, the maximum contingent deferred sales charge is 1.00%. Performance including a contingent deferred sales charge assumes the sales charge for the corresponding time period. Class R6, Administrator Class, and Institutional Class shares are sold without a front-end sales charge or contingent deferred sales charge.
Bond values fluctuate in response to the financial condition of individual issuers, general market and economic conditions, and changes in interest rates. Changes in market conditions and government policies may lead to periods of heightened volatility in the bond market and reduced liquidity for certain bonds held by the Fund. In general, when interest rates rise, bond values fall and investors may lose principal value. Interest rate changes and their impact on the Fund and its share price can be sudden and unpredictable. High-yield securities have a greater risk of default and tend to be more volatile than higher-rated debt securities. The use of derivatives may reduce returns and/or increase volatility. Certain investment strategies tend to increase the total risk of an investment (relative to the broader market). The Fund is exposed to municipal securities risk. Consult the Fund’s prospectus for additional information on these and other risks. A portion of the Fund’s income may be subject to federal, state, and/or local income taxes or the Alternative Minimum Tax (AMT). Any capital gains distributions may be taxable.
Please see footnotes on page 5.
4 | Wells Fargo High Yield Municipal Bond Fund
Performance highlights (unaudited)
| Effective maturity distribution as of December 31, 20207 |
| Credit quality as of December 31, 20208 |
| * | Ms. Laurin became a portfolio manager of the Fund on September 1, 2020. |
| 1 | Reflects the expense ratios as stated in the most recent prospectuses. The expense ratios shown are subject to change and may differ from the annualized expense ratios shown in the financial highlights of this report. |
| 2 | The manager has contractually committed through October 31, 2021, to waive fees and/or reimburse expenses to the extent necessary to cap total annual fund operating expenses after fee waivers at 0.80% for Class A, 1.55% for Class C, 0.50% for Class R6, 0.70% for Administrator Class, and 0.55% for Institutional Class. Brokerage commissions, stamp duty fees, interest, taxes, acquired fund fees and expenses (if any), and extraordinary expenses are excluded from the expense caps. Prior to or after the commitment expiration date, the caps may be increased or the commitment to maintain the caps may be terminated only with the approval of the Board of Trustees. Without these caps, the Fund’s returns would have been lower. The expense ratio paid by an investor is the net expense ratio (the total annual fund operating expenses after fee waivers) as stated in the prospectuses. |
| 3 | Historical performance shown for the Class R6 shares prior to their inception reflects the performance of the Institutional Class shares, and includes the higher expenses applicable to the Institutional Class shares. If these expenses had not been included, returns for the Class R6 shares would be higher. |
| 4 | Source: Wells Fargo Funds Management LLC. The High Yield Municipal Bond Blended Index is weighted 60% in the Bloomberg Barclays High Yield Municipal Bond Index and 40% in the Bloomberg Barclays Municipal Bond Index. You cannot invest directly in an index. |
| 5 | The Bloomberg Barclays Municipal Bond Index is an unmanaged index composed of long-term tax-exempt bonds with a minimum credit rating of Baa. You cannot invest directly in an index. |
| 6 | The Bloomberg Barclays High YieldMunicipal Bond Index measures the non-investment-grade and nonrated U.S. dollar–denominated, fixed-rate, tax-exempt bondmarket within the 50 United States and four other qualifying regions (Washington, D.C.; Puerto Rico; Guam; and the Virgin Islands). The index allows state and local general obligation, revenue, insured, and prefunded bonds; however, historically the index has been composed of mostly revenue bonds. You cannot invest directly in an index. |
| 7 | Figures represent the percentage of the Fund's long-term investments. These amounts are subject to change and may have changed since the date specified. |
| 8 | The credit quality distribution of portfolio holdings reflected in the chart is based on ratings from Standard & Poor’s, Moody’s Investors Service, and/ or Fitch Ratings Ltd. Credit quality ratings apply to the underlying holdings of the Fund and not to the Fund itself. The percentages of the Fund’s portfolio with the ratings depicted in the chart are calculated based on the total market value of fixed income securities held by the Fund. If a security was rated by all three rating agencies, the middle rating was utilized. If rated by two of three rating agencies, the lower rating was utilized, and if rated by one of the rating agencies, that rating was utilized. Standard & Poor’s rates the creditworthiness of bonds, ranging from AAA (highest) to D (lowest). Ratings from A to CCC may be modified by the addition of a plus (+) or minus (-) sign to show relative standing within the rating categories. Standard & Poor’s rates the creditworthiness of short-term notes from SP-1 (highest) to SP-3 (lowest).Moody’s rates the creditworthiness of bonds, ranging from Aaa (highest) to C (lowest). Ratings Aa to B may be modified by the addition of a number 1 (highest) to 3 (lowest) to show relative standing within the ratings categories. Moody’s rates the creditworthiness of short-term U.S. tax-exempt municipal securities from MIG 1/VMIG 1 (highest) to SG (lowest). Fitch rates the creditworthiness of bonds, ranging from AAA (highest) to D (lowest). Credit quality distribution is subject to change and may have changed since the date specified. |
Wells Fargo High Yield Municipal Bond Fund | 5
Fund expenses (unaudited)
As a shareholder of the Fund, you incur two types of costs: (1) transaction costs, including sales charges (loads) on purchase payments and contingent deferred sales charges (if any) on redemptions and (2) ongoing costs, including management fees, distribution (12b-1) and/or shareholder servicing fees, and other Fund expenses. This example is intended to help you understand your ongoing costs (in dollars) of investing in the Fund and to compare these costs with the ongoing costs of investing in other mutual funds.
The example is based on an investment of $1,000 invested at the beginning of the six-month period and held for the entire period from July 1, 2020 to December 31, 2020.
Actual expenses
The “Actual” line of the table below provides information about actual account values and actual expenses. You may use the information in this line, together with the amount you invested, to estimate the expenses that you paid over the period. Simply divide your account value by $1,000 (for example, an $8,600 account value divided by $1,000 = 8.6), then multiply the result by the number in the “Actual” line under the heading entitled “Expenses paid during period” for your applicable class of shares to estimate the expenses you paid on your account during this period.
Hypothetical example for comparison purposes
The “Hypothetical” line of the table below provides information about hypothetical account values and hypothetical expenses based on the Fund’s actual expense ratio and an assumed rate of return of 5% per year before expenses, which is not the Fund’s actual return. The hypothetical account values and expenses may not be used to estimate the actual ending account balance or expenses you paid for the period. You may use this information to compare the ongoing costs of investing in the Fund and other funds. To do so, compare this 5% hypothetical example with the 5% hypothetical examples that appear in the shareholder reports of the other funds.
Please note that the expenses shown in the table are meant to highlight your ongoing costs only and do not reflect any transactional costs, such as sales charges (loads) and contingent deferred sales charges. Therefore, the “Hypothetical” line of the table is useful in comparing ongoing costs only and will not help you determine the relative total costs of owning different funds. In addition, if these transactional costs were included, your costs would have been higher.
| | Beginning
account value
7-1-2020 | Ending
account value
12-31-2020 | Expenses
paid during
the period1 | Annualized net
expense ratio |
| Class A | | | | |
| Actual | $1,000.00 | $1,061.14 | $4.16 | 0.80% |
| Hypothetical (5% return before expenses) | $1,000.00 | $1,021.17 | $4.08 | 0.80% |
| Class C | | | | |
| Actual | $1,000.00 | $1,058.10 | $8.04 | 1.55% |
| Hypothetical (5% return before expenses) | $1,000.00 | $1,017.39 | $7.88 | 1.55% |
| Class R6 | | | | |
| Actual | $1,000.00 | $1,063.70 | $2.60 | 0.50% |
| Hypothetical (5% return before expenses) | $1,000.00 | $1,022.68 | $2.55 | 0.50% |
| Administrator Class | | | | |
| Actual | $1,000.00 | $1,062.69 | $3.59 | 0.69% |
| Hypothetical (5% return before expenses) | $1,000.00 | $1,021.73 | $3.52 | 0.69% |
| Institutional Class | | | | |
| Actual | $1,000.00 | $1,062.45 | $2.86 | 0.55% |
| Hypothetical (5% return before expenses) | $1,000.00 | $1,022.43 | $2.80 | 0.55% |
1 Expenses paid is equal to the annualized net expense ratio of each class multiplied by the average account value over the period, multiplied by the number of days in the most recent fiscal half-year divided by the number of days in the fiscal year (to reflect the one-half-year period).
6 | Wells Fargo High Yield Municipal Bond Fund
Portfolio of investments—December 31, 2020 (unaudited)
| | | Interest
rate | Maturity
date | Principal | Value |
| Municipal obligations: 92.58% | | | | | |
| Alabama: 0.81% | | | | | |
| Water & sewer revenue: 0.81% | | | | | |
| Jefferson County AL Warrants CAB Senior Lien Series B (AGM Insured)¤ | | 0.00 | 10-1-2027 | $ 920,000 | 735,890 |
| Arizona: 5.13% | | | | | |
| Education revenue: 1.74% | | | | | |
| Florence AZ IDA Legacy Traditional School Project Queen Creek & Casa Grande Campuses | | 5.00 | 7-1-2023 | 160,000 | 166,571 |
| Phoenix AZ IDA Legacy Traditional Schools Project Series A 144A | | 6.50 | 7-1-2034 | 500,000 | 570,560 |
| Pima County AZ IDA Desert Heights Charter School Facility Refunding Bond | | 6.00 | 5-1-2024 | 325,000 | 343,957 |
| Pima County AZ IDA New Plan Learning Project Series A | | 8.13 | 7-1-2041 | 495,000 | 495,322 |
| | | | | | 1,576,410 |
| Health revenue: 2.78% | | | | | |
| Maricopa County AZ IDA Senior Living Facility Series 2016 144A | | 6.00 | 1-1-2048 | 1,000,000 | 1,020,110 |
| Tempe AZ IDA Mirabella at ASU Incorporated Project Series A 144A | | 6.13 | 10-1-2052 | 1,400,000 | 1,489,866 |
| | | | | | 2,509,976 |
| Housing revenue: 0.61% | | | | | |
| Glendale AZ IDA Senior Living Facilities Royal Oaks Inspirata Pointe | | 5.00 | 5-15-2056 | 500,000 | 552,190 |
| | | | | | 4,638,576 |
| California: 3.51% | | | | | |
| Airport revenue: 1.20% | | | | | |
| Los Angeles CA Department of Airports AMT Los Angeles International Airport Subordinate Bond Series F | | 4.00 | 5-15-2049 | 950,000 | 1,082,772 |
| Education revenue: 0.31% | | | | | |
| California Municipal Finance Authority Charter School Albert Einstein Academies Project Series A | | 7.13 | 8-1-2043 | 250,000 | 276,910 |
| Miscellaneous revenue: 1.14% | | | | | |
| Compton CA PFA Refunding Bond 144A | | 4.00 | 9-1-2027 | 1,000,000 | 1,034,000 |
| Tax revenue: 0.86% | | | | | |
| San Francisco City & County CA RDA CAB Mission Bay South Redevelopment Project Subordinate Bond Series D 144A¤ | | 0.00 | 8-1-2026 | 1,000,000 | 781,290 |
| | | | | | 3,174,972 |
| Colorado: 10.22% | | | | | |
| GO revenue: 8.49% | | | | | |
| Aurora CO Cornerstar Metropolitan District Refunding Bond Series A | | 5.25 | 12-1-2047 | 1,000,000 | 1,041,080 |
| Colorado Big Dry Creek Metropolitan District Improvement & Refunding Bonds Limited Tax Series A | | 5.75 | 12-1-2047 | 1,000,000 | 1,055,020 |
The accompanying notes are an integral part of these financial statements.
Wells Fargo High Yield Municipal Bond Fund | 7
Portfolio of investments—December 31, 2020 (unaudited)
| | | Interest
rate | Maturity
date | Principal | Value |
| GO revenue (continued) | | | | | |
| Colorado Cottonwood Highlands Metropolitan District #1 Limited Tax Series A | | 5.00% | 12-1-2049 | $ 900,000 | $ 942,300 |
| Colorado Whispering Pines Metropolitan District #1 Series A | | 5.00 | 12-1-2047 | 966,000 | 1,003,809 |
| Denver CO International Business Center Metropolitan District #1 Series B | | 6.00 | 12-1-2048 | 1,145,000 | 1,228,837 |
| Eaton CO Area Park & Recreation District | | 5.00 | 12-1-2023 | 810,000 | 882,122 |
| Eaton CO Area Park & Recreation District | | 5.50 | 12-1-2030 | 475,000 | 521,802 |
| Great Western CO Metropolitan District #5 Refunding Bond | | 4.75 | 12-1-2050 | 1,000,000 | 1,005,220 |
| | | | | | 7,680,190 |
| Tax revenue: 1.14% | | | | | |
| Pueblo CO Urban Renewal Authority Regional Tourism Act Project | | 5.00 | 6-1-2036 | 1,000,000 | 1,026,060 |
| Transportation revenue: 0.59% | | | | | |
| Colorado High Performance Transportation Enterprise U.S. 36 & I-25 Managed Lanes | | 5.75 | 1-1-2044 | 500,000 | 535,955 |
| | | | | | 9,242,205 |
| Connecticut: 0.70% | | | | | |
| GO revenue: 0.70% | | | | | |
| Hartford CT Series A | | 4.00 | 4-1-2032 | 325,000 | 343,701 |
| Hartford CT Series A | | 5.00 | 4-1-2024 | 105,000 | 115,475 |
| Hartford CT Series B | | 5.00 | 4-1-2033 | 50,000 | 54,176 |
| Hartford CT Unrefunded Bond Series A | | 5.00 | 4-1-2029 | 45,000 | 47,321 |
| Hartford CT Unrefunded Bond Series A | | 5.00 | 4-1-2030 | 70,000 | 73,528 |
| | | | | | 634,201 |
| Delaware: 1.24% | | | | | |
| Education revenue: 1.24% | | | | | |
| Delaware EDA Odyssey Charter School Incorporated Project Series A 144A | | 7.00 | 9-1-2045 | 1,000,000 | 1,123,100 |
| District of Columbia: 0.49% | | | | | |
| Tobacco revenue: 0.49% | | | | | |
| District of Columbia Tobacco Settlement Financing Corporation | | 6.75 | 5-15-2040 | 435,000 | 447,019 |
| Florida: 4.15% | | | | | |
| Education revenue: 3.97% | | | | | |
| Florida Capital Trust Agency Educational Facilities Pineapple Cove Classical Academy Incorporated Project Series A 144A | | 5.13 | 7-1-2039 | 2,000,000 | 2,215,980 |
| Florida Development Finance Corporation Educational Facilities Renaissance Charter School Project Series A | | 8.50 | 6-15-2044 | 250,000 | 281,548 |
| Miami-Dade County FL IDA Youth Co-Op Charter Schools Project Series A 144A | | 6.00 | 9-15-2045 | 1,000,000 | 1,089,230 |
| | | | | | 3,586,758 |
The accompanying notes are an integral part of these financial statements.
8 | Wells Fargo High Yield Municipal Bond Fund
Portfolio of investments—December 31, 2020 (unaudited)
| | | Interest
rate | Maturity
date | Principal | Value |
| Health revenue: 0.18% | | | | | |
| Holmes County FL Hospital Corporation Doctors Memorial Hospital Project | | 6.00% | 11-1-2038 | $ 250,000 | $ 162,500 |
| | | | | | 3,749,258 |
| Georgia: 1.90% | | | | | |
| Housing revenue: 0.97% | | | | | |
| Cobb County GA Development Authority Student Housing Kennesaw State University Foundation Project Refunding Bond Series C | | 5.00 | 7-15-2028 | 800,000 | 873,064 |
| Transportation revenue: 0.93% | | | | | |
| Georgia Road & Tollway Authority CCAB I-75 South Expressway Lanes Project Series B 144A¤ | | 0.00 | 6-1-2049 | 1,000,000 | 845,510 |
| | | | | | ���1,718,574 |
| Idaho: 0.29% | | | | | |
| Education revenue: 0.29% | | | | | |
| Idaho Housing & Finance Association Legacy Public Charter School Incorporated Project Series A | | 6.25 | 5-1-2043 | 250,000 | 260,535 |
| Illinois: 15.41% | | | | | |
| Education revenue: 1.60% | | | | | |
| Illinois Finance Authority Charter School Aid Intrinsic Schools Belmont School Project Series A 144A | | 5.25 | 12-1-2025 | 800,000 | 857,368 |
| Illinois Finance Authority Charter Schools Improvement & Refunding Bonds Series A | | 6.88 | 10-1-2031 | 575,000 | 592,802 |
| | | | | | 1,450,170 |
| GO revenue: 8.22% | | | | | |
| Chicago IL Board of Education CAB School Reform Series A (National Insured)¤ | | 0.00 | 12-1-2025 | 500,000 | 446,585 |
| Chicago IL Neighborhoods Alive 21 Program Series B | | 5.50 | 1-1-2032 | 700,000 | 775,103 |
| Chicago IL Series A | | 5.00 | 1-1-2033 | 310,000 | 315,450 |
| Chicago IL Series A | | 6.00 | 1-1-2038 | 1,500,000 | 1,754,850 |
| Cook County IL School District #144 Prairie Hills CAB Refunding Bond Series C (AGM Insured)¤ | | 0.00 | 12-1-2025 | 730,000 | 688,178 |
| Illinois | | 5.00 | 3-1-2033 | 1,000,000 | 1,027,460 |
| Lake County IL Community Unit School District #187 North Chicago CAB Series A (AGM Insured)¤ | | 0.00 | 1-1-2023 | 590,000 | 574,566 |
| Will County IL Community High School CAB Refunding Bond Series B (BAM Insured)¤ | | 0.00 | 1-1-2033 | 1,000,000 | 763,460 |
| Will County IL Community High School Refunding Bond Tennessee Consolidated Retirement System Series A (BAM Insured) | | 3.25 | 1-1-2030 | 450,000 | 460,089 |
| Will County IL Lincoln-Way Community High School District #210 CAB Refunding Bond Series B (BAM Insured)¤ | | 0.00 | 1-1-2027 | 685,000 | 626,378 |
| | | | | | 7,432,119 |
The accompanying notes are an integral part of these financial statements.
Wells Fargo High Yield Municipal Bond Fund | 9
Portfolio of investments—December 31, 2020 (unaudited)
| | | Interest
rate | Maturity
date | Principal | Value |
| Miscellaneous revenue: 2.89% | | | | | |
| Chicago IL Certificate of Participation River Point Plaza Redevelopment Project Series A 144A | | 4.84% | 4-15-2028 | $1,825,000 | $ 1,891,083 |
| Illinois Finance Authority Educational Facility Senior Rogers Park Montessori School | | 6.00 | 2-1-2034 | 680,000 | 723,989 |
| | | | | | 2,615,072 |
| Tax revenue: 2.70% | | | | | |
| Hillside IL Tax Increment Refunding Bond | | 5.00 | 1-1-2030 | 1,345,000 | 1,407,973 |
| Illinois Sports Facilities Authority State Tax Supported CAB (Ambac Insured)¤ | | 0.00 | 6-15-2025 | 1,140,000 | 1,031,267 |
| | | | | | 2,439,240 |
| | | | | | 13,936,601 |
| Kansas: 3.23% | | | | | |
| Health revenue: 1.14% | | | | | |
| Kansas State Development Finance Authority Revenue Bond Series A | | 5.25 | 11-15-2033 | 1,000,000 | 1,032,210 |
| Tax revenue: 2.09% | | | | | |
| Wyandotte County & Kansas City KS Special Obligation Improvement & Refunding Bonds Plaza Redevelopment Project | | 4.00 | 12-1-2028 | 605,000 | 603,360 |
| Wyandotte County & Kansas City KS Special Obligation Vacation Village Project Area 4 Major Multi-Sport Athletic Complex Project CAB Series 2015 144A¤ | | 0.00 | 9-1-2034 | 2,895,000 | 1,282,224 |
| | | | | | 1,885,584 |
| | | | | | 2,917,794 |
| Kentucky: 1.12% | | | | | |
| Health revenue: 1.12% | | | | | |
| Kentucky EDFA Rosedale Green Project Refunding Bond | | 5.50 | 11-15-2035 | 1,000,000 | 1,016,100 |
| Maryland: 1.82% | | | | | |
| Education revenue: 1.25% | | | | | |
| Prince George's County MD Chesapeake Lighthouse Charter School Project Series 2016-A 144A | | 6.90 | 8-1-2041 | 1,000,000 | 1,127,840 |
| Miscellaneous revenue: 0.57% | | | | | |
| Maryland Economic Development Corporation Special Obligation Covington Project | | 4.00 | 9-1-2050 | 500,000 | 514,115 |
| | | | | | 1,641,955 |
| Michigan: 5.07% | | | | | |
| Education revenue: 0.50% | | | | | |
| Michigan Finance Authority Limited Obligation Refunding Bond Public School Academy Bradford | | 4.80 | 9-1-2040 | 150,000 | 154,790 |
| Michigan Public Educational Facilities Authority Limited Obligation Crescent Academy Project | | 7.00 | 10-1-2036 | 292,500 | 292,904 |
| | | | | | 447,694 |
The accompanying notes are an integral part of these financial statements.
10 | Wells Fargo High Yield Municipal Bond Fund
Portfolio of investments—December 31, 2020 (unaudited)
| | | Interest
rate | Maturity
date | Principal | Value |
| Miscellaneous revenue: 2.66% | | | | | |
| Charyl Stockwell Academy Michigan Public School Refunding Bond | | 4.88% | 10-1-2023 | $ 205,000 | $ 210,080 |
| Michigan Finance Authority Local Government Loan Program City of Detroit Financial Recovery Refunding Bond Series F | | 4.50 | 10-1-2029 | 1,000,000 | 1,054,890 |
| Michigan Municipal Bond Authority Local Government Loan Program Series C (Ambac Insured) | | 4.75 | 5-1-2027 | 950,000 | 950,570 |
| Michigan Public Educational Facilities Authority Chandler Park Academy Project | | 6.35 | 11-1-2028 | 190,000 | 190,429 |
| | | | | | 2,405,969 |
| Tax revenue: 1.91% | | | | | |
| Detroit MI Downtown Development Authority CAB ¤ | | 0.00 | 7-1-2021 | 170,000 | 166,739 |
| Detroit MI Downtown Development Authority CAB ¤ | | 0.00 | 7-1-2024 | 20,000 | 17,101 |
| Detroit MI Downtown Development Authority CAB ¤ | | 0.00 | 7-1-2025 | 580,000 | 470,206 |
| Michigan Finance Authority Local Government Loan Program Public Lighting Authority Refunding Bonds Series B | | 5.00 | 7-1-2044 | 1,000,000 | 1,076,810 |
| | | | | | 1,730,856 |
| | | | | | 4,584,519 |
| Minnesota: 1.79% | | | | | |
| Education revenue: 0.36% | | | | | |
| Deephaven MN Charter School Eagle Ridge Academy Project Series 2015-A | | 4.40 | 7-1-2025 | 105,000 | 110,853 |
| Deephaven MN Charter School Eagle Ridge Academy Project Series 2015-A | | 5.00 | 7-1-2030 | 195,000 | 216,454 |
| | | | | | 327,307 |
| Health revenue: 0.57% | | | | | |
| Shakopee MN Senior Housing Revenue Benedictine Living Community LLC Project 144A | | 5.85 | 11-1-2058 | 500,000 | 516,495 |
| Housing revenue: 0.86% | | | | | |
| Minneapolis MN Student Housing Riverton Community Housing Project Refunding Bond | | 4.70 | 8-1-2026 | 335,000 | 351,713 |
| Minneapolis MN Student Housing Riverton Community Housing Project Refunding Bond | | 4.80 | 8-1-2027 | 400,000 | 419,776 |
| | | | | | 771,489 |
| | | | | | 1,615,291 |
| Mississippi: 1.73% | | | | | |
| Resource recovery revenue: 1.73% | | | | | |
| Mississippi Business Finance Corporation AMT Waste Pro USA Incorporated Project 144A | | 5.00 | 2-1-2036 | 1,500,000 | 1,566,675 |
| Missouri: 1.26% | | | | | |
| Tax revenue: 1.26% | | | | | |
| Blue Springs MO Special Obligation Tax Improvement & Refunding Bonds Adams Farm Project Series A | | 4.00 | 6-1-2026 | 335,000 | 337,087 |
| Richmond Heights MO Francis Place Redevelopment Project | | 5.63 | 11-1-2025 | 800,000 | 799,960 |
| | | | | | 1,137,047 |
The accompanying notes are an integral part of these financial statements.
Wells Fargo High Yield Municipal Bond Fund | 11
Portfolio of investments—December 31, 2020 (unaudited)
| | | Interest
rate | Maturity
date | Principal | Value |
| New Jersey: 3.65% | | | | | |
| GO revenue: 1.25% | | | | | |
| Newark NJ Qualified General Improvement Series A | | 5.00% | 7-15-2027 | $1,000,000 | $ 1,134,840 |
| Industrial development revenue: 0.29% | | | | | |
| New Jersey EDA Continental Airlines Incorporated Project | | 5.25 | 9-15-2029 | 250,000 | 264,538 |
| Transportation revenue: 2.11% | | | | | |
| New Jersey TTFA CAB Series A ¤ | | 0.00 | 12-15-2031 | 1,000,000 | 769,670 |
| New Jersey TTFA Series C | | 5.25 | 6-15-2032 | 1,000,000 | 1,135,970 |
| | | | | | 1,905,640 |
| | | | | | 3,305,018 |
| New York: 5.02% | | | | | |
| Education revenue: 1.82% | | | | | |
| Dutchess County NY Local Development Corporation Bard College Project 144A | | 5.00 | 7-1-2051 | 500,000 | 546,590 |
| Hempstead Town NY Local Development Corporation The Academy Charter School Project Series A | | 5.73 | 2-1-2050 | 1,000,000 | 1,101,710 |
| | | | | | 1,648,300 |
| Tax revenue: 1.38% | | | | | |
| New York Dormitory Authority Series A Group 4 | | 5.00 | 3-15-2045 | 1,000,000 | 1,247,330 |
| Transportation revenue: 1.82% | | | | | |
| New York Metropolitan Transportation Authority Climate Bond Certified | | 4.00 | 11-15-2052 | 1,500,000 | 1,645,995 |
| | | | | | 4,541,625 |
| Ohio: 2.52% | | | | | |
| Resource recovery revenue: 1.17% | | | | | |
| Southern Ohio Port Authority Exempt Facility Revenue PureCycle Project 144A | | 7.00 | 12-1-2042 | 1,000,000 | 1,056,960 |
| Tobacco revenue: 1.35% | | | | | |
| Buckeye OH Tobacco Settlement Financing Authority CAB ¤ | | 0.00 | 6-1-2057 | 8,000,000 | 1,217,920 |
| | | | | | 2,274,880 |
| Oregon: 0.65% | | | | | |
| Health revenue: 0.65% | | | | | |
| Polk County OR Hospital Facility Authority Revenue Bond Dallas Retirement Village Project Series 2015-A | | 5.00 | 7-1-2025 | 550,000 | 586,823 |
| Pennsylvania: 3.13% | | | | | |
| Education revenue: 0.84% | | | | | |
| Allegheny County PA IDA Propel Charter School Sunrise Project | | 5.25 | 7-15-2023 | 75,000 | 78,526 |
| Philadelphia PA IDA Independence Charter School Project | | 5.00 | 6-15-2039 | 250,000 | 268,160 |
| Philadelphia PA IDA Tacony Academy Charter School Project | | 6.88 | 6-15-2033 | 375,000 | 415,830 |
| | | | | | 762,516 |
The accompanying notes are an integral part of these financial statements.
12 | Wells Fargo High Yield Municipal Bond Fund
Portfolio of investments—December 31, 2020 (unaudited)
| | | Interest
rate | Maturity
date | Principal | Value |
| Health revenue: 1.10% | | | | | |
| Quakertown PA General Authority Health LifeQuest Obligated Group Refunding Bond Series C | | 5.30% | 7-1-2042 | $1,000,000 | $ 988,620 |
| Miscellaneous revenue: 1.19% | | | | | |
| Chester County PA IDA Woodlands at Graystone Project Series 2018 144A | | 5.13 | 3-1-2048 | 1,049,000 | 1,077,680 |
| | | | | | 2,828,816 |
| Puerto Rico: 1.23% | | | | | |
| Tax revenue: 1.23% | | | | | |
| Puerto Rico Financing Corporation Sales Tax Revenue Restructured Series A1 | | 5.00 | 7-1-2058 | 1,000,000 | 1,114,400 |
| South Carolina: 3.40% | | | | | |
| Education revenue: 1.28% | | | | | |
| South Carolina Jobs EDA Refunding Bond Columbia College Project | | 5.75 | 10-1-2045 | 500,000 | 507,395 |
| South Carolina Jobs EDA York Preparatory Academy Project Series A | | 5.75 | 11-1-2023 | 100,000 | 104,242 |
| South Carolina Jobs EDA York Preparatory Academy Project Series A | | 7.25 | 11-1-2045 | 500,000 | 551,810 |
| | | | | | 1,163,447 |
| Health revenue: 1.18% | | | | | |
| South Carolina Jobs EDA Residential Facilities Revenue Episcopal Home Still Hopes Refunding Bond Series A | | 5.00 | 4-1-2048 | 1,000,000 | 1,067,830 |
| Resource recovery revenue: 0.94% | | | | | |
| South Carolina Jobs EDA | | 8.00 | 12-6-2029 | 100,000 | 99,300 |
| South Carolina Jobs EDA Solid Waste Disposal AMT RePower South Berkeley LLC Project Green Bond 144A | | 6.25 | 2-1-2045 | 1,000,000 | 748,420 |
| | | | | | 847,720 |
| | | | | | 3,078,997 |
| Tennessee: 1.23% | | | | | |
| Tax revenue: 1.23% | | | | | |
| Bristol TN Industrial Development Board Sales Tax CAB Series B 144A¤ | | 0.00 | 12-1-2031 | 1,000,000 | 575,910 |
| Nashville TN Metropolitan Development & Housing Agency Tax Increment Fifth & Broadway Development Project 144A | | 5.13 | 6-1-2036 | 500,000 | 539,105 |
| | | | | | 1,115,015 |
| Texas: 3.89% | | | | | |
| Education revenue: 1.57% | | | | | |
| Arlington TX Higher Education Finance Corporation Universal Academy Series A | | 7.00 | 3-1-2034 | 320,000 | 350,557 |
| Pottsboro TX Higher Education Finance Corporation Imagine International Academy of North Texas Series A | | 3.88 | 8-15-2026 | 1,005,000 | 1,072,023 |
| | | | | | 1,422,580 |
The accompanying notes are an integral part of these financial statements.
Wells Fargo High Yield Municipal Bond Fund | 13
Portfolio of investments—December 31, 2020 (unaudited)
| | | Interest
rate | Maturity
date | Principal | Value |
| GO revenue: 1.24% | | | | | |
| Port Isabel TX 144A | | 5.10% | 2-15-2049 | $ 995,000 | $ 1,117,087 |
| Miscellaneous revenue: 0.56% | | | | | |
| Lewisville TX Combination Contract Castle Hills Public Improvement Bonds District #6 144A | | 5.50 | 9-1-2039 | 500,000 | 503,590 |
| Transportation revenue: 0.25% | | | | | |
| Texas Private Activity Bond Surface Transportation Corporation Project NTE Mobility Partners Segments LLC | | 7.00 | 12-31-2038 | 200,000 | 229,998 |
| Utilities revenue: 0.27% | | | | | |
| Texas Gas Supply SA Energy Acquisition Public Facilities Corporation | | 5.50 | 8-1-2027 | 190,000 | 241,838 |
| | | | | | 3,515,093 |
| Virginia: 1.32% | | | | | |
| Health revenue: 1.32% | | | | | |
| Roanoke VA EDA Residential Care Richfield Living | | 5.13 | 9-1-2055 | 1,210,000 | 1,189,684 |
| West Virginia: 1.77% | | | | | |
| Tax revenue: 1.77% | | | | | |
| Monongalia County WV Commission Improvement & Refunding Bonds University Town Center Series A 144A | | 5.75 | 6-1-2043 | 1,500,000 | 1,599,837 |
| Wisconsin: 4.90% | | | | | |
| Education revenue: 3.21% | | | | | |
| Wisconsin PFA Charter School Voyager Funding Incorporated Project Series A | | 4.13 | 10-1-2024 | 130,000 | 136,315 |
| Wisconsin PFA Coral Academy Science Las Vegas Series A | | 5.00 | 7-1-2024 | 305,000 | 325,960 |
| Wisconsin PFA Research Triangle High School Project Series 2015-A 144A | | 5.63 | 7-1-2045 | 1,000,000 | 1,072,960 |
| Wisconsin PFA Wilson Preparatory Academy Series A 144A | | 5.00 | 6-15-2039 | 1,285,000 | 1,367,972 |
| | | | | | 2,903,207 |
| Health revenue: 1.69% | | | | | |
| Wisconsin HEFA Wisconsin Illinois Senior Housing Incorporated Series 2018-A | | 5.25 | 8-1-2048 | 1,500,000 | 1,529,025 |
| | | | | | 4,432,232 |
| Total Municipal obligations (Cost $78,433,081) | | | | | 83,722,732 |
| | | Yield | | Shares | |
| Short-term investments: 5.27% | | | | | |
| Investment companies: 5.27% | | | | | |
| Wells Fargo Municipal Cash Management Money Market Fund Institutional Class ♠∞ | | 0.01% | | 4,762,788 | 4,764,217 |
| Total Short-term investments (Cost $4,764,201) | | | | | 4,764,217 |
| Total investments in securities (Cost $83,197,282) | 97.85% | | | | 88,486,949 |
| Other assets and liabilities, net | 2.15 | | | | 1,947,479 |
| Total net assets | 100.00% | | | | $ 90,434,428 |
The accompanying notes are an integral part of these financial statements.
14 | Wells Fargo High Yield Municipal Bond Fund
Portfolio of investments—December 31, 2020 (unaudited)
| ¤ | The security is issued in zero coupon form with no periodic interest payments. |
| 144A | The security may be resold in transactions exempt from registration, normally to qualified institutional buyers, pursuant to Rule 144A under the Securities Act of 1933. |
| ♠ | The issuer of the security is an affiliated person of the Fund as defined in the Investment Company Act of 1940. |
| ∞ | The rate represents the 7-day annualized yield at period end. |
| Abbreviations: |
| AGM | Assured Guaranty Municipal |
| Ambac | Ambac Financial Group Incorporated |
| AMT | Alternative minimum tax |
| BAM | Build America Mutual Assurance Company |
| CAB | Capital appreciation bond |
| CCAB | Convertible capital appreciation bond |
| EDA | Economic Development Authority |
| EDFA | Economic Development Finance Authority |
| GO | General obligation |
| HEFA | Health & Educational Facilities Authority |
| IDA | Industrial Development Authority |
| National | National Public Finance Guarantee Corporation |
| PFA | Public Finance Authority |
| RDA | Redevelopment Authority |
| TTFA | Transportation Trust Fund Authority |
Investments in affiliates
An affiliated investment is an investment in which the Fund owns at least 5% of the outstanding voting shares of the issuer or as a result of other relationships, such as the Fund and the issuer having the same investment manager. Transactions with issuers that were either affiliated persons of the Fund at the beginning of the period or the end of the period were as follows:
| | Value,
beginning of
period | Purchases | Sales
proceeds | Net
realized
gains
(losses) | Net
change in
unrealized
gains
(losses) | Value,
end of
period | % of
net
assets | Shares,
end
of period | Income
from
affiliated
securities |
| Short-term investments | | | | | | | | | |
| Investment companies | | | | | | | | | |
| Wells Fargo Municipal Cash Management Money Market Fund Institutional Class | $699,474 | $17,150,183 | $(13,085,646) | $228 | $(22) | $4,764,217 | 5.27% | 4,762,788 | $109 |
The accompanying notes are an integral part of these financial statements.
Wells Fargo High Yield Municipal Bond Fund | 15
Statement of assets and liabilities—December 31, 2020 (unaudited)
| | |
| Assets | |
Investments in unaffiliated securities, at value (cost $78,433,081)
| $ 83,722,732 |
Investments in affiliated securites, at value (cost $4,764,201)
| 4,764,217 |
Receivable for interest
| 1,108,870 |
Receivable for Fund shares sold
| 1,103,763 |
Prepaid expenses and other assets
| 25,346 |
Total assets
| 90,724,928 |
| Liabilities | |
Payable for Fund shares redeemed
| 157,897 |
Dividends payable
| 46,962 |
Professional fees payable
| 27,120 |
Management fee payable
| 13,301 |
Administration fees payable
| 9,412 |
Distribution fee payable
| 6,567 |
Trustees’ fees and expenses payable
| 2,957 |
Accrued expenses and other liabilities
| 26,284 |
Total liabilities
| 290,500 |
Total net assets
| $90,434,428 |
| Net assets consist of | |
Paid-in capital
| $ 85,543,979 |
Total distributable earnings
| 4,890,449 |
Total net assets
| $90,434,428 |
| Computation of net asset value and offering price per share | |
Net assets – Class A
| $ 30,552,806 |
Shares outstanding – Class A1
| 2,812,326 |
Net asset value per share – Class A
| $10.86 |
Maximum offering price per share – Class A2
| $11.37 |
Net assets – Class C
| $ 9,232,740 |
Shares outstanding – Class C1
| 849,742 |
Net asset value per share – Class C
| $10.87 |
Net assets – Class R6
| $ 25,611 |
Shares outstanding – Class R61
| 2,356 |
Net asset value per share – Class R6
| $10.87 |
Net assets – Administrator Class
| $ 12,049,479 |
Shares outstanding – Administrator Class1
| 1,108,775 |
Net asset value per share – Administrator Class
| $10.87 |
Net assets – Institutional Class
| $ 38,573,792 |
Shares outstanding – Institutional Class1
| 3,551,012 |
Net asset value per share – Institutional Class
| $10.86 |
| 1 | The Fund has an unlimited number of authorized shares |
| 2 | Maximum offering price is computed as 100/95.50 of net asset value. On investments of $50,000 or more, the offering price is reduced. |
The accompanying notes are an integral part of these financial statements.
16 | Wells Fargo High Yield Municipal Bond Fund
Statement of operations—six months ended December 31, 2020 (unaudited)
| | |
| Investment income | |
Interest
| $ 2,049,084 |
Income from affiliated securities
| 109 |
Total investment income
| 2,049,193 |
| Expenses | |
Management fee
| 214,008 |
| Administration fees | |
Class A
| 22,074 |
Class C
| 7,595 |
Class R6
| 4 |
Administrator Class
| 5,650 |
Institutional Class
| 14,877 |
| Shareholder servicing fees | |
Class A
| 34,464 |
Class C
| 11,851 |
Administrator Class
| 14,078 |
| Distribution fee | |
Class C
| 35,550 |
Custody and accounting fees
| 5,543 |
Professional fees
| 27,113 |
Registration fees
| 41,296 |
Shareholder report expenses
| 19,904 |
Trustees’ fees and expenses
| 9,873 |
Other fees and expenses
| 6,746 |
Total expenses
| 470,626 |
| Less: Fee waivers and/or expense reimbursements | |
Fund-level
| (121,706) |
Class A
| (12,603) |
Class C
| (4,029) |
Administrator Class
| (7,774) |
Net expenses
| 324,514 |
Net investment income
| 1,724,679 |
| Realized and unrealized gains (losses) on investments | |
| Net realized gains on | |
Unaffiliated securities
| 154,000 |
Affiliated securities
| 228 |
Net realized gains on investments
| 154,228 |
| Net change in unrealized gains (losses) on | |
Unaffiliated securities
| 3,191,734 |
Affiliated securities
| (22) |
Net change in unrealized gains (losses) on investments
| 3,191,712 |
Net realized and unrealized gains (losses) on investments
| 3,345,940 |
Net increase in net assets resulting from operations
| $5,070,619 |
The accompanying notes are an integral part of these financial statements.
Wells Fargo High Yield Municipal Bond Fund | 17
Statement of changes in net assets
| | |
| | Six months ended
December 31, 2020
(unaudited) | Year ended
June 30, 2020 |
| Operations | | | | |
Net investment income
| | $ 1,724,679 | | $ 4,723,433 |
Net realized gains (losses) on investments
| | 154,228 | | (115,607) |
Net change in unrealized gains (losses) on investments
| | 3,191,712 | | (5,492,789) |
Net increase (decrease) in net assets resulting from operations
| | 5,070,619 | | (884,963) |
| Distributions to shareholders from | | | | |
| Net investment income and net realized gains | | | | |
Class A
| | (547,124) | | (1,016,115) |
Class C
| | (152,132) | | (324,379) |
Class R6
| | (547) | | (1,113) |
Administrator Class
| | (229,429) | | (557,564) |
Institutional Class
| | (782,742) | | (2,837,133) |
Total distributions to shareholders
| | (1,711,974) | | (4,736,304) |
| Capital share transactions | Shares | | Shares | |
| Proceeds from shares sold | | | | |
Class A
| 576,426 | 6,177,035 | 1,136,030 | 12,292,528 |
Class C
| 56,264 | 595,670 | 151,588 | 1,643,335 |
Administrator Class
| 210,001 | 2,224,414 | 339,763 | 3,572,890 |
Institutional Class
| 688,564 | 7,384,478 | 2,083,511 | 22,719,379 |
| | | 16,381,597 | | 40,228,132 |
| Reinvestment of distributions | | | | |
Class A
| 47,993 | 511,837 | 89,770 | 969,449 |
Class C
| 13,959 | 148,898 | 29,127 | 314,674 |
Administrator Class
| 13,450 | 143,594 | 35,739 | 388,413 |
Institutional Class
| 71,650 | 763,822 | 255,191 | 2,782,732 |
| | | 1,568,151 | | 4,455,268 |
| Payment for shares redeemed | | | | |
Class A
| (188,039) | (2,001,074) | (1,007,385) | (10,751,077) |
Class C
| (106,863) | (1,138,868) | (201,418) | (2,168,643) |
Administrator Class
| (179,592) | (1,892,467) | (741,308) | (8,002,341) |
Institutional Class
| (760,272) | (8,070,725) | (6,551,028) | (70,457,229) |
| | | (13,103,134) | | (91,379,290) |
Net increase (decrease) in net assets resulting from capital share transactions
| | 4,846,614 | | (46,695,890) |
Total increase (decrease) in net assets
| | 8,205,259 | | (52,317,157) |
| Net assets | | | | |
Beginning of period
| | 82,229,169 | | 134,546,326 |
End of period
| | $ 90,434,428 | | $ 82,229,169 |
The accompanying notes are an integral part of these financial statements.
18 | Wells Fargo High Yield Municipal Bond Fund
Financial highlights
(For a share outstanding throughout each period)
| | | Year ended June 30 |
| Class A | Six months ended
December 31, 2020
(unaudited) | 2020 | 2019 | 2018 | 2017 | 2016 |
Net asset value, beginning of period
| $10.43 | $10.97 | $10.59 | $10.37 | $10.91 | $10.34 |
Net investment income
| 0.22 | 0.44 | 0.39 | 0.40 | 0.37 | 0.35 |
Net realized and unrealized gains (losses) on investments
| 0.43 | (0.54) | 0.38 | 0.22 | (0.46) | 0.60 |
Total from investment operations
| 0.65 | (0.10) | 0.77 | 0.62 | (0.09) | 0.95 |
| Distributions to shareholders from | | | | | | |
Net investment income
| (0.22) | (0.44) | (0.39) | (0.40) | (0.37) | (0.35) |
Net realized gains
| 0.00 | 0.00 | 0.00 | 0.00 | (0.08) | (0.03) |
Total distributions to shareholders
| (0.22) | (0.44) | (0.39) | (0.40) | (0.45) | (0.38) |
Net asset value, end of period
| $10.86 | $10.43 | $10.97 | $10.59 | $10.37 | $10.91 |
Total return1
| 6.22% | (0.98)% | 7.43% | 6.11% | (0.76)% | 9.44% |
| Ratios to average net assets (annualized) | | | | | | |
Gross expenses
| 1.17% | 1.12% | 1.09% | 1.07% | 1.06% | 1.07% |
Net expenses
| 0.80% | 0.80% | 0.80% | 0.85% | 0.85% | 0.85% |
Net investment income
| 3.99% | 4.05% | 3.68% | 3.82% | 3.51% | 3.28% |
| Supplemental data | | | | | | |
Portfolio turnover rate
| 16% | 14% | 20% | 50% | 82% | 61% |
Net assets, end of period (000s omitted)
| $30,553 | $24,791 | $23,674 | $17,086 | $20,305 | $38,018 |
| 1 | Total return calculations do not include any sales charges. Returns for periods of less than one year are not annualized. |
The accompanying notes are an integral part of these financial statements.
Wells Fargo High Yield Municipal Bond Fund | 19
Financial highlights
(For a share outstanding throughout each period)
| | | Year ended June 30 |
| Class C | Six months ended
December 31, 2020
(unaudited) | 2020 | 2019 | 2018 | 2017 | 2016 |
Net asset value, beginning of period
| $10.44 | $10.97 | $10.59 | $10.37 | $10.91 | $10.34 |
Net investment income
| 0.18 | 0.36 | 0.31 | 0.32 | 0.29 | 0.27 |
Net realized and unrealized gains (losses) on investments
| 0.43 | (0.53) | 0.38 | 0.22 | (0.46) | 0.60 |
Total from investment operations
| 0.61 | (0.17) | 0.69 | 0.54 | (0.17) | 0.87 |
| Distributions to shareholders from | | | | | | |
Net investment income
| (0.18) | (0.36) | (0.31) | (0.32) | (0.29) | (0.27) |
Net realized gains
| 0.00 | 0.00 | 0.00 | 0.00 | (0.08) | (0.03) |
Total distributions to shareholders
| (0.18) | (0.36) | (0.31) | (0.32) | (0.37) | (0.30) |
Net asset value, end of period
| $10.87 | $10.44 | $10.97 | $10.59 | $10.37 | $10.91 |
Total return1
| 5.81% | (1.63)% | 6.63% | 5.32% | (1.50)% | 8.62% |
| Ratios to average net assets (annualized) | | | | | | |
Gross expenses
| 1.92% | 1.87% | 1.84% | 1.82% | 1.81% | 1.82% |
Net expenses
| 1.55% | 1.55% | 1.55% | 1.60% | 1.60% | 1.60% |
Net investment income
| 3.24% | 3.29% | 2.91% | 3.09% | 2.79% | 2.49% |
| Supplemental data | | | | | | |
Portfolio turnover rate
| 16% | 14% | 20% | 50% | 82% | 61% |
Net assets, end of period (000s omitted)
| $9,233 | $9,250 | $9,955 | $8,896 | $8,709 | $10,573 |
| 1 | Total return calculations do not include any sales charges. Returns for periods of less than one year are not annualized. |
The accompanying notes are an integral part of these financial statements.
20 | Wells Fargo High Yield Municipal Bond Fund
Financial highlights
(For a share outstanding throughout each period)
| | | Year ended June 30 |
| Class R6 | Six months ended
December 31, 2020
(unaudited) | 2020 | 2019 1 |
Net asset value, beginning of period
| $10.44 | $10.98 | $10.61 |
Net investment income
| 0.23 | 0.47 | 0.39 |
Net realized and unrealized gains (losses) on investments
| 0.43 | (0.54) | 0.37 |
Total from investment operations
| 0.66 | (0.07) | 0.76 |
| Distributions to shareholders from | | | |
Net investment income
| (0.23) | (0.47) | (0.39) |
Net asset value, end of period
| $10.87 | $10.44 | $10.98 |
Total return2
| 6.37% | (0.68)% | 7.29% |
| Ratios to average net assets (annualized) | | | |
Gross expenses
| 0.79% | 0.73% | 0.71% |
Net expenses
| 0.50% | 0.50% | 0.50% |
Net investment income
| 4.30% | 4.34% | 3.96% |
| Supplemental data | | | |
Portfolio turnover rate
| 16% | 14% | 20% |
Net assets, end of period (000s omitted)
| $26 | $25 | $26 |
| 1 | For the period from July 31, 2018 (commencement of class operations) to June 30, 2019 |
| 2 | Returns for periods of less than one year are not annualized. |
The accompanying notes are an integral part of these financial statements.
Wells Fargo High Yield Municipal Bond Fund | 21
Financial highlights
(For a share outstanding throughout each period)
| | | Year ended June 30 |
| Administrator Class | Six months ended
December 31, 2020
(unaudited) | 2020 | 2019 | 2018 | 2017 | 2016 |
Net asset value, beginning of period
| $10.44 | $10.98 | $10.59 | $10.37 | $10.92 | $10.34 |
Net investment income
| 0.22 | 0.45 | 0.40 | 0.41 | 0.38 | 0.36 |
Net realized and unrealized gains (losses) on investments
| 0.43 | (0.54) | 0.39 | 0.22 | (0.47) | 0.61 |
Total from investment operations
| 0.65 | (0.09) | 0.79 | 0.63 | (0.09) | 0.97 |
| Distributions to shareholders from | | | | | | |
Net investment income
| (0.22) | (0.45) | (0.40) | (0.41) | (0.38) | (0.36) |
Net realized gains
| 0.00 | 0.00 | 0.00 | 0.00 | (0.08) | (0.03) |
Total distributions to shareholders
| (0.22) | (0.45) | (0.40) | (0.41) | (0.46) | (0.39) |
Net asset value, end of period
| $10.87 | $10.44 | $10.98 | $10.59 | $10.37 | $10.92 |
Total return1
| 6.27% | (0.87)% | 7.64% | 6.21% | (0.75)% | 9.65% |
| Ratios to average net assets (annualized) | | | | | | |
Gross expenses
| 1.11% | 1.05% | 1.03% | 1.01% | 1.00% | 1.00% |
Net expenses
| 0.69% | 0.70% | 0.71% | 0.75% | 0.75% | 0.75% |
Net investment income
| 4.09% | 4.12% | 3.69% | 3.93% | 3.60% | 3.39% |
| Supplemental data | | | | | | |
Portfolio turnover rate
| 16% | 14% | 20% | 50% | 82% | 61% |
Net assets, end of period (000s omitted)
| $12,049 | $11,115 | $15,704 | $24,627 | $22,839 | $25,179 |
| 1 | Returns for periods of less than one year are not annualized. |
The accompanying notes are an integral part of these financial statements.
22 | Wells Fargo High Yield Municipal Bond Fund
Financial highlights
(For a share outstanding throughout each period)
| | | Year ended June 30 |
| Institutional Class | Six months ended
December 31, 2020
(unaudited) | 2020 | 2019 | 2018 | 2017 | 2016 |
Net asset value, beginning of period
| $10.43 | $10.97 | $10.59 | $10.37 | $10.91 | $10.34 |
Net investment income
| 0.23 | 0.46 | 0.42 | 0.43 | 0.40 | 0.38 |
Net realized and unrealized gains (losses) on investments
| 0.43 | (0.53) | 0.38 | 0.22 | (0.46) | 0.60 |
Total from investment operations
| 0.66 | (0.07) | 0.80 | 0.65 | (0.06) | 0.98 |
| Distributions to shareholders from | | | | | | |
Net investment income
| (0.23) | (0.47) | (0.42) | (0.43) | (0.40) | (0.38) |
Net realized gains
| 0.00 | 0.00 | 0.00 | 0.00 | (0.08) | (0.03) |
Total distributions to shareholders
| (0.23) | (0.47) | (0.42) | (0.43) | (0.48) | (0.41) |
Net asset value, end of period
| $10.86 | $10.43 | $10.97 | $10.59 | $10.37 | $10.91 |
Total return1
| 6.35% | (0.74)% | 7.70% | 6.37% | (0.51)% | 9.71% |
| Ratios to average net assets (annualized) | | | | | | |
Gross expenses
| 0.84% | 0.78% | 0.76% | 0.74% | 0.73% | 0.74% |
Net expenses
| 0.55% | 0.55% | 0.55% | 0.60% | 0.60% | 0.60% |
Net investment income
| 4.24% | 4.24% | 3.92% | 4.09% | 3.82% | 3.58% |
| Supplemental data | | | | | | |
Portfolio turnover rate
| 16% | 14% | 20% | 50% | 82% | 61% |
Net assets, end of period (000s omitted)
| $38,574 | $37,049 | $85,187 | $75,560 | $73,989 | $67,867 |
| 1 | Returns for periods of less than one year are not annualized. |
The accompanying notes are an integral part of these financial statements.
Wells Fargo High Yield Municipal Bond Fund | 23
Notes to financial statements (unaudited)
1. ORGANIZATION
Wells Fargo Funds Trust (the “Trust”), a Delaware statutory trust organized on March 10, 1999, is an open-end management investment company registered under the Investment Company Act of 1940, as amended (the “1940 Act”). As an investment company, the Trust follows the accounting and reporting guidance in Financial Accounting Standards Board (“FASB”) Accounting Standards Codification Topic 946, Financial Services – Investment Companies. These financial statements report on the Wells Fargo High Yield Municipal Bond Fund (the “Fund”) which is a diversified series of the Trust.
2. SIGNIFICANT ACCOUNTING POLICIES
The following significant accounting policies, which are consistently followed in the preparation of the financial statements of the Fund, are in conformity with U.S. generally accepted accounting principles which require management to make estimates and assumptions that affect the reported amounts of assets and liabilities, disclosure of contingent assets and liabilities at the date of the financial statements, and the reported amounts of income and expenses during the reporting period. Actual results could differ from those estimates.
Securities valuation
All investments are valued each business day as of the close of regular trading on the New York Stock Exchange (generally 4 p.m. Eastern Time), although the Fund may deviate from this calculation time under unusual or unexpected circumstances.
Debt securities are valued at the evaluated bid price provided by an independent pricing service (e.g. taking into account various factors, including yields, maturities, or credit ratings) or, if a reliable price is not available, the quoted bid price from an independent broker-dealer.
Investments in registered open-end investment companies are valued at net asset value.
Investments which are not valued using any of the methods discussed above are valued at their fair value, as determined in good faith by the Board of Trustees of the Fund. The Board of Trustees has established a Valuation Committee comprised of the Trustees and has delegated to it the authority to take any actions regarding the valuation of portfolio securities that the Valuation Committee deems necessary or appropriate, including determining the fair value of portfolio securities, unless the determination has been delegated to the Wells Fargo Asset Management Pricing Committee at Wells Fargo Funds Management, LLC ("Funds Management"). The Board of Trustees retains the authority to make or ratify any valuation decisions or approve any changes to the Valuation Procedures as it deems appropriate. On a quarterly basis, the Board of Trustees receives reports on any valuation actions taken by the Valuation Committee or the Wells Fargo Asset Management Pricing Committee which may include items for ratification.
When-issued transactions
The Fund may purchase securities on a forward commitment or when-issued basis. The Fund records a when-issued transaction on the trade date and will segregate assets in an amount at least equal in value to the Fund's commitment to purchase when-issued securities. Securities purchased on a when-issued basis are marked-to-market daily and the Fund begins earning interest on the settlement date. Losses may arise due to changes in the market value of the underlying securities or if the counterparty does not perform under the contract.
Security transactions and income recognition
Securities transactions are recorded on a trade date basis. Realized gains or losses are recorded on the basis of identified cost.
Interest income is accrued daily and bond discounts are accreted and premiums are amortized daily. To the extent debt obligations are placed on non-accrual status, any related interest income may be reduced by writing off interest receivables when the collection of all or a portion of interest has been determined to be doubtful based on consistently applied procedures and the fair value has decreased. If the issuer subsequently resumes interest payments or when the collectability of interest is reasonably assured, the debt obligation is removed from non-accrual status.
Distributions to shareholders
Distributions to shareholders from net investment income are declared daily and paid monthly. Distributions from net realized gains, if any, are recorded on the ex-dividend date and paid at least annually. Such distributions are determined in accordance with income tax regulations and may differ from U.S. generally accepted accounting principles. Dividend sources are estimated at the time of declaration. The tax character of distributions is determined as of the Fund’s fiscal year end. Therefore, a portion of the Fund’s distributions made prior to the Fund’s fiscal year end may be categorized as a tax return of capital at year end.
24 | Wells Fargo High Yield Municipal Bond Fund
Notes to financial statements (unaudited)
Federal and other taxes
The Fund intends to continue to qualify as a regulated investment company by distributing substantially all of its investment company taxable and tax-exempt income and any net realized capital gains (after reduction for capital loss carryforwards) sufficient to relieve it from all, or substantially all, federal income taxes. Accordingly, no provision for federal income taxes was required.
The Fund’s income and federal excise tax returns and all financial records supporting those returns for the prior three fiscal years are subject to examination by the federal and Delaware revenue authorities. Management has analyzed the Fund’s tax positions taken on federal, state, and foreign tax returns for all open tax years and does not believe that there are any uncertain tax positions that require recognition of a tax liability.
As of December 31, 2020, the aggregate cost of all investments for federal income tax purposes was $83,197,282 and the unrealized gains (losses) consisted of:
| Gross unrealized gains | $5,632,464 |
| Gross unrealized losses | (342,797) |
| Net unrealized gains | $5,289,667 |
As of June 30, 2020, the Fund had capital loss carryforwards which consisted of $46,096 in short-term capital losses and $502,345 in long-term capital losses.
Class allocations
The separate classes of shares offered by the Fund differ principally in applicable sales charges, distribution, shareholder servicing, and administration fees. Class specific expenses are charged directly to that share class. Investment income, common fund-level expenses, and realized and unrealized gains (losses) on investments are allocated daily to each class of shares based on the relative proportion of net assets of each class.
3. FAIR VALUATION MEASUREMENTS
Fair value measurements of investments are determined within a framework that has established a fair value hierarchy based upon the various data inputs utilized in determining the value of the Fund’s investments. The three-level hierarchy gives the highest priority to unadjusted quoted prices in active markets for identical assets or liabilities (Level 1) and the lowest priority to unobservable inputs (Level 3). The Fund’s investments are classified within the fair value hierarchy based on the lowest level of input that is significant to the fair value measurement. The inputs are summarized into three broad levels as follows:
| ■ | Level 1 – quoted prices in active markets for identical securities |
| ■ | Level 2 – other significant observable inputs (including quoted prices for similar securities, interest rates, prepayment speeds, credit risk, etc.) |
| ■ | Level 3 – significant unobservable inputs (including the Fund’s own assumptions in determining the fair value of investments) |
The inputs or methodologies used for valuing investments in securities are not necessarily an indication of the risk associated with investing in those securities.
The following is a summary of the inputs used in valuing the Fund’s assets and liabilities as of December 31, 2020:
| | Quoted prices
(Level 1) | Other significant
observable inputs
(Level 2) | Significant
unobservable inputs
(Level 3) | Total |
| Assets | | | | |
| Investments in: | | | | |
| Municipal obligations | $ 0 | $ 83,722,732 | $0 | $ 83,722,732 |
| Short-term investments | | | | |
| Investment companies | 4,764,217 | 0 | 0 | 4,764,217 |
| Total assets | $4,764,217 | $83,722,732 | $0 | $88,486,949 |
For the six months ended December 31, 2020, the Fund did not have any transfers into/out of Level 3.
Wells Fargo High Yield Municipal Bond Fund | 25
Notes to financial statements (unaudited)
4. TRANSACTIONS WITH AFFILIATES
Management fee
Funds Management, an indirect wholly owned subsidiary of Wells Fargo & Company (“Wells Fargo”), is the manager of the Fund and provides advisory and fund-level administrative services under an investment management agreement. Under the investment management agreement, Funds Management is responsible for, among other services, implementing the investment objectives and strategies of the Fund, supervising the subadviser and providing fund-level administrative services in connection with the Fund’s operations. As compensation for its services under the investment management agreement, Funds Management is entitled to receive a management fee at the following annual rate based on the Fund’s average daily net assets:
| Average daily net assets | Management fee |
| First $500 million | 0.500% |
| Next $500 million | 0.475 |
| Next $2 billion | 0.450 |
| Next $2 billion | 0.425 |
| Next $5 billion | 0.390 |
| Over $10 billion | 0.380 |
For the six months ended December 31, 2020, the management fee was equivalent to an annual rate of 0.50% of the Fund’s average daily net assets.
Funds Management has retained the services of a subadviser to provide daily portfolio management to the Fund. The fee for subadvisory services is borne by Funds Management. Wells Capital Management, Incorporated, an affiliate of Funds Management and an indirect wholly owned subsidiary of Wells Fargo, is the subadviser to the Fund and is entitled to receive a fee from Funds Management at an annual rate starting at 0.35% and declining to 0.20% as the average daily net assets of the Fund increase.
Administration fees
Under a class-level administration agreement, Funds Management provides class-level administrative services to the Fund, which includes paying fees and expenses for services provided by the transfer agent, sub-transfer agents, omnibus account servicers and record-keepers. As compensation for its services under the class-level administration agreement, Funds Management receives an annual fee which is calculated based on the average daily net assets of each class as follows:
| | Class-level
administration fee |
| Class A | 0.16% |
| Class C | 0.16 |
| Class R6 | 0.03 |
| Administrator Class | 0.10 |
| Institutional Class | 0.08 |
Waivers and/or expense reimbursements
Funds Management has contractually waived and/or reimbursed management and administration fees to the extent necessary to maintain certain net operating expense ratios for the Fund. When each class of the Fund has exceeded its expense cap, Funds Management has waived fees and/or reimbursed expenses from fund-level expenses on a proportionate basis and then from class specific expenses. When only certain classes exceed their expense caps, waivers and/or reimbursements are applied against class specific expenses before fund-level expenses. Funds Management has committed through October 31, 2021 to waive fees and/or reimburse expenses to the extent necessary to cap the Fund’s expenses at 0.80% for Class A shares, 1.55% for Class C shares, 0.50% for Class R6 shares, 0.70% for Administrator Class shares, and 0.55% for Institutional Class shares. Prior to or after the commitment expiration date, the cap may be increased or the commitment to maintain the cap may be terminated only with the approval of the Board of Trustees.
26 | Wells Fargo High Yield Municipal Bond Fund
Notes to financial statements (unaudited)
Distribution fee
The Trust has adopted a distribution plan for Class C shares of the Fund pursuant to Rule 12b-1 under the 1940 Act. A distribution fee is charged charged to Class C shares and paid to Wells Fargo Funds Distributor, LLC (“Funds Distributor”), the principal underwriter, at an annual rate of 0.75% of the average daily net assets of Class C shares.
In addition, Funds Distributor is entitled to receive the front-end sales charge from the purchase of Class A shares and a contingent deferred sales charge on the redemption of certain Class A shares. Funds Distributor is also entitled to receive the contingent deferred sales charges from redemptions of Class C shares. For the six months ended December 31, 2020, Funds Distributor received $3,490 from the sale of Class A shares. No contingent deferred sales charges were incurred by Class A and Class C shares for the six months ended December 31, 2020.
Shareholder servicing fees
The Trust has entered into contracts with one or more shareholder servicing agents, whereby Class A, Class C, and Administrator Class of the Fund are charged a fee at an annual rate of 0.25% of the average daily net assets of each respective class. A portion of these total shareholder servicing fees were paid to affiliates of Wells Fargo.
Interfund transactions
The Fund may purchase or sell portfolio investment securities to certain other Wells Fargo affiliates pursuant to Rule 17a-7 under the 1940 Act and under procedures adopted by the Board of Trustees. The procedures have been designed to ensure that these interfund transactions, which do not incur broker commissions, are effected at current market prices. Pursuant to these procedures, the Fund had $4,425,000, $4,425,000 and $0 in interfund purchases, sales and net realized gains (losses), respectively, during the six months ended December 31, 2020.
5. INVESTMENT PORTFOLIO TRANSACTIONS
Purchases and sales of investments, excluding U.S. government obligations (if any) and short-term securities, for the six months ended December 31, 2020 were $13,026,560 and $13,241,809, respectively.
6. BANK BORROWINGS
The Trust (excluding the money market funds), Wells Fargo Master Trust and Wells Fargo Variable Trust are parties to a $350,000,000 revolving credit agreement whereby the Fund is permitted to use bank borrowings for temporary or emergency purposes, such as to fund shareholder redemption requests. Interest under the credit agreement is charged to the Fund based on a borrowing rate equal to the higher of the Federal Funds rate in effect on that day plus 1.25% or the overnight LIBOR rate in effect on that day plus 1.25%. In addition, an annual commitment fee equal to 0.25% of the unused balance is allocated to each participating fund.
For the six months ended December 31, 2020, there were no borrowings by the Fund under the agreement.
7. INDEMNIFICATION
Under the Fund's organizational documents, the officers and Trustees have been granted certain indemnification rights against certain liabilities that may arise out of performance of their duties to the Fund. The Fund has entered into a separate agreement with each Trustee that converts indemnification rights currently existing under the Fund’s organizational documents into contractual rights that cannot be changed in the future without the consent of the Trustee. Additionally, in the normal course of business, the Fund may enter into contracts with service providers that contain a variety of indemnification clauses. The Fund’s maximum exposure under these arrangements is dependent on future claims that may be made against the Fund and, therefore, cannot be estimated.
8. NEW ACCOUNTING PRONOUNCEMENT
In August 2018, FASB issued Accounting Standards Update (“ASU”) No. 2018-13, Fair Value Measurement (Topic 820) Disclosure Framework - Changes to the Disclosure Requirements for Fair Value Measurement. ASU 2018-13 updates the disclosure requirements on fair value measurements in Topic 820, Fair Value Measurements. The amendments are effective for fiscal years, and interim periods within those fiscal years, beginning after December 15, 2019. Management has adopted this guidance which did not have a material impact on the financial statements.
9. SUBSEQUENT EVENT
On February 23, 2021, Wells Fargo announced that it has entered into a definitive agreement to sell Wells Fargo Asset Management (“WFAM”) to GTCR LLC and Reverence Capital Partners, L.P. WFAM is the trade name used by the asset management businesses of Wells Fargo and includes Wells Fargo Funds Management, LLC, the investment manager to the
Wells Fargo High Yield Municipal Bond Fund | 27
Notes to financial statements (unaudited)
Fund, Wells Capital Management Incorporated and Wells Fargo Asset Management (International) Limited, both registered investment advisers providing sub-advisory services to certain funds, and Wells Fargo Funds Distributor, LLC, the Fund’s principal underwriter. As part of the transaction, Wells Fargo will own a 9.9% equity interest and will continue to serve as an important client and distribution partner.
Consummation of the transaction will result in the automatic termination of the Fund’s investment management agreement and sub-advisory agreement(s). The Fund’s Board of Trustees will be asked to approve new investment management arrangements with the new company. If approved by the Board, the new investment management arrangements with the new company will be presented to the shareholders of the Fund for approval, and, if approved by shareholders, would take effect upon the closing of the transaction. The transaction is expected to close in the second half of 2021, subject to customary closing conditions.
10. CORONAVIRUS (COVID-19) PANDEMIC
On March 11, 2020, the World Health Organization announced that it had made the assessment that coronavirus disease 2019 (“COVID-19”) is a pandemic. The impacts of COVID-19 are affecting the entire global economy, individual companies and investment products, and the market in general. There is significant uncertainty around the extent and duration of business disruptions related to COVID-19 and the impacts may be short term or may last for an extended period of time. The risk of further spreading of COVID-19 has led to significant uncertainty and volatility in the financial markets.
28 | Wells Fargo High Yield Municipal Bond Fund
Other information (unaudited)
PROXY VOTING INFORMATION
A description of the policies and procedures used to determine how to vote proxies relating to portfolio securities is available without charge, upon request, by calling 1-800-222-8222, visiting our website at wfam.com, or visiting the SEC website at sec.gov. Information regarding how the proxies related to portfolio securities were voted during the most recent 12-month period ended June 30 is available on the website at wfam.com or by visiting the SEC website at sec.gov.
QUARTERLY PORTFOLIO HOLDINGS INFORMATION
The Fund files its complete schedule of portfolio holdings with the SEC for the first and third quarters of each fiscal year as an exhibit to its reports on Form N-PORT. Shareholders may view the filed Form N-PORT by visiting the SEC website at sec.gov.
Wells Fargo High Yield Municipal Bond Fund | 29
Other information (unaudited)
BOARD OF TRUSTEES AND OFFICERS
Each of the Trustees and Officers1 listed in the table below acts in identical capacities for each fund in the Wells Fargo family of funds, which consists of 144 mutual funds comprising the Wells Fargo Funds Trust, Wells Fargo Variable Trust, Wells Fargo Master Trust and four closed-end funds (collectively the “Fund Complex”). This table should be read in conjunction with the Prospectus and the Statement of Additional Information2. The mailing address of each Trustee and Officer is 525 Market Street, 12th Floor, San Francisco, CA 94105. Each Trustee and Officer serves an indefinite term, however, each Trustee serves such term until reaching the mandatory retirement age established by the Trustees.
Independent Trustees
Name and
year of birth | Position held and
length of service* | Principal occupations during past five years or longer | Current other
public company or
investment
company
directorships |
William R. Ebsworth
(Born 1957) | Trustee,
since 2015 | Retired. From 1984 to 2013, equities analyst, portfolio manager, research director and chief investment officer at Fidelity Management and Research Company in Boston, Tokyo, and Hong Kong, and retired in 2013 as Chief Investment Officer of Fidelity Strategic Advisers, Inc. where he led a team of investment professionals managing client assets. Prior thereto, Board member of Hong Kong Securities Clearing Co., Hong Kong Options Clearing Corp., the Thailand International Fund, Ltd., Fidelity Investments Life Insurance Company, and Empire Fidelity Investments Life Insurance Company. Audit Committee Chair and Investment Committee Chair of the Vincent Memorial Hospital Endowment (non-profit organization). Mr. Ebsworth is a CFA® charterholder. | N/A |
Jane A. Freeman
(Born 1953) | Trustee,
since 2015;
Chair Liaison,
since 2018 | Retired. From 2012 to 2014 and 1999 to 2008, Chief Financial Officer of Scientific Learning Corporation. From 2008 to 2012, Ms. Freeman provided consulting services related to strategic business projects. Prior to 1999, Portfolio Manager at Rockefeller & Co. and Scudder, Stevens & Clark. Board member of the Harding Loevner Funds from 1996 to 2014, serving as both Lead Independent Director and chair of the Audit Committee. Board member of the Russell Exchange Traded Funds Trust from 2011 to 2012 and the chair of the Audit Committee. Ms. Freeman is also an inactive Chartered Financial Analyst. | N/A |
Isaiah Harris, Jr.
(Born 1952) | Trustee,
since 2009; Audit
Committee
Chair,
since 2019 | Retired. Chairman of the Board of CIGNA Corporation since 2009, and Director since 2005. From 2003 to 2011, Director of Deluxe Corporation. Prior thereto, President and CEO of BellSouth Advertising and Publishing Corp. from 2005 to 2007, President and CEO of BellSouth Enterprises from 2004 to 2005 and President of BellSouth Consumer Services from 2000 to 2003. Emeritus member of the Iowa State University Foundation Board of Governors. Emeritus Member of the Advisory Board of Iowa State University School of Business. Advisory Board Member, Palm Harbor Academy (private school). Mr. Harris is a certified public accountant (inactive status). | CIGNA Corporation |
Judith M. Johnson
(Born 1949) | Trustee,
since 2008 | Retired. Prior thereto, Chief Executive Officer and Chief Investment Officer of Minneapolis Employees Retirement Fund from 1996 to 2008. Ms. Johnson is an attorney, certified public accountant and a certified managerial accountant. | N/A |
David F. Larcker
(Born 1950) | Trustee,
since 2009 | James Irvin Miller Professor of Accounting at the Graduate School of Business (Emeritus), Stanford University, Director of the Corporate Governance Research Initiative and Senior Faculty of The Rock Center for Corporate Governance since 2006. From 2005 to 2008, Professor of Accounting at the Graduate School of Business, Stanford University. Prior thereto, Ernst & Young Professor of Accounting at The Wharton School, University of Pennsylvania from 1985 to 2005. | N/A |
30 | Wells Fargo High Yield Municipal Bond Fund
Other information (unaudited)
Name and
year of birth | Position held and
length of service* | Principal occupations during past five years or longer | Current other
public company or
investment
company
directorships |
Olivia S. Mitchell
(Born 1953) | Trustee,
since 2006;
Nominating and
Governance
Committee Chair,
since 2018 | International Foundation of Employee Benefit Plans Professor, Wharton School of the University of Pennsylvania since 1993. Director of Wharton’s Pension Research Council and Boettner Center on Pensions & Retirement Research, and Research Associate at the National Bureau of Economic Research. Previously, Cornell University Professor from 1978 to 1993. | N/A |
Timothy J. Penny
(Born 1951) | Trustee,
since 1996;
Chair,
since 2018 | President and Chief Executive Officer of Southern Minnesota Initiative Foundation, a non-profit organization, since 2007. Member of the Board of Trustees of NorthStar Education Finance, Inc., a non-profit organization, since 2007. | N/A |
James G. Polisson
(Born 1959) | Trustee,
since 2018 | Retired. Chief Marketing Officer, Source (ETF) UK Services, Ltd, from 2015 to 2017. From 2012 to 2015, Principal of The Polisson Group, LLC, a management consulting, corporate advisory and principal investing company. Chief Executive Officer and Managing Director at Russell Investments, Global Exchange Traded Funds from 2010 to 2012. Managing Director of Barclays Global Investors from 1998 to 2010 and Global Chief Marketing Officer for iShares and Barclays Global Investors from 2000 to 2010. Trustee of the San Francisco Mechanics’ Institute, a non-profit organization, from 2013 to 2015. Board member of the Russell Exchange Traded Fund Trust from 2011 to 2012. Director of Barclays Global Investors Holdings Deutschland GmbH from 2006 to 2009. Mr. Polisson is an attorney and has a retired status with the Massachusetts and District of Columbia Bar Associations. | N/A |
Pamela Wheelock
(Born 1959) | Trustee,
since January
2020; previously
Trustee from
January 2018 to
July 2019 | Board member of the Destination Medical Center Economic Development Agency, Rochester, Minnesota since 2019. Interim President of the McKnight Foundation from January to September 2020. Acting Commissioner, Minnesota Department of Human Services, July 2019 through September 2019. Human Services Manager (part-time), Minnesota Department of Human Services, October 2019 through December 2019. Chief Operating Officer, Twin Cities Habitat for Humanity from 2017 to 2019. Vice President of University Services, University of Minnesota from 2012 to 2016. Prior thereto, on the Board of Directors, Governance Committee and Finance Committee for the Minnesota Philanthropy Partners (Saint Paul Foundation) from 2012 to 2018, Interim Chief Executive Officer of Blue Cross Blue Shield of Minnesota from 2011 to 2012, Chairman of the Board from 2009 to 2012 and Board Director from 2003 to 2015. Vice President, Leadership and Community Engagement, Bush Foundation, Saint Paul, Minnesota (a private foundation) from 2009 to 2011. Executive Vice President and Chief Financial Officer, Minnesota Sports and Entertainment from 2004 to 2009 and Senior Vice President from 2002 to 2004. Executive Vice President of the Minnesota Wild Foundation from 2004 to 2008. Commissioner of Finance, State of Minnesota, from 1999 to 2002. Currently Board Chair of the Minnesota Wild Foundation since 2010. | N/A |
* Length of service dates reflect the Trustee’s commencement of service with the Trust’s predecessor entities, where applicable.
Wells Fargo High Yield Municipal Bond Fund | 31
Other information (unaudited)
Officers
Name and
year of birth | Position held and
length of service | Principal occupations during past five years or longer |
Andrew Owen
(Born 1960) | President,
since 2017 | Executive Vice President of Wells Fargo & Company and Head of Affiliated Managers, Wells Fargo Asset Management, since 2014. In addition, Mr. Owen is currently President, Chief Executive Officer and Director of Wells Fargo Funds Management, LLC since 2017. Prior thereto, Executive Vice President responsible for marketing, investments and product development for Wells Fargo Funds Management, LLC, from 2009 to 2014. |
Nancy Wiser1
(Born 1967) | Treasurer,
since 2012 | Executive Vice President of Wells Fargo Funds Management, LLC since 2011. Chief Operating Officer and Chief Compliance Officer at LightBox Capital Management LLC, from 2008 to 2011. |
Michelle Rhee
(Born 1966) | Chief Legal Officer,
since 2019 | Secretary of Wells Fargo Funds Management, LLC and Chief Legal Counsel of Wells Fargo Asset Management since 2018. Deputy General Counsel of Wells Fargo Bank N.A. since 2020 and Assistant General Counsel of Wells Fargo Bank, N.A. from 2018 to 2020. Associate General Counsel and Managing Director of Bank of America Corporation from 2004 to 2018. |
Catherine Kennedy
(Born 1969) | Secretary,
since 2019 | Vice President of Wells Fargo Funds Management, LLC and Senior Counsel of the Wells Fargo Legal Department since 2010. Vice President and Senior Counsel of Evergreen Investment Management Company, LLC from 1998 to 2010. |
Michael H. Whitaker
(Born 1967) | Chief Compliance Officer,
since 2016 | Chief Compliance Officer of Wells Fargo Asset Management since 2016. Senior Vice President and Chief Compliance Officer for Fidelity Investments from 2007 to 2016. |
Jeremy DePalma1
(Born 1974) | Assistant Treasurer,
since 2009 | Senior Vice President of Wells Fargo Funds Management, LLC since 2009. Senior Vice President of Evergreen Investment Management Company, LLC from 2008 to 2010 and head of the Fund Reporting and Control Team within Fund Administration from 2005 to 2010. |
1 Nancy Wiser acts as Treasurer of 67 funds in the Fund Complex. Jeremy DePalma acts as the Treasurer of 77 funds and Assistant Treasurer of 67 funds in the Fund Complex.
2 The Statement of Additional Information includes additional information about the Trustees and is available, without charge, upon request, by calling 1-800-222-8222 or by visiting the website at wfam.com.
32 | Wells Fargo High Yield Municipal Bond Fund
For more information
More information about Wells Fargo Funds is available free upon request. To obtain literature, please write, visit the Fund's website, or call:
Wells Fargo Funds
P.O. Box 219967
Kansas City, MO 64121-9967
Website: wfam.com
Individual investors: 1-800-222-8222
Retail investment professionals: 1-888-877-9275
Institutional investment professionals: 1-866-765-0778
This report and the financial statements contained herein are submitted for the general information of the shareholders of the Fund. If this report is used for promotional purposes, distribution of the report must be accompanied or preceded by a current prospectus. Before investing, please consider the investment objectives, risks, charges, and expenses of the investment. For a current prospectus and, if available, a summary prospectus, containing this information, call 1-800-222-8222 or visit the Fund’s website at wfam.com. Read the prospectus carefully before you invest or send money.
Wells Fargo Asset Management (WFAM) is the trade name for certain investment advisory/management firms owned by Wells Fargo & Company. These firms include but are not limited to Wells Capital Management Incorporated and Wells Fargo Funds Management, LLC. Certain products managed by WFAM entities are distributed by Wells Fargo Funds Distributor, LLC (a broker-dealer and Member FINRA).
This material is for general informational and educational purposes only and is NOT intended to provide investment advice or a recommendation of any kind— including a recommendation for any specific investment, strategy, or plan.
INVESTMENT PRODUCTS: NOT FDIC INSURED ■ NO BANK GUARANTEE ■ MAY LOSE VALUE
© 2021 Wells Fargo & Company. All rights reserved.
PAR-0121-00274 02-21
SA264/SAR264 12-20
Semi-Annual Report
December 31, 2020
Wells Fargo
Intermediate Tax/AMT-Free Fund
Reduce clutter.
Save trees.
Sign up for electronic delivery of prospectuses and shareholder reports at wellsfargo.com/ advantagedelivery
The views expressed and any forward-looking statements are as of December 31, 2020, unless otherwise noted, and are those of the Fund's portfolio managers and/or Wells Fargo Asset Management. Discussions of individual securities or the markets generally are not intended as individual recommendations. Future events or results may vary significantly from those expressed in any forward-looking statements. The views expressed are subject to change at any time in response to changing circumstances in the market. Wells Fargo Asset Management and the Fund disclaim any obligation to publicly update or revise any views expressed or forward-looking statements.
INVESTMENT PRODUCTS: NOT FDIC INSURED ■ NO BANK GUARANTEE ■ MAY LOSE VALUE
Wells Fargo Intermediate Tax/AMT-Free Fund | 1
Letter to shareholders (unaudited)
Dear Shareholder:
We are pleased to offer you this semi-annual report for the Wells Fargo Intermediate Tax/AMT-Free Fund for the six-month period that ended December 31, 2020. Despite a deeply challenging year, dominated by the spread of COVID-19 cases and a sharp drop in economic output throughout much of the world, global stocks performed extremely well, benefiting from ongoing central bank support and rising optimism over the development and distribution of effective COVID-19 vaccines. Bonds also had positive returns, led by global bonds and high-yield bonds.
For the six-month period, U.S. stocks, based on the S&P 500 Index,1 gained 22.16%. International stocks, as measured by the MSCI ACWI ex USA Index (Net),2 returned 24.33%, while the MSCI EM Index (Net),3 had even stronger performance, with a 31.14% gain. Among bond indexes, the Bloomberg Barclays U.S. Aggregate Bond Index,4 returned 1.29%, the Bloomberg Barclays Global Aggregate ex-USD Index (unhedged),5 gained 9.44%, and the Bloomberg Barclays Municipal Bond Index,6 returned 3.07% while the ICE BofA U.S. High Yield Index,7 gained a hefty 11.49%.
The stock market rally continued in July.
After a volatile first half of the year, an existing stock market rally continued in July with strong results for equities and fixed income. However, economic data and a resurgence of COVID-19 cases underscored the urgent need to regain control of the pandemic. Second-quarter gross domestic product (GDP) shrank from the previous quarter by 9.5% and 12.1% in the U.S. and the eurozone, respectively. In contrast, China’s second-quarter GDP grew 3.2% year over year. The U.S. economy added 1.8 million jobs in July, but a double-digit jobless rate persisted.
The stock market continued to rally in August despite concerns over rising numbers of U.S. and European COVID-19 cases as well as the expiration of the $600 weekly bonus unemployment benefit in July. Relatively strong second-quarter earnings boosted investor sentiment along with the U.S. Federal Reserve’s announcement of a monetary policy shift expected to support longer-term low interest rates. U.S. manufacturing and services activity indexes beat expectations, while the U.S. housing market maintained strength. In Europe, retail sales expanded and consumer confidence was steady. China’s economy continued to expand.
Andrew Owen
President
Wells Fargo Funds
“After a volatile first half of the year, an existing stock market rally continued in July with strong results for equities and fixed income.”
| 1 | The S&P 500 Index consists of 500 stocks chosen for market size, liquidity, and industry group representation. It is a market-value-weighted index with each stock's weight in the index proportionate to its market value. You cannot invest directly in an index. |
| 2 | The Morgan Stanley Capital International (MSCI) All Country World Index (ACWI) ex USA Index (Net) is a free-float-adjusted market-capitalization-weighted index that is designed to measure the equity market performance of developed and emerging markets, excluding the United States. Source: MSCI. MSCI makes no express or implied warranties or representations and shall have no liability whatsoever with respect to any MSCI data contained herein. The MSCI data may not be further redistributed or used as a basis for other indices or any securities or financial products. This report is not approved, reviewed, or produced by MSCI. You cannot invest directly in an index. |
| 3 | The MSCI Emerging Markets (EM) Index (Net) is a free-float-adjusted market-capitalization-weighted index that is designed to measure equity market performance of emerging markets. You cannot invest directly in an index. |
| 4 | The Bloomberg Barclays U.S. Aggregate Bond Index is a broad-based benchmark that measures the investment-grade, U.S. dollar-denominated, fixed-rate taxable bond market, including Treasuries, government-related and corporate securities, mortgage-backed securities (agency fixed-rate and hybrid adjustable-rate mortgage pass-throughs), asset-backed securities, and commercial mortgage-backed securities. You cannot invest directly in an index. |
| 5 | The Bloomberg Barclays Global Aggregate ex-USD Index (unhedged) is an unmanaged index that provides a broad-based measure of the global investment-grade fixed-income markets excluding the U.S. dollar-denominated debt market. You cannot invest directly in an index. |
| 6 | The Bloomberg Barclays Municipal Bond Index is an unmanaged index composed of long-term tax-exempt bonds with a minimum credit rating of Baa. You cannot invest directly in an index. |
| 7 | The ICE BofA U.S. High Yield Index is a market-capitalization-weighted index of domestic and Yankee high-yield bonds. The index tracks the performance of high-yield securities traded in the U.S. bond market. You cannot invest directly in an index. Copyright 2021. ICE Data Indices, LLC. All rights reserved. |
2 | Wells Fargo Intermediate Tax/AMT-Free Fund
Letter to shareholders (unaudited)
Stocks grew more volatile in September on mixed economic data. U.S. economic activity continued to grow. However, U.S. unemployment remained elevated at 7.9% in September. With U.S. Congress delaying further fiscal relief and uncertainties surrounding a possible vaccine, doubts crept back into the financial markets. In the U.K., a lack of progress in Brexit talks weighed on markets. China’s economy picked up steam, fueled by increased global demand.
In October, capital markets stepped back from their six-month rally. Market volatility rose in advance of the U.S. election and amid a global increase in COVID-19 infections. Europe introduced tighter restrictions affecting economic activity. U.S. markets looked favorably at the prospect of Democratic control of the federal purse strings, which could lead to additional fiscal stimulus and a boost to economic activity. Meanwhile, China reported 4.9% third-quarter GDP growth.
Global stocks rallied in November, propelled by optimism over three promising COVID-19 vaccines. Reversing recent trends, value stocks outperformed growth stocks and cyclical stocks outpaced technology stocks. However, U.S. unemployment remained elevated, with a net job loss of 10 million since February. The eurozone services Purchasing Managers’ Index, a monthly survey of purchasing managers, contracted sharply while the region’s manufacturing activity grew. The U.S. election results added to the upbeat mood as investors anticipated more consistent policies in the new administration.
Financial markets ended the year with strength on high expectations for a rapid rollout of the COVID-19 vaccines, the successful passage of a $900 billion stimulus package, and rising expectations of additional economic support from a Democratic-led Congress. U.S. economic data were mixed with still-elevated unemployment and weak retail sales but growth in manufacturing output. In contrast, China’s economic expansion continued in both manufacturing and nonmanufacturing. U.S. COVID-19 infection rates continued to rise even as new state and local lockdown measures were implemented.
Don’t let short-term uncertainty derail long-term investment goals.
Periods of investment uncertainty can present challenges, but experience has taught us that maintaining long-term investment goals can be an effective way to plan for the future. To help you create a sound strategy based on your personal goals and risk tolerance, Wells Fargo Funds offers more than 100 mutual funds spanning a wide range of asset classes and investment styles. Although diversification cannot guarantee an investment profit or prevent losses, we believe it can be an effective way to manage investment risk and potentially smooth out overall portfolio performance. We encourage investors to know their investments and to understand that appropriate levels of risk-taking may unlock opportunities.
Thank you for choosing to invest with Wells Fargo Funds. We appreciate your confidence in us and remain committed to helping you meet your financial needs.
Sincerely,
Andrew Owen
President
Wells Fargo Funds
For further information about your Fund, contact your investment professional, visit our website at wfam.com, or call us directly at 1-800-222-8222.
Wells Fargo Intermediate Tax/AMT-Free Fund | 3
Letter to shareholders (unaudited)
Preparing for LIBOR Transition
The global financial industry is preparing to transition away from the London Interbank Offered Rate (LIBOR), a key benchmark interest rate, to new alternative rates. LIBOR underpins more than $350 trillion of financial contracts. It is the benchmark rate for a wide spectrum of products ranging from residential mortgages to corporate bonds to derivatives. Regulators have called for a market-wide transition away from LIBOR to successor reference rates by the end of 2021 (expected to be extended through June 30, 2023 for most tenors of the U.S. dollar LIBOR), which requires proactive steps be taken by issuers, counterparties, and asset managers to identify impacted products and adopt new reference rates.
The Fund holds at least one security that uses LIBOR as a floating reference rate and has a maturity date after 12-31-2021.
Although the transition process away from LIBOR has become increasingly well-defined in advance of the anticipated discontinuation date, there remains uncertainty regarding the nature of successor reference rates, and any potential effects of the transition away from LIBOR on investment instruments that use it as a benchmark rate. The transition process may result in, among other things, increased volatility or illiquidity in markets for instruments that currently rely on LIBOR and could negatively impact the value of certain instruments held by the Fund.
Wells Fargo Asset Management is monitoring LIBOR exposure closely and has put resources and controls in place to manage this transition effectively. The Fund’s portfolio management team is evaluating LIBOR holdings to understand what happens to those securities when LIBOR ceases to exist, including examining security documentation to identify the presence or absence of fallback language identifying a replacement rate to LIBOR.
While the pace of transition away from LIBOR will differ by asset class and investment strategy, the portfolio management team will monitor market conditions for those holdings to identify and mitigate deterioration or volatility in pricing and liquidity and ensure appropriate actions are taken in a timely manner.
Further information regarding the potential risks associated with the discontinuation of LIBOR can be found in the Fund’s Statement of Additional Information.
4 | Wells Fargo Intermediate Tax/AMT-Free Fund
This page is intentionally left blank.
Performance highlights (unaudited)
Investment objective
The Fund seeks current income exempt from federal income tax.
Manager
Wells Fargo Funds Management, LLC
Subadviser
Wells Capital Management Incorporated
Portfolio managers
Bruce R. Johns
Robert J. Miller
Adrian Van Poppel
Nicholos Venditti*
Average annual total returns (%) as of December 31, 2020
| | | Including sales charge | | Excluding sales charge | | Expense ratios1 (%) |
| | Inception date | 1 year | 5 year | 10 year | | 1 year | 5 year | 10 year | | Gross | Net 2 |
| Class A (WFTAX) | 7-31-2007 | 0.79 | 2.19 | 3.40 | | 3.91 | 2.82 | 3.71 | | 0.79 | 0.70 |
| Class C (WFTFX) | 7-31-2007 | 2.13 | 2.05 | 2.94 | | 3.13 | 2.05 | 2.94 | | 1.54 | 1.45 |
| Class R6 (WFRTX)3 | 7-31-2018 | – | – | – | | 4.12 | 3.08 | 4.00 | | 0.41 | 0.40 |
| Administrator Class (WFITX) | 3-31-2008 | – | – | – | | 4.00 | 2.92 | 3.82 | | 0.73 | 0.60 |
| Institutional Class (WITIX) | 3-31-2008 | – | – | – | | 4.16 | 3.07 | 3.99 | | 0.46 | 0.45 |
| Bloomberg Barclays Municipal Bond 1-15 Year Index4 | – | – | – | – | | 4.73 | 3.39 | 3.84 | | – | – |
Figures quoted represent past performance, which is no guarantee of future results, and do not reflect taxes that a shareholder may pay on an investment in a fund. Investment return and principal value of an investment will fluctuate so that an investor’s shares, when redeemed, may be worth more or less than their original cost. Performance shown without sales charges would be lower if sales charges were reflected. Current performance may be lower or higher than the performance data quoted, which assumes the reinvestment of dividends and capital gains. Current month-end performance is available on the Fund’s website, wfam.com.
Index returns do not include transaction costs associated with buying and selling securities, any mutual fund fees or expenses, or any taxes. It is not possible to invest directly in an index.
For Class A shares, the maximum front-end sales charge is 3.00%. For Class C shares, the maximum contingent deferred sales charge is 1.00%. Performance including a contingent deferred sales charge assumes the sales charge for the corresponding time period. Class R6, Administrator Class, and Institutional Class shares are sold without a front-end sales charge or contingent deferred sales charge.
Bond values fluctuate in response to the financial condition of individual issuers, general market and economic conditions, and changes in interest rates. Changes in market conditions and government policies may lead to periods of heightened volatility in the bond market and reduced liquidity for certain bonds held by the Fund. In general, when interest rates rise, bond values fall and investors may lose principal value. Interest rate changes and their impact on the Fund and its share price can be sudden and unpredictable. The use of derivatives may reduce returns and/or increase volatility. Certain investment strategies tend to increase the total risk of an investment (relative to the broader market). The Fund is exposed to high-yield securities risk and municipal securities risk. Consult the Fund’s prospectus for additional information on these and other risks. A portion of the Fund’s income may be subject to federal, state, and/or local income taxes or the Alternative Minimum Tax (AMT). Any capital gains distributions may be taxable.
Please see footnotes on page 7.
6 | Wells Fargo Intermediate Tax/AMT-Free Fund
Performance highlights (unaudited)
| Effective maturity distribution as of December 31, 20205 |
| Credit quality as of December 31, 20206 |
| * | Mr. Venditti became a portfolio manager of the Fund on September 1, 2020. |
| 1 | Reflects the expense ratios as stated in the most recent prospectuses. The expense ratios shown are subject to change and may differ from the annualized expense ratios shown in the financial highlights of this report. |
| 2 | The manager has contractually committed through October 31, 2021, to waive fees and/or reimburse expenses to the extent necessary to cap total annual fund operating expenses after fee waivers at 0.70% for Class A, 1.45% for Class C, 0.40% for Class R6, 0.60% for Administrator Class, and 0.45% for Institutional Class. Brokerage commissions, stamp duty fees, interest, taxes, acquired fund fees and expenses (if any), and extraordinary expenses are excluded from the expense caps. Prior to or after the commitment expiration date, the caps may be increased or the commitment to maintain the caps may be terminated only with the approval of the Board of Trustees. Without these caps, the Fund’s returns would have been lower. The expense ratio paid by an investor is the net expense ratio (the total annual fund operating expenses after fee waivers) as stated in the prospectuses. |
| 3 | Historical performance shown for the Class R6 shares prior to their inception reflects the performance of the Institutional Class shares, and includes the higher expenses applicable to the Institutional Class shares. If these expenses had not been included, returns for the Class R6 shares would be higher. |
| 4 | The Bloomberg Barclays Municipal Bond 1–15 Year Blend Index is the 1–15 year component of the Bloomberg Barclays Municipal Bond Index. The Bloomberg Barclays Municipal Bond Index is an unmanaged index composed of long-term tax-exempt bonds with a minimum credit rating of Baa. You cannot invest directly in an index. |
| 5 | Figures represent the percentage of the Fund's long-term investments. These amounts are subject to change and may have changed since the date specified. |
| 6 | The credit quality distribution of portfolio holdings reflected in the chart is based on ratings from Standard & Poor’s, Moody’s Investors Service, and/ or Fitch Ratings Ltd. Credit quality ratings apply to the underlying holdings of the Fund and not to the Fund itself. The percentages of the Fund’s portfolio with the ratings depicted in the chart are calculated based on the total market value of fixed income securities held by the Fund. If a security was rated by all three rating agencies, the middle rating was utilized. If rated by two of three rating agencies, the lower rating was utilized, and if rated by one of the rating agencies, that rating was utilized. Standard & Poor’s rates the creditworthiness of bonds, ranging from AAA (highest) to D (lowest). Ratings from A to CCC may be modified by the addition of a plus (+) or minus (-) sign to show relative standing within the rating categories. Standard & Poor’s rates the creditworthiness of short-term notes from SP-1 (highest) to SP-3 (lowest). Moody’s rates the creditworthiness of bonds, ranging from Aaa (highest) to C (lowest). Ratings Aa to B may be modified by the addition of a number 1 (highest) to 3 (lowest) to show relative standing within the ratings categories. Moody’s rates the creditworthiness of short-term U.S. tax-exempt municipal securities from MIG 1/VMIG 1 (highest) to SG (lowest). Fitch rates the creditworthiness of bonds, ranging from AAA (highest) to D (lowest). Credit quality distribution is subject to change and may have changed since the date specified. |
Wells Fargo Intermediate Tax/AMT-Free Fund | 7
Fund expenses (unaudited)
As a shareholder of the Fund, you incur two types of costs: (1) transaction costs, including sales charges (loads) on purchase payments and contingent deferred sales charges (if any) on redemptions and (2) ongoing costs, including management fees, distribution (12b-1) and/or shareholder servicing fees, and other Fund expenses. This example is intended to help you understand your ongoing costs (in dollars) of investing in the Fund and to compare these costs with the ongoing costs of investing in other mutual funds.
The example is based on an investment of $1,000 invested at the beginning of the six-month period and held for the entire period from July 1, 2020 to December 31, 2020.
Actual expenses
The “Actual” line of the table below provides information about actual account values and actual expenses. You may use the information in this line, together with the amount you invested, to estimate the expenses that you paid over the period. Simply divide your account value by $1,000 (for example, an $8,600 account value divided by $1,000 = 8.6), then multiply the result by the number in the “Actual” line under the heading entitled “Expenses paid during period” for your applicable class of shares to estimate the expenses you paid on your account during this period.
Hypothetical example for comparison purposes
The “Hypothetical” line of the table below provides information about hypothetical account values and hypothetical expenses based on the Fund’s actual expense ratio and an assumed rate of return of 5% per year before expenses, which is not the Fund’s actual return. The hypothetical account values and expenses may not be used to estimate the actual ending account balance or expenses you paid for the period. You may use this information to compare the ongoing costs of investing in the Fund and other funds. To do so, compare this 5% hypothetical example with the 5% hypothetical examples that appear in the shareholder reports of the other funds.
Please note that the expenses shown in the table are meant to highlight your ongoing costs only and do not reflect any transactional costs, such as sales charges (loads) and contingent deferred sales charges. Therefore, the “Hypothetical” line of the table is useful in comparing ongoing costs only and will not help you determine the relative total costs of owning different funds. In addition, if these transactional costs were included, your costs would have been higher.
| | Beginning
account value
7-1-2020 | Ending
account value
12-31-2020 | Expenses
paid during
the period1 | Annualized net
expense ratio |
| Class A | | | | |
| Actual | $1,000.00 | $1,028.04 | $3.58 | 0.70% |
| Hypothetical (5% return before expenses) | $1,000.00 | $1,021.68 | $3.57 | 0.70% |
| Class C | | | | |
| Actual | $1,000.00 | $1,024.15 | $7.40 | 1.45% |
| Hypothetical (5% return before expenses) | $1,000.00 | $1,017.90 | $7.38 | 1.45% |
| Class R6 | | | | |
| Actual | $1,000.00 | $1,028.69 | $2.05 | 0.40% |
| Hypothetical (5% return before expenses) | $1,000.00 | $1,023.19 | $2.04 | 0.40% |
| Administrator Class | | | | |
| Actual | $1,000.00 | $1,028.53 | $3.07 | 0.60% |
| Hypothetical (5% return before expenses) | $1,000.00 | $1,022.18 | $3.06 | 0.60% |
| Institutional Class | | | | |
| Actual | $1,000.00 | $1,029.29 | $2.30 | 0.45% |
| Hypothetical (5% return before expenses) | $1,000.00 | $1,022.94 | $2.29 | 0.45% |
1 Expenses paid is equal to the annualized net expense ratio of each class multiplied by the average account value over the period, multiplied by the number of days in the most recent fiscal half-year divided by the number of days in the fiscal year (to reflect the one-half-year period).
8 | Wells Fargo Intermediate Tax/AMT-Free Fund
Portfolio of investments—December 31, 2020 (unaudited)
| | | Interest
rate | Maturity
date | Principal | Value |
| Municipal obligations: 98.71% | | | | | |
| Alabama: 1.31% | | | | | |
| Education revenue: 0.18% | | | | | |
| Auburn AL Refunding Bond Series A | | 4.00 | 6-1-2033 | $ 1,000,000 | 1,150,900 |
| University of West Alabama General Fee Bond (AGM Insured) | | 4.00 | 1-1-2033 | 595,000 | 710,603 |
| University of West Alabama General Fee Bond (AGM Insured) | | 4.00 | 1-1-2035 | 865,000 | 1,023,399 |
| University of West Alabama General Fee Bond (AGM Insured) | | 4.00 | 1-1-2037 | 920,000 | 1,080,844 |
| | | | | | 3,965,746 |
| Health revenue: 0.08% | | | | | |
| Alabama Health Care Authority for Baptist Health Series B ø | | 0.35 | 11-1-2042 | 1,835,000 | 1,835,000 |
| Utilities revenue: 1.05% | | | | | |
| Lower Alabama Gas Supply District Project #2 | | 4.00 | 12-1-2050 | 11,430,000 | 13,193,992 |
| Southeast Alabama Gas Supply District Project #2 Series B (1 Month LIBOR+0.85%)± | | 0.95 | 6-1-2049 | 10,000,000 | 9,984,000 |
| | | | | | 23,177,992 |
| | | | | | 28,978,738 |
| Alaska: 0.19% | | | | | |
| Miscellaneous revenue: 0.19% | | | | | |
| Matanuska Susitna Borough AK Goode Creek Correctional Project | | 4.00 | 9-1-2030 | 3,870,000 | 4,271,474 |
| Arizona: 2.13% | | | | | |
| Education revenue: 0.54% | | | | | |
| Arizona Board of Regents University of Arizona System Series A | | 5.00 | 6-1-2037 | 2,645,000 | 3,435,934 |
| McAllister AZ Arizona State University Hassayampa Academic Village Project | | 5.00 | 7-1-2025 | 750,000 | 900,038 |
| Pima County AZ Community College District Series 2019 | | 5.00 | 7-1-2033 | 450,000 | 573,237 |
| Pima County AZ Community College District Series 2019 | | 5.00 | 7-1-2034 | 500,000 | 635,455 |
| Pima County AZ Community College District Series 2019 | | 5.00 | 7-1-2035 | 600,000 | 760,944 |
| Pima County AZ Community College District Series 2019 | | 5.00 | 7-1-2036 | 500,000 | 632,255 |
| Pima County AZ IDA New Plan Learning Project Series A | | 7.00 | 7-1-2021 | 185,000 | 184,926 |
| Pima County AZ IDA New Plan Learning Project Series A | | 7.75 | 7-1-2035 | 4,910,000 | 4,897,234 |
| | | | | | 12,020,023 |
| GO revenue: 0.46% | | | | | |
| Estrella Mountain Ranch AZ Community Facilities District Refunding Bond (AGM Insured) | | 5.00 | 7-15-2025 | 585,000 | 696,928 |
The accompanying notes are an integral part of these financial statements.
Wells Fargo Intermediate Tax/AMT-Free Fund | 9
Portfolio of investments—December 31, 2020 (unaudited)
| | | Interest
rate | Maturity
date | Principal | Value |
| GO revenue (continued) | | | | | |
| Maricopa County AZ Elementary School District #28 Kyrene Elementary School Project 2010 Series B | | 4.50% | 7-1-2024 | $ 1,575,000 | $ 1,744,313 |
| Maricopa County AZ Elementary School District #28 Kyrene Elementary School Project 2010 Series B | | 4.50 | 7-1-2025 | 1,270,000 | 1,406,525 |
| Maricopa County AZ Elementary School District #28 Kyrene Elementary School Project 2010 Series B | | 5.00 | 7-1-2027 | 420,000 | 470,362 |
| Maricopa County AZ Elementary School District #28 Kyrene Elementary School Project 2010 Series B | | 5.50 | 7-1-2029 | 960,000 | 1,087,027 |
| Phoenix AZ | | 5.00 | 7-1-2026 | 3,810,000 | 4,780,864 |
| | | | | | 10,186,019 |
| Miscellaneous revenue: 0.56% | | | | | |
| Arizona Refunding Bond Certificate of Participation | | 5.00 | 9-1-2027 | 3,040,000 | 3,662,197 |
| Phoenix AZ Civic Improvement Corporation Series D | | 5.00 | 7-1-2024 | 190,000 | 219,355 |
| Phoenix AZ Civic Improvement Corporation Series D | | 5.00 | 7-1-2036 | 7,000,000 | 8,536,500 |
| | | | | | 12,418,052 |
| Tax revenue: 0.33% | | | | | |
| Arizona Sports & Tourism Authority Series A | | 5.00 | 7-1-2021 | 795,000 | 809,366 |
| Arizona Sports & Tourism Authority Series A | | 5.00 | 7-1-2022 | 1,000,000 | 1,054,380 |
| San Luis AZ Pledged Excise Tax Series A (BAM Insured) | | 5.00 | 7-1-2027 | 450,000 | 513,644 |
| San Luis AZ Pledged Excise Tax Series A (BAM Insured) | | 5.00 | 7-1-2028 | 700,000 | 796,411 |
| San Luis AZ Pledged Excise Tax Series A (BAM Insured) | | 5.00 | 7-1-2034 | 3,680,000 | 4,119,539 |
| | | | | | 7,293,340 |
| Utilities revenue: 0.12% | | | | | |
| Salt River Project AZ Electric System Revenue Bond 2017 Series A | | 5.00 | 1-1-2034 | 2,000,000 | 2,554,900 |
| Water & sewer revenue: 0.12% | | | | | |
| Glendale AZ Subordinate Lien Water & Sewer Refunding Bond | | 5.00 | 7-1-2028 | 1,000,000 | 1,317,390 |
| Glendale AZ Subordinate Lien Water & Sewer Refunding Bond | | 5.00 | 7-1-2029 | 1,000,000 | 1,348,670 |
| | | | | | 2,666,060 |
| | | | | | 47,138,394 |
| Arkansas: 0.18% | | | | | |
| Miscellaneous revenue: 0.18% | | | | | |
| Arkansas Development Finance Authority Arkansas Division of Emergency Management Project | | 4.00 | 6-1-2030 | 500,000 | 595,845 |
| Arkansas Development Finance Authority Arkansas Division of Emergency Management Project | | 4.00 | 6-1-2032 | 500,000 | 589,805 |
| Arkansas Development Finance Authority Arkansas Division of Emergency Management Project | | 4.00 | 6-1-2033 | 500,000 | 587,240 |
The accompanying notes are an integral part of these financial statements.
10 | Wells Fargo Intermediate Tax/AMT-Free Fund
Portfolio of investments—December 31, 2020 (unaudited)
| | | Interest
rate | Maturity
date | Principal | Value |
| Miscellaneous revenue (continued) | | | | | |
| Arkansas Development Finance Authority Arkansas Division of Emergency Management Project | | 4.00% | 6-1-2035 | $ 1,000,000 | $ 1,170,940 |
| Arkansas Development Finance Authority Arkansas Division of Emergency Management Project | | 4.00 | 6-1-2036 | 850,000 | 993,132 |
| | | | | | 3,936,962 |
| California: 6.23% | | | | | |
| Airport revenue: 0.41% | | | | | |
| Sacramento CA Airport System Senior Bond Series A | | 5.00 | 7-1-2026 | 1,315,000 | 1,632,283 |
| Sacramento CA Airport System Senior Bond Series A | | 5.00 | 7-1-2041 | 395,000 | 468,367 |
| Sacramento CA Airport System Senior Bond Series B | | 5.00 | 7-1-2032 | 600,000 | 757,848 |
| Sacramento CA Airport System Senior Bond Series B | | 5.00 | 7-1-2033 | 500,000 | 628,770 |
| Sacramento CA Airport System Senior Bond Series B | | 5.00 | 7-1-2034 | 1,000,000 | 1,254,630 |
| Sacramento CA Airport System Senior Bond Series E | | 5.00 | 7-1-2026 | 750,000 | 924,105 |
| Sacramento CA Airport System Senior Bond Series E | | 5.00 | 7-1-2027 | 1,750,000 | 2,208,185 |
| Sacramento CA Airport System Senior Bond Series E | | 5.00 | 7-1-2028 | 1,000,000 | 1,287,850 |
| | | | | | 9,162,038 |
| Education revenue: 0.33% | | | | | |
| California Statewide CDA Series A | | 6.90 | 8-1-2031 | 1,670,000 | 1,720,284 |
| University of California General Project Unrefunded Bond Series Q | | 5.25 | 5-15-2024 | 65,000 | 65,237 |
| University of California Limited Project Unrefunded Bond Series G | | 5.00 | 5-15-2037 | 5,210,000 | 5,537,917 |
| | | | | | 7,323,438 |
| GO revenue: 3.12% | | | | | |
| California Series A (State Street Bank & Trust Company LOC)ø | | 0.15 | 5-1-2048 | 1,500,000 | 1,500,000 |
| California Various Purposes | | 5.00 | 8-1-2030 | 1,575,000 | 1,952,937 |
| California Various Purposes | | 5.00 | 8-1-2032 | 6,700,000 | 8,278,721 |
| Cerritos CA Community College District CAB Series D ¤ | | 0.00 | 8-1-2025 | 1,800,000 | 1,746,558 |
| Compton CA Community College District Election of 2002 CAB Series C ¤ | | 0.00 | 8-1-2029 | 1,565,000 | 1,390,862 |
| Compton CA Community College District Election of 2002 CAB Series C ¤ | | 0.00 | 8-1-2031 | 2,400,000 | 2,027,424 |
| Emery CA Unified School District Election of 2010 Series A (AGM Insured) | | 6.25 | 8-1-2031 | 4,500,000 | 4,658,265 |
| Los Angeles CA Unified School District Los Angeles County Series RYQ | | 4.00 | 7-1-2037 | 2,000,000 | 2,463,460 |
| Monterey County CA Alisal Union School District Series A (BAM Insured) | | 5.25 | 8-1-2042 | 1,500,000 | 1,836,900 |
| New Haven CA Unified School District CAB Project (AGC Insured)¤ | | 0.00 | 8-1-2033 | 5,590,000 | 4,460,093 |
| Northern Humboldt CA High School District Election of 2010 Series A | | 6.50 | 8-1-2034 | 1,145,000 | 1,186,632 |
| Oakland CA Unified School District Alameda County Election of 2012 | | 6.25 | 8-1-2028 | 2,000,000 | 2,069,760 |
| Oakland CA Unified School District Alameda County Election of 2012 | | 6.25 | 8-1-2030 | 2,000,000 | 2,069,760 |
| Oxnard CA School District Series A (National Insured) | | 5.75 | 8-1-2030 | 1,825,000 | 1,987,644 |
| Patterson CA Unified School District CAB Election of 2008 Project Series B (AGM Insured)¤ | | 0.00 | 8-1-2033 | 3,000,000 | 2,387,640 |
The accompanying notes are an integral part of these financial statements.
Wells Fargo Intermediate Tax/AMT-Free Fund | 11
Portfolio of investments—December 31, 2020 (unaudited)
| | | Interest
rate | Maturity
date | Principal | Value |
| GO revenue (continued) | | | | | |
| Peralta CA Community College District Alameda County | | 5.00% | 8-1-2023 | $ 3,045,000 | $ 3,272,522 |
| Peralta CA Community College District Alameda County | | 5.00 | 8-1-2024 | 3,000,000 | 3,223,650 |
| Rio Hondo CA Community College District ¤ | | 0.00 | 8-1-2030 | 2,315,000 | 2,023,889 |
| San Diego CA Community College District Election of 2012 | | 5.00 | 8-1-2032 | 3,095,000 | 3,475,964 |
| San Diego CA Unified School District Election of 1998 Series E-2 (AGM Insured) | | 5.50 | 7-1-2027 | 5,000,000 | 6,629,900 |
| Sylvan CA Unified School District CAB Election of 2006 (AGM Insured)¤ | | 0.00 | 8-1-2031 | 2,590,000 | 2,187,928 |
| Sylvan CA Unified School District CAB Election of 2006 (AGM Insured)¤ | | 0.00 | 8-1-2032 | 2,800,000 | 2,299,584 |
| Tustin CA Unified School District #88-1 Election of 2008 Series B | | 6.00 | 8-1-2036 | 1,500,000 | 1,550,610 |
| West Contra Costa CA Unified School District Election of 2005 Series C-1 (AGC Insured)¤ | | 0.00 | 8-1-2026 | 4,620,000 | 4,410,899 |
| | | | | | 69,091,602 |
| Health revenue: 0.92% | | | | | |
| California Municipal Finance Authority Institute of Aging Project | | 5.00 | 8-15-2032 | 975,000 | 1,217,366 |
| California Municipal Finance Authority Institute of Aging Project | | 5.00 | 8-15-2033 | 1,150,000 | 1,430,543 |
| California Statewide CDA Series C | | 5.25 | 8-15-2031 | 3,000,000 | 3,093,600 |
| University of California Medical Center Prerefunded Bond Series J | | 5.25 | 5-15-2030 | 13,135,000 | 14,666,804 |
| | | | | | 20,408,313 |
| Housing revenue: 0.05% | | | | | |
| California HFA Municipal Certificate of Participation Series 2 Class A | | 4.00 | 3-20-2033 | 984,880 | 1,109,940 |
| Miscellaneous revenue: 0.31% | | | | | |
| Anaheim CA PFA Convention Center Expansion Project Series A | | 5.00 | 5-1-2039 | 2,500,000 | 2,770,625 |
| California Public Works Board Various Judicial Council Project Series D | | 5.25 | 12-1-2026 | 1,000,000 | 1,046,510 |
| Foothill De Anza CA Community College District Certificate of Participation | | 5.00 | 4-1-2033 | 500,000 | 578,850 |
| Gold Coast Transit District California Transit Finance Corporation Certificate of Participation | | 5.00 | 7-1-2027 | 520,000 | 654,654 |
| San Diego CA Public Facilities Financing Authority Capital Improvement Projects Series B | | 5.00 | 10-15-2027 | 500,000 | 603,880 |
| San Diego CA Public Facilities Financing Authority Capital Improvement Projects Series B | | 5.00 | 10-15-2028 | 1,000,000 | 1,205,140 |
| | | | | | 6,859,659 |
| Tax revenue: 0.14% | | | | | |
| Santa Clara Valley CA Transportation Series B (TD Bank NA SPA)ø | | 0.06 | 4-1-2036 | 3,000,000 | 3,000,000 |
| Transportation revenue: 0.45% | | | | | |
| Bay Area CA Toll Authority Toll Bridge Series A (SIFMA Municipal Swap+1.25%)± | | 1.34 | 4-1-2036 | 9,810,000 | 9,951,755 |
The accompanying notes are an integral part of these financial statements.
12 | Wells Fargo Intermediate Tax/AMT-Free Fund
Portfolio of investments—December 31, 2020 (unaudited)
| | | Interest
rate | Maturity
date | Principal | Value |
| Utilities revenue: 0.50% | | | | | |
| California Municipal Finance Authority | | 5.00% | 10-1-2025 | $ 1,500,000 | $ 1,833,585 |
| M-S-R California Energy Authority Gas Series B | | 7.00 | 11-1-2034 | 2,035,000 | 3,260,843 |
| M-S-R California Energy Authority Gas Series C | | 7.00 | 11-1-2034 | 3,000,000 | 4,807,140 |
| Sacramento CA Municipal Utility District Series B | | 5.00 | 8-15-2030 | 1,075,000 | 1,202,667 |
| | | | | | 11,104,235 |
| | | | | | 138,010,980 |
| Colorado: 1.01% | | | | | |
| Education revenue: 0.06% | | | | | |
| Colorado ECFA University of Denver Project (National Insured) | | 5.25 | 3-1-2025 | 1,110,000 | 1,277,699 |
| GO revenue: 0.34% | | | | | |
| Adams County CO 12 Five Star Schools Series B | | 5.00 | 12-15-2028 | 3,800,000 | 4,799,134 |
| Mesa County CO Valley School District # 51 Grand Junction | | 5.50 | 12-1-2035 | 2,175,000 | 2,833,699 |
| | | | | | 7,632,833 |
| Industrial development revenue: 0.15% | | | | | |
| Denver CO Convention Center Hotel Authority Refunding Bond | | 5.00 | 12-1-2023 | 3,000,000 | 3,312,000 |
| Miscellaneous revenue: 0.25% | | | | | |
| Regents of the University of Colorado Certificate of Participation Series A | | 5.00 | 11-1-2028 | 5,000,000 | 5,598,800 |
| Tax revenue: 0.15% | | | | | |
| Colorado Regional Transportation District Denver Transit Partners Eagle P3 Project Series A & B | | 5.00 | 7-15-2028 | 885,000 | 1,127,472 |
| Colorado Regional Transportation District Denver Transit Partners Eagle P3 Project Series A & B | | 5.00 | 1-15-2029 | 600,000 | 770,538 |
| Colorado Regional Transportation District Denver Transit Partners Eagle P3 Project Series A & B | | 5.00 | 1-15-2030 | 1,000,000 | 1,309,650 |
| | | | | | 3,207,660 |
| Water & sewer revenue: 0.06% | | | | | |
| Central Weld County CO Water District Revenue Bond (AGM Insured) | | 4.00 | 12-1-2031 | 550,000 | 694,370 |
| Central Weld County CO Water District Revenue Bond (AGM Insured) | | 4.00 | 12-1-2033 | 500,000 | 622,905 |
| | | | | | 1,317,275 |
| | | | | | 22,346,267 |
| Connecticut: 1.61% | | | | | |
| Education revenue: 0.48% | | | | | |
| Connecticut HEFAR University of Hartford Issue Series N | | 5.00 | 7-1-2029 | 480,000 | 570,773 |
| Connecticut HEFAR University of Hartford Issue Series N | | 5.00 | 7-1-2030 | 870,000 | 1,025,678 |
| Connecticut Higher Education Supplemental Loan Authority Chesla Loan Program Series D | | 3.00 | 11-15-2035 | 1,000,000 | 1,044,010 |
The accompanying notes are an integral part of these financial statements.
Wells Fargo Intermediate Tax/AMT-Free Fund | 13
Portfolio of investments—December 31, 2020 (unaudited)
| | | Interest
rate | Maturity
date | Principal | Value |
| Education revenue (continued) | | | | | |
| University of Connecticut Series A | | 5.00% | 3-15-2032 | $ 4,355,000 | $ 5,206,098 |
| University of Connecticut Series A | | 5.00 | 2-15-2038 | 2,210,000 | 2,875,542 |
| | | | | | 10,722,101 |
| GO revenue: 0.93% | | | | | |
| Bridgeport CT Series A | | 5.00 | 6-1-2031 | 1,855,000 | 2,281,465 |
| Connecticut Series A | | 5.00 | 3-1-2029 | 2,500,000 | 2,830,000 |
| Connecticut Series B | | 5.00 | 6-15-2027 | 3,000,000 | 3,578,010 |
| Connecticut Series F | | 5.00 | 11-15-2032 | 300,000 | 356,115 |
| Hamden CT (AGM Insured) | | 5.00 | 8-15-2022 | 1,000,000 | 1,060,280 |
| Hamden CT Refunding Bond Series A (BAM Insured) | | 5.00 | 8-15-2029 | 500,000 | 621,560 |
| Hamden CT Refunding Bond Series A (BAM Insured) | | 5.00 | 8-15-2030 | 1,200,000 | 1,484,340 |
| Hamden CT Series A (BAM Insured) | | 5.00 | 8-15-2026 | 2,000,000 | 2,398,260 |
| Hamden CT Series A (BAM Insured) | | 5.00 | 8-15-2027 | 1,200,000 | 1,472,820 |
| Hartford CT Series A (AGM Insured) | | 5.00 | 4-1-2022 | 3,010,000 | 3,176,664 |
| Hartford CT Series A (AGM Insured) | | 5.00 | 7-1-2026 | 1,050,000 | 1,256,189 |
| | | | | | 20,515,703 |
| Miscellaneous revenue: 0.10% | | | | | |
| Connecticut Series G | | 4.00 | 10-15-2026 | 1,985,000 | 2,107,951 |
| Tax revenue: 0.10% | | | | | |
| Connecticut Special Tax Obligation Bonds Series A | | 4.00 | 9-1-2036 | 1,000,000 | 1,129,740 |
| Connecticut Special Tax Obligation Bonds Transportation Infrastructure Purposes Series A | | 5.00 | 8-1-2030 | 1,000,000 | 1,183,720 |
| | | | | | 2,313,460 |
| | | | | | 35,659,215 |
| Delaware: 0.10% | | | | | |
| Education revenue: 0.10% | | | | | |
| Delaware EDA Odyssey Charter School Project Series B 144A | | 6.75 | 9-1-2035 | 2,000,000 | 2,257,500 |
| District of Columbia: 1.57% | | | | | |
| Education revenue: 0.11% | | | | | |
| District of Columbia Howard University Series A | | 5.75 | 10-1-2026 | 2,510,000 | 2,543,007 |
| GO revenue: 0.65% | | | | | |
| District of Columbia Series 2014C | | 5.00 | 6-1-2034 | 3,000,000 | 3,440,550 |
| District of Columbia Series 2014C | | 5.00 | 6-1-2035 | 1,620,000 | 1,855,532 |
| District of Columbia Series 2016A | | 5.00 | 6-1-2033 | 5,000,000 | 6,119,300 |
| District of Columbia Series 2017A | | 5.00 | 6-1-2033 | 2,400,000 | 3,020,400 |
| | | | | | 14,435,782 |
| Miscellaneous revenue: 0.44% | | | | | |
| District of Columbia Federal Highway Grant Anticipation Bond | | 5.00 | 12-1-2025 | 3,520,000 | 3,828,106 |
| District of Columbia Federal Highway Grant Anticipation Bond | | 5.25 | 12-1-2025 | 2,630,000 | 2,639,258 |
| District of Columbia Medical Association of Colleges Series B | | 5.00 | 10-1-2024 | 3,095,000 | 3,206,513 |
| | | | | | 9,673,877 |
The accompanying notes are an integral part of these financial statements.
14 | Wells Fargo Intermediate Tax/AMT-Free Fund
Portfolio of investments—December 31, 2020 (unaudited)
| | | Interest
rate | Maturity
date | Principal | Value |
| Transportation revenue: 0.24% | | | | | |
| Washington Metropolitan Airport Authority Dulles Toll Road Series B | | 5.00% | 10-1-2034 | $ 1,250,000 | $ 1,580,063 |
| Washington Metropolitan Area Transit Authority Series B | | 5.00 | 7-1-2032 | 3,000,000 | 3,747,510 |
| | | | | | 5,327,573 |
| Water & sewer revenue: 0.13% | | | | | |
| District of Columbia Water & Sewer Authority Public Utility Senior Lien Series A | | 5.00 | 10-1-2037 | 2,260,000 | 2,883,489 |
| | | | | | 34,863,728 |
| Florida: 5.59% | | | | | |
| Airport revenue: 0.83% | | | | | |
| Hillsborough FL Aviation Authority Tampa International Airport Customer Facility Series A | | 5.00 | 10-1-2044 | 8,335,000 | 9,219,344 |
| Jacksonville FL Port Authority Series B | | 5.00 | 11-1-2035 | 2,045,000 | 2,567,354 |
| Miami-Dade County FL Aviation Refunding Bond Series A | | 4.00 | 10-1-2035 | 1,600,000 | 1,932,224 |
| Miami-Dade County FL Aviation Refunding Bond Series A | | 4.00 | 10-1-2036 | 1,700,000 | 2,045,202 |
| Miami-Dade County FL Aviation Refunding Bond Series A | | 4.00 | 10-1-2037 | 2,250,000 | 2,698,245 |
| | | | | | 18,462,369 |
| Education revenue: 0.05% | | | | | |
| Florida HEFAR | | 4.00 | 4-1-2021 | 1,000,000 | 1,008,970 |
| Health revenue: 0.61% | | | | | |
| Florida Health System Lee Memorial Hospital Series A | | 5.00 | 4-1-2036 | 4,500,000 | 5,743,305 |
| Highlands County FL HFA Adventist Health System Series I5 ø | | 0.09 | 11-15-2035 | 2,000,000 | 2,000,000 |
| Lee Memorial Health System Series B ø | | 0.22 | 4-1-2049 | 1,800,000 | 1,800,000 |
| Miami-Dade County FL Health Facilities Authority Nicklaus Children's Hospital Project | | 5.00 | 8-1-2031 | 500,000 | 612,215 |
| Miami-Dade County FL Health Facilities Authority Nicklaus Children's Hospital Project | | 5.00 | 8-1-2033 | 1,645,000 | 1,997,820 |
| Orange County FL Health Facilities Authority Lakeside Behavioral Healthcare Incorporated Project (Truist Bank LOC)ø | | 0.12 | 7-1-2027 | 1,430,000 | 1,430,000 |
| | | | | | 13,583,340 |
| Miscellaneous revenue: 2.23% | | | | | |
| Boynton FL PFA Capital Improvement Series 2018 | | 4.00 | 7-1-2030 | 2,090,000 | 2,440,451 |
| Boynton FL PFA Capital Improvement Series 2018 | | 5.00 | 7-1-2035 | 3,590,000 | 4,517,907 |
| Cityplace Florida Community Development District Special Assessment | | 5.00 | 5-1-2021 | 2,945,000 | 2,988,085 |
| Duval County FL School Board Certificate of Participation Series B | | 5.00 | 7-1-2028 | 2,500,000 | 2,965,850 |
| Duval County FL School Board Certificate of Participation Series B | | 5.00 | 7-1-2029 | 5,000,000 | 5,929,250 |
| Miami-Dade County FL School Board Certificate of Participation Series A | | 5.00 | 5-1-2031 | 3,000,000 | 3,441,720 |
| Miami-Dade County FL School Board Certificate of Participation Series D | | 5.00 | 11-1-2027 | 6,600,000 | 7,698,834 |
The accompanying notes are an integral part of these financial statements.
Wells Fargo Intermediate Tax/AMT-Free Fund | 15
Portfolio of investments—December 31, 2020 (unaudited)
| | | Interest
rate | Maturity
date | Principal | Value |
| Miscellaneous revenue (continued) | | | | | |
| Monroe County FL School Board Certificate of Participation Series A | | 5.00% | 6-1-2034 | $ 1,500,000 | $ 1,848,945 |
| Monroe County FL School Board Certificate of Participation Series A | | 5.00 | 6-1-2035 | 1,000,000 | 1,229,820 |
| Orange County FL School Board Certificate of Participation Series C | | 5.00 | 8-1-2029 | 2,000,000 | 2,385,280 |
| Orlando FL Senior Tourist Development 6th Cent Contract Payment Bond Series A (AGM Insured) | | 5.00 | 11-1-2032 | 2,000,000 | 2,481,580 |
| Orlando FL Senior Tourist Development 6th Cent Contract Payment Bond Series A (AGM Insured) | | 5.00 | 11-1-2033 | 4,500,000 | 5,551,425 |
| Orlando FL Senior Tourist Development 6th Cent Contract Payment Bond Series A (AGM Insured) | | 5.00 | 11-1-2034 | 600,000 | 737,760 |
| Palm Beach County FL Refunding Bond | | 5.00 | 5-1-2029 | 2,000,000 | 2,463,200 |
| University of South Florida Financing Corporation Certificate of Participation Master Lease Program Series A | | 5.00 | 7-1-2022 | 1,730,000 | 1,838,661 |
| University of South Florida Financing Corporation Certificate of Participation Master Lease Program Series A | | 5.00 | 7-1-2023 | 815,000 | 899,850 |
| | | | | | 49,418,618 |
| Tax revenue: 0.50% | | | | | |
| Miami-Dade County FL Public Services (AGM Insured) | | 4.00 | 4-1-2021 | 2,485,000 | 2,507,837 |
| Miami-Dade County FL Special Obligation Series A | | 5.00 | 10-1-2023 | 700,000 | 758,933 |
| Polk County FL School District | | 5.00 | 10-1-2033 | 2,915,000 | 3,816,435 |
| Tampa FL Sports Authority Stadium Project | | 5.00 | 1-1-2025 | 3,550,000 | 4,038,196 |
| | | | | | 11,121,401 |
| Transportation revenue: 0.49% | | | | | |
| Florida Department of Transportation Turnpike System Series A | | 5.00 | 7-1-2025 | 4,950,000 | 5,994,252 |
| Florida Mid-Bay Bridge Authority Series A | | 5.00 | 10-1-2025 | 1,250,000 | 1,474,263 |
| Miami-Dade County FL Expressway Authority Toll System (AGM Insured, Citibank NA LIQ)144Aø | | 0.29 | 7-1-2035 | 1,050,000 | 1,050,000 |
| Osceola County FL Transportation Improvement and Refunding Bond Series A-1 | | 5.00 | 10-1-2034 | 375,000 | 467,794 |
| Osceola County FL Transportation Improvement and Refunding Bond Series A-1 | | 5.00 | 10-1-2035 | 400,000 | 496,932 |
| Osceola County FL Transportation Improvement and Refunding Bond Series A-1 | | 5.00 | 10-1-2036 | 600,000 | 742,296 |
| Osceola County FL Transportation Improvement and Refunding Bond Series A-1 | | 5.00 | 10-1-2037 | 525,000 | 647,336 |
| | | | | | 10,872,873 |
| Water & sewer revenue: 0.88% | | | | | |
| North Sumter County FL Utility Dependent District Bond (BAM Insured) | | 5.00 | 10-1-2031 | 500,000 | 664,840 |
| North Sumter County FL Utility Dependent District Bond (BAM Insured) | | 5.00 | 10-1-2032 | 950,000 | 1,255,758 |
| North Sumter County FL Utility Dependent District Bond (BAM Insured) | | 5.00 | 10-1-2035 | 1,290,000 | 1,689,307 |
The accompanying notes are an integral part of these financial statements.
16 | Wells Fargo Intermediate Tax/AMT-Free Fund
Portfolio of investments—December 31, 2020 (unaudited)
| | | Interest
rate | Maturity
date | Principal | Value |
| Water & sewer revenue (continued) | | | | | |
| North Sumter County FL Utility Dependent District Bond (BAM Insured) | | 5.00% | 10-1-2036 | $ 880,000 | $ 1,148,497 |
| Tohopekaliga FL Water Authority Utility System Bond 144A | | 5.00 | 10-1-2025 | 12,000,000 | 14,687,760 |
| | | | | | 19,446,162 |
| | | | | | 123,913,733 |
| Georgia: 2.31% | | | | | |
| Education revenue: 0.15% | | | | | |
| Private Colleges & Universities Authority of Georgia Series A | | 5.00 | 10-1-2021 | 3,330,000 | 3,415,748 |
| Health revenue: 0.08% | | | | | |
| Brookhaven GA Development Authority Children's Healthcare Series A | | 5.00 | 7-1-2035 | 1,300,000 | 1,684,384 |
| Utilities revenue: 2.08% | | | | | |
| Bartow County GA Development Authority Georgia Power Company Plant Bowen Project | | 1.55 | 8-1-2043 | 3,000,000 | 3,047,880 |
| Burke County GA Development Authority Georgia Power Company Plant Vogtle Project | | 2.25 | 10-1-2032 | 4,800,000 | 4,967,088 |
| Burke County GA Development Authority Oglethorpe Power Corporation Vogtle Project Series A | | 1.50 | 1-1-2040 | 3,000,000 | 3,063,210 |
| Burke County GA Development Authority Oglethorpe Power Corporation Vogtle Project Series E | | 3.25 | 11-1-2045 | 6,000,000 | 6,545,220 |
| Dalton GA Utilities Bond | | 4.00 | 3-1-2033 | 1,100,000 | 1,332,056 |
| Dalton GA Utilities Bond | | 4.00 | 3-1-2034 | 1,200,000 | 1,439,928 |
| Georgia Municipal Electric Authority General Resolution Project Series A | | 4.00 | 1-1-2036 | 1,500,000 | 1,803,360 |
| Georgia Municipal Electric Authority Project One Series A | | 5.00 | 1-1-2035 | 925,000 | 1,168,210 |
| Georgia Municipal Electric Authority Units 3 & 4 Project Series A | | 5.00 | 1-1-2032 | 525,000 | 662,792 |
| Georgia Municipal Electric Authority Units 3 & 4 Project Series A | | 5.00 | 1-1-2034 | 930,000 | 1,163,811 |
| Georgia Municipal Electric Authority Units 3 & 4 Project Series A | | 5.00 | 1-1-2035 | 600,000 | 749,874 |
| Main Street Natural Gas Incorporated Georgia Gas Project Series A | | 5.00 | 5-15-2029 | 2,600,000 | 3,315,000 |
| Main Street Natural Gas Incorporated Georgia Gas Project Series A | | 5.50 | 9-15-2022 | 1,000,000 | 1,085,510 |
| Main Street Natural Gas Incorporated Georgia Gas Project Series C (Royal Bank of Canada LIQ) | | 4.00 | 8-1-2048 | 2,500,000 | 2,741,825 |
| Main Street Natural Gas Incorporated Georgia Gas Project Subordinate Bond Series B (1 Month LIBOR+0.75%)± | | 0.85 | 4-1-2048 | 10,000,000 | 10,016,900 |
| Monroe County GA Development Authority Pollution Control Gulf Power Company Plant Scherer Project ø | | 0.13 | 6-1-2049 | 3,000,000 | 3,000,000 |
| | | | | | 46,102,664 |
| | | | | | 51,202,796 |
The accompanying notes are an integral part of these financial statements.
Wells Fargo Intermediate Tax/AMT-Free Fund | 17
Portfolio of investments—December 31, 2020 (unaudited)
| | | Interest
rate | Maturity
date | Principal | Value |
| Guam: 0.23% | | | | | |
| Airport revenue: 0.10% | | | | | |
| Guam International Airport Authority | | 5.00% | 10-1-2022 | $ 1,000,000 | $ 1,045,900 |
| Guam International Airport Authority | | 5.00 | 10-1-2023 | 1,135,000 | 1,185,973 |
| | | | | | 2,231,873 |
| Water & sewer revenue: 0.13% | | | | | |
| Guam Government Waterworks Authority | | 5.25 | 7-1-2033 | 2,500,000 | 2,808,625 |
| | | | | | 5,040,498 |
| Hawaii: 0.10% | | | | | |
| Airport revenue: 0.10% | | | | | |
| Hawaii Harbor System Series C | | 4.00 | 7-1-2035 | 635,000 | 778,796 |
| Hawaii Harbor System Series C | | 4.00 | 7-1-2036 | 500,000 | 610,960 |
| Hawaii Harbor System Series C | | 4.00 | 7-1-2037 | 600,000 | 730,704 |
| | | | | | 2,120,460 |
| Illinois: 16.19% | | | | | |
| Airport revenue: 1.73% | | | | | |
| Chicago IL Midway Airport Second Lien Refunding Bond Series B | | 4.00 | 1-1-2035 | 2,860,000 | 3,128,039 |
| Chicago IL O'Hare International Airport Senior Lien (AGM Insured) | | 5.13 | 1-1-2030 | 2,610,000 | 2,837,853 |
| Chicago IL O'Hare International Airport Senior Lien (AGM Insured) | | 5.13 | 1-1-2031 | 3,335,000 | 3,619,909 |
| Chicago IL O'Hare International Airport Senior Lien Series A | | 4.00 | 1-1-2038 | 1,000,000 | 1,173,360 |
| Chicago IL O'Hare International Airport Senior Lien Series B | | 5.00 | 1-1-2030 | 8,025,000 | 9,307,877 |
| Chicago IL O'Hare International Airport Senior Lien Series B | | 5.00 | 1-1-2036 | 1,530,000 | 1,915,927 |
| Chicago IL O'Hare International Airport Senior Lien Series D | | 5.25 | 1-1-2032 | 8,755,000 | 9,495,410 |
| Chicago IL O'Hare International Airport Third Lien Series A | | 5.75 | 1-1-2039 | 4,065,000 | 4,065,000 |
| Peoria IL Metropolitan Airport Authority Series D | | 5.00 | 12-1-2027 | 2,250,000 | 2,754,540 |
| | | | | | 38,297,915 |
| Education revenue: 0.51% | | | | | |
| Illinois Finance Authority Academic Facilities University of Illinois at Urbana-Champaign Project Series A | | 5.00 | 10-1-2026 | 450,000 | 539,532 |
| Illinois Finance Authority Academic Facilities University of Illinois at Urbana-Champaign Project Series A | | 5.00 | 10-1-2031 | 400,000 | 497,472 |
| Illinois Finance Authority Academic Facilities University of Illinois at Urbana-Champaign Project Series A | | 5.00 | 10-1-2039 | 700,000 | 843,353 |
| Illinois Finance Authority Bradley University Project Series C | | 5.00 | 8-1-2032 | 2,500,000 | 2,888,275 |
| Illinois Finance Authority Student Housing Illinois State University Project | | 5.50 | 4-1-2021 | 990,000 | 1,002,058 |
| Illinois Finance Authority Wesleyan University | | 5.00 | 9-1-2026 | 680,000 | 800,408 |
| Northern Illinois University Board of Trustees Certificate of Participation (AGM Insured) | | 5.00 | 9-1-2022 | 1,325,000 | 1,410,436 |
The accompanying notes are an integral part of these financial statements.
18 | Wells Fargo Intermediate Tax/AMT-Free Fund
Portfolio of investments—December 31, 2020 (unaudited)
| | | Interest
rate | Maturity
date | Principal | Value |
| Education revenue (continued) | | | | | |
| Northern Illinois University Board of Trustees Certificate of Participation (AGM Insured) | | 5.00% | 9-1-2024 | $ 1,000,000 | $ 1,144,120 |
| University of Illinois Board of Trustees Auxiliary Facilities System Refunding Bond | | 4.00 | 4-1-2030 | 2,000,000 | 2,119,260 |
| | | | | | 11,244,914 |
| GO revenue: 4.32% | | | | | |
| Bolingbrook, Will & Dupage Counties Refunding Bond Series A (AGM Insured) | | 5.00 | 1-1-2023 | 85,000 | 92,916 |
| Bolingbrook, Will & Dupage Counties Refunding Bond Series A (AGM Insured) | | 5.00 | 1-1-2023 | 565,000 | 618,093 |
| Chicago IL Board of Education CAB School Reform Series B-1 (National Insured)¤ | | 0.00 | 12-1-2025 | 3,380,000 | 3,018,915 |
| Chicago IL Board of Education CAB School Reform Series B-1 (National Insured)¤ | | 0.00 | 12-1-2026 | 4,030,000 | 3,486,111 |
| Chicago IL CAB Series C ¤ | | 0.00 | 1-1-2023 | 2,500,000 | 2,360,975 |
| Chicago IL Metropolitan Reclamation Series B | | 5.00 | 12-1-2025 | 2,500,000 | 2,605,950 |
| Chicago IL Park District Series A | | 5.00 | 1-1-2036 | 2,250,000 | 2,311,043 |
| Chicago IL Park District Series B | | 5.00 | 1-1-2021 | 3,765,000 | 3,765,000 |
| Chicago IL Park District Series B (BAM Insured) | | 5.00 | 1-1-2029 | 2,000,000 | 2,211,200 |
| Chicago IL Park District Series C | | 5.00 | 1-1-2022 | 1,615,000 | 1,671,573 |
| Chicago IL Series A | | 5.00 | 1-1-2025 | 750,000 | 811,950 |
| Chicago IL Series C | | 5.00 | 1-1-2026 | 6,300,000 | 7,063,560 |
| Cook County IL Community College District #508 | | 5.25 | 12-1-2025 | 1,665,000 | 1,792,339 |
| Cook County IL Community College District #508 | | 5.25 | 12-1-2027 | 1,295,000 | 1,389,082 |
| Cook County IL Community College District #508 | | 5.25 | 12-1-2028 | 1,250,000 | 1,337,513 |
| Cook County IL Community College District #508 | | 5.25 | 12-1-2030 | 3,000,000 | 3,199,110 |
| Cook County IL Community College District #508 | | 5.25 | 12-1-2031 | 3,200,000 | 3,405,952 |
| Cook County IL Series A | | 5.00 | 11-15-2029 | 1,000,000 | 1,194,380 |
| Cook County IL Series A | | 5.00 | 11-15-2034 | 1,300,000 | 1,529,333 |
| Cook County IL Series A | | 5.25 | 11-15-2022 | 7,240,000 | 7,262,661 |
| Cook County IL Series A | | 5.25 | 11-15-2023 | 7,680,000 | 7,704,422 |
| Cook County IL Series A | | 5.25 | 11-15-2024 | 2,200,000 | 2,283,072 |
| Cook County IL Series B | | 5.00 | 11-15-2023 | 600,000 | 667,926 |
| Cook County IL Series C | | 5.00 | 11-15-2021 | 1,460,000 | 1,511,480 |
| Cook County IL Series C | | 5.00 | 11-15-2024 | 2,175,000 | 2,335,472 |
| Cook County IL Series C | | 5.00 | 11-15-2025 | 2,450,000 | 2,627,601 |
| Illinois (AGM Insured) | | 5.00 | 1-1-2023 | 2,450,000 | 2,486,211 |
| Illinois (AGM Insured) | | 5.00 | 4-1-2026 | 5,000,000 | 5,498,050 |
| Illinois Series A | | 5.00 | 4-1-2023 | 4,500,000 | 4,843,350 |
| Illinois Series A (AGM Insured) | | 5.00 | 4-1-2024 | 2,500,000 | 2,684,100 |
| Kane, Cook & DuPage Counties IL School District #46 Unrefunded Balance Bond Series B | | 4.50 | 1-1-2024 | 2,600,000 | 2,704,832 |
| McHenry & Kane Counties IL Community Consolidated School District #158 | | 5.63 | 1-15-2031 | 2,000,000 | 2,111,560 |
| Sangamon, Logan & Menard Counties IL Williamsville Community Unit School District Series B (BAM Insured) | | 4.00 | 12-1-2037 | 700,000 | 811,174 |
| Sangamon, Logan & Menard Counties IL Williamsville Community Unit School District Series B (BAM Insured) | | 5.00 | 12-1-2034 | 400,000 | 504,352 |
| Sangamon, Logan & Menard Counties IL Williamsville Community Unit School District Series B (BAM Insured) | | 5.00 | 12-1-2035 | 450,000 | 565,583 |
The accompanying notes are an integral part of these financial statements.
Wells Fargo Intermediate Tax/AMT-Free Fund | 19
Portfolio of investments—December 31, 2020 (unaudited)
| | | Interest
rate | Maturity
date | Principal | Value |
| GO revenue (continued) | | | | | |
| Sangamon, Logan & Menard Counties IL Williamsville Community Unit School District Series B (BAM Insured) | | 5.00% | 12-1-2036 | $ 500,000 | $ 626,275 |
| Springfield IL | | 5.00 | 12-1-2021 | 850,000 | 885,462 |
| Springfield IL | | 5.00 | 12-1-2023 | 570,000 | 637,072 |
| Stephenson County IL School District #145 Series A (AGM Insured) | | 5.00 | 2-1-2033 | 1,550,000 | 1,943,638 |
| Waukegan IL Series B (AGM Insured) | | 4.00 | 12-30-2024 | 1,030,000 | 1,160,789 |
| | | | | | 95,720,077 |
| Health revenue: 0.18% | | | | | |
| Illinois Finance Authority Ann & Robert H. Laurie Children's Hospital Project of Chicago | | 5.00 | 8-15-2034 | 1,000,000 | 1,230,220 |
| Illinois Finance Authority Edward Elmhurst Healthcare Series A | | 5.00 | 1-1-2026 | 1,000,000 | 1,208,380 |
| Illinois Finance Authority Health Services Facility Lease Bond | | 5.00 | 10-1-2032 | 520,000 | 668,408 |
| Illinois Finance Authority Lutheran Life Communities Obligated Group Series A | | 5.00 | 11-1-2035 | 900,000 | 983,043 |
| | | | | | 4,090,051 |
| Miscellaneous revenue: 1.02% | | | | | |
| Chicago IL Board of Education Series C | | 5.00 | 12-1-2021 | 5,000,000 | 5,133,350 |
| Illinois | | 5.00 | 7-1-2023 | 5,065,000 | 5,486,560 |
| Illinois | | 5.00 | 8-1-2024 | 1,000,000 | 1,049,840 |
| Illinois | | 5.50 | 7-1-2026 | 2,300,000 | 2,492,809 |
| Illinois Sports Facilities Authority State Tax Supported Refunding Bond (AGM Insured) | | 5.00 | 6-15-2028 | 2,500,000 | 2,802,975 |
| Peoria IL Public Building Commission Illinois School District Facilities Refunding Bond (BAM Insured) | | 5.00 | 12-1-2023 | 4,040,000 | 4,556,433 |
| Peoria IL Public Building Commission Illinois School District Facilities Refunding Bond (BAM Insured) | | 5.00 | 12-1-2024 | 1,000,000 | 1,169,630 |
| | | | | | 22,691,597 |
| Tax revenue: 6.16% | | | | | |
| Chicago IL Sales Tax Refunding Bond | | 5.00 | 1-1-2027 | 3,000,000 | 3,561,300 |
| Chicago IL Sales Tax Refunding Bond | | 5.00 | 1-1-2030 | 2,075,000 | 2,463,233 |
| Chicago IL Sales Tax Securitization Bond Series A | | 5.00 | 1-1-2029 | 1,000,000 | 1,264,190 |
| Chicago IL Sales Tax Securitization Bond Series C | | 5.00 | 1-1-2027 | 4,370,000 | 5,315,755 |
| Chicago IL Sales Tax Securitization Bond Series C | | 5.25 | 1-1-2035 | 4,700,000 | 5,875,376 |
| Chicago IL Transit Authority Sales Tax Receipts | | 5.25 | 12-1-2027 | 2,600,000 | 2,720,198 |
| Cook County IL Sales Tax Bond | | 5.00 | 11-15-2033 | 4,000,000 | 4,962,680 |
| Cook County IL Sales Tax Bond | | 5.25 | 11-15-2035 | 2,000,000 | 2,495,300 |
| Illinois | | 5.00 | 6-15-2023 | 16,150,000 | 17,568,293 |
| Illinois Junior Obligation | | 5.00 | 6-15-2025 | 6,000,000 | 6,522,120 |
| Illinois Regional Transportation Authority (National Insured) | | 6.50 | 7-1-2026 | 8,615,000 | 10,552,600 |
| Illinois Sales Tax Revenue Build Illinois Bond | | 5.00 | 6-15-2029 | 1,000,000 | 1,014,170 |
| Illinois Series A | | 5.00 | 1-1-2027 | 10,625,000 | 10,937,163 |
| Illinois Sports Facilities Authority State Tax Supported Refunding Bond | | 5.00 | 6-15-2028 | 1,000,000 | 1,152,220 |
| Illinois Sports Facilities Authority State Tax Supported Refunding Bond (AGM Insured) | | 5.25 | 6-15-2030 | 4,000,000 | 4,485,240 |
| Illinois Sports Facilities Authority State Tax Supported Refunding Bond (AGM Insured) | | 5.25 | 6-15-2032 | 3,000,000 | 3,359,640 |
The accompanying notes are an integral part of these financial statements.
20 | Wells Fargo Intermediate Tax/AMT-Free Fund
Portfolio of investments—December 31, 2020 (unaudited)
| | | Interest
rate | Maturity
date | Principal | Value |
| Tax revenue (continued) | | | | | |
| Illinois Tender Option Bond Trust Receipts/Floater Certificates Series 2020-XL0145 (Barclays Bank plc LIQ)144Aø | | 0.13% | 12-1-2055 | $ 100,000 | $ 100,000 |
| Metropolitan Pier & Exposition Authority CAB McCormick Place Expansion Project Series A (National Insured)¤ | | 0.00 | 12-15-2029 | 35,200,000 | 29,151,544 |
| Metropolitan Pier & Exposition Authority CAB McCormick Place Expansion Project Series A (National Insured)¤ | | 0.00 | 12-15-2030 | 12,800,000 | 10,254,976 |
| Metropolitan Pier & Exposition Authority CAB McCormick Place Expansion Project Series B (National Insured)¤ | | 0.00 | 6-15-2029 | 10,000,000 | 8,412,200 |
| Metropolitan Pier & Exposition Authority McCormick Place Expansion Project Series B | | 5.00 | 12-15-2028 | 1,945,000 | 2,026,729 |
| Southwestern Illinois Development Authority Local Government Program Collinsville Limited | | 5.00 | 3-1-2025 | 2,850,000 | 2,238,333 |
| | | | | | 136,433,260 |
| Tobacco revenue: 0.16% | | | | | |
| Railsplitter IL Tobacco Settlement Authority | | 5.00 | 6-1-2024 | 3,000,000 | 3,442,740 |
| Transportation revenue: 0.15% | | | | | |
| Illinois Toll Highway Authority Senior Bond Class A | | 5.00 | 1-1-2037 | 1,250,000 | 1,648,038 |
| Illinois Toll Highway Authority Senior Bond Class A | | 5.00 | 1-1-2038 | 1,355,000 | 1,781,148 |
| | | | | | 3,429,186 |
| Water & sewer revenue: 1.96% | | | | | |
| Chicago IL Second Lien | | 5.00 | 11-1-2022 | 1,730,000 | 1,860,183 |
| Chicago IL Second Lien | | 5.00 | 11-1-2023 | 1,515,000 | 1,640,927 |
| Chicago IL Second Lien | | 5.00 | 11-1-2025 | 620,000 | 671,193 |
| Chicago IL Second Lien | | 5.00 | 11-1-2026 | 2,000,000 | 2,161,480 |
| Chicago IL Second Lien | | 5.00 | 11-1-2028 | 3,000,000 | 3,230,040 |
| Chicago IL Second Lien | | 5.00 | 11-1-2029 | 1,490,000 | 1,601,378 |
| Chicago IL Second Lien | | 5.00 | 11-1-2033 | 1,000,000 | 1,132,420 |
| Chicago IL Second Lien (AGM Insured) | | 5.25 | 11-1-2033 | 2,000,000 | 2,470,400 |
| Chicago IL Waste Water Transmission Second Lien | | 5.00 | 1-1-2022 | 1,440,000 | 1,501,934 |
| Chicago IL Waste Water Transmission Second Lien | | 5.00 | 1-1-2023 | 2,335,000 | 2,435,195 |
| Chicago IL Waste Water Transmission Second Lien | | 5.00 | 1-1-2024 | 2,000,000 | 2,083,780 |
| Chicago IL Waste Water Transmission Second Lien | | 5.00 | 1-1-2027 | 2,670,000 | 2,988,745 |
| Chicago IL Waste Water Transmission Second Lien | | 5.00 | 1-1-2028 | 3,500,000 | 3,639,895 |
| Chicago IL Waste Water Transmission Second Lien | | 5.00 | 1-1-2029 | 4,700,000 | 4,886,919 |
| Chicago IL Waste Water Transmission Second Lien | | 5.00 | 1-1-2032 | 1,000,000 | 1,115,920 |
| Chicago IL Waste Water Transmission Second Lien | | 5.00 | 1-1-2033 | 1,000,000 | 1,114,980 |
| Chicago IL Waste Water Transmission Second Lien | | 5.00 | 1-1-2034 | 1,000,000 | 1,113,100 |
| Illinois Finance Authority Clean Water Initiative Revolving Fund Bond | | 5.25 | 7-1-2035 | 3,000,000 | 4,012,590 |
| Sangamon IL Water Commission Refunding Bond (AGM Insured) | | 4.00 | 1-1-2029 | 525,000 | 600,868 |
| Sangamon IL Water Commission Refunding Bond (AGM Insured) | | 4.00 | 1-1-2030 | 600,000 | 691,170 |
| Sangamon IL Water Commission Refunding Bond (AGM Insured) | | 4.00 | 1-1-2031 | 625,000 | 725,738 |
| Sangamon IL Water Commission Refunding Bond (AGM Insured) | | 4.00 | 1-1-2033 | 500,000 | 573,360 |
The accompanying notes are an integral part of these financial statements.
Wells Fargo Intermediate Tax/AMT-Free Fund | 21
Portfolio of investments—December 31, 2020 (unaudited)
| | | Interest
rate | Maturity
date | Principal | Value |
| Water & sewer revenue (continued) | | | | | |
| Sangamon IL Water Commission Refunding Bond (AGM Insured) | | 4.00% | 1-1-2036 | $ 570,000 | $ 647,269 |
| Sangamon IL Water Commission Refunding Bond (AGM Insured) | | 4.00 | 1-1-2037 | 525,000 | 593,870 |
| | | | | | 43,493,354 |
| | | | | | 358,843,094 |
| Indiana: 1.28% | | | | | |
| Airport revenue: 0.07% | | | | | |
| Indianapolis IN Local Public Improvement Bond Bank Series I | | 5.00 | 1-1-2033 | 1,120,000 | 1,444,800 |
| Health revenue: 0.11% | | | | | |
| Knox County IN EDA Series A | | 5.00 | 4-1-2022 | 925,000 | 965,857 |
| Knox County IN EDA Series A | | 5.00 | 4-1-2023 | 665,000 | 694,094 |
| Knox County IN EDA Series A | | 5.00 | 4-1-2026 | 750,000 | 781,553 |
| | | | | | 2,441,504 |
| Miscellaneous revenue: 0.81% | | | | | |
| Dubois IN Greater Jasper School Building Corporation First Mortgage Bond | | 5.00 | 7-15-2029 | 1,625,000 | 2,065,976 |
| Indiana Finance Authority Stadium Project Series A | | 5.25 | 2-1-2028 | 2,000,000 | 2,419,940 |
| Indianapolis IN Local Public Improvement Bond Bank Series E | | 5.00 | 1-1-2027 | 760,000 | 938,440 |
| Indianapolis IN Local Public Improvement Bond Bank Series E | | 5.00 | 1-1-2028 | 1,000,000 | 1,234,790 |
| Indianapolis IN Local Public Improvement Bond Bank Series E | | 5.00 | 1-1-2029 | 735,000 | 907,571 |
| Indianapolis IN Local Public Improvement Bond Bank Series E | | 5.00 | 1-1-2030 | 1,375,000 | 1,697,836 |
| Indianapolis IN Local Public Improvement Bond Bank Series E | | 5.00 | 1-1-2031 | 1,000,000 | 1,234,790 |
| Indianapolis IN Local Public Improvement Bond Bank Series E | | 5.00 | 1-1-2033 | 1,545,000 | 1,907,751 |
| Indianapolis IN Local Public Improvement Bond Bank Series E | | 5.00 | 1-1-2034 | 2,000,000 | 2,469,580 |
| North West Hendricks IN Multi-School Building Corporation Ad Valorem Mortgage Bond | | 4.00 | 7-15-2031 | 900,000 | 1,078,767 |
| North West Hendricks IN Multi-School Building Corporation Ad Valorem Mortgage Bond | | 4.00 | 7-15-2033 | 1,000,000 | 1,188,920 |
| Valparaiso IN Multi-Schools Building Corporation | | 5.00 | 7-15-2024 | 750,000 | 871,440 |
| | | | | | 18,015,801 |
| Water & sewer revenue: 0.29% | | | | | |
| Indiana Finance Authority First Lien Wastewater Utility Clean Water Project Series A | | 5.00 | 10-1-2030 | 2,315,000 | 2,692,993 |
| Indiana Finance Authority First Lien Wastewater Utility Clean Water Project Series A | | 5.00 | 10-1-2031 | 1,035,000 | 1,201,325 |
| Indiana Finance Authority First Lien Wastewater Utility Clean Water Project Series A | | 5.25 | 10-1-2038 | 2,500,000 | 2,586,875 |
| | | | | | 6,481,193 |
| | | | | | 28,383,298 |
The accompanying notes are an integral part of these financial statements.
22 | Wells Fargo Intermediate Tax/AMT-Free Fund
Portfolio of investments—December 31, 2020 (unaudited)
| | | Interest
rate | Maturity
date | Principal | Value |
| Iowa: 0.29% | | | | | |
| GO revenue: 0.13% | | | | | |
| Altoona IA Annual Appropriation Urban Renewal Refunding Bond | | 5.00% | 6-1-2027 | $ 2,310,000 | $ 2,821,480 |
| Utilities revenue: 0.16% | | | | | |
| Iowa Gas Project Public Expenditure and Financial Accountability Incorporated | | 5.00 | 9-1-2049 | 3,000,000 | 3,676,020 |
| | | | | | 6,497,500 |
| Kansas: 0.35% | | | | | |
| Health revenue: 0.06% | | | | | |
| Kansas Development Finance Authority Health Facilities Series F | | 5.00 | 11-15-2021 | 1,300,000 | 1,348,698 |
| Miscellaneous revenue: 0.13% | | | | | |
| Kansas Development Finance Authority Agro-Defense Facility Series G | | 5.00 | 4-1-2030 | 2,650,000 | 2,890,329 |
| Tax revenue: 0.07% | | | | | |
| Wyandotte County & Kansas City KS Special Obligation Vacation Village Project Area 4 Major Multi-Sport Athletic Complex Project CAB Series 2015 144A¤ | | 0.00 | 9-1-2034 | 3,350,000 | 1,483,749 |
| Utilities revenue: 0.09% | | | | | |
| Burlington KS Environmental Impact Series A ø | | 0.20 | 9-1-2035 | 2,000,000 | 2,000,000 |
| | | | | | 7,722,776 |
| Kentucky: 2.32% | | | | | |
| Transportation revenue: 0.40% | | | | | |
| Kentucky Public Transportation Infrastructure Authority Downtown Crossing Project CAB Series B ¤ | | 0.00 | 7-1-2021 | 2,750,000 | 2,725,718 |
| Kentucky Public Transportation Infrastructure Authority Downtown Crossing Project CAB Series B ¤ | | 0.00 | 7-1-2022 | 4,320,000 | 4,202,366 |
| Kentucky Public Transportation Infrastructure Authority Downtown Crossing Project CAB Series B ¤ | | 0.00 | 7-1-2025 | 1,020,000 | 864,674 |
| Kentucky Public Transportation Infrastructure Authority Downtown Crossing Project CAB Series B ¤ | | 0.00 | 7-1-2029 | 1,400,000 | 1,090,684 |
| | | | | | 8,883,442 |
| Utilities revenue: 1.92% | | | | | |
| Kentucky Public Energy Authority Gas Supply Series A-1 | | 4.00 | 12-1-2049 | 16,255,000 | 18,519,159 |
| Kentucky Public Energy Authority Gas Supply Series B | | 4.00 | 1-1-2049 | 13,000,000 | 14,613,040 |
| Kentucky Public Energy Authority Gas Supply Series C-1 | | 4.00 | 2-1-2050 | 8,000,000 | 9,528,480 |
| | | | | | 42,660,679 |
| | | | | | 51,544,121 |
The accompanying notes are an integral part of these financial statements.
Wells Fargo Intermediate Tax/AMT-Free Fund | 23
Portfolio of investments—December 31, 2020 (unaudited)
| | | Interest
rate | Maturity
date | Principal | Value |
| Louisiana: 2.01% | | | | | |
| Airport revenue: 0.15% | | | | | |
| New Orleans LA Aviation Board Consolidated Rental Car Project (AGM Insured) | | 5.00% | 1-1-2035 | $ 2,000,000 | $ 2,469,400 |
| New Orleans LA Aviation Board North Terminal Project Series A | | 5.00 | 1-1-2033 | 750,000 | 905,355 |
| | | | | | 3,374,755 |
| Education revenue: 0.26% | | | | | |
| Louisiana Public Facilities Authority Loyola University Project CAB ¤ | | 0.00 | 10-1-2027 | 3,380,000 | 3,301,584 |
| Louisiana Public Facilities Authority Loyola University Project CAB ¤ | | 0.00 | 10-1-2028 | 2,500,000 | 2,469,375 |
| | | | | | 5,770,959 |
| Miscellaneous revenue: 0.82% | | | | | |
| Lafayette LA Communications System (AGM Insured) | | 5.00 | 11-1-2025 | 1,500,000 | 1,802,550 |
| Louisiana Public Facilities Authority Archdiocese of New Orleans Project | | 5.00 | 7-1-2024 | 1,000,000 | 850,000 |
| Louisiana Public Facilities Authority Archdiocese of New Orleans Project | | 5.00 | 7-1-2025 | 600,000 | 510,000 |
| Louisiana Public Facilities Authority Archdiocese of New Orleans Project | | 5.00 | 7-1-2026 | 500,000 | 425,000 |
| Louisiana Unclaimed Property Special Bond 1-49 South Project | | 5.00 | 9-1-2026 | 2,000,000 | 2,359,760 |
| Louisiana Unclaimed Property Special Bond 1-49 South Project | | 5.00 | 9-1-2027 | 2,700,000 | 3,173,418 |
| Louisiana Unclaimed Property Special Bond 1-49 South Project | | 5.00 | 9-1-2028 | 2,405,000 | 2,817,842 |
| Louisiana Unclaimed Property Special Bond 1-49 South Project | | 5.00 | 9-1-2029 | 2,695,000 | 3,146,736 |
| Louisiana Unclaimed Property Special Bond 1-49 South Project | | 5.00 | 9-1-2030 | 2,700,000 | 3,146,634 |
| | | | | | 18,231,940 |
| Tax revenue: 0.28% | | | | | |
| Jefferson LA Sales Tax District Series B (AGM Insured) | | 5.00 | 12-1-2031 | 1,000,000 | 1,243,330 |
| Jefferson LA Sales Tax District Series B (AGM Insured) | | 5.00 | 12-1-2032 | 1,000,000 | 1,237,130 |
| St. Bernard Parish LA Sales Tax Refunding Bond | | 4.00 | 3-1-2023 | 3,405,000 | 3,641,818 |
| | | | | | 6,122,278 |
| Transportation revenue: 0.16% | | | | | |
| Greater New Orleans LA Expressway Commission Toll Subordinate Lien Bond (AGM Insured) | | 5.00 | 11-1-2031 | 1,000,000 | 1,182,750 |
| Greater New Orleans LA Expressway Commission Toll Subordinate Lien Bond (AGM Insured) | | 5.00 | 11-1-2032 | 1,000,000 | 1,178,540 |
| Greater New Orleans LA Expressway Commission Toll Subordinate Lien Bond (AGM Insured) | | 5.00 | 11-1-2033 | 1,000,000 | 1,175,600 |
| | | | | | 3,536,890 |
| Water & sewer revenue: 0.34% | | | | | |
| Greater Ouachita LA Waterworks and Sewer System Refunding Bond (BAM Insured) | | 4.00 | 9-1-2030 | 500,000 | 609,535 |
| Greater Ouachita LA Waterworks and Sewer System Refunding Bond (BAM Insured) | | 4.00 | 9-1-2031 | 600,000 | 727,968 |
The accompanying notes are an integral part of these financial statements.
24 | Wells Fargo Intermediate Tax/AMT-Free Fund
Portfolio of investments—December 31, 2020 (unaudited)
| | | Interest
rate | Maturity
date | Principal | Value |
| Water & sewer revenue (continued) | | | | | |
| Greater Ouachita LA Waterworks and Sewer System Refunding Bond (BAM Insured) | | 4.00% | 9-1-2032 | $ 655,000 | $ 790,054 |
| Louisiana Local Government Environmental Facilities & CDA East Baton Rouge Series A | | 5.00 | 2-1-2030 | 1,000,000 | 1,145,280 |
| New Orleans LA Sewerage Service Series B (AGM Insured) | | 4.00 | 6-1-2035 | 400,000 | 487,232 |
| New Orleans LA Sewerage Service Series B (AGM Insured) | | 4.00 | 6-1-2036 | 325,000 | 394,427 |
| New Orleans LA Sewerage Service Series B (AGM Insured) | | 4.00 | 6-1-2037 | 335,000 | 405,193 |
| New Orleans LA Sewerage Service Series B | | 5.00 | 6-1-2032 | 1,000,000 | 1,315,740 |
| New Orleans LA Sewerage Service Series B | | 5.00 | 6-1-2033 | 695,000 | 909,373 |
| New Orleans LA Sewerage Service Series B | | 5.00 | 6-1-2034 | 600,000 | 782,706 |
| | | | | | 7,567,508 |
| | | | | | 44,604,330 |
| Maine: 0.50% | | | | | |
| Education revenue: 0.28% | | | | | |
| Maine Health and HEFAR University of New England Series A | | 5.00 | 7-1-2029 | 1,015,000 | 1,221,877 |
| Maine Health and HEFAR University of New England Series A | | 5.00 | 7-1-2030 | 1,200,000 | 1,437,936 |
| Maine Health and HEFAR University of New England Series A | | 5.00 | 7-1-2032 | 1,415,000 | 1,682,393 |
| Maine Health and HEFAR University of New England Series A | | 5.00 | 7-1-2033 | 1,485,000 | 1,758,819 |
| | | | | | 6,101,025 |
| Health revenue: 0.16% | | | | | |
| Maine Health and HEFAR Series A | | 4.00 | 7-1-2036 | 800,000 | 960,296 |
| Maine Health and HEFAR Series A | | 4.00 | 7-1-2037 | 1,150,000 | 1,375,837 |
| Maine Health and HEFAR Series A | | 5.00 | 7-1-2035 | 1,000,000 | 1,306,580 |
| | | | | | 3,642,713 |
| Transportation revenue: 0.06% | | | | | |
| Maine Turnpike Authority Revenue Bond | | 5.00 | 7-1-2035 | 1,000,000 | 1,320,040 |
| | | | | | 11,063,778 |
| Maryland: 1.18% | | | | | |
| Education revenue: 0.15% | | | | | |
| Maryland Economic Development Corporation Salisbury University Project | | 5.00 | 6-1-2027 | 500,000 | 518,910 |
| Westminster MD Educational Facilities McDaniel College | | 5.00 | 11-1-2026 | 2,450,000 | 2,843,103 |
| | | | | | 3,362,013 |
| Miscellaneous revenue: 0.73% | | | | | |
| Baltimore MD Public Schools Construction & Revitalization Program | | 5.00 | 5-1-2041 | 5,000,000 | 6,236,850 |
| Maryland CDA Local Government Infrastructure Bond Series A-2 | | 2.00 | 6-1-2022 | 460,000 | 470,828 |
| Maryland Series A | | 4.00 | 3-15-2034 | 5,000,000 | 6,299,500 |
The accompanying notes are an integral part of these financial statements.
Wells Fargo Intermediate Tax/AMT-Free Fund | 25
Portfolio of investments—December 31, 2020 (unaudited)
| | | Interest
rate | Maturity
date | Principal | Value |
| Miscellaneous revenue (continued) | | | | | |
| Prince Georges County MD Upper Marlboro Courthouse Project Series A | | 5.00% | 5-1-2028 | $ 1,215,000 | $ 1,590,909 |
| Prince Georges County MD Upper Marlboro Courthouse Project Series A | | 5.00 | 5-1-2029 | 1,275,000 | 1,658,737 |
| | | | | | 16,256,824 |
| Tax revenue: 0.07% | | | | | |
| Howard County MD Downtown Columbia Project Series A 144A | | 4.00 | 2-15-2028 | 500,000 | 525,310 |
| Howard County MD Downtown Columbia Project Series A 144A | | 4.13 | 2-15-2034 | 1,000,000 | 1,033,250 |
| | | | | | 1,558,560 |
| Water & sewer revenue: 0.23% | | | | | |
| Baltimore MD Mayor and City Council Project Series A | | 4.00 | 7-1-2038 | 870,000 | 1,075,424 |
| Baltimore MD Mayor and City Council Project Series A | | 5.00 | 7-1-2029 | 575,000 | 774,922 |
| Baltimore MD Mayor and City Council Project Series A | | 5.00 | 7-1-2031 | 500,000 | 685,680 |
| Baltimore MD Mayor and City Council Project Series A | | 5.00 | 7-1-2033 | 500,000 | 677,935 |
| Baltimore MD Mayor and City Council Project Series A | | 5.00 | 7-1-2035 | 500,000 | 674,260 |
| Baltimore MD Mayor and City Council Project Series A | | 5.00 | 7-1-2036 | 845,000 | 1,135,393 |
| | | | | | 5,023,614 |
| | | | | | 26,201,011 |
| Massachusetts: 1.43% | | | | | |
| Education revenue: 0.08% | | | | | |
| Massachusetts Development Finance Agency Lasell College | | 5.00 | 7-1-2021 | 620,000 | 624,972 |
| Massachusetts Development Finance Agency Merrimack College Series A | | 5.00 | 7-1-2021 | 1,035,000 | 1,055,752 |
| | | | | | 1,680,724 |
| GO revenue: 0.64% | | | | | |
| Boston MA Series A | | 4.00 | 4-1-2031 | 1,500,000 | 1,800,585 |
| Boston MA Series A | | 5.00 | 4-1-2026 | 5,790,000 | 6,952,748 |
| Massachusetts Series B | | 5.00 | 7-1-2035 | 1,500,000 | 1,951,770 |
| Massachusetts Series B | | 5.00 | 7-1-2036 | 2,700,000 | 3,499,848 |
| | | | | | 14,204,951 |
| Health revenue: 0.06% | | | | | |
| Massachusetts Development Finance Agency Wellforce Issue Series C (AGM Insured) | | 5.00 | 10-1-2033 | 525,000 | 692,417 |
| Massachusetts Development Finance Agency Wellforce Issue Series C (AGM Insured) | | 5.00 | 10-1-2034 | 500,000 | 657,965 |
| | | | | | 1,350,382 |
| Miscellaneous revenue: 0.65% | | | | | |
| Massachusetts Consolidated Loan Series I | | 5.00 | 12-1-2030 | 2,570,000 | 3,218,488 |
| Massachusetts Series D | | 4.00 | 11-1-2036 | 5,500,000 | 6,917,295 |
| Massachusetts Series D | | 4.00 | 11-1-2037 | 3,500,000 | 4,384,275 |
| | | | | | 14,520,058 |
| | | | | | 31,756,115 |
The accompanying notes are an integral part of these financial statements.
26 | Wells Fargo Intermediate Tax/AMT-Free Fund
Portfolio of investments—December 31, 2020 (unaudited)
| | | Interest
rate | Maturity
date | Principal | Value |
| Michigan: 2.44% | | | | | |
| Airport revenue: 0.08% | | | | | |
| Wayne County MI Airport Authority Detroit Metropolitan Bond Series A | | 5.00% | 12-1-2032 | $ 800,000 | $ 977,912 |
| Wayne County MI Airport Authority Detroit Metropolitan Bond Series A | | 5.00 | 12-1-2034 | 600,000 | 732,678 |
| | | | | | 1,710,590 |
| Education revenue: 0.33% | | | | | |
| Flint MI International Academy Public School | | 5.38 | 10-1-2022 | 985,000 | 986,359 |
| Flint MI International Academy Public School | | 5.50 | 10-1-2027 | 1,985,000 | 1,987,104 |
| Michigan State University Board of Trustees | | 5.00 | 2-15-2036 | 1,325,000 | 1,688,726 |
| Western Michigan University Board of Trustees | | 5.25 | 11-15-2027 | 600,000 | 678,888 |
| Western Michigan University Board of Trustees | | 5.25 | 11-15-2029 | 1,000,000 | 1,129,950 |
| Western Michigan University Board of Trustees (AGM Insured) | | 5.25 | 11-15-2033 | 750,000 | 849,983 |
| | | | | | 7,321,010 |
| GO revenue: 0.37% | | | | | |
| Kent County MI Limited Tax Capital Improvement Bond | | 5.00 | 6-1-2030 | 1,040,000 | 1,293,396 |
| Pinckney MI Community School District (Qualified School Board Loan Fund Insured) | | 5.00 | 5-1-2025 | 2,040,000 | 2,346,204 |
| Pinckney MI Community School District (Qualified School Board Loan Fund Insured) | | 5.00 | 5-1-2026 | 2,505,000 | 2,876,517 |
| Southfield MI 2015 Street Improvement | | 4.00 | 5-1-2025 | 1,490,000 | 1,715,750 |
| | | | | | 8,231,867 |
| Health revenue: 0.22% | | | | | |
| Michigan Finance Authority Sparrow Obligated Group | | 5.00 | 11-15-2023 | 400,000 | 432,852 |
| Michigan Finance Authority Sparrow Obligated Group | | 5.00 | 11-15-2026 | 800,000 | 863,712 |
| Michigan Finance Authority Trinity Health Credit Group Series MI-2 | | 4.00 | 12-1-2035 | 3,000,000 | 3,598,890 |
| | | | | | 4,895,454 |
| Miscellaneous revenue: 0.34% | | | | | |
| Michigan Finance Authority Local Government Loan Program Series F | | 4.00 | 10-1-2024 | 3,000,000 | 3,157,650 |
| Michigan Strategic Fund Limited Obligation Cadillac Place Office Building Project | | 5.25 | 10-15-2025 | 4,165,000 | 4,317,689 |
| | | | | | 7,475,339 |
| Water & sewer revenue: 1.10% | | | | | |
| Great Lakes MI Water Authority Sewage Disposal System Series C | | 5.00 | 7-1-2030 | 3,350,000 | 4,097,285 |
| Michigan Finance Authority Local Government Loan Program Series D (National Insured) | | 5.00 | 7-1-2025 | 1,000,000 | 1,156,380 |
| Michigan Finance Authority Local Government Loan Program Series D | | 5.00 | 7-1-2030 | 12,000,000 | 13,746,240 |
The accompanying notes are an integral part of these financial statements.
Wells Fargo Intermediate Tax/AMT-Free Fund | 27
Portfolio of investments—December 31, 2020 (unaudited)
| | | Interest
rate | Maturity
date | Principal | Value |
| Water & sewer revenue (continued) | | | | | |
| Michigan Finance Authority Local Government Loan Program Series D (AGM Insured) | | 5.00% | 7-1-2035 | $ 2,750,000 | $ 3,125,705 |
| Michigan Finance Authority Local Government Loan Program Series D (AGM Insured) | | 5.00 | 7-1-2037 | 2,000,000 | 2,265,140 |
| | | | | | 24,390,750 |
| | | | | | 54,025,010 |
| Minnesota: 0.02% | | | | | |
| Education revenue: 0.02% | | | | | |
| Minnesota HEFAR Concordia University Series 6Q (U.S. Bank NA LOC)ø | | 0.13 | 4-1-2037 | 560,000 | 560,000 |
| Mississippi: 0.85% | | | | | |
| Health revenue: 0.17% | | | | | |
| Mississippi Hospital Equipment & Facilities Authority North Mississippi Health Services Series IV | | 5.00 | 10-1-2037 | 1,000,000 | 1,278,630 |
| Mississippi Hospital Equipment & Facilities Authority North Mississippi Health Services Series IV | | 5.00 | 10-1-2038 | 1,000,000 | 1,275,250 |
| Mississippi Hospital Equipment & Facilities Authority North Mississippi Health Services Series IV | | 5.00 | 10-1-2039 | 1,000,000 | ���1,272,580 |
| | | | | | 3,826,460 |
| Miscellaneous revenue: 0.48% | | | | | |
| Mississippi Development Bank Special Obligation Jackson Water & Sewer System Project Series A (AGM Insured) | | 5.00 | 9-1-2030 | 9,895,000 | 10,547,575 |
| Water & sewer revenue: 0.20% | | | | | |
| Mississippi Development Bank Special Obligation Jackson Water & Sewer System Project (AGM Insured) | | 6.00 | 12-1-2023 | 1,145,000 | 1,305,758 |
| West Rankin MS Utility Authority Series 2018 (AGM Insured) | | 5.00 | 1-1-2026 | 525,000 | 616,865 |
| West Rankin MS Utility Authority Series 2018 (AGM Insured) | | 5.00 | 1-1-2027 | 435,000 | 509,964 |
| West Rankin MS Utility Authority Series 2018 (AGM Insured) | | 5.00 | 1-1-2034 | 750,000 | 863,978 |
| West Rankin MS Utility Authority Series 2018 (AGM Insured) | | 5.00 | 1-1-2035 | 1,000,000 | 1,151,120 |
| | | | | | 4,447,685 |
| | | | | | 18,821,720 |
| Missouri: 0.46% | | | | | |
| Education revenue: 0.13% | | | | | |
| Missouri HEFA Webster University Project | | 5.00 | 4-1-2027 | 2,450,000 | 2,809,317 |
| GO revenue: 0.04% | | | | | |
| Belton MO School District #124 Missouri Direct Deposit Program Project | | 5.00 | 3-1-2026 | 750,000 | 929,040 |
The accompanying notes are an integral part of these financial statements.
28 | Wells Fargo Intermediate Tax/AMT-Free Fund
Portfolio of investments—December 31, 2020 (unaudited)
| | | Interest
rate | Maturity
date | Principal | Value |
| Miscellaneous revenue: 0.29% | | | | | |
| Kansas City MO Municipal Assistance Corporation CAB Series B-1 (Ambac Insured)¤ | | 0.00% | 4-15-2022 | $ 3,640,000 | $ 3,615,539 |
| Poplar Bluff MO School District (AGM Insured) | | 5.00 | 3-1-2032 | 1,500,000 | 1,693,740 |
| Poplar Bluff MO School District (AGM Insured) | | 5.00 | 3-1-2034 | 1,000,000 | 1,125,630 |
| | | | | | 6,434,909 |
| | | | | | 10,173,266 |
| Nebraska: 0.28% | | | | | |
| Health revenue: 0.11% | | | | | |
| Douglas County NE Hospital Authority Children's Hospital Obligated Group Series A | | 4.00 | 11-15-2038 | 1,200,000 | 1,436,940 |
| Lincoln County NE Hospital Authority Great Plains Regional Medical Center | | 5.00 | 11-1-2024 | 1,000,000 | 1,038,310 |
| | | | | | 2,475,250 |
| Utilities revenue: 0.17% | | | | | |
| Nebraska Central Plains Energy Gas Project #3 | | 5.00 | 9-1-2027 | 1,290,000 | ��� 1,380,468 |
| Nebraska Central Plains Energy Gas Project #4 | | 5.00 | 3-1-2050 | 2,000,000 | 2,247,860 |
| | | | | | 3,628,328 |
| | | | | | 6,103,578 |
| Nevada: 1.31% | | | | | |
| GO revenue: 1.28% | | | | | |
| Clark County NV Refunding Bond | | 5.00 | 6-1-2030 | 3,955,000 | 4,973,650 |
| Clark County NV Refunding Bond Series B | | 5.00 | 11-1-2028 | 5,000,000 | 6,224,200 |
| Clark County NV School District Building Bond Series A (AGM Insured) | | 4.00 | 6-15-2034 | 6,790,000 | 7,826,765 |
| Clark County NV Stadium Improvement Bond Series A | | 5.00 | 6-1-2032 | 1,615,000 | 2,042,781 |
| Clark County NV Water Reclamation District | | 5.00 | 7-1-2027 | 4,155,000 | 4,996,471 |
| Las Vegas NV Series A | | 5.00 | 5-1-2031 | 1,985,000 | 2,264,548 |
| | | | | | 28,328,415 |
| Miscellaneous revenue: 0.03% | | | | | |
| Las Vegas NV Special Improvement District #607 | | 4.00 | 6-1-2021 | 590,000 | 595,298 |
| Las Vegas NV Special Improvement District #607 | | 4.25 | 6-1-2024 | 200,000 | 213,816 |
| | | | | | 809,114 |
| | | | | | 29,137,529 |
| New Hampshire: 0.15% | | | | | |
| Housing revenue: 0.15% | | | | | |
| New Hampshire HFA SFMR Acquisition Series E & F | | 4.80 | 7-1-2028 | 545,000 | 552,526 |
| New Hampshire National Finance Authority Municipal Certificates Series A | | 4.13 | 1-20-2034 | 2,469,723 | 2,773,202 |
| | | | | | 3,325,728 |
The accompanying notes are an integral part of these financial statements.
Wells Fargo Intermediate Tax/AMT-Free Fund | 29
Portfolio of investments—December 31, 2020 (unaudited)
| | | Interest
rate | Maturity
date | Principal | Value |
| New Jersey: 3.74% | | | | | |
| Airport revenue: 0.23% | | | | | |
| South Jersey NJ Port Corporation Marine Terminal Refunding Bond Series S | | 5.00% | 1-1-2028 | $ 2,130,000 | $ 2,489,480 |
| South Jersey NJ Port Corporation Marine Terminal Refunding Bond Series S | | 5.00 | 1-1-2029 | 2,200,000 | 2,559,722 |
| | | | | | 5,049,202 |
| GO revenue: 0.33% | | | | | |
| Trenton City NJ (BAM Insured) | | 5.00 | 12-1-2022 | 1,630,000 | 1,772,837 |
| Trenton City NJ (BAM Insured) | | 5.00 | 12-1-2024 | 1,775,000 | 2,082,856 |
| Trenton City NJ (BAM Insured) | | 5.00 | 12-1-2025 | 1,860,000 | 2,252,386 |
| Trenton City NJ (BAM Insured) | | 5.00 | 12-1-2026 | 1,000,000 | 1,203,440 |
| | | | | | 7,311,519 |
| Miscellaneous revenue: 1.48% | | | | | |
| Camden County NJ Improvement Authority Capital Program | | 4.00 | 1-15-2034 | 550,000 | 671,055 |
| Camden County NJ Improvement Authority Capital Program | | 4.00 | 1-15-2036 | 500,000 | 606,920 |
| Camden County NJ Improvement Authority Capital Program | | 4.00 | 1-15-2037 | 525,000 | 635,003 |
| New Jersey EDA Motor Vehicle Surcharge Revenue Refunding Bond Series A | | 3.13 | 7-1-2029 | 445,000 | 449,441 |
| New Jersey EDA Motor Vehicle Surcharges Series A | | 5.00 | 7-1-2033 | 2,500,000 | 2,890,750 |
| New Jersey EDA School Facilities Construction Refunding Bond Series NN | | 5.00 | 3-1-2023 | 3,000,000 | 3,283,140 |
| New Jersey EDA School Facilities Construction Refunding Bond Series NN | | 5.00 | 3-1-2026 | 9,830,000 | 10,628,688 |
| New Jersey EDA School Facilities Construction Refunding Bond Series XX | | 5.00 | 6-15-2022 | 5,020,000 | 5,345,447 |
| New Jersey EDA School Facilities Construction Unrefunded Bond Series NN | | 5.00 | 3-1-2021 | 3,105,000 | 3,127,108 |
| New Jersey Educational Facilities Authority | | 5.00 | 6-15-2026 | 3,015,000 | 3,392,146 |
| New Jersey Sports & Exposition Authority (National Insured) | | 5.50 | 3-1-2022 | 1,755,000 | 1,861,248 |
| | | | | | 32,890,946 |
| Tax revenue: 0.76% | | | | | |
| New Jersey EDA Unrefunded Bond Motor Vehicle Surcharges Series A (National Insured) | | 5.25 | 7-1-2026 | 2,320,000 | 2,824,925 |
| New Jersey Garden State Preservation Trust Open & Farmland Series A (AGM Insured) | | 5.75 | 11-1-2028 | 5,000,000 | 6,289,050 |
| New Jersey TTFA Series AA | | 4.00 | 6-15-2038 | 1,000,000 | 1,141,350 |
| New Jersey TTFA Series AA | | 5.00 | 6-15-2036 | 2,000,000 | 2,501,240 |
| New Jersey TTFA Series AA | | 5.00 | 6-15-2038 | 3,250,000 | 4,037,573 |
| | | | | | 16,794,138 |
| Tobacco revenue: 0.11% | | | | | |
| New Jersey EDA Cigarette Tax Refunding Bond | | 5.00 | 6-15-2021 | 2,500,000 | 2,541,500 |
| Transportation revenue: 0.83% | | | | | |
| New Jersey TTFA CAB Series A ¤ | | 0.00 | 12-15-2030 | 2,000,000 | 1,594,480 |
| New Jersey TTFA CAB Transportation System Series C (Ambac Insured)¤ | | 0.00 | 12-15-2026 | 3,500,000 | 3,205,405 |
The accompanying notes are an integral part of these financial statements.
30 | Wells Fargo Intermediate Tax/AMT-Free Fund
Portfolio of investments—December 31, 2020 (unaudited)
| | | Interest
rate | Maturity
date | Principal | Value |
| Transportation revenue (continued) | | | | | |
| New Jersey TTFA Series A | | 5.00% | 12-15-2036 | $ 2,000,000 | $ 2,420,340 |
| New Jersey TTFA Series A | | 5.25 | 6-15-2025 | 2,000,000 | 2,041,040 |
| New Jersey TTFA Series C | | 5.25 | 6-15-2032 | ��2,500,000 | 2,839,925 |
| New Jersey TTFA Unrefunded Balance Bond (National Insured) | | 5.25 | 12-15-2021 | 6,000,000 | 6,272,280 |
| | | | | | 18,373,470 |
| | | | | | 82,960,775 |
| New Mexico: 0.90% | | | | | |
| GO revenue: 0.16% | | | | | |
| Albuquerque, Bernalillo & Sandoval Counties NM Municipal School District #12 | | 5.00 | 8-1-2025 | 400,000 | 482,264 |
| Albuquerque, Bernalillo & Sandoval Counties NM Municipal School District #12 | | 5.00 | 8-1-2026 | 1,205,000 | 1,500,888 |
| Albuquerque, Bernalillo & Sandoval Counties NM Municipal School District #12 | | 5.00 | 8-1-2034 | 1,150,000 | 1,469,470 |
| | | | | | 3,452,622 |
| Housing revenue: 0.02% | | | | | |
| New Mexico Mortgage Finance Authority SFMR Class I Series A (GNMA, FNMA, FHLMC Insured) | | 4.63 | 9-1-2025 | 225,000 | 226,051 |
| New Mexico Mortgage Finance Authority SFMR Class I Series B (GNMA, FNMA, FHLMC Insured) | | 5.00 | 3-1-2028 | 200,000 | 201,050 |
| | | | | | 427,101 |
| Miscellaneous revenue: 0.53% | | | | | |
| Clayton NM Jail Project Improvement & Refunding Bond (National Insured) | | 5.00 | 11-1-2028 | 9,265,000 | 10,658,456 |
| Clayton NM Jail Project Improvement & Refunding Bond (National Insured) | | 5.00 | 11-1-2029 | 1,000,000 | 1,146,900 |
| | | | | | 11,805,356 |
| Utilities revenue: 0.14% | | | | | |
| New Mexico Municipal Energy Acquisition Authority Gas Supply Revenue Refunding Bond and Acquisition Subordinated Series A (Royal Bank of Canada LIQ) | | 5.00 | 11-1-2039 | 2,570,000 | 3,040,207 |
| Water & sewer revenue: 0.05% | | | | | |
| Albuquerque & Bernalillo Counties NM Water Utility Authority Series B | | 5.00 | 7-1-2024 | 1,000,000 | 1,163,570 |
| | | | | | 19,888,856 |
| New York: 10.81% | | | | | |
| Airport revenue: 0.53% | | | | | |
| New York & New Jersey Port Authority | | 4.00 | 7-15-2036 | 1,000,000 | 1,215,640 |
| New York & New Jersey Port Authority | | 4.00 | 7-15-2037 | 3,250,000 | 3,931,363 |
| New York & New Jersey Port Authority | | 5.00 | 7-15-2034 | 5,000,000 | 6,665,150 |
| | | | | | 11,812,153 |
The accompanying notes are an integral part of these financial statements.
Wells Fargo Intermediate Tax/AMT-Free Fund | 31
Portfolio of investments—December 31, 2020 (unaudited)
| | | Interest
rate | Maturity
date | Principal | Value |
| Education revenue: 0.96% | | | | | |
| Albany NY IDA Foundation State University Project Series A ø | | 0.23% | 7-1-2032 | $ 2,400,000 | $ 2,400,000 |
| Dutchess County NY Local Development Corporation The Culinary Institute of America Project Series A-1 | | 5.00 | 7-1-2027 | 335,000 | 384,838 |
| Hempstead NY Local Development Corporation The Academy Charter School Project Series A | | 6.24 | 2-1-2047 | 1,750,000 | 1,947,453 |
| Hempstead Town NY Local Development Corporation The Academy Charter School Project Series A | | 5.53 | 2-1-2040 | 2,725,000 | 3,004,640 |
| Hempstead Town NY Local Development Corporation The Academy Charter School Project Series A | | 5.89 | 2-1-2032 | 2,745,000 | 3,080,274 |
| Hempstead Town NY Local Development Corporation The Academy Charter School Project Series B | | 5.57 | 2-1-2041 | 4,140,000 | 4,564,060 |
| Monroe County NY Industrial Development Monroe Community College Project Series A (AGM Insured) | | 5.00 | 1-15-2022 | 790,000 | 825,898 |
| Monroe County NY Industrial Development Monroe Community College Project Series A (AGM Insured) | | 5.00 | 1-15-2023 | 645,000 | 700,064 |
| Monroe County NY Industrial Development Monroe Community College Project Series A (AGM Insured) | | 5.00 | 1-15-2024 | 905,000 | 1,019,329 |
| Niagara NY Area Development Corporation | | 5.00 | 5-1-2022 | 1,350,000 | 1,425,708 |
| Westchester County NY Local Development Pace University Series B ø | | 0.63 | 5-1-2044 | 1,910,000 | 1,910,000 |
| | | | | | 21,262,264 |
| GO revenue: 1.35% | | | | | |
| Hempstead Town Nassau County NY Public Improvement Series A | | 4.00 | 6-15-2028 | 5,000,000 | 5,898,500 |
| Nassau County NY | | 5.00 | 10-1-2024 | 4,965,000 | 5,736,015 |
| New York NY Series A (Mizuho Bank Limited LOC)ø | | 0.10 | 10-1-2040 | 5,000,000 | 5,000,000 |
| New York NY Series B | | 5.00 | 12-1-2032 | 2,000,000 | 2,456,340 |
| New York NY Series C | | 5.00 | 8-1-2031 | 5,000,000 | 5,832,800 |
| Suffolk County NY Series A | | 5.00 | 3-19-2021 | 4,000,000 | 4,036,280 |
| Yonkers NY Series A (AGM Insured) | | 5.00 | 10-1-2024 | 1,000,000 | 1,036,180 |
| | | | | | 29,996,115 |
| Industrial development revenue: 0.21% | | | | | |
| Monroe County NY IDAG Continuing Development Services Project (Citizens Bank LOC)ø | | 0.25 | 7-1-2027 | 805,000 | 805,000 |
| New York Liberty Development Corporation Refunding Bond | | 2.80 | 9-15-2069 | 1,000,000 | 976,170 |
| New York NY Transportation Development John F. Kennedy International Airport Project Series C | | 5.00 | 12-1-2029 | 1,160,000 | 1,496,702 |
| New York NY Transportation Development John F. Kennedy International Airport Project Series C | | 5.00 | 12-1-2030 | 1,000,000 | 1,310,380 |
| | | | | | 4,588,252 |
| Miscellaneous revenue: 0.37% | | | | | |
| New York Dormitory Authority Series D | | 5.00 | 10-1-2031 | 2,005,000 | 2,493,398 |
| New York NY Transitional Finance Authority Building Aid Bond Series S-1 | | 5.00 | 7-15-2032 | 2,530,000 | 3,159,793 |
| New York NY Trust for Cultural Resources Series A-1 | | 5.00 | 7-1-2031 | 2,475,000 | 2,475,668 |
| | | | | | 8,128,859 |
| Tax revenue: 3.79% | | | | | |
| Metropolitan Transportation Authority Series A | | 5.00 | 11-15-2024 | 6,010,000 | 6,515,561 |
The accompanying notes are an integral part of these financial statements.
32 | Wells Fargo Intermediate Tax/AMT-Free Fund
Portfolio of investments—December 31, 2020 (unaudited)
| | | Interest
rate | Maturity
date | Principal | Value |
| Tax revenue (continued) | | | | | |
| New York Convention Center Development Corporation | | 5.00% | 11-15-2028 | $ 8,000,000 | $ 9,378,080 |
| New York Dormitory Authority Series A | | 5.00 | 3-15-2028 | 5,000,000 | 5,954,850 |
| New York Dormitory Authority Series A | | 5.00 | 2-15-2031 | 3,000,000 | 3,716,490 |
| New York Dormitory Authority Series B (Ambac Insured) | | 5.50 | 3-15-2025 | 3,885,000 | 4,720,430 |
| New York Dormitory Authority Series D | | 4.00 | 2-15-2037 | 5,000,000 | 5,998,600 |
| New York Dormitory Authority Series D | | 4.00 | 2-15-2039 | 5,000,000 | 5,960,800 |
| New York Dormitory Authority Series E | | 5.00 | 3-15-2035 | 15,000,000 | 19,221,300 |
| New York NY Transitional Finance Authority Series B | | 5.00 | 8-1-2027 | 1,145,000 | 1,331,807 |
| New York NY Transitional Finance Authority Series C | | 5.00 | 11-1-2027 | 5,000,000 | 5,947,600 |
| New York NY Transitional Finance Authority Subordinate Bond Series B-1 | | 5.00 | 11-1-2028 | 1,000,000 | 1,206,980 |
| New York Urban Development Corporation Personal income Tax Series A | | 5.00 | 3-15-2032 | 5,000,000 | 6,071,700 |
| New York Urban Development Corporation Personal Income Tax Series A | | 5.00 | 3-15-2031 | 3,815,000 | 4,347,612 |
| New York Urban Development Corporation Personal income Tax Series C | | 4.00 | 3-15-2037 | 3,000,000 | 3,639,720 |
| | | | | | 84,011,530 |
| Tobacco revenue: 0.04% | | | | | |
| Suffolk NY Tobacco Asset Securitization Corporation Tobacco Settlement Series B | | 4.00 | 6-1-2022 | 420,000 | 431,105 |
| Suffolk NY Tobacco Asset Securitization Corporation Tobacco Settlement Series B | | 5.00 | 6-1-2023 | 500,000 | 519,970 |
| | | | | | 951,075 |
| Transportation revenue: 3.16% | | | | | |
| Metropolitan Transportation Authority Series A | | 5.00 | 11-15-2027 | 12,640,000 | 14,811,678 |
| Metropolitan Transportation Authority Series B | | 5.00 | 11-15-2033 | 2,175,000 | 2,484,959 |
| Metropolitan Transportation Authority Series D | | 5.00 | 11-15-2027 | 2,000,000 | 2,228,540 |
| Metropolitan Transportation Authority Series D | | 5.00 | 11-15-2030 | 2,010,000 | 2,265,089 |
| Metropolitan Transportation Authority Series D | | 5.00 | 11-15-2031 | 3,415,000 | 3,921,820 |
| Metropolitan Transportation Authority Series F | | 5.00 | 11-15-2028 | 2,450,000 | 2,587,249 |
| New York Metropolitan Transportation Authority Series A | | 5.00 | 11-15-2030 | 4,010,000 | 4,227,863 |
| New York Metropolitan Transportation Authority Series C | | 5.25 | 11-15-2031 | 11,540,000 | 13,148,214 |
| New York Metropolitan Transportation Authority Subordinate Bond Series D1 | | 5.00 | 9-1-2022 | 4,000,000 | 4,191,440 |
| Triborough NY Bridges & Tunnels Authority Series B | | 5.00 | 11-15-2030 | 6,030,000 | 8,298,607 |
| Triborough NY Bridges & Tunnels Authority Series C | | 5.00 | 11-15-2034 | 4,165,000 | 5,354,857 |
| Triborough NY Bridges & Tunnels Authority Series C | | 5.00 | 11-15-2035 | 5,015,000 | 6,425,168 |
| | | | | | 69,945,484 |
| Utilities revenue: 0.06% | | | | | |
| New York Utility Debt Securitization Authority | | 5.00 | 12-15-2032 | 1,250,000 | 1,416,200 |
| Water & sewer revenue: 0.34% | | | | | |
| New York NY Municipal Water Finance Authority Series GG | | 5.00 | 6-15-2029 | 1,295,000 | 1,556,007 |
| New York NY Municipal Water Finance Authority Series HH | | 5.00 | 6-15-2037 | 4,000,000 | 4,755,600 |
| Western Nassau NY Water Authority Series A | | 5.00 | 4-1-2027 | 385,000 | 455,005 |
The accompanying notes are an integral part of these financial statements.
Wells Fargo Intermediate Tax/AMT-Free Fund | 33
Portfolio of investments—December 31, 2020 (unaudited)
| | | Interest
rate | Maturity
date | Principal | Value |
| Water & sewer revenue (continued) | | | | | |
| Western Nassau NY Water Authority Series A | | 5.00% | 4-1-2028 | $ 300,000 | $ 353,034 |
| Western Nassau NY Water Authority Series B | | 5.00 | 4-1-2024 | 430,000 | 493,545 |
| | | | | | 7,613,191 |
| | | | | | 239,725,123 |
| North Carolina: 0.13% | | | | | |
| Miscellaneous revenue: 0.13% | | | | | |
| North Carolina Grant Anticipation Vehicle Bond | | 5.00 | 3-1-2029 | 2,470,000 | 2,897,779 |
| Onslow County NC Limited Obligation Series A | | 4.00 | 6-1-2022 | 90,000 | 94,864 |
| | | | | | 2,992,643 |
| Ohio: 1.64% | | | | | |
| Education revenue: 0.20% | | | | | |
| Ohio HEFAR Xavier University Project | | 5.00 | 5-1-2029 | 1,080,000 | 1,394,669 |
| Ohio HEFAR Xavier University Project | | 5.00 | 5-1-2031 | 2,400,000 | 3,136,488 |
| | | | | | 4,531,157 |
| GO revenue: 0.10% | | | | | |
| Columbus OH Various Purposes Series 2 | | 5.00 | 7-1-2026 | 1,775,000 | 2,227,306 |
| Health revenue: 0.06% | | | | | |
| Hamilton OH Hospital Facilities UC Health | | 5.00 | 9-15-2035 | 1,100,000 | 1,396,197 |
| Miscellaneous revenue: 0.57% | | | | | |
| Cincinnati OH City School District Improvement Project Certificate of Participation | | 5.00 | 12-15-2024 | 4,815,000 | 5,683,096 |
| Cincinnati OH City School District Improvement Project Certificate of Participation | | 5.00 | 12-15-2025 | 2,095,000 | 2,467,302 |
| Clermont County OH Port Authority West Clermont Local School District Project (BAM Insured) | | 5.00 | 12-1-2025 | 500,000 | 606,560 |
| Clermont County OH Port Authority West Clermont Local School District Project (BAM Insured) | | 5.00 | 12-1-2026 | 600,000 | 723,348 |
| Clermont County OH Port Authority West Clermont Local School District Project (BAM Insured) | | 5.00 | 12-1-2028 | 1,250,000 | 1,502,963 |
| Ohio Building Authority Series A | | 5.00 | 10-1-2024 | 1,000,000 | 1,036,030 |
| RiverSouth OH Lazarus Building Redevelopment Series A | | 5.75 | 12-1-2027 | 700,000 | 700,959 |
| | | | | | 12,720,258 |
| Tax revenue: 0.14% | | | | | |
| Cleveland OH Subordinate Lien Income Tax Refunding Bond Series B-1 | | 5.00 | 10-1-2030 | 2,500,000 | 3,170,825 |
| Tobacco revenue: 0.12% | | | | | |
| Buckeye OH Tobacco Settlement Financing Authority Refunding Bond | | 4.00 | 6-1-2038 | 2,100,000 | 2,540,643 |
| Transportation revenue: 0.05% | | | | | |
| Ohio Turnpike Commission Junior Lien Infrastructure Projects Series A-1 | | 5.25 | 2-15-2029 | 1,000,000 | 1,098,280 |
The accompanying notes are an integral part of these financial statements.
34 | Wells Fargo Intermediate Tax/AMT-Free Fund
Portfolio of investments—December 31, 2020 (unaudited)
| | | Interest
rate | Maturity
date | Principal | Value |
| Utilities revenue: 0.34% | | | | | |
| Cleveland OH Public Power System Refunding Bond (AGM Insured) | | 5.00% | 11-15-2033 | $ 625,000 | $ 794,900 |
| Hamilton OH Electric System Improvement and Refunding Bond (BAM Insured) | | 4.00 | 10-1-2034 | 710,000 | 854,158 |
| Hamilton OH Electric System Improvement and Refunding Bond (BAM Insured) | | 4.00 | 10-1-2035 | 1,000,000 | 1,199,530 |
| Lancaster OH Port Authority Gas Supply (Royal Bank of Canada LIQ) | | 5.00 | 8-1-2049 | 3,000,000 | 3,515,670 |
| Ohio Air Quality Development Authority Ohio Valley Electric Corporation Project Series A | | 3.25 | 9-1-2029 | 1,000,000 | 1,088,130 |
| | | | | | 7,452,388 |
| Water & sewer revenue: 0.06% | | | | | |
| Ohio Water Development Authority Pollution Control Series A | | 5.00 | 12-1-2031 | 1,000,000 | 1,268,620 |
| | | | | | 36,405,674 |
| Oklahoma: 2.66% | | | | | |
| Education revenue: 0.04% | | | | | |
| Oklahoma Agricultural and Mechanical Colleges Refunding Bond Series A | | 4.00 | 9-1-2036 | 750,000 | 911,798 |
| Miscellaneous revenue: 2.23% | | | | | |
| Cache OK Educational Facilities Authority Cache Public Schools Project Series A | | 5.00 | 9-1-2024 | 2,905,000 | 3,362,247 |
| Cache OK Educational Facilities Authority Cache Public Schools Project Series A | | 5.00 | 9-1-2025 | 3,055,000 | 3,663,128 |
| Canadian County OK Education Facilities Authority Mustang Public Schools Project | | 4.00 | 9-1-2025 | 1,110,000 | 1,285,669 |
| Canadian County OK Education Facilities Authority Mustang Public Schools Project | | 5.00 | 9-1-2027 | 2,000,000 | 2,475,620 |
| Canadian County OK Education Facilities Authority Mustang Public Schools Project | | 5.00 | 9-1-2028 | 2,180,000 | 2,684,234 |
| Carter County OK Public Facilities Authority Educational Facilities Plainview Public School Project | | 5.00 | 12-1-2026 | 1,000,000 | 1,240,480 |
| Carter County OK Public Facilities Authority Educational Facilities Plainview Public School Project | | 5.00 | 12-1-2027 | 1,000,000 | 1,230,030 |
| Carter County OK Public Facilities Authority Educational Facilities Plainview Public School Project | | 5.00 | 12-1-2028 | 1,285,000 | 1,570,540 |
| Cleveland County OK Educational Facilities Authority Noble Public Schools Project | | 5.00 | 9-1-2027 | 700,000 | 880,187 |
| Cleveland County OK Educational Facilities Authority Noble Public Schools Project | | 5.00 | 9-1-2028 | 400,000 | 499,916 |
| Cleveland County OK Educational Facilities Authority Noble Public Schools Project | | 5.00 | 9-1-2029 | 250,000 | 310,600 |
| Cleveland County OK Educational Facilities Authority Noble Public Schools Project | | 5.00 | 9-1-2031 | 675,000 | 831,911 |
| Comanche County OK Educational Facilities Authority Elgin Public Schools Project Series A | | 5.00 | 12-1-2032 | 1,600,000 | 1,955,824 |
| Cushing OK Educational Facilities Authority | | 5.00 | 9-1-2022 | 2,210,000 | 2,372,214 |
| Dewey County OK Educational Facilities Authority Seiling Public Schools Project | | 5.00 | 9-1-2026 | 1,230,000 | 1,471,252 |
| Dewey County OK Educational Facilities Authority Seiling Public Schools Project | | 5.00 | 9-1-2027 | 1,240,000 | 1,501,156 |
The accompanying notes are an integral part of these financial statements.
Wells Fargo Intermediate Tax/AMT-Free Fund | 35
Portfolio of investments—December 31, 2020 (unaudited)
| | | Interest
rate | Maturity
date | Principal | Value |
| Miscellaneous revenue (continued) | | | | | |
| Garvin County OK Educational Facilities Authority Lindsay Public Schools Project | | 5.00% | 9-1-2026 | $ 1,000,000 | $ 1,189,420 |
| Garvin County OK Educational Facilities Authority Lindsay Public Schools Project | | 5.00 | 9-1-2027 | 1,245,000 | 1,475,748 |
| Grady County OK Educational Facilities Tuttle Public Schools Project | | 5.00 | 9-1-2023 | 1,000,000 | 1,115,100 |
| Grady County OK Educational Facilities Tuttle Public Schools Project | | 5.00 | 9-1-2024 | 1,075,000 | 1,242,098 |
| Grady County OK Educational Facilities Tuttle Public Schools Project | | 5.00 | 9-1-2025 | 500,000 | 596,990 |
| Grady County OK Educational Facilities Tuttle Public Schools Project | | 5.00 | 9-1-2028 | 1,160,000 | 1,376,491 |
| Muskogee OK Industrial Trust Educational Facilities | | 4.00 | 9-1-2029 | 3,000,000 | 3,529,530 |
| Muskogee OK Industrial Trust Educational Facilities | | 4.00 | 9-1-2032 | 3,000,000 | 3,473,160 |
| Muskogee OK Industrial Trust Educational Facilities | | 5.00 | 9-1-2021 | 1,000,000 | 1,028,270 |
| Muskogee OK Industrial Trust Educational Facilities | | 5.00 | 9-1-2022 | 1,000,000 | 1,070,650 |
| Oklahoma Development Finance Authority | | 4.00 | 6-1-2023 | 1,270,000 | 1,374,661 |
| Oklahoma Development Finance Authority | | 5.00 | 6-1-2023 | 1,230,000 | 1,368,240 |
| Oklahoma Development Finance Authority State System of Higher Education Series B | | 5.00 | 6-1-2030 | 500,000 | 660,435 |
| Oklahoma Development Finance Authority State System of Higher Education Series B | | 5.00 | 6-1-2031 | 520,000 | 683,790 |
| Oklahoma Development Finance Authority State System of Higher Education Series B | | 5.00 | 6-1-2032 | 550,000 | 718,443 |
| Tulsa County OK Industrial Authority Educational Facilities Glenpool Public Schools Project Series A | | 5.00 | 9-1-2025 | 880,000 | 1,058,314 |
| | | | | | 49,296,348 |
| Tax revenue: 0.20% | | | | | |
| Oklahoma City OK Public Property Authority | | 5.00 | 10-1-2026 | 1,495,000 | 1,722,240 |
| Oklahoma City OK Public Property Authority | | 5.00 | 10-1-2027 | 1,140,000 | 1,307,056 |
| Oklahoma City OK Public Property Authority | | 5.00 | 10-1-2028 | 1,265,000 | 1,443,972 |
| | | | | | 4,473,268 |
| Utilities revenue: 0.17% | | | | | |
| Claremore OK Public Works Authority | | 4.00 | 6-1-2022 | 2,595,000 | 2,727,682 |
| Claremore OK Public Works Authority | | 4.00 | 6-1-2023 | 1,010,000 | 1,060,369 |
| | | | | | 3,788,051 |
| Water & sewer revenue: 0.02% | | | | | |
| McGee Creek OK Authority (National Insured) | | 6.00 | 1-1-2023 | 485,000 | 510,981 |
| | | | | | 58,980,446 |
| Oregon: 0.68% | | | | | |
| Airport revenue: 0.13% | | | | | |
| Portland International Airport Refunding Bond Series 26A | | 4.00 | 7-1-2037 | 565,000 | 664,073 |
| Portland International Airport Refunding Bond Series 26A | | 5.00 | 7-1-2033 | 400,000 | 525,464 |
The accompanying notes are an integral part of these financial statements.
36 | Wells Fargo Intermediate Tax/AMT-Free Fund
Portfolio of investments—December 31, 2020 (unaudited)
| | | Interest
rate | Maturity
date | Principal | Value |
| Airport revenue (continued) | | | | | |
| Portland International Airport Refunding Bond Series 26B | | 5.00% | 7-1-2033 | $ 530,000 | $ 696,240 |
| Portland International Airport Refunding Bond Series 26B | | 5.00 | 7-1-2037 | 705,000 | 914,857 |
| | | | | | 2,800,634 |
| GO revenue: 0.38% | | | | | |
| Benton & Linn Counties OR Corvallis School District Series B (AGM Insured) | | 5.00 | 6-15-2031 | 5,110,000 | 6,647,752 |
| Washington & Multnomah Counties OR Beaverton School District Series D (AGM Insured) | | 5.00 | 6-15-2035 | 1,500,000 | 1,880,310 |
| | | | | | 8,528,062 |
| Health revenue: 0.17% | | | | | |
| Oregon Facilities Authority Asante Project Series A | | 5.00 | 8-15-2037 | 1,400,000 | 1,828,302 |
| Oregon Facilities Authority Samaritan Health Services Project Series A | | 5.00 | 10-1-2026 | 1,500,000 | 1,845,900 |
| | | | | | 3,674,202 |
| | | | | | 15,002,898 |
| Pennsylvania: 10.82% | | | | | |
| Airport revenue: 0.04% | | | | | |
| Philadelphia PA Airport Refunding Bond Series A | | 5.00 | 7-1-2028 | 315,000 | 396,434 |
| Philadelphia PA Airport Refunding Bond Series A | | 5.00 | 7-1-2031 | 450,000 | 558,770 |
| | | | | | 955,204 |
| Education revenue: 1.36% | | | | | |
| Chester County PA IDA Collegium Charter School Project Series A | | 5.00 | 10-15-2027 | 1,500,000 | 1,653,030 |
| Lycoming County PA Authority Pennsylvania College of Technology | | 5.50 | 7-1-2026 | 4,000,000 | 4,094,520 |
| Northampton County PA General Purpose Authority College Refunding Bond | | 5.00 | 11-1-2027 | 1,000,000 | 1,268,280 |
| Northeastern Pennsylvania Hospital & Education Authority Series A | | 5.00 | 3-1-2026 | 885,000 | 976,049 |
| Northeastern Pennsylvania Hospital & Education Authority Series A | | 5.00 | 3-1-2028 | 660,000 | 718,641 |
| Pennsylvania HEFAR Series AQ | | 5.00 | 6-15-2023 | 6,090,000 | 6,758,499 |
| Pennsylvania HEFAR Series AR | | 5.00 | 6-15-2025 | 1,000,000 | 1,195,690 |
| Pennsylvania HEFAR Series AS | | 5.00 | 6-15-2027 | 2,190,000 | 2,684,261 |
| Pennsylvania HEFAR Series LL1 | | 5.00 | 11-1-2022 | 1,310,000 | 1,349,955 |
| Pennsylvania Public School Building Authority | | 5.00 | 5-1-2023 | 2,185,000 | 2,403,434 |
| Pennsylvania Public School Building Authority | | 5.00 | 6-15-2025 | 2,265,000 | 2,609,008 |
| Philadelphia PA IDA | | 5.88 | 6-15-2022 | 510,000 | 530,053 |
| Philadelphia PA IDA | | 6.13 | 6-15-2023 | 645,000 | 686,022 |
| Philadelphia PA IDA | | 7.00 | 5-1-2026 | 740,000 | 752,395 |
| Philadelphia PA IDA West Philadelphia Achievement Charter Elementary School Project | | 6.25 | 5-1-2021 | 65,000 | 65,884 |
| Philadelphia PA Public School Building Authority (BAM Insured) | | 5.00 | 6-15-2026 | 2,000,000 | 2,379,640 |
| | | | | | 30,125,361 |
The accompanying notes are an integral part of these financial statements.
Wells Fargo Intermediate Tax/AMT-Free Fund | 37
Portfolio of investments—December 31, 2020 (unaudited)
| | | Interest
rate | Maturity
date | Principal | Value |
| GO revenue: 4.41% | | | | | |
| Allegheny County PA Moon Area School District Series A | | 5.00% | 11-15-2024 | $ 3,425,000 | $ 4,000,914 |
| Allegheny County PA Series 72 | | 5.25 | 12-1-2033 | 4,045,000 | 4,637,754 |
| Beaver County PA (BAM Insured) | | 4.00 | 4-15-2029 | 1,670,000 | 1,990,924 |
| Central Dauphin PA School District | | 5.00 | 2-1-2030 | 1,110,000 | 1,378,420 |
| Johnstown PA School District (AGM Insured) | | 5.00 | 8-1-2024 | 2,730,000 | 2,805,375 |
| Norristown PA Area School District Montgomery County Series 2018 (BAM Insured) | | 5.00 | 9-1-2035 | 2,035,000 | 2,471,202 |
| Philadelphia PA (AGM Insured) | | 5.00 | 8-1-2025 | 7,000,000 | 8,464,330 |
| Philadelphia PA School District Refunding Bond Series C | | 5.00 | 9-1-2021 | 2,200,000 | 2,264,394 |
| Philadelphia PA School District Refunding Bond Series D | | 5.00 | 9-1-2022 | 3,750,000 | 4,021,388 |
| Philadelphia PA School District Refunding Bond Series F | | 5.00 | 9-1-2028 | 5,000,000 | 6,093,200 |
| Philadelphia PA School District Refunding Bond Series F | | 5.00 | 9-1-2029 | 5,000,000 | 6,062,550 |
| Philadelphia PA School District Refunding Bond Series F | | 5.00 | 9-1-2031 | 1,240,000 | 1,495,961 |
| Philadelphia PA School District Refunding Bond Series F | | 5.00 | 9-1-2032 | 1,000,000 | 1,201,570 |
| Philadelphia PA Series A | | 5.00 | 8-1-2024 | 1,000,000 | 1,157,350 |
| Philadelphia PA Series A | | 5.00 | 7-15-2026 | 3,000,000 | 3,406,080 |
| Philadelphia PA Series A | | 5.00 | 8-1-2027 | 1,685,000 | 2,139,175 |
| Philadelphia PA Series A | | 5.00 | 8-1-2033 | 2,020,000 | 2,480,156 |
| Philadelphia PA Series A | | 5.25 | 7-15-2028 | 2,590,000 | 2,944,053 |
| Philadelphia PA Series A | | 5.25 | 7-15-2029 | 4,410,000 | 5,017,125 |
| Philadelphia PA Series A | | 5.25 | 7-15-2032 | 4,380,000 | 4,966,044 |
| Philadelphia School District Series A | | 5.00 | 9-1-2032 | 2,300,000 | 2,941,286 |
| Philadelphia School District Series C | | 5.00 | 9-1-2033 | 6,180,000 | 7,855,645 |
| Pittsburgh PA Moon Area School District Series A | | 5.00 | 11-15-2029 | 1,000,000 | 1,161,900 |
| Pittsburgh PA Series A | | 4.00 | 9-1-2022 | 1,000,000 | 1,060,540 |
| Pittsburgh PA Series A | | 5.00 | 9-1-2022 | 2,060,000 | 2,218,702 |
| Pittsburgh PA Series A | | 5.00 | 9-1-2023 | 3,810,000 | 4,115,410 |
| Reading Berks PA Series A (BAM Insured) | | 5.00 | 11-1-2026 | 1,000,000 | 1,221,190 |
| Reading PA School District | | 5.00 | 4-1-2021 | 3,120,000 | 3,152,323 |
| Reading PA School District (AGM Insured) | | 5.00 | 3-1-2037 | 2,000,000 | 2,414,900 |
| Reading PA School District (AGM Insured) | | 5.00 | 3-1-2038 | 1,735,000 | 2,089,669 |
| Scranton Lackawanna County PA School District Bond Series A (BAM Insured) | | 5.00 | 6-1-2037 | 500,000 | 625,705 |
| | | | | | 97,855,235 |
| Health revenue: 1.06% | | | | | |
| Allegheny County PA Hospital Development Authority Series A | | 4.00 | 7-15-2037 | 2,000,000 | 2,340,040 |
| Allegheny County PA Hospital Development Authority Series A | | 5.00 | 7-15-2031 | 3,750,000 | 4,916,250 |
| Allegheny County PA Hospital Development Authority Series B (National Insured) | | 6.00 | 7-1-2025 | 2,605,000 | 3,242,965 |
| Allegheny County PA Hospital Development Authority University of Pittsburgh Medical Center Series A | | 5.00 | 7-15-2025 | 155,000 | 187,042 |
| Cumberland PA Municipal Authority Diakon Lutheran Social Ministries Project | | 5.00 | 1-1-2025 | 170,000 | 201,062 |
| Cumberland PA Municipal Authority Diakon Lutheran Social Ministries Project | | 5.00 | 1-1-2025 | 1,170,000 | 1,311,570 |
The accompanying notes are an integral part of these financial statements.
38 | Wells Fargo Intermediate Tax/AMT-Free Fund
Portfolio of investments—December 31, 2020 (unaudited)
| | | Interest
rate | Maturity
date | Principal | Value |
| Health revenue (continued) | | | | | |
| Cumberland PA Municipal Authority Diakon Lutheran Social Ministries Project | | 5.00% | 1-1-2026 | $ 155,000 | $ 183,322 |
| Cumberland PA Municipal Authority Diakon Lutheran Social Ministries Project | | 5.00 | 1-1-2026 | 1,215,000 | 1,357,544 |
| Cumberland PA Municipal Authority Diakon Lutheran Social Ministries Project | | 5.00 | 1-1-2027 | 150,000 | 177,408 |
| Cumberland PA Municipal Authority Diakon Lutheran Social Ministries Project | | 5.00 | 1-1-2027 | 1,075,000 | 1,193,691 |
| Montgomery County PA HEFA Thomas Jefferson University | | 4.00 | 9-1-2037 | 1,000,000 | 1,156,370 |
| Pennsylvania EDFA University of Pittsburgh Medical Center Series A | | 5.00 | 4-15-2031 | 1,000,000 | 1,333,380 |
| Pennsylvania EDFA University of Pittsburgh Medical Center Series A | | 5.00 | 4-15-2034 | 1,650,000 | 2,168,183 |
| Pennsylvania EDFA University of Pittsburgh Medical Center Series A | | 5.00 | 4-15-2035 | 1,450,000 | 1,901,327 |
| Pennsylvania Tender Option Bond Trust Receipts/Floater Certificates Series 2020-XM0876 (Royal Bank of Canada LIQ)144Aø | | 0.13 | 8-15-2027 | 1,750,000 | 1,750,000 |
| | | | | | 23,420,154 |
| Miscellaneous revenue: 1.74% | | | | | |
| Delaware County PA Vocational & Technical School Authority (BAM Insured) | | 5.25 | 11-1-2033 | 2,000,000 | 2,244,480 |
| Pennsylvania Certificate of Participation Municipal Real Estate Payment Series A | | 5.00 | 7-1-2028 | 435,000 | 557,205 |
| Pennsylvania Certificate of Participation Municipal Real Estate Payment Series A | | 5.00 | 7-1-2029 | 480,000 | 611,016 |
| Pennsylvania Certificate of Participation Municipal Real Estate Payment Series A | | 5.00 | 7-1-2030 | 375,000 | 474,971 |
| Pennsylvania Certificate of Participation Retained Basic Lease Payment (AGM Insured) | | 5.00 | 11-1-2023 | 1,900,000 | 2,132,085 |
| Pennsylvania Certificate of Participation Retained Basic Lease Payment (AGM Insured) | | 5.00 | 11-1-2024 | 1,660,000 | 1,933,634 |
| Pennsylvania Public School Building Authority | | 5.00 | 4-1-2029 | 1,000,000 | 1,059,360 |
| Pennsylvania Public School Building Authority Chester Upland School District Project Series B | | 5.25 | 9-15-2030 | 1,990,000 | 2,510,345 |
| Pennsylvania Public School Building Authority Series A (AGM Insured) | | 5.00 | 12-1-2028 | 480,000 | 609,379 |
| Pennsylvania Public School Building Authority Series B (BAM Insured) | | 5.00 | 12-1-2024 | 625,000 | 724,706 |
| Pennsylvania Public School Building Authority Series B (BAM Insured) | | 5.00 | 12-1-2024 | 625,000 | 738,438 |
| Pennsylvania Public School Building Authority Series B (BAM Insured) | | 5.00 | 12-1-2025 | 340,000 | 395,668 |
| Pennsylvania Public School Building Authority Series B (BAM Insured) | | 5.00 | 12-1-2025 | 910,000 | 1,075,165 |
| Pennsylvania Public School Building Authority Series B (BAM Insured) | | 5.00 | 12-1-2026 | 605,000 | 714,808 |
| Pennsylvania Public School Building Authority Series B (BAM Insured) | | 5.00 | 12-1-2026 | 645,000 | 746,284 |
| Pennsylvania Public School Building Authority Series B (BAM Insured) | | 5.00 | 12-1-2027 | 360,000 | 414,731 |
| Pennsylvania Public School Building Authority Series B (BAM Insured) | | 5.00 | 12-1-2027 | 650,000 | 767,975 |
The accompanying notes are an integral part of these financial statements.
Wells Fargo Intermediate Tax/AMT-Free Fund | 39
Portfolio of investments—December 31, 2020 (unaudited)
| | | Interest
rate | Maturity
date | Principal | Value |
| Miscellaneous revenue (continued) | | | | | |
| Pennsylvania Public School Building Authority Series B (AGM Insured) | | 5.00% | 12-1-2028 | $ 3,020,000 | $ 3,726,620 |
| Pennsylvania Public School Building Authority Series B (AGM Insured) | | 5.00 | 6-1-2029 | 2,000,000 | 2,608,920 |
| Pennsylvania Public School Building Authority Series B (AGM Insured) | | 5.00 | 12-1-2033 | 920,000 | 1,167,977 |
| Pennsylvania Public School Building Authority Series B (AGM Insured) | | 5.00 | 12-1-2033 | 3,505,000 | 4,217,742 |
| Philadelphia PA Municipal Authority Juvenile Justice Services Center | | 5.00 | 4-1-2031 | 3,630,000 | 4,463,956 |
| Philadelphia PA Municipal Authority Juvenile Justice Services Center | | 5.00 | 4-1-2034 | 1,800,000 | 2,186,910 |
| Southeastern Pennsylvania Transportation Authority | | 5.00 | 3-1-2028 | 725,000 | 932,974 |
| York County PA School of Technology Authority Series B (BAM Insured) | | 5.00 | 2-15-2027 | 800,000 | 921,944 |
| York County PA School of Technology Authority Series B (BAM Insured) | | 5.00 | 2-15-2029 | 500,000 | 574,475 |
| | | | | | 38,511,768 |
| Resource recovery revenue: 0.29% | | | | | |
| Lancaster County PA Solid Waste Management Authority Series A | | 5.25 | 12-15-2028 | 5,665,000 | 6,472,149 |
| Tobacco revenue: 0.29% | | | | | |
| Commonwealth Financing Authority Tobacco Master Settlement Payment | | 5.00 | 6-1-2027 | 2,500,000 | 3,156,900 |
| Commonwealth Financing Authority Tobacco Master Settlement Payment | | 5.00 | 6-1-2028 | 2,500,000 | 3,228,075 |
| | | | | | 6,384,975 |
| Transportation revenue: 0.98% | | | | | |
| Pennsylvania Turnpike Commission Refunding Bond | | 5.00 | 6-1-2027 | 1,000,000 | 1,257,070 |
| Pennsylvania Turnpike Commission Refunding Bond | | 5.00 | 12-1-2033 | 3,780,000 | 4,363,745 |
| Pennsylvania Turnpike Commission Refunding Bond (AGM Insured) | | 6.00 | 12-1-2030 | 4,220,000 | 5,621,420 |
| Pennsylvania Turnpike Commission Subordinate Bond Series B | | 5.00 | 6-1-2031 | 5,000,000 | 6,126,100 |
| Pennsylvania Turnpike Commission Subordinate Bond Series C (AGM Insured) | | 6.25 | 6-1-2033 | 1,350,000 | 1,721,574 |
| Pennsylvania Turnpike Commission Subordinate Bond Series E | | 6.38 | 12-1-2038 | 2,000,000 | 2,639,360 |
| | | | | | 21,729,269 |
| Water & sewer revenue: 0.65% | | | | | |
| Bucks County PA Water & Sewer Authority Water System (AGM Insured) | | 5.00 | 12-1-2026 | 2,400,000 | 2,505,528 |
| Pennsylvania Capital Region Water System Series of 2017 | | 5.00 | 7-15-2030 | 1,180,000 | 1,470,256 |
| Pennsylvania Capital Region Water System Series of 2018 | | 5.00 | 7-15-2030 | 1,500,000 | 1,915,755 |
| Philadelphia PA Water and Wastewater Bond Series B | | 5.00 | 11-1-2027 | 1,535,000 | 1,971,370 |
| Philadelphia PA Water and Wastewater Bond Series B | | 5.00 | 11-1-2033 | 1,760,000 | 2,206,354 |
| Pittsburgh PA Water and Sewer Authority First Lien Series B (AGM Insured) | | 4.00 | 9-1-2035 | 575,000 | 717,451 |
| Pittsburgh PA Water and Sewer Authority First Lien Series B (AGM Insured) | | 5.00 | 9-1-2031 | 670,000 | 909,646 |
The accompanying notes are an integral part of these financial statements.
40 | Wells Fargo Intermediate Tax/AMT-Free Fund
Portfolio of investments—December 31, 2020 (unaudited)
| | | Interest
rate | Maturity
date | Principal | Value |
| Water & sewer revenue (continued) | | | | | |
| Pittsburgh PA Water and Sewer Authority First Lien Series B (AGM Insured) | | 5.00% | 9-1-2032 | $ 910,000 | $ 1,227,745 |
| Pittsburgh PA Water and Sewer Authority First Lien Series B (AGM Insured) | | 5.00 | 9-1-2033 | 675,000 | 906,107 |
| Pittsburgh PA Water and Sewer Authority First Lien Series B (AGM Insured) | | 5.00 | 9-1-2034 | 500,000 | 669,545 |
| | | | | | 14,499,757 |
| | | | | | 239,953,872 |
| South Carolina: 0.60% | | | | | |
| Education revenue: 0.34% | | | | | |
| South Carolina Education Assistance Authority Student Loan Series I | | 5.00 | 10-1-2024 | 925,000 | 925,342 |
| South Carolina Jobs EDA Furman University Project | | 5.00 | 10-1-2028 | 700,000 | 812,490 |
| South Carolina Jobs EDA Furman University Project | | 5.00 | 10-1-2030 | 1,885,000 | 2,171,746 |
| South Carolina Jobs EDA Furman University Project | | 5.00 | 10-1-2031 | 2,155,000 | 2,476,052 |
| South Carolina Jobs EDA York Preparatory Academy Project Series A | | 7.00 | 11-1-2033 | 1,090,000 | 1,212,102 |
| | | | | | 7,597,732 |
| Health revenue: 0.01% | | | | | |
| South Carolina Jobs EDA Prisma Health Obligated Group Series C ø | | 0.25 | 5-1-2048 | 275,000 | 275,000 |
| Miscellaneous revenue: 0.25% | | | | | |
| Laurens County SC Education Assistance for District #55 | | 5.00 | 12-1-2021 | 1,000,000 | 1,042,750 |
| Laurens County SC Education Assistance for District #55 | | 5.00 | 12-1-2022 | 1,250,000 | 1,349,825 |
| Laurens County SC Education Assistance for District #55 | | 5.00 | 12-1-2025 | 1,000,000 | 1,201,300 |
| Scago SC Educational Facilities Corporation for Sumter County School District #17 | | 5.00 | 12-1-2022 | 1,720,000 | 1,823,613 |
| | | | | | 5,417,488 |
| | | | | | 13,290,220 |
| Tennessee: 0.69% | | | | | |
| Education revenue: 0.04% | | | | | |
| Franklin County TN HEFA | | 4.00 | 9-1-2024 | 250,000 | 265,228 |
| Franklin County TN HEFA | | 5.00 | 9-1-2030 | 560,000 | 600,930 |
| | | | | | 866,158 |
| Housing revenue: 0.08% | | | | | |
| Chattanooga TN Health Educational & Housing Facilities University of Tennessee at Chattanooga Project | | 5.00 | 10-1-2023 | 750,000 | 787,110 |
| Chattanooga TN Health Educational & Housing Facilities University of Tennessee at Chattanooga Project | | 5.00 | 10-1-2028 | 1,000,000 | 1,059,990 |
| | | | | | 1,847,100 |
The accompanying notes are an integral part of these financial statements.
Wells Fargo Intermediate Tax/AMT-Free Fund | 41
Portfolio of investments—December 31, 2020 (unaudited)
| | | Interest
rate | Maturity
date | Principal | Value |
| Utilities revenue: 0.57% | | | | | |
| Tennessee Energy Acquisition Corporation Gas Project | | 4.00% | 11-1-2049 | $11,000,000 | $ 12,637,130 |
| | | | | | 15,350,388 |
| Texas: 5.82% | | | | | |
| Airport revenue: 0.84% | | | | | |
| Dallas & Fort Worth TX International Airport Refunding Bond Series A | | 4.00 | 11-1-2034 | 2,500,000 | 3,052,850 |
| Dallas & Fort Worth TX International Airport Refunding Bond Series A | | 4.00 | 11-1-2035 | 2,500,000 | 3,042,450 |
| Galveston TX Wharves & Terminal | | 5.00 | 2-1-2026 | 2,000,000 | 2,002,700 |
| Houston TX Airport System Subordinate Lien Refunding Bond Series D | | 5.00 | 7-1-2033 | 3,010,000 | 3,748,835 |
| Houston TX Airport System Subordinate Lien Refunding Bond Series D | | 5.00 | 7-1-2034 | 3,500,000 | 4,351,830 |
| Houston TX Airport System Subordinate Lien Refunding Bond Series D | | 5.00 | 7-1-2035 | 2,000,000 | 2,481,560 |
| | | | | | 18,680,225 |
| Education revenue: 0.25% | | | | | |
| Houston TX Higher Education Finance Corporation Series A | | 4.00 | 2-15-2022 | 270,000 | 275,503 |
| University of Houston Texas Series B | | 5.25 | 7-1-2026 | 4,225,000 | 5,345,893 |
| | | | | | 5,621,396 |
| GO revenue: 2.57% | | | | | |
| Austin TX Independent School District Series B | | 5.00 | 8-1-2024 | 3,970,000 | 4,636,206 |
| Austin TX Independent School District Series B | | 5.00 | 8-1-2025 | 2,050,000 | 2,486,117 |
| Austin TX Independent School District Series B | | 5.00 | 8-1-2026 | 1,450,000 | 1,759,938 |
| Austin TX Public Improvement Bond | | 5.00 | 9-1-2030 | 960,000 | 1,222,675 |
| Bexar County TX Hospital District Refunding Bond | | 5.00 | 2-15-2037 | 1,250,000 | 1,575,563 |
| Collin County TX Unlimited Tax Road & Refunding Bond | | 5.00 | 2-15-2026 | 1,000,000 | 1,193,140 |
| Collin County TX Unlimited Tax Road & Refunding Bond | | 5.00 | 2-15-2027 | 1,300,000 | 1,549,327 |
| Crane County TX Water District Unlimited Tax Bond | | 5.00 | 2-15-2023 | 1,395,000 | 1,528,195 |
| Crane County TX Water District Unlimited Tax Bond | | 5.00 | 2-15-2026 | 1,000,000 | 1,176,070 |
| Crane County TX Water District Unlimited Tax Bond | | 5.00 | 2-15-2030 | 1,130,000 | 1,303,150 |
| Crane County TX Water District Unlimited Tax Bond | | 5.00 | 2-15-2031 | 1,000,000 | 1,150,560 |
| Del Rio TX Refunding Bond (BAM Insured) | | 4.00 | 6-1-2023 | 720,000 | 783,137 |
| Del Rio TX Refunding Bond (BAM Insured) | | 4.00 | 6-1-2024 | 745,000 | 835,510 |
| Denton County TX Permanent Improvement & Refunding Bond | | 5.00 | 7-15-2024 | 1,145,000 | 1,335,665 |
| Denton County TX Permanent Improvement & Refunding Bond | | 5.00 | 7-15-2025 | 1,000,000 | 1,168,830 |
| Denton County TX Permanent Improvement & Refunding Bond | | 5.00 | 7-15-2030 | 1,000,000 | 1,168,650 |
| El Paso County TX Hospital District | | 5.00 | 8-15-2028 | 2,045,000 | 2,177,496 |
| El Paso County TX Refunding Bond Series A | | 5.00 | 2-15-2031 | 2,000,000 | 2,437,520 |
| El Paso County TX Refunding Bond Series A | | 5.00 | 2-15-2032 | 2,120,000 | 2,581,376 |
| Flower Mound, Denton & Tarrant Counties TX Refunding Bond | | 4.00 | 3-1-2026 | 755,000 | 870,515 |
| Fort Worth TX Independent School District Unlimited Tax Refunding and School Building Bond | | 5.00 | 2-15-2026 | 3,000,000 | 3,717,660 |
| Harris County TX Toll Road Project Series C (AGM Insured) | | 5.25 | 8-15-2027 | 4,000,000 | 5,237,480 |
| Hays County TX Limited Tax Bond | | 5.00 | 2-15-2027 | 1,000,000 | 1,266,120 |
The accompanying notes are an integral part of these financial statements.
42 | Wells Fargo Intermediate Tax/AMT-Free Fund
Portfolio of investments—December 31, 2020 (unaudited)
| | | Interest
rate | Maturity
date | Principal | Value |
| GO revenue (continued) | | | | | |
| Plano TX | | 5.00% | 9-1-2030 | $ 2,155,000 | $ 2,711,723 |
| San Antonio TX Certificate of Obligation | | 5.00 | 8-1-2036 | 3,990,000 | 5,111,589 |
| San Antonio TX Independent School District Unlimited Tax Series 2018 | | 5.00 | 8-15-2037 | 2,000,000 | 2,379,400 |
| Texas Independent School District Refunding Bond | | 5.00 | 8-15-2025 | 2,260,000 | 2,734,374 |
| Viridian TX Municipal Management District Unlimited Road Improvement Bond (BAM Insured) | | 4.00 | 12-1-2030 | 710,000 | 786,794 |
| | | | | | 56,884,780 |
| Miscellaneous revenue: 0.33% | | | | | |
| Austin TX Community College District Public Facility Corporation Bond Series C | | 5.00 | 8-1-2026 | 565,000 | 705,499 |
| Austin TX Community College District Public Facility Corporation Bond Series C | | 5.00 | 8-1-2029 | 400,000 | 507,616 |
| Austin TX Community College District Public Facility Corporation Bond Series C | | 5.00 | 8-1-2030 | 500,000 | 631,670 |
| Lower Colorado River TX Authority | | 5.50 | 5-15-2031 | 2,500,000 | 2,783,250 |
| Nueces River TX Water Supply Facility Corpus Christi Lake Texana Project | | 5.00 | 7-15-2026 | 1,000,000 | 1,200,230 |
| Nueces River TX Water Supply Facility Corpus Christi Lake Texana Project | | 5.00 | 7-15-2027 | 1,250,000 | 1,499,050 |
| | | | | | 7,327,315 |
| Tax revenue: 0.42% | | | | | |
| Houston TX Old Spanish Trail Almeda Corridors Redevelopment Authority (BAM Insured) | | 4.00 | 9-1-2031 | 1,540,000 | 1,838,637 |
| Texas Midtown RDA Refunding Bond (BAM Insured) | | 5.25 | 1-1-2027 | 1,880,000 | 2,051,118 |
| Texas Midtown RDA Refunding Bond (BAM Insured) | | 5.25 | 1-1-2029 | 2,390,000 | 2,604,048 |
| Texas Midtown RDA Refunding Bond (BAM Insured) | | 5.25 | 1-1-2030 | 1,500,000 | 1,633,095 |
| Texas Midtown RDA Refunding Bond (BAM Insured) | | 5.25 | 1-1-2031 | 1,000,000 | 1,088,730 |
| | | | | | 9,215,628 |
| Transportation revenue: 0.43% | | | | | |
| Texas Grand Parkway Transportation Corporation System Series A | | 5.00 | 10-1-2034 | 1,500,000 | 1,914,255 |
| Texas Private Activity Surface Transportation Corporation Senior Lien Series A | | 5.00 | 12-31-2035 | 3,000,000 | 3,827,520 |
| Texas Private Activity Surface Transportation Corporation Senior Lien Series A | | 5.00 | 12-31-2036 | 3,015,000 | 3,836,196 |
| | | | | | 9,577,971 |
| Utilities revenue: 0.66% | | | | | |
| Austin TX Refunding Bond (National Insured) | | 5.25 | 5-15-2025 | 1,400,000 | 1,553,594 |
| Brownsville TX Utilities System Refunding Bond | | 5.00 | 9-1-2026 | 2,190,000 | 2,625,941 |
| Brownsville TX Utilities System Refunding Bond | | 5.00 | 9-1-2029 | 1,500,000 | 1,790,220 |
| Brownsville TX Utilities System Refunding Bond | | 5.00 | 9-1-2030 | 2,500,000 | 2,979,900 |
| Texas Municipal Gas Acquisition & Supply Corporation III Gas Supply Series 2012 | | 5.00 | 12-15-2021 | 3,945,000 | 4,113,964 |
| Weatherford TX Utility System Refunding & Improvement Bond (AGM Insured) | | 5.00 | 9-1-2025 | 1,000,000 | 1,202,630 |
| Weatherford TX Utility System Refunding & Improvement Bond (AGM Insured) | | 5.00 | 9-1-2026 | 375,000 | 452,329 |
| | | | | | 14,718,578 |
The accompanying notes are an integral part of these financial statements.
Wells Fargo Intermediate Tax/AMT-Free Fund | 43
Portfolio of investments—December 31, 2020 (unaudited)
| | | Interest
rate | Maturity
date | Principal | Value |
| Water & sewer revenue: 0.32% | | | | | |
| Amarillo TX Waterworks and Sewer System Bond Series B | | 5.00% | 4-1-2028 | $ 645,000 | $ 845,976 |
| North Harris County TX Regional Water Authority Senior Lien (BAM Insured) | | 5.00 | 12-15-2029 | 1,215,000 | 1,319,514 |
| Tarrant TX Water Project Refunding Bond | | 4.00 | 2-1-2027 | 1,000,000 | 1,175,220 |
| Texas Water Development Board State Implementation Series A | | 4.00 | 10-15-2032 | 3,000,000 | 3,671,130 |
| | | | | | 7,011,840 |
| | | | | | 129,037,733 |
| Utah: 0.34% | | | | | |
| Education revenue: 0.16% | | | | | |
| University of Utah (Citibank NA LIQ)144Aø | | 0.13 | 8-1-2021 | 680,000 | 680,000 |
| Utah Charter School Finance Authority Refunding Bond (CSCE Insured) | | 4.00 | 4-15-2021 | 400,000 | 403,844 |
| Utah Charter School Finance Authority Refunding Bond (CSCE Insured) | | 4.00 | 4-15-2022 | 400,000 | 417,596 |
| Utah Charter School Finance Authority Refunding Bond (CSCE Insured) | | 4.00 | 4-15-2023 | 400,000 | 428,700 |
| Utah Charter School Finance Authority Refunding Bond (CSCE Insured) | | 4.00 | 4-15-2024 | 450,000 | 495,981 |
| Utah Charter School Finance Authority Refunding Bond (CSCE Insured)144A | | 4.50 | 6-15-2027 | 1,025,000 | 1,113,827 |
| | | | | | 3,539,948 |
| Miscellaneous revenue: 0.18% | | | | | |
| West Valley UT Municipal Building Authority (AGM Insured) | | 5.00 | 2-1-2028 | 1,000,000 | 1,255,950 |
| West Valley UT Municipal Building Authority (AGM Insured) | | 5.00 | 2-1-2032 | 1,555,000 | 1,918,886 |
| West Valley UT Municipal Building Authority (AGM Insured) | | 5.00 | 2-1-2033 | 645,000 | 792,434 |
| | | | | | 3,967,270 |
| | | | | | 7,507,218 |
| Virginia: 0.29% | | | | | |
| Education revenue: 0.16% | | | | | |
| Virginia Small Business Financing Authority | | 5.25 | 10-1-2029 | 3,000,000 | 3,504,360 |
| Industrial development revenue: 0.03% | | | | | |
| Fairfax County VA EDA Mount Vernon Ladies Association Project (Truist Bank LOC)ø | | 0.12 | 6-1-2037 | 740,000 | 740,000 |
| Tax revenue: 0.10% | | | | | |
| Greater Richmond VA Convention Center | | 5.00 | 6-15-2025 | 1,000,000 | 1,164,060 |
| Marquis VA CDA CAB Series 2015 144A¤ | | 0.00 | 9-1-2045 | 386,000 | 196,860 |
| Marquis VA CDA CAB Series C ¤ | | 0.00 | 9-1-2041 | 1,772,000 | 91,045 |
| Marquis VA CDA Series B | | 5.63 | 9-1-2041 | 1,274,000 | 649,727 |
| | | | | | 2,101,692 |
| | | | | | 6,346,052 |
The accompanying notes are an integral part of these financial statements.
44 | Wells Fargo Intermediate Tax/AMT-Free Fund
Portfolio of investments—December 31, 2020 (unaudited)
| | | Interest
rate | Maturity
date | Principal | Value |
| Washington: 4.60% | | | | | |
| Education revenue: 0.05% | | | | | |
| Washington EDFA | | 5.00% | 6-1-2028 | $ 1,000,000 | $ 1,150,500 |
| GO revenue: 1.68% | | | | | |
| King County WA Public Hospital District #1 Valley Medical Center Refunding Bond | | 5.00 | 12-1-2029 | 1,600,000 | 1,917,840 |
| King County WA Public Hospital District #1 Valley Medical Center Refunding Bond | | 5.00 | 12-1-2031 | 6,665,000 | 7,977,005 |
| King County WA Public Hospital District #1 Valley Medical Center Refunding Bond | | 5.00 | 12-1-2032 | 2,905,000 | 3,470,836 |
| King County WA Public Hospital District #1 Valley Medical Center Refunding Bond | | 5.00 | 12-1-2033 | 7,045,000 | 8,393,272 |
| King County WA Public Hospital District #1 Valley Medical Center Refunding Bonds | | 5.00 | 12-1-2026 | 775,000 | 936,991 |
| Washington Various Purposes Bond Series C | | 5.00 | 2-1-2034 | 5,800,000 | 7,038,300 |
| Washington Various Purposes Refunding Bond Series A | | 5.00 | 8-1-2036 | 2,000,000 | 2,638,700 |
| Washington Various Purposes Refunding Bond Series B | | 5.00 | 7-1-2028 | 4,000,000 | 4,888,440 |
| | | | | | 37,261,384 |
| Health revenue: 0.71% | | | | | |
| Washington HCFR Fred Hutchinson Cancer Research Center (SIFMA Municipal Swap+1.05%)± | | 1.14 | 1-1-2042 | 10,000,000 | 10,094,300 |
| Washington HCFR Fred Hutchinson Cancer Research Center | | 5.00 | 1-1-2026 | 2,250,000 | 2,693,565 |
| Washington HCFR Fred Hutchinson Cancer Research Center | | 5.00 | 1-1-2027 | 1,050,000 | 1,250,235 |
| Washington HCFR Fred Hutchinson Cancer Research Center | | 5.00 | 1-1-2028 | 1,350,000 | 1,598,832 |
| | | | | | 15,636,932 |
| Housing revenue: 0.50% | | | | | |
| Snohomish County WA Housing Authority Carvel Apartments Project | | 5.00 | 4-1-2032 | 1,955,000 | 2,476,399 |
| Snohomish County WA Housing Authority Carvel Apartments Project | | 5.00 | 4-1-2033 | 1,550,000 | 1,952,923 |
| Snohomish County WA Housing Authority Carvel Apartments Project | | 5.00 | 4-1-2034 | 655,000 | 822,752 |
| Washington Housing Finance Commission Downtowner Apartments Project (FHLMC LIQ) | | 3.70 | 7-1-2030 | 5,000,000 | 5,783,050 |
| | | | | | 11,035,124 |
| Miscellaneous revenue: 0.88% | | | | | |
| Washington Certificate of Participation Series B | | 5.00 | 7-1-2037 | 1,585,000 | 2,065,952 |
| Washington Lease FYI Properties Refunding Bond | | 5.00 | 6-1-2034 | 6,000,000 | 7,417,320 |
| Washington Motor Vehicle Fuel Tax Refunding Bond Series D | | 5.00 | 7-1-2031 | 5,830,000 | 6,872,404 |
| Washington Office Building Refunding Bond | | 5.00 | 7-1-2026 | 2,750,000 | 3,180,045 |
| | | | | | 19,535,721 |
| Resource recovery revenue: 0.26% | | | | | |
| Seattle WA Solid Waste System Improvement & Refunding Bond | | 4.00 | 6-1-2033 | 1,175,000 | 1,348,971 |
| Tacoma WA Solid Waste Refunding Bond Series B | | 5.00 | 12-1-2027 | 620,000 | 765,830 |
The accompanying notes are an integral part of these financial statements.
Wells Fargo Intermediate Tax/AMT-Free Fund | 45
Portfolio of investments—December 31, 2020 (unaudited)
| | | Interest
rate | Maturity
date | Principal | Value |
| Resource recovery revenue (continued) | | | | | |
| Tacoma WA Solid Waste Refunding Bond Series B | | 5.00% | 12-1-2028 | $ 1,455,000 | $ 1,795,485 |
| Tacoma WA Solid Waste Refunding Bond Series B | | 5.00 | 12-1-2029 | 1,525,000 | 1,878,205 |
| | | | | | 5,788,491 |
| Utilities revenue: 0.52% | | | | | |
| Chelan County WA Public Utility District #1 Refunding Bond Series A | | 4.00 | 7-1-2038 | 2,805,000 | 3,447,682 |
| Energy Northwest Washington Wind Project | | 5.00 | 7-1-2022 | 1,185,000 | 1,264,182 |
| Lewis County WA Public Utility District Refunding Bond | | 5.25 | 4-1-2032 | 6,115,000 | 6,906,893 |
| | | | | | 11,618,757 |
| | | | | | 102,026,909 |
| West Virginia: 0.80% | | | | | |
| GO revenue: 0.37% | | | | | |
| Ohio County WV Public School Bond | | 3.00 | 6-1-2027 | 2,740,000 | 3,144,150 |
| West Virginia State Road Bond Series 2018 B | | 5.00 | 12-1-2036 | 4,000,000 | 5,115,200 |
| | | | | | 8,259,350 |
| Health revenue: 0.08% | | | | | |
| West Virginia Hospital Finance Authority West Virginia University Health System Series A | | 5.00 | 6-1-2031 | 375,000 | 462,570 |
| West Virginia Hospital Finance Authority West Virginia University Health System Series A | | 5.00 | 6-1-2032 | 980,000 | 1,203,871 |
| | | | | | 1,666,441 |
| Miscellaneous revenue: 0.35% | | | | | |
| West Virginia EDA Excess Lottery Series A | | 5.00 | 7-1-2038 | 2,980,000 | 3,761,594 |
| West Virginia School Building Authority Capital Improvement Bond Series A | | 5.00 | 7-1-2027 | 1,595,000 | 1,913,298 |
| West Virginia School Building Authority Capital Improvement Bond Series A | | 5.00 | 7-1-2029 | 1,755,000 | 2,094,873 |
| | | | | | 7,769,765 |
| | | | | | 17,695,556 |
| Wisconsin: 0.57% | | | | | |
| Education revenue: 0.30% | | | | | |
| Wisconsin PFA Charter School Voyager Foundation Incorporated Project Series A | | 6.00 | 10-1-2032 | 1,475,000 | 1,618,252 |
| Wisconsin PFA KU Campus Development Corporation Central District Development Project | | 5.00 | 3-1-2032 | 4,315,000 | 5,065,422 |
| | | | | | 6,683,674 |
| Health revenue: 0.12% | | | | | |
| Wisconsin HEFA Series A | | 4.00 | 11-15-2039 | 2,250,000 | 2,559,533 |
| Miscellaneous revenue: 0.06% | | | | | |
| Milwaukee WI RDA Public Schools | | 5.00 | 11-15-2029 | 420,000 | 517,138 |
| Milwaukee WI RDA Public Schools | | 5.00 | 11-15-2030 | 635,000 | 780,231 |
| | | | | | 1,297,369 |
The accompanying notes are an integral part of these financial statements.
46 | Wells Fargo Intermediate Tax/AMT-Free Fund
Portfolio of investments—December 31, 2020 (unaudited)
| | | Interest
rate | Maturity
date | Principal | Value |
| Tax revenue: 0.09% | | | | | |
| Wisconsin Center District Senior Dedicated Tax Bond Series C (AGM Insured)¤ | | 0.00% | 12-15-2034 | $ 1,250,000 | $ 901,038 |
| Wisconsin Center District Senior Dedicated Tax Bond Series C (AGM Insured)¤ | | 0.00 | 12-15-2035 | 1,600,000 | 1,107,008 |
| | | | | | 2,008,046 |
| | | | | | 12,548,622 |
| Total Municipal obligations (Cost $2,021,993,815) | | | | | 2,188,216,584 |
| Total investments in securities (Cost $2,021,993,815) | 98.71% | | | | 2,188,216,584 |
| Other assets and liabilities, net | 1.29 | | | | 28,500,154 |
| Total net assets | 100.00% | | | | $2,216,716,738 |
| ø | Variable rate demand notes are subject to a demand feature which reduces the effective maturity. The maturity date shown represents the final maturity date of the security. The interest rate is determined and reset by the issuer daily, weekly, or monthly depending upon the terms of the security. The rate shown is the rate in effect at period end. |
| ± | Variable rate investment. The rate shown is the rate in effect at period end. |
| ¤ | The security is issued in zero coupon form with no periodic interest payments. |
| 144A | The security may be resold in transactions exempt from registration, normally to qualified institutional buyers, pursuant to Rule 144A under the Securities Act of 1933. |
| Abbreviations: |
| AGC | Assured Guaranty Corporation |
| AGM | Assured Guaranty Municipal |
| Ambac | Ambac Financial Group Incorporated |
| BAM | Build America Mutual Assurance Company |
| CAB | Capital appreciation bond |
| CDA | Community Development Authority |
| ECFA | Educational & Cultural Facilities Authority |
| EDA | Economic Development Authority |
| EDFA | Economic Development Finance Authority |
| FHLMC | Federal Home Loan Mortgage Corporation |
| FNMA | Federal National Mortgage Association |
| GNMA | Government National Mortgage Association |
| GO | General obligation |
| HCFR | Healthcare facilities revenue |
| HEFA | Health & Educational Facilities Authority |
| HEFAR | Higher Education Facilities Authority Revenue |
| HFA | Housing Finance Authority |
| IDA | Industrial Development Authority |
| LIBOR | London Interbank Offered Rate |
| LIQ | Liquidity agreement |
| LOC | Letter of credit |
| National | National Public Finance Guarantee Corporation |
| PFA | Public Finance Authority |
| RDA | Redevelopment Authority |
| SIFMA | Securities Industry and Financial Markets Association |
| SPA | Standby purchase agreement |
| TTFA | Transportation Trust Fund Authority |
The accompanying notes are an integral part of these financial statements.
Wells Fargo Intermediate Tax/AMT-Free Fund | 47
Statement of assets and liabilities—December 31, 2020 (unaudited)
| | |
| Assets | |
Investments in unaffiliated securities, at value (cost $2,021,993,815)
| $ 2,188,216,584 |
Cash
| 11,728,718 |
Receivable for interest
| 24,112,958 |
Receivable for investments sold
| 1,716,141 |
Receivable for Fund shares sold
| 950,890 |
Prepaid expenses and other assets
| 57,043 |
Total assets
| 2,226,782,334 |
| Liabilities | |
Payable for Fund shares redeemed
| 5,624,028 |
Dividends payable
| 2,236,402 |
Payable for investments purchased
| 1,262,122 |
Management fee payable
| 692,639 |
Administration fees payable
| 147,175 |
Distribution fee payable
| 9,299 |
Trustees’ fees and expenses payable
| 2,322 |
Accrued expenses and other liabilities
| 91,609 |
Total liabilities
| 10,065,596 |
Total net assets
| $2,216,716,738 |
| Net assets consist of | |
Paid-in capital
| $ 2,075,065,752 |
Total distributable earnings
| 141,650,986 |
Total net assets
| $2,216,716,738 |
| Computation of net asset value and offering price per share | |
Net assets – Class A
| $ 255,008,360 |
Shares outstanding – Class A1
| 21,393,100 |
Net asset value per share – Class A
| $11.92 |
Maximum offering price per share – Class A2
| $12.29 |
Net assets – Class C
| $ 13,270,495 |
Shares outstanding – Class C1
| 1,113,247 |
Net asset value per share – Class C
| $11.92 |
Net assets – Class R6
| $ 838,216,754 |
Shares outstanding – Class R61
| 70,242,245 |
Net asset value per share – Class R6
| $11.93 |
Net assets – Administrator Class
| $ 49,309,267 |
Shares outstanding – Administrator Class1
| 4,134,043 |
Net asset value per share – Administrator Class
| $11.93 |
Net assets – Institutional Class
| $ 1,060,911,862 |
Shares outstanding – Institutional Class1
| 88,872,105 |
Net asset value per share – Institutional Class
| $11.94 |
| 1 | The Fund has an unlimited number of authorized shares |
| 2 | Maximum offering price is computed as 100/97 of net asset value. On investments of $50,000 or more, the offering price is reduced. |
The accompanying notes are an integral part of these financial statements.
48 | Wells Fargo Intermediate Tax/AMT-Free Fund
Statement of operations—six months ended December 31, 2020 (unaudited)
| | |
| Investment income | |
Interest
| $ 35,301,801 |
| Expenses | |
Management fee
| 4,560,537 |
| Administration fees | |
Class A
| 207,904 |
Class C
| 13,039 |
Class R6
| 155,723 |
Administrator Class
| 26,510 |
Institutional Class
| 451,555 |
| Shareholder servicing fees | |
Class A
| 324,479 |
Class C
| 20,343 |
Administrator Class
| 65,632 |
| Distribution fee | |
Class C
| 61,024 |
Custody and accounting fees
| 50,184 |
Professional fees
| 31,805 |
Registration fees
| 71,073 |
Shareholder report expenses
| 53,388 |
Trustees’ fees and expenses
| 9,873 |
Other fees and expenses
| 29,692 |
Total expenses
| 6,132,761 |
| Less: Fee waivers and/or expense reimbursements | |
Fund-level
| (245,015) |
Class A
| (63,499) |
Class C
| (3,810) |
Administrator Class
| (17,609) |
Institutional Class
| (3,027) |
Net expenses
| 5,799,801 |
Net investment income
| 29,502,000 |
| Realized and unrealized gains (losses) on investments | |
Net realized gains on investments
| 18,740,858 |
Net change in unrealized gains (losses) on investments
| 20,322,790 |
Net realized and unrealized gains (losses) on investments
| 39,063,648 |
Net increase in net assets resulting from operations
| $68,565,648 |
The accompanying notes are an integral part of these financial statements.
Wells Fargo Intermediate Tax/AMT-Free Fund | 49
Statement of changes in net assets
| | |
| | Six months ended
December 31, 2020
(unaudited) | Year ended
June 30, 2020 |
| Operations | | | | |
Net investment income
| | $ 29,502,000 | | $ 66,061,506 |
Net realized gains (losses) on investments
| | 18,740,858 | | (11,184,895) |
Net change in unrealized gains (losses) on investments
| | 20,322,790 | | 16,254,772 |
Net increase in net assets resulting from operations
| | 68,565,648 | | 71,131,383 |
| Distributions to shareholders from | | | | |
| Net investment income and net realized gains | | | | |
Class A
| | (2,774,351) | | (5,665,902) |
Class C
| | (111,779) | | (320,518) |
Class R6
| | (12,558,381) | | (27,533,926) |
Administrator Class
| | (589,316) | | (3,954,214) |
Institutional Class
| | (13,415,721) | | (28,315,374) |
Total distributions to shareholders
| | (29,449,548) | | (65,789,934) |
| Capital share transactions | Shares | | Shares | |
| Proceeds from shares sold | | | | |
Class A
| 1,827,124 | 21,612,574 | 2,965,506 | 34,620,862 |
Class C
| 106,562 | 1,259,218 | 144,337 | 1,694,521 |
Class R6
| 9,905,246 | 117,240,558 | 46,910,464 | 549,315,972 |
Administrator Class
| 184,587 | 2,188,453 | 5,072,549 | 59,288,034 |
Institutional Class
| 7,209,652 | 85,374,768 | 24,518,409 | 286,969,473 |
| | | 227,675,571 | | 931,888,862 |
| Reinvestment of distributions | | | | |
Class A
| 219,753 | 2,601,352 | 464,092 | 5,437,440 |
Class C
| 9,022 | 106,761 | 24,503 | 287,109 |
Class R6
| 287,686 | 3,406,306 | 821,396 | 9,637,135 |
Administrator Class
| 47,093 | 557,821 | 327,038 | 3,835,145 |
Institutional Class
| 976,436 | 11,575,077 | 2,101,021 | 24,658,105 |
| | | 18,247,317 | | 43,854,934 |
| Payment for shares redeemed | | | | |
Class A
| (1,957,814) | (23,181,144) | (4,686,618) | (54,404,248) |
Class C
| (630,247) | (7,441,834) | (833,633) | (9,778,713) |
Class R6
| (38,740,842) | (457,561,253) | (34,293,227) | (395,802,003) |
Administrator Class
| (1,250,014) | (14,764,551) | (15,478,688) | (180,152,457) |
Institutional Class
| (15,206,410) | (179,576,718) | (33,441,703) | (390,400,383) |
| | | (682,525,500) | | (1,030,537,804) |
Net decrease in net assets resulting from capital share transactions
| | (436,602,612) | | (54,794,008) |
Total decrease in net assets
| | (397,486,512) | | (49,452,559) |
| Net assets | | | | |
Beginning of period
| | 2,614,203,250 | | 2,663,655,809 |
End of period
| | $2,216,716,738 | | $ 2,614,203,250 |
The accompanying notes are an integral part of these financial statements.
50 | Wells Fargo Intermediate Tax/AMT-Free Fund
Financial highlights
(For a share outstanding throughout each period)
| | | Year ended June 30 |
| Class A | Six months ended
December 31, 2020
(unaudited) | 2020 | 2019 | 2018 | 2017 | 2016 |
Net asset value, beginning of period
| $11.72 | $11.66 | $11.31 | $11.46 | $11.89 | $11.47 |
Net investment income
| 0.13 | 0.26 | 0.28 | 0.27 | 0.27 | 0.26 |
Net realized and unrealized gains (losses) on investments
| 0.20 | 0.05 | 0.35 | (0.15) | (0.42) | 0.42 |
Total from investment operations
| 0.33 | 0.31 | 0.63 | 0.12 | (0.15) | 0.68 |
| Distributions to shareholders from | | | | | | |
Net investment income
| (0.13) | (0.25) | (0.28) | (0.27) | (0.27) | (0.26) |
Net realized gains
| 0.00 | 0.00 | 0.00 | 0.00 | (0.01) | 0.00 |
Total distributions to shareholders
| (0.13) | (0.25) | (0.28) | (0.27) | (0.28) | (0.26) |
Net asset value, end of period
| $11.92 | $11.72 | $11.66 | $11.31 | $11.46 | $11.89 |
Total return1
| 2.80% | 2.72% | 5.67% | 1.08% | (1.27)% | 5.99% |
| Ratios to average net assets (annualized) | | | | | | |
Gross expenses
| 0.80% | 0.79% | 0.80% | 0.80% | 0.79% | 0.80% |
Net expenses
| 0.70% | 0.70% | 0.70% | 0.70% | 0.70% | 0.70% |
Net investment income
| 2.14% | 2.18% | 2.47% | 2.38% | 2.31% | 2.23% |
| Supplemental data | | | | | | |
Portfolio turnover rate
| 8% | 24% | 14% | 14% | 19% | 14% |
Net assets, end of period (000s omitted)
| $255,008 | $249,724 | $263,113 | $287,408 | $359,649 | $556,673 |
| 1 | Total return calculations do not include any sales charges. Returns for periods of less than one year are not annualized. |
The accompanying notes are an integral part of these financial statements.
Wells Fargo Intermediate Tax/AMT-Free Fund | 51
Financial highlights
(For a share outstanding throughout each period)
| | | Year ended June 30 |
| Class C | Six months ended
December 31, 2020
(unaudited) | 2020 | 2019 | 2018 | 2017 | 2016 |
Net asset value, beginning of period
| $11.72 | $11.66 | $11.31 | $11.46 | $11.89 | $11.47 |
Net investment income
| 0.08 | 0.17 | 0.20 | 0.19 | 0.18 | 0.17 |
Net realized and unrealized gains (losses) on investments
| 0.20 | 0.06 | 0.35 | (0.15) | (0.42) | 0.42 |
Total from investment operations
| 0.28 | 0.23 | 0.55 | 0.04 | (0.24) | 0.59 |
| Distributions to shareholders from | | | | | | |
Net investment income
| (0.08) | (0.17) | (0.20) | (0.19) | (0.18) | (0.17) |
Net realized gains
| 0.00 | 0.00 | 0.00 | 0.00 | (0.01) | 0.00 |
Total distributions to shareholders
| (0.08) | (0.17) | (0.20) | (0.19) | (0.19) | (0.17) |
Net asset value, end of period
| $11.92 | $11.72 | $11.66 | $11.31 | $11.46 | $11.89 |
Total return1
| 2.42% | 1.95% | 4.88% | 0.32% | (2.01)% | 5.20% |
| Ratios to average net assets (annualized) | | | | | | |
Gross expenses
| 1.54% | 1.54% | 1.55% | 1.55% | 1.54% | 1.55% |
Net expenses
| 1.45% | 1.45% | 1.45% | 1.45% | 1.45% | 1.45% |
Net investment income
| 1.38% | 1.43% | 1.73% | 1.63% | 1.56% | 1.48% |
| Supplemental data | | | | | | |
Portfolio turnover rate
| 8% | 24% | 14% | 14% | 19% | 14% |
Net assets, end of period (000s omitted)
| $13,270 | $19,082 | $26,737 | $35,421 | $44,462 | $56,601 |
| 1 | Total return calculations do not include any sales charges. Returns for periods of less than one year are not annualized. |
The accompanying notes are an integral part of these financial statements.
52 | Wells Fargo Intermediate Tax/AMT-Free Fund
Financial highlights
(For a share outstanding throughout each period)
| | | Year ended June 30 |
| Class R6 | Six months ended
December 31, 2020
(unaudited) | 2020 | 2019 1 |
Net asset value, beginning of period
| $11.74 | $11.67 | $11.33 |
Net investment income
| 0.15 | 0.29 | 0.29 |
Net realized and unrealized gains (losses) on investments
| 0.19 | 0.07 | 0.34 |
Total from investment operations
| 0.34 | 0.36 | 0.63 |
| Distributions to shareholders from | | | |
Net investment income
| (0.15) | (0.29) | (0.29) |
Net asset value, end of period
| $11.93 | $11.74 | $11.67 |
Total return2
| 2.87% | 3.110% | 5.65% |
| Ratios to average net assets (annualized) | | | |
Gross expenses
| 0.41% | 0.41% | 0.41% |
Net expenses
| 0.40% | 0.40% | 0.40% |
Net investment income
| 2.42% | 2.48% | 2.75% |
| Supplemental data | | | |
Portfolio turnover rate
| 8% | 24% | 14% |
Net assets, end of period (000s omitted)
| $838,217 | $1,159,305 | $996,477 |
| 1 | For the period from July 31, 2018 (commencement of class operations) to June 30, 2019 |
| 2 | Returns for periods of less than one year are not annualized. |
The accompanying notes are an integral part of these financial statements.
Wells Fargo Intermediate Tax/AMT-Free Fund | 53
Financial highlights
(For a share outstanding throughout each period)
| | | Year ended June 30 |
| Administrator Class | Six months ended
December 31, 2020
(unaudited) | 2020 | 2019 | 2018 | 2017 | 2016 |
Net asset value, beginning of period
| $11.73 | $11.67 | $11.32 | $11.47 | $11.90 | $11.48 |
Net investment income
| 0.14 | 0.27 | 0.29 | 0.28 | 0.28 | 0.27 |
Net realized and unrealized gains (losses) on investments
| 0.20 | 0.06 | 0.35 | (0.15) | (0.42) | 0.42 |
Total from investment operations
| 0.34 | 0.33 | 0.64 | 0.13 | (0.14) | 0.69 |
| Distributions to shareholders from | | | | | | |
Net investment income
| (0.14) | (0.27) | (0.29) | (0.28) | (0.28) | (0.27) |
Net realized gains
| 0.00 | 0.00 | 0.00 | 0.00 | (0.01) | 0.00 |
Total distributions to shareholders
| (0.14) | (0.27) | (0.29) | (0.28) | (0.29) | (0.27) |
Net asset value, end of period
| $11.93 | $11.73 | $11.67 | $11.32 | $11.47 | $11.90 |
Total return1
| 2.85% | 2.82% | 5.77% | 1.18% | (1.17)% | 6.09% |
| Ratios to average net assets (annualized) | | | | | | |
Gross expenses
| 0.73% | 0.73% | 0.74% | 0.73% | 0.73% | 0.74% |
Net expenses
| 0.60% | 0.60% | 0.60% | 0.60% | 0.60% | 0.60% |
Net investment income
| 2.23% | 2.28% | 2.57% | 2.48% | 2.39% | 2.33% |
| Supplemental data | | | | | | |
Portfolio turnover rate
| 8% | 24% | 14% | 14% | 19% | 14% |
Net assets, end of period (000s omitted)
| $49,309 | $60,435 | $177,742 | $183,624 | $309,793 | $802,527 |
| 1 | Returns for periods of less than one year are not annualized. |
The accompanying notes are an integral part of these financial statements.
54 | Wells Fargo Intermediate Tax/AMT-Free Fund
Financial highlights
(For a share outstanding throughout each period)
| | | Year ended June 30 |
| Institutional Class | Six months ended
December 31, 2020
(unaudited) | 2020 | 2019 | 2018 | 2017 | 2016 |
Net asset value, beginning of period
| $11.74 | $11.68 | $11.33 | $11.47 | $11.91 | $11.49 |
Net investment income
| 0.14 | 0.28 | 0.31 | 0.30 | 0.30 | 0.29 |
Net realized and unrealized gains (losses) on investments
| 0.20 | 0.06 | 0.35 | (0.14) | (0.43) | 0.42 |
Total from investment operations
| 0.34 | 0.34 | 0.66 | 0.16 | (0.13) | 0.71 |
| Distributions to shareholders from | | | | | | |
Net investment income
| (0.14) | (0.28) | (0.31) | (0.30) | (0.30) | (0.29) |
Net realized gains
| 0.00 | 0.00 | 0.00 | 0.00 | (0.01) | 0.00 |
Total distributions to shareholders
| (0.14) | (0.28) | (0.31) | (0.30) | (0.31) | (0.29) |
Net asset value, end of period
| $11.94 | $11.74 | $11.68 | $11.33 | $11.47 | $11.91 |
Total return1
| 2.93% | 2.97% | 5.93% | 1.42% | (1.10)% | 6.26% |
| Ratios to average net assets (annualized) | | | | | | |
Gross expenses
| 0.47% | 0.46% | 0.47% | 0.47% | 0.47% | 0.47% |
Net expenses
| 0.45% | 0.45% | 0.45% | 0.45% | 0.45% | 0.44% |
Net investment income
| 2.38% | 2.43% | 2.72% | 2.64% | 2.58% | 2.49% |
| Supplemental data | | | | | | |
Portfolio turnover rate
| 8% | 24% | 14% | 14% | 19% | 14% |
Net assets, end of period (000s omitted)
| $1,060,912 | $1,125,657 | $1,199,588 | $1,932,382 | $1,814,841 | $1,260,636 |
| 1 | Returns for periods of less than one year are not annualized. |
The accompanying notes are an integral part of these financial statements.
Wells Fargo Intermediate Tax/AMT-Free Fund | 55
Notes to financial statements (unaudited)
1. ORGANIZATION
Wells Fargo Funds Trust (the “Trust”), a Delaware statutory trust organized on March 10, 1999, is an open-end management investment company registered under the Investment Company Act of 1940, as amended (the “1940 Act”). As an investment company, the Trust follows the accounting and reporting guidance in Financial Accounting Standards Board (“FASB”) Accounting Standards Codification Topic 946, Financial Services – Investment Companies. These financial statements report on the Wells Fargo Intermediate Tax/AMT-Free Fund (the “Fund”) which is a diversified series of the Trust.
2. SIGNIFICANT ACCOUNTING POLICIES
The following significant accounting policies, which are consistently followed in the preparation of the financial statements of the Fund, are in conformity with U.S. generally accepted accounting principles which require management to make estimates and assumptions that affect the reported amounts of assets and liabilities, disclosure of contingent assets and liabilities at the date of the financial statements, and the reported amounts of income and expenses during the reporting period. Actual results could differ from those estimates.
Securities valuation
All investments are valued each business day as of the close of regular trading on the New York Stock Exchange (generally 4 p.m. Eastern Time), although the Fund may deviate from this calculation time under unusual or unexpected circumstances.
Debt securities are valued at the evaluated bid price provided by an independent pricing service (e.g. taking into account various factors, including yields, maturities, or credit ratings) or, if a reliable price is not available, the quoted bid price from an independent broker-dealer.
Investments which are not valued using any of the methods discussed above are valued at their fair value, as determined in good faith by the Board of Trustees of the Fund. The Board of Trustees has established a Valuation Committee comprised of the Trustees and has delegated to it the authority to take any actions regarding the valuation of portfolio securities that the Valuation Committee deems necessary or appropriate, including determining the fair value of portfolio securities, unless the determination has been delegated to the Wells Fargo Asset Management Pricing Committee at Wells Fargo Funds Management, LLC ("Funds Management"). The Board of Trustees retains the authority to make or ratify any valuation decisions or approve any changes to the Valuation Procedures as it deems appropriate. On a quarterly basis, the Board of Trustees receives reports on any valuation actions taken by the Valuation Committee or the Wells Fargo Asset Management Pricing Committee which may include items for ratification.
When-issued transactions
The Fund may purchase securities on a forward commitment or when-issued basis. The Fund records a when-issued transaction on the trade date and will segregate assets in an amount at least equal in value to the Fund's commitment to purchase when-issued securities. Securities purchased on a when-issued basis are marked-to-market daily and the Fund begins earning interest on the settlement date. Losses may arise due to changes in the market value of the underlying securities or if the counterparty does not perform under the contract.
Security transactions and income recognition
Securities transactions are recorded on a trade date basis. Realized gains or losses are recorded on the basis of identified cost.
Interest income is accrued daily and bond discounts are accreted and premiums are amortized daily. To the extent debt obligations are placed on non-accrual status, any related interest income may be reduced by writing off interest receivables when the collection of all or a portion of interest has been determined to be doubtful based on consistently applied procedures and the fair value has decreased. If the issuer subsequently resumes interest payments or when the collectability of interest is reasonably assured, the debt obligation is removed from non-accrual status.
Distributions to shareholders
Distributions to shareholders from net investment income are declared daily and paid monthly. Distributions from net realized gains, if any, are recorded on the ex-dividend date and paid at least annually. Such distributions are determined in accordance with income tax regulations and may differ from U.S. generally accepted accounting principles. Dividend sources are estimated at the time of declaration. The tax character of distributions is determined as of the Fund’s fiscal year end. Therefore, a portion of the Fund’s distributions made prior to the Fund’s fiscal year end may be categorized as a tax return of capital at year end.
56 | Wells Fargo Intermediate Tax/AMT-Free Fund
Notes to financial statements (unaudited)
Federal and other taxes
The Fund intends to continue to qualify as a regulated investment company by distributing substantially all of its investment company taxable and tax-exempt income and any net realized capital gains (after reduction for capital loss carryforwards) sufficient to relieve it from all, or substantially all, federal income taxes. Accordingly, no provision for federal income taxes was required.
The Fund’s income and federal excise tax returns and all financial records supporting those returns for the prior three fiscal years are subject to examination by the federal and Delaware revenue authorities. Management has analyzed the Fund’s tax positions taken on federal, state, and foreign tax returns for all open tax years and does not believe that there are any uncertain tax positions that require recognition of a tax liability.
As of December 31, 2020, the aggregate cost of all investments for federal income tax purposes was $2,021,909,727 and the unrealized gains (losses) consisted of:
| Gross unrealized gains | $167,454,525 |
| Gross unrealized losses | (1,147,668) |
| Net unrealized gains | $166,306,857 |
As of June 30, 2020, the Fund had capital loss carryforwards which consisted of $18,062,193 in short-term capital losses and $24,484,632 in long-term capital losses.
Class allocations
The separate classes of shares offered by the Fund differ principally in applicable sales charges, distribution, shareholder servicing, and administration fees. Class specific expenses are charged directly to that share class. Investment income, common fund-level expenses, and realized and unrealized gains (losses) on investments are allocated daily to each class of shares based on the relative proportion of net assets of each class.
3. FAIR VALUATION MEASUREMENTS
Fair value measurements of investments are determined within a framework that has established a fair value hierarchy based upon the various data inputs utilized in determining the value of the Fund’s investments. The three-level hierarchy gives the highest priority to unadjusted quoted prices in active markets for identical assets or liabilities (Level 1) and the lowest priority to unobservable inputs (Level 3). The Fund’s investments are classified within the fair value hierarchy based on the lowest level of input that is significant to the fair value measurement. The inputs are summarized into three broad levels as follows:
| ■ | Level 1 – quoted prices in active markets for identical securities |
| ■ | Level 2 – other significant observable inputs (including quoted prices for similar securities, interest rates, prepayment speeds, credit risk, etc.) |
| ■ | Level 3 – significant unobservable inputs (including the Fund’s own assumptions in determining the fair value of investments) |
The inputs or methodologies used for valuing investments in securities are not necessarily an indication of the risk associated with investing in those securities.
The following is a summary of the inputs used in valuing the Fund’s assets and liabilities as of December 31, 2020:
| | Quoted prices
(Level 1) | Other significant
observable inputs
(Level 2) | Significant
unobservable inputs
(Level 3) | Total |
| Assets | | | | |
| Investments in: | | | | |
| Municipal obligations | $0 | $2,188,216,584 | $0 | $2,188,216,584 |
Additional sector, industry or geographic detail is included in the Portfolio of Investments.
For the six months ended December 31, 2020, the Fund did not have any transfers into/out of Level 3.
Wells Fargo Intermediate Tax/AMT-Free Fund | 57
Notes to financial statements (unaudited)
4. TRANSACTIONS WITH AFFILIATES
Management fee
Funds Management, an indirect wholly owned subsidiary of Wells Fargo & Company (“Wells Fargo”), is the manager of the Fund and provides advisory and fund-level administrative services under an investment management agreement. Under the investment management agreement, Funds Management is responsible for, among other services, implementing the investment objectives and strategies of the Fund, supervising the subadviser and providing fund-level administrative services in connection with the Fund’s operations. As compensation for its services under the investment management agreement, Funds Management is entitled to receive a management fee at the following annual rate based on the Fund’s average daily net assets:
| Average daily net assets | Management fee |
| First $500 million | 0.400% |
| Next $500 million | 0.375 |
| Next $2 billion | 0.350 |
| Next $2 billion | 0.325 |
| Next $5 billion | 0.290 |
| Over $10 billion | 0.280 |
For the six months ended December 31, 2020, the management fee was equivalent to an annual rate of 0.37% of the Fund’s average daily net assets.
Funds Management has retained the services of a subadviser to provide daily portfolio management to the Fund. The fee for subadvisory services is borne by Funds Management. Wells Capital Management, Incorporated, an affiliate of Funds Management and an indirect wholly owned subsidiary of Wells Fargo, is the subadviser to the Fund and is entitled to receive a fee from Funds Management at an annual rate starting at 0.20% and declining to 0.10% as the average daily net assets of the Fund increase.
Administration fees
Under a class-level administration agreement, Funds Management provides class-level administrative services to the Fund, which includes paying fees and expenses for services provided by the transfer agent, sub-transfer agents, omnibus account servicers and record-keepers. As compensation for its services under the class-level administration agreement, Funds Management receives an annual fee which is calculated based on the average daily net assets of each class as follows:
| | Class-level
administration fee |
| Class A | 0.16% |
| Class C | 0.16 |
| Class R6 | 0.03 |
| Administrator Class | 0.10 |
| Institutional Class | 0.08 |
Waivers and/or expense reimbursements
Funds Management has contractually waived and/or reimbursed management and administration fees to the extent necessary to maintain certain net operating expense ratios for the Fund. When each class of the Fund has exceeded its expense cap, Funds Management has waived fees and/or reimbursed expenses from fund-level expenses on a proportionate basis and then from class specific expenses. When only certain classes exceed their expense caps, waivers and/or reimbursements are applied against class specific expenses before fund-level expenses. Funds Management has committed through October 31, 2021 to waive fees and/or reimburse expenses to the extent necessary to cap the Fund’s expenses at 0.70% for Class A shares, 1.45% for Class C shares, 0.40% for Class R6 shares, 0.60% for Administrator Class shares, and 0.45% for Institutional Class shares. Prior to or after the commitment expiration date, the cap may be increased or the commitment to maintain the cap may be terminated only with the approval of the Board of Trustees.
58 | Wells Fargo Intermediate Tax/AMT-Free Fund
Notes to financial statements (unaudited)
Distribution fee
The Trust has adopted a distribution plan for Class C shares of the Fund pursuant to Rule 12b-1 under the 1940 Act. A distribution fee is charged charged to Class C shares and paid to Wells Fargo Funds Distributor, LLC (“Funds Distributor”), the principal underwriter, at an annual rate of 0.75% of the average daily net assets of Class C shares.
In addition, Funds Distributor is entitled to receive the front-end sales charge from the purchase of Class A shares and a contingent deferred sales charge on the redemption of certain Class A shares. Funds Distributor is also entitled to receive the contingent deferred sales charges from redemptions of Class C shares. For the six months ended December 31, 2020, Funds Distributor received $3,024 from the sale of Class A shares. No contingent deferred sales charges were incurred by Class A and Class C shares for the six months ended December 31, 2020.
Shareholder servicing fees
The Trust has entered into contracts with one or more shareholder servicing agents, whereby Class A, Class C, and Administrator Class of the Fund are charged a fee at an annual rate of 0.25% of the average daily net assets of each respective class. A portion of these total shareholder servicing fees were paid to affiliates of Wells Fargo.
Interfund transactions
The Fund may purchase or sell portfolio investment securities to certain other Wells Fargo affiliates pursuant to Rule 17a-7 under the 1940 Act and under procedures adopted by the Board of Trustees. The procedures have been designed to ensure that these interfund transactions, which do not incur broker commissions, are effected at current market prices. Pursuant to these procedures, the Fund had $200,135,000, $332,022,000 and $0 in interfund purchases, sales and net realized gains (losses), respectively, during the six months ended December 31, 2020.
5. INVESTMENT PORTFOLIO TRANSACTIONS
Purchases and sales of investments, excluding U.S. government obligations (if any) and short-term securities, for the six months ended December 31, 2020 were $181,225,446 and $547,014,771, respectively.
6. BANK BORROWINGS
The Trust (excluding the money market funds), Wells Fargo Master Trust and Wells Fargo Variable Trust are parties to a $350,000,000 revolving credit agreement whereby the Fund is permitted to use bank borrowings for temporary or emergency purposes, such as to fund shareholder redemption requests. Interest under the credit agreement is charged to the Fund based on a borrowing rate equal to the higher of the Federal Funds rate in effect on that day plus 1.25% or the overnight LIBOR rate in effect on that day plus 1.25%. In addition, an annual commitment fee equal to 0.25% of the unused balance is allocated to each participating fund.
For the six months ended December 31, 2020, there were no borrowings by the Fund under the agreement.
7. INDEMNIFICATION
Under the Fund's organizational documents, the officers and Trustees have been granted certain indemnification rights against certain liabilities that may arise out of performance of their duties to the Fund. The Fund has entered into a separate agreement with each Trustee that converts indemnification rights currently existing under the Fund’s organizational documents into contractual rights that cannot be changed in the future without the consent of the Trustee. Additionally, in the normal course of business, the Fund may enter into contracts with service providers that contain a variety of indemnification clauses. The Fund’s maximum exposure under these arrangements is dependent on future claims that may be made against the Fund and, therefore, cannot be estimated.
8. NEW ACCOUNTING PRONOUNCEMENT
In August 2018, FASB issued Accounting Standards Update (“ASU”) No. 2018-13, Fair Value Measurement (Topic 820) Disclosure Framework - Changes to the Disclosure Requirements for Fair Value Measurement. ASU 2018-13 updates the disclosure requirements on fair value measurements in Topic 820, Fair Value Measurements. The amendments are effective for fiscal years, and interim periods within those fiscal years, beginning after December 15, 2019. Management has adopted this guidance which did not have a material impact on the financial statements.
9. SUBSEQUENT EVENT
On February 23, 2021, Wells Fargo announced that it has entered into a definitive agreement to sell Wells Fargo Asset Management (“WFAM”) to GTCR LLC and Reverence Capital Partners, L.P. WFAM is the trade name used by the asset management businesses of Wells Fargo and includes Wells Fargo Funds Management, LLC, the investment manager to the
Wells Fargo Intermediate Tax/AMT-Free Fund | 59
Notes to financial statements (unaudited)
Fund, Wells Capital Management Incorporated and Wells Fargo Asset Management (International) Limited, both registered investment advisers providing sub-advisory services to certain funds, and Wells Fargo Funds Distributor, LLC, the Fund’s principal underwriter. As part of the transaction, Wells Fargo will own a 9.9% equity interest and will continue to serve as an important client and distribution partner.
Consummation of the transaction will result in the automatic termination of the Fund’s investment management agreement and sub-advisory agreement(s). The Fund’s Board of Trustees will be asked to approve new investment management arrangements with the new company. If approved by the Board, the new investment management arrangements with the new company will be presented to the shareholders of the Fund for approval, and, if approved by shareholders, would take effect upon the closing of the transaction. The transaction is expected to close in the second half of 2021, subject to customary closing conditions.
10. CORONAVIRUS (COVID-19) PANDEMIC
On March 11, 2020, the World Health Organization announced that it had made the assessment that coronavirus disease 2019 (“COVID-19”) is a pandemic. The impacts of COVID-19 are affecting the entire global economy, individual companies and investment products, and the market in general. There is significant uncertainty around the extent and duration of business disruptions related to COVID-19 and the impacts may be short term or may last for an extended period of time. The risk of further spreading of COVID-19 has led to significant uncertainty and volatility in the financial markets.
60 | Wells Fargo Intermediate Tax/AMT-Free Fund
Other information (unaudited)
PROXY VOTING INFORMATION
A description of the policies and procedures used to determine how to vote proxies relating to portfolio securities is available without charge, upon request, by calling 1-800-222-8222, visiting our website at wfam.com, or visiting the SEC website at sec.gov. Information regarding how the proxies related to portfolio securities were voted during the most recent 12-month period ended June 30 is available on the website at wfam.com or by visiting the SEC website at sec.gov.
QUARTERLY PORTFOLIO HOLDINGS INFORMATION
The Fund files its complete schedule of portfolio holdings with the SEC for the first and third quarters of each fiscal year as an exhibit to its reports on Form N-PORT. Shareholders may view the filed Form N-PORT by visiting the SEC website at sec.gov.
Wells Fargo Intermediate Tax/AMT-Free Fund | 61
Other information (unaudited)
BOARD OF TRUSTEES AND OFFICERS
Each of the Trustees and Officers1 listed in the table below acts in identical capacities for each fund in the Wells Fargo family of funds, which consists of 144 mutual funds comprising the Wells Fargo Funds Trust, Wells Fargo Variable Trust, Wells Fargo Master Trust and four closed-end funds (collectively the “Fund Complex”). This table should be read in conjunction with the Prospectus and the Statement of Additional Information2. The mailing address of each Trustee and Officer is 525 Market Street, 12th Floor, San Francisco, CA 94105. Each Trustee and Officer serves an indefinite term, however, each Trustee serves such term until reaching the mandatory retirement age established by the Trustees.
Independent Trustees
Name and
year of birth | Position held and
length of service* | Principal occupations during past five years or longer | Current other
public company or
investment
company
directorships |
William R. Ebsworth
(Born 1957) | Trustee,
since 2015 | Retired. From 1984 to 2013, equities analyst, portfolio manager, research director and chief investment officer at Fidelity Management and Research Company in Boston, Tokyo, and Hong Kong, and retired in 2013 as Chief Investment Officer of Fidelity Strategic Advisers, Inc. where he led a team of investment professionals managing client assets. Prior thereto, Board member of Hong Kong Securities Clearing Co., Hong Kong Options Clearing Corp., the Thailand International Fund, Ltd., Fidelity Investments Life Insurance Company, and Empire Fidelity Investments Life Insurance Company. Audit Committee Chair and Investment Committee Chair of the Vincent Memorial Hospital Endowment (non-profit organization). Mr. Ebsworth is a CFA® charterholder. | N/A |
Jane A. Freeman
(Born 1953) | Trustee,
since 2015;
Chair Liaison,
since 2018 | Retired. From 2012 to 2014 and 1999 to 2008, Chief Financial Officer of Scientific Learning Corporation. From 2008 to 2012, Ms. Freeman provided consulting services related to strategic business projects. Prior to 1999, Portfolio Manager at Rockefeller & Co. and Scudder, Stevens & Clark. Board member of the Harding Loevner Funds from 1996 to 2014, serving as both Lead Independent Director and chair of the Audit Committee. Board member of the Russell Exchange Traded Funds Trust from 2011 to 2012 and the chair of the Audit Committee. Ms. Freeman is also an inactive Chartered Financial Analyst. | N/A |
Isaiah Harris, Jr.
(Born 1952) | Trustee,
since 2009; Audit
Committee
Chair,
since 2019 | Retired. Chairman of the Board of CIGNA Corporation since 2009, and Director since 2005. From 2003 to 2011, Director of Deluxe Corporation. Prior thereto, President and CEO of BellSouth Advertising and Publishing Corp. from 2005 to 2007, President and CEO of BellSouth Enterprises from 2004 to 2005 and President of BellSouth Consumer Services from 2000 to 2003. Emeritus member of the Iowa State University Foundation Board of Governors. Emeritus Member of the Advisory Board of Iowa State University School of Business. Advisory Board Member, Palm Harbor Academy (private school). Mr. Harris is a certified public accountant (inactive status). | CIGNA Corporation |
Judith M. Johnson
(Born 1949) | Trustee,
since 2008 | Retired. Prior thereto, Chief Executive Officer and Chief Investment Officer of Minneapolis Employees Retirement Fund from 1996 to 2008. Ms. Johnson is an attorney, certified public accountant and a certified managerial accountant. | N/A |
David F. Larcker
(Born 1950) | Trustee,
since 2009 | James Irvin Miller Professor of Accounting at the Graduate School of Business (Emeritus), Stanford University, Director of the Corporate Governance Research Initiative and Senior Faculty of The Rock Center for Corporate Governance since 2006. From 2005 to 2008, Professor of Accounting at the Graduate School of Business, Stanford University. Prior thereto, Ernst & Young Professor of Accounting at The Wharton School, University of Pennsylvania from 1985 to 2005. | N/A |
62 | Wells Fargo Intermediate Tax/AMT-Free Fund
Other information (unaudited)
Name and
year of birth | Position held and
length of service* | Principal occupations during past five years or longer | Current other
public company or
investment
company
directorships |
Olivia S. Mitchell
(Born 1953) | Trustee,
since 2006;
Nominating and
Governance
Committee Chair,
since 2018 | International Foundation of Employee Benefit Plans Professor, Wharton School of the University of Pennsylvania since 1993. Director of Wharton’s Pension Research Council and Boettner Center on Pensions & Retirement Research, and Research Associate at the National Bureau of Economic Research. Previously, Cornell University Professor from 1978 to 1993. | N/A |
Timothy J. Penny
(Born 1951) | Trustee,
since 1996;
Chair,
since 2018 | President and Chief Executive Officer of Southern Minnesota Initiative Foundation, a non-profit organization, since 2007. Member of the Board of Trustees of NorthStar Education Finance, Inc., a non-profit organization, since 2007. | N/A |
James G. Polisson
(Born 1959) | Trustee,
since 2018 | Retired. Chief Marketing Officer, Source (ETF) UK Services, Ltd, from 2015 to 2017. From 2012 to 2015, Principal of The Polisson Group, LLC, a management consulting, corporate advisory and principal investing company. Chief Executive Officer and Managing Director at Russell Investments, Global Exchange Traded Funds from 2010 to 2012. Managing Director of Barclays Global Investors from 1998 to 2010 and Global Chief Marketing Officer for iShares and Barclays Global Investors from 2000 to 2010. Trustee of the San Francisco Mechanics’ Institute, a non-profit organization, from 2013 to 2015. Board member of the Russell Exchange Traded Fund Trust from 2011 to 2012. Director of Barclays Global Investors Holdings Deutschland GmbH from 2006 to 2009. Mr. Polisson is an attorney and has a retired status with the Massachusetts and District of Columbia Bar Associations. | N/A |
Pamela Wheelock
(Born 1959) | Trustee,
since January
2020; previously
Trustee from
January 2018 to
July 2019 | Board member of the Destination Medical Center Economic Development Agency, Rochester, Minnesota since 2019. Interim President of the McKnight Foundation from January to September 2020. Acting Commissioner, Minnesota Department of Human Services, July 2019 through September 2019. Human Services Manager (part-time), Minnesota Department of Human Services, October 2019 through December 2019. Chief Operating Officer, Twin Cities Habitat for Humanity from 2017 to 2019. Vice President of University Services, University of Minnesota from 2012 to 2016. Prior thereto, on the Board of Directors, Governance Committee and Finance Committee for the Minnesota Philanthropy Partners (Saint Paul Foundation) from 2012 to 2018, Interim Chief Executive Officer of Blue Cross Blue Shield of Minnesota from 2011 to 2012, Chairman of the Board from 2009 to 2012 and Board Director from 2003 to 2015. Vice President, Leadership and Community Engagement, Bush Foundation, Saint Paul, Minnesota (a private foundation) from 2009 to 2011. Executive Vice President and Chief Financial Officer, Minnesota Sports and Entertainment from 2004 to 2009 and Senior Vice President from 2002 to 2004. Executive Vice President of the Minnesota Wild Foundation from 2004 to 2008. Commissioner of Finance, State of Minnesota, from 1999 to 2002. Currently Board Chair of the Minnesota Wild Foundation since 2010. | N/A |
* Length of service dates reflect the Trustee’s commencement of service with the Trust’s predecessor entities, where applicable.
Wells Fargo Intermediate Tax/AMT-Free Fund | 63
Other information (unaudited)
Officers
Name and
year of birth | Position held and
length of service | Principal occupations during past five years or longer |
Andrew Owen
(Born 1960) | President,
since 2017 | Executive Vice President of Wells Fargo & Company and Head of Affiliated Managers, Wells Fargo Asset Management, since 2014. In addition, Mr. Owen is currently President, Chief Executive Officer and Director of Wells Fargo Funds Management, LLC since 2017. Prior thereto, Executive Vice President responsible for marketing, investments and product development for Wells Fargo Funds Management, LLC, from 2009 to 2014. |
Nancy Wiser1
(Born 1967) | Treasurer,
since 2012 | Executive Vice President of Wells Fargo Funds Management, LLC since 2011. Chief Operating Officer and Chief Compliance Officer at LightBox Capital Management LLC, from 2008 to 2011. |
Michelle Rhee
(Born 1966) | Chief Legal Officer,
since 2019 | Secretary of Wells Fargo Funds Management, LLC and Chief Legal Counsel of Wells Fargo Asset Management since 2018. Deputy General Counsel of Wells Fargo Bank N.A. since 2020 and Assistant General Counsel of Wells Fargo Bank, N.A. from 2018 to 2020. Associate General Counsel and Managing Director of Bank of America Corporation from 2004 to 2018. |
Catherine Kennedy
(Born 1969) | Secretary,
since 2019 | Vice President of Wells Fargo Funds Management, LLC and Senior Counsel of the Wells Fargo Legal Department since 2010. Vice President and Senior Counsel of Evergreen Investment Management Company, LLC from 1998 to 2010. |
Michael H. Whitaker
(Born 1967) | Chief Compliance Officer,
since 2016 | Chief Compliance Officer of Wells Fargo Asset Management since 2016. Senior Vice President and Chief Compliance Officer for Fidelity Investments from 2007 to 2016. |
Jeremy DePalma1
(Born 1974) | Assistant Treasurer,
since 2009 | Senior Vice President of Wells Fargo Funds Management, LLC since 2009. Senior Vice President of Evergreen Investment Management Company, LLC from 2008 to 2010 and head of the Fund Reporting and Control Team within Fund Administration from 2005 to 2010. |
1 Nancy Wiser acts as Treasurer of 67 funds in the Fund Complex. Jeremy DePalma acts as the Treasurer of 77 funds and Assistant Treasurer of 67 funds in the Fund Complex.
2 The Statement of Additional Information includes additional information about the Trustees and is available, without charge, upon request, by calling 1-800-222-8222 or by visiting the website at wfam.com.
64 | Wells Fargo Intermediate Tax/AMT-Free Fund
For more information
More information about Wells Fargo Funds is available free upon request. To obtain literature, please write, visit the Fund's website, or call:
Wells Fargo Funds
P.O. Box 219967
Kansas City, MO 64121-9967
Website: wfam.com
Individual investors: 1-800-222-8222
Retail investment professionals: 1-888-877-9275
Institutional investment professionals: 1-866-765-0778
This report and the financial statements contained herein are submitted for the general information of the shareholders of the Fund. If this report is used for promotional purposes, distribution of the report must be accompanied or preceded by a current prospectus. Before investing, please consider the investment objectives, risks, charges, and expenses of the investment. For a current prospectus and, if available, a summary prospectus, containing this information, call 1-800-222-8222 or visit the Fund’s website at wfam.com. Read the prospectus carefully before you invest or send money.
Wells Fargo Asset Management (WFAM) is the trade name for certain investment advisory/management firms owned by Wells Fargo & Company. These firms include but are not limited to Wells Capital Management Incorporated and Wells Fargo Funds Management, LLC. Certain products managed by WFAM entities are distributed by Wells Fargo Funds Distributor, LLC (a broker-dealer and Member FINRA).
This material is for general informational and educational purposes only and is NOT intended to provide investment advice or a recommendation of any kind— including a recommendation for any specific investment, strategy, or plan.
INVESTMENT PRODUCTS: NOT FDIC INSURED ■ NO BANK GUARANTEE ■ MAY LOSE VALUE
© 2021 Wells Fargo & Company. All rights reserved.
PAR-0121-00276 02-21
SA251/SAR251 12-20
Semi-Annual Report
December 31, 2020
Wells Fargo
Minnesota Tax-Free Fund
Reduce clutter.
Save trees.
Sign up for electronic delivery of prospectuses and shareholder reports at wellsfargo.com/ advantagedelivery
The views expressed and any forward-looking statements are as of December 31, 2020, unless otherwise noted, and are those of the Fund's portfolio managers and/or Wells Fargo Asset Management. Discussions of individual securities or the markets generally are not intended as individual recommendations. Future events or results may vary significantly from those expressed in any forward-looking statements. The views expressed are subject to change at any time in response to changing circumstances in the market. Wells Fargo Asset Management and the Fund disclaim any obligation to publicly update or revise any views expressed or forward-looking statements.
INVESTMENT PRODUCTS: NOT FDIC INSURED ■ NO BANK GUARANTEE ■ MAY LOSE VALUE
Wells Fargo Minnesota Tax-Free Fund | 1
Letter to shareholders (unaudited)
Dear Shareholder:
We are pleased to offer you this semi-annual report for the Wells Fargo Minnesota Tax-Free Fund for the six-month period that ended December 31, 2020. Despite a deeply challenging year, dominated by the spread of COVID-19 cases and a sharp drop in economic output throughout much of the world, global stocks performed extremely well, benefiting from ongoing central bank support and rising optimism over the development and distribution of effective COVID-19 vaccines. Bonds also had positive returns, led by global bonds and high-yield bonds.
For the six-month period, U.S. stocks, based on the S&P 500 Index,1 gained 22.16%. International stocks, as measured by the MSCI ACWI ex USA Index (Net),2 returned 24.33%, while the MSCI EM Index (Net),3 had even stronger performance, with a 31.14% gain. Among bond indexes, the Bloomberg Barclays U.S. Aggregate Bond Index,4 returned 1.29%, the Bloomberg Barclays Global Aggregate ex-USD Index (unhedged),5 gained 9.44%, and the Bloomberg Barclays Municipal Bond Index,6 returned 3.07% while the ICE BofA U.S. High Yield Index,7 gained a hefty 11.49%.
The stock market rally continued in July.
After a volatile first half of the year, an existing stock market rally continued in July with strong results for equities and fixed income. However, economic data and a resurgence of COVID-19 cases underscored the urgent need to regain control of the pandemic. Second-quarter gross domestic product (GDP) shrank from the previous quarter by 9.5% and 12.1% in the U.S. and the eurozone, respectively. In contrast, China’s second-quarter GDP grew 3.2% year over year. The U.S. economy added 1.8 million jobs in July, but a double-digit jobless rate persisted.
The stock market continued to rally in August despite concerns over rising numbers of U.S. and European COVID-19 cases as well as the expiration of the $600 weekly bonus unemployment benefit in July. Relatively strong second-quarter earnings boosted investor sentiment along with the U.S. Federal Reserve’s announcement of a monetary policy shift expected to support longer-term low interest rates. U.S. manufacturing and services activity indexes beat expectations, while the U.S. housing market maintained strength. In Europe, retail sales expanded and consumer confidence was steady. China’s economy continued to expand.
Andrew Owen
President
Wells Fargo Funds
“After a volatile first half of the year, an existing stock market rally continued in July with strong results for equities and fixed income.”
| 1 | The S&P 500 Index consists of 500 stocks chosen for market size, liquidity, and industry group representation. It is a market-value-weighted index with each stock's weight in the index proportionate to its market value. You cannot invest directly in an index. |
| 2 | The Morgan Stanley Capital International (MSCI) All Country World Index (ACWI) ex USA Index (Net) is a free-float-adjusted market-capitalization-weighted index that is designed to measure the equity market performance of developed and emerging markets, excluding the United States. Source: MSCI. MSCI makes no express or implied warranties or representations and shall have no liability whatsoever with respect to any MSCI data contained herein. The MSCI data may not be further redistributed or used as a basis for other indices or any securities or financial products. This report is not approved, reviewed, or produced by MSCI. You cannot invest directly in an index. |
| 3 | The MSCI Emerging Markets (EM) Index (Net) is a free-float-adjusted market-capitalization-weighted index that is designed to measure equity market performance of emerging markets. You cannot invest directly in an index. |
| 4 | The Bloomberg Barclays U.S. Aggregate Bond Index is a broad-based benchmark that measures the investment-grade, U.S. dollar-denominated, fixed-rate taxable bond market, including Treasuries, government-related and corporate securities, mortgage-backed securities (agency fixed-rate and hybrid adjustable-rate mortgage pass-throughs), asset-backed securities, and commercial mortgage-backed securities. You cannot invest directly in an index. |
| 5 | The Bloomberg Barclays Global Aggregate ex-USD Index (unhedged) is an unmanaged index that provides a broad-based measure of the global investment-grade fixed-income markets excluding the U.S. dollar-denominated debt market. You cannot invest directly in an index. |
| 6 | The Bloomberg Barclays Municipal Bond Index is an unmanaged index composed of long-term tax-exempt bonds with a minimum credit rating of Baa. You cannot invest directly in an index. |
| 7 | The ICE BofA U.S. High Yield Index is a market-capitalization-weighted index of domestic and Yankee high-yield bonds. The index tracks the performance of high-yield securities traded in the U.S. bond market. You cannot invest directly in an index. Copyright 2021. ICE Data Indices, LLC. All rights reserved. |
2 | Wells Fargo Minnesota Tax-Free Fund
Letter to shareholders (unaudited)
Stocks grew more volatile in September on mixed economic data. U.S. economic activity continued to grow. However, U.S. unemployment remained elevated at 7.9% in September. With U.S. Congress delaying further fiscal relief and uncertainties surrounding a possible vaccine, doubts crept back into the financial markets. In the U.K., a lack of progress in Brexit talks weighed on markets. China’s economy picked up steam, fueled by increased global demand.
In October, capital markets stepped back from their six-month rally. Market volatility rose in advance of the U.S. election and amid a global increase in COVID-19 infections. Europe introduced tighter restrictions affecting economic activity. U.S. markets looked favorably at the prospect of Democratic control of the federal purse strings, which could lead to additional fiscal stimulus and a boost to economic activity. Meanwhile, China reported 4.9% third-quarter GDP growth.
Global stocks rallied in November, propelled by optimism over three promising COVID-19 vaccines. Reversing recent trends, value stocks outperformed growth stocks and cyclical stocks outpaced technology stocks. However, U.S. unemployment remained elevated, with a net job loss of 10 million since February. The eurozone services Purchasing Managers’ Index, a monthly survey of purchasing managers, contracted sharply while the region’s manufacturing activity grew. The U.S. election results added to the upbeat mood as investors anticipated more consistent policies in the new administration.
Financial markets ended the year with strength on high expectations for a rapid rollout of the COVID-19 vaccines, the successful passage of a $900 billion stimulus package, and rising expectations of additional economic support from a Democratic-led Congress. U.S. economic data were mixed with still-elevated unemployment and weak retail sales but growth in manufacturing output. In contrast, China’s economic expansion continued in both manufacturing and nonmanufacturing. U.S. COVID-19 infection rates continued to rise even as new state and local lockdown measures were implemented.
Don’t let short-term uncertainty derail long-term investment goals.
Periods of investment uncertainty can present challenges, but experience has taught us that maintaining long-term investment goals can be an effective way to plan for the future. To help you create a sound strategy based on your personal goals and risk tolerance, Wells Fargo Funds offers more than 100 mutual funds spanning a wide range of asset classes and investment styles. Although diversification cannot guarantee an investment profit or prevent losses, we believe it can be an effective way to manage investment risk and potentially smooth out overall portfolio performance. We encourage investors to know their investments and to understand that appropriate levels of risk-taking may unlock opportunities.
Thank you for choosing to invest with Wells Fargo Funds. We appreciate your confidence in us and remain committed to helping you meet your financial needs.
Sincerely,
Andrew Owen
President
Wells Fargo Funds
“Global stocks rallied in November, propelled by optimism over three promising COVID-19 vaccines.”
For further information about your Fund, contact your investment professional, visit our website at wfam.com, or call us directly at 1-800-222-8222.
Wells Fargo Minnesota Tax-Free Fund | 3
Performance highlights (unaudited)
Investment objective
The Fund seeks current income exempt from federal income tax and Minnesota individual income tax.
Manager
Wells Fargo Funds Management, LLC
Subadviser
Wells Capital Management Incorporated
Portfolio managers
Bruce R. Johns
Kerry Laurin*
Average annual total returns (%) as of December 31, 2020
| | | Including sales charge | | Excluding sales charge | | Expense ratios1 (%) |
| | Inception date | 1 year | 5 year | 10 year | | 1 year | 5 year | 10 year | | Gross | Net 2 |
| Class A (NMTFX) | 1-12-1988 | -0.83 | 1.95 | 3.30 | | 3.84 | 2.89 | 3.78 | | 0.93 | 0.85 |
| Class C (WMTCX) | 4-8-2005 | 2.06 | 2.12 | 3.00 | | 3.06 | 2.12 | 3.00 | | 1.68 | 1.60 |
| Administrator Class (NWMIX) | 8-2-1993 | – | – | – | | 4.10 | 3.15 | 4.04 | | 0.87 | 0.60 |
| Institutional Class (WMTIX)3 | 10-31-2016 | – | – | – | | 4.08 | 3.21 | 4.07 | | 0.60 | 0.52 |
| Bloomberg Barclays Municipal Bond Index4 | – | – | – | – | | 5.21 | 3.91 | 4.63 | | – | – |
| Bloomberg Barclays Minnesota Municipal Bond Index5 | – | – | – | – | | 5.12 | 3.45 | 4.03 | | – | – |
Figures quoted represent past performance, which is no guarantee of future results, and do not reflect taxes that a shareholder may pay on an investment in a fund. Investment return and principal value of an investment will fluctuate so that an investor’s shares, when redeemed, may be worth more or less than their original cost. Performance shown without sales charges would be lower if sales charges were reflected. Current performance may be lower or higher than the performance data quoted, which assumes the reinvestment of dividends and capital gains. Current month-end performance is available on the Fund’s website, wfam.com.
Index returns do not include transaction costs associated with buying and selling securities, any mutual fund fees or expenses, or any taxes. It is not possible to invest directly in an index.
For Class A shares, the maximum front-end sales charge is 4.50%. For Class C shares, the maximum contingent deferred sales charge is 1.00%. Performance including a contingent deferred sales charge assumes the sales charge for the corresponding time period. Administrator Class and Institutional Class shares are sold without a front-end sales charge or contingent deferred sales charge.
Bond values fluctuate in response to the financial condition of individual issuers, general market and economic conditions, and changes in interest rates. Changes in market conditions and government policies may lead to periods of heightened volatility in the bond market and reduced liquidity for certain bonds held by the Fund. In general, when interest rates rise, bond values fall and investors may lose principal value. Interest rate changes and their impact on the fund and its share price can be sudden and unpredictable. The use of derivatives may reduce returns and/or increase volatility. Certain investment strategies tend to increase the total risk of an investment (relative to the broader market). The Fund is exposed to Minnesota municipal securities risk and high-yield securities risk. Consult the Fund’s prospectus for additional information on these and other risks. A portion of the Fund’s income may be subject to federal, state, and/ or local income taxes or the Alternative Minimum Tax (AMT). Any capital gains distributions may be taxable.
Please see footnotes on page 5.
4 | Wells Fargo Minnesota Tax-Free Fund
Performance highlights (unaudited)
| Effective maturity distribution as of December 31, 20206 |
| Credit quality as of December 31, 20207 |
| * | Ms. Laurin became a portfolio manager of the Fund on September 1, 2020. |
| 1 | Reflects the expense ratios as stated in the most recent prospectuses. The expense ratios shown are subject to change and may differ from the annualized expense ratios shown in the financial highlights of this report. |
| 2 | The manager has contractually committed through October 31, 2021, to waive fees and/or reimburse expenses to the extent necessary to cap total annual fund operating expenses after fee waivers at 0.85% for Class A, 1.60% for Class C, 0.60% for Administrator Class, and 0.52% for Institutional Class. Brokerage commissions, stamp duty fees, interest, taxes, acquired fund fees and expenses (if any), and extraordinary expenses are excluded from the expense caps. Prior to or after the commitment expiration date, the caps may be increased or the commitment to maintain the caps may be terminated only with the approval of the Board of Trustees. Without these caps, the Fund’s returns would have been lower. The expense ratio paid by an investor is the net expense ratio (the total annual fund operating expenses after fee waivers) as stated in the prospectuses. |
| 3 | Historical performance shown for the Institutional Class shares prior to their inception reflects the performance of the Administrator Class shares, and is not adjusted to reflect the Institutional Class expenses. If these expenses had been included, returns for the Institutional Class shares would be higher. |
| 4 | The Bloomberg Barclays Municipal Bond Index is an unmanaged index composed of long-term tax-exempt bonds with a minimum credit rating of Baa. You cannot invest directly in an index. |
| 5 | The Bloomberg Barclays Minnesota Municipal Bond Index is the Minnesota component of the Bloomberg Barclays Municipal Bond Index. You cannot invest directly in an index. |
| 6 | Figures represent the percentage of the Fund's long-term investments. These amounts are subject to change and may have changed since the date specified. |
| 7 | The credit quality distribution of portfolio holdings reflected in the chart is based on ratings from Standard & Poor’s, Moody’s Investors Service, and/ or Fitch Ratings Ltd. Credit quality ratings apply to the underlying holdings of the Fund and not to the Fund itself. The percentages of the Fund’s portfolio with the ratings depicted in the chart are calculated based on the total market value of fixed income securities held by the Fund. If a security was rated by all three rating agencies, the middle rating was utilized. If rated by two of three rating agencies, the lower rating was utilized, and if rated by one of the rating agencies, that rating was utilized. Standard & Poor’s rates the creditworthiness of bonds, ranging from AAA (highest) to D (lowest). Ratings from A to CCC may be modified by the addition of a plus (+) or minus (-) sign to show relative standing within the rating categories. Standard & Poor’s rates the creditworthiness of short-term notes from SP-1 (highest) to SP-3 (lowest). Moody’s rates the creditworthiness of bonds, ranging from Aaa (highest) to C (lowest). Ratings Aa to B may be modified by the addition of a number 1 (highest) to 3 (lowest) to show relative standing within the ratings categories. Moody’s rates the creditworthiness of short-term U.S. tax-exempt municipal securities from MIG 1/VMIG 1 (highest) to SG (lowest). Fitch rates the creditworthiness of bonds, ranging from AAA (highest) to D (lowest). Credit quality distribution is subject to change and may have changed since the date specified. |
Wells Fargo Minnesota Tax-Free Fund | 5
Fund expenses (unaudited)
As a shareholder of the Fund, you incur two types of costs: (1) transaction costs, including sales charges (loads) on purchase payments and contingent deferred sales charges (if any) on redemptions and (2) ongoing costs, including management fees, distribution (12b-1) and/or shareholder servicing fees, and other Fund expenses. This example is intended to help you understand your ongoing costs (in dollars) of investing in the Fund and to compare these costs with the ongoing costs of investing in other mutual funds.
The example is based on an investment of $1,000 invested at the beginning of the six-month period and held for the entire period from July 1, 2020 to December 31, 2020.
Actual expenses
The “Actual” line of the table below provides information about actual account values and actual expenses. You may use the information in this line, together with the amount you invested, to estimate the expenses that you paid over the period. Simply divide your account value by $1,000 (for example, an $8,600 account value divided by $1,000 = 8.6), then multiply the result by the number in the “Actual” line under the heading entitled “Expenses paid during period” for your applicable class of shares to estimate the expenses you paid on your account during this period.
Hypothetical example for comparison purposes
The “Hypothetical” line of the table below provides information about hypothetical account values and hypothetical expenses based on the Fund’s actual expense ratio and an assumed rate of return of 5% per year before expenses, which is not the Fund’s actual return. The hypothetical account values and expenses may not be used to estimate the actual ending account balance or expenses you paid for the period. You may use this information to compare the ongoing costs of investing in the Fund and other funds. To do so, compare this 5% hypothetical example with the 5% hypothetical examples that appear in the shareholder reports of the other funds.
Please note that the expenses shown in the table are meant to highlight your ongoing costs only and do not reflect any transactional costs, such as sales charges (loads) and contingent deferred sales charges. Therefore, the “Hypothetical” line of the table is useful in comparing ongoing costs only and will not help you determine the relative total costs of owning different funds. In addition, if these transactional costs were included, your costs would have been higher.
| | Beginning
account value
7-1-2020 | Ending
account value
12-31-2020 | Expenses
paid during
the period1 | Annualized net
expense ratio |
| Class A | | | | |
| Actual | $1,000.00 | $1,025.12 | $4.34 | 0.85% |
| Hypothetical (5% return before expenses) | $1,000.00 | $1,020.92 | $4.33 | 0.85% |
| Class C | | | | |
| Actual | $1,000.00 | $1,021.23 | $8.15 | 1.60% |
| Hypothetical (5% return before expenses) | $1,000.00 | $1,017.14 | $8.13 | 1.60% |
| Administrator Class | | | | |
| Actual | $1,000.00 | $1,026.40 | $3.06 | 0.60% |
| Hypothetical (5% return before expenses) | $1,000.00 | $1,022.18 | $3.06 | 0.60% |
| Institutional Class | | | | |
| Actual | $1,000.00 | $1,025.87 | $2.66 | 0.52% |
| Hypothetical (5% return before expenses) | $1,000.00 | $1,022.58 | $2.65 | 0.52% |
1 Expenses paid is equal to the annualized net expense ratio of each class multiplied by the average account value over the period, multiplied by the number of days in the most recent fiscal half-year divided by the number of days in the fiscal year (to reflect the one-half-year period).
6 | Wells Fargo Minnesota Tax-Free Fund
Portfolio of investments—December 31, 2020 (unaudited)
| | | Interest
rate | Maturity
date | Principal | Value |
| Municipal obligations: 95.54% | | | | | |
| Guam: 0.92% | | | | | |
| Airport revenue: 0.41% | | | | | |
| Guam Port Authority Series 2018B | | 5.00 | 7-1-2035 | $ 605,000 | 733,538 |
| Water & sewer revenue: 0.51% | | | | | |
| Guam Government Waterworks Authority Water & Wastewater System Project Series 2013 | | 5.25 | 7-1-2022 | 865,000 | 919,677 |
| | | | | | 1,653,215 |
| Illinois: 1.79% | | | | | |
| GO revenue: 0.90% | | | | | |
| Illinois Refunding Bond Series 2018A | | 5.00 | 10-1-2021 | 500,000 | 514,565 |
| Kane, Cook, & DuPage Counties IL School District #46 Series 2015D | | 5.00 | 1-1-2027 | 965,000 | 1,092,428 |
| | | | | | 1,606,993 |
| Miscellaneous revenue: 0.89% | | | | | |
| Illinois Series A | | 5.00 | 11-1-2023 | 1,000,000 | 1,091,800 |
| Illinois Series D | | 5.00 | 11-1-2021 | 500,000 | 514,155 |
| | | | | �� | 1,605,955 |
| | | | | | 3,212,948 |
| Minnesota: 91.53% | | | | | |
| Airport revenue: 2.49% | | | | | |
| Minneapolis & St. Paul MN Metropolitan Airports Commission Series 2014A | | 5.00 | 1-1-2032 | 750,000 | 838,823 |
| Minneapolis & St. Paul MN Metropolitan Airports Commission Series 2016C | | 5.00 | 1-1-2046 | 1,000,000 | 1,188,780 |
| Minneapolis & St. Paul MN Metropolitan Airports Commission Series 2016D | | 5.00 | 1-1-2041 | 250,000 | 291,793 |
| Minneapolis & St. Paul MN Metropolitan Airports Commission Subordinate Bond Series 2014A | | 5.00 | 1-1-2029 | 665,000 | 745,851 |
| Minneapolis & St. Paul MN Metropolitan Airports Commission Subordinate Bond Series 2014B | | 5.00 | 1-1-2026 | 1,250,000 | 1,398,438 |
| | | | | | 4,463,685 |
| Education revenue: 22.33% | | | | | |
| Brooklyn Park MN Charter School Athlos Leadership Academy Project Series 2015A | | 5.50 | 7-1-2040 | 750,000 | 797,708 |
| Cologne MN Charter School Cologne Academy Project Series 2014A | | 5.00 | 7-1-2029 | 590,000 | 643,525 |
| Cologne MN Charter School Cologne Academy Project Series 2014A | | 5.00 | 7-1-2034 | 500,000 | 536,490 |
| Columbus MN Charter School New Millennium Academy Project Series 2015A | | 5.50 | 7-1-2030 | 1,000,000 | 1,017,470 |
| Deephaven MN Charter School Eagle Ridge Academy Project Series 2015A | | 5.25 | 7-1-2040 | 500,000 | 550,890 |
| Deephaven MN Charter School Eagle Ridge Academy Project Series 2016A | | 4.00 | 7-1-2025 | 125,000 | 134,235 |
The accompanying notes are an integral part of these financial statements.
Wells Fargo Minnesota Tax-Free Fund | 7
Portfolio of investments—December 31, 2020 (unaudited)
| | | Interest
rate | Maturity
date | Principal | Value |
| Education revenue (continued) | | | | | |
| Deephaven MN Charter School Eagle Ridge Academy Project Series 2016A | | 4.00% | 7-1-2026 | $ 100,000 | $ 107,211 |
| Deephaven MN Charter School Eagle Ridge Academy Project Series 2016A | | 4.00 | 7-1-2027 | 100,000 | 106,770 |
| Deephaven MN Charter School Eagle Ridge Academy Project Series 2016A | | 5.25 | 7-1-2037 | 400,000 | 442,848 |
| Forest Lakes MN Charter School Lakes International Language Academy Project Series 2014A | | 5.50 | 8-1-2036 | 500,000 | 529,945 |
| Ham Lake MN Charter School DaVinci Academy Project Series 2012A | | 4.00 | 7-1-2028 | 370,000 | 392,522 |
| Ham Lake MN Charter School DaVinci Academy Project Series 2016A | | 5.00 | 7-1-2031 | 625,000 | 678,900 |
| Hugo MN Charter School Lease Revenue Bonds Noble Academy Project Series 2014A | | 5.00 | 7-1-2029 | 600,000 | 646,482 |
| Minneapolis MN Charter School Northeast College Preparatory Project | | 5.00 | 7-1-2055 | 700,000 | 740,642 |
| Minneapolis MN Charter School Yinghua Academy Project Series 2013A | | 5.00 | 7-1-2023 | 190,000 | 198,124 |
| Minnesota HEFAR Bethel University Series 2017 | | 5.00 | 5-1-2037 | 1,250,000 | 1,378,613 |
| Minnesota HEFAR College of St. Scholastica Series 2019 | | 4.00 | 12-1-2040 | 1,000,000 | 1,099,030 |
| Minnesota HEFAR College of St. Scholastica Series 7R | | 4.25 | 12-1-2027 | 400,000 | 420,032 |
| Minnesota HEFAR Concordia University Series 6Q (U.S. Bank NA LOC)ø | | 0.13 | 4-1-2037 | 2,150,000 | 2,150,000 |
| Minnesota HEFAR Hamline University Series 2017B | | 5.00 | 10-1-2035 | 1,000,000 | 1,099,160 |
| Minnesota HEFAR St. Benedict College Series 2017 | | 4.00 | 3-1-2036 | 410,000 | 437,614 |
| Minnesota HEFAR St. Catherine University Refunding Bond Series A | | 5.00 | 10-1-2025 | 570,000 | 663,947 |
| Minnesota HEFAR St. Catherine University Series A | | 5.00 | 10-1-2045 | 2,000,000 | 2,341,240 |
| Minnesota HEFAR St. Thomas University Series 2019 | | 4.00 | 10-1-2041 | 515,000 | 584,916 |
| Minnesota HEFAR St. Thomas University Series 2019 | | 5.00 | 10-1-2040 | 750,000 | 921,255 |
| Minnesota HEFAR St. Thomas University Series 7U | | 5.00 | 4-1-2023 | 750,000 | 817,943 |
| Minnesota HEFAR St. Thomas University Series 8L | | 5.00 | 4-1-2028 | 920,000 | 1,094,634 |
| Minnesota HEFAR St. Thomas University Series 8L | | 5.00 | 4-1-2029 | 750,000 | 888,128 |
| Minnesota HEFAR St. Thomas University Series 8L | | 5.00 | 4-1-2035 | 750,000 | 872,835 |
| Minnesota Office of Higher Education Supplemental Student Loan Program Revenue Bonds | | 5.00 | 11-1-2027 | 500,000 | 623,280 |
| Minnesota Office of Higher Education Supplemental Student Loan Program Revenue Bonds Series 2018 | | 5.00 | 11-1-2026 | 700,000 | 852,628 |
| Minnesota State Colleges & Universities Revenue Fund & Refunding Bonds Series 2017A | | 5.00 | 10-1-2027 | 500,000 | 630,230 |
| Moorhead MN Educational Facilities Bond The Concordia College Corporation Project Series 2016 | | 5.00 | 12-1-2025 | 2,000,000 | 2,217,580 |
| Otsego MN Charter School Kaleidoscope Charter School Project Series 2014A | | 4.15 | 9-1-2024 | 360,000 | 367,618 |
| Otsego MN Charter School Kaleidoscope Charter School Project Series 2014A | | 5.00 | 9-1-2034 | 1,100,000 | 1,145,749 |
| Rice County MN Educational Facilities Shattuck-St. Mary's School Project 144A | | 5.00 | 8-1-2022 | 940,000 | 962,222 |
| St. Cloud MN Charter School Lease Revenue Bonds Stride Academy Project Series 2016A | | 5.00 | 4-1-2036 | 750,000 | 510,000 |
| St. Paul MN Housing & RDA Charter School Hmong College Preparatory Academy Project Series 2016A | | 5.25 | 9-1-2031 | 1,000,000 | 1,161,910 |
| St. Paul MN Housing & RDA Charter School Hmong College Preparatory Academy Project Series 2020 | | 5.00 | 9-1-2055 | 400,000 | 463,708 |
| St. Paul MN Housing & RDA Charter School Lease Revenue German Immersion School Project Series 2013A | | 4.00 | 7-1-2023 | 125,000 | 128,698 |
The accompanying notes are an integral part of these financial statements.
8 | Wells Fargo Minnesota Tax-Free Fund
Portfolio of investments—December 31, 2020 (unaudited)
| | | Interest
rate | Maturity
date | Principal | Value |
| Education revenue (continued) | | | | | |
| St. Paul MN Housing & RDA Charter School Lease Revenue Twin Cities Academy Project Series 2015A | | 5.00% | 7-1-2035 | $ 925,000 | $ 994,505 |
| St. Paul MN Housing & RDA Charter School Twin Cities German Immersion School Project Series 2019 | | 5.00 | 7-1-2055 | 750,000 | 827,235 |
| St. Paul MN Housing & RDA Conservatory for Performing Artists Series A | | 4.00 | 3-1-2028 | 150,000 | 153,546 |
| St. Paul MN Housing & RDA Hope Community Academy Project Series 2015A | | 5.00 | 12-1-2034 | 1,645,000 | 1,711,113 |
| University of Minnesota Series 2017A | | 5.00 | 9-1-2042 | 770,000 | 949,687 |
| University of Minnesota Series 2019A | | 5.00 | 4-1-2044 | 2,000,000 | 2,551,500 |
| University of Minnesota State Supported Biomedical Science Series 2011B | | 5.00 | 8-1-2036 | 1,000,000 | 1,025,790 |
| Woodbury MN Charter School Refunding Bond MSA Building Company Series A | | 4.00 | 12-1-2050 | 500,000 | 527,935 |
| | | | | | 40,098,043 |
| GO revenue: 17.71% | | | | | |
| Hastings MN Independent School District #200 CAB Series A (State School District Credit Program Insured)¤ | | 0.00 | 2-1-2032 | 1,305,000 | 1,026,017 |
| Hastings MN Independent School District #200 CAB Series A (State School District Credit Program Insured)¤ | | 0.00 | 2-1-2033 | 1,145,000 | 863,674 |
| Hennepin County MN Series 2016B | | 5.00 | 12-1-2029 | 450,000 | 568,589 |
| Hennepin County MN Series 2017C | | 5.00 | 12-1-2031 | 2,000,000 | 2,513,780 |
| Long Prairie MN Sewer Revenue Bond Series 2018A (Minnesota Credit Program Insured) | | 5.00 | 2-1-2025 | 160,000 | 187,282 |
| Long Prairie MN Sewer Revenue Bond Series 2018A (Minnesota Credit Program Insured) | | 5.00 | 2-1-2026 | 185,000 | 223,880 |
| Minnesota Series 2018A | | 5.00 | 8-1-2032 | 2,700,000 | 3,531,870 |
| Minnesota Trunk Highway Series A | | 5.00 | 8-1-2032 | 1,585,000 | 2,135,661 |
| Minnesota Trunk Highway Series B | | 4.00 | 8-1-2031 | 250,000 | 307,795 |
| Minnesota Various Purpose Bonds Series 2015A | | 5.00 | 8-1-2028 | 3,400,000 | 4,118,148 |
| North St. Paul Maplewood MN Independent School District #622 Facilities Maintenance Series B (State School District Credit Program Insured) | | 4.00 | 2-1-2029 | 2,735,000 | 3,341,951 |
| Rosemount MN Independent School District #196 School Building Series 2016A (State School District Credit Program Insured) | | 5.00 | 2-1-2027 | 1,500,000 | 1,842,090 |
| Roseville MN Independent School District #623 School Building Series A (State School District Credit Program Insured) | | 5.00 | 2-1-2031 | 2,090,000 | 2,602,280 |
| Sartell MN Independent School District #748 St. Stephen Public Schools GO Series 2016A (State School District Credit Program Insured) | | 5.00 | 2-1-2027 | 1,450,000 | 1,723,586 |
| Shakopee MN Independent School District #720 Series A (State School District Credit Program Insured) | | 5.00 | 2-1-2023 | 1,000,000 | 1,096,160 |
| Shakopee MN Independent School District #720 Series B (State School District Credit Program Insured) | | 5.00 | 2-1-2025 | 405,000 | 478,528 |
| St. Cloud MN Series A | | 4.00 | 2-1-2028 | 460,000 | 550,730 |
| St. Cloud MN Series A | | 4.00 | 2-1-2029 | 475,000 | 564,922 |
| St. Cloud MN Series A | | 4.00 | 2-1-2030 | 495,000 | 584,887 |
| St. Francis MN Independent School District #15 Series A (State School District Credit Program Insured) | | 5.00 | 2-1-2027 | 485,000 | 530,575 |
| St. Francis MN Independent School District #15 Series A (State School District Credit Program Insured) | | 5.00 | 2-1-2028 | 220,000 | 240,387 |
| Willmar MN Rice Memorial Hospital Project Series 2012A | | 5.00 | 2-1-2026 | 1,000,000 | 1,003,300 |
The accompanying notes are an integral part of these financial statements.
Wells Fargo Minnesota Tax-Free Fund | 9
Portfolio of investments—December 31, 2020 (unaudited)
| | | Interest
rate | Maturity
date | Principal | Value |
| GO revenue (continued) | | | | | |
| Worthington MN Independent School District #518 School Building Series A (State School District Credit Program Insured) | | 4.00% | 2-1-2030 | $ 440,000 | $ 511,315 |
| Worthington MN Independent School District #518 School Building Series A (State School District Credit Program Insured) | | 4.00 | 2-1-2032 | 530,000 | 612,245 |
| Worthington MN Independent School District #518 School Building Series A (State School District Credit Program Insured) | | 4.00 | 2-1-2033 | 555,000 | 638,677 |
| | | | | | 31,798,329 |
| Health revenue: 17.64% | | | | | |
| Center City MN Health Care Facilities Hazelden Betty Ford Foundation Project Series 2014 | | 5.00 | 11-1-2026 | 750,000 | 853,185 |
| Center City MN Health Care Facilities Hazelden Betty Ford Foundation Project Series 2014 | | 5.00 | 11-1-2027 | 500,000 | 567,015 |
| Center City MN Health Care Facilities Hazelden Betty Ford Foundation Project Series 2014 | | 5.00 | 11-1-2029 | 300,000 | 337,578 |
| Duluth MN EDA Health Care Facilities Essentia Health Series A | | 5.00 | 2-15-2048 | 650,000 | 771,992 |
| Duluth MN EDA Health Care Facilities Essentia Health Series A | | 5.25 | 2-15-2053 | 2,500,000 | 3,003,725 |
| Glencoe MN HCFR Glencoe Regional Health Services Project Series 2013 | | 4.00 | 4-1-2022 | 735,000 | 763,555 |
| Maple Grove MN HCFR Maple Grove Hospital Corporation | | 5.00 | 5-1-2030 | 850,000 | 1,032,580 |
| Maple Grove MN HCFR North Memorial Health Care Series 2015 | | 5.00 | 9-1-2023 | 655,000 | 722,524 |
| Maple Grove MN HCFR Series 2017 | | 5.00 | 5-1-2031 | 500,000 | 603,630 |
| Maple Grove MN HCFR Series 2017 | | 5.00 | 5-1-2032 | 500,000 | 599,575 |
| Minneapolis & St. Paul MN Housing & RDA Allina Health System | | 5.00 | 11-15-2029 | 1,000,000 | 1,345,330 |
| Minneapolis & St. Paul MN Housing & RDA Allina Health System Series 2017A | | 5.00 | 11-15-2029 | 1,000,000 | 1,254,270 |
| Minneapolis MN Health Care System Fairview Health Services Series 2015A | | 5.00 | 11-15-2033 | 2,000,000 | 2,350,640 |
| Minneapolis MN Health Care System Revenue Refunded Bond Fairview Health Services Series A | | 5.00 | 11-15-2049 | 1,000,000 | 1,218,590 |
| Plato MN Health Care Facilities Bond Glencoe Regional Health Services Project Series 2017 | | 5.00 | 4-1-2041 | 550,000 | 633,969 |
| Red Wing MN Senior Housing Deer Crest Project Series A | | 5.00 | 11-1-2032 | 660,000 | 667,022 |
| Red Wing MN Senior Housing Deer Crest Project Series A | | 5.00 | 11-1-2042 | 560,000 | 565,908 |
| Rochester MN Healthcare Facilities Mayo Clinic ø | | 0.07 | 11-15-2047 | 1,700,000 | 1,700,000 |
| Shakopee MN Senior Housing Revenue Benedictine Living Community LLC Project 144Aøø | | 5.85 | 11-1-2058 | 750,000 | 774,743 |
| Shakopee MN St. Francis Regional Medical Center Series 2014 | | 5.00 | 9-1-2027 | 700,000 | 797,181 |
| Shakopee MN St. Francis Regional Medical Center Series 2014 | | 5.00 | 9-1-2029 | 725,000 | 817,148 |
| St. Cloud MN Health Care Revenue Bonds Series 2016A | | 5.00 | 5-1-2030 | 2,000,000 | 2,392,540 |
| St. Cloud MN Health Care Revenue Bonds Series 2016A | | 5.00 | 5-1-2031 | 2,000,000 | 2,385,440 |
| St. Cloud MN Health Care Unrefunded Revenue Bonds CentraCare Health | | 5.13 | 5-1-2030 | 125,000 | 125,368 |
| St. Paul MN Housing & RDA Fairview Health Services Series 2017A | | 5.00 | 11-15-2034 | 565,000 | 697,888 |
| St. Paul MN Housing & RDA Healthfirst Care Systems Project Series 2015A | | 5.00 | 11-15-2027 | 1,000,000 | 1,223,930 |
The accompanying notes are an integral part of these financial statements.
10 | Wells Fargo Minnesota Tax-Free Fund
Portfolio of investments—December 31, 2020 (unaudited)
| | | Interest
rate | Maturity
date | Principal | Value |
| Health revenue (continued) | | | | | |
| St. Paul MN Housing & RDA Healthpartners Obligation Group | | 5.00% | 7-1-2025 | $ 520,000 | $ 620,448 |
| St. Paul MN Housing & RDA Healthpartners Obligation Group | | 5.00 | 7-1-2031 | 2,010,000 | 2,351,780 |
| Winona MN Health Care Facilities Refunding Bond Series 2012 | | 5.00 | 7-1-2034 | 500,000 | 507,270 |
| | | | | | 31,684,824 |
| Housing revenue: 5.29% | | | | | |
| Brooklyn Park MN MFHR Amorce I Limited Partnership Project Series 2019A (GNMA Insured)øø | | 1.25 | 1-1-2022 | 1,735,000 | 1,735,000 |
| Minneapolis MN Student Housing Riverton Community Housing Project Series 2014 | | 5.00 | 8-1-2032 | 860,000 | 898,528 |
| Minnesota HFA Series D (SIFMA Municipal Swap+0.43%)(GNMA/FNMA/FHLMC Insured)± | | 0.52 | 1-1-2045 | 1,000,000 | 999,060 |
| Minnesota Housing Finance Agency Rental Bond Series 2019C | | 1.60 | 8-1-2021 | 1,475,000 | 1,476,077 |
| Minnesota Housing Finance Agency Residential Housing Series 2012D (GNMA/FNMA/FHLMC Insured) | | 4.00 | 7-1-2040 | 25,000 | 25,392 |
| Minnesota Housing Finance Agency Residential Housing Series E (GNMA/FNMA/FHLMC Insured) | | 1.75 | 1-1-2028 | 790,000 | 822,801 |
| Minnesota Housing Finance Agency Residential Housing Series E (GNMA/FNMA/FHLMC Insured) | | 1.75 | 7-1-2028 | 625,000 | 650,425 |
| Minnesota Housing Finance Agency State Appropriation Bonds Series 2015A | | 5.00 | 8-1-2027 | 1,665,000 | 1,926,355 |
| Minnesota Housing Finance Agency State Appropriation Bonds Series 2015A | | 5.00 | 8-1-2032 | 500,000 | 571,980 |
| Oak Park Heights MN Boutwells Landing Project Series 2005 (FHLMC LIQ)ø | | 0.09 | 11-1-2035 | 395,000 | 395,000 |
| | | | | | 9,500,618 |
| Miscellaneous revenue: 15.89% | | | | | |
| Anoka Hennepin MN Independent School District #11 Certificate of Participation Series 2014A | | 5.00 | 2-1-2034 | 1,000,000 | 1,129,770 |
| Center City MN Heath Care Facilities Hazelden Betty Ford Foundation Project Series 2019 | | 4.00 | 11-1-2030 | 250,000 | 291,600 |
| Center City MN Heath Care Facilities Hazelden Betty Ford Foundation Project Series 2019 | | 4.00 | 11-1-2031 | 250,000 | 289,510 |
| Center City MN Heath Care Facilities Hazelden Betty Ford Foundation Project Series 2019 | | 4.00 | 11-1-2034 | 300,000 | 341,619 |
| Duluth MN Independent School District #709 Certificate of Participation Series 2019A | | 4.00 | 3-1-2026 | 700,000 | 746,977 |
| Duluth MN Independent School District #709 Certificate of Participation Series 2019B (State School District Credit Program Insured) | | 5.00 | 2-1-2026 | 395,000 | 477,358 |
| Duluth MN Independent School District #709 Certificate of Participation Series 2019B (State School District Credit Program Insured) | | 5.00 | 2-1-2028 | 700,000 | 889,686 |
| Goodhue County MN Education District #6051 Red Wing Certificate of Participation Series 2014A | | 5.00 | 2-1-2029 | 750,000 | 857,715 |
| Lake Agassiz Education Cooperative #0397-52 Certificate of Participation Series A | | 3.00 | 2-1-2028 | 290,000 | 309,607 |
| Lake Agassiz Education Cooperative #0397-52 Certificate of Participation Series A | | 3.00 | 2-1-2030 | 310,000 | 326,033 |
| Lake Agassiz Education Cooperative #0397-52 Certificate of Participation Series ACooperative | | 3.00 | 2-1-2029 | 300,000 | 317,604 |
The accompanying notes are an integral part of these financial statements.
Wells Fargo Minnesota Tax-Free Fund | 11
Portfolio of investments—December 31, 2020 (unaudited)
| | | Interest
rate | Maturity
date | Principal | Value |
| Miscellaneous revenue (continued) | | | | | |
| Minneapolis MN Development Limited Tax Supported Common Bond Series 2A | | 6.00% | 12-1-2040 | $1,000,000 | $ 1,022,830 |
| Minnesota General Fund Appropriation Bonds Series 2012B | | 5.00 | 3-1-2027 | 2,000,000 | 2,107,280 |
| Minnesota General Fund Appropriation Bonds Series 2012B | | 5.00 | 3-1-2029 | 2,000,000 | 2,106,320 |
| Minnesota General Fund Appropriation Bonds Series 2014A | | 5.00 | 6-1-2033 | 1,000,000 | 1,102,720 |
| Minnesota Legislative Office Facility Project Certificate of Participation Series 2014 | | 5.00 | 6-1-2023 | 435,000 | 484,560 |
| Minnetonka MN Independent School District #276 Certificate of Participation Series 2016F | | 5.00 | 2-1-2025 | 205,000 | 224,131 |
| Minnetonka MN Independent School District #276 Certificate of Participation Series 2018C | | 5.75 | 2-1-2042 | 2,145,000 | 2,623,657 |
| Northeastern Minnesota Metropolitan Intermediate School District #916 Certificate of Participation Series 2013A | | 4.00 | 2-1-2024 | 1,100,000 | 1,177,352 |
| Northeastern Minnesota Metropolitan Intermediate School District #916 Certificate of Participation Series 2015B | | 5.00 | 2-1-2034 | 1,500,000 | 1,729,650 |
| Plymouth MN Intermediate School District #287 Certificate of Participation Series 2016A | | 4.00 | 5-1-2026 | 500,000 | 569,090 |
| Plymouth MN Intermediate School District #287 Certificate of Participation Series 2016A | | 4.00 | 5-1-2027 | 1,000,000 | 1,129,920 |
| Plymouth MN Intermediate School District #287 Certificate of Participation Series A | | 4.00 | 2-1-2023 | 230,000 | 245,343 |
| Plymouth MN Intermediate School District #287 Certificate of Participation Series A | | 4.00 | 2-1-2024 | 130,000 | 142,636 |
| Plymouth MN Intermediate School District #287 Certificate of Participation Series A | | 4.00 | 2-1-2025 | 215,000 | 241,944 |
| St. Cloud MN Independent School District #742 Certificate of Participation Series 2017A | | 5.00 | 2-1-2032 | 500,000 | 581,970 |
| St. Cloud MN Independent School District #742 Certificate of Participation Series 2017A | | 5.00 | 2-1-2034 | 350,000 | 405,857 |
| St. Cloud MN Infrastructure Management Series B | | 4.00 | 2-1-2028 | 245,000 | 293,324 |
| St. Cloud MN Infrastructure Management Series B | | 4.00 | 2-1-2029 | 255,000 | 303,274 |
| St. Cloud MN Infrastructure Management Series B | | 4.00 | 2-1-2030 | 260,000 | 307,213 |
| St. Paul MN Housing & RDA Charter School Nova Classical Academy Project Series 2011A | | 6.63 | 9-1-2042 | 865,000 | 901,564 |
| St. Paul MN Independent School District Series C (State School District Credit Program Insured) | | 5.00 | 2-1-2030 | 2,965,000 | 3,682,085 |
| White Bear Lake MN Refunding Bonds YMCA of Greater Twin Cities Project Series 2018 | | 5.00 | 6-1-2032 | 1,000,000 | 1,168,440 |
| | | | | | 28,528,639 |
| Resource recovery revenue: 0.79% | | | | | |
| Douglas County MN Refunding Bond Solid Waste Series A | | 5.00 | 8-1-2030 | 1,055,000 | 1,416,338 |
| Tax revenue: 0.93% | | | | | |
| Hennepin County MN Series 2019B | | 5.00 | 12-15-2031 | 1,260,000 | 1,673,797 |
| Transportation revenue: 0.96% | | | | | |
| St. Paul MN Housing & RDA Parking Enterprise Refunding Bonds Series 2017A | | 4.00 | 8-1-2026 | 525,000 | 571,541 |
| St. Paul MN Housing & RDA Parking Enterprise Refunding Bonds Series 2017A | | 4.00 | 8-1-2027 | 545,000 | 589,810 |
| St. Paul MN Housing & RDA Parking Enterprise Refunding Bonds Series 2017A | | 5.00 | 8-1-2025 | 500,000 | 568,260 |
| | | | | | 1,729,611 |
The accompanying notes are an integral part of these financial statements.
12 | Wells Fargo Minnesota Tax-Free Fund
Portfolio of investments—December 31, 2020 (unaudited)
| | | Interest
rate | Maturity
date | Principal | Value |
| Utilities revenue: 7.50% | | | | | |
| Central Minnesota Municipal Power Agency Brookings Southeast Twin Cities Transmission Project Series 2012 | | 5.00% | 1-1-2042 | $1,500,000 | $ 1,564,365 |
| Hutchinson MN Public Utility Revenue Refunding Bonds Series 2012A | | 5.00 | 12-1-2026 | 700,000 | 759,871 |
| Northern Minnesota Municipal Power Agency Series 2013A | | 4.00 | 1-1-2028 | 450,000 | 476,699 |
| Northern Minnesota Municipal Power Agency Series 2016 | | 5.00 | 1-1-2030 | 520,000 | 622,991 |
| Northern Minnesota Municipal Power Agency Series 2016 | | 5.00 | 1-1-2031 | 350,000 | 417,249 |
| Northern Minnesota Municipal Power Agency Series 2017 | | 5.00 | 1-1-2041 | 400,000 | 475,560 |
| Rochester MN Electric Utility Revenue Series 2013B | | 5.00 | 12-1-2025 | 315,000 | 356,637 |
| Rochester MN Electric Utility Revenue Series 2013B | | 5.00 | 12-1-2026 | 250,000 | 282,578 |
| Rochester MN Electric Utility Revenue Series 2017A | | 5.00 | 12-1-2037 | 500,000 | 606,730 |
| Southern Minnesota Municipal Power Agency Badger Coulee Project Series 2019A | | 5.00 | 1-1-2032 | 700,000 | 928,879 |
| Southern Minnesota Municipal Power Agency Badger Coulee Project Series 2019A | | 5.00 | 1-1-2033 | 560,000 | 738,360 |
| Southern Minnesota Municipal Power Agency Badger Coulee Project Series 2019A | | 5.00 | 1-1-2034 | 615,000 | 807,716 |
| Western Minnesota Municipal Power Agency Series A | | 5.00 | 1-1-2027 | 1,565,000 | 1,706,570 |
| Western Minnesota Municipal Power Agency Series A | | 5.00 | 1-1-2030 | 1,000,000 | 1,086,920 |
| Western Minnesota Municipal Power Agency Series A | | 5.00 | 1-1-2031 | 1,000,000 | 1,199,680 |
| Western Minnesota Municipal Power Agency Series A | | 5.00 | 1-1-2032 | 1,250,000 | 1,428,713 |
| | | | | | 13,459,518 |
| | | | | | 164,353,402 |
| New Jersey: 0.24% | | | | | |
| Tax revenue: 0.24% | | | | | |
| New Jersey Statewide Covid-19 Emergency Series A | | 5.00 | 6-1-2027 | 350,000 | 437,745 |
| New York: 0.84% | | | | | |
| GO revenue: 0.84% | | | | | |
| Suffolk County NY Series A | | 5.00 | 3-19-2021 | 1,500,000 | 1,513,605 |
| Virgin Islands: 0.22% | | | | | |
| Tax revenue: 0.22% | | | | | |
| Virgin Islands PFA Matching Fund Loan Notes Senior Lien Series B (AGM Insured) | | 5.00 | 10-1-2025 | 375,000 | 387,960 |
| Total Municipal obligations (Cost $162,043,710) | | | | | 171,558,875 |
| Total investments in securities (Cost $162,043,710) | 95.54% | | | | 171,558,875 |
| Other assets and liabilities, net | 4.46 | | | | 8,006,113 |
| Total net assets | 100.00% | | | | $179,564,988 |
| ø | Variable rate demand notes are subject to a demand feature which reduces the effective maturity. The maturity date shown represents the final maturity date of the security. The interest rate is determined and reset by the issuer daily, weekly, or monthly depending upon the terms of the security. The rate shown is the rate in effect at period end. |
| 144A | The security may be resold in transactions exempt from registration, normally to qualified institutional buyers, pursuant to Rule 144A under the Securities Act of 1933. |
| ¤ | The security is issued in zero coupon form with no periodic interest payments. |
| øø | The interest rate is determined and reset by the issuer periodically depending upon the terms of the security. The rate shown is the rate in effect at period end. |
| ± | Variable rate investment. The rate shown is the rate in effect at period end. |
The accompanying notes are an integral part of these financial statements.
Wells Fargo Minnesota Tax-Free Fund | 13
Portfolio of investments—December 31, 2020 (unaudited)
| Abbreviations: |
| AGM | Assured Guaranty Municipal |
| CAB | Capital appreciation bond |
| EDA | Economic Development Authority |
| FHLMC | Federal Home Loan Mortgage Corporation |
| GNMA | Government National Mortgage Association |
| GO | General obligation |
| HCFR | Healthcare facilities revenue |
| HEFAR | Higher Education Facilities Authority Revenue |
| HFA | Housing Finance Authority |
| LIQ | Liquidity agreement |
| LOC | Letter of credit |
| MFHR | Multifamily housing revenue |
| PFA | Public Finance Authority |
| RDA | Redevelopment Authority |
| SIFMA | Securities Industry and Financial Markets Association |
The accompanying notes are an integral part of these financial statements.
14 | Wells Fargo Minnesota Tax-Free Fund
Statement of assets and liabilities—December 31, 2020 (unaudited)
| | |
| Assets | |
Investments in unaffiliated securities, at value (cost $162,043,710)
| $ 171,558,875 |
Cash
| 5,678,018 |
Receivable for interest
| 2,362,730 |
Receivable for investments sold
| 175,000 |
Receivable for Fund shares sold
| 105,648 |
Prepaid expenses and other assets
| 55,100 |
Total assets
| 179,935,371 |
| Liabilities | |
Payable for Fund shares redeemed
| 200,516 |
Dividends payable
| 81,861 |
Management fee payable
| 41,757 |
Shareholder servicing fees payable
| 24,451 |
Administration fees payable
| 17,054 |
Trustees’ fees and expenses payable
| 2,969 |
Distribution fee payable
| 1,513 |
Accrued expenses and other liabilities
| 262 |
Total liabilities
| 370,383 |
Total net assets
| $179,564,988 |
| Net assets consist of | |
Paid-in capital
| $ 169,214,365 |
Total distributable earnings
| 10,350,623 |
Total net assets
| $179,564,988 |
| Computation of net asset value and offering price per share | |
Net assets – Class A
| $ 30,997,548 |
Shares outstanding – Class A1
| 2,810,429 |
Net asset value per share – Class A
| $11.03 |
Maximum offering price per share – Class A2
| $11.55 |
Net assets – Class C
| $ 2,134,928 |
Shares outstanding – Class C1
| 193,543 |
Net asset value per share – Class C
| $11.03 |
Net assets – Administrator Class
| $ 73,639,375 |
Shares outstanding – Administrator Class1
| 6,678,637 |
Net asset value per share – Administrator Class
| $11.03 |
Net assets – Institutional Class
| $ 72,793,137 |
Shares outstanding – Institutional Class1
| 6,596,795 |
Net asset value per share – Institutional Class
| $11.03 |
| 1 | The Fund has an unlimited number of authorized shares |
| 2 | Maximum offering price is computed as 100/95.50 of net asset value. On investments of $50,000 or more, the offering price is reduced. |
The accompanying notes are an integral part of these financial statements.
Wells Fargo Minnesota Tax-Free Fund | 15
Statement of operations—six months ended December 31, 2020 (unaudited)
| | |
| Investment income | |
Interest
| $ 2,449,204 |
| Expenses | |
Management fee
| 364,089 |
| Administration fees | |
Class A
| 24,668 |
Class C
| 2,601 |
Administrator Class
| 36,356 |
Institutional Class
| 30,098 |
| Shareholder servicing fees | |
Class A
| 38,543 |
Class C
| 4,059 |
Administrator Class
| 90,562 |
| Distribution fee | |
Class C
| 12,174 |
Custody and accounting fees
| 4,160 |
Professional fees
| 25,786 |
Registration fees
| 34,700 |
Shareholder report expenses
| 18,373 |
Trustees’ fees and expenses
| 9,874 |
Other fees and expenses
| 8,225 |
Total expenses
| 704,268 |
| Less: Fee waivers and/or expense reimbursements | |
Fund-level
| (86,407) |
Administrator Class
| (47,440) |
Net expenses
| 570,421 |
Net investment income
| 1,878,783 |
| Realized and unrealized gains (losses) on investments | |
Net realized gains on investments
| 15,020 |
Net change in unrealized gains (losses) on investments
| 2,658,677 |
Net realized and unrealized gains (losses) on investments
| 2,673,697 |
Net increase in net assets resulting from operations
| $4,552,480 |
The accompanying notes are an integral part of these financial statements.
16 | Wells Fargo Minnesota Tax-Free Fund
Statement of changes in net assets
| | |
| | Six months ended
December 31, 2020
(unaudited) | Year ended
June 30, 2020 |
| Operations | | | | |
Net investment income
| | $ 1,878,783 | | $ 4,024,264 |
Net realized gains on investments
| | 15,020 | | 22,567 |
Net change in unrealized gains (losses) on investments
| | 2,658,677 | | 1,163,068 |
Net increase in net assets resulting from operations
| | 4,552,480 | | 5,209,899 |
| Distributions to shareholders from | | | | |
| Net investment income and net realized gains | | | | |
Class A
| | (284,098) | | (610,435) |
Class C
| | (17,765) | | (64,198) |
Administrator Class
| | (760,277) | | (1,922,632) |
Institutional Class
| | (816,641) | | (1,426,999) |
Total distributions to shareholders
| | (1,878,781) | | (4,024,264) |
| Capital share transactions | Shares | | Shares | |
| Proceeds from shares sold | | | | |
Class A
| 194,591 | 2,131,019 | 370,531 | 4,040,818 |
Class C
| 0 | 0 | 26,763 | 287,731 |
Administrator Class
| 773,225 | 8,486,224 | 2,134,245 | 23,116,572 |
Institutional Class
| 776,968 | 8,524,080 | 4,681,191 | 50,627,321 |
| | | 19,141,323 | | 78,072,442 |
| Reinvestment of distributions | | | | |
Class A
| 25,424 | 278,863 | 56,114 | 607,757 |
Class C
| 1,601 | 17,547 | 5,926 | 64,198 |
Administrator Class
| 67,314 | 738,309 | 150,724 | 1,632,339 |
Institutional Class
| 42,528 | 466,665 | 93,088 | 1,009,049 |
| | | 1,501,384 | | 3,313,343 |
| Payment for shares redeemed | | | | |
Class A
| (108,548) | (1,189,100) | (272,388) | (2,943,523) |
Class C
| (178,223) | (1,949,772) | (150,576) | (1,631,910) |
Administrator Class
| (604,065) | (6,614,766) | (4,676,308) | (50,444,414) |
Institutional Class
| (699,301) | (7,671,939) | (1,604,815) | (17,232,329) |
| | | (17,425,577) | | (72,252,176) |
Net increase in net assets resulting from capital share transactions
| | 3,217,130 | | 9,133,609 |
Total increase in net assets
| | 5,890,829 | | 10,319,244 |
| Net assets | | | | |
Beginning of period
| | 173,674,159 | | 163,354,915 |
End of period
| | $179,564,988 | | $173,674,159 |
The accompanying notes are an integral part of these financial statements.
Wells Fargo Minnesota Tax-Free Fund | 17
Financial highlights
(For a share outstanding throughout each period)
| | | Year ended June 30 |
| Class A | Six months ended
December 31, 2020
(unaudited) | 2020 | 2019 | 2018 | 2017 | 2016 |
Net asset value, beginning of period
| $10.86 | $10.77 | $10.51 | $10.68 | $11.07 | $10.79 |
Net investment income
| 0.10 | 0.23 | 0.27 1 | 0.28 1 | 0.28 1 | 0.33 |
Net realized and unrealized gains (losses) on investments
| 0.17 | 0.09 | 0.26 | (0.16) | (0.34) | 0.28 |
Total from investment operations
| 0.27 | 0.32 | 0.53 | 0.12 | (0.06) | 0.61 |
| Distributions to shareholders from | | | | | | |
Net investment income
| (0.10) | (0.23) | (0.27) | (0.28) | (0.28) | (0.33) |
Net realized gains
| 0.00 | 0.00 | 0.00 | (0.01) | (0.05) | (0.00) 2 |
Total distributions to shareholders
| (0.10) | (0.23) | (0.27) | (0.29) | (0.33) | (0.33) |
Net asset value, end of period
| $11.03 | $10.86 | $10.77 | $10.51 | $10.68 | $11.07 |
Total return3
| 2.51% | 2.99% | 5.13% | 1.10% | (0.53)% | 5.74% |
| Ratios to average net assets (annualized) | | | | | | |
Gross expenses
| 0.92% | 0.93% | 0.94% | 0.85% | 0.91% | 0.89% |
Net expenses
| 0.85% | 0.85% | 0.85% | 0.84% | 0.85% | 0.85% |
Net investment income
| 1.84% | 2.12% | 2.57% | 2.64% | 2.63% | 2.99% |
| Supplemental data | | | | | | |
Portfolio turnover rate
| 3% | 16% | 18% | 15% | 22% | 16% |
Net assets, end of period (000s omitted)
| $30,998 | $29,317 | $27,399 | $29,554 | $34,720 | $45,437 |
| 1 | Calculated based upon average shares outstanding |
| 2 | Amount is less than $0.005. |
| 3 | Total return calculations do not include any sales charges. Returns for periods of less than one year are not annualized. |
The accompanying notes are an integral part of these financial statements.
18 | Wells Fargo Minnesota Tax-Free Fund
Financial highlights
(For a share outstanding throughout each period)
| | | Year ended June 30 |
| Class C | Six months ended
December 31, 2020
(unaudited) | 2020 | 2019 | 2018 | 2017 | 2016 |
Net asset value, beginning of period
| $10.86 | $10.77 | $10.51 | $10.68 | $11.07 | $10.79 |
Net investment income
| 0.06 | 0.15 1 | 0.19 1 | 0.20 | 0.20 | 0.24 |
Net realized and unrealized gains (losses) on investments
| 0.17 | 0.09 | 0.26 | (0.16) | (0.34) | 0.28 |
Total from investment operations
| 0.23 | 0.24 | 0.45 | 0.04 | (0.14) | 0.52 |
| Distributions to shareholders from | | | | | | |
Net investment income
| (0.06) | (0.15) | (0.19) | (0.20) | (0.20) | (0.24) |
Net realized gains
| 0.00 | 0.00 | 0.00 | (0.01) | (0.05) | (0.00) 2 |
Total distributions to shareholders
| (0.06) | (0.15) | (0.19) | (0.21) | (0.25) | (0.24) |
Net asset value, end of period
| $11.03 | $10.86 | $10.77 | $10.51 | $10.68 | $11.07 |
Total return3
| 2.12% | 2.22% | 4.35% | 0.34% | (1.27)% | 4.95% |
| Ratios to average net assets (annualized) | | | | | | |
Gross expenses
| 1.67% | 1.68% | 1.69% | 1.59% | 1.65% | 1.64% |
Net expenses
| 1.60% | 1.60% | 1.60% | 1.59% | 1.60% | 1.60% |
Net investment income
| 1.09% | 1.37% | 1.83% | 1.89% | 1.88% | 2.24% |
| Supplemental data | | | | | | |
Portfolio turnover rate
| 3% | 16% | 18% | 15% | 22% | 16% |
Net assets, end of period (000s omitted)
| $2,135 | $4,020 | $5,254 | $7,387 | $9,525 | $10,358 |
| 1 | Calculated based upon average shares outstanding |
| 2 | Amount is less than $0.005. |
| 3 | Total return calculations do not include any sales charges. Returns for periods of less than one year are not annualized. |
The accompanying notes are an integral part of these financial statements.
Wells Fargo Minnesota Tax-Free Fund | 19
Financial highlights
(For a share outstanding throughout each period)
| | | Year ended June 30 |
| Administrator Class | Six months ended
December 31, 2020
(unaudited) | 2020 | 2019 | 2018 | 2017 | 2016 |
Net asset value, beginning of period
| $10.86 | $10.76 | $10.51 | $10.68 | $11.07 | $10.78 |
Net investment income
| 0.12 | 0.26 1 | 0.30 1 | 0.31 1 | 0.31 1 | 0.35 |
Net realized and unrealized gains (losses) on investments
| 0.17 | 0.10 | 0.25 | (0.16) | (0.34) | 0.29 |
Total from investment operations
| 0.29 | 0.36 | 0.55 | 0.15 | (0.03) | 0.64 |
| Distributions to shareholders from | | | | | | |
Net investment income
| (0.12) | (0.26) | (0.30) | (0.31) | (0.31) | (0.35) |
Net realized gains
| 0.00 | 0.00 | 0.00 | (0.01) | (0.05) | (0.00) 2 |
Total distributions to shareholders
| (0.12) | (0.26) | (0.30) | (0.32) | (0.36) | (0.35) |
Net asset value, end of period
| $11.03 | $10.86 | $10.76 | $10.51 | $10.68 | $11.07 |
Total return3
| 2.64% | 3.34% | 5.29% | 1.34% | (0.28)% | 6.10% |
| Ratios to average net assets (annualized) | | | | | | |
Gross expenses
| 0.86% | 0.87% | 0.88% | 0.78% | 0.84% | 0.83% |
Net expenses
| 0.60% | 0.60% | 0.60% | 0.60% | 0.60% | 0.60% |
Net investment income
| 2.09% | 2.38% | 2.81% | 2.89% | 2.87% | 3.24% |
| Supplemental data | | | | | | |
Portfolio turnover rate
| 3% | 16% | 18% | 15% | 22% | 16% |
Net assets, end of period (000s omitted)
| $73,639 | $69,954 | $95,072 | $85,259 | $104,906 | $124,485 |
| 1 | Calculated based upon average shares outstanding |
| 2 | Amount is less than $0.005. |
| 3 | Returns for periods of less than one year are not annualized. |
The accompanying notes are an integral part of these financial statements.
20 | Wells Fargo Minnesota Tax-Free Fund
Financial highlights
(For a share outstanding throughout each period)
| | | Year ended June 30 |
| Institutional Class | Six months ended
December 31, 2020
(unaudited) | 2020 | 2019 | 2018 | 2017 1 |
Net asset value, beginning of period
| $10.87 | $10.77 | $10.52 | $10.69 | $10.88 |
Net investment income
| 0.12 | 0.26 | 0.30 | 0.32 | 0.21 |
Net realized and unrealized gains (losses) on investments
| 0.16 | 0.10 | 0.25 | (0.16) | (0.14) |
Total from investment operations
| 0.28 | 0.36 | 0.55 | 0.16 | 0.07 |
| Distributions to shareholders from | | | | | |
Net investment income
| (0.12) | (0.26) | (0.30) | (0.32) | (0.21) |
Net realized gains
| 0.00 | 0.00 | 0.00 | (0.01) | (0.05) |
Total distributions to shareholders
| (0.12) | (0.26) | (0.30) | (0.33) | (0.26) |
Net asset value, end of period
| $11.03 | $10.87 | $10.77 | $10.52 | $10.69 |
Total return2
| 2.59% | 3.42% | 5.37% | 1.43% | 0.62% |
| Ratios to average net assets (annualized) | | | | | |
Gross expenses
| 0.59% | 0.60% | 0.61% | 0.52% | 0.52% |
Net expenses
| 0.52% | 0.52% | 0.52% | 0.52% | 0.51% |
Net investment income
| 2.17% | 2.43% | 2.89% | 2.98% | 2.91% |
| Supplemental data | | | | | |
Portfolio turnover rate
| 3% | 16% | 18% | 15% | 22% |
Net assets, end of period (000s omitted)
| $72,793 | $70,383 | $35,630 | $29,639 | $22,785 |
| 1 | For the period from October 31, 2016 (commencement of class operations) to June 30, 2017 |
| 2 | Returns for periods of less than one year are not annualized. |
The accompanying notes are an integral part of these financial statements.
Wells Fargo Minnesota Tax-Free Fund | 21
Notes to financial statements (unaudited)
1. ORGANIZATION
Wells Fargo Funds Trust (the “Trust”), a Delaware statutory trust organized on March 10, 1999, is an open-end management investment company registered under the Investment Company Act of 1940, as amended (the “1940 Act”). As an investment company, the Trust follows the accounting and reporting guidance in Financial Accounting Standards Board (“FASB”) Accounting Standards Codification Topic 946, Financial Services – Investment Companies. These financial statements report on the Wells Fargo Minnesota Tax-Free Fund (the “Fund”) which is a diversified series of the Trust.
2. SIGNIFICANT ACCOUNTING POLICIES
The following significant accounting policies, which are consistently followed in the preparation of the financial statements of the Fund, are in conformity with U.S. generally accepted accounting principles which require management to make estimates and assumptions that affect the reported amounts of assets and liabilities, disclosure of contingent assets and liabilities at the date of the financial statements, and the reported amounts of income and expenses during the reporting period. Actual results could differ from those estimates.
Securities valuation
All investments are valued each business day as of the close of regular trading on the New York Stock Exchange (generally 4 p.m. Eastern Time), although the Fund may deviate from this calculation time under unusual or unexpected circumstances.
Debt securities are valued at the evaluated bid price provided by an independent pricing service (e.g. taking into account various factors, including yields, maturities, or credit ratings) or, if a reliable price is not available, the quoted bid price from an independent broker-dealer.
Investments which are not valued using any of the methods discussed above are valued at their fair value, as determined in good faith by the Board of Trustees of the Fund. The Board of Trustees has established a Valuation Committee comprised of the Trustees and has delegated to it the authority to take any actions regarding the valuation of portfolio securities that the Valuation Committee deems necessary or appropriate, including determining the fair value of portfolio securities, unless the determination has been delegated to the Wells Fargo Asset Management Pricing Committee at Wells Fargo Funds Management, LLC ("Funds Management"). The Board of Trustees retains the authority to make or ratify any valuation decisions or approve any changes to the Valuation Procedures as it deems appropriate. On a quarterly basis, the Board of Trustees receives reports on any valuation actions taken by the Valuation Committee or the Wells Fargo Asset Management Pricing Committee which may include items for ratification.
When-issued transactions
The Fund may purchase securities on a forward commitment or when-issued basis. The Fund records a when-issued transaction on the trade date and will segregate assets in an amount at least equal in value to the Fund's commitment to purchase when-issued securities. Securities purchased on a when-issued basis are marked-to-market daily and the Fund begins earning interest on the settlement date. Losses may arise due to changes in the market value of the underlying securities or if the counterparty does not perform under the contract.
Security transactions and income recognition
Securities transactions are recorded on a trade date basis. Realized gains or losses are recorded on the basis of identified cost.
Interest income is accrued daily and bond discounts are accreted and premiums are amortized daily. To the extent debt obligations are placed on non-accrual status, any related interest income may be reduced by writing off interest receivables when the collection of all or a portion of interest has been determined to be doubtful based on consistently applied procedures and the fair value has decreased. If the issuer subsequently resumes interest payments or when the collectability of interest is reasonably assured, the debt obligation is removed from non-accrual status.
Distributions to shareholders
Distributions to shareholders from net investment income are declared daily and paid monthly. Distributions from net realized gains, if any, are recorded on the ex-dividend date and paid at least annually. Such distributions are determined in accordance with income tax regulations and may differ from U.S. generally accepted accounting principles. Dividend sources are estimated at the time of declaration. The tax character of distributions is determined as of the Fund’s fiscal year end. Therefore, a portion of the Fund’s distributions made prior to the Fund’s fiscal year end may be categorized as a tax return of capital at year end.
22 | Wells Fargo Minnesota Tax-Free Fund
Notes to financial statements (unaudited)
Federal and other taxes
The Fund intends to continue to qualify as a regulated investment company by distributing substantially all of its investment company taxable and tax-exempt income and any net realized capital gains (after reduction for capital loss carryforwards) sufficient to relieve it from all, or substantially all, federal income taxes. Accordingly, no provision for federal income taxes was required.
The Fund’s income and federal excise tax returns and all financial records supporting those returns for the prior three fiscal years are subject to examination by the federal and Delaware revenue authorities. Management has analyzed the Fund’s tax positions taken on federal, state, and foreign tax returns for all open tax years and does not believe that there are any uncertain tax positions that require recognition of a tax liability.
As of December 31, 2020, the aggregate cost of all investments for federal income tax purposes was $162,043,708 and the unrealized gains (losses) consisted of:
| Gross unrealized gains | $9,775,955 |
| Gross unrealized losses | (260,788) |
| Net unrealized gains | $9,515,167 |
As of June 30, 2020, the Fund had capital loss carryforwards which consisted of $10,530 in short-term capital losses .
Class allocations
The separate classes of shares offered by the Fund differ principally in applicable sales charges, distribution, shareholder servicing, and administration fees. Class specific expenses are charged directly to that share class. Investment income, common fund-level expenses, and realized and unrealized gains (losses) on investments are allocated daily to each class of shares based on the relative proportion of net assets of each class.
3. FAIR VALUATION MEASUREMENTS
Fair value measurements of investments are determined within a framework that has established a fair value hierarchy based upon the various data inputs utilized in determining the value of the Fund’s investments. The three-level hierarchy gives the highest priority to unadjusted quoted prices in active markets for identical assets or liabilities (Level 1) and the lowest priority to unobservable inputs (Level 3). The Fund’s investments are classified within the fair value hierarchy based on the lowest level of input that is significant to the fair value measurement. The inputs are summarized into three broad levels as follows:
| ■ | Level 1 – quoted prices in active markets for identical securities |
| ■ | Level 2 – other significant observable inputs (including quoted prices for similar securities, interest rates, prepayment speeds, credit risk, etc.) |
| ■ | Level 3 – significant unobservable inputs (including the Fund’s own assumptions in determining the fair value of investments) |
The inputs or methodologies used for valuing investments in securities are not necessarily an indication of the risk associated with investing in those securities.
The following is a summary of the inputs used in valuing the Fund’s assets and liabilities as of December 31, 2020:
| | Quoted prices
(Level 1) | Other significant
observable inputs
(Level 2) | Significant
unobservable inputs
(Level 3) | Total |
| Assets | | | | |
| Investments in: | | | | |
| Municipal obligations | $0 | $171,558,875 | $0 | $171,558,875 |
Additional sector, industry or geographic detail is included in the Portfolio of Investments.
For the six months ended December 31, 2020, the Fund did not have any transfers into/out of Level 3.
Wells Fargo Minnesota Tax-Free Fund | 23
Notes to financial statements (unaudited)
4. TRANSACTIONS WITH AFFILIATES
Management fee
Funds Management, an indirect wholly owned subsidiary of Wells Fargo & Company (“Wells Fargo”), is the manager of the Fund and provides advisory and fund-level administrative services under an investment management agreement. Under the investment management agreement, Funds Management is responsible for, among other services, implementing the investment objectives and strategies of the Fund, supervising the subadviser and providing fund-level administrative services in connection with the Fund’s operations. As compensation for its services under the investment management agreement, Funds Management is entitled to receive a management fee at the following annual rate based on the Fund’s average daily net assets:
| Average daily net assets | Management fee |
| First $500 million | 0.400% |
| Next $500 million | 0.375 |
| Next $2 billion | 0.350 |
| Next $2 billion | 0.325 |
| Next $5 billion | 0.290 |
| Over $10 billion | 0.280 |
For the six months ended December 31, 2020, the management fee was equivalent to an annual rate of 0.40% of the Fund’s average daily net assets.
Funds Management has retained the services of a subadviser to provide daily portfolio management to the Fund. The fee for subadvisory services is borne by Funds Management. Wells Capital Management, Incorporated, an affiliate of Funds Management and an indirect wholly owned subsidiary of Wells Fargo, is the subadviser to the Fund and is entitled to receive a fee from Funds Management at an annual rate starting at 0.20% and declining to 0.10% as the average daily net assets of the Fund increase.
Administration fees
Under a class-level administration agreement, Funds Management provides class-level administrative services to the Fund, which includes paying fees and expenses for services provided by the transfer agent, sub-transfer agents, omnibus account servicers and record-keepers. As compensation for its services under the class-level administration agreement, Funds Management receives an annual fee which is calculated based on the average daily net assets of each class as follows:
| | Class-level
administration fee |
| Class A | 0.16% |
| Class C | 0.16 |
| Administrator Class | 0.10 |
| Institutional Class | 0.08 |
Waivers and/or expense reimbursements
Funds Management has contractually waived and/or reimbursed management and administration fees to the extent necessary to maintain certain net operating expense ratios for the Fund. When each class of the Fund has exceeded its expense cap, Funds Management has waived fees and/or reimbursed expenses from fund-level expenses on a proportionate basis and then from class specific expenses. When only certain classes exceed their expense caps, waivers and/or reimbursements are applied against class specific expenses before fund-level expenses. Funds Management has committed through October 31, 2021 to waive fees and/or reimburse expenses to the extent necessary to cap the Fund’s expenses at 0.85% for Class A shares, 1.60% for Class C shares, 0.60% for Administrator Class shares and 0.52% for Institutional Class shares. Prior to or after the commitment expiration date, the cap may be increased or the commitment to maintain the cap may be terminated only with the approval of the Board of Trustees.
24 | Wells Fargo Minnesota Tax-Free Fund
Notes to financial statements (unaudited)
Distribution fee
The Trust has adopted a distribution plan for Class C shares of the Fund pursuant to Rule 12b-1 under the 1940 Act. A distribution fee is charged charged to Class C shares and paid to Wells Fargo Funds Distributor, LLC (“Funds Distributor”), the principal underwriter, at an annual rate of 0.75% of the average daily net assets of Class C shares.
In addition, Funds Distributor is entitled to receive the front-end sales charge from the purchase of Class A shares and a contingent deferred sales charge on the redemption of certain Class A shares. Funds Distributor is also entitled to receive the contingent deferred sales charges from redemptions of Class C shares. For the six months ended December 31, 2020, Funds Distributor received $205 from the sale of Class A shares. No contingent deferred sales charges were incurred by Class A and Class C shares for the six months ended December 31, 2020.
Shareholder servicing fees
The Trust has entered into contracts with one or more shareholder servicing agents, whereby Class A, Class C, and Administrator Class of the Fund are charged a fee at an annual rate of 0.25% of the average daily net assets of each respective class. A portion of these total shareholder servicing fees were paid to affiliates of Wells Fargo.
Interfund transactions
The Fund may purchase or sell portfolio investment securities to certain other Wells Fargo affiliates pursuant to Rule 17a-7 under the 1940 Act and under procedures adopted by the Board of Trustees. The procedures have been designed to ensure that these interfund transactions, which do not incur broker commissions, are effected at current market prices. Pursuant to these procedures, the Fund had $2,000,000, $0 and $0 in interfund purchases, sales and net realized gains (losses), respectively, during the six months ended December 31, 2020.
5. INVESTMENT PORTFOLIO TRANSACTIONS
Purchases and sales of investments, excluding U.S. government obligations (if any) and short-term securities, for the six months ended December 31, 2020 were $5,226,450 and $8,241,386, respectively.
6. BANK BORROWINGS
The Trust (excluding the money market funds), Wells Fargo Master Trust and Wells Fargo Variable Trust are parties to a $350,000,000 revolving credit agreement whereby the Fund is permitted to use bank borrowings for temporary or emergency purposes, such as to fund shareholder redemption requests. Interest under the credit agreement is charged to the Fund based on a borrowing rate equal to the higher of the Federal Funds rate in effect on that day plus 1.25% or the overnight LIBOR rate in effect on that day plus 1.25%. In addition, an annual commitment fee equal to 0.25% of the unused balance is allocated to each participating fund.
For the six months ended December 31, 2020, there were no borrowings by the Fund under the agreement.
7. CONCENTRATION RISK
The Fund invests a substantial portion of its assets in issuers of municipal debt securities located in a single state or territory of the U.S. Therefore, it may be more affected by economic and political developments in that state or region than would be a comparable general tax-exempt fund. As of the end of the period, the Fund invested a concentration of its portfolio in the state of Minnesota.
8. INDEMNIFICATION
Under the Fund's organizational documents, the officers and Trustees have been granted certain indemnification rights against certain liabilities that may arise out of performance of their duties to the Fund. The Fund has entered into a separate agreement with each Trustee that converts indemnification rights currently existing under the Fund’s organizational documents into contractual rights that cannot be changed in the future without the consent of the Trustee. Additionally, in the normal course of business, the Fund may enter into contracts with service providers that contain a variety of indemnification clauses. The Fund’s maximum exposure under these arrangements is dependent on future claims that may be made against the Fund and, therefore, cannot be estimated.
9. NEW ACCOUNTING PRONOUNCEMENT
In August 2018, FASB issued Accounting Standards Update (“ASU”) No. 2018-13, Fair Value Measurement (Topic 820) Disclosure Framework - Changes to the Disclosure Requirements for Fair Value Measurement. ASU 2018-13 updates the disclosure requirements on fair value measurements in Topic 820, Fair Value Measurements. The amendments are effective for fiscal years,
Wells Fargo Minnesota Tax-Free Fund | 25
Notes to financial statements (unaudited)
and interim periods within those fiscal years, beginning after December 15, 2019. Management has adopted this guidance which did not have a material impact on the financial statements.
10. SUBSEQUENT EVENT
On February 23, 2021, Wells Fargo announced that it has entered into a definitive agreement to sell Wells Fargo Asset Management (“WFAM”) to GTCR LLC and Reverence Capital Partners, L.P. WFAM is the trade name used by the asset management businesses of Wells Fargo and includes Wells Fargo Funds Management, LLC, the investment manager to the Fund, Wells Capital Management Incorporated and Wells Fargo Asset Management (International) Limited, both registered investment advisers providing sub-advisory services to certain funds, and Wells Fargo Funds Distributor, LLC, the Fund’s principal underwriter. As part of the transaction, Wells Fargo will own a 9.9% equity interest and will continue to serve as an important client and distribution partner.
Consummation of the transaction will result in the automatic termination of the Fund’s investment management agreement and sub-advisory agreement(s). The Fund’s Board of Trustees will be asked to approve new investment management arrangements with the new company. If approved by the Board, the new investment management arrangements with the new company will be presented to the shareholders of the Fund for approval, and, if approved by shareholders, would take effect upon the closing of the transaction. The transaction is expected to close in the second half of 2021, subject to customary closing conditions.
11. CORONAVIRUS (COVID-19) PANDEMIC
On March 11, 2020, the World Health Organization announced that it had made the assessment that coronavirus disease 2019 (“COVID-19”) is a pandemic. The impacts of COVID-19 are affecting the entire global economy, individual companies and investment products, and the market in general. There is significant uncertainty around the extent and duration of business disruptions related to COVID-19 and the impacts may be short term or may last for an extended period of time. The risk of further spreading of COVID-19 has led to significant uncertainty and volatility in the financial markets.
26 | Wells Fargo Minnesota Tax-Free Fund
Other information (unaudited)
PROXY VOTING INFORMATION
A description of the policies and procedures used to determine how to vote proxies relating to portfolio securities is available without charge, upon request, by calling 1-800-222-8222, visiting our website at wfam.com, or visiting the SEC website at sec.gov. Information regarding how the proxies related to portfolio securities were voted during the most recent 12-month period ended June 30 is available on the website at wfam.com or by visiting the SEC website at sec.gov.
QUARTERLY PORTFOLIO HOLDINGS INFORMATION
The Fund files its complete schedule of portfolio holdings with the SEC for the first and third quarters of each fiscal year as an exhibit to its reports on Form N-PORT. Shareholders may view the filed Form N-PORT by visiting the SEC website at sec.gov.
Wells Fargo Minnesota Tax-Free Fund | 27
Other information (unaudited)
BOARD OF TRUSTEES AND OFFICERS
Each of the Trustees and Officers1 listed in the table below acts in identical capacities for each fund in the Wells Fargo family of funds, which consists of 144 mutual funds comprising the Wells Fargo Funds Trust, Wells Fargo Variable Trust, Wells Fargo Master Trust and four closed-end funds (collectively the “Fund Complex”). This table should be read in conjunction with the Prospectus and the Statement of Additional Information2. The mailing address of each Trustee and Officer is 525 Market Street, 12th Floor, San Francisco, CA 94105. Each Trustee and Officer serves an indefinite term, however, each Trustee serves such term until reaching the mandatory retirement age established by the Trustees.
Independent Trustees
Name and
year of birth | Position held and
length of service* | Principal occupations during past five years or longer | Current other
public company or
investment
company
directorships |
William R. Ebsworth
(Born 1957) | Trustee,
since 2015 | Retired. From 1984 to 2013, equities analyst, portfolio manager, research director and chief investment officer at Fidelity Management and Research Company in Boston, Tokyo, and Hong Kong, and retired in 2013 as Chief Investment Officer of Fidelity Strategic Advisers, Inc. where he led a team of investment professionals managing client assets. Prior thereto, Board member of Hong Kong Securities Clearing Co., Hong Kong Options Clearing Corp., the Thailand International Fund, Ltd., Fidelity Investments Life Insurance Company, and Empire Fidelity Investments Life Insurance Company. Audit Committee Chair and Investment Committee Chair of the Vincent Memorial Hospital Endowment (non-profit organization). Mr. Ebsworth is a CFA® charterholder. | N/A |
Jane A. Freeman
(Born 1953) | Trustee,
since 2015;
Chair Liaison,
since 2018 | Retired. From 2012 to 2014 and 1999 to 2008, Chief Financial Officer of Scientific Learning Corporation. From 2008 to 2012, Ms. Freeman provided consulting services related to strategic business projects. Prior to 1999, Portfolio Manager at Rockefeller & Co. and Scudder, Stevens & Clark. Board member of the Harding Loevner Funds from 1996 to 2014, serving as both Lead Independent Director and chair of the Audit Committee. Board member of the Russell Exchange Traded Funds Trust from 2011 to 2012 and the chair of the Audit Committee. Ms. Freeman is also an inactive Chartered Financial Analyst. | N/A |
Isaiah Harris, Jr.
(Born 1952) | Trustee,
since 2009; Audit
Committee
Chair,
since 2019 | Retired. Chairman of the Board of CIGNA Corporation since 2009, and Director since 2005. From 2003 to 2011, Director of Deluxe Corporation. Prior thereto, President and CEO of BellSouth Advertising and Publishing Corp. from 2005 to 2007, President and CEO of BellSouth Enterprises from 2004 to 2005 and President of BellSouth Consumer Services from 2000 to 2003. Emeritus member of the Iowa State University Foundation Board of Governors. Emeritus Member of the Advisory Board of Iowa State University School of Business. Advisory Board Member, Palm Harbor Academy (private school). Mr. Harris is a certified public accountant (inactive status). | CIGNA Corporation |
Judith M. Johnson
(Born 1949) | Trustee,
since 2008 | Retired. Prior thereto, Chief Executive Officer and Chief Investment Officer of Minneapolis Employees Retirement Fund from 1996 to 2008. Ms. Johnson is an attorney, certified public accountant and a certified managerial accountant. | N/A |
David F. Larcker
(Born 1950) | Trustee,
since 2009 | James Irvin Miller Professor of Accounting at the Graduate School of Business (Emeritus), Stanford University, Director of the Corporate Governance Research Initiative and Senior Faculty of The Rock Center for Corporate Governance since 2006. From 2005 to 2008, Professor of Accounting at the Graduate School of Business, Stanford University. Prior thereto, Ernst & Young Professor of Accounting at The Wharton School, University of Pennsylvania from 1985 to 2005. | N/A |
28 | Wells Fargo Minnesota Tax-Free Fund
Other information (unaudited)
Name and
year of birth | Position held and
length of service* | Principal occupations during past five years or longer | Current other
public company or
investment
company
directorships |
Olivia S. Mitchell
(Born 1953) | Trustee,
since 2006;
Nominating and
Governance
Committee Chair,
since 2018 | International Foundation of Employee Benefit Plans Professor, Wharton School of the University of Pennsylvania since 1993. Director of Wharton’s Pension Research Council and Boettner Center on Pensions & Retirement Research, and Research Associate at the National Bureau of Economic Research. Previously, Cornell University Professor from 1978 to 1993. | N/A |
Timothy J. Penny
(Born 1951) | Trustee,
since 1996;
Chair,
since 2018 | President and Chief Executive Officer of Southern Minnesota Initiative Foundation, a non-profit organization, since 2007. Member of the Board of Trustees of NorthStar Education Finance, Inc., a non-profit organization, since 2007. | N/A |
James G. Polisson
(Born 1959) | Trustee,
since 2018 | Retired. Chief Marketing Officer, Source (ETF) UK Services, Ltd, from 2015 to 2017. From 2012 to 2015, Principal of The Polisson Group, LLC, a management consulting, corporate advisory and principal investing company. Chief Executive Officer and Managing Director at Russell Investments, Global Exchange Traded Funds from 2010 to 2012. Managing Director of Barclays Global Investors from 1998 to 2010 and Global Chief Marketing Officer for iShares and Barclays Global Investors from 2000 to 2010. Trustee of the San Francisco Mechanics’ Institute, a non-profit organization, from 2013 to 2015. Board member of the Russell Exchange Traded Fund Trust from 2011 to 2012. Director of Barclays Global Investors Holdings Deutschland GmbH from 2006 to 2009. Mr. Polisson is an attorney and has a retired status with the Massachusetts and District of Columbia Bar Associations. | N/A |
Pamela Wheelock
(Born 1959) | Trustee,
since January
2020; previously
Trustee from
January 2018 to
July 2019 | Board member of the Destination Medical Center Economic Development Agency, Rochester, Minnesota since 2019. Interim President of the McKnight Foundation from January to September 2020. Acting Commissioner, Minnesota Department of Human Services, July 2019 through September 2019. Human Services Manager (part-time), Minnesota Department of Human Services, October 2019 through December 2019. Chief Operating Officer, Twin Cities Habitat for Humanity from 2017 to 2019. Vice President of University Services, University of Minnesota from 2012 to 2016. Prior thereto, on the Board of Directors, Governance Committee and Finance Committee for the Minnesota Philanthropy Partners (Saint Paul Foundation) from 2012 to 2018, Interim Chief Executive Officer of Blue Cross Blue Shield of Minnesota from 2011 to 2012, Chairman of the Board from 2009 to 2012 and Board Director from 2003 to 2015. Vice President, Leadership and Community Engagement, Bush Foundation, Saint Paul, Minnesota (a private foundation) from 2009 to 2011. Executive Vice President and Chief Financial Officer, Minnesota Sports and Entertainment from 2004 to 2009 and Senior Vice President from 2002 to 2004. Executive Vice President of the Minnesota Wild Foundation from 2004 to 2008. Commissioner of Finance, State of Minnesota, from 1999 to 2002. Currently Board Chair of the Minnesota Wild Foundation since 2010. | N/A |
* Length of service dates reflect the Trustee’s commencement of service with the Trust’s predecessor entities, where applicable.
Wells Fargo Minnesota Tax-Free Fund | 29
Other information (unaudited)
Officers
Name and
year of birth | Position held and
length of service | Principal occupations during past five years or longer |
Andrew Owen
(Born 1960) | President,
since 2017 | Executive Vice President of Wells Fargo & Company and Head of Affiliated Managers, Wells Fargo Asset Management, since 2014. In addition, Mr. Owen is currently President, Chief Executive Officer and Director of Wells Fargo Funds Management, LLC since 2017. Prior thereto, Executive Vice President responsible for marketing, investments and product development for Wells Fargo Funds Management, LLC, from 2009 to 2014. |
Nancy Wiser1
(Born 1967) | Treasurer,
since 2012 | Executive Vice President of Wells Fargo Funds Management, LLC since 2011. Chief Operating Officer and Chief Compliance Officer at LightBox Capital Management LLC, from 2008 to 2011. |
Michelle Rhee
(Born 1966) | Chief Legal Officer,
since 2019 | Secretary of Wells Fargo Funds Management, LLC and Chief Legal Counsel of Wells Fargo Asset Management since 2018. Deputy General Counsel of Wells Fargo Bank N.A. since 2020 and Assistant General Counsel of Wells Fargo Bank, N.A. from 2018 to 2020. Associate General Counsel and Managing Director of Bank of America Corporation from 2004 to 2018. |
Catherine Kennedy
(Born 1969) | Secretary,
since 2019 | Vice President of Wells Fargo Funds Management, LLC and Senior Counsel of the Wells Fargo Legal Department since 2010. Vice President and Senior Counsel of Evergreen Investment Management Company, LLC from 1998 to 2010. |
Michael H. Whitaker
(Born 1967) | Chief Compliance Officer,
since 2016 | Chief Compliance Officer of Wells Fargo Asset Management since 2016. Senior Vice President and Chief Compliance Officer for Fidelity Investments from 2007 to 2016. |
Jeremy DePalma1
(Born 1974) | Assistant Treasurer,
since 2009 | Senior Vice President of Wells Fargo Funds Management, LLC since 2009. Senior Vice President of Evergreen Investment Management Company, LLC from 2008 to 2010 and head of the Fund Reporting and Control Team within Fund Administration from 2005 to 2010. |
1 Nancy Wiser acts as Treasurer of 67 funds in the Fund Complex. Jeremy DePalma acts as the Treasurer of 77 funds and Assistant Treasurer of 67 funds in the Fund Complex.
2 The Statement of Additional Information includes additional information about the Trustees and is available, without charge, upon request, by calling 1-800-222-8222 or by visiting the website at wfam.com.
30 | Wells Fargo Minnesota Tax-Free Fund
For more information
More information about Wells Fargo Funds is available free upon request. To obtain literature, please write, visit the Fund's website, or call:
Wells Fargo Funds
P.O. Box 219967
Kansas City, MO 64121-9967
Website: wfam.com
Individual investors: 1-800-222-8222
Retail investment professionals: 1-888-877-9275
Institutional investment professionals: 1-866-765-0778
This report and the financial statements contained herein are submitted for the general information of the shareholders of the Fund. If this report is used for promotional purposes, distribution of the report must be accompanied or preceded by a current prospectus. Before investing, please consider the investment objectives, risks, charges, and expenses of the investment. For a current prospectus and, if available, a summary prospectus, containing this information, call 1-800-222-8222 or visit the Fund’s website at wfam.com. Read the prospectus carefully before you invest or send money.
Wells Fargo Asset Management (WFAM) is the trade name for certain investment advisory/management firms owned by Wells Fargo & Company. These firms include but are not limited to Wells Capital Management Incorporated and Wells Fargo Funds Management, LLC. Certain products managed by WFAM entities are distributed by Wells Fargo Funds Distributor, LLC (a broker-dealer and Member FINRA).
This material is for general informational and educational purposes only and is NOT intended to provide investment advice or a recommendation of any kind— including a recommendation for any specific investment, strategy, or plan.
INVESTMENT PRODUCTS: NOT FDIC INSURED ■ NO BANK GUARANTEE ■ MAY LOSE VALUE
© 2021 Wells Fargo & Company. All rights reserved.
PAR-0121-00278 02-21
SA252/SAR252 12-20
Semi-Annual Report
December 31, 2020
Wells Fargo Municipal Bond Fund
Reduce clutter.
Save trees.
Sign up for electronic delivery of prospectuses and shareholder reports at wellsfargo.com/ advantagedelivery
The views expressed and any forward-looking statements are as of December 31, 2020, unless otherwise noted, and are those of the Fund's portfolio managers and/or Wells Fargo Asset Management. Discussions of individual securities or the markets generally are not intended as individual recommendations. Future events or results may vary significantly from those expressed in any forward-looking statements. The views expressed are subject to change at any time in response to changing circumstances in the market. Wells Fargo Asset Management and the Fund disclaim any obligation to publicly update or revise any views expressed or forward-looking statements.
INVESTMENT PRODUCTS: NOT FDIC INSURED ■ NO BANK GUARANTEE ■ MAY LOSE VALUE
Wells Fargo Municipal Bond Fund | 1
Letter to shareholders (unaudited)
Dear Shareholder:
We are pleased to offer you this semi-annual report for the Wells Fargo Municipal Bond Fund for the six-month period that ended December 31, 2020. Despite a deeply challenging year, dominated by the spread of COVID-19 cases and a sharp drop in economic output throughout much of the world, global stocks performed extremely well, benefiting from ongoing central bank support and rising optimism over the development and distribution of effective COVID-19 vaccines. Bonds also had positive returns, led by global bonds and high-yield bonds.
For the six-month period, U.S. stocks, based on the S&P 500 Index,1 gained 22.16%. International stocks, as measured by the MSCI ACWI ex USA Index (Net),2 returned 24.33%, while the MSCI EM Index (Net),3 had even stronger performance, with a 31.14% gain. Among bond indexes, the Bloomberg Barclays U.S. Aggregate Bond Index,4 returned 1.29%, the Bloomberg Barclays Global Aggregate ex-USD Index (unhedged),5 gained 9.44%, and the Bloomberg Barclays Municipal Bond Index,6 returned 3.07% while the ICE BofA U.S. High Yield Index,7 gained a hefty 11.49%.
The stock market rally continued in July.
After a volatile first half of the year, an existing stock market rally continued in July with strong results for equities and fixed income. However, economic data and a resurgence of COVID-19 cases underscored the urgent need to regain control of the pandemic. Second-quarter gross domestic product (GDP) shrank from the previous quarter by 9.5% and 12.1% in the U.S. and the eurozone, respectively. In contrast, China’s second-quarter GDP grew 3.2% year over year. The U.S. economy added 1.8 million jobs in July, but a double-digit jobless rate persisted.
The stock market continued to rally in August despite concerns over rising numbers of U.S. and European COVID-19 cases as well as the expiration of the $600 weekly bonus unemployment benefit in July. Relatively strong second-quarter earnings boosted investor sentiment along with the U.S. Federal Reserve’s announcement of a monetary policy shift expected to support longer-term low interest rates. U.S. manufacturing and services activity indexes beat expectations, while the U.S. housing market maintained strength. In Europe, retail sales expanded and consumer confidence was steady. China’s economy continued to expand.
Andrew Owen
President
Wells Fargo Funds
“After a volatile first half of the year, an existing stock market rally continued in July with strong results for equities and fixed income.”
| 1 | The S&P 500 Index consists of 500 stocks chosen for market size, liquidity, and industry group representation. It is a market-value-weighted index with each stock's weight in the index proportionate to its market value. You cannot invest directly in an index. |
| 2 | The Morgan Stanley Capital International (MSCI) All Country World Index (ACWI) ex USA Index (Net) is a free-float-adjusted market-capitalization-weighted index that is designed to measure the equity market performance of developed and emerging markets, excluding the United States. Source: MSCI. MSCI makes no express or implied warranties or representations and shall have no liability whatsoever with respect to any MSCI data contained herein. The MSCI data may not be further redistributed or used as a basis for other indices or any securities or financial products. This report is not approved, reviewed, or produced by MSCI. You cannot invest directly in an index. |
| 3 | The MSCI Emerging Markets (EM) Index (Net) is a free-float-adjusted market-capitalization-weighted index that is designed to measure equity market performance of emerging markets. You cannot invest directly in an index. |
| 4 | The Bloomberg Barclays U.S. Aggregate Bond Index is a broad-based benchmark that measures the investment-grade, U.S. dollar-denominated, fixed-rate taxable bond market, including Treasuries, government-related and corporate securities, mortgage-backed securities (agency fixed-rate and hybrid adjustable-rate mortgage pass-throughs), asset-backed securities, and commercial mortgage-backed securities. You cannot invest directly in an index. |
| 5 | The Bloomberg Barclays Global Aggregate ex-USD Index (unhedged) is an unmanaged index that provides a broad-based measure of the global investment-grade fixed-income markets excluding the U.S. dollar-denominated debt market. You cannot invest directly in an index. |
| 6 | The Bloomberg Barclays Municipal Bond Index is an unmanaged index composed of long-term tax-exempt bonds with a minimum credit rating of Baa. You cannot invest directly in an index. |
| 7 | The ICE BofA U.S. High Yield Index is a market-capitalization-weighted index of domestic and Yankee high-yield bonds. The index tracks the performance of high-yield securities traded in the U.S. bond market. You cannot invest directly in an index. Copyright 2021. ICE Data Indices, LLC. All rights reserved. |
2 | Wells Fargo Municipal Bond Fund
Letter to shareholders (unaudited)
Stocks grew more volatile in September on mixed economic data. U.S. economic activity continued to grow. However, U.S. unemployment remained elevated at 7.9% in September. With U.S. Congress delaying further fiscal relief and uncertainties surrounding a possible vaccine, doubts crept back into the financial markets. In the U.K., a lack of progress in Brexit talks weighed on markets. China’s economy picked up steam, fueled by increased global demand.
In October, capital markets stepped back from their six-month rally. Market volatility rose in advance of the U.S. election and amid a global increase in COVID-19 infections. Europe introduced tighter restrictions affecting economic activity. U.S. markets looked favorably at the prospect of Democratic control of the federal purse strings, which could lead to additional fiscal stimulus and a boost to economic activity. Meanwhile, China reported 4.9% third-quarter GDP growth.
Global stocks rallied in November, propelled by optimism over three promising COVID-19 vaccines. Reversing recent trends, value stocks outperformed growth stocks and cyclical stocks outpaced technology stocks. However, U.S. unemployment remained elevated, with a net job loss of 10 million since February. The eurozone services Purchasing Managers’ Index, a monthly survey of purchasing managers, contracted sharply while the region’s manufacturing activity grew. The U.S. election results added to the upbeat mood as investors anticipated more consistent policies in the new administration.
Financial markets ended the year with strength on high expectations for a rapid rollout of the COVID-19 vaccines, the successful passage of a $900 billion stimulus package, and rising expectations of additional economic support from a Democratic-led Congress. U.S. economic data were mixed with still-elevated unemployment and weak retail sales but growth in manufacturing output. In contrast, China’s economic expansion continued in both manufacturing and nonmanufacturing. U.S. COVID-19 infection rates continued to rise even as new state and local lockdown measures were implemented.
Don’t let short-term uncertainty derail long-term investment goals.
Periods of investment uncertainty can present challenges, but experience has taught us that maintaining long-term investment goals can be an effective way to plan for the future. To help you create a sound strategy based on your personal goals and risk tolerance, Wells Fargo Funds offers more than 100 mutual funds spanning a wide range of asset classes and investment styles. Although diversification cannot guarantee an investment profit or prevent losses, we believe it can be an effective way to manage investment risk and potentially smooth out overall portfolio performance. We encourage investors to know their investments and to understand that appropriate levels of risk-taking may unlock opportunities.
Thank you for choosing to invest with Wells Fargo Funds. We appreciate your confidence in us and remain committed to helping you meet your financial needs.
Sincerely,
Andrew Owen
President
Wells Fargo Funds
“Global stocks rallied in November, propelled by optimism over three promising COVID-19 vaccines.”
For further information about your Fund, contact your investment professional, visit our website at wfam.com, or call us directly at 1-800-222-8222.
Wells Fargo Municipal Bond Fund | 3
Letter to shareholders (unaudited)
Preparing for LIBOR Transition
The global financial industry is preparing to transition away from the London Interbank Offered Rate (LIBOR), a key benchmark interest rate, to new alternative rates. LIBOR underpins more than $350 trillion of financial contracts. It is the benchmark rate for a wide spectrum of products ranging from residential mortgages to corporate bonds to derivatives. Regulators have called for a market-wide transition away from LIBOR to successor reference rates by the end of 2021 (expected to be extended through June 30, 2023 for most tenors of the U.S. dollar LIBOR), which requires proactive steps be taken by issuers, counterparties, and asset managers to identify impacted products and adopt new reference rates.
The Fund holds at least one security that uses LIBOR as a floating reference rate and has a maturity date after 12-31-2021.
Although the transition process away from LIBOR has become increasingly well-defined in advance of the anticipated discontinuation date, there remains uncertainty regarding the nature of successor reference rates, and any potential effects of the transition away from LIBOR on investment instruments that use it as a benchmark rate. The transition process may result in, among other things, increased volatility or illiquidity in markets for instruments that currently rely on LIBOR and could negatively impact the value of certain instruments held by the Fund.
Wells Fargo Asset Management is monitoring LIBOR exposure closely and has put resources and controls in place to manage this transition effectively. The Fund’s portfolio management team is evaluating LIBOR holdings to understand what happens to those securities when LIBOR ceases to exist, including examining security documentation to identify the presence or absence of fallback language identifying a replacement rate to LIBOR.
While the pace of transition away from LIBOR will differ by asset class and investment strategy, the portfolio management team will monitor market conditions for those holdings to identify and mitigate deterioration or volatility in pricing and liquidity and ensure appropriate actions are taken in a timely manner.
Further information regarding the potential risks associated with the discontinuation of LIBOR can be found in the Fund’s Statement of Additional Information.
4 | Wells Fargo Municipal Bond Fund
This page is intentionally left blank.
Performance highlights (unaudited)
Investment objective
The Fund seeks current income exempt from federal income tax.
Manager
Wells Fargo Funds Management, LLC
Subadviser
Wells Capital Management Incorporated
Portfolio managers
Terry J. Goode
Robert J. Miller
Nicholos Venditti*
Average annual total returns (%) as of December 31, 2020
| | | Including sales charge | | Excluding sales charge | | Expense ratios1 (%) |
| | Inception date | 1 year | 5 year | 10 year | | 1 year | 5 year | 10 year | | Gross | Net 2 |
| Class A (WMFAX) | 4-8-2005 | -0.78 | 2.82 | 4.61 | | 3.89 | 3.77 | 5.09 | | 0.77 | 0.75 |
| Class C (WMFCX) | 4-8-2005 | 2.10 | 2.99 | 4.31 | | 3.10 | 2.99 | 4.31 | | 1.52 | 1.50 |
| Class R6 (WMBRX)3 | 7-31-2018 | – | – | – | | 4.26 | 4.10 | 5.41 | | 0.39 | 0.39 |
| Administrator Class (WMFDX) | 4-8-2005 | – | – | – | | 4.13 | 3.94 | 5.25 | | 0.71 | 0.60 |
| Institutional Class (WMBIX) | 3-31-2008 | – | – | – | | 4.20 | 4.08 | 5.40 | | 0.44 | 0.44 |
| Bloomberg Barclays Municipal Bond Index4 | – | – | – | – | | 5.21 | 3.91 | 4.63 | | – | – |
Figures quoted represent past performance, which is no guarantee of future results, and do not reflect taxes that a shareholder may pay on an investment in a fund. Investment return and principal value of an investment will fluctuate so that an investor’s shares, when redeemed, may be worth more or less than their original cost. Performance shown without sales charges would be lower if sales charges were reflected. Current performance may be lower or higher than the performance data quoted, which assumes the reinvestment of dividends and capital gains. Current month-end performance is available on the Fund’s website, wfam.com.
Index returns do not include transaction costs associated with buying and selling securities, any mutual fund fees or expenses, or any taxes. It is not possible to invest directly in an index.
For Class A shares, the maximum front-end sales charge is 4.50%. For Class C shares, the maximum contingent deferred sales charge is 1.00%. Performance including a contingent deferred sales charge assumes the sales charge for the corresponding time period. Class R6, Administrator Class, and Institutional Class shares are sold without a front-end sales charge or contingent deferred sales charge.
Bond values fluctuate in response to the financial condition of individual issuers, general market and economic conditions, and changes in interest rates. Changes in market conditions and government policies may lead to periods of heightened volatility in the bond market and reduced liquidity for certain bonds held by the Fund. In general, when interest rates rise, bond values fall and investors may lose principal value. Interest rate changes and their impact on the Fund and its share price can be sudden and unpredictable. The use of derivatives may reduce returns and/or increase volatility. Certain investment strategies tend to increase the total risk of an investment (relative to the broader market). The Fund is exposed to high-yield securities risk and municipal securities risk. Consult the Fund’s prospectus for additional information on these and other risks. A portion of the Fund’s income may be subject to federal, state, and/ or local income taxes or the Alternative Minimum Tax (AMT). Any capital gains distributions may be taxable.
Please see footnotes on page 7.
6 | Wells Fargo Municipal Bond Fund
Performance highlights (unaudited)
| Effective maturity distribution as of December 31, 20205 |
| Credit quality as of December 31, 20206 |
| * | Mr. Venditti became a portfolio manager of the Fund on September 1, 2020. |
| 1 | Reflects the expense ratios as stated in the most recent prospectuses. The expense ratios shown are subject to change and may differ from the annualized expense ratios shown in the financial highlights of this report. |
| 2 | The manager has contractually committed through October 31, 2021, to waive fees and/or reimburse expenses to the extent necessary to cap total annual fund operating expenses after fee waivers at 0.75% for Class A, 1.50% for Class C, 0.40% for Class R6, 0.60% for Administrator Class, and 0.45% for Institutional Class. Brokerage commissions, stamp duty fees, interest, taxes, acquired fund fees and expenses (if any), and extraordinary expenses are excluded from the expense caps. Prior to or after the commitment expiration date, the caps may be increased or the commitment to maintain the caps may be terminated only with the approval of the Board of Trustees. Without these caps, the Fund’s returns would have been lower. The expense ratio paid by an investor is the net expense ratio (the total annual fund operating expenses after fee waivers) as stated in the prospectuses. |
| 3 | Historical performance shown for the Class R6 shares prior to their inception reflects the performance of the Institutional Class shares, and includes the higher expenses applicable to the Institutional Class shares. If these expenses had not been included, returns for the Class R6 shares would be higher. |
| 4 | The Bloomberg Barclays Municipal Bond Index is an unmanaged index composed of long-term tax-exempt bonds with a minimum credit rating of Baa. You cannot invest directly in an index. |
| 5 | Figures represent the percentage of the Fund's long-term investments. These amounts are subject to change and may have changed since the date specified. |
| 6 | The credit quality distribution of portfolio holdings reflected in the chart is based on ratings from Standard & Poor’s, Moody’s Investors Service, and/ or Fitch Ratings Ltd. Credit quality ratings apply to the underlying holdings of the Fund and not to the Fund itself. The percentages of the Fund’s portfolio with the ratings depicted in the chart are calculated based on the total market value of fixed income securities held by the Fund. If a security was rated by all three rating agencies, the middle rating was utilized. If rated by two of three rating agencies, the lower rating was utilized, and if rated by one of the rating agencies, that rating was utilized. Standard & Poor’s rates the creditworthiness of bonds, ranging from AAA (highest) to D (lowest). Ratings from A to CCC may be modified by the addition of a plus (+) or minus (-) sign to show relative standing within the rating categories. Standard & Poor’s rates the creditworthiness of short-term notes from SP-1 (highest) to SP-3 (lowest). Moody’s rates the creditworthiness of bonds, ranging from Aaa (highest) to C (lowest). Ratings Aa to B may be modified by the addition of a number 1 (highest) to 3 (lowest) to show relative standing within the ratings categories. Moody’s rates the creditworthiness of short-term U.S. tax-exempt municipal securities from MIG 1/VMIG 1 (highest) to SG (lowest). Fitch rates the creditworthiness of bonds, ranging from AAA (highest) to D (lowest). Credit quality distribution is subject to change and may have changed since the date specified. |
Wells Fargo Municipal Bond Fund | 7
Fund expenses (unaudited)
As a shareholder of the Fund, you incur two types of costs: (1) transaction costs, including sales charges (loads) on purchase payments and contingent deferred sales charges (if any) on redemptions and (2) ongoing costs, including management fees, distribution (12b-1) and/or shareholder servicing fees, and other Fund expenses. This example is intended to help you understand your ongoing costs (in dollars) of investing in the Fund and to compare these costs with the ongoing costs of investing in other mutual funds.
The example is based on an investment of $1,000 invested at the beginning of the six-month period and held for the entire period from July 1, 2020 to December 31, 2020.
Actual expenses
The “Actual” line of the table below provides information about actual account values and actual expenses. You may use the information in this line, together with the amount you invested, to estimate the expenses that you paid over the period. Simply divide your account value by $1,000 (for example, an $8,600 account value divided by $1,000 = 8.6), then multiply the result by the number in the “Actual” line under the heading entitled “Expenses paid during period” for your applicable class of shares to estimate the expenses you paid on your account during this period.
Hypothetical example for comparison purposes
The “Hypothetical” line of the table below provides information about hypothetical account values and hypothetical expenses based on the Fund’s actual expense ratio and an assumed rate of return of 5% per year before expenses, which is not the Fund’s actual return. The hypothetical account values and expenses may not be used to estimate the actual ending account balance or expenses you paid for the period. You may use this information to compare the ongoing costs of investing in the Fund and other funds. To do so, compare this 5% hypothetical example with the 5% hypothetical examples that appear in the shareholder reports of the other funds.
Please note that the expenses shown in the table are meant to highlight your ongoing costs only and do not reflect any transactional costs, such as sales charges (loads) and contingent deferred sales charges. Therefore, the “Hypothetical” line of the table is useful in comparing ongoing costs only and will not help you determine the relative total costs of owning different funds. In addition, if these transactional costs were included, your costs would have been higher.
| | Beginning
account value
7-1-2020 | Ending
account value
12-31-2020 | Expenses
paid during
the period1 | Annualized net
expense ratio |
| Class A | | | | |
| Actual | $1,000.00 | $1,034.35 | $3.85 | 0.75% |
| Hypothetical (5% return before expenses) | $1,000.00 | $1,021.42 | $3.82 | 0.75% |
| Class C | | | | |
| Actual | $1,000.00 | $1,030.42 | $7.68 | 1.50% |
| Hypothetical (5% return before expenses) | $1,000.00 | $1,017.64 | $7.63 | 1.50% |
| Class R6 | | | | |
| Actual | $1,000.00 | $1,035.23 | $2.00 | 0.39% |
| Hypothetical (5% return before expenses) | $1,000.00 | $1,023.24 | $1.99 | 0.39% |
| Administrator Class | | | | |
| Actual | $1,000.00 | $1,035.07 | $3.08 | 0.60% |
| Hypothetical (5% return before expenses) | $1,000.00 | $1,022.18 | $3.06 | 0.60% |
| Institutional Class | | | | |
| Actual | $1,000.00 | $1,035.95 | $2.26 | 0.44% |
| Hypothetical (5% return before expenses) | $1,000.00 | $1,022.99 | $2.24 | 0.44% |
1 Expenses paid is equal to the annualized net expense ratio of each class multiplied by the average account value over the period, multiplied by the number of days in the most recent fiscal half-year divided by the number of days in the fiscal year (to reflect the one-half-year period).
8 | Wells Fargo Municipal Bond Fund
Portfolio of investments—December 31, 2020 (unaudited)
| | | | | Principal | Value |
| Closed end municipal bond fund obligations: 0.31% | | | | | |
| California: 0.31% | | | | | |
| Nuveen California AMT-Free Quality Municipal Income Fund MuniFund Preferred Shares Series A (170 Shares) 0.51% 144Aø | | | | $17,000,000 | 17,000,000 |
| Total Closed end municipal bond fund obligations (Cost $17,000,000) | | | | | 17,000,000 |
| | | Interest
rate | Maturity
date | | |
| Municipal obligations: 98.64% | | | | | |
| Alabama: 1.88% | | | | | |
| Airport revenue: 0.11% | | | | | |
| Birmingham AL Airport Authority Revenue (BAM Insured) | | 4.00 | 7-1-2036 | 500,000 | 592,010 |
| Birmingham AL Airport Authority Revenue (BAM Insured) | | 4.00 | 7-1-2037 | 500,000 | 590,045 |
| Birmingham AL Airport Authority Revenue (BAM Insured) | | 4.00 | 7-1-2038 | 400,000 | 470,664 |
| Birmingham AL Airport Authority Revenue (BAM Insured) | | 5.00 | 7-1-2028 | 700,000 | 892,801 |
| Birmingham AL Airport Authority Revenue (BAM Insured) | | 5.00 | 7-1-2029 | 750,000 | 973,583 |
| Birmingham AL Airport Authority Revenue (BAM Insured) | | 5.00 | 7-1-2030 | 500,000 | 660,260 |
| Birmingham AL Airport Authority Revenue (BAM Insured) | | 5.00 | 7-1-2032 | 600,000 | 783,138 |
| Birmingham AL Airport Authority Revenue (BAM Insured) | | 5.00 | 7-1-2033 | 650,000 | 843,850 |
| | | | | | 5,806,351 |
| GO revenue: 0.07% | | | | | |
| Birmingham AL CAB Series A1 | | 5.00 | 3-1-2045 | 3,160,000 | 3,693,977 |
| Health revenue: 0.05% | | | | | |
| UAB Medicine Finance Authority Series B | | 5.00 | 9-1-2034 | 1,000,000 | 1,307,760 |
| UAB Medicine Finance Authority Series B | | 5.00 | 9-1-2035 | 1,000,000 | 1,304,240 |
| | | | | | 2,612,000 |
| Miscellaneous revenue: 0.20% | | | | | |
| Alabama Federal Aid Highway Finance Authority Series A | | 5.00 | 6-1-2037 | 9,000,000 | 11,264,670 |
| Tax revenue: 0.54% | | | | | |
| Alabama Federal Aid Highway Finance Authority Series A | | 5.00 | 9-1-2035 | 24,000,000 | 29,538,922 |
| Utilities revenue: 0.80% | | | | | |
| Lower Alabama Gas Supply District Project #2 | | 4.00 | 12-1-2050 | 7,660,000 | 8,842,168 |
| Southeast Alabama Gas Supply District Project #2 Series A | | 4.00 | 6-1-2049 | 28,850,000 | 32,026,385 |
| Tender Option Bond Trust Receipts/Floater Certificates Series 2016-XM0184 (Morgan Stanley Bank LIQ)144Aø | | 0.59 | 9-1-2046 | 3,150,000 | 3,150,000 |
| | | | | | 44,018,553 |
The accompanying notes are an integral part of these financial statements.
Wells Fargo Municipal Bond Fund | 9
Portfolio of investments—December 31, 2020 (unaudited)
| | | Interest
rate | Maturity
date | Principal | Value |
| Water & sewer revenue: 0.11% | | | | | |
| Jefferson County AL CAB Series B (AGM Insured)¤ | | 0.00% | 10-1-2025 | $ 710,000 | $ 647,208 |
| Jefferson County AL CAB Series B (AGM Insured)¤ | | 0.00 | 10-1-2026 | 3,000,000 | 2,562,030 |
| Jefferson County AL CAB Series B (AGM Insured)¤ | | 0.00 | 10-1-2029 | 4,115,000 | 2,866,591 |
| | | | | | 6,075,829 |
| | | | | | 103,010,302 |
| Alaska: 0.04% | | | | | |
| Health revenue: 0.04% | | | | | |
| Alaska IDA Tanana Chiefs Conference Project | | 5.00 | 10-1-2033 | 1,930,000 | 2,475,302 |
| Arizona: 1.87% | | | | | |
| Education revenue: 0.49% | | | | | |
| Arizona Board of Regents University of Arizona Series C %% | | 5.00 | 8-1-2027 | 1,000,000 | 1,255,410 |
| Arizona Board of Regents University of Arizona Series C %% | | 5.00 | 8-1-2029 | 1,005,000 | 1,317,645 |
| La Paz County AZ IDA Educational Facility Imagine Schools West Middle Project Series A 144A | | 5.75 | 6-15-2038 | 1,085,000 | 1,131,145 |
| La Paz County AZ IDA Educational Facility Imagine Schools West Middle Project Series A 144A | | 5.88 | 6-15-2048 | 2,435,000 | 2,565,443 |
| Phoenix AZ IDA Legacy Traditional Schools Project Series A 144A | | 6.50 | 7-1-2034 | 2,000,000 | 2,282,240 |
| Phoenix AZ IDA Rowan University Project Series 2012 | | 5.25 | 6-1-2034 | 1,000,000 | 1,050,460 |
| Pima County AZ IDA New Plan Learning Project Series A | | 7.75 | 7-1-2035 | 7,375,000 | 7,355,825 |
| Pima County AZ IDA New Plan Learning Project Series A | | 8.13 | 7-1-2041 | 6,385,000 | 6,389,150 |
| Pima County AZ IDA Noah Webster Schools-Pima Project | | 7.00 | 12-15-2043 | 3,225,000 | 3,599,390 |
| | | | | | 26,946,708 |
| Health revenue: 0.25% | | | | | |
| Arizona Health Facilities Authority Revenue Bond Banner Health Series 2012A | | 4.00 | 1-1-2043 | 5,565,000 | 5,774,355 |
| Arizona Health Facilities Authority Revenue Bond Banner Health Series A | | 5.00 | 1-1-2044 | 5,000,000 | 5,628,800 |
| Tempe AZ IDA Friendship Village Project Series A | | 5.38 | 12-1-2021 | 1,000,000 | 1,026,470 |
| Tempe AZ IDA Friendship Village Project Series A | | 5.50 | 12-1-2022 | 1,000,000 | 1,026,940 |
| | | | | | 13,456,565 |
| Industrial development revenue: 0.26% | | | | | |
| Phoenix AZ IDA Various Republic Services Incorporated Projects | | 0.30 | 12-1-2035 | 14,000,000 | 13,999,860 |
| Miscellaneous revenue: 0.83% | | | | | |
| Arizona Board Regents Certificates Refunding Bonds University Arizona Series C | | 5.00 | 6-1-2028 | 3,250,000 | 3,439,833 |
| Navajo Nation AZ Refunding Bond Series A 144A | | 5.50 | 12-1-2030 | 7,275,000 | 8,105,732 |
| Phoenix AZ Civic Improvement Corporation Junior Lien Refunding Bond | | 5.00 | 7-1-2034 | 8,805,000 | 10,806,288 |
| Phoenix AZ Civic Improvement Corporation Series A | | 5.00 | 7-1-2034 | 13,875,000 | 16,500,983 |
| Phoenix AZ Civic Improvement Corporation Series B | | 5.00 | 7-1-2049 | 5,570,000 | 6,768,831 |
| | | | | | 45,621,667 |
The accompanying notes are an integral part of these financial statements.
10 | Wells Fargo Municipal Bond Fund
Portfolio of investments—December 31, 2020 (unaudited)
| | | Interest
rate | Maturity
date | Principal | Value |
| Water & sewer revenue: 0.04% | | | | | |
| Mesa AZ Utility System Revenue | | 4.00% | 7-1-2042 | $ 1,000,000 | $ 1,219,490 |
| Mesa AZ Utility System Revenue | | 4.00 | 7-1-2043 | 1,000,000 | 1,216,110 |
| | | | | | 2,435,600 |
| | | | | | 102,460,400 |
| Arkansas: 0.15% | | | | | |
| Miscellaneous revenue: 0.15% | | | | | |
| Arkansas Development Finance Authority Arkansas Division of Emergency Management | | 4.00 | 6-1-2038 | 1,170,000 | 1,362,149 |
| Arkansas Development Finance Authority Arkansas Division of Emergency Management | | 4.00 | 6-1-2039 | 1,000,000 | 1,162,670 |
| Arkansas Development Finance Authority Arkansas Division of Emergency Management | | 4.00 | 6-1-2040 | 500,000 | 580,605 |
| Arkansas Development Finance Authority Arkansas Division of Emergency Management | | 4.00 | 6-1-2045 | 4,500,000 | 5,179,815 |
| | | | | | 8,285,239 |
| California: 5.44% | | | | | |
| Airport revenue: 1.18% | | | | | |
| Los Angeles CA Department of Airports AMT Subordinate Revenue Bond | | 5.00 | 5-15-2034 | 1,750,000 | 2,083,918 |
| Los Angeles CA Department of Airports Subordinate Revenue Bonds | | 4.00 | 5-15-2036 | 2,000,000 | 2,229,480 |
| Los Angeles CA Department of Airports Subordinate Revenue Bonds | | 5.00 | 5-15-2034 | 1,465,000 | 1,821,845 |
| Los Angeles CA Department of Airports Subordinate Revenue Bonds Series A | | 5.25 | 5-15-2048 | 15,000,000 | 18,327,000 |
| Port of Oakland CA Refunding Bonds Series H %% | | 5.00 | 5-1-2026 | 2,500,000 | 3,032,000 |
| Port of Oakland CA Refunding Bonds Series H %% | | 5.00 | 5-1-2029 | 1,875,000 | 2,430,244 |
| San Francisco CA City & County Airport Commission San Francisco International Airport Series B | | 5.00 | 5-1-2046 | 30,000,000 | 34,901,100 |
| | | | | | 64,825,587 |
| Education revenue: 0.15% | | | | | |
| California Municipal Finance Authority Charter School Albert Einstein Academies Project Series A | | 7.13 | 8-1-2043 | 2,230,000 | 2,470,037 |
| University of California Series K | | 4.00 | 5-15-2046 | 5,075,000 | 5,723,281 |
| | | | | | 8,193,318 |
| GO revenue: 1.09% | | | | | |
| Alhambra CA Unified School District CAB Election of 2008 Series B (AGM Insured)¤ | | 0.00 | 8-1-2031 | 2,175,000 | 1,847,010 |
| Alhambra CA Unified School District CAB Election of 2008 Series B (AGC Insured)¤ | | 0.00 | 8-1-2031 | 7,500,000 | 6,369,000 |
| Alhambra CA Unified School District CAB Election of 2008 Series B (AGM Insured)¤ | | 0.00 | 8-1-2032 | 3,795,000 | 3,134,670 |
| Alhambra CA Unified School District CAB Election of 2008 Series B (AGM Insured)¤ | | 0.00 | 8-1-2034 | 5,000,000 | 3,911,350 |
| Alhambra CA Unified School District CAB Election of 2008 Series B (AGM Insured)¤ | | 0.00 | 8-1-2035 | 6,700,000 | 5,099,370 |
| California Series A (State Street Bank & Trust Company LOC)ø | | 0.15 | 5-1-2048 | 5,000,000 | 5,000,000 |
The accompanying notes are an integral part of these financial statements.
Wells Fargo Municipal Bond Fund | 11
Portfolio of investments—December 31, 2020 (unaudited)
| | | Interest
rate | Maturity
date | Principal | Value |
| GO revenue (continued) | | | | | |
| Colton CA Unified School District CAB Series B (AGM Insured)¤ | | 0.00% | 8-1-2031 | $ 1,000,000 | $ 843,870 |
| Colton CA Unified School District CAB Series B (AGM Insured)¤ | | 0.00 | 8-1-2032 | 1,000,000 | 821,280 |
| Colton CA Unified School District CAB Series B (AGM Insured)¤ | | 0.00 | 8-1-2033 | 1,000,000 | 797,870 |
| Compton CA Community College District CAB Election of 2002 Series C ¤ | | 0.00 | 8-1-2032 | 2,515,000 | 2,065,519 |
| Compton CA Community College District CAB Election of 2002 Series C ¤ | | 0.00 | 8-1-2033 | 2,000,000 | 1,595,740 |
| El Monte CA Union High School District CAB Election of 2008 (AGM Insured)¤ | | 0.00 | 6-1-2030 | 2,000,000 | 1,754,260 |
| El Monte CA Union High School District CAB Election of 2008 (AGM Insured)¤ | | 0.00 | 6-1-2031 | 2,000,000 | 1,713,520 |
| El Monte CA Union High School District CAB Election of 2008 (AGM Insured)¤ | | 0.00 | 6-1-2032 | 1,660,000 | 1,384,955 |
| El Monte CA Union High School District CAB Election of 2008 (AGM Insured)¤ | | 0.00 | 6-1-2033 | 1,230,000 | 997,555 |
| Los Angeles CA Unified School District Series R | | 4.00 | 7-1-2044 | 11,000,000 | 13,273,700 |
| Ontario Montclair CA School District CAB (AGC Insured)¤ | | 0.00 | 8-1-2028 | 1,500,000 | 1,379,475 |
| Ontario Montclair CA School District CAB (AGC Insured)¤ | | 0.00 | 8-1-2030 | 2,000,000 | 1,751,820 |
| San Diego CA Unified School District CAB Series C ¤ | | 0.00 | 7-1-2031 | 2,000,000 | 1,746,440 |
| San Diego CA Unified School District CAB Series C ¤ | | 0.00 | 7-1-2033 | 1,000,000 | 829,760 |
| San Diego CA Unified School District CAB Series C ¤ | | 0.00 | 7-1-2034 | 2,000,000 | 1,620,540 |
| Wiseburn CA School District CAB Election of 2010 Series B (AGM Insured)¤ | | 0.00 | 8-1-2034 | 2,530,000 | 1,961,028 |
| | | | | | 59,898,732 |
| Health revenue: 0.98% | | | | | |
| California HFFA Revenue Stanford Health Care Series A | | 4.00 | 8-15-2050 | 13,450,000 | 16,106,510 |
| California Statewide CDA Health Facilities Catholic Series E (AGM Insured)€ | | 0.19 | 7-1-2040 | 21,550,000 | 21,550,000 |
| University of California Regents University Medical Center Pooled Revenue Bonds 2016 Series L | | 5.00 | 5-15-2047 | 3,885,000 | 4,647,664 |
| University of California Regents University Medical Center Pooled Revenue Bonds Series L | | 4.00 | 5-15-2037 | 10,025,000 | 11,483,337 |
| | | | | | 53,787,511 |
| Housing revenue: 0.11% | | | | | |
| California Community Housing Agency Essential Housing Revenue Serenity at Larkspur Series C 144A | | 5.00 | 2-1-2050 | 1,000,000 | 1,117,180 |
| California HFA Municipal Certificate of Participation Series 2 Class A | | 4.00 | 3-20-2033 | 3,200,859 | 3,607,304 |
| California Statewide CDA Uptown Newport Apartments Series 2017 AA & BB (East West Bank LOC)ø | | 0.15 | 3-1-2057 | 1,500,000 | 1,500,000 |
| | | | | | 6,224,484 |
| Miscellaneous revenue: 0.60% | | | | | |
| Anaheim CA PFA Convention Center Expansion Project Series A | | 5.00 | 5-1-2046 | 8,500,000 | 9,347,280 |
| California Public Works Board Judicial Council Project Series A | | 5.00 | 3-1-2031 | 3,260,000 | 3,578,469 |
| Mesa CA Water District Participation Certificates | | 4.00 | 3-15-2039 | 500,000 | 613,475 |
The accompanying notes are an integral part of these financial statements.
12 | Wells Fargo Municipal Bond Fund
Portfolio of investments—December 31, 2020 (unaudited)
| | | Interest
rate | Maturity
date | Principal | Value |
| Miscellaneous revenue (continued) | | | | | |
| Mesa CA Water District Participation Certificates | | 4.00% | 3-15-2040 | $ 500,000 | $ 612,110 |
| Mesa CA Water District Participation Certificates | | 4.00 | 3-15-2045 | 1,200,000 | 1,446,792 |
| Pasadena CA PFA CAB Rose Bowl Series A ¤ | | 0.00 | 3-1-2027 | 2,095,000 | 1,966,870 |
| Pasadena CA PFA CAB Rose Bowl Series A ¤ | | 0.00 | 3-1-2028 | 4,450,000 | 4,088,616 |
| Pasadena CA PFA CAB Rose Bowl Series A ¤ | | 0.00 | 3-1-2029 | 4,520,000 | 4,054,124 |
| Pasadena CA PFA CAB Rose Bowl Series A ¤ | | 0.00 | 3-1-2031 | 2,185,000 | 1,863,171 |
| Pasadena CA PFA CAB Rose Bowl Series A ¤ | | 0.00 | 3-1-2032 | 2,000,000 | 1,660,720 |
| Pasadena CA PFA CAB Rose Bowl Series A ¤ | | 0.00 | 3-1-2033 | 4,295,000 | 3,461,598 |
| | | | | | 32,693,225 |
| Tax revenue: 0.48% | | | | | |
| Mizuho Tender Option Bond Trust Receipts/Floater Certificates (Mizuho Capital Markets LLC LIQ)144Aø | | 0.16 | 7-11-2040 | 15,000,000 | 15,000,000 |
| Mizuho Tender Option Bond Trust Receipts/Floater Certificates Series 2019-MIZ9003 (Mizuho Capital Markets LLC LOC, Mizuho Capital Markets LLC LIQ)144Aø | | 0.29 | 3-1-2036 | 4,930,000 | 4,930,000 |
| San Diego County CA Regional Transportation Commission Limited Tax Series A | | 5.00 | 4-1-2048 | 915,000 | 1,095,347 |
| Santa Clara Valley CA Transportation Series B (TD Bank NA SPA)ø | | 0.06 | 4-1-2036 | 5,000,000 | 5,000,000 |
| | | | | | 26,025,347 |
| Tobacco revenue: 0.04% | | | | | |
| California County CA Tobacco Securitization Agency | | 4.00 | 6-1-2039 | 500,000 | 602,455 |
| California County CA Tobacco Securitization Agency | | 4.00 | 6-1-2040 | 300,000 | 360,315 |
| California County CA Tobacco Securitization Agency | | 4.00 | 6-1-2049 | 1,200,000 | 1,393,656 |
| | | | | | 2,356,426 |
| Transportation revenue: 0.44% | | | | | |
| Bay Area CA Toll Authority Toll Bridge Series A (SIFMA Municipal Swap+1.25%)± | | 1.34 | 4-1-2036 | 23,545,000 | 23,885,225 |
| Utilities revenue: 0.37% | | | | | |
| M-S-R California Energy Authority Gas Series B | | 6.13 | 11-1-2029 | 15,685,000 | 20,071,467 |
| | | | | | 297,961,322 |
| Colorado: 4.02% | | | | | |
| Airport revenue: 0.44% | | | | | |
| Denver CO City & County Airport System Revenue Series 2012A | | 5.00 | 12-1-2034 | 12,855,000 | 17,849,039 |
| Denver CO City & County Airport System Revenue Series 2012A | | 5.00 | 12-1-2037 | 3,130,000 | 3,846,676 |
| Denver CO City & County Airport System Revenue Series 2012B | | 5.00 | 11-15-2030 | 2,000,000 | 2,177,840 |
| | | | | | 23,873,555 |
| Education revenue: 0.76% | | | | | |
| Colorado Board of Governors State University Enterprise System Revenue Bonds Series 2013C | | 5.25 | 3-1-2033 | 725,000 | 804,206 |
| Colorado Board of Governors State University Enterprise System Revenue Prerefunded Bond Series 2018 E-1 | | 5.00 | 3-1-2040 | 555,000 | 661,371 |
| Colorado Board of Governors State University Enterprise System Revenue Prerefunded Bond Series E-1 | | 5.00 | 3-1-2040 | 390,000 | 464,747 |
The accompanying notes are an integral part of these financial statements.
Wells Fargo Municipal Bond Fund | 13
Portfolio of investments—December 31, 2020 (unaudited)
| | | Interest
rate | Maturity
date | Principal | Value |
| Education revenue (continued) | | | | | |
| Colorado Board of Governors State University Enterprise System Revenue Unrefunded Bond Series 2018 E-1 | | 5.00% | 3-1-2040 | $ 1,055,000 | $ 1,262,033 |
| Colorado ECFA Alexander Dawson School LLC Project | | 5.00 | 2-15-2040 | 1,000,000 | 1,002,990 |
| Colorado ECFA Charter School Aspen Ridge School Project Series 2015A 144A | | 4.13 | 7-1-2026 | 425,000 | 442,115 |
| Colorado ECFA Charter School Banning Lewis Ranch Academy Project Series A | | 6.00 | 12-15-2037 | 3,250,000 | 3,444,838 |
| Colorado ECFA Charter School Banning Lewis Ranch Academy Project Series B-2 | | 7.00 | 12-15-2046 | 3,940,000 | 4,314,812 |
| Colorado ECFA Charter School Ben Franklin Academy Project | | 5.00 | 7-1-2036 | 750,000 | 854,295 |
| Colorado ECFA Charter School Community Leadership Academy Second Campus Project | | 7.00 | 8-1-2033 | 1,135,000 | 1,253,971 |
| Colorado ECFA Charter School District Montessori Charter School Project | | 5.00 | 7-15-2037 | 1,150,000 | 1,213,848 |
| Colorado ECFA Charter School Pinnacle High School Project Series 2009 | | 5.13 | 12-1-2039 | 500,000 | 500,420 |
| Colorado ECFA Charter School Refunding and Improvement Bonds Skyview Academy Project 2014 144A | | 4.13 | 7-1-2024 | 500,000 | 514,155 |
| Colorado ECFA Charter School Refunding and Improvement Bonds University Laboratory School Project 2015 | | 5.00 | 12-15-2028 | 600,000 | 679,590 |
| Colorado ECFA Charter School Rocky Mountain Classical Academy Project Series A | | 7.50 | 9-1-2033 | 5,015,000 | 5,956,065 |
| Colorado ECFA Charter School Rocky Mountain Classical Academy Project Series A | | 8.00 | 9-1-2043 | 5,930,000 | 7,112,205 |
| Colorado ECFA Charter School Rocky Mountain Classical Academy Project Series A | | 8.13 | 9-1-2048 | 3,795,000 | 4,564,095 |
| Colorado ECFA Charter School Twin Peaks Charter Academy | | 6.50 | 3-15-2043 | 1,290,000 | 1,299,378 |
| Colorado ECFA Refunding Bonds The University Corporation for Atmosphere Research Project Series B | | 5.00 | 9-1-2030 | 1,770,000 | 1,869,439 |
| Colorado ECFA School Refunding and Improvment Bonds | | 5.00 | 3-15-2035 | 2,000,000 | 2,572,260 |
| Colorado ECFA Union Colony School Project Revenue Bond Series 2018 | | 5.00 | 4-1-2048 | 715,000 | 843,421 |
| | | | | | 41,630,254 |
| GO revenue: 0.20% | | | | | |
| Aurora CO Cornerstar Metropolitan District Refunding Bond Series A | | 5.25 | 12-1-2047 | 1,000,000 | 1,041,080 |
| Aurora CO Park 70 Metropolitan District | | 5.00 | 12-1-2046 | 1,000,000 | 1,132,380 |
| Brighton Crossing Metropolitan District #6 Series A | | 5.00 | 12-1-2050 | 1,340,000 | 1,364,455 |
| Broadway Station Metropolitan District #3 Series A | | 5.00 | 12-1-2049 | 1,250,000 | 1,325,263 |
| Colorado International Center Metropolitan District #3 Refunding Bonds | | 4.63 | 12-1-2031 | 611,000 | 630,906 |
| Colorado Parker Homestead Metropolitan District Refunding & Improvement Bonds Series 2016 | | 5.63 | 12-1-2044 | 1,000,000 | 1,075,720 |
| Thompson Crossing Metropolitan District #4 Refunding & Improvement Bonds | | 5.00 | 12-1-2049 | 2,125,000 | 2,230,251 |
The accompanying notes are an integral part of these financial statements.
14 | Wells Fargo Municipal Bond Fund
Portfolio of investments—December 31, 2020 (unaudited)
| | | Interest
rate | Maturity
date | Principal | Value |
| GO revenue (continued) | | | | | |
| Weld County CO Eaton Area Park & Recreation District Series 2015 | | 5.50% | 12-1-2038 | $ 1,075,000 | $ 1,180,920 |
| Wheatlands CO Metropolitan District #2 Refunding Bond (BAM Insured) | | 5.00 | 12-1-2030 | 650,000 | 782,587 |
| | | | | | 10,763,562 |
| Health revenue: 0.25% | | | | | |
| Aspen Valley Hospital District Refunding Bonds Series 2012 | | 5.00 | 10-15-2033 | 600,000 | 631,536 |
| Colorado Health Facilities Authority Commonspirit Health Series A2 | | 5.00 | 8-1-2044 | 4,000,000 | 4,901,240 |
| Colorado Health Facilities Authority Evangelical Lutheran Good Samaritan Society Series 2015A | | 5.00 | 6-1-2040 | 1,000,000 | 1,205,540 |
| Colorado Health Facilities Authority Revenue Hospital Advent Health Obligated Group Series A | | 4.00 | 11-15-2043 | 3,500,000 | 4,101,685 |
| Colorado Health Facilities Authority Revenue Parkview Medical Center Incorporated | | 4.00 | 9-1-2045 | 500,000 | 573,085 |
| Colorado Health Facilities Authority Sisters of Charity Leavenworth Health System Series 2013A | | 5.50 | 1-1-2035 | 1,000,000 | 1,128,210 |
| Colorado Health Facilities Authority Sunny Vista Living Center Series 2015A 144A | | 5.00 | 12-1-2025 | 670,000 | 682,563 |
| Denver CO Health & Hospital Authority Refunding Bonds Series 2017A 144A | | 5.00 | 12-1-2034 | 500,000 | 598,280 |
| | | | | | 13,822,139 |
| Miscellaneous revenue: 0.53% | | | | | |
| Colorado Bridge Enterprise Revenue | | 4.00 | 12-31-2029 | 2,705,000 | 3,126,223 |
| Colorado Bridge Enterprise Revenue | | 4.00 | 6-30-2030 | 3,115,000 | 3,571,129 |
| Colorado Bridge Enterprise Revenue | | 4.00 | 6-30-2031 | 665,000 | 759,417 |
| Colorado Certificates of Participation Series A | | 4.00 | 12-15-2039 | 3,250,000 | 3,979,658 |
| Colorado E-470 Public Highway Authority CAB Series A (National Insured)¤ | | 0.00 | 9-1-2034 | 4,000,000 | 3,111,000 |
| Colorado Regional Transportation District Certificate of Participation Series 2014A | | 5.00 | 6-1-2044 | 2,000,000 | 2,180,800 |
| Denver CO School District #1 Certificate of Participation Series B | | 5.00 | 12-15-2035 | 1,000,000 | 1,204,440 |
| Denver CO School District #1 Certificate of Participation Series B | | 5.00 | 12-15-2045 | 1,200,000 | 1,425,432 |
| Fremont County CO Finance Corporation Certificate of Participation Series 2013 | | 5.25 | 12-15-2038 | 1,265,000 | 1,319,572 |
| Longmont CO Certificate of Participation Series 2014 | | 5.00 | 12-1-2034 | 1,000,000 | 1,113,400 |
| Platte Valley CO Fire Protection District Series 2012 | | 5.00 | 12-1-2036 | 325,000 | 332,153 |
| Westminster CO Certificate of Participation Series 2015A | | 5.00 | 12-1-2035 | 2,000,000 | 2,400,460 |
| Westminster CO Public Schools Certificate of Participation Series 2019 (AGM Insured) | | 5.00 | 12-1-2048 | 3,500,000 | 4,297,300 |
| | | | | | 28,820,984 |
| Tax revenue: 1.31% | | | | | |
| City of Commerce City CO Sales and Use Tax Revenue Bonds, Series 2014 (AGM Insured) | | 5.00 | 8-1-2044 | 1,250,000 | 1,419,075 |
| Colorado Park Creek Metropolitan District Refunding Bonds Series A | | 5.00 | 12-1-2045 | 500,000 | 574,125 |
| Colorado Regional Transportation District Certificate of Participation Series P-3 | | 4.00 | 7-15-2039 | 800,000 | 1,016,232 |
The accompanying notes are an integral part of these financial statements.
Wells Fargo Municipal Bond Fund | 15
Portfolio of investments—December 31, 2020 (unaudited)
| | | Interest
rate | Maturity
date | Principal | Value |
| Tax revenue (continued) | | | | | |
| Colorado Regional Transportation District Certificate of Participation Series P-3 | | 5.00% | 1-15-2031 | $ 500,000 | $ 665,270 |
| Colorado Regional Transportation District Certificate of Participation Series P-3 | | 5.00 | 7-15-2031 | 500,000 | 662,395 |
| Colorado Regional Transportation District Colorado Fastracks Project Series A | | 5.00 | 11-1-2041 | 50,945,000 | 61,383,121 |
| Colorado Regional Transportation District Fastracks Project Revenue Bonds Series 2013A | | 5.00 | 11-1-2031 | 1,000,000 | 1,079,750 |
| Denver CO City & County Refunding and Improvement Bonds Series A | | 5.00 | 8-1-2044 | 3,000,000 | 3,546,390 |
| Thornton CO Development Authority East 144th Avenue and I-25 Project Series B | | 5.00 | 12-1-2034 | 1,375,000 | 1,601,284 |
| | | | | | 71,947,642 |
| Transportation revenue: 0.29% | | | | | |
| Colorado E-470 Public Highway Authority CAB Series A | | 5.00 | 9-1-2034 | 1,300,000 | 1,728,298 |
| Colorado E-470 Public Highway Authority CAB Series A | | 5.00 | 9-1-2035 | 1,250,000 | 1,658,263 |
| Colorado E-470 Public Highway Authority CAB Series A | | 5.00 | 9-1-2036 | 1,400,000 | 1,850,436 |
| Colorado E-470 Public Highway Authority CAB Series A | | 5.00 | 9-1-2040 | 2,000,000 | 2,280,240 |
| Colorado E-470 Public Highway Authority CAB Series B (National Insured)¤ | | 0.00 | 9-1-2022 | 4,600,000 | 4,569,042 |
| Colorado High Performance Transportation Enterprise U.S. 36 & I-25 Managed Lanes | | 5.75 | 1-1-2044 | 3,360,000 | 3,601,618 |
| | | | | | 15,687,897 |
| Utilities revenue: 0.06% | | | | | |
| Colorado Springs CO Utilities System Improvement Bonds Series 2013 B-2 | | 5.00 | 11-15-2038 | 3,000,000 | 3,357,720 |
| Water & sewer revenue: 0.18% | | | | | |
| Aurora CO Water Revenue Refunding Bond First Lien | | 5.00 | 8-1-2046 | 5,000,000 | 5,981,450 |
| Central Weld County CO Water District (AGM Insured) | | 4.00 | 12-1-2035 | 800,000 | 989,488 |
| Central Weld County CO Water District (AGM Insured) | | 4.00 | 12-1-2037 | 400,000 | 491,704 |
| Central Weld County CO Water District (AGM Insured) | | 4.00 | 12-1-2038 | 400,000 | 489,804 |
| Central Weld County CO Water District (AGM Insured) | | 4.00 | 12-1-2039 | 450,000 | 549,329 |
| Central Weld County CO Water District (AGM Insured) | | 4.00 | 12-1-2040 | 500,000 | 608,030 |
| East Cherry Creek Valley CO Water and Sanitation District | | 5.00 | 11-15-2032 | 750,000 | 896,100 |
| | | | | | 10,005,905 |
| | | | | | 219,909,658 |
| Connecticut: 1.28% | | | | | |
| Education revenue: 0.35% | | | | | |
| Connecticut HEFA Trinity College Series R | | 4.00 | 6-1-2045 | 2,500,000 | 2,865,725 |
| Connecticut HEFA Trinity College Series R | | 5.00 | 6-1-2037 | 950,000 | 1,218,347 |
| Connecticut HEFA Trinity College Series R | | 5.00 | 6-1-2038 | 1,000,000 | 1,278,860 |
| Connecticut HEFA Trinity College Series R | | 5.00 | 6-1-2039 | 1,600,000 | 2,041,104 |
| Connecticut HEFA Trinity College Series R | | 5.00 | 6-1-2040 | 1,100,000 | 1,399,937 |
| Connecticut HEFA University of Hartford Series N | | 5.00 | 7-1-2031 | 75,000 | 87,719 |
| Connecticut HEFA University of Hartford Series N | | 5.00 | 7-1-2032 | 550,000 | 639,430 |
| Connecticut HEFA University of Hartford Series N | | 5.00 | 7-1-2033 | 605,000 | 699,997 |
| Connecticut HEFA University of Hartford Series N | | 5.00 | 7-1-2034 | 450,000 | 519,345 |
| Connecticut Higher Education Supplemental Loan Authority AMT | | 3.25 | 11-15-2036 | 1,400,000 | 1,450,064 |
The accompanying notes are an integral part of these financial statements.
16 | Wells Fargo Municipal Bond Fund
Portfolio of investments—December 31, 2020 (unaudited)
| | | Interest
rate | Maturity
date | Principal | Value |
| Education revenue (continued) | | | | | |
| Connecticut Higher Education Supplemental Loan Authority AMT | | 5.00% | 11-15-2027 | $ 610,000 | $ 727,779 |
| Connecticut Higher Education Supplemental Loan Authority AMT | | 5.00 | 11-15-2028 | 530,000 | 639,185 |
| Connecticut Higher Education Supplemental Loan Authority AMT | | 5.00 | 11-15-2029 | 535,000 | 653,032 |
| University of Connecticut Series A | | 5.00 | 2-15-2039 | 1,510,000 | 1,959,542 |
| University of Connecticut Series A | | 5.00 | 2-15-2040 | 2,500,000 | 3,237,525 |
| | | | | | 19,417,591 |
| GO revenue: 0.27% | | | | | |
| Bridgeport CT Series A | | 4.00 | 6-1-2039 | 1,750,000 | 1,939,298 |
| Hamden CT BAN | | 5.00 | 8-15-2026 | 1,235,000 | 1,330,305 |
| Hartford CT Series A | | 5.00 | 4-1-2028 | 3,165,000 | 3,458,934 |
| Hartford CT Series B | | 5.00 | 4-1-2025 | 1,220,000 | 1,340,792 |
| Hartford CT Series B | | 5.00 | 4-1-2026 | 1,470,000 | 1,614,104 |
| Hartford CT Series B | | 5.00 | 4-1-2027 | 1,000,000 | 1,095,410 |
| New Haven CT Series A (AGM Insured) | | 5.00 | 8-1-2039 | 3,000,000 | 3,758,100 |
| | | | | | 14,536,943 |
| Health revenue: 0.02% | | | | | |
| Connecticut HEFA McLean Series A 144A | | 5.00 | 1-1-2045 | 1,000,000 | 1,077,760 |
| Miscellaneous revenue: 0.10% | | | | | |
| Connecticut General Obligation Bonds 2012 Series E | | 5.00 | 9-15-2032 | 4,860,000 | 5,192,618 |
| Tax revenue: 0.54% | | | | | |
| Connecticut Special Tax Obligation Revenue Transportation Infrastructure Purpose | | 5.00 | 5-1-2040 | 1,700,000 | 2,212,754 |
| Connecticut Special Tax Obligation Revenue Transportation Infrastructure Purpose Series 2014A | | 5.00 | 9-1-2028 | 10,105,000 | 11,679,662 |
| Connecticut Special Tax Obligation Revenue Transportation Infrastructure Purpose Series 2018B | | 5.00 | 10-1-2036 | 5,000,000 | 6,338,500 |
| Connecticut Special Tax Obligation Revenue Transportation Infrastructure Purpose Series 2018B | | 5.00 | 10-1-2037 | 7,500,000 | 9,483,375 |
| | | | | | 29,714,291 |
| | | | | | 69,939,203 |
| Delaware: 0.36% | | | | | |
| Education revenue: 0.19% | | | | | |
| Delaware EDA Odyssey Charter School Incorporated Project Series A 144A | | 7.00 | 9-1-2045 | 7,500,000 | 8,423,250 |
| Kent County DE Charter School Incorporated Project | | 7.38 | 5-1-2037 | 2,110,000 | 2,143,992 |
| | | | | | 10,567,242 |
| Miscellaneous revenue: 0.09% | | | | | |
| Delaware EDA YMCA of Delaware Project (PNC Bank NA LOC)ø | | 0.11 | 5-1-2036 | 4,555,000 | 4,555,000 |
| Transportation revenue: 0.08% | | | | | |
| Delaware Transportation Authority U.S. 301 Project | | 5.00 | 6-1-2055 | 3,950,000 | 4,499,643 |
| | | | | | 19,621,885 |
The accompanying notes are an integral part of these financial statements.
Wells Fargo Municipal Bond Fund | 17
Portfolio of investments—December 31, 2020 (unaudited)
| | | Interest
rate | Maturity
date | Principal | Value |
| District of Columbia: 1.15% | | | | | |
| GO revenue: 0.11% | | | | | |
| District of Columbia Series A | | 5.00% | 6-1-2037 | $ 5,000,000 | $ 6,268,800 |
| Miscellaneous revenue: 0.31% | | | | | |
| District of Columbia Revenue Refunding Bonds National Public Radio Incorporated | | 4.00 | 4-1-2033 | 3,400,000 | 4,022,302 |
| District of Columbia Series A | | 5.00 | 10-15-2044 | 10,000,000 | 12,839,300 |
| | | | | | 16,861,602 |
| Tax revenue: 0.54% | | | | | |
| District of Columbia Income Tax Revenue Secured Series A | | 4.00 | 3-1-2045 | 15,980,000 | 19,195,336 |
| District of Columbia Income Tax Revenue Unrefunded Balance Secured Series G | | 5.00 | 12-1-2036 | 10,065,000 | 10,463,373 |
| | | | | | 29,658,709 |
| Transportation revenue: 0.19% | | | | | |
| Metropolitan Washington DC Airports Authority Subordinated Lien Series B (AGM Insured) | | 4.00 | 10-1-2049 | 8,000,000 | 9,077,280 |
| Washington DC Metropolitan Area Transit Authroity Series A | | 4.00 | 7-15-2045 | 1,000,000 | 1,192,950 |
| | | | | | 10,270,230 |
| | | | | | 63,059,341 |
| Florida: 6.14% | | | | | |
| Airport revenue: 2.34% | | | | | |
| Broward County FL Airport System Revenue Bond AMT Series 2015A | | 5.00 | 10-1-2036 | 12,440,000 | 14,354,392 |
| Broward County FL Airport System Revenue Bond AMT Series A | | 5.00 | 10-1-2034 | 1,750,000 | 2,220,208 |
| Broward County FL Port Facilities Revenue AMT Series B | | 4.00 | 9-1-2044 | 3,425,000 | 3,798,325 |
| Greater Orlando FL Aviation Authority AMT Series A | | 5.00 | 10-1-2046 | 3,000,000 | 3,514,620 |
| Hillsborough County FL Aviation Authority Revenue Tampa International Airport Series A | | 5.00 | 10-1-2048 | 7,000,000 | 8,353,590 |
| Hillsborough County FL Aviation Authority Revenue Tampa International Airport Series B | | 5.00 | 10-1-2040 | 1,000,000 | 1,128,430 |
| Hillsborough County FL Aviation Authority Revenue Tampa International Airport Series E | | 5.00 | 10-1-2048 | 10,000,000 | 12,028,100 |
| Hillsborough County FL Aviation Authority Revenue Tampa International Airport Series F | | 5.00 | 10-1-2048 | 17,000,000 | 20,623,380 |
| Jacksonville FL Port Authority Series B | | 5.00 | 11-1-2044 | 4,080,000 | 4,774,253 |
| Jacksonville FL Port Authority Series B | | 5.00 | 11-1-2048 | 9,870,000 | 11,480,981 |
| Miami-Dade County FL Aviation Refunding AMT | | 5.00 | 10-1-2030 | 11,000,000 | 12,563,760 |
| Miami-Dade County FL Aviation Refunding AMT | | 5.00 | 10-1-2032 | 14,000,000 | 15,907,500 |
| Miami-Dade County FL Aviation Refunding AMT Series A | | 4.00 | 10-1-2039 | 1,675,000 | 1,998,007 |
| Miami-Dade County FL Aviation Refunding AMT Series A | | 4.00 | 10-1-2040 | 1,750,000 | 2,081,643 |
| Miami-Dade County FL Aviation Refunding AMT Series A | | 4.00 | 10-1-2041 | 1,500,000 | 1,777,710 |
| Miami-Dade County FL Aviation Refunding AMT Series A | | 5.00 | 10-1-2033 | 5,000,000 | 5,669,500 |
| Miami-Dade County FL Aviation Refunding AMT Series A | | 5.00 | 10-1-2049 | 4,500,000 | 5,472,450 |
| Miami-Dade County FL Seaport AMT Series B | | 6.00 | 10-1-2033 | 500,000 | 558,790 |
| | | | | | 128,305,639 |
The accompanying notes are an integral part of these financial statements.
18 | Wells Fargo Municipal Bond Fund
Portfolio of investments—December 31, 2020 (unaudited)
| | | Interest
rate | Maturity
date | Principal | Value |
| Education revenue: 0.68% | | | | | |
| Capital Trust Agency Florida Educational Facilities Revenue Renaissance Charter School Incorporated 144A | | 5.00% | 6-15-2039 | $ 3,610,000 | $ 3,892,952 |
| Florida Development Finance Corporation Educational Facilities Renaissance Charter School Project Series A | | 8.50 | 6-15-2044 | 13,290,000 | 14,967,065 |
| Florida Higher Educational Facilities Authority Jacksonville University Project Series A-1 144A | | 5.00 | 6-1-2048 | 2,000,000 | 2,098,260 |
| Lakeland FL Educational Facilities Authority Florida Southern College Project Series A | | 5.00 | 9-1-2025 | 530,000 | 564,699 |
| Lakeland FL Educational Facilities Authority Florida Southern College Project Series A | | 5.00 | 9-1-2028 | 1,195,000 | 1,266,198 |
| Pinellas County FL Educational Facilities Authority Barry University Project | | 5.00 | 10-1-2027 | 1,600,000 | 1,663,984 |
| Volusia County FL Educational Facility Authority Embry-Riddle Aeronautical University | | 5.00 | 10-15-2044 | 6,500,000 | 8,026,460 |
| Volusia County FL Educational Facility Authority Embry-Riddle Aeronautical University | | 5.00 | 10-15-2049 | 4,000,000 | 4,899,720 |
| | | | | | 37,379,338 |
| GO revenue: 0.61% | | | | | |
| Miami-Dade County FL School District | | 5.00 | 3-15-2046 | 15,000,000 | 17,645,700 |
| Miami-Dade County FL Series 2014-A | | 5.00 | 7-1-2043 | 12,935,000 | 15,758,322 |
| | | | | | 33,404,022 |
| Health revenue: 0.87% | | | | | |
| Atlantic Beach FL Health Care Facilities Fleet Landing Project Series B | | 5.63 | 11-15-2043 | 5,000,000 | 5,327,350 |
| Collier County FL IDA NCH Healthcare System Project | | 6.25 | 10-1-2039 | 17,015,000 | 17,237,216 |
| Florida Tender Option Bond Trust Receipts/Floater Certificates Series 2018-XF2523 (Barclays Bank plc LIQ)144Aø | | 0.19 | 8-15-2047 | 4,000,000 | 4,000,000 |
| Hillsborough County FL IDA BayCare Health System Series C (TD Bank NA LOC)ø | | 0.09 | 11-1-2038 | 1,500,000 | 1,500,000 |
| Holmes County FL Hospital Corporation Doctors Memorial Hospital Project | | 6.00 | 11-1-2038 | 2,500,000 | 1,625,000 |
| Jacksonville FL HCFR Brooks Rehabilitation | | 4.00 | 11-1-2045 | 3,500,000 | 3,973,025 |
| Lee County FL IDA Shell Point Alliance | | 5.00 | 11-15-2044 | 5,350,000 | 5,917,796 |
| Lee County FL IDA Shell Point Alliance | | 5.00 | 11-15-2049 | 1,000,000 | 1,101,610 |
| Orange County FL Health Facilities Various Nemours Foundation Series C-1 (TD Bank NA LOC)ø | | 0.09 | 1-1-2039 | 1,770,000 | 1,770,000 |
| Tampa FL Hospital Revenue H. Lee Moffitt Cancer Center Project | | 4.00 | 7-1-2038 | 1,025,000 | 1,207,040 |
| Tampa FL Hospital Revenue H. Lee Moffitt Cancer Center Project | | 4.00 | 7-1-2045 | 2,500,000 | 2,884,175 |
| Tampa FL Hospital Revenue H. Lee Moffitt Cancer Center Project | | 5.00 | 7-1-2040 | 700,000 | 884,555 |
| | | | | | 47,427,767 |
| Housing revenue: 0.06% | | | | | |
| Florida Housing Finance Corporation Journet Place Apartments Series 1 | | 7.60 | 12-15-2047 | 780,000 | 930,181 |
| Florida Housing Finance Corporation Villa Capri Phase III | | 7.60 | 12-15-2042 | 2,555,000 | 2,561,617 |
| | | | | | 3,491,798 |
The accompanying notes are an integral part of these financial statements.
Wells Fargo Municipal Bond Fund | 19
Portfolio of investments—December 31, 2020 (unaudited)
| | | Interest
rate | Maturity
date | Principal | Value |
| Industrial development revenue: 0.04% | | | | | |
| Florida Development Finance Corporation 144A | | 5.00% | 5-1-2029 | $ 2,000,000 | $ 2,172,180 |
| Miscellaneous revenue: 0.44% | | | | | |
| CityPlace Florida Community Development District | | 5.00 | 5-1-2022 | 1,000,000 | 1,055,120 |
| Collier County FL School Board Refunding Bond Certificate of Participation (AGM Insured) | | 5.25 | 2-15-2021 | 1,000,000 | 1,005,590 |
| Hillsborough County FL Communications Services | | 5.00 | 10-1-2038 | 8,000,000 | 9,557,920 |
| Indigo FL Community Development District Series C | | 7.00 | 5-1-2030 | 2,248,150 | 1,573,705 |
| Lakeside Plantation FL Community Development District Series A | | 6.95 | 5-1-2031 | 981,000 | 982,668 |
| Marshall Creek Florida Community Development District | | 5.00 | 5-1-2032 | 1,710,000 | 1,727,664 |
| Marshall Creek Florida Community Development District | | 6.32 | 5-1-2045 | 120,000 | 121,831 |
| Orlando FL Capital Improvement Special Revenue Series B | | 5.00 | 10-1-2033 | 1,525,000 | 1,774,094 |
| Orlando FL Capital Improvement Special Revenue Series B | | 5.00 | 10-1-2035 | 1,680,000 | 1,950,346 |
| Orlando FL Capital Improvement Special Revenue Series B | | 5.00 | 10-1-2036 | 1,765,000 | 2,046,888 |
| Pinellas County FL IDA Drs. Kiran & Pallavi Patel Project | | 5.00 | 7-1-2039 | 2,000,000 | 2,360,180 |
| | | | | | 24,156,006 |
| Resource recovery revenue: 0.08% | | | | | |
| Florida Development Finance Corporation Solid Waste AMT Pro USA Incorporated 144A | | 5.00 | 8-1-2029 | 4,000,000 | 4,177,800 |
| Tax revenue: 0.15% | | | | | |
| Florida Board of Education Public Education Refunding Bond Capital Outlay Series D | | 4.00 | 6-1-2031 | 8,000,000 | 8,407,760 |
| Transportation revenue: 0.19% | | | | | |
| Florida Department of Transportation Series A (AGM Insured) | | 4.00 | 7-1-2038 | 4,185,000 | 4,986,051 |
| Osceola County FL Transportation Revenue Refunding Bonds and Improvement Osceola Parkway Series 2019A-1 | | 5.00 | 10-1-2044 | 4,250,000 | 5,127,328 |
| | | | | | 10,113,379 |
| Utilities revenue: 0.09% | | | | | |
| Jacksonville FL Electric Authority Subordinate Revenue Bonds 2012 Series A | | 4.00 | 10-1-2031 | 5,040,000 | 5,077,951 |
| Water & sewer revenue: 0.59% | | | | | |
| Daytona Beach FL Refunding & Improvement Bonds Project (AGM Insured) | | 5.00 | 11-1-2031 | 1,155,000 | 1,249,537 |
| Daytona Beach FL Refunding & Improvement Bonds Project (AGM Insured) | | 5.00 | 11-1-2032 | 1,465,000 | 1,584,632 |
| Florida Keys Aqueduct Authority Series A | | 5.00 | 9-1-2041 | 2,750,000 | 3,210,625 |
| North Sumter County FL Utility Dependent District (BAM Insured) | | 5.00 | 10-1-2044 | 3,000,000 | 3,798,090 |
| North Sumter County FL Utility Dependent District | | 5.00 | 10-1-2049 | 3,250,000 | 4,051,515 |
| Orange County FL Water and Wastewater Revenue Utility | | 5.00 | 10-1-2040 | 10,000,000 | 13,534,100 |
The accompanying notes are an integral part of these financial statements.
20 | Wells Fargo Municipal Bond Fund
Portfolio of investments—December 31, 2020 (unaudited)
| | | Interest
rate | Maturity
date | Principal | Value |
| Water & sewer revenue (continued) | | | | | |
| Viera East Florida Community Development District Water Management Project (National Insured) | | 5.75% | 5-1-2021 | $ 2,140,000 | $ 2,171,458 |
| Viera East Florida Community Development District Water Management Project (National Insured) | | 5.75 | 5-1-2022 | 2,265,000 | 2,402,214 |
| | | | | | 32,002,171 |
| | | | | | 336,115,811 |
| Georgia: 2.20% | | | | | |
| Education revenue: 0.18% | | | | | |
| Cobb County GA Development Authority Charter Learning Center Foundation Central Project Series A ♣ | | 6.38 | 7-1-2025 | 1,705,000 | 1,435,525 |
| Georgia Private Colleges & Universities Authority Mercer University Project | | 5.00 | 10-1-2040 | 5,000,000 | 5,470,150 |
| Georgia Private Colleges & Universities Authority Mercer University Project Series A | | 5.25 | 10-1-2027 | 2,655,000 | 2,727,375 |
| | | | | | 9,633,050 |
| Energy revenue: 0.08% | | | | | |
| Municipal Electric Authority of Georgia Project One Subordinated Bond Series A | | 5.00 | 1-1-2044 | 3,580,000 | 4,417,505 |
| Health revenue: 0.10% | | | | | |
| Fulton County GA Development Authority Hospital Revenue Bond Series A | | 5.00 | 4-1-2047 | 2,250,000 | 2,689,920 |
| The Glynn-Brunswick Memorial Hospital Authority Revenue Anticipation Certificates Series 2015 | | 5.00 | 8-1-2034 | 2,580,000 | 2,960,653 |
| | | | | | 5,650,573 |
| Tax revenue: 0.16% | | | | | |
| Metropolitan Atlanta Rapid Third Indenture Series B | | 5.00 | 7-1-2044 | 7,500,000 | 9,036,525 |
| Transportation revenue: 0.12% | | | | | |
| Georgia Road & Tollway Authority CAB I-75 South Expressway Lanes Project Series A 144A¤ | | 0.00 | 6-1-2034 | 3,750,000 | 1,681,913 |
| Georgia Road & Tollway Authority CCAB I-75 South Expressway Lanes Project Series B 144A¤ | | 0.00 | 6-1-2049 | 5,600,000 | 4,734,856 |
| | | | | | 6,416,769 |
| Utilities revenue: 1.56% | | | | | |
| Bartow County GA Development Authority Pollution Control Georgia Power Company Plant Bowen Project | | 2.75 | 12-1-2032 | 20,000,000 | 20,859,000 |
| Burke County GA Development Authority Georgia Power Company Plant Vogtle Project | | 2.93 | 11-1-2053 | 14,750,000 | 15,718,485 |
| Burke County GA Development Authority Georgia Power Company Plant Vogtle Project Series 2 | | 2.93 | 11-1-2048 | 10,000,000 | 10,656,600 |
| Burke County GA Development Authority Oglethorpe Power Corporation Vogtle Project Series F | | 3.00 | 11-1-2045 | 5,000,000 | 5,218,300 |
| Dalton GA Utilities Revenue | | 4.00 | 3-1-2040 | 1,000,000 | 1,177,370 |
| Dalton GA Utilities Revenue | | 4.00 | 3-1-2041 | 1,000,000 | 1,172,940 |
| Georgia Municipal Electric Authority Power Series EE (Ambac Insured) | | 7.25 | 1-1-2024 | 400,000 | 480,000 |
| Main Street Natural Gas Incorporated Georgia Gas Project Series A | | 5.00 | 5-15-2032 | 3,745,000 | 4,697,428 |
The accompanying notes are an integral part of these financial statements.
Wells Fargo Municipal Bond Fund | 21
Portfolio of investments—December 31, 2020 (unaudited)
| | | Interest
rate | Maturity
date | Principal | Value |
| Utilities revenue (continued) | | | | | |
| Main Street Natural Gas Incorporated Georgia Gas Project Series C (Royal Bank of Canada LIQ) | | 4.00% | 8-1-2048 | $15,000,000 | $ 16,450,950 |
| Main Street Natural Gas Incorporated Georgia Gas Project Subordinate Bond Series B (1 Month LIBOR+0.75%)± | | 0.85 | 4-1-2048 | 5,100,000 | 5,108,619 |
| Municipal Electric Authority of Georgia Plant Vogtle Units 3&4 Project M | | 5.00 | 1-1-2037 | 1,100,000 | 1,369,357 |
| Municipal Electric Authority of Georgia Plant Vogtle Units 3&4 Project M | | 5.00 | 1-1-2038 | 1,100,000 | 1,366,167 |
| Municipal Electric Authority of Georgia Project One Subordinated Bond Series A | | 4.00 | 1-1-2040 | 1,075,000 | 1,276,756 |
| | | | | | 85,551,972 |
| | | | | | 120,706,394 |
| Guam: 0.09% | | | | | |
| Airport revenue: 0.01% | | | | | |
| Guam Port Authority Private Activity-AMT Bond Series 2018B | | 5.00 | 7-1-2030 | 500,000 | 616,995 |
| Housing revenue: 0.00% | | | | | |
| Guam Housing Corporation Guaranteed Mortgage-Backed Securities Series A (FHLMC Insured) | | 5.75 | 9-1-2031 | 60,000 | 64,504 |
| Tax revenue: 0.02% | | | | | |
| Guam Government Business Privilege Tax Series A | | 5.00 | 1-1-2031 | 1,000,000 | 1,031,180 |
| Water & sewer revenue: 0.06% | | | | | |
| Guam Government Waterworks Authority Series 2013 | | 5.25 | 7-1-2023 | 1,000,000 | 1,104,250 |
| Guam Government Waterworks Authority Series A | | 5.00 | 1-1-2050 | 1,600,000 | 1,984,048 |
| | | | | | 3,088,298 |
| | | | | | 4,800,977 |
| Hawaii: 0.43% | | | | | |
| Airport revenue: 0.43% | | | | | |
| Hawaii Airports System Revenue Series A | | 5.00 | 7-1-2048 | 7,000,000 | 8,455,370 |
| Hawaii AMT Series A | | 4.00 | 7-1-2033 | 1,250,000 | 1,498,550 |
| Hawaii AMT Series A | | 4.00 | 7-1-2034 | 875,000 | 1,045,949 |
| Hawaii AMT Series A | | 4.00 | 7-1-2035 | 625,000 | 745,144 |
| Hawaii AMT Series A | | 4.00 | 7-1-2036 | 300,000 | 356,352 |
| Hawaii AMT Series A | | 5.00 | 7-1-2041 | 9,500,000 | 10,871,990 |
| Hawaii AMT Series C | | 4.00 | 7-1-2040 | 425,000 | 513,477 |
| | | | | | 23,486,832 |
| Idaho: 0.14% | | | | | |
| Education revenue: 0.14% | | | | | |
| Idaho Housing & Finance Association Idaho Arts Charter School Incorporated Project Series A | | 5.75 | 12-1-2032 | 500,000 | 535,780 |
| Idaho Housing & Finance Association Legacy Public Charter School Incorporated Project Series A | | 5.85 | 5-1-2033 | 635,000 | 656,488 |
| Idaho Housing & Finance Association Legacy Public Charter School Incorporated Project Series A | | 6.25 | 5-1-2043 | 1,365,000 | 1,422,521 |
The accompanying notes are an integral part of these financial statements.
22 | Wells Fargo Municipal Bond Fund
Portfolio of investments—December 31, 2020 (unaudited)
| | | Interest
rate | Maturity
date | Principal | Value |
| Education revenue (continued) | | | | | |
| Idaho Housing & Finance Association Nonprofit CAB North Star Charter School Series B 144A¤ | | 0.00% | 7-1-2049 | $ 1,276,564 | $ 249,019 |
| Idaho Housing & Finance Association Nonprofit North Star Charter School Series A | | 6.75 | 7-1-2048 | 1,322,876 | 1,446,552 |
| Idaho Housing & Finance Association Nonprofit Refunding Bonds Liberty Charter School Incorporated 144A | | 4.00 | 6-1-2030 | 1,360,000 | 1,467,970 |
| Idaho Housing & Finance Association Nonprofit Refunding Bonds Liberty Charter School Incorporated 144A | | 4.00 | 6-1-2038 | 1,715,000 | 1,821,553 |
| | | | | | 7,599,883 |
| Illinois: 13.35% | | | | | |
| Airport revenue: 0.55% | | | | | |
| Chicago IL O'Hare International Airport AMT Passenger Facility Charge Series B | | 5.00 | 1-1-2026 | 5,000,000 | 5,215,150 |
| Chicago IL O'Hare International Airport AMT Senior Lien Series C | | 5.50 | 1-1-2044 | 4,000,000 | 4,316,640 |
| Chicago IL O'Hare International Airport Customer Facility Charge Senior Lien (AGM Insured) | | 5.50 | 1-1-2043 | 4,530,000 | 4,894,212 |
| Chicago IL O'Hare International Airport Customer Facility Charge Senior Lien Series D | | 5.75 | 1-1-2043 | 4,500,000 | 4,797,630 |
| Chicago IL O'Hare International Airport Senior Lien Series B | | 5.00 | 1-1-2039 | 8,000,000 | 9,572,960 |
| Chicago IL O'Hare International Airport Transportation Infrastructure Properties Obligated Group | | 5.00 | 7-1-2038 | 1,000,000 | 1,178,630 |
| | | | | | 29,975,222 |
| Education revenue: 0.44% | | | | | |
| Illinois Finance Authority Bradley University Series B (PNC Bank NA LOC)ø | | 0.10 | 4-1-2038 | 1,500,000 | 1,500,000 |
| Illinois Finance Authority Charter Schools Improvement & Refunding Bonds Series A | | 6.88 | 10-1-2031 | 1,480,000 | 1,525,821 |
| Illinois Finance Authority Charter Schools Project Series A | | 6.25 | 9-1-2039 | 7,955,000 | 8,710,725 |
| Illinois Finance Authority Student Housing Illinois State University | | 6.75 | 4-1-2031 | 8,000,000 | 8,123,280 |
| University of Illinois Auxiliary Facilities Systems CAB Series A (National Insured)¤ | | 0.00 | 4-1-2026 | 2,355,000 | 2,233,247 |
| University of Illinois Auxiliary Facilities Systems CAB Series A (National Insured)¤ | | 0.00 | 4-1-2027 | 2,435,000 | 2,263,065 |
| | | | | | 24,356,138 |
| GO revenue: 3.53% | | | | | |
| Chicago IL Board of Education CAB City Colleges (National Insured)¤ | | 0.00 | 1-1-2025 | 9,935,000 | 9,058,137 |
| Chicago IL Board of Education CAB School Reform Series B-1 (National Insured)¤ | | 0.00 | 12-1-2023 | 2,930,000 | 2,763,928 |
| Chicago IL Board of Education CAB School Reform Series B-1 (National Insured)¤ | | 0.00 | 12-1-2026 | 4,245,000 | 3,672,095 |
| Chicago IL CAB City Colleges (National Insured)¤ | | 0.00 | 1-1-2030 | 5,995,000 | 4,618,428 |
| Chicago IL CAB Project & Refunding Bond Series C (AGM Insured)¤ | | 0.00 | 1-1-2026 | 7,360,000 | 6,737,859 |
| Chicago IL Neighborhoods Alive 21 Program Series B | | 5.50 | 1-1-2032 | 1,285,000 | 1,422,868 |
| Chicago IL Neighborhoods Alive 21 Program Series B | | 5.50 | 1-1-2034 | 1,500,000 | 1,652,805 |
The accompanying notes are an integral part of these financial statements.
Wells Fargo Municipal Bond Fund | 23
Portfolio of investments—December 31, 2020 (unaudited)
| | | Interest
rate | Maturity
date | Principal | Value |
| GO revenue (continued) | | | | | |
| Chicago IL Series A | | 5.00% | 1-1-2027 | $ 1,410,000 | $ 1,599,095 |
| Chicago IL Series A | | 5.50 | 1-1-2033 | 12,730,000 | 14,052,774 |
| Chicago IL Series A | | 5.50 | 1-1-2034 | 7,330,000 | 8,076,634 |
| Chicago IL Series A | | 5.50 | 1-1-2035 | 1,715,000 | 1,888,335 |
| Chicago IL Series A | | 6.00 | 1-1-2038 | 3,000,000 | 3,509,700 |
| Cook County IL Series A | | 5.25 | 11-15-2022 | 3,000,000 | 3,009,390 |
| Cook County IL Series C (AGM Insured) | | 5.00 | 11-15-2024 | 4,240,000 | 4,573,306 |
| Cook County IL Series C | | 5.00 | 11-15-2025 | 3,490,000 | 3,742,990 |
| Cook County IL Series C | | 5.00 | 11-15-2027 | 325,000 | 347,555 |
| Cook County IL Series G | | 5.00 | 11-15-2028 | 27,320,000 | 27,392,944 |
| Illinois (AGM Insured) | | 5.00 | 4-1-2026 | 3,000,000 | 3,298,830 |
| Illinois | | 5.00 | 11-1-2027 | 1,175,000 | 1,349,206 |
| Illinois | | 5.50 | 1-1-2030 | 2,900,000 | 3,597,189 |
| Illinois Series 1 (National Insured) | | 6.00 | 11-1-2026 | 3,200,000 | 3,873,856 |
| Illinois Series A (AGM Insured) | | 5.00 | 4-1-2024 | 3,000,000 | 3,220,920 |
| Illinois Series B | | 5.00 | 10-1-2028 | 2,750,000 | 3,258,668 |
| Illinois Series B | | 5.50 | 5-1-2024 | 2,500,000 | 2,804,300 |
| Illinois Series C | | 4.00 | 10-1-2038 | 4,820,000 | 5,227,097 |
| Kane, Cook & DuPage Counties IL Refunding Bond Series D | | 5.00 | 1-1-2028 | 830,000 | 939,070 |
| Kane, Cook & DuPage Counties IL Refunding Bond Series D | | 5.00 | 1-1-2033 | 2,000,000 | 2,253,920 |
| Kane, Cook & DuPage Counties IL School District #46 CAB Series B (Ambac Insured)¤ | | 0.00 | 1-1-2023 | 16,725,000 | 16,517,945 |
| Kane, Cook & DuPage Counties IL School District #46 Elgin Refunding Bond Series D | | 5.00 | 1-1-2035 | 1,850,000 | 2,081,953 |
| Kendall, Kane & Will Counties IL CAB School District #308 (AGM Insured)¤ | | 0.00 | 2-1-2025 | 855,000 | 827,264 |
| Kendall, Kane & Will Counties IL CAB School District #308 (AGM Insured)¤ | | 0.00 | 2-1-2026 | 5,050,000 | 4,830,679 |
| Kendall, Kane & Will Counties IL CAB School District #308 (AGM Insured)¤ | | 0.00 | 2-1-2027 | 12,050,000 | 11,308,564 |
| Lake County IL School District #24 Millburn CAB (National Insured)¤ | | 0.00 | 1-1-2024 | 2,000,000 | 1,937,200 |
| Lake County IL School District #38 Big Hollow CAB (Ambac Insured)¤ | | 0.00 | 2-1-2021 | 1,325,000 | 1,323,808 |
| Lake County IL School District #38 Big Hollow CAB (Ambac Insured)¤ | | 0.00 | 2-1-2024 | 5,385,000 | 5,136,913 |
| McHenry & Kane Counties IL Community Consolidated School District #158 | | 5.63 | 1-15-2032 | 2,500,000 | 2,639,450 |
| McHenry & Kane Counties IL Community Consolidated School District #158 CAB (AGM/FGIC Insured)¤ | | 0.00 | 1-1-2023 | 705,000 | 692,698 |
| Metropolitan Water Reclamation District of Greater Chicago Refunding Bond Series C | | 5.25 | 12-1-2032 | 1,565,000 | 2,222,144 |
| Peoria IL Refunding Bonds Series A (BAM Insured) | | 5.00 | 1-1-2029 | 2,000,000 | 2,528,380 |
| Sangamon Logan & Menard Counties IL Community Unit School District No. 015 Williamsville Series B (BAM Insured) | | 4.00 | 12-1-2044 | 1,500,000 | 1,704,720 |
| Tazewell County IL School District #51 (National Insured) | | 9.00 | 12-1-2023 | 350,000 | 432,051 |
| Will County IL Community High School CAB Refunding Bond Series B (BAM Insured)¤ | | 0.00 | 1-1-2033 | 2,830,000 | 2,160,592 |
| Will County IL Community High School Capital Refunding Bond Series B (BAM Insured)¤ | | 0.00 | 1-1-2032 | 400,000 | 316,256 |
| Will County IL Community High School Capital Refunding Bond Series B (BAM Insured) | | 5.00 | 1-1-2028 | 500,000 | 533,245 |
The accompanying notes are an integral part of these financial statements.
24 | Wells Fargo Municipal Bond Fund
Portfolio of investments—December 31, 2020 (unaudited)
| | | Interest
rate | Maturity
date | Principal | Value |
| GO revenue (continued) | | | | | |
| Will County IL Community Unit School District #201 Crete-Monee Prerefunded Bond CAB (National Insured)¤ | | 0.00% | 11-1-2023 | $ 430,000 | $ 423,864 |
| Will County IL Community Unit School District #201 Crete-Monee Unrefunded Bond CAB (National Insured)¤ | | 0.00 | 11-1-2023 | 1,070,000 | 1,039,526 |
| Will County IL Lincoln-Way Community High School District #210 Unrefunded Bond CAB (AGM Insured)¤ | | 0.00 | 1-1-2026 | 7,000,000 | 6,549,410 |
| | | | | | 193,148,561 |
| Health revenue: 0.23% | | | | | |
| Illinois Finance Authority Friendship Village of Schaumberg | | 5.00 | 2-15-2022 | 1,680,000 | 1,687,661 |
| Illinois Finance Authority Health Services Facility Lease Revenue Provident Group UIC Surgery | | 4.00 | 10-1-2050 | 2,000,000 | 2,206,900 |
| Illinois Finance Authority Lutheran Life Communities | | 5.00 | 11-1-2040 | 4,900,000 | 5,298,125 |
| Illinois Finance Authority Prerefunded Bonds Advocate Health | | 4.00 | 6-1-2047 | 40,000 | 42,103 |
| Illinois Finance Authority Prerefunded Bonds Advocate Health | | 4.00 | 6-1-2047 | 1,895,000 | 1,994,639 |
| Illinois Finance Authority Unrefunded Balance 2020 | | 4.00 | 6-1-2047 | 1,065,000 | 1,094,096 |
| | | | | | 12,323,524 |
| Miscellaneous revenue: 0.97% | | | | | |
| Chicago IL Board of Education Series C | | 5.00 | 12-1-2021 | 7,240,000 | 7,433,091 |
| Chicago IL Certificate of Participation River Point Plaza Redevelopment Project Series A 144A | | 4.84 | 4-15-2028 | 4,793,000 | 4,966,555 |
| Illinois | | 5.00 | 8-1-2024 | 2,000,000 | 2,099,680 |
| Illinois | | 5.00 | 8-1-2025 | 6,165,000 | 6,463,386 |
| Illinois | | 5.25 | 7-1-2030 | 2,500,000 | 2,666,100 |
| Illinois | | 5.50 | 7-1-2025 | 6,000,000 | 6,521,220 |
| Illinois | | 5.50 | 7-1-2026 | 4,450,000 | 4,823,044 |
| Illinois | | 5.50 | 7-1-2033 | 4,000,000 | 4,274,120 |
| Illinois Series 2017D | | 5.00 | 11-1-2022 | 1,360,000 | 1,435,874 |
| Illinois Series C | | 5.00 | 11-1-2029 | 2,965,000 | 3,330,199 |
| Illinois Series D | | 5.00 | 11-1-2021 | 4,575,000 | 4,704,518 |
| Illinois Sports Facilities Authority State Tax Supported Refunding Bond (AGM Insured) | | 5.00 | 6-15-2028 | 4,030,000 | 4,518,396 |
| | | | | | 53,236,183 |
| Tax revenue: 5.95% | | | | | |
| Chicago IL Motor Fuel Refunding Bond | | 5.00 | 1-1-2026 | 4,000,000 | 4,212,440 |
| Chicago IL Motor Fuel Refunding Bond | | 5.00 | 1-1-2028 | 1,000,000 | 1,052,020 |
| Chicago IL Motor Fuel Tax Refunding Bonds Series 2013 | | 5.00 | 1-1-2024 | 680,000 | 718,706 |
| Chicago IL Motor Fuel Tax Refunding Bonds Series 2013 | | 5.00 | 1-1-2025 | 2,595,000 | 2,740,709 |
| Chicago IL Refunding Bonds Series 2002 | | 5.00 | 1-1-2028 | 4,430,000 | 5,258,853 |
| Chicago IL Refunding Bonds Series 2002 | | 5.00 | 1-1-2029 | 1,500,000 | 1,780,650 |
| Chicago IL Series A | | 5.25 | 1-1-2038 | 6,000,000 | 6,302,880 |
| Chicago IL Transit Authority Sales Tax Receipts Bonds (AGM Insured) | | 5.00 | 12-1-2044 | 4,000,000 | 4,576,720 |
| Chicago IL Transit Authority Sales Tax Receipts Bonds | | 5.00 | 12-1-2046 | 18,250,000 | 21,330,235 |
| Chicago IL Transit Authority Sales Tax Receipts Bonds Series A | | 5.00 | 12-1-2045 | 1,750,000 | 2,126,723 |
| Cook County IL Sales Tax Revenue Bonds Series 2012 | | 5.00 | 11-15-2037 | 2,500,000 | 2,692,400 |
| Illinois Regional Transportation Authority (AGM Insured) | | 5.75 | 6-1-2023 | 400,000 | 431,564 |
The accompanying notes are an integral part of these financial statements.
Wells Fargo Municipal Bond Fund | 25
Portfolio of investments—December 31, 2020 (unaudited)
| | | Interest
rate | Maturity
date | Principal | Value |
| Tax revenue (continued) | | | | | |
| Illinois Regional Transportation Authority Series A | | 5.00% | 6-1-2044 | $22,840,000 | $ 25,480,532 |
| Illinois Regional Transportation Authority Series A (AGM Insured) | | 5.75 | 6-1-2034 | 19,000,000 | 26,641,040 |
| Illinois Regional Transportation Authority Series A (National Insured) | | 6.00 | 7-1-2027 | 10,620,000 | 13,162,003 |
| Illinois Regional Transportation Authority Series A (National Insured) | | 6.00 | 7-1-2033 | 5,000,000 | 7,240,050 |
| Illinois Regional Transportation Authority Series B (National Insured) | | 5.50 | 6-1-2027 | 16,455,000 | 19,540,148 |
| Illinois Sales Tax Revenue Bond Junior Obligation Tax Exempt Series A (BAM Insured) | | 4.00 | 6-15-2034 | 2,000,000 | 2,223,440 |
| Illinois Sales Tax Revenue Bond Junior Obligation Tax Exempt Series A (BAM Insured) | | 4.13 | 6-15-2037 | 1,945,000 | 2,162,120 |
| Illinois Sales Tax Revenue Build Illinois Bond | | 5.00 | 6-15-2029 | 3,000,000 | 3,042,510 |
| Illinois Sales Tax Revenue Build Illinois Bonds Junior Obligation Series C | | 4.00 | 6-15-2029 | 10,580,000 | 11,431,584 |
| Illinois Sales Tax Revenue Build Illinois Junior Obligation Tax Exempt Series C | | 4.00 | 6-15-2032 | 5,820,000 | 6,210,697 |
| Illinois Sales Tax Securitization Series A | | 5.00 | 1-1-2038 | 3,000,000 | 3,585,690 |
| Illinois Sales Tax Securitization Series C | | 5.00 | 1-1-2022 | 2,000,000 | 2,063,640 |
| Illinois Sales Tax Securitization Series C | | 5.00 | 1-1-2023 | 2,500,000 | 2,693,475 |
| Illinois Sales Tax Securitization Series C | | 5.00 | 1-1-2024 | 2,500,000 | 2,787,450 |
| Illinois Sports Facilities Authority Refunding Bonds Insured State Tax Supported CAB (Ambac Insured)¤ | | 0.00 | 6-15-2022 | 2,295,000 | 2,231,153 |
| Illinois Sports Facilities Authority Refunding Bonds Insured State Tax Supported CAB (Ambac Insured)¤ | | 0.00 | 6-15-2026 | 2,030,000 | 1,784,735 |
| Illinois Sports Facilities Authority State Tax Supported CAB (Ambac Insured)¤ | | 0.00 | 6-15-2021 | 7,705,000 | 7,642,127 |
| Illinois Sports Facilities Authority State Tax Supported CAB (Ambac Insured)¤ | | 0.00 | 6-15-2024 | 17,570,000 | 16,291,958 |
| Illinois Sports Facilities Authority State Tax Supported CAB (Ambac Insured)¤ | | 0.00 | 6-15-2025 | 2,575,000 | 2,329,397 |
| Illinois Sports Facilities Authority State Tax Supported Refunding Bond (AGM Insured) | | 5.00 | 6-15-2025 | 3,745,000 | 4,240,763 |
| Illinois Sports Facilities Authority State Tax Supported Refunding Bond (AGM Insured) | | 5.00 | 6-15-2026 | 4,775,000 | 5,393,267 |
| Illinois Sports Facilities Authority State Tax Supported Refunding Bond (AGM Insured) | | 5.00 | 6-15-2027 | 8,845,000 | 9,951,863 |
| Illinois Sports Facilities Authority State Tax Supported Refunding Bond (AGM Insured) | | 5.25 | 6-15-2032 | 3,500,000 | 3,919,580 |
| Illinois Tender Option Bond Trust Receipts/Floater Certificates Series 2018-XL0093 (Barclays Bank plc LIQ)144Aø | | 0.24 | 1-1-2048 | 2,000,000 | 2,000,000 |
| Illinois Tender Option Bond Trust Receipts/Floater Certificates Series 2020-XL0145 (Barclays Bank plc LIQ)144Aø | | 0.13 | 12-1-2055 | 3,325,000 | 3,325,000 |
| Metropolitan Pier & Exposition Authority CAB McCormick Place Expansion Project Series A (National Insured)¤ | | 0.00 | 12-15-2026 | 12,245,000 | 11,089,317 |
| Metropolitan Pier & Exposition Authority CAB McCormick Place Expansion Project Series A (National Insured)¤ | | 0.00 | 12-15-2030 | 25,700,000 | 20,590,069 |
| Metropolitan Pier & Exposition Authority CAB McCormick Place Expansion Project Series A (National Insured)¤ | | 0.00 | 6-15-2031 | 10,060,000 | 7,911,083 |
The accompanying notes are an integral part of these financial statements.
26 | Wells Fargo Municipal Bond Fund
Portfolio of investments—December 31, 2020 (unaudited)
| | | Interest
rate | Maturity
date | Principal | Value |
| Tax revenue (continued) | | | | | |
| Metropolitan Pier & Exposition Authority CAB McCormick Place Expansion Project Series A (National Insured)¤ | | 0.00% | 12-15-2031 | $ 9,800,000 | $ 7,583,632 |
| Metropolitan Pier & Exposition Authority CAB McCormick Place Expansion Project Series B (National Insured)¤ | | 0.00 | 6-15-2029 | 12,085,000 | 10,166,144 |
| Metropolitan Pier & Exposition Authority McCormick Place Expansion Project Series B | | 5.00 | 12-15-2028 | 5,000,000 | 5,210,100 |
| Sales Tax Securitization Corporation Second Lien Sales Tax | | 4.00 | 1-1-2038 | 8,950,000 | 10,106,698 |
| Southwestern Illinois Development Authority Local Government Program Collinsville Limited | | 5.00 | 3-1-2025 | 3,245,000 | 2,548,558 |
| Tender Option Bond Trust Receipts/Certificates Series 2018-YX1099 (Barclays Bank plc LIQ)144Aø | | 0.24 | 1-1-2035 | 9,750,000 | 9,750,000 |
| | | | | | 325,553,723 |
| Tobacco revenue: 0.06% | | | | | |
| Railsplitter IL Tobacco Settlement Authority | | 5.00 | 6-1-2024 | 3,000,000 | 3,442,740 |
| Transportation revenue: 0.50% | | | | | |
| Chicago IL Public Building Commission Transit Authority (Ambac Insured) | | 5.25 | 3-1-2025 | 2,960,000 | 3,450,650 |
| Chicago IL Public Building Commission Transit Authority (Ambac Insured) | | 5.25 | 3-1-2027 | 3,400,000 | 4,192,438 |
| Illinois Toll Highway Authority | | 5.00 | 1-1-2031 | 5,000,000 | 6,667,500 |
| Illinois Toll Highway Authority Toll Senior Series A | | 5.00 | 1-1-2045 | 9,000,000 | 11,584,260 |
| Illinois Toll Highway Authority Toll Senior Series B | | 5.00 | 1-1-2039 | 1,500,000 | 1,665,915 |
| | | | | | 27,560,763 |
| Utilities revenue: 0.32% | | | | | |
| Illinois Municipal Electric Agency Power Supply System Series A | | 5.00 | 2-1-2030 | 7,000,000 | 8,251,600 |
| Illinois Municipal Electric Agency Power Supply System Series A | | 5.00 | 2-1-2031 | 8,000,000 | 9,410,800 |
| | | | | | 17,662,400 |
| Water & sewer revenue: 0.80% | | | | | |
| Chicago IL Second Lien | | 5.00 | 11-1-2029 | 4,600,000 | 4,943,850 |
| Chicago IL Wastewater Refunding Bond Second Lien Bond Series C | | 5.00 | 1-1-2039 | 5,000,000 | 5,689,700 |
| Chicago IL Wastewater Transmission Second Lien Series 2012 | | 5.00 | 1-1-2027 | 5,000,000 | 5,200,850 |
| Chicago IL Wastewater Transmission Second Lien Series 2014 | | 5.00 | 1-1-2039 | 11,525,000 | 12,760,250 |
| Chicago IL Waterworks Second Lien (AGM Insured) | | 5.25 | 11-1-2032 | 3,250,000 | 4,027,953 |
| Chicago IL Waterworks Second Lien Series 2012 | | 5.00 | 11-1-2030 | 5,000,000 | 5,367,350 |
| Illinois Finance Authority Clean Water Initiative | | 4.00 | 7-1-2038 | 5,000,000 | 6,049,750 |
| | | | | | 44,039,703 |
| | | | | | 731,298,957 |
| Indiana: 1.37% | | | | | |
| Education revenue: 0.01% | | | | | |
| Indiana Finance Authority Educational Facilities Mulitpurpose KIPP Indianapolis Incorporated Project | | 5.00 | 7-1-2040 | 350,000 | 392,151 |
The accompanying notes are an integral part of these financial statements.
Wells Fargo Municipal Bond Fund | 27
Portfolio of investments—December 31, 2020 (unaudited)
| | | Interest
rate | Maturity
date | Principal | Value |
| Health revenue: 0.63% | | | | | |
| Indiana Finance Authority Health System Revenue Bonds Franciscan Alliance Incorporated Obligated Group Series C | | 4.00% | 11-1-2033 | $12,885,000 | $ 14,996,078 |
| Indiana Finance Authority Health System Revenue Bonds Franciscan Alliance Incorporated Obligated Group Series C | | 4.00 | 11-1-2036 | 5,000,000 | 5,779,700 |
| Indiana Finance Authority Kings Daughters Hospital & Health Revenue | | 5.50 | 8-15-2040 | 7,425,000 | 7,439,999 |
| Indiana Finance Authority Marion General Hospital Series A | | 4.00 | 7-1-2045 | 2,620,000 | 2,934,400 |
| Indiana HFFA Ascension Health Credit Group | | 5.00 | 11-15-2034 | 2,750,000 | 3,299,093 |
| | | | | | 34,449,270 |
| Industrial development revenue: 0.30% | | | | | |
| Indiana Finance Authority Ohio River Bridges East End Crossing Project Series A | | 5.00 | 7-1-2035 | 9,970,000 | 10,743,473 |
| Indiana Finance Authority Ohio River Bridges East End Crossing Project Series A | | 5.00 | 7-1-2040 | 2,470,000 | 2,648,803 |
| Valparaiso IN Pratt Paper LLC Project | | 5.88 | 1-1-2024 | 570,000 | 609,267 |
| Whiting IN | | 5.00 | 3-1-2046 | 2,500,000 | 2,742,575 |
| | | | | | 16,744,118 |
| Miscellaneous revenue: 0.18% | | | | | |
| Carmel IN Local Public Improvement Multipurpose Bonds | | 5.00 | 7-15-2031 | 6,000,000 | 7,320,240 |
| Hobart Industry Building Corporation First Mortgage | | 4.00 | 7-15-2035 | 2,295,000 | 2,680,583 |
| | | | | | 10,000,823 |
| Tax revenue: 0.09% | | | | | |
| Indianapolis IN Industry Local Public Improvement Bond Bank Community Justice Campus Courthouse & Jail Project | | 5.00 | 2-1-2049 | 4,000,000 | 4,985,600 |
| Utilities revenue: 0.16% | | | | | |
| Indiana Finance Authority Midwestern Disaster Relief Ohio Valley Electric Corporation Project | | 3.00 | 11-1-2030 | 4,000,000 | 4,268,760 |
| Indiana Finance Authority Ohio Valley Electric Corporation Project Series A | | 3.00 | 11-1-2030 | 4,000,000 | 4,268,760 |
| | | | | | 8,537,520 |
| | | | | | 75,109,482 |
| Iowa: 0.04% | | | | | |
| GO revenue: 0.04% | | | | | |
| Altoona IA Annual Appropriation Urban Renewal Series C | | 5.00 | 6-1-2031 | 1,805,000 | 2,158,618 |
| Kansas: 0.69% | | | | | |
| Housing revenue: 0.13% | | | | | |
| Kansas Development Finance Authority MFHR Woodland Village Apartments Project Series J | | 1.68 | 7-1-2022 | 7,250,000 | 7,297,778 |
| Tax revenue: 0.56% | | | | | |
| Kansas Department of Transportation Series C | | 4.00 | 9-1-2030 | 6,650,000 | 7,037,296 |
The accompanying notes are an integral part of these financial statements.
28 | Wells Fargo Municipal Bond Fund
Portfolio of investments—December 31, 2020 (unaudited)
| | | Interest
rate | Maturity
date | Principal | Value |
| Tax revenue (continued) | | | | | |
| Kansas Department of Transportation Series C | | 4.00% | 9-1-2032 | $ 7,500,000 | $ 7,930,200 |
| Wyandotte County & Kansas City KS Special Obligation Vacation Village Project Area 4 Major Multi-Sport Athletic Complex Project CAB Series 2015 144A¤ | | 0.00 | 9-1-2034 | 34,915,000 | 15,464,203 |
| | | | | | 30,431,699 |
| | | | | | 37,729,477 |
| Kentucky: 1.62% | | | | | |
| Health revenue: 0.25% | | | | | |
| Kentucky EDFA Norton Healthcare Incorporated Series B (National Insured)¤ | | 0.00 | 10-1-2024 | 9,260,000 | 8,859,042 |
| Kentucky EDFA Norton Healthcare Incorporated Series B (National Insured)¤ | | 0.00 | 10-1-2028 | 5,140,000 | 4,489,533 |
| | | | | | 13,348,575 |
| Transportation revenue: 0.16% | | | | | |
| Kentucky Public Transportation Infrastructure Authority Downtown Crossing Project CAB Series B ¤ | | 0.00 | 7-1-2030 | 2,000,000 | 1,449,320 |
| Kentucky Public Transportation Infrastructure Authority Downtown Crossing Project CAB Series B ¤ | | 0.00 | 7-1-2031 | 2,780,000 | 1,870,467 |
| Kentucky Public Transportation Infrastructure Authority Downtown Crossing Project CAB Series B ¤ | | 0.00 | 7-1-2032 | 2,500,000 | 1,559,150 |
| Kentucky Public Transportation Infrastructure Authority Downtown Crossing Project CAB Series C ¤ | | 0.00 | 7-1-2033 | 1,000,000 | 1,165,100 |
| Kentucky Public Transportation Infrastructure Authority Downtown Crossing Project CAB Series C ¤ | | 0.00 | 7-1-2034 | 2,505,000 | 2,907,829 |
| | | | | | 8,951,866 |
| Utilities revenue: 1.21% | | | | | |
| Kentucky Public Energy Authority Gas Supply Series A2 | | 4.00 | 4-1-2048 | 8,190,000 | 9,056,748 |
| Kentucky Public Energy Authority Gas Supply Series B | | 4.00 | 1-1-2049 | 23,250,000 | 26,134,860 |
| Kentucky Public Energy Authority Gas Supply Series C | | 4.00 | 12-1-2049 | 5,385,000 | 6,134,592 |
| Kentucky Public Energy Authority Gas Supply Series C-1 | | 4.00 | 2-1-2050 | 21,000,000 | 25,012,260 |
| | | | | | 66,338,460 |
| | | | | | 88,638,901 |
| Louisiana: 0.50% | | | | | |
| Airport revenue: 0.33% | | | | | |
| New Orleans LA Aviation Board AMT Series B (AGM Insured) | | 5.00 | 1-1-2033 | 3,000,000 | 3,422,580 |
| New Orleans LA Aviation Board AMT Series B | | 5.00 | 1-1-2034 | 4,500,000 | 5,096,385 |
| New Orleans LA Aviation Board General Airport North Terminal Project Series 2017B | | 5.00 | 1-1-2048 | 1,145,000 | 1,326,895 |
| New Orleans LA Aviation Board Gulf Opportunity Zone Consolidated Rental Car Project (AGM Insured) | | 5.00 | 1-1-2036 | 1,250,000 | 1,539,163 |
| New Orleans LA Aviation Board Gulf Opportunity Zone Consolidated Rental Car Project (AGM Insured) | | 5.00 | 1-1-2037 | 1,750,000 | 2,148,808 |
| New Orleans LA Aviation Board Gulf Opportunity Zone Consolidated Rental Car Project (AGM Insured) | | 5.00 | 1-1-2038 | 1,500,000 | 1,837,785 |
| Port of New Orleans LA AMT Series E | | 5.00 | 4-1-2040 | 2,000,000 | 2,493,320 |
| | | | | | 17,864,936 |
The accompanying notes are an integral part of these financial statements.
Wells Fargo Municipal Bond Fund | 29
Portfolio of investments—December 31, 2020 (unaudited)
| | | Interest
rate | Maturity
date | Principal | Value |
| GO revenue: 0.01% | | | | | |
| New Orleans LA (FGIC Insured) | | 5.50% | 12-1-2021 | $ 720,000 | $ 750,938 |
| Miscellaneous revenue: 0.04% | | | | | |
| Louisiana Local Government Environmental Facilities and CDA Jefferson Parish Gomesa Project 144A | | 4.00 | 11-1-2044 | 1,915,000 | 1,966,552 |
| Water & sewer revenue: 0.12% | | | | | |
| New Orleans LA Series B (AGM Insured) | | 4.00 | 6-1-2038 | 350,000 | 422,107 |
| New Orleans LA Series B (AGM Insured) | | 4.00 | 6-1-2039 | 400,000 | 481,176 |
| New Orleans LA Series B (AGM Insured) | | 4.00 | 6-1-2040 | 350,000 | 420,004 |
| New Orleans LA Series B | | 4.00 | 6-1-2050 | 1,200,000 | 1,399,968 |
| New Orleans LA Series B | | 5.00 | 6-1-2045 | 1,500,000 | 1,908,495 |
| Shreveport LA Series B (AGM Insured) | | 4.00 | 12-1-2036 | 730,000 | 861,787 |
| Shreveport LA Series B (AGM Insured) | | 4.00 | 12-1-2044 | 1,000,000 | 1,156,920 |
| | | | | | 6,650,457 |
| | | | | | 27,232,883 |
| Maine: 0.20% | | | | | |
| Health revenue: 0.20% | | | | | |
| Maine HEFA Mainehealth Series A | | 4.00 | 7-1-2040 | 1,700,000 | 2,017,747 |
| Maine HEFA Mainehealth Series A | | 4.00 | 7-1-2045 | 4,500,000 | 5,237,550 |
| Maine HEFA Series A | | 5.00 | 7-1-2028 | 1,445,000 | 1,814,414 |
| Maine HEFA Series A | | 5.00 | 7-1-2029 | 1,535,000 | 2,024,389 |
| | | | | | 11,094,100 |
| Maryland: 1.48% | | | | | |
| Education revenue: 0.34% | | | | | |
| Maryland Economic Development Corporation Salisbury University Project | | 5.00 | 6-1-2027 | 235,000 | 243,888 |
| Maryland Economic Development Corporation Salisbury University Project | | 5.00 | 6-1-2030 | 200,000 | 206,662 |
| Prince George's County MD Chesapeake Lighthouse Charter School Project Series 2016-A | | 5.75 | 8-1-2033 | 1,585,000 | 1,711,467 |
| Prince George's County MD Chesapeake Lighthouse Charter School Project Series 2016-A 144A | | 6.90 | 8-1-2041 | 8,480,000 | 9,564,083 |
| Prince George's County MD Chesapeake Lighthouse Charter School Project Series 2016-A | | 7.00 | 8-1-2046 | 6,085,000 | 6,824,145 |
| | | | | | 18,550,245 |
| Health revenue: 0.23% | | | | | |
| Maryland HEFA Frederick Health System | | 4.00 | 7-1-2045 | 745,000 | 861,555 |
| Maryland HEFA Frederick Health System | | 4.00 | 7-1-2050 | 850,000 | 976,854 |
| Tender Option Bond Trust Receipts/Certificates (Deutsche Bank LIQ)144Aø | | 0.22 | 8-15-2042 | 10,590,000 | 10,590,000 |
| | | | | | 12,428,409 |
| Housing revenue: 0.43% | | | | | |
| Maryland CDA Department of Housing & Community Multifamily Development Bay Country Apartments 144A | | 2.52 | 2-1-2021 | 9,000,000 | 9,008,910 |
The accompanying notes are an integral part of these financial statements.
30 | Wells Fargo Municipal Bond Fund
Portfolio of investments—December 31, 2020 (unaudited)
| | | Interest
rate | Maturity
date | Principal | Value |
| Housing revenue (continued) | | | | | |
| Maryland CDA Department of Housing & Community Multifamily Development Huntington Apartments Series C 144A | | 2.34% | 4-1-2021 | $ 7,000,000 | $ 7,021,770 |
| Maryland CDA Department of Housing & Community Multifamily Development Park View Woodlawn Series E | | 2.41 | 5-1-2021 | 7,450,000 | 7,481,737 |
| | | | | | 23,512,417 |
| Miscellaneous revenue: 0.41% | | | | | |
| Baltimore MD Public Schools Construction & Revitalization Program | | 5.00 | 5-1-2041 | 6,000,000 | 7,484,220 |
| Maryland Economic Development Corporation Special Obligation Covington Project | | 4.00 | 9-1-2050 | 2,500,000 | 2,570,575 |
| Maryland Series A | | 4.00 | 3-15-2034 | 10,000,000 | 12,599,000 |
| | | | | | 22,653,795 |
| Water & sewer revenue: 0.07% | | | | | |
| Baltimore MD Water Projects Series A | | 4.00 | 7-1-2039 | 500,000 | 616,005 |
| Baltimore MD Water Projects Series A | | 4.00 | 7-1-2040 | 500,000 | 613,950 |
| Baltimore MD Water Projects Series A | | 4.00 | 7-1-2045 | 2,000,000 | 2,417,680 |
| | | | | | 3,647,635 |
| | | | | | 80,792,501 |
| Massachusetts: 2.71% | | | | | |
| Airport revenue: 0.03% | | | | | |
| Massachusetts AMT Series B | | 4.00 | 7-1-2046 | 1,750,000 | 1,924,178 |
| Education revenue: 0.06% | | | | | |
| Lowell MA Collegiate Charter School Revenue | | 5.00 | 6-15-2039 | 1,000,000 | 1,096,600 |
| Lowell MA Collegiate Charter School Revenue | | 5.00 | 6-15-2049 | 1,750,000 | 1,896,213 |
| Massachusetts Educational Financing Authority Series I | | 6.00 | 1-1-2028 | 285,000 | 288,511 |
| | | | | | 3,281,324 |
| GO revenue: 0.20% | | | | | |
| Massachusetts | | 5.00 | 3-1-2041 | 7,500,000 | 8,550,225 |
| Massachusetts Series E | | 5.25 | 9-1-2048 | 1,765,000 | 2,252,193 |
| | | | | | 10,802,418 |
| Health revenue: 0.17% | | | | | |
| Massachusetts Development Finance Agency Revenue Massachusetts General/Brigham & Women's Hospital Series A-2 | | 4.00 | 7-1-2040 | 1,000,000 | 1,194,290 |
| Massachusetts Development Finance Agency Revenue Massachusetts General/Brigham & Women's Hospital Series A-2 | | 4.00 | 7-1-2041 | 1,200,000 | 1,425,228 |
| Massachusetts Development Finance Agency Various Partners Healthcare System Series K-2 (Barclays Bank plc SPA)ø | | 0.07 | 7-1-2046 | 3,000,000 | 3,000,000 |
| Massachusetts Development Finance Agency Wellforce Incorporated Series C (AGM Insured) | | 4.00 | 10-1-2045 | 2,500,000 | 2,924,600 |
| Massachusetts HEFA Partners Healthcare Systems Series F3 (TD Bank NA LOC)ø | | 0.10 | 7-1-2040 | 875,000 | 875,000 |
| | | | | | 9,419,118 |
The accompanying notes are an integral part of these financial statements.
Wells Fargo Municipal Bond Fund | 31
Portfolio of investments—December 31, 2020 (unaudited)
| | | Interest
rate | Maturity
date | Principal | Value |
| Miscellaneous revenue: 0.21% | | | | | |
| Massachusetts Series A | | 5.00% | 12-1-2036 | $10,850,000 | $ 11,327,075 |
| Tax revenue: 1.02% | | | | | |
| Massachusetts Series F | | 5.00 | 11-1-2041 | 5,000,000 | 6,251,500 |
| Massachusetts Transportation Fund Revenue Rail Enhancement & Accelerated Bridge Programs Series A | | 5.00 | 6-1-2047 | 6,485,000 | 8,000,934 |
| Massachusetts Transportation Fund Revenue Rail Enhancement & Accelerated Bridge Programs Series A | | 5.00 | 6-1-2048 | 11,510,000 | 14,345,719 |
| Massachusetts Transportation Fund Revenue Rail Enhancement & Accelerated Bridge Programs Series A | | 5.00 | 6-1-2049 | 21,500,000 | 27,296,830 |
| | | | | | 55,894,983 |
| Water & sewer revenue: 1.02% | | | | | |
| Massachusetts Water Resources Authority General Revenue Refunding Bonds Series B (AGM Insured) | | 5.25 | 8-1-2036 | 19,180,000 | 30,083,638 |
| Massachusetts Water Resources Authority General Revenue Refunding Bonds Series B (AGM Insured) | | 5.25 | 8-1-2038 | 16,000,000 | 25,584,320 |
| | | | | | 55,667,958 |
| | | | | | 148,317,054 |
| Michigan: 3.51% | | | | | |
| Airport revenue: 0.13% | | | | | |
| Wayne County MI Airport Authority AMT | | 5.00 | 12-1-2029 | 6,000,000 | 7,080,960 |
| Education revenue: 0.35% | | | | | |
| Michigan Finance Authority Limited Obligation Public School Holly Academy | | 8.00 | 10-1-2040 | 1,350,000 | 1,388,300 |
| Michigan Finance Authority Limited Obligation Public School Madison Academy Project Series A | | 8.00 | 12-1-2030 | 1,135,000 | 1,137,962 |
| Michigan Finance Authority Limited Obligation Public School Madison Academy Project Series A | | 8.25 | 12-1-2039 | 2,220,000 | 2,225,217 |
| Michigan Finance Authority Limited Obligation Refunding Bond Public School Academy Bradford | | 4.30 | 9-1-2030 | 1,280,000 | 1,317,696 |
| Michigan Finance Authority Limited Obligation Refunding Bond Public School Academy Bradford | | 4.80 | 9-1-2040 | 1,205,000 | 1,243,476 |
| Michigan Finance Authority Limited Obligation Refunding Bond Public School Academy Bradford | | 5.00 | 9-1-2050 | 4,530,000 | 4,673,284 |
| Michigan Public Educational Facilities Authority Limited Obligation Crescent Academy Project | | 7.00 | 10-1-2036 | 1,082,500 | 1,083,994 |
| Michigan Public Educational Facilities Authority Limited Obligation Madison Academy Project | | 8.38 | 12-1-2030 | 2,085,000 | 2,091,005 |
| Michigan Public Educational Facilities Authority Limited Obligation Madison Academy Project | | 8.63 | 12-1-2039 | 4,170,000 | 4,180,884 |
| | | | | | 19,341,818 |
| GO revenue: 0.14% | | | | | |
| Livonia MI Public Schools School District Building & Site Series I | | 5.00 | 5-1-2026 | 1,075,000 | 1,193,960 |
| Livonia MI Public Schools School District Building & Site Series I | | 5.00 | 5-1-2028 | 1,450,000 | 1,610,457 |
| Livonia MI Public Schools School District Building & Site Series I | | 5.00 | 5-1-2029 | 1,350,000 | 1,499,391 |
The accompanying notes are an integral part of these financial statements.
32 | Wells Fargo Municipal Bond Fund
Portfolio of investments—December 31, 2020 (unaudited)
| | | Interest
rate | Maturity
date | Principal | Value |
| GO revenue (continued) | | | | | |
| Livonia MI Public Schools School District Building & Site Series I | | 5.00% | 5-1-2030 | $ 1,775,000 | $ 1,971,422 |
| Livonia MI Public Schools School District Building & Site Series I | | 5.00 | 5-1-2031 | 1,425,000 | 1,582,691 |
| | | | | | 7,857,921 |
| Miscellaneous revenue: 1.09% | | | | | |
| Michigan Building Authority Refunding Facilities Program Bond Series I | | 5.00 | 4-15-2041 | 13,000,000 | 15,736,370 |
| Michigan Finance Authority Charter Company Wayne Criminal Justice Center Project | | 4.00 | 11-1-2048 | 6,000,000 | 6,896,100 |
| Michigan Finance Authority Local Government Loan Program City of Detroit Financial Recovery Refunding Bond Series F | | 4.50 | 10-1-2029 | 7,000,000 | 7,384,230 |
| Michigan Finance Authority Local Government Loan Program Series H-1 | | 5.00 | 10-1-2031 | 1,340,000 | 1,558,581 |
| Michigan Finance Authority Local Government Loan Program Series H-1 | | 5.00 | 10-1-2032 | 2,000,000 | 2,326,240 |
| Michigan Finance Authority Local Government Loan Program Series H-1 | | 5.00 | 10-1-2033 | 2,975,000 | 3,457,872 |
| Michigan Finance Authority Local Government Loan Program Series H-1 | | 5.00 | 10-1-2034 | 6,615,000 | 7,678,560 |
| Michigan Finance Authority Local Government Loan Program Series H-1 | | 5.00 | 10-1-2039 | 7,955,000 | 9,177,127 |
| Michigan Municipal Bond Authority Local Government Loan Program Series A (Ambac Insured) | | 4.00 | 11-1-2021 | 80,000 | 80,103 |
| Michigan Municipal Bond Authority Local Government Loan Program Series B Group A (Ambac Insured) | | 5.25 | 12-1-2023 | 920,000 | 921,454 |
| Michigan Municipal Bond Authority Local Government Loan Program Series C (Ambac Insured) | | 4.75 | 5-1-2027 | 4,610,000 | 4,612,766 |
| | | | | | 59,829,403 |
| Tax revenue: 0.50% | | | | | |
| Detroit MI Downtown Development Authority Tax Increment Revenue Refunding Bonds Catalyst Development Project Series A (AGM Insured) | | 5.00 | 7-1-2021 | 400,000 | 408,600 |
| Michigan Finance Authority Local Government Loan Program Public Lighting Authority Refunding Bonds Series B | | 5.00 | 7-1-2044 | 16,845,000 | 18,138,864 |
| Michigan Finance Authority Refunding Bond Local Government Loan Program Public Lighting Authority Series B | | 5.00 | 7-1-2039 | 7,895,000 | 8,563,549 |
| | | | | | 27,111,013 |
| Utilities revenue: 0.07% | | | | | |
| Michigan Strategic Fund Limited Obligation Detroit Edison Company Exempt Facilities Project | | 1.45 | 8-1-2029 | 3,500,000 | 3,511,865 |
| Water & sewer revenue: 1.23% | | | | | |
| Great Lakes Michigan Water Authority Sewage Disposal System Series 2016-C | | 5.00 | 7-1-2036 | 8,500,000 | 10,234,000 |
| Great Lakes Michigan Water Authority Water Supply System Series 2016-D | | 4.00 | 7-1-2032 | 11,000,000 | 12,393,260 |
| Great Lakes Michigan Water Authority Water Supply System Series 2016-D (AGM Insured) | | 4.00 | 7-1-2033 | 11,000,000 | 12,587,410 |
The accompanying notes are an integral part of these financial statements.
Wells Fargo Municipal Bond Fund | 33
Portfolio of investments—December 31, 2020 (unaudited)
| | | Interest
rate | Maturity
date | Principal | Value |
| Water & sewer revenue (continued) | | | | | |
| Michigan Finance Authority Local Government Loan Program Detroit Refunding Bond Series D-4 | | 5.00% | 7-1-2031 | $ 6,500,000 | $ 7,431,385 |
| Michigan Finance Authority Local Government Loan Program Detroit Refunding Bond Series D-6 (National Insured) | | 5.00 | 7-1-2036 | 3,250,000 | 3,678,480 |
| Michigan Finance Authority Local Government Loan Program Series C (National Insured) | | 5.00 | 7-1-2025 | 2,000,000 | 2,312,760 |
| Michigan Finance Authority Local Government Loan Program Series C (National Insured) | | 5.00 | 7-1-2026 | 1,945,000 | 2,247,700 |
| Michigan Finance Authority Local Government Loan Program Series C (National Insured) | | 5.00 | 7-1-2027 | 2,260,000 | 2,604,921 |
| Michigan Finance Authority Local Government Loan Program Series C (National Insured) | | 5.00 | 7-1-2028 | 3,480,000 | 4,003,322 |
| Michigan Finance Authority Local Government Loan Program Series C (National Insured) | | 5.00 | 7-1-2032 | 5,750,000 | 6,544,075 |
| Michigan Finance Authority Local Government Loan Program Series C | | 5.00 | 7-1-2035 | 2,000,000 | 2,330,320 |
| Michigan Finance Authority Refunding Bond Local Government Loan Program Detroit Series D-6 (National Insured) | | 5.00 | 7-1-2027 | 1,000,000 | 1,152,620 |
| | | | | | 67,520,253 |
| | | | | | 192,253,233 |
| Minnesota: 0.41% | | | | | |
| GO revenue: 0.01% | | | | | |
| Shakopee MN Independent School District # 720 Capital Facilities (State School District Credit Program Insured) | | 4.00 | 2-1-2030 | 225,000 | 265,565 |
| Shakopee MN Independent School District # 720 Capital Facilities (State School District Credit Program Insured) | | 4.00 | 2-1-2032 | 240,000 | 281,292 |
| | | | | | 546,857 |
| Health revenue: 0.31% | | | | | |
| Minneapolis MN Fairview Health Services Series 2018A | | 4.00 | 11-15-2048 | 2,315,000 | 2,629,655 |
| Shakopee MN Senior Housing Revenue Benedictine Living Community LLC Project 144A | | 5.85 | 11-1-2058 | 14,000,000 | 14,461,860 |
| | | | | | 17,091,515 |
| Utilities revenue: 0.09% | | | | | |
| Rochester MN Electric Utility Revenue Refunding Bond Series A | | 5.00 | 12-1-2042 | 3,895,000 | 4,684,594 |
| | | | | | 22,322,966 |
| Mississippi: 0.16% | | | | | |
| Miscellaneous revenue: 0.16% | | | | | |
| Mississippi Development Bank Special Obligation Jackson Water & Sewer System Project Series A (AGM Insured) | | 5.00 | 9-1-2030 | 8,070,000 | 8,602,217 |
The accompanying notes are an integral part of these financial statements.
34 | Wells Fargo Municipal Bond Fund
Portfolio of investments—December 31, 2020 (unaudited)
| | | Interest
rate | Maturity
date | Principal | Value |
| Missouri: 0.65% | | | | | |
| GO revenue: 0.10% | | | | | |
| St. Louis MO Special Administrative Board of The St. Louis School District | | 4.00% | 4-1-2030 | $ 4,840,000 | $ 5,652,394 |
| Miscellaneous revenue: 0.47% | | | | | |
| Kansas City MO IDA | | 5.00 | 3-1-2037 | 3,000,000 | 3,701,190 |
| Kansas City MO IDA Series B (AGM Insured) | | 5.00 | 3-1-2049 | 18,075,000 | 22,167,722 |
| | | | | | 25,868,912 |
| Tax revenue: 0.08% | | | | | |
| Blue Springs MO Special Obligation Tax Improvement & Refunding Bonds Adams Farm Project Series A | | 4.00 | 6-1-2026 | 4,020,000 | 4,045,045 |
| | | | | | 35,566,351 |
| Nebraska: 0.36% | | | | | |
| Health revenue: 0.02% | | | | | |
| Douglas County NE Hospital Authority Series 2 | | 4.00 | 11-15-2040 | 1,150,000 | 1,369,915 |
| Utilities revenue: 0.34% | | | | | |
| Central Plains Energy Project Nebraska Refunding Bond Project #3 | | 5.00 | 9-1-2033 | 6,000,000 | 8,181,660 |
| Central Plains Energy Project Nebraska Refunding Bond Project #3 Series 2012 | | 5.25 | 9-1-2037 | 1,800,000 | 1,933,632 |
| Nebraska Central Plains Energy Gas Project #3 | | 5.00 | 9-1-2027 | 1,020,000 | 1,091,533 |
| Tender Option Bond Trust Receipts/Certificates Series 2016 XF1053 (Deutsche Bank LIQ)144Aø | | 0.20 | 2-1-2049 | 7,345,000 | 7,345,000 |
| | | | | | 18,551,825 |
| | | | | | 19,921,740 |
| Nevada: 2.25% | | | | | |
| GO revenue: 2.24% | | | | | |
| Clark County NV Refunding Bond Limited Tax | | 4.00 | 7-1-2032 | 6,000,000 | 7,106,820 |
| Clark County NV School District Series A (AGM Insured) | | 4.00 | 6-15-2035 | 9,585,000 | 11,028,405 |
| Clark County NV School District Series A (AGM Insured) | | 4.00 | 6-15-2036 | 850,000 | 1,029,631 |
| Clark County NV School District Series A (AGM Insured) | | 4.00 | 6-15-2037 | 900,000 | 1,086,543 |
| Clark County NV School District Series A (AGM Insured) | | 4.00 | 6-15-2038 | 850,000 | 1,023,196 |
| Clark County NV School District Series A (AGM Insured) | | 4.00 | 6-15-2039 | 1,000,000 | 1,200,710 |
| Clark County NV School District Series A (AGM Insured) | | 5.00 | 6-15-2030 | 875,000 | 1,174,618 |
| Clark County NV School District Series A (AGM Insured) | | 5.00 | 6-15-2032 | 900,000 | 1,190,538 |
| Clark County NV School District Series A (AGM Insured) | | 5.00 | 6-15-2033 | 825,000 | 1,085,370 |
| Clark County NV School District Series A (AGM Insured) | | 5.00 | 6-15-2034 | 950,000 | 1,246,172 |
| Clark County NV School District Series A (AGM Insured) | | 5.00 | 6-15-2035 | 1,000,000 | 1,308,510 |
| Clark County NV Series A | | 5.00 | 6-1-2043 | 9,360,000 | 11,434,738 |
| Clark County NV Series A | | 5.00 | 5-1-2048 | 50,215,000 | 61,020,766 |
| Henderson NV Limited Tax Utillity System Series A-1 | | 4.00 | 6-1-2045 | 9,140,000 | 10,947,526 |
| Henderson NV Series B-1 | | 4.00 | 6-1-2039 | 4,060,000 | 4,951,048 |
| Henderson NV Series B-1 | | 4.00 | 6-1-2040 | 3,340,000 | 4,063,110 |
| Las Vegas NV Series A | | 4.00 | 2-1-2038 | 1,335,000 | 1,593,830 |
| | | | | | 122,491,531 |
The accompanying notes are an integral part of these financial statements.
Wells Fargo Municipal Bond Fund | 35
Portfolio of investments—December 31, 2020 (unaudited)
| | | Interest
rate | Maturity
date | Principal | Value |
| Miscellaneous revenue: 0.01% | | | | | |
| Las Vegas NV Special Improvement District #60 Local Improvement | | 5.00% | 6-1-2022 | $ 355,000 | $ 370,389 |
| Las Vegas NV Special Improvement District #60 Local Improvement | | 5.00 | 6-1-2023 | 280,000 | 300,107 |
| Las Vegas NV Special Improvement District #60 Local Improvement | | 5.00 | 6-1-2024 | 155,000 | 170,125 |
| | | | | | 840,621 |
| | | | | | 123,332,152 |
| New Hampshire: 0.13% | | | | | |
| Housing revenue: 0.13% | | | | | |
| New Hampshire National Finance Authority Municipal Certificates Series A | | 4.13 | 1-20-2034 | 6,421,279 | 7,210,326 |
| New Jersey: 4.03% | | | | | |
| Airport revenue: 0.03% | | | | | |
| South Jersey Port Corporation Marine Terminal Refunding Bond Series 2016S | | 5.00 | 1-1-2039 | 1,350,000 | 1,529,604 |
| Education revenue: 0.19% | | | | | |
| New Jersey Educational Facilities Authority Higher Education Facilities Trust Fund | | 5.00 | 6-15-2025 | 5,830,000 | 6,591,690 |
| Rutgers NJ State University Series L | | 5.00 | 5-1-2033 | 3,560,000 | 3,958,328 |
| | | | | | 10,550,018 |
| GO revenue: 0.39% | | | | | |
| Bayonne NJ School Refunding Bonds (AGM Insured) | | 5.00 | 7-15-2023 | 2,505,000 | 2,796,557 |
| Newark NJ Qualified General Improvement Series A | | 5.00 | 7-15-2025 | 5,000,000 | 5,716,200 |
| Newark NJ Qualified General Improvement Series A | | 5.00 | 7-15-2026 | 2,205,000 | 2,513,744 |
| Newark NJ Qualified General Improvement Series A | | 5.00 | 7-15-2027 | 6,035,000 | 6,848,759 |
| Newark NJ Qualified General Improvement Series A | | 5.25 | 7-15-2024 | 1,325,000 | 1,486,094 |
| Newark NJ Qualified General Improvement Series B | | 5.00 | 7-15-2025 | 385,000 | 433,344 |
| Newark NJ Qualified General Improvement Series B | | 5.00 | 7-15-2026 | 395,000 | 443,869 |
| Newark NJ Qualified General Improvement Series B | | 5.00 | 7-15-2027 | 405,000 | 454,365 |
| Newark NJ Qualified General Improvement Series B | | 5.25 | 7-15-2024 | 375,000 | 415,425 |
| | | | | | 21,108,357 |
| Industrial development revenue: 0.19% | | | | | |
| New Jersey EDA | | 5.00 | 3-1-2025 | 4,000,000 | 4,337,480 |
| New Jersey EDA Continental Airlines Incorporated Project | | 5.25 | 9-15-2029 | 5,960,000 | 6,306,574 |
| | | | | | 10,644,054 |
| Miscellaneous revenue: 1.26% | | | | | |
| New Jersey EDA Motor Vehicle Surcharge Revenue Refunding Bond Series A | | 3.13 | 7-1-2029 | 2,620,000 | 2,646,148 |
| New Jersey EDA Revenue Prerefunded Refunding Bonds School Facilities | | 5.00 | 3-1-2026 | 580,000 | 612,463 |
| New Jersey EDA Revenue Unrefunded Refunding Bonds School Facilities | | 5.00 | 3-1-2026 | 3,645,000 | 3,817,409 |
| New Jersey EDA School Facilities Construction Refunding Bond Series NN | | 5.00 | 3-1-2026 | 11,000,000 | 11,893,750 |
The accompanying notes are an integral part of these financial statements.
36 | Wells Fargo Municipal Bond Fund
Portfolio of investments—December 31, 2020 (unaudited)
| | | Interest
rate | Maturity
date | Principal | Value |
| Miscellaneous revenue (continued) | | | | | |
| New Jersey Tender Option Bond Trust Receipts/Floater Certificates Series 2018-XG0205 (Barclays Bank plc LOC, Barclays Bank plc LIQ)144Aø | | 0.12% | 6-15-2050 | $ 9,035,000 | $ 9,035,000 |
| New Jersey TTFA Series A ¤ | | 0.00 | 12-15-2039 | 10,000,000 | ���5,737,200 |
| New Jersey TTFA Series A (National Insured) | | 5.75 | 6-15-2023 | 2,000,000 | 2,250,680 |
| New Jersey TTFA Series A (National Insured) | | 5.75 | 6-15-2025 | 10,000,000 | 12,000,800 |
| Newark NJ Housing Authority Port Authority Port Newark Marine Terminal Rental Refunding Bond Newark Redevelopment Project (National Insured) | | 5.25 | 1-1-2024 | 1,225,000 | 1,344,805 |
| Newark NJ Housing Authority Port Newark Marine Terminal Rental (National Insured) | | 5.00 | 1-1-2032 | 7,620,000 | 9,186,824 |
| Union County NJ Utilities Authority Refunding AMT Covanta Union Series A | | 5.25 | 12-1-2031 | 10,000,000 | 10,404,400 |
| | | | | | 68,929,479 |
| Tax revenue: 0.76% | | | | | |
| New Jersey Covid 19 Emergency Series A | | 4.00 | 6-1-2032 | 12,050,000 | 15,019,000 |
| New Jersey Garden State Preservation Trust Open & Farmland Series A (AGM Insured) | | 5.75 | 11-1-2028 | 15,000,000 | 18,867,150 |
| New Jersey TTFA Series AA | | 5.00 | 6-15-2039 | 3,000,000 | 3,711,660 |
| New Jersey TTFA Series AA | | 5.00 | 6-15-2045 | 3,500,000 | 4,260,970 |
| | | | | | 41,858,780 |
| Transportation revenue: 1.21% | | | | | |
| New Jersey Transportation Trust | | 5.00 | 6-15-2038 | 4,035,000 | 4,233,320 |
| New Jersey TTFA CAB Series A ¤ | | 0.00 | 12-15-2026 | 1,150,000 | 1,037,795 |
| New Jersey TTFA CAB Series A ¤ | | 0.00 | 12-15-2028 | 10,100,000 | 8,611,563 |
| New Jersey TTFA CAB Series A ¤ | | 0.00 | 12-15-2029 | 11,875,000 | 9,782,388 |
| New Jersey TTFA CAB Series A ¤ | | 0.00 | 12-15-2030 | 8,000,000 | 6,377,920 |
| New Jersey TTFA CAB Series A ¤ | | 0.00 | 12-15-2031 | 4,500,000 | 3,463,515 |
| New Jersey TTFA Series A | | 5.00 | 12-15-2036 | 1,500,000 | 1,815,255 |
| New Jersey TTFA Series A | | 5.00 | 6-15-2042 | 1,505,000 | 1,575,148 |
| New Jersey TTFA Series AA | | 4.00 | 6-15-2045 | 2,195,000 | 2,454,712 |
| New Jersey TTFA Series AA | | 5.00 | 6-15-2044 | 1,000,000 | 1,089,240 |
| New Jersey TTFA Series AA | | 5.25 | 6-15-2033 | 10,000,000 | 10,845,800 |
| New Jersey TTFA Series B | | 5.25 | 6-15-2036 | 5,575,000 | 5,681,037 |
| New Jersey TTFA Series C | | 5.25 | 6-15-2032 | 8,000,000 | 9,087,760 |
| | | | | | 66,055,453 |
| | | | | | 220,675,745 |
| New Mexico: 0.14% | | | | | |
| Housing revenue: 0.01% | | | | | |
| New Mexico Mortgage Finance Authority Single-Family Mortgage Revenue Class I (GNMA/FNMA/FHLMC Insured) | | 5.35 | 3-1-2030 | 315,000 | 315,879 |
The accompanying notes are an integral part of these financial statements.
Wells Fargo Municipal Bond Fund | 37
Portfolio of investments—December 31, 2020 (unaudited)
| | | Interest
rate | Maturity
date | Principal | Value |
| Utilities revenue: 0.13% | | | | | |
| Farmington NM Public Service Company of New Mexico San Juan Project Series A ø | | 0.19% | 6-1-2040 | $ 1,045,000 | $ 1,045,000 |
| New Mexico Municipal Energy Acquisition Authority Gas Supply Revenue Refunding Bond and Acquisition Subordinated Series A (Royal Bank of Canada LIQ) | | 5.00 | 11-1-2039 | 5,140,000 | 6,080,414 |
| | | | | | 7,125,414 |
| | | | | | 7,441,293 |
| New York: 10.16% | | | | | |
| Airport revenue: 0.57% | | | | | |
| Port Authority of New York & New Jersey Series 193 | | 5.00 | 10-15-2028 | 1,760,000 | 2,089,965 |
| Port Authority of New York & New Jersey Series 205 | | 5.25 | 11-15-2039 | 16,580,000 | 20,887,152 |
| Port Authority of New York & New Jersey Series 211 | | 5.00 | 9-1-2048 | 2,000,000 | 2,473,440 |
| Port Authority of New York & New Jersey Series 221 | | 4.00 | 7-15-2045 | 5,000,000 | 5,817,200 |
| | | | | | 31,267,757 |
| Education revenue: 0.50% | | | | | |
| Dutchess County NY Local Development Corporation Bard College Project 144A | | 5.00 | 7-1-2051 | 3,000,000 | 3,279,540 |
| Hempstead Town NY Local Development Corporation The Academy Charter School Project Series A | | 5.73 | 2-1-2050 | 10,030,000 | 11,050,151 |
| New York Dormitory Authority Barnard College Series A | | 4.00 | 7-1-2045 | 1,270,000 | 1,453,845 |
| New York Dormitory Authority Barnard College Series A | | 4.00 | 7-1-2049 | 1,000,000 | 1,138,200 |
| New York Dormitory Authority New York University Series A | | 5.00 | 7-1-2049 | 4,265,000 | 5,405,632 |
| Westchester County NY Local Development Pace University Series B | | 0.63 | 5-1-2044 | 5,000,000 | 5,000,000 |
| | | | | | 27,327,368 |
| GO revenue: 0.75% | | | | | |
| New York NY Fiscal 2020 Subordinate Bond Series B-1 | | 4.00 | 8-1-2039 | 3,000,000 | 3,599,880 |
| New York NY Fiscal 2020 Subordinate Bond Series B-1 | | 5.00 | 10-1-2038 | 2,650,000 | 3,409,305 |
| New York NY Fiscal 2020 Subordinate Bond Series C | | 4.00 | 8-1-2037 | 8,800,000 | 10,634,184 |
| New York NY Series F-1 | | 5.00 | 3-1-2032 | 3,000,000 | 3,309,570 |
| New York NY Series S-2 | | 5.00 | 7-15-2041 | 13,805,000 | 16,290,728 |
| Suffolk County NY Series A | | 5.00 | 3-19-2021 | 4,000,000 | 4,036,280 |
| | | | | | 41,279,947 |
| Health revenue: 0.13% | | | | | |
| Nassau County NY Local Economic Catholic Health Services | | 5.00 | 7-1-2021 | 7,000,000 | 7,152,600 |
| Industrial development revenue: 0.77% | | | | | |
| New York Liberty Development Corporation Refunding Bond | | 2.80 | 9-15-2069 | 1,000,000 | 976,170 |
| New York Transportation Development Corporation Special Delta Air Lines Incorporated Laguardia | | 5.00 | 10-1-2035 | 20,000,000 | 24,608,400 |
| New York Transportation Development Corporation Special Facilities Revenue AMT | | 5.00 | 1-1-2032 | 5,000,000 | 5,930,400 |
| New York Transportation Development Corporation Special Facilities Revenue Terminal 4 John F Kennedy International Airport | | 5.00 | 12-1-2032 | 1,000,000 | 1,271,760 |
The accompanying notes are an integral part of these financial statements.
38 | Wells Fargo Municipal Bond Fund
Portfolio of investments—December 31, 2020 (unaudited)
| | | Interest
rate | Maturity
date | Principal | Value |
| Industrial development revenue (continued) | | | | | |
| New York Transportation Development Corporation Special Facility Revenue Terminal 4 John F Kennedy International | | 4.00% | 12-1-2039 | $ 700,000 | $ 812,035 |
| New York Transportation Development Corporation Special Facility Revenue Terminal 4 John F Kennedy International | | 4.00 | 12-1-2040 | 900,000 | 1,040,949 |
| New York Transportation Development Corporation Special Facility Revenue Terminal 4 John F Kennedy International | | 5.00 | 12-1-2035 | 1,850,000 | 2,379,618 |
| New York Transportation Development Corporation Special Facility Revenue Terminal 4 John F Kennedy International | | 5.00 | 12-1-2036 | 1,750,000 | 2,244,375 |
| New York Transportation Development Corporation Special Facility Revenue Terminal 4 John F Kennedy International | | 5.00 | 12-1-2037 | 700,000 | 877,800 |
| New York Transportation Development Corporation Special Facility Revenue Terminal 4 John F Kennedy International | | 5.00 | 12-1-2037 | 1,750,000 | 2,239,440 |
| | | | | | 42,380,947 |
| Miscellaneous revenue: 0.06% | | | | | |
| New York Dormitory Authority Non-State Supported School Districts Bond Financing Program Series A (AGM Insured) | | 5.00 | 10-1-2034 | 1,750,000 | 2,245,863 |
| New York Dormitory Authority Non-State Supported School Districts Bond Financing Program Series A (AGM Insured) | | 5.00 | 10-1-2035 | 1,000,000 | 1,280,040 |
| | | | | | 3,525,903 |
| Tax revenue: 3.24% | | | | | |
| New York Dormitory Authority Series A | | 5.00 | 2-15-2034 | 3,790,000 | 4,652,945 |
| New York Dormitory Authority Series D | | 4.00 | 2-15-2037 | 4,480,000 | 5,374,746 |
| New York Dormitory Authority State Personal Income Tax General Purpose Series D | | 4.00 | 2-15-2047 | 14,000,000 | 16,330,580 |
| New York Dormitory Authority State Personal Income Tax Series B | | 5.00 | 2-15-2045 | 7,330,000 | 8,513,648 |
| New York Dormitory Authority State Personal Income Tax Series D | | 4.00 | 2-15-2038 | 5,000,000 | 5,977,000 |
| New York Dormitory Authority State Personal Income Tax Series E | | 5.00 | 2-15-2044 | 10,000 | 11,933 |
| New York Dormitory Authority State Personal Income Tax Series E | | 5.00 | 2-15-2044 | 9,590,000 | 11,147,032 |
| New York Dormitory Authority State Personal Income Tax Unrefunded Bonds General Purpose Series D | | 5.00 | 3-15-2042 | 1,500,000 | 1,575,180 |
| New York NY Transitional Finance Authority Building Aid Revenue Fiscal 2019 Subordinate Bond Series S 3 A | | 4.00 | 7-15-2038 | 4,500,000 | 5,237,730 |
| New York NY Transitional Finance Authority Building Aid Revenue Fiscal Year 2015 Series S1 | | 5.00 | 7-15-2040 | 3,155,000 | 3,666,804 |
| New York NY Transitional Finance Authority Future Tax Secured Revenue Series A2 | | 5.00 | 8-1-2037 | 12,140,000 | 14,962,064 |
| New York NY Transitional Finance Authority Future Tax Secured Revenue Series I | | 5.00 | 5-1-2033 | 5,395,000 | 5,946,207 |
| New York NY Transitional Finance Authority Future Tax Secured Subordinate Bond | | 4.00 | 11-1-2035 | 5,000,000 | 6,171,750 |
| New York NY Transitional Finance Authority Future Tax Secured Subordinate Bond | | 4.00 | 11-1-2045 | 4,000,000 | 4,749,960 |
The accompanying notes are an integral part of these financial statements.
Wells Fargo Municipal Bond Fund | 39
Portfolio of investments—December 31, 2020 (unaudited)
| | | Interest
rate | Maturity
date | Principal | Value |
| Tax revenue (continued) | | | | | |
| New York NY Transitional Finance Authority Future Tax Secured Subordinate Bond | | 5.00% | 5-1-2038 | $ 5,000,000 | $ 6,393,250 |
| New York NY Transitional Finance Authority Future Tax Secured Subordinate Bond Series A | | 5.00 | 8-1-2031 | 17,075,000 | 19,768,411 |
| New York NY Transitional Finance Authority Future Tax Secured Subordinate Bond Series F1 | | 5.00 | 5-1-2042 | 2,390,000 | 2,892,354 |
| New York Urban Development Corporation Personal Income Tax General Purpose | | 4.00 | 3-15-2045 | 10,000,000 | 11,824,900 |
| New York Urban Development Corporation Personal Income Tax General Purpose | | 4.00 | 3-15-2045 | 35,560,000 | 42,049,344 |
| | | | | | 177,245,838 |
| Tobacco revenue: 0.01% | | | | | |
| Suffolk NY Tobacco Securitization Corporation Series B | | 4.50 | 6-1-2026 | 520,000 | 535,210 |
| Transportation revenue: 1.18% | | | | | |
| New York Metropolitan Transportacion Authority Revenue Various Refunding Bonds Transportation Subordinated Series G3 (SIFMA Municipal Swap+0.43%)± | | 0.52 | 11-1-2031 | 15,000,000 | 13,912,200 |
| New York Metropolitan Transportation Authority BAN | | 4.00 | 2-1-2022 | 1,670,000 | 1,703,767 |
| New York Metropolitan Transportation Authority Series A | | 5.00 | 11-15-2030 | 950,000 | 1,001,614 |
| New York Metropolitan Transportation Authority Series D | | 5.00 | 11-15-2029 | 20,000,000 | 21,097,800 |
| New York Metropolitan Transportation Authority Sub Series A-1 | | 5.00 | 11-15-2048 | 7,300,000 | 7,970,505 |
| Tender Option Bond Trust Receipts/Certificates (Barclays Bank plc LOC, Barclays Bank plc LIQ)144Aø | | 0.13 | 11-15-2052 | 4,485,000 | 4,485,000 |
| Tender Option Bond Trust Receipts/Certificates (Morgan Stanley Bank LIQ)144Aø | | 0.34 | 1-1-2053 | 4,250,000 | 4,250,000 |
| Triborough Bridge & Tunnel Authority | | 5.00 | 11-15-2049 | 7,750,000 | 10,011,528 |
| | | | | | 64,432,414 |
| Utilities revenue: 0.66% | | | | | |
| New York Utility Debt Securitization Authority Restructuring Bonds | | 5.00 | 12-15-2032 | 22,785,000 | 27,802,257 |
| New York Utility Debt Securitization Authority Restructuring Bonds | | 5.00 | 12-15-2037 | 3,780,000 | 4,581,436 |
| New York Utility Debt Securitization Authority Restructuring Bonds | | 5.00 | 12-15-2040 | 2,870,000 | 3,624,982 |
| | | | | | 36,008,675 |
| Water & sewer revenue: 2.29% | | | | | |
| New York Environmental Facilities Corporation Municipal Water Trust | | 4.00 | 6-15-2049 | 5,000,000 | 5,937,800 |
| New York Environmental Facilities Corporation Municipal Water Trust | | 5.00 | 6-15-2048 | 10,035,000 | 12,607,573 |
| New York NY Municipal Water Finance Authority 2nd General Resolution Series 2018 | | 5.00 | 6-15-2048 | 3,000,000 | 3,753,660 |
| New York NY Municipal Water Finance Authority 2nd General Resolution Series AA | | 5.00 | 6-15-2035 | 25,000,000 | 32,756,000 |
| New York NY Municipal Water Finance Authority 2nd General Resolution Series BB | | 5.00 | 6-15-2044 | 30,265,000 | 31,561,250 |
| New York NY Municipal Water Finance Authority 2nd General Resolution Series BB | | 5.00 | 6-15-2047 | 2,330,000 | 2,533,759 |
The accompanying notes are an integral part of these financial statements.
40 | Wells Fargo Municipal Bond Fund
Portfolio of investments—December 31, 2020 (unaudited)
| | | Interest
rate | Maturity
date | Principal | Value |
| Water & sewer revenue (continued) | | | | | |
| New York NY Municipal Water Finance Authority Water & Sewer System Series DD | | 5.00% | 6-15-2026 | $ 3,255,000 | $ 3,324,950 |
| New York NY Municipal Water Finance Authority Water and Sewer System Revenue Second General Resolution | | 4.00 | 6-15-2042 | 15,000,000 | 18,255,900 |
| New York NY Water Finance Authority Series DD | | 5.25 | 6-15-2047 | 11,490,000 | 14,426,155 |
| | | | | | 125,157,047 |
| | | | | | 556,313,706 |
| North Carolina: 1.01% | | | | | |
| Airport revenue: 0.13% | | | | | |
| Charlotte NC Airport Series A | | 5.50 | 7-1-2034 | 2,500,000 | 2,508,375 |
| Raleigh Durham NC Airport Authority Refunding AMT Series A | | 5.00 | 5-1-2035 | 3,400,000 | 4,393,650 |
| | | | | | 6,902,025 |
| Education revenue: 0.14% | | | | | |
| North Carolina Capital Facilities Finance Agency Forest University Series 2016 | | 5.00 | 1-1-2033 | 1,000,000 | 1,213,480 |
| North Carolina Capital Facilities Finance Agency Meredith College Series 2018 | | 5.00 | 6-1-2038 | 500,000 | 559,645 |
| University of North Carolina at Ashville Series 2017 | | 5.00 | 6-1-2042 | 625,000 | 724,238 |
| University of North Carolina at Greensboro Series 2014 | | 5.00 | 4-1-2033 | 2,000,000 | 2,247,020 |
| University of North Carolina at Greensboro Series 2014 | | 5.00 | 4-1-2039 | 1,620,000 | 1,807,499 |
| University of North Carolina Chapel Hill Series 2009- A (TD Bank NA SPA)ø | | 0.10 | 2-1-2024 | 840,000 | 840,000 |
| | | | | | 7,391,882 |
| Health revenue: 0.49% | | | | | |
| Charlotte-Mecklenburg Hospital Authority Health Care Refunding Bonds Series 2018 | | 5.00 | 1-15-2036 | 500,000 | 638,720 |
| Charlotte-Mecklenburg NC Hospital Authority Atrium Health Series C | | 5.00 | 1-15-2048 | 20,000,000 | 21,953,800 |
| North Carolina Medical Care Commission Deerfield Episcopal Retirement Community Project Series 2016 | | 5.00 | 11-1-2031 | 1,500,000 | 1,755,270 |
| North Carolina Medical Care Commission Presbyterian Homes Project Series 2016C | | 4.00 | 10-1-2031 | 1,500,000 | 1,654,905 |
| North Carolina Medical Care Commission Southeastern Regional Medical Center Series 2012 | | 5.00 | 6-1-2026 | 385,000 | 406,525 |
| North Carolina Medical Care Commission Southeastern Regional Medical Center Series 2012 | | 5.00 | 6-1-2032 | 500,000 | 522,140 |
| | | | | | 26,931,360 |
| Housing revenue: 0.04% | | | | | |
| North Carolina Facilities Finance Agency The Arc of North Carolina Project Series 2017A (Department of Housing and Urban Development Insured) | | 5.00 | 10-1-2034 | 1,000,000 | 1,164,230 |
| North Carolina Facilities Finance Agency The NCA&T University Foundation LLC Project Series 2015A (AGC Insured) | | 5.00 | 6-1-2027 | 1,000,000 | 1,181,650 |
| | | | | | 2,345,880 |
The accompanying notes are an integral part of these financial statements.
Wells Fargo Municipal Bond Fund | 41
Portfolio of investments—December 31, 2020 (unaudited)
| | | Interest
rate | Maturity
date | Principal | Value |
| Miscellaneous revenue: 0.07% | | | | | |
| Charlotte NC Certificate of Participation Equipment Acquisition and Public Facilities Series A | | 5.00% | 12-1-2026 | $ 1,160,000 | $ 1,209,810 |
| Charlotte NC Certificate of Participation Transit Projects Series C | | 5.00 | 6-1-2030 | 1,000,000 | 1,109,840 |
| Raleigh NC Limited Obligation Series A | | 5.00 | 10-1-2033 | 1,000,000 | 1,156,680 |
| Wilmington NC Limited Obligation Series A | | 5.00 | 6-1-2030 | 400,000 | 488,492 |
| | | | | | 3,964,822 |
| Transportation revenue: 0.14% | | | | | |
| North Carolina Department of Transportation I-77 Hot Lanes Project Series 2015 | | 5.00 | 6-30-2028 | 1,275,000 | 1,418,591 |
| North Carolina Turnpike Authority Monroe Expressway Toll Revenue Bond Series 2016A | | 5.00 | 7-1-2042 | 500,000 | 570,940 |
| North Carolina Turnpike Authority Triangle Expressway System (AGM Insured) | | 5.00 | 1-1-2049 | 4,500,000 | 5,598,810 |
| | | | | | 7,588,341 |
| | | | | | 55,124,310 |
| North Dakota: 0.28% | | | | | |
| Miscellaneous revenue: 0.19% | | | | | |
| University of North Dakota Infrastructure Energy Improvement Project Green Certificates Series A | | 5.00 | 4-1-2057 | 9,000,000 | 10,562,670 |
| Water & sewer revenue: 0.09% | | | | | |
| North Dakota PFA Revolving Fund Program Series A | | 5.00 | 10-1-2038 | 3,780,000 | 4,847,926 |
| | | | | | 15,410,596 |
| Ohio: 2.25% | | | | | |
| Airport revenue: 0.15% | | | | | |
| Cleveland OH Airport System Revenue Series A | | 5.00 | 1-1-2025 | 4,015,000 | 4,205,713 |
| Cleveland OH Airport System Revenue Series A (AGM Insured) | | 5.00 | 1-1-2031 | 3,600,000 | 3,771,000 |
| | | | | | 7,976,713 |
| GO revenue: 0.03% | | | | | |
| Highland OH Local School District Medina County School Improvement Series A | | 5.25 | 12-1-2054 | 1,500,000 | 1,682,850 |
| Health revenue: 0.98% | | | | | |
| Cleveland Cuyahoga County OH Facilities Improvement Centers for Dialysis | | 5.00 | 12-1-2047 | 5,205,000 | 5,861,351 |
| Franklin County OH Trinity Health Credit Group | | 4.00 | 12-1-2044 | 3,450,000 | 4,035,879 |
| Hamilton County OH Hospital Facilties Revenue Bonds | | 5.00 | 9-15-2045 | 7,500,000 | 9,187,350 |
| Lucas County OH Hospital Revenue Promedica Healthcare Obligation | | 5.25 | 11-15-2048 | 15,000,000 | 17,434,050 |
| Middleburg Heights OH Hospital Revenue Refunding Facilities Southwest General Health | | 4.00 | 8-1-2041 | 1,100,000 | 1,290,806 |
| Middleburg Heights OH Hospital Revenue Refunding Facilities Southwest General Health %% | | 4.00 | 8-1-2041 | 3,730,000 | 4,204,046 |
| Middleburg Heights OH Hospital Revenue Refunding Facilities Southwest General Health | | 4.00 | 8-1-2047 | 3,000,000 | 3,455,160 |
The accompanying notes are an integral part of these financial statements.
42 | Wells Fargo Municipal Bond Fund
Portfolio of investments—December 31, 2020 (unaudited)
| | | Interest
rate | Maturity
date | Principal | Value |
| Health revenue (continued) | | | | | |
| Montgomery County OH Hospital Revenue Refunding Bonds | | 4.00% | 11-15-2039 | $ 3,000,000 | $ 3,324,840 |
| Ohio Higher Educational Facility Commission Hospital Cleveland Clinic B4 (Barclays Bank plc SPA)ø | | 0.07 | 1-1-2043 | 5,000,000 | 5,000,000 |
| | | | | | 53,793,482 |
| Miscellaneous revenue: 0.79% | | | | | |
| Ohio Private Activity Bond AMT Portsmouth Bypass Project (AGM Insured) | | 5.00 | 12-31-2026 | 2,030,000 | 2,397,207 |
| Ohio Private Activity Bond AMT Portsmouth Bypass Project (AGM Insured) | | 5.00 | 12-31-2028 | 1,610,000 | 1,888,047 |
| Ohio Private Activity Bond AMT Portsmouth Bypass Project (AGM Insured) | | 5.00 | 12-31-2030 | 2,250,000 | 2,621,385 |
| Ohio Private Activity Bond AMT Portsmouth Bypass Project (AGM Insured) | | 5.00 | 12-31-2035 | 12,000,000 | 13,821,840 |
| Ohio Private Activity Bond AMT Portsmouth Bypass Project (AGM Insured) | | 5.00 | 12-31-2039 | 2,500,000 | 2,863,175 |
| Ohio Series A | | 5.00 | 2-1-2036 | 4,265,000 | 5,168,455 |
| Ohio Water Development Authority Drinking Water Assistance Fund | | 5.00 | 12-1-2035 | 5,390,000 | 6,693,194 |
| Ohio Water Development Authority Drinking Water Assistance Fund | | 5.00 | 12-1-2036 | 2,000,000 | 2,477,040 |
| Ohio Water Development Authority Fresh Water Series B | | 5.00 | 12-1-2034 | 1,895,000 | 2,358,119 |
| RiverSouth OH Lazarus Building Redevelopment Series A | | 5.75 | 12-1-2027 | 2,870,000 | 2,873,932 |
| | | | | | 43,162,394 |
| Tax revenue: 0.11% | | | | | |
| Franklin County OH | | 5.00 | 6-1-2048 | 5,000,000 | 6,231,850 |
| Transportation revenue: 0.19% | | | | | |
| Ohio Turnpike Commission CAB Series A-4 ¤ | | 0.00 | 2-15-2034 | 8,500,000 | 10,600,775 |
| | | | | | 123,448,064 |
| Oklahoma: 1.06% | | | | | |
| Airport revenue: 0.65% | | | | | |
| Oklahoma City OK Airport Trust Series 33 | | 5.00 | 7-1-2043 | 9,000,000 | 10,804,770 |
| Oklahoma City OK Airport Trust Series 33 | | 5.00 | 7-1-2047 | 11,500,000 | 13,712,600 |
| Tulsa OK Airports Improvement Trust AMT Series A (BAM Insured) | | 5.00 | 6-1-2035 | 1,055,000 | 1,177,348 |
| Tulsa OK Airports Improvement Trust Series A (AGM Insured) | | 5.00 | 6-1-2043 | 4,485,000 | 5,331,903 |
| Tulsa OK Airports Improvement Trust Series A (AGM Insured) | | 5.25 | 6-1-2048 | 3,770,000 | 4,510,277 |
| | | | | | 35,536,898 |
| Miscellaneous revenue: 0.37% | | | | | |
| Garfield County OK Educational Facilities Authority Enid Public Schools Project Series A | | 5.00 | 9-1-2030 | 2,000,000 | 2,451,880 |
| Garfield County OK Educational Facilities Authority Enid Public Schools Project Series A | | 5.00 | 9-1-2031 | 1,145,000 | 1,397,793 |
| Muskogee OK Industrial Trust Educational Facilities | | 4.00 | 9-1-2030 | 4,440,000 | 5,194,756 |
The accompanying notes are an integral part of these financial statements.
Wells Fargo Municipal Bond Fund | 43
Portfolio of investments—December 31, 2020 (unaudited)
| | | Interest
rate | Maturity
date | Principal | Value |
| Miscellaneous revenue (continued) | | | | | |
| Muskogee OK Industrial Trust Educational Facilities | | 4.00% | 9-1-2032 | $ 4,000,000 | $ 4,630,880 |
| Muskogee OK Industrial Trust Educational Facilities Lease Muskogee Public Schools Project | | 4.00 | 9-1-2031 | 5,520,000 | 6,427,874 |
| | | | | | 20,103,183 |
| Transportation revenue: 0.02% | | | | | |
| Oklahoma Turnpike Authority Revenue Series A | | 5.00 | 1-1-2042 | 1,000,000 | 1,185,640 |
| Water & sewer revenue: 0.02% | | | | | |
| McGee Creek OK Authority (National Insured) | | 6.00 | 1-1-2023 | 1,250,000 | 1,316,963 |
| | | | | | 58,142,684 |
| Oregon: 0.55% | | | | | |
| GO revenue: 0.17% | | | | | |
| Jackson County OR School District #005 (AGM Insured) | | 5.00 | 6-15-2030 | 2,560,000 | 3,445,837 |
| Jackson County OR School District #005 (AGM Insured) | | 5.00 | 6-15-2031 | 2,125,000 | 2,847,436 |
| Jackson County OR School District #005 (AGM Insured) | | 5.00 | 6-15-2032 | 2,350,000 | 3,132,198 |
| | | | | | 9,425,471 |
| Health revenue: 0.34% | | | | | |
| Clackamas County OR Hospital Facility Authority Senior Living Rose Ville Series A | | 5.13 | 11-15-2040 | 500,000 | 538,895 |
| Clackamas County OR Hospital Facility Authority Senior Living Rose Ville Series A | | 5.25 | 11-15-2050 | 500,000 | 535,645 |
| Clackamas County OR Hospital Facility Authority Senior Living Rose Ville Series A | | 5.38 | 11-15-2055 | 1,000,000 | 1,074,460 |
| Medford OR Hospital Facilities Refunding Bonds Asante Project Series A (AGM Insured) | | 4.00 | 8-15-2045 | 13,650,000 | 16,208,147 |
| | | | | | 18,357,147 |
| Utilities revenue: 0.04% | | | | | |
| Eugene OR Electric Utility Revenue Series A | | 4.00 | 8-1-2045 | 1,260,000 | 1,515,011 |
| Eugene OR Electric Utility Revenue Series A | | 4.00 | 8-1-2049 | 800,000 | 954,312 |
| | | | | | 2,469,323 |
| | | | | | 30,251,941 |
| Pennsylvania: 4.98% | | | | | |
| Airport revenue: 0.43% | | | | | |
| Philadelphia PA Airport Series A | | 5.00 | 7-1-2047 | 9,950,000 | 11,765,179 |
| Philadelphia PA Airport Series B | | 5.00 | 7-1-2029 | 1,000,000 | 1,230,760 |
| Philadelphia PA Airport Series B | | 5.00 | 7-1-2031 | 750,000 | 915,533 |
| Philadelphia PA Airport Series B | | 5.00 | 7-1-2042 | 7,860,000 | 9,368,020 |
| | | | | | 23,279,492 |
| Education revenue: 0.34% | | | | | |
| Montgomery County PA Higher Education & Health Authority Arcadia University | | 5.00 | 4-1-2024 | 1,540,000 | 1,689,226 |
| Montgomery County PA Higher Education & Health Authority Arcadia University | | 5.00 | 4-1-2025 | 1,625,000 | 1,822,844 |
| Pennsylvania HEFAR Indiana University Student Housing Project Series A | | 5.00 | 7-1-2032 | 1,000,000 | 1,068,220 |
The accompanying notes are an integral part of these financial statements.
44 | Wells Fargo Municipal Bond Fund
Portfolio of investments—December 31, 2020 (unaudited)
| | | Interest
rate | Maturity
date | Principal | Value |
| Education revenue (continued) | | | | | |
| Pennsylvania Higher Educational Facilities Revenue Drexel University Series A (AGM Insured) | | 5.00% | 5-1-2046 | $ 4,885,000 | $ 6,163,746 |
| Pennsylvania Tender Option Bond Trust Receipts/Floater Certificates Series 2019-XF2836 (Mizuho Capital Markets LLC LOC, Mizuho Capital Markets LLC LIQ)144Aø | | 0.29 | 6-15-2039 | 3,935,000 | 3,935,000 |
| Philadelphia PA IDA 1st Philadelphia Preparatory Charter School Project Series A | | 7.00 | 6-15-2033 | 2,000,000 | 2,311,700 |
| Philadelphia PA IDA New Foundations Charter School Project | | 6.00 | 12-15-2027 | 275,000 | 301,353 |
| Philadelphia PA IDA University Revenue Refunding Bond St. Joesph's University Project | | 4.00 | 11-1-2038 | 1,000,000 | 1,153,690 |
| | | | | | 18,445,779 |
| GO revenue: 0.40% | | | | | |
| Allegheny County PA West Mifflin Area School District (AGM Insured) | | 5.00 | 4-1-2025 | 1,180,000 | 1,389,143 |
| Allegheny County PA West Mifflin Area School District (AGM Insured) | | 5.00 | 4-1-2026 | 1,200,000 | 1,459,032 |
| Allegheny County PA West Mifflin Area School District (AGM Insured) | | 5.00 | 4-1-2027 | 1,000,000 | 1,232,490 |
| North Pocono PA School District Notes Series A (AGM Insured) | | 4.00 | 9-15-2029 | 2,170,000 | 2,652,087 |
| North Pocono PA School District Notes Series A (AGM Insured) | | 4.00 | 9-15-2032 | 1,750,000 | 2,107,770 |
| Philadelphia PA School District Series A | | 5.00 | 9-1-2024 | 2,075,000 | 2,395,090 |
| Philadelphia PA School District Series F | | 5.00 | 9-1-2035 | 3,820,000 | 4,560,087 |
| Williamsport PA Area School District (AGM Insured) | | 4.00 | 3-1-2032 | 1,440,000 | 1,591,214 |
| Williamsport PA Area School District (AGM Insured) | | 4.00 | 3-1-2033 | 1,490,000 | 1,643,679 |
| Williamsport PA Area School District (AGM Insured) | | 4.00 | 3-1-2034 | 1,555,000 | 1,710,298 |
| Williamsport PA Area School District (AGM Insured) | | 4.00 | 3-1-2035 | 1,205,000 | 1,325,608 |
| | | | | | 22,066,498 |
| Health revenue: 0.92% | | | | | |
| Allegheny County PA Hospital Development Authority Series A | | 4.00 | 7-15-2039 | 2,250,000 | 2,619,675 |
| Berks County PA Municipal Authority | | 5.00 | 11-1-2044 | 2,065,000 | 2,103,967 |
| Chester County PA HEFA Main Line Health System Series A | | 4.00 | 9-1-2050 | 3,500,000 | 4,125,835 |
| Geisinger PA Health System Series A-1 | | 4.00 | 2-15-2047 | 10,000,000 | 11,222,800 |
| Geisinger PA Health System Series A-1 | | 4.00 | 4-1-2050 | 8,000,000 | 9,313,920 |
| Montgomery County PA HEFA Thomas Jefferson University | | 4.00 | 9-1-2035 | 2,750,000 | 3,200,285 |
| Montgomery County PA HEFA Thomas Jefferson University | | 4.00 | 9-1-2038 | 1,000,000 | 1,153,270 |
| Montgomery County PA HEFA Thomas Jefferson University | | 5.00 | 9-1-2031 | 4,100,000 | 5,250,132 |
| Pennsylvania EDFA Series A-1 | | 4.00 | 4-15-2045 | 6,500,000 | 7,512,310 |
| Quakertown PA General Authority Health LifeQuest Obligated Group Series C | | 4.50 | 7-1-2027 | 750,000 | 740,040 |
| Quakertown PA General Authority Health LifeQuest Obligated Group Series C | | 5.00 | 7-1-2032 | 1,000,000 | 996,540 |
| Westmoreland County PA IDA Excela Health Project Series A | | 4.00 | 7-1-2037 | 625,000 | 726,281 |
The accompanying notes are an integral part of these financial statements.
Wells Fargo Municipal Bond Fund | 45
Portfolio of investments—December 31, 2020 (unaudited)
| | | Interest
rate | Maturity
date | Principal | Value |
| Health revenue (continued) | | | | | |
| Westmoreland County PA IDA Excela Health Project Series A | | 5.00% | 7-1-2029 | $ 700,000 | $ 869,232 |
| Westmoreland County PA IDA Excela Health Project Series A | | 5.00 | 7-1-2030 | 550,000 | 691,757 |
| | | | | �� | 50,526,044 |
| Industrial development revenue: 0.36% | | | | | |
| Pennsylvania EDFA Bridges Finco LP | | 5.00 | 12-31-2030 | 600,000 | 705,906 |
| Pennsylvania EDFA Bridges FinCo LP | | 5.00 | 12-31-2034 | 16,375,000 | 19,030,206 |
| | | | | | 19,736,112 |
| Miscellaneous revenue: 1.55% | | | | | |
| Delaware Valley PA Regional Finance Authority Local Government Public Improvements Project | | 5.75 | 7-1-2032 | 8,990,000 | 12,889,323 |
| Delaware Valley PA Regional Finance Authority Local Government Series C (Ambac Insured) | | 7.75 | 7-1-2027 | 4,025,000 | 5,422,480 |
| Delaware Valley Regional Finance Authority Pennsylvania Local Government Series A (Ambac Insured) | | 5.50 | 8-1-2028 | 22,830,000 | 29,801,369 |
| Pennsylvania Finance Authority Pennsylvania Hills Project Series B (National Insured)¤ | | 0.00 | 12-1-2025 | 1,060,000 | 1,002,198 |
| Pennsylvania Public School Building Authority Philadelphia School District Project | | 5.00 | 4-1-2024 | 3,960,000 | 4,195,066 |
| State Public School Building Authority Pennsylvania Philadelphia School District Project | | 5.00 | 4-1-2022 | 2,635,000 | 2,775,498 |
| State Public School Building Authority Pennsylvania Philadelphia School District Project Series A | | 5.00 | 6-1-2024 | 2,250,000 | 2,573,843 |
| State Public School Building Authority Pennsylvania Philadelphia School District Project Series A | | 5.00 | 6-1-2034 | 1,915,000 | 2,303,209 |
| State Public School Building Authority Pennsylvania Philadelphia School District Project Series A | | 5.00 | 6-1-2035 | 16,715,000 | 20,071,873 |
| Waverly Township Municipal Authority Career Technology Center (BAM Insured) | | 4.00 | 2-15-2030 | 1,065,000 | 1,252,365 |
| Waverly Township Municipal Authority Career Technology Center (BAM Insured) | | 4.00 | 2-15-2031 | 1,110,000 | 1,299,943 |
| Waverly Township Municipal Authority Career Technology Center (BAM Insured) | | 4.00 | 2-15-2032 | 1,155,000 | 1,346,580 |
| | | | | | 84,933,747 |
| Tax revenue: 0.13% | | | | | |
| Pennsylvania State Turnpike Commission | | 5.00 | 12-1-2043 | 6,000,000 | 7,287,840 |
| Transportation revenue: 0.57% | | | | | |
| Pennsylvania State Turnpike Commission (TD Bank NA LOC)ø | | 0.10 | 12-1-2039 | 1,000,000 | 1,000,000 |
| Pennsylvania Turnpike Commission Motor License Series B-2 | | 5.00 | 12-1-2035 | 9,900,000 | 12,240,063 |
| Pennsylvania Turnpike Commission Series A-1 | | 5.00 | 12-1-2047 | 1,750,000 | 2,122,645 |
| Pennsylvania Turnpike Commission Subordinate Bond Series B-1 | | 5.00 | 6-1-2027 | 1,150,000 | 1,437,500 |
| Pennsylvania Turnpike Commission Subordinate Bond Series B-1 | | 5.00 | 6-1-2028 | 1,450,000 | 1,801,625 |
| Pennsylvania Turnpike Commission Subordinate Bond Series B-2 | | 5.00 | 6-1-2027 | 1,260,000 | 1,575,000 |
The accompanying notes are an integral part of these financial statements.
46 | Wells Fargo Municipal Bond Fund
Portfolio of investments—December 31, 2020 (unaudited)
| | | Interest
rate | Maturity
date | Principal | Value |
| Transportation revenue (continued) | | | | | |
| Pennsylvania Turnpike Commission Subordinate Bond Series B-2 | | 5.00% | 6-1-2028 | $ 5,005,000 | $ 6,218,713 |
| Tender Option Bond Trust Receipts/Certificates (AGM Insured, Citibank NA LIQ)144Aø | | 0.15 | 6-1-2025 | 4,750,000 | 4,750,000 |
| | | | | | 31,145,546 |
| Water & sewer revenue: 0.28% | | | | | |
| Luzerne County PA IDA Refunding Bond AMT Pennsylvania American Water Company Project | | 2.45 | 12-1-2039 | 5,500,000 | 6,082,560 |
| Philadelphia PA Series B | | 5.00 | 7-1-2033 | 8,000,000 | 9,401,680 |
| | | | | | 15,484,240 |
| | | | | | 272,905,298 |
| Puerto Rico: 0.02% | | | | | |
| Tax revenue: 0.02% | | | | | |
| Puerto Rico Highway & Transportation Authority Series CC (AGM Insured) | | 5.50 | 7-1-2029 | 825,000 | 983,953 |
| Rhode Island: 0.05% | | | | | |
| Airport revenue: 0.05% | | | | | |
| Rhode Island Commerce Corporation First Lien Special Facility Airport Corporation Intermodal Facility Project Series 2018 | | 5.00 | 7-1-2031 | 2,115,000 | 2,490,391 |
| South Carolina: 0.53% | | | | | |
| Education revenue: 0.22% | | | | | |
| South Carolina Education Assistance Authority Student Loan Series I | | 5.10 | 10-1-2029 | 615,000 | 615,209 |
| South Carolina Jobs EDA York Preparatory Academy Project Series A | | 7.25 | 11-1-2045 | 1,500,000 | 1,655,430 |
| University of South Carolina Athletic Facilities Series A | | 5.00 | 5-1-2043 | 8,155,000 | 9,586,121 |
| | | | | | 11,856,760 |
| Resource recovery revenue: 0.07% | | | | | |
| South Carolina Jobs EDA | | 8.00 | 12-6-2029 | 370,000 | 367,410 |
| South Carolina Jobs EDA Solid Waste Disposal AMT RePower South Berkeley LLC Project Green Bond 144A | | 6.00 | 2-1-2035 | 1,880,000 | 1,501,424 |
| South Carolina Jobs EDA Solid Waste Disposal AMT RePower South Berkeley LLC Project Green Bond 144A | | 6.25 | 2-1-2045 | 2,750,000 | 2,058,155 |
| | | | | | 3,926,989 |
| Utilities revenue: 0.21% | | | | | |
| Patriots Energy Group Financing Agency South Carolina Series A (Royal Bank of Canada LIQ) | | 4.00 | 10-1-2048 | 9,040,000 | 9,951,594 |
| South Carolina Public Service Authority Refunding & Improvement Bonds Series A | | 4.00 | 12-1-2040 | 1,500,000 | 1,781,835 |
| | | | | | 11,733,429 |
The accompanying notes are an integral part of these financial statements.
Wells Fargo Municipal Bond Fund | 47
Portfolio of investments—December 31, 2020 (unaudited)
| | | Interest
rate | Maturity
date | Principal | Value |
| Water & sewer revenue: 0.03% | | | | | |
| Columbia SC Waterworks Series 2009 (Sumitomo Mitsui Banking Corporation LOC)ø | | 0.09% | 2-1-2038 | $ 1,760,000 | $ 1,760,000 |
| | | | | | 29,277,178 |
| South Dakota: 0.41% | | | | | |
| Health revenue: 0.26% | | | | | |
| South Dakota HEFA Sanford Health Project Series E | | 5.00 | 11-1-2042 | 13,465,000 | 14,371,329 |
| Housing revenue: 0.15% | | | | | |
| South Dakota Board of Regents Housing & Auxiliary Facilities System | | 5.00 | 4-1-2023 | 750,000 | 826,583 |
| South Dakota Board of Regents Housing & Auxiliary Facilities System | | 5.00 | 4-1-2024 | 1,100,000 | 1,260,644 |
| South Dakota Board of Regents Housing & Auxiliary Facilities System | | 5.00 | 4-1-2025 | 1,000,000 | 1,186,910 |
| South Dakota Board of Regents Housing & Auxiliary Facilities System | | 5.00 | 4-1-2026 | 1,540,000 | 1,886,623 |
| South Dakota Board of Regents Housing & Auxiliary Facilities System | | 5.00 | 4-1-2032 | 1,010,000 | 1,259,914 |
| South Dakota Board of Regents Housing & Auxiliary Facilities System | | 5.00 | 4-1-2033 | 1,250,000 | 1,552,300 |
| | | | | | 7,972,974 |
| | | | | | 22,344,303 |
| Tennessee: 0.46% | | | | | |
| Utilities revenue: 0.46% | | | | | |
| Tennessee Energy Acquisition Corporation Gas Project | | 4.00 | 11-1-2049 | 20,000,000 | 22,976,600 |
| Tennessee Energy Acquisition Corporation Series A | | 5.25 | 9-1-2026 | 1,020,000 | 1,252,591 |
| Tennessee Energy Acquisition Corporation Series C | | 5.00 | 2-1-2021 | 1,000,000 | 1,003,390 |
| | | | | | 25,232,581 |
| Texas: 10.00% | | | | | |
| Airport revenue: 1.04% | | | | | |
| Austin TX Airport System AMT | | 5.00 | 11-15-2039 | 8,000,000 | 9,014,720 |
| Austin TX Airport System AMT | | 5.00 | 11-15-2044 | 3,500,000 | 3,917,445 |
| Dallas-Fort Worth TX International Airport AMT Series D | | 5.00 | 11-1-2038 | 13,250,000 | 13,765,425 |
| Dallas-Fort Worth TX International Airport Series H | | 5.00 | 11-1-2042 | 20,765,000 | 21,572,759 |
| Houston TX Airport System Subordinate Bond Lien AMT | | 5.00 | 7-15-2027 | 2,500,000 | 2,805,725 |
| Houston TX Airport System Subordinate Bond Lien AMT Series A | | 5.00 | 7-1-2041 | 4,750,000 | 5,760,135 |
| | | | | | 56,836,209 |
| Education revenue: 0.43% | | | | | |
| Clifton TX Higher Education Finance Corporation International Leadership Series A | | 5.75 | 8-15-2038 | 2,000,000 | 2,303,980 |
| Clifton TX Higher Education Finance Corporation International Leadership Texas Series D | | 6.00 | 8-15-2038 | 6,000,000 | 6,977,220 |
| Clifton TX Higher Education Finance Corporation International Leadership Texas Series D | | 6.13 | 8-15-2048 | 6,750,000 | 7,806,038 |
| Newark TX Higher Education Finance Corporation Austin Achieve Public Schools Incorporated | | 5.00 | 6-15-2048 | 750,000 | 764,138 |
The accompanying notes are an integral part of these financial statements.
48 | Wells Fargo Municipal Bond Fund
Portfolio of investments—December 31, 2020 (unaudited)
| | | Interest
rate | Maturity
date | Principal | Value |
| Education revenue (continued) | | | | | |
| Southwest Texas Higher Education Authority Incorporated Southern Methodist University Project | | 5.00% | 10-1-2030 | $ 1,460,000 | $ 1,848,448 |
| Southwest Texas Higher Education Authority Incorporated Southern Methodist University Project | | 5.00 | 10-1-2032 | 650,000 | 815,991 |
| Southwest Texas Higher Education Authority Incorporated Southern Methodist University Project | | 5.00 | 10-1-2039 | 750,000 | 928,530 |
| Southwest Texas Higher Education Authority Incorporated Southern Methodist University Project | | 5.00 | 10-1-2040 | 1,000,000 | 1,233,400 |
| Southwest Texas Higher Education Authority Incorporated Southern Methodist University Project | | 5.00 | 10-1-2041 | 900,000 | 1,107,153 |
| | | | | | 23,784,898 |
| GO revenue: 2.07% | | | | | |
| El Paso TX | | 4.00 | 8-15-2031 | 6,500,000 | 7,616,635 |
| Houston TX Public Improvement Refunding Bonds Series A | | 4.00 | 3-1-2034 | 1,000,000 | 1,163,130 |
| Houston TX Public Improvement Refunding Bonds Series A | | 5.00 | 3-1-2029 | 2,160,000 | 2,723,328 |
| Nacogdoches TX Independent School District | | 5.00 | 2-15-2049 | 8,560,000 | 10,811,537 |
| Port Isabel TX 144A | | 5.10 | 2-15-2049 | 1,000,000 | 1,122,700 |
| Royse City TX Independent School District | | 5.00 | 8-15-2034 | 3,025,000 | 3,609,460 |
| Salado TX Independent School District | | 5.00 | 2-15-2049 | 1,605,000 | 1,971,759 |
| San Antonio TX Independent School District | | 5.00 | 8-15-2048 | 13,000,000 | 15,253,420 |
| Sugar Land TX Refunding Bonds | | 5.00 | 2-15-2030 | 1,250,000 | 1,559,863 |
| Temple TX | | 5.00 | 8-1-2032 | 1,070,000 | 1,281,999 |
| Texas Refunding Bond Series B | | 5.00 | 10-1-2036 | 24,500,000 | 29,575,665 |
| Travis County TX | | 5.00 | 3-1-2036 | 12,470,000 | 16,255,019 |
| Travis County TX | | 5.00 | 3-1-2039 | 6,250,000 | 8,087,688 |
| Viridian TX Municipal Management District Texas Road Improvement Project (BAM Insured) | | 4.00 | 12-1-2033 | 555,000 | 609,451 |
| Viridian TX Municipal Management District Texas Road Improvement Project (BAM Insured) | | 4.00 | 12-1-2034 | 630,000 | 690,297 |
| Viridian TX Municipal Management District Texas Road Improvement Project (BAM Insured) | | 4.00 | 12-1-2034 | 835,000 | 914,918 |
| Viridian TX Municipal Management District Texas Road Improvement Project (BAM Insured) | | 4.00 | 12-1-2035 | 655,000 | 715,601 |
| Viridian TX Municipal Management District Texas Road Improvement Project (BAM Insured) | | 4.00 | 12-1-2035 | 865,000 | 945,030 |
| Viridian TX Municipal Management District Texas Road Improvement Project (BAM Insured) | | 4.00 | 12-1-2036 | 680,000 | 741,023 |
| Viridian TX Municipal Management District Texas Road Improvement Project (BAM Insured) | | 4.00 | 12-1-2036 | 905,000 | 973,753 |
| Williamson County TX | | 4.00 | 2-15-2031 | 6,195,000 | 6,648,350 |
| | | | | | 113,270,626 |
| Health revenue: 0.16% | | | | | |
| Harris County TX Texas Childrens Hospital Series A | | 4.00 | 10-1-2037 | 3,000,000 | 3,613,590 |
| Harris County TX Texas Childrens Hospital Series A | | 4.00 | 10-1-2038 | 2,300,000 | 2,762,898 |
| New Hope ECFA Children's Health System of Texas Project Series A | | 4.00 | 8-15-2033 | 2,050,000 | 2,397,229 |
| | | | | | 8,773,717 |
| Housing revenue: 0.13% | | | | | |
| Alamito TX Public Facility Corporation Cramer Three Apartments Project | | 2.50 | 11-1-2021 | 7,000,000 | 7,047,740 |
The accompanying notes are an integral part of these financial statements.
Wells Fargo Municipal Bond Fund | 49
Portfolio of investments—December 31, 2020 (unaudited)
| | | Interest
rate | Maturity
date | Principal | Value |
| Miscellaneous revenue: 0.57% | | | | | |
| Lewisville TX Combination Contract Castle Hills Public Improvement Bonds District #5 144A | | 6.50% | 9-1-2034 | $ 3,750,000 | $ 3,841,275 |
| Lewisville TX Combination Contract Castle Hills Public Improvement Bonds District #6 144A | | 5.50 | 9-1-2039 | 2,495,000 | 2,512,914 |
| Lewisville TX Combination Contract Castle Hills Public Improvement Bonds District #6 144A | | 6.00 | 9-1-2037 | 1,820,000 | 1,897,259 |
| Lewisville TX Combination Contract Castle Hills Public Improvement Bonds District #6 144A | | 6.00 | 9-1-2037 | 8,690,000 | 9,058,891 |
| Lower Colorado TX River Authority Series A | | 5.00 | 5-15-2033 | 2,475,000 | 2,730,791 |
| Texas PFA | | 4.00 | 2-1-2034 | 5,000,000 | 6,100,900 |
| Texas PFA | | 4.00 | 2-1-2035 | 2,000,000 | 2,434,820 |
| Texas PFA | | 4.00 | 2-1-2036 | 2,175,000 | 2,639,428 |
| | | | | | 31,216,278 |
| Resource recovery revenue: 0.08% | | | | | |
| Mission TX Economic Development Corporation Republic Services Incorporated Project | | 0.30 | 1-1-2026 | 1,000,000 | 999,990 |
| Port Arthur TX Navigation District Jefferson County Environmental Facilities Motiva Enterprises LLC Project Series B ø | | 0.17 | 4-1-2040 | 3,400,000 | 3,400,000 |
| | | | | | 4,399,990 |
| Tax revenue: 0.78% | | | | | |
| Dallas TX Area Rapid Transit Sales Tax Revenue Series A | | 5.00 | 12-1-2046 | 28,455,000 | 33,865,718 |
| Dallas TX Area Rapid Transit Sales Tax Revenue Series A | | 5.00 | 12-1-2048 | 5,000,000 | 5,948,100 |
| Old Spanish Trail/Almeda Corridors RDA (BAM Insured) | | 4.00 | 9-1-2036 | 1,125,000 | 1,310,704 |
| Old Spanish Trail/Almeda Corridors RDA (BAM Insured) | | 4.00 | 9-1-2037 | 1,430,000 | 1,656,083 |
| | | | | | 42,780,605 |
| Transportation revenue: 1.64% | | | | | |
| Central Texas Regional Mobility Authority Senior Lien Series A | | 5.00 | 1-1-2033 | 3,740,000 | 4,095,375 |
| Central Texas Regional Mobility Authority Senior Lien Series A | | 5.00 | 1-1-2044 | 3,000,000 | 3,777,000 |
| Central Texas Regional Mobility Authority Senior Lien Series A | | 5.00 | 1-1-2049 | 2,450,000 | 3,059,658 |
| Grand Parkway Transportation Corporation Texas CAB Series B ¤ | | 0.00 | 10-1-2029 | 1,015,000 | 1,197,426 |
| Grand Parkway Transportation Corporation Texas Series B ¤ | | 0.00 | 10-1-2030 | 2,000,000 | 2,356,860 |
| Grand Parkway Transportation Corporation Texas Series C | | 4.00 | 10-1-2045 | 18,085,000 | 21,430,906 |
| Grand Parkway Transportation Corporation Texas Series C | | 4.00 | 10-1-2049 | 19,265,000 | 22,694,555 |
| North Texas Tollway Authority Series A | | 5.00 | 1-1-2033 | 3,600,000 | 4,157,136 |
| North Texas Tollway Authority Series A | | 5.00 | 1-1-2035 | 4,000,000 | 4,602,120 |
| Texas Private Activity Bond Surface Transportation Corporation Project NTE Mobility Partners Segments LLC | | 4.00 | 12-31-2037 | 3,000,000 | 3,503,910 |
The accompanying notes are an integral part of these financial statements.
50 | Wells Fargo Municipal Bond Fund
Portfolio of investments—December 31, 2020 (unaudited)
| | | Interest
rate | Maturity
date | Principal | Value |
| Transportation revenue (continued) | | | | | |
| Texas Private Activity Bond Surface Transportation Corporation Project NTE Mobility Partners Segments LLC | | 6.75% | 6-30-2043 | $ 4,000,000 | $ 4,568,240 |
| Texas Private Activity Bond Surface Transportation Corporation Project NTE Mobility Partners Segments LLC | | 7.00 | 12-31-2038 | 12,500,000 | 14,374,875 |
| | | | | | 89,818,061 |
| Utilities revenue: 0.41% | | | | | |
| San Antonio TX Electric & Gas Systems Junior Lien Refunding Bond Series 2018 | | 2.75 | 2-1-2048 | 11,000,000 | 11,524,590 |
| Texas Municipal Gas Acquisition & Supply Corporation III | | 5.00 | 12-15-2029 | 5,115,000 | 5,491,617 |
| Texas Municipal Gas Acquisition & Supply Corporation III | | 5.00 | 12-15-2031 | 5,000,000 | 5,351,400 |
| | | | | | 22,367,607 |
| Water & sewer revenue: 2.69% | | | | | |
| Austin TX Water & Wastewater Refunding Bond | | 5.00 | 11-15-2045 | 15,065,000 | 18,433,534 |
| Dallas TX Waterworks & Sewer System Refunding Bond Series A | | 5.00 | 10-1-2030 | 3,810,000 | 4,566,552 |
| Tarrant TX Regional Water District | | 5.00 | 9-1-2034 | 3,500,000 | 4,042,675 |
| Tarrant TX Regional Water District | | 5.00 | 3-1-2049 | 15,000,000 | 17,263,650 |
| Texas Series A | | 4.00 | 10-15-2036 | 5,000,000 | 6,010,500 |
| Texas Series B | | 5.00 | 4-15-2049 | 42,000,000 | 53,702,880 |
| Texas Water Development Board | | 4.00 | 8-1-2038 | 2,500,000 | 3,130,050 |
| Texas Water Development Board Series A | | 4.00 | 10-15-2037 | 11,650,000 | 13,971,962 |
| Texas Water Implementation Fund Series A | | 4.00 | 10-15-2036 | 1,015,000 | 1,256,093 |
| Texas Water Implementation Fund Series A | | 4.00 | 10-15-2037 | 4,000,000 | 4,939,440 |
| Texas Water Implementation Fund Series A | | 4.00 | 10-15-2038 | 6,500,000 | 8,016,775 |
| Texas Water Implementation Fund Series A | | 4.00 | 10-15-2044 | 9,905,000 | 12,033,089 |
| | | | | | 147,367,200 |
| | | | | | 547,662,931 |
| Utah: 1.03% | | | | | |
| Airport revenue: 0.40% | | | | | |
| Salt Lake City UT Series A | | 5.00 | 7-1-2036 | 2,500,000 | 3,057,325 |
| Salt Lake City UT Series A | | 5.00 | 7-1-2043 | 1,500,000 | 1,841,610 |
| Salt Lake City UT Series A | | 5.00 | 7-1-2043 | 2,500,000 | 3,010,950 |
| Salt Lake City UT Series A | | 5.00 | 7-1-2048 | 3,000,000 | 3,656,340 |
| Salt Lake City UT Series A | | 5.00 | 7-1-2048 | 5,500,000 | 6,575,910 |
| Salt Lake City UT Series A | | 5.25 | 7-1-2048 | 3,000,000 | 3,650,040 |
| | | | | | 21,792,175 |
| Education revenue: 0.04% | | | | | |
| University of Utah (Citibank NA LIQ)144Aø | | 0.13 | 8-1-2021 | 2,000,000 | 2,000,000 |
| Health revenue: 0.59% | | | | | |
| Utah County UT Hospital Revenue Bond IHC Health Services Incorporated Series 2012 | | 5.00 | 5-15-2043 | 32,000,000 | 32,561,280 |
| | | | | | 56,353,455 |
The accompanying notes are an integral part of these financial statements.
Wells Fargo Municipal Bond Fund | 51
Portfolio of investments—December 31, 2020 (unaudited)
| | | Interest
rate | Maturity
date | Principal | Value |
| Virginia: 0.35% | | | | | |
| GO revenue: 0.12% | | | | | |
| Norfolk VA Series C | | 4.00% | 9-1-2032 | $ 5,810,000 | $ 6,841,972 |
| Health revenue: 0.06% | | | | | |
| Roanoke VA EDA Residential Care Facility Revenue Richfield Living Prooject | | 5.00 | 9-1-2040 | 3,290,000 | 3,312,339 |
| Tax revenue: 0.02% | | | | | |
| Marquis VA CDA CAB Series 2015 144A¤ | | 0.00 | 9-1-2045 | 397,000 | 202,470 |
| Marquis VA CDA CAB Series C ¤ | | 0.00 | 9-1-2041 | 1,824,000 | 93,717 |
| Marquis VA CDA Series B | | 5.63 | 9-1-2041 | 1,310,000 | 668,087 |
| | | | | | 964,274 |
| Transportation revenue: 0.15% | | | | | |
| Virginia Small Business Financing Authority AMT 95 Express Lanes LLC Project | | 5.00 | 7-1-2049 | 4,000,000 | 4,149,760 |
| Virginia Small Business Financing Authority Senior Lien 95 Express Lanes LLC Project | | 5.00 | 7-1-2034 | 4,000,000 | 4,153,800 |
| | | | | | 8,303,560 |
| | | | | | 19,422,145 |
| Washington: 3.49% | | | | | |
| Airport revenue: 0.36% | | | | | |
| Port of Seattle WA Revenue AMT Intermediate Lien | | 5.00 | 4-1-2044 | 16,000,000 | 19,535,680 |
| Education revenue: 0.05% | | | | | |
| Washington HEFA Seattle University Project | | 4.00 | 5-1-2045 | 1,000,000 | 1,128,340 |
| Washington HEFA Seattle University Project | | 5.00 | 5-1-2030 | 760,000 | 981,137 |
| Washington HEFA Seattle University Project | | 5.00 | 5-1-2032 | 335,000 | 428,019 |
| Washington HEFA Seattle University Project | | 5.00 | 5-1-2033 | 300,000 | 381,120 |
| | | | | | 2,918,616 |
| GO revenue: 1.74% | | | | | |
| Clark County WA School District #114 (AGM Insured) | | 4.00 | 12-1-2031 | 9,000,000 | 10,991,700 |
| Clark County WA School District #114 (AGM Insured) | | 4.00 | 12-1-2034 | 2,500,000 | 3,021,325 |
| King County WA Public Hospital District #1 Valley Medical Center Refunding Bond | | 5.00 | 12-1-2029 | 8,940,000 | 10,715,931 |
| King County WA Public Hospital District #1 Valley Medical Center Refunding Bond | | 5.00 | 12-1-2035 | 9,430,000 | 11,196,333 |
| King County WA School District #210 Federal Way (AGM Insured) | | 4.00 | 12-1-2033 | 10,000,000 | 11,966,300 |
| King County WA School District #414 Lake Washington (AGM Insured) | | 5.00 | 12-1-2033 | 570,000 | 737,460 |
| King County WA School District #414 Lake Washington (AGM Insured) | | 5.00 | 12-1-2034 | 1,000,000 | 1,291,910 |
| Seattle WA | | 4.00 | 12-1-2040 | 2,500,000 | 2,795,025 |
| Snohomish County WA School District (AGM Insured) | | 5.00 | 12-1-2031 | 1,500,000 | 1,798,290 |
| Washington Motor Vehicle Fuel Tax %% | | 5.00 | 6-1-2040 | 10,000,000 | 13,090,200 |
| Washington Motor Vehicle Fuel Tax Series B | | 5.00 | 8-1-2032 | 8,545,000 | 10,263,656 |
| Washington Series 2017-A | | 5.00 | 8-1-2033 | 1,500,000 | 1,853,445 |
| Washington Series 2017-A | | 5.00 | 8-1-2040 | 3,500,000 | 4,271,120 |
The accompanying notes are an integral part of these financial statements.
52 | Wells Fargo Municipal Bond Fund
Portfolio of investments—December 31, 2020 (unaudited)
| | | Interest
rate | Maturity
date | Principal | Value |
| GO revenue (continued) | | | | | |
| Washington Series 2017-A | | 5.00% | 8-1-2041 | $ 2,500,000 | $ 3,043,225 |
| Washington Series RA | | 4.00 | 7-1-2030 | 7,950,000 | 8,366,660 |
| | | | | | 95,402,580 |
| Health revenue: 0.21% | | | | | |
| Spokane WA Housing Finance Commission Riverview Retirement Community Project | | 5.00 | 1-1-2023 | 495,000 | 509,528 |
| Washington HCFR Providence Health & Services Series 2012A | | 5.00 | 10-1-2042 | 2,160,000 | 2,279,729 |
| Washington Health Care Facilities Authority Commonspirit Health Series A-2 | | 5.00 | 8-1-2038 | 3,000,000 | 3,774,450 |
| Washington Health Care Facilities Authority Seattle Cancer Care Alliance | | 4.00 | 9-1-2045 | 3,000,000 | 3,477,930 |
| Washington Health Care Facilities Authority Seattle Cancer Care Alliance | | 5.00 | 9-1-2040 | 1,000,000 | 1,290,640 |
| | | | | | 11,332,277 |
| Miscellaneous revenue: 0.23% | | | | | |
| Washington Certificate of Participation | | 5.00 | 7-1-2038 | 1,660,000 | 2,158,100 |
| Washington Certificate of Participation | | 5.00 | 7-1-2039 | 1,745,000 | 2,263,544 |
| Washington Certificate of Participation | | 5.00 | 7-1-2040 | 1,480,000 | 1,915,490 |
| Washington Certificate of Participation | | 5.00 | 7-1-2041 | 1,555,000 | 2,006,510 |
| Washington Certificate of Participation Series A | | 5.00 | 7-1-2038 | 3,265,000 | 4,046,151 |
| | | | | | 12,389,795 |
| Tax revenue: 0.48% | | | | | |
| Central Puget Sound WA Regional Transportation Authority Series S1 | | 5.00 | 11-1-2035 | 9,485,000 | 11,403,152 |
| Washington Motor Vehicle Fuel Tax Series B | | 5.00 | 6-1-2036 | 5,000,000 | 6,732,400 |
| Washington Series B | | 5.00 | 8-1-2037 | 6,400,000 | 7,849,088 |
| | | | | | 25,984,640 |
| Utilities revenue: 0.16% | | | | | |
| Energy Northwest Washington Electric Revenue Refunding Bonds Columbia Generating Station | | 5.00 | 7-1-2034 | 2,500,000 | 3,396,150 |
| Energy Northwest Washington Electric Revenue Refunding Bonds Columbia Generating Station | | 5.00 | 7-1-2035 | 4,120,000 | 5,582,394 |
| | | | | | 8,978,544 |
| Water & sewer revenue: 0.26% | | | | | |
| King County WA | | 5.00 | 7-1-2042 | 4,660,000 | 5,759,434 |
| King County WA | | 5.00 | 7-1-2047 | 7,510,000 | 8,700,936 |
| | | | | | 14,460,370 |
| | | | | | 191,002,502 |
| West Virginia: 0.12% | | | | | |
| GO revenue: 0.06% | | | | | |
| Ohio County WV Board of Education | | 3.00 | 6-1-2026 | 2,680,000 | 3,034,671 |
The accompanying notes are an integral part of these financial statements.
Wells Fargo Municipal Bond Fund | 53
Portfolio of investments—December 31, 2020 (unaudited)
| | | Interest
rate | Maturity
date | Principal | Value |
| Tax revenue: 0.06% | | | | | |
| Monongalia County WV Commission Improvement & Refunding Bonds University Town Center Series A 144A | | 5.75% | 6-1-2043 | $ 675,000 | $ 719,928 |
| Monongalia County WV Commission Refunding & Improvement Bonds University Town Center Series A 144A | | 5.50 | 6-1-2037 | 2,500,000 | 2,660,975 |
| | | | | | 3,380,903 |
| | | | | | 6,415,574 |
| Wisconsin: 3.06% | | | | | |
| Education revenue: 0.37% | | | | | |
| Milwaukee WI RDA Science Education Consortium Incorporated Project Series A | | 6.00 | 8-1-2033 | 2,120,000 | 2,326,827 |
| Milwaukee WI RDA Science Education Consortium Incorporated Project Series A | | 6.25 | 8-1-2043 | 4,650,000 | 5,085,891 |
| Wisconsin PFA Carolina International School Series A 144A | | 6.00 | 8-1-2023 | 240,000 | 256,661 |
| Wisconsin PFA Carolina International School Series A 144A | | 6.75 | 8-1-2033 | 2,430,000 | 2,701,115 |
| Wisconsin PFA Carolina International School Series A 144A | | 7.00 | 8-1-2043 | 1,575,000 | 1,743,824 |
| Wisconsin PFA Carolina International School Series A 144A | | 7.20 | 8-1-2048 | 940,000 | 1,043,419 |
| Wisconsin PFA Charter School Revenue American Preparatory Academy 144A | | 5.00 | 7-15-2039 | 1,375,000 | 1,491,916 |
| Wisconsin PFA Wisland Revenue Northwest Nazarene University | | 4.25 | 10-1-2049 | 5,410,000 | 5,409,189 |
| | | | | | 20,058,842 |
| GO revenue: 0.17% | | | | | |
| Verona WI Area School District Building & Improvement Bonds | | 4.00 | 4-1-2027 | 3,385,000 | 3,953,443 |
| Verona WI Area School District Building & Improvement Bonds | | 4.00 | 4-1-2028 | 1,380,000 | 1,604,140 |
| Verona WI Area School District Building & Improvement Bonds | | 5.00 | 4-1-2026 | 3,310,000 | 4,093,543 |
| | | | | | 9,651,126 |
| Health revenue: 0.96% | | | | | |
| Tender Option Bond Trust Receipts/Certificates (Barclays Bank plc LOC, AGM Insured, Barclays Bank plc LIQ)144Aø | | 0.15 | 6-1-2045 | 5,320,000 | 5,320,000 |
| Wisconsin HEFA Ascension Senior Credit Group Series A | | 4.50 | 11-15-2039 | 4,580,000 | 5,341,104 |
| Wisconsin HEFA Ascension Senior Credit Group Series A | | 5.00 | 11-15-2035 | 12,000,000 | 14,558,520 |
| Wisconsin PFA Series A | | 4.00 | 10-1-2049 | 24,500,000 | 27,354,495 |
| | | | | | 52,574,119 |
| Housing revenue: 0.65% | | | | | |
| Wisconsin PFA Student Housing Revenue (AGM Insured) | | 4.00 | 7-1-2023 | 350,000 | 375,221 |
| Wisconsin PFA Student Housing Revenue (AGM Insured) | | 4.00 | 7-1-2024 | 800,000 | 879,912 |
| Wisconsin PFA Student Housing Revenue (AGM Insured) | | 4.00 | 7-1-2025 | 920,000 | 1,035,727 |
| Wisconsin PFA Student Housing Revenue (AGM Insured) | | 5.00 | 7-1-2026 | 1,360,000 | 1,635,033 |
| Wisconsin PFA Student Housing Revenue (AGM Insured) | | 5.00 | 7-1-2027 | 1,675,000 | 2,060,049 |
The accompanying notes are an integral part of these financial statements.
54 | Wells Fargo Municipal Bond Fund
Portfolio of investments—December 31, 2020 (unaudited)
| | | Interest
rate | Maturity
date | Principal | Value |
| Housing revenue (continued) | | | | | |
| Wisconsin PFA Student Housing Revenue (AGM Insured) | | 5.00% | 7-1-2028 | $ 2,025,000 | $ 2,531,655 |
| Wisconsin PFA Student Housing Revenue (AGM Insured) | | 5.00 | 7-1-2029 | 2,190,000 | 2,720,111 |
| Wisconsin PFA Student Housing Revenue (AGM Insured) | | 5.00 | 7-1-2030 | 2,300,000 | 2,834,543 |
| Wisconsin PFA Student Housing Revenue (AGM Insured) | | 5.00 | 7-1-2031 | 1,415,000 | 1,731,267 |
| Wisconsin PFA Student Housing Revenue (AGM Insured) | | 5.00 | 7-1-2048 | 16,775,000 | 19,638,996 |
| | | | | | 35,442,514 |
| Miscellaneous revenue: 0.07% | | | | | |
| Wisconsin Series A | | 5.00 | 6-1-2033 | 3,420,000 | 4,088,542 |
| Resource recovery revenue: 0.18% | | | | | |
| Wisconsin PFA Series A-2 | | 0.30 | 10-1-2025 | 10,000,000 | 10,000,100 |
| Tax revenue: 0.66% | | | | | |
| Mount Pleasant WI Series A | | 5.00 | 4-1-2043 | 20,205,000 | 24,566,047 |
| Mount Pleasant WI Series A | | 5.00 | 4-1-2048 | 650,000 | 783,582 |
| Mount Pleasant WI Series A | | 5.00 | 4-1-2048 | 7,205,000 | 8,631,878 |
| Wisconsin Center District CAB Series C (AGM Insured)¤ | | 0.00 | 12-15-2037 | 1,600,000 | 1,018,960 |
| Wisconsin Center District CAB Series C (AGM Insured)¤ | | 0.00 | 12-15-2038 | 1,600,000 | 976,880 |
| | | | | | 35,977,347 |
| | | | | | 167,792,590 |
| Wyoming: 0.04% | | | | | |
| Education revenue: 0.03% | | | | | |
| Wyoming CDA | | 6.50 | 7-1-2043 | 1,600,000 | 1,617,632 |
| Health revenue: 0.01% | | | | | |
| West Park Hospital District Wyoming Series B | | 6.50 | 6-1-2027 | 500,000 | 510,480 |
| | | | | | 2,128,112 |
| Total Municipal obligations (Cost $5,001,927,191) | | | | | 5,401,832,859 |
| | | Yield | | Shares | |
| Short-term investments: 0.57% | | | | | |
| Investment companies: 0.57% | | | | | |
| Wells Fargo Municipal Cash Management Money Market Fund Institutional Class ♠∞## | | 0.01% | | 30,965,253 | 30,974,543 |
| Total Short-term investments (Cost $30,974,503) | | | | | 30,974,543 |
| Total investments in securities (Cost $5,049,901,694) | 99.52% | | | | 5,449,807,402 |
| Other assets and liabilities, net | 0.48 | | | | 26,441,727 |
| Total net assets | 100.00% | | | | $ 5,476,249,129 |
| 144A | The security may be resold in transactions exempt from registration, normally to qualified institutional buyers, pursuant to Rule 144A under the Securities Act of 1933. |
| ø | Variable rate demand notes are subject to a demand feature which reduces the effective maturity. The maturity date shown represents the final maturity date of the security. The interest rate is determined and reset by the issuer daily, weekly, or monthly depending upon the terms of the security. The rate shown is the rate in effect at period end. |
| ¤ | The security is issued in zero coupon form with no periodic interest payments. |
| € | The security is an auction-rate security which has an interest rate that resets at predetermined short-term intervals through a Dutch auction. The rate shown is the rate in effect at period end. |
| ± | Variable rate investment. The rate shown is the rate in effect at period end. |
| ## | All or a portion of this security is segregated for when-issued securities. |
The accompanying notes are an integral part of these financial statements.
Wells Fargo Municipal Bond Fund | 55
Portfolio of investments—December 31, 2020 (unaudited)
| ♠ | The issuer of the security is an affiliated person of the Fund as defined in the Investment Company Act of 1940. |
| ∞ | The rate represents the 7-day annualized yield at period end. |
| %% | The security is purchased on a when-issued basis. |
| ♣ | On the last interest date, partial interest was paid. |
| Abbreviations: |
| AGC | Assured Guaranty Corporation |
| AGM | Assured Guaranty Municipal |
| Ambac | Ambac Financial Group Incorporated |
| AMT | Alternative minimum tax |
| BAM | Build America Mutual Assurance Company |
| BAN | Bond anticipation notes |
| CAB | Capital appreciation bond |
| CCAB | Convertible capital appreciation bond |
| CDA | Community Development Authority |
| ECFA | Educational & Cultural Facilities Authority |
| EDA | Economic Development Authority |
| EDFA | Economic Development Finance Authority |
| FGIC | Financial Guaranty Insurance Corporation |
| FHLMC | Federal Home Loan Mortgage Corporation |
| GO | General obligation |
| HCFR | Healthcare facilities revenue |
| HEFA | Health & Educational Facilities Authority |
| HEFAR | Higher Education Facilities Authority Revenue |
| HFA | Housing Finance Authority |
| HFFA | Health Facilities Financing Authority |
| IDA | Industrial Development Authority |
| LIBOR | London Interbank Offered Rate |
| LIQ | Liquidity agreement |
| LOC | Letter of credit |
| MFHR | Multifamily housing revenue |
| National | National Public Finance Guarantee Corporation |
| PFA | Public Finance Authority |
| RDA | Redevelopment Authority |
| SIFMA | Securities Industry and Financial Markets Association |
| SPA | Standby purchase agreement |
| TTFA | Transportation Trust Fund Authority |
Investments in affiliates
An affiliated investment is an investment in which the Fund owns at least 5% of the outstanding voting shares of the issuer or as a result of other relationships, such as the Fund and the issuer having the same investment manager. Transactions with issuers that were either affiliated persons of the Fund at the beginning of the period or the end of the period were as follows:
| | Value,
beginning of
period | Purchases | Sales
proceeds | Net
realized
gains
(losses) | Net
change in
unrealized
gains
(losses) | Value,
end of
period | % of
net
assets | Shares,
end
of period | Income
from
affiliated
securities |
| Short-term investments | | | | | | | | | |
| Investment companies | | | | | | | | | |
| Wells Fargo Municipal Cash Management Money Market Fund Institutional Class | $33,857,829 | $596,661,125 | $(599,540,269) | $(3,652) | $(490) | $30,974,543 | 0.57% | 30,965,253 | $3,793 |
The accompanying notes are an integral part of these financial statements.
56 | Wells Fargo Municipal Bond Fund
Statement of assets and liabilities—December 31, 2020 (unaudited)
| | |
| Assets | |
Investments in unaffiliated securities, at value (cost $5,018,927,191)
| $ 5,418,832,859 |
Investments in affiliated securites, at value (cost $30,974,503)
| 30,974,543 |
Cash
| 1,280,135 |
Receivable for interest
| 53,557,699 |
Receivable for Fund shares sold
| 10,119,770 |
Receivable for investments sold
| 1,320,000 |
Prepaid expenses and other assets
| 403,127 |
Total assets
| 5,516,488,133 |
| Liabilities | |
Payable for when-issued transactions
| 24,978,832 |
Payable for Fund shares redeemed
| 7,378,713 |
Dividends payable
| 2,806,404 |
Payable for investments purchased
| 2,576,305 |
Management fee payable
| 1,616,563 |
Administration fees payable
| 506,988 |
Distribution fee payable
| 39,727 |
Trustees’ fees and expenses payable
| 2,015 |
Accrued expenses and other liabilities
| 333,457 |
Total liabilities
| 40,239,004 |
Total net assets
| $5,476,249,129 |
| Net assets consist of | |
Paid-in capital
| $ 5,121,623,460 |
Total distributable earnings
| 354,625,669 |
Total net assets
| $5,476,249,129 |
| Computation of net asset value and offering price per share | |
Net assets – Class A
| $ 1,154,059,934 |
Shares outstanding – Class A1
| 106,920,342 |
Net asset value per share – Class A
| $10.79 |
Maximum offering price per share – Class A2
| $11.30 |
Net assets – Class C
| $ 56,664,541 |
Shares outstanding – Class C1
| 5,251,383 |
Net asset value per share – Class C
| $10.79 |
Net assets – Class R6
| $ 330,658,537 |
Shares outstanding – Class R61
| 30,632,306 |
Net asset value per share – Class R6
| $10.79 |
Net assets – Administrator Class
| $ 962,621,220 |
Shares outstanding – Administrator Class1
| 89,157,387 |
Net asset value per share – Administrator Class
| $10.80 |
Net assets – Institutional Class
| $ 2,972,244,897 |
Shares outstanding – Institutional Class1
| 275,386,929 |
Net asset value per share – Institutional Class
| $10.79 |
| 1 | The Fund has an unlimited number of authorized shares |
| 2 | Maximum offering price is computed as 100/95.50 of net asset value. On investments of $50,000 or more, the offering price is reduced. |
The accompanying notes are an integral part of these financial statements.
Wells Fargo Municipal Bond Fund | 57
Statement of operations—six months ended December 31, 2020 (unaudited)
| | |
| Investment income | |
Interest
| $ 84,582,909 |
Income from affiliated securities
| 3,793 |
Total investment income
| 84,586,702 |
| Expenses | |
Management fee
| 9,650,585 |
| Administration fees | |
Class A
| 937,454 |
Class C
| 56,209 |
Class R6
| 46,139 |
Administrator Class
| 507,149 |
Institutional Class
| 1,230,312 |
| Shareholder servicing fees | |
Class A
| 1,459,667 |
Class C
| 87,717 |
Administrator Class
| 1,267,872 |
| Distribution fee | |
Class C
| 263,151 |
Custody and accounting fees
| 111,134 |
Professional fees
| 42,930 |
Registration fees
| 95,112 |
Shareholder report expenses
| 78,619 |
Trustees’ fees and expenses
| 9,874 |
Other fees and expenses
| 58,859 |
Total expenses
| 15,902,783 |
| Less: Fee waivers and/or expense reimbursements | |
Fund-level
| (332,783) |
Class A
| (60,950) |
Class C
| (2,600) |
Administrator Class
| (269,233) |
Net expenses
| 15,237,217 |
Net investment income
| 69,349,485 |
| Realized and unrealized gains (losses) on investments | |
| Net realized gains (losses) on | |
Unaffiliated securities
| 9,156,585 |
Affiliated securities
| (3,652) |
Net realized gains on investments
| 9,152,933 |
| Net change in unrealized gains (losses) on | |
Unaffiliated securities
| 113,625,070 |
Affiliated securities
| (490) |
Net change in unrealized gains (losses) on investments
| 113,624,580 |
Net realized and unrealized gains (losses) on investments
| 122,777,513 |
Net increase in net assets resulting from operations
| $192,126,998 |
The accompanying notes are an integral part of these financial statements.
58 | Wells Fargo Municipal Bond Fund
Statement of changes in net assets
| | |
| | Six months ended
December 31, 2020
(unaudited) | Year ended
June 30, 2020 |
| Operations | | | | |
Net investment income
| | $ 69,349,485 | | $ 138,686,196 |
Net realized gains (losses) on investments
| | 9,152,933 | | (48,154,542) |
Net change in unrealized gains (losses) on investments
| | 113,624,580 | | 47,392,912 |
Net increase in net assets resulting from operations
| | 192,126,998 | | 137,924,566 |
| Distributions to shareholders from | | | | |
| Net investment income and net realized gains | | | | |
Class A
| | (13,125,584) | | (29,825,578) |
Class C
| | (519,831) | | (1,560,718) |
Class R6
| | (4,002,591) | | (4,491,029) |
Administrator Class
| | (12,081,276) | | (24,748,374) |
Institutional Class
| | (39,182,522) | | (84,244,945) |
Total distributions to shareholders
| | (68,911,804) | | (144,870,644) |
| Capital share transactions | Shares | | Shares | |
| Proceeds from shares sold | | | | |
Class A
| 5,382,577 | 57,510,929 | 9,167,275 | 97,235,133 |
Class C
| 184,459 | 1,967,367 | 766,819 | 8,149,104 |
Class R6
| 6,513,115 | 69,571,226 | 30,650,559 | 319,865,253 |
Administrator Class
| 12,805,796 | 136,713,777 | 45,240,283 | 475,573,522 |
Institutional Class
| 32,321,759 | 345,347,074 | 97,270,327 | 1,027,760,067 |
| | | 611,110,373 | | 1,928,583,079 |
| Reinvestment of distributions | | | | |
Class A
| 1,078,170 | 11,521,119 | 2,496,084 | 26,471,883 |
Class C
| 45,185 | 482,431 | 129,353 | 1,371,694 |
Class R6
| 2,046 | 21,855 | 2,722 | 28,842 |
Administrator Class
| 1,104,794 | 11,809,634 | 2,305,325 | 24,441,713 |
Institutional Class
| 3,105,331 | 33,182,938 | 6,798,581 | 72,103,950 |
| | | 57,017,977 | | 124,418,082 |
| Payment for shares redeemed | | | | |
Class A
| (7,458,724) | (79,637,835) | (18,119,157) | (190,725,711) |
Class C
| (2,548,583) | (27,144,304) | (2,656,976) | (28,073,292) |
Class R6
| (2,051,509) | (21,894,337) | (11,370,139) | (117,923,335) |
Administrator Class
| (21,162,080) | (225,559,770) | (29,998,773) | (314,967,801) |
Institutional Class
| (44,948,434) | (480,261,521) | (90,500,756) | (947,650,502) |
| | | (834,497,767) | | (1,599,340,641) |
Net increase (decrease) in net assets resulting from capital share transactions
| | (166,369,417) | | 453,660,520 |
Total increase (decrease) in net assets
| | (43,154,223) | | 446,714,442 |
| Net assets | | | | |
Beginning of period
| | 5,519,403,352 | | 5,072,688,910 |
End of period
| | $5,476,249,129 | | $ 5,519,403,352 |
The accompanying notes are an integral part of these financial statements.
Wells Fargo Municipal Bond Fund | 59
Financial highlights
(For a share outstanding throughout each period)
| | | Year ended June 30 |
| Class A | Six months ended
December 31, 2020
(unaudited) | 2020 | 2019 | 2018 | 2017 | 2016 |
Net asset value, beginning of period
| $10.55 | $10.55 | $10.21 | $10.25 | $10.70 | $10.25 |
Net investment income
| 0.12 | 0.25 | 0.30 1 | 0.32 | 0.33 | 0.31 |
Net realized and unrealized gains (losses) on investments
| 0.24 | 0.01 | 0.34 | (0.02) | (0.38) | 0.50 |
Total from investment operations
| 0.36 | 0.26 | 0.64 | 0.30 | (0.05) | 0.81 |
| Distributions to shareholders from | | | | | | |
Net investment income
| (0.12) | (0.25) | (0.30) | (0.32) | (0.33) | (0.31) |
Net realized gains
| 0.00 | (0.01) | 0.00 | (0.02) | (0.07) | (0.05) |
Total distributions to shareholders
| (0.12) | (0.26) | (0.30) | (0.34) | (0.40) | (0.36) |
Net asset value, end of period
| $10.79 | $10.55 | $10.55 | $10.21 | $10.25 | $10.70 |
Total return2
| 3.43% | 2.54% | 6.35% | 2.97% | (0.47)% | 8.04% |
| Ratios to average net assets (annualized) | | | | | | |
Gross expenses
| 0.77% | 0.77% | 0.78% | 0.79% | 0.79% | 0.79% |
Net expenses
| 0.75% | 0.74% | 0.75% | 0.75% | 0.75% | 0.75% |
Net investment income
| 2.26% | 2.40% | 2.89% | 3.10% | 3.13% | 2.99% |
| Supplemental data | | | | | | |
Portfolio turnover rate
| 9% | 24% | 20% | 19% | 24% | 16% |
Net assets, end of period (000s omitted)
| $1,154,060 | $1,138,934 | $1,206,717 | $1,179,800 | $1,244,267 | $1,529,884 |
| 1 | Calculated based upon average shares outstanding |
| 2 | Total return calculations do not include any sales charges. Returns for periods of less than one year are not annualized. |
The accompanying notes are an integral part of these financial statements.
60 | Wells Fargo Municipal Bond Fund
Financial highlights
(For a share outstanding throughout each period)
| | | Year ended June 30 |
| Class C | Six months ended
December 31, 2020
(unaudited) | 2020 | 2019 | 2018 | 2017 | 2016 |
Net asset value, beginning of period
| $10.55 | $10.55 | $10.21 | $10.24 | $10.69 | $10.25 |
Net investment income
| 0.08 | 0.17 | 0.22 | 0.24 | 0.25 | 0.23 |
Net realized and unrealized gains (losses) on investments
| 0.24 | 0.01 | 0.34 | (0.01) | (0.38) | 0.49 |
Total from investment operations
| 0.32 | 0.18 | 0.56 | 0.23 | (0.13) | 0.72 |
| Distributions to shareholders from | | | | | | |
Net investment income
| (0.08) | (0.17) | (0.22) | (0.24) | (0.25) | (0.23) |
Net realized gains
| 0.00 | (0.01) | 0.00 | (0.02) | (0.07) | (0.05) |
Total distributions to shareholders
| (0.08) | (0.18) | (0.22) | (0.26) | (0.32) | (0.28) |
Net asset value, end of period
| $10.79 | $10.55 | $10.55 | $10.21 | $10.24 | $10.69 |
Total return1
| 3.04% | 1.77% | 5.56% | 2.30% | (1.21)% | 7.14% |
| Ratios to average net assets (annualized) | | | | | | |
Gross expenses
| 1.52% | 1.51% | 1.53% | 1.54% | 1.54% | 1.54% |
Net expenses
| 1.50% | 1.50% | 1.50% | 1.50% | 1.50% | 1.50% |
Net investment income
| 1.50% | 1.64% | 2.15% | 2.35% | 2.38% | 2.24% |
| Supplemental data | | | | | | |
Portfolio turnover rate
| 9% | 24% | 20% | 19% | 24% | 16% |
Net assets, end of period (000s omitted)
| $56,665 | $79,863 | $98,411 | $132,529 | $148,944 | $186,036 |
| 1 | Total return calculations do not include any sales charges. Returns for periods of less than one year are not annualized. |
The accompanying notes are an integral part of these financial statements.
Wells Fargo Municipal Bond Fund | 61
Financial highlights
(For a share outstanding throughout each period)
| | | Year ended June 30 |
| Class R6 | Six months ended
December 31, 2020
(unaudited) | 2020 | 2019 1 |
Net asset value, beginning of period
| $10.55 | $10.55 | $10.21 |
Net investment income
| 0.14 | 0.29 | 0.30 |
Net realized and unrealized gains (losses) on investments
| 0.24 | 0.01 | 0.34 |
Total from investment operations
| 0.38 | 0.30 | 0.64 |
| Distributions to shareholders from | | | |
Net investment income
| (0.14) | (0.29) | (0.30) |
Net realized gains
| 0.00 | (0.01) | 0.00 |
Total distributions to shareholders
| (0.14) | (0.30) | (0.30) |
Net asset value, end of period
| $10.79 | $10.55 | $10.55 |
Total return2
| 3.62% | 2.90% | 6.43% |
| Ratios to average net assets (annualized) | | | |
Gross expenses
| 0.39% | 0.39% | 0.40% |
Net expenses
| 0.39% | 0.39% | 0.40% |
Net investment income
| 2.62% | 2.76% | 3.16% |
| Supplemental data | | | |
Portfolio turnover rate
| 9% | 24% | 20% |
Net assets, end of period (000s omitted)
| $330,659 | $276,204 | $72,655 |
| 1 | For the period from July 31, 2018 (commencement of class operations) to June 30, 2019 |
| 2 | Returns for periods of less than one year are not annualized. |
The accompanying notes are an integral part of these financial statements.
62 | Wells Fargo Municipal Bond Fund
Financial highlights
(For a share outstanding throughout each period)
| | | Year ended June 30 |
| Administrator Class | Six months ended
December 31, 2020
(unaudited) | 2020 | 2019 | 2018 | 2017 | 2016 |
Net asset value, beginning of period
| $10.56 | $10.55 | $10.21 | $10.25 | $10.70 | $10.26 |
Net investment income
| 0.13 | 0.27 | 0.31 1 | 0.33 1 | 0.34 | 0.33 |
Net realized and unrealized gains (losses) on investments
| 0.24 | 0.02 | 0.34 | (0.02) | (0.38) | 0.49 |
Total from investment operations
| 0.37 | 0.29 | 0.65 | 0.31 | (0.04) | 0.82 |
| Distributions to shareholders from | | | | | | |
Net investment income
| (0.13) | (0.27) | (0.31) | (0.33) | (0.34) | (0.33) |
Net realized gains
| 0.00 | (0.01) | 0.00 | (0.02) | (0.07) | (0.05) |
Total distributions to shareholders
| (0.13) | (0.28) | (0.31) | (0.35) | (0.41) | (0.38) |
Net asset value, end of period
| $10.80 | $10.56 | $10.55 | $10.21 | $10.25 | $10.70 |
Total return2
| 3.51% | 2.78% | 6.51% | 3.13% | (0.32)% | 8.10% |
| Ratios to average net assets (annualized) | | | | | | |
Gross expenses
| 0.71% | 0.71% | 0.72% | 0.73% | 0.73% | 0.73% |
Net expenses
| 0.60% | 0.60% | 0.60% | 0.60% | 0.60% | 0.60% |
Net investment income
| 2.40% | 2.54% | 3.02% | 3.27% | 3.18% | 3.15% |
| Supplemental data | | | | | | |
Portfolio turnover rate
| 9% | 24% | 20% | 19% | 24% | 16% |
Net assets, end of period (000s omitted)
| $962,621 | $1,017,781 | $832,318 | $227,116 | $108,715 | $270,304 |
| 1 | Calculated based upon average shares outstanding |
| 2 | Returns for periods of less than one year are not annualized. |
The accompanying notes are an integral part of these financial statements.
Wells Fargo Municipal Bond Fund | 63
Financial highlights
(For a share outstanding throughout each period)
| | | Year ended June 30 |
| Institutional Class | Six months ended
December 31, 2020
(unaudited) | 2020 | 2019 | 2018 | 2017 | 2016 |
Net asset value, beginning of period
| $10.55 | $10.55 | $10.21 | $10.24 | $10.70 | $10.25 |
Net investment income
| 0.14 | 0.29 | 0.33 | 0.35 | 0.36 | 0.34 |
Net realized and unrealized gains (losses) on investments
| 0.24 | 0.01 | 0.34 | (0.01) | (0.39) | 0.50 |
Total from investment operations
| 0.38 | 0.30 | 0.67 | 0.34 | (0.03) | 0.84 |
| Distributions to shareholders from | | | | | | |
Net investment income
| (0.14) | (0.29) | (0.33) | (0.35) | (0.36) | (0.34) |
Net realized gains
| 0.00 | (0.01) | 0.00 | (0.02) | (0.07) | (0.05) |
Total distributions to shareholders
| (0.14) | (0.30) | (0.33) | (0.37) | (0.43) | (0.39) |
Net asset value, end of period
| $10.79 | $10.55 | $10.55 | $10.21 | $10.24 | $10.70 |
Total return1
| 3.59% | 2.85% | 6.67% | 3.37% | (0.28)% | 8.35% |
| Ratios to average net assets (annualized) | | | | | | |
Gross expenses
| 0.44% | 0.44% | 0.45% | 0.46% | 0.46% | 0.46% |
Net expenses
| 0.44% | 0.44% | 0.45% | 0.46% | 0.46% | 0.46% |
Net investment income
| 2.57% | 2.71% | 3.15% | 3.40% | 3.44% | 3.27% |
| Supplemental data | | | | | | |
Portfolio turnover rate
| 9% | 24% | 20% | 19% | 24% | 16% |
Net assets, end of period (000s omitted)
| $2,972,245 | $3,006,622 | $2,862,588 | $1,425,703 | $1,149,911 | $961,289 |
| 1 | Returns for periods of less than one year are not annualized. |
The accompanying notes are an integral part of these financial statements.
64 | Wells Fargo Municipal Bond Fund
Notes to financial statements (unaudited)
1. ORGANIZATION
Wells Fargo Funds Trust (the “Trust”), a Delaware statutory trust organized on March 10, 1999, is an open-end management investment company registered under the Investment Company Act of 1940, as amended (the “1940 Act”). As an investment company, the Trust follows the accounting and reporting guidance in Financial Accounting Standards Board (“FASB”) Accounting Standards Codification Topic 946, Financial Services – Investment Companies. These financial statements report on the Wells Fargo Municipal Bond Fund (the “Fund”) which is a diversified series of the Trust.
2. SIGNIFICANT ACCOUNTING POLICIES
The following significant accounting policies, which are consistently followed in the preparation of the financial statements of the Fund, are in conformity with U.S. generally accepted accounting principles which require management to make estimates and assumptions that affect the reported amounts of assets and liabilities, disclosure of contingent assets and liabilities at the date of the financial statements, and the reported amounts of income and expenses during the reporting period. Actual results could differ from those estimates.
Securities valuation
All investments are valued each business day as of the close of regular trading on the New York Stock Exchange (generally 4 p.m. Eastern Time), although the Fund may deviate from this calculation time under unusual or unexpected circumstances.
Debt securities are valued at the evaluated bid price provided by an independent pricing service (e.g. taking into account various factors, including yields, maturities, or credit ratings) or, if a reliable price is not available, the quoted bid price from an independent broker-dealer.
Investments in registered open-end investment companies are valued at net asset value.
Investments which are not valued using any of the methods discussed above are valued at their fair value, as determined in good faith by the Board of Trustees of the Fund. The Board of Trustees has established a Valuation Committee comprised of the Trustees and has delegated to it the authority to take any actions regarding the valuation of portfolio securities that the Valuation Committee deems necessary or appropriate, including determining the fair value of portfolio securities, unless the determination has been delegated to the Wells Fargo Asset Management Pricing Committee at Wells Fargo Funds Management, LLC ("Funds Management"). The Board of Trustees retains the authority to make or ratify any valuation decisions or approve any changes to the Valuation Procedures as it deems appropriate. On a quarterly basis, the Board of Trustees receives reports on any valuation actions taken by the Valuation Committee or the Wells Fargo Asset Management Pricing Committee which may include items for ratification.
When-issued transactions
The Fund may purchase securities on a forward commitment or when-issued basis. The Fund records a when-issued transaction on the trade date and will segregate assets in an amount at least equal in value to the Fund's commitment to purchase when-issued securities. Securities purchased on a when-issued basis are marked-to-market daily and the Fund begins earning interest on the settlement date. Losses may arise due to changes in the market value of the underlying securities or if the counterparty does not perform under the contract.
Security transactions and income recognition
Securities transactions are recorded on a trade date basis. Realized gains or losses are recorded on the basis of identified cost.
Interest income is accrued daily and bond discounts are accreted and premiums are amortized daily. To the extent debt obligations are placed on non-accrual status, any related interest income may be reduced by writing off interest receivables when the collection of all or a portion of interest has been determined to be doubtful based on consistently applied procedures and the fair value has decreased. If the issuer subsequently resumes interest payments or when the collectability of interest is reasonably assured, the debt obligation is removed from non-accrual status.
Distributions to shareholders
Distributions to shareholders from net investment income are declared daily and paid monthly. Distributions from net realized gains, if any, are recorded on the ex-dividend date and paid at least annually. Such distributions are determined in accordance with income tax regulations and may differ from U.S. generally accepted accounting principles. Dividend sources are estimated at the time of declaration. The tax character of distributions is determined as of the Fund’s fiscal year end. Therefore, a portion of the Fund’s distributions made prior to the Fund’s fiscal year end may be categorized as a tax return of capital at year end.
Wells Fargo Municipal Bond Fund | 65
Notes to financial statements (unaudited)
Federal and other taxes
The Fund intends to continue to qualify as a regulated investment company by distributing substantially all of its investment company taxable and tax-exempt income and any net realized capital gains (after reduction for capital loss carryforwards) sufficient to relieve it from all, or substantially all, federal income taxes. Accordingly, no provision for federal income taxes was required.
The Fund’s income and federal excise tax returns and all financial records supporting those returns for the prior three fiscal years are subject to examination by the federal and Delaware revenue authorities. Management has analyzed the Fund’s tax positions taken on federal, state, and foreign tax returns for all open tax years and does not believe that there are any uncertain tax positions that require recognition of a tax liability.
As of December 31, 2020, the aggregate cost of all investments for federal income tax purposes was $5,051,042,648 and the unrealized gains (losses) consisted of:
| Gross unrealized gains | $406,305,790 |
| Gross unrealized losses | (7,541,036) |
| Net unrealized gains | $398,764,754 |
As of June 30, 2020, the Fund had current year net deferred post-October capital losses consisting of $46,493,296 in short-term losses and $5,605,214 in long-term capital losses which were recognized in the first day of the current fiscal year.
Class allocations
The separate classes of shares offered by the Fund differ principally in applicable sales charges, distribution, shareholder servicing, and administration fees. Class specific expenses are charged directly to that share class. Investment income, common fund-level expenses, and realized and unrealized gains (losses) on investments are allocated daily to each class of shares based on the relative proportion of net assets of each class.
3. FAIR VALUATION MEASUREMENTS
Fair value measurements of investments are determined within a framework that has established a fair value hierarchy based upon the various data inputs utilized in determining the value of the Fund’s investments. The three-level hierarchy gives the highest priority to unadjusted quoted prices in active markets for identical assets or liabilities (Level 1) and the lowest priority to unobservable inputs (Level 3). The Fund’s investments are classified within the fair value hierarchy based on the lowest level of input that is significant to the fair value measurement. The inputs are summarized into three broad levels as follows:
| ■ | Level 1 – quoted prices in active markets for identical securities |
| ■ | Level 2 – other significant observable inputs (including quoted prices for similar securities, interest rates, prepayment speeds, credit risk, etc.) |
| ■ | Level 3 – significant unobservable inputs (including the Fund’s own assumptions in determining the fair value of investments) |
The inputs or methodologies used for valuing investments in securities are not necessarily an indication of the risk associated with investing in those securities.
The following is a summary of the inputs used in valuing the Fund’s assets and liabilities as of December 31, 2020:
| | Quoted prices
(Level 1) | Other significant
observable inputs
(Level 2) | Significant
unobservable inputs
(Level 3) | Total |
| Assets | | | | |
| Investments in: | | | | |
| Closed end municipal bond fund obligations | $ 0 | $ 17,000,000 | $0 | $ 17,000,000 |
| Municipal obligations | 0 | 5,401,832,859 | 0 | 5,401,832,859 |
| Short-term investments | | | | |
| Investment companies | 30,974,543 | 0 | 0 | 30,974,543 |
| Total assets | $30,974,543 | $5,418,832,859 | $0 | $5,449,807,402 |
66 | Wells Fargo Municipal Bond Fund
Notes to financial statements (unaudited)
Additional sector, industry or geographic detail is included in the Portfolio of Investments.
For the six months ended December 31, 2020, the Fund did not have any transfers into/out of Level 3.
4. TRANSACTIONS WITH AFFILIATES
Management fee
Funds Management, an indirect wholly owned subsidiary of Wells Fargo & Company (“Wells Fargo”), is the manager of the Fund and provides advisory and fund-level administrative services under an investment management agreement. Under the investment management agreement, Funds Management is responsible for, among other services, implementing the investment objectives and strategies of the Fund, supervising the subadviser and providing fund-level administrative services in connection with the Fund’s operations. As compensation for its services under the investment management agreement, Funds Management is entitled to receive a management fee at the following annual rate based on the Fund’s average daily net assets:
| Average daily net assets | Management fee |
| First $500 million | 0.400% |
| Next $500 million | 0.375 |
| Next $2 billion | 0.350 |
| Next $2 billion | 0.325 |
| Next $5 billion | 0.290 |
| Over $10 billion | 0.280 |
For the six months ended December 31, 2020, the management fee was equivalent to an annual rate of 0.34% of the Fund’s average daily net assets.
Funds Management has retained the services of a subadviser to provide daily portfolio management to the Fund. The fee for subadvisory services is borne by Funds Management. Wells Capital Management, Incorporated, an affiliate of Funds Management and an indirect wholly owned subsidiary of Wells Fargo, is the subadviser to the Fund and is entitled to receive a fee from Funds Management at an annual rate starting at 0.20% and declining to 0.10% as the average daily net assets of the Fund increase.
Administration fees
Under a class-level administration agreement, Funds Management provides class-level administrative services to the Fund, which includes paying fees and expenses for services provided by the transfer agent, sub-transfer agents, omnibus account servicers and record-keepers. As compensation for its services under the class-level administration agreement, Funds Management receives an annual fee which is calculated based on the average daily net assets of each class as follows:
| | Class-level
administration fee |
| Class A | 0.16% |
| Class C | 0.16 |
| Class R6 | 0.03 |
| Administrator Class | 0.10 |
| Institutional Class | 0.08 |
Waivers and/or expense reimbursements
Funds Management has contractually waived and/or reimbursed management and administration fees to the extent necessary to maintain certain net operating expense ratios for the Fund. When each class of the Fund has exceeded its expense cap, Funds Management has waived fees and/or reimbursed expenses from fund-level expenses on a proportionate basis and then from class specific expenses. When only certain classes exceed their expense caps, waivers and/or reimbursements are applied against class specific expenses before fund-level expenses. Funds Management has committed through October 31, 2021 to waive fees and/or reimburse expenses to the extent necessary to cap the Fund’s expenses at 0.75% for Class A shares, 1.50% for Class C shares, 0.40% for Class R6 shares, 0.60% for Administrator Class shares, and 0.45% for Institutional Class shares. Prior to or after the commitment expiration date, the cap may be increased or the commitment to maintain the cap may be
Wells Fargo Municipal Bond Fund | 67
Notes to financial statements (unaudited)
terminated only with the approval of the Board of Trustees. Prior to November 1, 2020, the Fund's expenses were capped at 0.43% for Class R6 shares and 0.48% for Institutional Class shares.
Distribution fee
The Trust has adopted a distribution plan for Class C shares of the Fund pursuant to Rule 12b-1 under the 1940 Act. A distribution fee is charged charged to Class C shares and paid to Wells Fargo Funds Distributor, LLC (“Funds Distributor”), the principal underwriter, at an annual rate of 0.75% of the average daily net assets of Class C shares.
In addition, Funds Distributor is entitled to receive the front-end sales charge from the purchase of Class A shares and a contingent deferred sales charge on the redemption of certain Class A shares. Funds Distributor is also entitled to receive the contingent deferred sales charges from redemptions of Class C shares. For the six months ended December 31, 2020, Funds Distributor received $8,233 from the sale of Class A shares. No contingent deferred sales charges were incurred by Class A and Class C shares for the six months ended December 31, 2020.
Shareholder servicing fees
The Trust has entered into contracts with one or more shareholder servicing agents, whereby Class A, Class C, and Administrator Class of the Fund are charged a fee at an annual rate of 0.25% of the average daily net assets of each respective class. A portion of these total shareholder servicing fees were paid to affiliates of Wells Fargo.
Interfund transactions
The Fund may purchase or sell portfolio investment securities to certain other Wells Fargo affiliates pursuant to Rule 17a-7 under the 1940 Act and under procedures adopted by the Board of Trustees. The procedures have been designed to ensure that these interfund transactions, which do not incur broker commissions, are effected at current market prices. Pursuant to these procedures, the Fund had $283,995,000, $286,440,060 and $(2,940) in interfund purchases, sales and net realized gains (losses), respectively, during the six months ended December 31, 2020.
5. INVESTMENT PORTFOLIO TRANSACTIONS
Purchases and sales of investments, excluding U.S. government obligations (if any) and short-term securities, for the six months ended December 31, 2020 were $340,249,819 and $926,879,635, respectively.
6. BANK BORROWINGS
The Trust (excluding the money market funds), Wells Fargo Master Trust and Wells Fargo Variable Trust are parties to a $350,000,000 revolving credit agreement whereby the Fund is permitted to use bank borrowings for temporary or emergency purposes, such as to fund shareholder redemption requests. Interest under the credit agreement is charged to the Fund based on a borrowing rate equal to the higher of the Federal Funds rate in effect on that day plus 1.25% or the overnight LIBOR rate in effect on that day plus 1.25%. In addition, an annual commitment fee equal to 0.25% of the unused balance is allocated to each participating fund.
For the six months ended December 31, 2020, there were no borrowings by the Fund under the agreement.
7. INDEMNIFICATION
Under the Fund's organizational documents, the officers and Trustees have been granted certain indemnification rights against certain liabilities that may arise out of performance of their duties to the Fund. The Fund has entered into a separate agreement with each Trustee that converts indemnification rights currently existing under the Fund’s organizational documents into contractual rights that cannot be changed in the future without the consent of the Trustee. Additionally, in the normal course of business, the Fund may enter into contracts with service providers that contain a variety of indemnification clauses. The Fund’s maximum exposure under these arrangements is dependent on future claims that may be made against the Fund and, therefore, cannot be estimated.
8. NEW ACCOUNTING PRONOUNCEMENT
In August 2018, FASB issued Accounting Standards Update (“ASU”) No. 2018-13, Fair Value Measurement (Topic 820) Disclosure Framework - Changes to the Disclosure Requirements for Fair Value Measurement. ASU 2018-13 updates the disclosure requirements on fair value measurements in Topic 820, Fair Value Measurements. The amendments are effective for fiscal years, and interim periods within those fiscal years, beginning after December 15, 2019. Management has adopted this guidance which did not have a material impact on the financial statements.
68 | Wells Fargo Municipal Bond Fund
Notes to financial statements (unaudited)
9. SUBSEQUENT EVENT
On February 23, 2021, Wells Fargo announced that it has entered into a definitive agreement to sell Wells Fargo Asset Management (“WFAM”) to GTCR LLC and Reverence Capital Partners, L.P. WFAM is the trade name used by the asset management businesses of Wells Fargo and includes Wells Fargo Funds Management, LLC, the investment manager to the Fund, Wells Capital Management Incorporated and Wells Fargo Asset Management (International) Limited, both registered investment advisers providing sub-advisory services to certain funds, and Wells Fargo Funds Distributor, LLC, the Fund’s principal underwriter. As part of the transaction, Wells Fargo will own a 9.9% equity interest and will continue to serve as an important client and distribution partner.
Consummation of the transaction will result in the automatic termination of the Fund’s investment management agreement and sub-advisory agreement(s). The Fund’s Board of Trustees will be asked to approve new investment management arrangements with the new company. If approved by the Board, the new investment management arrangements with the new company will be presented to the shareholders of the Fund for approval, and, if approved by shareholders, would take effect upon the closing of the transaction. The transaction is expected to close in the second half of 2021, subject to customary closing conditions.
10. CORONAVIRUS (COVID-19) PANDEMIC
On March 11, 2020, the World Health Organization announced that it had made the assessment that coronavirus disease 2019 (“COVID-19”) is a pandemic. The impacts of COVID-19 are affecting the entire global economy, individual companies and investment products, and the market in general. There is significant uncertainty around the extent and duration of business disruptions related to COVID-19 and the impacts may be short term or may last for an extended period of time. The risk of further spreading of COVID-19 has led to significant uncertainty and volatility in the financial markets.
Wells Fargo Municipal Bond Fund | 69
Other information (unaudited)
PROXY VOTING INFORMATION
A description of the policies and procedures used to determine how to vote proxies relating to portfolio securities is available without charge, upon request, by calling 1-800-222-8222, visiting our website at wfam.com, or visiting the SEC website at sec.gov. Information regarding how the proxies related to portfolio securities were voted during the most recent 12-month period ended June 30 is available on the website at wfam.com or by visiting the SEC website at sec.gov.
QUARTERLY PORTFOLIO HOLDINGS INFORMATION
The Fund files its complete schedule of portfolio holdings with the SEC for the first and third quarters of each fiscal year as an exhibit to its reports on Form N-PORT. Shareholders may view the filed Form N-PORT by visiting the SEC website at sec.gov.
70 | Wells Fargo Municipal Bond Fund
Other information (unaudited)
BOARD OF TRUSTEES AND OFFICERS
Each of the Trustees and Officers1 listed in the table below acts in identical capacities for each fund in the Wells Fargo family of funds, which consists of 144 mutual funds comprising the Wells Fargo Funds Trust, Wells Fargo Variable Trust, Wells Fargo Master Trust and four closed-end funds (collectively the “Fund Complex”). This table should be read in conjunction with the Prospectus and the Statement of Additional Information2. The mailing address of each Trustee and Officer is 525 Market Street, 12th Floor, San Francisco, CA 94105. Each Trustee and Officer serves an indefinite term, however, each Trustee serves such term until reaching the mandatory retirement age established by the Trustees.
Independent Trustees
Name and
year of birth | Position held and
length of service* | Principal occupations during past five years or longer | Current other
public company or
investment
company
directorships |
William R. Ebsworth
(Born 1957) | Trustee,
since 2015 | Retired. From 1984 to 2013, equities analyst, portfolio manager, research director and chief investment officer at Fidelity Management and Research Company in Boston, Tokyo, and Hong Kong, and retired in 2013 as Chief Investment Officer of Fidelity Strategic Advisers, Inc. where he led a team of investment professionals managing client assets. Prior thereto, Board member of Hong Kong Securities Clearing Co., Hong Kong Options Clearing Corp., the Thailand International Fund, Ltd., Fidelity Investments Life Insurance Company, and Empire Fidelity Investments Life Insurance Company. Audit Committee Chair and Investment Committee Chair of the Vincent Memorial Hospital Endowment (non-profit organization). Mr. Ebsworth is a CFA® charterholder. | N/A |
Jane A. Freeman
(Born 1953) | Trustee,
since 2015;
Chair Liaison,
since 2018 | Retired. From 2012 to 2014 and 1999 to 2008, Chief Financial Officer of Scientific Learning Corporation. From 2008 to 2012, Ms. Freeman provided consulting services related to strategic business projects. Prior to 1999, Portfolio Manager at Rockefeller & Co. and Scudder, Stevens & Clark. Board member of the Harding Loevner Funds from 1996 to 2014, serving as both Lead Independent Director and chair of the Audit Committee. Board member of the Russell Exchange Traded Funds Trust from 2011 to 2012 and the chair of the Audit Committee. Ms. Freeman is also an inactive Chartered Financial Analyst. | N/A |
Isaiah Harris, Jr.
(Born 1952) | Trustee,
since 2009; Audit
Committee
Chair,
since 2019 | Retired. Chairman of the Board of CIGNA Corporation since 2009, and Director since 2005. From 2003 to 2011, Director of Deluxe Corporation. Prior thereto, President and CEO of BellSouth Advertising and Publishing Corp. from 2005 to 2007, President and CEO of BellSouth Enterprises from 2004 to 2005 and President of BellSouth Consumer Services from 2000 to 2003. Emeritus member of the Iowa State University Foundation Board of Governors. Emeritus Member of the Advisory Board of Iowa State University School of Business. Advisory Board Member, Palm Harbor Academy (private school). Mr. Harris is a certified public accountant (inactive status). | CIGNA Corporation |
Judith M. Johnson
(Born 1949) | Trustee,
since 2008 | Retired. Prior thereto, Chief Executive Officer and Chief Investment Officer of Minneapolis Employees Retirement Fund from 1996 to 2008. Ms. Johnson is an attorney, certified public accountant and a certified managerial accountant. | N/A |
David F. Larcker
(Born 1950) | Trustee,
since 2009 | James Irvin Miller Professor of Accounting at the Graduate School of Business (Emeritus), Stanford University, Director of the Corporate Governance Research Initiative and Senior Faculty of The Rock Center for Corporate Governance since 2006. From 2005 to 2008, Professor of Accounting at the Graduate School of Business, Stanford University. Prior thereto, Ernst & Young Professor of Accounting at The Wharton School, University of Pennsylvania from 1985 to 2005. | N/A |
Wells Fargo Municipal Bond Fund | 71
Other information (unaudited)
Name and
year of birth | Position held and
length of service* | Principal occupations during past five years or longer | Current other
public company or
investment
company
directorships |
Olivia S. Mitchell
(Born 1953) | Trustee,
since 2006;
Nominating and
Governance
Committee Chair,
since 2018 | International Foundation of Employee Benefit Plans Professor, Wharton School of the University of Pennsylvania since 1993. Director of Wharton’s Pension Research Council and Boettner Center on Pensions & Retirement Research, and Research Associate at the National Bureau of Economic Research. Previously, Cornell University Professor from 1978 to 1993. | N/A |
Timothy J. Penny
(Born 1951) | Trustee,
since 1996;
Chair,
since 2018 | President and Chief Executive Officer of Southern Minnesota Initiative Foundation, a non-profit organization, since 2007. Member of the Board of Trustees of NorthStar Education Finance, Inc., a non-profit organization, since 2007. | N/A |
James G. Polisson
(Born 1959) | Trustee,
since 2018 | Retired. Chief Marketing Officer, Source (ETF) UK Services, Ltd, from 2015 to 2017. From 2012 to 2015, Principal of The Polisson Group, LLC, a management consulting, corporate advisory and principal investing company. Chief Executive Officer and Managing Director at Russell Investments, Global Exchange Traded Funds from 2010 to 2012. Managing Director of Barclays Global Investors from 1998 to 2010 and Global Chief Marketing Officer for iShares and Barclays Global Investors from 2000 to 2010. Trustee of the San Francisco Mechanics’ Institute, a non-profit organization, from 2013 to 2015. Board member of the Russell Exchange Traded Fund Trust from 2011 to 2012. Director of Barclays Global Investors Holdings Deutschland GmbH from 2006 to 2009. Mr. Polisson is an attorney and has a retired status with the Massachusetts and District of Columbia Bar Associations. | N/A |
Pamela Wheelock
(Born 1959) | Trustee,
since January
2020; previously
Trustee from
January 2018 to
July 2019 | Board member of the Destination Medical Center Economic Development Agency, Rochester, Minnesota since 2019. Interim President of the McKnight Foundation from January to September 2020. Acting Commissioner, Minnesota Department of Human Services, July 2019 through September 2019. Human Services Manager (part-time), Minnesota Department of Human Services, October 2019 through December 2019. Chief Operating Officer, Twin Cities Habitat for Humanity from 2017 to 2019. Vice President of University Services, University of Minnesota from 2012 to 2016. Prior thereto, on the Board of Directors, Governance Committee and Finance Committee for the Minnesota Philanthropy Partners (Saint Paul Foundation) from 2012 to 2018, Interim Chief Executive Officer of Blue Cross Blue Shield of Minnesota from 2011 to 2012, Chairman of the Board from 2009 to 2012 and Board Director from 2003 to 2015. Vice President, Leadership and Community Engagement, Bush Foundation, Saint Paul, Minnesota (a private foundation) from 2009 to 2011. Executive Vice President and Chief Financial Officer, Minnesota Sports and Entertainment from 2004 to 2009 and Senior Vice President from 2002 to 2004. Executive Vice President of the Minnesota Wild Foundation from 2004 to 2008. Commissioner of Finance, State of Minnesota, from 1999 to 2002. Currently Board Chair of the Minnesota Wild Foundation since 2010. | N/A |
* Length of service dates reflect the Trustee’s commencement of service with the Trust’s predecessor entities, where applicable.
72 | Wells Fargo Municipal Bond Fund
Other information (unaudited)
Officers
Name and
year of birth | Position held and
length of service | Principal occupations during past five years or longer |
Andrew Owen
(Born 1960) | President,
since 2017 | Executive Vice President of Wells Fargo & Company and Head of Affiliated Managers, Wells Fargo Asset Management, since 2014. In addition, Mr. Owen is currently President, Chief Executive Officer and Director of Wells Fargo Funds Management, LLC since 2017. Prior thereto, Executive Vice President responsible for marketing, investments and product development for Wells Fargo Funds Management, LLC, from 2009 to 2014. |
Nancy Wiser1
(Born 1967) | Treasurer,
since 2012 | Executive Vice President of Wells Fargo Funds Management, LLC since 2011. Chief Operating Officer and Chief Compliance Officer at LightBox Capital Management LLC, from 2008 to 2011. |
Michelle Rhee
(Born 1966) | Chief Legal Officer,
since 2019 | Secretary of Wells Fargo Funds Management, LLC and Chief Legal Counsel of Wells Fargo Asset Management since 2018. Deputy General Counsel of Wells Fargo Bank N.A. since 2020 and Assistant General Counsel of Wells Fargo Bank, N.A. from 2018 to 2020. Associate General Counsel and Managing Director of Bank of America Corporation from 2004 to 2018. |
Catherine Kennedy
(Born 1969) | Secretary,
since 2019 | Vice President of Wells Fargo Funds Management, LLC and Senior Counsel of the Wells Fargo Legal Department since 2010. Vice President and Senior Counsel of Evergreen Investment Management Company, LLC from 1998 to 2010. |
Michael H. Whitaker
(Born 1967) | Chief Compliance Officer,
since 2016 | Chief Compliance Officer of Wells Fargo Asset Management since 2016. Senior Vice President and Chief Compliance Officer for Fidelity Investments from 2007 to 2016. |
Jeremy DePalma1
(Born 1974) | Assistant Treasurer,
since 2009 | Senior Vice President of Wells Fargo Funds Management, LLC since 2009. Senior Vice President of Evergreen Investment Management Company, LLC from 2008 to 2010 and head of the Fund Reporting and Control Team within Fund Administration from 2005 to 2010. |
1 Nancy Wiser acts as Treasurer of 67 funds in the Fund Complex. Jeremy DePalma acts as the Treasurer of 77 funds and Assistant Treasurer of 67 funds in the Fund Complex.
2 ��The Statement of Additional Information includes additional information about the Trustees and is available, without charge, upon request, by calling 1-800-222-8222 or by visiting the website at wfam.com.
Wells Fargo Municipal Bond Fund | 73
For more information
More information about Wells Fargo Funds is available free upon request. To obtain literature, please write, visit the Fund's website, or call:
Wells Fargo Funds
P.O. Box 219967
Kansas City, MO 64121-9967
Website: wfam.com
Individual investors: 1-800-222-8222
Retail investment professionals: 1-888-877-9275
Institutional investment professionals: 1-866-765-0778
This report and the financial statements contained herein are submitted for the general information of the shareholders of the Fund. If this report is used for promotional purposes, distribution of the report must be accompanied or preceded by a current prospectus. Before investing, please consider the investment objectives, risks, charges, and expenses of the investment. For a current prospectus and, if available, a summary prospectus, containing this information, call 1-800-222-8222 or visit the Fund’s website at wfam.com. Read the prospectus carefully before you invest or send money.
Wells Fargo Asset Management (WFAM) is the trade name for certain investment advisory/management firms owned by Wells Fargo & Company. These firms include but are not limited to Wells Capital Management Incorporated and Wells Fargo Funds Management, LLC. Certain products managed by WFAM entities are distributed by Wells Fargo Funds Distributor, LLC (a broker-dealer and Member FINRA).
This material is for general informational and educational purposes only and is NOT intended to provide investment advice or a recommendation of any kind— including a recommendation for any specific investment, strategy, or plan.
INVESTMENT PRODUCTS: NOT FDIC INSURED ■ NO BANK GUARANTEE ■ MAY LOSE VALUE
© 2021 Wells Fargo & Company. All rights reserved.
PAR-0121-00279 02-21
SA253/SAR253 12-20
Semi-Annual Report
December 31, 2020
Wells Fargo
Municipal Sustainability Fund
Reduce clutter.
Save trees.
Sign up for electronic delivery of prospectuses and shareholder reports at wellsfargo.com/ advantagedelivery
The views expressed and any forward-looking statements are as of December 31, 2020, unless otherwise noted, and are those of the Fund's portfolio managers and/or Wells Fargo Asset Management. Discussions of individual securities or the markets generally are not intended as individual recommendations. Future events or results may vary significantly from those expressed in any forward-looking statements. The views expressed are subject to change at any time in response to changing circumstances in the market. Wells Fargo Asset Management and the Fund disclaim any obligation to publicly update or revise any views expressed or forward-looking statements.
INVESTMENT PRODUCTS: NOT FDIC INSURED ■ NO BANK GUARANTEE ■ MAY LOSE VALUE
Wells Fargo Municipal Sustainability Fund | 1
Letter to shareholders (unaudited)
Dear Shareholder:
We are pleased to offer you this semi-annual report for the Wells Fargo Municipal Sustainability Fund for the six-month period that ended December 31, 2020. Despite a deeply challenging year, dominated by the spread of COVID-19 cases and a sharp drop in economic output throughout much of the world, global stocks performed extremely well, benefiting from ongoing central bank support and rising optimism over the development and distribution of effective COVID-19 vaccines. Bonds also had positive returns, led by global bonds and high-yield bonds.
For the six-month period, U.S. stocks, based on the S&P 500 Index,1 gained 22.16%. International stocks, as measured by the MSCI ACWI ex USA Index (Net),2 returned 24.33%, while the MSCI EM Index (Net),3 had even stronger performance, with a 31.14% gain. Among bond indexes, the Bloomberg Barclays U.S. Aggregate Bond Index,4 returned 1.29%, the Bloomberg Barclays Global Aggregate ex-USD Index (unhedged),5 gained 9.44%, and the Bloomberg Barclays Municipal Bond Index,6 returned 3.07% while the ICE BofA U.S. High Yield Index,7 gained a hefty 11.49%.
The stock market rally continued in July.
After a volatile first half of the year, an existing stock market rally continued in July with strong results for equities and fixed income. However, economic data and a resurgence of COVID-19 cases underscored the urgent need to regain control of the pandemic. Second-quarter gross domestic product (GDP) shrank from the previous quarter by 9.5% and 12.1% in the U.S. and the eurozone, respectively. In contrast, China’s second-quarter GDP grew 3.2% year over year. The U.S. economy added 1.8 million jobs in July, but a double-digit jobless rate persisted.
The stock market continued to rally in August despite concerns over rising numbers of U.S. and European COVID-19 cases as well as the expiration of the $600 weekly bonus unemployment benefit in July. Relatively strong second-quarter earnings boosted investor sentiment along with the U.S. Federal Reserve’s announcement of a monetary policy shift expected to support longer-term low interest rates. U.S. manufacturing and services activity indexes beat expectations, while the U.S. housing market maintained strength. In Europe, retail sales expanded and consumer confidence was steady. China’s economy continued to expand.
Andrew Owen
President
Wells Fargo Funds
“After a volatile first half of the year, an existing stock market rally continued in July with strong results for equities and fixed income.”
| 1 | The S&P 500 Index consists of 500 stocks chosen for market size, liquidity, and industry group representation. It is a market-value-weighted index with each stock's weight in the index proportionate to its market value. You cannot invest directly in an index. |
| 2 | The Morgan Stanley Capital International (MSCI) All Country World Index (ACWI) ex USA Index (Net) is a free-float-adjusted market-capitalization-weighted index that is designed to measure the equity market performance of developed and emerging markets, excluding the United States. Source: MSCI. MSCI makes no express or implied warranties or representations and shall have no liability whatsoever with respect to any MSCI data contained herein. The MSCI data may not be further redistributed or used as a basis for other indices or any securities or financial products. This report is not approved, reviewed, or produced by MSCI. You cannot invest directly in an index. |
| 3 | The MSCI Emerging Markets (EM) Index (Net) is a free-float-adjusted market-capitalization-weighted index that is designed to measure equity market performance of emerging markets. You cannot invest directly in an index. |
| 4 | The Bloomberg Barclays U.S. Aggregate Bond Index is a broad-based benchmark that measures the investment-grade, U.S. dollar-denominated, fixed-rate taxable bond market, including Treasuries, government-related and corporate securities, mortgage-backed securities (agency fixed-rate and hybrid adjustable-rate mortgage pass-throughs), asset-backed securities, and commercial mortgage-backed securities. You cannot invest directly in an index. |
| 5 | The Bloomberg Barclays Global Aggregate ex-USD Index (unhedged) is an unmanaged index that provides a broad-based measure of the global investment-grade fixed-income markets excluding the U.S. dollar-denominated debt market. You cannot invest directly in an index. |
| 6 | The Bloomberg Barclays Municipal Bond Index is an unmanaged index composed of long-term tax-exempt bonds with a minimum credit rating of Baa. You cannot invest directly in an index. |
| 7 | The ICE BofA U.S. High Yield Index is a market-capitalization-weighted index of domestic and Yankee high-yield bonds. The index tracks the performance of high-yield securities traded in the U.S. bond market. You cannot invest directly in an index. Copyright 2021. ICE Data Indices, LLC. All rights reserved. |
2 | Wells Fargo Municipal Sustainability Fund
Letter to shareholders (unaudited)
Stocks grew more volatile in September on mixed economic data. U.S. economic activity continued to grow. However, U.S. unemployment remained elevated at 7.9% in September. With U.S. Congress delaying further fiscal relief and uncertainties surrounding a possible vaccine, doubts crept back into the financial markets. In the U.K., a lack of progress in Brexit talks weighed on markets. China’s economy picked up steam, fueled by increased global demand.
In October, capital markets stepped back from their six-month rally. Market volatility rose in advance of the U.S. election and amid a global increase in COVID-19 infections. Europe introduced tighter restrictions affecting economic activity. U.S. markets looked favorably at the prospect of Democratic control of the federal purse strings, which could lead to additional fiscal stimulus and a boost to economic activity. Meanwhile, China reported 4.9% third-quarter GDP growth.
Global stocks rallied in November, propelled by optimism over three promising COVID-19 vaccines. Reversing recent trends, value stocks outperformed growth stocks and cyclical stocks outpaced technology stocks. However, U.S. unemployment remained elevated, with a net job loss of 10 million since February. The eurozone services Purchasing Managers’ Index, a monthly survey of purchasing managers, contracted sharply while the region’s manufacturing activity grew. The U.S. election results added to the upbeat mood as investors anticipated more consistent policies in the new administration.
Financial markets ended the year with strength on high expectations for a rapid rollout of the COVID-19 vaccines, the successful passage of a $900 billion stimulus package, and rising expectations of additional economic support from a Democratic-led Congress. U.S. economic data were mixed with still-elevated unemployment and weak retail sales but growth in manufacturing output. In contrast, China’s economic expansion continued in both manufacturing and nonmanufacturing. U.S. COVID-19 infection rates continued to rise even as new state and local lockdown measures were implemented.
Don’t let short-term uncertainty derail long-term investment goals.
Periods of investment uncertainty can present challenges, but experience has taught us that maintaining long-term investment goals can be an effective way to plan for the future. To help you create a sound strategy based on your personal goals and risk tolerance, Wells Fargo Funds offers more than 100 mutual funds spanning a wide range of asset classes and investment styles. Although diversification cannot guarantee an investment profit or prevent losses, we believe it can be an effective way to manage investment risk and potentially smooth out overall portfolio performance. We encourage investors to know their investments and to understand that appropriate levels of risk-taking may unlock opportunities.
Thank you for choosing to invest with Wells Fargo Funds. We appreciate your confidence in us and remain committed to helping you meet your financial needs.
Sincerely,
Andrew Owen
President
Wells Fargo Funds
“Global stocks rallied in November, propelled by optimism over three promising COVID-19 vaccines.”
For further information about your Fund, contact your investment professional, visit our website at wfam.com, or call us directly at 1-800-222-8222.
Wells Fargo Municipal Sustainability Fund | 3
Performance highlights (unaudited)
Investment objective
The Fund seeks current income exempt from federal income tax.
Manager
Wells Fargo Funds Management, LLC
Subadviser
Wells Capital Management Incorporated
Portfolio managers
Terry J. Goode
Robert J. Miller
Brandon Pae*
Nicholos Venditti*
Average annual total returns (%) as of December 31, 2020
| | | Including sales charge | | Excluding sales charge | | Expense ratios1 (%) |
| | Inception date | Since
Inception | | Since
Inception | | Gross | Net 2 |
| Class A (WMSAX) | 2-28-2020 | | 0.68 | | | | 5.41 | | | 2.26 | 0.75 |
| Class C (WMSCX) | 2-28-2020 | | 3.77 | | | | 4.77 | | | 3.01 | 1.50 |
| Class R6 (WMSRX) | 2-28-2020 | | - | | | | 5.72 | | | 1.88 | 0.40 |
| Administrator Class (WMSDX) | 2-28-2020 | | - | | | | 5.55 | | | 2.20 | 0.60 |
| Institutional Class (WMSIX) | 2-28-2020 | | - | | | | 5.68 | | | 1.93 | 0.45 |
| Bloomberg Barclays Municipal Bond Index3 | – | | - | | | | 2.04* | | | - | - |
* Based on inception date of the oldest Fund class.
Figures quoted represent past performance, which is no guarantee of future results, and do not reflect taxes that a shareholder may pay on an investment in a fund. Investment return and principal value of an investment will fluctuate so that an investor’s shares, when redeemed, may be worth more or less than their original cost. Current performance may be lower or higher than the performance data quoted, which assumes the reinvestment of dividends and capital gains. Current month-end performance is available on the Fund’s website, wfam.com.
Index returns do not include transaction costs associated with buying and selling securities, any mutual fund fees or expenses, or any taxes. It is not possible to invest directly in an index.
For Class A shares, the maximum front-end sales charge is 4.50%. For Class C shares, the maximum contingent deferred sales charge is 1.00%. Performance including a contingent deferred sales charge assumes the sales charge for the corresponding time period. Class R6, Administrator Class, and Institutional Class shares are sold without a front-end sales charge or contingent deferred sales charge.
Bond values fluctuate in response to the financial condition of individual issuers, general market and economic conditions, and changes in interest rates. Changes in market conditions and government policies may lead to periods of heightened volatility in the bond market and reduced liquidity for certain bonds held by the Fund. In general, when interest rates rise, bond values fall and investors may lose principal value. Interest rate changes and their impact on the Fund and its share price can be sudden and unpredictable. High-yield securities have a greater risk of default and tend to be more volatile than higher-rated debt securities. The use of derivatives may reduce returns and/or increase volatility. Investing in environmental, social, and governance (ESG) carries the risk that, under certain market conditions, the investments may underperform products that invest in a broader array of investments. In addition, some ESG investments may be dependent on government tax incentives and subsidies and on political support for certain environmental technologies and companies. The ESG sector also may have challenges such as a limited number of issuers and liquidity in the market, including a robust secondary market. Investing primarily in responsible investments carries the risk that, under certain market conditions, an investment may underperform funds that do not use a responsible investment strategy. The Fund is exposed to municipal securities risk. Consult the Fund’s prospectus for additional information on these and other risks.
Please see footnotes on page 5.
4 | Wells Fargo Municipal Sustainability Fund
Performance highlights (unaudited)
| Effective maturity distribution as of December 31, 20204 |
| Credit quality as of December 31, 20205 |
| * | Mr. Pae and Mr. Venditti became portfolio managers of the Fund on September 1, 2020. |
| 1 | Reflects the expense ratios as stated in the most recent prospectuses. The expense ratios shown are subject to change and may differ from the annualized expense ratios shown in the financial highlights of this report. |
| 2 | The manager has contractually committed through October 31, 2021, to waive fees and/or reimburse expenses to the extent necessary to cap total annual fund operating expenses after fee waivers at 0.75% for Class A, 1.50% for Class C, 0.40% for Class R6, 0.60% for Administrator Class, and 0.45% for Institutional Class. Brokerage commissions, stamp duty fees, interest, taxes, acquired fund fees and expenses (if any), and extraordinary expenses are excluded from the expense caps. Prior to or after the commitment expiration date, the caps may be increased or the commitment to maintain the caps may be terminated only with the approval of the Board of Trustees. Without these caps, the Fund’s returns would have been lower. The expense ratio paid by an investor is the net expense ratio (the total annual fund operating expenses after fee waivers) as stated in the prospectuses. |
| 3 | The Bloomberg Barclays Municipal Bond Index is an unmanaged index composed of long-term tax-exempt bonds with a minimum credit rating of Baa. You cannot invest directly in an index. |
| 4 | Figures represent the percentage of the Fund's long-term investments. These amounts are subject to change and may have changed since the date specified. |
| 5 | The credit quality distribution of portfolio holdings reflected in the chart is based on ratings from Standard & Poor’s, Moody’s Investors Service, and/ or Fitch Ratings Ltd. Credit quality ratings apply to the underlying holdings of the Fund and not to the Fund itself. The percentages of the Fund’s portfolio with the ratings depicted in the chart are calculated based on the total market value of fixed income securities held by the Fund. If a security was rated by all three rating agencies, the middle rating was utilized. If rated by two of three rating agencies, the lower rating was utilized, and if rated by one of the rating agencies, that rating was utilized. Standard & Poor’s rates the creditworthiness of bonds, ranging from AAA (highest) to D (lowest). Ratings from A to CCC may be modified by the addition of a plus (+) or minus (-) sign to show relative standing within the rating categories. Standard & Poor’s rates the creditworthiness of short-term notes from SP-1 (highest) to SP-3 (lowest). Moody’s rates the creditworthiness of bonds, ranging from Aaa (highest) to C (lowest). Ratings Aa to B may be modified by the addition of a number 1 (highest) to 3 (lowest) to show relative standing within the ratings categories. Moody’s rates the creditworthiness of short-term U.S. tax-exempt municipal securities from MIG 1/VMIG 1 (highest) to SG (lowest). Fitch rates the creditworthiness of bonds, ranging from AAA (highest) to D (lowest). Credit quality distribution is subject to change and may have changed since the date specified. |
Wells Fargo Municipal Sustainability Fund | 5
Fund expenses (unaudited)
As a shareholder of the Fund, you incur two types of costs: (1) transaction costs, including sales charges (loads) on purchase payments and contingent deferred sales charges (if any) on redemptions and (2) ongoing costs, including management fees, distribution (12b-1) and/or shareholder servicing fees, and other Fund expenses. This example is intended to help you understand your ongoing costs (in dollars) of investing in the Fund and to compare these costs with the ongoing costs of investing in other mutual funds.
The example is based on an investment of $1,000 invested at the beginning of the six-month period and held for the entire period from July 1, 2020 to December 31, 2020.
Actual expenses
The “Actual” line of the table below provides information about actual account values and actual expenses. You may use the information in this line, together with the amount you invested, to estimate the expenses that you paid over the period. Simply divide your account value by $1,000 (for example, an $8,600 account value divided by $1,000 = 8.6), then multiply the result by the number in the “Actual” line under the heading entitled “Expenses paid during period” for your applicable class of shares to estimate the expenses you paid on your account during this period.
Hypothetical example for comparison purposes
The “Hypothetical” line of the table below provides information about hypothetical account values and hypothetical expenses based on the Fund’s actual expense ratio and an assumed rate of return of 5% per year before expenses, which is not the Fund’s actual return. The hypothetical account values and expenses may not be used to estimate the actual ending account balance or expenses you paid for the period. You may use this information to compare the ongoing costs of investing in the Fund and other funds. To do so, compare this 5% hypothetical example with the 5% hypothetical examples that appear in the shareholder reports of the other funds.
Please note that the expenses shown in the table are meant to highlight your ongoing costs only and do not reflect any transactional costs, such as sales charges (loads) and contingent deferred sales charges. Therefore, the “Hypothetical” line of the table is useful in comparing ongoing costs only and will not help you determine the relative total costs of owning different funds. In addition, if these transactional costs were included, your costs would have been higher.
| | Beginning
account value
7-1-2020 | Ending
account value
12-31-2020 | Expenses
paid during
the period1 | Annualized net
expense ratio |
| Class A | | | | |
| Actual | $1,000.00 | $1,030.73 | $3.84 | 0.75% |
| Hypothetical (5% return before expenses) | $1,000.00 | $1,021.42 | $3.82 | 0.75% |
| Class C | | | | |
| Actual | $1,000.00 | $1,026.85 | $7.66 | 1.50% |
| Hypothetical (5% return before expenses) | $1,000.00 | $1,017.64 | $7.63 | 1.50% |
| Class R6 | | | | |
| Actual | $1,000.00 | $1,032.54 | $2.05 | 0.40% |
| Hypothetical (5% return before expenses) | $1,000.00 | $1,023.19 | $2.04 | 0.40% |
| Administrator Class | | | | |
| Actual | $1,000.00 | $1,031.51 | $3.07 | 0.60% |
| Hypothetical (5% return before expenses) | $1,000.00 | $1,022.18 | $3.06 | 0.60% |
| Institutional Class | | | | |
| Actual | $1,000.00 | $1,032.29 | $2.31 | 0.45% |
| Hypothetical (5% return before expenses) | $1,000.00 | $1,022.94 | $2.29 | 0.45% |
1 Expenses paid is equal to the annualized net expense ratio of each class multiplied by the average account value over the period, multiplied by the number of days in the most recent fiscal half-year divided by the number of days in the fiscal year (to reflect the one-half-year period).
6 | Wells Fargo Municipal Sustainability Fund
Portfolio of investments—December 31, 2020 (unaudited)
| | | Interest
rate | Maturity
date | Principal | Value |
| Municipal obligations: 98.77% | | | | | |
| Alabama: 1.08% | | | | | |
| Education revenue: 1.08% | | | | | |
| University of North Alabama Revenue General Fee Series A | | 5.00 | 11-1-2022 | $ 265,000 | 280,585 |
| Arizona: 6.33% | | | | | |
| GO revenue: 1.28% | | | | | |
| Maricopa County AZ Elementary School District #25 Liberty School Improvement Project 2019 Series A (AGM Insured) | | 5.00 | 7-1-2023 | 300,000 | 334,389 |
| Miscellaneous revenue: 5.05% | | | | | |
| Phoenix AZ Civic Improvement Corporation Water System Sustainability Bonds Series B | | 5.00 | 7-1-2044 | 1,000,000 | 1,315,825 |
| | | | | | 1,650,214 |
| California: 11.33% | | | | | |
| Education revenue: 0.51% | | | | | |
| California Municipal Finance Authority Education Revenue Stream Charter School Project 144A | | 5.00 | 6-15-2051 | 125,000 | 131,929 |
| Health revenue: 1.00% | | | | | |
| San Buenaventura CA Community Mental Health System | | 6.50 | 12-1-2021 | 250,000 | 260,548 |
| Housing revenue: 5.65% | | | | | |
| California HFA MFHR | | 1.45 | 4-1-2024 | 1,000,000 | 1,008,890 |
| California Municipal Finance Authority Student Housing Revenue CHF Riverside I LLC Projects | | 5.00 | 5-15-2029 | 375,000 | 464,145 |
| | | | | | 1,473,035 |
| Miscellaneous revenue: 3.63% | | | | | |
| California Infrastructure & Economic Development Bank Lease Revenue Teachers Retirement | | 5.00 | 8-1-2030 | 310,000 | 410,759 |
| San Francisco City & County CA 49 South Van Ness Project Green Bond Series A | | 4.00 | 4-1-2034 | 370,000 | 433,285 |
| San Joaquin CA Area Flood Control Agency Smith Canal Area Assessment District Revenue (AGM Insured) | | 4.00 | 10-1-2021 | 100,000 | 102,277 |
| | | | | | 946,321 |
| Water & sewer revenue: 0.54% | | | | | |
| Santa Paula CA Utility Authority Series A | | 4.00 | 2-1-2021 | 140,000 | 140,382 |
| | | | | | 2,952,215 |
| Colorado: 6.63% | | | | | |
| Education revenue: 2.54% | | | | | |
| Colorado ECFA Revenue Improvement & Refunding Bonds Charter School | | 5.00 | 3-15-2027 | 535,000 | 663,133 |
| Health revenue: 2.25% | | | | | |
| Colorado Health Facilities Authority Revenue Hospital Advent Health Obligated Group Series A | | 4.00 | 11-15-2043 | 500,000 | 585,955 |
The accompanying notes are an integral part of these financial statements.
Wells Fargo Municipal Sustainability Fund | 7
Portfolio of investments—December 31, 2020 (unaudited)
| | | Interest
rate | Maturity
date | Principal | Value |
| Tax revenue: 1.84% | | | | | |
| Regional Colorado Transportation District Private Activity Denver Transit Partners Eagle P3 Project Series A | | 4.00% | 7-15-2040 | $ 375,000 | $ 478,560 |
| | | | | | 1,727,648 |
| District of Columbia: 1.27% | | | | | |
| Water & sewer revenue: 1.27% | | | | | |
| District of Columbia Water & Sewer Authority Public Utility Green Bond Series A | | 5.00 | 10-1-2038 | 250,000 | 330,520 |
| Florida: 0.50% | | | | | |
| Education revenue: 0.50% | | | | | |
| Florida Development Finance Corporation Educational Facilities United Cerebral Palsy Charter Schools Projects Social Bonds Series A | | 5.00 | 6-1-2050 | 125,000 | 130,898 |
| Guam: 1.19% | | | | | |
| Water & sewer revenue: 1.19% | | | | | |
| Guam Government Waterworks Authority Series A | | 5.00 | 1-1-2050 | 250,000 | 310,008 |
| Idaho: 1.81% | | | | | |
| Health revenue: 1.81% | | | | | |
| Idaho Health Facilities Authority Hospital Trinity Health Credit Group Series A | | 5.00 | 12-1-2047 | 385,000 | 470,628 |
| Illinois: 17.81% | | | | | |
| GO revenue: 6.85% | | | | | |
| Chicago IL Series A | | 5.50 | 1-1-2039 | 360,000 | 394,225 |
| Chicago IL Series A | | 6.00 | 1-1-2038 | 375,000 | 438,713 |
| Decatur IL (BAM Insured) | | 5.00 | 3-1-2024 | 375,000 | 423,326 |
| Kendall, Kane & Will Counties IL CAB School District #308 (AGM Insured)¤ | | 0.00 | 2-1-2027 | 155,000 | 145,463 |
| Will County IL Lincoln-Way Community High School District #210 Refunded Bond (AGM Insured) | | 4.00 | 1-1-2022 | 375,000 | 383,794 |
| | | | | | 1,785,521 |
| Miscellaneous revenue: 2.61% | | | | | |
| Illinois Finance Authority Clean Water Initiative Revolving Fund | | 5.00 | 7-1-2024 | 585,000 | 681,578 |
| Tax revenue: 2.28% | | | | | |
| Chicago IL Transit Authority Sales Tax Receipts (AGM Insured) | | 5.00 | 12-1-2046 | 500,000 | 593,255 |
| Transportation revenue: 3.05% | | | | | |
| Chicago IL Public Building Commission Chicago Transit Authority (Ambac Insured) | | 5.25 | 3-1-2031 | 600,000 | 794,268 |
| Water & sewer revenue: 3.02% | | | | | |
| Chicago IL Wastewater Transmission Series C | | 5.00 | 1-1-2024 | 700,000 | 786,212 |
| | | | | | 4,640,834 |
The accompanying notes are an integral part of these financial statements.
8 | Wells Fargo Municipal Sustainability Fund
Portfolio of investments—December 31, 2020 (unaudited)
| | | Interest
rate | Maturity
date | Principal | Value |
| Indiana: 4.80% | | | | | |
| Miscellaneous revenue: 2.44% | | | | | |
| Indiana Finance Authority State Revolving Fund Program Green Bond Series E | | 5.00% | 2-1-2047 | $ 500,000 | $ 635,095 |
| Water & sewer revenue: 2.36% | | | | | |
| Indiana Finance Authority Green Bond Series B | | 5.00 | 2-1-2028 | 500,000 | 614,555 |
| | | | | | 1,249,650 |
| Louisiana: 0.66% | | | | | |
| Water & sewer revenue: 0.66% | | | | | |
| New Orleans LA Water (BAM Insured) | | 5.00 | 12-1-2034 | 150,000 | 172,649 |
| Massachusetts: 2.87% | | | | | |
| Education revenue: 2.32% | | | | | |
| Massachusetts Development Finance Agency Boston College Issue Series U | | 5.00 | 7-1-2025 | 500,000 | 604,480 |
| Health revenue: 0.55% | | | | | |
| Massachusetts Development Finance Agency Milford Regional Medical Center Series G 144A | | 5.00 | 7-15-2025 | 125,000 | 143,906 |
| | | | | | 748,386 |
| Michigan: 4.65% | | | | | |
| Miscellaneous revenue: 2.37% | | | | | |
| Michigan Building Authority Series I | | 5.00 | 10-15-2031 | 500,000 | 617,505 |
| Tax revenue: 0.41% | | | | | |
| Michigan Finance Authority Local Government Loan Program Public Lighting Authority Refunding Bonds Series B | | 5.00 | 7-1-2044 | 100,000 | 107,681 |
| Water & sewer revenue: 1.87% | | | | | |
| Great Lakes MI Water Authority Water Supply System Series D | | 5.00 | 7-1-2031 | 400,000 | 487,548 |
| | | | | | 1,212,734 |
| Minnesota: 0.45% | | | | | |
| Education revenue: 0.45% | | | | | |
| St. Paul MN Housing & RDA Charter School Hmong College Preparatory Academy Project Series 2020 | | 5.00 | 9-1-2055 | 100,000 | 115,927 |
| Nevada: 5.34% | | | | | |
| GO revenue: 5.34% | | | | | |
| Clark County NV Flood Control District | | 5.00 | 11-1-2029 | 500,000 | 663,235 |
| Clark County NV School District Building Series A | | 4.00 | 6-15-2035 | 625,000 | 728,131 |
| | | | | | 1,391,366 |
| New Jersey: 1.62% | | | | | |
| Miscellaneous revenue: 1.14% | | | | | |
| New Jersey EDA Series XX | | 4.00 | 6-15-2024 | 270,000 | 295,655 |
The accompanying notes are an integral part of these financial statements.
Wells Fargo Municipal Sustainability Fund | 9
Portfolio of investments—December 31, 2020 (unaudited)
| | | Interest
rate | Maturity
date | Principal | Value |
| Tax revenue: 0.48% | | | | | |
| New Jersey Garden State Preservation Trust Open & Farmland Series A (AGM Insured) | | 5.75% | 11-1-2028 | $ 100,000 | $ 125,781 |
| | | | | | 421,436 |
| New York: 6.91% | | | | | |
| Education revenue: 1.32% | | | | | |
| New York Dormitory Authority Non-State Supported Debt Series A | | 5.00 | 7-1-2038 | 270,000 | 343,019 |
| GO revenue: 0.52% | | | | | |
| Poughkeepsie City NY Refunding Bonds Public Improvement | | 5.00 | 6-1-2024 | 125,000 | 135,290 |
| Transportation revenue: 2.49% | | | | | |
| New York Metropolitan Transportation Authority Revenue BAN Subordinated Series B-1 | | 5.00 | 5-15-2022 | 625,000 | 649,713 |
| Water & sewer revenue: 2.58% | | | | | |
| New York Environmental Facilities Corporation Clean Water & Drinking Water New York City Municipal Water Finance Authority Project Series A | | 5.00 | 6-15-2032 | 500,000 | 671,235 |
| | | | | | 1,799,257 |
| North Carolina: 0.78% | | | | | |
| Housing revenue: 0.78% | | | | | |
| North Carolina Capital Facilities Finance Refunding Bonds Arc North Carolina Projects (Department of Housing and Urban Development Insured) | | 5.00 | 10-1-2024 | 180,000 | 202,268 |
| Oregon: 2.47% | | | | | |
| GO revenue: 2.47% | | | | | |
| Bend OR | | 5.00 | 6-1-2050 | 500,000 | 644,725 |
| Pennsylvania: 7.42% | | | | | |
| Education revenue: 3.28% | | | | | |
| Allegheny County PA Higher Education Robert Morris University | | 5.00 | 10-15-2037 | 250,000 | 276,250 |
| Philadelphia PA IDA Saint Joseph's University Series C | | 4.00 | 11-1-2037 | 500,000 | 578,420 |
| | | | | | 854,670 |
| Health revenue: 1.67% | | | | | |
| Westmoreland County PA IDA Excela Health Project Series A | | 4.00 | 7-1-2037 | 375,000 | 435,769 |
| Transportation revenue: 2.47% | | | | | |
| Pennsylvania Turnpike Commisson Turnpike Series B-1 | | 5.25 | 6-1-2047 | 535,000 | 642,321 |
| | | | | | 1,932,760 |
| South Carolina: 1.29% | | | | | |
| Education revenue: 1.29% | | | | | |
| South Carolina Jobs EDA Revenue Wofford College Project | | 5.00 | 4-1-2033 | 270,000 | 334,781 |
The accompanying notes are an integral part of these financial statements.
10 | Wells Fargo Municipal Sustainability Fund
Portfolio of investments—December 31, 2020 (unaudited)
| | | Interest
rate | Maturity
date | Principal | Value |
| Texas: 4.11% | | | | | |
| Airport revenue: 1.44% | | | | | |
| Galveston TX Wharves & Terminal Refunding Bonds | | 4.63% | 2-1-2024 | $ 375,000 | $ 375,345 |
| GO revenue: 2.67% | | | | | |
| Dallas County TX Hospital District Limited Tax | | 5.00 | 8-15-2030 | 625,000 | 696,281 |
| | | | | | 1,071,626 |
| Virginia: 1.49% | | | | | |
| Transportation revenue: 1.49% | | | | | |
| Virginia Small Business Financing Authority AMT 95 Express Lanes LLC Project | | 5.00 | 7-1-2049 | 375,000 | 389,040 |
| Washington: 5.96% | | | | | |
| Education revenue: 0.68% | | | | | |
| Washington HEFAR Seattle University Project | | 5.00 | 5-1-2027 | 145,000 | 177,495 |
| GO revenue: 2.90% | | | | | |
| King County WA Public Hospital District #1 Valley Medical Center Refunding Bonds | | 5.00 | 12-1-2026 | 625,000 | 755,638 |
| Utilities revenue: 2.38% | | | | | |
| Chelan County WA Public Utility District #001 Consolidated Revenue Refunding Bonds Governmental Series A | | 4.00 | 7-1-2036 | 500,000 | 620,950 |
| | | | | | 1,554,083 |
| Total Municipal obligations (Cost $24,349,651) | | | | | 25,734,238 |
| | | Yield | | Shares | |
| Short-term investments: 0.51% | | | | | |
| Investment companies: 0.51% | | | | | |
| Wells Fargo Municipal Cash Management Money Market Fund Institutional Class ♠∞ | | 0.01% | | 132,683 | 132,723 |
| Total Short-term investments (Cost $132,708) | | | | | 132,723 |
| Total investments in securities (Cost $24,482,359) | 99.28% | | | | 25,866,961 |
| Other assets and liabilities, net | 0.72 | | | | 186,973 |
| Total net assets | 100.00% | | | | $ 26,053,934 |
| 144A | The security may be resold in transactions exempt from registration, normally to qualified institutional buyers, pursuant to Rule 144A under the Securities Act of 1933. |
| ¤ | The security is issued in zero coupon form with no periodic interest payments. |
| ♠ | The issuer of the security is an affiliated person of the Fund as defined in the Investment Company Act of 1940. |
| ∞ | The rate represents the 7-day annualized yield at period end. |
The accompanying notes are an integral part of these financial statements.
Wells Fargo Municipal Sustainability Fund | 11
Portfolio of investments—December 31, 2020 (unaudited)
| Abbreviations: |
| AGM | Assured Guaranty Municipal |
| Ambac | Ambac Financial Group Incorporated |
| AMT | Alternative minimum tax |
| BAM | Build America Mutual Assurance Company |
| BAN | Bond anticipation notes |
| CAB | Capital appreciation bond |
| ECFA | Educational & Cultural Facilities Authority |
| EDA | Economic Development Authority |
| GO | General obligation |
| HEFAR | Higher Education Facilities Authority Revenue |
| HFA | Housing Finance Authority |
| IDA | Industrial Development Authority |
| MFHR | Multifamily housing revenue |
| RDA | Redevelopment Authority |
Investments in affiliates
An affiliated investment is an investment in which the Fund owns at least 5% of the outstanding voting shares of the issuer or as a result of other relationships, such as the Fund and the issuer having the same investment manager. Transactions with issuers that were either affiliated persons of the Fund at the beginning of the period or the end of the period were as follows:
| | Value,
beginning of
period | Purchases | Sales
proceeds | Net
realized
gains
(losses) | Net
change in
unrealized
gains
(losses) | Value,
end of
period | % of
net
assets | Shares,
end
of period | Income
from
affiliated
securities |
| Short-term investments | | | | | | | | | |
| Investment companies | | | | | | | | | |
| Wells Fargo Municipal Cash Management Money Market Fund Institutional Class | $315,780 | $1,529,963 | $(1,713,025) | $(5) | $10 | $132,723 | 0.51% | 132,683 | $46 |
The accompanying notes are an integral part of these financial statements.
12 | Wells Fargo Municipal Sustainability Fund
Statement of assets and liabilities—December 31, 2020 (unaudited)
| | |
| Assets | |
Investments in unaffiliated securities, at value (cost $24,349,651)
| $ 25,734,238 |
Investments in affiliated securites, at value (cost $132,708)
| 132,723 |
Receivable for interest
| 311,147 |
Receivable from manager
| 24,755 |
Prepaid expenses and other assets
| 44,627 |
Total assets
| 26,247,490 |
| Liabilities | |
Professional fees payable
| 83,806 |
Dividends payable
| 45,101 |
Shareholder report expenses payable
| 44,733 |
Administration fees payable
| 1,095 |
Distribution fee payable
| 725 |
Trustees’ fees and expenses payable
| 65 |
Payable for Fund shares redeemed
| 6 |
Accrued expenses and other liabilities
| 18,025 |
Total liabilities
| 193,556 |
Total net assets
| $26,053,934 |
| Net assets consist of | |
Paid-in capital
| $ 25,036,943 |
Total distributable earnings
| 1,016,991 |
Total net assets
| $26,053,934 |
| Computation of net asset value and offering price per share | |
Net assets – Class A
| $ 1,071,191 |
Shares outstanding – Class A1
| 51,466 |
Net asset value per share – Class A
| $20.81 |
Maximum offering price per share – Class A2
| $21.79 |
Net assets – Class C
| $ 1,040,549 |
Shares outstanding – Class C1
| 50,000 |
Net asset value per share – Class C
| $20.81 |
Net assets – Class R6
| $ 21,854,233 |
Shares outstanding – Class R61
| 1,050,000 |
Net asset value per share – Class R6
| $20.81 |
Net assets – Administrator Class
| $ 1,040,674 |
Shares outstanding – Administrator Class1
| 50,000 |
Net asset value per share – Administrator Class
| $20.81 |
Net assets – Institutional Class
| $ 1,047,287 |
Shares outstanding – Institutional Class1
| 50,318 |
Net asset value per share – Institutional Class
| $20.81 |
| 1 | The Fund has an unlimited number of authorized shares |
| 2 | Maximum offering price is computed as 100/95.50 of net asset value. On investments of $50,000 or more, the offering price is reduced. |
The accompanying notes are an integral part of these financial statements.
Wells Fargo Municipal Sustainability Fund | 13
Statement of operations—six months ended December 31, 2020 (unaudited)
| | |
| Investment income | |
Interest
| $ 307,741 |
Income from affiliated securities
| 46 |
Total investment income
| 307,787 |
| Expenses | |
Management fee
| 52,704 |
| Administration fees | |
Class A
| 852 |
Class C
| 843 |
Class R6
| 3,318 |
Administrator Class
| 527 |
Institutional Class
| 423 |
| Shareholder servicing fees | |
Class A
| 1,330 |
Class C
| 1,317 |
Administrator Class
| 1,317 |
| Distribution fee | |
Class C
| 3,950 |
Custody and accounting fees
| 6,661 |
Professional fees
| 70,018 |
Registration fees
| 41,499 |
Shareholder report expenses
| 46,750 |
Trustees’ fees and expenses
| 9,990 |
Other fees and expenses
| 9,478 |
Total expenses
| 250,977 |
| Less: Fee waivers and/or expense reimbursements | |
Fund-level
| (188,350) |
Class A
| (162) |
Class C
| (157) |
Administrator Class
| (631) |
Net expenses
| 61,677 |
Net investment income
| 246,110 |
| Realized and unrealized gains (losses) on investments | |
| Net realized gains (losses) on | |
Unaffiliated securities
| 12,287 |
Affiliated securities
| (5) |
Net realized gains on investments
| 12,282 |
| Net change in unrealized gains (losses) on | |
Unaffiliated securities
| 566,422 |
Affiliated securities
| 10 |
Net change in unrealized gains (losses) on investments
| 566,432 |
Net realized and unrealized gains (losses) on investments
| 578,714 |
Net increase in net assets resulting from operations
| $ 824,824 |
The accompanying notes are an integral part of these financial statements.
14 | Wells Fargo Municipal Sustainability Fund
Statement of changes in net assets
| | |
| | Six months ended
December 31, 2020
(unaudited) | Year ended
June 30, 20201 |
| Operations | | | | |
Net investment income
| | $ 246,110 | | $ 148,500 |
Net realized gains (losses) on investments
| | 12,282 | | (378,568) |
Net change in unrealized gains (losses) on investments
| | 566,432 | | 818,170 |
Net increase in net assets resulting from operations
| | 824,824 | | 588,102 |
| Distributions to shareholders from | | | | |
| Net investment income and net realized gains | | | | |
Class A
| | (8,382) | | (5,137) |
Class C
| | (4,339) | | (2,811) |
Class R6
| | (212,815) | | (131,738) |
Administrator Class
| | (9,080) | | (5,618) |
Institutional Class
| | (9,907) | | (6,108) |
Total distributions to shareholders
| | (244,523) | | (151,412) |
| Capital share transactions | Shares | | Shares | |
| Proceeds from shares sold | | | | |
Class A
| 2,619 | 54,206 | 50,101 | 1,002,010 |
Class C
| 0 | 0 | 50,000 | 1,000,000 |
Class R6
| 0 | 0 | 1,050,000 | 21,000,000 |
Administrator Class
| 0 | 0 | 50,000 | 1,000,000 |
Institutional Class
| 337 | 6,921 | 50,000 | 1,000,000 |
| | | 61,127 | | 25,002,010 |
| Reinvestment of distributions | | | | |
Class A
| 2 | 41 | 0 | 0 |
Institutional Class
| 2 | 35 | 0 | 0 |
| | | 76 | | 0 |
| Payment for shares redeemed | | | | |
Class A
| (1,256) | (25,844) | 0 | 0 |
Institutional Class
| (21) | (426) | 0 | 0 |
| | | (26,270) | | 0 |
Net increase in net assets resulting from capital share transactions
| | 34,933 | | 25,002,010 |
Total increase in net assets
| | 615,234 | | 25,438,700 |
| Net assets | | | | |
Beginning of period
| | 25,438,700 | | 0 |
End of period
| | $26,053,934 | | $25,438,700 |
| 1 | For the period from February 28, 2020 (commencement of operations) to June 30, 2020. |
The accompanying notes are an integral part of these financial statements.
Wells Fargo Municipal Sustainability Fund | 15
Financial highlights
(For a share outstanding throughout each period)
| | | Year ended June 30 |
| Class A | Six months ended
December 31, 2020
(unaudited) | 2020 1 |
Net asset value, beginning of period
| $20.35 | $20.00 |
Net investment income
| 0.17 | 0.10 |
Net realized and unrealized gains (losses) on investments
| 0.46 | 0.35 |
Total from investment operations
| 0.63 | 0.45 |
| Distributions to shareholders from | | |
Net investment income
| (0.17) | (0.10) |
Net asset value, end of period
| $20.81 | $20.35 |
Total return2
| 3.07% | 2.27% |
| Ratios to average net assets (annualized) | | |
Gross expenses
| 2.21% | 2.26% |
Net expenses
| 0.75% | 0.75% |
Net investment income
| 1.59% | 1.52% |
| Supplemental data | | |
Portfolio turnover rate
| 9% | 32% |
Net assets, end of period (000s omitted)
| $1,071 | $1,020 |
| 1 | For the period from February 28, 2020 (commencement of class operations) to June 30, 2020 |
| 2 | Total return calculations do not include any sales charges. Returns for periods of less than one year are not annualized. |
The accompanying notes are an integral part of these financial statements.
16 | Wells Fargo Municipal Sustainability Fund
Financial highlights
(For a share outstanding throughout each period)
| | | Year ended June 30 |
| Class C | Six months ended
December 31, 2020
(unaudited) | 2020 1 |
Net asset value, beginning of period
| $20.35 | $20.00 |
Net investment income
| 0.09 | 0.05 |
Net realized and unrealized gains (losses) on investments
| 0.46 | 0.36 |
Total from investment operations
| 0.55 | 0.41 |
| Distributions to shareholders from | | |
Net investment income
| (0.09) | (0.06) |
Net asset value, end of period
| $20.81 | $20.35 |
Total return2
| 2.68% | 2.04% |
| Ratios to average net assets (annualized) | | |
Gross expenses
| 2.96% | 3.01% |
Net expenses
| 1.50% | 1.50% |
Net investment income
| 0.84% | 0.78% |
| Supplemental data | | |
Portfolio turnover rate
| 9% | 32% |
Net assets, end of period (000s omitted)
| $1,041 | $1,017 |
| 1 | For the period from February 28, 2020 (commencement of class operations) to June 30, 2020 |
| 2 | Total return calculations do not include any sales charges. Returns for periods of less than one year are not annualized. |
The accompanying notes are an integral part of these financial statements.
Wells Fargo Municipal Sustainability Fund | 17
Financial highlights
(For a share outstanding throughout each period)
| | | Year ended June 30 |
| Class R6 | Six months ended
December 31, 2020
(unaudited) | 2020 1 |
Net asset value, beginning of period
| $20.35 | $20.00 |
Net investment income
| 0.20 | 0.13 2 |
Net realized and unrealized gains (losses) on investments
| 0.46 | 0.35 |
Total from investment operations
| 0.66 | 0.48 |
| Distributions to shareholders from | | |
Net investment income
| (0.20) | (0.13) |
Net asset value, end of period
| $20.81 | $20.35 |
Total return3
| 3.25% | 2.39% |
| Ratios to average net assets (annualized) | | |
Gross expenses
| 1.83% | 1.88% |
Net expenses
| 0.40% | 0.40% |
Net investment income
| 1.94% | 1.87% |
| Supplemental data | | |
Portfolio turnover rate
| 9% | 32% |
Net assets, end of period (000s omitted)
| $21,854 | $21,367 |
| 1 | For the period from February 28, 2020 (commencement of class operations) to June 30, 2020 |
| 2 | Calculated based upon average shares outstanding |
| 3 | Returns for periods of less than one year are not annualized. |
The accompanying notes are an integral part of these financial statements.
18 | Wells Fargo Municipal Sustainability Fund
Financial highlights
(For a share outstanding throughout each period)
| | | Year ended June 30 |
| Administrator Class | Six months ended
December 31, 2020
(unaudited) | 2020 1 |
Net asset value, beginning of period
| $20.35 | $20.00 |
Net investment income
| 0.18 | 0.11 |
Net realized and unrealized gains (losses) on investments
| 0.46 | 0.35 |
Total from investment operations
| 0.64 | 0.46 |
| Distributions to shareholders from | | |
Net investment income
| (0.18) | (0.11) |
Net asset value, end of period
| $20.81 | $20.35 |
Total return2
| 3.15% | 2.32% |
| Ratios to average net assets (annualized) | | |
Gross expenses
| 2.15% | 2.20% |
Net expenses
| 0.60% | 0.60% |
Net investment income
| 1.74% | 1.67% |
| Supplemental data | | |
Portfolio turnover rate
| 9% | 32% |
Net assets, end of period (000s omitted)
| $1,041 | $1,017 |
| 1 | For the period from February 28, 2020 (commencement of class operations) to June 30, 2020 |
| 2 | Returns for periods of less than one year are not annualized. |
The accompanying notes are an integral part of these financial statements.
Wells Fargo Municipal Sustainability Fund | 19
Financial highlights
(For a share outstanding throughout each period)
| | | Year ended June 30 |
| Institutional Class | Six months ended
December 31, 2020
(unaudited) | 2020 1 |
Net asset value, beginning of period
| $20.35 | $20.00 |
Net investment income
| 0.20 | 0.12 |
Net realized and unrealized gains (losses) on investments
| 0.46 | 0.35 |
Total from investment operations
| 0.66 | 0.47 |
| Distributions to shareholders from | | |
Net investment income
| (0.20) | (0.12) |
Net asset value, end of period
| $20.81 | $20.35 |
Total return2
| 3.23% | 2.37% |
| Ratios to average net assets (annualized) | | |
Gross expenses
| 1.88% | 1.93% |
Net expenses
| 0.45% | 0.45% |
Net investment income
| 1.89% | 1.82% |
| Supplemental data | | |
Portfolio turnover rate
| 9% | 32% |
Net assets, end of period (000s omitted)
| $1,047 | $1,017 |
| 1 | For the period from February 28, 2020 (commencement of class operations) to June 30, 2020 |
| 2 | Returns for periods of less than one year are not annualized. |
The accompanying notes are an integral part of these financial statements.
20 | Wells Fargo Municipal Sustainability Fund
Notes to financial statements (unaudited)
1. ORGANIZATION
Wells Fargo Funds Trust (the “Trust”), a Delaware statutory trust organized on March 10, 1999, is an open-end management investment company registered under the Investment Company Act of 1940, as amended (the “1940 Act”). As an investment company, the Trust follows the accounting and reporting guidance in Financial Accounting Standards Board (“FASB”) Accounting Standards Codification Topic 946, Financial Services – Investment Companies. These financial statements report on the Wells Fargo Municipal Sustainability Fund (the “Fund”) which is a diversified series of the Trust.
2. SIGNIFICANT ACCOUNTING POLICIES
The following significant accounting policies, which are consistently followed in the preparation of the financial statements of the Fund, are in conformity with U.S. generally accepted accounting principles which require management to make estimates and assumptions that affect the reported amounts of assets and liabilities, disclosure of contingent assets and liabilities at the date of the financial statements, and the reported amounts of income and expenses during the reporting period. Actual results could differ from those estimates.
Securities valuation
All investments are valued each business day as of the close of regular trading on the New York Stock Exchange (generally 4 p.m. Eastern Time), although the Fund may deviate from this calculation time under unusual or unexpected circumstances.
Debt securities are valued at the evaluated bid price provided by an independent pricing service (e.g. taking into account various factors, including yields, maturities, or credit ratings) or, if a reliable price is not available, the quoted bid price from an independent broker-dealer.
Investments in registered open-end investment companies are valued at net asset value.
Investments which are not valued using any of the methods discussed above are valued at their fair value, as determined in good faith by the Board of Trustees of the Fund. The Board of Trustees has established a Valuation Committee comprised of the Trustees and has delegated to it the authority to take any actions regarding the valuation of portfolio securities that the Valuation Committee deems necessary or appropriate, including determining the fair value of portfolio securities, unless the determination has been delegated to the Wells Fargo Asset Management Pricing Committee at Wells Fargo Funds Management, LLC ("Funds Management"). The Board of Trustees retains the authority to make or ratify any valuation decisions or approve any changes to the Valuation Procedures as it deems appropriate. On a quarterly basis, the Board of Trustees receives reports on any valuation actions taken by the Valuation Committee or the Wells Fargo Asset Management Pricing Committee which may include items for ratification.
When-issued transactions
The Fund may purchase securities on a forward commitment or when-issued basis. The Fund records a when-issued transaction on the trade date and will segregate assets in an amount at least equal in value to the Fund's commitment to purchase when-issued securities. Securities purchased on a when-issued basis are marked-to-market daily and the Fund begins earning interest on the settlement date. Losses may arise due to changes in the market value of the underlying securities or if the counterparty does not perform under the contract.
Security transactions and income recognition
Securities transactions are recorded on a trade date basis. Realized gains or losses are recorded on the basis of identified cost.
Interest income is accrued daily and bond discounts are accreted and premiums are amortized daily. To the extent debt obligations are placed on non-accrual status, any related interest income may be reduced by writing off interest receivables when the collection of all or a portion of interest has been determined to be doubtful based on consistently applied procedures and the fair value has decreased. If the issuer subsequently resumes interest payments or when the collectability of interest is reasonably assured, the debt obligation is removed from non-accrual status.
Distributions to shareholders
Distributions to shareholders from net investment income are declared daily and paid monthly. Distributions from net realized gains, if any, are recorded on the ex-dividend date and paid at least annually. Such distributions are determined in accordance with income tax regulations and may differ from U.S. generally accepted accounting principles. Dividend sources are estimated at the time of declaration. The tax character of distributions is determined as of the Fund’s fiscal year end. Therefore, a portion of the Fund’s distributions made prior to the Fund’s fiscal year end may be categorized as a tax return of capital at year end.
Wells Fargo Municipal Sustainability Fund | 21
Notes to financial statements (unaudited)
Federal and other taxes
The Fund intends to continue to qualify as a regulated investment company by distributing substantially all of its investment company taxable and tax-exempt income and any net realized capital gains (after reduction for capital loss carryforwards) sufficient to relieve it from all, or substantially all, federal income taxes. Accordingly, no provision for federal income taxes was required.
The Fund’s income and federal excise tax returns and all financial records supporting those returns for the fiscal years since commencement of operations are subject to examination by the federal and Delaware revenue authorities. Management has analyzed the Fund’s tax positions taken on federal, state, and foreign tax returns for all open tax years and does not believe that there are any uncertain tax positions that require recognition of a tax liability.
As of December 31, 2020, the aggregate cost of all investments for federal income tax purposes was $24,482,359 and the unrealized gains (losses) consisted of:
| Gross unrealized gains | $1,384,602 |
| Gross unrealized losses | 0 |
| Net unrealized gains | $1,384,602 |
As of June 30, 2020, the Fund had capital loss carryforwards which consisted of $378,568 in short-term capital losses.
Class allocations
The separate classes of shares offered by the Fund differ principally in applicable sales charges, distribution, shareholder servicing, and administration fees. Class specific expenses are charged directly to that share class. Investment income, common fund-level expenses, and realized and unrealized gains (losses) on investments are allocated daily to each class of shares based on the relative proportion of net assets of each class.
3. FAIR VALUATION MEASUREMENTS
Fair value measurements of investments are determined within a framework that has established a fair value hierarchy based upon the various data inputs utilized in determining the value of the Fund’s investments. The three-level hierarchy gives the highest priority to unadjusted quoted prices in active markets for identical assets or liabilities (Level 1) and the lowest priority to unobservable inputs (Level 3). The Fund’s investments are classified within the fair value hierarchy based on the lowest level of input that is significant to the fair value measurement. The inputs are summarized into three broad levels as follows:
| ■ | Level 1 – quoted prices in active markets for identical securities |
| ■ | Level 2 – other significant observable inputs (including quoted prices for similar securities, interest rates, prepayment speeds, credit risk, etc.) |
| ■ | Level 3 – significant unobservable inputs (including the Fund’s own assumptions in determining the fair value of investments) |
The inputs or methodologies used for valuing investments in securities are not necessarily an indication of the risk associated with investing in those securities.
The following is a summary of the inputs used in valuing the Fund’s assets and liabilities as of December 31, 2020:
| | Quoted prices
(Level 1) | Other significant
observable inputs
(Level 2) | Significant
unobservable inputs
(Level 3) | Total |
| Assets | | | | |
| Investments in: | | | | |
| Municipal obligations | $ 0 | $ 25,734,238 | $0 | $ 25,734,238 |
| Short-term investments | | | | |
| Investment companies | 132,723 | 0 | 0 | 132,723 |
| Total assets | $132,723 | $25,734,238 | $0 | $25,866,961 |
Additional sector, industry or geographic detail is included in the Portfolio of Investments.
For the six months ended December 31, 2020, the Fund did not have any transfers into/out of Level 3.
22 | Wells Fargo Municipal Sustainability Fund
Notes to financial statements (unaudited)
4. TRANSACTIONS WITH AFFILIATES
Management fee
Funds Management, an indirect wholly owned subsidiary of Wells Fargo & Company (“Wells Fargo”), is the manager of the Fund and provides advisory and fund-level administrative services under an investment management agreement. Under the investment management agreement, Funds Management is responsible for, among other services, implementing the investment objectives and strategies of the Fund, supervising the subadviser and providing fund-level administrative services in connection with the Fund’s operations. As compensation for its services under the investment management agreement, Funds Management is entitled to receive a management fee at the following annual rate based on the Fund’s average daily net assets:
| Average daily net assets | Management fee |
| First $500 million | 0.400% |
| Next $500 million | 0.375 |
| Next $2 billion | 0.350 |
| Next $2 billion | 0.325 |
| Next $5 billion | 0.290 |
| Over $10 billion | 0.280 |
For the six months ended December 31, 2020, the management fee was equivalent to an annual rate of 0.40% of the Fund’s average daily net assets.
Funds Management has retained the services of a subadviser to provide daily portfolio management to the Fund. The fee for subadvisory services is borne by Funds Management. Wells Capital Management, Incorporated, an affiliate of Funds Management and an indirect wholly owned subsidiary of Wells Fargo, is the subadviser to the Fund and is entitled to receive a fee from Funds Management at an annual rate starting at 0.20% and declining to 0.10% as the average daily net assets of the Fund increase.
Administration fees
Under a class-level administration agreement, Funds Management provides class-level administrative services to the Fund, which includes paying fees and expenses for services provided by the transfer agent, sub-transfer agents, omnibus account servicers and record-keepers. As compensation for its services under the class-level administration agreement, Funds Management receives an annual fee which is calculated based on the average daily net assets of each class as follows:
| | Class-level
administration fee |
| Class A | 0.16% |
| Class C | 0.16 |
| Class R6 | 0.03 |
| Administrator Class | 0.10 |
| Institutional Class | 0.08 |
Waivers and/or expense reimbursements
Funds Management has contractually waived and/or reimbursed management and administration fees to the extent necessary to maintain certain net operating expense ratios for the Fund. When each class of the Fund has exceeded its expense cap, Funds Management has waived fees and/or reimbursed expenses from fund-level expenses on a proportionate basis and then from class specific expenses. When only certain classes exceed their expense caps, waivers and/or reimbursements are applied against class specific expenses before fund-level expenses. Funds Management has committed through October 31, 2021 to waive fees and/or reimburse expenses to the extent necessary to cap the Fund’s expenses at 0.75% for Class A shares, 1.50% for Class C shares, 0.40% for Class R6 shares, 0.60% for Administrator Class shares, and 0.45% for Institutional Class shares. Prior to or after the commitment expiration date, the cap may be increased or the commitment to maintain the cap may be terminated only with the approval of the Board of Trustees.
Wells Fargo Municipal Sustainability Fund | 23
Notes to financial statements (unaudited)
Distribution fee
The Trust has adopted a distribution plan for Class C shares of the Fund pursuant to Rule 12b-1 under the 1940 Act. A distribution fee is charged charged to Class C shares and paid to Wells Fargo Funds Distributor, LLC (“Funds Distributor”), the principal underwriter, at an annual rate of 0.75% of the average daily net assets of Class C shares.
In addition, Funds Distributor is entitled to receive the front-end sales charge from the purchase of Class A shares and a contingent deferred sales charge on the redemption of certain Class A shares. Funds Distributor is also entitled to receive the contingent deferred sales charges from redemptions of Class C shares. Funds Distributor did not receive any front-end or contingent deferred sales charges from Class A and Class C shares for the six months ended December 31, 2020.
Shareholder servicing fees
The Trust has entered into contracts with one or more shareholder servicing agents, whereby Class A, Class C, and Administrator Class of the Fund are charged a fee at an annual rate of 0.25% of the average daily net assets of each respective class. A portion of these total shareholder servicing fees were paid to affiliates of Wells Fargo.
Interfund transactions
The Fund may purchase or sell portfolio investment securities to certain other Wells Fargo affiliates pursuant to Rule 17a-7 under the 1940 Act and under procedures adopted by the Board of Trustees. The procedures have been designed to ensure that these interfund transactions, which do not incur broker commissions, are effected at current market prices. Pursuant to these procedures, the Fund had $0, $1,003,810 and $890 in interfund purchases, sales and net realized gains (losses), respectively, during the six months ended December 31, 2020.
5. INVESTMENT PORTFOLIO TRANSACTIONS
Purchases and sales of investments, excluding U.S. government obligations (if any) and short-term securities, for the six months ended December 31, 2020 were $2,466,624 and $2,203,560, respectively.
6. INDEMNIFICATION
Under the Fund's organizational documents, the officers and Trustees have been granted certain indemnification rights against certain liabilities that may arise out of performance of their duties to the Fund. The Fund has entered into a separate agreement with each Trustee that converts indemnification rights currently existing under the Fund’s organizational documents into contractual rights that cannot be changed in the future without the consent of the Trustee. Additionally, in the normal course of business, the Fund may enter into contracts with service providers that contain a variety of indemnification clauses. The Fund’s maximum exposure under these arrangements is dependent on future claims that may be made against the Fund and, therefore, cannot be estimated.
7. SUBSEQUENT EVENT
On February 23, 2021, Wells Fargo announced that it has entered into a definitive agreement to sell Wells Fargo Asset Management (“WFAM”) to GTCR LLC and Reverence Capital Partners, L.P. WFAM is the trade name used by the asset management businesses of Wells Fargo and includes Wells Fargo Funds Management, LLC, the investment manager to the Fund, Wells Capital Management Incorporated and Wells Fargo Asset Management (International) Limited, both registered investment advisers providing sub-advisory services to certain funds, and Wells Fargo Funds Distributor, LLC, the Fund’s principal underwriter. As part of the transaction, Wells Fargo will own a 9.9% equity interest and will continue to serve as an important client and distribution partner.
Consummation of the transaction will result in the automatic termination of the Fund’s investment management agreement and sub-advisory agreement(s). The Fund’s Board of Trustees will be asked to approve new investment management arrangements with the new company. If approved by the Board, the new investment management arrangements with the new company will be presented to the shareholders of the Fund for approval, and, if approved by shareholders, would take effect upon the closing of the transaction. The transaction is expected to close in the second half of 2021, subject to customary closing conditions.
8. CORONAVIRUS (COVID-19) PANDEMIC
On March 11, 2020, the World Health Organization announced that it had made the assessment that coronavirus disease 2019 (“COVID-19”) is a pandemic. The impacts of COVID-19 are affecting the entire global economy, individual companies and investment products, and the market in general. There is significant uncertainty around the extent and duration of business disruptions related to COVID-19 and the impacts may be short term or may last for an extended period of time. The risk of further spreading of COVID-19 has led to significant uncertainty and volatility in the financial markets.
24 | Wells Fargo Municipal Sustainability Fund
Other information (unaudited)
PROXY VOTING INFORMATION
A description of the policies and procedures used to determine how to vote proxies relating to portfolio securities is available without charge, upon request, by calling 1-800-222-8222, visiting our website at wfam.com, or visiting the SEC website at sec.gov. Information regarding how the proxies related to portfolio securities were voted during the most recent 12-month period ended June 30 is available on the website at wfam.com or by visiting the SEC website at sec.gov.
QUARTERLY PORTFOLIO HOLDINGS INFORMATION
The Fund files its complete schedule of portfolio holdings with the SEC for the first and third quarters of each fiscal year as an exhibit to its reports on Form N-PORT. Shareholders may view the filed Form N-PORT by visiting the SEC website at sec.gov.
Wells Fargo Municipal Sustainability Fund | 25
Other information (unaudited)
BOARD OF TRUSTEES AND OFFICERS
Each of the Trustees and Officers1 listed in the table below acts in identical capacities for each fund in the Wells Fargo family of funds, which consists of 144 mutual funds comprising the Wells Fargo Funds Trust, Wells Fargo Variable Trust, Wells Fargo Master Trust and four closed-end funds (collectively the “Fund Complex”). This table should be read in conjunction with the Prospectus and the Statement of Additional Information2. The mailing address of each Trustee and Officer is 525 Market Street, 12th Floor, San Francisco, CA 94105. Each Trustee and Officer serves an indefinite term, however, each Trustee serves such term until reaching the mandatory retirement age established by the Trustees.
Independent Trustees
Name and
year of birth | Position held and
length of service* | Principal occupations during past five years or longer | Current other
public company or
investment
company
directorships |
William R. Ebsworth
(Born 1957) | Trustee,
since 2015 | Retired. From 1984 to 2013, equities analyst, portfolio manager, research director and chief investment officer at Fidelity Management and Research Company in Boston, Tokyo, and Hong Kong, and retired in 2013 as Chief Investment Officer of Fidelity Strategic Advisers, Inc. where he led a team of investment professionals managing client assets. Prior thereto, Board member of Hong Kong Securities Clearing Co., Hong Kong Options Clearing Corp., the Thailand International Fund, Ltd., Fidelity Investments Life Insurance Company, and Empire Fidelity Investments Life Insurance Company. Audit Committee Chair and Investment Committee Chair of the Vincent Memorial Hospital Endowment (non-profit organization). Mr. Ebsworth is a CFA® charterholder. | N/A |
Jane A. Freeman
(Born 1953) | Trustee,
since 2015;
Chair Liaison,
since 2018 | Retired. From 2012 to 2014 and 1999 to 2008, Chief Financial Officer of Scientific Learning Corporation. From 2008 to 2012, Ms. Freeman provided consulting services related to strategic business projects. Prior to 1999, Portfolio Manager at Rockefeller & Co. and Scudder, Stevens & Clark. Board member of the Harding Loevner Funds from 1996 to 2014, serving as both Lead Independent Director and chair of the Audit Committee. Board member of the Russell Exchange Traded Funds Trust from 2011 to 2012 and the chair of the Audit Committee. Ms. Freeman is also an inactive Chartered Financial Analyst. | N/A |
Isaiah Harris, Jr.
(Born 1952) | Trustee,
since 2009; Audit
Committee
Chair,
since 2019 | Retired. Chairman of the Board of CIGNA Corporation since 2009, and Director since 2005. From 2003 to 2011, Director of Deluxe Corporation. Prior thereto, President and CEO of BellSouth Advertising and Publishing Corp. from 2005 to 2007, President and CEO of BellSouth Enterprises from 2004 to 2005 and President of BellSouth Consumer Services from 2000 to 2003. Emeritus member of the Iowa State University Foundation Board of Governors. Emeritus Member of the Advisory Board of Iowa State University School of Business. Advisory Board Member, Palm Harbor Academy (private school). Mr. Harris is a certified public accountant (inactive status). | CIGNA Corporation |
Judith M. Johnson
(Born 1949) | Trustee,
since 2008 | Retired. Prior thereto, Chief Executive Officer and Chief Investment Officer of Minneapolis Employees Retirement Fund from 1996 to 2008. Ms. Johnson is an attorney, certified public accountant and a certified managerial accountant. | N/A |
David F. Larcker
(Born 1950) | Trustee,
since 2009 | James Irvin Miller Professor of Accounting at the Graduate School of Business (Emeritus), Stanford University, Director of the Corporate Governance Research Initiative and Senior Faculty of The Rock Center for Corporate Governance since 2006. From 2005 to 2008, Professor of Accounting at the Graduate School of Business, Stanford University. Prior thereto, Ernst & Young Professor of Accounting at The Wharton School, University of Pennsylvania from 1985 to 2005. | N/A |
26 | Wells Fargo Municipal Sustainability Fund
Other information (unaudited)
Name and
year of birth | Position held and
length of service* | Principal occupations during past five years or longer | Current other
public company or
investment
company
directorships |
Olivia S. Mitchell
(Born 1953) | Trustee,
since 2006;
Nominating and
Governance
Committee Chair,
since 2018 | International Foundation of Employee Benefit Plans Professor, Wharton School of the University of Pennsylvania since 1993. Director of Wharton’s Pension Research Council and Boettner Center on Pensions & Retirement Research, and Research Associate at the National Bureau of Economic Research. Previously, Cornell University Professor from 1978 to 1993. | N/A |
Timothy J. Penny
(Born 1951) | Trustee,
since 1996;
Chair,
since 2018 | President and Chief Executive Officer of Southern Minnesota Initiative Foundation, a non-profit organization, since 2007. Member of the Board of Trustees of NorthStar Education Finance, Inc., a non-profit organization, since 2007. | N/A |
James G. Polisson
(Born 1959) | Trustee,
since 2018 | Retired. Chief Marketing Officer, Source (ETF) UK Services, Ltd, from 2015 to 2017. From 2012 to 2015, Principal of The Polisson Group, LLC, a management consulting, corporate advisory and principal investing company. Chief Executive Officer and Managing Director at Russell Investments, Global Exchange Traded Funds from 2010 to 2012. Managing Director of Barclays Global Investors from 1998 to 2010 and Global Chief Marketing Officer for iShares and Barclays Global Investors from 2000 to 2010. Trustee of the San Francisco Mechanics’ Institute, a non-profit organization, from 2013 to 2015. Board member of the Russell Exchange Traded Fund Trust from 2011 to 2012. Director of Barclays Global Investors Holdings Deutschland GmbH from 2006 to 2009. Mr. Polisson is an attorney and has a retired status with the Massachusetts and District of Columbia Bar Associations. | N/A |
Pamela Wheelock
(Born 1959) | Trustee,
since January
2020; previously
Trustee from
January 2018 to
July 2019 | Board member of the Destination Medical Center Economic Development Agency, Rochester, Minnesota since 2019. Interim President of the McKnight Foundation from January to September 2020. Acting Commissioner, Minnesota Department of Human Services, July 2019 through September 2019. Human Services Manager (part-time), Minnesota Department of Human Services, October 2019 through December 2019. Chief Operating Officer, Twin Cities Habitat for Humanity from 2017 to 2019. Vice President of University Services, University of Minnesota from 2012 to 2016. Prior thereto, on the Board of Directors, Governance Committee and Finance Committee for the Minnesota Philanthropy Partners (Saint Paul Foundation) from 2012 to 2018, Interim Chief Executive Officer of Blue Cross Blue Shield of Minnesota from 2011 to 2012, Chairman of the Board from 2009 to 2012 and Board Director from 2003 to 2015. Vice President, Leadership and Community Engagement, Bush Foundation, Saint Paul, Minnesota (a private foundation) from 2009 to 2011. Executive Vice President and Chief Financial Officer, Minnesota Sports and Entertainment from 2004 to 2009 and Senior Vice President from 2002 to 2004. Executive Vice President of the Minnesota Wild Foundation from 2004 to 2008. Commissioner of Finance, State of Minnesota, from 1999 to 2002. Currently Board Chair of the Minnesota Wild Foundation since 2010. | N/A |
* Length of service dates reflect the Trustee’s commencement of service with the Trust’s predecessor entities, where applicable.
Wells Fargo Municipal Sustainability Fund | 27
Other information (unaudited)
Officers
Name and
year of birth | Position held and
length of service | Principal occupations during past five years or longer |
Andrew Owen
(Born 1960) | President,
since 2017 | Executive Vice President of Wells Fargo & Company and Head of Affiliated Managers, Wells Fargo Asset Management, since 2014. In addition, Mr. Owen is currently President, Chief Executive Officer and Director of Wells Fargo Funds Management, LLC since 2017. Prior thereto, Executive Vice President responsible for marketing, investments and product development for Wells Fargo Funds Management, LLC, from 2009 to 2014. |
Nancy Wiser1
(Born 1967) | Treasurer,
since 2012 | Executive Vice President of Wells Fargo Funds Management, LLC since 2011. Chief Operating Officer and Chief Compliance Officer at LightBox Capital Management LLC, from 2008 to 2011. |
Michelle Rhee
(Born 1966) | Chief Legal Officer,
since 2019 | Secretary of Wells Fargo Funds Management, LLC and Chief Legal Counsel of Wells Fargo Asset Management since 2018. Deputy General Counsel of Wells Fargo Bank N.A. since 2020 and Assistant General Counsel of Wells Fargo Bank, N.A. from 2018 to 2020. Associate General Counsel and Managing Director of Bank of America Corporation from 2004 to 2018. |
Catherine Kennedy
(Born 1969) | Secretary,
since 2019 | Vice President of Wells Fargo Funds Management, LLC and Senior Counsel of the Wells Fargo Legal Department since 2010. Vice President and Senior Counsel of Evergreen Investment Management Company, LLC from 1998 to 2010. |
Michael H. Whitaker
(Born 1967) | Chief Compliance Officer,
since 2016 | Chief Compliance Officer of Wells Fargo Asset Management since 2016. Senior Vice President and Chief Compliance Officer for Fidelity Investments from 2007 to 2016. |
Jeremy DePalma1
(Born 1974) | Assistant Treasurer,
since 2009 | Senior Vice President of Wells Fargo Funds Management, LLC since 2009. Senior Vice President of Evergreen Investment Management Company, LLC from 2008 to 2010 and head of the Fund Reporting and Control Team within Fund Administration from 2005 to 2010. |
1 Nancy Wiser acts as Treasurer of 67 funds in the Fund Complex. Jeremy DePalma acts as the Treasurer of 77 funds and Assistant Treasurer of 67 funds in the Fund Complex.
2 The Statement of Additional Information includes additional information about the Trustees and is available, without charge, upon request, by calling 1-800-222-8222 or by visiting the website at wfam.com.
28 | Wells Fargo Municipal Sustainability Fund
For more information
More information about Wells Fargo Funds is available free upon request. To obtain literature, please write, visit the Fund's website, or call:
Wells Fargo Funds
P.O. Box 219967
Kansas City, MO 64121-9967
Website: wfam.com
Individual investors: 1-800-222-8222
Retail investment professionals: 1-888-877-9275
Institutional investment professionals: 1-866-765-0778
This report and the financial statements contained herein are submitted for the general information of the shareholders of the Fund. If this report is used for promotional purposes, distribution of the report must be accompanied or preceded by a current prospectus. Before investing, please consider the investment objectives, risks, charges, and expenses of the investment. For a current prospectus and, if available, a summary prospectus, containing this information, call 1-800-222-8222 or visit the Fund’s website at wfam.com. Read the prospectus carefully before you invest or send money.
Wells Fargo Asset Management (WFAM) is the trade name for certain investment advisory/management firms owned by Wells Fargo & Company. These firms include but are not limited to Wells Capital Management Incorporated and Wells Fargo Funds Management, LLC. Certain products managed by WFAM entities are distributed by Wells Fargo Funds Distributor, LLC (a broker-dealer and Member FINRA).
This material is for general informational and educational purposes only and is NOT intended to provide investment advice or a recommendation of any kind— including a recommendation for any specific investment, strategy, or plan.
INVESTMENT PRODUCTS: NOT FDIC INSURED ■ NO BANK GUARANTEE ■ MAY LOSE VALUE
© 2021 Wells Fargo & Company. All rights reserved.
PAR-0121-00280 02-21
SA297/SAR297 12-20
Semi-Annual Report
December 31, 2020
Wells Fargo
Pennsylvania Tax-Free Fund
Reduce clutter.
Save trees.
Sign up for electronic delivery of prospectuses and shareholder reports at wellsfargo.com/ advantagedelivery
The views expressed and any forward-looking statements are as of December 31, 2020, unless otherwise noted, and are those of the Fund's portfolio managers and/or Wells Fargo Asset Management. Discussions of individual securities or the markets generally are not intended as individual recommendations. Future events or results may vary significantly from those expressed in any forward-looking statements. The views expressed are subject to change at any time in response to changing circumstances in the market. Wells Fargo Asset Management and the Fund disclaim any obligation to publicly update or revise any views expressed or forward-looking statements.
INVESTMENT PRODUCTS: NOT FDIC INSURED ■ NO BANK GUARANTEE ■ MAY LOSE VALUE
Wells Fargo Pennsylvania Tax-Free Fund | 1
Letter to shareholders (unaudited)
Dear Shareholder:
We are pleased to offer you this semi-annual report for the Wells Fargo Pennsylvania Tax-Free Fund for the six-month period that ended December 31, 2020. Despite a deeply challenging year, dominated by the spread of COVID-19 cases and a sharp drop in economic output throughout much of the world, global stocks performed extremely well, benefiting from ongoing central bank support and rising optimism over the development and distribution of effective COVID-19 vaccines. Bonds also had positive returns, led by global bonds and high-yield bonds.
For the six-month period, U.S. stocks, based on the S&P 500 Index,1 gained 22.16%. International stocks, as measured by the MSCI ACWI ex USA Index (Net),2 returned 24.33%, while the MSCI EM Index (Net),3 had even stronger performance, with a 31.14% gain. Among bond indexes, the Bloomberg Barclays U.S. Aggregate Bond Index,4 returned 1.29%, the Bloomberg Barclays Global Aggregate ex-USD Index (unhedged),5 gained 9.44%, and the Bloomberg Barclays Municipal Bond Index,6 returned 3.07% while the ICE BofA U.S. High Yield Index,7 gained a hefty 11.49%.
The stock market rally continued in July.
After a volatile first half of the year, an existing stock market rally continued in July with strong results for equities and fixed income. However, economic data and a resurgence of COVID-19 cases underscored the urgent need to regain control of the pandemic. Second-quarter gross domestic product (GDP) shrank from the previous quarter by 9.5% and 12.1% in the U.S. and the eurozone, respectively. In contrast, China’s second-quarter GDP grew 3.2% year over year. The U.S. economy added 1.8 million jobs in July, but a double-digit jobless rate persisted.
The stock market continued to rally in August despite concerns over rising numbers of U.S. and European COVID-19 cases as well as the expiration of the $600 weekly bonus unemployment benefit in July. Relatively strong second-quarter earnings boosted investor sentiment along with the U.S. Federal Reserve’s announcement of a monetary policy shift expected to support longer-term low interest rates. U.S. manufacturing and services activity indexes beat expectations, while the U.S. housing market maintained strength. In Europe, retail sales expanded and consumer confidence was steady. China’s economy continued to expand.
Andrew Owen
President
Wells Fargo Funds
“After a volatile first half of the year, an existing stock market rally continued in July with strong results for equities and fixed income.”
| 1 | The S&P 500 Index consists of 500 stocks chosen for market size, liquidity, and industry group representation. It is a market-value-weighted index with each stock's weight in the index proportionate to its market value. You cannot invest directly in an index. |
| 2 | The Morgan Stanley Capital International (MSCI) All Country World Index (ACWI) ex USA Index (Net) is a free-float-adjusted market-capitalization-weighted index that is designed to measure the equity market performance of developed and emerging markets, excluding the United States. Source: MSCI. MSCI makes no express or implied warranties or representations and shall have no liability whatsoever with respect to any MSCI data contained herein. The MSCI data may not be further redistributed or used as a basis for other indices or any securities or financial products. This report is not approved, reviewed, or produced by MSCI. You cannot invest directly in an index. |
| 3 | The MSCI Emerging Markets (EM) Index (Net) is a free-float-adjusted market-capitalization-weighted index that is designed to measure equity market performance of emerging markets. You cannot invest directly in an index. |
| 4 | The Bloomberg Barclays U.S. Aggregate Bond Index is a broad-based benchmark that measures the investment-grade, U.S. dollar-denominated, fixed-rate taxable bond market, including Treasuries, government-related and corporate securities, mortgage-backed securities (agency fixed-rate and hybrid adjustable-rate mortgage pass-throughs), asset-backed securities, and commercial mortgage-backed securities. You cannot invest directly in an index. |
| 5 | The Bloomberg Barclays Global Aggregate ex-USD Index (unhedged) is an unmanaged index that provides a broad-based measure of the global investment-grade fixed-income markets excluding the U.S. dollar-denominated debt market. You cannot invest directly in an index. |
| 6 | The Bloomberg Barclays Municipal Bond Index is an unmanaged index composed of long-term tax-exempt bonds with a minimum credit rating of Baa. You cannot invest directly in an index. |
| 7 | The ICE BofA U.S. High Yield Index is a market-capitalization-weighted index of domestic and Yankee high-yield bonds. The index tracks the performance of high-yield securities traded in the U.S. bond market. You cannot invest directly in an index. Copyright 2021. ICE Data Indices, LLC. All rights reserved. |
2 | Wells Fargo Pennsylvania Tax-Free Fund
Letter to shareholders (unaudited)
Stocks grew more volatile in September on mixed economic data. U.S. economic activity continued to grow. However, U.S. unemployment remained elevated at 7.9% in September. With U.S. Congress delaying further fiscal relief and uncertainties surrounding a possible vaccine, doubts crept back into the financial markets. In the U.K., a lack of progress in Brexit talks weighed on markets. China’s economy picked up steam, fueled by increased global demand.
In October, capital markets stepped back from their six-month rally. Market volatility rose in advance of the U.S. election and amid a global increase in COVID-19 infections. Europe introduced tighter restrictions affecting economic activity. U.S. markets looked favorably at the prospect of Democratic control of the federal purse strings, which could lead to additional fiscal stimulus and a boost to economic activity. Meanwhile, China reported 4.9% third-quarter GDP growth.
Global stocks rallied in November, propelled by optimism over three promising COVID-19 vaccines. Reversing recent trends, value stocks outperformed growth stocks and cyclical stocks outpaced technology stocks. However, U.S. unemployment remained elevated, with a net job loss of 10 million since February. The eurozone services Purchasing Managers’ Index, a monthly survey of purchasing managers, contracted sharply while the region’s manufacturing activity grew. The U.S. election results added to the upbeat mood as investors anticipated more consistent policies in the new administration.
Financial markets ended the year with strength on high expectations for a rapid rollout of the COVID-19 vaccines, the successful passage of a $900 billion stimulus package, and rising expectations of additional economic support from a Democratic-led Congress. U.S. economic data were mixed with still-elevated unemployment and weak retail sales but growth in manufacturing output. In contrast, China’s economic expansion continued in both manufacturing and nonmanufacturing. U.S. COVID-19 infection rates continued to rise even as new state and local lockdown measures were implemented.
Don’t let short-term uncertainty derail long-term investment goals.
Periods of investment uncertainty can present challenges, but experience has taught us that maintaining long-term investment goals can be an effective way to plan for the future. To help you create a sound strategy based on your personal goals and risk tolerance, Wells Fargo Funds offers more than 100 mutual funds spanning a wide range of asset classes and investment styles. Although diversification cannot guarantee an investment profit or prevent losses, we believe it can be an effective way to manage investment risk and potentially smooth out overall portfolio performance. We encourage investors to know their investments and to understand that appropriate levels of risk-taking may unlock opportunities.
Thank you for choosing to invest with Wells Fargo Funds. We appreciate your confidence in us and remain committed to helping you meet your financial needs.
Sincerely,
Andrew Owen
President
Wells Fargo Funds
For further information about your Fund, contact your investment professional, visit our website at wfam.com, or call us directly at 1-800-222-8222.
Wells Fargo Pennsylvania Tax-Free Fund | 3
Performance highlights (unaudited)
Investment objective
The Fund seeks current income exempt from federal income tax and Pennsylvania individual income tax.
Manager
Wells Fargo Funds Management, LLC
Subadviser
Wells Capital Management Incorporated
Portfolio managers
Bruce R. Johns
Kerry Laurin*
Robert J. Miller
Average annual total returns (%) as of December 31, 2020
| | | Including sales charge | | Excluding sales charge | | Expense ratios1 (%) |
| | Inception date | 1 year | 5 year | 10 year | | 1 year | 5 year | 10 year | | Gross | Net 2 |
| Class A (EKVAX) | 12-27-1990 | -1.05 | 2.21 | 4.09 | | 3.64 | 3.15 | 4.57 | | 0.97 | 0.74 |
| Class C (EKVCX) | 2-1-1993 | 1.77 | 2.37 | 3.78 | | 2.77 | 2.37 | 3.78 | | 1.72 | 1.49 |
| Institutional Class (EKVYX) | 11-24-1997 | – | – | – | | 3.89 | 3.41 | 4.83 | | 0.64 | 0.49 |
| Bloomberg Barclays Municipal Bond Index3 | – | – | – | – | | 5.21 | 3.91 | 4.63 | | – | – |
| Bloomberg Barclays Pennsylvania Municipal Bond Index4 | – | – | – | – | | 5.43 | 4.24 | 4.88 | | – | – |
Figures quoted represent past performance, which is no guarantee of future results, and do not reflect taxes that a shareholder may pay on an investment in a fund. Investment return and principal value of an investment will fluctuate so that an investor’s shares, when redeemed, may be worth more or less than their original cost. Performance shown without sales charges would be lower if sales charges were reflected. Current performance may be lower or higher than the performance data quoted, which assumes the reinvestment of dividends and capital gains. Current month-end performance is available on the Fund’s website, wfam.com.
Index returns do not include transaction costs associated with buying and selling securities, any mutual fund fees or expenses, or any taxes. It is not possible to invest directly in an index.
For Class A shares, the maximum front-end sales charge is 4.50%. For Class C shares, the maximum contingent deferred sales charge is 1.00%. Performance including a contingent deferred sales charge assumes the sales charge for the corresponding time period. Institutional Class shares are sold without a front-end sales charge or contingent deferred sales charge.
Bond values fluctuate in response to the financial condition of individual issuers, general market and economic conditions, and changes in interest rates. Changes in market conditions and government policies may lead to periods of heightened volatility in the bond market and reduced liquidity for certain bonds held by the Fund. In general, when interest rates rise, bond values fall and investors may lose principal value. Interest rate changes and their impact on the fund and its share price can be sudden and unpredictable. The use of derivatives may reduce returns and/or increase volatility. Certain investment strategies tend to increase the total risk of an investment (relative to the broader market). The Fund is exposed to Pennsylvania municipal securities risk and high-yield securities risk. Consult the Fund’s prospectus for additional information on these and other risks. A portion of the Fund’s income may be subject to federal, state, and/or local income taxes or the Alternative Minimum Tax (AMT). Any capital gains distributions may be taxable.
Please see footnotes on page 5.
4 | Wells Fargo Pennsylvania Tax-Free Fund
Performance highlights (unaudited)
| Effective maturity distribution as of December 31, 20205 |
| Credit quality as of December 31, 20206 |
| * | Ms. Laurin became a portfolio manager of the Fund on September 1, 2020. |
| 1 | Reflects the expense ratios as stated in the most recent prospectuses. The expense ratios shown are subject to change and may differ from the annualized expense ratios shown in the financial highlights of this report. |
| 2 | The manager has contractually committed through October 31, 2021, to waive fees and/or reimburse expenses to the extent necessary to cap total annual fund operating expenses after fee waivers at 0.74% for Class A, 1.49% for Class C, and 0.49% for Institutional Class. Brokerage commissions, stamp duty fees, interest, taxes, acquired fund fees and expenses (if any), and extraordinary expenses are excluded from the expense caps. Prior to or after the commitment expiration date, the caps may be increased or the commitment to maintain the caps may be terminated only with the approval of the Board of Trustees. Without these caps, the Fund’s returns would have been lower. The expense ratio paid by an investor is the net expense ratio (the total annual fund operating expenses after fee waivers) as stated in the prospectuses. |
| 3 | The Bloomberg Barclays Municipal Bond Index is an unmanaged index composed of long-term tax-exempt bonds with a minimum credit rating of Baa. You cannot invest directly in an index. |
| 4 | The Bloomberg Barclays Pennsylvania Municipal Bond Index is a Pennsylvania-specific total return index. The index is composed of Pennsylvania bonds. The bonds are all investment-grade, fixed-rate, long-term maturities (greater than two years) and are selected from issues larger than $50 million dated since January 1984. Bonds are added to the index and weighted and updated monthly, with a one-month lag. You cannot invest directly in an index. |
| 5 | Figures represent the percentage of the Fund's long-term investments. These amounts are subject to change and may have changed since the date specified. |
| 6 | The credit quality distribution of portfolio holdings reflected in the chart is based on ratings from Standard & Poor’s, Moody’s Investors Service, and/ or Fitch Ratings Ltd. Credit quality ratings apply to the underlying holdings of the Fund and not to the Fund itself. The percentages of the Fund’s portfolio with the ratings depicted in the chart are calculated based on the total market value of fixed income securities held by the Fund. If a security was rated by all three rating agencies, the middle rating was utilized. If rated by two of three rating agencies, the lower rating was utilized, and if rated by one of the rating agencies, that rating was utilized. Standard & Poor’s rates the creditworthiness of bonds, ranging from AAA (highest) to D (lowest). Ratings from A to CCC may be modified by the addition of a plus (+) or minus (-) sign to show relative standing within the rating categories. Standard & Poor’s rates the creditworthiness of short-term notes from SP-1 (highest) to SP-3 (lowest). Moody’s rates the creditworthiness of bonds, ranging from Aaa (highest) to C (lowest). Ratings Aa to B may be modified by the addition of a number 1 (highest) to 3 (lowest) to show relative standing within the ratings categories. Moody’s rates the creditworthiness of short-term U.S. tax-exempt municipal securities from MIG 1/VMIG 1 (highest) to SG (lowest). Fitch rates the creditworthiness of bonds, ranging from AAA (highest) to D (lowest). Credit quality distribution is subject to change and may have changed since the date specified. |
Wells Fargo Pennsylvania Tax-Free Fund | 5
Fund expenses (unaudited)
As a shareholder of the Fund, you incur two types of costs: (1) transaction costs, including sales charges (loads) on purchase payments and contingent deferred sales charges (if any) on redemptions and (2) ongoing costs, including management fees, distribution (12b-1) and/or shareholder servicing fees, and other Fund expenses. This example is intended to help you understand your ongoing costs (in dollars) of investing in the Fund and to compare these costs with the ongoing costs of investing in other mutual funds.
The example is based on an investment of $1,000 invested at the beginning of the six-month period and held for the entire period from July 1, 2020 to December 31, 2020.
Actual expenses
The “Actual” line of the table below provides information about actual account values and actual expenses. You may use the information in this line, together with the amount you invested, to estimate the expenses that you paid over the period. Simply divide your account value by $1,000 (for example, an $8,600 account value divided by $1,000 = 8.6), then multiply the result by the number in the “Actual” line under the heading entitled “Expenses paid during period” for your applicable class of shares to estimate the expenses you paid on your account during this period.
Hypothetical example for comparison purposes
The “Hypothetical” line of the table below provides information about hypothetical account values and hypothetical expenses based on the Fund’s actual expense ratio and an assumed rate of return of 5% per year before expenses, which is not the Fund’s actual return. The hypothetical account values and expenses may not be used to estimate the actual ending account balance or expenses you paid for the period. You may use this information to compare the ongoing costs of investing in the Fund and other funds. To do so, compare this 5% hypothetical example with the 5% hypothetical examples that appear in the shareholder reports of the other funds.
Please note that the expenses shown in the table are meant to highlight your ongoing costs only and do not reflect any transactional costs, such as sales charges (loads) and contingent deferred sales charges. Therefore, the “Hypothetical” line of the table is useful in comparing ongoing costs only and will not help you determine the relative total costs of owning different funds. In addition, if these transactional costs were included, your costs would have been higher.
| | Beginning
account value
7-1-2020 | Ending
account value
12-31-2020 | Expenses
paid during
the period1 | Annualized net
expense ratio |
| Class A | | | | |
| Actual | $1,000.00 | $1,028.17 | $3.78 | 0.74% |
| Hypothetical (5% return before expenses) | $1,000.00 | $1,021.48 | $3.77 | 0.74% |
| Class C | | | | |
| Actual | $1,000.00 | $1,023.44 | $7.60 | 1.49% |
| Hypothetical (5% return before expenses) | $1,000.00 | $1,017.69 | $7.58 | 1.49% |
| Institutional Class | | | | |
| Actual | $1,000.00 | $1,029.45 | $2.51 | 0.49% |
| Hypothetical (5% return before expenses) | $1,000.00 | $1,022.74 | $2.50 | 0.49% |
1 Expenses paid is equal to the annualized net expense ratio of each class multiplied by the average account value over the period, multiplied by the number of days in the most recent fiscal half-year divided by the number of days in the fiscal year (to reflect the one-half-year period).
6 | Wells Fargo Pennsylvania Tax-Free Fund
Portfolio of investments—December 31, 2020 (unaudited)
| | | Interest
rate | Maturity
date | Principal | Value |
| Municipal obligations: 97.83% | | | | | |
| Florida: 0.77% | | | | | |
| Industrial development revenue: 0.77% | | | | | |
| Jacksonville FL Economic Development AMT Metropolitan Parking Solutions Project (ACA Insured) | | 5.50 | 10-1-2030 | $1,000,000 | 1,002,940 |
| Guam: 0.52% | | | | | |
| Airport revenue: 0.52% | | | | | |
| Guam Port Authority AMT Series B | | 5.00 | 7-1-2032 | 550,000 | 674,014 |
| Illinois: 0.79% | | | | | |
| Miscellaneous revenue: 0.79% | | | | | |
| Illinois Series D | | 5.00 | 11-1-2021 | 1,000,000 | 1,028,310 |
| New Jersey: 0.29% | | | | | |
| Tax revenue: 0.29% | | | | | |
| New Jersey Statewide Covid-19 Emergency Series A | | 5.00 | 6-1-2027 | 300,000 | 375,210 |
| Pennsylvania: 95.46% | | | | | |
| Airport revenue: 1.33% | | | | | |
| Philadelphia PA Airport Refunding Bond AMT Series A | | 5.00 | 6-15-2030 | 1,500,000 | 1,730,610 |
| Education revenue: 23.16% | | | | | |
| Allegheny County PA Higher Education Building Authority Duquesne University Series A | | 4.00 | 3-1-2040 | 1,500,000 | 1,749,585 |
| Allegheny County PA Higher Education Robert Morris University | | 5.00 | 10-15-2037 | 750,000 | 828,750 |
| Chester County PA IDA Avon Grove Charter School Project Refunding Bond Series A | | 5.00 | 12-15-2047 | 1,160,000 | 1,309,304 |
| Chester County PA IDA Collegium Charter School Project Refunding Bond Series A | | 5.00 | 10-15-2022 | 730,000 | 754,915 |
| Chester County PA IDA Collegium Charter School Project Series A | | 5.13 | 10-15-2037 | 1,000,000 | 1,100,290 |
| Chester County PA IDA Renaissance Academy Charter School Project | | 3.75 | 10-1-2024 | 485,000 | 506,355 |
| Delaware County PA Authority Neumann University Bond | | 5.00 | 10-1-2039 | 250,000 | 283,135 |
| Lycoming County PA Authority Pennsylvania College of Technology | | 5.00 | 10-1-2023 | 325,000 | 356,467 |
| Lycoming County PA Authority Pennsylvania College of Technology | | 5.50 | 7-1-2026 | 3,000,000 | 3,070,890 |
| Montgomery County PA Higher Education & Health Authority Arcadia University Refunding Bond | | 5.00 | 4-1-2030 | 1,500,000 | 1,657,515 |
| Northeastern Pennsylvania Hospital & Education Authority Refunding Bond Wilkes University Project Series B | | 5.25 | 3-1-2037 | 1,000,000 | 1,072,070 |
| Pennsylvania HEFAR Temple University First Series | | 5.00 | 4-1-2032 | 1,000,000 | 1,060,010 |
| Pennsylvania Public School Building Authority Northampton County Area Community College Project | | 5.50 | 3-1-2031 | 5,000,000 | 5,041,650 |
| Pennsylvania Public School Building Authority Northampton County Area Community College Project Series A (BAM Insured) | | 5.00 | 6-15-2027 | 1,610,000 | 1,708,049 |
| Pennsylvania State University Refunding Bond Series B | | 5.00 | 9-1-2034 | 2,175,000 | 2,652,304 |
| Philadelphia PA Authority For Industrial Development Charter School Philadelphia Performing Arts 144A | | 5.00 | 6-15-2029 | 220,000 | 261,087 |
The accompanying notes are an integral part of these financial statements.
Wells Fargo Pennsylvania Tax-Free Fund | 7
Portfolio of investments—December 31, 2020 (unaudited)
| | | Interest
rate | Maturity
date | Principal | Value |
| Education revenue (continued) | | | | | |
| Philadelphia PA Authority For Industrial Development Charter School Philadelphia Performing Arts 144A | | 5.00% | 6-15-2030 | $ 145,000 | $ 171,100 |
| Philadelphia PA IDA 1st Philadelphia Preparatory Charter School Project Series A | | 7.00 | 6-15-2033 | 1,000,000 | 1,155,850 |
| Philadelphia PA IDA Independence Charter School Project | | 5.00 | 6-15-2039 | 250,000 | 268,160 |
| Philadelphia PA IDA La Salle University | | 5.00 | 5-1-2036 | 1,355,000 | 1,440,284 |
| Philadelphia PA IDA Tacony Academy Charter School Project | | 6.88 | 6-15-2033 | 1,000,000 | 1,108,880 |
| Philadelphia PA IDA Temple University 1st Series 2016 | | 5.00 | 4-1-2029 | 1,000,000 | 1,165,740 |
| Philadelphia PA IDA West Philadelphia Achievement Charter Elementary School Project | | 7.50 | 5-1-2031 | 1,285,000 | 1,306,074 |
| | | | | | 30,028,464 |
| GO revenue: 18.94% | | | | | |
| Allegheny County PA Series C-78 | | 4.00 | 11-1-2049 | 1,000,000 | 1,198,010 |
| Allentown PA Notes (BAM Insured) | | 4.00 | 10-1-2045 | 1,250,000 | 1,463,013 |
| Central Dauphin PA School District | | 5.00 | 2-1-2037 | 2,075,000 | 2,422,438 |
| Coatesville PA Area School District CAB Series C (BAM Insured)¤ | | 0.00 | 10-1-2033 | 1,000,000 | 657,620 |
| Downingtown PA Area School District Series C | | 5.00 | 8-1-2032 | 1,000,000 | 1,245,550 |
| Erie PA City School District Limited Tax Series A (AGM Insured) | | 5.00 | 4-1-2034 | 515,000 | 655,992 |
| North Allegheny PA School District | | 5.00 | 5-1-2030 | 100,000 | 132,956 |
| North Allegheny PA School District | | 5.00 | 5-1-2031 | 290,000 | 383,603 |
| Penn-Delco PA School District | | 4.00 | 6-1-2045 | 1,000,000 | 1,134,850 |
| Philadelphia PA Refunding Bond Series A | | 5.25 | 7-15-2033 | 1,500,000 | 1,700,700 |
| Philadelphia PA School District Refunding Bond Series A (AGM/FGIC Insured) | | 5.00 | 6-1-2024 | 1,410,000 | 1,604,510 |
| Philadelphia PA School District Refunding Bond Series C | | 5.00 | 9-1-2021 | 1,395,000 | 1,435,832 |
| Philadelphia PA School District Series B | | 5.00 | 9-1-2043 | 1,235,000 | 1,506,749 |
| Philadelphia PA Series A | | 5.00 | 8-1-2036 | 1,250,000 | 1,525,638 |
| Pittsburgh PA (BAM Insured) | | 5.00 | 9-1-2030 | 500,000 | 587,170 |
| Pittsburgh PA Moon Area School District Series A | | 5.00 | 11-15-2029 | 1,445,000 | 1,678,946 |
| Reading PA School District Series A (AGM Insured) | | 5.00 | 2-1-2033 | 1,500,000 | 1,743,300 |
| West Mifflin PA Area School District (AGM Insured) | | 5.00 | 4-1-2028 | 1,000,000 | 1,229,970 |
| West Shore PA School District | | 5.00 | 11-15-2048 | 1,500,000 | 1,811,895 |
| Wilkes-Barre School District Luzerne County PA Series 2019 (BAM Insured) | | 5.00 | 4-15-2027 | 100,000 | 125,652 |
| Wilkes-Barre School District Luzerne County PA Series 2019 (BAM Insured) | | 5.00 | 4-15-2028 | 120,000 | 154,487 |
| Wilkes-Barre School District Luzerne County PA Series 2019 (BAM Insured) | | 5.00 | 4-15-2029 | 50,000 | 65,799 |
| Wilkes-Barre School District Luzerne County PA Series 2019 (BAM Insured) | | 5.00 | 4-15-2030 | 70,000 | 91,535 |
| | | | | | 24,556,215 |
| Health revenue: 17.11% | | | | | |
| Allegheny County PA Hospital Development Authority Allegheny Health Network | | 4.00 | 4-1-2044 | 1,810,000 | 2,019,363 |
| Allegheny County PA Hospital Development Authority Health Center Series B (National Insured) | | 6.00 | 7-1-2027 | 1,800,000 | 2,404,854 |
| Berks County PA IDA Tower Health Project | | 5.00 | 11-1-2037 | 1,930,000 | 2,108,236 |
| Bucks County PA IDA St. Lukes University Health Network | | 4.00 | 8-15-2050 | 400,000 | 441,420 |
| Cumberland County PA Municipal Authority | | 5.00 | 1-1-2028 | 265,000 | 313,421 |
| Cumberland County PA Municipal Authority | | 5.00 | 1-1-2028 | 1,825,000 | 2,021,334 |
The accompanying notes are an integral part of these financial statements.
8 | Wells Fargo Pennsylvania Tax-Free Fund
Portfolio of investments—December 31, 2020 (unaudited)
| | | Interest
rate | Maturity
date | Principal | Value |
| Health revenue (continued) | | | | | |
| Dauphin County PA General Authority Pinnacle Health System Project | | 5.00% | 6-1-2042 | $ 500,000 | $ 525,855 |
| Dauphin County PA General Authority Pinnacle Health System Project Series A | | 5.00 | 6-1-2035 | 1,000,000 | 1,180,800 |
| Doylestown PA Hospital Authority Doylestown Hospital Series A | | 5.00 | 7-1-2049 | 250,000 | 286,503 |
| East Hempfield Township PA IDA Willow Valley Communities Project Refunding Bond | | 5.00 | 12-1-2028 | 450,000 | 522,990 |
| East Hempfield Township PA IDA Willow Valley Communities Project Refunding Bond | | 5.00 | 12-1-2029 | 375,000 | 434,633 |
| Geisinger PA Health System Series A-1 | | 4.00 | 4-1-2050 | 1,000,000 | 1,164,240 |
| Lancaster County PA Hospital Authority Healthcare Facilities Moravian Manors Incorporated Project | | 2.88 | 12-15-2023 | 185,000 | 185,009 |
| Lancaster County PA Hospital Authority St. Annes Retirement Community Incorporated | | 5.00 | 3-1-2045 | 500,000 | 531,615 |
| Montgomery County PA IDA ACTS Retirement Life Communities | | 5.00 | 11-15-2045 | 1,000,000 | 1,187,180 |
| Montgomery County PA IDA Jefferson Health System Series A | | 5.00 | 10-1-2027 | 1,000,000 | 1,060,010 |
| Montgomery County PA IDA Waverly Heights Limited Project | | 5.00 | 12-1-2044 | 1,000,000 | 1,125,030 |
| Northampton County PA St. Luke's Hospital of Bethlehem Series A | | 5.00 | 8-15-2033 | 1,435,000 | 1,555,554 |
| Pennsylvania Economic Development Financing Authority Series A-1 | | 4.00 | 4-15-2037 | 700,000 | 827,890 |
| Pennsylvania Higher Educational University Pennsylvania Health System Series A | | 5.00 | 8-15-2047 | 1,500,000 | 1,824,855 |
| Westmoreland County PA IDA Excela Health Project Series A | | 4.00 | 7-1-2037 | 400,000 | 464,820 |
| | | | | | 22,185,612 |
| Housing revenue: 0.42% | | | | | |
| Chester County PA IDA University Student Housing LLC Project Series A | | 5.00 | 8-1-2030 | 555,000 | 549,766 |
| Miscellaneous revenue: 21.34% | | | | | |
| Butler County PA General Authority Hampton Township School District Project Series 2007 (AGM Insured, PNC Bank NA SPA)ø | | 0.13 | 9-1-2027 | 4,000,000 | 4,000,000 |
| Delaware County PA Authority Neumann University Refunding Bond | | 5.00 | 10-1-2031 | 1,500,000 | 1,633,620 |
| Delaware County PA Vocational & Technical School Authority (BAM Insured) | | 5.25 | 11-1-2033 | 1,000,000 | 1,122,240 |
| Delaware Valley Regional Finance Authority Pennsylvania Local Government Series A (Ambac Insured) | | 5.50 | 8-1-2028 | 3,980,000 | 5,195,333 |
| Pennsylvania Certificate of Participation Series A | | 5.00 | 7-1-2038 | 1,000,000 | 1,233,050 |
| Pennsylvania Commonwealth Financing Authority Refunding Bond Series B | | 5.00 | 6-1-2031 | 250,000 | 340,293 |
| Pennsylvania Commonwealth Financing Authority Series B | | 5.00 | 6-1-2026 | 1,000,000 | 1,068,070 |
| Pennsylvania Economic Development Financing Authority Sewage Sludge Disposal Refunding Bond Philadelphia Bioslides Facility | | 4.00 | 1-1-2030 | 400,000 | 470,432 |
| Pennsylvania Financing Authority Pennsylvania Hills Project CAB Series B (National Insured)¤ | | 0.00 | 12-1-2022 | 1,200,000 | 1,179,756 |
| Pennsylvania Financing Authority Pennsylvania Hills Project CAB Series B (National Insured)¤ | | 0.00 | 12-1-2023 | 3,790,000 | 3,679,787 |
The accompanying notes are an integral part of these financial statements.
Wells Fargo Pennsylvania Tax-Free Fund | 9
Portfolio of investments—December 31, 2020 (unaudited)
| | | Interest
rate | Maturity
date | Principal | Value |
| Miscellaneous revenue (continued) | | | | | |
| Pennsylvania Public School Building Authority Chester Upland School District Project Series B | | 5.25% | 9-15-2030 | $ 540,000 | $ 681,199 |
| Pennsylvania Public School Building Authority Chester Upland School District Project Series C (AGM Insured) | | 5.00 | 9-15-2026 | 875,000 | 901,075 |
| Pennsylvania Public School Building Authority Series B (BAM Insured) | | 5.00 | 12-1-2027 | 360,000 | 414,731 |
| Pennsylvania Public School Building Authority Series B (BAM Insured) | | 5.00 | 12-1-2027 | 650,000 | 767,975 |
| Pennsylvania Turnpike Commission Series A (AGM Insured) | | 5.25 | 7-15-2021 | 1,000,000 | 1,027,000 |
| Philadelphia PA IDA City Agreement Green Bond Museum Art Energy Saving Program Series A | | 5.00 | 2-15-2038 | 785,000 | 963,823 |
| Philadelphia PA IDA Refunding Bond Cultural & Commercial Corridors Program Series A | | 5.00 | 12-1-2028 | 2,500,000 | 2,991,275 |
| | | | | | 27,669,659 |
| Tax revenue: 2.33% | | | | | |
| Allegheny County PA Port Authority Refunding Bond | | 5.75 | 3-1-2029 | 3,000,000 | 3,026,160 |
| Transportation revenue: 6.22% | | | | | |
| Delaware River PA Joint Toll Bridge Commission | | 5.00 | 7-1-2042 | 580,000 | 709,543 |
| Pennsylvania Turnpike Commission Series A-1 | | 5.00 | 12-1-2047 | 1,000,000 | 1,212,940 |
| Pennsylvania Turnpike Commission Series A-2 | | 5.00 | 12-1-2048 | 2,000,000 | 2,450,660 |
| Pennsylvania Turnpike Commission Subordinate Bond Series A | | 5.50 | 12-1-2042 | 3,000,000 | 3,695,820 |
| | | | | | 8,068,963 |
| Water & sewer revenue: 4.61% | | | | | |
| Capital Region Pennsylvania Water & Sewer System Refunding Bond | | 5.00 | 7-15-2037 | 1,000,000 | 1,221,260 |
| Lehigh County PA General Purpose Authority CAB Allentown Project ¤ | | 0.00 | 12-1-2030 | 2,000,000 | 1,671,560 |
| Luzerne County PA IDA Refunding Bond AMT Pennsylvania American Water Company Project | | 2.45 | 12-1-2039 | 500,000 | 552,960 |
| Philadelphia PA Water & Wastewater Refunding Bond Series A | | 5.00 | 10-1-2038 | 2,000,000 | 2,526,193 |
| | | | | | 5,971,973 |
| | | | | | 123,787,422 |
| Total Municipal obligations (Cost $117,352,277) | | | | | 126,867,896 |
| | | Yield | | Shares | |
| Short-term investments: 1.37% | | | | | |
| Investment companies: 1.37% | | | | | |
| Wells Fargo Municipal Cash Management Money Market Fund Institutional Class ♠∞ | | 0.01% | | 1,773,433 | 1,773,965 |
| Total Short-term investments (Cost $1,773,965) | | | | | 1,773,965 |
| Total investments in securities (Cost $119,126,242) | 99.20% | | | | 128,641,861 |
| Other assets and liabilities, net | 0.80 | | | | 1,036,077 |
| Total net assets | 100.00% | | | | $ 129,677,938 |
The accompanying notes are an integral part of these financial statements.
10 | Wells Fargo Pennsylvania Tax-Free Fund
Portfolio of investments—December 31, 2020 (unaudited)
| 144A | The security may be resold in transactions exempt from registration, normally to qualified institutional buyers, pursuant to Rule 144A under the Securities Act of 1933. |
| ¤ | The security is issued in zero coupon form with no periodic interest payments. |
| ø | Variable rate demand notes are subject to a demand feature which reduces the effective maturity. The maturity date shown represents the final maturity date of the security. The interest rate is determined and reset by the issuer daily, weekly, or monthly depending upon the terms of the security. The rate shown is the rate in effect at period end. |
| ♠ | The issuer of the security is an affiliated person of the Fund as defined in the Investment Company Act of 1940. |
| ∞ | The rate represents the 7-day annualized yield at period end. |
| Abbreviations: |
| ACA | ACA Financial Guaranty Corporation |
| AGM | Assured Guaranty Municipal |
| Ambac | Ambac Financial Group Incorporated |
| AMT | Alternative minimum tax |
| BAM | Build America Mutual Assurance Company |
| CAB | Capital appreciation bond |
| GO | General obligation |
| HEFAR | Higher Education Facilities Authority Revenue |
| IDA | Industrial Development Authority |
| National | National Public Finance Guarantee Corporation |
| SPA | Standby purchase agreement |
Investments in affiliates
An affiliated investment is an investment in which the Fund owns at least 5% of the outstanding voting shares of the issuer or as a result of other relationships, such as the Fund and the issuer having the same investment manager. Transactions with issuers that were either affiliated persons of the Fund at the beginning of the period or the end of the period were as follows:
| | Value,
beginning of
period | Purchases | Sales
proceeds | Net
realized
gains
(losses) | Net
change in
unrealized
gains
(losses) | Value,
end of
period | % of
net
assets | Shares,
end
of period | Income
from
affiliated
securities |
| Short-term investments | | | | | | | | | |
| Investment companies | | | | | | | | | |
| Wells Fargo Municipal Cash Management Money Market Fund Institutional Class | $1,563,134 | $9,563,942 | $(9,352,985) | $(27) | $(99) | $1,773,965 | 1.37% | 1,773,433 | $137 |
The accompanying notes are an integral part of these financial statements.
Wells Fargo Pennsylvania Tax-Free Fund | 11
Statement of assets and liabilities—December 31, 2020 (unaudited)
| | |
| Assets | |
Investments in unaffiliated securities, at value (cost $117,352,277)
| $ 126,867,896 |
Investments in affiliated securites, at value (cost $1,773,965)
| 1,773,965 |
Receivable for interest
| 1,390,248 |
Receivable for Fund shares sold
| 11,316 |
Prepaid expenses and other assets
| 23,332 |
Total assets
| 130,066,757 |
| Liabilities | |
Payable for Fund shares redeemed
| 157,875 |
Dividends payable
| 138,112 |
Management fee payable
| 30,874 |
Administration fees payable
| 13,291 |
Distribution fee payable
| 4,909 |
Trustees’ fees and expenses payable
| 2,030 |
Accrued expenses and other liabilities
| 41,728 |
Total liabilities
| 388,819 |
Total net assets
| $129,677,938 |
| Net assets consist of | |
Paid-in capital
| $ 120,676,354 |
Total distributable earnings
| 9,001,584 |
Total net assets
| $129,677,938 |
| Computation of net asset value and offering price per share | |
Net assets – Class A
| $ 42,102,171 |
Shares outstanding – Class A1
| 3,533,508 |
Net asset value per share – Class A
| $11.92 |
Maximum offering price per share – Class A2
| $12.48 |
Net assets – Class C
| $ 6,906,644 |
Shares outstanding – Class C1
| 580,692 |
Net asset value per share – Class C
| $11.89 |
Net assets – Institutional Class
| $ 80,669,123 |
Shares outstanding – Institutional Class1
| 6,770,146 |
Net asset value per share – Institutional Class
| $11.92 |
| 1 | The Fund has an unlimited number of authorized shares |
| 2 | Maximum offering price is computed as 100/95.50 of net asset value. On investments of $50,000 or more, the offering price is reduced. |
The accompanying notes are an integral part of these financial statements.
12 | Wells Fargo Pennsylvania Tax-Free Fund
Statement of operations—six months ended December 31, 2020 (unaudited)
| | |
| Investment income | |
Interest
| $ 2,316,440 |
Income from affiliated securities
| 137 |
Total investment income
| 2,316,577 |
| Expenses | |
Management fee
| 264,606 |
| Administration fees | |
Class A
| 34,149 |
Class C
| 6,384 |
Institutional Class
| 32,655 |
| Shareholder servicing fees | |
Class A
| 53,211 |
Class C
| 9,969 |
| Distribution fee | |
Class C
| 29,832 |
Custody and accounting fees
| 5,399 |
Professional fees
| 25,567 |
Registration fees
| 23,747 |
Shareholder report expenses
| 9,853 |
Trustees’ fees and expenses
| 9,874 |
Other fees and expenses
| 7,108 |
Total expenses
| 512,354 |
| Less: Fee waivers and/or expense reimbursements | |
Fund-level
| (74,228) |
Class A
| (17,994) |
Class C
| (3,170) |
Net expenses
| 416,962 |
Net investment income
| 1,899,615 |
| Realized and unrealized gains (losses) on investments | |
| Net realized gains (losses) on | |
Unaffiliated securities
| 234,298 |
Affiliated securities
| (27) |
Net realized gains on investments
| 234,271 |
| Net change in unrealized gains (losses) on | |
Unaffiliated securities
| 1,536,845 |
Affiliated securities
| (99) |
Net change in unrealized gains (losses) on investments
| 1,536,746 |
Net realized and unrealized gains (losses) on investments
| 1,771,017 |
Net increase in net assets resulting from operations
| $3,670,632 |
The accompanying notes are an integral part of these financial statements.
Wells Fargo Pennsylvania Tax-Free Fund | 13
Statement of changes in net assets
| | |
| | Six months ended
December 31, 2020
(unaudited) | Year ended
June 30, 2020 |
| Operations | | | | |
Net investment income
| | $ 1,899,615 | | $ 3,986,943 |
Net realized gains (losses) on investments
| | 234,271 | | (262,188) |
Net change in unrealized gains (losses) on investments
| | 1,536,746 | | (211,449) |
Net increase in net assets resulting from operations
| | 3,670,632 | | 3,513,306 |
| Distributions to shareholders from | | | | |
| Net investment income and net realized gains | | | | |
Class A
| | (568,597) | | (1,173,120) |
Class C
| | (76,148) | | (184,695) |
Institutional Class
| | (1,187,967) | | (2,565,155) |
Total distributions to shareholders
| | (1,832,712) | | (3,922,970) |
| Capital share transactions | Shares | | Shares | |
| Proceeds from shares sold | | | | |
Class A
| 221,330 | 2,618,527 | 488,464 | 5,729,161 |
Class C
| 13,654 | 161,525 | 101,019 | 1,188,807 |
Institutional Class
| 296,341 | 3,508,504 | 1,171,692 | 13,830,091 |
| | | 6,288,556 | | 20,748,059 |
| Reinvestment of distributions | | | | |
Class A
| 44,277 | 524,062 | 92,310 | 1,090,759 |
Class C
| 6,025 | 71,170 | 14,791 | 174,514 |
Institutional Class
| 43,361 | 513,223 | 88,777 | 1,048,900 |
| | | 1,108,455 | | 2,314,173 |
| Payment for shares redeemed | | | | |
Class A
| (269,031) | (3,177,585) | (544,701) | (6,432,927) |
Class C
| (154,825) | (1,828,401) | (145,323) | (1,715,156) |
Institutional Class
| (429,729) | (5,086,456) | (1,114,671) | (13,119,929) |
| | | (10,092,442) | | (21,268,012) |
Net increase (decrease) in net assets resulting from capital share transactions
| | (2,695,431) | | 1,794,220 |
Total increase (decrease) in net assets
| | (857,511) | | 1,384,556 |
| Net assets | | | | |
Beginning of period
| | 130,535,449 | | 129,150,893 |
End of period
| | $129,677,938 | | $130,535,449 |
The accompanying notes are an integral part of these financial statements.
14 | Wells Fargo Pennsylvania Tax-Free Fund
Financial highlights
(For a share outstanding throughout each period)
| | | Year ended June 30 |
| Class A | Six months ended
December 31, 2020
(unaudited) | 2020 | 2019 | 2018 | 2017 | 2016 |
Net asset value, beginning of period
| $11.75 | $11.78 | $11.48 | $11.67 | $12.13 | $11.75 |
Net investment income
| 0.17 | 0.35 | 0.35 | 0.38 | 0.36 | 0.38 |
Net realized and unrealized gains (losses) on investments
| 0.16 | (0.04) | 0.32 | (0.19) | (0.46) | 0.38 |
Total from investment operations
| 0.33 | 0.31 | 0.67 | 0.19 | (0.10) | 0.76 |
| Distributions to shareholders from | | | | | | |
Net investment income
| (0.16) | (0.34) | (0.34) | (0.38) | (0.36) | (0.38) |
Net realized gains
| 0.00 | 0.00 | (0.03) | 0.00 | 0.00 | 0.00 |
Total distributions to shareholders
| (0.16) | (0.34) | (0.37) | (0.38) | (0.36) | (0.38) |
Net asset value, end of period
| $11.92 | $11.75 | $11.78 | $11.48 | $11.67 | $12.13 |
Total return1
| 2.82% | 2.65% | 6.00% | 1.62% | (0.83)% | 6.62% |
| Ratios to average net assets (annualized) | | | | | | |
Gross expenses
| 0.93% | 0.97% | 0.96% | 0.91% | 0.90% | 0.90% |
Net expenses
| 0.74% | 0.74% | 0.74% | 0.74% | 0.74% | 0.74% |
Net investment income
| 2.77% | 2.92% | 3.07% | 3.25% | 3.02% | 3.23% |
| Supplemental data | | | | | | |
Portfolio turnover rate
| 8% | 14% | 9% | 10% | 20% | 13% |
Net assets, end of period (000s omitted)
| $42,102 | $41,550 | $41,255 | $40,664 | $45,381 | $55,352 |
| 1 | Total return calculations do not include any sales charges. Returns for periods of less than one year are not annualized. |
The accompanying notes are an integral part of these financial statements.
Wells Fargo Pennsylvania Tax-Free Fund | 15
Financial highlights
(For a share outstanding throughout each period)
| | | Year ended June 30 |
| Class C | Six months ended
December 31, 2020
(unaudited) | 2020 | 2019 | 2018 | 2017 | 2016 |
Net asset value, beginning of period
| $11.73 | $11.76 | $11.45 | $11.65 | $12.11 | $11.73 |
Net investment income
| 0.12 | 0.27 | 0.26 1 | 0.29 1 | 0.27 1 | 0.29 1 |
Net realized and unrealized gains (losses) on investments
| 0.16 | (0.05) | 0.34 | (0.20) | (0.46) | 0.38 |
Total from investment operations
| 0.28 | 0.22 | 0.60 | 0.09 | (0.19) | 0.67 |
| Distributions to shareholders from | | | | | | |
Net investment income
| (0.12) | (0.25) | (0.26) | (0.29) | (0.27) | (0.29) |
Net realized gains
| 0.00 | 0.00 | (0.03) | 0.00 | 0.00 | 0.00 |
Total distributions to shareholders
| (0.12) | (0.25) | (0.29) | (0.29) | (0.27) | (0.29) |
Net asset value, end of period
| $11.89 | $11.73 | $11.76 | $11.45 | $11.65 | $12.11 |
Total return2
| 2.34% | 1.89% | 5.31% | 0.77% | (1.58)% | 5.83% |
| Ratios to average net assets (annualized) | | | | | | |
Gross expenses
| 1.68% | 1.72% | 1.70% | 1.66% | 1.65% | 1.65% |
Net expenses
| 1.49% | 1.49% | 1.49% | 1.49% | 1.49% | 1.49% |
Net investment income
| 2.01% | 2.23% | 2.32% | 2.50% | 2.27% | 2.46% |
| Supplemental data | | | | | | |
Portfolio turnover rate
| 8% | 14% | 9% | 10% | 20% | 13% |
Net assets, end of period (000s omitted)
| $6,907 | $8,394 | $8,768 | $13,440 | $16,323 | $19,493 |
| 1 | Calculated based upon average shares outstanding |
| 2 | Total return calculations do not include any sales charges. Returns for periods of less than one year are not annualized. |
The accompanying notes are an integral part of these financial statements.
16 | Wells Fargo Pennsylvania Tax-Free Fund
Financial highlights
(For a share outstanding throughout each period)
| | | Year ended June 30 |
| Institutional Class | Six months ended
December 31, 2020
(unaudited) | 2020 | 2019 | 2018 | 2017 | 2016 |
Net asset value, beginning of period
| $11.75 | $11.78 | $11.48 | $11.67 | $12.13 | $11.75 |
Net investment income
| 0.18 | 0.38 | 0.38 | 0.40 | 0.39 1 | 0.41 1 |
Net realized and unrealized gains (losses) on investments
| 0.17 | (0.04) | 0.32 | (0.18) | (0.46) | 0.38 |
Total from investment operations
| 0.35 | 0.34 | 0.70 | 0.22 | (0.07) | 0.79 |
| Distributions to shareholders from | | | | | | |
Net investment income
| (0.18) | (0.37) | (0.37) | (0.41) | (0.39) | (0.41) |
Net realized gains
| 0.00 | 0.00 | (0.03) | 0.00 | 0.00 | 0.00 |
Total distributions to shareholders
| (0.18) | (0.37) | (0.40) | (0.41) | (0.39) | (0.41) |
Net asset value, end of period
| $11.92 | $11.75 | $11.78 | $11.48 | $11.67 | $12.13 |
Total return2
| 2.94% | 2.91% | 6.27% | 1.88% | (0.58)% | 6.88% |
| Ratios to average net assets (annualized) | | | | | | |
Gross expenses
| 0.60% | 0.64% | 0.62% | 0.58% | 0.57% | 0.57% |
Net expenses
| 0.49% | 0.49% | 0.49% | 0.49% | 0.49% | 0.49% |
Net investment income
| 3.01% | 3.18% | 3.31% | 3.50% | 3.27% | 3.47% |
| Supplemental data | | | | | | |
Portfolio turnover rate
| 8% | 14% | 9% | 10% | 20% | 13% |
Net assets, end of period (000s omitted)
| $80,669 | $80,592 | $79,128 | $88,663 | $102,672 | $132,844 |
| 1 | Calculated based upon average shares outstanding |
| 2 | Returns for periods of less than one year are not annualized. |
The accompanying notes are an integral part of these financial statements.
Wells Fargo Pennsylvania Tax-Free Fund | 17
Notes to financial statements (unaudited)
1. ORGANIZATION
Wells Fargo Funds Trust (the “Trust”), a Delaware statutory trust organized on March 10, 1999, is an open-end management investment company registered under the Investment Company Act of 1940, as amended (the “1940 Act”). As an investment company, the Trust follows the accounting and reporting guidance in Financial Accounting Standards Board (“FASB”) Accounting Standards Codification Topic 946, Financial Services – Investment Companies. These financial statements report on the Wells Fargo Pennsylvania Tax-Free Fund (the “Fund”) which is a diversified series of the Trust.
2. SIGNIFICANT ACCOUNTING POLICIES
The following significant accounting policies, which are consistently followed in the preparation of the financial statements of the Fund, are in conformity with U.S. generally accepted accounting principles which require management to make estimates and assumptions that affect the reported amounts of assets and liabilities, disclosure of contingent assets and liabilities at the date of the financial statements, and the reported amounts of income and expenses during the reporting period. Actual results could differ from those estimates.
Securities valuation
All investments are valued each business day as of the close of regular trading on the New York Stock Exchange (generally 4 p.m. Eastern Time), although the Fund may deviate from this calculation time under unusual or unexpected circumstances.
Debt securities are valued at the evaluated bid price provided by an independent pricing service (e.g. taking into account various factors, including yields, maturities, or credit ratings) or, if a reliable price is not available, the quoted bid price from an independent broker-dealer.
Investments in registered open-end investment companies are valued at net asset value.
Investments which are not valued using any of the methods discussed above are valued at their fair value, as determined in good faith by the Board of Trustees of the Fund. The Board of Trustees has established a Valuation Committee comprised of the Trustees and has delegated to it the authority to take any actions regarding the valuation of portfolio securities that the Valuation Committee deems necessary or appropriate, including determining the fair value of portfolio securities, unless the determination has been delegated to the Wells Fargo Asset Management Pricing Committee at Wells Fargo Funds Management, LLC ("Funds Management"). The Board of Trustees retains the authority to make or ratify any valuation decisions or approve any changes to the Valuation Procedures as it deems appropriate. On a quarterly basis, the Board of Trustees receives reports on any valuation actions taken by the Valuation Committee or the Wells Fargo Asset Management Pricing Committee which may include items for ratification.
When-issued transactions
The Fund may purchase securities on a forward commitment or when-issued basis. The Fund records a when-issued transaction on the trade date and will segregate assets in an amount at least equal in value to the Fund's commitment to purchase when-issued securities. Securities purchased on a when-issued basis are marked-to-market daily and the Fund begins earning interest on the settlement date. Losses may arise due to changes in the market value of the underlying securities or if the counterparty does not perform under the contract.
Security transactions and income recognition
Securities transactions are recorded on a trade date basis. Realized gains or losses are recorded on the basis of identified cost.
Interest income is accrued daily and bond discounts are accreted and premiums are amortized daily. To the extent debt obligations are placed on non-accrual status, any related interest income may be reduced by writing off interest receivables when the collection of all or a portion of interest has been determined to be doubtful based on consistently applied procedures and the fair value has decreased. If the issuer subsequently resumes interest payments or when the collectability of interest is reasonably assured, the debt obligation is removed from non-accrual status.
Distributions to shareholders
Distributions to shareholders from net investment income are declared daily and paid monthly. Distributions from net realized gains, if any, are recorded on the ex-dividend date and paid at least annually. Such distributions are determined in accordance with income tax regulations and may differ from U.S. generally accepted accounting principles. Dividend sources are estimated at the time of declaration. The tax character of distributions is determined as of the Fund’s fiscal year end. Therefore, a portion of the Fund’s distributions made prior to the Fund’s fiscal year end may be categorized as a tax return of capital at year end.
18 | Wells Fargo Pennsylvania Tax-Free Fund
Notes to financial statements (unaudited)
Federal and other taxes
The Fund intends to continue to qualify as a regulated investment company by distributing substantially all of its investment company taxable and tax-exempt income and any net realized capital gains (after reduction for capital loss carryforwards) sufficient to relieve it from all, or substantially all, federal income taxes. Accordingly, no provision for federal income taxes was required.
The Fund’s income and federal excise tax returns and all financial records supporting those returns for the prior three fiscal years are subject to examination by the federal and Delaware revenue authorities. Management has analyzed the Fund’s tax positions taken on federal, state, and foreign tax returns for all open tax years and does not believe that there are any uncertain tax positions that require recognition of a tax liability.
As of December 31, 2020, the aggregate cost of all investments for federal income tax purposes was $119,126,242 and the unrealized gains (losses) consisted of:
| Gross unrealized gains | $9,638,220 |
| Gross unrealized losses | (122,601) |
| Net unrealized gains | $9,515,619 |
As of June 30, 2020, the Fund had capital loss carryforwards which consisted of $732,081 in short-term capital losses.
Class allocations
The separate classes of shares offered by the Fund differ principally in applicable sales charges, distribution, shareholder servicing, and administration fees. Class specific expenses are charged directly to that share class. Investment income, common fund-level expenses, and realized and unrealized gains (losses) on investments are allocated daily to each class of shares based on the relative proportion of net assets of each class.
3. FAIR VALUATION MEASUREMENTS
Fair value measurements of investments are determined within a framework that has established a fair value hierarchy based upon the various data inputs utilized in determining the value of the Fund’s investments. The three-level hierarchy gives the highest priority to unadjusted quoted prices in active markets for identical assets or liabilities (Level 1) and the lowest priority to unobservable inputs (Level 3). The Fund’s investments are classified within the fair value hierarchy based on the lowest level of input that is significant to the fair value measurement. The inputs are summarized into three broad levels as follows:
| ■ | Level 1 – quoted prices in active markets for identical securities |
| ■ | Level 2 – other significant observable inputs (including quoted prices for similar securities, interest rates, prepayment speeds, credit risk, etc.) |
| ■ | Level 3 – significant unobservable inputs (including the Fund’s own assumptions in determining the fair value of investments) |
The inputs or methodologies used for valuing investments in securities are not necessarily an indication of the risk associated with investing in those securities.
The following is a summary of the inputs used in valuing the Fund’s assets and liabilities as of December 31, 2020:
| | Quoted prices
(Level 1) | Other significant
observable inputs
(Level 2) | Significant
unobservable inputs
(Level 3) | Total |
| Assets | | | | |
| Investments in: | | | | |
| Municipal obligations | $ 0 | $ 126,867,896 | $0 | $ 126,867,896 |
| Short-term investments | | | | |
| Investment companies | 1,773,965 | 0 | 0 | 1,773,965 |
| Total assets | $1,773,965 | $126,867,896 | $0 | $128,641,861 |
Additional sector, industry or geographic detail is included in the Portfolio of Investments.
For the six months ended December 31, 2020, the Fund did not have any transfers into/out of Level 3.
Wells Fargo Pennsylvania Tax-Free Fund | 19
Notes to financial statements (unaudited)
4. TRANSACTIONS WITH AFFILIATES
Management fee
Funds Management, an indirect wholly owned subsidiary of Wells Fargo & Company (“Wells Fargo”), is the manager of the Fund and provides advisory and fund-level administrative services under an investment management agreement. Under the investment management agreement, Funds Management is responsible for, among other services, implementing the investment objectives and strategies of the Fund, supervising the subadviser and providing fund-level administrative services in connection with the Fund’s operations. As compensation for its services under the investment management agreement, Funds Management is entitled to receive a management fee at the following annual rate based on the Fund’s average daily net assets:
| Average daily net assets | Management fee |
| First $500 million | 0.400% |
| Next $500 million | 0.375 |
| Next $2 billion | 0.350 |
| Next $2 billion | 0.325 |
| Next $5 billion | 0.290 |
| Over $10 billion | 0.280 |
For the six months ended December 31, 2020, the management fee was equivalent to an annual rate of 0.40% of the Fund’s average daily net assets.
Funds Management has retained the services of a subadviser to provide daily portfolio management to the Fund. The fee for subadvisory services is borne by Funds Management. Wells Capital Management, Incorporated, an affiliate of Funds Management and an indirect wholly owned subsidiary of Wells Fargo, is the subadviser to the Fund and is entitled to receive a fee from Funds Management at an annual rate starting at 0.20% and declining to 0.10% as the average daily net assets of the Fund increase.
Administration fees
Under a class-level administration agreement, Funds Management provides class-level administrative services to the Fund, which includes paying fees and expenses for services provided by the transfer agent, sub-transfer agents, omnibus account servicers and record-keepers. As compensation for its services under the class-level administration agreement, Funds Management receives an annual fee which is calculated based on the average daily net assets of each class as follows:
| | Class-level
administration fee |
| Class A | 0.16% |
| Class C | 0.16 |
| Institutional Class | 0.08 |
Waivers and/or expense reimbursements
Funds Management has contractually waived and/or reimbursed management and administration fees to the extent necessary to maintain certain net operating expense ratios for the Fund. When each class of the Fund has exceeded its expense cap, Funds Management has waived fees and/or reimbursed expenses from fund-level expenses on a proportionate basis and then from class specific expenses. When only certain classes exceed their expense caps, waivers and/or reimbursements are applied against class specific expenses before fund-level expenses. Funds Management has committed through October 31, 2021 to waive fees and/ or reimburse expenses to the extent necessary to cap the Fund’s expenses at 0.74% for Class A shares, 1.49% for Class C shares and 0.49% for Institutional Class shares. Prior to or after the commitment expiration date, the cap may be increased or the commitment to maintain the cap may be terminated only with the approval of the Board of Trustees.
Distribution fee
The Trust has adopted a distribution plan for Class C shares of the Fund pursuant to Rule 12b-1 under the 1940 Act. A distribution fee is charged charged to Class C shares and paid to Wells Fargo Funds Distributor, LLC (“Funds Distributor”), the principal underwriter, at an annual rate of 0.75% of the average daily net assets of Class C shares.
20 | Wells Fargo Pennsylvania Tax-Free Fund
Notes to financial statements (unaudited)
In addition, Funds Distributor is entitled to receive the front-end sales charge from the purchase of Class A shares and a contingent deferred sales charge on the redemption of certain Class A shares. Funds Distributor is also entitled to receive the contingent deferred sales charges from redemptions of Class C shares. For the six months ended December 31, 2020, Funds Distributor received $737 from the sale of Class A shares. No contingent deferred sales charges were incurred by Class A and Class C shares for the six months ended December 31, 2020.
Shareholder servicing fees
The Trust has entered into contracts with one or more shareholder servicing agents, whereby Class A and Class C shares of the Fund are charged a fee at an annual rate of 0.25% of the average daily net assets of each respective class. A portion of these total shareholder servicing fees were paid to affiliates of Wells Fargo.
Interfund transactions
The Fund may purchase or sell portfolio investment securities to certain other Wells Fargo affiliates pursuant to Rule 17a-7 under the 1940 Act and under procedures adopted by the Board of Trustees. The procedures have been designed to ensure that these interfund transactions, which do not incur broker commissions, are effected at current market prices.
5. INVESTMENT PORTFOLIO TRANSACTIONS
Purchases and sales of investments, excluding U.S. government obligations (if any) and short-term securities, for the six months ended December 31, 2020 were $9,885,544 and $14,186,751, respectively.
6. BANK BORROWINGS
The Trust (excluding the money market funds), Wells Fargo Master Trust and Wells Fargo Variable Trust are parties to a $350,000,000 revolving credit agreement whereby the Fund is permitted to use bank borrowings for temporary or emergency purposes, such as to fund shareholder redemption requests. Interest under the credit agreement is charged to the Fund based on a borrowing rate equal to the higher of the Federal Funds rate in effect on that day plus 1.25% or the overnight LIBOR rate in effect on that day plus 1.25%. In addition, an annual commitment fee equal to 0.25% of the unused balance is allocated to each participating fund.
For the six months ended December 31, 2020, there were no borrowings by the Fund under the agreement.
7. CONCENTRATION RISK
The Fund invests a substantial portion of its assets in issuers of municipal debt securities located in a single state or territory of the U.S. Therefore, it may be more affected by economic and political developments in that state or region than would be a comparable general tax-exempt fund. As of the end of the period, the Fund invested a concentration of its portfolio in the state of Pennsylvania.
8. INDEMNIFICATION
Under the Fund's organizational documents, the officers and Trustees have been granted certain indemnification rights against certain liabilities that may arise out of performance of their duties to the Fund. The Fund has entered into a separate agreement with each Trustee that converts indemnification rights currently existing under the Fund’s organizational documents into contractual rights that cannot be changed in the future without the consent of the Trustee. Additionally, in the normal course of business, the Fund may enter into contracts with service providers that contain a variety of indemnification clauses. The Fund’s maximum exposure under these arrangements is dependent on future claims that may be made against the Fund and, therefore, cannot be estimated.
9. NEW ACCOUNTING PRONOUNCEMENT
In August 2018, FASB issued Accounting Standards Update (“ASU”) No. 2018-13, Fair Value Measurement (Topic 820) Disclosure Framework - Changes to the Disclosure Requirements for Fair Value Measurement. ASU 2018-13 updates the disclosure requirements on fair value measurements in Topic 820, Fair Value Measurements. The amendments are effective for fiscal years, and interim periods within those fiscal years, beginning after December 15, 2019. Management has adopted this guidance which did not have a material impact on the financial statements.
10. SUBSEQUENT EVENT
On February 23, 2021, Wells Fargo announced that it has entered into a definitive agreement to sell Wells Fargo Asset Management (“WFAM”) to GTCR LLC and Reverence Capital Partners, L.P. WFAM is the trade name used by the asset management businesses of Wells Fargo and includes Wells Fargo Funds Management, LLC, the investment manager to the
Wells Fargo Pennsylvania Tax-Free Fund | 21
Notes to financial statements (unaudited)
Fund, Wells Capital Management Incorporated and Wells Fargo Asset Management (International) Limited, both registered investment advisers providing sub-advisory services to certain funds, and Wells Fargo Funds Distributor, LLC, the Fund’s principal underwriter. As part of the transaction, Wells Fargo will own a 9.9% equity interest and will continue to serve as an important client and distribution partner.
Consummation of the transaction will result in the automatic termination of the Fund’s investment management agreement and sub-advisory agreement(s). The Fund’s Board of Trustees will be asked to approve new investment management arrangements with the new company. If approved by the Board, the new investment management arrangements with the new company will be presented to the shareholders of the Fund for approval, and, if approved by shareholders, would take effect upon the closing of the transaction. The transaction is expected to close in the second half of 2021, subject to customary closing conditions.
11. CORONAVIRUS (COVID-19) PANDEMIC
On March 11, 2020, the World Health Organization announced that it had made the assessment that coronavirus disease 2019 (“COVID-19”) is a pandemic. The impacts of COVID-19 are affecting the entire global economy, individual companies and investment products, and the market in general. There is significant uncertainty around the extent and duration of business disruptions related to COVID-19 and the impacts may be short term or may last for an extended period of time. The risk of further spreading of COVID-19 has led to significant uncertainty and volatility in the financial markets.
22 | Wells Fargo Pennsylvania Tax-Free Fund
Other information (unaudited)
PROXY VOTING INFORMATION
A description of the policies and procedures used to determine how to vote proxies relating to portfolio securities is available without charge, upon request, by calling 1-800-222-8222, visiting our website at wfam.com, or visiting the SEC website at sec.gov. Information regarding how the proxies related to portfolio securities were voted during the most recent 12-month period ended June 30 is available on the website at wfam.com or by visiting the SEC website at sec.gov.
QUARTERLY PORTFOLIO HOLDINGS INFORMATION
The Fund files its complete schedule of portfolio holdings with the SEC for the first and third quarters of each fiscal year as an exhibit to its reports on Form N-PORT. Shareholders may view the filed Form N-PORT by visiting the SEC website at sec.gov.
Wells Fargo Pennsylvania Tax-Free Fund | 23
Other information (unaudited)
BOARD OF TRUSTEES AND OFFICERS
Each of the Trustees and Officers1 listed in the table below acts in identical capacities for each fund in the Wells Fargo family of funds, which consists of 144 mutual funds comprising the Wells Fargo Funds Trust, Wells Fargo Variable Trust, Wells Fargo Master Trust and four closed-end funds (collectively the “Fund Complex”). This table should be read in conjunction with the Prospectus and the Statement of Additional Information2. The mailing address of each Trustee and Officer is 525 Market Street, 12th Floor, San Francisco, CA 94105. Each Trustee and Officer serves an indefinite term, however, each Trustee serves such term until reaching the mandatory retirement age established by the Trustees.
Independent Trustees
Name and
year of birth | Position held and
length of service* | Principal occupations during past five years or longer | Current other
public company or
investment
company
directorships |
William R. Ebsworth
(Born 1957) | Trustee,
since 2015 | Retired. From 1984 to 2013, equities analyst, portfolio manager, research director and chief investment officer at Fidelity Management and Research Company in Boston, Tokyo, and Hong Kong, and retired in 2013 as Chief Investment Officer of Fidelity Strategic Advisers, Inc. where he led a team of investment professionals managing client assets. Prior thereto, Board member of Hong Kong Securities Clearing Co., Hong Kong Options Clearing Corp., the Thailand International Fund, Ltd., Fidelity Investments Life Insurance Company, and Empire Fidelity Investments Life Insurance Company. Audit Committee Chair and Investment Committee Chair of the Vincent Memorial Hospital Endowment (non-profit organization). Mr. Ebsworth is a CFA® charterholder. | N/A |
Jane A. Freeman
(Born 1953) | Trustee,
since 2015;
Chair Liaison,
since 2018 | Retired. From 2012 to 2014 and 1999 to 2008, Chief Financial Officer of Scientific Learning Corporation. From 2008 to 2012, Ms. Freeman provided consulting services related to strategic business projects. Prior to 1999, Portfolio Manager at Rockefeller & Co. and Scudder, Stevens & Clark. Board member of the Harding Loevner Funds from 1996 to 2014, serving as both Lead Independent Director and chair of the Audit Committee. Board member of the Russell Exchange Traded Funds Trust from 2011 to 2012 and the chair of the Audit Committee. Ms. Freeman is also an inactive Chartered Financial Analyst. | N/A |
Isaiah Harris, Jr.
(Born 1952) | Trustee,
since 2009; Audit
Committee
Chair,
since 2019 | Retired. Chairman of the Board of CIGNA Corporation since 2009, and Director since 2005. From 2003 to 2011, Director of Deluxe Corporation. Prior thereto, President and CEO of BellSouth Advertising and Publishing Corp. from 2005 to 2007, President and CEO of BellSouth Enterprises from 2004 to 2005 and President of BellSouth Consumer Services from 2000 to 2003. Emeritus member of the Iowa State University Foundation Board of Governors. Emeritus Member of the Advisory Board of Iowa State University School of Business. Advisory Board Member, Palm Harbor Academy (private school). Mr. Harris is a certified public accountant (inactive status). | CIGNA Corporation |
Judith M. Johnson
(Born 1949) | Trustee,
since 2008 | Retired. Prior thereto, Chief Executive Officer and Chief Investment Officer of Minneapolis Employees Retirement Fund from 1996 to 2008. Ms. Johnson is an attorney, certified public accountant and a certified managerial accountant. | N/A |
David F. Larcker
(Born 1950) | Trustee,
since 2009 | James Irvin Miller Professor of Accounting at the Graduate School of Business (Emeritus), Stanford University, Director of the Corporate Governance Research Initiative and Senior Faculty of The Rock Center for Corporate Governance since 2006. From 2005 to 2008, Professor of Accounting at the Graduate School of Business, Stanford University. Prior thereto, Ernst & Young Professor of Accounting at The Wharton School, University of Pennsylvania from 1985 to 2005. | N/A |
24 | Wells Fargo Pennsylvania Tax-Free Fund
Other information (unaudited)
Name and
year of birth | Position held and
length of service* | Principal occupations during past five years or longer | Current other
public company or
investment
company
directorships |
Olivia S. Mitchell
(Born 1953) | Trustee,
since 2006;
Nominating and
Governance
Committee Chair,
since 2018 | International Foundation of Employee Benefit Plans Professor, Wharton School of the University of Pennsylvania since 1993. Director of Wharton’s Pension Research Council and Boettner Center on Pensions & Retirement Research, and Research Associate at the National Bureau of Economic Research. Previously, Cornell University Professor from 1978 to 1993. | N/A |
Timothy J. Penny
(Born 1951) | Trustee,
since 1996;
Chair,
since 2018 | President and Chief Executive Officer of Southern Minnesota Initiative Foundation, a non-profit organization, since 2007. Member of the Board of Trustees of NorthStar Education Finance, Inc., a non-profit organization, since 2007. | N/A |
James G. Polisson
(Born 1959) | Trustee,
since 2018 | Retired. Chief Marketing Officer, Source (ETF) UK Services, Ltd, from 2015 to 2017. From 2012 to 2015, Principal of The Polisson Group, LLC, a management consulting, corporate advisory and principal investing company. Chief Executive Officer and Managing Director at Russell Investments, Global Exchange Traded Funds from 2010 to 2012. Managing Director of Barclays Global Investors from 1998 to 2010 and Global Chief Marketing Officer for iShares and Barclays Global Investors from 2000 to 2010. Trustee of the San Francisco Mechanics’ Institute, a non-profit organization, from 2013 to 2015. Board member of the Russell Exchange Traded Fund Trust from 2011 to 2012. Director of Barclays Global Investors Holdings Deutschland GmbH from 2006 to 2009. Mr. Polisson is an attorney and has a retired status with the Massachusetts and District of Columbia Bar Associations. | N/A |
Pamela Wheelock
(Born 1959) | Trustee,
since January
2020; previously
Trustee from
January 2018 to
July 2019 | Board member of the Destination Medical Center Economic Development Agency, Rochester, Minnesota since 2019. Interim President of the McKnight Foundation from January to September 2020. Acting Commissioner, Minnesota Department of Human Services, July 2019 through September 2019. Human Services Manager (part-time), Minnesota Department of Human Services, October 2019 through December 2019. Chief Operating Officer, Twin Cities Habitat for Humanity from 2017 to 2019. Vice President of University Services, University of Minnesota from 2012 to 2016. Prior thereto, on the Board of Directors, Governance Committee and Finance Committee for the Minnesota Philanthropy Partners (Saint Paul Foundation) from 2012 to 2018, Interim Chief Executive Officer of Blue Cross Blue Shield of Minnesota from 2011 to 2012, Chairman of the Board from 2009 to 2012 and Board Director from 2003 to 2015. Vice President, Leadership and Community Engagement, Bush Foundation, Saint Paul, Minnesota (a private foundation) from 2009 to 2011. Executive Vice President and Chief Financial Officer, Minnesota Sports and Entertainment from 2004 to 2009 and Senior Vice President from 2002 to 2004. Executive Vice President of the Minnesota Wild Foundation from 2004 to 2008. Commissioner of Finance, State of Minnesota, from 1999 to 2002. Currently Board Chair of the Minnesota Wild Foundation since 2010. | N/A |
* Length of service dates reflect the Trustee’s commencement of service with the Trust’s predecessor entities, where applicable.
Wells Fargo Pennsylvania Tax-Free Fund | 25
Other information (unaudited)
Officers
Name and
year of birth | Position held and
length of service | Principal occupations during past five years or longer |
Andrew Owen
(Born 1960) | President,
since 2017 | Executive Vice President of Wells Fargo & Company and Head of Affiliated Managers, Wells Fargo Asset Management, since 2014. In addition, Mr. Owen is currently President, Chief Executive Officer and Director of Wells Fargo Funds Management, LLC since 2017. Prior thereto, Executive Vice President responsible for marketing, investments and product development for Wells Fargo Funds Management, LLC, from 2009 to 2014. |
Nancy Wiser1
(Born 1967) | Treasurer,
since 2012 | Executive Vice President of Wells Fargo Funds Management, LLC since 2011. Chief Operating Officer and Chief Compliance Officer at LightBox Capital Management LLC, from 2008 to 2011. |
Michelle Rhee
(Born 1966) | Chief Legal Officer,
since 2019 | Secretary of Wells Fargo Funds Management, LLC and Chief Legal Counsel of Wells Fargo Asset Management since 2018. Deputy General Counsel of Wells Fargo Bank N.A. since 2020 and Assistant General Counsel of Wells Fargo Bank, N.A. from 2018 to 2020. Associate General Counsel and Managing Director of Bank of America Corporation from 2004 to 2018. |
Catherine Kennedy
(Born 1969) | Secretary,
since 2019 | Vice President of Wells Fargo Funds Management, LLC and Senior Counsel of the Wells Fargo Legal Department since 2010. Vice President and Senior Counsel of Evergreen Investment Management Company, LLC from 1998 to 2010. |
Michael H. Whitaker
(Born 1967) | Chief Compliance Officer,
since 2016 | Chief Compliance Officer of Wells Fargo Asset Management since 2016. Senior Vice President and Chief Compliance Officer for Fidelity Investments from 2007 to 2016. |
Jeremy DePalma1
(Born 1974) | Assistant Treasurer,
since 2009 | Senior Vice President of Wells Fargo Funds Management, LLC since 2009. Senior Vice President of Evergreen Investment Management Company, LLC from 2008 to 2010 and head of the Fund Reporting and Control Team within Fund Administration from 2005 to 2010. |
1 Nancy Wiser acts as Treasurer of 67 funds in the Fund Complex. Jeremy DePalma acts as the Treasurer of 77 funds and Assistant Treasurer of 67 funds in the Fund Complex.
2 The Statement of Additional Information includes additional information about the Trustees and is available, without charge, upon request, by calling 1-800-222-8222 or by visiting the website at wfam.com.
26 | Wells Fargo Pennsylvania Tax-Free Fund
For more information
More information about Wells Fargo Funds is available free upon request. To obtain literature, please write, visit the Fund's website, or call:
Wells Fargo Funds
P.O. Box 219967
Kansas City, MO 64121-9967
Website: wfam.com
Individual investors: 1-800-222-8222
Retail investment professionals: 1-888-877-9275
Institutional investment professionals: 1-866-765-0778
This report and the financial statements contained herein are submitted for the general information of the shareholders of the Fund. If this report is used for promotional purposes, distribution of the report must be accompanied or preceded by a current prospectus. Before investing, please consider the investment objectives, risks, charges, and expenses of the investment. For a current prospectus and, if available, a summary prospectus, containing this information, call 1-800-222-8222 or visit the Fund’s website at wfam.com. Read the prospectus carefully before you invest or send money.
Wells Fargo Asset Management (WFAM) is the trade name for certain investment advisory/management firms owned by Wells Fargo & Company. These firms include but are not limited to Wells Capital Management Incorporated and Wells Fargo Funds Management, LLC. Certain products managed by WFAM entities are distributed by Wells Fargo Funds Distributor, LLC (a broker-dealer and Member FINRA).
This material is for general informational and educational purposes only and is NOT intended to provide investment advice or a recommendation of any kind— including a recommendation for any specific investment, strategy, or plan.
INVESTMENT PRODUCTS: NOT FDIC INSURED ■ NO BANK GUARANTEE ■ MAY LOSE VALUE
© 2021 Wells Fargo & Company. All rights reserved.
PAR-0121-00281 02-21
SA255/SAR255 12-20
Semi-Annual Report
December 31, 2020
Wells Fargo
Short-Term Municipal Bond Fund
Reduce clutter.
Save trees.
Sign up for electronic delivery of prospectuses and shareholder reports at wellsfargo.com/ advantagedelivery
The views expressed and any forward-looking statements are as of December 31, 2020, unless otherwise noted, and are those of the Fund's portfolio managers and/or Wells Fargo Asset Management. Discussions of individual securities or the markets generally are not intended as individual recommendations. Future events or results may vary significantly from those expressed in any forward-looking statements. The views expressed are subject to change at any time in response to changing circumstances in the market. Wells Fargo Asset Management and the Fund disclaim any obligation to publicly update or revise any views expressed or forward-looking statements.
INVESTMENT PRODUCTS: NOT FDIC INSURED ■ NO BANK GUARANTEE ■ MAY LOSE VALUE
Wells Fargo Short-Term Municipal Bond Fund | 1
Letter to shareholders (unaudited)
Dear Shareholder:
We are pleased to offer you this semi-annual report for the Wells Fargo Short-Term Municipal Bond Fund for the six-month period that ended December 31, 2020. Despite a deeply challenging year, dominated by the spread of COVID-19 cases and a sharp drop in economic output throughout much of the world, global stocks performed extremely well, benefiting from ongoing central bank support and rising optimism over the development and distribution of effective COVID-19 vaccines. Bonds also had positive returns, led by global bonds and high-yield bonds.
For the six-month period, U.S. stocks, based on the S&P 500 Index,1 gained 22.16%. International stocks, as measured by the MSCI ACWI ex USA Index (Net),2 returned 24.33%, while the MSCI EM Index (Net),3 had even stronger performance, with a 31.14% gain. Among bond indexes, the Bloomberg Barclays U.S. Aggregate Bond Index,4 returned 1.29%, the Bloomberg Barclays Global Aggregate ex-USD Index (unhedged),5 gained 9.44%, and the Bloomberg Barclays Municipal Bond Index,6 returned 3.07% while the ICE BofA U.S. High Yield Index,7 gained a hefty 11.49%.
The stock market rally continued in July.
After a volatile first half of the year, an existing stock market rally continued in July with strong results for equities and fixed income. However, economic data and a resurgence of COVID-19 cases underscored the urgent need to regain control of the pandemic. Second-quarter gross domestic product (GDP) shrank from the previous quarter by 9.5% and 12.1% in the U.S. and the eurozone, respectively. In contrast, China’s second-quarter GDP grew 3.2% year over year. The U.S. economy added 1.8 million jobs in July, but a double-digit jobless rate persisted.
The stock market continued to rally in August despite concerns over rising numbers of U.S. and European COVID-19 cases as well as the expiration of the $600 weekly bonus unemployment benefit in July. Relatively strong second-quarter earnings boosted investor sentiment along with the U.S. Federal Reserve’s announcement of a monetary policy shift expected to support longer-term low interest rates. U.S. manufacturing and services activity indexes beat expectations, while the U.S. housing market maintained strength. In Europe, retail sales expanded and consumer confidence was steady. China’s economy continued to expand.
Andrew Owen
President
Wells Fargo Funds
“After a volatile first half of the year, an existing stock market rally continued in July with strong results for equities and fixed income.”
| 1 | The S&P 500 Index consists of 500 stocks chosen for market size, liquidity, and industry group representation. It is a market-value-weighted index with each stock's weight in the index proportionate to its market value. You cannot invest directly in an index. |
| 2 | The Morgan Stanley Capital International (MSCI) All Country World Index (ACWI) ex USA Index (Net) is a free-float-adjusted market-capitalization-weighted index that is designed to measure the equity market performance of developed and emerging markets, excluding the United States. Source: MSCI. MSCI makes no express or implied warranties or representations and shall have no liability whatsoever with respect to any MSCI data contained herein. The MSCI data may not be further redistributed or used as a basis for other indices or any securities or financial products. This report is not approved, reviewed, or produced by MSCI. You cannot invest directly in an index. |
| 3 | The MSCI Emerging Markets (EM) Index (Net) is a free-float-adjusted market-capitalization-weighted index that is designed to measure equity market performance of emerging markets. You cannot invest directly in an index. |
| 4 | The Bloomberg Barclays U.S. Aggregate Bond Index is a broad-based benchmark that measures the investment-grade, U.S. dollar-denominated, fixed-rate taxable bond market, including Treasuries, government-related and corporate securities, mortgage-backed securities (agency fixed-rate and hybrid adjustable-rate mortgage pass-throughs), asset-backed securities, and commercial mortgage-backed securities. You cannot invest directly in an index. |
| 5 | The Bloomberg Barclays Global Aggregate ex-USD Index (unhedged) is an unmanaged index that provides a broad-based measure of the global investment-grade fixed-income markets excluding the U.S. dollar-denominated debt market. You cannot invest directly in an index. |
| 6 | The Bloomberg Barclays Municipal Bond Index is an unmanaged index composed of long-term tax-exempt bonds with a minimum credit rating of Baa. You cannot invest directly in an index. |
| 7 | The ICE BofA U.S. High Yield Index is a market-capitalization-weighted index of domestic and Yankee high-yield bonds. The index tracks the performance of high-yield securities traded in the U.S. bond market. You cannot invest directly in an index. Copyright 2021. ICE Data Indices, LLC. All rights reserved. |
2 | Wells Fargo Short-Term Municipal Bond Fund
Letter to shareholders (unaudited)
Stocks grew more volatile in September on mixed economic data. U.S. economic activity continued to grow. However, U.S. unemployment remained elevated at 7.9% in September. With U.S. Congress delaying further fiscal relief and uncertainties surrounding a possible vaccine, doubts crept back into the financial markets. In the U.K., a lack of progress in Brexit talks weighed on markets. China’s economy picked up steam, fueled by increased global demand.
In October, capital markets stepped back from their six-month rally. Market volatility rose in advance of the U.S. election and amid a global increase in COVID-19 infections. Europe introduced tighter restrictions affecting economic activity. U.S. markets looked favorably at the prospect of Democratic control of the federal purse strings, which could lead to additional fiscal stimulus and a boost to economic activity. Meanwhile, China reported 4.9% third-quarter GDP growth.
Global stocks rallied in November, propelled by optimism over three promising COVID-19 vaccines. Reversing recent trends, value stocks outperformed growth stocks and cyclical stocks outpaced technology stocks. However, U.S. unemployment remained elevated, with a net job loss of 10 million since February. The eurozone services Purchasing Managers’ Index, a monthly survey of purchasing managers, contracted sharply while the region’s manufacturing activity grew. The U.S. election results added to the upbeat mood as investors anticipated more consistent policies in the new administration.
Financial markets ended the year with strength on high expectations for a rapid rollout of the COVID-19 vaccines, the successful passage of a $900 billion stimulus package, and rising expectations of additional economic support from a Democratic-led Congress. U.S. economic data were mixed with still-elevated unemployment and weak retail sales but growth in manufacturing output. In contrast, China’s economic expansion continued in both manufacturing and nonmanufacturing. U.S. COVID-19 infection rates continued to rise even as new state and local lockdown measures were implemented.
Don’t let short-term uncertainty derail long-term investment goals.
Periods of investment uncertainty can present challenges, but experience has taught us that maintaining long-term investment goals can be an effective way to plan for the future. To help you create a sound strategy based on your personal goals and risk tolerance, Wells Fargo Funds offers more than 100 mutual funds spanning a wide range of asset classes and investment styles. Although diversification cannot guarantee an investment profit or prevent losses, we believe it can be an effective way to manage investment risk and potentially smooth out overall portfolio performance. We encourage investors to know their investments and to understand that appropriate levels of risk-taking may unlock opportunities.
Thank you for choosing to invest with Wells Fargo Funds. We appreciate your confidence in us and remain committed to helping you meet your financial needs.
Sincerely,
Andrew Owen
President
Wells Fargo Funds
“Global stocks rallied in November, propelled by optimism over three promising COVID-19 vaccines.”
For further information about your Fund, contact your investment professional, visit our website at wfam.com, or call us directly at 1-800-222-8222.
Wells Fargo Short-Term Municipal Bond Fund | 3
Letter to shareholders (unaudited)
Preparing for LIBOR Transition
The global financial industry is preparing to transition away from the London Interbank Offered Rate (LIBOR), a key benchmark interest rate, to new alternative rates. LIBOR underpins more than $350 trillion of financial contracts. It is the benchmark rate for a wide spectrum of products ranging from residential mortgages to corporate bonds to derivatives. Regulators have called for a market-wide transition away from LIBOR to successor reference rates by the end of 2021 (expected to be extended through June 30, 2023 for most tenors of the U.S. dollar LIBOR), which requires proactive steps be taken by issuers, counterparties, and asset managers to identify impacted products and adopt new reference rates.
The Fund holds at least one security that uses LIBOR as a floating reference rate and has a maturity date after 12-31-2021.
Although the transition process away from LIBOR has become increasingly well-defined in advance of the anticipated discontinuation date, there remains uncertainty regarding the nature of successor reference rates, and any potential effects of the transition away from LIBOR on investment instruments that use it as a benchmark rate. The transition process may result in, among other things, increased volatility or illiquidity in markets for instruments that currently rely on LIBOR and could negatively impact the value of certain instruments held by the Fund.
Wells Fargo Asset Management is monitoring LIBOR exposure closely and has put resources and controls in place to manage this transition effectively. The Fund’s portfolio management team is evaluating LIBOR holdings to understand what happens to those securities when LIBOR ceases to exist, including examining security documentation to identify the presence or absence of fallback language identifying a replacement rate to LIBOR.
While the pace of transition away from LIBOR will differ by asset class and investment strategy, the portfolio management team will monitor market conditions for those holdings to identify and mitigate deterioration or volatility in pricing and liquidity and ensure appropriate actions are taken in a timely manner.
Further information regarding the potential risks associated with the discontinuation of LIBOR can be found in the Fund’s Statement of Additional Information.
4 | Wells Fargo Short-Term Municipal Bond Fund
This page is intentionally left blank.
Performance highlights (unaudited)
Investment objective
The Fund seeks current income exempt from federal income tax consistent with capital preservation.
Manager
Wells Fargo Funds Management, LLC
Portfolio managers
Bruce Johns
Brandon Pae*
Nicholos Venditti*
Average annual total returns (%) as of December 31, 2020
| | | Including sales charge | | Excluding sales charge | | Expense ratios1 (%) |
| | Inception date | 1 year | 5 year | 10 year | | 1 year | 5 year | 10 year | | Gross | Net 2 |
| Class A (WSMAX) | 7-18-2008 | -0.21 | 1.06 | 1.36 | | 1.82 | 1.47 | 1.57 | | 0.76 | 0.63 |
| Class C (WSSCX) | 1-31-2003 | 0.06 | 0.71 | 0.81 | | 1.06 | 0.71 | 0.81 | | 1.51 | 1.38 |
| Class R6 (WSSRX)3 | 7-31-2018 | – | – | – | | 2.10 | 1.73 | 1.80 | | 0.38 | 0.35 |
| Administrator Class (WSTMX) | 7-30-2010 | – | – | – | | 1.85 | 1.50 | 1.58 | | 0.70 | 0.60 |
| Institutional Class (WSBIX) | 3-31-2008 | – | – | – | | 2.05 | 1.70 | 1.79 | | 0.43 | 0.40 |
| Bloomberg Barclays 1-3 Year Composite Municipal Bond Index4 | – | – | – | – | | 2.36 | 1.72 | 1.53 | | – | – |
Figures quoted represent past performance, which is no guarantee of future results, and do not reflect taxes that a shareholder may pay on an investment in a fund. Investment return and principal value of an investment will fluctuate so that an investor’s shares, when redeemed, may be worth more or less than their original cost. Performance shown without sales charges would be lower if sales charges were reflected. Current performance may be lower or higher than the performance data quoted, which assumes the reinvestment of dividends and capital gains. Current month-end performance is available on the Fund’s website, wfam.com.
Index returns do not include transaction costs associated with buying and selling securities, any mutual fund fees or expenses, or any taxes. It is not possible to invest directly in an index.
For Class A shares, the maximum front-end sales charge is 2.00%. For Class C shares, the maximum contingent deferred sales charge is 1.00%. Performance including a contingent deferred sales charge assumes the sales charge for the corresponding time period. Class R6, Administrator Class, and Institutional Class shares are sold without a front-end sales charge or contingent deferred sales charge.
Bond values fluctuate in response to the financial condition of individual issuers, general market and economic conditions, and changes in interest rates. Changes in market conditions and government policies may lead to periods of heightened volatility in the bond market and reduced liquidity for certain bonds held by the Fund. In general, when interest rates rise, bond values fall and investors may lose principal value. Interest rate changes and their impact on the fund and its share price can be sudden and unpredictable. The use of derivatives may reduce returns and/or increase volatility. Certain investment strategies tend to increase the total risk of an investment (relative to the broader market). The Fund is exposed to high-yield securities risk and municipal securities risk. Consult the Fund’s prospectus for additional information on these and other risks. A portion of the Fund’s income may be subject to federal, state, and/or local income taxes or the Alternative Minimum Tax (AMT). Any capital gains distributions may be taxable.
Please see footnotes on page 7.
6 | Wells Fargo Short-Term Municipal Bond Fund
Performance highlights (unaudited)
| Effective matuirty distrbution as of December 31, 20205 |
| Credit quality as of December 31, 20206 |
| * | Mr. Pae and Mr. Venditti became portfolio managers of the Fund on September 1, 2020. |
| 1 | Reflects the expense ratios as stated in the most recent prospectuses. The expense ratios shown are subject to change and may differ from the annualized expense ratios shown in the financial highlights of this report. |
| 2 | The manager has contractually committed through October 31, 2021, to waive fees and/or reimburse expenses to the extent necessary to cap total annual fund operating expenses after fee waivers at 0.63% for Class A, 1.38% for Class C, 0.35% for Class R6, 0.60% for Administrator Class, and 0.40% for Institutional Class. Brokerage commissions, stamp duty fees, interest, taxes, acquired fund fees and expenses (if any), and extraordinary expenses are excluded from the expense caps. Prior to or after the commitment expiration date, the caps may be increased or the commitment to maintain the caps may be terminated only with the approval of the Board of Trustees. Without these caps, the Fund’s returns would have been lower. The expense ratio paid by an investor is the net expense ratio (the total annual fund operating expenses after fee waivers) as stated in the prospectuses. |
| 3 | Historical performance shown for the Class R6 shares prior to their inception reflects the performance of the Institutional Class shares, and includes the higher expenses applicable to the Institutional Class shares. If these expenses had not been included, returns for the Class R6 shares would be higher. |
| 4 | The Bloomberg Barclays 1-3 Year Composite Municipal Bond Index is a blended index weighted 50% in the Bloomberg Barclays 1-Year Municipal Bond Index and 50% in the Barclays 3-Year Municipal Bond Index. You cannot invest directly in an index. |
| 5 | Figures represent the percentage of the Fund's long-term investments. These amounts are subject to change and may have changed since the date specified. |
| 6 | The credit quality distribution of portfolio holdings reflected in the chart is based on ratings from Standard & Poor’s, Moody’s Investors Service, and/ or Fitch Ratings Ltd. Credit quality ratings apply to the underlying holdings of the Fund and not to the Fund itself. The percentages of the Fund’s portfolio with the ratings depicted in the chart are calculated based on the total market value of fixed income securities held by the Fund. If a security was rated by all three rating agencies, the middle rating was utilized. If rated by two of three rating agencies, the lower rating was utilized, and if rated by one of the rating agencies, that rating was utilized. Standard & Poor’s rates the creditworthiness of bonds, ranging from AAA (highest) to D (lowest). Ratings from A to CCC may be modified by the addition of a plus (+) or minus (-) sign to show relative standing within the rating categories. Standard & Poor’s rates the creditworthiness of short-term notes from SP-1 (highest) to SP-3 (lowest). Moody’s rates the creditworthiness of bonds, ranging from Aaa (highest) to C (lowest). Ratings Aa to B may be modified by the addition of a number 1 (highest) to 3 (lowest) to show relative standing within the ratings categories. Moody’s rates the creditworthiness of short-term U.S. tax-exempt municipal securities from MIG 1/VMIG 1 (highest) to SG (lowest). Fitch rates the creditworthiness of bonds, ranging from AAA (highest) to D (lowest). Credit quality distribution is subject to change and may have changed since the date specified. |
Wells Fargo Short-Term Municipal Bond Fund | 7
Fund expenses (unaudited)
As a shareholder of the Fund, you incur two types of costs: (1) transaction costs, including sales charges (loads) on purchase payments and contingent deferred sales charges (if any) on redemptions and (2) ongoing costs, including management fees, distribution (12b-1) and/or shareholder servicing fees, and other Fund expenses. This example is intended to help you understand your ongoing costs (in dollars) of investing in the Fund and to compare these costs with the ongoing costs of investing in other mutual funds.
The example is based on an investment of $1,000 invested at the beginning of the six-month period and held for the entire period from July 1, 2020 to December 31, 2020.
Actual expenses
The “Actual” line of the table below provides information about actual account values and actual expenses. You may use the information in this line, together with the amount you invested, to estimate the expenses that you paid over the period. Simply divide your account value by $1,000 (for example, an $8,600 account value divided by $1,000 = 8.6), then multiply the result by the number in the “Actual” line under the heading entitled “Expenses paid during period” for your applicable class of shares to estimate the expenses you paid on your account during this period.
Hypothetical example for comparison purposes
The “Hypothetical” line of the table below provides information about hypothetical account values and hypothetical expenses based on the Fund’s actual expense ratio and an assumed rate of return of 5% per year before expenses, which is not the Fund’s actual return. The hypothetical account values and expenses may not be used to estimate the actual ending account balance or expenses you paid for the period. You may use this information to compare the ongoing costs of investing in the Fund and other funds. To do so, compare this 5% hypothetical example with the 5% hypothetical examples that appear in the shareholder reports of the other funds.
Please note that the expenses shown in the table are meant to highlight your ongoing costs only and do not reflect any transactional costs, such as sales charges (loads) and contingent deferred sales charges. Therefore, the “Hypothetical” line of the table is useful in comparing ongoing costs only and will not help you determine the relative total costs of owning different funds. In addition, if these transactional costs were included, your costs would have been higher.
| | Beginning
account value
7-1-2020 | Ending
account value
12-31-2020 | Expenses
paid during
the period1 | Annualized net
expense ratio |
| Class A | | | | |
| Actual | $1,000.00 | $1,012.36 | $3.20 | 0.63% |
| Hypothetical (5% return before expenses) | $1,000.00 | $1,022.03 | $3.21 | 0.63% |
| Class C | | | | |
| Actual | $1,000.00 | $1,008.52 | $6.99 | 1.38% |
| Hypothetical (5% return before expenses) | $1,000.00 | $1,018.25 | $7.02 | 1.38% |
| Class R6 | | | | |
| Actual | $1,000.00 | $1,013.76 | $1.78 | 0.35% |
| Hypothetical (5% return before expenses) | $1,000.00 | $1,023.44 | $1.79 | 0.35% |
| Administrator Class | | | | |
| Actual | $1,000.00 | $1,013.52 | $3.05 | 0.60% |
| Hypothetical (5% return before expenses) | $1,000.00 | $1,022.18 | $3.06 | 0.60% |
| Institutional Class | | | | |
| Actual | $1,000.00 | $1,013.50 | $2.03 | 0.40% |
| Hypothetical (5% return before expenses) | $1,000.00 | $1,023.19 | $2.04 | 0.40% |
1 Expenses paid is equal to the annualized net expense ratio of each class multiplied by the average account value over the period, multiplied by the number of days in the most recent fiscal half-year divided by the number of days in the fiscal year (to reflect the one-half-year period).
8 | Wells Fargo Short-Term Municipal Bond Fund
Portfolio of investments—December 31, 2020 (unaudited)
| | | | | Principal | Value |
| Closed end municipal bond fund obligations: 0.89% | | | | | |
| California: 0.53% | | | | | |
| Nuveen California AMT-Free Quality Municipal Income Fund MuniFund Preferred Shares Series A (144 shares) 0.51% 144Aø | | | | $14,400,000 | 14,400,000 |
| Other: 0.36% | | | | | |
| Nuveen AMT-Free Municipal Credit Income Fund MuniFund Preferred Shares Series B (10,000 shares) 0.51% 144Aø | | | | 10,000,000 | 10,000,000 |
| Total Closed end municipal bond fund obligations (Cost $24,400,000) | | | | | 24,400,000 |
| | | Interest
rate | Maturity
date | | |
| Municipal obligations: 97.10% | | | | | |
| Alabama: 3.04% | | | | | |
| Airport revenue: 0.08% | | | | | |
| Birmingham AL Airport Authority Series 2020 (BAM Insured) | | 5.00 | 7-1-2023 | 475,000 | 525,573 |
| Birmingham AL Airport Authority Series 2020 (BAM Insured) | | 5.00 | 7-1-2026 | 900,000 | 1,099,143 |
| Birmingham AL Airport Authority Series 2020 (BAM Insured) | | 5.00 | 7-1-2027 | 500,000 | 624,820 |
| | | | | | 2,249,536 |
| Health revenue: 0.24% | | | | | |
| Alabama Health Care Authority for Baptist Health Series B ø | | 0.35 | 11-1-2042 | 6,500,000 | 6,500,000 |
| Industrial development revenue: 0.35% | | | | | |
| Mobile AL Industrial Development Board Alabama Power Company Barry Plant Project Series A | | 1.00 | 6-1-2034 | 8,500,000 | 8,714,965 |
| Selma AL Industrial Development Board Refunding Bonds Gulf Opportunity Zone International Paper Company | | 2.00 | 11-1-2033 | 1,000,000 | 1,056,640 |
| | | | | | 9,771,605 |
| Utilities revenue: 2.37% | | | | | |
| Alabama Black Belt Energy Gas District Series A | | 4.00 | 6-1-2024 | 3,640,000 | 4,054,705 |
| Alabama Black Belt Energy Gas District Series A (Royal Bank of Canada LIQ) | | 4.00 | 8-1-2047 | 3,880,000 | 4,074,790 |
| Alabama Black Belt Energy Gas District Series A | | 4.00 | 12-1-2048 | 8,000,000 | 8,756,640 |
| Alabama Black Belt Energy Gas District Series A | | 4.00 | 10-1-2049 | 9,500,000 | 11,160,220 |
| Chatom AL Industrial Development Board Alabama Electric Series A (National Rural Utilities Cooperative Finance SPA)ø | | 0.38 | 8-1-2037 | 12,457,000 | 12,457,000 |
| Chatom AL Industrial Development Board Gulf Opportunity Zone Powersouth Energy Cooperative Projects Series 2020 (AGM Insured) | | 5.00 | 8-1-2024 | 985,000 | 1,127,175 |
| Chatom AL Industrial Development Board Gulf Opportunity Zone Powersouth Energy Cooperative Projects Series 2020 (AGM Insured) | | 5.00 | 8-1-2025 | 425,000 | 501,823 |
The accompanying notes are an integral part of these financial statements.
Wells Fargo Short-Term Municipal Bond Fund | 9
Portfolio of investments—December 31, 2020 (unaudited)
| | | Interest
rate | Maturity
date | Principal | Value |
| Utilities revenue (continued) | | | | | |
| Chatom AL Industrial Development Board Gulf Opportunity Zone Powersouth Energy Cooperative Projects Series 2020 (AGM Insured) | | 5.00% | 8-1-2026 | $ 500,000 | $ 605,925 |
| Southeast Alabama Gas Supply District Project #2 Series A | | 4.00 | 6-1-2049 | 20,060,000 | 22,268,606 |
| | | | | | 65,006,884 |
| | | | | | 83,528,025 |
| Alaska: 0.44% | | | | | |
| Health revenue: 0.18% | | | | | |
| Alaska Industrial Development and Export Authority Tanana Chiefs Conference Project | | 5.00 | 10-1-2023 | 600,000 | 672,396 |
| Alaska Industrial Development and Export Authority Tanana Chiefs Conference Project | | 5.00 | 10-1-2024 | 750,000 | 869,783 |
| Alaska Industrial Development and Export Authority Tanana Chiefs Conference Project | | 5.00 | 10-1-2025 | 1,310,000 | 1,569,839 |
| Alaska Industrial Development and Export Authority Tanana Chiefs Conference Project | | 5.00 | 10-1-2026 | 1,385,000 | 1,708,744 |
| | | | | | 4,820,762 |
| Miscellaneous revenue: 0.12% | | | | | |
| Alaska Municipal Bond Bank Refunding Bond Series 2020-1 | | 5.00 | 12-1-2025 | 1,470,000 | 1,769,850 |
| Alaska Municipal Bond Bank Refunding Bond Series 2020-1 | | 5.00 | 12-1-2026 | 1,350,000 | 1,666,751 |
| | | | | | 3,436,601 |
| Utilities revenue: 0.05% | | | | | |
| Alaska IDA Snettisham Hydroelectric Project | | 5.00 | 1-1-2021 | 1,400,000 | 1,400,000 |
| Water & sewer revenue: 0.09% | | | | | |
| North Slope Borough Service Area Water & Wastewater Facilities | | 5.25 | 6-30-2034 | 2,445,000 | 2,495,538 |
| | | | | | 12,152,901 |
| Arizona: 2.65% | | | | | |
| Education revenue: 0.10% | | | | | |
| Cochise County AZ Community College District of Cochise County Series 2016A (BAM Insured) | | 5.00 | 7-1-2021 | 425,000 | 434,053 |
| Pima County AZ IDA Education Facility Odyssey Preparatory Academy Goodyear Project | | 7.00 | 6-1-2034 | 312,000 | 320,368 |
| Pima County AZ IDA Education Facility Odyssey Preparatory Academy Goodyear Project | | 7.13 | 6-1-2049 | 1,950,000 | 2,003,294 |
| | | | | | 2,757,715 |
| GO revenue: 0.11% | | | | | |
| Vistancia AZ Community Facilities District GO Series 2020 (BAM Insured) | | 3.00 | 7-15-2022 | 700,000 | 727,692 |
The accompanying notes are an integral part of these financial statements.
10 | Wells Fargo Short-Term Municipal Bond Fund
Portfolio of investments—December 31, 2020 (unaudited)
| | | Interest
rate | Maturity
date | Principal | Value |
| GO revenue (continued) | | | | | |
| Vistancia AZ Community Facilities District GO Series 2020 (BAM Insured) | | 4.00% | 7-15-2024 | $ 1,150,000 | $ 1,288,621 |
| Vistancia AZ Community Facilities District GO Series 2020 (BAM Insured) | | 4.00 | 7-15-2026 | 900,000 | 1,059,255 |
| | | | | | 3,075,568 |
| Health revenue: 0.88% | | | | | |
| Maricopa County AZ IDA Series 2019C (SIFMA Municipal Swap+0.57%)± | | 0.66 | 1-1-2035 | 4,730,000 | 4,707,296 |
| Maricopa County AZ IDA Series 2019C (SIFMA Municipal Swap+0.80%)± | | 0.89 | 9-1-2048 | 9,000,000 | 8,966,970 |
| Scottsdale AZ IDA Healthcare Series F (AGM Insured)€ | | 0.17 | 9-1-2045 | 4,500,000 | 4,500,000 |
| Tempe AZ IDA Mirabella Arizona State University Project Series B1 144A | | 4.00 | 10-1-2023 | 6,000,000 | 6,000,840 |
| | | | | | 24,175,106 |
| Industrial development revenue: 1.39% | | | | | |
| Chandler AZ IDA Intel Corporation Project | | 2.40 | 12-1-2035 | 32,885,000 | 34,580,879 |
| Chandler AZ IDA Intel Corporation Project | | 2.70 | 12-1-2037 | 1,175,000 | 1,241,270 |
| Chandler AZ IDA Intel Corporation Project | | 5.00 | 6-1-2049 | 2,000,000 | 2,300,340 |
| | | | | | 38,122,489 |
| Miscellaneous revenue: 0.17% | | | | | |
| Arizona Board of Regents Certificate of Participation Series A | | 5.00 | 6-1-2021 | 3,000,000 | 3,054,870 |
| Navajo Nation AZ Tribal Utility Authority (Municipal Government Guaranty Insured) | | 4.00 | 1-1-2021 | 1,621,000 | 1,621,000 |
| | | | | | 4,675,870 |
| | | | | | 72,806,748 |
| Arkansas: 0.06% | | | | | |
| Health revenue: 0.06% | | | | | |
| Batesville AR Public Facilities Board Hospital Series 2020 | | 5.00 | 6-1-2025 | 1,385,000 | 1,530,550 |
| California: 5.14% | | | | | |
| GO revenue: 1.00% | | | | | |
| California Series B (SIFMA Municipal Swap+0.38%)± | | 0.47 | 12-1-2027 | 20,000,000 | 19,997,000 |
| Kern CA Community College District CAB Anticipation Notes Facilities ¤ | | 0.00 | 8-1-2023 | 7,000,000 | 6,903,470 |
| San Ysidro CA School District (AGM Insured)¤ | | 0.00 | 8-1-2047 | 3,610,000 | 512,909 |
| | | | | | 27,413,379 |
| Health revenue: 0.12% | | | | | |
| California Statewide Communities Development Authority Series 2020A | | 5.00 | 4-1-2026 | 570,000 | 701,938 |
| California Statewide Communities Development Authority Series 2020A | | 5.00 | 4-1-2027 | 845,000 | 1,069,542 |
| Palomar CA Pomerado Health Care District Certificate of Participation Series C (AGM Insured)€ | | 0.57 | 11-1-2036 | 1,050,000 | 1,050,000 |
The accompanying notes are an integral part of these financial statements.
Wells Fargo Short-Term Municipal Bond Fund | 11
Portfolio of investments—December 31, 2020 (unaudited)
| | | Interest
rate | Maturity
date | Principal | Value |
| Health revenue (continued) | | | | | |
| Washington Township Health Care District Revenue Refunding Bonds Series 2020A | | 5.00% | 7-1-2024 | $ 200,000 | $ 228,064 |
| Washington Township Health Care District Revenue Refunding Bonds Series 2020A | | 5.00 | 7-1-2025 | 200,000 | 235,138 |
| | | | | | 3,284,682 |
| Housing revenue: 0.12% | | | | | |
| Mizuho Floater/Residual Trust Tender Option Bond (Mizuho Capital Markets LLC LIQ)144Aø | | 0.29 | 10-1-2036 | 3,400,000 | 3,400,000 |
| Industrial development revenue: 0.55% | | | | | |
| California Infrastructure and Economic Development Bank Revenue AMT Brightline West Passenger 144A | | 0.45 | 1-1-2050 | 15,000,000 | 15,013,950 |
| Miscellaneous revenue: 1.25% | | | | | |
| California Infrastructure & Economic Development Bank The J. Paul Getty Trust Series A-1 (1 Month LIBOR+0.33%)± | | 0.44 | 10-1-2047 | 19,000,000 | 19,016,340 |
| California Infrastructure & Economic Development Bank The J. Paul Getty Trust Series B-2 (1 Month LIBOR+0.20%)± | | 0.31 | 10-1-2047 | 8,000,000 | 8,000,080 |
| Ceres CA Financing Authority Water System Series 2020 | | 0.50 | 6-1-2050 | 7,400,000 | 7,402,442 |
| | | | | | 34,418,862 |
| Resource recovery revenue: 0.50% | | | | | |
| California Municipal Finance Authority Republic Services øø | | 0.23 | 9-1-2021 | 3,750,000 | 3,750,000 |
| California PCFA Series A 144Aøø | | 0.30 | 8-1-2023 | 10,000,000 | 9,999,900 |
| | | | | | 13,749,900 |
| Tax revenue: 0.03% | | | | | |
| Commerce CA RDA CAB Project #1 ¤ | | 0.00 | 8-1-2021 | 690,000 | 688,779 |
| Transportation revenue: 0.93% | | | | | |
| Bay Area Toll Authority San Francisco Bay Area Series C-1 (SIFMA Municipal Swap+0.90%)± | | 0.99 | 4-1-2045 | 25,500,000 | 25,683,855 |
| Utilities revenue: 0.07% | | | | | |
| Long Beach CA Bond Finance Authority Natural Gas Series B (3 Month LIBOR+1.43%)± | | 1.58 | 11-15-2026 | 2,000,000 | 2,044,960 |
| Water & sewer revenue: 0.57% | | | | | |
| California Department of Water Resources Central Valley Project Series AT (SIFMA Municipal Swap+0.37%)± | | 0.46 | 12-1-2035 | 15,500,000 | 15,541,230 |
| | | | | | 141,239,597 |
| Colorado: 1.27% | | | | | |
| Airport revenue: 0.04% | | | | | |
| Denver CO City & County Department of Aviation Airport System Series A | | 5.00 | 11-15-2024 | 1,000,000 | 1,082,200 |
| GO revenue: 0.15% | | | | | |
| Grand River CO Hospital District (AGM Insured) | | 5.00 | 12-1-2022 | 1,450,000 | 1,564,362 |
| Grand River CO Hospital District (AGM Insured) | | 5.00 | 12-1-2024 | 1,140,000 | 1,312,368 |
The accompanying notes are an integral part of these financial statements.
12 | Wells Fargo Short-Term Municipal Bond Fund
Portfolio of investments—December 31, 2020 (unaudited)
| | | Interest
rate | Maturity
date | Principal | Value |
| GO revenue (continued) | | | | | |
| Sand Creek CO Metropolitan District GO Series 2020A (AGM Insured) | | 4.00% | 12-1-2024 | $ 550,000 | $ 620,048 |
| Sand Creek CO Metropolitan District GO Series 2020A (AGM Insured) | | 4.00 | 12-1-2025 | 400,000 | 462,992 |
| | | | | | 3,959,770 |
| Health revenue: 0.60% | | | | | |
| Colorado Health Facilities Authority Hospital Adventhealth Oblligated Group Series B | | 5.00 | 11-15-2049 | 900,000 | 1,137,249 |
| Colorado Health Facilities Authority Improvement Christian Living | | 4.00 | 1-1-2025 | 325,000 | 347,737 |
| University of Colorado Hospital Authority Series 2017C-1 | | 5.00 | 11-15-2038 | 14,630,000 | 15,061,292 |
| | | | | | 16,546,278 |
| Miscellaneous revenue: 0.32% | | | | | |
| Colorado Bridge Enterprise Central 70 Project Series 2017 | | 4.00 | 12-31-2023 | 1,285,000 | 1,403,002 |
| Colorado Bridge Enterprise Central 70 Project Series 2017 | | 4.00 | 12-31-2025 | 2,455,000 | 2,811,540 |
| Colorado Bridge Enterprise Central 70 Project Series 2017 | | 4.00 | 6-30-2026 | 4,050,000 | 4,670,420 |
| | | | | | 8,884,962 |
| Tax revenue: 0.02% | | | | | |
| Colorado Regional Trasportation District Series 2020A & Series 2020B | | 4.00 | 7-15-2033 | 500,000 | 621,485 |
| Transportation revenue: 0.11% | | | | | |
| E-470 Public Highway Authority Colorado Series A | | 5.00 | 9-1-2024 | 450,000 | 524,385 |
| E-470 Public Highway Authority Colorado Series A | | 5.00 | 9-1-2025 | 300,000 | 362,016 |
| E-470 Public Highway Authority Colorado Series A | | 5.00 | 9-1-2026 | 1,750,000 | 2,181,690 |
| | | | | | 3,068,091 |
| Water & sewer revenue: 0.03% | | | | | |
| Central Weld County CO Water District Series 2020 (AGM Insured) | | 5.00 | 12-1-2027 | 500,000 | 645,030 |
| | | | | | 34,807,816 |
| Connecticut: 2.87% | | | | | |
| Education revenue: 1.31% | | | | | |
| Connecticut HEFAR University of Hartford Series N | | 5.00 | 7-1-2024 | 120,000 | 132,052 |
| Connecticut HEFAR University of Hartford Series N | | 5.00 | 7-1-2025 | 140,000 | 157,440 |
| Connecticut HEFAR Yale University Issue Series A | | 1.10 | 7-1-2048 | 7,000,000 | 7,112,140 |
| Connecticut HEFAR Yale University Issue Series A | | 2.05 | 7-1-2035 | 25,000,000 | 25,259,750 |
| Connecticut Higher Education Supplemental Loan Authority Chesla Loan Program Series A | | 3.60 | 11-15-2023 | 1,265,000 | 1,347,642 |
| Connecticut Higher Education Supplemental Loan Authority Chesla Loan Program Series B | | 5.00 | 11-15-2024 | 250,000 | 282,915 |
| Connecticut Higher Education Supplemental Loan Authority Chesla Loan Program Series B | | 5.00 | 11-15-2025 | 400,000 | 462,428 |
The accompanying notes are an integral part of these financial statements.
Wells Fargo Short-Term Municipal Bond Fund | 13
Portfolio of investments—December 31, 2020 (unaudited)
| | | Interest
rate | Maturity
date | Principal | Value |
| Education revenue (continued) | | | | | |
| Connecticut Higher Education Supplemental Loan Authority Chesla Loan Program Series B | | 5.00% | 11-15-2026 | $ 585,000 | $ 688,124 |
| Connecticut Higher Education Supplemental Loan Authority Chesla Loan Program Series D | | 5.00 | 11-15-2025 | 500,000 | 598,720 |
| | | | | | 36,041,211 |
| GO revenue: 0.66% | | | | | |
| Connecticut Refunding Bond Series B | | 4.00 | 5-15-2021 | 11,190,000 | 11,342,520 |
| Connecticut Series C | | 4.00 | 6-1-2025 | 1,000,000 | 1,155,280 |
| Hamden CT GO Series 2020A (BAM Insured) | | 5.00 | 8-1-2026 | 710,000 | 850,630 |
| New Haven CT Series A | | 5.25 | 8-1-2021 | 1,830,000 | 1,870,736 |
| West Haven CT BAN Series B | | 2.00 | 9-30-2021 | 2,800,000 | 2,823,856 |
| | | | | | 18,043,022 |
| Health revenue: 0.32% | | | | | |
| Connecticut HEFAR Hartford Healthcare Series B1 | | 5.00 | 7-1-2053 | 7,500,000 | 8,811,675 |
| Housing revenue: 0.37% | | | | | |
| Meriden CT MFHR Yale Acres Project | | 1.73 | 8-1-2022 | 10,000,000 | 10,138,700 |
| Tax revenue: 0.21% | | | | | |
| Connecticut Special Tax Obligation Transportation Infrastructure Purposes Series A | | 5.00 | 5-1-2026 | 1,200,000 | 1,481,460 |
| Connecticut Special Tax Obligation Transportation Infrastructure Purposes Series A | | 5.00 | 5-1-2027 | 3,400,000 | 4,313,070 |
| | | | | | 5,794,530 |
| | | | | | 78,829,138 |
| Delaware: 0.15% | | | | | |
| Utilities revenue: 0.15% | | | | | |
| Delaware EDA Gas Facilities Delmarva Power & Light Company Series A | | 1.05 | 1-1-2031 | 4,000,000 | 4,094,960 |
| District of Columbia: 0.79% | | | | | |
| Airport revenue: 0.38% | | | | | |
| Metropolitan Washington Airport Authority Series A | | 5.00 | 10-1-2024 | 3,450,000 | 3,718,410 |
| Metropolitan Washington Airports Authority Refunding Bond Series 2014A | | 3.00 | 10-1-2022 | 6,500,000 | 6,764,810 |
| | | | | | 10,483,220 |
| Housing revenue: 0.09% | | | | | |
| District of Columbia HFA MFHR Strand Residences Project | | 1.45 | 2-1-2039 | 2,500,000 | 2,539,275 |
| Transportation revenue: 0.09% | | | | | |
| Metropolitan Washington DC Transit Authority Series A | | 5.00 | 7-15-2025 | 2,000,000 | 2,419,440 |
| Water & sewer revenue: 0.23% | | | | | |
| District of Columbia Water and Sewer Authority Public Utility Subordinated Lien Bond Series C | | 1.75 | 10-1-2054 | 6,000,000 | 6,281,400 |
| | | | | | 21,723,335 |
The accompanying notes are an integral part of these financial statements.
14 | Wells Fargo Short-Term Municipal Bond Fund
Portfolio of investments—December 31, 2020 (unaudited)
| | | Interest
rate | Maturity
date | Principal | Value |
| Florida: 3.23% | | | | | |
| Airport revenue: 0.17% | | | | | |
| Broward County FL Airport System Series C | | 5.00% | 10-1-2022 | $ 2,000,000 | $ 2,155,620 |
| Greater Orlando Aviation Authority Florida Airport Facilities Series A | | 5.00 | 10-1-2025 | 2,000,000 | 2,398,760 |
| | | | | | 4,554,380 |
| Education revenue: 0.28% | | | | | |
| Capital Projects Finance Authority Student Housing Refunding Series 2020A-1 | | 5.00 | 10-1-2024 | 500,000 | 548,650 |
| Capital Projects Finance Authority Student Housing Refunding Series 2020A-1 | | 5.00 | 10-1-2025 | 1,000,000 | 1,118,150 |
| Capital Projects Finance Authority Student Housing Refunding Series 2020A-1 | | 5.00 | 10-1-2026 | 1,000,000 | 1,134,560 |
| Florida Higher Educational Facilities Financing Authority Educational Facilities Institute Technology | | 5.00 | 10-1-2025 | 500,000 | 561,700 |
| Florida Higher Educational Facilities Financing Authority Educational Facilities Institute Technology | | 5.00 | 10-1-2026 | 750,000 | 855,233 |
| University of North Florida Financing Corporation Capital Housing Project (AGM Insured) | | 5.00 | 11-1-2021 | 3,440,000 | 3,549,461 |
| | | | | | 7,767,754 |
| Health revenue: 0.34% | | | | | |
| North Broward FL Hospital District Series B | | 5.00 | 1-1-2022 | 1,570,000 | 1,634,025 |
| North Broward FL Hospital District Series B | | 5.00 | 1-1-2023 | 1,700,000 | 1,842,103 |
| North Broward FL Hospital District Series B | | 5.00 | 1-1-2024 | 2,000,000 | 2,248,860 |
| Palm Beach County FL HCFR Retirement Life Communities Series 2016 | | 5.00 | 11-15-2021 | 3,515,000 | 3,640,169 |
| | | | | | 9,365,157 |
| Housing revenue: 0.24% | | | | | |
| Miami-Dade County FL HFA MFHR Liberty Square Phase Two Project | | 1.42 | 11-1-2040 | 6,500,000 | 6,583,980 |
| Industrial development revenue: 0.36% | | | | | |
| Martin County FL PCR Adjusted Refunding Florida Power And Light Company Project ø | | 0.13 | 7-15-2022 | 10,000,000 | 10,000,000 |
| Miscellaneous revenue: 0.48% | | | | | |
| Miami-Dade County FL School Board Certificate of Participation Series A | | 5.00 | 5-1-2031 | 10,115,000 | 11,604,333 |
| St. Johns County FL School Board Refunding Bond Certificate of Participation | | 5.00 | 7-1-2021 | 1,670,000 | 1,709,061 |
| | | | | | 13,313,394 |
| Resource recovery revenue: 0.07% | | | | | |
| Lee County FL Solid Waste System Refunding Bond | | 5.00 | 10-1-2023 | 1,750,000 | 1,945,440 |
| Tax revenue: 0.54% | | | | | |
| Department of Environmental Protection Florida Forever Series A | | 5.00 | 7-1-2023 | 7,720,000 | 8,265,341 |
| Leon County FL School District | | 4.00 | 9-1-2026 | 6,000,000 | 6,549,540 |
| | | | | | 14,814,881 |
The accompanying notes are an integral part of these financial statements.
Wells Fargo Short-Term Municipal Bond Fund | 15
Portfolio of investments—December 31, 2020 (unaudited)
| | | Interest
rate | Maturity
date | Principal | Value |
| Transportation revenue: 0.05% | | | | | |
| Osceola County FL Improvement Osceola Parkway Series | | 5.00% | 10-1-2024 | $ 300,000 | $ 345,045 |
| Osceola County FL Improvement Osceola Parkway Series | | 5.00 | 10-1-2026 | 735,000 | 891,790 |
| | | | | | 1,236,835 |
| Utilities revenue: 0.07% | | | | | |
| JEA Bulk Power Supply System Scherer 4 Project Series A | | 3.00 | 10-1-2022 | 1,800,000 | 1,803,150 |
| Water & sewer revenue: 0.63% | | | | | |
| Tohopekaliga FL Water Authority Utility System Bond 144A | | 5.00 | 10-1-2025 | 14,160,000 | 17,331,557 |
| | | | | | 88,716,528 |
| Georgia: 3.39% | | | | | |
| Health revenue: 0.05% | | | | | |
| Cobb County GA Kennestone Hospital Authority Series 2020B %% | | 5.00 | 4-1-2026 | 1,000,000 | 1,223,350 |
| Housing revenue: 0.38% | | | | | |
| Cobb County GA Housing Authority MFHR White Circle Phase 2 Project | | 1.65 | 12-1-2022 | 6,000,000 | 6,032,040 |
| Northwest Georgia Housing Authority MFHR Park Homes Apartments Project (FHA Insured) | | 1.54 | 8-1-2022 | 4,500,000 | 4,531,095 |
| | | | | | 10,563,135 |
| Industrial development revenue: 0.20% | | | | | |
| Savannah GA EDA PCR International Paper Company Project Series B | | 1.90 | 8-1-2024 | 4,250,000 | 4,465,050 |
| Savannah GA EDA Recovery Zone Facility International | | 2.00 | 11-1-2033 | 1,000,000 | 1,056,640 |
| | | | | | 5,521,690 |
| Utilities revenue: 2.76% | | | | | |
| Bartow County GA Development Authority Georgia Power Company Bowen Project | | 2.05 | 9-1-2029 | 4,100,000 | 4,158,835 |
| Burke County GA Development Authority Georgia Power Company Plant Vogtle Project | | 1.55 | 12-1-2049 | 4,000,000 | 4,063,840 |
| Burke County GA Development Authority Oglethorpe Power Corporation Vogtle Project Series F | | 3.00 | 11-1-2045 | 22,050,000 | 23,012,703 |
| Georgia Municipal Electric Authority Plant Vogtle Units 3&4 Project M | | 5.00 | 1-1-2025 | 200,000 | 235,066 |
| Georgia Municipal Electric Authority Plant Vogtle Units 3&4 Project M | | 5.00 | 1-1-2026 | 300,000 | 364,155 |
| Georgia Municipal Electric Authority Plant Vogtle Units 3&4 Project P | | 5.00 | 1-1-2023 | 250,000 | 271,873 |
| Georgia Municipal Electric Authority Plant Vogtle Units 3&4 Project P | | 5.00 | 1-1-2024 | 400,000 | 452,056 |
| Georgia Municipal Electric Authority Plant Vogtle Units 3&4 Project P | | 5.00 | 1-1-2025 | 1,000,000 | 1,172,740 |
| Georgia Tender Option Bond Trust Receipts/Floater Certificates Series 2019-XF2847 (Barclays Bank plc LOC, Barclays Bank plc LIQ)144Aø | | 0.13 | 1-1-2056 | 4,315,000 | 4,315,000 |
| Main Street Natural Gas Incorporated Georgia Gas Project Series B | | 5.00 | 3-15-2021 | 2,800,000 | 2,825,004 |
The accompanying notes are an integral part of these financial statements.
16 | Wells Fargo Short-Term Municipal Bond Fund
Portfolio of investments—December 31, 2020 (unaudited)
| | | Interest
rate | Maturity
date | Principal | Value |
| Utilities revenue (continued) | | | | | |
| Main Street Natural Gas Incorporated Georgia Gas Project Series C (Royal Bank of Canada LIQ) | | 4.00% | 8-1-2048 | $ 6,225,000 | $ 6,827,144 |
| Main Street Natural Gas Incorporated Georgia Gas Project Series C | | 4.00 | 3-1-2050 | 22,750,000 | 26,717,145 |
| Monroe County GA Development Authority PCR Oglethorpe Power Corporation Scherer Project Series A | | 1.50 | 1-1-2039 | 1,500,000 | 1,531,605 |
| | | | | | 75,947,166 |
| | | | | | 93,255,341 |
| Hawaii: 0.59% | | | | | |
| Housing revenue: 0.26% | | | | | |
| Hawaii Housing Finance & Development Corporation MFHR Hale Kewalo Apartments Series A (GNMA Insured) | | 1.90 | 1-1-2021 | 7,160,000 | 7,160,000 |
| Miscellaneous revenue: 0.33% | | | | | |
| Hawaii Department of Transportation Airports Division Series 2013 | | 5.25 | 8-1-2025 | 1,945,000 | 2,145,977 |
| Hawaii Department of Transportation Airports Division Series 2013 | | 5.25 | 8-1-2026 | 6,350,000 | 6,989,128 |
| | | | | | 9,135,105 |
| | | | | | 16,295,105 |
| Illinois: 7.95% | | | | | |
| Airport revenue: 1.26% | | | | | |
| Chicago IL Midway Airport Refunding Bond Second Lien Series A | | 5.00 | 1-1-2022 | 6,100,000 | 6,363,642 |
| Chicago IL Midway Airport Refunding Bond Second Lien Series A | | 5.00 | 1-1-2025 | 5,000,000 | 5,595,300 |
| Chicago IL O'Hare International Airport Refunding Bond General Senior Lien Series B | | 5.00 | 1-1-2023 | 5,000,000 | 5,228,300 |
| Chicago IL O'Hare International Airport Refunding Bond General Senior Lien Series B | | 5.00 | 1-1-2024 | 1,550,000 | 1,620,773 |
| Chicago IL O'Hare International Airport Refunding Bond Passenger Facility | | 5.00 | 1-1-2023 | 13,720,000 | 14,308,725 |
| Chicago IL O'Hare International Airport Refunding Bond Passenger Facility | | 5.00 | 1-1-2024 | 1,335,000 | 1,502,382 |
| | | | | | 34,619,122 |
| Education revenue: 0.18% | | | | | |
| Illinois State University Auxiliary Facilities System Series A | | 5.00 | 4-1-2024 | 2,325,000 | 2,542,713 |
| Illinois State University Auxiliary Facilities System Series A (AGM Insured) | | 5.00 | 4-1-2025 | 700,000 | 819,910 |
| Illinois State University Auxiliary Facilities System Series B (AGM Insured) | | 5.00 | 4-1-2024 | 415,000 | 469,722 |
| Western Illinois University Refunding Bond Auxiliary Facilities System (BAM Insured) | | 4.00 | 4-1-2024 | 1,000,000 | 1,095,270 |
| | | | | | 4,927,615 |
The accompanying notes are an integral part of these financial statements.
Wells Fargo Short-Term Municipal Bond Fund | 17
Portfolio of investments—December 31, 2020 (unaudited)
| | | Interest
rate | Maturity
date | Principal | Value |
| GO revenue: 2.25% | | | | | |
| Chicago IL Board of Education Refunding Bond Series A (AGM Insured) | | 5.00% | 12-1-2022 | $ 500,000 | $ 537,060 |
| Chicago IL Board of Education Refunding Bond Series A (AGM Insured) | | 5.00 | 12-1-2023 | 2,000,000 | 2,223,140 |
| Chicago IL Park District Harbor Facility Series C | | 5.00 | 1-1-2022 | 3,155,000 | 3,155,000 |
| Chicago IL Park District Refunding Bond Series D | | 5.00 | 1-1-2021 | 1,000,000 | 1,000,000 |
| Chicago IL Prerefunded Refunding Bond Series C | | 5.00 | 1-1-2022 | 10,505,000 | 10,998,630 |
| Chicago IL Prerefunded Refunding Bond Series C | | 5.00 | 1-1-2023 | 1,450,000 | 1,586,257 |
| Chicago IL Refunding Bond Series A | | 5.00 | 1-1-2026 | 5,000,000 | 5,606,000 |
| Chicago IL Refunding Bond Series B (Ambac Insured) | | 5.13 | 1-1-2022 | 525,000 | 532,702 |
| Chicago IL Series C | | 5.00 | 1-1-2021 | 3,000,000 | 3,000,000 |
| Chicago IL Unrefunded Balance Refunding Bond Series C | | 5.00 | 1-1-2022 | 5,340,000 | 5,504,579 |
| Chicago IL Unrefunded Balance Refunding Bond Series C | | 5.00 | 1-1-2023 | 3,300,000 | 3,499,386 |
| Dekalb & Kane Counties IL Community Unit School District Series B (AGM Insured)¤ | | 0.00 | 1-1-2025 | 3,235,000 | 3,098,968 |
| Illinois Series 2014 | | 5.00 | 4-1-2022 | 3,000,000 | 3,142,530 |
| Illinois Series 2016 | | 5.00 | 11-1-2021 | 5,000,000 | 5,161,600 |
| Illinois Series 2020 | | 5.13 | 5-1-2022 | 2,000,000 | 2,103,780 |
| Illinois Series 2020 | | 5.38 | 5-1-2023 | 1,000,000 | 1,087,080 |
| Kane County IL School District Series B | | 2.00 | 2-1-2021 | 880,000 | 880,836 |
| Kane, McHenry, Cook & Dekalb Counties IL Community Unit School District #300 | | 4.25 | 1-1-2023 | 1,000,000 | 1,005,020 |
| Kendall, Kane & Will Counties IL Refunding Bond Series B | | 5.00 | 10-1-2022 | 1,660,000 | 1,782,541 |
| Kendall, Kane & Will Counties IL Refunding Bond Series B | | 5.00 | 10-1-2023 | 825,000 | 918,803 |
| Waukegan IL Series B (AGM Insured) | | 4.00 | 12-30-2023 | 500,000 | 548,675 |
| Whiteside & Lee Counties IL Community Unit School District Series A (BAM Insured) | | 4.00 | 12-1-2024 | 1,490,000 | 1,666,312 |
| Will County IL Community High School District #161 | | 4.00 | 1-1-2024 | 2,000,000 | 2,202,380 |
| Winnebago Boone County IL Community College District Rock Valley College Series A (AGM Insured) | | 5.00 | 1-1-2022 | 500,000 | 521,710 |
| | | | | | 61,762,989 |
| Health revenue: 0.51% | | | | | |
| Illinois Finance Authority Ascension Health Alliance Senior Credit Group Series E-2 | | 1.75 | 11-15-2042 | 2,000,000 | 2,007,020 |
| Illinois Finance Authority Health Services Facility Series 2020 | | 5.00 | 10-1-2025 | 500,000 | 591,995 |
| Illinois Finance Authority Health Services Facility Series 2020 | | 5.00 | 10-1-2026 | 500,000 | 606,865 |
| Illinois Finance Authority Revenue Advocate Health Care Network | | 4.00 | 11-1-2030 | 3,600,000 | 4,141,440 |
| Illinois Finance Authority Series 2020B-2 | | 5.00 | 5-15-2050 | 4,000,000 | 4,882,280 |
| Southwestern Illinois Development Authority Health Facility Memorial Group Incorporated | | 6.38 | 11-1-2023 | 1,505,000 | 1,664,349 |
| | | | | | 13,893,949 |
| Housing revenue: 0.28% | | | | | |
| Illinois Housing Development Authority (SIFMA Municipal Swap+1.00%)(FNMA LOC, FNMA LIQ)± | | 1.09 | 5-15-2050 | 7,500,000 | 7,578,075 |
| Miscellaneous revenue: 1.10% | | | | | |
| Chicago IL Board of Education Refunding Bond Series B | | 5.00 | 12-1-2024 | 2,270,000 | 2,501,790 |
| Chicago IL Board of Education Refunding Bond Series B | | 5.00 | 12-1-2025 | 2,460,000 | 2,769,542 |
| Illinois Refunding Bond | | 5.00 | 2-1-2022 | 4,375,000 | 4,556,694 |
| Illinois Refunding Bond | | 5.00 | 2-1-2023 | 8,775,000 | 9,403,904 |
The accompanying notes are an integral part of these financial statements.
18 | Wells Fargo Short-Term Municipal Bond Fund
Portfolio of investments—December 31, 2020 (unaudited)
| | | Interest
rate | Maturity
date | Principal | Value |
| Miscellaneous revenue (continued) | | | | | |
| Illinois Series 2014 | | 5.00% | 5-1-2021 | $ 2,000,000 | $ 2,025,760 |
| Illinois Series 2017D | | 5.00 | 11-1-2026 | 8,000,000 | 9,044,720 |
| | | | | | 30,302,410 |
| Tax revenue: 1.90% | | | | | |
| Build Illinois Bond Junior Obligation Series C | | 5.00 | 6-15-2022 | 2,985,000 | 3,141,862 |
| Chicago IL Motor Fuel Tax Refunding Bond Series 2013 | | 5.00 | 1-1-2021 | 380,000 | 380,000 |
| Chicago IL Motor Fuel Tax Refunding Bond Series 2013 | | 5.00 | 1-1-2022 | 955,000 | 974,501 |
| Chicago IL Transit Authority Sales Tax Receipts | | 5.25 | 12-1-2024 | 6,705,000 | 7,014,972 |
| Hillside IL Refunding Bond Series 2018 | | 5.00 | 1-1-2024 | 925,000 | 948,625 |
| Huntley IL Special Service Area #6 Special Tax Refunding Bond (BAM Insured) | | 2.20 | 3-1-2024 | 1,525,000 | 1,570,003 |
| Illinois Refunding Bond | | 5.00 | 1-1-2021 | 1,760,000 | 1,760,000 |
| Illinois Regional Transportation Authority Refunding Bond (AGM Insured) | | 5.75 | 6-1-2021 | 3,000,000 | 3,067,470 |
| Illinois Sales Tax Revenue Junior Obligation Series A | | 5.00 | 6-15-2023 | 5,825,000 | 6,336,552 |
| Illinois Sales Tax Revenue Junior Obligation Series C | | 4.00 | 6-15-2025 | 4,000,000 | 4,400,480 |
| Illinois Sales Tax Revenue Refunding Bond Series C | | 4.00 | 6-15-2023 | 3,315,000 | 3,526,696 |
| Illinois Series 2013 | | 5.00 | 6-15-2024 | 585,000 | 636,117 |
| Illinois Series A | | 4.00 | 1-1-2021 | 2,715,000 | 2,715,000 |
| Macon County IL Decatur School District #61 Series 2020 C (AGM Insured) | | 4.00 | 1-1-2024 | 475,000 | 519,356 |
| Macon County IL Decatur School District #61 Series 2020 C (AGM Insured) | | 4.00 | 1-1-2027 | 600,000 | 701,742 |
| Metropolitan Pier & Exposition Authority McCormick Place Project Non-Callable Bond Series B | | 5.00 | 12-15-2022 | 7,000,000 | 7,447,090 |
| Metropolitan Pier & Exposition Authority McCormick Place Project Series A (National Insured)¤ | | 0.00 | 12-15-2021 | 920,000 | 910,855 |
| Sales Tax Securitization Corporation Second Lien Sales Tax | | 5.00 | 1-1-2028 | 5,000,000 | 6,201,800 |
| | | | | | 52,253,121 |
| Tobacco revenue: 0.46% | | | | | |
| Illinois Railsplitter Tobacco Settlement Authority | | 5.00 | 6-1-2022 | 12,000,000 | 12,760,320 |
| Water & sewer revenue: 0.01% | | | | | |
| Waukegan Lake County IL First Lien Water & Sewer System Revenue Bonds Series 2020 (AGM Insured) | | 5.00 | 12-30-2027 | 280,000 | 350,456 |
| | | | | | 218,448,057 |
| Indiana: 0.82% | | | | | |
| Health revenue: 0.64% | | | | | |
| Indiana Finance Authority Health System Franciscan Alliance Incorporated Series B | | 5.00 | 11-1-2022 | 1,000,000 | 1,075,630 |
| Indiana Finance Authority Health System Franciscan Alliance Incorporated Series B | | 5.00 | 11-1-2023 | 1,270,000 | 1,422,095 |
| Indiana Finance Authority Health System Franciscan Alliance Incorporated Series B | | 5.00 | 11-1-2024 | 3,000,000 | 3,483,390 |
| Indiana Finance Authority Health System Franciscan Alliance Incorporated Series C | | 5.00 | 11-1-2021 | 1,000,000 | 1,035,770 |
| Indiana Finance Authority Health System Franciscan Alliance Incorporated Series C | | 5.00 | 11-1-2023 | 800,000 | 895,808 |
| Indiana Finance Authority Health System Franciscan Alliance Incorporated Series C | | 5.00 | 11-1-2024 | 1,000,000 | 1,161,130 |
The accompanying notes are an integral part of these financial statements.
Wells Fargo Short-Term Municipal Bond Fund | 19
Portfolio of investments—December 31, 2020 (unaudited)
| | | Interest
rate | Maturity
date | Principal | Value |
| Health revenue (continued) | | | | | |
| Indiana Finance Authority Parkview Health Series A | | 5.00% | 5-1-2021 | $ 1,020,000 | $ 1,034,647 |
| Indiana Finance Authority Parkview Health Series A | | 5.00 | 5-1-2023 | 1,010,000 | 1,118,393 |
| Indiana Finance Authority Refunding Bond University Health Obligated Group Series B | | 1.65 | 12-1-2042 | 5,130,000 | 5,197,819 |
| Indiana Finance Authority Senior Living Series A | | 5.00 | 11-15-2022 | 500,000 | 527,445 |
| Indiana Finance Authority Senior Living Series A | | 5.00 | 11-15-2023 | 500,000 | 540,915 |
| | | | | | 17,493,042 |
| Miscellaneous revenue: 0.18% | | | | | |
| Indiana Bond Bank Special Program Series A | | 5.25 | 10-15-2021 | 2,000,000 | 2,067,880 |
| Indianapolis IN Industry Local Public Improvement Bond Bank Notes Series C Fieldhouse Project | | 1.40 | 6-1-2021 | 3,000,000 | 3,000,060 |
| | | | | | 5,067,940 |
| | | | | | 22,560,982 |
| Iowa: 0.81% | | | | | |
| Education revenue: 0.09% | | | | | |
| Iowa Student Loan Liquidity Corporation AMT Senior Series B | | 5.00 | 12-1-2022 | 500,000 | 543,165 |
| Iowa Student Loan Liquidity Corporation AMT Senior Series B | | 5.00 | 12-1-2023 | 700,000 | 790,349 |
| Iowa Student Loan Liquidity Corporation AMT Senior Series B | | 5.00 | 12-1-2024 | 1,000,000 | 1,164,150 |
| | | | | | 2,497,664 |
| Housing revenue: 0.27% | | | | | |
| Iowa Finance Authority SFMR Series D (1 Month LIBOR+0.35%)(GNMA/FNMA/FHLMC Insured)± | | 0.45 | 7-1-2048 | 7,500,000 | 7,500,900 |
| Utilities revenue: 0.45% | | | | | |
| Iowa Gas Project Public Expenditure and Financial Accountability Incorporated | | 5.00 | 9-1-2049 | 10,000,000 | 12,253,400 |
| | | | | | 22,251,964 |
| Kansas: 0.26% | | | | | |
| Health revenue: 0.08% | | | | | |
| Wichita KS Health Care Facilities Presbyterian Manors Incorporated | | 4.00 | 5-15-2024 | 1,015,000 | 1,030,925 |
| Wichita KS Health Care Facilities Presbyterian Manors Incorporated | | 5.00 | 5-15-2025 | 1,055,000 | 1,115,821 |
| | | | | | 2,146,746 |
| Housing revenue: 0.18% | | | | | |
| Kansas Development Finance Authority MFHR Woodland Village Apartments Project Series J | | 1.68 | 7-1-2022 | 5,000,000 | 5,032,950 |
| | | | | | 7,179,696 |
| Kentucky: 3.27% | | | | | |
| Health revenue: 0.18% | | | | | |
| Louisville & Jefferson Counties KY Metro Health System Revenue Norton Healthcare Incorporated Series C | | 5.00 | 10-1-2047 | 4,000,000 | 4,945,840 |
The accompanying notes are an integral part of these financial statements.
20 | Wells Fargo Short-Term Municipal Bond Fund
Portfolio of investments—December 31, 2020 (unaudited)
| | | Interest
rate | Maturity
date | Principal | Value |
| Housing revenue: 1.38% | | | | | |
| Kentucky Housing Corporation Beecher Phase I Project | | 2.00% | 3-1-2022 | $ 5,500,000 | $ 5,560,115 |
| Kentucky Housing Corporation Jefferson Green Apartments Project | | 2.20 | 9-1-2022 | 20,250,000 | 20,300,828 |
| Kentucky Housing Corporation MFHR Chapel House Apartments Project | | 0.80 | 9-1-2022 | 3,070,000 | 3,086,455 |
| Kentucky Housing Corporation MFHR City View Park Project | | 1.16 | 2-1-2023 | 9,000,000 | 9,097,110 |
| | | | | | 38,044,508 |
| Miscellaneous revenue: 0.29% | | | | | |
| Lexington Fayette KY Urban County Lease Eastern State Hospital Series A | | 5.25 | 6-1-2026 | 6,620,000 | 6,742,139 |
| Pendleton County KY School District Finance Corporation | | 2.00 | 2-1-2021 | 1,200,000 | 1,201,440 |
| | | | | | 7,943,579 |
| Utilities revenue: 1.42% | | | | | |
| Kentucky Public Energy Authority Gas Supply Series B | | 4.00 | 1-1-2049 | 26,085,000 | 29,321,627 |
| Louisville & Jefferson Counties KY Metro Government PCR Series B | | 2.55 | 11-1-2027 | 5,500,000 | 5,533,055 |
| Trimble County KY Pollution Control Revenue Refunding Louisville Gas and Electric Company | | 1.30 | 9-1-2044 | 4,000,000 | 4,057,400 |
| | | | | | 38,912,082 |
| | | | | | 89,846,009 |
| Louisiana: 1.16% | | | | | |
| Health revenue: 0.27% | | | | | |
| Louisiana Public Facilities Authority Hospital Revenue Louisiana Childrens Medical Center Project | | 5.00 | 6-1-2045 | 6,695,000 | 7,420,135 |
| Industrial development revenue: 0.54% | | | | | |
| St John Baptist Parish LA Marathon Oil Corporation Project | | 2.10 | 6-1-2037 | 14,450,000 | 14,793,188 |
| Miscellaneous revenue: 0.18% | | | | | |
| Louisiana Local Government Environmental Facilities and Community Development Authority Subordinated Lien East Baton Rouge | | 0.88 | 2-1-2046 | 5,000,000 | 5,010,450 |
| Tax revenue: 0.02% | | | | | |
| Louisiana Regional Transit Authority CAB (National Insured)¤ | | 0.00 | 12-1-2021 | 695,000 | 693,054 |
| Utilities revenue: 0.15% | | | | | |
| Lafayette LA Refunding Bond | | 5.00 | 11-1-2023 | 3,680,000 | 3,996,701 |
| | | | | | 31,913,528 |
| Maine: 0.08% | | | | | |
| Education revenue: 0.02% | | | | | |
| Maine Finance Authority Supplemental Education Loan Program Class A Series A-1 (AGM Insured) | | 5.00 | 12-1-2025 | 425,000 | 504,917 |
The accompanying notes are an integral part of these financial statements.
Wells Fargo Short-Term Municipal Bond Fund | 21
Portfolio of investments—December 31, 2020 (unaudited)
| | | Interest
rate | Maturity
date | Principal | Value |
| Health revenue: 0.06% | | | | | |
| Maine Health & HEFAR Series 200A | | 5.00% | 7-1-2026 | $ 500,000 | $ 618,805 |
| Maine Health & Higher Educational Facilities Authority Series A | | 5.00 | 7-1-2025 | 800,000 | 957,680 |
| | | | | | 1,576,485 |
| | | | | | 2,081,402 |
| Maryland: 1.37% | | | | | |
| Housing revenue: 0.76% | | | | | |
| Maryland CDA Department of Housing & Community Multifamily Development Huntington Apartments Series C 144A | | 2.34 | 4-1-2021 | 7,500,000 | 7,523,325 |
| Maryland CDA Department of Housing & Community Multifamily Development Orchard Mews | | 2.06 | 9-1-2021 | 5,500,000 | 5,536,190 |
| Maryland CDA Department of Housing & Community Multifamily Development Park View | | 1.75 | 2-1-2022 | 7,700,000 | 7,745,584 |
| | | | | | 20,805,099 |
| Transportation revenue: 0.11% | | | | | |
| Maryland Transportation Authority Refunding Bond AMT | | 5.00 | 3-1-2022 | 2,995,000 | 3,136,154 |
| Utilities revenue: 0.50% | | | | | |
| Maryland Economic Development Corporation PCR Potomac Electric Power Company Project | | 1.70 | 9-1-2022 | 13,500,000 | 13,744,215 |
| | | | | | 37,685,468 |
| Massachusetts: 2.84% | | | | | |
| Education revenue: 0.24% | | | | | |
| Massachusetts Educational Financing Authority AMT Issue J | | 5.00 | 7-1-2021 | 1,280,000 | 1,309,107 |
| Massachusetts Educational Financing Authority AMT Issue K Series A | | 5.00 | 7-1-2022 | 1,000,000 | 1,068,000 |
| Massachusetts Educational Financing Authority Series A | | 5.00 | 1-1-2022 | 4,115,000 | 4,302,891 |
| | | | | | 6,679,998 |
| Health revenue: 0.62% | | | | | |
| Massachusetts Development Finance Agency Partners Healthcare System Series S-3 (SIFMA Municipal Swap+0.50%)± | | 0.59 | 7-1-2038 | 5,000,000 | 5,007,150 |
| Massachusetts Development Finance Agency Partners Healthcare System Series S-5 (SIFMA Municipal Swap+0.42%)± | | 0.51 | 7-1-2044 | 11,230,000 | 11,236,850 |
| Massachusetts Development Finance Agency Wellforce Issue Series C (AGM Insured) | | 5.00 | 10-1-2026 | 300,000 | 370,884 |
| Massachusetts Development Finance Agency Wellforce Issue Series C (AGM Insured) | | 5.00 | 10-1-2027 | 410,000 | 519,892 |
| | | | | | 17,134,776 |
| Housing revenue: 0.50% | | | | | |
| Massachusetts HFA Construction Loan Notes Series B | | 2.05 | 12-1-2021 | 13,675,000 | 13,683,752 |
The accompanying notes are an integral part of these financial statements.
22 | Wells Fargo Short-Term Municipal Bond Fund
Portfolio of investments—December 31, 2020 (unaudited)
| | | Interest
rate | Maturity
date | Principal | Value |
| Miscellaneous revenue: 0.91% | | | | | |
| Massachusetts Consolidated Loan Subordinate Bond Series D-2 | | 1.70% | 8-1-2043 | $24,550,000 | $ 25,069,233 |
| Tax revenue: 0.10% | | | | | |
| Massachusetts Bay Transportation Authority Series B Subseries B-1 | | 5.00 | 7-1-2025 | 2,300,000 | 2,784,058 |
| Transportation revenue: 0.47% | | | | | |
| Massachusetts Department of Transportation Refunding Bond | | 5.00 | 1-1-2039 | 11,685,000 | 12,768,316 |
| | | | | | 78,120,133 |
| Michigan: 1.70% | | | | | |
| GO revenue: 0.21% | | | | | |
| Allendale MI Public School District Series A (Qualified School Board Loan Fund Insured) | | 3.00 | 11-1-2021 | 895,000 | 914,681 |
| Caledonia MI Community Schools (Qualified School Board Loan Fund Insured) | | 5.00 | 5-1-2021 | 1,140,000 | 1,157,807 |
| Detroit MI Series 2018 | | 5.00 | 4-1-2021 | 620,000 | 625,196 |
| Flushing MI Community School District (Qualified School Board Loan Fund Insured) | | 4.00 | 5-1-2021 | 1,135,000 | 1,148,586 |
| Haslett MI Public Schools (Qualified School Board Loan Fund Insured) | | 5.00 | 5-1-2021 | 500,000 | 507,510 |
| Lake Orion MI Community School District 2016 Refunding Bond (Qualified School Board Loan Fund Insured) | | 5.00 | 5-1-2021 | 1,385,000 | 1,406,038 |
| | | | | | 5,759,818 |
| Health revenue: 0.55% | | | | | |
| Kalamazoo MI Economic Development Corporation Series 2020B-2 | | 2.63 | 5-15-2025 | 1,150,000 | 1,153,738 |
| Michigan Finance Authority Bronson Healthcare Group Series B & C | | 3.75 | 11-15-2049 | 7,600,000 | 8,796,012 |
| Michigan Finance Authority Crittenden Hospital Medical Center Series A | | 4.13 | 6-1-2032 | 4,290,000 | 4,526,207 |
| Michigan Strategic Limited Obligation Refunding Bond Holland Home Project | | 4.00 | 11-15-2024 | 580,000 | 616,436 |
| | | | | | 15,092,393 |
| Industrial development revenue: 0.74% | | | | | |
| Michigan Strategic Limited Obligation Consumers Energy Company Project | | 1.80 | 10-1-2049 | 19,500,000 | 20,304,375 |
| Miscellaneous revenue: 0.09% | | | | | |
| Michigan Finance Authority Local Government Loan Program Series 2014H-1 | | 5.00 | 10-1-2022 | 1,075,000 | 1,112,260 |
| Michigan Finance Authority Senior Lien Distributable State Aid Charter County of Wayne Criminal Justice Center Project | | 5.00 | 11-1-2022 | 1,150,000 | 1,244,841 |
| | | | | | 2,357,101 |
The accompanying notes are an integral part of these financial statements.
Wells Fargo Short-Term Municipal Bond Fund | 23
Portfolio of investments—December 31, 2020 (unaudited)
| | | Interest
rate | Maturity
date | Principal | Value |
| Water & sewer revenue: 0.11% | | | | | |
| Michigan Finance Authority Refunding Bond Second Lien Detroit Water & Sewer Series C-7 (National Insured) | | 5.00% | 7-1-2021 | $ 3,095,000 | $ 3,166,464 |
| | | | | | 46,680,151 |
| Minnesota: 1.01% | | | | | |
| GO revenue: 0.26% | | | | | |
| Hastings MN Independent School District #200 Series A (State School District Credit Program Insured)¤ | | 0.00 | 2-1-2023 | 815,000 | 805,619 |
| Hastings MN Independent School District #200 Series A (State School District Credit Program Insured)¤ | | 0.00 | 2-1-2024 | 1,015,000 | 995,238 |
| JPMorgan Chase Puttable Tax-Exempt Receipts Trust Series 5027 (JPMorgan Chase & Company LIQ)144Aø | | 0.29 | 6-1-2021 | 5,300,000 | 5,300,000 |
| | | | | | 7,100,857 |
| Housing revenue: 0.72% | | | | | |
| Brooklyn Center MN MFHR Development Sonder House Apartments Project | | 1.35 | 1-1-2037 | 2,355,000 | 2,356,649 |
| Dakota County MN Community Development Agency Senior MFHR West St. Paul Apartments Project Series B | | 3.80 | 7-1-2022 | 6,325,000 | 6,307,353 |
| Minnesota HFA Series D (SIFMA Municipal Swap+0.43%)(GNMA/FNMA/FHLMC Insured)± | | 0.52 | 1-1-2045 | 11,000,000 | 10,989,660 |
| | | | | | 19,653,662 |
| Miscellaneous revenue: 0.03% | | | | | |
| Duluth MN Independent School District Certificate of Participation Series B (State School District Credit Program Insured) | | 5.00 | 2-1-2024 | 425,000 | 479,600 |
| Duluth MN Independent School District Certificate of Participation Series B (State School District Credit Program Insured) | | 5.00 | 2-1-2025 | 375,000 | 438,446 |
| | | | | | 918,046 |
| | | | | | 27,672,565 |
| Mississippi: 0.49% | | | | | |
| Health revenue: 0.22% | | | | | |
| Mississippi Hospital Equipment & Facilities Authority Baptist Memorial Health Care Project | | 0.65 | 9-1-2036 | 3,000,000 | 3,000,570 |
| Mississippi Hospital Equipment and Facilities Authority Revenue Refunding Bond Baptist Memorial Health Care | | 5.00 | 9-1-2044 | 2,500,000 | 2,922,025 |
| | | | | | 5,922,595 |
| Industrial development revenue: 0.02% | | | | | |
| Mississippi Business Finance Corporation Solid Waste Disposal Facilities Mississippi Power Company Project ø | | 0.17 | 5-1-2028 | 520,000 | 520,000 |
| Utilities revenue: 0.25% | | | | | |
| Mississippi Business Finance Corporation Mississippi Power Company Project Series 2010 | | 2.75 | 12-1-2040 | 6,750,000 | 6,920,978 |
| | | | | | 13,363,573 |
The accompanying notes are an integral part of these financial statements.
24 | Wells Fargo Short-Term Municipal Bond Fund
Portfolio of investments—December 31, 2020 (unaudited)
| | | Interest
rate | Maturity
date | Principal | Value |
| Missouri: 1.10% | | | | | |
| GO revenue: 0.19% | | | | | |
| St. Louis MO Special Administrative Board The Transitional School Direct Deposit Program | | 4.00% | 4-1-2022 | $ 5,030,000 | $ 5,270,233 |
| Industrial development revenue: 0.88% | | | | | |
| Missouri Environmental Improvement and Energy Resources Authority Kansas City Power and Light Company Project | | 2.75 | 5-1-2038 | 23,400,000 | 24,208,470 |
| Tax revenue: 0.03% | | | | | |
| Arnold MO Real Property Arnold Triangle Redevelopment Project Series A | | 3.75 | 5-1-2023 | 770,000 | 775,429 |
| | | | | | 30,254,132 |
| Nebraska: 0.18% | | | | | |
| Health revenue: 0.14% | | | | | |
| Douglas County NE Hospital Authority Children's Hospital Obligated Group Series B | | 5.00 | 11-15-2053 | 3,250,000 | 3,921,873 |
| Utilities revenue: 0.04% | | | | | |
| Central Plains Energy Project Nebraska Refunding Bond Project #3 Series 2012 | | 5.00 | 9-1-2042 | 1,075,000 | 1,150,390 |
| | | | | | 5,072,263 |
| Nevada: 0.49% | | | | | |
| GO revenue: 0.40% | | | | | |
| Clark County NV School District Series B (AGM Insured) | | 5.00 | 6-15-2027 | 5,000,000 | 6,345,100 |
| Clark County NV School District Series C | | 5.00 | 6-15-2022 | 2,000,000 | 2,131,160 |
| Clark County NV School District Series D | | 5.00 | 6-15-2021 | 2,395,000 | 2,444,074 |
| | | | | | 10,920,334 |
| Utilities revenue: 0.09% | | | | | |
| Washoe County NV Sierra Pacific Power Series B | | 3.00 | 3-1-2036 | 560,000 | 580,227 |
| Washoe County NV Water Facility Refunding Bond Series F | | 2.05 | 3-1-2036 | 2,000,000 | 2,037,620 |
| | | | | | 2,617,847 |
| | | | | | 13,538,181 |
| New Jersey: 5.61% | | | | | |
| Airport revenue: 0.27% | | | | | |
| New Jersey EDA Refunding Bond Port Newark Container Terminal LLC Project | | 5.00 | 10-1-2021 | 1,500,000 | 1,540,875 |
| New Jersey EDA Refunding Bond Port Newark Container Terminal LLC Project | | 5.00 | 10-1-2022 | 1,755,000 | 1,864,688 |
| New Jersey EDA Refunding Bond Port Newark Container Terminal LLC Project | | 5.00 | 10-1-2023 | 1,500,000 | 1,643,715 |
| New Jersey EDA Refunding Bond Port Newark Container Terminal LLC Project | | 5.00 | 10-1-2024 | 2,000,000 | 2,255,100 |
| | | | | | 7,304,378 |
The accompanying notes are an integral part of these financial statements.
Wells Fargo Short-Term Municipal Bond Fund | 25
Portfolio of investments—December 31, 2020 (unaudited)
| | | Interest
rate | Maturity
date | Principal | Value |
| Education revenue: 0.04% | | | | | |
| New Jersey Higher Education Assistance Authoirty Student Loan Series 2011-1 | | 5.50% | 12-1-2021 | $ 1,000,000 | $ 1,046,420 |
| Housing revenue: 1.80% | | | | | |
| New Jersey Housing & Mortgage Finance Agency MFHR Series A | | 2.00 | 11-1-2021 | 325,000 | 329,183 |
| New Jersey Housing & Mortgage Finance Agency MFHR Series B | | 2.00 | 5-1-2021 | 14,335,000 | 14,407,392 |
| New Jersey Housing & Mortgage Finance Agency Single Family Housing Revenue Series B | | 2.60 | 10-1-2021 | 5,585,000 | 5,660,565 |
| New Jersey Housing & Mortgage Finance Agency Single Family Housing Revenue Series B | | 2.70 | 4-1-2022 | 5,700,000 | 5,826,996 |
| New Jersey Housing & Mortgage Finance Agency Single Family Housing Revenue Series B | | 2.80 | 10-1-2022 | 5,320,000 | 5,493,911 |
| New Jersey Housing & Mortgage Finance Agency Single Family Housing Revenue Series B | | 2.90 | 4-1-2023 | 5,870,000 | 6,121,177 |
| New Jersey Housing & Mortgage Finance Agency Single Family Housing Revenue Series B | | 2.95 | 10-1-2023 | 5,490,000 | 5,782,343 |
| New Jersey Housing & Mortgage Finance Agency Single Family Housing Revenue Series B | | 3.10 | 4-1-2024 | 2,600,000 | 2,770,768 |
| New Jersey Housing & Mortgage Finance Agency Single Family Housing Revenue Series B | | 3.25 | 4-1-2025 | 2,955,000 | 3,218,113 |
| | | | | | 49,610,448 |
| Miscellaneous revenue: 2.62% | | | | | |
| New Jersey EDA School Facilities Construction Bond Series DDD | | 5.00 | 6-15-2023 | 3,000,000 | 3,320,160 |
| New Jersey EDA School Facilities Construction Bond Series DDD | | 5.00 | 6-15-2024 | 2,605,000 | 2,966,808 |
| New Jersey EDA School Facilities Construction Bond Series K (National Insured) | | 5.25 | 12-15-2021 | 1,040,000 | 1,087,195 |
| New Jersey EDA School Facilities Construction Bond Series NN | | 5.00 | 3-1-2022 | 405,000 | 426,068 |
| New Jersey EDA School Facilities Construction Prerefunded Bond Series NN | | 5.00 | 3-1-2021 | 1,410,000 | 1,420,646 |
| New Jersey EDA School Facilities Construction Refunding Bond Series XX | | 5.00 | 6-15-2022 | 7,500,000 | 7,986,225 |
| New Jersey EDA School Facilities Construction Unrefunded Bond Series NN | | 5.00 | 3-1-2021 | 3,610,000 | 3,635,703 |
| New Jersey EDA Series BBB | | 5.00 | 6-15-2022 | 6,000,000 | 6,388,980 |
| New Jersey EDA Series BBB | | 5.00 | 6-15-2023 | 4,000,000 | 4,426,880 |
| New Jersey EDA Transportation Project New Jersey Transit Corporation Project Series B | | 5.00 | 11-1-2021 | 2,490,000 | 2,583,500 |
| New Jersey EDA Transportation Project New Jersey Transit Corporation Project Series B | | 5.00 | 11-1-2022 | 26,000,000 | 28,069,860 |
| New Jersey TTFA Series A1 | | 5.00 | 6-15-2021 | 5,000,000 | 5,097,250 |
| Newark NJ Housing Authority Newark Redevelopment Project Refunding Bond (National Insured) | | 5.25 | 1-1-2021 | 4,570,000 | 4,570,000 |
| | | | | | 71,979,275 |
| Tax revenue: 0.09% | | | | | |
| New Jersey Statewide Covid-19 Emergency Series A | | 5.00 | 6-1-2027 | 2,000,000 | 2,501,400 |
The accompanying notes are an integral part of these financial statements.
26 | Wells Fargo Short-Term Municipal Bond Fund
Portfolio of investments—December 31, 2020 (unaudited)
| | | Interest
rate | Maturity
date | Principal | Value |
| Transportation revenue: 0.79% | | | | | |
| New Jersey Turnpike Authority Series C-6 (1 Month LIBOR+0.75%)± | | 0.86% | 1-1-2030 | $21,820,000 | $ 21,835,492 |
| | | | | | 154,277,413 |
| New Mexico: 0.02% | | | | | |
| Health revenue: 0.02% | | | | | |
| Santa Fe NM Retirement Facility El Castillo Retirement | | 2.25 | 5-15-2024 | 600,000 | 591,372 |
| New York: 6.53% | | | | | |
| Airport revenue: 0.30% | | | | | |
| Port of New York & Port of New Jersey Authority Consolidated Bonds 185th Series | | 5.00 | 9-1-2026 | 7,150,000 | 8,208,272 |
| Education revenue: 0.11% | | | | | |
| Hempstead Town NY Local Development Corporation Education Revenue Refunding Bond Academy Charter School Project | | 4.76 | 2-1-2027 | 2,000,000 | 2,108,020 |
| St. Lawrence County NY Industrial Development Clarkson University Project Series B | | 1.55 | 9-1-2042 | 1,000,000 | 977,230 |
| | | | | | 3,085,250 |
| GO revenue: 0.66% | | | | | |
| Oyster Bay NY BAN Series C | | 4.00 | 8-27-2021 | 3,000,000 | 3,070,530 |
| Suffolk County NY Tax Anticipation Notes Series I | | 2.00 | 7-22-2021 | 15,000,000 | 15,095,550 |
| | | | | | 18,166,080 |
| Health revenue: 0.27% | | | | | |
| Broome County NY Local Development Corporation Series 2020 (AGM Insured) | | 5.00 | 4-1-2026 | 500,000 | 614,860 |
| Broome County NY Local Development Corporation Series 2020 (AGM Insured) | | 5.00 | 4-1-2027 | 950,000 | 1,196,478 |
| New York Dormitory Authority Montefiore Obligated Group Series 2018A | | 5.00 | 8-1-2026 | 1,000,000 | 1,198,670 |
| New York Dormitory Authority Non State Supported Debt Northwell Health | | 5.00 | 5-1-2048 | 4,000,000 | 4,501,800 |
| | | | | | 7,511,808 |
| Housing revenue: 0.29% | | | | | |
| New York HFA Affordable Housing Series M-1 (GNMA/FNMA/FHLMC Insured) | | 2.00 | 5-1-2021 | 5,000,000 | 5,026,050 |
| New York NY Housing Development Corporation MFHR AMT Sustainable Neighborhood | | 1.75 | 11-1-2023 | 400,000 | 410,624 |
| New York NY Housing Development Corporation MFHR AMT Sustainable Neighborhood | | 1.80 | 5-1-2024 | 400,000 | 412,376 |
| New York NY Housing Development Corporation MFHR AMT Sustainable Neighborhood | | 1.85 | 11-1-2024 | 400,000 | 414,884 |
| New York NY Housing Development Corporation MFHR AMT Sustainable Neighborhood | | 1.90 | 5-1-2025 | 515,000 | 536,424 |
| New York NY Housing Development Corporation MFHR AMT Sustainable Neighborhood | | 1.95 | 11-1-2025 | 520,000 | 545,085 |
| New York NY Housing Development Corporation MFHR AMT Sustainable Neighborhood | | 2.00 | 5-1-2026 | 535,000 | 563,649 |
| | | | | | 7,909,092 |
The accompanying notes are an integral part of these financial statements.
Wells Fargo Short-Term Municipal Bond Fund | 27
Portfolio of investments—December 31, 2020 (unaudited)
| | | Interest
rate | Maturity
date | Principal | Value |
| Industrial development revenue: 1.32% | | | | | |
| New York Transportation Development Corporation Special Facilities Revenue Delta Airlines Incorporated LaGuardia Airport Terminals C&D Redevelopment Project | | 5.00% | 1-1-2024 | $ 7,205,000 | $ 7,950,501 |
| New York Transportation Development Corporation Special Facilities Revenue Delta Airlines Incorporated LaGuardia Airport Termnials C&D Redevelopment Project | | 5.00 | 1-1-2025 | 22,925,000 | 25,972,879 |
| New York Transportation Development Corporation Terminal 4 John F. Kennedy International Airport Project Series 2020A | | 5.00 | 12-1-2026 | 490,000 | 591,494 |
| New York Transportation Development Corporation Terminal 4 John F. Kennedy International Airport Project Series 2020A | | 5.00 | 12-1-2027 | 500,000 | 615,080 |
| New York Transportation Development Corporation Terminal 4 John F. Kennedy International Airport Project Series 2020A | | 5.00 | 12-1-2028 | 500,000 | 623,540 |
| New York Transportation Development Corporation Terminal 4 John F. Kennedy International Airport Project Series 2020A | | 5.00 | 12-1-2029 | 500,000 | 632,750 |
| | | | | | 36,386,244 |
| Miscellaneous revenue: 0.10% | | | | | |
| Public Housing Capital Fund Trust I (Department of Housing and Urban Development Insured)144A | | 4.50 | 7-1-2022 | 2,315,705 | 2,346,550 |
| Public Housing Capital Fund Trust II (Department of Housing and Urban Development Insured)144A | | 4.50 | 7-1-2022 | 360,988 | 360,988 |
| | | | | | 2,707,538 |
| Tax revenue: 0.54% | | | | | |
| New York NY Transitional Finance Authority Subordinate Bond Series 1-B (SIFMA Municipal Swap+0.80%)± | | 0.89 | 11-1-2022 | 9,715,000 | 9,755,026 |
| New York Transitional Finance Authority Revenue Series (Barclays Bank plc SPA)ø | | 0.08 | 8-1-2039 | 5,000,000 | 5,000,000 |
| | | | | | 14,755,026 |
| Transportation revenue: 2.71% | | | | | |
| New York Metropolitan Transportation Authority BAN | | 4.00 | 2-1-2022 | 9,600,000 | 9,794,112 |
| New York Metropolitan Transportation Authority BAN | | 5.00 | 2-1-2023 | 10,400,000 | 11,019,216 |
| New York Metropolitan Transportation Authority Subordinate Bond Series A2A (SIFMA Municipal Swap+0.45%)± | | 0.54 | 11-1-2026 | 5,960,000 | 5,925,134 |
| New York Metropolitan Transportation Authority Subordinate Bond Series D2 (SIFMA Municipal Swap+0.45%)± | | 0.54 | 11-15-2044 | 22,545,000 | 21,838,891 |
| New York Metropolitan Transportation Authority Subordinate Bond Series D-2A-2 (1 Month LIBOR+0.68%)(AGM Insured)± | | 0.79 | 11-1-2032 | 20,000,000 | 19,936,800 |
| New York Metropolitan Transportation Authority Subordinate Bond Series D-2B (1 Month LIBOR+0.30%)(AGM Insured)± | | 0.41 | 11-1-2032 | 6,000,000 | 5,976,780 |
| | | | | | 74,490,933 |
The accompanying notes are an integral part of these financial statements.
28 | Wells Fargo Short-Term Municipal Bond Fund
Portfolio of investments—December 31, 2020 (unaudited)
| | | Interest
rate | Maturity
date | Principal | Value |
| Utilities revenue: 0.23% | | | | | |
| Long Island NY Power Authority Electric System General Series B | | 1.65% | 9-1-2049 | $ 6,000,000 | $ 6,234,600 |
| | | | | | 179,454,843 |
| North Carolina: 0.38% | | | | | |
| Health revenue: 0.34% | | | | | |
| Charlotte-Mecklenburg NC Hospital Authority Atrium Health Series B | | 5.00 | 1-15-2048 | 7,000,000 | 7,376,670 |
| North Carolina Medical Care Commission Retirement Facilities Entrance Fee Series 2020B-2 | | 2.30 | 9-1-2025 | 1,250,000 | 1,257,888 |
| North Carolina Medical Care Commission Retirement Facilities First Mortgage Series 2020B-2 | | 2.50 | 10-1-2024 | 740,000 | 743,500 |
| | | | | | 9,378,058 |
| Industrial development revenue: 0.04% | | | | | |
| Columbus County NC Industrial Facilities & PCFA Environmental Improvement Revenue Refunding Bond International Paper Company Project Series A | | 2.00 | 11-1-2033 | 1,000,000 | 1,056,640 |
| | | | | | 10,434,698 |
| Ohio: 2.86% | | | | | |
| Health revenue: 0.34% | | | | | |
| Hamilton County OH Hospital Facilities UC Health Series 2020 | | 5.00 | 9-15-2026 | 655,000 | 812,907 |
| Ohio Higher Educational Facility Commission Hospital Cleveland Clinic B4 (Barclays Bank plc SPA)ø | | 0.07 | 1-1-2043 | 5,000,000 | 5,000,000 |
| Ohio Hospital Revenue Bonds Series 2020 | | 5.00 | 11-15-2025 | 265,000 | 311,237 |
| Ohio Hospital University Hospital Health System Series B | | 5.00 | 1-15-2050 | 2,820,000 | 3,293,309 |
| | | | | | 9,417,453 |
| Housing revenue: 0.52% | | | | | |
| Ohio HFA Multifamily Southwick Place Townhomes Project | | 1.55 | 3-1-2022 | 4,975,000 | 4,984,652 |
| Trumbull Metropolitan Housing Authority Multifamily Housing Apartments Project Series A | | 1.70 | 6-1-2022 | 9,250,000 | 9,301,338 |
| | | | | | 14,285,990 |
| Industrial development revenue: 0.14% | | | | | |
| Ohio Air Quality Development Authority Ohio Valley Electric Corporation Series A | | 2.88 | 2-1-2026 | 3,750,000 | 3,924,600 |
| Miscellaneous revenue: 0.05% | | | | | |
| Ohio Portsmouth Bypass Project | | 5.00 | 12-31-2021 | 1,205,000 | 1,254,995 |
| Resource recovery revenue: 0.46% | | | | | |
| Ohio Air Quality Development Authority Refunding Bond American Electric Power Company Project | | 1.90 | 5-1-2026 | 12,000,000 | 12,541,680 |
| Utilities revenue: 1.35% | | | | | |
| American Municipal Power Ohio Incorporated Hydroelectric Projects Series A | | 5.00 | 2-15-2025 | 1,200,000 | 1,423,644 |
| American Municipal Power Ohio Incorporated Hydroelectric Projects Series A | | 5.00 | 2-15-2026 | 1,500,000 | 1,843,410 |
The accompanying notes are an integral part of these financial statements.
Wells Fargo Short-Term Municipal Bond Fund | 29
Portfolio of investments—December 31, 2020 (unaudited)
| | | Interest
rate | Maturity
date | Principal | Value |
| Utilities revenue (continued) | | | | | |
| American Municipal Power Ohio Incorporated Hydroelectric Projects Series A | | 5.00% | 2-15-2027 | $ 1,600,000 | $ 2,019,216 |
| American Municipal Power Ohio Incorporated Prairie Energy Campus | | 2.30 | 2-15-2038 | 8,825,000 | 8,903,719 |
| Lancaster OH Port Authority Gas Supply (Royal Bank of Canada LIQ) | | 5.00 | 8-1-2049 | 19,500,000 | 22,851,855 |
| | | | | | 37,041,844 |
| | | | | | 78,466,562 |
| Oklahoma: 1.19% | | | | | |
| Education revenue: 0.02% | | | | | |
| Oklahoma Development Finance Authority Refunding Bond Oklahoma City University Project | | 4.00 | 8-1-2022 | 535,000 | 554,003 |
| GO revenue: 0.38% | | | | | |
| Oklahoma County OK Independent School District #52 Series A | | 2.50 | 1-1-2021 | 3,535,000 | 3,535,000 |
| Oklahoma County OK Independent School District #52 Series A | | 3.00 | 1-1-2022 | 3,535,000 | 3,633,096 |
| Oklahoma County OK Independent School District #52 Series A | | 3.00 | 1-1-2023 | 3,135,000 | 3,309,149 |
| | | | | | 10,477,245 |
| Health revenue: 0.14% | | | | | |
| Oklahoma Development Finance Authority Health System Revenue ø | | 0.27 | 8-15-2031 | 2,000,000 | 2,000,000 |
| Oklahoma Development Finance Authority Oklahoma University Medicine Project Series B | | 5.00 | 8-15-2022 | 500,000 | 528,650 |
| Oklahoma Development Finance Authority Oklahoma University Medicine Project Series B | | 5.00 | 8-15-2023 | 500,000 | 546,640 |
| Oklahoma Development Finance Authority Oklahoma University Medicine Project Series B | | 5.00 | 8-15-2024 | 600,000 | 676,332 |
| | | | | | 3,751,622 |
| Miscellaneous revenue: 0.65% | | | | | |
| Blaine County OK Educational Facilities Authority Watonga Public Schools Project | | 5.00 | 12-1-2021 | 945,000 | 984,870 |
| Grady County OK School Finance Authority Tuttle Public School Project | | 5.00 | 9-1-2021 | 1,065,000 | 1,097,898 |
| Kay County OK Public Buildings Authority | | 2.25 | 4-1-2024 | 720,000 | 741,096 |
| Kay County OK Public Buildings Authority | | 2.25 | 4-1-2025 | 735,000 | 762,636 |
| Kay County OK Public Buildings Authority | | 2.38 | 4-1-2026 | 750,000 | 785,025 |
| Kingfisher OK Special Projects Authority Educational Facilities Kingfisher Public Schools Project | | 4.00 | 3-1-2026 | 2,005,000 | 2,343,143 |
| Oklahoma County OK Finance Authority Educational Facilities Jones Public Schools Project | | 4.00 | 9-1-2025 | 550,000 | 611,551 |
| Oklahoma County OK Finance Authority Educational Facilities Jones Public Schools Project | | 4.00 | 9-1-2026 | 590,000 | 664,488 |
| Ottawa County OK Educational Facilities Authority Educational Facilities Lease Miami Public Schools Project | | 5.00 | 9-1-2023 | 830,000 | 924,371 |
| Ottawa County OK Educational Facilities Authority Educational Facilities Lease Miami Public Schools Project | | 5.00 | 9-1-2024 | 1,080,000 | 1,246,180 |
The accompanying notes are an integral part of these financial statements.
30 | Wells Fargo Short-Term Municipal Bond Fund
Portfolio of investments—December 31, 2020 (unaudited)
| | | Interest
rate | Maturity
date | Principal | Value |
| Miscellaneous revenue (continued) | | | | | |
| Ottawa County OK Educational Facilities Authority Educational Facilities Lease Miami Public Schools Project | | 5.00% | 9-1-2025 | $ 930,000 | $ 1,109,462 |
| Tulsa County OK Industrial Authority Educational Broken Arrow Public Schools Project | | 5.00 | 9-1-2025 | 3,000,000 | 3,367,320 |
| Wagoner County OK School Development Authority Wagoner Public Schools Project | | 4.00 | 9-1-2025 | 1,255,000 | 1,426,948 |
| Weatherford OK Industrial Trust Educational Facilities Lease Weatherford Public Schools Project | | 5.00 | 3-1-2027 | 1,475,000 | 1,832,540 |
| | | | | | 17,897,528 |
| | | | | | 32,680,398 |
| Oregon: 0.06% | | | | | |
| Airport revenue: 0.06% | | | | | |
| Port of Portland OR International Airport Series C | | 5.00 | 7-1-2026 | 1,240,000 | 1,514,375 |
| Other: 0.60% | | | | | |
| Miscellaneous revenue: 0.60% | | | | | |
| FHLMC Multiclass Mortgage Certificate of Participation Series M012 Class A1A øø | | 1.60 | 8-15-2051 | 2,865,823 | 2,909,412 |
| FHLMC Multiclass Mortgage Certificate of Participation Series M012 Class A1B1 øø | | 2.25 | 8-15-2051 | 13,254,541 | 13,560,721 |
| | | | | | 16,470,133 |
| Pennsylvania: 7.00% | | | | | |
| Airport revenue: 0.62% | | | | | |
| Philadelphia PA Airport Revenue Refunding Bonds Series 2015A | | 5.00 | 6-15-2023 | 1,410,000 | 1,560,038 |
| Philadelphia PA Airport Revenue Refunding Bonds Series 2020A | | 5.00 | 7-1-2026 | 1,160,000 | 1,432,090 |
| Philadelphia PA Airport Revenue Refunding Bonds Series 2020A | | 5.00 | 7-1-2027 | 1,400,000 | 1,771,602 |
| Philadelphia PA Airport Revenue Refunding Bonds Series 2020C | | 5.00 | 7-1-2024 | 10,745,000 | 12,332,681 |
| | | | | | 17,096,411 |
| Education revenue: 0.38% | | | | | |
| Lehigh County PA General Purpose Authority (SIFMA Municipal Swap+0.58%)± | | 0.67 | 11-1-2037 | 10,545,000 | 10,521,063 |
| GO revenue: 1.36% | | | | | |
| Albert Gallatin PA School District Series A (AGM Insured) | | 4.00 | 9-1-2025 | 1,130,000 | 1,289,805 |
| Albert Gallatin PA School District Series B (AGM Insured) | | 4.00 | 9-1-2025 | 350,000 | 399,497 |
| Butler PA Area School District (AGM Insured) | | 5.00 | 10-1-2023 | 1,280,000 | 1,435,942 |
| Butler PA Area School District (AGM Insured) | | 5.00 | 10-1-2024 | 2,965,000 | 3,454,077 |
| Butler PA Area School District (AGM Insured) | | 5.00 | 10-1-2025 | 4,695,000 | 5,665,222 |
| Coatesville PA Area School District (AGM Insured) | | 5.00 | 8-1-2023 | 1,000,000 | 1,109,670 |
| Manheim Township PA School District Series A (1 Month LIBOR+0.47%)± | | 0.58 | 5-1-2025 | 3,760,000 | 3,754,586 |
| Penn Hills PA School District (BAM Insured) | | 5.00 | 11-15-2021 | 1,275,000 | 1,324,904 |
| Peoria PA GO Series 2016B | | 5.00 | 1-1-2023 | 715,000 | 769,705 |
| Philadelphia PA School District Refunding Bond | | 5.00 | 9-1-2023 | 4,500,000 | 5,017,950 |
| Philadelphia PA School District Series A | | 5.00 | 9-1-2022 | 1,000,000 | 1,072,370 |
The accompanying notes are an integral part of these financial statements.
Wells Fargo Short-Term Municipal Bond Fund | 31
Portfolio of investments—December 31, 2020 (unaudited)
| | | Interest
rate | Maturity
date | Principal | Value |
| GO revenue (continued) | | | | | |
| Philadelphia PA School District Series A | | 5.00% | 9-1-2024 | $ 800,000 | $ 923,408 |
| Philadelphia PA School District Series D | | 5.00 | 9-1-2021 | 1,750,000 | 1,801,223 |
| Philadelphia PA School District Series F | | 5.00 | 9-1-2021 | 3,885,000 | 3,998,714 |
| Scranton PA School District Series A | | 5.00 | 6-1-2021 | 680,000 | 691,560 |
| Scranton PA School District Series A | | 5.00 | 6-1-2022 | 730,000 | 772,654 |
| Scranton PA School District Series A | | 5.00 | 6-1-2023 | 835,000 | 922,249 |
| Scranton PA School District Series B | | 5.00 | 6-1-2021 | 580,000 | 589,860 |
| Scranton PA School District Series B (National Insured) | | 5.00 | 6-1-2022 | 870,000 | 920,834 |
| Scranton PA School District Series B (National Insured) | | 5.00 | 6-1-2023 | 615,000 | 680,823 |
| Scranton PA School District Series C | | 5.00 | 6-1-2021 | 590,000 | 600,030 |
| | | | | | 37,195,083 |
| Health revenue: 1.61% | | | | | |
| Allegheny County PA Hospital Development Authority University of Pittsburgh Medical Center Series A-1 (3 Month LIBOR+0.72%)± | | 0.86 | 2-1-2021 | 680,000 | 679,878 |
| Berks County PA IDA Health System Tower Health Project | | 5.00 | 11-1-2023 | 1,000,000 | 1,064,690 |
| Berks County PA IDA Health System Tower Health Project | | 5.00 | 11-1-2024 | 1,000,000 | 1,086,050 |
| Berks County PA Municipal Authority Tower Health Project Series B1 | | 5.00 | 2-1-2040 | 4,140,000 | 4,478,404 |
| Berks County PA Municipal Authority Tower Health Project Series B2 | | 5.00 | 2-1-2040 | 5,500,000 | 6,119,740 |
| Franklin County PA IDA Menno-Haven Incorporated Project | | 5.00 | 12-1-2021 | 230,000 | 236,095 |
| Geisinger Authority PA Health System Series B | | 5.00 | 4-1-2043 | 10,000,000 | 12,313,900 |
| Lancaster County PA Hospital Authority Healthcare Facilities Moravian Manors Incorporated Project | | 2.88 | 12-15-2023 | 445,000 | 445,022 |
| Montgomery County PA Higher Education & Health Authority Thomas Jefferson University Series A | | 5.00 | 9-1-2023 | 1,050,000 | 1,168,209 |
| Montgomery County PA Higher Education & Health Authority Thomas Jefferson University Series C (SIFMA Municipal Swap+0.72%)± | | 0.81 | 9-1-2051 | 10,000,000 | 10,000,300 |
| Philadelphia PA Hospitals & HEFAR Temple University Health System | | 5.00 | 7-1-2021 | 1,250,000 | 1,272,025 |
| Philadelphia PA Hospitals & HEFAR Temple University Health System | | 5.00 | 7-1-2022 | 2,000,000 | 2,105,120 |
| Quakertown PA Health Facilities Authority Series A | | 3.13 | 7-1-2021 | 3,250,000 | 3,221,043 |
| | | | | | 44,190,476 |
| Housing revenue: 1.23% | | | | | |
| Pennsylvania HFA Limited Obligation Norris Homes Phase V | | 1.40 | 1-1-2043 | 10,000,000 | 10,166,400 |
| Pennsylvania HFA Single Family Series 125A | | 2.38 | 10-1-2025 | 15,665,000 | 16,249,774 |
| Pennsylvania HFA Single Family Series 128A | | 4.75 | 4-1-2033 | 6,720,000 | 7,371,370 |
| | | | | | 33,787,544 |
| Industrial development revenue: 0.15% | | | | | |
| Lehigh County PA IDA Electric Utilities Corporation Series B | | 1.80 | 2-15-2027 | 2,500,000 | 2,555,325 |
| Pennsylvania EDFA Bridges Finco LP | | 5.00 | 12-31-2021 | 1,525,000 | 1,587,647 |
| | | | | | 4,142,972 |
The accompanying notes are an integral part of these financial statements.
32 | Wells Fargo Short-Term Municipal Bond Fund
Portfolio of investments—December 31, 2020 (unaudited)
| | | Interest
rate | Maturity
date | Principal | Value |
| Miscellaneous revenue: 0.56% | | | | | |
| Bethlehem PA Area School District Authority Bethlehem Area School District Refunding Bond Project (1 Month LIBOR+0.49%)± | | 0.59% | 1-1-2030 | $ 4,960,000 | $ 4,949,782 |
| Butler County PA General Authority Hampton Township School District Project Series 2007 (AGM Insured, PNC Bank NA SPA)ø | | 0.13 | 9-1-2027 | 265,000 | 265,000 |
| Delaware County PA Authority Neumann University | | 4.00 | 10-1-2021 | 695,000 | 705,439 |
| Pennsylvania EDFA Sewage Sludge Disposal Series 2020 | | 3.00 | 1-1-2025 | 505,000 | 542,552 |
| Pennsylvania EDFA Sewage Sludge Disposal Series 2020 | | 4.00 | 1-1-2026 | 615,000 | 700,128 |
| Pittsburgh & Allegheny Counties PA Sports & Exhibition Authority Series 2020 (AGM Insured) | | 4.00 | 2-1-2024 | 1,700,000 | 1,886,065 |
| Pittsburgh & Allegheny Counties PA Sports & Exhibition Authority Series 2020 (AGM Insured) | | 5.00 | 2-1-2026 | 2,000,000 | 2,443,760 |
| Scranton PA RDA Series A (Municipal Government Guaranty Insured) | | 5.00 | 11-15-2021 | 905,000 | 912,159 |
| State Public School Building Authority Prerefunded Bond Series A (AGM Insured) | | 5.00 | 12-1-2023 | 375,000 | 426,068 |
| State Public School Building Authority Prerefunded Bond Series A (AGM Insured) | | 5.00 | 12-1-2023 | 2,130,000 | 2,385,217 |
| | | | | | 15,216,170 |
| Resource recovery revenue: 0.86% | | | | | |
| Pennsylvania EDFA Solid Waste Disposal Republic Services Incoporated Project Series A ø | | 0.30 | 4-1-2034 | 4,000,000 | 4,000,040 |
| Pennsylvania EDFA Solid Waste Disposal Waste Management Incorporated Project | | 0.30 | 8-1-2045 | 19,700,000 | 19,700,197 |
| | | | | | 23,700,237 |
| Transportation revenue: 0.18% | | | | | |
| Lancaster PA Parking Authority Series A (BAM Insured) | | 4.00 | 9-1-2025 | 530,000 | 608,610 |
| Lancaster PA Parking Authority Series A (BAM Insured) | | 4.00 | 9-1-2026 | 545,000 | 640,506 |
| Pennsylvania Turnpike Commission Series B (SIFMA Municipal Swap+0.70%)± | | 0.79 | 12-1-2023 | 2,880,000 | 2,894,400 |
| Pennsylvania Turnpike Commission Turpike Series B 2020 | | 5.00 | 12-1-2025 | 300,000 | 368,013 |
| Pennsylvania Turnpike Commission Turpike Series B 2020 | | 5.00 | 12-1-2026 | 350,000 | 443,167 |
| | | | | | 4,954,696 |
| Water & sewer revenue: 0.05% | | | | | |
| Allegheny County PA Sanitary Authority Sewer Revenue Series A 2020 | | 5.00 | 6-1-2026 | 850,000 | 1,055,564 |
| Allegheny County PA Sanitary Authority Sewer Revenue Series A 2020 | | 5.00 | 6-1-2027 | 300,000 | 381,837 |
| | | | | | 1,437,401 |
| | | | | | 192,242,053 |
| Rhode Island: 0.36% | | | | | |
| Education revenue: 0.05% | | | | | |
| Rhode Island Student Loan Authority AMT Series A | | 5.00 | 12-1-2023 | 1,175,000 | 1,326,657 |
The accompanying notes are an integral part of these financial statements.
Wells Fargo Short-Term Municipal Bond Fund | 33
Portfolio of investments—December 31, 2020 (unaudited)
| | | Interest
rate | Maturity
date | Principal | Value |
| Miscellaneous revenue: 0.31% | | | | | |
| Rhode Island & Providence Plantations Consolidated Capital Development Series A | | 5.00% | 8-1-2023 | $ 8,045,000 | $ 8,650,064 |
| | | | | | 9,976,721 |
| South Carolina: 0.44% | | | | | |
| Miscellaneous revenue: 0.24% | | | | | |
| South Carolina Transportation Infrastructure Bank Refunding Bond Series B (1 Month LIBOR+0.45%)± | | 0.55 | 10-1-2031 | 6,425,000 | 6,416,391 |
| Utilities revenue: 0.20% | | | | | |
| Piedmont SC Municipal Power Agency (National Insured) | | 5.38 | 1-1-2025 | 4,705,000 | 5,526,869 |
| | | | | | 11,943,260 |
| Tennessee: 2.36% | | | | | |
| Health revenue: 0.32% | | | | | |
| Chattanooga TN Health & Education Housing Facilities Tender Option Bond Trust Receipts/Certificates Series 2015-XF1023 (Barclays Bank plc LOC, Barclays Bank plc LIQ)144Aøø | | 0.13 | 1-1-2045 | 5,910,000 | 5,910,000 |
| Greeneville TN Health and Educational Ballad Health Series A | | 5.00 | 7-1-2023 | 1,600,000 | 1,761,984 |
| Knox County TN Health Educational & Housing Facility University Health System Incorporate | | 5.00 | 4-1-2024 | 1,000,000 | 1,119,920 |
| | | | | | 8,791,904 |
| Housing revenue: 0.25% | | | | | |
| Kingsport TN Housing & RDA Collateralized MFHR Series B | | 2.22 | 1-1-2022 | 6,700,000 | 6,761,774 |
| Utilities revenue: 1.79% | | | | | |
| Memphis TN Light, Gas & Water Division Series 2020A | | 5.00 | 12-1-2025 | 600,000 | 737,670 |
| Memphis TN Light, Gas & Water Division Series 2020A | | 5.00 | 12-1-2026 | 600,000 | 761,322 |
| Memphis TN Light, Gas & Water Division Series 2020A | | 5.00 | 12-1-2027 | 450,000 | 584,757 |
| Tennessee Energy Acquisition Corporation Gas Project | | 4.00 | 11-1-2049 | 7,500,000 | 8,616,225 |
| Tennessee Energy Acquisition Corporation Series A | | 4.00 | 5-1-2048 | 35,840,000 | 38,558,106 |
| | | | | | 49,258,080 |
| | | | | | 64,811,758 |
| Texas: 11.86% | | | | | |
| Airport revenue: 0.87% | | | | | |
| Dallas-Fort Worth TX International Airport Series 2020A | | 5.00 | 11-1-2025 | 1,000,000 | 1,216,540 |
| Dallas-Fort Worth TX International Airport Series B | | 5.00 | 11-1-2023 | 500,000 | 540,540 |
| El Paso TX Airport Series 2018 | | 5.00 | 8-15-2025 | 3,110,000 | 3,676,735 |
| Houston TX Airport System Refunding Bond Subordinated Lien Bond Series 2020A | | 5.00 | 7-1-2026 | 1,000,000 | 1,221,870 |
| Houston TX Airport System Refunding Bond Subordinated Lien Bond Series 2020A | | 5.00 | 7-1-2027 | 1,000,000 | 1,251,780 |
| Houston TX Airport System Refunding Bond Subordinated Lien Bond Series 2020B | | 5.00 | 7-1-2026 | 1,500,000 | 1,856,415 |
| Houston TX Airport System Refunding Bond Subordinated Lien Bond Series 2020B | | 5.00 | 7-1-2027 | 3,000,000 | 3,807,150 |
The accompanying notes are an integral part of these financial statements.
34 | Wells Fargo Short-Term Municipal Bond Fund
Portfolio of investments—December 31, 2020 (unaudited)
| | | Interest
rate | Maturity
date | Principal | Value |
| Airport revenue (continued) | | | | | |
| Houston TX Airport System Refunding Bond Subordinated Lien Bond Series A | | 5.00% | 7-1-2024 | $ 3,620,000 | $ 3,865,255 |
| Houston TX Airport System Refunding Bond Subordinated Lien Bond Series B | | 5.00 | 7-1-2027 | 6,090,000 | 6,524,339 |
| | | | | | 23,960,624 |
| Education revenue: 0.43% | | | | | |
| Clifton TX Higher Education Finance Corporation Education International Leadership Series D | | 5.00 | 8-15-2021 | 665,000 | 680,621 |
| Clifton TX Higher Education Finance Corporation Education International Leadership Series D | | 5.00 | 8-15-2022 | 1,000,000 | 1,060,440 |
| Clifton TX Higher Education Finance Corporation Education International Leadership Series D | | 5.00 | 8-15-2023 | 1,510,000 | 1,654,598 |
| Clifton TX Higher Education Finance Corporation Education International Leadership Series D | | 5.00 | 8-15-2024 | 3,125,000 | 3,526,844 |
| Texas A&M University System Permanent University Series A | | 5.00 | 7-1-2021 | 4,870,000 | 4,986,588 |
| | | | | | 11,909,091 |
| GO revenue: 5.26% | | | | | |
| Cypress-Fairbanks TX Independent School District Series B-2 | | 2.13 | 2-15-2040 | 17,000,000 | 17,194,310 |
| Dallas TX Unrefunded Balance Refunding Bond | | 5.00 | 2-15-2021 | 3,580,000 | 3,599,511 |
| Denton TX Independent School District School Building Series B | | 2.00 | 8-1-2044 | 4,070,000 | 4,302,845 |
| Eanes TX Independent School District School Building Series B | | 1.75 | 8-1-2039 | 7,465,000 | 7,760,987 |
| Hays TX Consolidated Independent School District Building Bond Series B | | 2.70 | 8-15-2042 | 7,370,000 | 7,624,118 |
| Houston TX Public Improvement Series A | | 5.00 | 3-1-2021 | 4,000,000 | 4,030,360 |
| Houston TX Public Improvement Series A | | 5.00 | 3-1-2022 | 5,000,000 | 5,281,050 |
| Houston TX Public Improvement Series A | | 5.00 | 3-1-2023 | 3,500,000 | 3,861,060 |
| Lake Travis TX Independent School District Prefunded Bond Series B | | 2.63 | 2-15-2048 | 1,010,000 | 1,036,482 |
| Lake Travis TX Independent School District Series B | | 2.63 | 2-15-2048 | 1,720,000 | 1,765,098 |
| Lake Travis TX Independent School District Series B | | 2.63 | 2-15-2048 | 7,270,000 | 7,457,348 |
| Leander TX Independent School District Refunding CAB ¤ | | 0.00 | 8-15-2023 | 1,065,000 | 1,056,097 |
| Mansfield TX Independent School District | | 2.50 | 8-1-2042 | 8,500,000 | 8,608,800 |
| McAllen TX Independent School District Series A | | 5.00 | 2-15-2024 | 2,620,000 | 2,887,135 |
| New Caney TX Independent School District School Building Bond | | 3.00 | 2-15-2050 | 1,100,000 | 1,118,392 |
| North East TX Independent School District | | 2.20 | 8-1-2049 | 4,800,000 | 5,064,720 |
| North East TX Independent School District | | 2.38 | 8-1-2047 | 7,135,000 | 7,367,030 |
| Northside TX Independent School District School Building | | 0.70 | 6-1-2050 | 5,000,000 | 5,047,150 |
| Northside TX Independent School District School Building Bond | | 1.75 | 6-1-2032 | 5,675,000 | 5,690,436 |
| Northside TX Independent School District School Building Bond | | 2.00 | 6-1-2046 | 10,970,000 | 11,047,339 |
| Northside TX Independent School District School Building Bond Series 2018 | | 2.75 | 8-1-2048 | 20,305,000 | 21,486,954 |
The accompanying notes are an integral part of these financial statements.
Wells Fargo Short-Term Municipal Bond Fund | 35
Portfolio of investments—December 31, 2020 (unaudited)
| | | Interest
rate | Maturity
date | Principal | Value |
| GO revenue (continued) | | | | | |
| Texas Transportation Commission Mobility Fund Series B (SIFMA Municipal Swap+0.30%)± | | 0.39% | 10-1-2041 | $ 4,500,000 | $ 4,505,940 |
| Tomball TX Independent School District Series B2 | | 2.13 | 2-15-2039 | 6,750,000 | 6,827,153 |
| | | | | | 144,620,315 |
| Health revenue: 0.43% | | | | | |
| Harris County TX Cultural Education Facilities Finance Corporation Hospital Memorial Hermann Health System (SIFMA Municipal Swap+0.57%)± | | 0.66 | 12-1-2049 | 11,000,000 | 10,946,650 |
| Travis County TX Health Facilities Development Corporation Longhorn Village Project Series A | | 7.13 | 1-1-2046 | 845,000 | 845,000 |
| | | | | | 11,791,650 |
| Housing revenue: 1.21% | | | | | |
| Alamito TX Public Facility Corporation Cramer Three Apartments Project | | 2.50 | 11-1-2021 | 20,000,000 | 20,136,400 |
| Dallas TX Housing Finance Corporation Multifamily Housing Estates at Shiloh | | 1.51 | 7-1-2037 | 7,000,000 | 7,145,110 |
| Odessa TX Housing Finance Corporation Multifamily Housing Vera Odessa Apartments (FHA Insured) | | 0.35 | 9-1-2023 | 6,000,000 | 5,997,300 |
| | | | | | 33,278,810 |
| Miscellaneous revenue: 0.06% | | | | | |
| Texas Subordinate Bond Series E2 | | 2.25 | 8-1-2029 | 1,675,000 | 1,677,395 |
| Resource recovery revenue: 1.21% | | | | | |
| Mission TX Economic Development Corporation Republic Services Incorporated Project | | 0.30 | 1-1-2026 | 20,000,000 | 19,999,800 |
| Port Arthur TX Navigation District Jefferson County Environmental Facilities Motiva Enterprises LLC Project Series B ø | | 0.17 | 4-1-2040 | 5,000,000 | 5,000,000 |
| Port Arthur TX Navigation District Jefferson County Environmental Facilities Motiva Enterprises LLC Project Series E ø | | 0.25 | 11-1-2040 | 8,100,000 | 8,100,000 |
| | | | | | 33,099,800 |
| Transportation revenue: 0.29% | | | | | |
| Central Texas Regional Mobility Authority Subordinate Bond | | 4.00 | 1-1-2022 | 6,000,000 | 6,092,280 |
| North Texas Tollway Authority Series A | | 5.00 | 1-1-2021 | 1,860,000 | 1,860,000 |
| | | | | | 7,952,280 |
| Utilities revenue: 1.39% | | | | | |
| San Antonio TX Electric & Gas Revenue Various Refunding Bond Junior Lien Series 2020 | | 1.75 | 2-1-2049 | 11,500,000 | 12,106,165 |
| San Antonio TX Electric & Gas Systems Junior Lien Refunding Bond Series 2015D | | 1.13 | 12-1-2045 | 10,000,000 | 10,309,300 |
| San Antonio TX Electric & Gas Systems Junior Lien Refunding Bond Series 2018 | | 2.75 | 2-1-2048 | 6,000,000 | 6,286,140 |
| Texas Municipal Gas Acquisition & Supply Corporation Series A (SIFMA Municipal Swap+0.55%)± | | 0.64 | 9-15-2027 | 9,470,000 | 9,449,071 |
| | | | | | 38,150,676 |
The accompanying notes are an integral part of these financial statements.
36 | Wells Fargo Short-Term Municipal Bond Fund
Portfolio of investments—December 31, 2020 (unaudited)
| | | Interest
rate | Maturity
date | Principal | Value |
| Water & sewer revenue: 0.71% | | | | | |
| San Antonio TX Water System Junior Lien Series A | | 2.63% | 5-1-2049 | $12,490,000 | $ 13,413,261 |
| San Antonio TX Water System Junior Lien Series B | | 2.00 | 5-1-2044 | 5,930,000 | 6,119,641 |
| | | | | | 19,532,902 |
| | | | | | 325,973,543 |
| Utah: 0.42% | | | | | |
| Airport revenue: 0.31% | | | | | |
| Salt Lake City UT International Airport Series A | | 5.00 | 7-1-2023 | 3,150,000 | 3,482,073 |
| Salt Lake City UT International Airport Series A | | 5.00 | 7-1-2024 | 2,000,000 | 2,290,300 |
| Salt Lake City UT International Airport Series A | | 5.00 | 7-1-2025 | 2,300,000 | 2,721,866 |
| | | | | | 8,494,239 |
| Housing revenue: 0.11% | | | | | |
| Utah Housing Corporation Multifamily Lincoln Tower Apartments Project | | 1.54 | 8-1-2022 | 3,000,000 | 3,020,730 |
| | | | | | 11,514,969 |
| Vermont: 0.02% | | | | | |
| Education revenue: 0.02% | | | | | |
| Vermont Educational & Health Buildings Financing Agency Saint Michael's College Project | | 5.00 | 10-1-2026 | 575,000 | 597,477 |
| Virginia: 2.32% | | | | | |
| Health revenue: 0.04% | | | | | |
| Lexington VA IDA Residential Care Facility Kendal at Lexington Refunding Bond | | 4.00 | 1-1-2021 | 440,000 | 440,000 |
| Lexington VA IDA Residential Care Facility Kendal at Lexington Refunding Bond | | 4.00 | 1-1-2022 | 525,000 | 534,555 |
| | | | | | 974,555 |
| Housing revenue: 0.50% | | | | | |
| Spotsylvania County VA EDA Palmers Creek Apartments Project (FHA/GNMA Insured) | | 1.45 | 8-1-2022 | 13,700,000 | 13,848,919 |
| Industrial development revenue: 0.12% | | | | | |
| Peninsula VA Ports Authority Coal Terminal Refunding Bond Dominion Terminal Associates Project | | 1.70 | 10-1-2033 | 3,300,000 | 3,350,424 |
| Miscellaneous revenue: 0.65% | | | | | |
| Westmoreland County VA IDA Lease BAN High School Project | | 2.00 | 6-1-2022 | 17,510,000 | 17,787,008 |
| Tax revenue: 0.06% | | | | | |
| Marquis VA CDA CAB Series 2015 144A¤ | | 0.00 | 9-1-2045 | 680,000 | 346,800 |
| Marquis VA CDA CAB Series A | | 5.10 | 9-1-2036 | 2,169,000 | 1,107,014 |
| Marquis VA CDA CAB Series C ¤ | | 0.00 | 9-1-2041 | 3,493,000 | 179,470 |
| | | | | | 1,633,284 |
The accompanying notes are an integral part of these financial statements.
Wells Fargo Short-Term Municipal Bond Fund | 37
Portfolio of investments—December 31, 2020 (unaudited)
| | | Interest
rate | Maturity
date | Principal | Value |
| Transportation revenue: 0.63% | | | | | |
| Chesapeake VA Bay Bridge & Tunnel District First Tier Generation Resolution | | 5.00% | 11-1-2023 | $14,115,000 | $ 15,775,912 |
| Virginia Commonwealth Transportation Board Refunding Bond Series A | | 5.00 | 5-15-2023 | 1,500,000 | 1,669,290 |
| | | | | | 17,445,202 |
| Utilities revenue: 0.32% | | | | | |
| York County VA EDA PCR Virginia Electric and Power Company Project Series A | | 1.90 | 5-1-2033 | 8,500,000 | 8,808,805 |
| | | | | | 63,848,197 |
| Washington: 4.18% | | | | | |
| Airport revenue: 0.16% | | | | | |
| Port of Seattle WA Refunding Bond Series B | | 5.00 | 8-1-2023 | 4,155,000 | 4,435,463 |
| Education revenue: 0.78% | | | | | |
| University of Washington Series A | | 5.00 | 5-1-2048 | 20,500,000 | 21,304,420 |
| GO revenue: 0.30% | | | | | |
| Washington Refunding Bond %% | | 5.00 | 6-1-2025 | 1,000,000 | 1,197,260 |
| Washington Refunding Bond %% | | 5.00 | 6-1-2026 | 1,570,000 | 1,944,021 |
| Washington Series A | | 5.00 | 8-1-2022 | 4,800,000 | 5,166,240 |
| | | | | | 8,307,521 |
| Health revenue: 0.70% | | | | | |
| Washington Health Care Facilities Authority Catholic Health Initiatives Series A | | 5.00 | 2-1-2023 | 1,025,000 | 1,028,516 |
| Washington Health Care Facilities Authority Commonspirit Health Series B1 | | 5.00 | 8-1-2049 | 2,500,000 | 2,830,450 |
| Washington Health Care Facilities Authority Commonspirit Health Series B3 | | 5.00 | 8-1-2049 | 4,000,000 | 4,834,000 |
| Washington Health Care Facilities Authority Fred Hutchinson Cancer Research (1 Month LIBOR+1.10%)± | | 1.20 | 1-1-2042 | 9,500,000 | 9,534,105 |
| Washington Housing Finance Commission Nonprofit Housing Revenue Rockwood Retirement Communities 144A | | 3.00 | 7-1-2027 | 1,000,000 | 1,007,320 |
| | | | | | 19,234,391 |
| Housing revenue: 0.89% | | | | | |
| Snohomish County WA Housing Authority Carvel Apartments Project | | 5.00 | 4-1-2025 | 500,000 | 585,420 |
| Snohomish County WA Housing Authority Carvel Apartments Project | | 5.00 | 4-1-2026 | 730,000 | 880,490 |
| Washington Housing Finance Commission MFHR College Glen Apartments Project Series A (FHA Insured) | | 1.55 | 7-1-2022 | 5,880,000 | 5,950,736 |
| Washington Housing Finance Commission MFHR Sanford Hildebrandt Towers Project | | 2.25 | 7-1-2021 | 17,025,000 | 17,025,000 |
| | | | | | 24,441,646 |
| Miscellaneous revenue: 0.04% | | | | | |
| FYI Properties Refunding Bond State of Washington District Project | | 5.00 | 6-1-2027 | 1,000,000 | 1,242,970 |
The accompanying notes are an integral part of these financial statements.
38 | Wells Fargo Short-Term Municipal Bond Fund
Portfolio of investments—December 31, 2020 (unaudited)
| | | Interest
rate | Maturity
date | Principal | Value |
| Utilities revenue: 1.31% | | | | | |
| Seattle WA Municipal Light & Power Refunding Bond Series B-2 (SIFMA Municipal Swap+0.29%)± | | 0.38% | 5-1-2045 | $12,635,000 | $ 12,635,253 |
| Seattle WA Municipal Light & Power Refunding Bond Series C-1 (SIFMA Municipal Swap+0.49%)± | | 0.58 | 11-1-2046 | 23,190,000 | 23,263,744 |
| | | | | | 35,898,997 |
| | | | | | 114,865,408 |
| West Virginia: 0.39% | | | | | |
| GO revenue: 0.08% | | | | | |
| Berkeley County WV Board of Education Public School Series 2020 | | 2.00 | 5-1-2023 | 1,000,000 | 1,040,610 |
| Berkeley County WV Board of Education Public School Series 2020 | | 2.00 | 5-1-2024 | 1,000,000 | 1,056,380 |
| | | | | | 2,096,990 |
| Utilities revenue: 0.31% | | | | | |
| West Virginia EDA Solid Waste Disposal Facilities Wheeling Power Company Mitchell Project Series A | | 3.00 | 6-1-2037 | 8,300,000 | 8,535,305 |
| | | | | | 10,632,295 |
| Wisconsin: 3.35% | | | | | |
| Airport revenue: 0.16% | | | | | |
| Wisconsin Airport Facilities PFA Senior Obligation Group Series B | | 5.00 | 7-1-2022 | 4,210,000 | 4,369,727 |
| Education revenue: 0.05% | | | | | |
| Wisconsin PFA Guilford College | | 5.00 | 1-1-2021 | 650,000 | 650,000 |
| Wisconsin PFA Guilford College | | 5.00 | 1-1-2022 | 625,000 | 631,056 |
| | | | | | 1,281,056 |
| Health revenue: 1.89% | | | | | |
| Wisconsin HEFA Advocate Aurora Health Credit Group Series B-3 | | 5.00 | 8-15-2054 | 2,000,000 | 2,275,940 |
| Wisconsin HEFA Advocate Aurora Health Credit Group Series B-4 | | 5.00 | 8-15-2054 | 1,450,000 | 1,714,176 |
| Wisconsin HEFA Advocate Aurora Health Credit Group Series C-4 (SIFMA Municipal Swap+0.65%)± | | 0.74 | 8-15-2054 | 4,200,000 | 4,219,488 |
| Wisconsin HEFA Ascension Health Alliance | | 5.00 | 11-15-2033 | 12,000,000 | 14,181,360 |
| Wisconsin HEFA Beloit Health System Incorporated | | 5.00 | 7-1-2025 | 1,000,000 | 1,188,280 |
| Wisconsin HEFA Beloit Health System Incorporated | | 5.00 | 7-1-2026 | 1,060,000 | 1,299,009 |
| Wisconsin HEFA Marshfield Clinic Health System Incorporated | | 5.00 | 2-15-2052 | 3,000,000 | 3,451,500 |
| Wisconsin HEFA Marshfield Clinic Health System Incorporated Series B2 | | 5.00 | 2-15-2051 | 18,300,000 | 22,198,083 |
| Wisconsin HEFA Marshfield Clinic Series 2012B | | 5.00 | 2-15-2026 | 630,000 | 658,470 |
| Wisconsin HEFA St. Camillus Health System Incorporated | | 5.00 | 11-1-2024 | 155,000 | 166,052 |
| Wisconsin HEFA St. Camillus Health System Incorporated | | 5.00 | 11-1-2025 | 245,000 | 265,805 |
| Wisconsin HEFA St. Camillus Health System Incorporated | | 5.00 | 11-1-2026 | 355,000 | 388,682 |
| | | | | | 52,006,845 |
The accompanying notes are an integral part of these financial statements.
Wells Fargo Short-Term Municipal Bond Fund | 39
Portfolio of investments—December 31, 2020 (unaudited)
| | | Interest
rate | Maturity
date | Principal | Value |
| Miscellaneous revenue: 0.89% | | | | | |
| Waukesha County WI Anticipation Notes Series C | | 3.00% | 5-1-2022 | $ 570,000 | $ 571,151 |
| Waukesha County WI Series B | | 3.00 | 5-1-2021 | 6,400,000 | 6,412,992 |
| Wisconsin State Refunding Bond Series A | | 5.00 | 5-1-2022 | 8,040,000 | 8,553,756 |
| Wisconsin State Refunding Bond Series A | | 5.00 | 5-1-2023 | 8,015,000 | 8,910,837 |
| | | | | | 24,448,736 |
| Resource recovery revenue: 0.36% | | | | | |
| Wisconsin PFA Series A-2 | | 0.30 | 10-1-2025 | 10,000,000 | 10,000,100 |
| | | | | | 92,106,464 |
| Total Municipal obligations (Cost $2,608,872,627) | | | | | 2,668,050,087 |
| | | Yield | | Shares | |
| Short-term investments: 1.13% | | | | | |
| Investment companies: 1.13% | | | | | |
| Wells Fargo Municipal Cash Management Money Market Fund Institutional Class ♠∞## | | 0.01% | | 31,131,260 | 31,140,600 |
| Total Short-term investments (Cost $31,140,569) | | | | | 31,140,600 |
| Total investments in securities (Cost $2,664,413,196) | 99.12% | | | | 2,723,590,687 |
| Other assets and liabilities, net | 0.88 | | | | 24,276,050 |
| Total net assets | 100.00% | | | | $ 2,747,866,737 |
| 144A | The security may be resold in transactions exempt from registration, normally to qualified institutional buyers, pursuant to Rule 144A under the Securities Act of 1933. |
| ø | Variable rate demand notes are subject to a demand feature which reduces the effective maturity. The maturity date shown represents the final maturity date of the security. The interest rate is determined and reset by the issuer daily, weekly, or monthly depending upon the terms of the security. The rate shown is the rate in effect at period end. |
| ± | Variable rate investment. The rate shown is the rate in effect at period end. |
| € | The security is an auction-rate security which has an interest rate that resets at predetermined short-term intervals through a Dutch auction. The rate shown is the rate in effect at period end. |
| ¤ | The security is issued in zero coupon form with no periodic interest payments. |
| øø | The interest rate is determined and reset by the issuer periodically depending upon the terms of the security. The rate shown is the rate in effect at period end. |
| ## | All or a portion of this security is segregated for when-issued securities. |
| ♠ | The issuer of the security is an affiliated person of the Fund as defined in the Investment Company Act of 1940. |
| ∞ | The rate represents the 7-day annualized yield at period end. |
| %% | The security is purchased on a when-issued basis. |
The accompanying notes are an integral part of these financial statements.
40 | Wells Fargo Short-Term Municipal Bond Fund
Portfolio of investments—December 31, 2020 (unaudited)
| Abbreviations: |
| AGM | Assured Guaranty Municipal |
| Ambac | Ambac Financial Group Incorporated |
| AMT | Alternative minimum tax |
| BAM | Build America Mutual Assurance Company |
| BAN | Bond anticipation notes |
| CAB | Capital appreciation bond |
| CDA | Community Development Authority |
| EDA | Economic Development Authority |
| EDFA | Economic Development Finance Authority |
| FHA | Federal Housing Administration |
| FHLMC | Federal Home Loan Mortgage Corporation |
| FNMA | Federal National Mortgage Association |
| GNMA | Government National Mortgage Association |
| GO | General obligation |
| HCFR | Healthcare facilities revenue |
| HEFA | Health & Educational Facilities Authority |
| HEFAR | Higher Education Facilities Authority Revenue |
| HFA | Housing Finance Authority |
| IDA | Industrial Development Authority |
| LIBOR | London Interbank Offered Rate |
| LIQ | Liquidity agreement |
| LOC | Letter of credit |
| MFHR | Multifamily housing revenue |
| National | National Public Finance Guarantee Corporation |
| PCFA | Pollution Control Financing Authority |
| PCR | Pollution control revenue |
| PFA | Public Finance Authority |
| RDA | Redevelopment Authority |
| SIFMA | Securities Industry and Financial Markets Association |
| SPA | Standby purchase agreement |
| TTFA | Transportation Trust Fund Authority |
Investments in affiliates
An affiliated investment is an investment in which the Fund owns at least 5% of the outstanding voting shares of the issuer or as a result of other relationships, such as the Fund and the issuer having the same investment manager. Transactions with issuers that were either affiliated persons of the Fund at the beginning of the period or the end of the period were as follows:
| | Value,
beginning of
period | Purchases | Sales
proceeds | Net
realized
gains
(losses) | Net
change in
unrealized
gains
(losses) | Value,
end of
period | % of
net
assets | Shares,
end
of period | Income
from
affiliated
securities |
| Short-term investments | | | | | | | | | |
| Investment companies | | | | | | | | | |
| Wells Fargo Municipal Cash Management Money Market Fund Institutional Class | $5,068,712 | $556,535,234 | $(530,463,091) | $463 | $(718) | $31,140,600 | 1.13% | 31,131,260 | $1,920 |
The accompanying notes are an integral part of these financial statements.
Wells Fargo Short-Term Municipal Bond Fund | 41
Statement of assets and liabilities—December 31, 2020 (unaudited)
| | |
| Assets | |
Investments in unaffiliated securities, at value (cost $2,633,272,627)
| $ 2,692,450,087 |
Investments in affiliated securites, at value (cost $31,140,569)
| 31,140,600 |
Cash
| 468 |
Receivable for interest
| 21,727,980 |
Receivable for Fund shares sold
| 10,358,412 |
Receivable for investments sold
| 1,776,000 |
Total assets
| 2,757,453,547 |
| Liabilities | |
Payable for investments purchased
| 4,118,624 |
Payable for Fund shares redeemed
| 2,950,268 |
Dividends payable
| 923,929 |
Management fee payable
| 690,581 |
Administration fees payable
| 236,615 |
Distribution fee payable
| 5,433 |
Trustees’ fees and expenses payable
| 2,060 |
Accrued expenses and other liabilities
| 659,300 |
Total liabilities
| 9,586,810 |
Total net assets
| $2,747,866,737 |
| Net assets consist of | |
Paid-in capital
| $ 2,740,973,527 |
Total distributable earnings
| 6,893,210 |
Total net assets
| $2,747,866,737 |
| Computation of net asset value and offering price per share | |
Net assets – Class A
| $ 719,112,952 |
Shares outstanding – Class A1
| 72,040,817 |
Net asset value per share – Class A
| $9.98 |
Maximum offering price per share – Class A2
| $10.18 |
Net assets – Class C
| $ 7,694,764 |
Shares outstanding – Class C1
| 770,847 |
Net asset value per share – Class C
| $9.98 |
Net assets – Class R6
| $ 478,699,617 |
Shares outstanding – Class R61
| 47,864,181 |
Net asset value per share – Class R6
| $10.00 |
Net assets – Administrator Class
| $ 11,106,814 |
Shares outstanding – Administrator Class1
| 1,112,079 |
Net asset value per share – Administrator Class
| $9.99 |
Net assets – Institutional Class
| $ 1,531,252,590 |
Shares outstanding – Institutional Class1
| 153,116,342 |
Net asset value per share – Institutional Class
| $10.00 |
| 1 | The Fund has an unlimited number of authorized shares |
| 2 | Maximum offering price is computed as 100/98 of net asset value. On investments of $50,000 or more, the offering price is reduced. |
The accompanying notes are an integral part of these financial statements.
42 | Wells Fargo Short-Term Municipal Bond Fund
Statement of operations—six months ended December 31, 2020 (unaudited)
| | |
| Investment income | |
Interest
| $ 28,263,875 |
Income from affiliated securities
| 1,920 |
Total investment income
| 28,265,795 |
| Expenses | |
Management fee
| 5,114,105 |
| Administration fees | |
Class A
| 594,253 |
Class C
| 9,874 |
Class R6
| 89,085 |
Administrator Class
| 8,308 |
Institutional Class
| 681,058 |
| Shareholder servicing fees | |
Class A
| 926,872 |
Class C
| 15,360 |
Administrator Class
| 20,583 |
| Distribution fee | |
Class C
| 46,033 |
Custody and accounting fees
| 78,306 |
Professional fees
| 36,495 |
Registration fees
| 80,055 |
Shareholder report expenses
| 98,203 |
Trustees’ fees and expenses
| 9,874 |
Other fees and expenses
| 43,386 |
Total expenses
| 7,851,850 |
| Less: Fee waivers and/or expense reimbursements | |
Fund-level
| (676,830) |
Class A
| (257,119) |
Class C
| (4,018) |
Administrator Class
| (4,352) |
Net expenses
| 6,909,531 |
Net investment income
| 21,356,264 |
| Realized and unrealized gains (losses) on investments | |
| Net realized gains on | |
Unaffiliated securities
| 1,198,797 |
Affiliated securities
| 463 |
Net realized gains on investments
| 1,199,260 |
| Net change in unrealized gains (losses) on | |
Unaffiliated securities
| 19,331,431 |
Affiliated securities
| (718) |
Net change in unrealized gains (losses) on investments
| 19,330,713 |
Net realized and unrealized gains (losses) on investments
| 20,529,973 |
Net increase in net assets resulting from operations
| $41,886,237 |
The accompanying notes are an integral part of these financial statements.
Wells Fargo Short-Term Municipal Bond Fund | 43
Statement of changes in net assets
| | |
| | Six months ended
December 31, 2020
(unaudited) | Year ended
June 30, 2020 |
| Operations | | | | |
Net investment income
| | $ 21,356,264 | | $ 61,771,330 |
Net realized gains (losses) on investments
| | 1,199,260 | | (10,303,927) |
Net change in unrealized gains (losses) on investments
| | 19,330,713 | | 4,040,095 |
Net increase in net assets resulting from operations
| | 41,886,237 | | 55,507,498 |
| Distributions to shareholders from | | | | |
| Net investment income and net realized gains | | | | |
Class A
| | (4,604,000) | | (12,821,770) |
Class C
| | (30,273) | | (174,616) |
Class R6
| | (4,499,885) | | (12,105,361) |
Administrator Class
| | (105,656) | | (417,282) |
Institutional Class
| | (12,493,619) | | (34,358,443) |
Total distributions to shareholders
| | (21,733,433) | | (59,877,472) |
| Capital share transactions | Shares | | Shares | |
| Proceeds from shares sold | | | | |
Class A
| 4,993,653 | 49,722,489 | 8,784,206 | 87,069,338 |
Class C
| 50,767 | 505,192 | 232,715 | 2,303,946 |
Class R6
| 5,174,691 | 51,611,383 | 26,743,010 | 265,860,662 |
Administrator Class
| 42,371 | 421,550 | 403,245 | 4,002,941 |
Institutional Class
| 25,069,969 | 250,065,949 | 69,711,947 | 690,696,127 |
| | | 352,326,563 | | 1,049,933,014 |
| Reinvestment of distributions | | | | |
Class A
| 439,380 | 4,376,144 | 1,217,651 | 12,072,188 |
Class C
| 2,874 | 28,625 | 15,450 | 153,234 |
Class R6
| 251,554 | 2,509,793 | 763,747 | 7,588,226 |
Administrator Class
| 9,908 | 98,718 | 40,545 | 402,421 |
Institutional Class
| 1,035,314 | 10,330,086 | 2,922,853 | 29,035,946 |
| | | 17,343,366 | | 49,252,015 |
| Payment for shares redeemed | | | | |
Class A
| (8,328,756) | (82,900,923) | (35,025,616) | (346,670,591) |
Class C
| (983,448) | (9,786,120) | (2,013,422) | (19,947,015) |
Class R6
| (20,589,327) | (205,472,142) | (43,721,125) | (433,057,352) |
Administrator Class
| (810,280) | (8,079,428) | (2,152,095) | (21,342,631) |
Institutional Class
| (66,212,232) | (660,611,998) | (96,689,449) | (956,952,570) |
| | | (966,850,611) | | (1,777,970,159) |
Net decrease in net assets resulting from capital share transactions
| | (597,180,682) | | (678,785,130) |
Total decrease in net assets
| | (577,027,878) | | (683,155,104) |
| Net assets | | | | |
Beginning of period
| | 3,324,894,615 | | 4,008,049,719 |
End of period
| | $2,747,866,737 | | $ 3,324,894,615 |
The accompanying notes are an integral part of these financial statements.
44 | Wells Fargo Short-Term Municipal Bond Fund
Financial highlights
(For a share outstanding throughout each period)
| | | Year ended June 30 |
| Class A | Six months ended
December 31, 2020
(unaudited) | 2020 | 2019 | 2018 | 2017 | 2016 |
Net asset value, beginning of period
| $9.92 | $9.92 | $9.83 | $9.85 | $9.96 | $9.93 |
Net investment income
| 0.06 | 0.15 | 0.15 | 0.13 | 0.12 | 0.11 |
Net realized and unrealized gains (losses) on investments
| 0.06 | (0.01) | 0.10 | (0.02) | (0.11) | 0.04 |
Total from investment operations
| 0.12 | 0.14 | 0.25 | 0.11 | 0.01 | 0.15 |
| Distributions to shareholders from | | | | | | |
Net investment income
| (0.06) | (0.14) | (0.16) | (0.13) | (0.12) | (0.11) |
Net realized gains
| 0.00 | 0.00 | 0.00 | 0.00 | 0.00 | (0.01) |
Tax basis return of capital
| 0.00 | 0.00 | (0.00) 1 | 0.00 | 0.00 | 0.00 |
Total distributions to shareholders
| (0.06) | (0.14) | (0.16) | (0.13) | (0.12) | (0.12) |
Net asset value, end of period
| $9.98 | $9.92 | $9.92 | $9.83 | $9.85 | $9.96 |
Total return2
| 1.24% | 1.47% | 2.57% | 1.15% | 0.14% | 1.49% |
| Ratios to average net assets (annualized) | | | | | | |
Gross expenses
| 0.77% | 0.76% | 0.76% | 0.77% | 0.76% | 0.75% |
Net expenses
| 0.63% | 0.63% | 0.63% | 0.63% | 0.63% | 0.62% |
Net investment income
| 1.22% | 1.52% | 1.59% | 1.34% | 1.23% | 1.11% |
| Supplemental data | | | | | | |
Portfolio turnover rate
| 11% | 35% | 33% | 31% | 23% | 16% |
Net assets, end of period (000s omitted)
| $719,113 | $743,254 | $991,514 | $1,209,079 | $1,619,974 | $3,362,147 |
| 1 | Amount is less than $0.005. |
| 2 | Total return calculations do not include any sales charges. Returns for periods of less than one year are not annualized. |
The accompanying notes are an integral part of these financial statements.
Wells Fargo Short-Term Municipal Bond Fund | 45
Financial highlights
(For a share outstanding throughout each period)
| | | Year ended June 30 |
| Class C | Six months ended
December 31, 2020
(unaudited) | 2020 | 2019 | 2018 | 2017 | 2016 |
Net asset value, beginning of period
| $9.92 | $9.92 | $9.83 | $9.85 | $9.96 | $9.93 |
Net investment income
| 0.03 | 0.08 | 0.08 | 0.06 | 0.05 | 0.04 |
Net realized and unrealized gains (losses) on investments
| 0.05 | (0.01) | 0.10 | (0.02) | (0.11) | 0.04 |
Total from investment operations
| 0.08 | 0.07 | 0.18 | 0.04 | (0.06) | 0.08 |
| Distributions to shareholders from | | | | | | |
Net investment income
| (0.02) | (0.07) | (0.09) | (0.06) | (0.05) | (0.04) |
Net realized gains
| 0.00 | 0.00 | 0.00 | 0.00 | 0.00 | (0.01) |
Tax basis return of capital
| 0.00 | 0.00 | (0.00) 1 | 0.00 | 0.00 | 0.00 |
Total distributions to shareholders
| (0.02) | (0.07) | (0.09) | (0.06) | (0.05) | (0.05) |
Net asset value, end of period
| $9.98 | $9.92 | $9.92 | $9.83 | $9.85 | $9.96 |
Total return2
| 0.85% | 0.71% | 1.81% | 0.40% | (0.61)% | 0.73% |
| Ratios to average net assets (annualized) | | | | | | |
Gross expenses
| 1.51% | 1.50% | 1.51% | 1.52% | 1.51% | 1.50% |
Net expenses
| 1.38% | 1.38% | 1.38% | 1.38% | 1.38% | 1.37% |
Net investment income
| 0.46% | 0.77% | 0.84% | 0.59% | 0.49% | 0.35% |
| Supplemental data | | | | | | |
Portfolio turnover rate
| 11% | 35% | 33% | 31% | 23% | 16% |
Net assets, end of period (000s omitted)
| $7,695 | $16,870 | $34,381 | $48,101 | $62,796 | $82,111 |
| 1 | Amount is less than $0.005. |
| 2 | Total return calculations do not include any sales charges. Returns for periods of less than one year are not annualized. |
The accompanying notes are an integral part of these financial statements.
46 | Wells Fargo Short-Term Municipal Bond Fund
Financial highlights
(For a share outstanding throughout each period)
| | | Year ended June 30 |
| Class R6 | Six months ended
December 31, 2020
(unaudited) | 2020 | 2019 1 |
Net asset value, beginning of period
| $9.94 | $9.94 | $9.86 |
Net investment income
| 0.08 | 0.18 | 0.17 |
Net realized and unrealized gains (losses) on investments
| 0.06 | (0.01) | 0.08 |
Total from investment operations
| 0.14 | 0.17 | 0.25 |
| Distributions to shareholders from | | | |
Net investment income
| (0.08) | (0.17) | (0.17) |
Tax basis return of capital
| 0.00 | 0.00 | (0.00) 2 |
Total distributions to shareholders
| (0.08) | (0.17) | (0.17) |
Net asset value, end of period
| $10.00 | $9.94 | $9.94 |
Total return3
| 1.38% | 1.75% | 2.60% |
| Ratios to average net assets (annualized) | | | |
Gross expenses
| 0.39% | 0.38% | 0.38% |
Net expenses
| 0.35% | 0.35% | 0.35% |
Net investment income
| 1.49% | 1.80% | 1.94% |
| Supplemental data | | | |
Portfolio turnover rate
| 11% | 35% | 33% |
Net assets, end of period (000s omitted)
| $478,700 | $626,312 | $787,524 |
| 1 | For the period from July 31, 2018 (commencement of class operations) to June 30, 2019 |
| 2 | Amount is less than $0.005. |
| 3 | Returns for periods of less than one year are not annualized. |
The accompanying notes are an integral part of these financial statements.
Wells Fargo Short-Term Municipal Bond Fund | 47
Financial highlights
(For a share outstanding throughout each period)
| | | Year ended June 30 |
| Administrator Class | Six months ended
December 31, 2020
(unaudited) | 2020 | 2019 | 2018 | 2017 | 2016 |
Net asset value, beginning of period
| $9.92 | $9.93 | $9.84 | $9.86 | $9.97 | $9.95 |
Net investment income
| 0.06 1 | 0.16 | 0.16 | 0.14 | 0.13 | 0.11 1 |
Net realized and unrealized gains (losses) on investments
| 0.07 | (0.02) | 0.09 | (0.02) | (0.11) | 0.03 |
Total from investment operations
| 0.13 | 0.14 | 0.25 | 0.12 | 0.02 | 0.14 |
| Distributions to shareholders from | | | | | | |
Net investment income
| (0.06) | (0.15) | (0.16) | (0.14) | (0.13) | (0.11) |
Net realized gains
| 0.00 | 0.00 | 0.00 | 0.00 | 0.00 | (0.01) |
Tax basis return of capital
| 0.00 | 0.00 | (0.00) 2 | 0.00 | 0.00 | 0.00 |
Total distributions to shareholders
| (0.06) | (0.15) | (0.16) | (0.14) | (0.13) | (0.12) |
Net asset value, end of period
| $9.99 | $9.92 | $9.93 | $9.84 | $9.86 | $9.97 |
Total return3
| 1.35% | 1.39% | 2.60% | 1.18% | 0.17% | 1.42% |
| Ratios to average net assets (annualized) | | | | | | |
Gross expenses
| 0.70% | 0.69% | 0.70% | 0.71% | 0.70% | 0.66% |
Net expenses
| 0.60% | 0.60% | 0.60% | 0.60% | 0.60% | 0.59% |
Net investment income
| 1.25% | 1.55% | 1.62% | 1.36% | 1.27% | 1.08% |
| Supplemental data | | | | | | |
Portfolio turnover rate
| 11% | 35% | 33% | 31% | 23% | 16% |
Net assets, end of period (000s omitted)
| $11,107 | $18,560 | $35,517 | $44,186 | $68,621 | $95,121 |
| 1 | Calculated based upon average shares outstanding |
| 2 | Amount is less than $0.005. |
| 3 | Returns for periods of less than one year are not annualized. |
The accompanying notes are an integral part of these financial statements.
48 | Wells Fargo Short-Term Municipal Bond Fund
Financial highlights
(For a share outstanding throughout each period)
| | | Year ended June 30 |
| Institutional Class | Six months ended
December 31, 2020
(unaudited) | 2020 | 2019 | 2018 | 2017 | 2016 |
Net asset value, beginning of period
| $9.94 | $9.94 | $9.85 | $9.87 | $9.98 | $9.95 |
Net investment income
| 0.07 | 0.17 | 0.18 | 0.16 | 0.15 | 0.13 |
Net realized and unrealized gains (losses) on investments
| 0.06 | (0.00) 1 | 0.09 | (0.02) | (0.11) | 0.04 |
Total from investment operations
| 0.13 | 0.17 | 0.27 | 0.14 | 0.04 | 0.17 |
| Distributions to shareholders from | | | | | | |
Net investment income
| (0.07) | (0.17) | (0.18) | (0.16) | (0.15) | (0.13) |
Net realized gains
| 0.00 | 0.00 | 0.00 | 0.00 | 0.00 | (0.01) |
Tax basis return of capital
| 0.00 | 0.00 | (0.00) 2 | 0.00 | 0.00 | 0.00 |
Total distributions to shareholders
| (0.07) | (0.17) | (0.18) | (0.16) | (0.15) | (0.14) |
Net asset value, end of period
| $10.00 | $9.94 | $9.94 | $9.85 | $9.87 | $9.98 |
Total return3
| 1.35% | 1.70% | 2.81% | 1.39% | 0.37% | 1.71% |
| Ratios to average net assets (annualized) | | | | | | |
Gross expenses
| 0.44% | 0.43% | 0.43% | 0.44% | 0.43% | 0.42% |
Net expenses
| 0.40% | 0.40% | 0.40% | 0.40% | 0.40% | 0.40% |
Net investment income
| 1.44% | 1.74% | 1.80% | 1.58% | 1.48% | 1.33% |
| Supplemental data | | | | | | |
Portfolio turnover rate
| 11% | 35% | 33% | 31% | 23% | 16% |
Net assets, end of period (000s omitted)
| $1,531,253 | $1,919,898 | $2,159,113 | $3,421,249 | $3,427,060 | $2,261,092 |
| 1 | Amount is more than $(0.005). |
| 2 | Amount is less than $0.005. |
| 3 | Returns for periods of less than one year are not annualized. |
The accompanying notes are an integral part of these financial statements.
Wells Fargo Short-Term Municipal Bond Fund | 49
Notes to financial statements (unaudited)
1. ORGANIZATION
Wells Fargo Funds Trust (the “Trust”), a Delaware statutory trust organized on March 10, 1999, is an open-end management investment company registered under the Investment Company Act of 1940, as amended (the “1940 Act”). As an investment company, the Trust follows the accounting and reporting guidance in Financial Accounting Standards Board (“FASB”) Accounting Standards Codification Topic 946, Financial Services – Investment Companies. These financial statements report on the Wells Fargo Short-Term Municipal Bond Fund (the “Fund”) which is a diversified series of the Trust.
2. SIGNIFICANT ACCOUNTING POLICIES
The following significant accounting policies, which are consistently followed in the preparation of the financial statements of the Fund, are in conformity with U.S. generally accepted accounting principles which require management to make estimates and assumptions that affect the reported amounts of assets and liabilities, disclosure of contingent assets and liabilities at the date of the financial statements, and the reported amounts of income and expenses during the reporting period. Actual results could differ from those estimates.
Securities valuation
All investments are valued each business day as of the close of regular trading on the New York Stock Exchange (generally 4 p.m. Eastern Time), although the Fund may deviate from this calculation time under unusual or unexpected circumstances.
Debt securities are valued at the evaluated bid price provided by an independent pricing service (e.g. taking into account various factors, including yields, maturities, or credit ratings) or, if a reliable price is not available, the quoted bid price from an independent broker-dealer.
Futures contracts that are listed on a foreign or domestic exchange or market are valued at the official closing price or, if none, the last sales price.
Investments in registered open-end investment companies are valued at net asset value.
Investments which are not valued using any of the methods discussed above are valued at their fair value, as determined in good faith by the Board of Trustees of the Fund. The Board of Trustees has established a Valuation Committee comprised of the Trustees and has delegated to it the authority to take any actions regarding the valuation of portfolio securities that the Valuation Committee deems necessary or appropriate, including determining the fair value of portfolio securities, unless the determination has been delegated to the Wells Fargo Asset Management Pricing Committee at Wells Fargo Funds Management, LLC ("Funds Management"). The Board of Trustees retains the authority to make or ratify any valuation decisions or approve any changes to the Valuation Procedures as it deems appropriate. On a quarterly basis, the Board of Trustees receives reports on any valuation actions taken by the Valuation Committee or the Wells Fargo Asset Management Pricing Committee which may include items for ratification.
When-issued transactions
The Fund may purchase securities on a forward commitment or when-issued basis. The Fund records a when-issued transaction on the trade date and will segregate assets in an amount at least equal in value to the Fund's commitment to purchase when-issued securities. Securities purchased on a when-issued basis are marked-to-market daily and the Fund begins earning interest on the settlement date. Losses may arise due to changes in the market value of the underlying securities or if the counterparty does not perform under the contract.
Futures contracts
Futures contracts are agreements between the Fund and a counterparty to buy or sell a specific amount of a commodity, financial instrument or currency at a specified price on a specified date. The Fund may buy and sell futures contracts in order to gain exposure to, or protect against, changes in interest rates and is subject to interest rate risk. The primary risks associated with the use of futures contracts are the imperfect correlation between changes in market values of securities held by the Fund and the prices of futures contracts, and the possibility of an illiquid market. Futures contracts are generally entered into on a regulated futures exchange and cleared through a clearinghouse associated with the exchange. With futures contracts, there is minimal counterparty risk to the Fund since futures contracts are exchange traded and the exchange’s clearinghouse, as the counterparty to all exchange traded futures, guarantees the futures contracts against default.
Upon entering into a futures contracts, the Fund is required to deposit either cash or securities (initial margin) with the broker in an amount equal to a certain percentage of the contract value. Subsequent payments (variation margin) are paid to or from the broker each day equal to the daily changes in the contract value. Such payments are recorded as unrealized gains or losses and, if any, shown as variation margin receivable (payable) in the Statement of Assets and Liabilities. Should the Fund fail to
50 | Wells Fargo Short-Term Municipal Bond Fund
Notes to financial statements (unaudited)
make requested variation margin payments, the broker can gain access to the initial margin to satisfy the Fund’s payment obligations. When the contracts are closed, a realized gain or loss is recorded in the Statement of Operations.
Security transactions and income recognition
Securities transactions are recorded on a trade date basis. Realized gains or losses are recorded on the basis of identified cost.
Interest income is accrued daily and bond discounts are accreted and premiums are amortized daily. To the extent debt obligations are placed on non-accrual status, any related interest income may be reduced by writing off interest receivables when the collection of all or a portion of interest has been determined to be doubtful based on consistently applied procedures and the fair value has decreased. If the issuer subsequently resumes interest payments or when the collectability of interest is reasonably assured, the debt obligation is removed from non-accrual status.
Distributions to shareholders
Distributions to shareholders from net investment income are declared daily and paid monthly. Distributions from net realized gains, if any, are recorded on the ex-dividend date and paid at least annually. Such distributions are determined in accordance with income tax regulations and may differ from U.S. generally accepted accounting principles. Dividend sources are estimated at the time of declaration. The tax character of distributions is determined as of the Fund’s fiscal year end. Therefore, a portion of the Fund’s distributions made prior to the Fund’s fiscal year end may be categorized as a tax return of capital at year end.
Federal and other taxes
The Fund intends to continue to qualify as a regulated investment company by distributing substantially all of its investment company taxable and tax-exempt income and any net realized capital gains (after reduction for capital loss carryforwards) sufficient to relieve it from all, or substantially all, federal income taxes. Accordingly, no provision for federal income taxes was required.
The Fund’s income and federal excise tax returns and all financial records supporting those returns for the prior three fiscal years are subject to examination by the federal and Delaware revenue authorities. Management has analyzed the Fund’s tax positions taken on federal, state, and foreign tax returns for all open tax years and does not believe that there are any uncertain tax positions that require recognition of a tax liability.
As of December 31, 2020, the aggregate cost of all investments for federal income tax purposes was $2,664,002,720 and the unrealized gains (losses) consisted of:
| Gross unrealized gains | $63,350,041 |
| Gross unrealized losses | (3,762,074) |
| Net unrealized gains | $59,587,967 |
As of June 30, 2020, the Fund had capital loss carryforwards which consisted of $4,358,707 in short-term capital losses and $49,074,399 in long-term capital losses.
Class allocations
The separate classes of shares offered by each Fund differ principally in applicable sales charges, distribution, shareholder servicing, and administration fees. Class specific expenses are charged directly to that share class. Investment income, common fund-level expenses, and realized and unrealized gains (losses) on investments are allocated daily to each class of shares based on the relative proportion of net assets of each class.
Wells Fargo Short-Term Municipal Bond Fund | 51
Notes to financial statements (unaudited)
3. FAIR VALUATION MEASUREMENTS
Fair value measurements of investments are determined within a framework that has established a fair value hierarchy based upon the various data inputs utilized in determining the value of the Fund’s investments. The three-level hierarchy gives the highest priority to unadjusted quoted prices in active markets for identical assets or liabilities (Level 1) and the lowest priority to unobservable inputs (Level 3). The Fund’s investments are classified within the fair value hierarchy based on the lowest level of input that is significant to the fair value measurement. The inputs are summarized into three broad levels as follows:
| ■ | Level 1 – quoted prices in active markets for identical securities |
| ■ | Level 2 – other significant observable inputs (including quoted prices for similar securities, interest rates, prepayment speeds, credit risk, etc.) |
| ■ | Level 3 – significant unobservable inputs (including the Fund’s own assumptions in determining the fair value of investments) |
The inputs or methodologies used for valuing investments in securities are not necessarily an indication of the risk associated with investing in those securities.
The following is a summary of the inputs used in valuing the Fund’s assets and liabilities as of December 31, 2020:
| | Quoted prices
(Level 1) | Other significant
observable inputs
(Level 2) | Significant
unobservable inputs
(Level 3) | Total |
| Assets | | | | |
| Investments in: | | | | |
| Closed end municipal bond fund obligations | $ 0 | $ 24,400,000 | $0 | $ 24,400,000 |
| Municipal obligations | 0 | 2,668,050,087 | 0 | 2,668,050,087 |
| Short-term investments | | | | |
| Investment companies | 31,140,600 | 0 | 0 | 31,140,600 |
| Total assets | $31,140,600 | $2,692,450,087 | $0 | $2,723,590,687 |
Additional sector, industry or geographic detail is included in the Portfolio of Investments.
For the six months ended December 31, 2020, the Fund did not have any transfers into/out of Level 3.
4. TRANSACTIONS WITH AFFILIATES
Management fee
Funds Management, an indirect wholly owned subsidiary of Wells Fargo & Company (“Wells Fargo”), is the manager of the Fund and provides advisory and fund-level administrative services under an investment management agreement. Under the investment management agreement, Funds Management is responsible for, among other services, implementing the investment objectives and strategies of the Fund, supervising the subadviser and providing fund-level administrative services in connection with the Fund’s operations. As compensation for its services under the investment management agreement, Funds Management is entitled to receive a management fee at the following annual rate based on the Fund’s average daily net assets:
| Average daily net assets | Management fee |
| First $1 billion | 0.350% |
| Next $4 billion | 0.325 |
| Next $3 billion | 0.290 |
| Next $2 billion | 0.265 |
| Over $10 billion | 0.255 |
For the six months ended December 31, 2020, the management fee was equivalent to an annual rate of 0.33% of the Fund’s average daily net assets.
Funds Management has retained the services of a subadviser to provide daily portfolio management to the Fund. The fee for subadvisory services is borne by Funds Management. Wells Capital Management, Incorporated, an affiliate of Funds
52 | Wells Fargo Short-Term Municipal Bond Fund
Notes to financial statements (unaudited)
Management and an indirect wholly owned subsidiary of Wells Fargo, is the subadviser to the Fund and is entitled to receive a fee from Funds Management at an annual rate starting at 0.15% and declining to 0.05% as the average daily net assets of the Fund increase.
Administration fees
Under a class-level administration agreement, Funds Management provides class-level administrative services to the Fund, which includes paying fees and expenses for services provided by the transfer agent, sub-transfer agents, omnibus account servicers and record-keepers. As compensation for its services under the class-level administration agreement, Funds Management receives an annual fee which is calculated based on the average daily net assets of each class as follows:
| | Class-level
administration fee |
| Class A | 0.16% |
| Class C | 0.16 |
| Class R6 | 0.03 |
| Administrator Class | 0.10 |
| Institutional Class | 0.08 |
Waivers and/or expense reimbursements
Funds Management has contractually waived and/or reimbursed management and administration fees to the extent necessary to maintain certain net operating expense ratios for the Fund. When each class of the Fund has exceeded its expense cap, Funds Management has waived fees and/or reimbursed expenses from fund-level expenses on a proportionate basis and then from class specific expenses. When only certain classes exceed their expense caps, waivers and/or reimbursements are applied against class specific expenses before fund-level expenses. Funds Management has committed through October 31, 2021 to waive fees and/or reimburse expenses to the extent necessary to cap the Fund’s expenses at 0.63% for Class A shares, 1.38% for Class C shares, 0.35% for Class R6 shares, 0.60% for Administrator Class shares, and 0.40% for Institutional Class shares. Prior to or after the commitment expiration date, the cap may be increased or the commitment to maintain the cap may be terminated only with the approval of the Board of Trustees.
Distribution fee
The Trust has adopted a distribution plan for Class C shares of the Fund pursuant to Rule 12b-1 under the 1940 Act. A distribution fee is charged charged to Class C shares and paid to Wells Fargo Funds Distributor, LLC (“Funds Distributor”), the principal underwriter, at an annual rate of 0.75% of the average daily net assets of Class C shares.
In addition, Funds Distributor is entitled to receive the front-end sales charge from the purchase of Class A shares and a contingent deferred sales charge on the redemption of certain Class A shares. Funds Distributor is also entitled to receive the contingent deferred sales charges from redemptions of Class C shares. For the six months ended December 31, 2020, Funds Distributor received $416 from the sale of Class A shares and $51 in contingent deferred sales charges from redemptions of Class C shares. Funds Distributor did not receive any contingent deferred sales charges from Class A for the six months ended December 31, 2020.
Shareholder servicing fees
The Trust has entered into contracts with one or more shareholder servicing agents, whereby Class A, Class C, and Administrator Class of the Fund are charged a fee at an annual rate of 0.25% of the average daily net assets of each respective class. A portion of these total shareholder servicing fees were paid to affiliates of Wells Fargo.
Interfund transactions
The Fund may purchase or sell portfolio investment securities to certain other Wells Fargo affiliates pursuant to Rule 17a-7 under the 1940 Act and under procedures adopted by the Board of Trustees. The procedures have been designed to ensure that these interfund transactions, which do not incur broker commissions, are effected at current market prices. Pursuant to these procedures, the Fund had $135,198,000, $296,845,063 and $0 in interfund purchases, sales and net realized gains (losses), respectively, during the six months ended December 31, 2020.
5. INVESTMENT PORTFOLIO TRANSACTIONS
Purchases and sales of investments, excluding U.S. government obligations (if any) and short-term securities, for the six months ended December 31, 2020 were $316,430,677 and $437,458,703, respectively.
Wells Fargo Short-Term Municipal Bond Fund | 53
Notes to financial statements (unaudited)
6. BANK BORROWINGS
The Trust (excluding the money market funds), Wells Fargo Master Trust and Wells Fargo Variable Trust are parties to a $350,000,000 revolving credit agreement whereby the Fund is permitted to use bank borrowings for temporary or emergency purposes, such as to fund shareholder redemption requests. Interest under the credit agreement is charged to the Fund based on a borrowing rate equal to the higher of the Federal Funds rate in effect on that day plus 1.25% or the overnight LIBOR rate in effect on that day plus 1.25%. In addition, an annual commitment fee equal to 0.25% of the unused balance is allocated to each participating fund.
For the six months ended December 31, 2020, there were no borrowings by the Fund under the agreement.
7. INDEMNIFICATION
Under the Fund's organizational documents, the officers and Trustees have been granted certain indemnification rights against certain liabilities that may arise out of performance of their duties to the Fund. The Fund has entered into a separate agreement with each Trustee that converts indemnification rights currently existing under the Fund’s organizational documents into contractual rights that cannot be changed in the future without the consent of the Trustee. Additionally, in the normal course of business, the Fund may enter into contracts with service providers that contain a variety of indemnification clauses. The Fund’s maximum exposure under these arrangements is dependent on future claims that may be made against the Fund and, therefore, cannot be estimated.
8. NEW ACCOUNTING PRONOUNCEMENT
In August 2018, FASB issued Accounting Standards Update (“ASU”) No. 2018-13, Fair Value Measurement (Topic 820) Disclosure Framework - Changes to the Disclosure Requirements for Fair Value Measurement. ASU 2018-13 updates the disclosure requirements on fair value measurements in Topic 820, Fair Value Measurements. The amendments are effective for fiscal years, and interim periods within those fiscal years, beginning after December 15, 2019. Management has adopted this guidance which did not have a material impact on the financial statements.
9. SUBSEQUENT EVENT
On February 23, 2021, Wells Fargo announced that it has entered into a definitive agreement to sell Wells Fargo Asset Management (“WFAM”) to GTCR LLC and Reverence Capital Partners, L.P. WFAM is the trade name used by the asset management businesses of Wells Fargo and includes Wells Fargo Funds Management, LLC, the investment manager to the Fund, Wells Capital Management Incorporated and Wells Fargo Asset Management (International) Limited, both registered investment advisers providing sub-advisory services to certain funds, and Wells Fargo Funds Distributor, LLC, the Fund’s principal underwriter. As part of the transaction, Wells Fargo will own a 9.9% equity interest and will continue to serve as an important client and distribution partner.
Consummation of the transaction will result in the automatic termination of the Fund’s investment management agreement and sub-advisory agreement(s). The Fund’s Board of Trustees will be asked to approve new investment management arrangements with the new company. If approved by the Board, the new investment management arrangements with the new company will be presented to the shareholders of the Fund for approval, and, if approved by shareholders, would take effect upon the closing of the transaction. The transaction is expected to close in the second half of 2021, subject to customary closing conditions.
10. CORONAVIRUS (COVID-19) PANDEMIC
On March 11, 2020, the World Health Organization announced that it had made the assessment that coronavirus disease 2019 (“COVID-19”) is a pandemic. The impacts of COVID-19 are affecting the entire global economy, individual companies and investment products, and the market in general. There is significant uncertainty around the extent and duration of business disruptions related to COVID-19 and the impacts may be short term or may last for an extended period of time. The risk of further spreading of COVID-19 has led to significant uncertainty and volatility in the financial markets.
54 | Wells Fargo Short-Term Municipal Bond Fund
Other information (unaudited)
PROXY VOTING INFORMATION
A description of the policies and procedures used to determine how to vote proxies relating to portfolio securities is available without charge, upon request, by calling 1-800-222-8222, visiting our website at wfam.com, or visiting the SEC website at sec.gov. Information regarding how the proxies related to portfolio securities were voted during the most recent 12-month period ended June 30 is available on the website at wfam.com or by visiting the SEC website at sec.gov.
QUARTERLY PORTFOLIO HOLDINGS INFORMATION
The Fund files its complete schedule of portfolio holdings with the SEC for the first and third quarters of each fiscal year as an exhibit to its reports on Form N-PORT. Shareholders may view the filed Form N-PORT by visiting the SEC website at sec.gov.
Wells Fargo Short-Term Municipal Bond Fund | 55
Other information (unaudited)
BOARD OF TRUSTEES AND OFFICERS
Each of the Trustees and Officers1 listed in the table below acts in identical capacities for each fund in the Wells Fargo family of funds, which consists of 144 mutual funds comprising the Wells Fargo Funds Trust, Wells Fargo Variable Trust, Wells Fargo Master Trust and four closed-end funds (collectively the “Fund Complex”). This table should be read in conjunction with the Prospectus and the Statement of Additional Information2. The mailing address of each Trustee and Officer is 525 Market Street, 12th Floor, San Francisco, CA 94105. Each Trustee and Officer serves an indefinite term, however, each Trustee serves such term until reaching the mandatory retirement age established by the Trustees.
Independent Trustees
Name and
year of birth | Position held and
length of service* | Principal occupations during past five years or longer | Current other
public company or
investment
company
directorships |
William R. Ebsworth
(Born 1957) | Trustee,
since 2015 | Retired. From 1984 to 2013, equities analyst, portfolio manager, research director and chief investment officer at Fidelity Management and Research Company in Boston, Tokyo, and Hong Kong, and retired in 2013 as Chief Investment Officer of Fidelity Strategic Advisers, Inc. where he led a team of investment professionals managing client assets. Prior thereto, Board member of Hong Kong Securities Clearing Co., Hong Kong Options Clearing Corp., the Thailand International Fund, Ltd., Fidelity Investments Life Insurance Company, and Empire Fidelity Investments Life Insurance Company. Audit Committee Chair and Investment Committee Chair of the Vincent Memorial Hospital Endowment (non-profit organization). Mr. Ebsworth is a CFA® charterholder. | N/A |
Jane A. Freeman
(Born 1953) | Trustee,
since 2015;
Chair Liaison,
since 2018 | Retired. From 2012 to 2014 and 1999 to 2008, Chief Financial Officer of Scientific Learning Corporation. From 2008 to 2012, Ms. Freeman provided consulting services related to strategic business projects. Prior to 1999, Portfolio Manager at Rockefeller & Co. and Scudder, Stevens & Clark. Board member of the Harding Loevner Funds from 1996 to 2014, serving as both Lead Independent Director and chair of the Audit Committee. Board member of the Russell Exchange Traded Funds Trust from 2011 to 2012 and the chair of the Audit Committee. Ms. Freeman is also an inactive Chartered Financial Analyst. | N/A |
Isaiah Harris, Jr.
(Born 1952) | Trustee,
since 2009; Audit
Committee
Chair,
since 2019 | Retired. Chairman of the Board of CIGNA Corporation since 2009, and Director since 2005. From 2003 to 2011, Director of Deluxe Corporation. Prior thereto, President and CEO of BellSouth Advertising and Publishing Corp. from 2005 to 2007, President and CEO of BellSouth Enterprises from 2004 to 2005 and President of BellSouth Consumer Services from 2000 to 2003. Emeritus member of the Iowa State University Foundation Board of Governors. Emeritus Member of the Advisory Board of Iowa State University School of Business. Advisory Board Member, Palm Harbor Academy (private school). Mr. Harris is a certified public accountant (inactive status). | CIGNA Corporation |
Judith M. Johnson
(Born 1949) | Trustee,
since 2008 | Retired. Prior thereto, Chief Executive Officer and Chief Investment Officer of Minneapolis Employees Retirement Fund from 1996 to 2008. Ms. Johnson is an attorney, certified public accountant and a certified managerial accountant. | N/A |
David F. Larcker
(Born 1950) | Trustee,
since 2009 | James Irvin Miller Professor of Accounting at the Graduate School of Business (Emeritus), Stanford University, Director of the Corporate Governance Research Initiative and Senior Faculty of The Rock Center for Corporate Governance since 2006. From 2005 to 2008, Professor of Accounting at the Graduate School of Business, Stanford University. Prior thereto, Ernst & Young Professor of Accounting at The Wharton School, University of Pennsylvania from 1985 to 2005. | N/A |
56 | Wells Fargo Short-Term Municipal Bond Fund
Other information (unaudited)
Name and
year of birth | Position held and
length of service* | Principal occupations during past five years or longer | Current other
public company or
investment
company
directorships |
Olivia S. Mitchell
(Born 1953) | Trustee,
since 2006;
Nominating and
Governance
Committee Chair,
since 2018 | International Foundation of Employee Benefit Plans Professor, Wharton School of the University of Pennsylvania since 1993. Director of Wharton’s Pension Research Council and Boettner Center on Pensions & Retirement Research, and Research Associate at the National Bureau of Economic Research. Previously, Cornell University Professor from 1978 to 1993. | N/A |
Timothy J. Penny
(Born 1951) | Trustee,
since 1996;
Chair,
since 2018 | President and Chief Executive Officer of Southern Minnesota Initiative Foundation, a non-profit organization, since 2007. Member of the Board of Trustees of NorthStar Education Finance, Inc., a non-profit organization, since 2007. | N/A |
James G. Polisson
(Born 1959) | Trustee,
since 2018 | Retired. Chief Marketing Officer, Source (ETF) UK Services, Ltd, from 2015 to 2017. From 2012 to 2015, Principal of The Polisson Group, LLC, a management consulting, corporate advisory and principal investing company. Chief Executive Officer and Managing Director at Russell Investments, Global Exchange Traded Funds from 2010 to 2012. Managing Director of Barclays Global Investors from 1998 to 2010 and Global Chief Marketing Officer for iShares and Barclays Global Investors from 2000 to 2010. Trustee of the San Francisco Mechanics’ Institute, a non-profit organization, from 2013 to 2015. Board member of the Russell Exchange Traded Fund Trust from 2011 to 2012. Director of Barclays Global Investors Holdings Deutschland GmbH from 2006 to 2009. Mr. Polisson is an attorney and has a retired status with the Massachusetts and District of Columbia Bar Associations. | N/A |
Pamela Wheelock
(Born 1959) | Trustee,
since January
2020; previously
Trustee from
January 2018 to
July 2019 | Board member of the Destination Medical Center Economic Development Agency, Rochester, Minnesota since 2019. Interim President of the McKnight Foundation from January to September 2020. Acting Commissioner, Minnesota Department of Human Services, July 2019 through September 2019. Human Services Manager (part-time), Minnesota Department of Human Services, October 2019 through December 2019. Chief Operating Officer, Twin Cities Habitat for Humanity from 2017 to 2019. Vice President of University Services, University of Minnesota from 2012 to 2016. Prior thereto, on the Board of Directors, Governance Committee and Finance Committee for the Minnesota Philanthropy Partners (Saint Paul Foundation) from 2012 to 2018, Interim Chief Executive Officer of Blue Cross Blue Shield of Minnesota from 2011 to 2012, Chairman of the Board from 2009 to 2012 and Board Director from 2003 to 2015. Vice President, Leadership and Community Engagement, Bush Foundation, Saint Paul, Minnesota (a private foundation) from 2009 to 2011. Executive Vice President and Chief Financial Officer, Minnesota Sports and Entertainment from 2004 to 2009 and Senior Vice President from 2002 to 2004. Executive Vice President of the Minnesota Wild Foundation from 2004 to 2008. Commissioner of Finance, State of Minnesota, from 1999 to 2002. Currently Board Chair of the Minnesota Wild Foundation since 2010. | N/A |
* Length of service dates reflect the Trustee’s commencement of service with the Trust’s predecessor entities, where applicable.
Wells Fargo Short-Term Municipal Bond Fund | 57
Other information (unaudited)
Officers
Name and
year of birth | Position held and
length of service | Principal occupations during past five years or longer |
Andrew Owen
(Born 1960) | President,
since 2017 | Executive Vice President of Wells Fargo & Company and Head of Affiliated Managers, Wells Fargo Asset Management, since 2014. In addition, Mr. Owen is currently President, Chief Executive Officer and Director of Wells Fargo Funds Management, LLC since 2017. Prior thereto, Executive Vice President responsible for marketing, investments and product development for Wells Fargo Funds Management, LLC, from 2009 to 2014. |
Nancy Wiser1
(Born 1967) | Treasurer,
since 2012 | Executive Vice President of Wells Fargo Funds Management, LLC since 2011. Chief Operating Officer and Chief Compliance Officer at LightBox Capital Management LLC, from 2008 to 2011. |
Michelle Rhee
(Born 1966) | Chief Legal Officer,
since 2019 | Secretary of Wells Fargo Funds Management, LLC and Chief Legal Counsel of Wells Fargo Asset Management since 2018. Deputy General Counsel of Wells Fargo Bank N.A. since 2020 and Assistant General Counsel of Wells Fargo Bank, N.A. from 2018 to 2020. Associate General Counsel and Managing Director of Bank of America Corporation from 2004 to 2018. |
Catherine Kennedy
(Born 1969) | Secretary,
since 2019 | Vice President of Wells Fargo Funds Management, LLC and Senior Counsel of the Wells Fargo Legal Department since 2010. Vice President and Senior Counsel of Evergreen Investment Management Company, LLC from 1998 to 2010. |
Michael H. Whitaker
(Born 1967) | Chief Compliance Officer,
since 2016 | Chief Compliance Officer of Wells Fargo Asset Management since 2016. Senior Vice President and Chief Compliance Officer for Fidelity Investments from 2007 to 2016. |
Jeremy DePalma1
(Born 1974) | Assistant Treasurer,
since 2009 | Senior Vice President of Wells Fargo Funds Management, LLC since 2009. Senior Vice President of Evergreen Investment Management Company, LLC from 2008 to 2010 and head of the Fund Reporting and Control Team within Fund Administration from 2005 to 2010. |
1 Nancy Wiser acts as Treasurer of 67 funds in the Fund Complex. Jeremy DePalma acts as the Treasurer of 77 funds and Assistant Treasurer of 67 funds in the Fund Complex.
2 The Statement of Additional Information includes additional information about the Trustees and is available, without charge, upon request, by calling 1-800-222-8222 or by visiting the website at wfam.com.
58 | Wells Fargo Short-Term Municipal Bond Fund
For more information
More information about Wells Fargo Funds is available free upon request. To obtain literature, please write, visit the Fund's website, or call:
Wells Fargo Funds
P.O. Box 219967
Kansas City, MO 64121-9967
Website: wfam.com
Individual investors: 1-800-222-8222
Retail investment professionals: 1-888-877-9275
Institutional investment professionals: 1-866-765-0778
This report and the financial statements contained herein are submitted for the general information of the shareholders of the Fund. If this report is used for promotional purposes, distribution of the report must be accompanied or preceded by a current prospectus. Before investing, please consider the investment objectives, risks, charges, and expenses of the investment. For a current prospectus and, if available, a summary prospectus, containing this information, call 1-800-222-8222 or visit the Fund’s website at wfam.com. Read the prospectus carefully before you invest or send money.
Wells Fargo Asset Management (WFAM) is the trade name for certain investment advisory/management firms owned by Wells Fargo & Company. These firms include but are not limited to Wells Capital Management Incorporated and Wells Fargo Funds Management, LLC. Certain products managed by WFAM entities are distributed by Wells Fargo Funds Distributor, LLC (a broker-dealer and Member FINRA).
This material is for general informational and educational purposes only and is NOT intended to provide investment advice or a recommendation of any kind— including a recommendation for any specific investment, strategy, or plan.
INVESTMENT PRODUCTS: NOT FDIC INSURED ■ NO BANK GUARANTEE ■ MAY LOSE VALUE
© 2021 Wells Fargo & Company. All rights reserved.
PAR-0121-00282 02-21
SA256/SAR256 12-20
Semi-Annual Report
December 31, 2020
Wells Fargo
Strategic Municipal Bond Fund
Reduce clutter.
Save trees.
Sign up for electronic delivery of prospectuses and shareholder reports at wellsfargo.com/ advantagedelivery
The views expressed and any forward-looking statements are as of December 31, 2020, unless otherwise noted, and are those of the Fund's portfolio managers and/or Wells Fargo Asset Management. Discussions of individual securities or the markets generally are not intended as individual recommendations. Future events or results may vary significantly from those expressed in any forward-looking statements. The views expressed are subject to change at any time in response to changing circumstances in the market. Wells Fargo Asset Management and the Fund disclaim any obligation to publicly update or revise any views expressed or forward-looking statements.
INVESTMENT PRODUCTS: NOT FDIC INSURED ■ NO BANK GUARANTEE ■ MAY LOSE VALUE
Wells Fargo Strategic Municipal Bond Fund | 1
Letter to shareholders (unaudited)
Dear Shareholder:
We are pleased to offer you this semi-annual report for the Wells Fargo Strategic Municipal Bond Fund for the six-month period that ended December 31, 2020. Despite a deeply challenging year, dominated by the spread of COVID-19 cases and a sharp drop in economic output throughout much of the world, global stocks performed extremely well, benefiting from ongoing central bank support and rising optimism over the development and distribution of effective COVID-19 vaccines. Bonds also had positive returns, led by global bonds and high-yield bonds.
For the six-month period, U.S. stocks, based on the S&P 500 Index,1 gained 22.16%. International stocks, as measured by the MSCI ACWI ex USA Index (Net),2 returned 24.33%, while the MSCI EM Index (Net),3 had even stronger performance, with a 31.14% gain. Among bond indexes, the Bloomberg Barclays U.S. Aggregate Bond Index,4 returned 1.29%, the Bloomberg Barclays Global Aggregate ex-USD Index (unhedged),5 gained 9.44%, and the Bloomberg Barclays Municipal Bond Index,6 returned 3.07% while the ICE BofA U.S. High Yield Index,7 gained a hefty 11.49%.
The stock market rally continued in July.
After a volatile first half of the year, an existing stock market rally continued in July with strong results for equities and fixed income. However, economic data and a resurgence of COVID-19 cases underscored the urgent need to regain control of the pandemic. Second-quarter gross domestic product (GDP) shrank from the previous quarter by 9.5% and 12.1% in the U.S. and the eurozone, respectively. In contrast, China’s second-quarter GDP grew 3.2% year over year. The U.S. economy added 1.8 million jobs in July, but a double-digit jobless rate persisted.
The stock market continued to rally in August despite concerns over rising numbers of U.S. and European COVID-19 cases as well as the expiration of the $600 weekly bonus unemployment benefit in July. Relatively strong second-quarter earnings boosted investor sentiment along with the U.S. Federal Reserve’s announcement of a monetary policy shift expected to support longer-term low interest rates. U.S. manufacturing and services activity indexes beat expectations, while the U.S. housing market maintained strength. In Europe, retail sales expanded and consumer confidence was steady. China’s economy continued to expand.
Andrew Owen
President
Wells Fargo Funds
“After a volatile first half of the year, an existing stock market rally continued in July with strong results for equities and fixed income.”
| 1 | The S&P 500 Index consists of 500 stocks chosen for market size, liquidity, and industry group representation. It is a market-value-weighted index with each stock's weight in the index proportionate to its market value. You cannot invest directly in an index. |
| 2 | The Morgan Stanley Capital International (MSCI) All Country World Index (ACWI) ex USA Index (Net) is a free-float-adjusted market-capitalization-weighted index that is designed to measure the equity market performance of developed and emerging markets, excluding the United States. Source: MSCI. MSCI makes no express or implied warranties or representations and shall have no liability whatsoever with respect to any MSCI data contained herein. The MSCI data may not be further redistributed or used as a basis for other indices or any securities or financial products. This report is not approved, reviewed, or produced by MSCI. You cannot invest directly in an index. |
| 3 | The MSCI Emerging Markets (EM) Index (Net) is a free-float-adjusted market-capitalization-weighted index that is designed to measure equity market performance of emerging markets. You cannot invest directly in an index. |
| 4 | The Bloomberg Barclays U.S. Aggregate Bond Index is a broad-based benchmark that measures the investment-grade, U.S. dollar-denominated, fixed-rate taxable bond market, including Treasuries, government-related and corporate securities, mortgage-backed securities (agency fixed-rate and hybrid adjustable-rate mortgage pass-throughs), asset-backed securities, and commercial mortgage-backed securities. You cannot invest directly in an index. |
| 5 | The Bloomberg Barclays Global Aggregate ex-USD Index (unhedged) is an unmanaged index that provides a broad-based measure of the global investment-grade fixed-income markets excluding the U.S. dollar-denominated debt market. You cannot invest directly in an index. |
| 6 | The Bloomberg Barclays Municipal Bond Index is an unmanaged index composed of long-term tax-exempt bonds with a minimum credit rating of Baa. You cannot invest directly in an index. |
| 7 | The ICE BofA U.S. High Yield Index is a market-capitalization-weighted index of domestic and Yankee high-yield bonds. The index tracks the performance of high-yield securities traded in the U.S. bond market. You cannot invest directly in an index. Copyright 2021. ICE Data Indices, LLC. All rights reserved. |
2 | Wells Fargo Strategic Municipal Bond Fund
Letter to shareholders (unaudited)
Stocks grew more volatile in September on mixed economic data. U.S. economic activity continued to grow. However, U.S. unemployment remained elevated at 7.9% in September. With U.S. Congress delaying further fiscal relief and uncertainties surrounding a possible vaccine, doubts crept back into the financial markets. In the U.K., a lack of progress in Brexit talks weighed on markets. China’s economy picked up steam, fueled by increased global demand.
In October, capital markets stepped back from their six-month rally. Market volatility rose in advance of the U.S. election and amid a global increase in COVID-19 infections. Europe introduced tighter restrictions affecting economic activity. U.S. markets looked favorably at the prospect of Democratic control of the federal purse strings, which could lead to additional fiscal stimulus and a boost to economic activity. Meanwhile, China reported 4.9% third-quarter GDP growth.
Global stocks rallied in November, propelled by optimism over three promising COVID-19 vaccines. Reversing recent trends, value stocks outperformed growth stocks and cyclical stocks outpaced technology stocks. However, U.S. unemployment remained elevated, with a net job loss of 10 million since February. The eurozone services Purchasing Managers’ Index, a monthly survey of purchasing managers, contracted sharply while the region’s manufacturing activity grew. The U.S. election results added to the upbeat mood as investors anticipated more consistent policies in the new administration.
Financial markets ended the year with strength on high expectations for a rapid rollout of the COVID-19 vaccines, the successful passage of a $900 billion stimulus package, and rising expectations of additional economic support from a Democratic-led Congress. U.S. economic data were mixed with still-elevated unemployment and weak retail sales but growth in manufacturing output. In contrast, China’s economic expansion continued in both manufacturing and nonmanufacturing. U.S. COVID-19 infection rates continued to rise even as new state and local lockdown measures were implemented.
Don’t let short-term uncertainty derail long-term investment goals.
Periods of investment uncertainty can present challenges, but experience has taught us that maintaining long-term investment goals can be an effective way to plan for the future. To help you create a sound strategy based on your personal goals and risk tolerance, Wells Fargo Funds offers more than 100 mutual funds spanning a wide range of asset classes and investment styles. Although diversification cannot guarantee an investment profit or prevent losses, we believe it can be an effective way to manage investment risk and potentially smooth out overall portfolio performance. We encourage investors to know their investments and to understand that appropriate levels of risk-taking may unlock opportunities.
Thank you for choosing to invest with Wells Fargo Funds. We appreciate your confidence in us and remain committed to helping you meet your financial needs.
Sincerely,
Andrew Owen
President
Wells Fargo Funds
For further information about your Fund, contact your investment professional, visit our website at wfam.com, or call us directly at 1-800-222-8222.
Wells Fargo Strategic Municipal Bond Fund | 3
Letter to shareholders (unaudited)
Preparing for LIBOR Transition
The global financial industry is preparing to transition away from the London Interbank Offered Rate (LIBOR), a key benchmark interest rate, to new alternative rates. LIBOR underpins more than $350 trillion of financial contracts. It is the benchmark rate for a wide spectrum of products ranging from residential mortgages to corporate bonds to derivatives. Regulators have called for a market-wide transition away from LIBOR to successor reference rates by the end of 2021 (expected to be extended through June 30, 2023 for most tenors of the U.S. dollar LIBOR), which requires proactive steps be taken by issuers, counterparties, and asset managers to identify impacted products and adopt new reference rates.
The Fund holds at least one security that uses LIBOR as a floating reference rate and has a maturity date after 12-31-2021.
Although the transition process away from LIBOR has become increasingly well-defined in advance of the anticipated discontinuation date, there remains uncertainty regarding the nature of successor reference rates, and any potential effects of the transition away from LIBOR on investment instruments that use it as a benchmark rate. The transition process may result in, among other things, increased volatility or illiquidity in markets for instruments that currently rely on LIBOR and could negatively impact the value of certain instruments held by the Fund.
Wells Fargo Asset Management is monitoring LIBOR exposure closely and has put resources and controls in place to manage this transition effectively. The Fund’s portfolio management team is evaluating LIBOR holdings to understand what happens to those securities when LIBOR ceases to exist, including examining security documentation to identify the presence or absence of fallback language identifying a replacement rate to LIBOR.
While the pace of transition away from LIBOR will differ by asset class and investment strategy, the portfolio management team will monitor market conditions for those holdings to identify and mitigate deterioration or volatility in pricing and liquidity and ensure appropriate actions are taken in a timely manner.
Further information regarding the potential risks associated with the discontinuation of LIBOR can be found in the Fund’s Statement of Additional Information.
4 | Wells Fargo Strategic Municipal Bond Fund
This page is intentionally left blank.
Performance highlights (unaudited)
Investment objective
The Fund seeks current income exempt from regular federal income tax.
Manager
Wells Fargo Funds Management, LLC
Subadviser
Wells Capital Management Incorporated
Portfolio managers
Terry J. Goode
Robert J. Miller
Nicholos Venditti*
Average annual total returns (%) as of December 31, 2020
| | | Including sales charge | | Excluding sales charge | | Expense ratios1 (%) |
| | Inception date | 1 year | 5 year | 10 year | | 1 year | 5 year | 10 year | | Gross | Net 2 |
| Class A (VMPAX) | 12-1-1994 | -0.97 | 1.80 | 2.50 | | 3.13 | 2.62 | 2.91 | | 0.79 | 0.79 |
| Class C (DHICX) | 8-18-1997 | 1.36 | 1.85 | 2.14 | | 2.36 | 1.85 | 2.14 | | 1.54 | 1.54 |
| Class R6 (VMPRX)3 | 7-31-2018 | – | – | – | | 3.52 | 2.88 | 3.10 | | 0.41 | 0.41 |
| Administrator Class (VMPYX) | 10-6-1997 | – | – | – | | 3.24 | 2.77 | 3.05 | | 0.73 | 0.68 |
| Institutional Class (STRIX)4 | 11-30-2012 | – | – | – | | 3.47 | 2.96 | 3.22 | | 0.46 | 0.46 |
| Bloomberg Barclays Short-Intermediate Municipal Bond Index5 | – | – | – | – | | 3.97 | 2.74 | 2.95 | | – | – |
Figures quoted represent past performance, which is no guarantee of future results, and do not reflect taxes that a shareholder may pay on an investment in a fund. Investment return and principal value of an investment will fluctuate so that an investor’s shares, when redeemed, may be worth more or less than their original cost. Performance shown without sales charges would be lower if sales charges were reflected. Current performance may be lower or higher than the performance data quoted, which assumes the reinvestment of dividends and capital gains. Current month-end performance is available on the Fund’s website, wfam.com.
Index returns do not include transaction costs associated with buying and selling securities, any mutual fund fees or expenses, or any taxes. It is not possible to invest directly in an index.
For Class A shares, the maximum front-end sales charge is 4.00%. For Class C shares, the maximum contingent deferred sales charge is 1.00%. Performance including a contingent deferred sales charge assumes the sales charge for the corresponding time period. Class R6, Administrator Class, and Institutional Class shares are sold without a front-end sales charge or contingent deferred sales charge.
Bond values fluctuate in response to the financial condition of individual issuers, general market and economic conditions, and changes in interest rates. Changes in market conditions and government policies may lead to periods of heightened volatility in the bond market and reduced liquidity for certain bonds held by the Fund. In general, when interest rates rise, bond values fall and investors may lose principal value. Interest rate changes and their impact on the Fund and its share price can be sudden and unpredictable. High-yield securities have a greater risk of default and tend to be more volatile than higher-rated debt securities. The use of derivatives may reduce returns and/or increase volatility. Certain investment strategies tend to increase the total risk of an investment (relative to the broader market). The Fund is exposed to municipal securities risk. Consult the Fund’s prospectus for additional information on these and other risks. A portion of the Fund’s income may be subject to federal, state, and/or local income taxes or the Alternative Minimum Tax (AMT). Any capital gains distributions may be taxable.
Please see footnotes on page 7.
6 | Wells Fargo Strategic Municipal Bond Fund
Performance highlights (unaudited)
| Effective maturity distribution as of December 31, 20206 |
| Credit quality as of December 31, 20207 |
| * | Mr. Venditti became a portfolio manager of the Fund on September 1, 2020. |
| 1 | Reflects the expense ratios as stated in the most recent prospectuses. The expense ratios shown are subject to change and may differ from the annualized expense ratios shown in the financial highlights of this report. |
| 2 | The manager has contractually committed through October 31, 2021, to waive fees and/or reimburse expenses to the extent necessary to cap total annual fund operating expenses after fee waivers at 0.81% for Class A, 1.56% for Class C, 0.43% for Class R6, 0.68% for Administrator Class, and 0.48% for Institutional Class. Brokerage commissions, stamp duty fees, interest, taxes, acquired fund fees and expenses (if any), and extraordinary expenses are excluded from the expense caps. Prior to or after the commitment expiration date, the caps may be increased or the commitment to maintain the caps may be terminated only with the approval of the Board of Trustees. Without these caps, the Fund’s returns would have been lower. The expense ratio paid by an investor is the net expense ratio (the total annual fund operating expenses after fee waivers) as stated in the prospectuses. |
| 3 | Historical performance shown for the Class R6 shares prior to their inception reflects the performance of the Institutional Class shares, and includes the higher expenses applicable to the Institutional Class shares. If these expenses had not been included, returns for the Class R6 shares would be higher. |
| 4 | Historical performance shown for the Institutional class shares prior to their inception reflects the performance of the Administrator Class shares, and includes the higher expenses applicable to the Administrator Class shares. If these expenses had not been included, returns for the Institutional Class shares would be higher. |
| 5 | The Bloomberg Barclays Short-Intermediate Municipal Bond Index is a rules-based, market-value-weighted index composed of publicly traded municipal bonds that cover the U.S. dollar–denominated short-term tax-exempt bond market, including state and local general obligation bonds, revenue bonds, insured bonds, and prefunded bonds. You cannot invest directly in an index. |
| 6 | Figures represent the percentage of the Fund's long-term investments. These amounts are subject to change and may have changed since the date specified. |
| 7 | The credit quality distribution of portfolio holdings reflected in the chart is based on ratings from Standard & Poor’s, Moody’s Investors Service, and/ or Fitch Ratings Ltd. Credit quality ratings apply to the underlying holdings of the Fund and not to the Fund itself. The percentages of the Fund’s portfolio with the ratings depicted in the chart are calculated based on the total market value of fixed income securities held by the Fund. If a security was rated by all three rating agencies, the middle rating was utilized. If rated by two of three rating agencies, the lower rating was utilized, and if rated by one of the rating agencies, that rating was utilized. Standard & Poor’s rates the creditworthiness of bonds, ranging from AAA (highest) to D (lowest). Ratings from A to CCC may be modified by the addition of a plus (+) or minus (-) sign to show relative standing within the rating categories. Standard & Poor’s rates the creditworthiness of short-term notes from SP-1 (highest) to SP-3 (lowest). Moody’s rates the creditworthiness of bonds, ranging from Aaa (highest) to C (lowest). Ratings Aa to B may be modified by the addition of a number 1 (highest) to 3 (lowest) to show relative standing within the ratings categories. Moody’s rates the creditworthiness of short-term U.S. tax-exempt municipal securities from MIG 1/VMIG 1 (highest) to SG (lowest). Fitch rates the creditworthiness of bonds, ranging from AAA (highest) to D (lowest). Credit quality distribution is subject to change and may have changed since the date specified. |
Wells Fargo Strategic Municipal Bond Fund | 7
Fund expenses (unaudited)
As a shareholder of the Fund, you incur two types of costs: (1) transaction costs, including sales charges (loads) on purchase payments and contingent deferred sales charges (if any) on redemptions and (2) ongoing costs, including management fees, distribution (12b-1) and/or shareholder servicing fees, and other Fund expenses. This example is intended to help you understand your ongoing costs (in dollars) of investing in the Fund and to compare these costs with the ongoing costs of investing in other mutual funds.
The example is based on an investment of $1,000 invested at the beginning of the six-month period and held for the entire period from July 1, 2020 to December 31, 2020.
Actual expenses
The “Actual” line of the table below provides information about actual account values and actual expenses. You may use the information in this line, together with the amount you invested, to estimate the expenses that you paid over the period. Simply divide your account value by $1,000 (for example, an $8,600 account value divided by $1,000 = 8.6), then multiply the result by the number in the “Actual” line under the heading entitled “Expenses paid during period” for your applicable class of shares to estimate the expenses you paid on your account during this period.
Hypothetical example for comparison purposes
The “Hypothetical” line of the table below provides information about hypothetical account values and hypothetical expenses based on the Fund’s actual expense ratio and an assumed rate of return of 5% per year before expenses, which is not the Fund’s actual return. The hypothetical account values and expenses may not be used to estimate the actual ending account balance or expenses you paid for the period. You may use this information to compare the ongoing costs of investing in the Fund and other funds. To do so, compare this 5% hypothetical example with the 5% hypothetical examples that appear in the shareholder reports of the other funds.
Please note that the expenses shown in the table are meant to highlight your ongoing costs only and do not reflect any transactional costs, such as sales charges (loads) and contingent deferred sales charges. Therefore, the “Hypothetical” line of the table is useful in comparing ongoing costs only and will not help you determine the relative total costs of owning different funds. In addition, if these transactional costs were included, your costs would have been higher.
| | Beginning
account value
7-1-2020 | Ending
account value
12-31-2020 | Expenses
paid during
the period1 | Annualized net
expense ratio |
| Class A | | | | |
| Actual | $1,000.00 | $1,023.20 | $4.03 | 0.79% |
| Hypothetical (5% return before expenses) | $1,000.00 | $1,021.22 | $4.02 | 0.79% |
| Class C | | | | |
| Actual | $1,000.00 | $1,019.30 | $7.84 | 1.54% |
| Hypothetical (5% return before expenses) | $1,000.00 | $1,017.44 | $7.83 | 1.54% |
| Class R6 | | | | |
| Actual | $1,000.00 | $1,025.16 | $2.09 | 0.41% |
| Hypothetical (5% return before expenses) | $1,000.00 | $1,023.14 | $2.09 | 0.41% |
| Administrator Class | | | | |
| Actual | $1,000.00 | $1,023.78 | $3.47 | 0.68% |
| Hypothetical (5% return before expenses) | $1,000.00 | $1,021.78 | $3.47 | 0.68% |
| Institutional Class | | | | |
| Actual | $1,000.00 | $1,024.90 | $2.35 | 0.46% |
| Hypothetical (5% return before expenses) | $1,000.00 | $1,022.89 | $2.35 | 0.46% |
1 Expenses paid is equal to the annualized net expense ratio of each class multiplied by the average account value over the period, multiplied by the number of days in the most recent fiscal half-year divided by the number of days in the fiscal year (to reflect the one-half-year period).
8 | Wells Fargo Strategic Municipal Bond Fund
Portfolio of investments—December 31, 2020 (unaudited)
| | | | | Principal | Value |
| Closed end municipal bond fund obligations: 0.70% | | | | | |
| Other: 0.70% | | | | | |
| Nuveen AMT-Free Municipal Credit Income Fund MuniFund Preferred Shares Series B (100 shares) 0.51% 144Aø | | | | $10,000,000 | 10,000,000 |
| Nuveen AMT-Free Quality Municipal Income Fund Preferred Shares Series C (100 shares) 0.15% 144Aø | | | | 10,000,000 | 10,000,000 |
| Total Closed end municipal bond fund obligations (Cost $20,000,000) | | | | | 20,000,000 |
| | | Interest
rate | Maturity
date | | |
| Municipal obligations: 96.82% | | | | | |
| Alabama: 1.30% | | | | | |
| Health revenue: 0.19% | | | | | |
| Birmingham AL Special Care Facilities Ascension Senior Credit Group Series C-1 | | 1.85 | 11-15-2046 | 5,395,000 | 5,544,873 |
| Industrial development revenue: 0.14% | | | | | |
| Selma AL Industrial Development Board Refunding Bonds Gulf Opportunity Zone International Paper Company | | 2.00 | 11-1-2033 | 3,675,000 | 3,883,152 |
| Utilities revenue: 0.97% | | | | | |
| Alabama Black Belt Energy Gas District Series A (Royal Bank of Canada LIQ) | | 4.00 | 7-1-2046 | 2,050,000 | 2,074,088 |
| Alabama Black Belt Energy Gas District Series A | | 4.00 | 12-1-2048 | 2,000,000 | 2,189,160 |
| Lower Alabama Gas Supply District Project #2 | | 4.00 | 12-1-2050 | 8,660,000 | 9,996,498 |
| Southeast Alabama Gas Supply District Project #2 Series A | | 4.00 | 6-1-2049 | 12,150,000 | 13,487,715 |
| | | | | | 27,747,461 |
| | | | | | 37,175,486 |
| Alaska: 0.54% | | | | | |
| Health revenue: 0.23% | | | | | |
| Alaska Industrial Development & Export Authority Tanana Chiefs Conference Project Series 2019A | | 5.00 | 10-1-2027 | 1,455,000 | 1,835,221 |
| Alaska Industrial Development & Export Authority Tanana Chiefs Conference Project Series 2019A | | 5.00 | 10-1-2028 | 1,530,000 | 1,968,070 |
| Alaska Industrial Development & Export Authority Tanana Chiefs Conference Project Series 2019A | | 5.00 | 10-1-2029 | 2,220,000 | 2,911,841 |
| | | | | | 6,715,132 |
| Industrial development revenue: 0.14% | | | | | |
| Valdez AK Marine Terminal BP Pipelines Project Series B | | 5.00 | 1-1-2021 | 4,000,000 | 4,000,000 |
The accompanying notes are an integral part of these financial statements.
Wells Fargo Strategic Municipal Bond Fund | 9
Portfolio of investments—December 31, 2020 (unaudited)
| | | Interest
rate | Maturity
date | Principal | Value |
| Utilities revenue: 0.17% | | | | | |
| Alaska Industrial Development & Export Authority Power Refunding Bonds Snettisham Hydroelectric Project Series 2015 | | 5.00% | 1-1-2022 | $ 1,735,000 | $ 1,800,132 |
| Alaska Industrial Development & Export Authority Power Refunding Bonds Snettisham Hydroelectric Project Series 2015 | | 5.00 | 1-1-2023 | 2,835,000 | 3,042,777 |
| | | | | | 4,842,909 |
| | | | | | 15,558,041 |
| Arizona: 2.26% | | | | | |
| Education revenue: 0.54% | | | | | |
| Arizona Board Regents University Arizona System Revenue Refunding Speed Series C %% | | 5.00 | 8-1-2023 | 1,000,000 | 1,100,580 |
| Arizona Board Regents University Arizona System Revenue Refunding Speed Series C %% | | 5.00 | 8-1-2025 | 600,000 | 710,646 |
| Arizona IDA Agribusiness & Equine Center Incorporated Project Series 2017B 144A | | 4.00 | 3-1-2027 | 1,195,000 | 1,265,756 |
| Arizona IDA Education Facility Leman Academy of Excellence Incorporated Project 144A | | 4.50 | 7-1-2029 | 765,000 | 803,655 |
| Maricopa County AZ IDA Educational Horizon Community Learning Center Project | | 2.63 | 7-1-2021 | 550,000 | 550,385 |
| Phoenix AZ IDA Great Hearts Academies Project | | 5.20 | 7-1-2022 | 240,000 | 245,597 |
| Pima County AZ IDA American Leadership Academy Project Series 2015 144A | | 4.60 | 6-15-2025 | 940,000 | 983,249 |
| Pima County AZ IDA Charter Schools Project Series 2013 | | 4.50 | 7-1-2021 | 1,210,000 | 1,230,062 |
| Pima County AZ IDA Charter Schools Project Series 2013 | | 4.50 | 7-1-2022 | 1,245,000 | 1,270,348 |
| Pima County AZ IDA Education Revenue Refunding Facility Edkey Charter 144A | | 3.50 | 7-1-2025 | 2,605,000 | 2,656,006 |
| Pima County AZ IDA New Plan Learning Project Series A | | 7.75 | 7-1-2035 | 985,000 | 982,439 |
| Pima County AZ IDA New Plan Learning Project Series A | | 8.13 | 7-1-2041 | 2,945,000 | 2,946,914 |
| Pima County AZ IDA Noah Webster Schools Project Series A | | 5.50 | 12-15-2023 | 605,000 | 642,498 |
| | | | | | 15,388,135 |
| GO revenue: 0.02% | | | | | |
| Verrado AZ Community Facilities District #1 Series A 144A | | 5.00 | 7-15-2021 | 500,000 | 504,535 |
| Health revenue: 0.45% | | | | | |
| Maricopa County AZ IDA Senior Living Facilities Christian Care Retirement Apartments Incorporated Project | | 5.00 | 1-1-2022 | 1,065,000 | 1,111,349 |
| Maricopa County AZ IDA Senior Living Facilities Christian Care Retirement Apartments Incorporated Project | | 5.00 | 1-1-2023 | 1,120,000 | 1,215,950 |
| Maricopa County AZ IDA Senior Living Facilities Christian Care Surprise Incorporated Project 144A | | 5.00 | 1-1-2026 | 3,015,000 | 3,059,351 |
| Maricopa County AZ IDA Series 2019C (SIFMA Municipal Swap+0.57%)± | | 0.66 | 1-1-2035 | 5,675,000 | 5,647,760 |
| Tempe AZ IDA Mirabella Arizona State University Project Series B1 144A | | 4.00 | 10-1-2023 | 1,810,000 | 1,810,253 |
| | | | | | 12,844,663 |
The accompanying notes are an integral part of these financial statements.
10 | Wells Fargo Strategic Municipal Bond Fund
Portfolio of investments—December 31, 2020 (unaudited)
| | | Interest
rate | Maturity
date | Principal | Value |
| Industrial development revenue: 0.65% | | | | | |
| Chandler AZ IDA Intel Corporation Project | | 5.00% | 6-1-2049 | $11,645,000 | $ 13,393,730 |
| Phoenix AZ IDA Various Republic Services Incorporated Projects | | 0.30 | 12-1-2035 | 5,410,000 | 5,409,946 |
| | | | | | 18,803,676 |
| Miscellaneous revenue: 0.60% | | | | | |
| Arizona IDA Revenue Lincoln South Beltway Project | | 5.00 | 2-1-2027 | 1,255,000 | 1,579,054 |
| Arizona IDA Revenue Lincoln South Beltway Project | | 5.00 | 5-1-2027 | 1,125,000 | 1,423,406 |
| Arizona IDA Revenue Lincoln South Beltway Project | | 5.00 | 8-1-2027 | 1,205,000 | 1,534,519 |
| Arizona IDA Revenue Lincoln South Beltway Project | | 5.00 | 11-1-2027 | 1,000,000 | 1,281,480 |
| Navajo Nation AZ Series A 144A | | 4.00 | 12-1-2022 | 6,345,000 | 6,533,637 |
| Navajo Nation AZ Series A 144A | | 5.00 | 12-1-2025 | 4,110,000 | 4,545,167 |
| Navajo Nation AZ Tribal Utility Authority (Municipal Government Guaranty Insured) | | 4.00 | 1-1-2021 | 406,000 | 406,000 |
| | | | | | 17,303,263 |
| | | | | | 64,844,272 |
| Arkansas: 0.10% | | | | | |
| Tax revenue: 0.10% | | | | | |
| Fayetteville AR Sales and Use Tax Capital Improvement Refunding Bonds Series A | | 1.60 | 11-1-2035 | 2,750,000 | 2,748,680 |
| California: 4.97% | | | | | |
| Airport revenue: 0.30% | | | | | |
| Port Oakland CA Revenue Refunding Intermediate Lien Series H %% | | 5.00 | 5-1-2024 | 3,100,000 | 3,528,978 |
| San Francisco County CA AMT Series A | | 5.00 | 5-1-2027 | 4,775,000 | 5,055,245 |
| | | | | | 8,584,223 |
| Education revenue: 0.04% | | | | | |
| California Municipal Finance Authority Charter School Nova Academy Project Series 2016A 144A | | 4.00 | 6-15-2026 | 760,000 | 795,644 |
| California School Finance Authority Charter School Rocketship Education Obligated Group Series 2017A 144A | | 4.50 | 6-1-2027 | 250,000 | 276,195 |
| | | | | | 1,071,839 |
| GO revenue: 0.12% | | | | | |
| El Cerrito CA Tax and Revenue Anticipation Notes | | 3.00 | 7-1-2021 | 3,510,000 | 3,545,907 |
| Health revenue: 1.16% | | | | | |
| California Statewide CDA Health Facilities Catholic Series D (AGM Insured)€ | | 0.05 | 7-1-2041 | 8,700,000 | 8,700,000 |
| California Statewide CDA Health Facilities Catholic Series E (AGM Insured)€ | | 0.19 | 7-1-2040 | 8,525,000 | 8,525,000 |
| California Tender Option Bond Trust Receipts/Floater Certificates Series 2017-XG0119 (Deutsche Bank LIQ)144Aø | | 0.22 | 7-1-2044 | 14,900,000 | 14,900,000 |
| San Buenaventura CA Community Mental Health System | | 6.50 | 12-1-2021 | 1,250,000 | 1,302,738 |
| | | | | | 33,427,738 |
The accompanying notes are an integral part of these financial statements.
Wells Fargo Strategic Municipal Bond Fund | 11
Portfolio of investments—December 31, 2020 (unaudited)
| | | Interest
rate | Maturity
date | Principal | Value |
| Housing revenue: 0.06% | | | | | |
| California HFA Municipal Certificate of Participation Series 2 Class A | | 4.00% | 3-20-2033 | $ 1,477,320 | $ 1,664,910 |
| Industrial development revenue: 0.49% | | | | | |
| California Infrastructure and Economic Development Bank Revenue AMT Brightline West Passenger 144A | | 0.45 | 1-1-2050 | 14,000,000 | 14,013,020 |
| Miscellaneous revenue: 0.74% | | | | | |
| Compton CA PFA Lease 144A | | 4.00 | 9-1-2022 | 2,305,000 | 2,340,728 |
| Turlock CA PFA Water Revenue BAN | | 4.00 | 3-1-2027 | 18,500,000 | 18,940,670 |
| | | | | | 21,281,398 |
| Resource recovery revenue: 0.52% | | | | | |
| California PCFA Series A 144A | | 0.30 | 8-1-2023 | 15,000,000 | 14,999,850 |
| Tax revenue: 1.54% | | | | | |
| Mizuho Tender Option Bond Trust Receipts/Floater Certificates (Mizuho Capital Markets LLC LIQ)144Aø | | 0.16 | 7-11-2040 | 3,825,000 | 3,825,000 |
| Mizuho Tender Option Bond Trust Receipts/Floater Certificates Series 2019-MIZ9002 (Mizuho Capital Markets LLC LOC, Mizuho Capital Markets LLC LIQ)144Aø | | 0.29 | 3-1-2021 | 28,500,000 | 28,500,000 |
| Santa Clara Valley CA Transportation Series B (TD Bank NA SPA)ø | | 0.06 | 4-1-2036 | 10,000,000 | 10,000,000 |
| Transbay Joint Powers Authority Green Subordinated Bond Tax Allocation Bond Series B | | 2.40 | 10-1-2049 | 1,820,000 | 1,850,157 |
| | | | | | 44,175,157 |
| | | | | | 142,764,042 |
| Colorado: 1.44% | | | | | |
| Education revenue: 0.36% | | | | | |
| Colorado ECFA Eagle Ridge Academy Project 144A | | 3.63 | 11-1-2026 | 1,600,000 | 1,616,864 |
| Colorado ECFA Rocky Mountain Classical Academy Project | | 6.38 | 9-1-2023 | 920,000 | 1,011,402 |
| Colorado ECFA Vanguard School Project | | 4.00 | 6-15-2021 | 250,000 | 253,563 |
| Colorado ECFA Vanguard School Project | | 4.00 | 6-15-2022 | 515,000 | 538,618 |
| Colorado ECFA Windsor Charter Academy | | 3.88 | 9-1-2026 | 1,085,000 | 1,094,971 |
| Colorado School of Mines Institutional Enterprise Refunding Bonds Series 2018A (1 Month LIBOR+0.50%)± | | 0.60 | 2-1-2023 | 5,730,000 | 5,714,013 |
| | | | | | 10,229,431 |
| GO revenue: 0.13% | | | | | |
| Aviation Station North Metropolitan District #2 Colorado Improvement & Refunding Bonds Limited Tax Series A | | 4.00 | 12-1-2029 | 500,000 | 518,615 |
| Centennial CO Southglenn Metropolitan District | | 3.00 | 12-1-2021 | 259,000 | 259,508 |
| Grand River CO Hospital District (AGM Insured) | | 5.00 | 12-1-2025 | 1,000,000 | 1,188,040 |
| Mirabelle Metropolitan District #2 Colorado Senior Series A | | 5.00 | 12-1-2039 | 700,000 | 738,374 |
The accompanying notes are an integral part of these financial statements.
12 | Wells Fargo Strategic Municipal Bond Fund
Portfolio of investments—December 31, 2020 (unaudited)
| | | Interest
rate | Maturity
date | Principal | Value |
| GO revenue (continued) | | | | | |
| Sterling Ranch Community Authority Board CO Supported Revenue Refunding and Improvement Limited Tax District #2 | | 3.38% | 12-1-2030 | $ 500,000 | $ 515,500 |
| Thompson Crossing Metropolitan District #4 Colorado Improvement & Refunding Bonds Limited Tax | | 3.50 | 12-1-2029 | 515,000 | 528,199 |
| | | | | | 3,748,236 |
| Health revenue: 0.74% | | | | | |
| Colorado Health Facilities Authority Catholic Health Initiatives Series 2011A | | 5.00 | 2-1-2022 | 3,415,000 | 3,426,850 |
| Colorado Health Facilities Authority Catholic Health Initiatives Series 2011A | | 5.25 | 2-1-2031 | 5,150,000 | 5,168,798 |
| Colorado Health Facilities Authority Series B-2 | | 5.00 | 8-1-2049 | 3,000,000 | 3,625,500 |
| Colorado HFA Catholic Health Initiatives Series 2008-D2 (Morgan Stanley Bank LIQ)144Aø | | 0.17 | 10-1-2037 | 9,000,000 | 9,000,000 |
| | | | | | 21,221,148 |
| Miscellaneous revenue: 0.06% | | | | | |
| Colorado State Bridge Enterprise Senior Revenue Bonds AMT Central 70 Project Private Activity | | 4.00 | 12-31-2024 | 1,610,000 | 1,800,415 |
| Tax revenue: 0.12% | | | | | |
| Centerra CO Metropolitan District #1 Series 2017 144A | | 5.00 | 12-1-2021 | 1,440,000 | 1,471,090 |
| Centerra CO Metropolitan District #1 Series 2017 144A | | 5.00 | 12-1-2022 | 1,940,000 | 2,021,926 |
| | | | | | 3,493,016 |
| Transportation revenue: 0.03% | | | | | |
| Colorado E-470 Public Highway Authority CAB Series A | | 5.00 | 9-1-2040 | 800,000 | 912,096 |
| | | | | | 41,404,342 |
| Connecticut: 2.79% | | | | | |
| Education revenue: 0.22% | | | | | |
| Connecticut HEFAR Yale University Issue Series A-2 | | 2.00 | 7-1-2042 | 1,500,000 | 1,626,450 |
| Connecticut State HEFA University of Hartford Project Series N | | 5.00 | 7-1-2026 | 575,000 | 658,657 |
| Connecticut State HEFA University of Hartford Project Series N | | 5.00 | 7-1-2027 | 430,000 | 499,755 |
| Connecticut State HEFA University of Hartford Project Series N | | 5.00 | 7-1-2028 | 530,000 | 623,508 |
| Connecticut State Higher Education Supplemental Loan Authority AMT Chelsea Loan Program Series B | | 5.00 | 11-15-2025 | 480,000 | 574,771 |
| Connecticut State Higher Education Supplemental Loan Authority AMT Chelsea Loan Program Series B | | 5.00 | 11-15-2026 | 385,000 | 472,561 |
| Connecticut State Higher Education Supplemental Loan Authority AMT Chelsea Loan Program Series B | | 5.00 | 11-15-2026 | 940,000 | 1,133,565 |
| Connecticut State Higher Education Supplemental Loan Authority AMT Chelsea Loan Program Series B | | 5.00 | 11-15-2027 | 125,000 | 152,148 |
| Connecticut State Higher Education Supplemental Loan Authority AMT Chelsea Loan Program Series B | | 5.00 | 11-15-2027 | 500,000 | 608,350 |
| | | | | | 6,349,765 |
| GO revenue: 0.34% | | | | | |
| Bridgeport CT Series A | | 5.00 | 6-1-2026 | 1,220,000 | 1,437,111 |
| Bridgeport CT Series A | | 5.00 | 6-1-2027 | 1,425,000 | 1,712,522 |
The accompanying notes are an integral part of these financial statements.
Wells Fargo Strategic Municipal Bond Fund | 13
Portfolio of investments—December 31, 2020 (unaudited)
| | | Interest
rate | Maturity
date | Principal | Value |
| GO revenue (continued) | | | | | |
| Bridgeport CT Series A | | 5.00% | 6-1-2028 | $ 1,605,000 | $ 1,933,351 |
| Hartford CT Series A | | 5.00 | 4-1-2025 | 2,500,000 | 2,747,525 |
| Hartford CT Series A | | 5.00 | 4-1-2027 | 1,650,000 | 1,807,427 |
| | | | | | 9,637,936 |
| Health revenue: 0.36% | | | | | |
| Connecticut HEFA Revenue Hartford Healthcare Series B2 | | 5.00 | 7-1-2053 | 7,800,000 | 9,767,940 |
| Connecticut HEFA Revenue Temps 50 Mclean Series B2 144A | | 2.75 | 1-1-2026 | 650,000 | 656,162 |
| | | | | | 10,424,102 |
| Housing revenue: 0.34% | | | | | |
| Meriden CT MFHR Yale Acres Project | | 1.73 | 8-1-2022 | 9,635,000 | 9,768,637 |
| Miscellaneous revenue: 0.09% | | | | | |
| Connecticut Series A (SIFMA Municipal Swap+0.75%)± | | 0.84 | 3-1-2021 | 2,700,000 | 2,702,079 |
| Tax revenue: 1.44% | | | | | |
| Connecticut State Special Tax Obligation Revenue Transportation Infrastructure Purpose Series A | | 5.00 | 8-1-2029 | 16,280,000 | 19,327,290 |
| Connecticut State Special Tax Obligation Revenue Transportation Infrastructure Purpose Series B | | 5.00 | 10-1-2030 | 3,000,000 | 3,894,300 |
| Connecticut State Special Tax Obligation Revenue Transportation Infrastructure Purpose Series B | | 5.00 | 10-1-2031 | 9,000,000 | 11,625,570 |
| Connecticut State Special Tax Obligation Revenue Transportation Infrastructure Purpose Series B | | 5.00 | 10-1-2032 | 5,000,000 | 6,420,150 |
| | | | | | 41,267,310 |
| | | | | | 80,149,829 |
| Delaware: 0.06% | | | | | |
| Education revenue: 0.06% | | | | | |
| Delaware EDA Odyssey Charter School Project Series A 144A | | 6.25 | 9-1-2025 | 1,485,000 | 1,625,229 |
| District of Columbia: 0.79% | | | | | |
| Education revenue: 0.08% | | | | | |
| District of Columbia Revenue Two Rivers Public Charter School Incorporate | | 3.00 | 6-1-2030 | 1,100,000 | 1,145,111 |
| District of Columbia Revenue Two Rivers Public Charter School Incorporate | | 4.00 | 6-1-2030 | 1,000,000 | 1,113,840 |
| | | | | | 2,258,951 |
| Housing revenue: 0.57% | | | | | |
| District of Columbia HFA MFHR 1550 First Street Project | | 1.46 | 6-1-2039 | 16,100,000 | 16,307,851 |
| Water & sewer revenue: 0.14% | | | | | |
| District of Columbia Water and Sewer Authority Public Utility Subordinated Lien Bond Series C | | 1.75 | 10-1-2054 | 4,000,000 | 4,187,600 |
| | | | | | 22,754,402 |
The accompanying notes are an integral part of these financial statements.
14 | Wells Fargo Strategic Municipal Bond Fund
Portfolio of investments—December 31, 2020 (unaudited)
| | | Interest
rate | Maturity
date | Principal | Value |
| Florida: 2.34% | | | | | |
| Airport revenue: 0.65% | | | | | |
| Broward County FL Port Facilities Revenue Refunding Series C | | 5.00% | 9-1-2027 | $ 2,330,000 | $ 2,904,252 |
| Miami-Dade County FL Aviation Refunding AMT | | 5.00 | 10-1-2029 | 11,000,000 | 12,598,630 |
| Miami-Dade County FL Seaport AMT Series B | | 6.00 | 10-1-2032 | 1,385,000 | 1,547,848 |
| Miami-Dade County FL Seaport AMT Series B | | 6.00 | 10-1-2033 | 1,500,000 | 1,676,370 |
| | | | | | 18,727,100 |
| Education revenue: 0.30% | | | | | |
| Capital Trust Agency Educational Facilities Renaissance Charter School Incorporated Projects Series 2017A 144A | | 4.38 | 6-15-2027 | 1,180,000 | 1,238,198 |
| Capital Trust Agency Educational Facilities Renaissance Charter School Incorporated Projects Series A 144A | | 4.00 | 6-15-2029 | 2,410,000 | 2,530,187 |
| Capital Trust Agency FL Educational Facilities Revenue Imagine School at Land O' Lakes 144A | | 3.00 | 12-15-2029 | 420,000 | 421,634 |
| Florida Development Finance Corporation Educational Facilities Revenue Renaissance Charter School Incorporated 144A | | 4.00 | 9-15-2030 | 470,000 | 499,469 |
| Florida State HEFAR Educational Facilities Florida Institute of Technology | | 5.00 | 10-1-2027 | 650,000 | 750,178 |
| Florida State HEFAR Educational Facilities Florida Institute of Technology | | 5.00 | 10-1-2028 | 1,050,000 | 1,223,985 |
| Florida State HEFAR Educational Facilities Florida Institute of Technology | | 5.00 | 10-1-2029 | 1,000,000 | 1,175,380 |
| Miami-Dade County FL IDA Youth Charter Schools Project Series 2015A 144A | | 5.00 | 9-15-2025 | 700,000 | 739,158 |
| | | | | | 8,578,189 |
| Health revenue: 0.30% | | | | | |
| Lakeland FL Hospital System Lakeland Regional Health System | | 5.00 | 11-15-2022 | 4,495,000 | 4,662,214 |
| Palm Beach County FL HFA Revenue Toby and Leon Cooperman Sinai | | 2.63 | 6-1-2025 | 4,000,000 | 4,072,640 |
| | | | | | 8,734,854 |
| Housing revenue: 0.14% | | | | | |
| University of West Florida Foundation Incorporated Dormitory Series A | | 5.00 | 6-1-2021 | 1,265,000 | 1,288,023 |
| University of West Florida Foundation Incorporated Dormitory Series A | | 5.00 | 6-1-2022 | 1,325,000 | 1,408,011 |
| University of West Florida Foundation Incorporated Dormitory Series A | | 5.00 | 6-1-2023 | 1,190,000 | 1,316,461 |
| | | | | | 4,012,495 |
| Industrial development revenue: 0.11% | | | | | |
| Escambia County FL Environmental Improvement Refunding Bonds International Paper Company Project Series B | | 2.00 | 11-1-2033 | 825,000 | 871,728 |
| Florida Development Finance Corporation 144A | | 5.00 | 5-1-2029 | 2,000,000 | 2,172,180 |
| | | | | | 3,043,908 |
The accompanying notes are an integral part of these financial statements.
Wells Fargo Strategic Municipal Bond Fund | 15
Portfolio of investments—December 31, 2020 (unaudited)
| | | Interest
rate | Maturity
date | Principal | Value |
| Miscellaneous revenue: 0.14% | | | | | |
| Florida Village Community Development District #10 Special Assessment Bonds | | 5.13% | 5-1-2024 | $ 1,770,000 | $ 1,885,776 |
| Florida Village Community Development District #12 Special Assessment Bonds Series 2016 | | 2.88 | 5-1-2021 | 325,000 | 326,498 |
| Florida Village Community Development District #13 Special Assessment Bonds | | 2.63 | 5-1-2024 | 500,000 | 509,330 |
| Pinellas County FL IDA 2017 Foundation for Global Understanding Incorporated Project | | 5.00 | 7-1-2029 | 1,000,000 | 1,138,480 |
| | | | | | 3,860,084 |
| Resource recovery revenue: 0.13% | | | | | |
| Florida Development Finance Corporation Solid Waste AMT Pro USA Incorporated 144A | | 5.00 | 8-1-2029 | 3,500,000 | 3,655,575 |
| Transportation revenue: 0.06% | | | | | |
| Osceola County FL Transportation Revenue Improvement & Refunding Bonds Osceola Parkway Series 2019A-1 | | 5.00 | 10-1-2027 | 950,000 | 1,178,162 |
| Osceola County FL Transportation Revenue Improvement & Refunding Bonds Osceola Parkway Series 2019A-1 | | 5.00 | 10-1-2029 | 450,000 | 577,571 |
| | | | | | 1,755,733 |
| Water & sewer revenue: 0.51% | | | | | |
| Tohopekaliga FL Water Authority Utility System Bond 144A | | 5.00 | 10-1-2025 | 12,000,000 | 14,687,760 |
| | | | | | 67,055,698 |
| Georgia: 4.27% | | | | | |
| Health revenue: 0.37% | | | | | |
| Georgia Tender Option Bond Trust Receipts/Floater Certificates Series 2015-XF1016 (Barclays Bank plc LIQ)144Aø | | 0.14 | 8-15-2049 | 10,520,000 | 10,520,000 |
| Housing revenue: 0.03% | | | | | |
| Northwest Georgia Housing Authority MFHR Charles Hight Apartments Project (FHA Insured) | | 1.54 | 8-1-2022 | 1,000,000 | 1,006,620 |
| Transportation revenue: 0.08% | | | | | |
| Georgia Road & Tollway Authority I-75 S Express Lanes Project Series A 144A¤ | | 0.00 | 6-1-2024 | 2,500,000 | 2,269,075 |
| Utilities revenue: 3.79% | | | | | |
| Appling County GA Development Authority Oglethorpe Power Corporation Hatch Project | | 1.50 | 1-1-2038 | 2,500,000 | 2,552,675 |
| Bartow County GA Development Authority Georgia Power Company Plant Bowen Project | | 1.55 | 8-1-2043 | 6,500,000 | 6,603,740 |
| Bartow County GA Development Authority Pollution Control Georgia Power Company Plant Bowen Project | | 2.75 | 12-1-2032 | 4,500,000 | 4,693,275 |
| Burke County GA Development Authority Georgia Power Company Plant Vogtle Project | | 2.25 | 10-1-2032 | 1,500,000 | 1,552,215 |
| Burke County GA Development Authority Oglethorpe Power Corporation Vogtle Project Series E | | 3.25 | 11-1-2045 | 3,000,000 | 3,272,610 |
| Burke County GA Development Authority Oglethorpe Power Corporation Vogtle Project Series F | | 3.00 | 11-1-2045 | 14,955,000 | 15,607,935 |
The accompanying notes are an integral part of these financial statements.
16 | Wells Fargo Strategic Municipal Bond Fund
Portfolio of investments—December 31, 2020 (unaudited)
| | | Interest
rate | Maturity
date | Principal | Value |
| Utilities revenue (continued) | | | | | |
| Burke County GA Development Authority Pollution Control Revenue Bonds Georgia Power Company Plant Vogtle Project | | 1.70% | 12-1-2049 | $ 3,500,000 | $ 3,609,130 |
| Dalton GA Utilities Revenue Comb | | 5.00 | 3-1-2023 | 625,000 | 684,781 |
| Dalton GA Utilities Revenue Comb | | 5.00 | 3-1-2024 | 350,000 | 398,398 |
| Dalton GA Utilities Revenue Comb | | 5.00 | 3-1-2025 | 400,000 | 471,888 |
| Dalton GA Utilities Revenue Comb | | 5.00 | 3-1-2026 | 600,000 | 728,832 |
| Dalton GA Utilities Revenue Comb | | 5.00 | 3-1-2027 | 700,000 | 872,053 |
| Dalton GA Utilities Revenue Comb | | 5.00 | 3-1-2028 | 850,000 | 1,083,725 |
| Dalton GA Utilities Revenue Comb | | 5.00 | 3-1-2029 | 1,000,000 | 1,297,230 |
| Dalton GA Utilities Revenue Comb | | 5.00 | 3-1-2030 | 1,100,000 | 1,452,055 |
| Dalton GA Utilities Revenue Comb | | 5.00 | 3-1-2031 | 1,000,000 | 1,307,810 |
| Dalton GA Utilities Revenue Comb | | 5.00 | 3-1-2032 | 1,000,000 | 1,302,000 |
| Main Street Natural Gas Incorporated Georgia Gas Project Series B | | 4.00 | 8-1-2049 | 10,000,000 | 11,336,700 |
| Main Street Natural Gas Incorporated Georgia Gas Project Series C (Royal Bank of Canada LIQ) | | 4.00 | 8-1-2048 | 14,485,000 | 15,886,134 |
| Main Street Natural Gas Incorporated Georgia Gas Project Series C | | 4.00 | 3-1-2050 | 10,500,000 | 12,330,990 |
| Main Street Natural Gas Incorporated Georgia Gas Project Subordinate Bond Series A (Royal Bank of Canada LIQ) | | 4.00 | 4-1-2048 | 2,640,000 | 2,875,462 |
| Main Street Natural Gas Incorporated Georgia Gas Project Subordinate Bond Series B (1 Month LIBOR+0.75%)± | | 0.85 | 4-1-2048 | 4,700,000 | 4,707,943 |
| Municipal Electric Authority Georgia General Resolution Projects Subordinate Bonds Series A | | 5.00 | 1-1-2028 | 1,035,000 | 1,315,361 |
| Municipal Electric Authority Georgia General Resolution Projects Subordinated Bonds Series A | | 5.00 | 1-1-2027 | 1,010,000 | 1,258,288 |
| Municipal Electric Authority Georgia Plant Vogtle Units 3&4 Project M Series A | | 5.00 | 1-1-2027 | 300,000 | 373,749 |
| Municipal Electric Authority Georgia Plant Vogtle Units 3&4 Project M Series A | | 5.00 | 1-1-2028 | 400,000 | 508,352 |
| Municipal Electric Authority Georgia Plant Vogtle Units 3&4 Project M Series A | | 5.00 | 1-1-2029 | 400,000 | 512,468 |
| Municipal Electric Authority Georgia Plant Vogtle Units 3&4 Project P Series B | | 5.00 | 1-1-2028 | 1,000,000 | 1,267,780 |
| Municipal Electric Authority Georgia Plant Vogtle Units 3&4 Project P Series B | | 5.00 | 1-1-2029 | 910,000 | 1,162,106 |
| Municipal Electric Authority Georgia Project One Subordinated Bonds Series A | | 5.00 | 1-1-2027 | 1,150,000 | 1,432,705 |
| Municipal Electric Authority Georgia Project One Subordinated Bonds Series A | | 5.00 | 1-1-2028 | 1,270,000 | 1,614,018 |
| Municipal Electric Authority Georgia Project One Subordinated Bonds Series A | | 5.00 | 1-1-2029 | 1,140,000 | 1,479,013 |
| Municipal Electric Authority Georgia Project One Subordinated Bonds Series A | | 5.00 | 1-1-2030 | 1,025,000 | 1,319,667 |
| Municipal Electric Authority Georgia Project One Subordinated Bonds Series A | | 5.00 | 1-1-2031 | 1,385,000 | 1,775,764 |
| | | | | | 108,646,852 |
| | | | | | 122,442,547 |
The accompanying notes are an integral part of these financial statements.
Wells Fargo Strategic Municipal Bond Fund | 17
Portfolio of investments—December 31, 2020 (unaudited)
| | | Interest
rate | Maturity
date | Principal | Value |
| Guam: 0.07% | | | | | |
| Miscellaneous revenue: 0.07% | | | | | |
| Guam Government Department Education Certificates Participation Refunding John F Kennedy High School | | 3.63% | 2-1-2025 | $ 750,000 | $ 754,605 |
| Guam Government Department Education Certificates Participation Refunding John F Kennedy High School | | 4.25 | 2-1-2030 | 1,355,000 | 1,395,257 |
| | | | | | 2,149,862 |
| Hawaii: 0.34% | | | | | |
| Airport revenue: 0.03% | | | | | |
| Hawaii Airports System Revenue Refunding AMT | | 5.00 | 7-1-2024 | 1,000,000 | 1,023,490 |
| Health revenue: 0.31% | | | | | |
| Hawaii Department of Budget & Finance Queens Health System Series B (SIFMA Municipal Swap+0.45%)± | | 0.54 | 7-1-2039 | 8,815,000 | 8,815,000 |
| | | | | | 9,838,490 |
| Illinois: 18.19% | | | | | |
| Airport revenue: 1.93% | | | | | |
| Chicago IL Midway Airport Second Lien Refunding Bonds Series 2013A | | 5.50 | 1-1-2027 | 3,925,000 | 4,281,155 |
| Chicago IL Midway Airport Second Lien Refunding Bonds Series 2014A | | 5.00 | 1-1-2026 | 7,000,000 | 7,826,840 |
| Chicago IL Midway Airport Second Lien Refunding Bonds Series 2014A | | 5.00 | 1-1-2030 | 5,175,000 | 5,713,614 |
| Chicago IL O'Hare International Airport AMT Passenger Facility Charge Refunding Bonds Series B | | 5.00 | 1-1-2032 | 5,125,000 | 5,323,133 |
| Chicago IL O'Hare International Airport Customer Facility Charge | | 5.25 | 1-1-2023 | 1,350,000 | 1,441,962 |
| Chicago IL O'Hare International Airport Customer Facility Charge | | 5.25 | 1-1-2024 | 1,665,000 | 1,777,837 |
| Chicago IL O'Hare International Airport Passenger Facility Charge | | 4.00 | 1-1-2029 | 10,955,000 | 11,254,400 |
| Chicago IL O'Hare International Airport Senior Lien Bonds Series 2015 C | | 5.00 | 1-1-2022 | 695,000 | 725,385 |
| Chicago IL O'Hare International Airport Senior Lien Bonds Series 2015 D | | 5.00 | 1-1-2021 | 500,000 | 500,000 |
| Chicago IL O'Hare International Airport Senior Lien Refunding Bonds Series 2013A | | 5.00 | 1-1-2026 | 2,690,000 | 2,918,166 |
| Chicago IL O'Hare International Airport Senior Lien Refunding Bonds Series 2015A | | 5.00 | 1-1-2028 | 10,000,000 | 11,560,200 |
| Chicago IL O'Hare International Airport Senior Lien Refunding Bonds Series 2017D | | 5.00 | 1-1-2025 | 1,700,000 | 1,979,038 |
| | | | | | 55,301,730 |
| Education revenue: 0.26% | | | | | |
| Illinois Finance Authority Revenue Refunding Bradley University Project Series C | | 5.00 | 8-1-2028 | 1,860,000 | 2,192,084 |
| University of Illinois Board of Trustees Auxiliary Facilities System Refunding Bond | | 4.00 | 4-1-2030 | 5,000,000 | 5,298,150 |
| | | | | | 7,490,234 |
| GO revenue: 7.17% | | | | | |
| Bensenville IL Series B (AGM Insured) | | 5.00 | 12-30-2025 | 435,000 | 455,828 |
The accompanying notes are an integral part of these financial statements.
18 | Wells Fargo Strategic Municipal Bond Fund
Portfolio of investments—December 31, 2020 (unaudited)
| | | Interest
rate | Maturity
date | Principal | Value |
| GO revenue (continued) | | | | | |
| Berwyn IL Series A | | 5.00% | 12-1-2028 | $ 3,000,000 | $ 3,370,440 |
| Berwyn IL Series A | | 5.00 | 12-1-2029 | 2,345,000 | 2,626,353 |
| Chicago IL Board of Education Unlimited Tax General Obligation Refunding Bonds Series 2018A (AGM Insured) | | 5.00 | 12-1-2024 | 3,000,000 | 3,446,160 |
| Chicago IL CAB City Colleges (National Insured)¤ | | 0.00 | 1-1-2024 | 14,800,000 | 13,826,160 |
| Chicago IL CAB City Colleges (National Insured)¤ | | 0.00 | 1-1-2027 | 7,720,000 | 6,645,067 |
| Chicago IL Park District General Obligation Limited Series A | | 5.00 | 1-1-2022 | 400,000 | 414,012 |
| Chicago IL Park District General Obligation Limited Series A | | 5.00 | 1-1-2023 | 800,000 | 858,464 |
| Chicago IL Park District General Obligation Limited Series A | | 5.00 | 1-1-2024 | 550,000 | 609,637 |
| Chicago IL Park District General Obligation Limited Series A | | 5.00 | 1-1-2025 | 625,000 | 713,563 |
| Chicago IL Park District General Obligation Limited Series C | | 5.00 | 1-1-2022 | 1,000,000 | 1,035,030 |
| Chicago IL Park District General Obligation Limited Series C | | 5.00 | 1-1-2023 | 1,000,000 | 1,073,080 |
| Chicago IL Park District General Obligation Limited Series C | | 5.00 | 1-1-2024 | 410,000 | 454,456 |
| Chicago IL Park District Harbor Facilities Series D | | 5.00 | 1-1-2022 | 1,645,000 | 1,702,624 |
| Chicago IL Park District Harbor Facilities Series D | | 5.00 | 1-1-2023 | 1,175,000 | 1,260,869 |
| Chicago IL Park District Limited Tax Series B | | 5.00 | 1-1-2022 | 4,675,000 | 4,838,765 |
| Chicago IL Park District Unlimited Tax Series E | | 5.00 | 11-15-2022 | 1,235,000 | 1,319,684 |
| Chicago IL Park District Unlimited Tax Series E | | 5.00 | 11-15-2023 | 1,295,000 | 1,429,615 |
| Chicago IL Prerefunded Refunding Bond Series C | | 5.00 | 1-1-2022 | 1,490,000 | 1,560,015 |
| Chicago IL Prerefunded Refunding Bond Series C | | 5.00 | 1-1-2023 | 765,000 | 836,887 |
| Chicago IL Refunding Project Series B | | 5.13 | 1-1-2027 | 1,700,000 | 1,876,443 |
| Chicago IL Refunding Project Series B | | 5.50 | 1-1-2032 | 1,145,000 | 1,267,847 |
| Chicago IL Series A | | 5.00 | 1-1-2025 | 2,000,000 | 2,209,040 |
| Chicago IL Series A | | 5.00 | 1-1-2027 | 4,045,000 | 4,362,573 |
| Chicago IL Series A | | 5.00 | 1-1-2027 | 8,000,000 | 9,072,880 |
| Chicago IL Series A | | 5.00 | 1-1-2028 | 6,125,000 | 6,982,378 |
| Chicago IL Series C | | 5.00 | 1-1-2021 | 1,000,000 | 1,000,000 |
| Chicago IL Series C | | 5.00 | 1-1-2026 | 970,000 | 1,087,564 |
| Chicago IL Unrefunded Balance Refunding Bond Series C | | 5.00 | 1-1-2022 | 760,000 | 783,423 |
| Chicago IL Unrefunded Balance Refunding Bond Series C | | 5.00 | 1-1-2023 | 1,735,000 | 1,839,829 |
| Cook County IL Community Consolidated School District #15 Limited Tax | | 5.00 | 12-1-2026 | 2,540,000 | 3,092,323 |
| Cook County IL Refunding Bonds Series 2010 G | | 5.00 | 11-15-2026 | 1,000,000 | 1,002,830 |
| Cook County IL School District #123 Oak Lawn CAB (National Insured)¤ | | 0.00 | 12-1-2021 | 1,090,000 | 1,082,348 |
| Cook County IL School District #153 Homewood Series A (AGM Insured)¤ | | 0.00 | 12-15-2023 | 1,225,000 | 1,190,271 |
| Cook County IL School District #227 Rich Township Refunding Bonds Series 2015 | | 3.00 | 12-1-2024 | 965,000 | 1,043,397 |
| Cook County IL School District #99 Cicero Limited Tax (BAM Insured) | | 5.00 | 12-1-2026 | 3,030,000 | 3,721,355 |
| Cook County IL School District #99 Cicero Limited Tax (BAM Insured) | | 5.00 | 12-1-2027 | 2,950,000 | 3,697,147 |
| Cook County IL School District #99 Cicero Limited Tax (BAM Insured) | | 5.00 | 12-1-2028 | 2,285,000 | 2,923,566 |
| Cook County IL School District #99 Cicero Refunding Bonds Limited Tax Series B | | 5.00 | 12-1-2022 | 1,000,000 | 1,081,640 |
The accompanying notes are an integral part of these financial statements.
Wells Fargo Strategic Municipal Bond Fund | 19
Portfolio of investments—December 31, 2020 (unaudited)
| | | Interest
rate | Maturity
date | Principal | Value |
| GO revenue (continued) | | | | | |
| Cook County IL School District #99 Cicero Refunding Bonds Limited Tax Series B | | 5.00% | 12-1-2024 | $ 1,000,000 | $ 1,160,790 |
| Cook County IL School District #99 Cicero Refunding Bonds Limited Tax Series B | | 5.00 | 12-1-2025 | 1,000,000 | 1,197,040 |
| Cook County IL Series A | | 5.00 | 11-15-2021 | 2,250,000 | 2,329,335 |
| Cook County IL Series A (AGM Insured) | | 5.00 | 11-15-2026 | 3,000,000 | 3,668,910 |
| Cook County IL Series A | | 5.00 | 11-15-2030 | 2,200,000 | 2,618,660 |
| Cook County IL Series A | | 5.25 | 11-15-2022 | 1,000,000 | 1,041,200 |
| Cook County IL Series A | | 5.25 | 11-15-2022 | 10,040,000 | 10,071,425 |
| Decatur IL Macon County General Obligation Refunding Bonds Series 2013 | | 5.00 | 3-1-2024 | 1,405,000 | 1,533,979 |
| Decatur IL Macon County School District #061 Series 2011A (AGM Insured) | | 5.25 | 1-1-2026 | 715,000 | 715,000 |
| Decatur IL Macon County School District #061 Series 2011A (AGM Insured) | | 5.25 | 1-1-2027 | 1,495,000 | 1,495,000 |
| DeKalb & Kane Counties IL Community (AGM Insured)¤ | | 0.00 | 1-1-2024 | 2,345,000 | 2,317,845 |
| DeKalb & Kane Counties IL Community (AGM Insured)¤ | | 0.00 | 1-1-2024 | 2,830,000 | 2,746,855 |
| DeKalb & Kane Counties IL Community Unit School District #427 Sycamore Prerefunded Bond Balance CAB (AGM Insured)¤ | | 0.00 | 1-1-2024 | 455,000 | 449,062 |
| DuPage & Cook Counties IL Township High School District #86 Hinsdale | | 4.00 | 1-15-2034 | 2,815,000 | 3,337,070 |
| Illinois | | 5.00 | 11-1-2025 | 5,000,000 | 5,692,850 |
| Illinois Land Refunding Bond Series A | | 5.00 | 10-1-2026 | 3,000,000 | 3,463,620 |
| Illinois Series 2012 | | 5.00 | 3-1-2028 | 6,465,000 | 6,672,979 |
| Illinois Series A | | 5.00 | 4-1-2023 | 3,500,000 | 3,767,050 |
| Kane, Cook & DuPage Counties IL School District #46 Elgin Series 2015A | | 5.00 | 1-1-2028 | 1,555,000 | 1,759,343 |
| Kane, Cook & DuPage Counties IL School District #46 Elgin Series 2015D | | 5.00 | 1-1-2032 | 1,025,000 | 1,156,108 |
| Kane, Cook & DuPage Counties IL School District #46 Elgin Unrefunded Bond Balance Series 2012B | | 4.50 | 1-1-2025 | 4,295,000 | 4,467,315 |
| Kane, Cook & DuPage Counties IL School District #46 Prerefunded CAB Series B (Ambac Insured)¤ | | 0.00 | 1-1-2021 | 510,000 | 510,000 |
| Kane, Cook & DuPage Counties IL School District #46 Unrefunded CAB Series B (Ambac Insured)¤ | | 0.00 | 1-1-2021 | 595,000 | 595,000 |
| Madison-Macoupin Etc Counties IL Community College District #536 Series A (BAM Insured) | | 5.00 | 11-1-2025 | 1,620,000 | 1,885,032 |
| Madison-Macoupin Etc Counties IL Community College District #536 Series A (BAM Insured) | | 5.00 | 11-1-2026 | 1,410,000 | 1,639,520 |
| Peoria County IL School District #150 Peoria Series A (AGM Insured) | | 4.00 | 12-1-2027 | 1,000,000 | 1,179,080 |
| Peoria County IL School District #150 Peoria Series A (AGM Insured) | | 4.00 | 12-1-2028 | 950,000 | 1,115,243 |
| Peoria County IL School District #150 Peoria Series A (AGM Insured) | | 4.00 | 12-1-2029 | 2,500,000 | 2,915,750 |
| Rockford IL Waterworks System Series B (BAM Insured) | | 5.00 | 12-15-2021 | 1,015,000 | 1,058,178 |
| Rockford IL Waterworks System Series B (BAM Insured) | | 5.00 | 12-15-2022 | 1,065,000 | 1,151,776 |
| Waukegan IL Series 2015A (AGM Insured) | | 5.00 | 12-30-2031 | 1,000,000 | 1,163,170 |
| Will County IL | | 4.00 | 11-15-2035 | 2,490,000 | 2,831,454 |
| Will County IL Lincoln-Way Community High School District #210 Refunded Bond (AGM Insured) | | 4.00 | 1-1-2022 | 600,000 | 614,070 |
The accompanying notes are an integral part of these financial statements.
20 | Wells Fargo Strategic Municipal Bond Fund
Portfolio of investments—December 31, 2020 (unaudited)
| | | Interest
rate | Maturity
date | Principal | Value |
| GO revenue (continued) | | | | | |
| Will County IL Lincoln-Way Community High School District #210 Unrefunded Bond CAB (AGM Insured)¤ | | 0.00% | 1-1-2026 | $ 8,695,000 | $ 8,135,303 |
| Will County IL Lincoln-Way Community High School District #210 Unrefunded CAB (AGM Insured)¤ | | 0.00 | 1-1-2021 | 2,185,000 | 2,185,000 |
| Will County IL Lincoln-Way Community High School District #210 Unrefunded CAB (AGM Insured)¤ | | 0.00 | 1-1-2025 | 14,385,000 | 13,676,683 |
| Will County IL School District #114 Manhattan CAB Series C (National Insured)¤ | | 0.00 | 12-1-2021 | 1,055,000 | 1,044,851 |
| Winnebago & Boone Counties IL School District #205 Series A ¤ | | 0.00 | 2-1-2021 | 1,305,000 | 1,304,204 |
| Winnebago & Boone Counties IL School District #205 Series B ¤ | | 0.00 | 2-1-2021 | 3,400,000 | 3,397,926 |
| | | | | | 205,857,239 |
| Health revenue: 0.35% | | | | | |
| Illinois Finance Authority Ascension Health Alliance Senior Credit Group Bonds Series A | | 5.00 | 11-15-2027 | 1,000,000 | 1,041,450 |
| Illinois Finance Authority Friendship Village of Schaumburg Series 2017 | | 5.00 | 2-15-2021 | 2,555,000 | 2,556,124 |
| Illinois Finance Authority Revenue Advocate Health Care Network | | 4.00 | 11-1-2030 | 3,000,000 | 3,451,200 |
| Illinois Finance Authority Revenue Bonds Lutheran Life Communities | | 4.00 | 11-1-2022 | 390,000 | 398,038 |
| Illinois Finance Authority Revenue Bonds Lutheran Life Communities | | 4.00 | 11-1-2024 | 420,000 | 435,662 |
| Illinois Finance Authority Revenue Bonds Series 2014 | | 5.00 | 8-1-2038 | 1,520,000 | 1,776,014 |
| Illinois Finance Authority Rosalind Franklin University of Medicine & Science Series A | | 3.25 | 2-15-2022 | 260,000 | 257,670 |
| | | | | | 9,916,158 |
| Housing revenue: 0.04% | | | | | |
| Illinois Housing Development Authority Homeowner Mortgage 2016 Series C | | 2.90 | 8-1-2031 | 1,000,000 | 1,069,030 |
| Miscellaneous revenue: 1.62% | | | | | |
| Brookfield IL Revenue Adjusted Brookfield Zoo Project (Northern Trust Company LOC)ø | | 0.10 | 6-1-2038 | 1,430,000 | 1,430,000 |
| Chicago IL Board of Education Refunding Bonds Series B | | 5.00 | 12-1-2026 | 2,000,000 | 2,287,340 |
| Chicago IL Board of Education Refunding Bonds Series B | | 5.00 | 12-1-2027 | 1,625,000 | 1,880,288 |
| Chicago IL Transit Authority Capital Grant Receipts Refunding Bond Series 2011 (AGM Insured) | | 5.25 | 6-1-2024 | 4,450,000 | 4,537,710 |
| Illinois | | 5.50 | 7-1-2033 | 4,000,000 | 4,274,120 |
| Illinois Refunding Bonds Series 2016 | | 5.00 | 2-1-2026 | 2,000,000 | 2,284,980 |
| Illinois Series 2012 | | 5.00 | 8-1-2021 | 5,620,000 | 5,747,574 |
| Illinois Series 2013 (AGM Insured) | | 5.00 | 7-1-2023 | 4,875,000 | 5,296,541 |
| Illinois Series 2017D | | 5.00 | 11-1-2022 | 1,805,000 | 1,905,701 |
| Illinois Series A | | 5.00 | 11-1-2023 | 8,955,000 | 9,777,069 |
| Illinois Series A | | 5.00 | 12-1-2035 | 650,000 | 737,770 |
| Illinois Series D | | 5.00 | 11-1-2021 | 6,080,000 | 6,252,125 |
| | | | | | 46,411,218 |
| Tax revenue: 5.23% | | | | | |
| Chicago IL Motor Fuel Tax Refunding Bond Series 2013 | | 5.00 | 1-1-2021 | 1,450,000 | 1,450,000 |
| Chicago IL Motor Fuel Tax Refunding Bond Series 2013 | | 5.00 | 1-1-2022 | 1,810,000 | 1,846,960 |
| Chicago IL Motor Fuel Tax Refunding Bonds Series 2013 | | 5.00 | 1-1-2023 | 2,400,000 | 2,495,064 |
The accompanying notes are an integral part of these financial statements.
Wells Fargo Strategic Municipal Bond Fund | 21
Portfolio of investments—December 31, 2020 (unaudited)
| | | Interest
rate | Maturity
date | Principal | Value |
| Tax revenue (continued) | | | | | |
| Chicago IL Motor Fuel Tax Refunding Bonds Series 2013 | | 5.00% | 1-1-2024 | $ 2,475,000 | $ 2,615,877 |
| Chicago IL Motor Fuel Tax Refunding Bonds Series 2013 | | 5.00 | 1-1-2025 | 1,000,000 | 1,056,150 |
| Chicago IL Tax Increment Bond Pilson Redevelopment Project Series A | | 5.00 | 6-1-2022 | 1,635,000 | 1,720,134 |
| Chicago IL Transit Authority Sales Tax Receipts Series 2011 | | 5.25 | 12-1-2036 | 17,415,000 | 18,220,095 |
| Cook County IL Sales Tax Revenue | | 5.00 | 11-15-2029 | 1,000,000 | 1,260,760 |
| Illinois Junior Obligation | | 5.00 | 6-15-2025 | 9,025,000 | 9,810,356 |
| Illinois Regional Transportation Authority Series A (AGM Insured) | | 5.25 | 6-1-2024 | 9,995,000 | 11,572,511 |
| Illinois Regional Transportation Authority Series B-RMKT øø | | 0.80 | 6-1-2025 | 8,580,000 | 8,580,000 |
| Illinois Sales Tax First Series (National Insured) | | 6.00 | 6-15-2024 | 515,000 | 592,806 |
| Illinois Sales Tax First Series (National Insured) | | 6.00 | 6-15-2025 | 8,365,000 | 9,916,457 |
| Illinois Sports Facilities Authority Refunding Bonds Insured State Tax Supported (BAM Insured) | | 5.00 | 6-15-2028 | 1,500,000 | 1,871,280 |
| Illinois Sports Facilities Authority Refunding Bonds Insured State Tax Supported (BAM Insured) | | 5.00 | 6-15-2028 | 1,515,000 | 1,889,993 |
| Illinois Sports Facilities Authority Refunding Bonds Insured State Tax Supported (BAM Insured) | | 5.00 | 6-15-2030 | 2,000,000 | 2,524,060 |
| Illinois Sports Facilities Authority Refunding Bonds Insured State Tax Supported (BAM Insured) | | 5.00 | 6-15-2030 | 3,250,000 | 4,101,598 |
| Illinois Sports Facilities Authority Refunding Bonds Insured State Tax Supported CAB (Ambac Insured)¤ | | 0.00 | 6-15-2022 | 3,795,000 | 3,689,423 |
| Illinois Sports Facilities Authority Refunding Bonds Insured State Tax Supported CAB (Ambac Insured)¤ | | 0.00 | 6-15-2026 | 1,740,000 | 1,529,773 |
| Illinois Sports Facilities Authority Refunding Bonds Insured State Tax Supported Series 2014 | | 5.00 | 6-15-2022 | 3,395,000 | 3,528,899 |
| Illinois Sports Facilities Authority Refunding Bonds Insured State Tax Supported Series 2014 | | 5.00 | 6-15-2023 | 3,220,000 | 3,431,168 |
| Illinois Sports Facilities Authority Refunding Bonds Insured State Tax Supported Series 2014 | | 5.00 | 6-15-2024 | 4,135,000 | 4,501,981 |
| Illinois Sports Facilities Authority State Tax Supported Refunding Bond | | 5.00 | 6-15-2028 | 1,000,000 | 1,152,220 |
| Metropolitan Pier & Exposition Authority CAB McCormick Place Expansion Project Series A (National Insured)¤ | | 0.00 | 12-15-2029 | 1,750,000 | 1,449,298 |
| Metropolitan Pier & Exposition Authority CAB McCormick Place Project Series A (National Insured)¤ | | 0.00 | 12-15-2022 | 1,390,000 | 1,358,405 |
| Metropolitan Pier & Exposition Authority McCormick Place Expansion Project Series B | | 5.00 | 12-15-2028 | 19,090,000 | 19,892,162 |
| Metropolitan Pier & Exposition Authority Prerefunded Bond (National Insured)¤ | | 0.00 | 12-15-2023 | 20,000 | 19,697 |
| Metropolitan Pier & Exposition Authority Prerefunded Bond (National Insured) | | 5.70 | 6-15-2025 | 220,000 | 239,131 |
| Metropolitan Pier & Exposition Authority Unrefunded Bond (National Insured)¤ | | 0.00 | 12-15-2023 | 1,105,000 | 1,063,353 |
| Metropolitan Pier & Exposition Authority Unrefunded Bond (National Insured) | | 5.70 | 6-15-2025 | 780,000 | 829,054 |
| Sales Tax Securitization Corporation Second Lien Sales Tax | | 5.00 | 1-1-2028 | 5,000,000 | 6,201,800 |
| Sales Tax Securitization Corporation Series 2017A | | 5.00 | 1-1-2026 | 4,815,000 | 5,722,098 |
| Sales Tax Securitization Corporation Series 2017A | | 5.00 | 1-1-2028 | 5,265,000 | 6,530,495 |
| Sales Tax Securitization Corporation Series A | | 5.00 | 1-1-2027 | 1,000,000 | 1,216,420 |
| St. Charles, Kane & DuPage Counties IL Series 2016 | | 4.00 | 1-1-2021 | 790,000 | 790,000 |
| St. Charles, Kane & DuPage Counties IL Series 2016 | | 4.00 | 1-1-2022 | 820,000 | 826,093 |
| St. Charles, Kane & DuPage Counties IL Series 2016 | | 4.00 | 1-1-2023 | 855,000 | 865,277 |
| St. Charles, Kane & DuPage Counties IL Series 2016 | | 4.00 | 1-1-2024 | 885,000 | 897,815 |
The accompanying notes are an integral part of these financial statements.
22 | Wells Fargo Strategic Municipal Bond Fund
Portfolio of investments—December 31, 2020 (unaudited)
| | | Interest
rate | Maturity
date | Principal | Value |
| Tax revenue (continued) | | | | | |
| St. Charles, Kane & DuPage Counties IL Series 2016 | | 4.00% | 1-1-2025 | $ 925,000 | $ 937,941 |
| Tender Option Bond Trust Receipts/Certificates Series 2018-YX1099 (Barclays Bank plc LIQ)144Aø | | 0.24 | 1-1-2035 | 1,820,000 | 1,820,000 |
| | | | | | 150,016,604 |
| Tobacco revenue: 0.69% | | | | | |
| Railsplitter Tobacco Settlement Authority | | 5.00 | 6-1-2023 | 18,000,000 | 19,917,540 |
| Transportation revenue: 0.55% | | | | | |
| Illinois State Toll Highway Authority Senior Revenue Refunding Bonds Series B | | 5.00 | 1-1-2029 | 11,990,000 | 15,867,446 |
| Water & sewer revenue: 0.35% | | | | | |
| Chicago IL Wastewater Transmission Series B (AGM Insured) | | 5.00 | 1-1-2031 | 3,140,000 | 3,816,544 |
| Chicago IL Waterworks Second Lien | | 5.00 | 11-1-2028 | 2,560,000 | 3,080,755 |
| Chicago IL Waterworks Second Lien Series 2017-2 (AGM Insured) | | 5.00 | 11-1-2030 | 2,620,000 | 3,232,739 |
| | | | | | 10,130,038 |
| | | | | | 521,977,237 |
| Indiana: 0.65% | | | | | |
| Education revenue: 0.01% | | | | | |
| Indiana Finance Authority Environmental Facilities Revenue Refunding Indianapolisland Power and Light | | 4.00 | 7-1-2030 | 210,000 | 228,398 |
| Health revenue: 0.01% | | | | | |
| Indiana HFFA Ancilla System Incorporated (National Insured) | | 5.25 | 7-1-2022 | 150,000 | 150,473 |
| Housing revenue: 0.25% | | | | | |
| Hobart Industry MFHR A Safe Haven Veterans Apartments øø | | 0.75 | 9-1-2022 | 7,100,000 | 7,119,525 |
| Miscellaneous revenue: 0.20% | | | | | |
| Indiana Bond Bank Revenue CAB Hamilton Company Projects Series B ¤ | | 0.00 | 7-15-2026 | 735,000 | 704,108 |
| Indiana Bond Bank Revenue CAB Hamilton Company Projects Series B ¤ | | 0.00 | 7-15-2027 | 630,000 | 592,232 |
| Indianapolis IN Industry Local Public Improvement Bond Bank Notes Series C Fieldhouse Project | | 1.40 | 6-1-2021 | 2,500,000 | 2,500,050 |
| Michigan IN City School Building Corporation Series 2016A | | 5.00 | 1-15-2025 | 1,000,000 | 1,155,980 |
| Westfield-Washington IN Multi-School Building Corporation First Mortgage Series B 144A | | 1.50 | 1-15-2022 | 910,000 | 913,804 |
| | | | | | 5,866,174 |
The accompanying notes are an integral part of these financial statements.
Wells Fargo Strategic Municipal Bond Fund | 23
Portfolio of investments—December 31, 2020 (unaudited)
| | | Interest
rate | Maturity
date | Principal | Value |
| Utilities revenue: 0.18% | | | | | |
| Indiana Finance Authority Environmental Facilities Revenue Refunding Indianapolisland Power and Light | | 0.75% | 12-1-2038 | $ 3,000,000 | $ 3,014,400 |
| Indiana Finance Authority Midwestern Disaster Relief Revenue Various Ohio Valley Electric Corporation Project | | 3.00 | 11-1-2030 | 2,000,000 | 2,134,380 |
| | | | | | 5,148,780 |
| | | | | | 18,513,350 |
| Iowa: 0.83% | | | | | |
| Education revenue: 0.10% | | | | | |
| Iowa Student Loan Liquidity Corporation Senior Revenue Bonds AMT Series B | | 5.00 | 12-1-2025 | 1,295,000 | 1,549,480 |
| Iowa Student Loan Liquidity Corporation Senior Revenue Bonds AMT Series B | | 5.00 | 12-1-2026 | 1,215,000 | 1,481,316 |
| | | | | | 3,030,796 |
| GO revenue: 0.33% | | | | | |
| Coralville IA Taxable-Annual Appropriation Series 2018E | | 7.00 | 6-1-2025 | 8,485,000 | 8,999,361 |
| Coralville IA Taxable-Annual Appropriation Series B | | 4.40 | 5-1-2023 | 410,000 | 415,400 |
| | | | | | 9,414,761 |
| Health revenue: 0.05% | | | | | |
| Iowa Finance Authority Revenue Bonds Lifespace Commnunities Incorporated Series A2 | | 2.88 | 5-15-2049 | 1,500,000 | 1,514,505 |
| Utilities revenue: 0.28% | | | | | |
| Iowa Gas Project Public Expenditure and Financial Accountability Incorporated | | 5.00 | 9-1-2049 | 6,500,000 | 7,964,710 |
| Water & sewer revenue: 0.07% | | | | | |
| Xenia Dallas County IA Rural Water District Capital Loan Notes | | 5.00 | 12-1-2031 | 1,615,000 | 1,923,853 |
| | | | | | 23,848,625 |
| Kansas: 0.66% | | | | | |
| Health revenue: 0.09% | | | | | |
| Wichita KS Health Care Facilities Presbyterian Manors Obligated Group | | 5.00 | 5-15-2026 | 1,105,000 | 1,178,096 |
| Wichita KS Health Care Facilities Presbyterian Manors Obligated Group | | 5.00 | 5-15-2028 | 1,220,000 | 1,314,806 |
| | | | | | 2,492,902 |
| Housing revenue: 0.17% | | | | | |
| Kansas Development Finance Authority MFHR Woodland Village Apartments Project Series J | | 1.68 | 7-1-2022 | 5,000,000 | 5,032,950 |
The accompanying notes are an integral part of these financial statements.
24 | Wells Fargo Strategic Municipal Bond Fund
Portfolio of investments—December 31, 2020 (unaudited)
| | | Interest
rate | Maturity
date | Principal | Value |
| Tax revenue: 0.40% | | | | | |
| Wyandotte County & Kansas City KS Special Obligation Improvement & Refunding Bonds Plaza Redevelopment Project | | 4.00% | 12-1-2028 | $ 605,000 | $ 603,360 |
| Wyandotte County & Kansas City KS Special Obligation Vacation Village Project Area 4 Major Multi-Sport Athletic Complex Project CAB Series 2015 144A¤ | | 0.00 | 9-1-2034 | 24,725,000 | 10,950,950 |
| | | | | | 11,554,310 |
| | | | | | 19,080,162 |
| Kentucky: 2.15% | | | | | |
| Education revenue: 0.11% | | | | | |
| Columbia KY Educational Development Lindsey Wilson College Incorporated Project | | 3.00 | 12-1-2024 | 3,080,000 | 3,119,978 |
| Health revenue: 0.31% | | | | | |
| Kentucky Economic Development Finance Authority Health System Revenue Norton Healthcare Incorporate Series B (National Insured)¤ | | 0.00 | 10-1-2026 | 3,000,000 | 2,762,610 |
| Kentucky EDFA Healthcare Facilities Rosedale Green Project Series 2015 | | 5.00 | 11-15-2025 | 1,500,000 | 1,526,790 |
| Kentucky EDFA Norton Healthcare Incorporated Series B (National Insured)¤ | | 0.00 | 10-1-2022 | 1,000,000 | 983,650 |
| Louisville & Jefferson Counties KY Metro Health System Revenue Norton Healthcare Incorporated Series C | | 5.00 | 10-1-2047 | 3,000,000 | 3,709,380 |
| | | | | | 8,982,430 |
| Utilities revenue: 1.73% | | | | | |
| Kentucky Public Energy Authority Gas Supply Series A-1 | | 4.00 | 12-1-2049 | 3,755,000 | 4,278,034 |
| Kentucky Public Energy Authority Gas Supply Series B | | 4.00 | 1-1-2049 | 14,725,000 | 16,552,078 |
| Kentucky Public Energy Authority Gas Supply Series C | | 4.00 | 12-1-2049 | 4,605,000 | 5,246,016 |
| Kentucky Public Energy Authority Gas Supply Series C-1 | | 4.00 | 2-1-2050 | 17,150,000 | 20,426,679 |
| Trimble County KY Pollution Control Revenue Refunding Louisville Gas and Electric Company | | 1.30 | 9-1-2044 | 3,000,000 | 3,043,050 |
| | | | | | 49,545,857 |
| | | | | | 61,648,265 |
| Louisiana: 1.26% | | | | | |
| Airport revenue: 0.18% | | | | | |
| New Orleans LA Aviation Board General North Terminal Project Series A | | 5.00 | 1-1-2032 | 1,000,000 | 1,146,310 |
| New Orleans LA Aviation Board Gulf Opportunity Zone Controlled Foreign Corporation Revenue Refunding Bonds Consolidated Rental Car Project (AGM Insured) | | 5.00 | 1-1-2031 | 1,250,000 | 1,567,113 |
| New Orleans LA Aviation Board Gulf Opportunity Zone Controlled Foreign Corporation Revenue Refunding Bonds Consolidated Rental Car Project (AGM Insured) | | 5.00 | 1-1-2032 | 2,000,000 | 2,494,480 |
| | | | | | 5,207,903 |
| Education revenue: 0.22% | | | | | |
| Louisiana Public Facilities Authority Loyola University Project Series 2011 | | 5.25 | 10-1-2025 | 2,815,000 | 2,877,409 |
The accompanying notes are an integral part of these financial statements.
Wells Fargo Strategic Municipal Bond Fund | 25
Portfolio of investments—December 31, 2020 (unaudited)
| | | Interest
rate | Maturity
date | Principal | Value |
| Education revenue (continued) | | | | | |
| Louisiana Public Facilities Authority Loyola University Project Series 2017 ¤ | | 0.00% | 10-1-2021 | $ 1,950,000 | $ 1,920,419 |
| Louisiana Public Facilities Authority Loyola University Project Series 2017 ¤ | | 0.00 | 10-1-2022 | 1,500,000 | 1,430,430 |
| | | | | | 6,228,258 |
| Industrial development revenue: 0.56% | | | | | |
| St. John the Baptist Parish LA Revenue Refunding Marathon Oil Corporation Project | | 2.38 | 6-1-2037 | 8,330,000 | 8,667,948 |
| St. John the Baptist Parish LA Series A | | 2.20 | 6-1-2037 | 7,000,000 | 7,219,870 |
| | | | | | 15,887,818 |
| Miscellaneous revenue: 0.05% | | | | | |
| Louisiana Local Government Environmental Facilities and CDA Jefferson Parish Gomesa Project 144A | | 4.00 | 11-1-2044 | 1,440,000 | 1,478,765 |
| Water & sewer revenue: 0.25% | | | | | |
| Greater Ouachita Water Company Incorporate Louisiana Waterworks and Sewer System Refunding Bonds (BAM Insured) | | 3.00 | 9-1-2023 | 250,000 | 265,903 |
| Greater Ouachita Water Company Incorporate Louisiana Waterworks and Sewer System Refunding Bonds (BAM Insured) | | 5.00 | 9-1-2021 | 550,000 | 566,357 |
| Greater Ouachita Water Company Incorporate Louisiana Waterworks and Sewer System Refunding Bonds (BAM Insured) | | 5.00 | 9-1-2024 | 460,000 | 532,588 |
| Greater Ouachita Water Company Incorporate Louisiana Waterworks and Sewer System Refunding Bonds (BAM Insured) | | 5.00 | 9-1-2025 | 510,000 | 610,485 |
| New Orleans LA Sewage Service Revenue Series B | | 5.00 | 6-1-2026 | 350,000 | 426,899 |
| New Orleans LA Sewage Service Revenue Series B | | 5.00 | 6-1-2027 | 600,000 | 750,420 |
| New Orleans LA Sewage Service Revenue Series B | | 5.00 | 6-1-2028 | 400,000 | 511,224 |
| New Orleans LA Sewage Service Revenue Series B | | 5.00 | 6-1-2029 | 600,000 | 782,676 |
| New Orleans LA Sewage Service Revenue Series B | | 5.00 | 6-1-2030 | 600,000 | 797,892 |
| New Orleans LA Sewage Service Revenue Series B | | 5.00 | 6-1-2031 | 1,520,000 | 2,011,431 |
| | | | | | 7,255,875 |
| | | | | | 36,058,619 |
| Maine: 0.03% | | | | | |
| Health revenue: 0.03% | | | | | |
| Maine Health & HEFAR Series A | | 5.00 | 7-1-2027 | 750,000 | 951,248 |
| Maryland: 2.83% | | | | | |
| Education revenue: 0.09% | | | | | |
| Prince George's County MD Chesapeake Lighthouse Charter School Project Series 2015 144A | | 5.25 | 8-1-2022 | 1,100,000 | 1,124,915 |
| Prince George's County MD Chesapeake Lighthouse Charter School Project Series 2016 | | 5.00 | 8-1-2026 | 1,335,000 | 1,405,875 |
| | | | | | 2,530,790 |
| GO revenue: 0.50% | | | | | |
| Prince George's County MD Consolidated Public Improvement Bonds Series C | | 4.00 | 8-1-2028 | 12,960,000 | 14,229,950 |
The accompanying notes are an integral part of these financial statements.
26 | Wells Fargo Strategic Municipal Bond Fund
Portfolio of investments—December 31, 2020 (unaudited)
| | | Interest
rate | Maturity
date | Principal | Value |
| Health revenue: 0.07% | | | | | |
| Maryland Health and Higher Educational Facilities Authority Revenue Adventist Healthcare Series 2021 %% | | 5.00% | 1-1-2026 | $ 495,000 | $ 561,043 |
| Maryland Health and Higher Educational Facilities Authority Revenue Adventist Healthcare Series 2021 %% | | 5.00 | 1-1-2027 | 430,000 | 497,734 |
| Maryland Health and Higher Educational Facilities Authority Revenue Adventist Healthcare Series 2021 %% | | 5.00 | 1-1-2028 | 300,000 | 352,866 |
| Maryland Health and Higher Educational Facilities Authority Revenue Adventist Healthcare Series 2021 %% | | 5.00 | 1-1-2029 | 290,000 | 345,271 |
| Maryland Health and Higher Educational Facilities Authority Revenue Adventist Healthcare Series 2021 %% | | 5.00 | 1-1-2030 | 285,000 | 343,277 |
| | | | | | 2,100,191 |
| Housing revenue: 1.81% | | | | | |
| Maryland CDA Department of Housing & Community Multifamily Development Headen House Series B | | 2.45 | 3-1-2021 | 19,500,000 | 19,541,145 |
| Maryland CDA Department of Housing & Community Multifamily Development Huntington Apartments Series C 144A | | 2.34 | 4-1-2021 | 5,000,000 | 5,015,550 |
| Maryland Community Development Department Housing Rosemont Tower LLC Series F (FHA/GNMA Insured) | | 2.01 | 11-1-2021 | 18,500,000 | 18,628,205 |
| Maryland State Administration Department of Housing & Community Development Park View at Taylor Series D | | 2.45 | 4-1-2021 | 8,820,000 | 8,848,665 |
| | | | | | 52,033,565 |
| Tax revenue: 0.36% | | | | | |
| Maryland State Department of Transportation | | 4.00 | 12-15-2027 | 9,260,000 | 10,244,708 |
| | | | | | 81,139,204 |
| Massachusetts: 3.74% | | | | | |
| Education revenue: 1.40% | | | | | |
| Lowell MA Collegiate Charter School Revenue | | 4.00 | 6-15-2024 | 320,000 | 333,613 |
| Lowell MA Collegiate Charter School Revenue | | 5.00 | 6-15-2029 | 490,000 | 551,191 |
| Massachusetts Development Finance Agency Harvard University Series A | | 5.00 | 7-15-2033 | 22,560,000 | 28,001,923 |
| Massachusetts Development Finance Agency Sabis International Charter School Series 2015 | | 5.00 | 4-15-2025 | 1,000,000 | 1,077,650 |
| Massachusetts Educational Financing Authority AMT Issue I Series B | | 5.70 | 1-1-2031 | 1,015,000 | 1,026,327 |
| Massachusetts Educational Financing Authority Education Loan Revenue AMT Issue Lien Senior Series B | | 5.00 | 7-1-2026 | 1,000,000 | 1,215,280 |
| Massachusetts Educational Financing Authority Education Loan Revenue AMT Issue Lien Senior Series B | | 5.00 | 7-1-2027 | 1,500,000 | 1,857,465 |
| Massachusetts Educational Financing Authority Education Loan Revenue AMT Issue Lien Senior Series B | | 5.00 | 7-1-2028 | 1,250,000 | 1,570,813 |
| Massachusetts Educational Financing Authority Education Loan Revenue AMT Issue Lien Senior Series B | | 5.00 | 7-1-2029 | 1,400,000 | 1,781,220 |
| Massachusetts Educational Financing Authority Series B | | 5.00 | 7-1-2023 | 2,460,000 | 2,729,026 |
| | | | | | 40,144,508 |
The accompanying notes are an integral part of these financial statements.
Wells Fargo Strategic Municipal Bond Fund | 27
Portfolio of investments—December 31, 2020 (unaudited)
| | | Interest
rate | Maturity
date | Principal | Value |
| Health revenue: 0.70% | | | | | |
| Massachusetts Development Finance Agency Linden Ponds Incorporated Facility 144A | | 4.00% | 11-15-2023 | $ 850,000 | $ 874,795 |
| Massachusetts Development Finance Agency Partners Healthcare System Series S-3 (SIFMA Municipal Swap+0.50%)± | | 0.59 | 7-1-2038 | 14,870,000 | 14,891,264 |
| Massachusetts Development Finance Agency Revenue Milford Regional Medical Center Series G 144A | | 5.00 | 7-15-2026 | 150,000 | 176,459 |
| Massachusetts Development Finance Agency Revenue Milford Regional Medical Center Series G 144A | | 5.00 | 7-15-2027 | 160,000 | 191,298 |
| Massachusetts Development Finance Agency Revenue Milford Regional Medical Center Series G 144A | | 5.00 | 7-15-2028 | 175,000 | 211,997 |
| Massachusetts Development Finance Agency Revenue Milford Regional Medical Center Series G 144A | | 5.00 | 7-15-2029 | 300,000 | 367,170 |
| Massachusetts Development Finance Agency Revenue Milford Regional Medical Center Series G 144A | | 5.00 | 7-15-2030 | 320,000 | 395,200 |
| Massachusetts Development Finance Agency Revenue Milford Regional Medical Center Series G 144A | | 5.00 | 7-15-2031 | 350,000 | 426,780 |
| Massachusetts Development Finance Agency Revenue Milford Regional Medical Center Series G 144A | | 5.00 | 7-15-2032 | 400,000 | 484,876 |
| Tender Option Bond Trust Receipts/Floater Certificates Series 2020-XF2891 (Barclays Bank plc LOC, AGM Insured, Barclays Bank plc LIQ)144Aø | | 0.13 | 10-1-2045 | 2,245,000 | 2,245,000 |
| | | | | | 20,264,839 |
| Miscellaneous revenue: 1.31% | | | | | |
| Massachusetts Series A (3 Month LIBOR+0.55%)± | | 0.69 | 11-1-2025 | 15,800,000 | 15,777,090 |
| Massachusetts Water Pollution Abatement Trust Series 17 | | 5.00 | 2-1-2031 | 10,000,000 | 10,931,000 |
| Massachusetts Water Pollution Abatement Trust Series 17 | | 5.00 | 2-1-2032 | 10,000,000 | 10,913,600 |
| | | | | | 37,621,690 |
| Tax revenue: 0.33% | | | | | |
| Massachusetts Bay Transportation Authority Assessment Bonds Series A | | 4.00 | 7-1-2037 | 9,000,000 | 9,394,560 |
| | | | | | 107,425,597 |
| Michigan: 2.70% | | | | | |
| Airport revenue: 0.04% | | | | | |
| Wayne County MI Airport Authority AMT Detroit Metropolitan Airport Series C | | 5.00 | 12-1-2022 | 1,000,000 | 1,003,120 |
| Education revenue: 0.12% | | | | | |
| Michigan Finance Authority Limited Obligation Refunding Higher Education College Creative | | 5.00 | 12-1-2026 | 840,000 | 881,236 |
| Michigan Finance Authority Limited Obligation Refunding Higher Education College Creative | | 5.00 | 12-1-2027 | 585,000 | 613,004 |
| Michigan Finance Authority Limited Obligation Refunding Higher Education College Creative | | 5.00 | 12-1-2028 | 535,000 | 560,279 |
| Michigan Finance Authority Limited Obligation Refunding Higher Education College Creative | | 5.00 | 12-1-2029 | 590,000 | 616,845 |
The accompanying notes are an integral part of these financial statements.
28 | Wells Fargo Strategic Municipal Bond Fund
Portfolio of investments—December 31, 2020 (unaudited)
| | | Interest
rate | Maturity
date | Principal | Value |
| Education revenue (continued) | | | | | |
| Michigan Finance Authority Limited Obligation Refunding Higher Education College Creative | | 5.00% | 12-1-2030 | $ 400,000 | $ 417,356 |
| Michigan Finance Authority Limited Obligation Revenue Refunding Bonds Public School Academy Cesar Chavez Academy Project | | 3.25 | 2-1-2024 | 295,000 | 298,705 |
| | | | | | 3,387,425 |
| GO revenue: 0.32% | | | | | |
| Constantine MI Public Schools (Qualified School Board Loan Fund Insured) | | 5.00 | 5-1-2021 | 1,200,000 | 1,218,228 |
| Detroit MI | | 5.00 | 4-1-2021 | 875,000 | 882,333 |
| Forest Hills MI Public Schools | | 5.00 | 5-1-2021 | 1,600,000 | 1,624,992 |
| Fraser MI Public Schools District (Qualified School Board Loan Fund Insured) | | 5.00 | 5-1-2021 | 1,000,000 | 1,015,020 |
| Fraser MI Public Schools District (Qualified School Board Loan Fund Insured) | | 5.00 | 5-1-2022 | 610,000 | 647,381 |
| Hudsonville MI Public Schools (Qualified School Board Loan Fund Insured) | | 5.00 | 5-1-2021 | 1,465,000 | 1,487,253 |
| Ingham County MI Williamston Community Schools Series A (Qualified School Board Loan Fund Insured) | | 4.00 | 5-1-2024 | 1,025,000 | 1,132,902 |
| Ingham County MI Williamston Community Schools Series A (Qualified School Board Loan Fund Insured) | | 4.00 | 5-1-2025 | 1,000,000 | 1,135,860 |
| | | | | | 9,143,969 |
| Health revenue: 0.53% | | | | | |
| Kalamazoo MI Economic Development Corporation Revenue Limited Obligation Heritage Community | | 2.88 | 5-15-2026 | 1,520,000 | 1,527,752 |
| Michigan Finance Authority Bronson Healthcare Group Series B & C | | 3.75 | 11-15-2049 | 4,800,000 | 5,555,376 |
| St. Joseph MI Hospital Finance Authority Lakeland Hospital Niles & St. Joseph Obligated Group Series 2002 (AGM Insured, JPMorgan Chase & Company SPA)ø | | 0.19 | 1-1-2032 | 8,260,000 | 8,260,000 |
| | | | | | 15,343,128 |
| Housing revenue: 0.31% | | | | | |
| Michigan Housing Development Authority Series E (3 Month LIBOR+1.00%)± | | 1.16 | 4-1-2042 | 8,945,000 | 8,955,555 |
| Miscellaneous revenue: 0.55% | | | | | |
| Michigan Finance Authority Detroit Recovery Project Series 2014F | | 3.60 | 10-1-2021 | 500,000 | 504,610 |
| Michigan Finance Authority Detroit Recovery Project Series 2014F | | 3.80 | 10-1-2022 | 500,000 | 512,265 |
| Michigan Finance Authority Detroit Recovery Project Series 2014F | | 3.88 | 10-1-2023 | 2,500,000 | 2,590,750 |
| Michigan Finance Authority Local Government Loan Program City of Detroit Financial Recovery Refunding Bond Series F | | 4.50 | 10-1-2029 | 5,685,000 | 5,997,050 |
| Michigan Finance Authority Senior Lien Distributable State Aid | | 5.00 | 11-1-2028 | 865,000 | 1,113,843 |
| Michigan Finance Authority Senior Lien Distributable State Aid | | 5.00 | 11-1-2029 | 1,500,000 | 1,944,270 |
The accompanying notes are an integral part of these financial statements.
Wells Fargo Strategic Municipal Bond Fund | 29
Portfolio of investments—December 31, 2020 (unaudited)
| | | Interest
rate | Maturity
date | Principal | Value |
| Miscellaneous revenue (continued) | | | | | |
| Michigan Municipal Bond Authority Local Government Loan Program Series C (Ambac Insured) | | 5.00% | 5-1-2023 | $ 1,900,000 | $ 1,901,729 |
| Michigan Public Educational Facilities Authority Chandler Park Academy Project | | 6.35 | 11-1-2028 | 1,265,000 | 1,267,859 |
| | | | | | 15,832,376 |
| Tax revenue: 0.11% | | | | | |
| Michigan Finance Authority Series 2014B | | 5.00 | 7-1-2032 | 3,000,000 | 3,292,080 |
| Water & sewer revenue: 0.72% | | | | | |
| Detroit MI Water & Sewage Department Series A | | 5.00 | 7-1-2022 | 1,000,000 | 1,069,770 |
| Michigan Financial Authority Great Lakes Water Authority Series C-3 (AGM Insured) | | 5.00 | 7-1-2031 | 3,000,000 | 3,433,230 |
| Michigan Financial Authority Local Government Loan Program Series C7 (National Insured) | | 5.00 | 7-1-2022 | 2,000,000 | 2,139,840 |
| Michigan Financial Authority Local Government Loan Program Series D1 (AGM Insured) | | 5.00 | 7-1-2022 | 2,700,000 | 2,890,890 |
| Michigan Financial Authority Local Government Loan Program Series D1 (AGM Insured) | | 5.00 | 7-1-2023 | 2,000,000 | 2,231,380 |
| Michigan Financial Authority Local Government Loan Program Series D6 (National Insured) | | 5.00 | 7-1-2022 | 2,080,000 | 2,225,434 |
| Michigan Financial Authority Local Government Loan Program Series D6 (National Insured) | | 5.00 | 7-1-2023 | 3,670,000 | 4,082,948 |
| Michigan Financial Authority Local Government Loan Program Series D6 (National Insured) | | 5.00 | 7-1-2024 | 2,130,000 | 2,459,894 |
| | | | | | 20,533,386 |
| | | | | | 77,491,039 |
| Minnesota: 0.37% | | | | | |
| Education revenue: 0.17% | | | | | |
| Cologne MN Charter School Lease Academy Project Series 2014A | | 4.00 | 7-1-2023 | 260,000 | 274,903 |
| Minneapolis MN Charter School Lease Revenue Northeast College Preparatory Project | | 5.00 | 7-1-2040 | 875,000 | 943,521 |
| Minnesota State HEFAR Refunding Saint Catherine University Series A | | 5.00 | 10-1-2024 | 545,000 | 616,482 |
| Minnesota State HEFAR Refunding Saint Catherine University Series A | | 5.00 | 10-1-2027 | 1,035,000 | 1,258,001 |
| Minnesota State HEFAR Refunding Saint Catherine University Series A | | 5.00 | 10-1-2029 | 660,000 | 811,490 |
| St. Paul MN Housing & RDA Charter School Hmong College Preparatory Academy Project Series A | | 5.00 | 9-1-2026 | 1,000,000 | 1,116,160 |
| | | | | | 5,020,557 |
| Health revenue: 0.20% | | | | | |
| Shakopee MN Senior Housing Revenue Benedictine Living Community LLC Project 144A | | 5.85 | 11-1-2058 | 5,500,000 | 5,681,445 |
| | | | | | 10,702,002 |
The accompanying notes are an integral part of these financial statements.
30 | Wells Fargo Strategic Municipal Bond Fund
Portfolio of investments—December 31, 2020 (unaudited)
| | | Interest
rate | Maturity
date | Principal | Value |
| Mississippi: 0.29% | | | | | |
| Health revenue: 0.29% | | | | | |
| Mississippi Hospital Equipment and Facilities Authority Revenue North Mississippi Health Services Series LI | | 5.00% | 10-1-2040 | $ 3,930,000 | $ 4,781,395 |
| Mississippi Hospital Equipment and Facilities Authority Revenue Refunding Bond Baptist Memorial Health Care | | 5.00 | 9-1-2044 | 3,000,000 | 3,506,430 |
| | | | | | 8,287,825 |
| Missouri: 1.62% | | | | | |
| Airport revenue: 0.23% | | | | | |
| Kansas City MO Airport Revenue Refunding AMT General Improvement Series A | | 5.25 | 9-1-2025 | 6,390,000 | 6,596,972 |
| Education revenue: 0.33% | | | | | |
| Missouri State HEFAR University Health Science | | 5.00 | 10-1-2026 | 925,000 | 1,110,731 |
| Missouri State HEFAR University Health Science | | 5.00 | 10-1-2027 | 975,000 | 1,195,545 |
| Missouri State HEFAR University Health Science | | 5.00 | 10-1-2028 | 1,025,000 | 1,280,574 |
| Missouri State HEFAR Webster University Project | | 5.00 | 4-1-2022 | 775,000 | 804,063 |
| Missouri State HEFAR Webster University Project | | 5.00 | 4-1-2023 | 1,050,000 | 1,118,082 |
| Missouri State HEFAR Webster University Project | | 5.00 | 4-1-2024 | 2,820,000 | 3,077,466 |
| Missouri State HEFAR Webster University Project | | 5.00 | 4-1-2025 | 350,000 | 390,194 |
| Missouri State HEFAR Webster University Project | | 5.00 | 4-1-2026 | 500,000 | 565,990 |
| | | | | | 9,542,645 |
| Health revenue: 0.30% | | | | | |
| RBC Municipal Products Incorporated (Royal Bank of Canada LOC, Royal Bank of Canada LIQ)144Aø | | 0.15 | 9-1-2039 | 8,700,000 | 8,700,000 |
| Miscellaneous revenue: 0.48% | | | | | |
| Branson MO IDA Branson Shoppes Series A | | 3.00 | 11-1-2021 | 1,055,000 | 1,058,133 |
| Branson MO IDA Branson Shoppes Series A | | 4.00 | 11-1-2022 | 350,000 | 356,962 |
| Branson MO IDA Branson Shoppes Series A | | 4.00 | 11-1-2023 | 750,000 | 769,583 |
| Kansas City MO IDA International Airport Terminal Modernization Project Series B | | 5.00 | 3-1-2028 | 3,000,000 | 3,775,380 |
| Kansas City MO IDA International Airport Terminal Modernization Project Series B | | 5.00 | 3-1-2030 | 2,000,000 | 2,541,840 |
| Platte County MO Riverside-Quindaro Bend Levee District Project L-385 | | 4.00 | 3-1-2021 | 930,000 | 934,399 |
| Platte County MO Riverside-Quindaro Bend Levee District Project L-385 | | 4.00 | 3-1-2022 | 970,000 | 1,002,883 |
| Platte County MO Riverside-Quindaro Bend Levee District Project L-385 | | 4.00 | 3-1-2023 | 1,010,000 | 1,067,742 |
| Platte County MO Riverside-Quindaro Bend Levee District Project L-385 | | 5.00 | 3-1-2024 | 1,000,000 | 1,110,340 |
| Platte County MO Riverside-Quindaro Bend Levee District Project L-385 | | 5.00 | 3-1-2025 | 1,105,000 | 1,255,777 |
| | | | | | 13,873,039 |
| Tax revenue: 0.15% | | | | | |
| Arnold MO Real Property Arnold Triangle Redevelopment Project Series A | | 3.75 | 5-1-2023 | 515,000 | 518,631 |
| Hanley Road Corridor Transportation Development District Missouri Transportation Sales Tax Revenue Refunding | | 1.00 | 10-1-2027 | 750,000 | 747,435 |
The accompanying notes are an integral part of these financial statements.
Wells Fargo Strategic Municipal Bond Fund | 31
Portfolio of investments—December 31, 2020 (unaudited)
| | | Interest
rate | Maturity
date | Principal | Value |
| Tax revenue (continued) | | | | | |
| Hanley Road Corridor Transportation Development District Missouri Transportation Sales Tax Revenue Refunding | | 1.63% | 10-1-2033 | $ 700,000 | $ 700,028 |
| Hanley Road Corridor Transportation Development District Missouri Transportation Sales Tax Revenue Refunding | | 2.00 | 10-1-2039 | 750,000 | 750,285 |
| Lees Summit MO Summit Fair Project Series 2017 144A | | 3.50 | 11-1-2023 | 265,000 | 264,849 |
| Richmond Heights MO Francis Place Redevelopment Project | | 5.63 | 11-1-2025 | 1,195,000 | 1,194,940 |
| | | | | | 4,176,168 |
| Water & sewer revenue: 0.13% | | | | | |
| Kansas City MO Sanitation Sewer System Revenue Series B | | 5.00 | 1-1-2021 | 575,000 | 575,000 |
| Kansas City MO Sanitation Sewer System Revenue Series B | | 5.00 | 1-1-2023 | 805,000 | 882,505 |
| Kansas City MO Sanitation Sewer System Revenue Series B | | 5.00 | 1-1-2025 | 810,000 | 961,195 |
| Kansas City MO Sanitation Sewer System Revenue Series B | | 5.00 | 1-1-2027 | 700,000 | 889,441 |
| Kansas City MO Sanitation Sewer System Revenue Series B | | 5.00 | 1-1-2028 | 275,000 | 359,222 |
| | | | | | 3,667,363 |
| | | | | | 46,556,187 |
| Nebraska: 0.59% | | | | | |
| Utilities revenue: 0.59% | | | | | |
| Central Plains Energy Nebraska Gas Project #3 | | 5.00 | 9-1-2025 | 3,290,000 | 3,916,581 |
| Central Plains Energy Nebraska Gas Project #3 | | 5.00 | 9-1-2026 | 3,750,000 | 4,579,163 |
| Central Plains Energy Nebraska Gas Project #3 | | 5.00 | 9-1-2027 | 1,000,000 | 1,244,290 |
| Nebraska Central Plains Energy Gas Project #1 (Royal Bank of Canada LIQ) | | 4.00 | 12-1-2049 | 6,355,000 | 7,299,289 |
| | | | | | 17,039,323 |
| Nevada: 0.39% | | | | | |
| Industrial development revenue: 0.35% | | | | | |
| Director of the State of Nevada Department Business and Industry AMT Brightline West Passenger 144A | | 0.50 | 1-1-2050 | 10,000,000 | 10,011,700 |
| Tax revenue: 0.04% | | | | | |
| Sparks NV Tourism Improvement District #1 Senior Revenue Refunding Sales Tax Anticipation Notes 144A | | 2.50 | 6-15-2024 | 1,315,000 | 1,320,405 |
| | | | | | 11,332,105 |
| New Hampshire: 0.32% | | | | | |
| Health revenue: 0.22% | | | | | |
| New Hampshire Covenant Health Systems Series B | | 5.00 | 7-1-2028 | 6,400,000 | 6,416,960 |
The accompanying notes are an integral part of these financial statements.
32 | Wells Fargo Strategic Municipal Bond Fund
Portfolio of investments—December 31, 2020 (unaudited)
| | | Interest
rate | Maturity
date | Principal | Value |
| Housing revenue: 0.10% | | | | | |
| New Hampshire National Finance Authority Municipal Certificates Series A | | 4.13% | 1-20-2034 | $ 2,469,723 | $ 2,773,202 |
| | | | | | 9,190,162 |
| New Jersey: 4.43% | | | | | |
| Airport revenue: 0.46% | | | | | |
| New Jersey EDA Refunding Bonds Port Newark Container | | 5.00 | 10-1-2025 | 2,750,000 | 3,180,458 |
| New Jersey EDA Refunding Bonds Port Newark Container | | 5.00 | 10-1-2026 | 2,130,000 | 2,516,574 |
| New Jersey EDA Refunding Bonds Port Newark Container | | 5.00 | 10-1-2027 | 1,675,000 | 2,019,581 |
| South Jersey NJ Port Corporation Marine Terminal Series R | | 4.00 | 1-1-2022 | 1,600,000 | 1,641,504 |
| South Jersey NJ Port Corporation Marine Terminal Series S-2 | | 5.00 | 1-1-2023 | 1,665,000 | 1,780,118 |
| South Jersey NJ Port Corporation Marine Terminal Series S-2 | | 5.00 | 1-1-2024 | 1,750,000 | 1,926,908 |
| | | | | | 13,065,143 |
| Education revenue: 0.18% | | | | | |
| New Jersey Higher Education Student Assistance Authority Series 2014-1A-1 | | 5.00 | 12-1-2021 | 2,250,000 | 2,344,298 |
| New Jersey Higher Education Student Assistance Authority Series 2017-1B | | 5.00 | 12-1-2021 | 2,815,000 | 2,932,977 |
| | | | | | 5,277,275 |
| Industrial development revenue: 0.12% | | | | | |
| New Jersey EDA Elite Pharmaceuticals Project Series A | | 6.50 | 9-1-2030 | 330,000 | 292,826 |
| New Jersey EDA The Goethals Bridge Replacement Project | | 5.00 | 1-1-2021 | 585,000 | 585,000 |
| New Jersey EDA The Goethals Bridge Replacement Project | | 5.00 | 7-1-2021 | 900,000 | 918,855 |
| New Jersey EDA The Goethals Bridge Replacement Project | | 5.00 | 1-1-2023 | 1,520,000 | 1,647,102 |
| | | | | | 3,443,783 |
| Miscellaneous revenue: 0.92% | | | | | |
| New Jersey EDA Motor Vehicle Surcharge Revenue Refunding Bond Series A | | 3.13 | 7-1-2029 | 5,620,000 | 5,676,088 |
| New Jersey EDA Motor Vehicle Surcharge Revenue Refunding Bond Series A | | 3.38 | 7-1-2030 | 9,705,000 | 10,021,480 |
| New Jersey EDA School Facilities Construction Project Prerefunded Bond Series EE | | 5.50 | 9-1-2021 | 2,025,000 | 2,042,030 |
| New Jersey EDA School Facilities Construction Project Series EE | | 5.25 | 9-1-2025 | 2,350,000 | 2,367,367 |
| New Jersey EDA School Facilities Construction Project Series NN (AGM Insured) | | 5.00 | 3-1-2024 | 1,645,000 | 1,795,485 |
| New Jersey EDA School Facilities Construction Refunding Bond Project Series I (SIFMA Municipal Swap+1.25%)± | | 1.34 | 9-1-2025 | 4,500,000 | 4,445,100 |
| | | | | | 26,347,550 |
| Tax revenue: 0.82% | | | | | |
| New Jersey Covid 19 Emergency Series A | | 4.00 | 6-1-2032 | 3,000,000 | 3,739,170 |
| New Jersey EDA School Facilities Construction Project Unrefunded Bond Series EE | | 5.50 | 9-1-2021 | 750,000 | 755,910 |
The accompanying notes are an integral part of these financial statements.
Wells Fargo Strategic Municipal Bond Fund | 33
Portfolio of investments—December 31, 2020 (unaudited)
| | | Interest
rate | Maturity
date | Principal | Value |
| Tax revenue (continued) | | | | | |
| New Jersey Garden State Preservation Trust Open & Farmland Series A (AGM Insured) | | 5.75% | 11-1-2028 | $ 5,000,000 | $ 6,289,050 |
| New Jersey State TTFA Transportation Program Series BB | | 5.00 | 6-15-2030 | 1,500,000 | 1,865,340 |
| New Jersey Tender Option Bond Trust Receipts/Floater Certificates Series 2019-XG0258 (Barclays Bank plc LOC, Barclays Bank plc LIQ)144Aø | | 0.12 | 6-15-2050 | 6,000,000 | 6,000,000 |
| New Jersey TTFA Transportation Program Series AA | | 4.00 | 6-15-2035 | 2,000,000 | 2,324,140 |
| New Jersey TTFA Transportation Program Series AA | | 5.00 | 6-15-2035 | 2,000,000 | 2,520,760 |
| | | | | | 23,494,370 |
| Transportation revenue: 1.30% | | | | | |
| New Jersey TTFA CAB Series A ¤ | | 0.00 | 12-15-2026 | 12,000,000 | 10,829,160 |
| New Jersey TTFA CAB Transportation System Series C (Ambac Insured)¤ | | 0.00 | 12-15-2026 | 3,500,000 | 3,205,405 |
| New Jersey TTFA Series A | | 5.00 | 6-15-2022 | 4,815,000 | 4,917,608 |
| New Jersey TTFA Series A | | 5.00 | 12-15-2025 | 1,000,000 | 1,185,460 |
| New Jersey TTFA Series A | | 5.25 | 6-15-2022 | 2,785,000 | 2,847,440 |
| New Jersey TTFA Series AA | | 5.00 | 6-15-2023 | 1,350,000 | 1,435,631 |
| New Jersey TTFA Series AA | | 5.00 | 6-15-2023 | 4,665,000 | 5,150,860 |
| New Jersey TTFA Series D | | 5.00 | 12-15-2023 | 6,960,000 | 7,828,538 |
| | | | | | 37,400,102 |
| Unknown Revenue Source: 0.35% | | | | | |
| New Jersey EDA School Facilities Construction Refunding Bond (SIFMA Municipal Swap+1.60%)± | | 1.69 | 3-1-2028 | 10,000,000 | 9,992,200 |
| Water & sewer revenue: 0.28% | | | | | |
| New Jersey EDA | | 2.20 | 10-1-2039 | 5,500,000 | 5,954,245 |
| New Jersey EDA Water Facilities Revenue Refunding AMT New Jersey American Water Company Incorporate | | 1.10 | 11-1-2029 | 2,075,000 | 2,085,147 |
| | | | | | 8,039,392 |
| | | | | | 127,059,815 |
| New Mexico: 0.31% | | | | | |
| Utilities revenue: 0.31% | | | | | |
| Farmington NM Public Service Company of New Mexico San Juan Project Series A ø | | 0.19 | 6-1-2040 | 1,000,000 | 1,000,000 |
| New Mexico Municipal Energy Acquisition Authority Gas Supply Revenue Refunding Bond and Acquisition Subordinated Series A (Royal Bank of Canada LIQ) | | 5.00 | 11-1-2039 | 6,660,000 | 7,878,514 |
| | | | | | 8,878,514 |
| New York: 8.01% | | | | | |
| Airport revenue: 1.46% | | | | | |
| New York Transportation Development Corporation Special Refunding Terminal One Group Association | | 5.00 | 1-1-2022 | 3,000,000 | 3,118,080 |
| Port Authority New York & New Jersey Consolidated Bonds 205 Series | | 5.00 | 11-15-2025 | 475,000 | 577,895 |
| Port Authority of New York & New Jersey Consolidated Bonds 172 Series | | 5.00 | 10-1-2027 | 5,000,000 | 5,257,850 |
The accompanying notes are an integral part of these financial statements.
34 | Wells Fargo Strategic Municipal Bond Fund
Portfolio of investments—December 31, 2020 (unaudited)
| | | Interest
rate | Maturity
date | Principal | Value |
| Airport revenue (continued) | | | | | |
| Port Authority of New York & New Jersey Consolidated Bonds 185 Series | | 5.00% | 9-1-2028 | $ 5,000,000 | $ 5,728,350 |
| Port Authority of New York & New Jersey Consolidated Bonds 207 Series | | 5.00 | 9-15-2027 | 21,380,000 | 27,097,226 |
| | | | | | 41,779,401 |
| Education revenue: 0.28% | | | | | |
| Build New York City Resource Corporation Bronx Charter School for International Cultures & Arts Series A | | 3.88 | 4-15-2023 | 610,000 | 621,218 |
| Hempstead Town NY Local Development Corporation Academy Charter School Project Series A | | 5.45 | 2-1-2027 | 2,880,000 | 3,164,227 |
| Hempstead Town NY Local Development Corporation Academy Charter School Project Series A | | 6.47 | 2-1-2033 | 1,435,000 | 1,678,362 |
| Hempstead Town NY Local Development Corporation Education Revenue Academy Charter School Project Series A | | 4.76 | 2-1-2027 | 970,000 | 1,040,674 |
| Hempstead Town NY Local Development Corporation Education Revenue Refunding Bond Academy Charter School Project | | 4.76 | 2-1-2027 | 215,000 | 226,612 |
| New York NY IDA Civic Facility Stars Churchill School Center Project (AGC Insured) | | 2.25 | 10-1-2029 | 1,330,000 | 1,371,443 |
| | | | | | 8,102,536 |
| GO revenue: 1.81% | | | | | |
| New York NY Series A (Mizuho Bank Limited LOC)ø | | 0.10 | 10-1-2040 | 10,360,000 | 10,360,000 |
| Poughkeepsie City NY Refunding Bonds Public Improvement | | 5.00 | 6-1-2024 | 340,000 | 367,989 |
| Poughkeepsie City NY Refunding Public Improvement | | 5.00 | 6-1-2025 | 235,000 | 259,593 |
| Poughkeepsie City NY Refunding Public Improvement | | 5.00 | 6-1-2031 | 600,000 | 655,032 |
| Suffolk County NY Series A | | 5.00 | 3-19-2021 | 11,500,000 | 11,604,305 |
| Suffolk County NY Tax Anticipation Notes Series I | | 2.00 | 7-22-2021 | 13,500,000 | 13,585,995 |
| Suffolk County NY Tax Anticipation Notes Series I | | 3.00 | 9-24-2021 | 15,000,000 | 15,230,550 |
| | | | | | 52,063,464 |
| Health revenue: 0.37% | | | | | |
| New York Dormitory Authority Non-State Supported Debt Northwell Health Obligated Group | | 5.00 | 5-1-2048 | 6,000,000 | 7,159,860 |
| New York Dormitory Authority Revenues Non-State Supported Debit Montefiore Obligation Group Series A | | 5.00 | 9-1-2029 | 1,350,000 | 1,712,192 |
| New York Dormitory Authority Revenues Non-State Supported Debt Montefiore Obligation Group Series A | | 5.00 | 9-1-2028 | 1,400,000 | 1,746,500 |
| | | | | | 10,618,552 |
| Housing revenue: 0.08% | | | | | |
| New York HFA Affordable Housing Project Series M (GNMA/FNMA/FHLMC Insured) | | 2.00 | 5-1-2021 | 2,250,000 | 2,250,225 |
| Industrial development revenue: 0.91% | | | | | |
| New York Liberty Development Corporation Refunding Bond | | 2.80 | 9-15-2069 | 2,000,000 | 1,952,340 |
The accompanying notes are an integral part of these financial statements.
Wells Fargo Strategic Municipal Bond Fund | 35
Portfolio of investments—December 31, 2020 (unaudited)
| | | Interest
rate | Maturity
date | Principal | Value |
| Industrial development revenue (continued) | | | | | |
| New York Transportation Development Corporation Special Delta Air Lines Incorporated Laguardia | | 5.00% | 10-1-2035 | $ 9,250,000 | $ 11,381,385 |
| New York Transportation Development Corporation Special Facilities Revenue Delta Air Lines Incorporated LaGuardia Airport Terminals C&D Redevelopment | | 5.00 | 1-1-2026 | 11,030,000 | 12,792,594 |
| | | | | | 26,126,319 |
| Miscellaneous revenue: 0.01% | | | | | |
| Public Housing Capital Fund Trust II (Department of Housing and Urban Development Insured)144A | | 4.50 | 7-1-2022 | 262,537 | 262,537 |
| Resource recovery revenue: 0.07% | | | | | |
| New York Environmental Facilities Corporation Solid Waste Disposal Revenue Casella Waste System Incorporate Project | | 2.75 | 9-1-2050 | 2,000,000 | 2,068,200 |
| Tax revenue: 0.60% | | | | | |
| New York City Transitional Future Tax Secured Subordinated Series E | | 5.00 | 2-1-2031 | 10,000,000 | 10,481,400 |
| New York Transitional Finance Authority Revenue Series (Barclays Bank plc SPA)ø | | 0.08 | 8-1-2039 | 6,700,000 | 6,700,000 |
| | | | | | 17,181,400 |
| Transportation revenue: 2.31% | | | | | |
| New York Metropolitan Transportacion Authority Revenue Various Refunding Bonds Transportation Subordinated Series G3 (SIFMA Municipal Swap+0.43%)± | | 0.52 | 11-1-2031 | 20,000,000 | 18,549,600 |
| New York Metropolitan Transportation Authority Revenue BAN Subordinated Series C-2 | | 5.00 | 9-1-2021 | 10,560,000 | 10,760,112 |
| New York Metropolitan Transportation Authority Sub Series A-1 | | 5.00 | 11-15-2048 | 800,000 | 873,480 |
| New York Metropolitan Transportation Authority Subordinate Bond Series D (1 Month LIBOR+0.65%)± | | 0.75 | 11-1-2035 | 16,445,000 | 16,326,432 |
| New York Metropolitan Transportation Authority Subordinate Bond Series D1 | | 5.00 | 9-1-2022 | 5,000,000 | 5,239,300 |
| New York Metropolitan Transportation Authority Transportation Subordinated Series C1 | | 5.00 | 11-15-2024 | 3,535,000 | 3,923,002 |
| Tender Option Bond Trust Receipts/Certificates (Barclays Bank plc LOC, Barclays Bank plc LIQ)144Aø | | 0.13 | 11-15-2038 | 5,625,000 | 5,625,000 |
| Tender Option Bond Trust Receipts/Certificates (Morgan Stanley Bank LIQ)144Aø | | 0.34 | 1-1-2053 | 5,000,000 | 5,000,000 |
| | | | | | 66,296,926 |
| Utilities revenue: 0.11% | | | | | |
| Long Island NY Power Authority Electric System Revenue General Series B | | 0.85 | 9-1-2050 | 3,000,000 | 3,022,950 |
| | | | | | 229,772,510 |
| North Carolina: 0.09% | | | | | |
| Health revenue: 0.06% | | | | | |
| North Carolina Medical Care Commission Retirement Facilities Revenue Entrance Fee Friends Homes | | 2.55 | 9-1-2026 | 1,575,000 | 1,583,883 |
The accompanying notes are an integral part of these financial statements.
36 | Wells Fargo Strategic Municipal Bond Fund
Portfolio of investments—December 31, 2020 (unaudited)
| | | Interest
rate | Maturity
date | Principal | Value |
| Industrial development revenue: 0.03% | | | | | |
| Columbus County NC Industrial Facilities and PCFA Refunding Bonds Recovery Zone Facility International Paper Company Project | | 2.00% | 11-1-2033 | $ 850,000 | $ 898,144 |
| | | | | | 2,482,027 |
| North Dakota: 0.61% | | | | | |
| GO revenue: 0.44% | | | | | |
| McKenzie County ND Public School District #1 School Building Series A | | 5.00 | 8-1-2025 | 960,000 | 1,133,530 |
| McKenzie County ND Public School District #1 School Building Series A | | 5.00 | 8-1-2026 | 1,115,000 | 1,354,580 |
| McKenzie County ND Public School District #1 School Building Series A | | 5.00 | 8-1-2027 | 1,170,000 | 1,455,667 |
| McKenzie County ND Public School District #1 School Building Series A | | 5.00 | 8-1-2028 | 1,225,000 | 1,556,987 |
| McKenzie County ND Public School District #1 School Building Series A | | 5.00 | 8-1-2029 | 1,290,000 | 1,628,793 |
| McKenzie County ND Public School District #1 School Building Series A | | 5.00 | 8-1-2030 | 1,355,000 | 1,702,205 |
| McKenzie County ND Public School District #1 School Building Series A | | 5.00 | 8-1-2031 | 1,420,000 | 1,776,548 |
| McKenzie County ND Public School District #1 School Building Series A | | 5.00 | 8-1-2032 | 1,490,000 | 1,854,871 |
| | | | | | 12,463,181 |
| Housing revenue: 0.17% | | | | | |
| North Dakota Housing Finance Agency Various Housing Home Mortgage Finance Program (TD Bank NA SPA)ø | | 0.11 | 7-1-2036 | 5,000,000 | 5,000,000 |
| | | | | | 17,463,181 |
| Ohio: 1.96% | | | | | |
| Education revenue: 0.07% | | | | | |
| Portage County OH Port Authority Northeast Ohio Medical University Project | | 5.00 | 12-1-2026 | 1,980,000 | 2,033,797 |
| Health revenue: 0.81% | | | | | |
| Akron OH Bath and Copley Joint Township Hospital District | | 5.00 | 1-1-2031 | 2,000,000 | 2,093,980 |
| Allen County OH Hospital Facilities Revenue Bonds Series B | | 5.00 | 8-1-2047 | 2,500,000 | 2,650,675 |
| Hamilton County OH Healthcare Series 2017 | | 3.00 | 1-1-2022 | 235,000 | 236,196 |
| Hamilton County OH Hospital Facilities Revenue UC Health | | 5.00 | 9-15-2027 | 615,000 | 782,667 |
| Hamilton County OH Hospital Facilities Revenue UC Health | | 5.00 | 9-15-2028 | 650,000 | 845,897 |
| Montgomery County OH Hospital Refunding Bonds Facilities Premier Health Partners | | 5.00 | 11-15-2033 | 4,000,000 | 4,893,760 |
| Montgomery County OH Hospital Refunding Bonds Facilities Premier Health Partners | | 5.00 | 11-15-2034 | 5,460,000 | 6,668,189 |
| Ohio Higher Educational Facility Commission Hospital Cleveland Clinic B4 (Barclays Bank plc SPA)ø | | 0.07 | 1-1-2043 | 5,000,000 | 5,000,000 |
| | | | | | 23,171,364 |
The accompanying notes are an integral part of these financial statements.
Wells Fargo Strategic Municipal Bond Fund | 37
Portfolio of investments—December 31, 2020 (unaudited)
| | | Interest
rate | Maturity
date | Principal | Value |
| Housing revenue: 0.51% | | | | | |
| Ohio HFA MFHR Chadwick Place & Union Square Apartments | | 1.60% | 1-1-2022 | $ 3,130,000 | $ 3,130,000 |
| Ohio HFA MFHR Terrace Towers Apartments Project | | 1.45 | 6-1-2022 | 11,525,000 | 11,636,332 |
| | | | | | 14,766,332 |
| Resource recovery revenue: 0.18% | | | | | |
| Ohio Air Quality Development Authority Revenue Refunding Bonds AMT American Electric Power Company | | 2.10 | 12-1-2027 | 4,930,000 | 5,169,105 |
| Utilities revenue: 0.15% | | | | | |
| Ohio Air Quality Development Authority Ohio Valley Electric Corporation Project Series A | | 3.25 | 9-1-2029 | 4,000,000 | 4,352,520 |
| Water & sewer revenue: 0.24% | | | | | |
| Columbus OH Sewerage System | | 5.00 | 6-1-2031 | 5,825,000 | 6,837,735 |
| | | | | | 56,330,853 |
| Oklahoma: 0.63% | | | | | |
| Education revenue: 0.19% | | | | | |
| Oklahoma Development Finance Authority Revenue Refunding Bonds Oklahoma City University Project | | 5.00 | 8-1-2025 | 925,000 | 1,048,673 |
| Oklahoma Development Finance Authority Revenue Refunding Bonds Oklahoma City University Project | | 5.00 | 8-1-2026 | 975,000 | 1,125,550 |
| Oklahoma Development Finance Authority Revenue Refunding Bonds Oklahoma City University Project | | 5.00 | 8-1-2027 | 1,370,000 | 1,604,051 |
| Oklahoma Development Finance Authority Revenue Refunding Bonds Oklahoma City University Project | | 5.00 | 8-1-2028 | 715,000 | 846,310 |
| Oklahoma Development Finance Authority Revenue Refunding Bonds Oklahoma City University Project | | 5.00 | 8-1-2029 | 755,000 | 902,972 |
| | | | | | 5,527,556 |
| Miscellaneous revenue: 0.27% | | | | | |
| Carter County OK Public Facilities Authority Dickson Public Schools Project | | 4.00 | 9-1-2025 | 350,000 | 392,518 |
| Carter County OK Public Facilities Authority Dickson Public Schools Project | | 5.00 | 9-1-2025 | 365,000 | 419,889 |
| Muskogee OK Industrial Trust Educational Facilities Lease Muskogee Public Schools Project | | 4.00 | 9-1-2028 | 2,500,000 | 2,913,500 |
| Muskogee OK Industrial Trust Educational Facilities Lease Muskogee Public Schools Project | | 5.00 | 9-1-2024 | 890,000 | 1,011,387 |
| Muskogee OK Industrial Trust Educational Facilities Lease Muskogee Public Schools Project | | 5.00 | 9-1-2025 | 855,000 | 999,897 |
| Muskogee OK Industrial Trust Educational Facilities Lease Muskogee Public Schools Project | | 5.00 | 9-1-2026 | 1,810,000 | 2,166,099 |
| | | | | | 7,903,290 |
| Tax revenue: 0.17% | | | | | |
| Tulsa OK Public Facilities Authority Capital Improvements | | 4.00 | 10-1-2027 | 4,050,000 | 4,757,414 |
| | | | | | 18,188,260 |
The accompanying notes are an integral part of these financial statements.
38 | Wells Fargo Strategic Municipal Bond Fund
Portfolio of investments—December 31, 2020 (unaudited)
| | | Interest
rate | Maturity
date | Principal | Value |
| Oregon: 0.43% | | | | | |
| Health revenue: 0.43% | | | | | |
| Clackamas County OR Hospital Facility Authority Revenue Senior Living Rose Villa Project | | 2.75% | 11-15-2025 | $ 500,000 | $ 504,935 |
| Multnomah County OR Hospital Facilities Authority Revenue Refunding Bonds Adventist Health System/West | | 5.00 | 3-1-2040 | 9,500,000 | 10,946,850 |
| Oregon State Facilities Authority Revenue Refunding Samaritan Health Services Project | | 5.00 | 10-1-2025 | 400,000 | 478,308 |
| Oregon State Facilities Authority Revenue Refunding Samaritan Health Services Project | | 5.00 | 10-1-2026 | 125,000 | 153,825 |
| Oregon State Facilities Authority Revenue Refunding Samaritan Health Services Project | | 5.00 | 10-1-2027 | 300,000 | 377,505 |
| | | | | | 12,461,423 |
| Other: 0.09% | | | | | |
| Miscellaneous revenue: 0.09% | | | | | |
| FHLMC Multiclass Mortgage Certificate of Participation Series M012 Class A1A øø | | 1.60 | 8-15-2051 | 2,507,595 | 2,545,735 |
| Pennsylvania: 3.80% | | | | | |
| Education revenue: 0.54% | | | | | |
| Chester County PA IDA Avon Grove Charter School Project Series 2017A | | 4.00 | 12-15-2027 | 1,700,000 | 1,832,005 |
| Chester County PA IDA Collegium Charter School Project Series A | | 3.70 | 10-15-2022 | 780,000 | 791,778 |
| Lycoming County PA Authority Association of Independent Colleges & Universities of Pennsylvania Financing Program øø | | 2.00 | 11-1-2035 | 3,000,000 | 3,000,000 |
| Montgomery County PA HEFAR Arcadia University | | 5.00 | 4-1-2022 | 1,575,000 | 1,622,880 |
| Montgomery County PA HEFAR Arcadia University | | 5.00 | 4-1-2023 | 1,555,000 | 1,662,964 |
| Philadelphia PA IDA Charter School Project Series 2016B | | 4.88 | 8-1-2026 | 1,720,000 | 1,854,504 |
| Philadelphia PA IDA Charter School Project Series A | | 4.50 | 8-1-2026 | 2,630,000 | 2,823,358 |
| Philadelphia PA IDA for Independence Charter School | | 4.00 | 6-15-2029 | 350,000 | 368,337 |
| Philadelphia PA IDA Tacony Academy Christian School Project Series A-1 | | 6.25 | 6-15-2023 | 400,000 | 426,216 |
| Philadelphia PA IDA University of the Arts Series 2017 144A | | 5.00 | 3-15-2021 | 1,205,000 | 1,209,459 |
| | | | | | 15,591,501 |
| GO revenue: 1.05% | | | | | |
| Allegheny County PA Penn Hills Schools District Series 2015 (BAM Insured) | | 5.00 | 11-15-2022 | 340,000 | 367,642 |
| Allegheny County PA Penn Hills Schools District Series 2015 (BAM Insured) | | 5.00 | 11-15-2023 | 1,025,000 | 1,151,885 |
| Armstrong PA School District Refunding Bonds Series A (BAM Insured) | | 5.00 | 3-15-2027 | 745,000 | 930,535 |
| Armstrong PA School District Refunding Bonds Series A (BAM Insured) | | 5.00 | 3-15-2029 | 920,000 | 1,201,042 |
| Armstrong PA School District Refunding Bonds Series A (BAM Insured) | | 5.00 | 3-15-2030 | 1,800,000 | 2,342,718 |
| Bristol Township PA School District | | 5.25 | 6-1-2031 | 6,990,000 | 7,747,814 |
| Philadelphia PA School District Series D | | 5.00 | 9-1-2021 | 2,000,000 | 2,058,540 |
| Philadelphia PA School District Series D | | 5.00 | 9-1-2022 | 3,565,000 | 3,822,999 |
| Philadelphia PA School District Series F | | 5.00 | 9-1-2022 | 5,000,000 | 5,361,850 |
The accompanying notes are an integral part of these financial statements.
Wells Fargo Strategic Municipal Bond Fund | 39
Portfolio of investments—December 31, 2020 (unaudited)
| | | Interest
rate | Maturity
date | Principal | Value |
| GO revenue (continued) | | | | | |
| Scranton PA School District Series A | | 5.00% | 6-1-2024 | $ 750,000 | $ 860,138 |
| Scranton PA School District Series A | | 5.00 | 6-1-2025 | 1,000,000 | 1,188,740 |
| Scranton PA School District Series B (National Insured) | | 5.00 | 6-1-2024 | 665,000 | 765,083 |
| Scranton PA School District Series B (National Insured) | | 5.00 | 6-1-2025 | 710,000 | 847,421 |
| Scranton PA Series 2017 144A | | 5.00 | 9-1-2023 | 1,355,000 | 1,464,985 |
| | | | | | 30,111,392 |
| Health revenue: 0.54% | | | | | |
| Berks County PA Municipal Authority Tower Health Project Series B2 | | 5.00 | 2-1-2040 | 6,000,000 | 6,676,080 |
| Bucks County PA IDA Hospital St. Lukes University Health Network | | 4.00 | 8-15-2031 | 750,000 | 873,540 |
| Bucks County PA IDA Hospital St. Lukes University Health Network | | 4.00 | 8-15-2032 | 1,390,000 | 1,608,494 |
| Montgomery County PA Higher Education & Health Authority Thomas Jefferson University Series C (SIFMA Municipal Swap+0.72%)± | | 0.81 | 9-1-2051 | 3,500,000 | 3,500,105 |
| Quakertown PA Health Facilities Authority Series A | | 3.13 | 7-1-2021 | 1,500,000 | 1,486,635 |
| Westmoreland County PA Industrial Development Authority Health System Revenue Excela Health Project Series A | | 5.00 | 7-1-2027 | 1,200,000 | 1,446,012 |
| | | | | | 15,590,866 |
| Housing revenue: 0.53% | | | | | |
| East Hempfield Township Pennsylvania Industrial Development Student Services Incorporate Student Housing | | 5.00 | 7-1-2025 | 1,330,000 | 1,346,199 |
| Pennsylvania HFA Single Family Series 128A | | 4.75 | 4-1-2033 | 1,495,000 | 1,639,910 |
| Pennsylvania HFA Special Limited Obligation MFHR Development Episcopal House | | 1.38 | 12-1-2022 | 12,000,000 | 12,108,360 |
| | | | | | 15,094,469 |
| Miscellaneous revenue: 0.68% | | | | | |
| Butler County PA General Authority Hampton Township School District Project Series 2007 (AGM Insured, PNC Bank NA SPA)ø | | 0.13 | 9-1-2027 | 1,560,000 | 1,560,000 |
| Delaware Valley PA Regional Finance Authority Local Government Series B (Ambac Insured) | | 5.70 | 7-1-2027 | 1,780,000 | 2,286,944 |
| Delaware Valley PA Regional Finance Authority Local Government Series C (Ambac Insured) | | 7.75 | 7-1-2027 | 125,000 | 168,400 |
| Delaware Valley Regional Finance Authority Pennsylvania Local Government Series A (Ambac Insured) | | 5.50 | 8-1-2028 | 11,885,000 | 15,514,204 |
| | | | | | 19,529,548 |
| Resource recovery revenue: 0.07% | | | | | |
| Pennsylvania EDFA Solid Waste Disposal Republic Services Incoporated Project Series A øø | | 0.30 | 4-1-2034 | 2,000,000 | 2,000,020 |
| Transportation revenue: 0.12% | | | | | |
| Lancaster PA Guaranteed Parking Authority Series A (BAM Insured) | | 4.00 | 9-1-2027 | 570,000 | 678,887 |
| Lancaster PA Guaranteed Parking Authority Series A (BAM Insured) | | 4.00 | 9-1-2028 | 590,000 | 699,610 |
| Lancaster PA Guaranteed Parking Authority Series A (BAM Insured) | | 4.00 | 9-1-2029 | 410,000 | 483,234 |
The accompanying notes are an integral part of these financial statements.
40 | Wells Fargo Strategic Municipal Bond Fund
Portfolio of investments—December 31, 2020 (unaudited)
| | | Interest
rate | Maturity
date | Principal | Value |
| Transportation revenue (continued) | | | | | |
| Lancaster PA Guaranteed Parking Authority Series A (BAM Insured) | | 4.00% | 9-1-2030 | $ 425,000 | $ 498,699 |
| Lancaster PA Guaranteed Parking Authority Series A (BAM Insured) | | 4.00 | 9-1-2031 | 440,000 | 514,356 |
| Lancaster PA Guaranteed Parking Authority Series A (BAM Insured) | | 4.00 | 9-1-2032 | 460,000 | 535,242 |
| | | | | | 3,410,028 |
| Water & sewer revenue: 0.27% | | | | | |
| Luzerne County PA IDA Refunding Bond AMT Pennsylvania American Water Company Project | | 2.45 | 12-1-2039 | 3,250,000 | 3,594,240 |
| Pittsburgh PA Water & Sewer Authority Series C (SIFMA Municipal Swap+0.65%)(AGM Insured)± | | 0.74 | 9-1-2040 | 4,000,000 | 4,009,680 |
| | | | | | 7,603,920 |
| | | | | | 108,931,744 |
| Puerto Rico: 0.72% | | | | | |
| Water & sewer revenue: 0.72% | | | | | |
| Puerto Rico Commonwealth Aqueduct and Sewer Authority Revenue Refunding Senior Lien Series A 144A | | 4.00 | 7-1-2022 | 5,000,000 | 5,123,900 |
| Puerto Rico Commonwealth Aqueduct and Sewer Authority Revenue Refunding Senior Lien Series A 144A | | 4.00 | 7-1-2023 | 4,000,000 | 4,151,680 |
| Puerto Rico Commonwealth Aqueduct and Sewer Authority Revenue Refunding Senior Lien Series A 144A | | 5.00 | 7-1-2047 | 10,000,000 | 11,250,600 |
| | | | | | 20,526,180 |
| Rhode Island: 0.16% | | | | | |
| GO revenue: 0.09% | | | | | |
| Providence RI Refunding Series A %% | | 5.00 | 1-15-2021 | 160,000 | 160,059 |
| Providence RI Refunding Series A %% | | 5.00 | 1-15-2022 | 300,000 | 313,218 |
| Providence RI Refunding Series A %% | | 5.00 | 1-15-2023 | 425,000 | 461,559 |
| Providence RI Refunding Series A %% | | 5.00 | 1-15-2024 | 400,000 | 450,596 |
| Providence RI Refunding Series A %% | | 5.00 | 1-15-2025 | 450,000 | 524,588 |
| Providence RI Refunding Series A %% | | 5.00 | 1-15-2026 | 450,000 | 540,581 |
| | | | | | 2,450,601 |
| Housing revenue: 0.00% | | | | | |
| Rhode Island Housing & Mortgage Finance | | 6.50 | 4-1-2027 | 15,000 | 15,055 |
| Miscellaneous revenue: 0.07% | | | | | |
| Providence RI RDA Series A | | 5.00 | 4-1-2022 | 1,940,000 | 2,036,515 |
| | | | | | 4,502,171 |
| South Carolina: 0.52% | | | | | |
| Education revenue: 0.02% | | | | | |
| South Carolina Jobs EDA York Preparatory Academy Project Series A | | 5.75 | 11-1-2023 | 425,000 | 443,029 |
| Health revenue: 0.10% | | | | | |
| Greenville Hospital System South Carolina Hospital Refunding | | 5.00 | 5-1-2029 | 2,725,000 | 2,863,893 |
The accompanying notes are an integral part of these financial statements.
Wells Fargo Strategic Municipal Bond Fund | 41
Portfolio of investments—December 31, 2020 (unaudited)
| | | Interest
rate | Maturity
date | Principal | Value |
| Miscellaneous revenue: 0.16% | | | | | |
| Berkeley County SC Assessment Revenue Bonds Nexton Improvement District | | 4.00% | 11-1-2030 | $ 425,000 | $ 462,876 |
| South Carolina Transportation Infrastructure Refunding Bonds Series A | | 5.00 | 10-1-2032 | 4,025,000 | 4,170,021 |
| | | | | | 4,632,897 |
| Resource recovery revenue: 0.11% | | | | | |
| South Carolina Jobs EDA | | 8.00 | 12-6-2029 | 260,000 | 258,180 |
| South Carolina Jobs EDA Solid Waste Disposal RePower South Berkeley LLC 144A | | 5.25 | 2-1-2027 | 3,310,000 | 2,810,885 |
| | | | | | 3,069,065 |
| Utilities revenue: 0.13% | | | | | |
| South Carolina Public Service Authority Revenue Refunding and Improvement Series A | | 5.00 | 12-1-2031 | 2,850,000 | 3,876,456 |
| | | | | | 14,885,340 |
| South Dakota: 0.31% | | | | | |
| Health revenue: 0.31% | | | | | |
| South Dakota HEFA Avera Health Series A | | 5.00 | 7-1-2033 | 7,675,000 | 8,756,561 |
| Tennessee: 0.59% | | | | | |
| Utilities revenue: 0.59% | | | | | |
| Tennessee Energy Acquisition Corporation Gas Project | | 4.00 | 11-1-2049 | 2,210,000 | 2,538,914 |
| Tennessee Energy Acquisition Corporation Series A | | 4.00 | 5-1-2048 | 12,390,000 | 13,329,658 |
| Tennessee Energy Acquisition Corporation Series B | | 5.63 | 9-1-2026 | 925,000 | 1,140,608 |
| | | | | | 17,009,180 |
| Texas: 9.06% | | | | | |
| Airport revenue: 1.60% | | | | | |
| Dallas Fort Worth TX International Airport Improvement Bonds AMT Series H | | 5.00 | 11-1-2032 | 9,175,000 | 9,531,908 |
| Dallas Fort Worth TX International Airport Improvement Bonds AMT Series H | | 5.00 | 11-1-2037 | 22,000,000 | 22,855,800 |
| Dallas Fort Worth TX International Airport Refunding Bonds AMT Series A | | 5.00 | 11-1-2032 | 3,125,000 | 3,460,281 |
| El Paso TX Airport Revenue Refunding El Paso International Airport | | 5.00 | 8-15-2023 | 690,000 | 768,888 |
| El Paso TX Airport Revenue Refunding El Paso International Airport | | 5.00 | 8-15-2024 | 725,000 | 838,890 |
| El Paso TX Airport Revenue Refunding El Paso International Airport | | 5.00 | 8-15-2027 | 835,000 | 1,051,273 |
| El Paso TX Airport Revenue Refunding El Paso International Airport | | 5.00 | 8-15-2028 | 880,000 | 1,131,152 |
| El Paso TX Airport Revenue Refunding El Paso International Airport | | 5.00 | 8-15-2029 | 920,000 | 1,203,875 |
| El Paso TX Airport Revenue Refunding El Paso International Airport | | 5.00 | 8-15-2030 | 970,000 | 1,293,126 |
| Galveston TX Wharves & Terminal Refunding Bonds | | 4.63 | 2-1-2024 | 755,000 | 755,695 |
| Houston TX Airport System Subordinate Refunding Bonds AMT Series A | | 5.00 | 7-1-2031 | 2,750,000 | 2,936,313 |
| | | | | | 45,827,201 |
The accompanying notes are an integral part of these financial statements.
42 | Wells Fargo Strategic Municipal Bond Fund
Portfolio of investments—December 31, 2020 (unaudited)
| | | Interest
rate | Maturity
date | Principal | Value |
| Education revenue: 1.01% | | | | | |
| Alamo TX Community College District Various Financing System | | 1.70% | 11-1-2042 | $ 1,265,000 | $ 1,268,441 |
| Arlington TX Higher Education Finance Corporate Education Series A | | 4.00 | 6-15-2026 | 530,000 | 533,318 |
| Austin TX Community College District Series A | | 4.00 | 2-1-2023 | 320,000 | 344,307 |
| Clifton TX Higher Education Finance Corporation Education Revenue International Leadership Texas Series A | | 6.00 | 3-1-2029 | 2,150,000 | 2,363,323 |
| Clifton TX Higher Education Finance Corporation International Leadership Series 2015A | | 4.63 | 8-15-2025 | 8,610,000 | 9,341,420 |
| Clifton TX Higher Education Finance Corporation Uplift Education Series 2018D | | 5.00 | 8-15-2025 | 6,565,000 | 7,613,496 |
| Clifton TX Higher Education Finance Corporation Uplift Education Series A | | 4.00 | 12-1-2025 | 2,410,000 | 2,555,058 |
| New Hope TX Cultural Education Facilities Finance Corporation Education Revenue Cumberland Academy Series A 144A | | 4.00 | 8-15-2030 | 1,735,000 | 1,812,190 |
| New Hope TX Cultural Education Facilities Finance Corporation Jubilee Academic Center 144A | | 3.38 | 8-15-2021 | 550,000 | 553,124 |
| Newark TX Higher Educational Finance Corporation Charter Schools Incorporated Series 2015 A 144A | | 4.63 | 8-15-2025 | 1,160,000 | 1,246,014 |
| Texas PFA Southern University Financing System (BAM Insured) | | 5.00 | 11-1-2021 | 1,275,000 | 1,315,252 |
| | | | | | 28,945,943 |
| GO revenue: 3.15% | | | | | |
| Brazosporight TX Independent School District School Building Series A | | 4.00 | 2-15-2029 | 2,355,000 | 2,830,922 |
| Denton TX Independent School District Refunding Bonds Series B | | 5.00 | 8-15-2032 | 5,000,000 | 5,390,050 |
| Grapevine Colleyville TX Independent School Building | | 5.00 | 8-15-2034 | 2,890,000 | 3,455,631 |
| Grapevine Colleyville TX Independent School Building | | 5.00 | 8-15-2035 | 1,600,000 | 1,909,936 |
| Houston TX Public Improvement Refunding Bonds Series A | | 4.00 | 3-1-2031 | 10,110,000 | 11,128,785 |
| Leander TX Independent School District CAB Bonds Series 2014C ¤ | | 0.00 | 8-15-2035 | 2,975,000 | 1,695,423 |
| Northside TX Independent School District School Building Bond Series 2018 | | 2.75 | 8-1-2048 | 11,275,000 | 11,931,318 |
| Northwest Texas Independent School District Refunding Bonds | | 5.00 | 2-15-2032 | 1,750,000 | 2,086,595 |
| Texas State College Student Loan | | 4.00 | 8-1-2032 | 1,500,000 | 1,846,995 |
| Texas Transportation Commission Mobility Fund Refunding Bonds Series A | | 5.00 | 10-1-2030 | 40,760,000 | 48,010,796 |
| | | | | | 90,286,451 |
| Health revenue: 0.29% | | | | | |
| Harris County TX Cultural Education Facilities Finance Corporation Revenue Texas Medical Center Series A | | 0.90 | 5-15-2050 | 1,500,000 | 1,502,055 |
| Mesquite TX Health Facilities Development Corporation Christian Care Centers Incorporated Project Series 2016 | | 5.00 | 2-15-2021 | 560,000 | 559,714 |
| New Hope TX Cultural Education Facilities Finance Corporation Hospital Series 2017A | | 5.00 | 8-15-2024 | 1,000,000 | 1,162,150 |
| New Hope TX Cultural Education Facilities Finance Corporation Hospital Series 2017A | | 5.00 | 8-15-2026 | 2,000,000 | 2,483,900 |
The accompanying notes are an integral part of these financial statements.
Wells Fargo Strategic Municipal Bond Fund | 43
Portfolio of investments—December 31, 2020 (unaudited)
| | | Interest
rate | Maturity
date | Principal | Value |
| Health revenue (continued) | | | | | |
| New Hope TX Cultural Education Facilities Finance Corporation Presbyterian Village North Project | | 5.00% | 10-1-2023 | $ 1,570,000 | $ 1,644,308 |
| Tarrant County TX Cultural Education Facilities Finance Corporation Retirement Facility Revenue MRC Stevenson Oaks Project | | 3.00 | 11-15-2026 | 1,000,000 | 1,009,180 |
| | | | | | 8,361,307 |
| Housing revenue: 0.13% | | | | | |
| New Hope TX Cultural Education Facilities Finance Corporation Student Housing Tarleton State University Project | | 5.38 | 4-1-2028 | 1,845,000 | 2,026,696 |
| New Hope TX ECFA Collegiate Housing Tarleton State University Series A | | 4.00 | 4-1-2021 | 310,000 | 312,669 |
| New Hope TX ECFA Collegiate Housing Tarleton State University Series A | | 4.00 | 4-1-2022 | 870,000 | 908,106 |
| New Hope TX ECFA Collegiate Housing Tarleton State University Series A | | 5.00 | 4-1-2025 | 480,000 | 569,371 |
| | | | | | 3,816,842 |
| Industrial development revenue: 0.02% | | | | | |
| Austin Convention Enterprises Incorporated Series 2017B | | 5.00 | 1-1-2021 | 500,000 | 500,000 |
| Miscellaneous revenue: 0.47% | | | | | |
| Houston TX Airport System Revenue Refunding AMT Special Facilities United | | 5.00 | 7-1-2027 | 1,750,000 | 1,963,360 |
| Lewisville TX Combination Contract Revenue Special Assessment Bonds Utility System 144A | | 8.00 | 9-1-2039 | 1,775,000 | 1,817,831 |
| Lewisville TX Combination Contract Revenue Special Assessment Bonds Utility System 144A | | 8.00 | 9-1-2039 | 1,895,000 | 1,940,726 |
| Lower Colorado River Authority Texas Transmission Contract LCRA Transmission Services Corporation | | 5.00 | 5-15-2028 | 1,845,000 | 2,119,112 |
| Texas Transportation Commission Highway Improvement | | 5.00 | 4-1-2027 | 3,010,000 | 3,476,189 |
| Wood Glen TX Housing Finance Corporation Mortgage Copperwood Project Series A (National/FHA Insured) | | 7.65 | 7-1-2022 | 2,125,000 | 2,269,755 |
| | | | | | 13,586,973 |
| Resource recovery revenue: 0.71% | | | | | |
| Mission TX Economic Development Corporation Republic Services Incorporated Project | | 0.30 | 1-1-2026 | 10,000,000 | 9,999,900 |
| Port Arthur TX Navigation District Jefferson County Environmental Facilities Motiva Enterprises LLC Project Series B ø | | 0.17 | 4-1-2040 | 5,000,000 | 5,000,000 |
| Port Arthur TX Navigation District Jefferson County Environmental Facilities Motiva Enterprises LLC Project Series C ø | | 0.18 | 4-1-2040 | 5,365,000 | 5,365,000 |
| | | | | | 20,364,900 |
| Transportation revenue: 0.60% | | | | | |
| Central Texas Regional Mobility Authority Revenue Subordinated Lien BAN Series F | | 5.00 | 1-1-2025 | 2,000,000 | 2,298,880 |
| Central Texas Regional Mobility Authority Senior Lien Series A | | 5.00 | 1-1-2021 | 1,000,000 | 1,000,000 |
| Central Texas Regional Mobility Authority Senior Lien Series A | | 5.00 | 1-1-2023 | 500,000 | 544,890 |
The accompanying notes are an integral part of these financial statements.
44 | Wells Fargo Strategic Municipal Bond Fund
Portfolio of investments—December 31, 2020 (unaudited)
| | | Interest
rate | Maturity
date | Principal | Value |
| Transportation revenue (continued) | | | | | |
| RBC Municipal Products Incorporated Trust Floaters Series E-145 (Royal Bank of Canada LOC, Royal Bank of Canada LIQ)144Aø | | 0.12% | 9-8-2021 | $ 7,000,000 | $ 7,000,000 |
| Texas Private Activity Bond Surface Transportation Corporation Senior Lien Revenue Refunding Notes Mobility | | 5.00 | 12-31-2030 | 1,000,000 | 1,302,670 |
| Texas Private Activity Bond Surface Transportation Corporation Senior Lien Revenue Refunding Notes Mobility | | 5.00 | 12-31-2032 | 1,000,000 | 1,287,100 |
| Texas Private Activity Bond Surface Transportation Corporation Senior Lien Revenue Refunding Notes Mobility | | 5.00 | 12-31-2033 | 3,000,000 | 3,849,180 |
| | | | | | 17,282,720 |
| Utilities revenue: 0.38% | | | | | |
| San Antonio TX Electric & Gas Revenue Various Refunding Bond Junior Lien Series 2020 | | 1.75 | 2-1-2049 | 4,250,000 | 4,474,018 |
| San Antonio TX Electric & Gas Systems Junior Lien Refunding Bond Series 2018 | | 2.75 | 2-1-2048 | 6,000,000 | 6,286,140 |
| | | | | | 10,760,158 |
| Water & sewer revenue: 0.70% | | | | | |
| Dallas TX Waterworks Refunding Bonds Series A | | 5.00 | 10-1-2029 | 16,225,000 | 20,175,788 |
| | | | | | 259,908,283 |
| Utah: 0.20% | | | | | |
| Airport revenue: 0.16% | | | | | |
| Salt Lake City UT Airport Revenue Bonds AMT Series 2018A | | 5.00 | 7-1-2029 | 1,000,000 | 1,254,910 |
| Salt Lake City UT Airport Revenue Bonds AMT Series 2018A | | 5.00 | 7-1-2031 | 2,705,000 | 3,363,154 |
| | | | | | 4,618,064 |
| Education revenue: 0.04% | | | | | |
| Utah Charter School Finance Authority Ronald Wilson Reagan Academy Project Series A 144A | | 3.50 | 2-15-2026 | 1,215,000 | 1,228,146 |
| | | | | | 5,846,210 |
| Vermont: 0.20% | | | | | |
| Education revenue: 0.13% | | | | | |
| Vermont Student Assistance Corporation Series A | | 5.00 | 6-15-2021 | 1,800,000 | 1,835,658 |
| Vermont Student Assistance Corporation Series A | | 5.00 | 6-15-2022 | 550,000 | 584,645 |
| Vermont Student Assistance Corporation Series A | | 5.00 | 6-15-2023 | 1,200,000 | 1,324,596 |
| | | | | | 3,744,899 |
| Housing revenue: 0.07% | | | | | |
| Vermont Housing Finance Agency Multiple Purpose Series A (GNMA/FNMA/FHLMC Insured) | | 3.75 | 11-1-2050 | 1,815,000 | 2,031,965 |
| | | | | | 5,776,864 |
The accompanying notes are an integral part of these financial statements.
Wells Fargo Strategic Municipal Bond Fund | 45
Portfolio of investments—December 31, 2020 (unaudited)
| | | Interest
rate | Maturity
date | Principal | Value |
| Virginia: 1.78% | | | | | |
| Health revenue: 0.20% | | | | | |
| Mizuho Tender Option Bond Trust Receipts/Floater Certificates Series 2020-MIZ9025 (Mizuho Capital Markets LLC LOC, Mizuho Capital Markets LLC LIQ)144Aø | | 0.17% | 11-1-2035 | $ 4,830,000 | $ 4,830,000 |
| Roanoke VA Economic Development Authority Residential Care Facility Revenue Richfield Living | | 4.30 | 9-1-2030 | 770,000 | 762,169 |
| | | | | | 5,592,169 |
| Miscellaneous revenue: 0.25% | | | | | |
| Westmoreland County VA IDA Lease BAN High School Project | | 2.00 | 6-1-2022 | 7,000,000 | 7,110,740 |
| Transportation revenue: 1.00% | | | | | |
| Chesapeake VA Bay Bridge & Tunnel District First Tier Generation Resolution | | 5.00 | 11-1-2023 | 20,000,000 | 22,353,400 |
| Toll Road Investors Partnership II LP Series 1999B (National Public Finance Guaranty Insured)144A¤ | | 0.00 | 2-15-2029 | 10,000,000 | 6,477,953 |
| | | | | | 28,831,353 |
| Utilities revenue: 0.33% | | | | | |
| Chesapeake VA EDA Poll Control Electric & Power Company Series 2008A | | 1.90 | 2-1-2032 | 4,250,000 | 4,403,893 |
| Wise County VA IDA Solid Waste and Sewage Disposal Revenue Virginia Electric and Power Company Project Series A | | 0.75 | 10-1-2040 | 5,000,000 | 5,047,550 |
| | | | | | 9,451,443 |
| | | | | | 50,985,705 |
| Washington: 1.61% | | | | | |
| Airport revenue: 0.07% | | | | | |
| Port of Seattle WA Intermediate Lien Revenue Bonds AMT Series 2018A | | 5.00 | 5-1-2036 | 1,710,000 | 2,043,878 |
| GO revenue: 0.22% | | | | | |
| Washington State Refunding Bonds Motor Vehicle Fuel Tax %% | | 5.00 | 6-1-2027 | 1,120,000 | 1,428,235 |
| Washington State Refunding Bonds Motor Vehicle Fuel Tax %% | | 5.00 | 6-1-2028 | 1,500,000 | 1,964,415 |
| Washington State Refunding Bonds Motor Vehicle Fuel Tax %% | | 5.00 | 6-1-2029 | 1,000,000 | 1,339,730 |
| Washington State Refunding Bonds Motor Vehicle Fuel Tax %% | | 5.00 | 6-1-2030 | 1,150,000 | 1,572,349 |
| | | | | | 6,304,729 |
| Health revenue: 0.92% | | | | | |
| Skagit County WA Public Hospital District Refunding and Improvement Skagit Regional Health | | 5.00 | 12-1-2029 | 3,975,000 | 4,663,868 |
| Washington HCFR Catholic Health Initiatives Series B (SIFMA Municipal Swap+1.40%)± | | 1.49 | 1-1-2035 | 11,000,000 | 10,903,640 |
| Washington Health Care Facilities Authority Commonspirit Health Series B3 | | 5.00 | 8-1-2049 | 3,000,000 | 3,625,500 |
The accompanying notes are an integral part of these financial statements.
46 | Wells Fargo Strategic Municipal Bond Fund
Portfolio of investments—December 31, 2020 (unaudited)
| | | Interest
rate | Maturity
date | Principal | Value |
| Health revenue (continued) | | | | | |
| Washington Health Care Facilities Authority Fred Hutchinson Cancer Research (1 Month LIBOR+1.10%)± | | 1.20% | 1-1-2042 | $ 6,150,000 | $ 6,172,079 |
| Washington Housing Finance Commission Nonprofit Housing Revenue Rockwood Retirement Communities 144A | | 3.00 | 7-1-2027 | 1,000,000 | 1,007,320 |
| | | | | | 26,372,407 |
| Housing revenue: 0.40% | | | | | |
| Snohomish County WA Housing Authority | | 5.00 | 4-1-2027 | 1,130,000 | 1,397,528 |
| Snohomish County WA Housing Authority | | 5.00 | 4-1-2028 | 1,610,000 | 2,032,223 |
| Snohomish County WA Housing Authority | | 5.00 | 4-1-2029 | 1,690,000 | 2,174,455 |
| Washington Housing Finance Commission Downtowner Apartments Project (FHLMC LIQ) | | 3.70 | 7-1-2030 | 5,000,000 | 5,783,050 |
| | | | | | 11,387,256 |
| | | | | | 46,108,270 |
| West Virginia: 0.43% | | | | | |
| Education revenue: 0.04% | | | | | |
| West Virginia University Revenues Refunding West Virginia University Projects Series B | | 5.00 | 10-1-2041 | 1,000,000 | 1,286,490 |
| Miscellaneous revenue: 0.08% | | | | | |
| Roane County WV Building Commission Lease BAN Roane General Hospital | | 2.55 | 11-1-2021 | 2,250,000 | 2,252,768 |
| Tax revenue: 0.11% | | | | | |
| Monongalia County WV Commission Special District University Town Center Series A 144A | | 4.50 | 6-1-2027 | 3,105,000 | 3,254,164 |
| Utilities revenue: 0.20% | | | | | |
| West Virginia EDA Solid Waste Disposal Facilities Wheeling Power Company Mitchell Project Series A | | 3.00 | 6-1-2037 | 5,450,000 | 5,604,508 |
| | | | | | 12,397,930 |
| Wisconsin: 2.99% | | | | | |
| Airport revenue: 0.03% | | | | | |
| Wisconsin PFA Airport Series C | | 5.00 | 7-1-2022 | 905,000 | 944,304 |
| Education revenue: 0.21% | | | | | |
| Corvian County WI Community School Revenue 144A | | 4.25 | 6-15-2029 | 1,015,000 | 1,038,162 |
| Milwaukee WI RDA Science Education Consortium Incorporated Project Series A | | 4.75 | 8-1-2023 | 640,000 | 673,421 |
| PFA Wisconsin Charter School Revenue American Preparatory Academy 144A | | 4.00 | 7-15-2029 | 650,000 | 682,221 |
| PFA Wisconsin Education Revenue Corvian Community School Series A 144A | | 4.00 | 6-15-2029 | 965,000 | 986,790 |
| Pine Lake WI PFA Preparatory Series 2015 144A | | 4.35 | 3-1-2025 | 1,805,000 | 1,874,890 |
| Wisconsin PFA Roseman University of Health Sciences Project Series 2012 | | 5.00 | 4-1-2022 | 630,000 | 643,747 |
| | | | | | 5,899,231 |
| GO revenue: 0.89% | | | | | |
| Eau Claire WI Area School District Refunding Bonds | | 5.00 | 4-1-2022 | 1,245,000 | 1,318,741 |
The accompanying notes are an integral part of these financial statements.
Wells Fargo Strategic Municipal Bond Fund | 47
Portfolio of investments—December 31, 2020 (unaudited)
| | | Interest
rate | Maturity
date | Principal | Value |
| GO revenue (continued) | | | | | |
| Eau Claire WI Area School District Refunding Bonds | | 5.00% | 4-1-2023 | $ 1,860,000 | $ 2,053,012 |
| Eau Claire WI Area School District Refunding Bonds | | 5.00 | 4-1-2024 | 1,000,000 | 1,148,830 |
| Wisconsin State Series B | | 5.00 | 5-1-2031 | 12,230,000 | 15,040,821 |
| Wisconsin State Series B | | 5.00 | 5-1-2034 | 5,000,000 | 5,912,350 |
| | | | | | 25,473,754 |
| Health revenue: 0.53% | | | | | |
| Wisconsin HEFA Ascension Health Credit Group Series A | | 4.00 | 11-15-2034 | 2,000,000 | 2,295,140 |
| Wisconsin HEFA Bellin Memorial Hospital Series 2015 | | 5.00 | 12-1-2022 | 755,000 | 818,299 |
| Wisconsin HEFA Beloit Health System Incorporated | | 5.00 | 7-1-2027 | 1,145,000 | 1,435,750 |
| Wisconsin HEFA Beloit Health System Incorporated | | 5.00 | 7-1-2028 | 600,000 | 767,238 |
| Wisconsin HEFA Marshfield Clinic Health System Incorporated | | 5.00 | 2-15-2052 | 3,000,000 | 3,451,500 |
| Wisconsin HEFA St. Camillus Health System Incorporated | | 5.00 | 11-1-2027 | 375,000 | 412,920 |
| Wisconsin HEFA St. Camillus Health System Incorporated | | 5.00 | 11-1-2028 | 470,000 | 519,891 |
| Wisconsin HEFA Temps 50 St. Camillus Health System Incorporated | | 2.25 | 11-1-2026 | 4,000,000 | 3,999,960 |
| Wisconsin PFA Bancroft Neurohealth Project Series A 144A | | 4.00 | 6-1-2021 | 1,370,000 | 1,379,371 |
| | | | | | 15,080,069 |
| Industrial development revenue: 0.05% | | | | | |
| Appleton WI Recovery Zone Facilities Foremost Farms Project Series 2010 (CoBank ACB LOC)ø | | 0.12 | 5-1-2037 | 1,500,000 | 1,500,000 |
| Miscellaneous revenue: 0.20% | | | | | |
| Monona WI Anticipation Notes Series D | | 3.63 | 9-1-2022 | 1,925,000 | 1,928,927 |
| Wisconsin State Series 2 | | 5.00 | 11-1-2029 | 3,000,000 | 3,701,880 |
| | | | | | 5,630,807 |
| Resource recovery revenue: 0.38% | | | | | |
| Wisconsin PFA Series A-2 | | 0.30 | 10-1-2025 | 11,000,000 | 11,000,110 |
| Tax revenue: 0.63% | | | | | |
| Wisconsin Center District WI Tax Revenue Capital Appreciation Junior Dedicated Series D ¤ | | 0.00 | 12-15-2028 | 260,000 | 231,863 |
| Wisconsin Center District WI Tax Revenue Capital Appreciation Junior Dedicated Series D ¤ | | 0.00 | 12-15-2029 | 390,000 | 338,220 |
| Wisconsin Center District WI Tax Revenue Capital Appreciation Junior Dedicated Series D ¤ | | 0.00 | 12-15-2030 | 550,000 | 464,255 |
| Wisconsin Center District WI Tax Revenue Capital Appreciation Senior Dedicated Series C (AGM Insured)¤ | | 0.00 | 12-15-2029 | 1,050,000 | 910,592 |
| Wisconsin Center District WI Tax Revenue Capital Appreciation Senior Dedicated Series C (AGM Insured)¤ | | 0.00 | 12-15-2031 | 1,350,000 | 1,097,550 |
| Wisconsin State General Fund Annual Appropriations Series A | | 5.00 | 5-1-2028 | 11,775,000 | 15,006,178 |
| | | | | | 18,048,658 |
The accompanying notes are an integral part of these financial statements.
48 | Wells Fargo Strategic Municipal Bond Fund
Portfolio of investments—December 31, 2020 (unaudited)
| | | Interest
rate | Maturity
date | Principal | Value |
| Water & sewer revenue: 0.07% | | | | | |
| Wisconsin Clean Water Refunding Bonds Series 2012 | | 5.00% | 6-1-2023 | $ 310,000 | $ 345,532 |
| Wisconsin Clean Water Refunding Bonds Series 2015 | | 5.00 | 6-1-2026 | 1,525,000 | 1,770,479 |
| | | | | | 2,116,011 |
| | | | | | 85,692,944 |
| Total Municipal obligations (Cost $2,667,177,562) | | | | | 2,778,261,570 |
| | | Yield | | Shares | |
| Short-term investments: 2.16% | | | | | |
| Investment companies: 2.16% | | | | | |
| Wells Fargo Municipal Cash Management Money Market Fund Institutional Class ♠∞## | | 0.01% | | 62,098,296 | 62,116,925 |
| Total Short-term investments (Cost $62,116,179) | | | | | 62,116,925 |
| Total investments in securities (Cost $2,749,293,741) | 99.68% | | | | 2,860,378,495 |
| Other assets and liabilities, net | 0.32 | | | | 9,200,604 |
| Total net assets | 100.00% | | | | $ 2,869,579,099 |
| 144A | The security may be resold in transactions exempt from registration, normally to qualified institutional buyers, pursuant to Rule 144A under the Securities Act of 1933. |
| ø | Variable rate demand notes are subject to a demand feature which reduces the effective maturity. The maturity date shown represents the final maturity date of the security. The interest rate is determined and reset by the issuer daily, weekly, or monthly depending upon the terms of the security. The rate shown is the rate in effect at period end. |
| ± | Variable rate investment. The rate shown is the rate in effect at period end. |
| € | The security is an auction-rate security which has an interest rate that resets at predetermined short-term intervals through a Dutch auction. The rate shown is the rate in effect at period end. |
| ¤ | The security is issued in zero coupon form with no periodic interest payments. |
| øø | The interest rate is determined and reset by the issuer periodically depending upon the terms of the security. The rate shown is the rate in effect at period end. |
| ## | All or a portion of this security is segregated for when-issued securities. |
| ♠ | The issuer of the security is an affiliated person of the Fund as defined in the Investment Company Act of 1940. |
| ∞ | The rate represents the 7-day annualized yield at period end. |
| %% | The security is purchased on a when-issued basis. |
The accompanying notes are an integral part of these financial statements.
Wells Fargo Strategic Municipal Bond Fund | 49
Portfolio of investments—December 31, 2020 (unaudited)
| Abbreviations: |
| AGC | Assured Guaranty Corporation |
| AGM | Assured Guaranty Municipal |
| Ambac | Ambac Financial Group Incorporated |
| AMT | Alternative minimum tax |
| BAM | Build America Mutual Assurance Company |
| BAN | Bond anticipation notes |
| CAB | Capital appreciation bond |
| CDA | Community Development Authority |
| ECFA | Educational & Cultural Facilities Authority |
| EDA | Economic Development Authority |
| EDFA | Economic Development Finance Authority |
| FHA | Federal Housing Administration |
| FHLMC | Federal Home Loan Mortgage Corporation |
| GO | General obligation |
| HCFR | Healthcare facilities revenue |
| HEFA | Health & Educational Facilities Authority |
| HEFAR | Higher Education Facilities Authority Revenue |
| HFA | Housing Finance Authority |
| HFFA | Health Facilities Financing Authority |
| IDA | Industrial Development Authority |
| LIBOR | London Interbank Offered Rate |
| LIQ | Liquidity agreement |
| LOC | Letter of credit |
| MFHR | Multifamily housing revenue |
| National | National Public Finance Guarantee Corporation |
| PCFA | Pollution Control Financing Authority |
| PFA | Public Finance Authority |
| RDA | Redevelopment Authority |
| SIFMA | Securities Industry and Financial Markets Association |
| SPA | Standby purchase agreement |
| TTFA | Transportation Trust Fund Authority |
Investments in affiliates
An affiliated investment is an investment in which the Fund owns at least 5% of the outstanding voting shares of the issuer or as a result of other relationships, such as the Fund and the issuer having the same investment manager. Transactions with issuers that were either affiliated persons of the Fund at the beginning of the period or the end of the period were as follows:
| | Value,
beginning of
period | Purchases | Sales
proceeds | Net
realized
gains
(losses) | Net
change in
unrealized
gains
(losses) | Value,
end of
period | % of
net
assets | Shares,
end
of period | Income
from
affiliated
securities |
| Short-term investments | | | | | | | | | |
| Investment companies | | | | | | | | | |
| Wells Fargo Municipal Cash Management Money Market Fund Institutional Class | $22,727,227 | $498,167,447 | $(458,781,437) | $5,612 | $(1,924) | $62,116,925 | 2.16% | 62,098,296 | $4,626 |
The accompanying notes are an integral part of these financial statements.
50 | Wells Fargo Strategic Municipal Bond Fund
Statement of assets and liabilities—December 31, 2020 (unaudited)
| | |
| Assets | |
Investments in unaffiliated securities, at value (cost $2,687,177,562)
| $ 2,798,261,570 |
Investments in affiliated securites, at value (cost $62,116,179)
| 62,116,925 |
Cash
| 84,500 |
Cash due from broker
| 60,009 |
Receivable for interest
| 25,434,279 |
Receivable for Fund shares sold
| 9,850,608 |
Receivable for investments sold
| 2,155,000 |
Prepaid expenses and other assets
| 124,095 |
Total assets
| 2,898,086,986 |
| Liabilities | |
Payable for when-issued transactions
| 15,503,568 |
Payable for investments purchased
| 6,389,096 |
Payable for Fund shares redeemed
| 4,139,052 |
Management fee payable
| 962,944 |
Dividends payable
| 944,611 |
Administration fees payable
| 262,956 |
Distribution fee payable
| 40,880 |
Trustees’ fees and expenses payable
| 2,187 |
Accrued expenses and other liabilities
| 262,593 |
Total liabilities
| 28,507,887 |
Total net assets
| $2,869,579,099 |
| Net assets consist of | |
Paid-in capital
| $ 2,769,823,488 |
Total distributable earnings
| 99,755,611 |
Total net assets
| $2,869,579,099 |
| Computation of net asset value and offering price per share | |
Net assets – Class A
| $ 596,471,584 |
Shares outstanding – Class A1
| 64,047,424 |
Net asset value per share – Class A
| $9.31 |
Maximum offering price per share – Class A2
| $9.70 |
Net assets – Class C
| $ 58,705,671 |
Shares outstanding – Class C1
| 6,282,065 |
Net asset value per share – Class C
| $9.34 |
Net assets – Class R6
| $ 21,342,087 |
Shares outstanding – Class R61
| 2,291,499 |
Net asset value per share – Class R6
| $9.31 |
Net assets – Administrator Class
| $ 116,727,872 |
Shares outstanding – Administrator Class1
| 12,541,497 |
Net asset value per share – Administrator Class
| $9.31 |
Net assets – Institutional Class
| $ 2,076,331,885 |
Shares outstanding – Institutional Class1
| 223,006,278 |
Net asset value per share – Institutional Class
| $9.31 |
| 1 | The Fund has an unlimited number of authorized shares |
| 2 | Maximum offering price is computed as 100/96 of net asset value. On investments of $50,000 or more, the offering price is reduced. |
The accompanying notes are an integral part of these financial statements.
Wells Fargo Strategic Municipal Bond Fund | 51
Statement of operations—six months ended December 31, 2020 (unaudited)
| | |
| Investment income | |
Interest
| $ 32,735,019 |
Income from affiliated securities
| 4,626 |
Total investment income
| 32,739,645 |
| Expenses | |
Management fee
| 5,142,453 |
| Administration fees | |
Class A
| 468,623 |
Class C
| 52,618 |
Class R6
| 3,261 |
Administrator Class
| 61,095 |
Institutional Class
| 813,312 |
| Shareholder servicing fees | |
Class A
| 731,740 |
Class C
| 82,127 |
Administrator Class
| 152,062 |
| Distribution fee | |
Class C
| 246,380 |
Custody and accounting fees
| 56,106 |
Professional fees
| 35,107 |
Registration fees
| 98,209 |
Shareholder report expenses
| 43,861 |
Trustees’ fees and expenses
| 9,874 |
Other fees and expenses
| 28,932 |
Total expenses
| 8,025,760 |
| Less: Fee waivers and/or expense reimbursements | |
Fund-level
| (15,867) |
Class A
| (773) |
Administrator Class
| (15,867) |
Net expenses
| 7,993,253 |
Net investment income
| 24,746,392 |
| Realized and unrealized gains (losses) on investments | |
| Net realized gains (losses) on | |
Unaffiliated securities
| (401,094) |
Affiliated securities
| 5,612 |
Futures contracts
| 4,499 |
Net realized losses on investments
| (390,983) |
| Net change in unrealized gains (losses) on | |
Unaffiliated securities
| 42,803,962 |
Affiliated securities
| (1,924) |
Futures contracts
| 15,740 |
Net change in unrealized gains (losses) on investments
| 42,817,778 |
Net realized and unrealized gains (losses) on investments
| 42,426,795 |
Net increase in net assets resulting from operations
| $67,173,187 |
The accompanying notes are an integral part of these financial statements.
52 | Wells Fargo Strategic Municipal Bond Fund
Statement of changes in net assets
| | |
| | Six months ended
December 31, 2020
(unaudited) | Year ended
June 30, 2020 |
| Operations | | | | |
Net investment income
| | $ 24,746,392 | | $ 51,940,887 |
Net realized losses on investments
| | (390,983) | | (10,576,238) |
Net change in unrealized gains (losses) on investments
| | 42,817,778 | | 12,244,799 |
Net increase in net assets resulting from operations
| | 67,173,187 | | 53,609,448 |
| Distributions to shareholders from | | | | |
| Net investment income and net realized gains | | | | |
Class A
| | (4,522,553) | | (10,397,610) |
Class C
| | (262,699) | | (857,859) |
Class R6
| | (209,041) | | (365,000) |
Administrator Class
| | (1,012,829) | | (2,747,561) |
Institutional Class
| | (19,035,147) | | (39,466,814) |
Total distributions to shareholders
| | (25,042,269) | | (53,834,844) |
| Capital share transactions | Shares | | Shares | |
| Proceeds from shares sold | | | | |
Class A
| 11,000,438 | 101,815,986 | 18,849,916 | 172,905,977 |
Class C
| 845,784 | 7,853,567 | 1,396,675 | 12,877,889 |
Class R6
| 347,599 | 3,210,982 | 2,389,745 | 21,930,358 |
Administrator Class
| 2,366,597 | 21,883,714 | 2,699,164 | 24,742,963 |
Institutional Class
| 58,593,309 | 541,830,045 | 93,352,999 | 853,335,830 |
| | | 676,594,294 | | 1,085,793,017 |
| Reinvestment of distributions | | | | |
Class A
| 434,191 | 4,021,322 | 1,035,246 | 9,479,576 |
Class C
| 25,138 | 233,566 | 79,915 | 734,143 |
Class R6
| 9,597 | 88,880 | 11,437 | 104,320 |
Administrator Class
| 104,613 | 968,134 | 292,011 | 2,673,202 |
Institutional Class
| 1,720,122 | 15,925,848 | 3,591,282 | 32,877,993 |
| | | 21,237,750 | | 45,869,234 |
| Payment for shares redeemed | | | | |
Class A
| (6,889,785) | (63,748,826) | (18,134,239) | (164,712,253) |
Class C
| (2,138,370) | (19,836,475) | (2,900,830) | (26,634,023) |
Class R6
| (296,379) | (2,745,601) | (1,623,820) | (14,770,396) |
Administrator Class
| (2,573,890) | (23,811,333) | (6,663,826) | (60,284,872) |
Institutional Class
| (36,840,030) | (341,098,729) | (77,609,421) | (703,994,181) |
| | | (451,240,964) | | (970,395,725) |
Net increase in net assets resulting from capital share transactions
| | 246,591,080 | | 161,266,526 |
Total increase in net assets
| | 288,721,998 | | 161,041,130 |
| Net assets | | | | |
Beginning of period
| | 2,580,857,101 | | 2,419,815,971 |
End of period
| | $2,869,579,099 | | $2,580,857,101 |
The accompanying notes are an integral part of these financial statements.
Wells Fargo Strategic Municipal Bond Fund | 53
Financial highlights
(For a share outstanding throughout each period)
| | | Year ended June 30 |
| Class A | Six months ended
December 31, 2020
(unaudited) | 2020 | 2019 | 2018 | 2017 | 2016 |
Net asset value, beginning of period
| $9.17 | $9.14 | $8.93 | $8.94 | $9.06 | $8.90 |
Net investment income
| 0.07 | 0.17 | 0.18 | 0.15 | 0.13 | 0.14 |
Net realized and unrealized gains (losses) on investments
| 0.14 | 0.03 | 0.21 | 0.01 | (0.07) | 0.18 |
Total from investment operations
| 0.21 | 0.20 | 0.39 | 0.16 | 0.06 | 0.32 |
| Distributions to shareholders from | | | | | | |
Net investment income
| (0.07) | (0.16) | (0.18) | (0.15) | (0.13) | (0.14) |
Net realized gains
| 0.00 | (0.01) | 0.00 | (0.02) | (0.05) | (0.02) |
Total distributions to shareholders
| (0.07) | (0.17) | (0.18) | (0.17) | (0.18) | (0.16) |
Net asset value, end of period
| $9.31 | $9.17 | $9.14 | $8.93 | $8.94 | $9.06 |
Total return1
| 2.32% | 2.23% | 4.41% | 1.82% | 0.65% | 3.67% |
| Ratios to average net assets (annualized) | | | | | | |
Gross expenses
| 0.79% | 0.79% | 0.80% | 0.82% | 0.81% | 0.81% |
Net expenses
| 0.79% | 0.79% | 0.80% | 0.82% | 0.81% | 0.81% |
Net investment income
| 1.52% | 1.81% | 1.99% | 1.69% | 1.45% | 1.53% |
| Supplemental data | | | | | | |
Portfolio turnover rate
| 14% | 26% | 29% | 33% | 31% | 53% |
Net assets, end of period (000s omitted)
| $596,472 | $545,670 | $528,004 | $491,128 | $550,965 | $726,135 |
| 1 | Total return calculations do not include any sales charges. Returns for periods of less than one year are not annualized. |
The accompanying notes are an integral part of these financial statements.
54 | Wells Fargo Strategic Municipal Bond Fund
Financial highlights
(For a share outstanding throughout each period)
| | | Year ended June 30 |
| Class C | Six months ended
December 31, 2020
(unaudited) | 2020 | 2019 | 2018 | 2017 | 2016 |
Net asset value, beginning of period
| $9.20 | $9.17 | $8.96 | $8.97 | $9.09 | $8.94 |
Net investment income
| 0.04 | 0.10 | 0.11 1 | 0.08 1 | 0.07 | 0.07 |
Net realized and unrealized gains (losses) on investments
| 0.14 | 0.04 | 0.21 | 0.01 | (0.07) | 0.17 |
Total from investment operations
| 0.18 | 0.14 | 0.32 | 0.09 | 0.00 | 0.24 |
| Distributions to shareholders from | | | | | | |
Net investment income
| (0.04) | (0.10) | (0.11) | (0.08) | (0.07) | (0.07) |
Net realized gains
| 0.00 | (0.01) | 0.00 | (0.02) | (0.05) | (0.02) |
Total distributions to shareholders
| (0.04) | (0.11) | (0.11) | (0.10) | (0.12) | (0.09) |
Net asset value, end of period
| $9.34 | $9.20 | $9.17 | $8.96 | $8.97 | $9.09 |
Total return2
| 1.93% | 1.47% | 3.62% | 1.06% | (0.10)% | 2.78% |
| Ratios to average net assets (annualized) | | | | | | |
Gross expenses
| 1.54% | 1.54% | 1.55% | 1.57% | 1.56% | 1.56% |
Net expenses
| 1.54% | 1.54% | 1.55% | 1.57% | 1.56% | 1.56% |
Net investment income
| 0.78% | 1.06% | 1.24% | 0.94% | 0.72% | 0.78% |
| Supplemental data | | | | | | |
Portfolio turnover rate
| 14% | 26% | 29% | 33% | 31% | 53% |
Net assets, end of period (000s omitted)
| $58,706 | $69,472 | $82,331 | $115,518 | $137,955 | $156,560 |
| 1 | Calculated based upon average shares outstanding |
| 2 | Total return calculations do not include any sales charges. Returns for periods of less than one year are not annualized. |
The accompanying notes are an integral part of these financial statements.
Wells Fargo Strategic Municipal Bond Fund | 55
Financial highlights
(For a share outstanding throughout each period)
| | | Year ended June 30 |
| Class R6 | Six months ended
December 31, 2020
(unaudited) | 2020 | 2019 1 |
Net asset value, beginning of period
| $9.17 | $9.15 | $8.94 |
Net investment income
| 0.09 | 0.20 | 0.20 |
Net realized and unrealized gains (losses) on investments
| 0.14 | 0.03 | 0.21 |
Total from investment operations
| 0.23 | 0.23 | 0.41 |
| Distributions to shareholders from | | | |
Net investment income
| (0.09) | (0.20) | (0.20) |
Net realized gains
| 0.00 | (0.01) | 0.00 |
Total distributions to shareholders
| (0.09) | (0.21) | (0.20) |
Net asset value, end of period
| $9.31 | $9.17 | $9.15 |
Total return2
| 2.52% | 2.51% | 4.61% |
| Ratios to average net assets (annualized) | | | |
Gross expenses
| 0.41% | 0.41% | 0.41% |
Net expenses
| 0.41% | 0.41% | 0.41% |
Net investment income
| 1.90% | 2.19% | 2.39% |
| Supplemental data | | | |
Portfolio turnover rate
| 14% | 26% | 29% |
Net assets, end of period (000s omitted)
| $21,342 | $20,459 | $13,291 |
| 1 | For the period from July 31, 2018 (commencement of class operations) to June 30, 2019 |
| 2 | Returns for periods of less than one year are not annualized. |
The accompanying notes are an integral part of these financial statements.
56 | Wells Fargo Strategic Municipal Bond Fund
Financial highlights
(For a share outstanding throughout each period)
| | | Year ended June 30 |
| Administrator Class | Six months ended
December 31, 2020
(unaudited) | 2020 | 2019 | 2018 | 2017 | 2016 |
Net asset value, beginning of period
| $9.17 | $9.14 | $8.93 | $8.93 | $9.06 | $8.90 |
Net investment income
| 0.08 | 0.17 | 0.19 | 0.16 | 0.14 | 0.15 |
Net realized and unrealized gains (losses) on investments
| 0.14 | 0.04 | 0.21 | 0.02 | (0.08) | 0.18 |
Total from investment operations
| 0.22 | 0.21 | 0.40 | 0.18 | 0.06 | 0.33 |
| Distributions to shareholders from | | | | | | |
Net investment income
| (0.08) | (0.17) | (0.19) | (0.16) | (0.14) | (0.15) |
Net realized gains
| 0.00 | (0.01) | 0.00 | (0.02) | (0.05) | (0.02) |
Total distributions to shareholders
| (0.08) | (0.18) | (0.19) | (0.18) | (0.19) | (0.17) |
Net asset value, end of period
| $9.31 | $9.17 | $9.14 | $8.93 | $8.93 | $9.06 |
Total return1
| 2.38% | 2.34% | 4.53% | 2.07% | 0.67% | 3.80% |
| Ratios to average net assets (annualized) | | | | | | |
Gross expenses
| 0.73% | 0.73% | 0.73% | 0.76% | 0.75% | 0.74% |
Net expenses
| 0.68% | 0.68% | 0.68% | 0.68% | 0.68% | 0.68% |
Net investment income
| 1.64% | 1.92% | 2.10% | 1.80% | 1.51% | 1.66% |
| Supplemental data | | | | | | |
Portfolio turnover rate
| 14% | 26% | 29% | 33% | 31% | 53% |
Net assets, end of period (000s omitted)
| $116,728 | $115,889 | $149,097 | $191,723 | $195,138 | $408,846 |
| 1 | Returns for periods of less than one year are not annualized. |
The accompanying notes are an integral part of these financial statements.
Wells Fargo Strategic Municipal Bond Fund | 57
Financial highlights
(For a share outstanding throughout each period)
| | | Year ended June 30 |
| Institutional Class | Six months ended
December 31, 2020
(unaudited) | 2020 | 2019 | 2018 | 2017 | 2016 |
Net asset value, beginning of period
| $9.17 | $9.14 | $8.93 | $8.94 | $9.06 | $8.90 |
Net investment income
| 0.09 | 0.20 | 0.21 | 0.18 | 0.16 | 0.17 |
Net realized and unrealized gains (losses) on investments
| 0.14 | 0.04 | 0.21 | 0.01 | (0.07) | 0.18 |
Total from investment operations
| 0.23 | 0.24 | 0.42 | 0.19 | 0.09 | 0.35 |
| Distributions to shareholders from | | | | | | |
Net investment income
| (0.09) | (0.20) | (0.21) | (0.18) | (0.16) | (0.17) |
Net realized gains
| 0.00 | (0.01) | 0.00 | (0.02) | (0.05) | (0.02) |
Total distributions to shareholders
| (0.09) | (0.21) | (0.21) | (0.20) | (0.21) | (0.19) |
Net asset value, end of period
| $9.31 | $9.17 | $9.14 | $8.93 | $8.94 | $9.06 |
Total return1
| 2.49% | 2.57% | 4.75% | 2.16% | 0.99% | 4.02% |
| Ratios to average net assets (annualized) | | | | | | |
Gross expenses
| 0.46% | 0.46% | 0.47% | 0.49% | 0.48% | 0.48% |
Net expenses
| 0.46% | 0.46% | 0.47% | 0.48% | 0.48% | 0.48% |
Net investment income
| 1.85% | 2.14% | 2.32% | 2.05% | 1.85% | 1.85% |
| Supplemental data | | | | | | |
Portfolio turnover rate
| 14% | 26% | 29% | 33% | 31% | 53% |
Net assets, end of period (000s omitted)
| $2,076,332 | $1,829,368 | $1,647,093 | $1,224,170 | $1,033,007 | $608,995 |
| 1 | Returns for periods of less than one year are not annualized. |
The accompanying notes are an integral part of these financial statements.
58 | Wells Fargo Strategic Municipal Bond Fund
Notes to financial statements (unaudited)
1. ORGANIZATION
Wells Fargo Funds Trust (the “Trust”), a Delaware statutory trust organized on March 10, 1999, is an open-end management investment company registered under the Investment Company Act of 1940, as amended (the “1940 Act”). As an investment company, the Trust follows the accounting and reporting guidance in Financial Accounting Standards Board (“FASB”) Accounting Standards Codification Topic 946, Financial Services – Investment Companies. These financial statements report on the Wells Fargo Strategic Municipal Bond Fund (the “Fund”) which is a diversified series of the Trust.
2. SIGNIFICANT ACCOUNTING POLICIES
The following significant accounting policies, which are consistently followed in the preparation of the financial statements of the Fund, are in conformity with U.S. generally accepted accounting principles which require management to make estimates and assumptions that affect the reported amounts of assets and liabilities, disclosure of contingent assets and liabilities at the date of the financial statements, and the reported amounts of income and expenses during the reporting period. Actual results could differ from those estimates.
Securities valuation
All investments are valued each business day as of the close of regular trading on the New York Stock Exchange (generally 4 p.m. Eastern Time), although the Fund may deviate from this calculation time under unusual or unexpected circumstances.
Debt securities are valued at the evaluated bid price provided by an independent pricing service (e.g. taking into account various factors, including yields, maturities, or credit ratings) or, if a reliable price is not available, the quoted bid price from an independent broker-dealer.
Futures contracts that are listed on a foreign or domestic exchange or market are valued at the official closing price or, if none, the last sales price.
Investments in registered open-end investment companies are valued at net asset value.
Investments which are not valued using any of the methods discussed above are valued at their fair value, as determined in good faith by the Board of Trustees of the Fund. The Board of Trustees has established a Valuation Committee comprised of the Trustees and has delegated to it the authority to take any actions regarding the valuation of portfolio securities that the Valuation Committee deems necessary or appropriate, including determining the fair value of portfolio securities, unless the determination has been delegated to the Wells Fargo Asset Management Pricing Committee at Wells Fargo Funds Management, LLC ("Funds Management"). The Board of Trustees retains the authority to make or ratify any valuation decisions or approve any changes to the Valuation Procedures as it deems appropriate. On a quarterly basis, the Board of Trustees receives reports on any valuation actions taken by the Valuation Committee or the Wells Fargo Asset Management Pricing Committee which may include items for ratification.
When-issued transactions
The Fund may purchase securities on a forward commitment or when-issued basis. The Fund records a when-issued transaction on the trade date and will segregate assets in an amount at least equal in value to the Fund's commitment to purchase when-issued securities. Securities purchased on a when-issued basis are marked-to-market daily and the Fund begins earning interest on the settlement date. Losses may arise due to changes in the market value of the underlying securities or if the counterparty does not perform under the contract.
Futures contracts
Futures contracts are agreements between the Fund and a counterparty to buy or sell a specific amount of a commodity, financial instrument or currency at a specified price on a specified date. The Fund may buy and sell futures contracts in order to gain exposure to, or protect against, changes in interest rates and is subject to interest rate risk. The primary risks associated with the use of futures contracts are the imperfect correlation between changes in market values of securities held by the Fund and the prices of futures contracts, and the possibility of an illiquid market. Futures contracts are generally entered into on a regulated futures exchange and cleared through a clearinghouse associated with the exchange. With futures contracts, there is minimal counterparty risk to the Fund since futures contracts are exchange traded and the exchange’s clearinghouse, as the counterparty to all exchange traded futures, guarantees the futures contracts against default.
Upon entering into a futures contracts, the Fund is required to deposit either cash or securities (initial margin) with the broker in an amount equal to a certain percentage of the contract value. Subsequent payments (variation margin) are paid to or from the broker each day equal to the daily changes in the contract value. Such payments are recorded as unrealized gains or losses and, if any, shown as variation margin receivable (payable) in the Statement of Assets and Liabilities. Should the Fund fail to
Wells Fargo Strategic Municipal Bond Fund | 59
Notes to financial statements (unaudited)
make requested variation margin payments, the broker can gain access to the initial margin to satisfy the Fund’s payment obligations. When the contracts are closed, a realized gain or loss is recorded in the Statement of Operations.
Security transactions and income recognition
Securities transactions are recorded on a trade date basis. Realized gains or losses are recorded on the basis of identified cost.
Interest income is accrued daily and bond discounts are accreted and premiums are amortized daily. To the extent debt obligations are placed on non-accrual status, any related interest income may be reduced by writing off interest receivables when the collection of all or a portion of interest has been determined to be doubtful based on consistently applied procedures and the fair value has decreased. If the issuer subsequently resumes interest payments or when the collectability of interest is reasonably assured, the debt obligation is removed from non-accrual status.
Distributions to shareholders
Distributions to shareholders from net investment income are declared daily and paid monthly. Distributions from net realized gains, if any, are recorded on the ex-dividend date and paid at least annually. Such distributions are determined in accordance with income tax regulations and may differ from U.S. generally accepted accounting principles. Dividend sources are estimated at the time of declaration. The tax character of distributions is determined as of the Fund’s fiscal year end. Therefore, a portion of the Fund’s distributions made prior to the Fund’s fiscal year end may be categorized as a tax return of capital at year end.
Federal and other taxes
The Fund intends to continue to qualify as a regulated investment company by distributing substantially all of its investment company taxable and tax-exempt income and any net realized capital gains (after reduction for capital loss carryforwards) sufficient to relieve it from all, or substantially all, federal income taxes. Accordingly, no provision for federal income taxes was required.
The Fund’s income and federal excise tax returns and all financial records supporting those returns for the prior three fiscal years are subject to examination by the federal and Delaware revenue authorities. Management has analyzed the Fund’s tax positions taken on federal, state, and foreign tax returns for all open tax years and does not believe that there are any uncertain tax positions that require recognition of a tax liability.
As of December 31, 2020, the aggregate cost of all investments for federal income tax purposes was $2,749,277,998 and the unrealized gains (losses) consisted of:
| Gross unrealized gains | $113,886,357 |
| Gross unrealized losses | (2,785,860) |
| Net unrealized gains | $111,100,497 |
As of June 30, 2020, the Fund had capital loss carryforwards which consisted of $8,424,845 in short-term capital losses and $2,167,133 in long-term capital losses.
Class allocations
The separate classes of shares offered by the Fund differ principally in applicable sales charges, distribution, shareholder servicing, and administration fees. Class specific expenses are charged directly to that share class. Investment income, common fund-level expenses, and realized and unrealized gains (losses) on investments are allocated daily to each class of shares based on the relative proportion of net assets of each class.
60 | Wells Fargo Strategic Municipal Bond Fund
Notes to financial statements (unaudited)
3. FAIR VALUATION MEASUREMENTS
Fair value measurements of investments are determined within a framework that has established a fair value hierarchy based upon the various data inputs utilized in determining the value of the Fund’s investments. The three-level hierarchy gives the highest priority to unadjusted quoted prices in active markets for identical assets or liabilities (Level 1) and the lowest priority to unobservable inputs (Level 3). The Fund’s investments are classified within the fair value hierarchy based on the lowest level of input that is significant to the fair value measurement. The inputs are summarized into three broad levels as follows:
| ■ | Level 1 – quoted prices in active markets for identical securities |
| ■ | Level 2 – other significant observable inputs (including quoted prices for similar securities, interest rates, prepayment speeds, credit risk, etc.) |
| ■ | Level 3 – significant unobservable inputs (including the Fund’s own assumptions in determining the fair value of investments) |
The inputs or methodologies used for valuing investments in securities are not necessarily an indication of the risk associated with investing in those securities.
The following is a summary of the inputs used in valuing the Fund’s assets and liabilities as of December 31, 2020:
| | Quoted prices
(Level 1) | Other significant
observable inputs
(Level 2) | Significant
unobservable inputs
(Level 3) | Total |
| Assets | | | | |
| Investments in: | | | | |
| Closed end municipal bond fund obligations | $ 0 | $ 20,000,000 | $0 | $ 20,000,000 |
| Municipal obligations | 0 | 2,778,261,570 | 0 | 2,778,261,570 |
| Short-term investments | | | | |
| Investment companies | 62,116,925 | 0 | 0 | 62,116,925 |
| Total assets | $62,116,925 | $2,798,261,570 | $0 | $2,860,378,495 |
Additional sector, industry or geographic detail is included in the Portfolio of Investments.
For the six months ended December 31, 2020, the Fund did not have any transfers into/out of Level 3.
4. TRANSACTIONS WITH AFFILIATES
Management fee
Funds Management, an indirect wholly owned subsidiary of Wells Fargo & Company (“Wells Fargo”), is the manager of the Fund and provides advisory and fund-level administrative services under an investment management agreement. Under the investment management agreement, Funds Management is responsible for, among other services, implementing the investment objectives and strategies of the Fund, supervising the subadviser and providing fund-level administrative services in connection with the Fund’s operations. As compensation for its services under the investment management agreement, Funds Management is entitled to receive a management fee at the following annual rate based on the Fund’s average daily net assets:
| Average daily net assets | Management fee |
| First $500 million | 0.400% |
| Next $500 million | 0.375 |
| Next $2 billion | 0.350 |
| Next $2 billion | 0.325 |
| Next $5 billion | 0.290 |
| Over $10 billion | 0.280 |
For the six months ended December 31, 2020, the management fee was equivalent to an annual rate of 0.36% of the Fund’s average daily net assets.
Wells Fargo Strategic Municipal Bond Fund | 61
Notes to financial statements (unaudited)
Funds Management has retained the services of a subadviser to provide daily portfolio management to the Fund. The fee for subadvisory services is borne by Funds Management. Wells Capital Management, Incorporated, an affiliate of Funds Management and an indirect wholly owned subsidiary of Wells Fargo, is the subadviser to the Fund and is entitled to receive a fee from Funds Management at an annual rate starting at 0.20% and declining to 0.10% as the average daily net assets of the Fund increase.
Administration fees
Under a class-level administration agreement, Funds Management provides class-level administrative services to the Fund, which includes paying fees and expenses for services provided by the transfer agent, sub-transfer agents, omnibus account servicers and record-keepers. As compensation for its services under the class-level administration agreement, Funds Management receives an annual fee which is calculated based on the average daily net assets of each class as follows:
| | Class-level
administration fee |
| Class A | 0.16% |
| Class C | 0.16 |
| Class R6 | 0.03 |
| Administrator Class | 0.10 |
| Institutional Class | 0.08 |
Waivers and/or expense reimbursements
Funds Management has contractually waived and/or reimbursed management and administration fees to the extent necessary to maintain certain net operating expense ratios for the Fund. When each class of the Fund has exceeded its expense cap, Funds Management has waived fees and/or reimbursed expenses from fund-level expenses on a proportionate basis and then from class specific expenses. When only certain classes exceed their expense caps, waivers and/or reimbursements are applied against class specific expenses before fund-level expenses. Funds Management has committed through October 31, 2021 to waive fees and/or reimburse expenses to the extent necessary to cap the Fund’s expenses at 0.81% for Class A shares, 1.56% for Class C shares, 0.43% for Class R6 shares, 0.68% for Administrator Class shares, and 0.48% for Institutional Class shares. Prior to or after the commitment expiration date, the cap may be increased or the commitment to maintain the cap may be terminated only with the approval of the Board of Trustees.
Distribution fee
The Trust has adopted a distribution plan for Class C shares of the Fund pursuant to Rule 12b-1 under the 1940 Act. A distribution fee is charged charged to Class C shares and paid to Wells Fargo Funds Distributor, LLC (“Funds Distributor”), the principal underwriter, at an annual rate of 0.75% of the average daily net assets of Class C shares.
In addition, Funds Distributor is entitled to receive the front-end sales charge from the purchase of Class A shares and a contingent deferred sales charge on the redemption of certain Class A shares. Funds Distributor is also entitled to receive the contingent deferred sales charges from redemptions of Class C shares. For the six months ended December 31, 2020, Funds Distributor received $10,227 from the sale of Class A shares. No contingent deferred sales charges were incurred by Class A and Class C shares for the six months ended December 31, 2020.
Shareholder servicing fees
The Trust has entered into contracts with one or more shareholder servicing agents, whereby Class A, Class C, and Administrator Class of the Fund are charged a fee at an annual rate of 0.25% of the average daily net assets of each respective class. A portion of these total shareholder servicing fees were paid to affiliates of Wells Fargo.
Interfund transactions
The Fund may purchase or sell portfolio investment securities to certain other Wells Fargo affiliates pursuant to Rule 17a-7 under the 1940 Act and under procedures adopted by the Board of Trustees. The procedures have been designed to ensure that these interfund transactions, which do not incur broker commissions, are effected at current market prices. Pursuant to these procedures, the Fund had $340,122,060, $35,915,000 and $0 in interfund purchases, sales and net realized gains (losses), respectively, during the six months ended December 31, 2020.
62 | Wells Fargo Strategic Municipal Bond Fund
Notes to financial statements (unaudited)
5. INVESTMENT PORTFOLIO TRANSACTIONS
Purchases and sales of investments, excluding U.S. government obligations (if any) and short-term securities, for the six months ended December 31, 2020 were $340,249,819 and $926,879,635, respectively.
6. DERIVATIVE TRANSACTIONS
During the six months ended December 31, 2020, the Fund entered into futures contracts to take advantage of the differences between municipal and treasury yields and to help manage the duration of the portfolio. The Fund had an average notional amount of $2,580,055 in short futures contracts during the six months ended December 31, 2020.
The fair value, realized gains or losses and change in unrealized gains or losses, if any, on derivative instruments are reflected in the corresponding financial statement captions.
7. BANK BORROWINGS
The Trust (excluding the money market funds), Wells Fargo Master Trust and Wells Fargo Variable Trust are parties to a $350,000,000 revolving credit agreement whereby the Fund is permitted to use bank borrowings for temporary or emergency purposes, such as to fund shareholder redemption requests. Interest under the credit agreement is charged to the Fund based on a borrowing rate equal to the higher of the Federal Funds rate in effect on that day plus 1.25% or the overnight LIBOR rate in effect on that day plus 1.25%. In addition, an annual commitment fee equal to 0.25% of the unused balance is allocated to each participating fund.
For the six months ended December 31, 2020, there were no borrowings by the Fund under the agreement.
8. INDEMNIFICATION
Under the Fund's organizational documents, the officers and Trustees have been granted certain indemnification rights against certain liabilities that may arise out of performance of their duties to the Fund. The Fund has entered into a separate agreement with each Trustee that converts indemnification rights currently existing under the Fund’s organizational documents into contractual rights that cannot be changed in the future without the consent of the Trustee. Additionally, in the normal course of business, the Fund may enter into contracts with service providers that contain a variety of indemnification clauses. The Fund’s maximum exposure under these arrangements is dependent on future claims that may be made against the Fund and, therefore, cannot be estimated.
9. NEW ACCOUNTING PRONOUNCEMENT
In August 2018, FASB issued Accounting Standards Update (“ASU”) No. 2018-13, Fair Value Measurement (Topic 820) Disclosure Framework - Changes to the Disclosure Requirements for Fair Value Measurement. ASU 2018-13 updates the disclosure requirements on fair value measurements in Topic 820, Fair Value Measurements. The amendments are effective for fiscal years, and interim periods within those fiscal years, beginning after December 15, 2019. Management has adopted this guidance which did not have a material impact on the financial statements.
10. SUBSEQUENT EVENT
On February 23, 2021, Wells Fargo announced that it has entered into a definitive agreement to sell Wells Fargo Asset Management (“WFAM”) to GTCR LLC and Reverence Capital Partners, L.P. WFAM is the trade name used by the asset management businesses of Wells Fargo and includes Wells Fargo Funds Management, LLC, the investment manager to the Fund, Wells Capital Management Incorporated and Wells Fargo Asset Management (International) Limited, both registered investment advisers providing sub-advisory services to certain funds, and Wells Fargo Funds Distributor, LLC, the Fund’s principal underwriter. As part of the transaction, Wells Fargo will own a 9.9% equity interest and will continue to serve as an important client and distribution partner.
Consummation of the transaction will result in the automatic termination of the Fund’s investment management agreement and sub-advisory agreement(s). The Fund’s Board of Trustees will be asked to approve new investment management arrangements with the new company. If approved by the Board, the new investment management arrangements with the new company will be presented to the shareholders of the Fund for approval, and, if approved by shareholders, would take effect upon the closing of the transaction. The transaction is expected to close in the second half of 2021, subject to customary closing conditions.
Wells Fargo Strategic Municipal Bond Fund | 63
Notes to financial statements (unaudited)
11. CORONAVIRUS (COVID-19) PANDEMIC
On March 11, 2020, the World Health Organization announced that it had made the assessment that coronavirus disease 2019 (“COVID-19”) is a pandemic. The impacts of COVID-19 are affecting the entire global economy, individual companies and investment products, and the market in general. There is significant uncertainty around the extent and duration of business disruptions related to COVID-19 and the impacts may be short term or may last for an extended period of time. The risk of further spreading of COVID-19 has led to significant uncertainty and volatility in the financial markets.
64 | Wells Fargo Strategic Municipal Bond Fund
Other information (unaudited)
PROXY VOTING INFORMATION
A description of the policies and procedures used to determine how to vote proxies relating to portfolio securities is available without charge, upon request, by calling 1-800-222-8222, visiting our website at wfam.com, or visiting the SEC website at sec.gov. Information regarding how the proxies related to portfolio securities were voted during the most recent 12-month period ended June 30 is available on the website at wfam.com or by visiting the SEC website at sec.gov.
QUARTERLY PORTFOLIO HOLDINGS INFORMATION
The Fund files its complete schedule of portfolio holdings with the SEC for the first and third quarters of each fiscal year as an exhibit to its reports on Form N-PORT. Shareholders may view the filed Form N-PORT by visiting the SEC website at sec.gov.
Wells Fargo Strategic Municipal Bond Fund | 65
Other information (unaudited)
BOARD OF TRUSTEES AND OFFICERS
Each of the Trustees and Officers1 listed in the table below acts in identical capacities for each fund in the Wells Fargo family of funds, which consists of 144 mutual funds comprising the Wells Fargo Funds Trust, Wells Fargo Variable Trust, Wells Fargo Master Trust and four closed-end funds (collectively the “Fund Complex”). This table should be read in conjunction with the Prospectus and the Statement of Additional Information2. The mailing address of each Trustee and Officer is 525 Market Street, 12th Floor, San Francisco, CA 94105. Each Trustee and Officer serves an indefinite term, however, each Trustee serves such term until reaching the mandatory retirement age established by the Trustees.
Independent Trustees
Name and
year of birth | Position held and
length of service* | Principal occupations during past five years or longer | Current other
public company or
investment
company
directorships |
William R. Ebsworth
(Born 1957) | Trustee,
since 2015 | Retired. From 1984 to 2013, equities analyst, portfolio manager, research director and chief investment officer at Fidelity Management and Research Company in Boston, Tokyo, and Hong Kong, and retired in 2013 as Chief Investment Officer of Fidelity Strategic Advisers, Inc. where he led a team of investment professionals managing client assets. Prior thereto, Board member of Hong Kong Securities Clearing Co., Hong Kong Options Clearing Corp., the Thailand International Fund, Ltd., Fidelity Investments Life Insurance Company, and Empire Fidelity Investments Life Insurance Company. Audit Committee Chair and Investment Committee Chair of the Vincent Memorial Hospital Endowment (non-profit organization). Mr. Ebsworth is a CFA® charterholder. | N/A |
Jane A. Freeman
(Born 1953) | Trustee,
since 2015;
Chair Liaison,
since 2018 | Retired. From 2012 to 2014 and 1999 to 2008, Chief Financial Officer of Scientific Learning Corporation. From 2008 to 2012, Ms. Freeman provided consulting services related to strategic business projects. Prior to 1999, Portfolio Manager at Rockefeller & Co. and Scudder, Stevens & Clark. Board member of the Harding Loevner Funds from 1996 to 2014, serving as both Lead Independent Director and chair of the Audit Committee. Board member of the Russell Exchange Traded Funds Trust from 2011 to 2012 and the chair of the Audit Committee. Ms. Freeman is also an inactive Chartered Financial Analyst. | N/A |
Isaiah Harris, Jr.
(Born 1952) | Trustee,
since 2009; Audit
Committee
Chair,
since 2019 | Retired. Chairman of the Board of CIGNA Corporation since 2009, and Director since 2005. From 2003 to 2011, Director of Deluxe Corporation. Prior thereto, President and CEO of BellSouth Advertising and Publishing Corp. from 2005 to 2007, President and CEO of BellSouth Enterprises from 2004 to 2005 and President of BellSouth Consumer Services from 2000 to 2003. Emeritus member of the Iowa State University Foundation Board of Governors. Emeritus Member of the Advisory Board of Iowa State University School of Business. Advisory Board Member, Palm Harbor Academy (private school). Mr. Harris is a certified public accountant (inactive status). | CIGNA Corporation |
Judith M. Johnson
(Born 1949) | Trustee,
since 2008 | Retired. Prior thereto, Chief Executive Officer and Chief Investment Officer of Minneapolis Employees Retirement Fund from 1996 to 2008. Ms. Johnson is an attorney, certified public accountant and a certified managerial accountant. | N/A |
David F. Larcker
(Born 1950) | Trustee,
since 2009 | James Irvin Miller Professor of Accounting at the Graduate School of Business (Emeritus), Stanford University, Director of the Corporate Governance Research Initiative and Senior Faculty of The Rock Center for Corporate Governance since 2006. From 2005 to 2008, Professor of Accounting at the Graduate School of Business, Stanford University. Prior thereto, Ernst & Young Professor of Accounting at The Wharton School, University of Pennsylvania from 1985 to 2005. | N/A |
66 | Wells Fargo Strategic Municipal Bond Fund
Other information (unaudited)
Name and
year of birth | Position held and
length of service* | Principal occupations during past five years or longer | Current other
public company or
investment
company
directorships |
Olivia S. Mitchell
(Born 1953) | Trustee,
since 2006;
Nominating and
Governance
Committee Chair,
since 2018 | International Foundation of Employee Benefit Plans Professor, Wharton School of the University of Pennsylvania since 1993. Director of Wharton’s Pension Research Council and Boettner Center on Pensions & Retirement Research, and Research Associate at the National Bureau of Economic Research. Previously, Cornell University Professor from 1978 to 1993. | N/A |
Timothy J. Penny
(Born 1951) | Trustee,
since 1996;
Chair,
since 2018 | President and Chief Executive Officer of Southern Minnesota Initiative Foundation, a non-profit organization, since 2007. Member of the Board of Trustees of NorthStar Education Finance, Inc., a non-profit organization, since 2007. | N/A |
James G. Polisson
(Born 1959) | Trustee,
since 2018 | Retired. Chief Marketing Officer, Source (ETF) UK Services, Ltd, from 2015 to 2017. From 2012 to 2015, Principal of The Polisson Group, LLC, a management consulting, corporate advisory and principal investing company. Chief Executive Officer and Managing Director at Russell Investments, Global Exchange Traded Funds from 2010 to 2012. Managing Director of Barclays Global Investors from 1998 to 2010 and Global Chief Marketing Officer for iShares and Barclays Global Investors from 2000 to 2010. Trustee of the San Francisco Mechanics’ Institute, a non-profit organization, from 2013 to 2015. Board member of the Russell Exchange Traded Fund Trust from 2011 to 2012. Director of Barclays Global Investors Holdings Deutschland GmbH from 2006 to 2009. Mr. Polisson is an attorney and has a retired status with the Massachusetts and District of Columbia Bar Associations. | N/A |
Pamela Wheelock
(Born 1959) | Trustee,
since January
2020; previously
Trustee from
January 2018 to
July 2019 | Board member of the Destination Medical Center Economic Development Agency, Rochester, Minnesota since 2019. Interim President of the McKnight Foundation from January to September 2020. Acting Commissioner, Minnesota Department of Human Services, July 2019 through September 2019. Human Services Manager (part-time), Minnesota Department of Human Services, October 2019 through December 2019. Chief Operating Officer, Twin Cities Habitat for Humanity from 2017 to 2019. Vice President of University Services, University of Minnesota from 2012 to 2016. Prior thereto, on the Board of Directors, Governance Committee and Finance Committee for the Minnesota Philanthropy Partners (Saint Paul Foundation) from 2012 to 2018, Interim Chief Executive Officer of Blue Cross Blue Shield of Minnesota from 2011 to 2012, Chairman of the Board from 2009 to 2012 and Board Director from 2003 to 2015. Vice President, Leadership and Community Engagement, Bush Foundation, Saint Paul, Minnesota (a private foundation) from 2009 to 2011. Executive Vice President and Chief Financial Officer, Minnesota Sports and Entertainment from 2004 to 2009 and Senior Vice President from 2002 to 2004. Executive Vice President of the Minnesota Wild Foundation from 2004 to 2008. Commissioner of Finance, State of Minnesota, from 1999 to 2002. Currently Board Chair of the Minnesota Wild Foundation since 2010. | N/A |
* Length of service dates reflect the Trustee’s commencement of service with the Trust’s predecessor entities, where applicable.
Wells Fargo Strategic Municipal Bond Fund | 67
Other information (unaudited)
Officers
Name and
year of birth | Position held and
length of service | Principal occupations during past five years or longer |
Andrew Owen
(Born 1960) | President,
since 2017 | Executive Vice President of Wells Fargo & Company and Head of Affiliated Managers, Wells Fargo Asset Management, since 2014. In addition, Mr. Owen is currently President, Chief Executive Officer and Director of Wells Fargo Funds Management, LLC since 2017. Prior thereto, Executive Vice President responsible for marketing, investments and product development for Wells Fargo Funds Management, LLC, from 2009 to 2014. |
Nancy Wiser1
(Born 1967) | Treasurer,
since 2012 | Executive Vice President of Wells Fargo Funds Management, LLC since 2011. Chief Operating Officer and Chief Compliance Officer at LightBox Capital Management LLC, from 2008 to 2011. |
Michelle Rhee
(Born 1966) | Chief Legal Officer,
since 2019 | Secretary of Wells Fargo Funds Management, LLC and Chief Legal Counsel of Wells Fargo Asset Management since 2018. Deputy General Counsel of Wells Fargo Bank N.A. since 2020 and Assistant General Counsel of Wells Fargo Bank, N.A. from 2018 to 2020. Associate General Counsel and Managing Director of Bank of America Corporation from 2004 to 2018. |
Catherine Kennedy
(Born 1969) | Secretary,
since 2019 | Vice President of Wells Fargo Funds Management, LLC and Senior Counsel of the Wells Fargo Legal Department since 2010. Vice President and Senior Counsel of Evergreen Investment Management Company, LLC from 1998 to 2010. |
Michael H. Whitaker
(Born 1967) | Chief Compliance Officer,
since 2016 | Chief Compliance Officer of Wells Fargo Asset Management since 2016. Senior Vice President and Chief Compliance Officer for Fidelity Investments from 2007 to 2016. |
Jeremy DePalma1
(Born 1974) | Assistant Treasurer,
since 2009 | Senior Vice President of Wells Fargo Funds Management, LLC since 2009. Senior Vice President of Evergreen Investment Management Company, LLC from 2008 to 2010 and head of the Fund Reporting and Control Team within Fund Administration from 2005 to 2010. |
1 Nancy Wiser acts as Treasurer of 67 funds in the Fund Complex. Jeremy DePalma acts as the Treasurer of 77 funds and Assistant Treasurer of 67 funds in the Fund Complex.
2 The Statement of Additional Information includes additional information about the Trustees and is available, without charge, upon request, by calling 1-800-222-8222 or by visiting the website at wfam.com.
68 | Wells Fargo Strategic Municipal Bond Fund
For more information
More information about Wells Fargo Funds is available free upon request. To obtain literature, please write, visit the Fund's website, or call:
Wells Fargo Funds
P.O. Box 219967
Kansas City, MO 64121-9967
Website: wfam.com
Individual investors: 1-800-222-8222
Retail investment professionals: 1-888-877-9275
Institutional investment professionals: 1-866-765-0778
This report and the financial statements contained herein are submitted for the general information of the shareholders of the Fund. If this report is used for promotional purposes, distribution of the report must be accompanied or preceded by a current prospectus. Before investing, please consider the investment objectives, risks, charges, and expenses of the investment. For a current prospectus and, if available, a summary prospectus, containing this information, call 1-800-222-8222 or visit the Fund’s website at wfam.com. Read the prospectus carefully before you invest or send money.
Wells Fargo Asset Management (WFAM) is the trade name for certain investment advisory/management firms owned by Wells Fargo & Company. These firms include but are not limited to Wells Capital Management Incorporated and Wells Fargo Funds Management, LLC. Certain products managed by WFAM entities are distributed by Wells Fargo Funds Distributor, LLC (a broker-dealer and Member FINRA).
This material is for general informational and educational purposes only and is NOT intended to provide investment advice or a recommendation of any kind— including a recommendation for any specific investment, strategy, or plan.
INVESTMENT PRODUCTS: NOT FDIC INSURED ■ NO BANK GUARANTEE ■ MAY LOSE VALUE
© 2021 Wells Fargo & Company. All rights reserved.
PAR-0121-00284 02-21
SA257/SAR257 12-20
Semi-Annual Report
December 31, 2020
Wells Fargo Ultra Short-Term
Municipal Income Fund
Reduce clutter.
Save trees.
Sign up for electronic delivery of prospectuses and shareholder reports at wellsfargo.com/ advantagedelivery
The views expressed and any forward-looking statements are as of December 31, 2020, unless otherwise noted, and are those of the Fund's portfolio managers and/or Wells Fargo Asset Management. Discussions of individual securities or the markets generally are not intended as individual recommendations. Future events or results may vary significantly from those expressed in any forward-looking statements. The views expressed are subject to change at any time in response to changing circumstances in the market. Wells Fargo Asset Management and the Fund disclaim any obligation to publicly update or revise any views expressed or forward-looking statements.
INVESTMENT PRODUCTS: NOT FDIC INSURED ■ NO BANK GUARANTEE ■ MAY LOSE VALUE
Wells Fargo Ultra Short-Term Municipal Income Fund | 1
Letter to shareholders (unaudited)
Dear Shareholder:
We are pleased to offer you this semi-annual report for the Wells Fargo Ultra Short-Term Municipal Income Fund for the six-month period that ended December 31, 2020. Despite a deeply challenging year, dominated by the spread of COVID-19 cases and a sharp drop in economic output throughout much of the world, global stocks performed extremely well, benefiting from ongoing central bank support and rising optimism over the development and distribution of effective COVID-19 vaccines. Bonds also had positive returns, led by global bonds and high-yield bonds.
For the six-month period, U.S. stocks, based on the S&P 500 Index,1 gained 22.16%. International stocks, as measured by the MSCI ACWI ex USA Index (Net),2 returned 24.33%, while the MSCI EM Index (Net),3 had even stronger performance, with a 31.14% gain. Among bond indexes, the Bloomberg Barclays U.S. Aggregate Bond Index,4 returned 1.29%, the Bloomberg Barclays Global Aggregate ex-USD Index (unhedged),5 gained 9.44%, and the Bloomberg Barclays Municipal Bond Index,6 returned 3.07% while the ICE BofA U.S. High Yield Index,7 gained a hefty 11.49%.
The stock market rally continued in July.
After a volatile first half of the year, an existing stock market rally continued in July with strong results for equities and fixed income. However, economic data and a resurgence of COVID-19 cases underscored the urgent need to regain control of the pandemic. Second-quarter gross domestic product (GDP) shrank from the previous quarter by 9.5% and 12.1% in the U.S. and the eurozone, respectively. In contrast, China’s second-quarter GDP grew 3.2% year over year. The U.S. economy added 1.8 million jobs in July, but a double-digit jobless rate persisted.
The stock market continued to rally in August despite concerns over rising numbers of U.S. and European COVID-19 cases as well as the expiration of the $600 weekly bonus unemployment benefit in July. Relatively strong second-quarter earnings boosted investor sentiment along with the U.S. Federal Reserve’s announcement of a monetary policy shift expected to support longer-term low interest rates. U.S. manufacturing and services activity indexes beat expectations, while the U.S. housing market maintained strength. In Europe, retail sales expanded and consumer confidence was steady. China’s economy continued to expand.
Andrew Owen
President
Wells Fargo Funds
“After a volatile first half of the year, an existing stock market rally continued in July with strong results for equities and fixed income.”
| 1 | The S&P 500 Index consists of 500 stocks chosen for market size, liquidity, and industry group representation. It is a market-value-weighted index with each stock's weight in the index proportionate to its market value. You cannot invest directly in an index. |
| 2 | The Morgan Stanley Capital International (MSCI) All Country World Index (ACWI) ex USA Index (Net) is a free-float-adjusted market-capitalization-weighted index that is designed to measure the equity market performance of developed and emerging markets, excluding the United States. Source: MSCI. MSCI makes no express or implied warranties or representations and shall have no liability whatsoever with respect to any MSCI data contained herein. The MSCI data may not be further redistributed or used as a basis for other indices or any securities or financial products. This report is not approved, reviewed, or produced by MSCI. You cannot invest directly in an index. |
| 3 | The MSCI Emerging Markets (EM) Index (Net) is a free-float-adjusted market-capitalization-weighted index that is designed to measure equity market performance of emerging markets. You cannot invest directly in an index. |
| 4 | The Bloomberg Barclays U.S. Aggregate Bond Index is a broad-based benchmark that measures the investment-grade, U.S. dollar-denominated, fixed-rate taxable bond market, including Treasuries, government-related and corporate securities, mortgage-backed securities (agency fixed-rate and hybrid adjustable-rate mortgage pass-throughs), asset-backed securities, and commercial mortgage-backed securities. You cannot invest directly in an index. |
| 5 | The Bloomberg Barclays Global Aggregate ex-USD Index (unhedged) is an unmanaged index that provides a broad-based measure of the global investment-grade fixed-income markets excluding the U.S. dollar-denominated debt market. You cannot invest directly in an index. |
| 6 | The Bloomberg Barclays Municipal Bond Index is an unmanaged index composed of long-term tax-exempt bonds with a minimum credit rating of Baa. You cannot invest directly in an index. |
| 7 | The ICE BofA U.S. High Yield Index is a market-capitalization-weighted index of domestic and Yankee high-yield bonds. The index tracks the performance of high-yield securities traded in the U.S. bond market. You cannot invest directly in an index. Copyright 2021. ICE Data Indices, LLC. All rights reserved. |
2 | Wells Fargo Ultra Short-Term Municipal Income Fund
Letter to shareholders (unaudited)
Stocks grew more volatile in September on mixed economic data. U.S. economic activity continued to grow. However, U.S. unemployment remained elevated at 7.9% in September. With U.S. Congress delaying further fiscal relief and uncertainties surrounding a possible vaccine, doubts crept back into the financial markets. In the U.K., a lack of progress in Brexit talks weighed on markets. China’s economy picked up steam, fueled by increased global demand.
In October, capital markets stepped back from their six-month rally. Market volatility rose in advance of the U.S. election and amid a global increase in COVID-19 infections. Europe introduced tighter restrictions affecting economic activity. U.S. markets looked favorably at the prospect of Democratic control of the federal purse strings, which could lead to additional fiscal stimulus and a boost to economic activity. Meanwhile, China reported 4.9% third-quarter GDP growth.
Global stocks rallied in November, propelled by optimism over three promising COVID-19 vaccines. Reversing recent trends, value stocks outperformed growth stocks and cyclical stocks outpaced technology stocks. However, U.S. unemployment remained elevated, with a net job loss of 10 million since February. The eurozone services Purchasing Managers’ Index, a monthly survey of purchasing managers, contracted sharply while the region’s manufacturing activity grew. The U.S. election results added to the upbeat mood as investors anticipated more consistent policies in the new administration.
Financial markets ended the year with strength on high expectations for a rapid rollout of the COVID-19 vaccines, the successful passage of a $900 billion stimulus package, and rising expectations of additional economic support from a Democratic-led Congress. U.S. economic data were mixed with still-elevated unemployment and weak retail sales but growth in manufacturing output. In contrast, China’s economic expansion continued in both manufacturing and nonmanufacturing. U.S. COVID-19 infection rates continued to rise even as new state and local lockdown measures were implemented.
Don’t let short-term uncertainty derail long-term investment goals.
Periods of investment uncertainty can present challenges, but experience has taught us that maintaining long-term investment goals can be an effective way to plan for the future. To help you create a sound strategy based on your personal goals and risk tolerance, Wells Fargo Funds offers more than 100 mutual funds spanning a wide range of asset classes and investment styles. Although diversification cannot guarantee an investment profit or prevent losses, we believe it can be an effective way to manage investment risk and potentially smooth out overall portfolio performance. We encourage investors to know their investments and to understand that appropriate levels of risk-taking may unlock opportunities.
Thank you for choosing to invest with Wells Fargo Funds. We appreciate your confidence in us and remain committed to helping you meet your financial needs.
Sincerely,
Andrew Owen
President
Wells Fargo Funds
“Global stocks rallied in November, propelled by optimism over three promising COVID-19 vaccines.”
For further information about your Fund, contact your investment professional, visit our website at wfam.com, or call us directly at 1-800-222-8222.
Wells Fargo Ultra Short-Term Municipal Income Fund | 3
Letter to shareholders (unaudited)
Preparing for LIBOR Transition
The global financial industry is preparing to transition away from the London Interbank Offered Rate (LIBOR), a key benchmark interest rate, to new alternative rates. LIBOR underpins more than $350 trillion of financial contracts. It is the benchmark rate for a wide spectrum of products ranging from residential mortgages to corporate bonds to derivatives. Regulators have called for a market-wide transition away from LIBOR to successor reference rates by the end of 2021 (expected to be extended through June 30, 2023 for most tenors of the U.S. dollar LIBOR), which requires proactive steps be taken by issuers, counterparties, and asset managers to identify impacted products and adopt new reference rates.
The Fund holds at least one security that uses LIBOR as a floating reference rate and has a maturity date after 12-31-2021.
Although the transition process away from LIBOR has become increasingly well-defined in advance of the anticipated discontinuation date, there remains uncertainty regarding the nature of successor reference rates, and any potential effects of the transition away from LIBOR on investment instruments that use it as a benchmark rate. The transition process may result in, among other things, increased volatility or illiquidity in markets for instruments that currently rely on LIBOR and could negatively impact the value of certain instruments held by the Fund.
Wells Fargo Asset Management is monitoring LIBOR exposure closely and has put resources and controls in place to manage this transition effectively. The Fund’s portfolio management team is evaluating LIBOR holdings to understand what happens to those securities when LIBOR ceases to exist, including examining security documentation to identify the presence or absence of fallback language identifying a replacement rate to LIBOR.
While the pace of transition away from LIBOR will differ by asset class and investment strategy, the portfolio management team will monitor market conditions for those holdings to identify and mitigate deterioration or volatility in pricing and liquidity and ensure appropriate actions are taken in a timely manner.
Further information regarding the potential risks associated with the discontinuation of LIBOR can be found in the Fund’s Statement of Additional Information.
4 | Wells Fargo Ultra Short-Term Municipal Income Fund
This page is intentionally left blank.
Performance highlights (unaudited)
Investment objective
The Fund seeks current income exempt from federal income tax, consistent with capital preservation.
Manager
Wells Fargo Funds Management, LLC
Subadviser
Wells Capital Management Incorporated
Portfolio managers
Bruce R. Johns
James Randazzo
Nicholos Venditti*
Average annual total returns (%) as of December 31, 2020
| | | Including sales charge | | Excluding sales charge | | Expense ratios1 (%) |
| | Inception date | 1 year | 5 year | 10 year | | 1 year | 5 year | 10 year | | Gross | Net 2 |
| Class A (SMAVX) | 10-2-2000 | -1.05 | 0.47 | 0.50 | | 0.97 | 0.87 | 0.71 | | 0.67 | 0.50 |
| Class A2 (WFUNX)3 | 5-29-2020 | – | – | – | | 0.95 | 0.87 | 0.71 | | 0.67 | 0.50 |
| Class C (WFUSX) | 3-31-2008 | -0.24 | 0.24 | 0.03 | | 0.76 | 0.24 | 0.03 | | 1.42 | 1.25 |
| Class R6 (WUSRX)4 | 7-31-2018 | – | – | – | | 1.28 | 1.19 | 1.02 | | 0.29 | 0.20 |
| Administrator Class (WUSMX) | 7-30-2010 | – | – | – | | 0.99 | 0.93 | 0.77 | | 0.61 | 0.50 |
| Institutional Class (SMAIX) | 7-31-2000 | – | – | – | | 1.13 | 1.17 | 1.01 | | 0.34 | 0.25 |
| Ultra Short-Term Municipal Blended Index5 | – | – | – | – | | 1.04 | 1.14 | 0.79 | | – | – |
| Bloomberg Barclays 1-Year Municipal Bond Index6 | – | – | – | – | | 1.76 | 1.43 | 1.16 | | – | – |
| iMoneyNet Tax-Free National Institutional Money Market Funds Average7 | – | – | – | – | | 0.32 | 0.84 | 0.43 | | – | – |
Figures quoted represent past performance, which is no guarantee of future results, and do not reflect taxes that a shareholder may pay on an investment in a fund. Investment return and principal value of an investment will fluctuate so that an investor’s shares, when redeemed, may be worth more or less than their original cost. Performance shown without sales charges would be lower if sales charges were reflected. Current performance may be lower or higher than the performance data quoted, which assumes the reinvestment of dividends and capital gains. Current month-end performance is available on the Fund’s website, wfam.com.
Index returns do not include transaction costs associated with buying and selling securities, any mutual fund fees or expenses, or any taxes. It is not possible to invest directly in an index.
For Class A shares, the maximum front-end sales charge is 2.00%. For Class C shares, the maximum contingent deferred sales charge is 1.00%. Performance including a contingent deferred sales charge assumes the sales charge for the corresponding time period. Class A2, Class R6, Administrator Class, and Institutional Class shares are sold without a front-end sales charge or contingent deferred sales charge.
Bond values fluctuate in response to the financial condition of individual issuers, general market and economic conditions, and changes in interest rates. Changes in market conditions and government policies may lead to periods of heightened volatility in the bond market and reduced liquidity for certain bonds held by the Fund. In general, when interest rates rise, bond values fall and investors may lose principal value. Interest rate changes and their impact on the fund and its share price can be sudden and unpredictable. The use of derivatives may reduce returns and/or increase volatility. Certain investment strategies tend to increase the total risk of an investment (relative to the broader market). The Fund is exposed to high-yield securities risk. Consult the Fund’s prospectus for additional information on these and other risks. A portion of the Fund’s income may be subject to federal, state, and/or local income taxes or the Alternative Minimum Tax (AMT). Any capital gains distributions may be taxable.
Please see footnotes on page 7.
6 | Wells Fargo Ultra Short-Term Municipal Income Fund
Performance highlights (unaudited)
| Effective maturity distribution as of December 31, 20208 |
| Credit quality as of December 31, 20209 |
| * | Mr. Venditti became a portfolio manager of the Fund on September 1, 2020. |
| 1 | Reflects the expense ratios as stated in the most recent prospectuses. The expense ratios shown are subject to change and may differ from the annualized expense ratios shown in the financial highlights of this report. |
| 2 | The manager has contractually committed through October 31, 2021, to waive fees and/or reimburse expenses to the extent necessary to cap total annual fund operating expenses after fee waivers at 0.50% for Class A, 0.50% for Class A2, 1.25% for Class C, 0.20% for Class R6, 0.50% for Administrator Class, and 0.25% for Institutional Class. Brokerage commissions, stamp duty fees, interest, taxes, acquired fund fees and expenses (if any), and extraordinary expenses are excluded from the expense caps. Prior to or after the commitment expiration date, the caps may be increased or the commitment to maintain the caps may be terminated only with the approval of the Board of Trustees. Without these caps, the Fund’s returns would have been lower. The expense ratio paid by an investor is the net expense ratio (the total annual fund operating expenses after fee waivers) as stated in the prospectuses. |
| 3 | Historical performance shown for the Class A2 shares prior to their inception reflects the performance of the Class A shares, and it is not adjusted to reflect the higher expenses applicable to the the Class A shares. |
| 4 | Historical performance shown for the Class R6 shares prior to their inception reflects the performance of the Institutional Class shares, and includes the higher expenses applicable to the Institutional Class shares. If these expenses had not been included, returns for the Class R6 shares would be higher. |
| 5 | Source: Wells Fargo Funds Management LLC. The Ultra Short-Term Municipal Income Blended Index is composed 50% of the Bloomberg Barclays 1-Year Municipal Bond Index and 50% of the iMoneyNet Tax-Free National Institutional Money Market Funds Average. You cannot invest directly in an index. |
| 6 | The Bloomberg Barclays 1-Year Municipal Bond Index is the one-year component of the Bloomberg Barclays Municipal Bond Index, which is an unmanaged index composed of long-term tax-exempt bonds with a minimum credit rating of Baa. You cannot invest directly in an index. |
| 7 | iMoneyNet Tax-Free National Institutional Money Market Funds Average is the return of an unmanaged group of money market funds. You cannot invest directly in this average. |
| 8 | Figures represent the percentage of the Fund's long-term investments. These amounts are subject to change and may have changed since the date specified. |
| 9 | The credit quality distribution of portfolio holdings reflected in the chart is based on ratings from Standard & Poor’s, Moody’s Investors Service, and/ or Fitch Ratings Ltd. Credit quality ratings apply to the underlying holdings of the Fund and not to the Fund itself. The percentages of the Fund’s portfolio with the ratings depicted in the chart are calculated based on the total market value of fixed income securities held by the Fund. If a security was rated by all three rating agencies, the middle rating was utilized. If rated by two of three rating agencies, the lower rating was utilized, and if rated by one of the rating agencies, that rating was utilized. Standard & Poor’s rates the creditworthiness of bonds, ranging from AAA (highest) to D (lowest). Ratings from A to CCC may be modified by the addition of a plus (+) or minus (-) sign to show relative standing within the rating categories. Standard & Poor’s rates the creditworthiness of short-term notes from SP-1 (highest) to SP-3 (lowest). Moody’s rates the creditworthiness of bonds, ranging from Aaa (highest) to C (lowest). Ratings Aa to B may be modified by the addition of a number 1 (highest) to 3 (lowest) to show relative standing within the ratings categories. Moody’s rates the creditworthiness of short-term U.S. tax-exempt municipal securities from MIG 1/VMIG 1 (highest) to SG (lowest). Fitch rates the creditworthiness of bonds, ranging from AAA (highest) to D (lowest). Credit quality distribution is subject to change and may have changed since the date specified. |
Wells Fargo Ultra Short-Term Municipal Income Fund | 7
Fund expenses (unaudited)
As a shareholder of the Fund, you incur two types of costs: (1) transaction costs, including sales charges (loads) on purchase payments and contingent deferred sales charges (if any) on redemptions and (2) ongoing costs, including management fees, distribution (12b-1) and/or shareholder servicing fees, and other Fund expenses. This example is intended to help you understand your ongoing costs (in dollars) of investing in the Fund and to compare these costs with the ongoing costs of investing in other mutual funds.
The example is based on an investment of $1,000 invested at the beginning of the six-month period and held for the entire period from July 1, 2020 to December 31, 2020.
Actual expenses
The “Actual” line of the table below provides information about actual account values and actual expenses. You may use the information in this line, together with the amount you invested, to estimate the expenses that you paid over the period. Simply divide your account value by $1,000 (for example, an $8,600 account value divided by $1,000 = 8.6), then multiply the result by the number in the “Actual” line under the heading entitled “Expenses paid during period” for your applicable class of shares to estimate the expenses you paid on your account during this period.
Hypothetical example for comparison purposes
The “Hypothetical” line of the table below provides information about hypothetical account values and hypothetical expenses based on the Fund’s actual expense ratio and an assumed rate of return of 5% per year before expenses, which is not the Fund’s actual return. The hypothetical account values and expenses may not be used to estimate the actual ending account balance or expenses you paid for the period. You may use this information to compare the ongoing costs of investing in the Fund and other funds. To do so, compare this 5% hypothetical example with the 5% hypothetical examples that appear in the shareholder reports of the other funds.
Please note that the expenses shown in the table are meant to highlight your ongoing costs only and do not reflect any transactional costs, such as sales charges (loads) and contingent deferred sales charges. Therefore, the “Hypothetical” line of the table is useful in comparing ongoing costs only and will not help you determine the relative total costs of owning different funds. In addition, if these transactional costs were included, your costs would have been higher.
| | Beginning
account value
7-1-2020 | Ending
account value
12-31-2020 | Expenses
paid during
the period1 | Annualized net
expense ratio |
| Class A | | | | |
| Actual | $1,000.00 | $1,004.69 | $2.53 | 0.50% |
| Hypothetical (5% return before expenses) | $1,000.00 | $1,022.68 | $2.55 | 0.50% |
| Class A2 | | | | |
| Actual | $1,000.00 | $1,004.66 | $2.53 | 0.50% |
| Hypothetical (5% return before expenses) | $1,000.00 | $1,022.68 | $2.55 | 0.50% |
| Class C | | | | |
| Actual | $1,000.00 | $1,007.50 | $5.11 | 1.01% |
| Hypothetical (5% return before expenses) | $1,000.00 | $1,020.11 | $5.14 | 1.01% |
| Class R6 | | | | |
| Actual | $1,000.00 | $1,006.19 | $1.01 | 0.20% |
| Hypothetical (5% return before expenses) | $1,000.00 | $1,024.20 | $1.02 | 0.20% |
| Administrator Class | | | | |
| Actual | $1,000.00 | $1,004.66 | $2.53 | 0.50% |
| Hypothetical (5% return before expenses) | $1,000.00 | $1,022.68 | $2.55 | 0.50% |
| Institutional Class | | | | |
| Actual | $1,000.00 | $1,005.93 | $1.26 | 0.25% |
| Hypothetical (5% return before expenses) | $1,000.00 | $1,023.95 | $1.28 | 0.25% |
1 Expenses paid is equal to the annualized net expense ratio of each class multiplied by the average account value over the period, multiplied by the number of days in the most recent fiscal half-year divided by the number of days in the fiscal year (to reflect the one-half-year period).
8 | Wells Fargo Ultra Short-Term Municipal Income Fund
Portfolio of investments—December 31, 2020 (unaudited)
| | | | | Principal | Value |
| Closed end municipal bond fund obligations: 1.68% | | | | | |
| California: 0.30% | | | | | |
| Nuveen California AMT-Free Quality Municipal Income Fund MuniFund Preferred Shares Series A (70 shares) 0.51% 144Aø | | | | $ 7,000,000 | 7,000,000 |
| New York: 1.04% | | | | | |
| Nuveen New York Quality Municipal Income Fund Institutional MuniFund Term Preferred Shares (242 shares) 0.51% 144Aø | | | | 24,200,000 | 24,200,000 |
| Other: 0.34% | | | | | |
| Nuveen AMT Quality Municipal Income Fund MuniFund Preferred Shares Series 1-2118 (30 shares) 0.19% 144Aø | | | | 3,000,000 | 3,000,000 |
| Nuveen AMT-Free Municipal Credit Income Fund MuniFund Preferred Shares Series B (50 shares) 0.51% 144Aø | | | | 5,000,000 | 5,000,000 |
| | | | | | 8,000,000 |
| Total Closed end municipal bond fund obligations (Cost $39,200,000) | | | | | 39,200,000 |
| | | Interest
rate | Maturity
date | | |
| Municipal obligations: 98.17% | | | | | |
| Alabama: 4.28% | | | | | |
| Health revenue: 1.77% | | | | | |
| Alabama Health Care Authority for Baptist Health Series B (AGC Insured)€ | | 0.19 | 11-15-2037 | 18,250,000 | 18,250,000 |
| Alabama Health Care Authority for Baptist Health Series B ø | | 0.35 | 11-1-2042 | 8,200,000 | 8,200,000 |
| East Alabama Health Care Authority Series B ø | | 0.28 | 9-1-2039 | 14,829,000 | 14,829,000 |
| | | | | | 41,279,000 |
| Utilities revenue: 2.51% | | | | | |
| Alabama Black Belt Energy Gas District Series A (Royal Bank of Canada LIQ) | | 4.00 | 7-1-2046 | 18,635,000 | 18,853,961 |
| Alabama Black Belt Energy Gas District Series A (Royal Bank of Canada LIQ) | | 4.00 | 8-1-2047 | 4,415,000 | 4,636,677 |
| Black Belt Energy Gas District Project 4 Series A-1 | | 4.00 | 6-1-2022 | 500,000 | 524,180 |
| Chatom AL Industrial Development Board Alabama Electric Series A (National Rural Utilities Cooperative Finance SPA)ø | | 0.38 | 8-1-2037 | 9,832,000 | 9,832,000 |
| Southeast Alabama Gas Supply District Project #1 Series A | | 4.00 | 4-1-2049 | 4,000,000 | 4,413,080 |
| Tender Option Bond Trust Receipts/Floater Certificates Series 2016-XM0184 (Morgan Stanley Bank LIQ)144Aø | | 0.59 | 9-1-2046 | 20,400,000 | 20,400,000 |
| | | | | | 58,659,898 |
| | | | | | 99,938,898 |
The accompanying notes are an integral part of these financial statements.
Wells Fargo Ultra Short-Term Municipal Income Fund | 9
Portfolio of investments—December 31, 2020 (unaudited)
| | | Interest
rate | Maturity
date | Principal | Value |
| Alaska: 0.18% | | | | | |
| Miscellaneous revenue: 0.18% | | | | | |
| Alaska Municipal Bond Bank Series 1 | | 5.00% | 12-1-2023 | $ 1,900,000 | $ 2,141,698 |
| Alaska Municipal Bond Bank Series 1 | | 5.00 | 12-1-2024 | 1,750,000 | 2,043,894 |
| | | | | | 4,185,592 |
| Arizona: 1.72% | | | | | |
| Education revenue: 0.08% | | | | | |
| Arizona Tender Option Bond Trust Receipts/Floater Certificates Series 2020-XF2862 (Mizuho Capital Markets LLC LOC, Mizuho Capital Markets LLC LIQ)144Aø | | 0.29 | 12-15-2047 | 2,000,000 | 2,000,000 |
| Health revenue: 1.06% | | | | | |
| Maricopa County AZ IDA Series A | | 5.00 | 1-1-2048 | 3,910,000 | 4,220,923 |
| Scottsdale AZ IDA Healthcare Series F (AGM Insured)€ | | 0.17 | 9-1-2045 | 20,500,000 | 20,500,000 |
| | | | | | 24,720,923 |
| Industrial development revenue: 0.45% | | | | | |
| Chandler AZ IDA Intel Corporation Project | | 2.70 | 12-1-2037 | 3,325,000 | 3,512,530 |
| Phoenix AZ IDA Various Republic Services Incorporated Projects | | 0.30 | 12-1-2035 | 7,000,000 | 6,999,930 |
| | | | | | 10,512,460 |
| Utilities revenue: 0.13% | | | | | |
| Salt Verde AZ Financial Corporation | | 5.25 | 12-1-2021 | 2,900,000 | 3,015,101 |
| | | | | | 40,248,484 |
| Arkansas: 0.52% | | | | | |
| Health revenue: 0.26% | | | | | |
| Batesville AK Public Facilities Board Hospital White River Health System Incorporated | | 5.00 | 6-1-2024 | 1,345,000 | 1,461,692 |
| Boone County AR Hospital Construction Series 2006 (BOKF NA LOC)ø | | 3.00 | 5-1-2037 | 4,700,000 | 4,700,000 |
| | | | | | 6,161,692 |
| Housing revenue: 0.26% | | | | | |
| Arkansas Development Finance Authority Multifamily Housing Homes Project (Department of Housing and Urban Development Insured) | | 1.20 | 3-1-2024 | 6,000,000 | 6,074,279 |
| | | | | | 12,235,971 |
| California: 7.10% | | | | | |
| Airport revenue: 0.15% | | | | | |
| Port Oakland CA Revenue Refunding Intermediate Lien Series H %% | | 5.00 | 5-1-2022 | 2,700,000 | 2,845,638 |
| San Francisco CA City & County Airports Commission AMT Series H | | 5.00 | 5-1-2021 | 735,000 | 745,797 |
| | | | | | 3,591,435 |
| Health revenue: 2.37% | | | | | |
| California HFFA Kaiser Permanente Series C | | 5.00 | 8-1-2031 | 2,450,000 | 2,662,856 |
The accompanying notes are an integral part of these financial statements.
10 | Wells Fargo Ultra Short-Term Municipal Income Fund
Portfolio of investments—December 31, 2020 (unaudited)
| | | Interest
rate | Maturity
date | Principal | Value |
| Health revenue (continued) | | | | | |
| California Statewide CDA Emanate Health Series A | | 5.00% | 4-1-2025 | $ 750,000 | $ 892,268 |
| California Statewide CDA Health Facilities Catholic Series D (AGM Insured)€ | | 0.05 | 7-1-2041 | 25,175,000 | 25,175,000 |
| California Statewide CDA Health Facilities Catholic Series E (AGM Insured)€ | | 0.19 | 7-1-2040 | 50,000 | 50,000 |
| California Statewide CDA Health Facilities Catholic Series F (AGM Insured)€ | | 0.17 | 7-1-2040 | 15,025,000 | 15,025,000 |
| Palomar CA Pomerado Health Care District Certificate of Participation Series A (AGM Insured)€ | | 0.57 | 11-1-2036 | 9,425,000 | 9,425,000 |
| Palomar CA Pomerado Health Care District Certificate of Participation Series B (AGM Insured)€ | | 0.57 | 11-1-2036 | 1,300,000 | 1,300,000 |
| Palomar CA Pomerado Health Care District Certificate of Participation Series C (AGM Insured)€ | | 0.57 | 11-1-2036 | 775,000 | 775,000 |
| | | | | | 55,305,124 |
| Housing revenue: 0.74% | | | | | |
| California HFA MFHR | | 1.45 | 4-1-2024 | 3,500,000 | 3,531,115 |
| California Municipal Finance Authority Housing Revenue Dino Papavero Apartments Project | | 1.50 | 6-1-2022 | 8,700,000 | 8,741,238 |
| Deutsche Bank Spears Series DBE-8061 (Deutsche Bank LIQ)144Aø | | 0.69 | 1-1-2060 | 4,000,000 | 4,000,000 |
| Mizuho Floater/Residual Trust Tender Option Bond (Mizuho Capital Markets LLC LIQ)144Aø | | 0.29 | 10-1-2036 | 892,000 | 892,000 |
| | | | | | 17,164,353 |
| Industrial development revenue: 0.51% | | | | | |
| California Infrastructure and Economic Development Bank Revenue AMT Brightline West Passenger 144A | | 0.45 | 1-1-2050 | 12,000,000 | 12,011,160 |
| Miscellaneous revenue: 0.43% | | | | | |
| California Infrastructure & Economic Development Bank The J. Paul Getty Trust Series A-1 (1 Month LIBOR+0.33%)± | | 0.44 | 10-1-2047 | 5,000,000 | 5,004,300 |
| California Infrastructure & Economic Development Bank The J. Paul Getty Trust Series B-2 (1 Month LIBOR+0.20%)± | | 0.31 | 10-1-2047 | 5,000,000 | 5,000,050 |
| | | | | | 10,004,350 |
| Resource recovery revenue: 0.67% | | | | | |
| California Municipal Finance Authority Republic Services øø | | 0.23 | 9-1-2021 | 5,550,000 | 5,550,000 |
| California PCFA Series A 144Aøø | | 0.30 | 8-1-2023 | 10,000,000 | 9,999,900 |
| | | | | | 15,549,900 |
| Tax revenue: 2.16% | | | | | |
| California Tender Option Bond Trust Receipts/Floater Certificates Series 2020-YX1142 (Barclays Bank plc LOC, Barclays Bank plc LIQ)144Aø | | 0.19 | 10-1-2049 | 1,000,000 | 1,000,000 |
| Mizuho Tender Option Bond Trust Receipts/Floater Certificates Series 2019-MIZ9002 (Mizuho Capital Markets LLC LOC, Mizuho Capital Markets LLC LIQ)144Aø | | 0.29 | 3-1-2021 | 23,000,000 | 23,000,000 |
The accompanying notes are an integral part of these financial statements.
Wells Fargo Ultra Short-Term Municipal Income Fund | 11
Portfolio of investments—December 31, 2020 (unaudited)
| | | Interest
rate | Maturity
date | Principal | Value |
| Tax revenue (continued) | | | | | |
| Mizuho Tender Option Bond Trust Receipts/Floater Certificates Series 2019-MIZ9003 (Mizuho Capital Markets LLC LOC, Mizuho Capital Markets LLC LIQ)144Aø | | 0.29% | 3-1-2036 | $16,295,000 | $ 16,295,000 |
| Santa Clara Valley CA Transportation Series B (TD Bank NA SPA)ø | | 0.06 | 4-1-2036 | 10,000,000 | 10,000,000 |
| | | | | | 50,295,000 |
| Utilities revenue: 0.07% | | | | | |
| School Project for Utility Rate Reduction California Revenue Anticipation Notes | | 1.00 | 8-1-2021 | 1,715,000 | 1,722,186 |
| | | | | | 165,643,508 |
| Colorado: 0.56% | | | | | |
| Airport revenue: 0.09% | | | | | |
| Denver CO City and County Airport Revenue AMT Series B 2 | | 5.00 | 11-15-2031 | 1,840,000 | 2,205,222 |
| Health revenue: 0.02% | | | | | |
| Colorado Health Facilities Authority Catholic Health Initiatives Series B-3 | | 4.00 | 1-1-2024 | 530,000 | 559,500 |
| Miscellaneous revenue: 0.21% | | | | | |
| Colorado Bridge Enterprise Central 70 Project | | 4.00 | 6-30-2024 | 2,000,000 | 2,204,680 |
| Colorado Bridge Enterprise Central 70 Project Series 2017 | | 4.00 | 12-31-2023 | 1,385,000 | 1,512,185 |
| Colorado State Bridge Enterprise Senior Revenue Bonds AMT Central 70 Project Private Activity | | 4.00 | 12-31-2024 | 1,000,000 | 1,118,270 |
| | | | | | 4,835,135 |
| Tax revenue: 0.02% | | | | | |
| Regional Transportation District Colorado Private Activity Revenue Denver Trans Partners Eagle P3 | | 5.00 | 7-15-2024 | 300,000 | 345,606 |
| Transportation revenue: 0.19% | | | | | |
| Colorado E-470 Public Highway Authority Series A (1 Month LIBOR+0.42%)± | | 0.52 | 9-1-2039 | 4,500,000 | 4,495,275 |
| Water & sewer revenue: 0.03% | | | | | |
| Central Weld County CO Water District Water Revenue (AGM Insured) | | 5.00 | 12-1-2025 | 520,000 | 633,074 |
| | | | | | 13,073,812 |
| Connecticut: 3.00% | | | | | |
| Education revenue: 0.79% | | | | | |
| Connecticut HEFAR Yale University Issue Series A | | 1.10 | 7-1-2048 | 7,000,000 | 7,112,140 |
| Connecticut HEFAR Yale University issue Series B | | 0.55 | 7-1-2037 | 8,000,000 | 8,126,800 |
| Connecticut Higher Education Supplemental Loan Authority Chesla Loan Program | | 5.00 | 11-15-2022 | 1,350,000 | 1,458,608 |
| Connecticut Higher Education Supplemental Loan Authority Chesla Loan Program | | 5.00 | 11-15-2024 | 585,000 | 678,740 |
The accompanying notes are an integral part of these financial statements.
12 | Wells Fargo Ultra Short-Term Municipal Income Fund
Portfolio of investments—December 31, 2020 (unaudited)
| | | Interest
rate | Maturity
date | Principal | Value |
| Education revenue (continued) | | | | | |
| Connecticut Higher Education Supplemental Loan Authority Chesla Loan Program Series B | | 5.00% | 11-15-2021 | $ 545,000 | $ 565,754 |
| Connecticut Higher Education Supplemental Loan Authority Chesla Loan Program Series B | | 5.00 | 11-15-2023 | 440,000 | 492,070 |
| | | | | | 18,434,112 |
| GO revenue: 0.59% | | | | | |
| Bridgeport CT Series A | | 5.00 | 6-1-2023 | 655,000 | 710,629 |
| Bridgeport CT Series A | | 5.00 | 6-1-2024 | 800,000 | 894,752 |
| Bridgeport CT Series A | | 5.00 | 6-1-2025 | 2,695,000 | 3,099,681 |
| Connecticut Series A %% | | 3.00 | 1-15-2025 | 3,000,000 | 3,307,230 |
| Connecticut Series C | | 3.00 | 6-1-2022 | 1,050,000 | 1,090,635 |
| Connecticut Series C | | 3.00 | 6-1-2023 | 600,000 | 638,700 |
| Connecticut Series C | | 3.00 | 6-1-2024 | 1,055,000 | 1,149,401 |
| Connecticut Series C | | 4.00 | 6-1-2023 | 400,000 | 435,276 |
| Connecticut Series C | | 4.00 | 6-1-2024 | 500,000 | 561,650 |
| West Haven CT BAN Series B | | 2.00 | 9-30-2021 | 2,000,000 | 2,017,040 |
| | | | | | 13,904,994 |
| Housing revenue: 1.40% | | | | | |
| Connecticut HFA Series 25 | | 2.30 | 6-15-2021 | 950,000 | 957,458 |
| Connecticut HFA Series 25 | | 2.50 | 6-15-2022 | 840,000 | 863,621 |
| Connecticut HFA Series A 3 (Helaba SPA)ø | | 0.08 | 11-15-2047 | 28,340,000 | 28,340,000 |
| Waterbury CT Housing Authority Multifamily Housing Exchange Place Project | | 0.40 | 2-1-2023 | 2,500,000 | 2,500,050 |
| | | | | | 32,661,129 |
| Miscellaneous revenue: 0.09% | | | | | |
| Bridgeport CT Grant Anticipation Notes | | 1.50 | 12-9-2021 | 2,000,000 | 2,015,180 |
| Tax revenue: 0.13% | | | | | |
| Connecticutial Tax Obligation Revenue Transportation Infrastructure Purpose | | 5.00 | 5-1-2023 | 375,000 | 415,616 |
| Connecticutial Tax Obligation Revenue Transportation Infrastructure Purpose | | 5.00 | 5-1-2024 | 1,000,000 | 1,152,610 |
| Connecticutial Tax Obligation Revenue Transportation Infrastructure Purpose | | 5.00 | 5-1-2025 | 1,150,000 | 1,373,399 |
| | | | | | 2,941,625 |
| | | | | | 69,957,040 |
| District of Columbia: 2.43% | | | | | |
| Education revenue: 0.88% | | | | | |
| Tender Option Bond Trust Receipts/Floater Certificates Series 2016-XG0094 (Deutsche Bank LIQ)144Aø | | 0.24 | 10-1-2041 | 20,560,000 | 20,560,000 |
| Housing revenue: 1.28% | | | | | |
| District of Columbia HFA MFHR Liberty Place Apartments Project | | 0.50 | 12-1-2021 | 9,800,000 | 9,806,174 |
| District of Columbia HFA Park Southern Apartments Project (FHA Insured) | | 0.70 | 6-1-2024 | 20,000,000 | 20,038,200 |
| | | | | | 29,844,374 |
The accompanying notes are an integral part of these financial statements.
Wells Fargo Ultra Short-Term Municipal Income Fund | 13
Portfolio of investments—December 31, 2020 (unaudited)
| | | Interest
rate | Maturity
date | Principal | Value |
| Transportation revenue: 0.27% | | | | | |
| Washington DC Metropolitan Area Transit Authority Series A | | 5.00% | 7-15-2023 | $ 3,600,000 | $ 4,027,716 |
| Washington DC Metropolitan Area Transit Authority Series A | | 5.00 | 7-15-2024 | 2,000,000 | 2,329,960 |
| | | | | | 6,357,676 |
| | | | | | 56,762,050 |
| Florida: 2.63% | | | | | |
| Airport revenue: 0.16% | | | | | |
| Miami Dade County FL Aviation Revenue Refunding Series A | | 5.00 | 10-1-2024 | 2,500,000 | 2,926,575 |
| Miami-Dade County FL Seaport Series A | | 5.00 | 10-1-2021 | 855,000 | 881,266 |
| | | | | | 3,807,841 |
| Education revenue: 0.35% | | | | | |
| Florida HEFAR Florida Institute of Technology | | 5.00 | 10-1-2023 | 500,000 | 538,380 |
| Florida HEFAR Florida Institute of Technology | | 5.00 | 10-1-2024 | 250,000 | 275,268 |
| Tender Option Bond Trust Receipts/Certificates (Morgan Stanley Bank LIQ)144Aø | | 0.34 | 4-1-2053 | 7,325,000 | 7,325,000 |
| | | | | | 8,138,648 |
| Health revenue: 0.19% | | | | | |
| Miami-Dade County FL Health Facilities Authority Miami Children's Hospital Project Series A | | 5.25 | 8-1-2021 | 145,000 | 145,481 |
| North Broward FL Hospital District Series B ## | | 5.00 | 1-1-2021 | 925,000 | 925,000 |
| Tender Option Bond Trust Receipts/Certificates (JPMorgan Chase & Company LIQ)144Aø | | 0.19 | 2-15-2026 | 3,225,000 | 3,225,000 |
| | | | | | 4,295,481 |
| Housing revenue: 0.66% | | | | | |
| Deutsche Bank Spears Series DBE-8055 (Deutsche Bank LOC, Deutsche Bank LIQ)144Aø | | 0.69 | 11-1-2058 | 10,000,000 | 10,000,000 |
| Florida Housing Finance Corporation Multifamily Mortgage Parrish Oaks Series A | | 1.25 | 2-1-2023 | 500,000 | 505,175 |
| Florida Housing Finance Corporation Series 1 (GNMA/FNMA/FHLMC Insured)## | | 1.95 | 1-1-2021 | 1,085,000 | 1,085,000 |
| Florida Housing Finance Corporation Series 1 (GNMA/FNMA/FHLMC Insured) | | 2.00 | 7-1-2021 | 775,000 | 780,634 |
| Florida Housing Finance Corporation Series 1 (GNMA/FNMA/FHLMC Insured) | | 2.05 | 1-1-2022 | 570,000 | 578,533 |
| Miami-Dade County FL HFA Multifamily Housing Revenue øø | | 0.60 | 12-1-2022 | 2,500,000 | 2,501,725 |
| | | | | | 15,451,067 |
| Industrial development revenue: 0.86% | | | | | |
| Martin County FL PCR Adjusted Refunding Florida Power And Light Company Project ø | | 0.13 | 7-15-2022 | 20,000,000 | 20,000,000 |
| Miscellaneous revenue: 0.34% | | | | | |
| Pasco County FL School Board Certificates Participation Sifma Index Rate Certificates (SIFMA Municipal Swap+0.75%)± | | 0.84 | 8-1-2032 | 8,000,000 | 8,022,400 |
The accompanying notes are an integral part of these financial statements.
14 | Wells Fargo Ultra Short-Term Municipal Income Fund
Portfolio of investments—December 31, 2020 (unaudited)
| | | Interest
rate | Maturity
date | Principal | Value |
| Tax revenue: 0.05% | | | | | |
| Miami FL Special Obligation Refunding Bond Street & Sidewalk Improvement Program (AGM Insured)144A## | | 5.00% | 1-1-2021 | $ 1,060,000 | $ 1,060,000 |
| Transportation revenue: 0.02% | | | | | |
| Miami Dade County FL Expressway Authority Series B | | 5.00 | 7-1-2022 | 460,000 | 489,389 |
| | | | | | 61,264,826 |
| Georgia: 1.72% | | | | | |
| Health revenue: 0.10% | | | | | |
| Cobb County GA Kennestone Hospital Authority Anticipation Certificates Wellstar %% | | 5.00 | 4-1-2024 | 1,300,000 | 1,485,783 |
| Cobb County GA Kennestone Hospital Authority Anticipation Certificates Wellstar | | 5.00 | 4-1-2025 | 660,000 | 783,664 |
| | | | | | 2,269,447 |
| Housing revenue: 0.56% | | | | | |
| Clayton County GA Housing Authority Renaissance at Garden Walk Apartments Project | | 2.30 | 6-1-2022 | 13,000,000 | 13,103,740 |
| Utilities revenue: 1.06% | | | | | |
| Burke County GA Development Authority Georgia Power Company Plant Vogtle Project | | 1.55 | 12-1-2049 | 4,000,000 | 4,063,840 |
| Burke County GA Development Authority Georgia Power Company Plant Vogtle Project Fifth Series 1995 | | 2.05 | 10-1-2032 | 1,850,000 | 1,876,548 |
| Burke County GA Development Authority Georgia Power Company Plant Vogtle Project First Series 2008 | | 1.65 | 11-1-2048 | 2,795,000 | 2,810,792 |
| Burke County GA Development Authority Georgia Power Company Plant Vogtle Project First St Series ø | | 0.11 | 7-1-2049 | 10,700,000 | 10,700,000 |
| Monroe County GA Development Authority Power Company Plant Scherer Project First Series 2009 | | 2.05 | 7-1-2049 | 2,545,000 | 2,581,521 |
| Municipal Electric Authority Georgia Project One Subordinated Bond Series A | | 5.00 | 1-1-2022 | 2,500,000 | 2,615,175 |
| | | | | | 24,647,876 |
| | | | | | 40,021,063 |
| Guam: 0.11% | | | | | |
| Airport revenue: 0.11% | | | | | |
| Guam International Airport Authority AMT Refunding Bond Series A | | 3.00 | 10-1-2021 | 55,000 | 55,251 |
| Guam International Airport Authority AMT Refunding Bond Series A | | 5.00 | 10-1-2022 | 1,000,000 | 1,044,150 |
| Guam International Airport Authority AMT Refunding Bond Series A | | 5.00 | 10-1-2023 | 1,395,000 | 1,486,931 |
| | | | | | 2,586,332 |
| Hawaii: 0.08% | | | | | |
| Health revenue: 0.08% | | | | | |
| Hawaii Department of Budget & Finance Queens Health System Series B (SIFMA Municipal Swap+0.45%)± | | 0.54 | 7-1-2039 | 1,955,000 | 1,955,000 |
The accompanying notes are an integral part of these financial statements.
Wells Fargo Ultra Short-Term Municipal Income Fund | 15
Portfolio of investments—December 31, 2020 (unaudited)
| | | Interest
rate | Maturity
date | Principal | Value |
| Idaho: 0.17% | | | | | |
| Housing revenue: 0.17% | | | | | |
| Idaho Housing & Finance Association Series A ø | | 0.24% | 1-1-2038 | $ 4,000,000 | $ 4,000,000 |
| Illinois: 7.36% | | | | | |
| Airport revenue: 0.14% | | | | | |
| Chicago IL Midway Airport Revenue Refunding Second Lien Series B ## | | 5.00 | 1-1-2021 | 3,200,000 | 3,200,000 |
| Education revenue: 0.06% | | | | | |
| University of Illinois Auxiliary Facilities Series A | | 5.00 | 4-1-2022 | 1,070,000 | 1,126,100 |
| University of Illinois Auxiliary Facilities Series A | | 5.00 | 4-1-2024 | 350,000 | 353,605 |
| | | | | | 1,479,705 |
| GO revenue: 1.34% | | | | | |
| Chicago IL CAB City Colleges (National Insured)¤ | | 0.00 | 1-1-2024 | 3,670,000 | 3,428,514 |
| Chicago IL Series A | | 5.00 | 1-1-2025 | 2,500,000 | 2,761,300 |
| Chicago IL Series C ## | | 5.00 | 1-1-2021 | 1,565,000 | 1,565,000 |
| Cook County IL Refunding Bond Series C | | 5.00 | 11-15-2022 | 3,045,000 | 3,274,867 |
| Illinois ## | | 5.00 | 2-1-2021 | 3,115,000 | 3,124,096 |
| Illinois | | 5.00 | 1-1-2022 | 5,915,000 | 6,143,615 |
| Illinois Series 2016 | | 5.00 | 11-1-2021 | 5,380,000 | 5,553,882 |
| Lake County IL Water Sewerage System Grainger Incorporated Project (Northern Trust Company LIQ)ø | | 0.22 | 4-1-2021 | 1,500,000 | 1,500,000 |
| Waukegan IL Series 2018B (AGM Insured) | | 4.00 | 12-30-2021 | 800,000 | 826,864 |
| Whiteside & Lee County IL Community Unit School District 5 Series A (BAM Insured) | | 4.00 | 12-1-2022 | 1,375,000 | 1,457,500 |
| Whiteside & Lee County IL Community Unit School District 5 Series A (BAM Insured) | | 4.00 | 12-1-2023 | 1,435,000 | 1,561,926 |
| | | | | | 31,197,564 |
| Health revenue: 0.56% | | | | | |
| Illinois Finance Authority Ascension Health Alliance Senior Credit Group Series E-2 | | 1.75 | 11-15-2042 | 2,970,000 | 2,980,425 |
| Illinois Finance Authority Healthcare System Series B-1 | | 5.00 | 5-15-2050 | 1,200,000 | 1,374,816 |
| Illinois Finance Authority Mercy Health Corporation | | 5.00 | 12-1-2021 | 1,165,000 | 1,209,806 |
| Illinois Finance Authority Presbyterian Homes Obligated Group Series B (1 Month LIBOR+1.35%)± | | 1.46 | 5-1-2036 | 6,410,000 | 6,410,769 |
| Illinois Finance Authority Rehabilitation Institute of Chicago | | 5.00 | 7-1-2023 | 1,100,000 | 1,198,824 |
| | | | | | 13,174,640 |
| Housing revenue: 0.21% | | | | | |
| Illinois Tender Option Bond Trust Receipts/Floater Certificates Series 2020-YX1119 (GNMA/FNMA/FHLMC Insured, Barclays Bank plc LIQ)144Aø | | 0.14 | 4-1-2041 | 4,880,000 | 4,880,000 |
| Miscellaneous revenue: 2.12% | | | | | |
| Chicago IL Board of Education Series B | | 5.00 | 12-1-2022 | 1,500,000 | 1,583,115 |
| Chicago IL Board of Education Series B | | 5.00 | 12-1-2023 | 1,150,000 | 1,239,505 |
| Illinois Refunding Bond | | 5.00 | 8-1-2022 | 2,290,000 | 2,423,141 |
The accompanying notes are an integral part of these financial statements.
16 | Wells Fargo Ultra Short-Term Municipal Income Fund
Portfolio of investments—December 31, 2020 (unaudited)
| | | Interest
rate | Maturity
date | Principal | Value |
| Miscellaneous revenue (continued) | | | | | |
| Illinois Series D | | 5.00% | 11-1-2021 | $ 9,820,000 | $ 10,098,004 |
| Illinois Tender Option Bond Trust Receipts/Floater Certificates Series 2020-XF2854 (Barclays Bank plc LOC, Barclays Bank plc LIQ)144Aø | | 0.27 | 6-15-2050 | 34,160,000 | 34,160,000 |
| | | | | | 49,503,765 |
| Tax revenue: 2.74% | | | | | |
| Illinois Regional Transportation Authority Series B-RMKT øø | | 0.80 | 6-1-2025 | 29,530,000 | 29,530,000 |
| Illinois Series A | | 5.00 | 6-1-2021 | 1,455,000 | 1,478,542 |
| Illinois Tender Option Bond Trust Receipts/Floater Certificates Series 2018-XF0603 (Royal Bank of Canada LIQ)144Aø | | 0.30 | 1-1-2026 | 2,265,000 | 2,265,000 |
| Illinois Tender Option Bond Trust Receipts/Floater Certificates Series 2018-XL0093 (Barclays Bank plc LIQ)144Aø | | 0.24 | 1-1-2048 | 8,000,000 | 8,000,000 |
| Illinois Tender Option Bond Trust Receipts/Floater Certificates Series 2018-XM0683 (Bank of America NA LIQ)144Aø | | 0.30 | 1-1-2048 | 8,340,000 | 8,340,000 |
| lllinois Tender Option Bond Trust Receipts/Floater Certificates Series 2018-XM0713 (Morgan Stanley Bank LIQ)144Aø | | 0.29 | 1-1-2043 | 8,000,000 | 8,000,000 |
| Metropolitan Pier & Exposition Authority McCormick Place Project Non-Callable Bond Series B | | 5.00 | 12-15-2022 | 5,925,000 | 6,303,430 |
| | | | | | 63,916,972 |
| Water & sewer revenue: 0.19% | | | | | |
| Chicago IL Wastewater Transmission Revenue CAB Refunding Series A (National Insured)¤ | | 0.00 | 1-1-2022 | 3,265,000 | 3,240,904 |
| South Sangamon IL Water Commission (AGM Insured) | | 4.00 | 1-1-2023 | 500,000 | 528,170 |
| South Sangamon IL Water Commission (AGM Insured) | | 4.00 | 1-1-2026 | 500,000 | 560,940 |
| | | | | | 4,330,014 |
| | | | | | 171,682,660 |
| Indiana: 0.81% | | | | | |
| Industrial development revenue: 0.11% | | | | | |
| Whiting IN Environmental Facilities North America Incorporated Project | | 5.00 | 11-1-2047 | 2,250,000 | 2,630,970 |
| Miscellaneous revenue: 0.45% | | | | | |
| Indiana Bond Bank Advance Funding Program Series A | | 3.00 | 1-11-2021 | 1,000,000 | 1,000,540 |
| Indianapolis IN Local Public Improvement Bond Bank Fieldhouse Project Series B | | 1.45 | 6-1-2021 | 9,500,000 | 9,500,380 |
| | | | | | 10,500,920 |
| Utilities revenue: 0.25% | | | | | |
| Mount Vernon Industry Environmental Southern Industry Gas and Electric Company | | 0.88 | 9-1-2055 | 5,750,000 | 5,754,888 |
| | | | | | 18,886,778 |
The accompanying notes are an integral part of these financial statements.
Wells Fargo Ultra Short-Term Municipal Income Fund | 17
Portfolio of investments—December 31, 2020 (unaudited)
| | | Interest
rate | Maturity
date | Principal | Value |
| Kansas: 0.60% | | | | | |
| Health revenue: 0.11% | | | | | |
| Wichita KS HCFR Presbyterian Manors Obligated Group | | 4.00% | 5-15-2022 | $ 1,250,000 | $ 1,260,350 |
| Wichita KS HCFR Series I | | 3.75 | 5-15-2023 | 1,410,000 | 1,416,007 |
| | | | | | 2,676,357 |
| Housing revenue: 0.36% | | | | | |
| Kansas HFA Forest Glen Apartments Project Series B | | 1.66 | 7-1-2022 | 8,300,000 | 8,353,867 |
| Utilities revenue: 0.13% | | | | | |
| Burlington KS Environmental Impact Series A ø | | 0.20 | 9-1-2035 | 3,000,000 | 3,000,000 |
| | | | | | 14,030,224 |
| Kentucky: 1.27% | | | | | |
| Airport revenue: 0.05% | | | | | |
| Louisville KY Regional Airport Authority Refunding Bond AMT Series A | | 5.00 | 7-1-2021 | 1,250,000 | 1,275,625 |
| Health revenue: 0.04% | | | | | |
| Kentucky EDFA Owensboro Health Incorporated Series A | | 5.00 | 6-1-2021 | 825,000 | 834,826 |
| Housing revenue: 0.43% | | | | | |
| Kentucky Housing Corporation MFHR City View Park Project | | 1.16 | 2-1-2023 | 10,000,000 | 10,107,900 |
| Transportation revenue: 0.10% | | | | | |
| Kentucky Asset / Liability Commission Agency Fund Revenue Refunding Project Notes Federal Highway Trust Fund | | 5.00 | 9-1-2021 | 2,195,000 | 2,263,682 |
| Utilities revenue: 0.48% | | | | | |
| Louisville & Jefferson Counties KY Metro Government PCR Series B | | 2.55 | 11-1-2027 | 6,500,000 | 6,539,065 |
| Paducah KY Electric Plant Board Refunding Bond | | 5.00 | 10-1-2021 | 2,305,000 | 2,381,733 |
| Paducah KY Electric Plant Board Refunding Bond | | 5.00 | 10-1-2023 | 1,995,000 | 2,233,403 |
| | | | | | 11,154,201 |
| Water & sewer revenue: 0.17% | | | | | |
| Kentucky Rural Water Finance Corporation Public Project Revenue Construction Notes Series E 2020 1 | | 0.43 | 12-1-2021 | 4,000,000 | 4,000,880 |
| | | | | | 29,637,114 |
| Louisiana: 2.31% | | | | | |
| Airport revenue: 0.26% | | | | | |
| Louisiana Offshore Terminal Authority Deepwater Loop LLC Project Series B-1A | | 2.00 | 10-1-2040 | 5,540,000 | 5,594,015 |
| New Orleans LA Aviation Board Series D-2 ## | | 5.00 | 1-1-2021 | 590,000 | 590,000 |
| | | | | | 6,184,015 |
| Health revenue: 0.24% | | | | | |
| Louisiana Public Facilities Authority Hospital Revenue Louisiana Childrens Medical Center Project | | 5.00 | 6-1-2045 | 5,000,000 | 5,541,550 |
The accompanying notes are an integral part of these financial statements.
18 | Wells Fargo Ultra Short-Term Municipal Income Fund
Portfolio of investments—December 31, 2020 (unaudited)
| | | Interest
rate | Maturity
date | Principal | Value |
| Housing revenue: 0.17% | | | | | |
| Louisiana Housing Corporation Hollywood Acres & Hollywood Heights Project Series 2019 | | 1.44% | 12-1-2023 | $ 4,000,000 | $ 4,042,280 |
| Industrial development revenue: 1.25% | | | | | |
| East Baton Rouge Parish LA Industrial Development Board ExxonMobil Project Series 2010A ø | | 0.10 | 8-1-2035 | 21,000,000 | 21,000,000 |
| Saint John The Baptist Parish LA Revenue Refunding Bond Marathon Oil Corporation Project | | 2.00 | 6-1-2037 | 8,045,000 | 8,161,653 |
| | | | | | 29,161,653 |
| Miscellaneous revenue: 0.39% | | | | | |
| Louisiana Local Government Environmental Facilities and Community Development Authority Subordinated Lien East Baton Rouge | | 0.88 | 2-1-2046 | 9,000,000 | 9,018,810 |
| | | | | | 53,948,308 |
| Maine: 0.09% | | | | | |
| Education revenue: 0.03% | | | | | |
| Maine Student Loan Authority AMT Refunding Student Loan Revenue Bond Class A Series 2019A-1 (AGM Insured) | | 5.00 | 12-1-2021 | 300,000 | 312,237 |
| Maine Student Loan Authority AMT Refunding Student Loan Revenue Bond Class A Series 2019A-1 (AGM Insured) | | 5.00 | 12-1-2022 | 370,000 | 400,762 |
| | | | | | 712,999 |
| Health revenue: 0.06% | | | | | |
| Maine HEFA Series A | | 4.00 | 7-1-2024 | 755,000 | 845,306 |
| Maine HEFA Series A | | 5.00 | 7-1-2023 | 575,000 | 638,940 |
| | | | | | 1,484,246 |
| | | | | | 2,197,245 |
| Maryland: 1.39% | | | | | |
| Health revenue: 0.11% | | | | | |
| Maryland Health and Higher Educational Facilities Authority Revenue Adventist Healthcare Series 2021 %% | | 5.00 | 1-1-2022 | 1,110,000 | 1,118,958 |
| Maryland Health and Higher Educational Facilities Authority Revenue Adventist Healthcare Series 2021 %% | | 5.00 | 1-1-2023 | 795,000 | 827,985 |
| Maryland Health and Higher Educational Facilities Authority Revenue Adventist Healthcare Series 2021 %% | | 5.00 | 1-1-2024 | 540,000 | 579,857 |
| | | | | | 2,526,800 |
The accompanying notes are an integral part of these financial statements.
Wells Fargo Ultra Short-Term Municipal Income Fund | 19
Portfolio of investments—December 31, 2020 (unaudited)
| | | Interest
rate | Maturity
date | Principal | Value |
| Housing revenue: 0.84% | | | | | |
| Maryland Community Development Department Housing Rosemont Tower LLC Series F (FHA/GNMA Insured) | | 2.01% | 11-1-2021 | $ 5,000,000 | $ 5,034,650 |
| Maryland Tender Option Bond Trust Receipts/Floater Certificates Series 2019-XF2832 (Mizuho Capital Markets LLC LOC, Mizuho Capital Markets LLC LIQ)144Aø | | 0.29 | 7-1-2037 | 14,595,000 | 14,595,000 |
| | | | | | 19,629,650 |
| Transportation revenue: 0.44% | | | | | |
| Maryland Transportation Authority Refunding Bond AMT | | 5.00 | 3-1-2021 | 4,000,000 | 4,025,520 |
| Maryland Transportation Authority Refunding Bond AMT | | 5.00 | 3-1-2022 | 6,000,000 | 6,282,780 |
| | | | | | 10,308,300 |
| | | | | | 32,464,750 |
| Massachusetts: 1.24% | | | | | |
| Health revenue: 0.43% | | | | | |
| Massachusetts Development Finance Agency Milford Regional Medical Center Series G 144A | | 5.00 | 7-15-2021 | 130,000 | 132,383 |
| Massachusetts Development Finance Agency Milford Regional Medical Center Series G 144A | | 5.00 | 7-15-2022 | 115,000 | 120,824 |
| Massachusetts Development Finance Agency Milford Regional Medical Center Series G 144A | | 5.00 | 7-15-2023 | 125,000 | 135,975 |
| Massachusetts Development Finance Agency Milford Regional Medical Center Series G 144A | | 5.00 | 7-15-2024 | 125,000 | 139,906 |
| Massachusetts Development Finance Agency Wellforce Incorporate Series C (AGM Insured) | | 5.00 | 10-1-2023 | 635,000 | 710,330 |
| Massachusetts HEFA Partners Healthcare Series G-2 (AGM Insured)€ | | 0.16 | 7-1-2042 | 5,020,000 | 5,020,000 |
| Tender Option Bond Trust Receipts/Floater Certificates Series 2020-XF2891 (Barclays Bank plc LOC, AGM Insured, Barclays Bank plc LIQ)144Aø | | 0.13 | 10-1-2045 | 3,845,000 | 3,845,000 |
| | | | | | 10,104,418 |
| Housing revenue: 0.14% | | | | | |
| Boston MA Housing Authority Capital Program Revenue Refunding Series B | | 5.00 | 10-1-2024 | 650,000 | 755,385 |
| Boston MA Housing Authority Capital Program Revenue Refunding Series B | | 5.00 | 10-1-2025 | 380,000 | 455,962 |
| Massachusetts HFA Series 212 | | 1.45 | 12-1-2049 | 2,000,000 | 2,023,900 |
| | | | | | 3,235,247 |
| Tax revenue: 0.19% | | | | | |
| Massachusetts Bay Transportation Authority Series B-1 | | 5.00 | 7-1-2023 | 1,775,000 | 1,984,113 |
| Massachusetts Bay Transportation Authority Series B-1 | | 5.00 | 7-1-2024 | 2,200,000 | 2,561,526 |
| | | | | | 4,545,639 |
| Transportation revenue: 0.48% | | | | | |
| Massachusetts Department of Transportation Refunding Bond | | 5.00 | 1-1-2039 | 10,175,000 | 11,118,324 |
| | | | | | 29,003,628 |
The accompanying notes are an integral part of these financial statements.
20 | Wells Fargo Ultra Short-Term Municipal Income Fund
Portfolio of investments—December 31, 2020 (unaudited)
| | | Interest
rate | Maturity
date | Principal | Value |
| Michigan: 1.66% | | | | | |
| Education revenue: 0.09% | | | | | |
| Michigan Tender Option Bond Trust Receipts/Certificates Series 2018-ZM0614 (Morgan Stanley Bank LIQ)144Aø | | 0.27% | 11-1-2028 | $ 2,000,000 | $ 2,000,000 |
| Health revenue: 0.36% | | | | | |
| Michigan Finance Authority Bronson Healthcare Group Incorporated Series 2019B | | 3.50 | 11-15-2044 | 800,000 | 842,872 |
| Michigan Finance Authority Mclaren Health Care (SIFMA Municipal Swap+0.50%)± | | 0.59 | 10-15-2038 | 7,500,000 | 7,502,850 |
| | | | | | 8,345,722 |
| Housing revenue: 0.17% | | | | | |
| Michigan Housing Development Authority Series A | | 2.30 | 10-1-2021 | 4,000,000 | 4,005,080 |
| Miscellaneous revenue: 0.46% | | | | | |
| Michigan Finance Auhority State Aid Series A-2 (JPMorgan Chase & Company LOC) | | 4.00 | 8-20-2021 | 10,500,000 | 10,753,575 |
| Tax revenue: 0.40% | | | | | |
| Tender Option Bond Trust Receipts/Certificates (AGM Insured, Morgan Stanley Bank LIQ)144Aø | | 0.39 | 7-1-2043 | 9,410,000 | 9,410,000 |
| Utilities revenue: 0.18% | | | | | |
| Michigan Strategic Fund Limited Obligation Detroit Edison Company Exempt Facilities Project | | 1.45 | 8-1-2029 | 4,300,000 | 4,314,577 |
| | | | | | 38,828,954 |
| Minnesota: 2.30% | | | | | |
| Education revenue: 0.13% | | | | | |
| Minnesota Tender Option Bond Trust Receipts/Certificates Series 2018-XF2760 (Morgan Stanley Bank LIQ)144Aø | | 0.29 | 11-1-2037 | 3,000,000 | 3,000,000 |
| GO revenue: 1.71% | | | | | |
| JPMorgan Chase Puttable Tax-Exempt Receipts Trust Series 5027 (JPMorgan Chase & Company LIQ)144Aø | | 0.29 | 6-1-2021 | 40,000,000 | 40,000,000 |
| Health revenue: 0.10% | | | | | |
| Apple Valley MN Senior Living LLC Project Series B ## | | 4.00 | 1-1-2021 | 545,000 | 545,000 |
| Apple Valley MN Senior Living LLC Project Series B | | 4.00 | 1-1-2022 | 565,000 | 553,513 |
| Minnesota HCFR Maple Grove Hospital Corporation | | 4.00 | 5-1-2021 | 390,000 | 393,557 |
| Minnesota HCFR Maple Grove Hospital Corporation | | 4.00 | 5-1-2022 | 390,000 | 404,278 |
| Minnesota HCFR Maple Grove Hospital Corporation | | 5.00 | 5-1-2023 | 390,000 | 428,130 |
| | | | | | 2,324,478 |
| Housing revenue: 0.20% | | | | | |
| Minnesota Housing Finance Agency Rental Housing Series B | | 0.35 | 2-1-2023 | 4,695,000 | 4,693,122 |
| Miscellaneous revenue: 0.16% | | | | | |
| Lake Agassiz Education Cooperative Certificates of Participation Series A | | 3.00 | 2-1-2022 | 205,000 | 208,963 |
| Lake Agassiz Education Cooperative Certificates of Participation Series A | | 3.00 | 2-1-2023 | 255,000 | 264,211 |
The accompanying notes are an integral part of these financial statements.
Wells Fargo Ultra Short-Term Municipal Income Fund | 21
Portfolio of investments—December 31, 2020 (unaudited)
| | | Interest
rate | Maturity
date | Principal | Value |
| Miscellaneous revenue (continued) | | | | | |
| Lake Agassiz Education Cooperative Certificates of Participation Series A | | 3.00% | 2-1-2024 | $ 265,000 | $ 278,761 |
| Minnesota Rural Water Finance Authority Public Projects Construction | | 1.00 | 8-1-2021 | 3,000,000 | 3,001,740 |
| | | | | | 3,753,675 |
| | | | | | 53,771,275 |
| Mississippi: 0.21% | | | | | |
| Health revenue: 0.21% | | | | | |
| Mississippi Hospital Equipment & Facilities Authority Baptist Memorial Health Care Project | | 0.65 | 9-1-2036 | 5,000,000 | 5,000,950 |
| Missouri: 0.68% | | | | | |
| Health revenue: 0.15% | | | | | |
| RBC Municipal Products Incorporated (Royal Bank of Canada LOC, Royal Bank of Canada LIQ)144Aø | | 0.15 | 9-1-2039 | 3,500,000 | 3,500,000 |
| Miscellaneous revenue: 0.53% | | | | | |
| Bridgeton MO IDA Mestek Machinery Incorporated (Santander Bank NA LOC)ø | | 0.43 | 7-1-2030 | 2,425,000 | 2,425,000 |
| Missouri Public Utilities Commission Interim Construction Notes | | 0.50 | 3-1-2022 | 10,000,000 | 10,006,500 |
| | | | | | 12,431,500 |
| | | | | | 15,931,500 |
| Montana: 0.19% | | | | | |
| Miscellaneous revenue: 0.19% | | | | | |
| Montana Board of Investments INTERCAP Loan Program Municipal Finance Consolidation Act | | 1.00 | 3-1-2042 | 4,500,000 | 4,503,330 |
| Nebraska: 1.11% | | | | | |
| Housing revenue: 0.08% | | | | | |
| Nebraska Investment Finance Authority Series D (GNMA/FNMA/FHLMC Insured) | | 3.65 | 3-1-2021 | 430,000 | 431,944 |
| Nebraska Investment Finance Authority Series D (GNMA/FNMA/FHLMC Insured) | | 3.65 | 9-1-2021 | 1,390,000 | 1,416,118 |
| | | | | | 1,848,062 |
| Utilities revenue: 1.03% | | | | | |
| Nebraska Public Power District Revenue General Series A | | 0.60 | 1-1-2051 | 10,000,000 | 10,034,700 |
| Tender Option Bond Trust Receipts/Certificates Series 2016 XF1053 (Deutsche Bank LIQ)144Aø | | 0.20 | 2-1-2049 | 14,000,000 | 14,000,000 |
| | | | | | 24,034,700 |
| | | | | | 25,882,762 |
The accompanying notes are an integral part of these financial statements.
22 | Wells Fargo Ultra Short-Term Municipal Income Fund
Portfolio of investments—December 31, 2020 (unaudited)
| | | Interest
rate | Maturity
date | Principal | Value |
| Nevada: 1.21% | | | | | |
| GO revenue: 0.12% | | | | | |
| Clark County NV School District Refunding Bond Limited Tax Series A | | 5.00% | 6-15-2023 | $ 2,095,000 | $ 2,317,384 |
| Clark County NV School District Refunding Bond Limited Tax Series C | | 5.00 | 6-15-2023 | 500,000 | 553,075 |
| | | | | | 2,870,459 |
| Housing revenue: 0.52% | | | | | |
| Nevada Housing Division Multi Unit Housing Silver Terrace | | 1.19 | 10-1-2022 | 6,000,000 | 6,012,720 |
| Nevada Housing Division Multi Unit Housing Whittell Pointe | | 0.30 | 10-1-2023 | 6,000,000 | 5,997,840 |
| | | | | | 12,010,560 |
| Tax revenue: 0.18% | | | | | |
| Nevada Tender Option Bond Trust Receipts/Floater Certificates Series 2020-XM0866 (Royal Bank of Canada LOC, Royal Bank of Canada LIQ)144Aø | | 0.13 | 7-1-2026 | 4,100,000 | 4,100,000 |
| Utilities revenue: 0.39% | | | | | |
| Washoe County NV Water Facility Refunding Bond Series F | | 2.05 | 3-1-2036 | 6,000,000 | 6,112,860 |
| Washoe County NV Water Facility Revenue Refunding AMT Sierra Pacific Power Company | | 2.05 | 3-1-2036 | 1,500,000 | 1,528,215 |
| Washoe County NV Water Facility Revenue Refunding Sierra Pacific Power Company | | 0.63 | 3-1-2036 | 1,500,000 | 1,501,050 |
| | | | | | 9,142,125 |
| | | | | | 28,123,144 |
| New Jersey: 3.39% | | | | | |
| Education revenue: 0.09% | | | | | |
| New Jersey Higher Education Assistance Authority Series B | | 5.00 | 12-1-2021 | 2,000,000 | 2,083,820 |
| GO revenue: 0.42% | | | | | |
| Newark NJ | | 3.50 | 7-27-2021 | 3,500,000 | 3,557,260 |
| Newark NJ BAN General Capital Improvement | | 2.00 | 10-5-2021 | 1,200,000 | 1,212,144 |
| Newark NJ Refunding Bond Qualified General Improvement Series A | | 5.00 | 10-1-2022 | 750,000 | 802,253 |
| Newark NJ Refunding Bond Tax Appeal Notes Series B | | 2.00 | 10-5-2021 | 1,160,000 | 1,171,739 |
| Ramsey Borough NJ BAN %% | | 1.25 | 1-7-2022 | 3,000,000 | 3,025,350 |
| | | | | | 9,768,746 |
| Health revenue: 0.03% | | | | | |
| New Jersey HFFA St. Joseph's Healthcare System Group | | 5.00 | 7-1-2021 | 780,000 | 794,407 |
| Housing revenue: 0.70% | | | | | |
| New Jersey Housing & Mortgage Finance Agency Multifamily Conduit Post Road Gardens Series A | | 0.75 | 5-1-2023 | 3,000,000 | 3,012,960 |
| New Jersey Housing & Mortgage Finance Agency Peter J McGuire Gardens Preservation Project Series G | | 1.45 | 11-1-2022 | 13,160,000 | 13,283,046 |
| | | | | | 16,296,006 |
The accompanying notes are an integral part of these financial statements.
Wells Fargo Ultra Short-Term Municipal Income Fund | 23
Portfolio of investments—December 31, 2020 (unaudited)
| | | Interest
rate | Maturity
date | Principal | Value |
| Miscellaneous revenue: 0.79% | | | | | |
| New Jersey EDA School Facilities Construction Notes Series BBB | | 5.00% | 6-15-2021 | $ 3,910,000 | $ 3,989,608 |
| New Jersey EDA School Facilities Construction Notes Series DDD | | 5.00 | 6-15-2022 | 780,000 | 830,567 |
| New Jersey Tender Option Bond Trust Receipts/Floater Certificates Series 2018-XF2538 (Barclays Bank plc LOC, Barclays Bank plc LIQ)144Aø | | 0.12 | 6-15-2040 | 2,810,000 | 2,810,000 |
| New Jersey Tender Option Bond Trust Receipts/Floater Certificates Series 2018-XG0205 (Barclays Bank plc LOC, Barclays Bank plc LIQ)144Aø | | 0.12 | 6-15-2050 | 5,600,000 | 5,600,000 |
| New Jersey Transportation Trust Fund Series B | | 5.00 | 6-15-2021 | 2,290,000 | 2,336,624 |
| New Jersey Transportation Trust Fund Series D | | 5.25 | 12-15-2023 | 2,500,000 | 2,831,975 |
| | | | | | 18,398,774 |
| Tax revenue: 0.14% | | | | | |
| New Jersey Covid 19 Emergency Series A | | 4.00 | 6-1-2023 | 3,000,000 | 3,257,010 |
| Transportation revenue: 1.00% | | | | | |
| New Brunswick NJ Parking Authority City Guaranteed Series B (Municipal Government Guaranty Insured) | | 5.00 | 9-1-2022 | 700,000 | 750,778 |
| New Brunswick NJ Parking Authority City Guaranteed Series B (BAM Insured) | | 5.00 | 9-1-2024 | 875,000 | 1,013,766 |
| New Jersey TTFA Series A | | 5.25 | 12-15-2022 | 1,295,000 | 1,411,226 |
| New Jersey Turnpike Authority Series C-5 (1 Month LIBOR+0.46%)± | | 0.57 | 1-1-2028 | 20,330,000 | 20,330,000 |
| | | | | | 23,505,770 |
| Water & sewer revenue: 0.22% | | | | | |
| New Jersey EDA Refunding Bond AMT American Water Company Incorporated | | 1.20 | 11-1-2034 | 5,000,000 | 5,070,700 |
| | | | | | 79,175,233 |
| New Mexico: 0.06% | | | | | |
| Health revenue: 0.06% | | | | | |
| New Mexico Hospital Equipment Loan Council Hospital Improvement System Sanitary Juan Regional | | 5.00 | 6-1-2021 | 220,000 | 223,533 |
| New Mexico Hospital Equipment Loan Council Hospital Improvement System Sanitary Juan Regional | | 5.00 | 6-1-2022 | 445,000 | 469,199 |
| New Mexico Hospital Equipment Loan Council Hospital Improvement System Sanitary Juan Regional | | 5.00 | 6-1-2023 | 665,000 | 726,446 |
| | | | | | 1,419,178 |
| New York: 15.37% | | | | | |
| Airport revenue: 0.19% | | | | | |
| New York Transportation Development Corporation Special Refunding Bond Terminal One Group Association ## | | 5.00 | 1-1-2021 | 2,500,000 | 2,500,000 |
| Niagara NY Frontier Transportation Refunding AMT Buffalo Niagara International | | 5.00 | 4-1-2021 | 1,975,000 | 1,994,632 |
| | | | | | 4,494,632 |
The accompanying notes are an integral part of these financial statements.
24 | Wells Fargo Ultra Short-Term Municipal Income Fund
Portfolio of investments—December 31, 2020 (unaudited)
| | | Interest
rate | Maturity
date | Principal | Value |
| Education revenue: 0.10% | | | | | |
| Saratoga County NY Capital Resource Corporation Revenue Refunding Skidmore College Series A %% | | 5.00% | 7-1-2022 | $ 550,000 | $ 578,842 |
| Saratoga County NY Capital Resource Corporation Revenue Refunding Skidmore College Series A %% | | 5.00 | 7-1-2023 | 575,000 | 628,561 |
| Saratoga County NY Capital Resource Corporation Revenue Refunding Skidmore College Series A %% | | 5.00 | 7-1-2024 | 600,000 | 679,818 |
| Saratoga County NY Capital Resource Corporation Revenue Refunding Skidmore College Series A %% | | 5.00 | 7-1-2025 | 425,000 | 497,862 |
| | | | | | 2,385,083 |
| GO revenue: 5.39% | | | | | |
| Cortland NY Enlarged City School District Anticipation Notes | | 1.50 | 7-30-2021 | 2,500,000 | 2,513,400 |
| Elmira City NY Tax Anticipation Notes | | 4.00 | 5-27-2021 | 790,000 | 790,790 |
| Erie County NY Revenue Anticipation Notes | | 3.00 | 6-24-2021 | 1,370,000 | 1,387,043 |
| Island Park NY BAN Series D | | 1.25 | 6-16-2021 | 2,192,000 | 2,200,176 |
| Long Beach NY Public Improvement Series A | | 5.00 | 9-1-2022 | 1,770,000 | 1,885,935 |
| Long Beach NY Public Improvement Series A | | 5.00 | 9-1-2023 | 2,075,000 | 2,297,004 |
| New York NY Adjusted Fiscal 2008 Subordinate Bond Series A-4 (AGM Insured)€ | | 0.19 | 8-1-2026 | 1,975,000 | 1,975,000 |
| New York NY Adjusted Fiscal 2008 Subordinate Bond Series C-4 (AGC Insured)€ | | 0.19 | 10-1-2027 | 20,300,000 | 20,300,000 |
| New York NY Series A (Mizuho Bank Limited LOC)ø | | 0.10 | 10-1-2040 | 5,000,000 | 5,000,000 |
| New York NY Series J Subordinate Bond Series J-2 (AGM Insured)€ | | 0.17 | 6-1-2036 | 800,000 | 800,000 |
| New York NY Series J Subordinate Bond Series J3 (AGM Insured)€ | | 0.19 | 6-1-2036 | 5,375,000 | 5,375,000 |
| New York NY Subordinate Bond Series C-4 (AGM Insured)€ | | 0.09 | 1-1-2032 | 800,000 | 800,000 |
| Oyster Bay NY BAN Series C | | 4.00 | 8-27-2021 | 23,000,000 | 23,540,730 |
| Oyster Bay NY Public Improvement Series B ## | | 3.00 | 2-1-2021 | 2,260,000 | 2,264,226 |
| Oyster Bay NY Water District Series B | | 2.00 | 3-12-2021 | 5,000,000 | 5,016,100 |
| Rockland County NY Tax Anticipation Notes | | 2.00 | 4-1-2021 | 8,250,000 | 8,285,888 |
| Suffolk County NY Series A | | 5.00 | 3-19-2021 | 6,000,000 | 6,054,420 |
| Suffolk County NY Tax Anticipation Notes Series I | | 2.00 | 7-22-2021 | 15,000,000 | 15,095,550 |
| Suffolk County NY Tax Anticipation Notes Series I | | 3.00 | 9-24-2021 | 20,000,000 | 20,307,400 |
| | | | | | 125,888,662 |
| Health revenue: 0.35% | | | | | |
| Broome County NY Local Development Corporation United Health Services Hospital Incorporate Project (AGM Insured) | | 5.00 | 4-1-2024 | 500,000 | 573,370 |
| Broome County NY Local Development Corporation United Health Services Hospital Incorporate Project (AGM Insured) | | 5.00 | 4-1-2025 | 500,000 | 595,075 |
| New York NY Health And Hospital Corporation Revenue Health System Series A %% | | 5.00 | 2-15-2025 | 3,615,000 | 4,275,750 |
| Tender Option Bond Trust/Floater Certificates Series 2020-XG0294 (FHA Insured, Bank of America NA LIQ)144Aø | | 0.13 | 2-1-2050 | 2,800,000 | 2,800,000 |
| | | | | | 8,244,195 |
| Housing revenue: 1.45% | | | | | |
| Deutsche Bank Spears Series DBE-8063 (Deutsche Bank LOC, Deutsche Bank LIQ)144Aø | | 0.69 | 10-1-2045 | 11,000,000 | 11,000,000 |
The accompanying notes are an integral part of these financial statements.
Wells Fargo Ultra Short-Term Municipal Income Fund | 25
Portfolio of investments—December 31, 2020 (unaudited)
| | | Interest
rate | Maturity
date | Principal | Value |
| Housing revenue (continued) | | | | | |
| East Rochester NY Housing Authority Home Good Shepherd Project Series A (Citizens Bank LOC)ø | | 0.25% | 12-1-2036 | $ 2,335,000 | $ 2,335,000 |
| New York Housing Finance Agency Revenue Affordable Housing Series J Climate | | 0.75 | 5-1-2025 | 8,250,000 | 8,256,600 |
| New York Mortgage Agency Homeowner Revenue Series 183 | | 3.50 | 4-1-2022 | 1,200,000 | 1,240,056 |
| New York NY Housing Development Corporation Series A-3 | | 1.13 | 5-1-2060 | 4,000,000 | 4,029,280 |
| New York NY Housing Development Corporation Series G-2 | | 2.00 | 11-1-2057 | 6,980,000 | 6,983,281 |
| | | | | | 33,844,217 |
| Industrial development revenue: 1.08% | | | | | |
| New York Energy Research & Development Authority PCR Keyspan Generation Series A (Ambac Insured)€ | | 1.25 | 10-1-2028 | 900,000 | 900,000 |
| New York Transportation Development Corporation Series 2018 | | 5.00 | 1-1-2022 | 2,000,000 | 2,072,480 |
| New York Transportation Development Corporation Series 2018 | | 5.00 | 1-1-2023 | 12,750,000 | 13,647,218 |
| New York Transportation Development Corporation Special Facilities Revenue Delta Airlines Incorporated LaGuardia Airport Terminals C&D Redevelopment Project | | 5.00 | 1-1-2024 | 5,250,000 | 5,793,218 |
| New York Transportation Development Corporation Special Facility Revenue Terminal 4 John F Kennedy International | | 5.00 | 12-1-2023 | 1,260,000 | 1,404,421 |
| New York Transportation Development Corporation Special Facility Revenue Terminal 4 John F Kennedy International | | 5.00 | 12-1-2024 | 1,250,000 | 1,440,563 |
| | | | | | 25,257,900 |
| Miscellaneous revenue: 0.30% | | | | | |
| Board Cooperative Educational Services New York Sole Supervisory District Revenue Anticipation Notes | | 1.50 | 9-29-2021 | 7,000,000 | 7,050,330 |
| Tax revenue: 2.12% | | | | | |
| New York Dormitory Authority Personal Income Tax Revenue Series B | | 5.00 | 3-31-2021 | 18,000,000 | 18,211,680 |
| New York Dormitory Authority Revenues Mental Health Services Subordinated Series D 2 F (JPMorgan Chase & Company SPA)ø | | 0.08 | 2-15-2031 | 4,280,000 | 4,280,000 |
| New York NY Transitional Finance Authority Subordinate Bond Series 1-B (SIFMA Municipal Swap+0.80%)± | | 0.89 | 11-1-2022 | 6,885,000 | 6,913,366 |
| New York Transitional Finance Authority Revenue Series (Barclays Bank plc SPA)ø | | 0.08 | 8-1-2039 | 20,000,000 | 20,000,000 |
| | | | | | 49,405,046 |
| Transportation revenue: 2.79% | | | | | |
| New York Metropolitan Transportation Authority BAN | | 4.00 | 2-1-2022 | 3,950,000 | 4,029,869 |
| New York Metropolitan Transportation Authority BAN | | 5.00 | 2-1-2023 | 4,050,000 | 4,291,137 |
| New York Metropolitan Transportation Authority Series B (1 Month LIBOR+0.55%)± | | 0.65 | 11-1-2041 | 6,255,000 | 6,058,405 |
| New York Metropolitan Transportation Authority Subordinate Bond Series D2 (SIFMA Municipal Swap+0.45%)± | | 0.54 | 11-15-2044 | 18,460,000 | 17,881,833 |
The accompanying notes are an integral part of these financial statements.
26 | Wells Fargo Ultra Short-Term Municipal Income Fund
Portfolio of investments—December 31, 2020 (unaudited)
| | | Interest
rate | Maturity
date | Principal | Value |
| Transportation revenue (continued) | | | | | |
| New York Metropolitan Transportation Authority Subordinate Bond Series G-1F (1 Month LIBOR+0.65%)± | | 0.75% | 11-1-2026 | $21,530,000 | $ 21,374,769 |
| Triborough Bridge & Tunnel Authority Series A | | 5.00 | 11-15-2023 | 1,570,000 | 1,732,260 |
| Triborough Bridge & Tunnel Authority Series B-4 (1 Month LIBOR+0.70%)± | | 0.80 | 1-1-2032 | 9,630,000 | 9,631,926 |
| | | | | | 65,000,199 |
| Utilities revenue: 0.51% | | | | | |
| Long Island NY Power Authority Electric System Revenue General Series B | | 0.85 | 9-1-2050 | 10,000,000 | 10,076,500 |
| New York Tender Option Bond Trust Bond Trust Receipts\Floater Certificates Series 2020-XF0945 (JPMorgan Chase & Company LIQ)144Aø | | 0.13 | 11-15-2027 | 1,750,000 | 1,750,000 |
| | | | | | 11,826,500 |
| Water & sewer revenue: 1.09% | | | | | |
| New York NY Municipal Water Finance Authority Fiscal 2015 Series BB-2 (Mizuho Bank Limited SPA)ø | | 0.09 | 6-15-2049 | 21,900,000 | 21,900,000 |
| New York NY Municipal Water Finance Authority Water And Sewer System Revenue Second General Resolution | | 4.00 | 6-15-2024 | 3,000,000 | 3,387,300 |
| | | | | | 25,287,300 |
| | | | | | 358,684,064 |
| North Carolina: 0.69% | | | | | |
| Housing revenue: 0.58% | | | | | |
| Charlotte NC Housing Authority Heritage Park Housing LP | | 1.45 | 6-1-2022 | 7,500,000 | 7,531,275 |
| Charlotte NC Housing Authority West Tyvola Seniors LLC | | 0.50 | 12-1-2021 | 6,000,000 | 6,003,780 |
| | | | | | 13,535,055 |
| Resource recovery revenue: 0.11% | | | | | |
| North Carolina Capital Finance Republic Services Incorporated Project Series 2013 | | 0.70 | 6-1-2038 | 2,500,000 | 2,500,000 |
| | | | | | 16,035,055 |
| North Dakota: 0.49% | | | | | |
| Housing revenue: 0.36% | | | | | |
| North Dakota Housing Finance Agency Home Mortgage Finance Program Series B (SIFMA Municipal Swap+0.40%)± | | 0.49 | 1-1-2043 | 8,500,000 | 8,502,125 |
| Miscellaneous revenue: 0.13% | | | | | |
| Horace ND Series A | | 1.90 | 8-1-2022 | 3,000,000 | 3,002,370 |
| | | | | | 11,504,495 |
| Ohio: 2.14% | | | | | |
| Education revenue: 0.04% | | | | | |
| Ohio Higher Educational Facility Commission | | 5.00 | 5-1-2025 | 885,000 | 1,044,831 |
| GO revenue: 0.83% | | | | | |
| Akron OH Refunding Bonds Series 2020 | | 2.00 | 12-1-2022 | 1,135,000 | 1,169,218 |
| Chillicothe OH BAN Sanitary Sewer Improvements | | 1.00 | 9-29-2021 | 1,140,000 | 1,144,856 |
The accompanying notes are an integral part of these financial statements.
Wells Fargo Ultra Short-Term Municipal Income Fund | 27
Portfolio of investments—December 31, 2020 (unaudited)
| | | Interest
rate | Maturity
date | Principal | Value |
| GO revenue (continued) | | | | | |
| Fairfield OH BAN | | 2.25% | 4-27-2021 | $ 1,770,000 | $ 1,778,744 |
| Lorain County OH BAN | | 3.00 | 2-6-2021 | 4,510,000 | 4,519,516 |
| Newark OH BAN | | 1.25 | 9-29-2021 | 2,900,000 | 2,918,734 |
| Newark OH BAN | | 1.25 | 9-29-2021 | 3,000,000 | 3,019,380 |
| Newark OH BAN Horns Hill Road Sanitary | | 3.00 | 3-30-2021 | 965,000 | 971,070 |
| North Olmsted OH BAN Capital Improvement and Equipment | | 2.00 | 3-10-2021 | 1,025,000 | 1,027,296 |
| Tipp City OH BAN | | 2.00 | 2-11-2021 | 2,000,000 | 2,003,660 |
| Toledo OH Refunding Limited Tax Various Purpose | | 3.00 | 12-1-2022 | 310,000 | 323,832 |
| Toledo OH Refunding Limited Tax Various Purpose | | 3.00 | 12-1-2023 | 440,000 | 468,684 |
| | | | | | 19,344,990 |
| Health revenue: 0.53% | | | | | |
| Allen County OH Mercy Health Hospital | | 5.00 | 12-1-2024 | 2,325,000 | 2,734,176 |
| Allen County OH Mercy Health Hospital Series A | | 5.00 | 8-1-2021 | 2,795,000 | 2,868,899 |
| Lucas County OH Hospital Promedica Healthcare Series D | | 5.00 | 11-15-2021 | 715,000 | 736,443 |
| Ohio Higher Educational Facility Commission Hospital Cleveland Clinic B4 (Barclays Bank plc SPA)ø | | 0.07 | 1-1-2043 | 5,000,000 | 5,000,000 |
| Ohio Hospital Facility Revenue Refunding Bonds Cleveland Clinic Health ## | | 5.00 | 1-1-2021 | 1,000,000 | 1,000,000 |
| | | | | | 12,339,518 |
| Housing revenue: 0.32% | | | | | |
| Cuyahoga OH Metropolitan Housing Authority Multifamily Housing Riverside Park Phase 2 Project | | 2.00 | 4-1-2022 | 4,750,000 | 4,769,238 |
| Ohio Housing Finance Agency Multifamily Housing Revenue Lima Apartments Project Series A øø | | 0.45 | 2-1-2023 | 2,600,000 | 2,601,040 |
| | | | | | 7,370,278 |
| Miscellaneous revenue: 0.17% | | | | | |
| American Municipal Power OH Incorporate BAN Electric System Improvement | | 1.50 | 8-12-2021 | 645,000 | 649,714 |
| Orange Village OH BAN | | 1.00 | 8-26-2021 | 3,400,000 | 3,415,980 |
| | | | | | 4,065,694 |
| Utilities revenue: 0.25% | | | | | |
| Lancaster OH Port Authority Gas Supply (Royal Bank of Canada LIQ) | | 5.00 | 8-1-2049 | 5,000,000 | 5,859,450 |
| | | | | | 50,024,761 |
| Oklahoma: 0.55% | | | | | |
| Education revenue: 0.03% | | | | | |
| University Oklahoma Revenues Refunding General Series B | | 5.00 | 7-1-2025 | 510,000 | 610,266 |
| Health revenue: 0.43% | | | | | |
| Oklahoma Development Finance Authority Health System Revenue ø | | 0.27 | 8-15-2031 | 10,000,000 | 10,000,000 |
| Miscellaneous revenue: 0.09% | | | | | |
| Kay County OK Public Building Authority | | 4.00 | 4-1-2021 | 350,000 | 352,258 |
| Kay County OK Public Building Authority | | 4.00 | 4-1-2022 | 400,000 | 412,924 |
| Kay County OK Public Building Authority | | 4.00 | 4-1-2023 | 450,000 | 475,763 |
The accompanying notes are an integral part of these financial statements.
28 | Wells Fargo Ultra Short-Term Municipal Income Fund
Portfolio of investments—December 31, 2020 (unaudited)
| | | Interest
rate | Maturity
date | Principal | Value |
| Miscellaneous revenue (continued) | | | | | |
| Oklahoma County OK Finance Authority Jones Public School Project | | 4.00% | 9-1-2023 | $ 330,000 | $ 352,262 |
| Oklahoma County OK Finance Authority Jones Public School Project | | 4.00 | 9-1-2024 | 525,000 | 572,355 |
| | | | | | 2,165,562 |
| | | | | | 12,775,828 |
| Oregon: 0.74% | | | | | |
| Airport revenue: 0.05% | | | | | |
| Port of Portland OR Portland International Airport AMT | | 5.00 | 7-1-2022 | 1,200,000 | 1,271,868 |
| Education revenue: 0.08% | | | | | |
| Yamhill County OR Linfield University Project Series A | | 4.00 | 10-1-2021 | 330,000 | 335,250 |
| Yamhill County OR Linfield University Project Series A | | 4.00 | 10-1-2022 | 500,000 | 517,515 |
| Yamhill County OR Linfield University Project Series A | | 4.00 | 10-1-2024 | 850,000 | 912,594 |
| | | | | | 1,765,359 |
| Health revenue: 0.16% | | | | | |
| Tender Option Bond Trust/Floaters Certificates Series 2020-WF0977 (AGM Insured, JPMorgan Chase & Company LIQ)144Aø | | 0.17 | 2-15-2028 | 3,750,000 | 3,750,000 |
| Industrial development revenue: 0.45% | | | | | |
| Oregon Business Development Commission Intel Corporation Project Series 232 | | 2.40 | 12-1-2040 | 10,000,000 | 10,515,700 |
| | | | | | 17,302,927 |
| Pennsylvania: 5.44% | | | | | |
| Airport revenue: 0.84% | | | | | |
| Philadelphia PA Airport Revenue Refunding AMT Series C Private Activity | | 5.00 | 7-1-2022 | 2,750,000 | 2,932,490 |
| Philadelphia PA Airport Revenue Refunding AMT Series C Private Activity | | 5.00 | 7-1-2025 | 12,465,000 | 14,787,728 |
| Philadelphia PA Airport Revenue Refunding Series A Private Activity | | 5.00 | 7-1-2025 | 1,545,000 | 1,850,277 |
| | | | | | 19,570,495 |
| Education revenue: 1.19% | | | | | |
| Chester County PA HEFA Immaculata University Project | | 5.00 | 11-1-2021 | 580,000 | 579,867 |
| Cumberland County PA Authority Association of Independent Colleges & Universities of Pennsylvania Financing Program Series T-1 øø | | 3.75 | 5-1-2044 | 2,000,000 | 2,012,800 |
| Delaware County PA Authority University Revenue Neumann University | | 5.00 | 10-1-2024 | 500,000 | 555,865 |
| Delaware County PA Authority University Revenue Neumann University | | 5.00 | 10-1-2025 | 525,000 | 595,854 |
| Pennsylvania HEFA Association of Independent Colleges & Universities of Pennsylvania Financing Program Series T-3 øø | | 3.00 | 5-1-2033 | 2,000,000 | 2,045,460 |
| Pennsylvania HEFA Independent Colleges Series I4 | | 2.72 | 11-1-2031 | 3,000,000 | 3,024,330 |
| Pennsylvania HEFA Wilkes University Project Series A | | 5.00 | 3-1-2021 | 390,000 | 391,283 |
The accompanying notes are an integral part of these financial statements.
Wells Fargo Ultra Short-Term Municipal Income Fund | 29
Portfolio of investments—December 31, 2020 (unaudited)
| | | Interest
rate | Maturity
date | Principal | Value |
| Education revenue (continued) | | | | | |
| Pennsylvania HEFAR Association of Independent Colleges and Universities of Pennsylvania Financing Program Mount Aloysius College Project Series R-1 | | 2.25% | 11-1-2041 | $ 5,000,000 | $ 5,014,750 |
| Philadelphia PA IDA Thomas Jefferson University Series B ø | | 0.24 | 9-1-2050 | 13,500,000 | 13,500,000 |
| | | | | | 27,720,209 |
| GO revenue: 0.21% | | | | | |
| Albert Gallatin PA Area School District Series A (AGM Insured) | | 4.00 | 9-1-2023 | 1,000,000 | 1,082,179 |
| Albert Gallatin PA Area School District Series A (AGM Insured) | | 4.00 | 9-1-2024 | 725,000 | 806,279 |
| Allentown PA City School District Tax & Revenue Anticipation Notes | | 2.38 | 3-31-2021 | 1,800,000 | 1,800,125 |
| Hollidaysburg PA Area School District | | 4.00 | 7-15-2023 | 525,000 | 569,027 |
| Octorara PA Area School District (AGM Insured) | | 4.00 | 4-1-2025 | 600,000 | 686,760 |
| | | | | | 4,944,370 |
| Health revenue: 0.21% | | | | | |
| Berks County PA Municipal Authority Tower Health Project Series A | | 5.00 | 2-1-2022 | 500,000 | 514,585 |
| Montgomery County PA Higher Education & Health Authority Presbytery Homes Incorporated Project | | 3.00 | 12-1-2021 | 560,000 | 565,449 |
| Montgomery County PA Higher Education & Health Authority Series 2018A | | 5.00 | 9-1-2022 | 1,250,000 | 1,339,388 |
| Quakertown PA Health Facilities Authority Series A | | 3.13 | 7-1-2021 | 2,595,000 | 2,571,879 |
| | | | | | 4,991,301 |
| Housing revenue: 0.60% | | | | | |
| Pennsylvania HFA Limited Obligation Norris Homes Phase V | | 1.40 | 1-1-2043 | 10,500,000 | 10,674,720 |
| Pennsylvania HFA Series 114A | | 2.90 | 10-1-2021 | 3,145,000 | 3,194,471 |
| | | | | | 13,869,191 |
| Miscellaneous revenue: 0.75% | | | | | |
| Bethlehem PA School District Revenue (1 Month LIBOR+0.48%)± | | 0.58 | 7-1-2031 | 9,975,000 | 9,953,654 |
| Pennsylvania Economic Development Financing Authority Refunding Bond Philadelphia Bioslides Facility | | 3.00 | 1-1-2024 | 865,000 | 915,810 |
| Pennsylvania Economic Development Financing Pennsylvania Rapid Bridge | | 5.00 | 6-30-2022 | 2,000,000 | 2,122,620 |
| Pittsburgh and Allegheny County PA Sports and Exhibition Authority Regional Asset District (AGM Insured) | | 4.00 | 2-1-2025 | 1,860,000 | 2,125,217 |
| Southeastern PA Transportation | | 5.00 | 6-1-2024 | 1,000,000 | 1,151,600 |
| Southeastern PA Transportation | | 5.00 | 6-1-2025 | 1,000,000 | 1,194,030 |
| | | | | | 17,462,931 |
| Resource recovery revenue: 0.81% | | | | | |
| Pennsylvania EDFA Solid Waste Disposal Republic Services Incoporated Project Series A ø | | 0.30 | 4-1-2034 | 4,000,000 | 4,000,040 |
| Pennsylvania EDFA Solid Waste Disposal Waste Management Incorporated Project øø | | 0.30 | 8-1-2045 | 15,000,000 | 15,000,150 |
| | | | | | 19,000,190 |
The accompanying notes are an integral part of these financial statements.
30 | Wells Fargo Ultra Short-Term Municipal Income Fund
Portfolio of investments—December 31, 2020 (unaudited)
| | | Interest
rate | Maturity
date | Principal | Value |
| Tax revenue: 0.31% | | | | | |
| Philadelphia PA School District AMT Series A | | 4.00% | 6-30-2021 | $ 7,000,000 | $ 7,130,970 |
| Tobacco revenue: 0.24% | | | | | |
| Tender Option Bond Trust Receipts/Certificates (Barclays Bank plc LOC, Barclays Bank plc LIQ)144Aø | | 0.13 | 6-1-2034 | 5,650,000 | 5,650,000 |
| Transportation revenue: 0.04% | | | | | |
| Pennsylvania Turnpike Series B | | 5.00 | 12-1-2023 | 425,000 | 483,161 |
| Pennsylvania Turnpike Series B | | 5.00 | 12-1-2024 | 450,000 | 532,458 |
| | | | | | 1,015,619 |
| Water & sewer revenue: 0.24% | | | | | |
| Allegheny County PA Sanitary Authority Series A | | 4.00 | 6-1-2024 | 300,000 | 336,989 |
| Allegheny County PA Sanitary Authority Series A | | 4.00 | 6-1-2025 | 150,000 | 173,789 |
| Pittsburgh PA Water & Sewer Authority Series C (SIFMA Municipal Swap+0.65%)(AGM Insured)± | | 0.74 | 9-1-2040 | 5,000,000 | 5,012,100 |
| | | | | | 5,522,878 |
| | | | | | 126,878,154 |
| Rhode Island: 0.24% | | | | | |
| Health revenue: 0.24% | | | | | |
| Rhode Island Health & Educational Building Refunding Hospital Financing Lifespan Obligation Bond | | 5.00 | 5-15-2022 | 1,250,000 | 1,313,750 |
| Rhode Island Health & Educational Building Refunding Hospital Financing Lifespan Obligation Bond | | 5.00 | 5-15-2023 | 1,300,000 | 1,413,191 |
| Rhode Island Health & Educational Building Refunding Hospital Financing Lifespan Obligation Bond | | 5.00 | 5-15-2024 | 2,475,000 | 2,776,579 |
| | | | | | 5,503,520 |
| South Carolina: 0.93% | | | | | |
| Health revenue: 0.76% | | | | | |
| South Carolina Jobs EDA Episcopal Home at Still Hopes Series A | | 5.00 | 4-1-2021 | 425,000 | 427,678 |
| South Carolina Jobs EDA Episcopal Home at Still Hopes Series A | | 5.00 | 4-1-2022 | 455,000 | 469,337 |
| South Carolina Jobs EDA Prisma Health Obligated Group Series C ø | | 0.25 | 5-1-2048 | 16,700,000 | 16,700,000 |
| | | | | | 17,597,015 |
| Water & sewer revenue: 0.17% | | | | | |
| Laurens County SC Water and Sewer Commission Waterworks Distribution System BAN | | 1.38 | 2-1-2022 | 4,000,000 | 4,020,400 |
| | | | | | 21,617,415 |
| South Dakota: 0.16% | | | | | |
| Health revenue: 0.16% | | | | | |
| Tender Option Bond Trust Receipts Series 2020-XG0302 (Barclays Bank plc LIQ)144Aø | | 0.24 | 9-1-2050 | 3,675,000 | 3,675,000 |
The accompanying notes are an integral part of these financial statements.
Wells Fargo Ultra Short-Term Municipal Income Fund | 31
Portfolio of investments—December 31, 2020 (unaudited)
| | | Interest
rate | Maturity
date | Principal | Value |
| Tennessee: 0.56% | | | | | |
| Health revenue: 0.06% | | | | | |
| Greeneville TN HEFA Board Series 2018A | | 5.00% | 7-1-2022 | $ 1,280,000 | $ 1,357,248 |
| Housing revenue: 0.15% | | | | | |
| Chattanooga TN Health Educational & Housing Facility Board Ridgeway Apartments Project | | 1.63 | 12-1-2021 | 500,000 | 502,620 |
| Memphis TN Health Educational And Housing Facility Board MFHR Collateralized Memphis Towers | | 0.25 | 12-1-2023 | 3,000,000 | 2,999,130 |
| | | | | | 3,501,750 |
| Utilities revenue: 0.35% | | | | | |
| Memphis TN Electric System Series A | | 4.00 | 12-1-2021 | 285,000 | 294,978 |
| Memphis TN Electric System Series A | | 4.00 | 12-1-2022 | 435,000 | 466,855 |
| Memphis TN Electric System Series A | | 5.00 | 12-1-2023 | 425,000 | 483,297 |
| Memphis TN Electric System Series A | | 5.00 | 12-1-2024 | 500,000 | 591,835 |
| Tennessee Energy Acquisition Corporation Series A | | 4.00 | 5-1-2048 | 4,690,000 | 5,045,690 |
| Tennessee Energy Acquisition Corporation Series A | | 5.00 | 2-1-2022 | 1,300,000 | 1,363,154 |
| | | | | | 8,245,809 |
| | | | | | 13,104,807 |
| Texas: 13.22% | | | | | |
| Airport revenue: 0.19% | | | | | |
| Dallas TX Fort Worth International Airport Series A | | 5.00 | 11-1-2024 | 1,500,000 | 1,760,940 |
| Houston TX Airport System Series C | | 5.00 | 7-1-2022 | 2,500,000 | 2,664,725 |
| | | | | | 4,425,665 |
| GO revenue: 4.88% | | | | | |
| Burleson TX Independent School District | | 2.50 | 2-1-2047 | 7,885,000 | 8,156,875 |
| Cypress-Fairbanks TX Independent School District Series A-1 | | 2.13 | 2-15-2027 | 4,355,000 | 4,404,778 |
| Cypress-Fairbanks TX Independent School District Series B-2 | | 2.13 | 2-15-2040 | 7,015,000 | 7,095,181 |
| El Paso TX Independent School District Maintenance Tax Notes | | 2.50 | 2-1-2040 | 3,500,000 | 3,544,800 |
| Fort Bend TX Independent School District School Building Series B | | 0.88 | 8-1-2050 | 4,000,000 | 4,051,280 |
| Galveston TX Dickinson Independent High School District | | 1.35 | 8-1-2037 | 3,350,000 | 3,370,971 |
| Goose Creek TX Consolidated Independent School District School Building Series B øø | | 0.27 | 10-1-2049 | 5,000,000 | 5,001,100 |
| Katy TX Independent School District Series 2015C-REMK (1 Month LIBOR+0.28%)± | | 0.39 | 8-15-2036 | 9,120,000 | 9,108,418 |
| North East TX Independent School District Series B | | 1.42 | 8-1-2040 | 1,165,000 | 1,165,944 |
| Northside TX Independent School District Building Project | | 1.60 | 8-1-2049 | 2,860,000 | 2,967,536 |
| Northside TX Independent School District School Building | | 0.70 | 6-1-2050 | 10,150,000 | 10,245,715 |
| Northside TX Independent School District School Building Bond | | 2.00 | 6-1-2046 | 2,135,000 | 2,150,052 |
| Plainview TX Idependent School District Series B | | 1.50 | 2-15-2050 | 9,000,000 | 9,218,610 |
| Texas Tax Anticipation Notes | | 4.00 | 8-26-2021 | 40,500,000 | 41,509,260 |
| Tomball TX Independent School District School Building Series B-1 | | 0.45 | 2-15-2036 | 2,000,000 | 2,000,440 |
| | | | | | 113,990,960 |
The accompanying notes are an integral part of these financial statements.
32 | Wells Fargo Ultra Short-Term Municipal Income Fund
Portfolio of investments—December 31, 2020 (unaudited)
| | | Interest
rate | Maturity
date | Principal | Value |
| Health revenue: 1.05% | | | | | |
| Board of Managers Joint Guadalupe Refunding & Improvement Project | | 5.00% | 12-1-2021 | $ 1,000,000 | $ 1,031,900 |
| Coastal Bend TX Health Facilities Development Corporation (AGM Insured)€ | | 0.10 | 7-1-2031 | 6,925,000 | 6,925,000 |
| Harris County TX Cultural Education Facilities Finance Corporation Hospital Memorial Hermann | | 5.00 | 6-1-2032 | 3,000,000 | 3,532,020 |
| Harris County TX Cultural Education Facilities Finance Corporation Revenue Texas Medical Center Series A | | 0.90 | 5-15-2050 | 2,100,000 | 2,102,877 |
| Harris County TX Health Facilities Development Corporation Series A3 (AGM Insured)€ | | 0.10 | 7-1-2031 | 6,850,000 | 6,850,000 |
| Harris County TX Health Facilities Development Corporation Series A4 (AGM Insured)€ | | 0.19 | 7-1-2031 | 4,075,000 | 4,075,000 |
| | | | | | 24,516,797 |
| Housing revenue: 3.33% | | | | | |
| Alamito TX Public Facilities Corporation MFHR HACEP RAD Conversion Program (Department of Housing and Urban Development Insured) | | 1.51 | 5-1-2037 | 10,000,000 | 10,076,199 |
| Alamito TX Public Facility Corporation Cramer Three Apartments Project | | 2.50 | 11-1-2021 | 2,000,000 | 2,013,639 |
| Austin TX Affordable PFC Incorporated MFHR Bridge Granada Apartments | | 1.46 | 6-1-2023 | 2,125,000 | 2,158,298 |
| Deutsche Bank Spears Series DBE-8054 (Deutsche Bank LOC, Deutsche Bank LIQ)144Aø | | 0.69 | 8-1-2060 | 10,000,000 | 10,000,000 |
| Midland County TX Public Facility Corporation Multifamily Housing Revenue Palladium West Francis | | 0.35 | 6-1-2024 | 4,000,000 | 4,000,240 |
| Mizuho Tender Option Bond Trust Receipts/Floater Certificates Series2019-MIZ9010 (Mizuho Capital Markets LLC LOC, Mizuho Capital Markets LLC LIQ)144Aø | | 0.32 | 4-1-2034 | 20,750,000 | 20,750,000 |
| Odessa TX Housing Finance Corporation Multifamily Housing Vera Odessa Apartments (FHA Insured) | | 0.35 | 9-1-2023 | 6,500,000 | 6,497,075 |
| Port Aransas TX Public Facilities Corporation MFHR Palladium Port Aransas Apartments | | 0.70 | 1-1-2024 | 6,300,000 | 6,309,891 |
| San Antonio TX Housing Trust Finance Corporation Majestic Ranch Apartments LP (FHA Insured) | | 1.40 | 7-1-2022 | 6,000,000 | 6,049,620 |
| Texas Capital Area Housing Finance Agency MFHR Mission Trail at El Camino Real Apartments | | 2.10 | 9-1-2037 | 9,750,000 | 9,834,045 |
| | | | | | 77,689,007 |
| Industrial development revenue: 0.69% | | | | | |
| Austin TX Convention First Tier Series A | | 5.00 | 1-1-2022 | 400,000 | 409,587 |
| Austin TX Convention First Tier Series A | | 5.00 | 1-1-2023 | 750,000 | 777,465 |
| Port Arthur TX Navigation District Industrial Development Corporation Total Petrochemicals USA Incorporated Project ø | | 0.14 | 6-1-2041 | 15,000,000 | 15,000,000 |
| | | | | | 16,187,052 |
| Resource recovery revenue: 1.16% | | | | | |
| Mission TX Economic Development Corporation Republic Services Incorporated Project | | 0.30 | 1-1-2026 | 6,000,000 | 5,999,940 |
The accompanying notes are an integral part of these financial statements.
Wells Fargo Ultra Short-Term Municipal Income Fund | 33
Portfolio of investments—December 31, 2020 (unaudited)
| | | Interest
rate | Maturity
date | Principal | Value |
| Resource recovery revenue (continued) | | | | | |
| Port Arthur TX Navigation District Jefferson County Environmental Facilities Motiva Enterprises LLC Project Series B ø | | 0.17% | 4-1-2040 | $10,000,000 | $ 10,000,000 |
| Port Arthur TX Navigation District Jefferson County Environmental Facilities Motiva Enterprises LLC Project Series E ø | | 0.25 | 11-1-2040 | 11,000,000 | 11,000,000 |
| | | | | | 26,999,940 |
| Transportation revenue: 1.25% | | | | | |
| Central Texas Regional Mobility Authority Revenue Subordinated Lien BAN Series F | | 5.00 | 1-1-2025 | 2,500,000 | 2,873,600 |
| Harris County TX Senior Lien Toll Road Series B | | 1.45 | 8-15-2021 | 7,635,000 | 7,696,080 |
| RBC Municipal Products Incorporated Trust Floaters Series E-145 (Royal Bank of Canada LOC, Royal Bank of Canada LIQ)144Aø | | 0.12 | 9-8-2021 | 3,000,000 | 3,000,000 |
| Tender Option Bond Trust Receipts Series 2019-XM0753 (Deutsche Bank LIQ)144Aø | | 0.32 | 8-1-2057 | 9,635,000 | 9,635,000 |
| Tender Option Bond Trust Receipts Series 2019-XM0756 (Deutsche Bank LIQ)144Aø | | 0.47 | 6-30-2058 | 6,000,000 | 6,000,000 |
| | | | | | 29,204,680 |
| Utilities revenue: 0.50% | | | | | |
| San Antonio TX Electric & Gas Systems Refunding Bond Series B | | 2.00 | 2-1-2033 | 11,440,000 | 11,522,482 |
| Water & sewer revenue: 0.17% | | | | | |
| Houston TX Combined Utility System Revenue Series C (1 Month LIBOR+0.36%)± | | 0.46 | 5-15-2034 | 4,000,000 | 3,999,240 |
| | | | | | 308,535,823 |
| Vermont: 0.08% | | | | | |
| Education revenue: 0.08% | | | | | |
| Vermont Educational & Health Buildings Saint Michaels College Project | | 5.00 | 10-1-2023 | 1,185,000 | 1,234,343 |
| Vermont Educational & Health Buildings Saint Michaels College Project | | 5.00 | 10-1-2024 | 675,000 | 702,371 |
| | | | | | 1,936,714 |
| Virginia: 0.91% | | | | | |
| Health revenue: 0.05% | | | | | |
| Virginia Small Business Financing Authority Revenue National Senior Campuses Incorporate Series A | | 5.00 | 1-1-2023 | 500,000 | 543,665 |
| Virginia Small Business Financing Authority Revenue National Senior Campuses Incorporate Series A | | 5.00 | 1-1-2024 | 500,000 | 564,590 |
| | | | | | 1,108,255 |
| Industrial development revenue: 0.18% | | | | | |
| Louisa VA IDA Pollution Control Virginia Electric & Power Company Series A | | 1.90 | 11-1-2035 | 4,000,000 | 4,148,040 |
| Miscellaneous revenue: 0.13% | | | | | |
| Louisa VA IDA Electric and Power Company Project Series A | | 0.75 | 11-1-2035 | 3,000,000 | 3,038,190 |
The accompanying notes are an integral part of these financial statements.
34 | Wells Fargo Ultra Short-Term Municipal Income Fund
Portfolio of investments—December 31, 2020 (unaudited)
| | | Interest
rate | Maturity
date | Principal | Value |
| Utilities revenue: 0.55% | | | | | |
| Halifax County VA Electric and Power Company Project | | 0.45% | 12-1-2041 | $ 4,000,000 | $ 4,000,000 |
| Wise County IDA Waste & Sewage Disposal Revenue | | 1.20 | 11-1-2040 | 3,525,000 | 3,607,485 |
| Wise County VA IDA Solid Waste and Sewage Disposal Revenue Virginia Electric and Power Company Project Series A | | 0.75 | 10-1-2040 | 5,250,000 | 5,299,928 |
| | | | | | 12,907,413 |
| | | | | | 21,201,898 |
| Washington: 1.32% | | | | | |
| Airport revenue: 0.12% | | | | | |
| Port of Seattle WA AMT Intermediate Lien Series C | | 5.00 | 4-1-2025 | 2,500,000 | 2,886,225 |
| Health revenue: 0.19% | | | | | |
| Washington Tender Option Bond Trust Receipts/Floater Certificates Series 2016-XM0424 (JPMorgan Chase & Company LIQ)144Aø | | 0.19 | 2-1-2021 | 4,375,000 | 4,375,000 |
| Housing revenue: 0.49% | | | | | |
| Washington Housing Finance Commission Columbia Park Apartments Project (FHA/GNMA Insured) | | 1.39 | 7-1-2022 | 5,200,000 | 5,226,884 |
| Washington Housing Finance Commission SAG Portfolio Project | | 2.55 | 7-1-2022 | 6,250,000 | 6,317,750 |
| | | | | | 11,544,634 |
| Utilities revenue: 0.52% | | | | | |
| Seattle WA Municipal Light & Power Refunding Bond Series B-2 (SIFMA Municipal Swap+0.29%)± | | 0.38 | 5-1-2045 | 10,000,000 | 10,000,200 |
| Seattle WA Municipal Light & Power Series C1 (SIFMA Municipal Swap+0.25%)± | | 0.34 | 11-1-2021 | 1,055,000 | 1,054,947 |
| Seattle WA Municipal Light & Power Series C2 (SIFMA Municipal Swap+0.25%)± | | 0.34 | 11-1-2021 | 1,055,000 | 1,054,947 |
| | | | | | 12,110,094 |
| | | | | | 30,915,953 |
| West Virginia: 1.12% | | | | | |
| Health revenue: 0.38% | | | | | |
| West Virginia Hospital Finance Authority United Health System | | 5.00 | 6-1-2022 | 4,000,000 | 4,243,040 |
| West Virginia Hospital Finance Authority United Health System | | 5.00 | 6-1-2024 | 4,000,000 | 4,604,960 |
| | | | | | 8,848,000 |
| Housing revenue: 0.21% | | | | | |
| West Virginia Housing Development Brookpark Place Project | | 1.65 | 8-1-2022 | 5,000,000 | 5,037,700 |
| Industrial development revenue: 0.13% | | | | | |
| West Virginia EDA Solid Waste Disposal Facilities Revenue Refunding Appalachian Power Company | | 0.63 | 12-1-2038 | 3,000,000 | 3,002,700 |
The accompanying notes are an integral part of these financial statements.
Wells Fargo Ultra Short-Term Municipal Income Fund | 35
Portfolio of investments—December 31, 2020 (unaudited)
| | | Interest
rate | Maturity
date | Principal | Value |
| Utilities revenue: 0.40% | | | | | |
| West Virginia EDA Solid Waste Disposal Facilities Appalachian Power Company Amos Project | | 1.00% | 1-1-2041 | $ 5,900,000 | $ 6,004,843 |
| West Virginia EDA Solid Waste Disposal Facilities Wheeling Power Company Mitchell Project Series A | | 3.00 | 6-1-2037 | 3,250,000 | 3,342,138 |
| | | | | | 9,346,981 |
| | | | | | 26,235,381 |
| Wisconsin: 3.83% | | | | | |
| Education revenue: 0.06% | | | | | |
| Wisconsin PFA Gardner Webb University 144A | | 5.00 | 7-1-2021 | 1,360,000 | 1,369,466 |
| GO revenue: 0.09% | | | | | |
| Dane County WI AMT Promissory Notes Apartment Project Series D | | 2.50 | 6-1-2022 | 445,000 | 448,783 |
| Dane County WI AMT Promissory Notes Apartment Project Series D | | 2.63 | 6-1-2023 | 980,000 | 988,359 |
| Dane County WI AMT Promissory Notes Apartment Project Series D | | 3.50 | 6-1-2021 | 735,000 | 744,584 |
| | | | | | 2,181,726 |
| Health revenue: 1.05% | | | | | |
| Public Finance Authority Wisconsin Hospital Renown Regional Medical Center Project Series A | | 5.00 | 6-1-2025 | 385,000 | 458,219 |
| Wisconsin HEFA Advocate Aurora Health Credit Group Series C3 (SIFMA Municipal Swap+0.55%)± | | 0.64 | 8-15-2054 | 7,065,000 | 7,079,342 |
| Wisconsin HEFA Marshfield Clinic Health System Incorporated | | 5.00 | 2-15-2052 | 10,000,000 | 11,505,000 |
| Wisconsin HEFA Series 2053 ø | | 0.25 | 2-15-2053 | 4,000,000 | 4,000,000 |
| Wisconsin HEFA St. Camillus Health System Series A | | 5.00 | 11-1-2021 | 110,000 | 111,932 |
| Wisconsin HEFA St. Camillus Health System Series A | | 5.00 | 11-1-2022 | 120,000 | 124,480 |
| Wisconsin HEFA St. Camillus Health System Series A | | 5.00 | 11-1-2023 | 125,000 | 131,850 |
| Wisconsin HEFA St. Camillus Health System Series A | | 5.00 | 7-1-2024 | 945,000 | 1,086,041 |
| | | | | | 24,496,864 |
| Housing revenue: 1.66% | | | | | |
| Wisconsin Housing & EDA Series A | | 2.80 | 3-1-2022 | 1,070,000 | 1,093,380 |
| Wisconsin Tender Option Bond Trust Receipts/Certificates Series 2019-XF2821 (Mizuho Bank Limited LOC, Mizuho Bank Limited LIQ)144Aø | | 0.39 | 1-1-2026 | 3,845,000 | 3,845,000 |
| Wisconsin Tender Option Bond Trust Receipts/Floater Certificates Series 2020-XF2871 (Mizuho Capital Markets LLC LOC, Mizuho Capital Markets LLC LIQ)144Aø | | 0.39 | 11-1-2025 | 33,766,000 | 33,766,000 |
| | | | | | 38,704,380 |
| Miscellaneous revenue: 0.43% | | | | | |
| Appleton WI Redevelopment Authority Redevelopment Revenue Adjusted Fox Cities Arts Center B (Associated Trust Company NA LOC)ø | | 0.25 | 6-1-2036 | 5,100,000 | 5,100,000 |
| Mauston WI School District BAN | | 1.50 | 6-30-2021 | 3,000,000 | 3,009,510 |
| Osceola WI Anticipation Notes | | 3.00 | 12-1-2021 | 1,800,000 | 1,813,356 |
| | | | | | 9,922,866 |
The accompanying notes are an integral part of these financial statements.
36 | Wells Fargo Ultra Short-Term Municipal Income Fund
Portfolio of investments—December 31, 2020 (unaudited)
| | | Interest
rate | Maturity
date | Principal | Value |
| Resource recovery revenue: 0.54% | | | | | |
| La Crosse WI Resource Recovery Northern States Power Company Project | | 6.00% | 11-1-2021 | $ 2,500,000 | $ 2,609,900 |
| Wisconsin PFA Series A-2 | | 0.30 | 10-1-2025 | 10,000,000 | 10,000,100 |
| | | | | | 12,610,000 |
| | | | | | 89,285,302 |
| Total Municipal obligations (Cost $2,281,820,685) | | | | | 2,291,576,706 |
| | | Yield | | Shares | |
| Short-term investments: 0.19% | | | | | |
| Investment companies: 0.19% | | | | | |
| Wells Fargo Municipal Cash Management Money Market Fund Institutional Class ♠∞## | | 0.01% | | 4,433,356 | 4,434,686 |
| Total Short-term investments (Cost $4,434,635) | | | | | 4,434,686 |
| Total investments in securities (Cost $2,325,455,320) | 100.04% | | | | 2,335,211,392 |
| Other assets and liabilities, net | (0.04) | | | | (842,399) |
| Total net assets | 100.00% | | | | $ 2,334,368,993 |
| 144A | The security may be resold in transactions exempt from registration, normally to qualified institutional buyers, pursuant to Rule 144A under the Securities Act of 1933. |
| ø | Variable rate demand notes are subject to a demand feature which reduces the effective maturity. The maturity date shown represents the final maturity date of the security. The interest rate is determined and reset by the issuer daily, weekly, or monthly depending upon the terms of the security. The rate shown is the rate in effect at period end. |
| € | The security is an auction-rate security which has an interest rate that resets at predetermined short-term intervals through a Dutch auction. The rate shown is the rate in effect at period end. |
| ± | Variable rate investment. The rate shown is the rate in effect at period end. |
| øø | The interest rate is determined and reset by the issuer periodically depending upon the terms of the security. The rate shown is the rate in effect at period end. |
| ## | All or a portion of this security is segregated for when-issued securities. |
| ¤ | The security is issued in zero coupon form with no periodic interest payments. |
| ♠ | The issuer of the security is an affiliated person of the Fund as defined in the Investment Company Act of 1940. |
| ∞ | The rate represents the 7-day annualized yield at period end. |
| %% | The security is purchased on a when-issued basis. |
The accompanying notes are an integral part of these financial statements.
Wells Fargo Ultra Short-Term Municipal Income Fund | 37
Portfolio of investments—December 31, 2020 (unaudited)
| Abbreviations: |
| AGC | Assured Guaranty Corporation |
| AGM | Assured Guaranty Municipal |
| Ambac | Ambac Financial Group Incorporated |
| AMT | Alternative minimum tax |
| BAM | Build America Mutual Assurance Company |
| BAN | Bond anticipation notes |
| CAB | Capital appreciation bond |
| CDA | Community Development Authority |
| EDA | Economic Development Authority |
| EDFA | Economic Development Finance Authority |
| FHA | Federal Housing Administration |
| GO | General obligation |
| HCFR | Healthcare facilities revenue |
| HEFA | Health & Educational Facilities Authority |
| HEFAR | Higher Education Facilities Authority Revenue |
| HFA | Housing Finance Authority |
| HFFA | Health Facilities Financing Authority |
| IDA | Industrial Development Authority |
| LIBOR | London Interbank Offered Rate |
| LIQ | Liquidity agreement |
| LOC | Letter of credit |
| MFHR | Multifamily housing revenue |
| National | National Public Finance Guarantee Corporation |
| PCFA | Pollution Control Financing Authority |
| PCR | Pollution control revenue |
| PFA | Public Finance Authority |
| SIFMA | Securities Industry and Financial Markets Association |
| SPA | Standby purchase agreement |
| TTFA | Transportation Trust Fund Authority |
Investments in affiliates
An affiliated investment is an investment in which the Fund owns at least 5% of the outstanding voting shares of the issuer or as a result of other relationships, such as the Fund and the issuer having the same investment manager. Transactions with issuers that were either affiliated persons of the Fund at the beginning of the period or the end of the period were as follows:
| | Value,
beginning of
period | Purchases | Sales
proceeds | Net
realized
gains
(losses) | Net
change in
unrealized
gains
(losses) | Value,
end of
period | % of
net
assets | Shares,
end
of period | Income
from
affiliated
securities |
| Short-term investments | | | | | | | | | |
| Investment companies | | | | | | | | | |
| Wells Fargo Municipal Cash Management Money Market Fund Institutional Class | $6,556,901 | $515,328,450 | $(517,447,662) | $(2,964) | $(39) | $4,434,686 | 0.19% | 4,433,356 | $1,494 |
The accompanying notes are an integral part of these financial statements.
38 | Wells Fargo Ultra Short-Term Municipal Income Fund
Statement of assets and liabilities—December 31, 2020 (unaudited)
| | |
| Assets | |
Investments in unaffiliated securities, at value (cost $2,321,020,685)
| $ 2,330,776,706 |
Investments in affiliated securites, at value (cost $4,434,635)
| 4,434,686 |
Cash
| 513,951 |
Receivable for Fund shares sold
| 18,740,556 |
Receivable for interest
| 9,874,771 |
Receivable for investments sold
| 3,542,029 |
Total assets
| 2,367,882,699 |
| Liabilities | |
Payable for when-issued transactions
| 19,812,602 |
Payable for Fund shares redeemed
| 11,349,187 |
Dividends payable
| 714,074 |
Payable for investments purchased
| 500,000 |
Management fee payable
| 298,015 |
Administration fees payable
| 154,353 |
Trustees’ fees and expenses payable
| 2,953 |
Distribution fee payable
| 1,069 |
Accrued expenses and other liabilities
| 681,453 |
Total liabilities
| 33,513,706 |
Total net assets
| $2,334,368,993 |
| Net assets consist of | |
Paid-in capital
| $ 2,352,541,574 |
Total distributable loss
| (18,172,581) |
Total net assets
| $2,334,368,993 |
| Computation of net asset value and offering price per share | |
Net assets – Class A
| $ 337,557,614 |
Shares outstanding – Class A1
| 35,122,496 |
Net asset value per share – Class A
| $9.61 |
Maximum offering price per share – Class A2
| $9.81 |
Net assets – Class A2
| $ 38,113,697 |
Shares outstanding – Class A21
| 3,965,252 |
Net asset value per share – Class A2
| $9.61 |
Net assets – Class C
| $ 1,485,122 |
Shares outstanding – Class C1
| 156,685 |
Net asset value per share – Class C
| $9.48 |
Net assets – Class R6
| $ 1,022,815,647 |
Shares outstanding – Class R61
| 106,428,354 |
Net asset value per share – Class R6
| $9.61 |
Net assets – Administrator Class
| $ 16,018,182 |
Shares outstanding – Administrator Class1
| 1,666,513 |
Net asset value per share – Administrator Class
| $9.61 |
Net assets – Institutional Class
| $ 918,378,731 |
Shares outstanding – Institutional Class1
| 95,545,262 |
Net asset value per share – Institutional Class
| $9.61 |
| 1 | The Fund has an unlimited number of authorized shares |
| 2 | Maximum offering price is computed as 100/98 of net asset value. On investments of $50,000 or more, the offering price is reduced. |
The accompanying notes are an integral part of these financial statements.
Wells Fargo Ultra Short-Term Municipal Income Fund | 39
Statement of operations—six months ended December 31, 2020 (unaudited)
| | |
| Investment income | |
Interest
| $ 11,241,822 |
Income from affiliated securities
| 1,494 |
Total investment income
| 11,243,316 |
| Expenses | |
Management fee
| 2,627,817 |
| Administration fees | |
Class A
| 284,804 |
Class A2
| 31,680 |
Class C
| 1,863 |
Class R6
| 143,284 |
Administrator Class
| 8,810 |
Institutional Class
| 340,482 |
| Shareholder servicing fees | |
Class A
| 443,908 |
Class A2
| 49,500 |
Class C
| 2,899 |
Administrator Class
| 22,012 |
| Distribution fee | |
Class C
| 8,674 |
Custody and accounting fees
| 49,656 |
Professional fees
| 25,413 |
Registration fees
| 34,382 |
Shareholder report expenses
| 41,408 |
Trustees’ fees and expenses
| 9,875 |
Other fees and expenses
| 26,775 |
Total expenses
| 4,153,242 |
| Less: Fee waivers and/or expense reimbursements | |
Fund-level
| (928,211) |
Class A
| (148,709) |
Class A2
| (16,081) |
Class C
| (2,310) |
Administrator Class
| (1,914) |
Net expenses
| 3,056,017 |
Net investment income
| 8,187,299 |
Payment from affiliate
| 12,001 |
| Realized and unrealized gains (losses) on investments | |
| Net realized gains (losses) on | |
Unaffiliated securities
| 149,880 |
Affiliated securities
| (2,964) |
Net realized gains on investments
| 146,916 |
| Net change in unrealized gains (losses) on | |
Unaffiliated securities
| 4,970,282 |
Affiliated securities
| (39) |
Net change in unrealized gains (losses) on investments
| 4,970,243 |
Net realized and unrealized gains (losses) on investments
| 5,117,159 |
Net increase in net assets resulting from operations
| $13,316,459 |
The accompanying notes are an integral part of these financial statements.
40 | Wells Fargo Ultra Short-Term Municipal Income Fund
Statement of changes in net assets
| | |
| | Six months ended
December 31, 2020
(unaudited) | Year ended
June 30, 2020 |
| Operations | | | | |
Net investment income
| | $ 8,187,299 | | $ 24,982,955 |
Payment from affiliate
| | 12,001 | | 0 |
Net realized gains (losses) on investments
| | 146,916 | | (833,365) |
Net change in unrealized gains (losses) on investments
| | 4,970,243 | | (1,876,251) |
Net increase in net assets resulting from operations
| | 13,316,459 | | 22,273,399 |
| Distributions to shareholders from | | | | |
| Net investment income and net realized gains | | | | |
Class A
| | (912,678) | | (5,002,816) |
Class A2
| | (97,257) | | (19) 1 |
Class C
| | (155) | | (24,530) |
Class R6
| | (3,845,114) | | (10,901,380) |
Administrator Class
| | (44,989) | | (263,819) |
Institutional Class
| | (3,192,282) | | (9,119,360) |
Total distributions to shareholders
| | (8,092,475) | | (25,311,924) |
| Capital share transactions | Shares | | Shares | |
| Proceeds from shares sold | | | | |
Class A
| 2,910,961 | 27,943,807 | 6,982,039 | 66,981,049 |
Class A2
| 6,084,777 | 58,385,781 | 2,610 1 | 25,000 1 |
Class C
| 4,656 | 44,110 | 20,765 | 195,705 |
Class R6
| 83,053,797 | 797,403,961 | 114,021,707 | 1,093,480,689 |
Administrator Class
| 160,941 | 1,545,393 | 672,542 | 6,422,333 |
Institutional Class
| 57,597,493 | 553,031,038 | 56,534,508 | 541,850,398 |
| | | 1,438,354,090 | | 1,708,955,175 |
| Reinvestment of distributions | | | | |
Class A
| 90,206 | 866,084 | 491,863 | 4,718,388 |
Class A2
| 10,003 | 96,062 | 0 1 | 0 1 |
Class C
| 11 | 104 | 1,927 | 18,164 |
Class R6
| 6,134 | 58,890 | 22,585 | 216,591 |
Administrator Class
| 4,588 | 44,056 | 26,926 | 258,320 |
Institutional Class
| 273,791 | 2,629,328 | 809,047 | 7,763,721 |
| | | 3,694,524 | | 12,975,184 |
| Payment for shares redeemed | | | | |
Class A
| (7,119,936) | (68,320,101) | (14,529,551) | (139,266,683) |
Class A2
| (2,132,138) | (20,477,417) | 0 1 | 0 1 |
Class C
| (158,741) | (1,501,562) | (786,807) | (7,418,979) |
Class R6
| (62,482,089) | (599,882,758) | (108,448,304) | (1,040,161,896) |
Administrator Class
| (401,748) | (3,857,225) | (1,467,495) | (14,059,616) |
Institutional Class
| (33,773,654) | (324,326,887) | (52,922,721) | (507,283,441) |
| | | (1,018,365,950) | | (1,708,190,615) |
Net increase in net assets resulting from capital share transactions
| | 423,682,664 | | 13,739,745 |
Total increase in net assets
| | 428,906,648 | | 10,701,158 |
| Net assets | | | | |
Beginning of period
| | 1,905,462,345 | | 1,894,761,187 |
End of period
| | $ 2,334,368,993 | | $ 1,905,462,345 |
| 1 | For the period from May 29, 2020 (commencement of class operations) to June 30, 2020 |
The accompanying notes are an integral part of these financial statements.
Wells Fargo Ultra Short-Term Municipal Income Fund | 41
Financial highlights
(For a share outstanding throughout each period)
| | | Year ended June 30 |
| Class A | Six months ended
December 31, 2020
(unaudited) | 2020 | 2019 | 2018 | 2017 | 2016 |
Net asset value, beginning of period
| $9.59 | $9.60 | $9.57 | $9.57 | $9.63 | $9.61 |
Net investment income
| 0.03 | 0.12 | 0.12 1 | 0.08 | 0.06 | 0.04 |
Net realized and unrealized gains (losses) on investments
| 0.02 | (0.01) | 0.03 | 0.00 2 | (0.06) | 0.02 |
Total from investment operations
| 0.05 | 0.11 | 0.15 | 0.08 | 0.00 | 0.06 |
| Distributions to shareholders from | | | | | | |
Net investment income
| (0.03) | (0.12) | (0.12) | (0.08) | (0.06) | (0.04) |
Net realized gains
| 0.00 | 0.00 | 0.00 | 0.00 | (0.00) 2 | (0.00) 2 |
Total distributions to shareholders
| (0.03) | (0.12) | (0.12) | (0.08) | (0.06) | (0.04) |
Net asset value, end of period
| $9.61 | $9.59 | $9.60 | $9.57 | $9.57 | $9.63 |
Total return3
| 0.47% | 1.13% | 1.63% | 0.88% | (0.04)% | 0.61% |
| Ratios to average net assets (annualized) | | | | | | |
Gross expenses
| 0.66% | 0.77% | 0.77% | 0.77% | 0.75% | 0.75% |
Net expenses
| 0.50% | 0.65% | 0.67% | 0.67% | 0.67% | 0.67% |
Net investment income
| 0.52% | 1.21% | 1.28% | 0.86% | 0.57% | 0.38% |
| Supplemental data | | | | | | |
Portfolio turnover rate
| 14% | 55% | 55% | 50% | 56% | 41% |
Net assets, end of period (000s omitted)
| $337,558 | $376,203 | $444,581 | $702,570 | $971,189 | $1,209,818 |
| 1 | Calculated based upon average shares outstanding |
| 2 | Amount is less than $0.005. |
| 3 | Total return calculations do not include any sales charges. Returns for periods of less than one year are not annualized. |
The accompanying notes are an integral part of these financial statements.
42 | Wells Fargo Ultra Short-Term Municipal Income Fund
Financial highlights
(For a share outstanding throughout each period)
| | | Year ended June 30 |
| Class A2 | Six months ended
December 31, 2020
(unaudited) | 2020 1 |
Net asset value, beginning of period
| $9.59 | $9.58 |
Net investment income
| 0.03 | 0.01 |
Net realized and unrealized gains (losses) on investments
| 0.02 | 0.01 |
Total from investment operations
| 0.05 | 0.02 |
| Distributions to shareholders from | | |
Net investment income
| (0.03) | (0.01) |
Net asset value, end of period
| $9.61 | $9.59 |
Total return2
| 0.47% | 0.18% |
| Ratios to average net assets (annualized) | | |
Gross expenses
| 0.66% | 0.65% |
Net expenses
| 0.50% | 0.50% |
Net investment income
| 0.49% | 0.88% |
| Supplemental data | | |
Portfolio turnover rate
| 14% | 55% |
Net assets, end of period (000s omitted)
| $38,114 | $25 |
| 1 | For the period from May 29, 2020 (commencement of class operations) to June 30, 2020 |
| 2 | Returns for periods of less than one year are not annualized. |
The accompanying notes are an integral part of these financial statements.
Wells Fargo Ultra Short-Term Municipal Income Fund | 43
Financial highlights
(For a share outstanding throughout each period)
| | | Year ended June 30 |
| Class C | Six months ended
December 31, 2020
(unaudited) | 2020 | 2019 | 2018 | 2017 | 2016 |
Net asset value, beginning of period
| $9.41 | $9.43 | $9.40 | $9.40 | $9.47 | $9.49 |
Net investment income (loss)
| 0.00 1 | 0.04 2 | 0.05 2 | 0.01 2 | (0.02) 2 | (0.04) 2 |
Payment from affiliate
| 0.08 | 0.00 | 0.00 | 0.00 | 0.00 | 0.00 |
Net realized and unrealized gains (losses) on investments
| (0.01) | (0.02) | 0.03 | 0.00 1 | (0.05) | 0.02 |
Total from investment operations
| 0.07 | 0.02 | 0.08 | 0.01 | (0.07) | (0.02) |
| Distributions to shareholders from | | | | | | |
Net investment income
| (0.00) 1 | (0.04) | (0.05) | (0.01) | (0.00) 1 | 0.00 |
Net realized gains
| 0.00 | 0.00 | 0.00 | 0.00 | (0.00) 1 | (0.00) 1 |
Total distributions to shareholders
| 0.00 | (0.04) | (0.05) | (0.01) | (0.00) 1 | (0.00) 1 |
Net asset value, end of period
| $9.48 | $9.41 | $9.43 | $9.40 | $9.40 | $9.47 |
Total return3
| 0.75% 4 | 0.26% | 0.87% | 0.16% | (0.73)% | (0.19)% |
| Ratios to average net assets (annualized) | | | | | | |
Gross expenses
| 1.41% | 1.51% | 1.52% | 1.52% | 1.50% | 1.50% |
Net expenses
| 1.01% | 1.41% | 1.42% | 1.42% | 1.42% | 1.42% |
Net investment income (loss)
| 0.02% | 0.47% | 0.54% | 0.11% | (0.18)% | (0.37)% |
| Supplemental data | | | | | | |
Portfolio turnover rate
| 14% | 55% | 55% | 50% | 56% | 41% |
Net assets, end of period (000s omitted)
| $1,485 | $2,925 | $10,135 | $17,154 | $23,650 | $31,837 |
| 1 | Amount is less than $0.005. |
| 2 | Calculated based upon average shares outstanding |
| 3 | Total return calculations do not include any sales charges. Returns for periods of less than one year are not annualized. |
| 4 | During the six months ended December 31, 2020, the Fund received a payment from an affiliate which had a 0.81% impact on the total return. See Note 4 in the Notes to Financial Statements for additional information. |
The accompanying notes are an integral part of these financial statements.
44 | Wells Fargo Ultra Short-Term Municipal Income Fund
Financial highlights
(For a share outstanding throughout each period)
| | | Year ended June 30 |
| Class R6 | Six months ended
December 31, 2020
(unaudited) | 2020 | 2019 1 |
Net asset value, beginning of period
| $9.59 | $9.60 | $9.58 |
Net investment income
| 0.04 | 0.15 | 0.15 2 |
Net realized and unrealized gains (losses) on investments
| 0.02 | (0.01) | 0.02 |
Total from investment operations
| 0.06 | (0.14) | 0.17 |
| Distributions to shareholders from | | | |
Net investment income
| (0.04) | (0.15) | (0.15) |
Net asset value, end of period
| $9.61 | $9.59 | $9.60 |
Total return3
| 0.62% | 1.47% | 1.76% |
| Ratios to average net assets (annualized) | | | |
Gross expenses
| 0.28% | 0.38% | 0.39% |
Net expenses
| 0.20% | 0.31% | 0.32% |
Net investment income
| 0.81% | 1.54% | 1.73% |
| Supplemental data | | | |
Portfolio turnover rate
| 14% | 55% | 55% |
Net assets, end of period (000s omitted)
| $1,022,816 | $822,986 | $770,634 |
| 1 | For the period from July 31, 2018 (commencement of class operations) to June 30, 2019 |
| 2 | Calculated based upon average shares outstanding |
| 3 | Returns for periods of less than one year are not annualized. |
The accompanying notes are an integral part of these financial statements.
Wells Fargo Ultra Short-Term Municipal Income Fund | 45
Financial highlights
(For a share outstanding throughout each period)
| | | Year ended June 30 |
| Administrator Class | Six months ended
December 31, 2020
(unaudited) | 2020 | 2019 | 2018 | 2017 | 2016 |
Net asset value, beginning of period
| $9.59 | $9.60 | $9.57 | $9.57 | $9.63 | $9.61 |
Net investment income
| 0.03 | 0.12 1 | 0.13 1 | 0.08 1 | 0.06 | 0.04 |
Net realized and unrealized gains (losses) on investments
| 0.01 | (0.01) | 0.03 | 0.01 | (0.06) | 0.02 |
Total from investment operations
| 0.04 | 0.11 | 0.16 | 0.09 | 0.00 | 0.06 |
| Distributions to shareholders from | | | | | | |
Net investment income
| (0.02) | (0.12) | (0.13) | (0.09) | (0.06) | (0.04) |
Net realized gains
| 0.00 | 0.00 | 0.00 | 0.00 | (0.00) 2 | (0.00) 2 |
Total distributions to shareholders
| (0.02) | (0.12) | (0.13) | (0.09) | (0.06) | (0.04) |
Net asset value, end of period
| $9.61 | $9.59 | $9.60 | $9.57 | $9.57 | $9.63 |
Total return3
| 0.47% | 1.19% | 1.70% | 0.95% | 0.03% | 0.68% |
| Ratios to average net assets (annualized) | | | | | | |
Gross expenses
| 0.60% | 0.70% | 0.70% | 0.70% | 0.70% | 0.68% |
Net expenses
| 0.50% | 0.59% | 0.60% | 0.60% | 0.60% | 0.60% |
Net investment income
| 0.52% | 1.28% | 1.34% | 0.82% | 0.69% | 0.45% |
| Supplemental data | | | | | | |
Portfolio turnover rate
| 14% | 55% | 55% | 50% | 56% | 41% |
Net assets, end of period (000s omitted)
| $16,018 | $18,243 | $25,649 | $53,746 | $1,946,987 | $226,125 |
| 1 | Calculated based upon average shares outstanding |
| 2 | Amount is less than $0.005. |
| 3 | Returns for periods of less than one year are not annualized. |
The accompanying notes are an integral part of these financial statements.
46 | Wells Fargo Ultra Short-Term Municipal Income Fund
Financial highlights
(For a share outstanding throughout each period)
| | | Year ended June 30 |
| Institutional Class | Six months ended
December 31, 2020
(unaudited) | 2020 | 2019 | 2018 | 2017 | 2016 |
Net asset value, beginning of period
| $9.59 | $9.60 | $9.57 | $9.58 | $9.63 | $9.61 |
Net investment income
| 0.04 | 0.14 | 0.15 1 | 0.11 | 0.08 1 | 0.07 |
Net realized and unrealized gains (losses) on investments
| 0.02 | 0.00 | 0.03 | (0.01) | (0.05) | 0.02 |
Total from investment operations
| 0.06 | 0.14 | 0.18 | 0.10 | 0.03 | 0.09 |
| Distributions to shareholders from | | | | | | |
Net investment income
| (0.04) | (0.15) | (0.15) | (0.11) | (0.08) | (0.07) |
Net realized gains
| 0.00 | 0.00 | 0.00 | 0.00 | (0.00) 2 | (0.00) 2 |
Total distributions to shareholders
| (0.04) | (0.15) | (0.15) | (0.11) | (0.08) | (0.07) |
Net asset value, end of period
| $9.61 | $9.59 | $9.60 | $9.57 | $9.58 | $9.63 |
Total return3
| 0.59% | 1.42% | 1.93% | 1.07% | 0.36% | 0.91% |
| Ratios to average net assets (annualized) | | | | | | |
Gross expenses
| 0.33% | 0.43% | 0.44% | 0.44% | 0.42% | 0.42% |
Net expenses
| 0.25% | 0.36% | 0.37% | 0.37% | 0.37% | 0.37% |
Net investment income
| 0.76% | 1.50% | 1.56% | 1.16% | 0.86% | 0.68% |
| Supplemental data | | | | | | |
Portfolio turnover rate
| 14% | 55% | 55% | 50% | 56% | 41% |
Net assets, end of period (000s omitted)
| $918,379 | $685,081 | $643,762 | $2,141,197 | $2,713,317 | $4,061,647 |
| 1 | Calculated based upon average shares outstanding |
| 2 | Amount is less than $0.005. |
| 3 | Returns for periods of less than one year are not annualized. |
The accompanying notes are an integral part of these financial statements.
Wells Fargo Ultra Short-Term Municipal Income Fund | 47
Notes to financial statements (unaudited)
1. ORGANIZATION
Wells Fargo Funds Trust (the “Trust”), a Delaware statutory trust organized on March 10, 1999, is an open-end management investment company registered under the Investment Company Act of 1940, as amended (the “1940 Act”). As an investment company, the Trust follows the accounting and reporting guidance in Financial Accounting Standards Board (“FASB”) Accounting Standards Codification Topic 946, Financial Services – Investment Companies. These financial statements report on the Wells Fargo Ultra Short-Term Municipal Income Fund (the “Fund”) which is a diversified series of the Trust.
2. SIGNIFICANT ACCOUNTING POLICIES
The following significant accounting policies, which are consistently followed in the preparation of the financial statements of the Fund, are in conformity with U.S. generally accepted accounting principles which require management to make estimates and assumptions that affect the reported amounts of assets and liabilities, disclosure of contingent assets and liabilities at the date of the financial statements, and the reported amounts of income and expenses during the reporting period. Actual results could differ from those estimates.
Securities valuation
All investments are valued each business day as of the close of regular trading on the New York Stock Exchange (generally 4 p.m. Eastern Time), although the Fund may deviate from this calculation time under unusual or unexpected circumstances.
Debt securities are valued at the evaluated bid price provided by an independent pricing service (e.g. taking into account various factors, including yields, maturities, or credit ratings) or, if a reliable price is not available, the quoted bid price from an independent broker-dealer.
Investments in registered open-end investment companies are valued at net asset value.
Investments which are not valued using any of the methods discussed above are valued at their fair value, as determined in good faith by the Board of Trustees of the Fund. The Board of Trustees has established a Valuation Committee comprised of the Trustees and has delegated to it the authority to take any actions regarding the valuation of portfolio securities that the Valuation Committee deems necessary or appropriate, including determining the fair value of portfolio securities, unless the determination has been delegated to the Wells Fargo Asset Management Pricing Committee at Wells Fargo Funds Management, LLC ("Funds Management"). The Board of Trustees retains the authority to make or ratify any valuation decisions or approve any changes to the Valuation Procedures as it deems appropriate. On a quarterly basis, the Board of Trustees receives reports on any valuation actions taken by the Valuation Committee or the Wells Fargo Asset Management Pricing Committee which may include items for ratification.
When-issued transactions
The Fund may purchase securities on a forward commitment or when-issued basis. The Fund records a when-issued transaction on the trade date and will segregate assets in an amount at least equal in value to the Fund's commitment to purchase when-issued securities. Securities purchased on a when-issued basis are marked-to-market daily and the Fund begins earning interest on the settlement date. Losses may arise due to changes in the market value of the underlying securities or if the counterparty does not perform under the contract.
Security transactions and income recognition
Securities transactions are recorded on a trade date basis. Realized gains or losses are recorded on the basis of identified cost.
Interest income is accrued daily and bond discounts are accreted and premiums are amortized daily. To the extent debt obligations are placed on non-accrual status, any related interest income may be reduced by writing off interest receivables when the collection of all or a portion of interest has been determined to be doubtful based on consistently applied procedures and the fair value has decreased. If the issuer subsequently resumes interest payments or when the collectability of interest is reasonably assured, the debt obligation is removed from non-accrual status.
Distributions to shareholders
Distributions to shareholders from net investment income are declared daily and paid monthly. Distributions from net realized gains, if any, are recorded on the ex-dividend date and paid at least annually. Such distributions are determined in accordance with income tax regulations and may differ from U.S. generally accepted accounting principles. Dividend sources are estimated at the time of declaration. The tax character of distributions is determined as of the Fund’s fiscal year end. Therefore, a portion of the Fund’s distributions made prior to the Fund’s fiscal year end may be categorized as a tax return of capital at year end.
48 | Wells Fargo Ultra Short-Term Municipal Income Fund
Notes to financial statements (unaudited)
Federal and other taxes
The Fund intends to continue to qualify as a regulated investment company by distributing substantially all of its investment company taxable and tax-exempt income and any net realized capital gains (after reduction for capital loss carryforwards) sufficient to relieve it from all, or substantially all, federal income taxes. Accordingly, no provision for federal income taxes was required.
The Fund’s income and federal excise tax returns and all financial records supporting those returns for the prior three fiscal years are subject to examination by the federal and Delaware revenue authorities. Management has analyzed the Fund’s tax positions taken on federal, state, and foreign tax returns for all open tax years and does not believe that there are any uncertain tax positions that require recognition of a tax liability.
As of December 31, 2020, the aggregate cost of all investments for federal income tax purposes was $2,325,647,590 and the unrealized gains (losses) consisted of:
| Gross unrealized gains | $10,886,565 |
| Gross unrealized losses | (1,322,763) |
| Net unrealized gains | $ 9,563,802 |
As of June 30, 2020, the Fund had capital loss carryforwards which consisted of $3,461,404 in short-term capital losses and $23,743,779 in long-term capital losses.
Class allocations
The separate classes of shares offered by the Fund differ principally in applicable sales charges, distribution, shareholder servicing, and administration fees. Class specific expenses are charged directly to that share class. Investment income, common fund-level expenses, and realized and unrealized gains (losses) on investments are allocated daily to each class of shares based on the relative proportion of net assets of each class.
3. FAIR VALUATION MEASUREMENTS
Fair value measurements of investments are determined within a framework that has established a fair value hierarchy based upon the various data inputs utilized in determining the value of the Fund’s investments. The three-level hierarchy gives the highest priority to unadjusted quoted prices in active markets for identical assets or liabilities (Level 1) and the lowest priority to unobservable inputs (Level 3). The Fund’s investments are classified within the fair value hierarchy based on the lowest level of input that is significant to the fair value measurement. The inputs are summarized into three broad levels as follows:
| ■ | Level 1 – quoted prices in active markets for identical securities |
| ■ | Level 2 – other significant observable inputs (including quoted prices for similar securities, interest rates, prepayment speeds, credit risk, etc.) |
| ■ | Level 3 – significant unobservable inputs (including the Fund’s own assumptions in determining the fair value of investments) |
The inputs or methodologies used for valuing investments in securities are not necessarily an indication of the risk associated with investing in those securities.
The following is a summary of the inputs used in valuing the Fund’s assets and liabilities as of December 31, 2020:
| | Quoted prices
(Level 1) | Other significant
observable inputs
(Level 2) | Significant
unobservable inputs
(Level 3) | Total |
| Assets | | | | |
| Investments in: | | | | |
| Closed end municipal bond fund obligations | $ 0 | $ 39,200,000 | $0 | $ 39,200,000 |
| Municipal obligations | 0 | 2,291,576,706 | 0 | 2,291,576,706 |
| Short-term investments | | | | |
| Investment companies | 4,434,686 | 0 | 0 | 4,434,686 |
| Total assets | $4,434,686 | $2,330,776,706 | $0 | $2,335,211,392 |
Wells Fargo Ultra Short-Term Municipal Income Fund | 49
Notes to financial statements (unaudited)
Additional sector, industry or geographic detail is included in the Portfolio of Investments.
For the six months ended December 31, 2020, the Fund did not have any transfers into/out of Level 3.
4. TRANSACTIONS WITH AFFILIATES
Management fee
Funds Management, an indirect wholly owned subsidiary of Wells Fargo & Company (“Wells Fargo”), is the manager of the Fund and provides advisory and fund-level administrative services under an investment management agreement. Under the investment management agreement, Funds Management is responsible for, among other services, implementing the investment objectives and strategies of the Fund, supervising the subadviser and providing fund-level administrative services in connection with the Fund’s operations. As compensation for its services under the investment management agreement, Funds Management is entitled to receive a management fee at the following annual rate based on the Fund’s average daily net assets:
| Average daily net assets | Management fee |
| First $1 billion | 0.250% |
| Next $4 billion | 0.225 |
| Next $5 billion | 0.190 |
| Over $10 billion | 0.180 |
For the six months ended December 31, 2020, the management fee was equivalent to an annual rate of 0.24% of the Fund’s average daily net assets.
Funds Management has retained the services of a subadviser to provide daily portfolio management to the Fund. The fee for subadvisory services is borne by Funds Management. Wells Capital Management, Incorporated, an affiliate of Funds Management and an indirect wholly owned subsidiary of Wells Fargo, is the subadviser to the Fund and is entitled to receive a fee from Funds Management at an annual rate starting at 0.15% and declining to 0.05% as the average daily net assets of the Fund increase.
Administration fees
Under a class-level administration agreement, Funds Management provides class-level administrative services to the Fund, which includes paying fees and expenses for services provided by the transfer agent, sub-transfer agents, omnibus account servicers and record-keepers. As compensation for its services under the class-level administration agreement, Funds Management receives an annual fee which is calculated based on the average daily net assets of each class as follows:
| | Class-level
administration fee |
| Class A | 0.16% |
| Class A2 | 0.16 |
| Class C | 0.16 |
| Class R6 | 0.03 |
| Administrator Class | 0.10 |
| Institutional Class | 0.08 |
Waivers and/or expense reimbursements
Funds Management has contractually waived and/or reimbursed management and administration fees to the extent necessary to maintain certain net operating expense ratios for the Fund. When each class of the Fund has exceeded its expense cap, Funds Management has waived fees and/or reimbursed expenses from fund-level expenses on a proportionate basis and then from class specific expenses. When only certain classes exceed their expense caps, waivers and/or reimbursements are applied against class specific expenses before fund-level expenses. Funds Management has committed through October 31, 2021 to waive fees and/or reimburse expenses to the extent necessary to cap the Fund’s expenses at 0.50% or Class A shares, 0.50% for Class A2 shares, 1.25% for Class C shares, 0.20% for Class R6 shares, 0.50% for Administrator Class shares, and 0.25% for Institutional Class shares. Prior to or after the commitment expiration date, the cap may be increased or the commitment to maintain the cap may be terminated only with the approval of the Board of Trustees.
50 | Wells Fargo Ultra Short-Term Municipal Income Fund
Notes to financial statements (unaudited)
Distribution fee
The Trust has adopted a distribution plan for Class C shares of the Fund pursuant to Rule 12b-1 under the 1940 Act. A distribution fee is charged charged to Class C shares and paid to Wells Fargo Funds Distributor, LLC (“Funds Distributor”), the principal underwriter, at an annual rate of 0.75% of the average daily net assets of Class C shares.
In addition, Funds Distributor is entitled to receive the front-end sales charge from the purchase of Class A shares and a contingent deferred sales charge on the redemption of certain Class A shares. Funds Distributor is also entitled to receive the contingent deferred sales charges from redemptions of Class C shares. For the six months ended December 31, 2020, Funds Distributor received $417 from the sale of Class A shares. No contingent deferred sales charges were incurred by Class A and Class C shares for the six months ended December 31, 2020.
Shareholder servicing fees
The Trust has entered into contracts with one or more shareholder servicing agents, whereby Class A, Class A2, Class C, and Administrator Class of the Fund are charged a fee at an annual rate of 0.25% of the average daily net assets of each respective class. A portion of these total shareholder servicing fees were paid to affiliates of Wells Fargo.
Interfund transactions
The Fund may purchase or sell portfolio investment securities to certain other Wells Fargo affiliates pursuant to Rule 17a-7 under the 1940 Act and under procedures adopted by the Board of Trustees. The procedures have been designed to ensure that these interfund transactions, which do not incur broker commissions, are effected at current market prices. Pursuant to these procedures, the Fund had $488,090,873, $337,470,000 and $0 in interfund purchases, sales and net realized gains (losses), respectively, during the six months ended December 31, 2020.
Other transactions
On August 14, 2020, Class C of the Fund was reimbursed by Funds Management in the amount of $12,001. The reimbursement was made in connection with resolving certain fee reimbursements.
5. INVESTMENT PORTFOLIO TRANSACTIONS
Purchases and sales of investments, excluding U.S. government obligations (if any) and short-term securities, for the six months ended December 31, 2020 were $689,004,655 and $219,549,882, respectively.
6. BANK BORROWINGS
The Trust (excluding the money market funds), Wells Fargo Master Trust and Wells Fargo Variable Trust are parties to a $350,000,000 revolving credit agreement whereby the Fund is permitted to use bank borrowings for temporary or emergency purposes, such as to fund shareholder redemption requests. Interest under the credit agreement is charged to the Fund based on a borrowing rate equal to the higher of the Federal Funds rate in effect on that day plus 1.25% or the overnight LIBOR rate in effect on that day plus 1.25%. In addition, an annual commitment fee equal to 0.25% of the unused balance is allocated to each participating fund.
For the six months ended December 31, 2020, there were no borrowings by the Fund under the agreement.
7. INDEMNIFICATION
Under the Fund's organizational documents, the officers and Trustees have been granted certain indemnification rights against certain liabilities that may arise out of performance of their duties to the Fund. The Fund has entered into a separate agreement with each Trustee that converts indemnification rights currently existing under the Fund’s organizational documents into contractual rights that cannot be changed in the future without the consent of the Trustee. Additionally, in the normal course of business, the Fund may enter into contracts with service providers that contain a variety of indemnification clauses. The Fund’s maximum exposure under these arrangements is dependent on future claims that may be made against the Fund and, therefore, cannot be estimated.
8. NEW ACCOUNTING PRONOUNCEMENT
In August 2018, FASB issued Accounting Standards Update (“ASU”) No. 2018-13, Fair Value Measurement (Topic 820) Disclosure Framework - Changes to the Disclosure Requirements for Fair Value Measurement. ASU 2018-13 updates the disclosure requirements on fair value measurements in Topic 820, Fair Value Measurements. The amendments are effective for fiscal years, and interim periods within those fiscal years, beginning after December 15, 2019. Management has adopted this guidance which did not have a material impact on the financial statements.
Wells Fargo Ultra Short-Term Municipal Income Fund | 51
Notes to financial statements (unaudited)
9. SUBSEQUENT EVENT
On February 23, 2021, Wells Fargo announced that it has entered into a definitive agreement to sell Wells Fargo Asset Management (“WFAM”) to GTCR LLC and Reverence Capital Partners, L.P. WFAM is the trade name used by the asset management businesses of Wells Fargo and includes Wells Fargo Funds Management, LLC, the investment manager to the Fund, Wells Capital Management Incorporated and Wells Fargo Asset Management (International) Limited, both registered investment advisers providing sub-advisory services to certain funds, and Wells Fargo Funds Distributor, LLC, the Fund’s principal underwriter. As part of the transaction, Wells Fargo will own a 9.9% equity interest and will continue to serve as an important client and distribution partner.
Consummation of the transaction will result in the automatic termination of the Fund’s investment management agreement and sub-advisory agreement(s). The Fund’s Board of Trustees will be asked to approve new investment management arrangements with the new company. If approved by the Board, the new investment management arrangements with the new company will be presented to the shareholders of the Fund for approval, and, if approved by shareholders, would take effect upon the closing of the transaction. The transaction is expected to close in the second half of 2021, subject to customary closing conditions.
10. CORONAVIRUS (COVID-19) PANDEMIC
On March 11, 2020, the World Health Organization announced that it had made the assessment that coronavirus disease 2019 (“COVID-19”) is a pandemic. The impacts of COVID-19 are affecting the entire global economy, individual companies and investment products, and the market in general. There is significant uncertainty around the extent and duration of business disruptions related to COVID-19 and the impacts may be short term or may last for an extended period of time. The risk of further spreading of COVID-19 has led to significant uncertainty and volatility in the financial markets.
52 | Wells Fargo Ultra Short-Term Municipal Income Fund
Other information (unaudited)
PROXY VOTING INFORMATION
A description of the policies and procedures used to determine how to vote proxies relating to portfolio securities is available without charge, upon request, by calling 1-800-222-8222, visiting our website at wfam.com, or visiting the SEC website at sec.gov. Information regarding how the proxies related to portfolio securities were voted during the most recent 12-month period ended June 30 is available on the website at wfam.com or by visiting the SEC website at sec.gov.
QUARTERLY PORTFOLIO HOLDINGS INFORMATION
The Fund files its complete schedule of portfolio holdings with the SEC for the first and third quarters of each fiscal year as an exhibit to its reports on Form N-PORT. Shareholders may view the filed Form N-PORT by visiting the SEC website at sec.gov.
Wells Fargo Ultra Short-Term Municipal Income Fund | 53
Other information (unaudited)
BOARD OF TRUSTEES AND OFFICERS
Each of the Trustees and Officers1 listed in the table below acts in identical capacities for each fund in the Wells Fargo family of funds, which consists of 144 mutual funds comprising the Wells Fargo Funds Trust, Wells Fargo Variable Trust, Wells Fargo Master Trust and four closed-end funds (collectively the “Fund Complex”). This table should be read in conjunction with the Prospectus and the Statement of Additional Information2. The mailing address of each Trustee and Officer is 525 Market Street, 12th Floor, San Francisco, CA 94105. Each Trustee and Officer serves an indefinite term, however, each Trustee serves such term until reaching the mandatory retirement age established by the Trustees.
Independent Trustees
Name and
year of birth | Position held and
length of service* | Principal occupations during past five years or longer | Current other
public company or
investment
company
directorships |
William R. Ebsworth
(Born 1957) | Trustee,
since 2015 | Retired. From 1984 to 2013, equities analyst, portfolio manager, research director and chief investment officer at Fidelity Management and Research Company in Boston, Tokyo, and Hong Kong, and retired in 2013 as Chief Investment Officer of Fidelity Strategic Advisers, Inc. where he led a team of investment professionals managing client assets. Prior thereto, Board member of Hong Kong Securities Clearing Co., Hong Kong Options Clearing Corp., the Thailand International Fund, Ltd., Fidelity Investments Life Insurance Company, and Empire Fidelity Investments Life Insurance Company. Audit Committee Chair and Investment Committee Chair of the Vincent Memorial Hospital Endowment (non-profit organization). Mr. Ebsworth is a CFA® charterholder. | N/A |
Jane A. Freeman
(Born 1953) | Trustee,
since 2015;
Chair Liaison,
since 2018 | Retired. From 2012 to 2014 and 1999 to 2008, Chief Financial Officer of Scientific Learning Corporation. From 2008 to 2012, Ms. Freeman provided consulting services related to strategic business projects. Prior to 1999, Portfolio Manager at Rockefeller & Co. and Scudder, Stevens & Clark. Board member of the Harding Loevner Funds from 1996 to 2014, serving as both Lead Independent Director and chair of the Audit Committee. Board member of the Russell Exchange Traded Funds Trust from 2011 to 2012 and the chair of the Audit Committee. Ms. Freeman is also an inactive Chartered Financial Analyst. | N/A |
Isaiah Harris, Jr.
(Born 1952) | Trustee,
since 2009; Audit
Committee
Chair,
since 2019 | Retired. Chairman of the Board of CIGNA Corporation since 2009, and Director since 2005. From 2003 to 2011, Director of Deluxe Corporation. Prior thereto, President and CEO of BellSouth Advertising and Publishing Corp. from 2005 to 2007, President and CEO of BellSouth Enterprises from 2004 to 2005 and President of BellSouth Consumer Services from 2000 to 2003. Emeritus member of the Iowa State University Foundation Board of Governors. Emeritus Member of the Advisory Board of Iowa State University School of Business. Advisory Board Member, Palm Harbor Academy (private school). Mr. Harris is a certified public accountant (inactive status). | CIGNA Corporation |
Judith M. Johnson
(Born 1949) | Trustee,
since 2008 | Retired. Prior thereto, Chief Executive Officer and Chief Investment Officer of Minneapolis Employees Retirement Fund from 1996 to 2008. Ms. Johnson is an attorney, certified public accountant and a certified managerial accountant. | N/A |
David F. Larcker
(Born 1950) | Trustee,
since 2009 | James Irvin Miller Professor of Accounting at the Graduate School of Business (Emeritus), Stanford University, Director of the Corporate Governance Research Initiative and Senior Faculty of The Rock Center for Corporate Governance since 2006. From 2005 to 2008, Professor of Accounting at the Graduate School of Business, Stanford University. Prior thereto, Ernst & Young Professor of Accounting at The Wharton School, University of Pennsylvania from 1985 to 2005. | N/A |
54 | Wells Fargo Ultra Short-Term Municipal Income Fund
Other information (unaudited)
Name and
year of birth | Position held and
length of service* | Principal occupations during past five years or longer | Current other
public company or
investment
company
directorships |
Olivia S. Mitchell
(Born 1953) | Trustee,
since 2006;
Nominating and
Governance
Committee Chair,
since 2018 | International Foundation of Employee Benefit Plans Professor, Wharton School of the University of Pennsylvania since 1993. Director of Wharton’s Pension Research Council and Boettner Center on Pensions & Retirement Research, and Research Associate at the National Bureau of Economic Research. Previously, Cornell University Professor from 1978 to 1993. | N/A |
Timothy J. Penny
(Born 1951) | Trustee,
since 1996;
Chair,
since 2018 | President and Chief Executive Officer of Southern Minnesota Initiative Foundation, a non-profit organization, since 2007. Member of the Board of Trustees of NorthStar Education Finance, Inc., a non-profit organization, since 2007. | N/A |
James G. Polisson
(Born 1959) | Trustee,
since 2018 | Retired. Chief Marketing Officer, Source (ETF) UK Services, Ltd, from 2015 to 2017. From 2012 to 2015, Principal of The Polisson Group, LLC, a management consulting, corporate advisory and principal investing company. Chief Executive Officer and Managing Director at Russell Investments, Global Exchange Traded Funds from 2010 to 2012. Managing Director of Barclays Global Investors from 1998 to 2010 and Global Chief Marketing Officer for iShares and Barclays Global Investors from 2000 to 2010. Trustee of the San Francisco Mechanics’ Institute, a non-profit organization, from 2013 to 2015. Board member of the Russell Exchange Traded Fund Trust from 2011 to 2012. Director of Barclays Global Investors Holdings Deutschland GmbH from 2006 to 2009. Mr. Polisson is an attorney and has a retired status with the Massachusetts and District of Columbia Bar Associations. | N/A |
Pamela Wheelock
(Born 1959) | Trustee,
since January
2020; previously
Trustee from
January 2018 to
July 2019 | Board member of the Destination Medical Center Economic Development Agency, Rochester, Minnesota since 2019. Interim President of the McKnight Foundation from January to September 2020. Acting Commissioner, Minnesota Department of Human Services, July 2019 through September 2019. Human Services Manager (part-time), Minnesota Department of Human Services, October 2019 through December 2019. Chief Operating Officer, Twin Cities Habitat for Humanity from 2017 to 2019. Vice President of University Services, University of Minnesota from 2012 to 2016. Prior thereto, on the Board of Directors, Governance Committee and Finance Committee for the Minnesota Philanthropy Partners (Saint Paul Foundation) from 2012 to 2018, Interim Chief Executive Officer of Blue Cross Blue Shield of Minnesota from 2011 to 2012, Chairman of the Board from 2009 to 2012 and Board Director from 2003 to 2015. Vice President, Leadership and Community Engagement, Bush Foundation, Saint Paul, Minnesota (a private foundation) from 2009 to 2011. Executive Vice President and Chief Financial Officer, Minnesota Sports and Entertainment from 2004 to 2009 and Senior Vice President from 2002 to 2004. Executive Vice President of the Minnesota Wild Foundation from 2004 to 2008. Commissioner of Finance, State of Minnesota, from 1999 to 2002. Currently Board Chair of the Minnesota Wild Foundation since 2010. | N/A |
* Length of service dates reflect the Trustee’s commencement of service with the Trust’s predecessor entities, where applicable.
Wells Fargo Ultra Short-Term Municipal Income Fund | 55
Other information (unaudited)
Officers
Name and
year of birth | Position held and
length of service | Principal occupations during past five years or longer |
Andrew Owen
(Born 1960) | President,
since 2017 | Executive Vice President of Wells Fargo & Company and Head of Affiliated Managers, Wells Fargo Asset Management, since 2014. In addition, Mr. Owen is currently President, Chief Executive Officer and Director of Wells Fargo Funds Management, LLC since 2017. Prior thereto, Executive Vice President responsible for marketing, investments and product development for Wells Fargo Funds Management, LLC, from 2009 to 2014. |
Nancy Wiser1
(Born 1967) | Treasurer,
since 2012 | Executive Vice President of Wells Fargo Funds Management, LLC since 2011. Chief Operating Officer and Chief Compliance Officer at LightBox Capital Management LLC, from 2008 to 2011. |
Michelle Rhee
(Born 1966) | Chief Legal Officer,
since 2019 | Secretary of Wells Fargo Funds Management, LLC and Chief Legal Counsel of Wells Fargo Asset Management since 2018. Deputy General Counsel of Wells Fargo Bank N.A. since 2020 and Assistant General Counsel of Wells Fargo Bank, N.A. from 2018 to 2020. Associate General Counsel and Managing Director of Bank of America Corporation from 2004 to 2018. |
Catherine Kennedy
(Born 1969) | Secretary,
since 2019 | Vice President of Wells Fargo Funds Management, LLC and Senior Counsel of the Wells Fargo Legal Department since 2010. Vice President and Senior Counsel of Evergreen Investment Management Company, LLC from 1998 to 2010. |
Michael H. Whitaker
(Born 1967) | Chief Compliance Officer,
since 2016 | Chief Compliance Officer of Wells Fargo Asset Management since 2016. Senior Vice President and Chief Compliance Officer for Fidelity Investments from 2007 to 2016. |
Jeremy DePalma1
(Born 1974) | Assistant Treasurer,
since 2009 | Senior Vice President of Wells Fargo Funds Management, LLC since 2009. Senior Vice President of Evergreen Investment Management Company, LLC from 2008 to 2010 and head of the Fund Reporting and Control Team within Fund Administration from 2005 to 2010. |
1 Nancy Wiser acts as Treasurer of 67 funds in the Fund Complex. Jeremy DePalma acts as the Treasurer of 77 funds and Assistant Treasurer of 67 funds in the Fund Complex.
2 The Statement of Additional Information includes additional information about the Trustees and is available, without charge, upon request, by calling 1-800-222-8222 or by visiting the website at wfam.com.
56 | Wells Fargo Ultra Short-Term Municipal Income Fund
For more information
More information about Wells Fargo Funds is available free upon request. To obtain literature, please write, visit the Fund's website, or call:
Wells Fargo Funds
P.O. Box 219967
Kansas City, MO 64121-9967
Website: wfam.com
Individual investors: 1-800-222-8222
Retail investment professionals: 1-888-877-9275
Institutional investment professionals: 1-866-765-0778
This report and the financial statements contained herein are submitted for the general information of the shareholders of the Fund. If this report is used for promotional purposes, distribution of the report must be accompanied or preceded by a current prospectus. Before investing, please consider the investment objectives, risks, charges, and expenses of the investment. For a current prospectus and, if available, a summary prospectus, containing this information, call 1-800-222-8222 or visit the Fund’s website at wfam.com. Read the prospectus carefully before you invest or send money.
Wells Fargo Asset Management (WFAM) is the trade name for certain investment advisory/management firms owned by Wells Fargo & Company. These firms include but are not limited to Wells Capital Management Incorporated and Wells Fargo Funds Management, LLC. Certain products managed by WFAM entities are distributed by Wells Fargo Funds Distributor, LLC (a broker-dealer and Member FINRA).
This material is for general informational and educational purposes only and is NOT intended to provide investment advice or a recommendation of any kind— including a recommendation for any specific investment, strategy, or plan.
INVESTMENT PRODUCTS: NOT FDIC INSURED ■ NO BANK GUARANTEE ■ MAY LOSE VALUE
© 2021 Wells Fargo & Company. All rights reserved.
PAR-0121-00285 02-21
SA258/SAR258 12-20
Semi-Annual Report
December 31, 2020
Wells Fargo
Wisconsin Tax-Free Fund
Reduce clutter.
Save trees.
Sign up for electronic delivery of prospectuses and shareholder reports at wellsfargo.com/ advantagedelivery
The views expressed and any forward-looking statements are as of December 31, 2020, unless otherwise noted, and are those of the Fund's portfolio managers and/or Wells Fargo Asset Management. Discussions of individual securities or the markets generally are not intended as individual recommendations. Future events or results may vary significantly from those expressed in any forward-looking statements. The views expressed are subject to change at any time in response to changing circumstances in the market. Wells Fargo Asset Management and the Fund disclaim any obligation to publicly update or revise any views expressed or forward-looking statements.
INVESTMENT PRODUCTS: NOT FDIC INSURED ■ NO BANK GUARANTEE ■ MAY LOSE VALUE
Wells Fargo Wisconsin Tax-Free Fund | 1
Letter to shareholders (unaudited)
Andrew Owen
President
Wells Fargo Funds
Dear Shareholder:
We are pleased to offer you this semi-annual report for the Wells Fargo Wisconsin Tax-Free Fund for the six-month period that ended December 31, 2020. Despite a deeply challenging year, dominated by the spread of COVID-19 cases and a sharp drop in economic output throughout much of the world, global stocks performed extremely well, benefiting from ongoing central bank support and rising optimism over the development and distribution of effective COVID-19 vaccines. Bonds also had positive returns, led by global bonds and high-yield bonds.
For the six-month period, U.S. stocks, based on the S&P 500 Index,1 gained 22.16%. International stocks, as measured by the MSCI ACWI ex USA Index (Net),2 returned 24.33%, while the MSCI EM Index (Net),3 had even stronger performance, with a 31.14% gain. Among bond indexes, the Bloomberg Barclays U.S. Aggregate Bond Index,4 returned 1.29%, the Bloomberg Barclays Global Aggregate ex-USD Index (unhedged),5 gained 9.44%, and the Bloomberg Barclays Municipal Bond Index,6 returned 3.07% while the ICE BofA U.S. High Yield Index,7 gained a hefty 11.49%.
The stock market rally continued in July.
After a volatile first half of the year, an existing stock market rally continued in July with strong results for equities and fixed income. However, economic data and a resurgence of COVID-19 cases underscored the urgent need to regain control of the pandemic. Second-quarter gross domestic product (GDP) shrank from the previous quarter by 9.5% and 12.1% in the U.S. and the eurozone, respectively. In contrast, China’s second-quarter GDP grew 3.2% year over year. The U.S. economy added 1.8 million jobs in July, but a double-digit jobless rate persisted.
The stock market continued to rally in August despite concerns over rising numbers of U.S. and European COVID-19 cases as well as the expiration of the $600 weekly bonus unemployment benefit in July. Relatively strong second-quarter earnings boosted investor sentiment along with the U.S. Federal Reserve’s announcement of a monetary policy shift expected to support longer-term low interest rates. U.S. manufacturing and services activity indexes beat expectations, while the U.S. housing market maintained strength. In Europe, retail sales expanded and consumer confidence was steady. China’s economy continued to expand.
“After a volatile first half of the year, an existing stock market rally continued in July with strong results for equities and fixed income.”
| 1 | The S&P 500 Index consists of 500 stocks chosen for market size, liquidity, and industry group representation. It is a market-value-weighted index with each stock's weight in the index proportionate to its market value. You cannot invest directly in an index. |
| 2 | The Morgan Stanley Capital International (MSCI) All Country World Index (ACWI) ex USA Index (Net) is a free-float-adjusted market-capitalization-weighted index that is designed to measure the equity market performance of developed and emerging markets, excluding the United States. Source: MSCI. MSCI makes no express or implied warranties or representations and shall have no liability whatsoever with respect to any MSCI data contained herein. The MSCI data may not be further redistributed or used as a basis for other indices or any securities or financial products. This report is not approved, reviewed, or produced by MSCI. You cannot invest directly in an index. |
| 3 | The MSCI Emerging Markets (EM) Index (Net) is a free-float-adjusted market-capitalization-weighted index that is designed to measure equity market performance of emerging markets. You cannot invest directly in an index. |
| 4 | The Bloomberg Barclays U.S. Aggregate Bond Index is a broad-based benchmark that measures the investment-grade, U.S. dollar-denominated, fixed-rate taxable bond market, including Treasuries, government-related and corporate securities, mortgage-backed securities (agency fixed-rate and hybrid adjustable-rate mortgage pass-throughs), asset-backed securities, and commercial mortgage-backed securities. You cannot invest directly in an index. |
| 5 | The Bloomberg Barclays Global Aggregate ex-USD Index (unhedged) is an unmanaged index that provides a broad-based measure of the global investment-grade fixed-income markets excluding the U.S. dollar-denominated debt market. You cannot invest directly in an index. |
| 6 | The Bloomberg Barclays Municipal Bond Index is an unmanaged index composed of long-term tax-exempt bonds with a minimum credit rating of Baa. You cannot invest directly in an index. |
| 7 | The ICE BofA U.S. High Yield Index is a market-capitalization-weighted index of domestic and Yankee high-yield bonds. The index tracks the performance of high-yield securities traded in the U.S. bond market. You cannot invest directly in an index. Copyright 2021. ICE Data Indices, LLC. All rights reserved. |
2 | Wells Fargo Wisconsin Tax-Free Fund
Letter to shareholders (unaudited)
Stocks grew more volatile in September on mixed economic data. U.S. economic activity continued to grow. However, U.S. unemployment remained elevated at 7.9% in September. With U.S. Congress delaying further fiscal relief and uncertainties surrounding a possible vaccine, doubts crept back into the financial markets. In the U.K., a lack of progress in Brexit talks weighed on markets. China’s economy picked up steam, fueled by increased global demand.
In October, capital markets stepped back from their six-month rally. Market volatility rose in advance of the U.S. election and amid a global increase in COVID-19 infections. Europe introduced tighter restrictions affecting economic activity. U.S. markets looked favorably at the prospect of Democratic control of the federal purse strings, which could lead to additional fiscal stimulus and a boost to economic activity. Meanwhile, China reported 4.9% third-quarter GDP growth.
Global stocks rallied in November, propelled by optimism over three promising COVID-19 vaccines. Reversing recent trends, value stocks outperformed growth stocks and cyclical stocks outpaced technology stocks. However, U.S. unemployment remained elevated, with a net job loss of 10 million since February. The eurozone services Purchasing Managers’ Index, a monthly survey of purchasing managers, contracted sharply while the region’s manufacturing activity grew. The U.S. election results added to the upbeat mood as investors anticipated more consistent policies in the new administration.
Financial markets ended the year with strength on high expectations for a rapid rollout of the COVID-19 vaccines, the successful passage of a $900 billion stimulus package, and rising expectations of additional economic support from a Democratic-led Congress. U.S. economic data were mixed with still-elevated unemployment and weak retail sales but growth in manufacturing output. In contrast, China’s economic expansion continued in both manufacturing and nonmanufacturing. U.S. COVID-19 infection rates continued to rise even as new state and local lockdown measures were implemented.
Don’t let short-term uncertainty derail long-term investment goals.
Periods of investment uncertainty can present challenges, but experience has taught us that maintaining long-term investment goals can be an effective way to plan for the future. To help you create a sound strategy based on your personal goals and risk tolerance, Wells Fargo Funds offers more than 100 mutual funds spanning a wide range of asset classes and investment styles. Although diversification cannot guarantee an investment profit or prevent losses, we believe it can be an effective way to manage investment risk and potentially smooth out overall portfolio performance. We encourage investors to know their investments and to understand that appropriate levels of risk-taking may unlock opportunities.
Thank you for choosing to invest with Wells Fargo Funds. We appreciate your confidence in us and remain committed to helping you meet your financial needs.
Sincerely,
Andrew Owen
President
Wells Fargo Funds
“Global stocks rallied in November, propelled by optimism over three promising COVID-19 vaccines.”
For further information about your Fund, contact your investment professional, visit our website at wfam.com, or call us directly at 1-800-222-8222.
Wells Fargo Wisconsin Tax-Free Fund | 3
Performance highlights (unaudited)
Investment objective
The Fund seeks current income exempt from federal income tax and Wisconsin individual income tax.
Manager
Wells Fargo Funds Management, LLC
Subadviser
Wells Capital Management Incorporated
Portfolio managers
Bruce R. Johns
Kerry Laurin*
Thomas Stoeckmann
Average annual total returns (%) as of December 31, 2020
| | | Including sales charge | | Excluding sales charge | | Expense ratios1 (%) |
| | Inception date | 1 year | 5 year | 10 year | | 1 year | 5 year | 10 year | | Gross | Net 2 |
| Class A (WWTFX) | 3-31-2008 | -1.09 | 2.04 | 3.07 | | 3.54 | 2.99 | 3.55 | | 0.95 | 0.70 |
| Class C (WWTCX) | 12-26-2002 | 1.75 | 2.22 | 2.77 | | 2.75 | 2.22 | 2.77 | | 1.70 | 1.45 |
| Institutional Class (WWTIX)3 | 10-31-2016 | – | – | – | | 3.71 | 3.14 | 3.62 | | 0.62 | 0.52 |
| Bloomberg Barclays Municipal Bond Index4 | – | – | – | – | | 5.21 | 3.91 | 4.63 | | – | – |
| Bloomberg Barclays Wisconsin Municipal Bond Index5 | – | – | – | – | | 4.82 | 3.49 | 4.17 | | – | – |
Figures quoted represent past performance, which is no guarantee of future results, and do not reflect taxes that a shareholder may pay on an investment in a fund. Investment return and principal value of an investment will fluctuate so that an investor’s shares, when redeemed, may be worth more or less than their original cost. Performance shown without sales charges would be lower if sales charges were reflected. Current performance may be lower or higher than the performance data quoted, which assumes the reinvestment of dividends and capital gains. Current month-end performance is available on the Fund’s website, wfam.com.
Index returns do not include transaction costs associated with buying and selling securities, any mutual fund fees or expenses, or any taxes. It is not possible to invest directly in an index.
For Class A shares, the maximum front-end sales charge is 4.50%. For Class C shares, the maximum contingent deferred sales charge is 1.00%. Performance including a contingent deferred sales charge assumes the sales charge for the corresponding time period. Institutional Class shares are sold without a front-end sales charge or contingent deferred sales charge.
Bond values fluctuate in response to the financial condition of individual issuers, general market and economic conditions, and changes in interest rates. Changes in market conditions and government policies may lead to periods of heightened volatility in the bond market and reduced liquidity for certain bonds held by the Fund. In general, when interest rates rise, bond values fall and investors may lose principal value. Interest rate changes and their impact on the Fund and its share price can be sudden and unpredictable. The use of derivatives may reduce returns and/or increase volatility. Certain investment strategies tend to increase the total risk of an investment (relative to the broader market). The Fund is exposed to Wisconsin and Puerto Rico municipal securities risk, high-yield securities risk, and nondiversification risk. Consult the Fund’s prospectus for additional information on these and other risks. A portion of the Fund’s income may be subject to federal, state, and/or local income taxes or the Alternative Minimum Tax (AMT). Any capital gains distributions may be taxable.
Please see footnotes on page 5.
4 | Wells Fargo Wisconsin Tax-Free Fund
Performance highlights (unaudited)
| Effective maturity distribution as of December 31, 20206 |
| Credit quality as of December 31, 20207 |
| * | Ms. Laurin became a portfolio manager of the Fund on September 1, 2020. |
| 1 | Reflects the expense ratios as stated in the most recent prospectuses. The expense ratios shown are subject to change and may differ from the annualized expense ratios shown in the financial highlights of this report. |
| 2 | The manager has contractually committed through October 31, 2021, to waive fees and/or reimburse expenses to the extent necessary to cap total annual fund operating expenses after fee waivers at 0.70% for Class A, 1.45% for Class C, and 0.52% for Institutional Class. Brokerage commissions, stamp duty fees, interest, taxes, acquired fund fees and expenses (if any), and extraordinary expenses are excluded from the expense caps. Prior to or after the commitment expiration date, the caps may be increased or the commitment to maintain the caps may be terminated only with the approval of the Board of Trustees. Without these caps, the Fund’s returns would have been lower. The expense ratio paid by an investor is the net expense ratio (the total annual fund operating expenses after fee waivers) as stated in the prospectuses. |
| 3 | Historical performance shown for the Institutional Class shares prior to their inception reflects the performance of the Class A shares, and is not adjusted to reflect the Institutional Class expenses. If these expenses had been included, returns for the Institutional Class would be higher. |
| 4 | The Bloomberg Barclays Municipal Bond Index is an unmanaged index composed of long-term tax-exempt bonds with a minimum credit rating of Baa. You cannot invest directly in an index. |
| 5 | The Bloomberg Barclays Wisconsin Municipal Bond Index is the Wisconsin component of the Bloomberg Barclays Municipal Bond Index. You cannot invest directly in an index. |
| 6 | Figures represent the percentage of the Fund's long-term investments. These amounts are subject to change and may have changed since the date specified. |
| 7 | The credit quality distribution of portfolio holdings reflected in the chart is based on ratings from Standard & Poor’s, Moody’s Investors Service, and/ or Fitch Ratings Ltd. Credit quality ratings apply to the underlying holdings of the Fund and not to the Fund itself. The percentages of the Fund’s portfolio with the ratings depicted in the chart are calculated based on the total market value of fixed income securities held by the Fund. If a security was rated by all three rating agencies, the middle rating was utilized. If rated by two of three rating agencies, the lower rating was utilized, and if rated by one of the rating agencies, that rating was utilized. Standard & Poor’s rates the creditworthiness of bonds, ranging from AAA (highest) to D (lowest). Ratings from A to CCC may be modified by the addition of a plus (+) or minus (-) sign to show relative standing within the rating categories. Standard & Poor’s rates the creditworthiness of short-term notes from SP-1 (highest) to SP-3 (lowest). Moody’s rates the creditworthiness of bonds, ranging from Aaa (highest) to C (lowest). Ratings Aa to B may be modified by the addition of a number 1 (highest) to 3 (lowest) to show relative standing within the ratings categories. Moody’s rates the creditworthiness of short-term U.S. tax-exempt municipal securities from MIG 1/VMIG 1 (highest) to SG (lowest). Fitch rates the creditworthiness of bonds, ranging from AAA (highest) to D (lowest). Credit quality distribution is subject to change and may have changed since the date specified. |
Wells Fargo Wisconsin Tax-Free Fund | 5
Fund expenses (unaudited)
As a shareholder of the Fund, you incur two types of costs: (1) transaction costs, including sales charges (loads) on purchase payments and contingent deferred sales charges (if any) on redemptions and (2) ongoing costs, including management fees, distribution (12b-1) and/or shareholder servicing fees, and other Fund expenses. This example is intended to help you understand your ongoing costs (in dollars) of investing in the Fund and to compare these costs with the ongoing costs of investing in other mutual funds.
The example is based on an investment of $1,000 invested at the beginning of the six-month period and held for the entire period from July 1, 2020 to December 31, 2020.
Actual expenses
The “Actual” line of the table below provides information about actual account values and actual expenses. You may use the information in this line, together with the amount you invested, to estimate the expenses that you paid over the period. Simply divide your account value by $1,000 (for example, an $8,600 account value divided by $1,000 = 8.6), then multiply the result by the number in the “Actual” line under the heading entitled “Expenses paid during period” for your applicable class of shares to estimate the expenses you paid on your account during this period.
Hypothetical example for comparison purposes
The “Hypothetical” line of the table below provides information about hypothetical account values and hypothetical expenses based on the Fund’s actual expense ratio and an assumed rate of return of 5% per year before expenses, which is not the Fund’s actual return. The hypothetical account values and expenses may not be used to estimate the actual ending account balance or expenses you paid for the period. You may use this information to compare the ongoing costs of investing in the Fund and other funds. To do so, compare this 5% hypothetical example with the 5% hypothetical examples that appear in the shareholder reports of the other funds.
Please note that the expenses shown in the table are meant to highlight your ongoing costs only and do not reflect any transactional costs, such as sales charges (loads) and contingent deferred sales charges. Therefore, the “Hypothetical” line of the table is useful in comparing ongoing costs only and will not help you determine the relative total costs of owning different funds. In addition, if these transactional costs were included, your costs would have been higher.
| | Beginning
account value
7-1-2020 | Ending
account value
12-31-2020 | Expenses
paid during
the period1 | Annualized net
expense ratio |
| Class A | | | | |
| Actual | $1,000.00 | $1,023.51 | $3.47 | 0.68% |
| Hypothetical (5% return before expenses) | $1,000.00 | $1,021.78 | $3.47 | 0.68% |
| Class C | | | | |
| Actual | $1,000.00 | $1,019.57 | $7.38 | 1.45% |
| Hypothetical (5% return before expenses) | $1,000.00 | $1,017.90 | $7.38 | 1.45% |
| Institutional Class | | | | |
| Actual | $1,000.00 | $1,024.35 | $2.65 | 0.52% |
| Hypothetical (5% return before expenses) | $1,000.00 | $1,022.58 | $2.65 | 0.52% |
1 Expenses paid is equal to the annualized net expense ratio of each class multiplied by the average account value over the period, multiplied by the number of days in the most recent fiscal half-year divided by the number of days in the fiscal year (to reflect the one-half-year period).
6 | Wells Fargo Wisconsin Tax-Free Fund
Portfolio of investments—December 31, 2020 (unaudited)
| | | Interest
rate | Maturity
date | Principal | Value |
| Municipal obligations: 97.91% | | | | | |
| Guam: 4.43% | | | | | |
| Airport revenue: 2.11% | | | | | |
| Guam International Airport Authority Series C (AGM Insured) | | 6.13% | 10-1-2043 | $1,500,000 | $ 1,640,070 |
| Guam Port Authority AMT Series A | | 5.00 | 7-1-2048 | 1,000,000 | 1,192,570 |
| Guam Port Authority AMT Series B | | 5.00 | 7-1-2034 | 445,000 | 540,671 |
| | | | | | 3,373,311 |
| Miscellaneous revenue: 0.91% | | | | | |
| Guam Education Financing Foundation Refunding Bond Certificate of Participation Series 2016A | | 5.00 | 10-1-2022 | 1,400,000 | 1,461,810 |
| Tax revenue: 0.81% | | | | | |
| Guam Government Business Privilege Tax Revenue Series 2011A | | 5.00 | 1-1-2021 | 670,000 | 670,000 |
| Guam Government Limited Obligation Bonds Section 30 Series A | | 5.00 | 12-1-2021 | 600,000 | 619,470 |
| | | | | | 1,289,470 |
| Water & sewer revenue: 0.60% | | | | | |
| Guam Government Waterworks Authority Series A | | 5.00 | 1-1-2050 | 300,000 | 372,009 |
| Guam Government Waterworks Authority Water and Wastewater Refunding Bond | | 5.00 | 7-1-2034 | 500,000 | 597,040 |
| | | | | | 969,049 |
| | | | | | 7,093,640 |
| Illinois: 3.00% | | | | | |
| GO revenue: 1.60% | | | | | |
| Chicago IL CAB City Colleges (National Insured)¤ | | 0.00 | 1-1-2027 | 1,000,000 | 860,760 |
| Chicago IL Park District Special Recreation Activity Series E | | 5.00 | 11-15-2027 | 1,000,000 | 1,179,260 |
| Illinois Refunding Bond Series 2018A | | 5.00 | 10-1-2021 | 500,000 | ��� 514,565 |
| | | | | | 2,554,585 |
| Miscellaneous revenue: 0.77% | | | | | |
| Illinois | | 5.50 | 7-1-2026 | 250,000 | 270,958 |
| Illinois Series C | | 5.00 | 11-1-2029 | 630,000 | 707,597 |
| Illinois Series D | | 5.00 | 11-1-2021 | 250,000 | 257,078 |
| | | | | | 1,235,633 |
| Tax revenue: 0.63% | | | | | |
| Metropolitan Pier & Exposition Authority McCormick Place Expansion Project Series B | | 5.00 | 12-15-2028 | 970,000 | 1,010,759 |
| | | | | | 4,800,977 |
| Michigan: 0.07% | | | | | |
| Miscellaneous revenue: 0.07% | | | | | |
| Michigan Municipal Bond Authority Local Government Loan Program Series A (Ambac Insured) | | 4.00 | 11-1-2021 | 110,000 | 110,142 |
The accompanying notes are an integral part of these financial statements.
Wells Fargo Wisconsin Tax-Free Fund | 7
Portfolio of investments—December 31, 2020 (unaudited)
| | | Interest
rate | Maturity
date | Principal | Value |
| New Jersey: 1.91% | | | | | |
| Education revenue: 0.67% | | | | | |
| New Jersey EDA Series EE | | 5.00% | 9-1-2023 | $1,070,000 | $ 1,077,490 |
| Tax revenue: 0.28% | | | | | |
| New Jersey Statewide Covid-19 Emergency Series A | | 5.00 | 6-1-2027 | 350,000 | 437,745 |
| Transportation revenue: 0.96% | | | | | |
| New Jersey TTFA CAB Series A ¤ | | 0.00 | 12-15-2031 | 2,000,000 | 1,539,340 |
| | | | | | 3,054,575 |
| New York: 1.64% | | | | | |
| Education revenue: 0.69% | | | | | |
| Hempstead NY Local Development Corporation The Academy Charter School Project Series A | | 6.24 | 2-1-2047 | 1,000,000 | 1,112,830 |
| GO revenue: 0.95% | | | | | |
| Suffolk County NY Series A | | 5.00 | 3-19-2021 | 1,500,000 | 1,513,605 |
| | | | | | 2,626,435 |
| Puerto Rico: 0.19% | | | | | |
| Transportation revenue: 0.19% | | | | | |
| Puerto Rico Highway & Transportation Authority Refunding Bond Series L (BHAC / FGIC Insured) | | 5.25 | 7-1-2021 | 300,000 | 305,889 |
| South Carolina: 0.76% | | | | | |
| Utilities revenue: 0.76% | | | | | |
| South Carolina Statewide Public Service Authority Revenue Refunding Bond and Improvement Series A | | 4.00 | 12-1-2033 | 1,000,000 | 1,212,760 |
| Texas: 1.46% | | | | | |
| GO revenue: 1.46% | | | | | |
| Denton TX Independent School District School Building | | 4.00 | 8-15-2048 | 2,000,000 | 2,339,620 |
| Virgin Islands: 1.13% | | | | | |
| Tax revenue: 1.13% | | | | | |
| Virgin Islands PFA Gross Receipts Taxes Loan Notes (AGM Insured) | | 4.00 | 10-1-2022 | 255,000 | 264,359 |
| Virgin Islands PFA Matching Fund Loan Notes Senior Lien Series B (AGM Insured) | | 5.00 | 10-1-2025 | 1,500,000 | 1,551,840 |
| | | | | | 1,816,199 |
| Wisconsin: 83.32% | | | | | |
| Education revenue: 9.33% | | | | | |
| Milwaukee WI RDA Milwaukee School of Engineering Project (AGM Insured) | | 2.75 | 4-1-2021 | 1,080,000 | 1,086,750 |
| Milwaukee WI RDA Milwaukee School of Engineering Project (AGM Insured) | | 4.10 | 4-1-2032 | 1,500,000 | 1,554,255 |
| Milwaukee WI RDA Science Education Consortium Incorporated Project Series A | | 6.25 | 8-1-2043 | 2,100,000 | 2,296,854 |
| Platteville WI RDA University of Wisconsin Platteville Real Estate Foundation Incorporated | | 5.00 | 7-1-2022 | 675,000 | 692,111 |
The accompanying notes are an integral part of these financial statements.
8 | Wells Fargo Wisconsin Tax-Free Fund
Portfolio of investments—December 31, 2020 (unaudited)
| | | Interest
rate | Maturity
date | Principal | Value |
| Education revenue (continued) | | | | | |
| Platteville WI RDA University of Wisconsin Platteville Real Estate Foundation Incorporated | | 5.00% | 7-1-2032 | $1,500,000 | $ 1,535,400 |
| Platteville WI RDA University of Wisconsin Platteville Real Estate Foundation Incorporated | | 5.00 | 7-1-2042 | 1,000,000 | 1,016,510 |
| Wisconsin HEFA Revenue Lawrence University | | 4.00 | 2-1-2021 | 425,000 | 425,735 |
| Wisconsin HEFA Revenue Lawrence University | | 4.00 | 2-1-2022 | 280,000 | 287,143 |
| Wisconsin HEFA Revenue Lawrence University | | 4.00 | 3-15-2040 | 1,555,000 | 1,732,892 |
| Wisconsin HEFA Revenue Lawrence University | | 4.00 | 2-1-2045 | 1,685,000 | 1,825,900 |
| Wisconsin HEFA Revenue Various Refunding Bond Medical College Series B (U.S. Bank NA LOC)ø | | 0.09 | 12-1-2033 | 2,500,000 | 2,500,000 |
| | | | | | 14,953,550 |
| GO revenue: 1.53% | | | | | |
| Milwaukee WI Series B6 | | 2.00 | 4-1-2021 | 175,000 | 175,693 |
| Milwaukee WI Series B6 | | 3.00 | 4-1-2024 | 570,000 | 614,335 |
| Milwaukee WI Series B6 | | 5.00 | 4-1-2022 | 350,000 | 370,101 |
| Milwaukee WI Series B6 | | 5.00 | 4-1-2023 | 580,000 | 637,716 |
| Milwaukee WI Series B6 | | 5.00 | 4-1-2025 | 550,000 | 651,530 |
| | | | | | 2,449,375 |
| Health revenue: 15.95% | | | | | |
| Wisconsin HEFA Bellin Memorial Hospital Incorporated Series A | | 5.00 | 12-1-2027 | 175,000 | 222,917 |
| Wisconsin HEFA Bellin Memorial Hospital Incorporated Series A | | 5.00 | 12-1-2028 | 150,000 | 194,798 |
| Wisconsin HEFA Bellin Memorial Hospital Incorporated Series A | | 5.00 | 12-1-2029 | 150,000 | 198,675 |
| Wisconsin HEFA Bellin Memorial Hospital Incorporated Series A | | 5.00 | 12-1-2030 | 275,000 | 361,133 |
| Wisconsin HEFA Beloit Health System Incorporated | | 4.00 | 7-1-2036 | 3,000,000 | 3,513,780 |
| Wisconsin HEFA Beloit Health System Incorporated | | 5.00 | 7-1-2029 | 1,270,000 | 1,656,918 |
| Wisconsin HEFA Marshfield Clinic Health System | | 3.00 | 2-15-2031 | 230,000 | 241,661 |
| Wisconsin HEFA Marshfield Clinic Health System | | 3.25 | 2-15-2032 | 185,000 | 198,018 |
| Wisconsin HEFA Marshfield Clinic Health System | | 5.00 | 2-15-2047 | 3,385,000 | 3,917,257 |
| Wisconsin HEFA Marshfield Clinic Health System Obligated Group Series C | | 5.00 | 2-15-2027 | 400,000 | 488,944 |
| Wisconsin HEFA Marshfield Clinic Health System Obligated Group Series C | | 5.00 | 2-15-2028 | 650,000 | 789,003 |
| Wisconsin HEFA Marshfield Clinic Health System Obligated Group Series C | | 5.00 | 2-15-2029 | 500,000 | 603,625 |
| Wisconsin HEFA Monroe Clinic Incorporated | | 3.00 | 2-15-2035 | 520,000 | 580,949 |
| Wisconsin HEFA Monroe Clinic Incorporated | | 4.00 | 2-15-2031 | 900,000 | 1,047,879 |
| Wisconsin HEFA Monroe Clinic Incorporated | | 4.00 | 2-15-2033 | 550,000 | 640,371 |
| Wisconsin HEFA Monroe Clinic Incorporated | | 5.00 | 2-15-2028 | 900,000 | 1,088,955 |
| Wisconsin HEFA Monroe Clinic Incorporated | | 5.00 | 2-15-2029 | 575,000 | 695,721 |
| Wisconsin HEFA Monroe Clinic Incorporated | | 5.00 | 2-15-2030 | 340,000 | 411,383 |
| Wisconsin HEFA Refunding Bond Bellin Memorial Hospital Incorporated | | 4.00 | 12-1-2035 | 1,000,000 | 1,077,940 |
| Wisconsin HEFA Refunding Bond Bellin Memorial Hospital Incorporated | | 5.00 | 12-1-2025 | 1,500,000 | 1,722,900 |
| Wisconsin HEFA Refunding Bond Bellin Memorial Hospital Incorporated | | 5.00 | 12-1-2026 | 1,740,000 | 1,988,803 |
The accompanying notes are an integral part of these financial statements.
Wells Fargo Wisconsin Tax-Free Fund | 9
Portfolio of investments—December 31, 2020 (unaudited)
| | | Interest
rate | Maturity
date | Principal | Value |
| Health revenue (continued) | | | | | |
| Wisconsin HEFA Rogers Memorial Hospital Incorporated Series A | | 5.00% | 7-1-2049 | $ 250,000 | $ 290,133 |
| Wisconsin HEFA Rogers Memorial Hospital Incorporated Series B | | 5.00 | 7-1-2044 | 3,250,000 | 3,613,090 |
| | | | | | 25,544,853 |
| Housing revenue: 21.57% | | | | | |
| Green Bay WI Housing Authority Housing Revenue Refunding Bond Student University Village Housing Incorporated | | 2.00 | 4-1-2028 | 125,000 | 129,616 |
| Green Bay WI Housing Authority Housing Revenue Refunding Bond Student University Village Housing Incorporated | | 2.00 | 4-1-2029 | 250,000 | 258,168 |
| Green Bay WI Housing Authority Housing Revenue Refunding Bond Student University Village Housing Incorporated | | 2.00 | 4-1-2030 | 875,000 | 900,226 |
| Whitewater WI CDA Multifamily Revenue Various Housing Wisconsin Housing Preservation (BMO Harris Bank NA LOC)ø | | 0.10 | 6-1-2042 | 1,055,000 | 1,055,000 |
| Wisconsin HEFA Aspirus Wausau Hospital Incorporated Obligated Group Series 2004B (JPMorgan Chase & Company LOC)ø | | 0.08 | 8-15-2034 | 4,000,000 | 4,000,000 |
| Wisconsin Housing & EDA AMT Series A | | 4.63 | 11-1-2037 | 25,000 | 25,042 |
| Wisconsin Housing & EDA Madison Pool Project Series A | | 4.55 | 7-1-2037 | 165,000 | 178,570 |
| Wisconsin Housing & EDA Madison Pool Project Series A | | 4.70 | 7-1-2047 | 2,300,000 | 2,489,359 |
| Wisconsin Housing & EDA Madison Pool Project Series A | | 4.85 | 7-1-2052 | 3,000,000 | 3,254,460 |
| Wisconsin Housing & EDA President House Project (Associated Trust Company NA LOC)ø | | 0.20 | 8-1-2046 | 1,480,000 | 1,480,000 |
| Wisconsin Housing & EDA Series A (FHLB SPA)ø | | 0.09 | 4-1-2046 | 2,935,000 | 2,935,000 |
| Wisconsin Housing & EDA Series A | | 1.70 | 11-1-2052 | 1,700,000 | 1,721,726 |
| Wisconsin Housing & EDA Series A | | 3.00 | 5-1-2022 | 100,000 | 103,305 |
| Wisconsin Housing & EDA Series A | | 3.00 | 11-1-2022 | 125,000 | 130,655 |
| Wisconsin Housing & EDA Series A | | 3.38 | 5-1-2057 | 635,000 | 674,954 |
| Wisconsin Housing & EDA Series A | | 3.40 | 11-1-2032 | 2,450,000 | 2,697,083 |
| Wisconsin Housing & EDA Series A | | 3.95 | 11-1-2038 | 2,000,000 | 2,238,900 |
| Wisconsin Housing & EDA Series A | | 4.05 | 12-1-2049 | 800,000 | 839,032 |
| Wisconsin Housing & EDA Series A | | 5.75 | 11-1-2043 | 2,830,000 | 2,837,245 |
| Wisconsin Housing & EDA Series B (FHLB SPA)ø | | 0.09 | 5-1-2055 | 5,510,000 | 5,510,000 |
| Wisconsin Housing & EDA Series C | | 3.88 | 11-1-2035 | 1,000,000 | 1,081,410 |
| | | | | | 34,539,751 |
| Industrial development revenue: 2.50% | | | | | |
| Appleton WI Recovery Zone Facilities Foremost Farms Project Series 2010 (CoBank ACB LOC)ø | | 0.12 | 5-1-2037 | 4,000,000 | 4,000,000 |
| Miscellaneous revenue: 18.72% | | | | | |
| Appleton WI Redevelopment Authority Redevelopment Revenue Adjusted Fox Cities Arts Center B (Associated Trust Company NA LOC)ø | | 0.25 | 6-1-2036 | 4,000,000 | 4,000,000 |
| Ashwaubenon WI CDA Lease Revenue Brown County Expo Center Project | | 4.00 | 6-1-2031 | 1,310,000 | 1,487,741 |
| Ashwaubenon WI CDA Lease Revenue Brown County Expo Center Project | | 4.00 | 6-1-2035 | 900,000 | 1,006,480 |
| Ashwaubenon WI CDA Lease Revenue Brown County Expo Center Project | | 4.00 | 6-1-2036 | 265,000 | 295,382 |
The accompanying notes are an integral part of these financial statements.
10 | Wells Fargo Wisconsin Tax-Free Fund
Portfolio of investments—December 31, 2020 (unaudited)
| | | Interest
rate | Maturity
date | Principal | Value |
| Miscellaneous revenue (continued) | | | | | |
| Ashwaubenon WI CDA Lease Revenue Brown County Expo Center Project CAB ¤ | | 0.00% | 6-1-2049 | $8,000,000 | $ 2,999,040 |
| Kaukauna WI RDA | | 3.75 | 6-1-2032 | 850,000 | 924,231 |
| Kaukauna WI RDA | | 4.00 | 6-1-2021 | 310,000 | 314,734 |
| Kaukauna WI RDA | | 4.00 | 6-1-2022 | 235,000 | 247,356 |
| Kaukauna WI RDA | | 4.00 | 6-1-2023 | 200,000 | 216,332 |
| Kaukauna WI RDA | | 4.00 | 6-1-2025 | 425,000 | 484,993 |
| Kaukauna WI RDA | | 4.00 | 6-1-2028 | 425,000 | 478,202 |
| Kaukauna WI RDA | | 4.00 | 6-1-2035 | 900,000 | 986,508 |
| Milwaukee WI RDA Lease Public Schools Series A | | 5.00 | 11-15-2026 | 220,000 | 273,579 |
| Milwaukee WI RDA Lease Revenue Public Schools | | 5.00 | 11-15-2033 | 750,000 | 913,890 |
| Milwaukee WI RDA Milwaukee Public Schools | | 5.00 | 11-15-2028 | 325,000 | 400,790 |
| Milwaukee WI RDA Milwaukee Public Schools | | 5.00 | 11-15-2034 | 675,000 | 820,361 |
| Milwaukee WI RDA Milwaukee Public Schools | | 5.00 | 11-15-2035 | 1,000,000 | 1,211,570 |
| Milwaukee WI RDA Milwaukee Public Schools | | 5.00 | 11-15-2036 | 500,000 | 604,840 |
| Milwaukee WI RDA Milwaukee Public Schools Series A | | 5.00 | 11-15-2027 | 1,020,000 | 1,260,496 |
| Milwaukee WI RDA Milwaukee Public Schools Series A | | 5.00 | 11-15-2028 | 1,000,000 | 1,233,200 |
| Milwaukee WI RDA Milwaukee Public Schools Series A | | 5.00 | 11-15-2031 | 750,000 | 919,620 |
| Milwaukee WI RDA Public Schools Series A | | 5.00 | 8-1-2021 | 3,330,000 | 3,420,776 |
| Milwaukee WI RDA Revenue Refunding Bond Milwaukee Public Schools (National Insured) | | 4.00 | 8-1-2023 | 1,025,000 | 1,117,660 |
| Weston WI CDA Series A | | 1.60 | 10-1-2021 | 340,000 | 342,805 |
| Weston WI CDA Series A | | 1.75 | 10-1-2022 | 200,000 | 205,096 |
| Weston WI CDA Series A | | 1.90 | 10-1-2023 | 800,000 | 835,008 |
| Weston WI CDA Series A | | 2.00 | 10-1-2024 | 625,000 | 664,050 |
| Weston WI CDA Series A | | 2.15 | 10-1-2025 | 615,000 | 667,785 |
| Weston WI CDA Series A | | 2.25 | 10-1-2026 | 940,000 | 1,025,643 |
| Weston WI CDA Series A | | 2.40 | 10-1-2027 | 570,000 | 619,744 |
| | | | | | 29,977,912 |
| Tax revenue: 13.72% | | | | | |
| Southeast Wisconsin Professional Baseball Park District Series A (National Insured) | | 5.50 | 12-15-2021 | 2,000,000 | 2,101,140 |
| Southeast Wisconsin Professional Baseball Park District Series A (National Insured) | | 5.50 | 12-15-2023 | 1,600,000 | 1,841,680 |
| Southeast Wisconsin Professional Baseball Park District Series A (National Insured) | | 5.50 | 12-15-2026 | 2,435,000 | 2,985,286 |
| Warrens WI CDA Interim Workout Extension | | 3.70 | 11-1-2029 | 145,030 | 87,034 |
| Wisconsin Center District CAB (AGM Insured)¤ | | 0.00 | 12-15-2030 | 295,000 | 249,010 |
| Wisconsin Center District CAB Senior Dedicated Milwaukee Arena Project Series A (BAM Insured)¤ | | 0.00 | 12-15-2033 | 2,985,000 | 2,068,515 |
| Wisconsin Center District CAB Series A (National Insured)¤ | | 0.00 | 12-15-2027 | 100,000 | 90,170 |
| Wisconsin Center District Junior Dedicated Bond Series A | | 5.00 | 12-15-2022 | 730,000 | 787,561 |
| Wisconsin Center District Junior Dedicated Bond Series A | | 5.00 | 12-15-2030 | 2,100,000 | 2,227,344 |
| Wisconsin Center District Junior Dedicated Tax Revenue Prerefunded Bond (AGM Insured) | | 5.25 | 12-15-2023 | 1,095,000 | 1,189,728 |
| Wisconsin Center District Junior Dedicated Tax Revenue Prerefunded Bond (AGM Insured) | | 5.25 | 12-15-2027 | 220,000 | 274,710 |
| Wisconsin Center District Junior Dedicated Tax Revenue Unrefunded Balance Refunding Bond (AGM Insured) | | 5.25 | 12-15-2023 | 605,000 | 674,974 |
| Wisconsin Center District Junior Dedicated Tax Revenue Unrefunded Balance Refunding Bond (AGM Insured) | | 5.25 | 12-15-2027 | 785,000 | 977,019 |
| Wisconsin Center District Milwaukee Arena Project | | 4.00 | 12-15-2032 | 1,100,000 | 1,242,615 |
| Wisconsin Center District Milwaukee Arena Project | | 4.00 | 12-15-2033 | 920,000 | 1,036,546 |
| Wisconsin Center District Milwaukee Arena Project | | 4.00 | 12-15-2034 | 2,000,000 | 2,252,080 |
The accompanying notes are an integral part of these financial statements.
Wells Fargo Wisconsin Tax-Free Fund | 11
Portfolio of investments—December 31, 2020 (unaudited)
| | | Interest
rate | Maturity
date | Principal | Value |
| Tax revenue (continued) | | | | | |
| Wisconsin Center District Tax Revenue CAB Senior Dedicated Series C (AGM Insured)¤ | | 0.00% | 12-15-2028 | $1,075,000 | $ 958,664 |
| Wisconsin Center District Tax Revenue CAB Senior Dedicated Series C (AGM Insured)¤ | | 0.00 | 12-15-2030 | 1,095,000 | 924,290 |
| | | | | | 21,968,366 |
| | | | | | 133,433,807 |
| Total Municipal obligations (Cost $148,644,573) | | | | | 156,794,044 |
| Total investments in securities (Cost $148,644,573) | 97.91% | | | | 156,794,044 |
| Other assets and liabilities, net | 2.09 | | | | 3,347,211 |
| Total net assets | 100.00% | | | | $160,141,255 |
| ¤ | The security is issued in zero coupon form with no periodic interest payments. |
| ø | Variable rate demand notes are subject to a demand feature which reduces the effective maturity. The maturity date shown represents the final maturity date of the security. The interest rate is determined and reset by the issuer daily, weekly, or monthly depending upon the terms of the security. The rate shown is the rate in effect at period end. |
| Abbreviations: |
| AGM | Assured Guaranty Municipal |
| Ambac | Ambac Financial Group Incorporated |
| AMT | Alternative minimum tax |
| BAM | Build America Mutual Assurance Company |
| BHAC | Berkshire Hathaway Assurance Corporation |
| CAB | Capital appreciation bond |
| CDA | Community Development Authority |
| EDA | Economic Development Authority |
| FGIC | Financial Guaranty Insurance Corporation |
| FHLB | Federal Home Loan Bank |
| GO | General obligation |
| HEFA | Health & Educational Facilities Authority |
| LOC | Letter of credit |
| National | National Public Finance Guarantee Corporation |
| PFA | Public Finance Authority |
| RDA | Redevelopment Authority |
| SPA | Standby purchase agreement |
| TTFA | Transportation Trust Fund Authority |
The accompanying notes are an integral part of these financial statements.
12 | Wells Fargo Wisconsin Tax-Free Fund
Statement of assets and liabilities—December 31, 2020 (unaudited)
| | |
| Assets | |
Investments in unaffiliated securities, at value (cost $148,644,573)
| $ 156,794,044 |
Cash
| 2,549,034 |
Receivable for interest
| 1,361,505 |
Receivable for Fund shares sold
| 94,108 |
Receivable for investments sold
| 45,000 |
Prepaid expenses and other assets
| 52,437 |
Total assets
| 160,896,128 |
| Liabilities | |
Payable for Fund shares redeemed
| 619,930 |
Dividends payable
| 42,370 |
Management fee payable
| 38,699 |
Administration fees payable
| 18,083 |
Distribution fee payable
| 3,573 |
Trustees’ fees and expenses payable
| 2,892 |
Accrued expenses and other liabilities
| 29,326 |
Total liabilities
| 754,873 |
Total net assets
| $160,141,255 |
| Net assets consist of | |
Paid-in capital
| $ 151,845,015 |
Total distributable earnings
| 8,296,240 |
Total net assets
| $160,141,255 |
| Computation of net asset value and offering price per share | |
Net assets – Class A
| $ 76,869,586 |
Shares outstanding – Class A1
| 6,822,334 |
Net asset value per share – Class A
| $11.27 |
Maximum offering price per share – Class A2
| $11.80 |
Net assets – Class C
| $ 5,204,050 |
Shares outstanding – Class C1
| 461,875 |
Net asset value per share – Class C
| $11.27 |
Net assets – Institutional Class
| $ 78,067,619 |
Shares outstanding – Institutional Class1
| 6,927,774 |
Net asset value per share – Institutional Class
| $11.27 |
| 1 | The Fund has an unlimited number of authorized shares |
| 2 | Maximum offering price is computed as 100/95.50 of net asset value. On investments of $50,000 or more, the offering price is reduced. |
The accompanying notes are an integral part of these financial statements.
Wells Fargo Wisconsin Tax-Free Fund | 13
Statement of operations—six months ended December 31, 2020 (unaudited)
| | |
| Investment income | |
Interest
| $ 2,096,329 |
| Expenses | |
Management fee
| 318,426 |
| Administration fees | |
Class A
| 62,855 |
Class C
| 4,562 |
Institutional Class
| 29,977 |
| Shareholder servicing fees | |
Class A
| 98,028 |
Class C
| 7,125 |
| Distribution fee | |
Class C
| 21,374 |
Custody and accounting fees
| 3,321 |
Professional fees
| 25,784 |
Registration fees
| 26,797 |
Shareholder report expenses
| 12,482 |
Trustees’ fees and expenses
| 9,874 |
Other fees and expenses
| 5,724 |
Total expenses
| 626,329 |
| Less: Fee waivers and/or expense reimbursements | |
Fund-level
| (73,380) |
Class A
| (45,547) |
Class C
| (3,071) |
Net expenses
| 504,331 |
Net investment income
| 1,591,998 |
| Realized and unrealized gains (losses) on investments | |
Net realized gains on investments
| 170,485 |
Net change in unrealized gains (losses) on investments
| 1,892,502 |
Net realized and unrealized gains (losses) on investments
| 2,062,987 |
Net increase in net assets resulting from operations
| $3,654,985 |
The accompanying notes are an integral part of these financial statements.
14 | Wells Fargo Wisconsin Tax-Free Fund
Statement of changes in net assets
| | |
| | Six months ended
December 31, 2020
(unaudited) | Year ended
June 30, 2020 |
| Operations | | | | |
Net investment income
| | $ 1,591,998 | | $ 3,310,968 |
Net realized gains on investments
| | 170,485 | | 74,869 |
Net change in unrealized gains (losses) on investments
| | 1,892,502 | | 755,258 |
Net increase in net assets resulting from operations
| | 3,654,985 | | 4,141,095 |
| Distributions to shareholders from | | | | |
| Net investment income and net realized gains | | | | |
Class A
| | (765,329) | | (1,934,145) |
Class C
| | (33,880) | | (95,769) |
Institutional Class
| | (792,789) | | (1,341,692) |
Total distributions to shareholders
| | (1,591,998) | | (3,371,606) |
| Capital share transactions | Shares | | Shares | |
| Proceeds from shares sold | | | | |
Class A
| 600,098 | 6,704,528 | 1,482,669 | 16,452,135 |
Class C
| 70,166 | 787,096 | 86,182 | 958,748 |
Institutional Class
| 1,555,612 | 17,430,799 | 3,006,711 | 33,400,716 |
| | | 24,922,423 | | 50,811,599 |
| Reinvestment of distributions | | | | |
Class A
| 59,598 | 667,504 | 148,360 | 1,649,205 |
Class C
| 2,955 | 33,082 | 8,593 | 95,503 |
Institutional Class
| 66,711 | 747,141 | 117,088 | 1,301,290 |
| | | 1,447,727 | | 3,045,998 |
| Payment for shares redeemed | | | | |
Class A
| (1,136,384) | (12,722,115) | (2,022,543) | (22,260,904) |
Class C
| (136,549) | (1,525,241) | (174,988) | (1,938,589) |
Institutional Class
| (828,949) | (9,289,960) | (971,526) | (10,771,669) |
| | | (23,537,316) | | (34,971,162) |
Net increase in net assets resulting from capital share transactions
| | 2,832,834 | | 18,886,435 |
Total increase in net assets
| | 4,895,821 | | 19,655,924 |
| Net assets | | | | |
Beginning of period
| | 155,245,434 | | 135,589,510 |
End of period
| | $160,141,255 | | $155,245,434 |
The accompanying notes are an integral part of these financial statements.
Wells Fargo Wisconsin Tax-Free Fund | 15
Financial highlights
(For a share outstanding throughout each period)
| | | Year ended June 30 |
| Class A | Six months ended
December 31, 2020
(unaudited) | 2020 | 2019 | 2018 | 2017 | 2016 |
Net asset value, beginning of period
| $11.12 | $11.04 | $10.74 | $10.83 | $11.16 | $10.83 |
Net investment income
| 0.11 | 0.25 | 0.29 | 0.28 | 0.26 | 0.25 |
Net realized and unrealized gains (losses) on investments
| 0.15 | 0.08 | 0.30 | (0.09) | (0.32) | 0.33 |
Total from investment operations
| 0.26 | 0.33 | 0.59 | 0.19 | (0.06) | 0.58 |
| Distributions to shareholders from | | | | | | |
Net investment income
| (0.11) | (0.25) | (0.29) | (0.28) | (0.26) | (0.25) |
Net realized gains
| 0.00 | (0.00) 1 | 0.00 | 0.00 | (0.01) | (0.00) 1 |
Total distributions to shareholders
| (0.11) | (0.25) | (0.29) | (0.28) | (0.27) | (0.25) |
Net asset value, end of period
| $11.27 | $11.12 | $11.04 | $10.74 | $10.83 | $11.16 |
Total return2
| 2.35% | 3.05% | 5.56% | 1.76% | (0.48)% | 5.44% |
| Ratios to average net assets (annualized) | | | | | | |
Gross expenses
| 0.91% | 0.95% | 0.94% | 0.88% | 0.93% | 0.94% |
Net expenses
| 0.68% | 0.69% | 0.70% | 0.70% | 0.70% | 0.70% |
Net investment income
| 1.95% | 2.24% | 2.66% | 2.57% | 2.41% | 2.26% |
| Supplemental data | | | | | | |
Portfolio turnover rate
| 5% | 24% | 8% | 11% | 27% | 16% |
Net assets, end of period (000s omitted)
| $76,870 | $81,173 | $84,924 | $87,790 | $131,518 | $160,480 |
| 1 | Amount is less than $0.005. |
| 2 | Total return calculations do not include any sales charges. Returns for periods of less than one year are not annualized. |
The accompanying notes are an integral part of these financial statements.
16 | Wells Fargo Wisconsin Tax-Free Fund
Financial highlights
(For a share outstanding throughout each period)
| | | Year ended June 30 |
| Class C | Six months ended
December 31, 2020
(unaudited) | 2020 | 2019 | 2018 | 2017 | 2016 |
Net asset value, beginning of period
| $11.12 | $11.04 | $10.74 | $10.83 | $11.16 | $10.83 |
Net investment income
| 0.07 | 0.17 1 | 0.21 | 0.20 | 0.18 | 0.17 |
Net realized and unrealized gains (losses) on investments
| 0.15 | 0.08 | 0.30 | (0.09) | (0.32) | 0.33 |
Total from investment operations
| 0.22 | 0.25 | 0.51 | 0.11 | (0.14) | 0.50 |
| Distributions to shareholders from | | | | | | |
Net investment income
| (0.07) | (0.17) | (0.21) | (0.20) | (0.18) | (0.17) |
Net realized gains
| 0.00 | (0.00) 2 | 0.00 | 0.00 | (0.01) | (0.00) 2 |
Total distributions to shareholders
| (0.07) | (0.17) | (0.21) | (0.20) | (0.19) | (0.17) |
Net asset value, end of period
| $11.27 | $11.12 | $11.04 | $10.74 | $10.83 | $11.16 |
Total return3
| 1.96% | 2.27% | 4.78% | 1.01% | (1.22)% | 4.66% |
| Ratios to average net assets (annualized) | | | | | | |
Gross expenses
| 1.67% | 1.70% | 1.69% | 1.63% | 1.68% | 1.68% |
Net expenses
| 1.45% | 1.45% | 1.45% | 1.45% | 1.45% | 1.45% |
Net investment income
| 1.19% | 1.49% | 1.92% | 1.83% | 1.67% | 1.52% |
| Supplemental data | | | | | | |
Portfolio turnover rate
| 5% | 24% | 8% | 11% | 27% | 16% |
Net assets, end of period (000s omitted)
| $5,204 | $5,842 | $6,687 | $8,105 | $9,449 | $10,949 |
| 1 | Calculated based upon average shares outstanding |
| 2 | Amount is less than $0.005. |
| 3 | Total return calculations do not include any sales charges. Returns for periods of less than one year are not annualized. |
The accompanying notes are an integral part of these financial statements.
Wells Fargo Wisconsin Tax-Free Fund | 17
Financial highlights
(For a share outstanding throughout each period)
| | | Year ended June 30 |
| Institutional Class | Six months ended
December 31, 2020
(unaudited) | 2020 | 2019 | 2018 | 2017 1 |
Net asset value, beginning of period
| $11.12 | $11.04 | $10.74 | $10.83 | $10.99 |
Net investment income
| 0.12 | 0.27 | 0.31 | 0.30 | 0.20 |
Net realized and unrealized gains (losses) on investments
| 0.15 | 0.08 | 0.30 | (0.09) | (0.15) |
Total from investment operations
| 0.27 | 0.35 | 0.61 | 0.21 | 0.05 |
| Distributions to shareholders from | | | | | |
Net investment income
| (0.12) | (0.27) | (0.31) | (0.30) | (0.20) |
Net realized gains
| 0.00 | (0.00) 2 | 0.00 | 0.00 | (0.01) |
Total distributions to shareholders
| (0.12) | (0.27) | (0.31) | (0.30) | (0.21) |
Net asset value, end of period
| $11.27 | $11.12 | $11.04 | $10.74 | $10.83 |
Total return3
| 2.43% | 3.23% | 5.75% | 1.95% | 0.44% |
| Ratios to average net assets (annualized) | | | | | |
Gross expenses
| 0.59% | 0.62% | 0.61% | 0.55% | 0.54% |
Net expenses
| 0.52% | 0.52% | 0.52% | 0.52% | 0.52% |
Net investment income
| 2.12% | 2.40% | 2.85% | 2.79% | 2.74% |
| Supplemental data | | | | | |
Portfolio turnover rate
| 5% | 24% | 8% | 11% | 27% |
Net assets, end of period (000s omitted)
| $78,068 | $68,230 | $43,978 | $36,181 | $13,573 |
| 1 | For the period from October 31, 2016 (commencement of class operations) to June 30, 2017 |
| 2 | Amount is less than $0.005. |
| 3 | Returns for periods of less than one year are not annualized. |
The accompanying notes are an integral part of these financial statements.
18 | Wells Fargo Wisconsin Tax-Free Fund
Notes to financial statements (unaudited)
1. ORGANIZATION
Wells Fargo Funds Trust (the “Trust”), a Delaware statutory trust organized on March 10, 1999, is an open-end management investment company registered under the Investment Company Act of 1940, as amended (the “1940 Act”). As an investment company, the Trust follows the accounting and reporting guidance in Financial Accounting Standards Board (“FASB”) Accounting Standards Codification Topic 946, Financial Services – Investment Companies. These financial statements report on the Wells Fargo Wisconsin Tax-Free Fund (the “Fund”) which is a non-diversified series of the Trust.
2. SIGNIFICANT ACCOUNTING POLICIES
The following significant accounting policies, which are consistently followed in the preparation of the financial statements of the Fund, are in conformity with U.S. generally accepted accounting principles which require management to make estimates and assumptions that affect the reported amounts of assets and liabilities, disclosure of contingent assets and liabilities at the date of the financial statements, and the reported amounts of income and expenses during the reporting period. Actual results could differ from those estimates.
Securities valuation
All investments are valued each business day as of the close of regular trading on the New York Stock Exchange (generally 4 p.m. Eastern Time), although the Fund may deviate from this calculation time under unusual or unexpected circumstances.
Debt securities are valued at the evaluated bid price provided by an independent pricing service (e.g. taking into account various factors, including yields, maturities, or credit ratings) or, if a reliable price is not available, the quoted bid price from an independent broker-dealer.
Investments which are not valued using any of the methods discussed above are valued at their fair value, as determined in good faith by the Board of Trustees of the Fund. The Board of Trustees has established a Valuation Committee comprised of the Trustees and has delegated to it the authority to take any actions regarding the valuation of portfolio securities that the Valuation Committee deems necessary or appropriate, including determining the fair value of portfolio securities, unless the determination has been delegated to the Wells Fargo Asset Management Pricing Committee at Wells Fargo Funds Management, LLC ("Funds Management"). The Board of Trustees retains the authority to make or ratify any valuation decisions or approve any changes to the Valuation Procedures as it deems appropriate. On a quarterly basis, the Board of Trustees receives reports on any valuation actions taken by the Valuation Committee or the Wells Fargo Asset Management Pricing Committee which may include items for ratification.
Security transactions and income recognition
Securities transactions are recorded on a trade date basis. Realized gains or losses are recorded on the basis of identified cost.
Interest income is accrued daily and bond discounts are accreted and premiums are amortized daily. To the extent debt obligations are placed on non-accrual status, any related interest income may be reduced by writing off interest receivables when the collection of all or a portion of interest has been determined to be doubtful based on consistently applied procedures and the fair value has decreased. If the issuer subsequently resumes interest payments or when the collectability of interest is reasonably assured, the debt obligation is removed from non-accrual status.
Distributions to shareholders
Distributions to shareholders from net investment income are declared daily and paid monthly. Distributions from net realized gains, if any, are recorded on the ex-dividend date and paid at least annually. Such distributions are determined in accordance with income tax regulations and may differ from U.S. generally accepted accounting principles. Dividend sources are estimated at the time of declaration. The tax character of distributions is determined as of the Fund’s fiscal year end. Therefore, a portion of the Fund’s distributions made prior to the Fund’s fiscal year end may be categorized as a tax return of capital at year end.
Federal and other taxes
The Fund intends to continue to qualify as a regulated investment company by distributing substantially all of its investment company taxable and tax-exempt income and any net realized capital gains (after reduction for capital loss carryforwards) sufficient to relieve it from all, or substantially all, federal income taxes. Accordingly, no provision for federal income taxes was required.
The Fund’s income and federal excise tax returns and all financial records supporting those returns for the prior three fiscal years are subject to examination by the federal and Delaware revenue authorities. Management has analyzed the Fund’s tax positions taken on federal, state, and foreign tax returns for all open tax years and does not believe that there are any uncertain tax positions that require recognition of a tax liability.
Wells Fargo Wisconsin Tax-Free Fund | 19
Notes to financial statements (unaudited)
As of December 31, 2020, the aggregate cost of all investments for federal income tax purposes was $148,644,088 and the unrealized gains (losses) consisted of:
| Gross unrealized gains | $8,212,957 |
| Gross unrealized losses | (63,001) |
| Net unrealized gains | $8,149,956 |
As of June 30, 2020, the Fund had current year net deferred post-October capital losses consisting of $11,591 in short-term losses which was recognized on the first day of the current fiscal year.
Class allocations
The separate classes of shares offered by the Fund differ principally in applicable sales charges, distribution, shareholder servicing, and administration fees. Class specific expenses are charged directly to that share class. Investment income, common fund-level expenses, and realized and unrealized gains (losses) on investments are allocated daily to each class of shares based on the relative proportion of net assets of each class.
3. FAIR VALUATION MEASUREMENTS
Fair value measurements of investments are determined within a framework that has established a fair value hierarchy based upon the various data inputs utilized in determining the value of the Fund’s investments. The three-level hierarchy gives the highest priority to unadjusted quoted prices in active markets for identical assets or liabilities (Level 1) and the lowest priority to unobservable inputs (Level 3). The Fund’s investments are classified within the fair value hierarchy based on the lowest level of input that is significant to the fair value measurement. The inputs are summarized into three broad levels as follows:
| ■ | Level 1 – quoted prices in active markets for identical securities |
| ■ | Level 2 – other significant observable inputs (including quoted prices for similar securities, interest rates, prepayment speeds, credit risk, etc.) |
| ■ | Level 3 – significant unobservable inputs (including the Fund’s own assumptions in determining the fair value of investments) |
The inputs or methodologies used for valuing investments in securities are not necessarily an indication of the risk associated with investing in those securities.
The following is a summary of the inputs used in valuing the Fund’s assets and liabilities as of December 31, 2020:
| | Quoted prices
(Level 1) | Other significant
observable inputs
(Level 2) | Significant
unobservable inputs
(Level 3) | Total |
| Assets | | | | |
| Investments in: | | | | |
| Municipal obligations | $0 | $156,794,044 | $0 | $156,794,044 |
Additional sector, industry or geographic detail is included in the Portfolio of Investments.
For the six months ended December 31, 2020, the Fund did not have any transfers into/out of Level 3.
4. TRANSACTIONS WITH AFFILIATES
Management fee
Funds Management, an indirect wholly owned subsidiary of Wells Fargo & Company (“Wells Fargo”), is the manager of the Fund and provides advisory and fund-level administrative services under an investment management agreement. Under the investment management agreement, Funds Management is responsible for, among other services, implementing the investment objectives and strategies of the Fund, supervising the subadviser and providing fund-level administrative services in connection with the Fund’s operations. As compensation for its services under the investment management agreement, Funds Management is entitled to receive a management fee at the following annual rate based on the Fund’s average daily net assets:
20 | Wells Fargo Wisconsin Tax-Free Fund
Notes to financial statements (unaudited)
| Average daily net assets | Management fee |
| First $500 million | 0.400% |
| Next $500 million | 0.375 |
| Next $2 billion | 0.350 |
| Next $2 billion | 0.325 |
| Next $5 billion | 0.290 |
| Over $10 billion | 0.280 |
For the six months ended December 31, 2020, the management fee was equivalent to an annual rate of 0.40% of the Fund’s average daily net assets.
Funds Management has retained the services of a subadviser to provide daily portfolio management to the Fund. The fee for subadvisory services is borne by Funds Management. Wells Capital Management, Incorporated, an affiliate of Funds Management and an indirect wholly owned subsidiary of Wells Fargo, is the subadviser to the Fund and is entitled to receive a fee from Funds Management at an annual rate starting at 0.20% and declining to 0.10% as the average daily net assets of the Fund increase.
Administration fees
Under a class-level administration agreement, Funds Management provides class-level administrative services to the Fund, which includes paying fees and expenses for services provided by the transfer agent, sub-transfer agents, omnibus account servicers and record-keepers. As compensation for its services under the class-level administration agreement, Funds Management receives an annual fee which is calculated based on the average daily net assets of each class as follows:
| | Class-level
administration fee |
| Class A | 0.16% |
| Class C | 0.16 |
| Institutional Class | 0.08 |
Waivers and/or expense reimbursements
Funds Management has contractually waived and/or reimbursed management and administration fees to the extent necessary to maintain certain net operating expense ratios for the Fund. When each class of the Fund has exceeded its expense cap, Funds Management has waived fees and/or reimbursed expenses from fund-level expenses on a proportionate basis and then from class specific expenses. When only certain classes exceed their expense caps, waivers and/or reimbursements are applied against class specific expenses before fund-level expenses. Funds Management has committed through October 31, 2021 to waive fees and/ or reimburse expenses to the extent necessary to cap the Fund’s expenses at 0.70% for Class A shares, 1.45% for Class C shares and 0.52% for Institutional Class shares. Prior to or after the commitment expiration date, the cap may be increased or the commitment to maintain the cap may be terminated only with the approval of the Board of Trustees.
Distribution fee
The Trust has adopted a distribution plan for Class C shares of the Fund pursuant to Rule 12b-1 under the 1940 Act. A distribution fee is charged charged to Class C shares and paid to Wells Fargo Funds Distributor, LLC (“Funds Distributor”), the principal underwriter, at an annual rate of 0.75% of the average daily net assets of Class C shares.
In addition, Funds Distributor is entitled to receive the front-end sales charge from the purchase of Class A shares and a contingent deferred sales charge on the redemption of certain Class A shares. Funds Distributor is also entitled to receive the contingent deferred sales charges from redemptions of Class C shares. For the six months ended December 31, 2020, Funds Distributor received $3,860 from the sale of Class A shares. No contingent deferred sales charges were incurred by Class A and Class C shares for the six months ended December 31, 2020.
Shareholder servicing fees
The Trust has entered into contracts with one or more shareholder servicing agents, whereby Class A and Class C shares of the Fund are charged a fee at an annual rate of 0.25% of the average daily net assets of each respective class. A portion of these total shareholder servicing fees were paid to affiliates of Wells Fargo.
Wells Fargo Wisconsin Tax-Free Fund | 21
Notes to financial statements (unaudited)
Interfund transactions
The Fund may purchase or sell portfolio investment securities to certain other Wells Fargo affiliates pursuant to Rule 17a-7 under the 1940 Act and under procedures adopted by the Board of Trustees. The procedures have been designed to ensure that these interfund transactions, which do not incur broker commissions, are effected at current market prices.
5. INVESTMENT PORTFOLIO TRANSACTIONS
Purchases and sales of investments, excluding U.S. government obligations (if any) and short-term securities, for the six months ended December 31, 2020 were $6,371,672 and $7,123,384, respectively.
6. BANK BORROWINGS
The Trust (excluding the money market funds), Wells Fargo Master Trust and Wells Fargo Variable Trust are parties to a $350,000,000 revolving credit agreement whereby the Fund is permitted to use bank borrowings for temporary or emergency purposes, such as to fund shareholder redemption requests. Interest under the credit agreement is charged to the Fund based on a borrowing rate equal to the higher of the Federal Funds rate in effect on that day plus 1.25% or the overnight LIBOR rate in effect on that day plus 1.25%. In addition, an annual commitment fee equal to 0.25% of the unused balance is allocated to each participating fund.
For the six months ended December 31, 2020, there were no borrowings by the Fund under the agreement.
7. CONCENTRATION RISK
The Fund invests a substantial portion of its assets in issuers of municipal debt securities located in a single state or territory of the U.S. Therefore, it may be more affected by economic and political developments in that state or region than would be a comparable general tax-exempt fund. As of the end of the period, the Fund invested a concentration of its portfolio in the state of Wisconsin.
8. INDEMNIFICATION
Under the Fund's organizational documents, the officers and Trustees have been granted certain indemnification rights against certain liabilities that may arise out of performance of their duties to the Fund. The Fund has entered into a separate agreement with each Trustee that converts indemnification rights currently existing under the Fund’s organizational documents into contractual rights that cannot be changed in the future without the consent of the Trustee. Additionally, in the normal course of business, the Fund may enter into contracts with service providers that contain a variety of indemnification clauses. The Fund’s maximum exposure under these arrangements is dependent on future claims that may be made against the Fund and, therefore, cannot be estimated.
9. NEW ACCOUNTING PRONOUNCEMENT
In August 2018, FASB issued Accounting Standards Update (“ASU”) No. 2018-13, Fair Value Measurement (Topic 820) Disclosure Framework - Changes to the Disclosure Requirements for Fair Value Measurement. ASU 2018-13 updates the disclosure requirements on fair value measurements in Topic 820, Fair Value Measurements. The amendments are effective for fiscal years, and interim periods within those fiscal years, beginning after December 15, 2019. Management has adopted this guidance which did not have a material impact on the financial statements.
10. SUBSEQUENT EVENT
On February 23, 2021, Wells Fargo announced that it has entered into a definitive agreement to sell Wells Fargo Asset Management (“WFAM”) to GTCR LLC and Reverence Capital Partners, L.P. WFAM is the trade name used by the asset management businesses of Wells Fargo and includes Wells Fargo Funds Management, LLC, the investment manager to the Fund, Wells Capital Management Incorporated and Wells Fargo Asset Management (International) Limited, both registered investment advisers providing sub-advisory services to certain funds, and Wells Fargo Funds Distributor, LLC, the Fund’s principal underwriter. As part of the transaction, Wells Fargo will own a 9.9% equity interest and will continue to serve as an important client and distribution partner.
Consummation of the transaction will result in the automatic termination of the Fund’s investment management agreement and sub-advisory agreement(s). The Fund’s Board of Trustees will be asked to approve new investment management arrangements with the new company. If approved by the Board, the new investment management arrangements with the new company will be presented to the shareholders of the Fund for approval, and, if approved by shareholders, would take effect upon the closing of the transaction. The transaction is expected to close in the second half of 2021, subject to customary closing conditions.
22 | Wells Fargo Wisconsin Tax-Free Fund
Notes to financial statements (unaudited)
11. CORONAVIRUS (COVID-19) PANDEMIC
On March 11, 2020, the World Health Organization announced that it had made the assessment that coronavirus disease 2019 (“COVID-19”) is a pandemic. The impacts of COVID-19 are affecting the entire global economy, individual companies and investment products, and the market in general. There is significant uncertainty around the extent and duration of business disruptions related to COVID-19 and the impacts may be short term or may last for an extended period of time. The risk of further spreading of COVID-19 has led to significant uncertainty and volatility in the financial markets.
Wells Fargo Wisconsin Tax-Free Fund | 23
Other information (unaudited)
PROXY VOTING INFORMATION
A description of the policies and procedures used to determine how to vote proxies relating to portfolio securities is available without charge, upon request, by calling 1-800-222-8222, visiting our website at wfam.com, or visiting the SEC website at sec.gov. Information regarding how the proxies related to portfolio securities were voted during the most recent 12-month period ended June 30 is available on the website at wfam.com or by visiting the SEC website at sec.gov.
QUARTERLY PORTFOLIO HOLDINGS INFORMATION
The Fund files its complete schedule of portfolio holdings with the SEC for the first and third quarters of each fiscal year as an exhibit to its reports on Form N-PORT. Shareholders may view the filed Form N-PORT by visiting the SEC website at sec.gov.
24 | Wells Fargo Wisconsin Tax-Free Fund
Other information (unaudited)
BOARD OF TRUSTEES AND OFFICERS
Each of the Trustees and Officers1 listed in the table below acts in identical capacities for each fund in the Wells Fargo family of funds, which consists of 144 mutual funds comprising the Wells Fargo Funds Trust, Wells Fargo Variable Trust, Wells Fargo Master Trust and four closed-end funds (collectively the “Fund Complex”). This table should be read in conjunction with the Prospectus and the Statement of Additional Information2. The mailing address of each Trustee and Officer is 525 Market Street, 12th Floor, San Francisco, CA 94105. Each Trustee and Officer serves an indefinite term, however, each Trustee serves such term until reaching the mandatory retirement age established by the Trustees.
Independent Trustees
Name and
year of birth | Position held and
length of service* | Principal occupations during past five years or longer | Current other
public company or
investment
company
directorships |
William R. Ebsworth
(Born 1957) | Trustee,
since 2015 | Retired. From 1984 to 2013, equities analyst, portfolio manager, research director and chief investment officer at Fidelity Management and Research Company in Boston, Tokyo, and Hong Kong, and retired in 2013 as Chief Investment Officer of Fidelity Strategic Advisers, Inc. where he led a team of investment professionals managing client assets. Prior thereto, Board member of Hong Kong Securities Clearing Co., Hong Kong Options Clearing Corp., the Thailand International Fund, Ltd., Fidelity Investments Life Insurance Company, and Empire Fidelity Investments Life Insurance Company. Audit Committee Chair and Investment Committee Chair of the Vincent Memorial Hospital Endowment (non-profit organization). Mr. Ebsworth is a CFA® charterholder. | N/A |
Jane A. Freeman
(Born 1953) | Trustee,
since 2015;
Chair Liaison,
since 2018 | Retired. From 2012 to 2014 and 1999 to 2008, Chief Financial Officer of Scientific Learning Corporation. From 2008 to 2012, Ms. Freeman provided consulting services related to strategic business projects. Prior to 1999, Portfolio Manager at Rockefeller & Co. and Scudder, Stevens & Clark. Board member of the Harding Loevner Funds from 1996 to 2014, serving as both Lead Independent Director and chair of the Audit Committee. Board member of the Russell Exchange Traded Funds Trust from 2011 to 2012 and the chair of the Audit Committee. Ms. Freeman is also an inactive Chartered Financial Analyst. | N/A |
Isaiah Harris, Jr.
(Born 1952) | Trustee,
since 2009; Audit
Committee
Chair,
since 2019 | Retired. Chairman of the Board of CIGNA Corporation since 2009, and Director since 2005. From 2003 to 2011, Director of Deluxe Corporation. Prior thereto, President and CEO of BellSouth Advertising and Publishing Corp. from 2005 to 2007, President and CEO of BellSouth Enterprises from 2004 to 2005 and President of BellSouth Consumer Services from 2000 to 2003. Emeritus member of the Iowa State University Foundation Board of Governors. Emeritus Member of the Advisory Board of Iowa State University School of Business. Advisory Board Member, Palm Harbor Academy (private school). Mr. Harris is a certified public accountant (inactive status). | CIGNA Corporation |
Judith M. Johnson
(Born 1949) | Trustee,
since 2008 | Retired. Prior thereto, Chief Executive Officer and Chief Investment Officer of Minneapolis Employees Retirement Fund from 1996 to 2008. Ms. Johnson is an attorney, certified public accountant and a certified managerial accountant. | N/A |
David F. Larcker
(Born 1950) | Trustee,
since 2009 | James Irvin Miller Professor of Accounting at the Graduate School of Business (Emeritus), Stanford University, Director of the Corporate Governance Research Initiative and Senior Faculty of The Rock Center for Corporate Governance since 2006. From 2005 to 2008, Professor of Accounting at the Graduate School of Business, Stanford University. Prior thereto, Ernst & Young Professor of Accounting at The Wharton School, University of Pennsylvania from 1985 to 2005. | N/A |
Wells Fargo Wisconsin Tax-Free Fund | 25
Other information (unaudited)
Name and
year of birth | Position held and
length of service* | Principal occupations during past five years or longer | Current other
public company or
investment
company
directorships |
Olivia S. Mitchell
(Born 1953) | Trustee,
since 2006;
Nominating and
Governance
Committee Chair,
since 2018 | International Foundation of Employee Benefit Plans Professor, Wharton School of the University of Pennsylvania since 1993. Director of Wharton’s Pension Research Council and Boettner Center on Pensions & Retirement Research, and Research Associate at the National Bureau of Economic Research. Previously, Cornell University Professor from 1978 to 1993. | N/A |
Timothy J. Penny
(Born 1951) | Trustee,
since 1996;
Chair,
since 2018 | President and Chief Executive Officer of Southern Minnesota Initiative Foundation, a non-profit organization, since 2007. Member of the Board of Trustees of NorthStar Education Finance, Inc., a non-profit organization, since 2007. | N/A |
James G. Polisson
(Born 1959) | Trustee,
since 2018 | Retired. Chief Marketing Officer, Source (ETF) UK Services, Ltd, from 2015 to 2017. From 2012 to 2015, Principal of The Polisson Group, LLC, a management consulting, corporate advisory and principal investing company. Chief Executive Officer and Managing Director at Russell Investments, Global Exchange Traded Funds from 2010 to 2012. Managing Director of Barclays Global Investors from 1998 to 2010 and Global Chief Marketing Officer for iShares and Barclays Global Investors from 2000 to 2010. Trustee of the San Francisco Mechanics’ Institute, a non-profit organization, from 2013 to 2015. Board member of the Russell Exchange Traded Fund Trust from 2011 to 2012. Director of Barclays Global Investors Holdings Deutschland GmbH from 2006 to 2009. Mr. Polisson is an attorney and has a retired status with the Massachusetts and District of Columbia Bar Associations. | N/A |
Pamela Wheelock
(Born 1959) | Trustee,
since January
2020; previously
Trustee from
January 2018 to
July 2019 | Board member of the Destination Medical Center Economic Development Agency, Rochester, Minnesota since 2019. Interim President of the McKnight Foundation from January to September 2020. Acting Commissioner, Minnesota Department of Human Services, July 2019 through September 2019. Human Services Manager (part-time), Minnesota Department of Human Services, October 2019 through December 2019. Chief Operating Officer, Twin Cities Habitat for Humanity from 2017 to 2019. Vice President of University Services, University of Minnesota from 2012 to 2016. Prior thereto, on the Board of Directors, Governance Committee and Finance Committee for the Minnesota Philanthropy Partners (Saint Paul Foundation) from 2012 to 2018, Interim Chief Executive Officer of Blue Cross Blue Shield of Minnesota from 2011 to 2012, Chairman of the Board from 2009 to 2012 and Board Director from 2003 to 2015. Vice President, Leadership and Community Engagement, Bush Foundation, Saint Paul, Minnesota (a private foundation) from 2009 to 2011. Executive Vice President and Chief Financial Officer, Minnesota Sports and Entertainment from 2004 to 2009 and Senior Vice President from 2002 to 2004. Executive Vice President of the Minnesota Wild Foundation from 2004 to 2008. Commissioner of Finance, State of Minnesota, from 1999 to 2002. Currently Board Chair of the Minnesota Wild Foundation since 2010. | N/A |
* Length of service dates reflect the Trustee’s commencement of service with the Trust’s predecessor entities, where applicable.
26 | Wells Fargo Wisconsin Tax-Free Fund
Other information (unaudited)
Officers
Name and
year of birth | Position held and
length of service | Principal occupations during past five years or longer |
Andrew Owen
(Born 1960) | President,
since 2017 | Executive Vice President of Wells Fargo & Company and Head of Affiliated Managers, Wells Fargo Asset Management, since 2014. In addition, Mr. Owen is currently President, Chief Executive Officer and Director of Wells Fargo Funds Management, LLC since 2017. Prior thereto, Executive Vice President responsible for marketing, investments and product development for Wells Fargo Funds Management, LLC, from 2009 to 2014. |
Nancy Wiser1
(Born 1967) | Treasurer,
since 2012 | Executive Vice President of Wells Fargo Funds Management, LLC since 2011. Chief Operating Officer and Chief Compliance Officer at LightBox Capital Management LLC, from 2008 to 2011. |
Michelle Rhee
(Born 1966) | Chief Legal Officer,
since 2019 | Secretary of Wells Fargo Funds Management, LLC and Chief Legal Counsel of Wells Fargo Asset Management since 2018. Deputy General Counsel of Wells Fargo Bank N.A. since 2020 and Assistant General Counsel of Wells Fargo Bank, N.A. from 2018 to 2020. Associate General Counsel and Managing Director of Bank of America Corporation from 2004 to 2018. |
Catherine Kennedy
(Born 1969) | Secretary,
since 2019 | Vice President of Wells Fargo Funds Management, LLC and Senior Counsel of the Wells Fargo Legal Department since 2010. Vice President and Senior Counsel of Evergreen Investment Management Company, LLC from 1998 to 2010. |
Michael H. Whitaker
(Born 1967) | Chief Compliance Officer,
since 2016 | Chief Compliance Officer of Wells Fargo Asset Management since 2016. Senior Vice President and Chief Compliance Officer for Fidelity Investments from 2007 to 2016. |
Jeremy DePalma1
(Born 1974) | Assistant Treasurer,
since 2009 | Senior Vice President of Wells Fargo Funds Management, LLC since 2009. Senior Vice President of Evergreen Investment Management Company, LLC from 2008 to 2010 and head of the Fund Reporting and Control Team within Fund Administration from 2005 to 2010. |
1 Nancy Wiser acts as Treasurer of 67 funds in the Fund Complex. Jeremy DePalma acts as the Treasurer of 77 funds and Assistant Treasurer of 67 funds in the Fund Complex.
2 The Statement of Additional Information includes additional information about the Trustees and is available, without charge, upon request, by calling 1-800-222-8222 or by visiting the website at wfam.com.
Wells Fargo Wisconsin Tax-Free Fund | 27
For more information
More information about Wells Fargo Funds is available free upon request. To obtain literature, please write, visit the Fund's website, or call:
Wells Fargo Funds
P.O. Box 219967
Kansas City, MO 64121-9967
Website: wfam.com
Individual investors: 1-800-222-8222
Retail investment professionals: 1-888-877-9275
Institutional investment professionals: 1-866-765-0778
This report and the financial statements contained herein are submitted for the general information of the shareholders of the Fund. If this report is used for promotional purposes, distribution of the report must be accompanied or preceded by a current prospectus. Before investing, please consider the investment objectives, risks, charges, and expenses of the investment. For a current prospectus and, if available, a summary prospectus, containing this information, call 1-800-222-8222 or visit the Fund’s website at wfam.com. Read the prospectus carefully before you invest or send money.
Wells Fargo Asset Management (WFAM) is the trade name for certain investment advisory/management firms owned by Wells Fargo & Company. These firms include but are not limited to Wells Capital Management Incorporated and Wells Fargo Funds Management, LLC. Certain products managed by WFAM entities are distributed by Wells Fargo Funds Distributor, LLC (a broker-dealer and Member FINRA).
This material is for general informational and educational purposes only and is NOT intended to provide investment advice or a recommendation of any kind— including a recommendation for any specific investment, strategy, or plan.
INVESTMENT PRODUCTS: NOT FDIC INSURED ■ NO BANK GUARANTEE ■ MAY LOSE VALUE
© 2021 Wells Fargo & Company. All rights reserved.
PAR-0121-00287 02-21
SA259/SAR259 12-20
Semi-Annual Report
December 31, 2020
Wells Fargo
Alternative Risk Premia Fund
Reduce clutter.
Save trees.
Sign up for electronic delivery of prospectuses and shareholder reports at wellsfargo.com/ advantagedelivery
The views expressed and any forward-looking statements are as of December 31, 2020, unless otherwise noted, and are those of the Fund's portfolio managers and/or Wells Fargo Asset Management. Discussions of individual securities or the markets generally are not intended as individual recommendations. Future events or results may vary significantly from those expressed in any forward-looking statements. The views expressed are subject to change at any time in response to changing circumstances in the market. Wells Fargo Asset Management and the Fund disclaim any obligation to publicly update or revise any views expressed or forward-looking statements.
INVESTMENT PRODUCTS: NOT FDIC INSURED ■ NO BANK GUARANTEE ■ MAY LOSE VALUE
Wells Fargo Alternative Risk Premia Fund | 1
Letter to shareholders (unaudited)
Dear Shareholder:
We are pleased to offer you this semi-annual report for the Wells Fargo Alternative Risk Premia Fund for the six-month period that ended December 31, 2020. Despite a deeply challenging year, dominated by the spread of COVID-19 cases and a sharp drop in economic output throughout much of the world, global stocks performed extremely well, benefiting from ongoing central bank support and rising optimism over the development and distribution of effective COVID-19 vaccines. Bonds also had positive returns, led by global bonds and high-yield bonds.
For the six-month period, U.S. stocks, based on the S&P 500 Index,1 gained 22.16%. International stocks, as measured by the MSCI ACWI ex USA Index (Net),2 returned 24.33%, while the MSCI EM Index (Net),3 had even stronger performance, with a 31.14% gain. Among bond indexes, the Bloomberg Barclays U.S. Aggregate Bond Index,4 returned 1.29%, the Bloomberg Barclays Global Aggregate ex-USD Index (unhedged),5 gained 9.44%, and the Bloomberg Barclays Municipal Bond Index,6 returned 3.07% while the ICE BofA U.S. High Yield Index,7 gained a hefty 11.49%.
The stock market rally continued in July.
After a volatile first half of the year, an existing stock market rally continued in July with strong results for equities and fixed income. However, economic data and a resurgence of COVID-19 cases underscored the urgent need to regain control of the pandemic. Second-quarter gross domestic product (GDP) shrank from the previous quarter by 9.5% and 12.1% in the U.S. and the eurozone, respectively. In contrast, China’s second-quarter GDP grew 3.2% year over year. The U.S. economy added 1.8 million jobs in July, but a double-digit jobless rate persisted.
The stock market continued to rally in August despite concerns over rising numbers of U.S. and European COVID-19 cases as well as the expiration of the $600 weekly bonus unemployment benefit in July. Relatively strong second-quarter earnings boosted investor sentiment along with the U.S. Federal Reserve’s announcement of a monetary policy shift expected to support longer-term low interest rates. U.S. manufacturing and services activity indexes beat expectations, while the U.S. housing market maintained strength. In Europe, retail sales expanded and consumer confidence was steady. China’s economy continued to expand.
Andrew Owen
President
Wells Fargo Funds
“After a volatile first half of the year, an existing stock market rally continued in July with strong results for equities and fixed income.”
| 1 | The S&P 500 Index consists of 500 stocks chosen for market size, liquidity, and industry group representation. It is a market-value-weighted index with each stock's weight in the index proportionate to its market value. You cannot invest directly in an index. |
| 2 | The Morgan Stanley Capital International (MSCI) All Country World Index (ACWI) ex USA Index (Net) is a free-float-adjusted market-capitalization-weighted index that is designed to measure the equity market performance of developed and emerging markets, excluding the United States. Source: MSCI. MSCI makes no express or implied warranties or representations and shall have no liability whatsoever with respect to any MSCI data contained herein. The MSCI data may not be further redistributed or used as a basis for other indices or any securities or financial products. This report is not approved, reviewed, or produced by MSCI. You cannot invest directly in an index. |
| 3 | The MSCI Emerging Markets (EM) Index (Net) is a free-float-adjusted market-capitalization-weighted index that is designed to measure equity market performance of emerging markets. You cannot invest directly in an index. |
| 4 | The Bloomberg Barclays U.S. Aggregate Bond Index is a broad-based benchmark that measures the investment-grade, U.S. dollar-denominated, fixed-rate taxable bond market, including Treasuries, government-related and corporate securities, mortgage-backed securities (agency fixed-rate and hybrid adjustable-rate mortgage pass-throughs), asset-backed securities, and commercial mortgage-backed securities. You cannot invest directly in an index. |
| 5 | The Bloomberg Barclays Global Aggregate ex-USD Index (unhedged) is an unmanaged index that provides a broad-based measure of the global investment-grade fixed-income markets excluding the U.S. dollar-denominated debt market. You cannot invest directly in an index. |
| 6 | The Bloomberg Barclays Municipal Bond Index is an unmanaged index composed of long-term tax-exempt bonds with a minimum credit rating of Baa. You cannot invest directly in an index. |
| 7 | The ICE BofA U.S. High Yield Index is a market-capitalization-weighted index of domestic and Yankee high-yield bonds. The index tracks the performance of high-yield securities traded in the U.S. bond market. You cannot invest directly in an index. Copyright 2021. ICE Data Indices, LLC. All rights reserved. |
2 | Wells Fargo Alternative Risk Premia Fund
Letter to shareholders (unaudited)
Stocks grew more volatile in September on mixed economic data. U.S. economic activity continued to grow. However, U.S. unemployment remained elevated at 7.9% in September. With U.S. Congress delaying further fiscal relief and uncertainties surrounding a possible vaccine, doubts crept back into the financial markets. In the U.K., a lack of progress in Brexit talks weighed on markets. China’s economy picked up steam, fueled by increased global demand.
In October, capital markets stepped back from their six-month rally. Market volatility rose in advance of the U.S. election and amid a global increase in COVID-19 infections. Europe introduced tighter restrictions affecting economic activity. U.S. markets looked favorably at the prospect of Democratic control of the federal purse strings, which could lead to additional fiscal stimulus and a boost to economic activity. Meanwhile, China reported 4.9% third-quarter GDP growth.
Global stocks rallied in November, propelled by optimism over three promising COVID-19 vaccines. Reversing recent trends, value stocks outperformed growth stocks and cyclical stocks outpaced technology stocks. However, U.S. unemployment remained elevated, with a net job loss of 10 million since February. The eurozone services Purchasing Managers’ Index, a monthly survey of purchasing managers, contracted sharply while the region’s manufacturing activity grew. The U.S. election results added to the upbeat mood as investors anticipated more consistent policies in the new administration.
Financial markets ended the year with strength on high expectations for a rapid rollout of the COVID-19 vaccines, the successful passage of a $900 billion stimulus package, and rising expectations of additional economic support from a Democratic-led Congress. U.S. economic data were mixed with still-elevated unemployment and weak retail sales but growth in manufacturing output. In contrast, China’s economic expansion continued in both manufacturing and nonmanufacturing. U.S. COVID-19 infection rates continued to rise even as new state and local lockdown measures were implemented.
Don’t let short-term uncertainty derail long-term investment goals.
Periods of investment uncertainty can present challenges, but experience has taught us that maintaining long-term investment goals can be an effective way to plan for the future. To help you create a sound strategy based on your personal goals and risk tolerance, Wells Fargo Funds offers more than 100 mutual funds spanning a wide range of asset classes and investment styles. Although diversification cannot guarantee an investment profit or prevent losses, we believe it can be an effective way to manage investment risk and potentially smooth out overall portfolio performance. We encourage investors to know their investments and to understand that appropriate levels of risk-taking may unlock opportunities.
Thank you for choosing to invest with Wells Fargo Funds. We appreciate your confidence in us and remain committed to helping you meet your financial needs.
Sincerely,
Andrew Owen
President
Wells Fargo Funds
“Global stocks rallied in November, propelled by optimism over three promising COVID-19 vaccines.”
For further information about your Fund, contact your investment professional, visit our website at wfam.com, or call us directly at 1-800-222-8222.
Wells Fargo Alternative Risk Premia Fund | 3
Performance highlights (unaudited)
Investment objective
The Fund seeks long-term capital appreciation.
Manager
Wells Fargo Funds Management, LLC
Subadvisers
Wells Capital Management Incorporated
Wells Fargo Asset Management (International) Limited
Portfolio managers
Petros N. Bocray, CFA®‡ , FRM
Eddie Cheng, CFA®‡
Monisha Jayakumar
Average annual total returns (%) as of December 31, 2020
| | | | | Expense ratios1 (%) |
| | Inception date | 1 year | Since inception | Gross | Net 2 |
| Class R6 (WRPRX) | 1-29-2019 | -16.67 | -11.06 | 1.04 | 0.62 |
| Institutional Class (WRPIX) | 1-29-2019 | -16.77 | -11.17 | 1.14 | 0.72 |
| ICE BofA U.S. 3-Month Treasury Bill Index3 | – | 0.67 | 1.43 * | – | – |
* Based on inception date of the oldest Fund class.
Figures quoted represent past performance, which is no guarantee of future results, and do not reflect taxes that a shareholder may pay on an investment in a fund. Investment return and principal value of an investment will fluctuate so that an investor’s shares, when redeemed, may be worth more or less than their original cost. Current performance may be lower or higher than the performance data quoted, which assumes the reinvestment of dividends and capital gains. Current month-end performance is available on the Fund’s website, wfam.com.
Index returns do not include transaction costs associated with buying and selling securities, any mutual fund fees or expenses, or any taxes. It is not possible to invest directly in an index.
Class R6 and Institutional Class shares are sold without a front-end sales charge or contingent deferred sales charge.
The investment techniques employed by the Fund create leverage. As a result, the sum of the Fund’s investment exposures will typically exceed the amount of the Fund’s net assets. These exposures may vary over time. We expect gross notional exposure of the Fund to be in a range of 400% to 1200% of the net asset value of the Fund under normal market conditions. Leverage may be significantly different (higher or lower) as deemed necessary by the investment manager. We expect net notional exposure of the Fund to be in a range of -200% to 200% of the net asset value of the Fund under normal market conditions.
Alternative risk premia investment risk is the Fund’s ability to achieve its investment objective depending largely upon the portfolio managers’ successful evaluation of the risks, potential returns, and correlation properties with respect to the various risk premia in which the Fund invests. Stock values fluctuate in response to the activities of individual companies and general market and economic conditions. Bond values fluctuate in response to the financial condition of individual issuers, general market and economic conditions, and changes in interest rates. Changes in market conditions and government policies may lead to periods of heightened volatility in the bond market and reduced liquidity for certain bonds held by the Fund. In general, when interest rates rise, bond values fall and investors may lose principal value. Interest rate changes and their impact on the Fund and its share price can be sudden and unpredictable. The use of leverage results in certain risks, including, among others, the likelihood of greater volatility of net asset value. Short selling is generally considered speculative, has the potential for unlimited loss, and may involve leverage. Foreign investments are especially volatile and can rise or fall dramatically due to differences in the political and economic conditions of the host country. The use of derivatives may reduce returns and/or increase volatility. Certain investment strategies tend to increase the total risk of an investment (relative to the broader market). The Fund is exposed to subsidiary risk and smaller-company securities risk. Consult the Fund’s prospectus for additional information on these and other risks.
Please see footnotes on page 5.
4 | Wells Fargo Alternative Risk Premia Fund
Performance highlights (unaudited)
| Net asset exposure as of December 31, 20204 |
| | % of net assets |
| | Long
positions | Short
positions |
| Stocks | 23 | 17 |
| Bond futures | 99 | 82 |
| Currency forwards | 81 | 51 |
| Equity index futures | 8 | 0 |
| Commodity futures | 27 | 12 |
| ‡ | CFA® and Chartered Financial Analyst® are trademarks owned by CFA Institute. |
| 1 | Reflects the expense ratios as stated in the most recent prospectuses. The expense ratios shown are subject to change and may differ from the annualized expense ratios shown in the financial highlights of this report. |
| 2 | The manager has contractually committed through October 31, 2021, to waive fees and/or reimburse expenses to the extent necessary to cap total annual fund operating expenses after fee waivers at 0.62% for Class R6 and 0.72% for Institutional Class. Brokerage commissions, stamp duty fees, interest, taxes, acquired fund fees and expenses (if any), and extraordinary expenses are excluded from the expense caps. Prior to or after the commitment expiration date, the caps may be increased or the commitment to maintain the caps may be terminated only with the approval of the Board of Trustees. Without these caps, the Fund’s returns would have been lower. The expense ratio paid by an investor is the net expense ratio (the total annual fund operating expenses after fee waivers) as stated in the prospectuses. |
| 3 | The ICE BofA 3-Month U.S. Treasury Bill Index is an unmanaged index that is comprised of a single U.S. Treasury issue with approximately three months to final maturity, purchased at the beginning of each month and held for one full month. Copyright 2021. ICE Data Indices, LLC. All rights reserved. You cannot invest directly in an index. |
| 4 | Figures are subject to change and may have changed since the date specified. |
Wells Fargo Alternative Risk Premia Fund | 5
Fund expenses (unaudited)
As a shareholder of the Fund, you incur ongoing costs, including management fees, and other Fund expenses. This example is intended to help you understand your ongoing costs (in dollars) of investing in the Fund and to compare these costs with the ongoing costs of investing in other mutual funds.
The example is based on an investment of $1,000 invested at the beginning of the six-month period and held for the entire period from July 1, 2020 to December 31, 2020.
Actual expenses
The “Actual” line of the table below provides information about actual account values and actual expenses. You may use the information in this line, together with the amount you invested, to estimate the expenses that you paid over the period. Simply divide your account value by $1,000 (for example, an $8,600 account value divided by $1,000 = 8.6), then multiply the result by the number in the “Actual” line under the heading entitled “Expenses paid during period” for your applicable class of shares to estimate the expenses you paid on your account during this period.
Hypothetical example for comparison purposes
The “Hypothetical” line of the table below provides information about hypothetical account values and hypothetical expenses based on the Fund’s actual expense ratio and an assumed rate of return of 5% per year before expenses, which is not the Fund’s actual return. The hypothetical account values and expenses may not be used to estimate the actual ending account balance or expenses you paid for the period. You may use this information to compare the ongoing costs of investing in the Fund and other funds. To do so, compare this 5% hypothetical example with the 5% hypothetical examples that appear in the shareholder reports of the other funds.
Please note that the expenses shown in the table are meant to highlight your ongoing costs. Therefore, the “Hypothetical” line of the table is useful in comparing ongoing costs only and will not help you determine the relative total costs of owning different funds.
| | Beginning
account value
7-1-2020 | Ending
account value
12-31-2020 | Expenses
paid during
the period1 | Annualized net
expense ratio |
| Class R6 | | | | |
| Actual | $1,000.00 | $ 985.04 | $3.10 | 0.62% |
| Hypothetical (5% return before expenses) | $1,000.00 | $1,022.08 | $3.16 | 0.62% |
| Institutional Class | | | | |
| Actual | $1,000.00 | $ 983.79 | $3.60 | 0.72% |
| Hypothetical (5% return before expenses) | $1,000.00 | $1,021.58 | $3.67 | 0.72% |
1 Expenses paid is equal to the annualized net expense ratio of each class multiplied by the average account value over the period, multiplied by the number of days in the most recent fiscal half-year divided by the number of days in the fiscal year (to reflect the one-half-year period).
6 | Wells Fargo Alternative Risk Premia Fund
Consolidated portfolio of investments—December 31, 2020 (unaudited)
| | | Yield | | Shares | Value |
| Short-term investments: 89.19% | | | | | |
| Investment companies: 20.86% | | | | | |
| Wells Fargo Government Money Market Fund Select Class ♠∞* | | 0.03 | | 15,179,599 | 15,179,599 |
| | | | Maturity
date | Principal | |
| U.S. Treasury securities: 68.33% | | | | | |
| U.S. Treasury Bill ☼# | | 0.03% | 6-17-2021 | $ 8,803,000 | 8,799,692 |
| U.S. Treasury Bill ☼ | | 0.09 | 1-14-2021 | 30,000,000 | 29,999,625 |
| U.S. Treasury Bill ☼ | | 0.09 | 1-28-2021 | 10,919,000 | 10,918,581 |
| | | | | | 49,717,898 |
| Total Short-term investments (Cost $64,898,626) | | | | | 64,897,497 |
| Total investments in securities (Cost $64,898,626) | 89.19% | | | | 64,897,497 |
| Other assets and liabilities, net | 10.81 | | | | 7,869,624 |
| Total net assets | 100.00% | | | | $ 72,767,121 |
| ♠ | The issuer of the security is an affiliated person of the Fund as defined in the Investment Company Act of 1940. |
| * | A portion of the holding represents an investment held in Alt Risk Premia Special Investments (Cayman) Ltd., the consolidated entity. |
| ∞ | The rate represents the 7-day annualized yield at period end. |
| ☼ | Zero coupon security. The rate represents the current yield to maturity. |
| # | All or a portion of this security is segregated as collateral for investments in derivative instruments. |
Investments in affiliates
An affiliated investment is an investment in which the Fund owns at least 5% of the outstanding voting shares of the issuer or as a result of other relationships, such as the Fund and the issuer having the same investment manager. Transactions with issuers that were either affiliated persons of the Fund at the beginning of the period or the end of the period were as follows:
| | Value,
beginning of
period | Purchases | Sales
proceeds | Net
realized
gains
(losses) | Net
change in
unrealized
gains
(losses) | Value,
end of
period | % of
net
assets | Shares,
end
of period | Income
from
affiliated
securities |
| Short-term investments | | | | | | | | | |
| Investment companies | | | | | | | | | |
| Wells Fargo Government Money Market Fund Select Class | $7,855,265 | $101,546,059 | $(94,221,725) | $0 | $0 | $15,179,599 | 20.86% | 15,179,599 | $6,218 |
Futures contracts
| Description | Number of
contracts | Expiration
date | Notional
cost | Notional
value | Unrealized
gains | Unrealized
losses |
| Long | | | | | | |
| CAC 40 Index | 7 | 1-15-2021 | $ 474,627 | $ 473,927 | $ 0 | $ (700) |
| London Metal Exchange Aluminium Futures** | 13 | 1-18-2021 | 656,883 | 643,175 | 0 | (13,708) |
| London Metal Exchange Lead Futures** | 14 | 1-18-2021 | 715,466 | 694,138 | 0 | (21,328) |
| London Metal Exchange Nickel Futures** | 13 | 1-18-2021 | 1,210,313 | 1,292,187 | 81,874 | 0 |
| London Metal Exchange Zinc Futures** | 1 | 1-18-2021 | 65,595 | 68,333 | 2,738 | 0 |
| Hang Seng Index | 3 | 1-28-2021 | 509,641 | 526,653 | 17,012 | 0 |
| Gasoline RBOB Futures** | 7 | 1-29-2021 | 392,442 | 414,569 | 22,127 | 0 |
| Gold 100 Ounces Futures** | 5 | 2-24-2021 | 919,967 | 947,550 | 27,583 | 0 |
| Sugar #11 World Futures** | 178 | 2-26-2021 | 2,871,600 | 3,088,086 | 216,486 | 0 |
The accompanying notes are an integral part of these consolidated financial statements.
Wells Fargo Alternative Risk Premia Fund | 7
Consolidated portfolio of investments—December 31, 2020 (unaudited)
Futures contracts (continued)
| Description | Number of
contracts | Expiration
date | Notional
cost | Notional
value | Unrealized
gains | | Unrealized
losses |
| Long (continued) | | | | | | | |
| Cotton #2 Futures** | 11 | 3-9-2021 | $393,238 | $429,660 | $36,422 | | $0 |
| TOPIX Index | 4 | 3-11-2021 | 679,516 | 699,046 | 19,530 | | 0 |
| Corn Futures** | 17 | 3-12-2021 | 361,739 | 411,400 | 49,661 | | 0 |
| KC Hard Red Winter Wheat Futures** | 29 | 3-12-2021 | 812,471 | 875,075 | 62,604 | | 0 |
| Soybean Futures** | 27 | 3-12-2021 | 1,604,233 | 1,769,850 | 165,617 | | 0 |
| Soybean Meal Futures** | 13 | 3-12-2021 | 504,709 | 558,220 | 53,511 | | 0 |
| Soybean Oil Futures** | 118 | 3-12-2021 | 2,753,853 | 3,001,920 | 248,067 | | 0 |
| Wheat Futures** | 26 | 3-12-2021 | 783,997 | 832,650 | 48,653 | | 0 |
| 10-Year Australian Treasury Bonds | 83 | 3-15-2021 | 9,396,176 | 9,421,083 | 24,907 | | 0 |
| 10-Year Japanese Treasury Bonds | 29 | 3-15-2021 | 42,690,685 | 42,667,958 | 0 | | (22,727) |
| London Metal Exchange Copper Futures** | 11 | 3-15-2021 | 2,119,047 | 2,135,856 | 16,809 | | 0 |
| Cocoa Futures** | 98 | 3-16-2021 | 2,515,921 | 2,550,940 | 35,019 | | 0 |
| SPI 200 Index | 4 | 3-18-2021 | 506,910 | 503,970 | 0 | | (2,940) |
| DAX Futures Index | 1 | 3-19-2021 | 403,820 | 419,820 | 16,000 | | 0 |
| E-Mini NASDAQ 100 Index | 2 | 3-19-2021 | 496,060 | 515,420 | 19,360 | | 0 |
| E-Mini Russell 2000 Index | 4 | 3-19-2021 | 383,995 | 394,960 | 10,965 | | 0 |
| E-Mini S&P 500 Index | 3 | 3-19-2021 | 549,142 | 562,320 | 13,178 | | 0 |
| Euro STOXX 50 Index | 12 | 3-19-2021 | 514,074 | 520,423 | 6,349 | | 0 |
| FTSE 100 Index | 6 | 3-19-2021 | 539,862 | 526,761 | 0 | | (13,101) |
| MSCI Emerging Markets Index | 7 | 3-19-2021 | 438,569 | 450,870 | 12,301 | | 0 |
| S&P/TSX 60 Index | 3 | 3-19-2021 | 490,339 | 484,987 | 0 | | (5,352) |
| 10-Year Canadian Treasury Bonds | 171 | 3-22-2021 | 20,019,826 | 20,029,932 | 10,106 | | 0 |
| Silver Futures** | 6 | 3-29-2021 | 730,654 | 792,360 | 61,706 | | 0 |
| Short | | | | | | | |
| London Metal Exchange Lead Futures** | (22) | 1-18-2021 | (1,017,672) | (1,090,788) | 0 | | (73,116) |
| WTI Crude Futures** | (17) | 1-20-2021 | (805,744) | (824,840) | 0 | | (19,096) |
| Natural Gas Futures** | (32) | 1-27-2021 | (849,495) | (812,480) | 37,015 | | 0 |
| Brent Crude Futures** | (8) | 1-29-2021 | (385,899) | (414,400) | 0 | | (28,501) |
| NY Harbor Ultra-Low Sulfur Diesel Futures** | (1) | 1-29-2021 | (61,418) | (62,328) | 0 | | (910) |
| Low Sugar Gas Oil Futures** | (30) | 2-11-2021 | (1,263,673) | (1,269,000) | 0 | | (5,327) |
| Lean Hogs Futures** | (54) | 2-12-2021 | (1,437,440) | (1,517,940) | 0 | | (80,500) |
| Live Cattle Futures** | (76) | 2-26-2021 | (3,453,682) | (3,496,760) | 0 | | (43,078) |
| Euro-Bund Futures | (215) | 3-8-2021 | (46,678,273) | (46,657,993) | 20,280 | | 0 |
| Coffee C Futures** | (4) | 3-19-2021 | (163,184) | (192,375) | 0 | | (29,191) |
| 10-Year U.S. Treasury Notes | (87) | 3-22-2021 | (11,969,067) | (12,012,797) | 0 | | (43,730) |
| Long Gilt Futures | (5) | 3-29-2021 | (915,941) | (926,755) | 0 | | (10,814) |
| | | | | | $1,335,880 | | $(414,119) |
| ** | Represents an investment held in Alt Risk Premia Special Investments (Cayman) Ltd., the consolidated entity. |
Forward foreign currency contracts
Currency to be
received | Currency to be
delivered | Counterparty | Settlement
date | Unrealized
gains | Unrealized
losses |
| 10,455,000 EUR | 12,688,690 USD | Goldman Sachs International | 1-20-2021 | $ 88,574 | $ 0 |
| 1,300,368 USD | 379,880,000 HUF | Goldman Sachs International | 1-20-2021 | 20,624 | 0 |
| 10,622,071 USD | 9,415,000 CHF | Goldman Sachs International | 1-20-2021 | 0 | (17,790) |
| 11,219,537 USD | 14,908,000 AUD | Goldman Sachs International | 1-20-2021 | 0 | (275,922) |
| 1,029,767 USD | 5,203,000 BRL | Goldman Sachs International | 1-20-2021 | 28,089 | 0 |
| 7,412,237 USD | 65,012,000 NOK | Goldman Sachs International | 1-20-2021 | 0 | (170,022) |
| 559,207 USD | 411,352,000 CLP | Goldman Sachs International | 1-20-2021 | 0 | (19,672) |
| 4,206,921 USD | 35,501,000 SEK | Goldman Sachs International | 1-20-2021 | 0 | (108,843) |
| 2,468,944,000 KRW | 2,269,167 USD | Goldman Sachs International | 1-20-2021 | 4,123 | 0 |
The accompanying notes are an integral part of these consolidated financial statements.
8 | Wells Fargo Alternative Risk Premia Fund
Consolidated portfolio of investments—December 31, 2020 (unaudited)
Forward foreign currency contracts (continued)
Currency to be
received | Currency to be
delivered | Counterparty | Settlement
date | Unrealized
gains | | Unrealized
losses |
| 16,330,000 CAD | 12,836,920 USD | Goldman Sachs International | 1-20-2021 | $0 | | $(6,964) |
| 1,622,000 PLN | 444,459 USD | Goldman Sachs International | 1-20-2021 | 0 | | (10,219) |
| 5,484,000 TRY | 684,552 USD | Goldman Sachs International | 1-20-2021 | 49,435 | | 0 |
| 26,352,850,000 IDR | 1,858,452 USD | Goldman Sachs International | 1-20-2021 | 14,587 | | 0 |
| 673,890,000 JPY | 6,467,585 USD | Goldman Sachs International | 1-20-2021 | 60,124 | | 0 |
| 5,259,283 USD | 3,994,000 GBP | Goldman Sachs International | 1-20-2021 | 0 | | (203,247) |
| 40,068,000 MXN | 2,000,896 USD | Goldman Sachs International | 1-20-2021 | 9,120 | | 0 |
| 38,796,000 ZAR | 2,570,313 USD | Goldman Sachs International | 1-20-2021 | 63,762 | | 0 |
| 32,140,000 RUB | 437,577 USD | Goldman Sachs International | 1-20-2021 | 0 | | (3,347) |
| 7,971,000 GBP | 10,607,193 USD | Goldman Sachs International | 1-20-2021 | 294,617 | | 0 |
| 2,785,000 NZD | 1,971,680 USD | Goldman Sachs International | 1-20-2021 | 32,322 | | 0 |
| 28,739,000 CZK | 1,326,156 USD | Goldman Sachs International | 1-20-2021 | 11,982 | | 0 |
| 81,515,000 INR | 1,101,926 USD | Goldman Sachs International | 1-20-2021 | 11,743 | | 0 |
| 4,485,000 GBP | 6,107,135 USD | Goldman Sachs International | 1-20-2021 | 26,928 | | 0 |
| | | | | $716,030 | | $(816,026) |
Swaps
| Reference asset/index | Counterparty | Payment
frequency | Maturity
date | Notional
amount | Value | Unrealized
gains | Unrealized
gains |
| Markit CDX North American High Yield Index† | Goldman Sachs International | Monthly | 2-1-2024 | $4,647,514 | $4,718,853 | $71,339 | $0 |
| † | The Fund receives or pays the difference between the total return on a portfolio of long and short positions underlying the total return swap and the return on a specified benchmark (either the Federal Funds Effective Rate or the One Month LIBOR), plus or minus a spread in a typical range of 20-75 basis points (bps; 100 bps equal 1.00%). The spread is determined based upon the country and/or currency of the individual underlying positions. Certain short positions may be subject to higher market rates. |
The following table represents the component disclosures associated with the synthetic total return swap basket as of the end of the period.
| Reference asset | | Shares | Value | % of swap
basket value |
| Long positions | | | | |
| Common stocks | | | | |
| Communication services | | | | |
| Diversified telecommunication services | | | | |
| Hong Kong Telecommunications Trust & Hong Kong Trust Limited | | 37,000 | $ 48,013 | 1.02% |
| Iliad SA | | 477 | 97,956 | 2.08 |
| PCCW Limited | | 173,000 | 104,214 | 2.21 |
| Spark New Zealand Limited | | 60,859 | 205,804 | 4.36 |
| Media | | | | |
| CyberAgent Incorporated | | 1,000 | 68,985 | 1.46 |
| Quebecor Incorporated Class B | | 2,700 | 69,489 | 1.47 |
| Telenet Group Holding NV | | 1,675 | 71,783 | 1.52 |
| | | | 666,244 | |
| Consumer discretionary | | | | |
| Automobiles | | | | |
| Fiat Chrysler Automobiles NV | | 4,047 | 73,113 | 1.55 |
| Peugeot SA | | 2,840 | 77,612 | 1.64 |
The accompanying notes are an integral part of these consolidated financial statements.
Wells Fargo Alternative Risk Premia Fund | 9
Consolidated portfolio of investments—December 31, 2020 (unaudited)
| Reference asset | | Shares | Value | % of swap
basket value |
| Long positions (continued) | | | | |
| Hotels, restaurants & leisure | | | | |
| Domino's Pizza Incorporated | | 451 | $ 172,940 | 3.66% |
| Evolution Gaming Group | | 853 | 85,756 | 1.82 |
| La Francaise Des Jeux SA | | 4,149 | 189,617 | 4.02 |
| McDonald's Holdings Company Japan Limited | | 1,300 | 63,000 | 1.34 |
| Specialty retail | | | | |
| Best Buy Company Incorporated | | 1,256 | 125,336 | 2.66 |
| Kingfisher plc | | 22,892 | 84,648 | 1.79 |
| Shimamura Company Limited | | 1,100 | 115,582 | 2.45 |
| Tractor Supply Company | | 495 | 69,587 | 1.47 |
| Yamada Denki Company Limited | | 17,600 | 93,509 | 1.98 |
| Textiles, apparel & luxury goods | | | | |
| Pandora AS | | 657 | 73,530 | 1.56 |
| | | | 1,224,230 | |
| Consumer staples | | | | |
| Beverages | | | | |
| Coca-Cola Amatil Limited | | 5,352 | 53,351 | 1.13 |
| ITO EN Limited | | 900 | 56,990 | 1.21 |
| Monster Beverage Corporation | | 698 | 64,551 | 1.37 |
| Remy Cointreau SA | | 315 | 58,608 | 1.24 |
| Food & staples retailing | | | | |
| Cosmos Pharmaceutical Corporation | | 400 | 64,591 | 1.37 |
| The Kroger Company | | 5,672 | 180,143 | 3.82 |
| Food products | | | | |
| Archer Daniels Midland Company | | 2,531 | 127,588 | 2.70 |
| Bunge Limited | | 4,693 | 307,767 | 6.52 |
| NH Foods Limited | | 1,300 | 57,258 | 1.21 |
| Household products | | | | |
| The Clorox Company | | 645 | 130,238 | 2.76 |
| Tobacco | | | | |
| Swedish Match AB | | 2,958 | 230,194 | 4.88 |
| | | | 1,331,279 | |
| Energy | | | | |
| Oil, gas & consumable fuels | | | | |
| Ampol Limited | | 10,291 | 225,480 | 4.78 |
| Cabot Oil & Gas Corporation | | 6,784 | 110,444 | 2.34 |
| ENEOS Holdings Incorporated | | 97,100 | 348,754 | 7.39 |
| Keyera Corporation | | 3,800 | 67,528 | 1.43 |
| Neste Oil Oyj | | 833 | 60,479 | 1.28 |
| Parkland Corporation | | 4,200 | 133,269 | 2.82 |
| | | | 945,954 | |
| Financials | | | | |
| Banks | | | | |
| Aozora Bank Limited | | 4,300 | 79,511 | 1.68 |
| Banque Cantonale Vaudoise | | 859 | 93,501 | 1.98 |
| Fukuoka Financial Group Incorporated | | 6,600 | 117,645 | 2.49 |
| Mebuki Financial Group Incorporated | | 26,200 | 51,623 | 1.09 |
| Capital markets | | | | |
| CI Financial Corporation | | 15,900 | 197,111 | 4.18 |
| FactSet Research Systems Incorporated | | 180 | 59,850 | 1.27 |
| Stonex Group Incorporated | | 844 | 48,868 | 1.04 |
The accompanying notes are an integral part of these consolidated financial statements.
10 | Wells Fargo Alternative Risk Premia Fund
Consolidated portfolio of investments—December 31, 2020 (unaudited)
| Reference asset | | Shares | Value | % of swap
basket value |
| Long positions (continued) | | | | |
| Diversified financial services | | | | |
| Sofina SA | | 376 | $ 127,237 | 2.70% |
| Insurance | | | | |
| Direct Line Insurance Group plc | | 30,795 | 134,338 | 2.85 |
| Erie Indemnity Company Class A | | 408 | 100,205 | 2.12 |
| Medibank Private Limited | | 34,185 | 79,328 | 1.68 |
| Progressive Corporation | | 1,733 | 171,359 | 3.63 |
| Mortgage REITs | | | | |
| AGNC Investment Corporation | | 8,843 | 137,951 | 2.92 |
| Dynex Capital Incorporated REIT | | 2,970 | 52,866 | 1.12 |
| | | | 1,451,393 | |
| Health care | | | | |
| Biotechnology | | | | |
| Genus plc | | 1,065 | 61,110 | 1.30 |
| Regeneron Pharmaceuticals Incorporated | | 186 | 89,858 | 1.90 |
| Health care equipment & supplies | | | | |
| West Pharmaceutical Services Incorporated | | 260 | 73,661 | 1.56 |
| Health care providers & services | | | | |
| AmerisourceBergen Corporation | | 3,357 | 328,180 | 6.95 |
| McKesson Corporation | | 496 | 86,264 | 1.83 |
| Molina Healthcare Incorporated | | 414 | 88,050 | 1.87 |
| Health care technology | | | | |
| Computer Programs & Systems Incorporated | | 1,785 | 47,909 | 1.02 |
| Pharmaceuticals | | | | |
| Hikma Pharmaceuticals plc | | 3,129 | 107,743 | 2.28 |
| Jazz Pharmaceuticals plc | | 293 | 48,360 | 1.02 |
| Kyorin Company Limited | | 3,200 | 60,233 | 1.28 |
| Recordati SpA | | 2,153 | 119,726 | 2.54 |
| | | | 1,111,094 | |
| Industrials | | | | |
| Aerospace & defense | | | | |
| Huntington Ingalls Industries Incorporated | | 480 | 81,830 | 1.73 |
| Lockheed Martin Corporation | | 397 | 140,927 | 2.99 |
| Industrial conglomerates | | | | |
| DCC plc | | 1,890 | 133,829 | 2.84 |
| Professional services | | | | |
| Adecco SA | | 1,957 | 130,343 | 2.76 |
| Robert Half International Incorporated | | 1,669 | 104,279 | 2.21 |
| Road & rail | | | | |
| AMERCO | | 200 | 90,792 | 1.92 |
| J.B. Hunt Transport Services Incorporated | | 2,267 | 309,786 | 6.56 |
| Knight-Swift Transportation Holdings Incorporated | | 3,323 | 138,968 | 2.94 |
| Nippon Express Company Limited | | 4,000 | 269,067 | 5.70 |
| Old Dominion Freight Line Incorporated | | 1,339 | 261,346 | 5.54 |
| Transportation infrastructure | | | | |
| Kamigumi Company Limited | | 19,100 | 348,926 | 7.39 |
| | | | 2,010,093 | |
| Information technology | | | | |
| Electronic equipment, instruments & components | | | | |
| Arrow Electronics Incorporated | | 3,093 | 300,949 | 6.38 |
| Venture Corporation Limited | | 16,900 | 248,334 | 5.26 |
The accompanying notes are an integral part of these consolidated financial statements.
Wells Fargo Alternative Risk Premia Fund | 11
Consolidated portfolio of investments—December 31, 2020 (unaudited)
| Reference asset | | Shares | Value | % of swap
basket value |
| Long positions (continued) | | | | |
| IT services | | | | |
| Booz Allen Hamilton Holding Corporation | | 1,647 | $ 143,585 | 3.04% |
| Broadridge Financial Solutions Incorporated | | 556 | 85,179 | 1.81 |
| Itochu Techno-Solutions Corporation | | 4,800 | 171,398 | 3.63 |
| Leidos Holdings Incorporated | | 740 | 77,789 | 1.65 |
| Otsuka Corporation | | 2,400 | 126,593 | 2.68 |
| Software | | | | |
| CDK Global Incorporated | | 1,782 | 92,361 | 1.96 |
| NortonLifeLock Incorporated | | 5,388 | 111,963 | 2.37 |
| TIS Incorporated | | 4,400 | 90,198 | 1.91 |
| | | | 1,448,349 | |
| Materials | | | | |
| Chemicals | | | | |
| Johnson Matthey plc | | 2,431 | 80,617 | 1.71 |
| Tosoh Corporation | | 9,500 | 148,430 | 3.15 |
| Construction materials | | | | |
| Taiheiyo Cement Corporation | | 5,000 | 125,245 | 2.65 |
| Metals & mining | | | | |
| EVRAZ plc | | 13,381 | 86,296 | 1.83 |
| | | | 440,588 | |
| Real estate | | | | |
| Equity REITs | | | | |
| Canadian Apartment Properties | | 1,800 | 70,691 | 1.50 |
| Covivio | | 665 | 61,214 | 1.30 |
| Extra Space Storage Incorporated | | 1,276 | 147,837 | 3.13 |
| Iron Mountain Incorporated | | 1,837 | 54,155 | 1.15 |
| Mapletree Logistics Trust | | 57,000 | 86,690 | 1.84 |
| Northview Apartment REIT | | 2,300 | 65,464 | 1.39 |
| Public Storage Incorporated | | 311 | 71,819 | 1.52 |
| Smart REIT | | 10,300 | 186,758 | 3.96 |
| Real estate management & development | | | | |
| Kerry Properties Limited | | 95,500 | 241,939 | 5.13 |
| | | | 986,567 | |
| Utilities | | | | |
| Electric utilities | | | | |
| Kyushu Electric Power Company Incorporated | | 16,700 | 144,068 | 3.05 |
| NRG Energy Incorporated | | 5,780 | 217,039 | 4.60 |
| Tohoku Electric Power Company Incorporated | | 7,600 | 62,724 | 1.33 |
| Gas utilities | | | | |
| Enagás SA | | 4,086 | 89,675 | 1.90 |
| | | | 513,506 | |
| | Dividend yield | | | |
| Preferred stocks | | | | |
| Materials | | | | |
| Chemicals | | | | |
| Fuchs Petrolub SE | 2.07% | 3,291 | $ 185,686 | 3.93% |
The accompanying notes are an integral part of these consolidated financial statements.
12 | Wells Fargo Alternative Risk Premia Fund
Consolidated portfolio of investments—December 31, 2020 (unaudited)
| Reference asset | | Shares | Value | % of swapbasket value |
| Short positions | | | | |
| Common stocks | | | | |
| Communication services | | | | |
| Diversified telecommunication services | | | | |
| Singapore Telecommunications Limited | | (123,400) | $ (215,689) | (4.57)% |
| Entertainment | | | | |
| The Walt Disney Company | | (2,109) | (382,109) | (8.10) |
| Media | | | | |
| Liberty Broadband Corporation Class C | | (356) | (56,380) | (1.19) |
| | | | (654,178) | |
| Consumer discretionary | | | | |
| Automobiles | | | | |
| Nissan Motor Company Limited | | (36,900) | (200,013) | (4.24) |
| Volkswagen AG | | (698) | (145,535) | (3.08) |
| Hotels, restaurants & leisure | | | | |
| Whitbread plc | | (2,433) | (103,141) | (2.19) |
| Household durables | | | | |
| Sony Corporation | | (1,200) | (120,922) | (2.56) |
| Internet & direct marketing retail | | | | |
| Rakuten Incorporated | | (6,900) | (66,398) | (1.41) |
| Rocket Internet SE | | (2,930) | (77,030) | (1.63) |
| Specialty retail | | | | |
| Fast Retailing Company Limited | | (100) | (89,668) | (1.90) |
| Ross Stores Incorporated | | (529) | (64,966) | (1.38) |
| TJX Companies Incorporated | | (716) | (48,896) | (1.04) |
| | | | (916,569) | |
| Consumer staples | | | | |
| Food & staples retailing | | | | |
| Lawson Products Incorporated | | (1,800) | (83,765) | (1.78) |
| Food products | | | | |
| Danone SA | | (1,813) | (119,070) | (2.52) |
| | | | (202,835) | |
| Energy | | | | |
| Oil, gas & consumable fuels | | | | |
| Chevron Corporation | | (1,177) | (99,398) | (2.11) |
| Eni SpA | | (13,195) | (137,752) | (2.92) |
| Hess Corporation | | (895) | (47,247) | (1.00) |
| Royal Dutch Shell PLC A Shares | | (8,601) | (152,646) | (3.23) |
| Royal Dutch Shell PLC B Shares | | (4,869) | (83,855) | (1.78) |
| Suncor Energy Incorporated | | (4,000) | (67,091) | (1.42) |
| Woodside Petroleum Limited | | (11,396) | (199,788) | (4.23) |
| | | | (787,777) | |
| Financials | | | | |
| Banks | | | | |
| Bank of America Corporation | | (2,310) | (70,016) | (1.48) |
| HSBC Holdings plc | | (18,944) | (98,145) | (2.08) |
| JPMorgan Chase & Company | | (1,284) | (163,158) | (3.46) |
| UniCredit SpA | | (8,756) | (82,038) | (1.74) |
| Capital markets | | | | |
| Brookfield Asset Management Incorporated Class A | | (4,300) | (177,756) | (3.77) |
| CME Group Incorporated | | (546) | (99,399) | (2.11) |
The accompanying notes are an integral part of these consolidated financial statements.
Wells Fargo Alternative Risk Premia Fund | 13
Consolidated portfolio of investments—December 31, 2020 (unaudited)
| Reference asset | | Shares | Value | % of swapbasket value |
| Short positions (continued) | | | | |
| Capital markets (continued) | | | | |
| Industrivarden AB Series C | | (4,912) | $ (158,767) | (3.36)% |
| London Stock Exchange Group PLC | | (482) | (59,375) | (1.26) |
| Diversified financial services | | | | |
| Berkshire Hathaway Incorporated Class B | | (574) | (133,093) | (2.82) |
| Onex Corporation | | (2,200) | (126,272) | (2.68) |
| Insurance | | | | |
| Insurance Australia Group | | (52,568) | (190,478) | (4.04) |
| Japan Post Holdings Company Limited | | (39,700) | (309,229) | (6.55) |
| Loews Corporation | | (6,125) | (275,748) | (5.84) |
| | | | (1,943,474) | |
| Health care | | | | |
| Biotechnology | | | | |
| Alnylam Pharmaceuticals Incorporated | | (468) | (60,826) | (1.29) |
| Argenx SE | | (232) | (68,588) | (1.45) |
| Health care providers & services | | | | |
| Orpea SA | | (373) | (49,008) | (1.04) |
| Life sciences tools & services | | | | |
| Illumina Incorporated | | (217) | (80,290) | (1.70) |
| QIAGEN NV | | (1,028) | (53,311) | (1.13) |
| Pharmaceuticals | | | | |
| Takeda Pharmaceutical Company Limited | | (5,400) | (195,423) | (4.14) |
| | | | (507,446) | |
| Industrials | | | | |
| Aerospace & defense | | | | |
| The Boeing Company | | (250) | (53,515) | (1.13) |
| Construction & engineering | | | | |
| Vinci SA | | (2,696) | (267,965) | (5.68) |
| Machinery | | | | |
| FANUC Corporation | | (400) | (98,740) | (2.09) |
| SMC Corporation | | (100) | (61,074) | (1.29) |
| Marine | | | | |
| AP Moller-Maersk AS | | (37) | (76,434) | (1.62) |
| Professional services | | | | |
| Thomson Reuters Corporation | | (1,700) | (139,136) | (2.95) |
| Road & rail | | | | |
| East Japan Railway Co | | (4,900) | (326,905) | (6.93) |
| Uber Technologies Incorporated | | (1,453) | (74,103) | (1.57) |
| | | | (1,097,872) | |
| Information technology | | | | |
| Electronic equipment, instruments & components | | | | |
| Horiba Limited | | (1,000) | (58,735) | (1.24) |
| Keyence Corporation | | (200) | (112,503) | (2.38) |
| Kyocera Corporation | | (5,400) | (331,443) | (7.02) |
| IT services | | | | |
| Fidelity National Information Service | | (1,110) | (157,021) | (3.33) |
| Fiserv Incorporated | | (1,685) | (191,854) | (4.07) |
| Global Payments Incorporated | | (501) | (107,925) | (2.29) |
| Okta Incorporated | | (271) | (68,904) | (1.46) |
| Shopify Incorporated Class A | | (100) | (112,917) | (2.39) |
| Twilio Incorporated Class A | | (141) | (47,729) | (1.01) |
The accompanying notes are an integral part of these consolidated financial statements.
14 | Wells Fargo Alternative Risk Premia Fund
Consolidated portfolio of investments—December 31, 2020 (unaudited)
| Reference asset | | Shares | Value | % of swapbasket value |
| Short positions (continued) | | | | |
| Software | | | | |
| Guidewire Software Incorporated | | (457) | $ (58,830) | (1.25)% |
| salesforce.com Incorporated | | (319) | (70,987) | (1.50) |
| Splunk Incorporated | | (395) | (67,107) | (1.42) |
| Technology hardware, storage & peripherals | | | | |
| Canon Incorporated | | (8,600) | (166,604) | (3.53) |
| | | | (1,552,559) | |
| Materials | | | | |
| Chemicals | | | | |
| BASF SE | | (993) | (78,489) | (1.66) |
| Metals & mining | | | | |
| Franco-Nevada Corporation | | (500) | (62,691) | (1.33) |
| Ivanhoe Mines Limited Class A | | (8,800) | (47,426) | (1.01) |
| Nippon Steel Corporation | | (3,700) | (47,720) | (1.01) |
| | | | (236,326) | |
| Real estate | | | | |
| Equity REITs | | | | |
| UDR Incorporated REIT | | (3,288) | (126,358) | (2.68) |
| Real estate management & development | | | | |
| Hongkong Land Holdings Limited | | (31,200) | (128,856) | (2.73) |
| Wharf Real Estate Investment Company Limited | | (14,000) | (72,867) | (1.54) |
| | | | (328,081) | |
| Utilities | | | | |
| Gas utilities | | | | |
| The Hong Kong and China Gas Company Limited | | (65,000) | (97,092) | (2.06) |
| | | | (97,092) | |
| Abbreviations: |
| REIT | Real estate investment trust |
The accompanying notes are an integral part of these consolidated financial statements.
Wells Fargo Alternative Risk Premia Fund | 15
Consolidated statement of assets and liabilities—December 31, 2020 (unaudited)
| | |
| Assets | |
Investments in unaffiliated securities, at value (cost $49,719,027)
| $ 49,717,898 |
Investments in affiliated securites, at value (cost $15,179,599)
| 15,179,599 |
Cash
| 34,100 |
Segregated cash for futures contracts
| 7,878,909 |
Unrealized gains on forward foreign currency contracts
| 716,030 |
Unrealized gains on swap contracts
| 71,339 |
Receivable for daily variation margin on open futures contracts
| 24,706 |
Receivable for Fund shares sold
| 3,044 |
Receivable for dividends
| 352 |
Prepaid expenses and other assets
| 39,713 |
Total assets
| 73,665,690 |
| Liabilities | |
Unrealized losses on forward foreign currency contracts
| 816,026 |
Payable for investments purchased
| 34,100 |
Management fee payable
| 10,227 |
Trustees’ fees and expenses payable
| 4,591 |
Administration fees payable
| 2,006 |
Accrued expenses and other liabilities
| 31,619 |
Total liabilities
| 898,569 |
Total net assets
| $ 72,767,121 |
| Net assets consist of | |
Paid-in capital
| $ 88,036,223 |
Total distributable loss
| (15,269,102) |
Total net assets
| $ 72,767,121 |
| Computation of net asset value per share | |
Net assets – Class R6
| $ 72,747,388 |
Shares outstanding – Class R61
| 9,206,156 |
Net asset value per share – Class R6
| $7.90 |
Net assets – Institutional Class
| $ 19,733 |
Shares outstanding – Institutional Class1
| 2,500 |
Net asset value per share – Institutional Class
| $7.89 |
| 1 | The Fund has an unlimited number of authorized shares |
The accompanying notes are an integral part of these consolidated financial statements.
16 | Wells Fargo Alternative Risk Premia Fund
Consolidated statement of operations— six months ended December 31, 2020 (unaudited)
| | |
| Investment income | |
Interest
| $ 30,021 |
Income from affiliated securities
| 6,218 |
Total investment income
| 36,239 |
| Expenses | |
Management fee
| 249,311 |
| Administration fees | |
Class R6
| 12,462 |
Institutional Class
| 13 |
Custody and accounting fees
| 33,419 |
Professional fees
| 51,279 |
Registration fees
| 30,288 |
Shareholder report expenses
| 13,045 |
Trustees’ fees and expenses
| 10,883 |
Other fees and expenses
| 21,630 |
Total expenses
| 422,330 |
| Less: Fee waivers and/or expense reimbursements | |
Fund-level
| (164,700) |
Net expenses
| 257,630 |
Net investment loss
| (221,391) |
| Realized and unrealized gains (losses) on investments | |
| Net realized losses on | |
Unaffiliated securities
| (12,541) |
Futures contracts
| (189,980) |
Forward foreign currency contracts
| (59,593) |
Swap contracts
| (2,346,382) |
Net realized losses on investments
| (2,608,496) |
| Net change in unrealized gains (losses) on | |
Unaffiliated securities
| (31,199) |
Futures contracts
| 1,230,797 |
Forward foreign currency contracts
| 423,608 |
Swap contracts
| (87,906) |
Net change in unrealized gains (losses) on investments
| 1,535,300 |
Net realized and unrealized gains (losses) on investments
| (1,073,196) |
Net decrease in net assets resulting from operations
| $(1,294,587) |
The accompanying notes are an integral part of these consolidated financial statements.
Wells Fargo Alternative Risk Premia Fund | 17
Consolidated statement of changes in net assets
| | |
| | Six months ended
December 31, 2020
(unaudited) | Year ended
June 30, 2020 |
| Operations | | | | |
Net investment income (loss)
| | $ (221,391) | | $ 907,712 |
Net realized losses on investments
| | (2,608,496) | | (16,733,363) |
Net change in unrealized gains (losses) on investments
| | 1,535,300 | | (966,567) |
Net decrease in net assets resulting from operations
| | (1,294,587) | | (16,792,218) |
| Distributions to shareholders from | | | | |
| Net investment income and net realized gains | | | | |
Class R6
| | 0 | | (1,035,896) |
Institutional Class
| | 0 | | (233) |
Total distributions to shareholders
| | 0 | | (1,036,129) |
| Capital share transactions | Shares | | Shares | |
| Proceeds from shares sold | | | | |
Class R6
| 4,286,396 | 34,391,619 | 8,031,702 | 77,333,419 |
| Reinvestment of distributions | | | | |
Class R6
| 0 | 0 | 64,136 | 622,954 |
| Payment for shares redeemed | | | | |
Class R6
| (3,279,313) | (26,115,009) | (3,894,265) | (33,323,865) |
Net increase in net assets resulting from capital share transactions
| | 8,276,610 | | 44,632,508 |
Total increase in net assets
| | 6,982,023 | | 26,804,161 |
| Net assets | | | | |
Beginning of period
| | 65,785,098 | | 38,980,937 |
End of period
| | $ 72,767,121 | | $ 65,785,098 |
The accompanying notes are an integral part of these consolidated financial statements.
18 | Wells Fargo Alternative Risk Premia Fund
Consolidated financial highlights
(For a share outstanding throughout each period)
| | | Year ended June 30 |
| Class R6 | Six months ended
December 31, 2020
(unaudited) | 2020 | 2019 1 |
Net asset value, beginning of period
| $8.02 | $9.75 | $10.00 |
Net investment income (loss)
| (0.02) 2 | 0.10 | 0.07 |
Net realized and unrealized gains (losses) on investments
| (0.10) | (1.73) | (0.32) |
Total from investment operations
| (0.12) | (1.63) | (0.25) |
| Distributions to shareholders from | | | |
Net investment income
| 0.00 | (0.03) | 0.00 |
Net realized gains
| 0.00 | (0.07) | 0.00 |
Total distributions to shareholders
| 0.00 | (0.10) | 0.00 |
Net asset value, end of period
| $7.90 | $8.02 | $9.75 |
Total return3
| (1.50)% | (16.78)% | (2.50)% |
| Ratios to average net assets (annualized) | | | |
Gross expenses
| 1.02% | 1.04% | 1.56% |
Net expenses
| 0.62% | 0.62% | 0.62% |
Net investment income (loss)
| (0.51)% | 1.03% | 1.78% |
| Supplemental data | | | |
Portfolio turnover rate
| 0% | 0% | 0% |
Net assets, end of period (000s omitted)
| $72,747 | $65,765 | $38,957 |
| 1 | For the period from January 29, 2019 (commencement of class operations) to June 30, 2019 |
| 2 | Calculated based upon average shares outstanding |
| 3 | Returns for periods of less than one year are not annualized. |
The accompanying notes are an integral part of these consolidated financial statements.
Wells Fargo Alternative Risk Premia Fund | 19
Consolidated financial highlights
(For a share outstanding throughout each period)
| | | Year ended June 30 |
| Institutional Class | Six months ended
December 31, 2020
(unaudited) | 2020 | 2019 1 |
Net asset value, beginning of period
| $8.02 | $9.74 | $10.00 |
Net investment income (loss)
| (0.02) | 0.09 | 0.07 |
Net realized and unrealized gains (losses) on investments
| (0.11) | (1.72) | (0.33) |
Total from investment operations
| (0.13) | (1.63) | (0.26) |
| Distributions to shareholders from | | | |
Net investment income
| 0.00 | (0.02) | 0.00 |
Net realized gains
| 0.00 | (0.07) | 0.00 |
Total distributions to shareholders
| 0.00 | (0.09) | 0.00 |
Net asset value, end of period
| $7.89 | $8.02 | $9.74 |
Total return2
| (1.62)% | (16.87)% | (2.60)% |
| Ratios to average net assets (annualized) | | | |
Gross expenses
| 1.12% | 1.15% | 1.68% |
Net expenses
| 0.72% | 0.72% | 0.72% |
Net investment income (loss)
| (0.59)% | 0.95% | 1.69% |
| Supplemental data | | | |
Portfolio turnover rate
| 0% | 0% | 0% |
Net assets, end of period (000s omitted)
| $20 | $20 | $24 |
| 1 | For the period from January 29, 2019 (commencement of class operations) to June 30, 2019 |
| 2 | Returns for periods of less than one year are not annualized. |
The accompanying notes are an integral part of these consolidated financial statements.
20 | Wells Fargo Alternative Risk Premia Fund
Consolidated notes to financial statements (unaudited)
1. ORGANIZATION
Wells Fargo Funds Trust (the “Trust”), a Delaware statutory trust organized on March 10, 1999, is an open-end management investment company registered under the Investment Company Act of 1940, as amended (the “1940 Act”). As an investment company, the Trust follows the accounting and reporting guidance in Financial Accounting Standards Board (“FASB”) Accounting Standards Codification Topic 946, Financial Services – Investment Companies. These financial statements report on the Wells Fargo Alternative Risk Premia Fund (the “Fund”) which is a diversified series of the Trust.
2. INVESTMENT IN SUBSIDIARY
The Fund invests in direct or indirect investments in various derivatives, including commodity-linked derivatives, through Alt Risk Premia Special Investments (Cayman) Ltd. (the “Subsidiary”), a wholly owned subsidiary incorporated on October 2, 2018 under the laws of the Cayman Islands as an exempted segregated portfolio company with limited liability. As of December 31, 2020, the Subsidiary primarily had $6,130 in variation margin receivable related to open futures contracts representing 0.09% of its net assets. The Fund is the sole shareholder of the Subsidiary. As of December 31, 2020, the Fund held $6,706,110 in the Subsidiary, representing 9.22% of the Fund’s net assets prior to consolidation.
The consolidated financial statements of the Fund include the financial results of the Subsidiary. The Consolidated Portfolio of Investments includes positions of the Fund and the Subsidiary and the consolidated financial statements include the accounts of the Fund and the Subsidiary. Accordingly, all interfund balances and transactions between the Fund and the Subsidiary have been eliminated in consolidation.
3. SIGNIFICANT ACCOUNTING POLICIES
The following significant accounting policies, which are consistently followed in the preparation of the financial statements of the Fund, are in conformity with U.S. generally accepted accounting principles which require management to make estimates and assumptions that affect the reported amounts of assets and liabilities, disclosure of contingent assets and liabilities at the date of the financial statements, and the reported amounts of income and expenses during the reporting period. Actual results could differ from those estimates.
Securities valuation
All investments are valued each business day as of the close of regular trading on the New York Stock Exchange (generally 4 p.m. Eastern Time), although the Fund may deviate from this calculation time under unusual or unexpected circumstances.
Futures contracts that are listed on a foreign or domestic exchange or market are valued at the official closing price or, if none, the last sales price. If no sale occurs on the principal exchange or market that day, a fair value price will be determined in accordance with the Fund’s Valuation Procedures.
Forward foreign currency contracts are recorded at the forward rate provided by an independent foreign currency pricing source at a time each business day specified by the Wells Fargo Asset Management Pricing Committee at Wells Fargo Funds Management, LLC (“Funds Management”).
Swap contracts are valued at the evaluated price provided by an independent pricing service or, if a reliable price is not available, the quoted bid price from an independent broker-dealer.
Debt securities are valued at the evaluated bid price provided by an independent pricing service (e.g. taking into account various factors, including yields, maturities, or credit ratings) or, if a reliable price is not available, the quoted bid price from an independent broker-dealer.
Investments in registered open-end investment companies are valued at net asset value.
Investments which are not valued using any of the methods discussed above are valued at their fair value, as determined in good faith by the Board of Trustees of the Fund. The Board of Trustees has established a Valuation Committee comprised of the Trustees and has delegated to it the authority to take any actions regarding the valuation of portfolio securities that the Valuation Committee deems necessary or appropriate, including determining the fair value of portfolio securities, unless the determination has been delegated to the Wells Fargo Asset Management Pricing Committee. The Board of Trustees retains the authority to make or ratify any valuation decisions or approve any changes to the Valuation Procedures as it deems appropriate. On a quarterly basis, the Board of Trustees receives reports on any valuation actions taken by the Valuation Committee or the Wells Fargo Asset Management Pricing Committee which may include items for ratification.
Wells Fargo Alternative Risk Premia Fund | 21
Consolidated notes to financial statements (unaudited)
Foreign currency translation
The accounting records of the Fund are maintained in U.S. dollars. The values of other assets and liabilities denominated in foreign currencies are translated into U.S. dollars at rates provided by an independent foreign currency pricing source at a time each business day specified by the Wells Fargo Asset Management Pricing Committee. Purchases and sales of securities, and income and expenses are converted at the rate of exchange on the respective dates of such transactions. Net realized foreign exchange gains or losses arise from sales of foreign currencies, currency gains or losses realized between the trade and settlement dates on securities transactions, and the difference between the amounts of dividends, interest and foreign withholding taxes recorded and the U.S. dollar equivalent of the amounts actually paid or received. Net unrealized foreign exchange gains and losses arise from changes in the fair value of assets and liabilities other than investments in securities resulting from changes in exchange rates. The changes in net assets arising from changes in exchange rates of securities and the changes in net assets resulting from changes in market prices of securities are not separately presented. Such changes are included in net realized and unrealized gains or losses from investments.
Forward foreign currency contracts
A forward foreign currency contract is an agreement between two parties to purchase or sell a specific currency for an agreed-upon price at a future date. The Fund enters into forward foreign currency contracts to facilitate transactions in foreign-denominated securities and to attempt to minimize the risk to the Fund from adverse changes in the relationship between currencies. Forward foreign currency contracts are recorded at the forward rate and marked-to-market daily. When the contracts are closed, realized gains and losses arising from such transactions are recorded as realized gains or losses on forward foreign currency contracts. The Fund is subject to foreign currency risk and may be exposed to risks if the counterparties to the contracts are unable to meet the terms of their contracts or if the value of the foreign currency changes unfavorably. The Fund's maximum risk of loss from counterparty credit risk is the unrealized gains on the contracts. This risk may be mitigated if there is a master netting arrangement between the Fund and the counterparty.
Futures contracts
Futures contracts are agreements between the Fund and a counterparty to buy or sell a specific amount of a commodity, financial instrument or currency at a specified price and on a specified date. The Fund may buy and sell futures contracts in order to gain exposure to, or protect against, changes in interest rates, security values, commodity prices and foreign exchange rates and is subject to interest rate risk, equity price risk, commodity price risk and foreign currency risk. The primary risks associated with the use of futures contracts are the imperfect correlation between changes in market values of securities held by the Fund and the prices of futures contracts, and the possibility of an illiquid market. Futures contracts are generally entered into on a regulated futures exchange and cleared through a clearinghouse associated with the exchange. With futures contracts, there is minimal counterparty risk to the Fund since futures contracts are exchange traded and the exchange’s clearinghouse, as the counterparty to all exchange traded futures, guarantees the futures contracts against default.
Upon entering into a futures contracts, the Fund is required to deposit either cash or securities (initial margin) with the broker in an amount equal to a certain percentage of the contract value. Subsequent payments (variation margin) are paid to or from the broker each day equal to the daily changes in the contract value. Such payments are recorded as unrealized gains or losses and, if any, shown as variation margin receivable (payable) in the Consolidated Statement of Assets and Liabilities. Should the Fund fail to make requested variation margin payments, the broker can gain access to the initial margin to satisfy the Fund’s payment obligations. When the contracts are closed, a realized gain or loss is recorded in the Consolidated Statement of Operations.
Swap contracts
Swap contracts are agreements between the Fund and a counterparty to exchange a series of cash flows over a specified period. Swap agreements are privately negotiated contracts between the Fund that are entered into as bilateral contracts in the OTC market (“OTC swaps”) or centrally cleared (“centrally cleared swaps”) with a central clearinghouse.
The Fund entered into OTC swaps. For OTC swaps, any upfront premiums paid and any upfront fees received are shown as swap premiums paid and swap premiums received, respectively, in the Consolidated Statement of Assets and Liabilities and amortized over the term of the contract. The daily fluctuations in market value are recorded as unrealized gains or losses on OTC swaps in the Consolidated Statement of Assets and Liabilities. Payments received or paid are recorded in the Consolidated Statement of Operations as realized gains or losses, respectively. When an OTC swap is terminated, a realized gain or loss is recorded in the Consolidated Statement of Operations equal to the difference between the proceeds from (or cost of) the closing transaction and the Fund’s basis in the contract, if any. Generally, the basis of the contract is the premium received or paid.
22 | Wells Fargo Alternative Risk Premia Fund
Consolidated notes to financial statements (unaudited)
Total return basket swaps
The Fund may enter into total return basket swap contracts to obtain exposure to a custom basket of long and short securities without owning such securities. The Fund has the ability to trade in and out of the long and short positions within the swap and receives the economic benefits and risks equivalent to direct investments in these positions. Under the terms of the contract, the Fund and the counterparty exchange periodic payments based on the total return of reference assets within a basket for a specified interest rate. Benefits and risks include capital appreciation (depreciation), corporate actions and dividends received and paid, all of which are reflected in the swap’s market value. The market value also includes interest charges and credits (“financing fees”) related to the notional values of the long and short positions and cash balances within the swap. To the extent the total return of the reference assets exceeds or falls short of the offsetting interest rate obligation, the Fund will receive a payment from, or make a payment to, the counterparty. Positions within the swap are reset periodically. During a reset, any unrealized appreciation (depreciation) on positions and accrued financing fees become available for cash settlement between the Fund and the counterparty. The amounts that are available for cash settlement are recorded as realized gains or losses on swap contracts in the Consolidated Statement of Operations. Cash settlement in and out of the swap may occur at a reset date or any other date, at the discretion of the Fund and the counterparty, over the life of the agreement. Certain swaps have no stated expiration and can be terminated by either party at any time.
The Fund is exposed to risks if the counterparty defaults on its obligation to perform, or if there are unfavorable changes in the fluctuation of interest rates or in the price of the reference securities in the basket. In addition to counterparty credit risk, the Fund is subject to liquidity risk if there is no market for the contracts and is exposed to the market risk associated with the reference securities in the basket.
Security transactions and income recognition
Securities transactions are recorded on a trade date basis. Realized gains or losses are recorded on the basis of identified cost.
Interest income is accrued daily and bond discounts are accreted and premiums are amortized daily. To the extent debt obligations are placed on non-accrual status, any related interest income may be reduced by writing off interest receivables when the collection of all or a portion of interest has been determined to be doubtful based on consistently applied procedures and the fair value has decreased. If the issuer subsequently resumes interest payments or when the collectability of interest is reasonably assured, the debt obligation is removed from non-accrual status.
Distributions to shareholders
Distributions to shareholders from net investment income and any net realized gains are recorded on the ex-dividend date and paid at least annually. Such distributions are determined in accordance with income tax regulations and may differ from U.S. generally accepted accounting principles. Dividend sources are estimated at the time of declaration. The tax character of distributions is determined as of the Fund’s fiscal year end. Therefore, a portion of the Fund’s distributions made prior to the Fund’s fiscal year end may be categorized as a tax return of capital at year end.
Federal and other taxes
The Fund intends to continue to qualify as a regulated investment company by distributing substantially all of its investment company taxable income and any net realized capital gains (after reduction for capital loss carryforwards) sufficient to relieve it from all, or substantially all, federal income taxes. Accordingly, no provision for federal income taxes was required.
The Subsidiary is classified as a controlled foreign corporation under Subchapter N of the Internal Revenue Code. Therefore, the Fund is required to increase its taxable income by its share of the Subsidiary’s income. Net investment losses of the Subsidiary cannot be deducted by the Fund in the current period nor carried forward to offset taxable income in future periods.
The Fund’s income and federal excise tax returns and all financial records supporting those returns for the fiscal years since commencement of operations are subject to examination by the federal and Delaware revenue authorities. Management has analyzed the Fund’s tax positions taken on federal, state, and foreign tax returns for all open tax years and does not believe that there are any uncertain tax positions that require recognition of a tax liability.
As of December 31, 2020, the aggregate cost of all investments for federal income tax purposes was $64,312,529 and the unrealized gains (losses) consisted of:
| Gross unrealized gains | $2,124,225 |
| Gross unrealized losses | (646,153) |
| Net unrealized gains | $1,478,072 |
Wells Fargo Alternative Risk Premia Fund | 23
Consolidated notes to financial statements (unaudited)
As of June 30, 2020, the Fund had capital loss carryforwards which consisted of $2,479,978 in short-term capital losses and $112,066 in long-term capital losses.
As of June 30, 2020, the Fund had a qualified late-year ordinary loss of $11,325,293 which was recognized on the first day of the current fiscal year.
Class allocations
The separate classes of shares offered by the Fund differ principally in administration fees. Class specific expenses are charged directly to that share class. Investment income, common fund-level expenses, and realized and unrealized gains (losses) on investments are allocated daily to each class of shares based on the relative proportion of net assets of each class.
4. FAIR VALUATION MEASUREMENTS
Fair value measurements of investments are determined within a framework that has established a fair value hierarchy based upon the various data inputs utilized in determining the value of the Fund’s investments. The three-level hierarchy gives the highest priority to unadjusted quoted prices in active markets for identical assets or liabilities (Level 1) and the lowest priority to unobservable inputs (Level 3). The Fund’s investments are classified within the fair value hierarchy based on the lowest level of input that is significant to the fair value measurement. The inputs are summarized into three broad levels as follows:
| ■ | Level 1 – quoted prices in active markets for identical securities |
| ■ | Level 2 – other significant observable inputs (including quoted prices for similar securities, interest rates, prepayment speeds, credit risk, etc.) |
| ■ | Level 3 – significant unobservable inputs (including the Fund’s own assumptions in determining the fair value of investments) |
The inputs or methodologies used for valuing investments in securities are not necessarily an indication of the risk associated with investing in those securities.
The following is a summary of the inputs used in valuing the Fund’s assets and liabilities as of December 31, 2020:
| | Quoted prices
(Level 1) | Other significant
observable inputs
(Level 2) | Significant
unobservable inpouts
(level 3) | Total |
| Assets | | | | |
| Investments in: | | | | |
| Short-term investments | | | | |
| Investment companies | $ 15,179,599 | $ 0 | $0 | $ 15,179,599 |
| U.S. Treasury securities | 49,717,898 | 0 | 0 | 49,717,898 |
| | 64,897,497 | 0 | 0 | 64,897,497 |
| Futures contracts | 1,335,880 | 0 | 0 | 1,335,880 |
| Forward foreign currency contracts | 0 | 716,030 | 0 | 716,030 |
| Swap contracts | 0 | 71,339 | 0 | 71,339 |
| Total assets | $66,233,377 | $787,369 | $0 | $67,020,746 |
| Liabilities | | | | |
| Futures contracts | $ 414,119 | $ 0 | $0 | $ 414,119 |
| Forward foreign currency contracts | 0 | 816,026 | 0 | 816,026 |
| Total liabilities | $ 414,119 | $816,026 | $0 | $ 1,230,145 |
Futures contracts and forward foreign currency contracts are reported at their cumulative unrealized gains (losses) at measurement date as reported in the tables following the Consolidated Portfolio of Investments. For futures contracts, the current day’s variation margin is reported on the Consolidated Statement of Assets and Liabilities. All other assets and liabilities are reported at their market value at measurement date.
For the six months ended December 31, 2020, the Fund did not have any transfers into/out of Level 3.
24 | Wells Fargo Alternative Risk Premia Fund
Consolidated notes to financial statements (unaudited)
5. TRANSACTIONS WITH AFFILIATES
Management fee
Funds Management, an indirect wholly owned subsidiary of Wells Fargo & Company (“Wells Fargo”), is the manager of the Fund and provides advisory and fund-level administrative services under an investment management agreement. Under the investment management agreement, Funds Management is responsible for, among other services, implementing the investment objectives and strategies of the Fund, supervising the subadvisers and providing fund-level administrative services in connection with the Fund’s operations. As compensation for its services under the investment management agreement, Funds Management is entitled to receive a management fee at the following annual rate based on the Fund’s average daily net assets:
| Average daily net assets | Management fee |
| First $500 million | 0.600% |
| Next $500 million | 0.575 |
| Next $2 billion | 0.550 |
| Next $2 billion | 0.525 |
| Next $5 billion | 0.490 |
| Over $10 billion | 0.480 |
For the six months ended December 31, 2020, the management fee was equivalent to an annual rate of 0.60% of the Fund’s average daily net assets.
The Subsidiary has entered into a separate advisory contract with Funds Management to manage the investment and reinvestment of its assets in conformity with its investment objectives and restrictions. Under this agreement, the Subsidiary does not pay Funds Management a fee for its services.
Funds Management has retained the services of certain subavisers to provide daily portfolio management to the Fund. The fee for subadvisory services is borne by Funds Management. Wells Capital Management Incorporated (“WellsCap”) and Wells Fargo Asset Management (International) Limited (“WFAM(I) Ltd”), each an affiliate of Funds Management and an indirect wholly owned subsidiary of Wells Fargo, serve as subadvisers to the Fund. WellsCap receives a subadvisory fee at an annual rate starting at 0.20% and declining to 0.10% as the average daily net assets of the Fund increase. WFAM(I) Ltd receives a subadvisory fee for its asset allocation services at an annual rate of 0.10% of the Fund’s average daily net assets and a fee for portfolio management services on the assets it co-manages with WellsCap at an annual rate starting at 0.15% and declining to 0.075%.
Administration fees
Under a class-level administration agreement, Funds Management provides class-level administrative services to the Fund, which includes paying fees and expenses for services provided by the transfer agent, sub-transfer agents, omnibus account servicers and record-keepers. As compensation for its services under the class-level administration agreement, Funds Management receives an annual fee which is calculated based on the average daily net assets of each class as follows:
| | Class-level
administration fee |
| Class R6 | 0.03% |
| Institutional Class | 0.13 |
Waivers and/or expense reimbursements
Funds Management has contractually waived and/or reimbursed management and administration fees to the extent necessary to maintain certain net operating expense ratios for the Fund. When each class of the Fund has exceeded its expense cap, Funds Management has waived fees and/or reimbursed expenses from fund-level expenses on a proportionate basis and then from class specific expenses. When only certain classes exceed their expense caps, waivers and/or reimbursements are applied against class specific expenses before fund-level expenses. Funds Management has committed through October 31, 2021 to waive fees and/or reimburse expenses to the extent necessary to cap the Fund’s expenses at 0.62% for Class R6 shares and 0.72% for Institutional Class shares. Prior to or after the commitment expiration date, the cap may be increased or the commitment to maintain the cap may be terminated only with the approval of the Board of Trustees.
Wells Fargo Alternative Risk Premia Fund | 25
Consolidated notes to financial statements (unaudited)
Interfund transactions
The Fund may purchase or sell portfolio investment securities to certain other Wells Fargo affiliates pursuant to Rule 17a-7 under the 1940 Act and under procedures adopted by the Board of Trustees. The procedures have been designed to ensure that these interfund transactions, which do not incur broker commissions, are effected at current market prices.
6. INVESTMENT PORTFOLIO TRANSACTIONS
For the six months ended December 31, 2020, the Fund did not have any purchases and sales of securities, excluding any short-term securities.
7. DERIVATIVE TRANSACTIONS
During the six months ended December 31, 2020, the Fund entered into futures contracts, forward foreign currency contracts, and swap contracts to gain market exposure as a substitute for taking a position in the underlying security or basket of securities aiming to achieve Fund's risk return objective.
The volume of the Fund's derivative activity during the six months ended December 31, 2020 was as follows:
| Futures contracts | |
| Average notional balance on long futures | $120,041,485 |
| Average notional balance on short futures | 73,346,780 |
| Forward foreign currency contracts | |
| Average contract amounts to buy | $ 99,818,422 |
| Average contract amounts to sell | 76,865,265 |
| Swap contracts | |
| Average notional balance | $ $8,009,073 |
The Fund's swap transactions may contain provisions for early termination in the event the net assets of the Fund declines below specific levels identified by the counterparty. If these levels are triggered, the counterparty may terminate the transaction and seek payment or request full collateralization of the derivative transactions in net liability positions.
A summary of the location of derivative instruments on the financial statements by primary risk exposure is outlined in the following tables.
The fair value of derivative instruments as of December 31, 2020 by risk type was as follows for the Fund:
| | Asset derivatives | | Liability derivatives |
| | Consolidated Statement of
Assets and Liabilities location | Fair value | | Consolidated Statement of
Assets and Liabilities location | Fair value |
| Interest rate risk | Unrealized gains on futures contracts | $ 55,293* | | Unrealized losses on futures contracts | $ 77,271* |
| Commodity risk | Unrealized gains on futures contracts | 1,165,892* | | Unrealized losses on futures contracts | 314,755* |
| Equity risk | Unrealized gains on futures contracts | 114,695* | | Unrealized losses on futures contracts | 22,093* |
| | Unrealized gains on swaps contracts | 71,339* | | Unrealized losses on swaps contracts | 0* |
| Foreign currency risk | Unrealized gains on forward foreign currency contracts | 716,030* | | Unrealized losses on forward foreign currency contracts | 816,026* |
| | | $2,123,249 | | | $1,230,145 |
* Amount represents the cumulative unrealized gains (losses) as reported in the tables following the Consolidated Portfolio of Investments. For futures contracts, only the current day's variation margin as of December 31, 2020 is reported separately on the Consolidated Statement of Assets and Liabilities.
26 | Wells Fargo Alternative Risk Premia Fund
Consolidated notes to financial statements (unaudited)
The effect of derivative instruments on the Consolidated Statement of Operations for the six months ended December 31, 2020 was as follows for the Fund:
| | Amount of realized gains (losses) on derivatives |
| | Futures
contracts | Forward
foreign
currency
contracts | Swap
contracts | Total |
| Interest rate risk | $(1,167,590) | $ 0 | $ 0 | $ (1,167,590) |
| Commodity risk | 827,555 | 0 | 0 | 827,555 |
| Equity risk | 150,055 | 0 | (2,346,382) | (2,196,327) |
| Foreign currency risk | 0 | (59,593) | 0 | (59,593) |
| | $ (189,980) | $(59,593) | $(2,346,382) | $(2,595,955) |
| | Change in unrealized gains (losses) on derivatives |
| | Futures
contracts | Forward
foreign
currency
contracts | Swap
contracts | Total |
| Interest rate risk | $ 241,290 | $ 0 | $ 0 | $ 241,290 |
| Commodity risk | 976,179 | 0 | 0 | 976,179 |
| Equity risk | 13,328 | 0 | (87,906) | (74,578) |
| Foreign currency risk | 0 | 423,608 | 0 | 423,608 |
| | $1,230,797 | $423,608 | $(87,906) | $1,566,499 |
For certain types of derivative transactions, the Fund has entered into International Swaps and Derivatives Association, Inc. master agreements (“ISDA Master Agreements”) or similar agreements with approved counterparties. The ISDA Master Agreements or similar agreements may have requirements to deliver/deposit securities or cash to/with an exchange or broker-dealer as collateral and allows the Fund to offset, with each counterparty, certain derivative financial instrument’s assets and/or liabilities with collateral held or pledged. Collateral requirements differ by type of derivative. Collateral or margin requirements are set by the broker or exchange clearinghouse for exchange traded derivatives while collateral terms are contract specific for over-the-counter traded derivatives. Cash collateral that has been pledged to cover obligations of the Fund under ISDA Master Agreements or similar agreements, if any, are reported separately in the Consolidated Statement of Assets and Liabilities. Securities pledged as collateral, if any, are noted in the Consolidated Portfolio of Investments. With respect to balance sheet offsetting, absent an event of default by the counterparty or a termination of the agreement, the reported amounts of financial assets and financial liabilities in the Consolidated Statement of Assets and Liabilities are not offset across transactions between the Fund and the applicable counterparty. A reconciliation of the gross amounts on the Consolidated Statement of Assets and Liabilities to the net amounts by counterparty, including any collateral exposure, for OTC derivatives is as follows:
| Counterparty | Gross amounts
of assets in the
Consolidated
Statement of
Assets and
Liabilities | Amounts
subject to
netting
agreements | Collateral
received | Net amount
of assets |
| Goldman Sachs International | $787,369 | $(787,369) | $0 | $0 |
Wells Fargo Alternative Risk Premia Fund | 27
Consolidated notes to financial statements (unaudited)
| Counterparty | Gross amounts
of liabilities in the
Consolidated
Statement of
Assets and
Liabilities | Amounts
subject to
netting
agreements | Collateral
pledged1 | Net amount
of liabilities |
| Goldman Sachs International | $816,026 | $(787,369) | $(28,657) | $0 |
| 1 | Collateral pledged within this table is limited to the collateral for the net transaction with the counterparty. |
8. BANK BORROWINGS
The Trust (excluding the money market funds), Wells Fargo Master Trust and Wells Fargo Variable Trust are parties to a $350,000,000 revolving credit agreement whereby the Fund is permitted to use bank borrowings for temporary or emergency purposes, such as to fund shareholder redemption requests. Interest under the credit agreement is charged to the Fund based on a borrowing rate equal to the higher of the Federal Funds rate in effect on that day plus 1.25% or the overnight LIBOR rate in effect on that day plus 1.25%. In addition, an annual commitment fee equal to 0.25% of the unused balance is allocated to each participating fund.
For the six months ended December 31, 2020, there were no borrowings by the Fund under the agreement.
9. INDEMNIFICATION
Under the Fund's organizational documents, the officers and Trustees have been granted certain indemnification rights against certain liabilities that may arise out of performance of their duties to the Fund. The Fund has entered into a separate agreement with each Trustee that converts indemnification rights currently existing under the Fund’s organizational documents into contractual rights that cannot be changed in the future without the consent of the Trustee. Additionally, in the normal course of business, the Fund may enter into contracts with service providers that contain a variety of indemnification clauses. The Fund’s maximum exposure under these arrangements is dependent on future claims that may be made against the Fund and, therefore, cannot be estimated.
10. NEW ACCOUNTING PRONOUNCEMENT
In August 2018, FASB issued Accounting Standards Update (“ASU”) No. 2018-13, Fair Value Measurement (Topic 820) Disclosure Framework - Changes to the Disclosure Requirements for Fair Value Measurement. ASU 2018-13 updates the disclosure requirements on fair value measurements in Topic 820, Fair Value Measurements. The amendments are effective for fiscal years, and interim periods within those fiscal years, beginning after December 15, 2019. Management has adopted this guidance which did not have a material impact on the financial statements.
11. SUBSEQUENT EVENT
On February 23, 2021, Wells Fargo announced that it has entered into a definitive agreement to sell Wells Fargo Asset Management (“WFAM”) to GTCR LLC and Reverence Capital Partners, L.P. WFAM is the trade name used by the asset management businesses of Wells Fargo and includes Wells Fargo Funds Management, LLC, the investment manager to the Fund, Wells Capital Management Incorporated and Wells Fargo Asset Management (International) Limited, both registered investment advisers providing sub-advisory services to certain funds, and Wells Fargo Funds Distributor, LLC, the Fund’s principal underwriter. As part of the transaction, Wells Fargo will own a 9.9% equity interest and will continue to serve as an important client and distribution partner.
Consummation of the transaction will result in the automatic termination of the Fund’s investment management agreement and sub-advisory agreement(s). The Fund’s Board of Trustees will be asked to approve new investment management arrangements with the new company. If approved by the Board, the new investment management arrangements with the new company will be presented to the shareholders of the Fund for approval, and, if approved by shareholders, would take effect upon the closing of the transaction. The transaction is expected to close in the second half of 2021, subject to customary closing conditions.
12. CORONAVIRUS (COVID-19) PANDEMIC
On March 11, 2020, the World Health Organization announced that it had made the assessment that coronavirus disease 2019 (“COVID-19”) is a pandemic. The impacts of COVID-19 are affecting the entire global economy, individual companies and investment products, and the market in general. There is significant uncertainty around the extent and duration of business
28 | Wells Fargo Alternative Risk Premia Fund
Consolidated notes to financial statements (unaudited)
disruptions related to COVID-19 and the impacts may be short term or may last for an extended period of time. The risk of further spreading of COVID-19 has led to significant uncertainty and volatility in the financial markets.
Wells Fargo Alternative Risk Premia Fund | 29
Other information (unaudited)
PROXY VOTING INFORMATION
A description of the policies and procedures used to determine how to vote proxies relating to portfolio securities is available without charge, upon request, by calling 1-800-222-8222, visiting our website at wfam.com, or visiting the SEC website at sec.gov. Information regarding how the proxies related to portfolio securities were voted during the most recent 12-month period ended June 30 is available on the website at wfam.com or by visiting the SEC website at sec.gov.
QUARTERLY PORTFOLIO HOLDINGS INFORMATION
The Fund files its complete schedule of portfolio holdings with the SEC for the first and third quarters of each fiscal year as an exhibit to its reports on Form N-PORT. Shareholders may view the filed Form N-PORT by visiting the SEC website at sec.gov.
30 | Wells Fargo Alternative Risk Premia Fund
Other information (unaudited)
BOARD OF TRUSTEES AND OFFICERS
Each of the Trustees and Officers1 listed in the table below acts in identical capacities for each fund in the Wells Fargo family of funds, which consists of 144 mutual funds comprising the Wells Fargo Funds Trust, Wells Fargo Variable Trust, Wells Fargo Master Trust and four closed-end funds (collectively the “Fund Complex”). This table should be read in conjunction with the Prospectus and the Statement of Additional Information2. The mailing address of each Trustee and Officer is 525 Market Street, 12th Floor, San Francisco, CA 94105. Each Trustee and Officer serves an indefinite term, however, each Trustee serves such term until reaching the mandatory retirement age established by the Trustees.
Independent Trustees
Name and
year of birth | Position held and
length of service* | Principal occupations during past five years or longer | Current other
public company or
investment
company
directorships |
William R. Ebsworth
(Born 1957) | Trustee,
since 2015 | Retired. From 1984 to 2013, equities analyst, portfolio manager, research director and chief investment officer at Fidelity Management and Research Company in Boston, Tokyo, and Hong Kong, and retired in 2013 as Chief Investment Officer of Fidelity Strategic Advisers, Inc. where he led a team of investment professionals managing client assets. Prior thereto, Board member of Hong Kong Securities Clearing Co., Hong Kong Options Clearing Corp., the Thailand International Fund, Ltd., Fidelity Investments Life Insurance Company, and Empire Fidelity Investments Life Insurance Company. Audit Committee Chair and Investment Committee Chair of the Vincent Memorial Hospital Endowment (non-profit organization). Mr. Ebsworth is a CFA® charterholder. | N/A |
Jane A. Freeman
(Born 1953) | Trustee,
since 2015;
Chair Liaison,
since 2018 | Retired. From 2012 to 2014 and 1999 to 2008, Chief Financial Officer of Scientific Learning Corporation. From 2008 to 2012, Ms. Freeman provided consulting services related to strategic business projects. Prior to 1999, Portfolio Manager at Rockefeller & Co. and Scudder, Stevens & Clark. Board member of the Harding Loevner Funds from 1996 to 2014, serving as both Lead Independent Director and chair of the Audit Committee. Board member of the Russell Exchange Traded Funds Trust from 2011 to 2012 and the chair of the Audit Committee. Ms. Freeman is also an inactive Chartered Financial Analyst. | N/A |
Isaiah Harris, Jr.
(Born 1952) | Trustee,
since 2009; Audit
Committee
Chair,
since 2019 | Retired. Chairman of the Board of CIGNA Corporation since 2009, and Director since 2005. From 2003 to 2011, Director of Deluxe Corporation. Prior thereto, President and CEO of BellSouth Advertising and Publishing Corp. from 2005 to 2007, President and CEO of BellSouth Enterprises from 2004 to 2005 and President of BellSouth Consumer Services from 2000 to 2003. Emeritus member of the Iowa State University Foundation Board of Governors. Emeritus Member of the Advisory Board of Iowa State University School of Business. Advisory Board Member, Palm Harbor Academy (private school). Mr. Harris is a certified public accountant (inactive status). | CIGNA Corporation |
Judith M. Johnson
(Born 1949) | Trustee,
since 2008 | Retired. Prior thereto, Chief Executive Officer and Chief Investment Officer of Minneapolis Employees Retirement Fund from 1996 to 2008. Ms. Johnson is an attorney, certified public accountant and a certified managerial accountant. | N/A |
David F. Larcker
(Born 1950) | Trustee,
since 2009 | James Irvin Miller Professor of Accounting at the Graduate School of Business (Emeritus), Stanford University, Director of the Corporate Governance Research Initiative and Senior Faculty of The Rock Center for Corporate Governance since 2006. From 2005 to 2008, Professor of Accounting at the Graduate School of Business, Stanford University. Prior thereto, Ernst & Young Professor of Accounting at The Wharton School, University of Pennsylvania from 1985 to 2005. | N/A |
Wells Fargo Alternative Risk Premia Fund | 31
Other information (unaudited)
Name and
year of birth | Position held and
length of service* | Principal occupations during past five years or longer | Current other
public company or
investment
company
directorships |
Olivia S. Mitchell
(Born 1953) | Trustee,
since 2006;
Nominating and
Governance
Committee Chair,
since 2018 | International Foundation of Employee Benefit Plans Professor, Wharton School of the University of Pennsylvania since 1993. Director of Wharton’s Pension Research Council and Boettner Center on Pensions & Retirement Research, and Research Associate at the National Bureau of Economic Research. Previously, Cornell University Professor from 1978 to 1993. | N/A |
Timothy J. Penny
(Born 1951) | Trustee,
since 1996;
Chair,
since 2018 | President and Chief Executive Officer of Southern Minnesota Initiative Foundation, a non-profit organization, since 2007. Member of the Board of Trustees of NorthStar Education Finance, Inc., a non-profit organization, since 2007. | N/A |
James G. Polisson
(Born 1959) | Trustee,
since 2018 | Retired. Chief Marketing Officer, Source (ETF) UK Services, Ltd, from 2015 to 2017. From 2012 to 2015, Principal of The Polisson Group, LLC, a management consulting, corporate advisory and principal investing company. Chief Executive Officer and Managing Director at Russell Investments, Global Exchange Traded Funds from 2010 to 2012. Managing Director of Barclays Global Investors from 1998 to 2010 and Global Chief Marketing Officer for iShares and Barclays Global Investors from 2000 to 2010. Trustee of the San Francisco Mechanics’ Institute, a non-profit organization, from 2013 to 2015. Board member of the Russell Exchange Traded Fund Trust from 2011 to 2012. Director of Barclays Global Investors Holdings Deutschland GmbH from 2006 to 2009. Mr. Polisson is an attorney and has a retired status with the Massachusetts and District of Columbia Bar Associations. | N/A |
Pamela Wheelock
(Born 1959) | Trustee,
since January
2020; previously
Trustee from
January 2018 to
July 2019 | Board member of the Destination Medical Center Economic Development Agency, Rochester, Minnesota since 2019. Interim President of the McKnight Foundation from January to September 2020. Acting Commissioner, Minnesota Department of Human Services, July 2019 through September 2019. Human Services Manager (part-time), Minnesota Department of Human Services, October 2019 through December 2019. Chief Operating Officer, Twin Cities Habitat for Humanity from 2017 to 2019. Vice President of University Services, University of Minnesota from 2012 to 2016. Prior thereto, on the Board of Directors, Governance Committee and Finance Committee for the Minnesota Philanthropy Partners (Saint Paul Foundation) from 2012 to 2018, Interim Chief Executive Officer of Blue Cross Blue Shield of Minnesota from 2011 to 2012, Chairman of the Board from 2009 to 2012 and Board Director from 2003 to 2015. Vice President, Leadership and Community Engagement, Bush Foundation, Saint Paul, Minnesota (a private foundation) from 2009 to 2011. Executive Vice President and Chief Financial Officer, Minnesota Sports and Entertainment from 2004 to 2009 and Senior Vice President from 2002 to 2004. Executive Vice President of the Minnesota Wild Foundation from 2004 to 2008. Commissioner of Finance, State of Minnesota, from 1999 to 2002. Currently Board Chair of the Minnesota Wild Foundation since 2010. | N/A |
* Length of service dates reflect the Trustee’s commencement of service with the Trust’s predecessor entities, where applicable.
32 | Wells Fargo Alternative Risk Premia Fund
Other information (unaudited)
Officers
Name and
year of birth | Position held and
length of service | Principal occupations during past five years or longer |
Andrew Owen
(Born 1960) | President,
since 2017 | Executive Vice President of Wells Fargo & Company and Head of Affiliated Managers, Wells Fargo Asset Management, since 2014. In addition, Mr. Owen is currently President, Chief Executive Officer and Director of Wells Fargo Funds Management, LLC since 2017. Prior thereto, Executive Vice President responsible for marketing, investments and product development for Wells Fargo Funds Management, LLC, from 2009 to 2014. |
Jeremy DePalma1
(Born 1974) | Treasurer,
since 2012 | Senior Vice President of Wells Fargo Funds Management, LLC since 2009. Senior Vice President of Evergreen Investment Management Company, LLC from 2008 to 2010 and head of the Fund Reporting and Control Team within Fund Administration from 2005 to 2010. |
Michelle Rhee
(Born 1966) | Chief Legal Officer,
since 2019 | Secretary of Wells Fargo Funds Management, LLC and Chief Legal Counsel of Wells Fargo Asset Management since 2018. Deputy General Counsel of Wells Fargo Bank, N.A. since 2020 and Assistant General Counsel of Wells Fargo Bank, N.A. from 2018 to 2020. Associate General Counsel and Managing Director of Bank of America Corporation from 2004 to 2018. |
Catherine Kennedy
(Born 1969) | Secretary,
since 2019 | Vice President of Wells Fargo Funds Management, LLC and Senior Counsel of the Wells Fargo Legal Department since 2010. Vice President and Senior Counsel of Evergreen Investment Management Company, LLC from 1998 to 2010. |
Michael H. Whitaker
(Born 1967) | Chief Compliance Officer,
since 2016 | Chief Compliance Officer of Wells Fargo Asset Management since 2016. Senior Vice President and Chief Compliance Officer for Fidelity Investments from 2007 to 2016. |
1 Jeremy DePalma acts as Treasurer of 77 funds in the Fund Complex.
2 The Statement of Additional Information includes additional information about the Trustees and is available, without charge, upon request, by calling 1-800-222-8222 or by visiting the website at wfam.com.
Wells Fargo Alternative Risk Premia Fund | 33
For more information
More information about Wells Fargo Funds is available free upon request. To obtain literature, please write, visit the Fund's website, or call:
Wells Fargo Funds
P.O. Box 219967
Kansas City, MO 64121-9967
Website: wfam.com
Individual investors: 1-800-222-8222
Retail investment professionals: 1-888-877-9275
Institutional investment professionals: 1-866-765-0778
This report and the financial statements contained herein are submitted for the general information of the shareholders of the Fund. If this report is used for promotional purposes, distribution of the report must be accompanied or preceded by a current prospectus. Before investing, please consider the investment objectives, risks, charges, and expenses of the investment. For a current prospectus and, if available, a summary prospectus, containing this information, call 1-800-222-8222 or visit the Fund’s website at wfam.com. Read the prospectus carefully before you invest or send money.
Wells Fargo Asset Management (WFAM) is the trade name for certain investment advisory/management firms owned by Wells Fargo & Company. These firms include but are not limited to Wells Capital Management Incorporated and Wells Fargo Funds Management, LLC. Certain products managed by WFAM entities are distributed by Wells Fargo Funds Distributor, LLC (a broker-dealer and Member FINRA).
This material is for general informational and educational purposes only and is NOT intended to provide investment advice or a recommendation of any kind— including a recommendation for any specific investment, strategy, or plan.
INVESTMENT PRODUCTS: NOT FDIC INSURED ■ NO BANK GUARANTEE ■ MAY LOSE VALUE
© 2021 Wells Fargo & Company. All rights reserved.
PAR-0121-00271 02-21
SA295/SAR295 12-20
Not applicable.
| ITEM 3. | AUDIT COMMITTEE FINANCIAL EXPERT |
Not applicable.
| ITEM 4. | PRINCIPAL ACCOUNTANT FEES AND SERVICES |
Not applicable.
| ITEM 5. | AUDIT COMMITTEE OF LISTED REGISTRANTS |
Not applicable.
A Portfolio of Investments for each series of Wells Fargo Funds Trust is included as part of the report to shareholders filed under Item 1 of this Form.
ITEM 7. DISCLOSURE OF PROXY VOTING POLICIES AND PROCEDURES FOR CLOSED-END MANAGEMENT
INVESTMENT COMPANIES
Not applicable.
ITEM 8. PORTFOLIO MANAGERS OF CLOSED-END MANAGEMENT INVESTMENT COMPANIES
Not applicable.
ITEM 9. PURCHASES OF EQUITY SECURITIES BY CLOSED-END MANAGEMEENT INVESTMENT COMPANY AND
AFFILIATED PURCHASERS
Not applicable.
| ITEM 10. | SUBMISSION OF MATTERS TO A VOTE OF SECURITY HOLDERS |
There have been no material changes to the procedures by which shareholders may recommend nominees to the registrant’s Board of Trustees that have been implemented since the registrant’s last provided disclosure in response to the requirements of this Item.
| ITEM 11. | CONTROLS AND PROCEDURES |
(a) The President and Treasurer have concluded that the Wells Fargo Funds Trust disclosure controls and procedures (as defined in Rule 30a-3(c) under the Investment Company Act of 1940) provide reasonable assurances that material information relating to the registrant is made known to them by the appropriate persons, based on their evaluation of these controls and procedures as of a date within 90 days of the filing of this report.
(b) There were no significant changes in the registrant’s internal controls over financial reporting (as defined in Rule 30a-3(d) under the Investment Company Act of 1940) that occurred during the most recent fiscal half-year of the period covered by this report that materially affected, or is reasonably likely to materially affect, the registrant’s internal control over financial reporting.
ITEM 12. DISCLOSURES OF SECURITIES LENDING ACTIVITES FOR CLOSED-END MANAGEMENT INVESTMENT COMPANIES
Not applicable.
(a)(1) Not applicable.
(a)(2) Certifications pursuant to Section 302 of the Sarbanes-Oxley Act of 2002.
(b) Certifications pursuant to Section 906 of the Sarbanes-Oxley Act of 2002.
SIGNATURES
Pursuant to the requirements of the Securities Exchange Act of 1934 and the Investment Company Act of 1940, the registrant has duly caused this report to be signed on its behalf by the undersigned, thereunto duly authorized.
| | |
Wells Fargo Funds Trust |
| |
By: | | |
| | /s/ Andrew Owen |
| |
| | Andrew Owen |
| | President |
|
Date: February 25, 2021 |
Pursuant to the requirements of the Securities Exchange Act of 1934 and the Investment Company Act of 1940, this report has been signed below by the following persons on behalf of the registrant and in the capacities and on the date indicated.
| | |
| Wells Fargo Funds Trust |
| |
| By: | | |
| | /s/ Andrew Owen |
| |
| | Andrew Owen |
| | President |
|
| Date: February 25, 2021 |
| |
| By: | | |
| | /s/ Nancy Wiser |
| |
| | Nancy Wiser |
| | Treasurer |
|
| Date: February 25, 2021 |
| |
| By: | | |
| | /s/ Jeremy DePalma |
| |
| | Jeremy DePalma |
| | Treasurer |
|
| Date: February 25, 2021 |