UNITED STATES
SECURITIES AND EXCHANGE COMMISSION
Washington, D.C. 20549
FORM N-CSRS
CERTIFIED SHAREHOLDER REPORT OF REGISTERED
MANAGEMENT INVESTMENT COMPANIES
Investment Company Act file number: 811-09253
Wells Fargo Funds Trust
(Exact name of registrant as specified in charter)
525 Market St., San Francisco, CA 94105
(Address of principal executive offices) (Zip code)
Catherine Kennedy
Wells Fargo Funds Management, LLC
525 Market St., San Francisco, CA 94105
(Name and address of agent for service)
Registrant’s telephone number, including area code: 800-222-8222
Date of fiscal year end: August 31
Registrant is making a filing for 9 of its series:
Wells Fargo Adjustable Rate Government Fund, Wells Fargo Conservative Income Fund, Wells Fargo Government Securities Fund, Wells Fargo High Yield Bond Fund, Wells Fargo Core Plus Bond Fund, Wells Fargo Short Duration Government Bond Fund, Wells Fargo Short-Term Bond Plus Fund, Wells Fargo Short-Term High Yield Bond Fund, and Wells Fargo Ultra Short-Term Income Fund.
Date of reporting period: February 28, 2021
ITEM 1. REPORT TO STOCKHOLDERS
Semi-Annual Report
February 28, 2021
Wells Fargo
Adjustable Rate Government Fund
Reduce clutter.
Save trees.
Sign up for electronic delivery of prospectuses and shareholder reports at wellsfargo.com/ advantagedelivery
The views expressed and any forward-looking statements are as of February 28, 2021, unless otherwise noted, and are those of the Fund's portfolio managers and/or Wells Fargo Asset Management. Discussions of individual securities or the markets generally are not intended as individual recommendations. Future events or results may vary significantly from those expressed in any forward-looking statements. The views expressed are subject to change at any time in response to changing circumstances in the market. Wells Fargo Asset Management and the Fund disclaim any obligation to publicly update or revise any views expressed or forward-looking statements.
INVESTMENT PRODUCTS: NOT FDIC INSURED ■ NO BANK GUARANTEE ■ MAY LOSE VALUE
Wells Fargo Adjustable Rate Government Fund | 1
Letter to shareholders (unaudited)
Andrew Owen
President
Wells Fargo Funds
Dear Shareholder:
We are pleased to offer you this semi-annual report for the Wells Fargo Adjustable Rate Government Fund for the six-month period that ended February 28, 2021. Global stocks showed robust returns, as the global economy began emerging from the haze of COVID-19. Tailwinds were provided by global stimulus programs, a rapid vaccination rollout, and recovering consumer and corporate sentiment. Bonds also had positive returns, led by high-yield bonds.
For the six-month period, U.S. stocks, based on the S&P 500 Index,1 gained 9.74%. International stocks, as measured by the MSCI ACWI ex USA Index (Net),2 returned 16.65%, while the MSCI EM Index (Net),3 had even stronger performance, with a 22.32% gain. Among bond indexes, the Bloomberg Barclays U.S. Aggregate Bond Index,4 returned (1.55)%, the Bloomberg Barclays Global Aggregate ex-USD Index (unhedged),5 gained 1.41%, and the Bloomberg Barclays Municipal Bond Index,6 returned 0.86% while the ICE BofA U.S. High Yield Index,7 gained 6.14%.
Hope drove the stock markets to new highs.
Stocks grew more volatile in September on mixed economic data. U.S. economic activity continued to grow. However, U.S. unemployment remained elevated at 7.9% in September. With U.S. Congress delaying further fiscal relief and uncertainties surrounding a possible vaccine, doubts crept back into the financial markets. In the U.K., a lack of progress in Brexit talks weighed on markets. China’s economy picked up steam, fueled by increased global demand.
In October, capital markets stepped back from their six-month rally. Market volatility rose in advance of the U.S. election and amid a global increase in COVID-19 infections. Europe introduced tighter restrictions affecting economic activity. U.S. markets looked favorably at the prospect of Democratic control of the federal purse strings, which could lead to additional fiscal stimulus and a boost to economic activity. Meanwhile, China reported 4.9% third-quarter gross domestic product growth.
| 1 | The S&P 500 Index consists of 500 stocks chosen for market size, liquidity, and industry group representation. It is a market-value-weighted index with each stock's weight in the index proportionate to its market value. You cannot invest directly in an index. |
| 2 | The Morgan Stanley Capital International (MSCI) All Country World Index (ACWI) ex USA Index (Net) is a free-float-adjusted market-capitalization-weighted index that is designed to measure the equity market performance of developed and emerging markets, excluding the United States. Source: MSCI. MSCI makes no express or implied warranties or representations and shall have no liability whatsoever with respect to any MSCI data contained herein. The MSCI data may not be further redistributed or used as a basis for other indices or any securities or financial products. This report is not approved, reviewed, or produced by MSCI. You cannot invest directly in an index. |
| 1 | The S&P 500 Index consists of 500 stocks chosen for market size, liquidity, and industry group representation. It is a market-value-weighted index with each stock's weight in the index proportionate to its market value. You cannot invest directly in an index. |
| 3 | The MSCI Emerging Markets (EM) Index (Net) is a free-float-adjusted market-capitalization-weighted index that is designed to measure equity market performance of emerging markets. You cannot invest directly in an index. |
| 1 | The S&P 500 Index consists of 500 stocks chosen for market size, liquidity, and industry group representation. It is a market-value-weighted index with each stock's weight in the index proportionate to its market value. You cannot invest directly in an index. |
| 4 | The Bloomberg Barclays U.S. Aggregate Bond Index is a broad-based benchmark that measures the investment-grade, U.S. dollar-denominated, fixed-rate taxable bond market, including Treasuries, government-related and corporate securities, mortgage-backed securities (agency fixed-rate and hybrid adjustable-rate mortgage pass-throughs), asset-backed securities, and commercial mortgage-backed securities. You cannot invest directly in an index. |
| 1 | The S&P 500 Index consists of 500 stocks chosen for market size, liquidity, and industry group representation. It is a market-value-weighted index with each stock's weight in the index proportionate to its market value. You cannot invest directly in an index. |
| 5 | The Bloomberg Barclays Global Aggregate ex-USD Index (unhedged) is an unmanaged index that provides a broad-based measure of the global investment-grade fixed-income markets excluding the U.S. dollar-denominated debt market. You cannot invest directly in an index. |
| 1 | The S&P 500 Index consists of 500 stocks chosen for market size, liquidity, and industry group representation. It is a market-value-weighted index with each stock's weight in the index proportionate to its market value. You cannot invest directly in an index. |
| 6 | The Bloomberg Barclays Municipal Bond Index is an unmanaged index composed of long-term tax-exempt bonds with a minimum credit rating of Baa. You cannot invest directly in an index. |
| 1 | The S&P 500 Index consists of 500 stocks chosen for market size, liquidity, and industry group representation. It is a market-value-weighted index with each stock's weight in the index proportionate to its market value. You cannot invest directly in an index. |
| 7 | The ICE BofA U.S. High Yield Index is a market-capitalization-weighted index of domestic and Yankee high-yield bonds. The index tracks the performance of high-yield securities traded in the U.S. bond market. You cannot invest directly in an index. Copyright 2021. ICE Data Indices, LLC. All rights reserved. |
2 | Wells Fargo Adjustable Rate Government Fund
Letter to shareholders (unaudited)
Global stocks rallied in November, propelled by optimism over three promising COVID-19 vaccines. Reversing recent trends, value stocks outperformed growth stocks and cyclical stocks outpaced technology stocks. However, U.S. unemployment remained elevated, with a net job loss of 10 million since February 2020. The eurozone services Purchasing Managers’ Index, a monthly survey of purchasing managers, contracted sharply while the region’s manufacturing activity grew. The U.S. election results added to the upbeat mood as investors anticipated more consistent policies in the new administration.
Financial markets ended the year with strength on high expectations for a rapid rollout of the COVID-19 vaccines, the successful passage of a $900 billion stimulus package, and rising expectations of additional economic support from a Democratic-led Congress. U.S. economic data were mixed with still-elevated unemployment and weak retail sales but growth in manufacturing output. In contrast, China’s economic expansion continued in both manufacturing and nonmanufacturing. U.S. COVID-19 infection rates continued to rise even as new state and local lockdown measures were implemented.
The year 2021 began with emerging market stocks leading all major asset classes in January, driven by China’s strong economic growth and a broad recovery in corporate earnings, which propelled China’s stock market higher. In the United States, positive news on vaccine trials and January's expansion in both the manufacturing and services sectors was offset by a weak December monthly jobs report. This was compounded by technical factors as some hedge funds were forced to sell stocks to protect themselves against a well-publicized short squeeze coordinated by a group of retail investors. Eurozone sentiment and economic growth were particularly weak, reflecting the impact of a new lockdown with stricter social distancing along with a slow vaccine rollout.
February saw major domestic equity indexes driven higher on the hope of a new stimulus bill, improving COVID-19 vaccination numbers, and the gradual reopening of the economy. Most S&P 500 companies reported better-than-expected earnings, with positive surprises coming from the financials, IT, health care, and materials sectors. Japan saw its economy strengthen as a result of strong export numbers. Meanwhile, crude oil prices continued their climb, rising more than 25% for the year. Domestic government bonds experienced a sharp sell-off in late February as markets priced in a more robust economic recovery and higher growth and inflation expectations.
Don’t let short-term uncertainty derail long-term investment goals.
Periods of investment uncertainty can present challenges, but experience has taught us that maintaining long-term investment goals can be an effective way to plan for the future. To help you create a sound strategy based on your personal goals and risk tolerance, Wells Fargo Funds offers more than 100 mutual funds spanning a wide range of asset classes and investment styles. Although diversification cannot guarantee an investment profit or prevent losses, we believe it can be an effective way to manage investment risk and potentially smooth out overall portfolio performance. We encourage investors to know their investments and to understand that appropriate levels of risk-taking may unlock opportunities.
Thank you for choosing to invest with Wells Fargo Funds. We appreciate your confidence in us and remain committed to helping you meet your financial needs.
Sincerely,
Andrew Owen
President
Wells Fargo Funds
“Global stocks rallied in November, propelled by optimism over three promising COVID-19 vaccines.”
“February saw major domestic equity indexes driven higher on the hope of a new stimulus bill, improving COVID-19 vaccination numbers, and the gradual reopening of the economy.”
For further information about your Fund, contact your investment professional, visit our website at wfam.com, or call us directly at 1-800-222-8222.
Wells Fargo Adjustable Rate Government Fund | 3
Letter to shareholders (unaudited)
Preparing for LIBOR Transition
The global financial industry is preparing to transition away from the London Interbank Offered Rate (LIBOR), a key benchmark interest rate, to new alternative rates. LIBOR underpins more than $350 trillion of financial contracts. It is the benchmark rate for a wide spectrum of products ranging from residential mortgages to corporate bonds to derivatives. Regulators have called for a market-wide transition away from LIBOR to successor reference rates by the end of 2021 (extended through June 30, 2023 for most tenors of the U.S. dollar LIBOR), which requires proactive steps be taken by issuers, counterparties, and asset managers to identify impacted products and adopt new reference rates.
The Fund holds at least one security that uses LIBOR as a floating reference rate and has a maturity date after 12-31-2021.
Although the transition process away from LIBOR has become increasingly well-defined in advance of the anticipated discontinuation date, there remains uncertainty regarding the nature of successor reference rates, and any potential effects of the transition away from LIBOR on investment instruments that use it as a benchmark rate. The transition process may result in, among other things, increased volatility or illiquidity in markets for instruments that currently rely on LIBOR and could negatively impact the value of certain instruments held by the Fund.
Wells Fargo Asset Management is monitoring LIBOR exposure closely and has put resources and controls in place to manage this transition effectively. The Fund’s portfolio management team is evaluating LIBOR holdings to understand what happens to those securities when LIBOR ceases to exist, including examining security documentation to identify the presence or absence of fallback language identifying a replacement rate to LIBOR.
While the pace of transition away from LIBOR will differ by asset class and investment strategy, the portfolio management team will monitor market conditions for those holdings to identify and mitigate deterioration or volatility in pricing and liquidity and ensure appropriate actions are taken in a timely manner.
Further information regarding the potential risks associated with the discontinuation of LIBOR can be found in the Fund’s Statement of Additional Information.
4 | Wells Fargo Adjustable Rate Government Fund
This page is intentionally left blank.
Performance highlights (unaudited)
| Investment objective | The Fund seeks current income consistent with capital preservation. |
| Manager | Wells Fargo Funds Management, LLC |
| Subadviser | Wells Capital Management Incorporated |
| Portfolio managers | Christopher Y. Kauffman, CFA®‡, Michal Stanczyk |
| Average annual total returns (%) as of February 28, 2021 |
| | | Including sales charge | | Excluding sales charge | | Expense ratios1 (%) |
| | Inception date | 1 year | 5 year | 10 year | | 1 year | 5 year | 10 year | | Gross | Net 2 |
| Class A (ESAAX) | 6-30-2000 | -1.12 | 0.87 | 0.80 | | 0.85 | 1.27 | 1.01 | | 0.89 | 0.75 |
| Class C (ESACX) | 6-30-2000 | -0.98 | 0.47 | 0.23 | | 0.02 | 0.47 | 0.23 | | 1.64 | 1.50 |
| Administrator Class (ESADX) | 7-30-2010 | – | – | – | | 0.99 | 1.41 | 1.15 | | 0.83 | 0.61 |
| Institutional Class (EKIZX) | 10-1-1991 | – | – | – | | 1.13 | 1.55 | 1.28 | | 0.56 | 0.47 |
| Bloomberg Barclays 6-Month Treasury Bill Index3 | – | – | – | – | | 0.65 | 1.42 | 0.82 | | – | – |
Figures quoted represent past performance, which is no guarantee of future results, and do not reflect taxes that a shareholder may pay on an investment in a fund. Investment return and principal value of an investment will fluctuate so that an investor’s shares, when redeemed, may be worth more or less than their original cost. Performance shown without sales charges would be lower if sales charges were reflected. Current performance may be lower or higher than the performance data quoted, which assumes the reinvestment of dividends and capital gains. Current month-end performance is available on the Fund’s website, wfam.com.
Index returns do not include transaction costs associated with buying and selling securities, any mutual fund fees or expenses, or any taxes. It is not possible to invest directly in an index.
For Class A shares, the maximum front-end sales charge is 2.00%. For Class C shares, the maximum contingent deferred sales charge is 1.00%. Performance including a contingent deferred sales charge assumes the sales charge for the corresponding time period. Administrator Class and Institutional Class shares are sold without a front-end sales charge or contingent deferred sales charge.
| 1 | Reflects the expense ratios as stated in the most recent prospectuses, which include the impact of 0.01% in acquired fund fees and expenses. The expense ratios shown are subject to change and may differ from the annualized expense ratios shown in the financial highlights of this report, which do not include acquired fund fees and expenses. |
| 2 | The manager has contractually committed through December 31, 2021, to waive fees and/or reimburse expenses to the extent necessary to cap total annual fund operating expenses after fee waivers at 0.74% for Class A, 1.49% for Class C, 0.60% for Administrator Class and 0.46% for Institutional Class. Brokerage commissions, stamp duty fees, interest, taxes, acquired fund fees and expenses (if any), and extraordinary expenses are excluded from the expense caps. Prior to or after the commitment expiration date, the caps may be increased or the commitment to maintain the caps may be terminated only with the approval of the Board of Trustees. Without these caps, the Fund’s returns would have been lower. The expense ratio paid by an investor is the net expense ratio (the total annual fund operating expenses after fee waivers) as stated in the prospectuses. |
| 3 | The Bloomberg Barclays 6-Month Treasury Bill Index tracks the performance and attributes of recently issued 6-Month U.S. Treasury bills. The index follows Bloomberg Barclays’ monthly rebalancing conventions. You cannot invest directly in an index. |
Bond values fluctuate in response to the financial condition of individual issuers, general market and economic conditions, and changes in interest rates. Changes in market conditions and government policies may lead to periods of heightened volatility in the bond market and reduced liquidity for certain bonds held by the Fund. In general, when interest rates rise, bond values fall and investors may lose principal value. Interest rate changes and their impact on the Fund and its share price can be sudden and unpredictable. The use of derivatives may reduce returns and/or increase volatility. Securities issued by U.S. government agencies or government-sponsored entities may not be guaranteed by the U.S. Treasury. Certain investment strategies tend to increase the total risk of an investment (relative to the broader market). The Fund is exposed to mortgage- and asset-backed securities risk. The U.S. government guarantee applies to certain underlying securities and not to shares of the Fund. Consult the Fund’s prospectus for additional information on these and other risks.
| ‡ | CFA® and Chartered Financial Analyst® are trademarks owned by CFA Institute. |
6 | Wells Fargo Adjustable Rate Government Fund
Performance highlights (unaudited)
| Ten largest holdings (%) as of February 28, 20211 |
| FHLMC, 2.82%, 7-1-2038 | 2.03 |
| FNMA Series 2002-66 Class A3, 3.81%, 4-25-2042 | 1.26 |
| FNMA, 2.98%, 12-1-2040 | 1.24 |
| FNMA Series 2018-39 Class WF, 0.44%, 6-25-2048 | 1.23 |
| FHLMC, 2.64%, 6-1-2050 | 1.16 |
| FNMA Series 2013-23 Class LF, 0.49%, 3-25-2043 | 1.11 |
| ECMC Group Student Loan Trust Series 2018-2A Class A, 0.92%, 9-25-2068 | 1.02 |
| GNMA Series 2017-H11 Class FE, 1.18%, 5-20-2067 | 0.96 |
| FNMA Series 2004-W15 Class 3A, 3.61%, 6-25-2044 | 0.96 |
| Navient Student Loan Trust Series 2019-2A Class A2, 1.13%, 2-27-2068 | 0.95 |
| 1 | Figures represent the percentage of the Fund's net assets. Holdings are subject to change and may have changed since the date specified. |
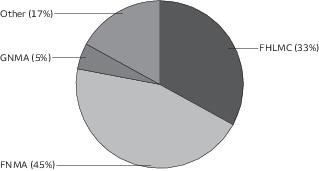
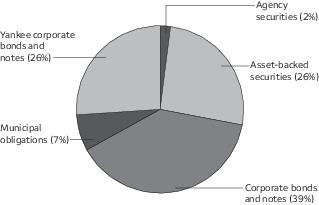
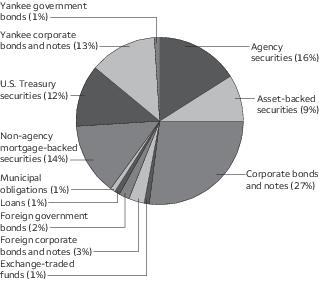
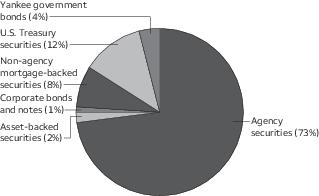
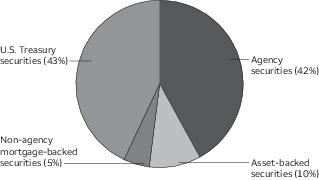
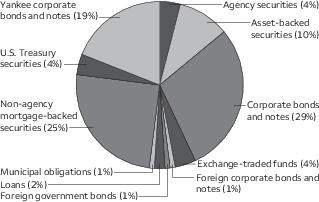
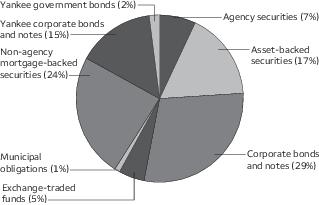
| Portfolio composition as of February 28, 20211 |
| 1 | Figures represent the percentage of the Fund's long-term investments. These amounts are subject to change and may have changed since the date specified. |
Wells Fargo Adjustable Rate Government Fund | 7
Fund expenses (unaudited)
As a shareholder of the Fund, you incur two types of costs: (1) transaction costs, including sales charges (loads) on purchase payments and contingent deferred sales charges (if any) on redemptions and (2) ongoing costs, including management fees, distribution (12b-1) and/or shareholder servicing fees, and other Fund expenses. This example is intended to help you understand your ongoing costs (in dollars) of investing in the Fund and to compare these costs with the ongoing costs of investing in other mutual funds.
The example is based on an investment of $1,000 invested at the beginning of the six-month period and held for the entire period from September 1, 2020 to February 28, 2021.
Actual expenses
The “Actual” line of the table below provides information about actual account values and actual expenses. You may use the information in this line, together with the amount you invested, to estimate the expenses that you paid over the period. Simply divide your account value by $1,000 (for example, an $8,600 account value divided by $1,000 = 8.6), then multiply the result by the number in the “Actual” line under the heading entitled “Expenses paid during period” for your applicable class of shares to estimate the expenses you paid on your account during this period.
Hypothetical example for comparison purposes
The “Hypothetical” line of the table below provides information about hypothetical account values and hypothetical expenses based on the Fund’s actual expense ratio and an assumed rate of return of 5% per year before expenses, which is not the Fund’s actual return. The hypothetical account values and expenses may not be used to estimate the actual ending account balance or expenses you paid for the period. You may use this information to compare the ongoing costs of investing in the Fund and other funds. To do so, compare this 5% hypothetical example with the 5% hypothetical examples that appear in the shareholder reports of the other funds.
Please note that the expenses shown in the table are meant to highlight your ongoing costs only and do not reflect any transactional costs, such as sales charges (loads) and contingent deferred sales charges. Therefore, the “Hypothetical” line of the table is useful in comparing ongoing costs only and will not help you determine the relative total costs of owning different funds. In addition, if these transactional costs were included, your costs would have been higher.
| | Beginning
account value
9-1-2020 | Ending
account value
2-28-2021 | Expenses
paid during
the period1 | Annualized net
expense ratio |
| Class A | | | | |
| Actual | $1,000.00 | $1,009.25 | $3.69 | 0.74% |
| Hypothetical (5% return before expenses) | $1,000.00 | $1,021.12 | $3.71 | 0.74% |
| Class C | | | | |
| Actual | $1,000.00 | $1,004.73 | $7.06 | 1.42% |
| Hypothetical (5% return before expenses) | $1,000.00 | $1,017.75 | $7.10 | 1.42% |
| Administrator Class | | | | |
| Actual | $1,000.00 | $1,009.95 | $2.99 | 0.60% |
| Hypothetical (5% return before expenses) | $1,000.00 | $1,021.82 | $3.01 | 0.60% |
| Institutional Class | | | | |
| Actual | $1,000.00 | $1,010.65 | $2.29 | 0.46% |
| Hypothetical (5% return before expenses) | $1,000.00 | $1,022.51 | $2.31 | 0.46% |
1 Expenses paid is equal to the annualized net expense ratio of each class multiplied by the average account value over the period, multiplied by the number of days in the most recent fiscal half-year divided by the number of days in the fiscal year (to reflect the one-half-year period).
8 | Wells Fargo Adjustable Rate Government Fund
Portfolio of investments—February 28, 2021 (unaudited)
| | | Interest
rate | Maturity
date | Principal | Value |
| Agency securities: 79.47% | | | | | |
| FHLMC (1 Year Treasury Constant Maturity+0.75%)± | | 1.49% | 4-1-2030 | $ 24,610 | $ 24,761 |
| FHLMC (11th District Cost of Funds+1.25%)± | | 1.77 | 2-1-2035 | 47,332 | 46,810 |
| FHLMC (11th District Cost of Funds+1.25%)± | | 1.78 | 1-1-2030 | 1,942 | 1,924 |
| FHLMC (11th District Cost of Funds+1.25%)± | | 1.78 | 1-1-2030 | 448 | 446 |
| FHLMC (11th District Cost of Funds+1.25%)± | | 1.78 | 7-1-2030 | 107,571 | 107,064 |
| FHLMC (6 Month LIBOR+1.73%)± | | 1.98 | 6-1-2024 | 3,792 | 3,801 |
| FHLMC (12 Month LIBOR+1.51%)± | | 2.01 | 2-1-2037 | 47,781 | 47,917 |
| FHLMC (1 Year Treasury Constant Maturity+1.99%)± | | 2.11 | 11-1-2034 | 258,910 | 259,201 |
| FHLMC (6 Month LIBOR+1.42%)± | | 2.13 | 2-1-2037 | 2,398 | 2,480 |
| FHLMC (12 Month LIBOR+1.73%)± | | 2.19 | 1-1-2035 | 360,580 | 362,404 |
| FHLMC (12 Month LIBOR+1.74%)± | | 2.23 | 12-1-2036 | 169,261 | 178,839 |
| FHLMC (6 Month LIBOR+1.72%)± | | 2.28 | 6-1-2037 | 245,674 | 246,770 |
| FHLMC (12 Month LIBOR+1.78%)± | | 2.30 | 11-1-2035 | 205,674 | 217,138 |
| FHLMC (U.S. Treasury H15 Treasury Bill 6 Month Auction High Discount+1.75%)± | | 2.34 | 1-1-2023 | 6,760 | 6,767 |
| FHLMC (1 Year Treasury Constant Maturity+2.22%)± | | 2.34 | 12-1-2033 | 325,888 | 326,834 |
| FHLMC (6 Month LIBOR+1.68%)± | | 2.34 | 1-1-2037 | 698,885 | 727,098 |
| FHLMC (12 Month LIBOR+1.98%)± | | 2.35 | 11-1-2032 | 98,400 | 98,219 |
| FHLMC (1 Year Treasury Constant Maturity+2.25%)± | | 2.38 | 5-1-2034 | 53,597 | 57,043 |
| FHLMC (1 Year Treasury Constant Maturity+2.25%)± | | 2.38 | 12-1-2034 | 167,442 | 168,026 |
| FHLMC (1 Year Treasury Constant Maturity+1.88%)± | | 2.39 | 5-1-2035 | 261,314 | 262,312 |
| FHLMC (11th District Cost of Funds+0.00%)± | | 2.40 | 3-1-2025 | 239 | 239 |
| FHLMC (1 Year Treasury Constant Maturity+2.27%)± | | 2.40 | 5-1-2025 | 41,579 | 41,645 |
| FHLMC (1 Year Treasury Constant Maturity+2.27%)± | | 2.40 | 11-1-2029 | 32,899 | 32,919 |
| FHLMC (12 Month LIBOR+1.77%)± | | 2.40 | 1-1-2040 | 2,218,128 | 2,315,827 |
| FHLMC (1 Year Treasury Constant Maturity+2.29%)± | | 2.41 | 11-1-2029 | 50,352 | 50,458 |
| FHLMC (1 Year Treasury Constant Maturity+2.28%)± | | 2.41 | 1-1-2035 | 180,196 | 180,646 |
| FHLMC (1 Year Treasury Constant Maturity+2.03%)± | | 2.41 | 12-1-2035 | 297,127 | 297,179 |
| FHLMC (12 Month LIBOR+1.99%)± | | 2.42 | 7-1-2036 | 218,116 | 220,144 |
| FHLMC (1 Year Treasury Constant Maturity+2.25%)± | | 2.45 | 4-1-2036 | 268,394 | 275,510 |
| FHLMC (1 Year Treasury Constant Maturity+2.25%)± | | 2.46 | 9-1-2033 | 70,520 | 74,421 |
| FHLMC (1 Year Treasury Constant Maturity+2.29%)± | | 2.54 | 11-1-2027 | 249,214 | 249,079 |
| FHLMC (6 Month LIBOR+2.09%)± | | 2.55 | 6-1-2026 | 428,015 | 430,358 |
| FHLMC (1 Year Treasury Constant Maturity+2.33%)± | | 2.56 | 7-1-2031 | 124,738 | 125,232 |
| FHLMC (1 Year Treasury Constant Maturity+2.36%)± | | 2.57 | 1-1-2028 | 9,348 | 9,349 |
| FHLMC (1 Year Treasury Constant Maturity+2.23%)± | | 2.60 | 11-1-2026 | 49,436 | 49,395 |
| FHLMC (1 Year Treasury Constant Maturity+2.22%)± | | 2.60 | 8-1-2033 | 58,680 | 58,434 |
| FHLMC (1 Year Treasury Constant Maturity+2.25%)± | | 2.60 | 1-1-2037 | 53,660 | 57,267 |
| FHLMC (12 Month LIBOR+1.75%)± | | 2.60 | 9-1-2037 | 214,624 | 226,726 |
| FHLMC (1 Year Treasury Constant Maturity+2.36%)± | | 2.61 | 1-1-2028 | 1,378 | 1,379 |
| FHLMC (3 Year Treasury Constant Maturity+2.44%)± | | 2.62 | 5-1-2032 | 94,885 | 94,660 |
| FHLMC (12 Month LIBOR+1.93%)± | | 2.62 | 4-1-2035 | 703,519 | 712,737 |
| FHLMC (12 Month LIBOR+1.64%)± | | 2.64 | 6-1-2050 | 4,782,996 | 4,959,426 |
| FHLMC (1 Year Treasury Constant Maturity+2.40%)± | | 2.65 | 9-1-2031 | 34,128 | 34,205 |
| FHLMC (12 Month LIBOR+1.75%)± | | 2.65 | 6-1-2033 | 281,384 | 284,587 |
| FHLMC (1 Year Treasury Constant Maturity+2.34%)± | | 2.65 | 7-1-2034 | 251,451 | 251,673 |
| FHLMC (1 Year Treasury Constant Maturity+2.48%)± | | 2.66 | 12-1-2032 | 66,224 | 66,529 |
| FHLMC (1 Year Treasury Constant Maturity+2.55%)± | | 2.67 | 9-1-2029 | 28,624 | 28,604 |
| FHLMC (1 Year Treasury Constant Maturity+2.03%)± | | 2.67 | 8-1-2033 | 749,103 | 760,004 |
| FHLMC (1 Year Treasury Constant Maturity+2.18%)± | | 2.69 | 6-1-2036 | 487,926 | 519,254 |
| FHLMC (12 Month LIBOR+1.81%)± | | 2.70 | 5-1-2039 | 328,286 | 330,491 |
| FHLMC (12 Month LIBOR+1.62%)± | | 2.72 | 7-1-2045 | 1,068,752 | 1,109,484 |
| FHLMC (1 Year Treasury Constant Maturity+2.35%)± | | 2.73 | 7-1-2038 | 149,506 | 149,085 |
| FHLMC (6 Month LIBOR+2.12%)± | | 2.74 | 5-1-2037 | 28,017 | 28,236 |
The accompanying notes are an integral part of these financial statements.
Wells Fargo Adjustable Rate Government Fund | 9
Portfolio of investments—February 28, 2021 (unaudited)
| | | Interest
rate | Maturity
date | Principal | Value |
| Agency securities (continued) | | | | | |
| FHLMC (1 Year Treasury Constant Maturity+2.33%)± | | 2.75% | 7-1-2027 | $ 230,708 | $ 232,162 |
| FHLMC (12 Month LIBOR+1.77%)± | | 2.75 | 6-1-2035 | 362,765 | 364,665 |
| FHLMC (1 Year Treasury Constant Maturity+2.10%)± | | 2.77 | 10-1-2037 | 507,101 | 526,356 |
| FHLMC (U.S. Treasury H15 Treasury Bill 6 Month Auction High Discount+1.94%)± | | 2.81 | 7-1-2024 | 16,286 | 16,197 |
| FHLMC (1 Year Treasury Constant Maturity+2.28%)± | | 2.82 | 10-1-2036 | 169,010 | 170,937 |
| FHLMC (1 Year Treasury Constant Maturity+2.26%)± | | 2.82 | 7-1-2038 | 8,171,401 | 8,677,116 |
| FHLMC (12 Month LIBOR+1.77%)± | | 2.83 | 10-1-2035 | 453,264 | 455,238 |
| FHLMC (12 Month LIBOR+1.86%)± | | 2.83 | 7-1-2038 | 929,920 | 983,271 |
| FHLMC (1 Year Treasury Constant Maturity+2.48%)± | | 2.86 | 6-1-2030 | 189,649 | 189,358 |
| FHLMC (12 Month LIBOR+1.78%)± | | 2.87 | 9-1-2037 | 239,257 | 253,253 |
| FHLMC (1 Year Treasury Constant Maturity+2.47%)± | | 2.89 | 7-1-2034 | 164,891 | 166,566 |
| FHLMC (12 Month LIBOR+1.77%)± | | 2.89 | 10-1-2036 | 272,677 | 288,362 |
| FHLMC (1 Year Treasury Constant Maturity+2.26%)± | | 2.89 | 4-1-2037 | 2,027,140 | 2,164,876 |
| FHLMC (12 Month LIBOR+1.75%)± | | 2.90 | 5-1-2033 | 131,190 | 131,564 |
| FHLMC (1 Year Treasury Constant Maturity+2.23%)± | | 2.92 | 5-1-2038 | 419,852 | 426,336 |
| FHLMC (1 Year Treasury Constant Maturity+2.40%)± | | 2.96 | 11-1-2029 | 214,949 | 214,842 |
| FHLMC (1 Year Treasury Constant Maturity+2.47%)± | | 2.97 | 6-1-2035 | 167,301 | 167,119 |
| FHLMC (12 Month LIBOR+1.73%)± | | 2.97 | 5-1-2037 | 643,679 | 681,238 |
| FHLMC (1 Year Treasury Constant Maturity+2.21%)± | | 2.99 | 1-1-2037 | 507,619 | 511,396 |
| FHLMC (1 Year Treasury Constant Maturity+2.48%)± | | 3.00 | 9-1-2030 | 51,324 | 51,775 |
| FHLMC (1 Year Treasury Constant Maturity+2.26%)± | | 3.00 | 9-1-2038 | 2,996,355 | 3,191,119 |
| FHLMC (1 Year Treasury Constant Maturity+2.33%)± | | 3.01 | 10-1-2033 | 591,086 | 600,328 |
| FHLMC (1 Year Treasury Constant Maturity+2.39%)± | | 3.01 | 6-1-2035 | 665,484 | 695,213 |
| FHLMC (1 Year Treasury Constant Maturity+2.36%)± | | 3.07 | 2-1-2035 | 300,174 | 303,024 |
| FHLMC (1 Year Treasury Constant Maturity+2.27%)± | | 3.09 | 11-1-2022 | 29,164 | 29,401 |
| FHLMC (1 Year Treasury Constant Maturity+2.26%)± | | 3.09 | 2-1-2036 | 3,222,052 | 3,435,128 |
| FHLMC (1 Year Treasury Constant Maturity+2.66%)± | | 3.10 | 5-1-2028 | 103,305 | 103,215 |
| FHLMC (11th District Cost of Funds+2.41%)± | | 3.12 | 6-1-2029 | 10,666 | 10,800 |
| FHLMC (1 Year Treasury Constant Maturity+2.48%)± | | 3.13 | 6-1-2030 | 23,816 | 24,031 |
| FHLMC (1 Year Treasury Constant Maturity+2.16%)± | | 3.14 | 6-1-2033 | 300,967 | 304,100 |
| FHLMC (1 Year Treasury Constant Maturity+2.25%)± | | 3.14 | 6-1-2035 | 58,642 | 62,554 |
| FHLMC (6 Month LIBOR+2.38%)± | | 3.27 | 2-1-2024 | 6,995 | 7,010 |
| FHLMC (1 Year Treasury Constant Maturity+2.39%)± | | 3.27 | 1-1-2037 | 899,145 | 964,840 |
| FHLMC (1 Year Treasury Constant Maturity+2.43%)± | | 3.30 | 6-1-2025 | 34,572 | 34,417 |
| FHLMC (1 Year Treasury Constant Maturity+2.25%)± | | 3.31 | 2-1-2036 | 359,646 | 372,484 |
| FHLMC (12 Month LIBOR+1.84%)± | | 3.31 | 9-1-2036 | 302,909 | 319,163 |
| FHLMC (1 Year Treasury Constant Maturity+2.17%)± | | 3.31 | 5-1-2037 | 30,422 | 30,519 |
| FHLMC (1 Year Treasury Constant Maturity+2.36%)± | | 3.32 | 2-1-2034 | 2,715,100 | 2,861,006 |
| FHLMC (1 Year Treasury Constant Maturity+2.29%)± | | 3.33 | 9-1-2033 | 213,531 | 216,496 |
| FHLMC (1 Year Treasury Constant Maturity+2.24%)± | | 3.36 | 8-1-2027 | 3,721 | 3,745 |
| FHLMC (1 Year Treasury Constant Maturity+2.03%)± | | 3.37 | 3-1-2025 | 13,511 | 13,508 |
| FHLMC (11th District Cost of Funds+2.39%)± | | 3.39 | 6-1-2021 | 2,782 | 2,785 |
| FHLMC (12 Month Treasury Average+2.52%)± | | 3.39 | 6-1-2028 | 28,032 | 27,936 |
| FHLMC (1 Year Treasury Constant Maturity+2.25%)± | | 3.41 | 4-1-2038 | 531,950 | 568,129 |
| FHLMC (1 Year Treasury Constant Maturity+2.38%)± | | 3.42 | 4-1-2034 | 273,091 | 273,690 |
| FHLMC (1 Year Treasury Constant Maturity+2.28%)± | | 3.44 | 7-1-2031 | 343,644 | 344,830 |
| FHLMC (12 Month Treasury Average+1.90%)± | | 3.45 | 5-1-2028 | 137,554 | 137,993 |
| FHLMC (1 Year Treasury Constant Maturity+2.40%)± | | 3.47 | 7-1-2029 | 35,899 | 35,965 |
| FHLMC (12 Month LIBOR+1.87%)± | | 3.50 | 5-1-2035 | 51,845 | 52,325 |
| FHLMC (1 Year Treasury Constant Maturity+2.25%)± | | 3.53 | 4-1-2023 | 50,769 | 50,738 |
| FHLMC (12 Month LIBOR+1.75%)± | | 3.55 | 4-1-2035 | 111,127 | 117,253 |
| FHLMC (1 Year Treasury Constant Maturity+2.48%)± | | 3.56 | 10-1-2025 | 29,017 | 28,928 |
| FHLMC (12 Month LIBOR+1.67%)± | | 3.67 | 8-1-2035 | 127,351 | 126,919 |
| FHLMC (1 Year Treasury Constant Maturity+2.23%)± | | 3.73 | 4-1-2034 | 157,614 | 157,959 |
The accompanying notes are an integral part of these financial statements.
10 | Wells Fargo Adjustable Rate Government Fund
Portfolio of investments—February 28, 2021 (unaudited)
| | | Interest
rate | Maturity
date | Principal | Value |
| Agency securities (continued) | | | | | |
| FHLMC (1 Year Treasury Constant Maturity+2.23%)± | | 3.73% | 4-1-2034 | $ 164,997 | $ 164,895 |
| FHLMC (1 Year Treasury Constant Maturity+2.25%)± | | 3.75 | 5-1-2034 | 116,517 | 116,193 |
| FHLMC (3 Year Treasury Constant Maturity+2.27%)± | | 3.77 | 4-1-2032 | 31,149 | 31,328 |
| FHLMC (12 Month LIBOR+1.90%)± | | 3.77 | 4-1-2037 | 233,955 | 248,823 |
| FHLMC (1 Year Treasury Constant Maturity+2.24%)± | | 3.80 | 3-1-2027 | 32,498 | 32,460 |
| FHLMC (5 Year Treasury Constant Maturity+2.44%)± | | 3.82 | 8-1-2027 | 25,902 | 25,953 |
| FHLMC (12 Month LIBOR+1.84%)± | | 3.83 | 4-1-2035 | 702,937 | 741,981 |
| FHLMC (12 Month LIBOR+1.84%)± | | 3.84 | 4-1-2037 | 272,755 | 288,226 |
| FHLMC (12 Month LIBOR+1.91%)± | | 3.85 | 3-1-2032 | 180,670 | 181,682 |
| FHLMC (1 Year Treasury Constant Maturity+2.23%)± | | 3.85 | 2-1-2034 | 595,258 | 600,514 |
| FHLMC (1 Year Treasury Constant Maturity+2.23%)± | | 3.86 | 2-1-2034 | 119,344 | 119,801 |
| FHLMC (1 Year Treasury Constant Maturity+2.36%)± | | 3.86 | 4-1-2038 | 644,636 | 644,964 |
| FHLMC (3 Year Treasury Constant Maturity+2.69%)± | | 3.88 | 6-1-2035 | 360,817 | 368,867 |
| FHLMC (12 Month Treasury Average+2.46%)± | | 3.89 | 10-1-2029 | 76,393 | 76,434 |
| FHLMC (11th District Cost of Funds+1.25%)± | | 3.92 | 11-1-2030 | 12,691 | 12,959 |
| FHLMC (1 Year Treasury Constant Maturity+2.44%)± | | 3.94 | 4-1-2029 | 54,333 | 54,560 |
| FHLMC (1 Year Treasury Constant Maturity+2.61%)± | | 3.96 | 9-1-2030 | 46,953 | 46,943 |
| FHLMC (1 Year Treasury Constant Maturity+2.48%)± | | 3.98 | 2-1-2030 | 24,801 | 24,847 |
| FHLMC (1 Year Treasury Constant Maturity+2.48%)± | | 3.98 | 6-1-2030 | 65,960 | 66,045 |
| FHLMC | | 4.00 | 7-1-2029 | 1,879,612 | 2,005,603 |
| FHLMC (1 Year Treasury Constant Maturity+2.52%)± | | 4.00 | 11-1-2029 | 71,492 | 71,824 |
| FHLMC (1 Year Treasury Constant Maturity+2.48%)± | | 4.01 | 10-1-2024 | 43,950 | 43,980 |
| FHLMC (1 Year Treasury Constant Maturity+2.60%)± | | 4.10 | 6-1-2032 | 128,262 | 128,235 |
| FHLMC (3 Year Treasury Constant Maturity+2.44%)± | | 4.26 | 5-1-2031 | 84,613 | 85,758 |
| FHLMC (11th District Cost of Funds+2.57%)± | | 4.29 | 12-1-2025 | 182,142 | 182,900 |
| FHLMC (2 Year Treasury Constant Maturity+2.44%)± | | 4.32 | 8-1-2029 | 14,357 | 14,386 |
| FHLMC (11th District Cost of Funds+2.29%)± | | 4.42 | 12-1-2025 | 3,920 | 3,918 |
| FHLMC (5 Year Treasury Constant Maturity+2.13%)± | | 4.51 | 8-1-2029 | 7,367 | 7,391 |
| FHLMC (6 Month LIBOR+3.83%)± | | 4.71 | 11-1-2026 | 21,537 | 21,595 |
| FHLMC | | 5.00 | 10-1-2022 | 2,298 | 2,406 |
| FHLMC Multifamily Structured Pass Through Certificates Series KF61 Class A (1 Month LIBOR+0.53%)± | | 0.65 | 3-25-2029 | 918,924 | 928,795 |
| FHLMC Multifamily Structured Pass Through Certificates Series KF85 Class AL (1 Month LIBOR+0.30%)± | | 0.41 | 8-25-2030 | 2,000,000 | 2,009,216 |
| FHLMC Multifamily Structured Pass Through Certificates Series KF86 Class AL (1 Month LIBOR+0.29%)± | | 0.40 | 8-25-2027 | 3,393,940 | 3,408,253 |
| FHLMC Multifamily Structured Pass Through Certificates Series KX04 Class AFL (1 Month LIBOR+0.33%)± | | 0.44 | 3-25-2030 | 2,609,412 | 2,617,598 |
| FHLMC Series 1671 Class QA (11th District Cost of Funds+0.95%)± | | 1.42 | 2-15-2024 | 452,902 | 455,142 |
| FHLMC Series 1686 Class FE (11th District Cost of Funds+1.10%)± | | 1.57 | 2-15-2024 | 6,388 | 6,465 |
| FHLMC Series 1709 Class FA (10 Year Treasury Constant Maturity+(0.85)%)± | | 0.26 | 3-15-2024 | 117,100 | 115,120 |
| FHLMC Series 1730 Class FA (10 Year Treasury Constant Maturity+(0.60)%)± | | 0.51 | 5-15-2024 | 51,558 | 50,695 |
| FHLMC Series 20 Class F ±± | | 3.39 | 7-1-2029 | 4,259 | 4,367 |
| FHLMC Series 2315 Class FW (1 Month LIBOR+0.55%)± | | 0.66 | 4-15-2027 | 42,685 | 42,869 |
| FHLMC Series 2391 Class EF (1 Month LIBOR+0.50%)± | | 0.61 | 6-15-2031 | 43,113 | 43,345 |
| FHLMC Series 2454 Class SL (1 Month LIBOR+8.00%)♀± | | 7.89 | 3-15-2032 | 85,936 | 14,464 |
| FHLMC Series 2461 Class FI (1 Month LIBOR+0.50%)± | | 0.61 | 4-15-2028 | 58,505 | 58,719 |
| FHLMC Series 2464 Class FE (1 Month LIBOR+1.00%)± | | 1.11 | 3-15-2032 | 56,010 | 57,245 |
| FHLMC Series 2466 Class FV (1 Month LIBOR+0.55%)± | | 0.66 | 3-15-2032 | 114,110 | 114,951 |
| FHLMC Series 2538 Class F (1 Month LIBOR+0.60%)± | | 0.71 | 12-15-2032 | 241,966 | 245,450 |
| FHLMC Series 264 Class F1 (1 Month LIBOR+0.55%)± | | 0.66 | 7-15-2042 | 1,122,768 | 1,133,571 |
| FHLMC Series 2682 Class FK (1 Month LIBOR+1.47%)± | | 1.58 | 1-15-2033 | 2,435,769 | 2,535,485 |
The accompanying notes are an integral part of these financial statements.
Wells Fargo Adjustable Rate Government Fund | 11
Portfolio of investments—February 28, 2021 (unaudited)
| | | Interest
rate | Maturity
date | Principal | Value |
| Agency securities (continued) | | | | | |
| FHLMC Series 3067 Class FA (1 Month LIBOR+0.35%)± | | 0.46% | 11-15-2035 | $ 800,417 | $ 805,102 |
| FHLMC Series 3140 Class GF (1 Month LIBOR+0.35%)± | | 0.46 | 3-15-2036 | 573,789 | 577,174 |
| FHLMC Series 3146 Class FP (1 Month LIBOR+0.35%)± | | 0.46 | 4-15-2036 | 560,945 | 564,225 |
| FHLMC Series 3149 Class FB (1 Month LIBOR+0.35%)± | | 0.46 | 5-15-2036 | 966,961 | 971,738 |
| FHLMC Series 319 Class F1 (1 Month LIBOR+0.45%)± | | 0.56 | 11-15-2043 | 1,524,889 | 1,490,781 |
| FHLMC Series 3240 Class FM (1 Month LIBOR+0.35%)± | | 0.46 | 11-15-2036 | 1,066,200 | 1,072,534 |
| FHLMC Series 3284 Class CF (1 Month LIBOR+0.37%)± | | 0.48 | 3-15-2037 | 719,661 | 724,753 |
| FHLMC Series 3286 Class FA (1 Month LIBOR+0.40%)± | | 0.51 | 3-15-2037 | 323,811 | 325,965 |
| FHLMC Series 3436 Class A ±± | | 2.44 | 11-15-2036 | 364,937 | 375,444 |
| FHLMC Series 350 Class F2 (1 Month LIBOR+0.35%)± | | 2.85 | 9-15-2040 | 2,776,748 | 2,761,437 |
| FHLMC Series 3684 Class FM (1 Month LIBOR+0.35%)± | | 0.49 | 11-15-2036 | 1,528,970 | 1,492,123 |
| FHLMC Series 3753 Class FA (1 Month LIBOR+0.50%)± | | 0.61 | 11-15-2040 | 1,773,075 | 1,788,728 |
| FHLMC Series 3757 Class PF (1 Month LIBOR+0.50%)± | | 0.61 | 8-15-2040 | 552,534 | 552,083 |
| FHLMC Series 3822 Class FY (1 Month LIBOR+0.40%)± | | 0.51 | 2-15-2033 | 777,387 | 783,519 |
| FHLMC Series 3827 Class DF (1 Month LIBOR+0.45%)± | | 0.56 | 3-15-2041 | 692,774 | 699,864 |
| FHLMC Series 3997 Class FQ (1 Month LIBOR+0.50%)± | | 0.61 | 2-15-2042 | 761,894 | 768,805 |
| FHLMC Series 4013 Class QF (1 Month LIBOR+0.55%)± | | 0.66 | 3-15-2041 | 585,658 | 589,680 |
| FHLMC Series 4039 Class FA (1 Month LIBOR+0.50%)± | | 0.61 | 5-15-2042 | 1,275,828 | 1,288,051 |
| FHLMC Series 4095 Class FB (1 Month LIBOR+0.40%)± | | 0.51 | 4-15-2039 | 588,375 | 589,673 |
| FHLMC Series 4136 Class DF (1 Month LIBOR+0.30%)± | | 0.41 | 11-15-2042 | 789,670 | 789,778 |
| FHLMC Series 4143 Class KF (1 Month LIBOR+0.35%)± | | 0.49 | 9-15-2037 | 2,395,766 | 2,396,997 |
| FHLMC Series 4248 Class FL (1 Month LIBOR+0.45%)± | | 0.56 | 5-15-2041 | 298,757 | 301,570 |
| FHLMC Series 4316 Class JF (1 Month LIBOR+0.40%)± | | 0.51 | 1-15-2044 | 1,232,354 | 1,235,666 |
| FHLMC Series 4503 Class FA (1 Month LIBOR+0.35%)± | | 0.49 | 2-15-2042 | 2,030,890 | 2,031,872 |
| FHLMC Series 4515 Class FA (1 Month LIBOR+0.37%)± | | 0.51 | 8-15-2038 | 302,405 | 304,175 |
| FHLMC Series 4604 Class PA | | 3.00 | 1-15-2044 | 1,952,506 | 1,998,510 |
| FHLMC Series 4628 Class KF (1 Month LIBOR+0.50%)± | | 0.61 | 1-15-2055 | 1,817,335 | 1,839,482 |
| FHLMC Series 4678 Class AF (1 Month LIBOR+0.40%)± | | 0.54 | 12-15-2042 | 1,562,401 | 1,577,487 |
| FHLMC Series 4691 Class FA (1 Month LIBOR+0.35%)± | | 0.46 | 6-15-2047 | 775,124 | 769,456 |
| FHLMC Series 4754 Class FM (1 Month LIBOR+0.30%)± | | 0.41 | 2-15-2048 | 2,638,432 | 2,645,827 |
| FHLMC Series 4821 Class FA (1 Month LIBOR+0.30%)± | | 0.41 | 7-15-2048 | 842,871 | 845,311 |
| FHLMC Series 4842 Class FA (1 Month LIBOR+0.35%)± | | 0.46 | 11-15-2048 | 1,902,426 | 1,915,914 |
| FHLMC Series 4921 Class FN (1 Month LIBOR+0.45%)± | | 0.57 | 10-25-2049 | 1,380,593 | 1,389,788 |
| FHLMC Series 4925 Class FY (1 Month LIBOR+0.45%)± | | 0.57 | 10-25-2049 | 738,111 | 742,091 |
| FHLMC Series 4933 Class FA (1 Month LIBOR+0.50%)± | | 0.62 | 12-25-2049 | 1,620,021 | 1,632,250 |
| FHLMC Series 5062 Class FC (30 Day Average U.S. SOFR+0.20%)± | | 0.24 | 1-25-2051 | 1,975,131 | 1,974,232 |
| FHLMC Series T-15 Class A6 (1 Month LIBOR+0.40%)± | | 0.52 | 11-25-2028 | 273,634 | 273,698 |
| FHLMC Series T-16 Class A (1 Month LIBOR+0.35%)± | | 0.22 | 6-25-2029 | 972,376 | 976,503 |
| FHLMC Series T-20 Class A7 (1 Month LIBOR+0.30%)± | | 0.27 | 12-25-2029 | 2,118,249 | 2,074,560 |
| FHLMC Series T-21 Class A (1 Month LIBOR+0.36%)± | | 0.30 | 10-25-2029 | 607,453 | 604,989 |
| FHLMC Series T-23 Class A (1 Month LIBOR+0.14%)± | | 0.27 | 5-25-2030 | 1,160,374 | 1,162,821 |
| FHLMC Series T-27 Class A (1 Month LIBOR+0.30%)± | | 0.27 | 10-25-2030 | 725,999 | 727,005 |
| FHLMC Series T-30 Class A7 (1 Month LIBOR+0.24%)± | | 0.36 | 12-25-2030 | 777,370 | 754,245 |
| FHLMC Series T-35 Class A (1 Month LIBOR+0.28%)± | | 0.26 | 9-25-2031 | 1,901,347 | 1,885,279 |
| FHLMC Series T-48 Class 2A ±± | | 3.71 | 7-25-2033 | 1,474,618 | 1,555,226 |
| FHLMC Series T-54 Class 4A ±± | | 3.68 | 2-25-2043 | 942,417 | 1,014,801 |
| FHLMC Series T-55 Class 1A1 | | 6.50 | 3-25-2043 | 44,342 | 52,174 |
| FHLMC Series T-56 Class 3AF (1 Month LIBOR+1.00%)± | | 1.12 | 5-25-2043 | 962,478 | 991,170 |
| FHLMC Series T-62 Class 1A1 (12 Month Treasury Average+1.20%)± | | 1.58 | 10-25-2044 | 2,178,599 | 2,199,493 |
| FHLMC Series T-63 Class 1A1 (12 Month Treasury Average+1.20%)± | | 1.70 | 2-25-2045 | 1,922,566 | 1,920,342 |
| FHLMC Series T-66 Class 2A1 ±± | | 3.44 | 1-25-2036 | 1,215,337 | 1,301,683 |
| FHLMC Series T-67 Class 1A1C ±± | | 3.16 | 3-25-2036 | 2,873,324 | 3,064,981 |
The accompanying notes are an integral part of these financial statements.
12 | Wells Fargo Adjustable Rate Government Fund
Portfolio of investments—February 28, 2021 (unaudited)
| | | Interest
rate | Maturity
date | Principal | Value |
| Agency securities (continued) | | | | | |
| FHLMC Series T-67 Class 2A1C ±± | | 3.25% | 3-25-2036 | $ 2,718,097 | $ 2,871,640 |
| FNMA (1 Month LIBOR+0.30%)± | | 0.42 | 12-1-2022 | 3,000,000 | 3,000,917 |
| FNMA (6 Month LIBOR+1.03%)± | | 1.28 | 2-1-2033 | 107,332 | 106,804 |
| FNMA (1 Month LIBOR+1.17%)± | | 1.30 | 5-1-2029 | 35,313 | 35,782 |
| FNMA (6 Month LIBOR+1.18%)± | | 1.43 | 8-1-2033 | 52,642 | 52,914 |
| FNMA (6 Month LIBOR+1.00%)± | | 1.51 | 6-1-2021 | 446 | 447 |
| FNMA (6 Month LIBOR+1.37%)± | | 1.62 | 1-1-2032 | 155,607 | 156,119 |
| FNMA (6 Month LIBOR+1.16%)± | | 1.62 | 8-1-2033 | 2,993 | 3,010 |
| FNMA (6 Month LIBOR+1.38%)± | | 1.63 | 12-1-2031 | 15,963 | 15,995 |
| FNMA (11th District Cost of Funds+1.25%)± | | 1.72 | 4-1-2042 | 1,176,556 | 1,182,907 |
| FNMA (11th District Cost of Funds+1.25%)± | | 1.72 | 10-1-2044 | 694,770 | 691,953 |
| FNMA (11th District Cost of Funds+1.25%)± | | 1.74 | 1-1-2038 | 21,761 | 21,701 |
| FNMA (11th District Cost of Funds+1.25%)± | | 1.75 | 11-1-2023 | 7,203 | 7,175 |
| FNMA (11th District Cost of Funds+1.25%)± | | 1.75 | 11-1-2024 | 85 | 85 |
| FNMA (6 Month LIBOR+1.38%)± | | 1.75 | 8-1-2031 | 108,739 | 109,377 |
| FNMA (11th District Cost of Funds+1.25%)± | | 1.77 | 3-1-2033 | 64,370 | 64,676 |
| FNMA (11th District Cost of Funds+1.26%)± | | 1.78 | 1-1-2035 | 332,895 | 334,305 |
| FNMA (6 Month LIBOR+1.53%)± | | 1.78 | 1-1-2035 | 742,461 | 771,119 |
| FNMA (6 Month LIBOR+1.42%)± | | 1.79 | 12-1-2031 | 122,970 | 123,939 |
| FNMA (6 Month LIBOR+1.55%)± | | 1.80 | 12-1-2022 | 1,803 | 1,806 |
| FNMA (6 Month LIBOR+1.35%)± | | 1.80 | 10-1-2037 | 348,581 | 360,503 |
| FNMA (1 Year Treasury Constant Maturity+1.70%)± | | 1.82 | 2-1-2033 | 199,002 | 200,869 |
| FNMA (6 Month LIBOR+1.55%)± | | 1.83 | 3-1-2034 | 136,976 | 138,667 |
| FNMA (1 Year Treasury Constant Maturity+1.52%)± | | 1.86 | 8-1-2033 | 661,729 | 667,218 |
| FNMA (6 Month LIBOR+1.52%)± | | 1.86 | 11-1-2034 | 309,429 | 311,724 |
| FNMA (1 Year Treasury Constant Maturity+1.74%)± | | 1.87 | 1-1-2035 | 38,030 | 37,972 |
| FNMA (6 Month LIBOR+1.63%)± | | 1.88 | 1-1-2022 | 1,450 | 1,449 |
| FNMA (1 Year Treasury Constant Maturity+1.66%)± | | 1.89 | 7-1-2048 | 750,463 | 773,030 |
| FNMA (12 Month Treasury Average+1.40%)± | | 1.90 | 12-1-2030 | 59,211 | 59,755 |
| FNMA (11th District Cost of Funds+1.25%)± | | 1.92 | 9-1-2037 | 1,183,171 | 1,188,825 |
| FNMA (6 Month LIBOR+1.08%)± | | 1.95 | 9-1-2032 | 46,330 | 46,340 |
| FNMA (6 Month LIBOR+1.74%)± | | 1.99 | 12-1-2024 | 31,595 | 31,606 |
| FNMA %% | | 2.00 | 3-11-2051 | 3,440,000 | 3,474,803 |
| FNMA (1 Year Treasury Constant Maturity+1.50%)± | | 2.06 | 8-1-2030 | 610,536 | 628,921 |
| FNMA (11th District Cost of Funds+1.78%)± | | 2.08 | 1-1-2036 | 156,320 | 156,855 |
| FNMA (12 Month LIBOR+1.56%)± | | 2.11 | 9-1-2036 | 207,166 | 209,207 |
| FNMA (6 Month LIBOR+1.74%)± | | 2.12 | 10-1-2024 | 24,049 | 24,143 |
| FNMA (1 Year Treasury Constant Maturity+1.76%)± | | 2.13 | 8-1-2032 | 114,960 | 115,458 |
| FNMA (12 Month LIBOR+1.75%)± | | 2.13 | 1-1-2035 | 304,315 | 318,806 |
| FNMA (11th District Cost of Funds+1.42%)± | | 2.14 | 4-1-2024 | 556,425 | 555,671 |
| FNMA (6 Month LIBOR+1.93%)± | | 2.18 | 6-1-2032 | 59,596 | 60,071 |
| FNMA (12 Month LIBOR+1.53%)± | | 2.18 | 9-1-2035 | 475,111 | 496,418 |
| FNMA (1 Year Treasury Constant Maturity+2.09%)± | | 2.21 | 1-1-2036 | 65,996 | 67,189 |
| FNMA (1 Year Treasury Constant Maturity+1.88%)± | | 2.26 | 8-1-2031 | 47,859 | 48,073 |
| FNMA (12 Month Treasury Average+1.75%)± | | 2.26 | 10-1-2035 | 399,924 | 413,068 |
| FNMA (12 Month LIBOR+1.65%)± | | 2.27 | 9-1-2037 | 524,659 | 526,465 |
| FNMA (6 Month LIBOR+1.96%)± | | 2.28 | 1-1-2033 | 53,143 | 53,434 |
| FNMA (11th District Cost of Funds+1.83%)± | | 2.29 | 1-1-2036 | 17,040 | 17,133 |
| FNMA (1 Year Treasury Constant Maturity+2.17%)± | | 2.29 | 12-1-2039 | 157,053 | 156,590 |
| FNMA (1 Year Treasury Constant Maturity+2.18%)± | | 2.30 | 12-1-2024 | 15,405 | 15,428 |
| FNMA (1 Year Treasury Constant Maturity+0.00%)± | | 2.30 | 1-1-2035 | 23,091 | 23,146 |
| FNMA (1 Year Treasury Constant Maturity+2.18%)± | | 2.30 | 1-1-2036 | 230,345 | 229,840 |
| FNMA (11th District Cost of Funds+1.81%)± | | 2.31 | 3-1-2033 | 188,986 | 189,760 |
| FNMA (1 Year Treasury Constant Maturity+2.13%)± | | 2.32 | 10-1-2025 | 57,692 | 57,842 |
| FNMA (12 Month LIBOR+1.82%)± | | 2.32 | 12-1-2046 | 62,424 | 62,471 |
The accompanying notes are an integral part of these financial statements.
Wells Fargo Adjustable Rate Government Fund | 13
Portfolio of investments—February 28, 2021 (unaudited)
| | | Interest
rate | Maturity
date | Principal | Value |
| Agency securities (continued) | | | | | |
| FNMA (12 Month LIBOR+1.83%)± | | 2.33% | 1-1-2033 | $ 184,149 | $ 184,851 |
| FNMA (1 Year Treasury Constant Maturity+0.00%)± | | 2.35 | 6-1-2026 | 115 | 115 |
| FNMA (1 Year Treasury Constant Maturity+2.22%)± | | 2.35 | 8-1-2031 | 90,608 | 90,744 |
| FNMA (1 Year Treasury Constant Maturity+2.22%)± | | 2.35 | 10-1-2034 | 126,185 | 126,265 |
| FNMA (12 Month Treasury Average+1.83%)± | | 2.35 | 11-1-2035 | 85,954 | 90,577 |
| FNMA (U.S. Treasury H15 Treasury Bill 6 Month Auction High Discount+2.23%)± | | 2.36 | 7-1-2025 | 557 | 557 |
| FNMA (11th District Cost of Funds+1.86%)± | | 2.36 | 10-1-2027 | 184,116 | 186,412 |
| FNMA (1 Year Treasury Constant Maturity+2.15%)± | | 2.37 | 2-1-2033 | 50,934 | 51,276 |
| FNMA (12 Month LIBOR+1.62%)± | | 2.38 | 8-1-2050 | 3,751,023 | 3,892,211 |
| FNMA (12 Month LIBOR+1.60%)± | | 2.39 | 3-1-2046 | 1,855,410 | 1,917,365 |
| FNMA (12 Month LIBOR+1.60%)± | | 2.39 | 8-1-2050 | 3,394,750 | 3,509,041 |
| FNMA (3 Year Treasury Constant Maturity+2.15%)± | | 2.40 | 10-1-2024 | 17,739 | 17,790 |
| FNMA (12 Month Treasury Average+1.85%)± | | 2.40 | 6-1-2035 | 323,627 | 340,946 |
| FNMA (1 Year Treasury Constant Maturity+2.18%)± | | 2.40 | 9-1-2035 | 747,127 | 794,280 |
| FNMA (12 Month Treasury Average+1.87%)± | | 2.40 | 11-1-2035 | 460,274 | 462,446 |
| FNMA (12 Month Treasury Average+1.94%)± | | 2.41 | 7-1-2035 | 583,521 | 616,709 |
| FNMA (6 Month LIBOR+2.02%)± | | 2.44 | 10-1-2024 | 23,393 | 23,657 |
| FNMA (1 Year Treasury Constant Maturity+2.32%)± | | 2.44 | 5-1-2025 | 19,169 | 19,220 |
| FNMA (1 Year Treasury Constant Maturity+2.32%)± | | 2.45 | 6-1-2032 | 17,000 | 16,980 |
| FNMA (1 Year Treasury Constant Maturity+2.09%)± | | 2.46 | 8-1-2025 | 13,326 | 13,361 |
| FNMA (12 Month LIBOR+1.90%)± | | 2.46 | 10-1-2034 | 371,576 | 375,234 |
| FNMA (1 Year Treasury Constant Maturity+2.21%)± | | 2.47 | 9-1-2022 | 25,906 | 26,187 |
| FNMA (1 Year Treasury Constant Maturity+2.03%)± | | 2.47 | 12-1-2033 | 392,199 | 394,896 |
| FNMA (1 Year Treasury Constant Maturity+2.31%)± | | 2.47 | 12-1-2034 | 344,325 | 353,186 |
| FNMA (12 Month LIBOR+1.68%)± | | 2.48 | 6-1-2041 | 1,467,026 | 1,547,066 |
| FNMA (11th District Cost of Funds+1.82%)± | | 2.49 | 5-1-2028 | 30,038 | 30,186 |
| FNMA (1 Year Treasury Constant Maturity+2.37%)± | | 2.50 | 7-1-2027 | 15,176 | 15,177 |
| FNMA (1 Year Treasury Constant Maturity+2.29%)± | | 2.50 | 1-1-2031 | 235,460 | 235,753 |
| FNMA (12 Month LIBOR+1.76%)± | | 2.50 | 1-1-2042 | 1,920,014 | 2,030,553 |
| FNMA %% | | 2.50 | 7-25-2050 | 3,440,000 | 3,566,313 |
| FNMA (12 Month Treasury Average+1.97%)± | | 2.51 | 11-1-2035 | 497,096 | 508,144 |
| FNMA (12 Month Treasury Average+1.99%)± | | 2.51 | 11-1-2035 | 16,296 | 17,219 |
| FNMA (12 Month Treasury Average+2.05%)± | | 2.52 | 7-1-2035 | 371,123 | 393,857 |
| FNMA (12 Month LIBOR+1.72%)± | | 2.52 | 7-1-2043 | 1,867,663 | 1,959,649 |
| FNMA (1 Year Treasury Constant Maturity+2.28%)± | | 2.53 | 9-1-2026 | 14,689 | 14,659 |
| FNMA (1 Year Treasury Constant Maturity+2.40%)± | | 2.53 | 9-1-2033 | 357,778 | 358,725 |
| FNMA (1 Year Treasury Constant Maturity+2.29%)± | | 2.54 | 12-1-2030 | 17,450 | 17,425 |
| FNMA (12 Month Treasury Average+2.01%)± | | 2.54 | 10-1-2035 | 228,890 | 242,446 |
| FNMA (1 Year Treasury Constant Maturity+2.11%)± | | 2.55 | 4-1-2040 | 85,758 | 89,460 |
| FNMA (12 Month LIBOR+1.62%)± | | 2.55 | 4-1-2050 | 2,010,113 | 2,091,179 |
| FNMA (12 Month LIBOR+1.95%)± | | 2.56 | 9-1-2035 | 212,755 | 225,973 |
| FNMA (1 Year Treasury Constant Maturity+2.18%)± | | 2.56 | 1-1-2036 | 344,285 | 344,986 |
| FNMA (12 Month LIBOR+1.77%)± | | 2.56 | 7-1-2044 | 2,266,954 | 2,398,599 |
| FNMA (1 Year Treasury Constant Maturity+2.33%)± | | 2.57 | 11-1-2024 | 26,866 | 27,149 |
| FNMA (1 Year Treasury Constant Maturity+2.19%)± | | 2.57 | 8-1-2033 | 363,197 | 364,334 |
| FNMA (12 Month Treasury Average+2.07%)± | | 2.57 | 1-1-2035 | 251,985 | 254,814 |
| FNMA (1 Year Treasury Constant Maturity+2.19%)± | | 2.58 | 1-1-2033 | 853,709 | 873,150 |
| FNMA (1 Year Treasury Constant Maturity+2.11%)± | | 2.58 | 7-1-2035 | 255,353 | 258,149 |
| FNMA (1 Year Treasury Constant Maturity+2.21%)± | | 2.58 | 8-1-2035 | 511,684 | 536,547 |
| FNMA (1 Year Treasury Constant Maturity+1.93%)± | | 2.58 | 7-1-2038 | 441,112 | 441,866 |
| FNMA (1 Year Treasury Constant Maturity+1.85%)± | | 2.60 | 11-1-2027 | 687 | 688 |
| FNMA (11th District Cost of Funds+1.92%)± | | 2.60 | 9-1-2030 | 159,764 | 159,030 |
| FNMA (1 Year Treasury Constant Maturity+2.48%)± | | 2.60 | 5-1-2035 | 352,699 | 374,330 |
| FNMA (1 Year Treasury Constant Maturity+2.18%)± | | 2.60 | 6-1-2035 | 173,973 | 175,062 |
The accompanying notes are an integral part of these financial statements.
14 | Wells Fargo Adjustable Rate Government Fund
Portfolio of investments—February 28, 2021 (unaudited)
| | | Interest
rate | Maturity
date | Principal | Value |
| Agency securities (continued) | | | | | |
| FNMA (1 Year Treasury Constant Maturity+2.22%)± | | 2.60% | 7-1-2035 | $ 57,478 | $ 59,801 |
| FNMA (1 Year Treasury Constant Maturity+2.22%)± | | 2.60 | 7-1-2035 | 330,946 | 344,331 |
| FNMA (1 Year Treasury Constant Maturity+2.27%)± | | 2.62 | 9-1-2030 | 52,602 | 52,647 |
| FNMA (1 Year Treasury Constant Maturity+2.14%)± | | 2.62 | 5-1-2034 | 344,094 | 344,280 |
| FNMA (1 Year Treasury Constant Maturity+2.36%)± | | 2.62 | 11-1-2034 | 205,512 | 219,062 |
| FNMA (1 Year Treasury Constant Maturity+2.50%)± | | 2.63 | 6-1-2032 | 75,974 | 75,581 |
| FNMA (1 Year Treasury Constant Maturity+2.52%)± | | 2.64 | 11-1-2024 | 14,974 | 14,995 |
| FNMA (1 Year Treasury Constant Maturity+2.28%)± | | 2.65 | 4-1-2024 | 11,862 | 11,866 |
| FNMA (1 Year Treasury Constant Maturity+2.20%)± | | 2.65 | 12-1-2040 | 2,404,507 | 2,552,912 |
| FNMA (12 Month LIBOR+1.59%)± | | 2.66 | 1-1-2040 | 89,126 | 90,887 |
| FNMA (1 Year Treasury Constant Maturity+2.22%)± | | 2.66 | 12-1-2040 | 1,833,778 | 1,947,367 |
| FNMA (1 Year Treasury Constant Maturity+2.25%)± | | 2.67 | 11-1-2038 | 2,872,570 | 3,065,916 |
| FNMA (1 Year Treasury Constant Maturity+2.38%)± | | 2.68 | 7-1-2027 | 56,724 | 57,210 |
| FNMA (12 Month LIBOR+1.67%)± | | 2.68 | 7-1-2035 | 685,340 | 722,154 |
| FNMA (12 Month LIBOR+1.72%)± | | 2.69 | 6-1-2035 | 75,679 | 79,829 |
| FNMA (1 Year Treasury Constant Maturity+2.21%)± | | 2.71 | 6-1-2033 | 84,781 | 84,827 |
| FNMA (1 Year Treasury Constant Maturity+2.60%)± | | 2.72 | 10-1-2025 | 5,207 | 5,242 |
| FNMA (1 Year Treasury Constant Maturity+2.60%)± | | 2.72 | 2-1-2028 | 27,890 | 27,865 |
| FNMA (1 Year Treasury Constant Maturity+2.23%)± | | 2.72 | 5-1-2033 | 669,399 | 675,371 |
| FNMA (6 Month LIBOR+2.25%)± | | 2.72 | 3-1-2034 | 434,494 | 441,513 |
| FNMA (1 Year Treasury Constant Maturity+2.22%)± | | 2.72 | 7-1-2037 | 195,588 | 208,606 |
| FNMA (12 Month LIBOR+1.87%)± | | 2.72 | 5-1-2038 | 409,592 | 434,919 |
| FNMA (1 Year Treasury Constant Maturity+2.50%)± | | 2.73 | 3-1-2027 | 54,378 | 54,754 |
| FNMA (6 Month LIBOR+2.48%)± | | 2.73 | 7-1-2033 | 30,730 | 30,730 |
| FNMA (1 Year Treasury Constant Maturity+2.25%)± | | 2.73 | 1-1-2037 | 699,191 | 713,727 |
| FNMA (11th District Cost of Funds+1.70%)± | | 2.74 | 4-1-2030 | 718 | 720 |
| FNMA (1 Year Treasury Constant Maturity+2.24%)± | | 2.75 | 5-1-2036 | 1,586,525 | 1,660,659 |
| FNMA (1 Year Treasury Constant Maturity+2.58%)± | | 2.77 | 3-1-2032 | 98,942 | 98,695 |
| FNMA (1 Year Treasury Constant Maturity+1.84%)± | | 2.78 | 4-1-2030 | 24,402 | 24,433 |
| FNMA (12 Month Treasury Average+2.23%)± | | 2.78 | 8-1-2035 | 354,819 | 358,357 |
| FNMA (12 Month LIBOR+1.90%)± | | 2.78 | 5-1-2037 | 934,710 | 992,237 |
| FNMA (1 Year Treasury Constant Maturity+2.24%)± | | 2.79 | 7-1-2038 | 2,210,178 | 2,353,996 |
| FNMA (1 Year Treasury Constant Maturity+2.30%)± | | 2.80 | 1-1-2026 | 119,677 | 119,759 |
| FNMA (1 Year Treasury Constant Maturity+2.10%)± | | 2.80 | 9-1-2036 | 250,276 | 249,705 |
| FNMA (12 Month LIBOR+1.70%)± | | 2.81 | 4-1-2034 | 367,032 | 385,895 |
| FNMA (1 Year Treasury Constant Maturity+2.26%)± | | 2.82 | 5-1-2033 | 107,388 | 108,061 |
| FNMA (1 Year Treasury Constant Maturity+2.22%)± | | 2.82 | 6-1-2035 | 323,143 | 344,360 |
| FNMA (1 Year Treasury Constant Maturity+2.27%)± | | 2.82 | 10-1-2036 | 314,935 | 335,343 |
| FNMA (1 Year Treasury Constant Maturity+2.22%)± | | 2.82 | 4-1-2038 | 414,812 | 420,273 |
| FNMA (1 Year Treasury Constant Maturity+2.21%)± | | 2.83 | 1-1-2027 | 118,421 | 118,782 |
| FNMA (1 Year Treasury Constant Maturity+2.40%)± | | 2.83 | 7-1-2030 | 209,375 | 210,134 |
| FNMA (12 Month LIBOR+1.78%)± | | 2.83 | 6-1-2036 | 166,107 | 175,350 |
| FNMA (1 Year Treasury Constant Maturity+2.47%)± | | 2.84 | 9-1-2028 | 31,050 | 30,971 |
| FNMA (1 Year Treasury Constant Maturity+2.03%)± | | 2.84 | 12-1-2032 | 333,970 | 334,182 |
| FNMA (6 Month LIBOR+1.98%)± | | 2.85 | 9-1-2033 | 48,450 | 48,765 |
| FNMA (12 Month LIBOR+1.75%)± | | 2.86 | 7-1-2035 | 337,333 | 355,807 |
| FNMA (12 Month Treasury Average+2.36%)± | | 2.86 | 8-1-2040 | 338,730 | 342,055 |
| FNMA (12 Month LIBOR+1.59%)± | | 2.86 | 6-1-2044 | 887,163 | 915,605 |
| FNMA (1 Year Treasury Constant Maturity+2.28%)± | | 2.89 | 4-1-2024 | 4,967 | 4,991 |
| FNMA (1 Year Treasury Constant Maturity+2.38%)± | | 2.89 | 1-1-2029 | 105,690 | 105,687 |
| FNMA (1 Year Treasury Constant Maturity+2.27%)± | | 2.91 | 6-1-2037 | 1,060,232 | 1,132,719 |
| FNMA (1 Year Treasury Constant Maturity+2.64%)± | | 2.92 | 10-1-2028 | 79,060 | 78,820 |
| FNMA (1 Year Treasury Constant Maturity+2.23%)± | | 2.93 | 9-1-2033 | 273,267 | 274,872 |
| FNMA (1 Year Treasury Constant Maturity+2.33%)± | | 2.94 | 12-1-2030 | 433,971 | 435,182 |
| FNMA (1 Year Treasury Constant Maturity+2.21%)± | | 2.94 | 10-1-2034 | 655,605 | 696,093 |
The accompanying notes are an integral part of these financial statements.
Wells Fargo Adjustable Rate Government Fund | 15
Portfolio of investments—February 28, 2021 (unaudited)
| | | Interest
rate | Maturity
date | Principal | Value |
| Agency securities (continued) | | | | | |
| FNMA (1 Year Treasury Constant Maturity+2.50%)± | | 2.95% | 7-1-2028 | $ 212,256 | $ 212,016 |
| FNMA (11th District Cost of Funds+1.28%)± | | 2.98 | 10-1-2034 | 58,462 | 59,102 |
| FNMA (1 Year Treasury Constant Maturity+2.19%)± | | 2.98 | 12-1-2040 | 5,001,710 | 5,311,175 |
| FNMA (1 Year Treasury Constant Maturity+2.49%)± | | 2.99 | 7-1-2037 | 81,399 | 81,948 |
| FNMA (6 Month LIBOR+2.55%)± | | 3.02 | 4-1-2033 | 201,771 | 202,540 |
| FNMA (1 Year Treasury Constant Maturity+2.21%)± | | 3.04 | 6-1-2027 | 56,254 | 56,216 |
| FNMA (1 Year Treasury Constant Maturity+2.29%)± | | 3.04 | 5-1-2034 | 117,148 | 117,166 |
| FNMA (6 Month LIBOR+2.31%)± | | 3.06 | 4-1-2033 | 166,676 | 167,029 |
| FNMA (1 Year Treasury Constant Maturity+2.20%)± | | 3.06 | 9-1-2035 | 1,558,010 | 1,655,050 |
| FNMA (1 Year Treasury Constant Maturity+1.58%)± | | 3.08 | 3-1-2034 | 240,683 | 241,396 |
| FNMA (1 Year Treasury Constant Maturity+2.24%)± | | 3.09 | 7-1-2028 | 74 | 75 |
| FNMA (11th District Cost of Funds+1.25%)± | | 3.14 | 4-1-2034 | 562,250 | 578,695 |
| FNMA (1 Year Treasury Constant Maturity+2.41%)± | | 3.19 | 5-1-2027 | 39,629 | 39,614 |
| FNMA (1 Year Treasury Constant Maturity+2.84%)± | | 3.20 | 9-1-2030 | 130,722 | 130,422 |
| FNMA (1 Year Treasury Constant Maturity+2.34%)± | | 3.21 | 9-1-2037 | 374,135 | 376,843 |
| FNMA (1 Year Treasury Constant Maturity+2.22%)± | | 3.26 | 7-1-2029 | 266,871 | 269,587 |
| FNMA (1 Year Treasury Constant Maturity+2.37%)± | | 3.26 | 9-1-2030 | 420,348 | 421,335 |
| FNMA (12 Month LIBOR+1.63%)± | | 3.26 | 11-1-2038 | 173,379 | 182,238 |
| FNMA (1 Year Treasury Constant Maturity+2.51%)± | | 3.32 | 8-1-2035 | 211,306 | 211,607 |
| FNMA (1 Year Treasury Constant Maturity+2.35%)± | | 3.33 | 6-1-2027 | 52,545 | 52,966 |
| FNMA (1 Year Treasury Constant Maturity+2.50%)± | | 3.33 | 10-1-2029 | 228,058 | 228,253 |
| FNMA (1 Year Treasury Constant Maturity+2.45%)± | | 3.33 | 7-1-2037 | 1,025,399 | 1,102,422 |
| FNMA (1 Year Treasury Constant Maturity+1.89%)± | | 3.39 | 6-1-2032 | 50,681 | 50,403 |
| FNMA (6 Month LIBOR+2.75%)± | | 3.45 | 5-1-2033 | 755,227 | 772,713 |
| FNMA (1 Year Treasury Constant Maturity+2.22%)± | | 3.48 | 8-1-2026 | 122,184 | 122,372 |
| FNMA (1 Year Treasury Constant Maturity+2.12%)± | | 3.49 | 8-1-2026 | 18,817 | 18,749 |
| FNMA (1 Year Treasury Constant Maturity+1.63%)± | | 3.50 | 11-1-2029 | 5,974 | 6,083 |
| FNMA (1 Year Treasury Constant Maturity+2.50%)± | | 3.52 | 9-1-2030 | 336,721 | 336,348 |
| FNMA (6 Month LIBOR+2.70%)± | | 3.55 | 1-1-2033 | 54,698 | 54,887 |
| FNMA (12 Month LIBOR+1.75%)± | | 3.58 | 4-1-2034 | 240,920 | 243,027 |
| FNMA (5 Year Treasury Constant Maturity+1.90%)± | | 3.60 | 9-1-2031 | 162,055 | 161,945 |
| FNMA (1 Year Treasury Constant Maturity+2.10%)± | | 3.60 | 7-1-2035 | 42,252 | 42,244 |
| FNMA (12 Month LIBOR+1.75%)± | | 3.61 | 5-1-2035 | 445,145 | 469,650 |
| FNMA (1 Year Treasury Constant Maturity+2.64%)± | | 3.62 | 7-1-2028 | 35,844 | 35,836 |
| FNMA (1 Year Treasury Constant Maturity+2.12%)± | | 3.62 | 3-1-2031 | 25,752 | 25,621 |
| FNMA (6 Month LIBOR+2.67%)± | | 3.67 | 4-1-2024 | 69,188 | 69,686 |
| FNMA (12 Month LIBOR+1.75%)± | | 3.68 | 4-1-2033 | 308,138 | 309,310 |
| FNMA (1 Year Treasury Constant Maturity+2.19%)± | | 3.69 | 3-1-2035 | 297,440 | 300,080 |
| FNMA (12 Month Treasury Average+2.48%)± | | 3.70 | 6-1-2040 | 512,802 | 514,621 |
| FNMA (1 Year Treasury Constant Maturity+2.21%)± | | 3.71 | 5-1-2037 | 517,239 | 517,001 |
| FNMA (1 Year Treasury Constant Maturity+2.25%)± | | 3.75 | 10-1-2029 | 13,875 | 13,878 |
| FNMA (1 Year Treasury Constant Maturity+2.32%)± | | 3.82 | 4-1-2028 | 68,291 | 68,348 |
| FNMA (1 Year Treasury Constant Maturity+2.39%)± | | 3.83 | 4-1-2038 | 209,415 | 209,428 |
| FNMA (5 Year Treasury Constant Maturity+2.42%)± | | 3.89 | 6-1-2028 | 16,950 | 17,011 |
| FNMA (1 Year Treasury Constant Maturity+2.28%)± | | 3.90 | 7-1-2024 | 5,098 | 5,102 |
| FNMA (Federal Cost of Funds+2.39%)± | | 3.95 | 2-1-2029 | 659,078 | 663,948 |
| FNMA (3 Year Treasury Constant Maturity+1.21%)± | | 3.95 | 3-1-2030 | 13,460 | 13,584 |
| FNMA (11th District Cost of Funds+1.81%)± | | 3.96 | 6-1-2034 | 70,416 | 71,448 |
| FNMA (1 Year Treasury Constant Maturity+2.40%)± | | 4.03 | 6-1-2024 | 20,710 | 20,653 |
| FNMA | | 4.06 | 7-1-2021 | 926,931 | 926,755 |
| FNMA (11th District Cost of Funds+1.93%)± | | 4.07 | 12-1-2036 | 35,774 | 37,632 |
| FNMA (6 Month LIBOR+3.47%)± | | 4.09 | 12-1-2032 | 130,602 | 131,036 |
| FNMA (Federal Cost of Funds+2.00%)± | | 4.11 | 8-1-2029 | 28,089 | 28,191 |
| FNMA (1 Year Treasury Constant Maturity+2.70%)± | | 4.13 | 5-1-2035 | 524,669 | 527,043 |
| FNMA (1 Year Treasury Constant Maturity+2.64%)± | | 4.14 | 3-1-2030 | 4,158 | 4,155 |
The accompanying notes are an integral part of these financial statements.
16 | Wells Fargo Adjustable Rate Government Fund
Portfolio of investments—February 28, 2021 (unaudited)
| | | Interest
rate | Maturity
date | Principal | Value |
| Agency securities (continued) | | | | | |
| FNMA | | 4.16% | 7-1-2021 | $ 1,300,000 | $ 1,301,781 |
| FNMA (6 Month LIBOR+3.57%)± | | 4.20 | 11-1-2031 | 6,199 | 6,212 |
| FNMA (11th District Cost of Funds+1.88%)± | | 4.33 | 5-1-2034 | 95,168 | 96,746 |
| FNMA (3 Year Treasury Constant Maturity+2.47%)± | | 4.34 | 6-1-2024 | 6,323 | 6,367 |
| FNMA (3 Year Treasury Constant Maturity+2.14%)± | | 4.39 | 10-1-2025 | 4,237 | 4,264 |
| FNMA (3 Year Treasury Constant Maturity+2.15%)± | | 4.90 | 8-1-2031 | 26,036 | 25,919 |
| FNMA | | 6.50 | 8-1-2028 | 35,733 | 36,165 |
| FNMA | | 6.50 | 5-1-2031 | 79,196 | 90,370 |
| FNMA | | 7.06 | 12-1-2024 | 15,373 | 15,459 |
| FNMA | | 7.06 | 1-1-2027 | 16,522 | 16,591 |
| FNMA | | 7.50 | 1-1-2031 | 31,211 | 34,011 |
| FNMA | | 7.50 | 1-1-2033 | 92,486 | 102,109 |
| FNMA | | 7.50 | 5-1-2033 | 86,340 | 95,913 |
| FNMA | | 7.50 | 5-1-2033 | 89,843 | 98,353 |
| FNMA | | 7.50 | 6-1-2033 | 18,481 | 18,645 |
| FNMA | | 7.50 | 7-1-2033 | 30,498 | 30,994 |
| FNMA | | 7.50 | 8-1-2033 | 45,700 | 47,611 |
| FNMA | | 8.00 | 12-1-2026 | 23,835 | 24,922 |
| FNMA | | 8.00 | 2-1-2030 | 138 | 139 |
| FNMA | | 8.00 | 3-1-2030 | 133 | 136 |
| FNMA | | 8.00 | 5-1-2033 | 39,993 | 40,534 |
| FNMA | | 8.50 | 8-15-2024 | 11,992 | 12,149 |
| FNMA Series 1992-39 Class FA (7 Year Treasury Constant Maturity+0.00%)± | | 0.95 | 3-25-2022 | 11,052 | 11,022 |
| FNMA Series 1992-45 Class F (7 Year Treasury Constant Maturity+0.00%)± | | 0.95 | 4-25-2022 | 2,335 | 2,326 |
| FNMA Series 1992-87 Class Z | | 8.00 | 5-25-2022 | 1,381 | 1,423 |
| FNMA Series 1993-113 Class FA (10 Year Treasury Constant Maturity-0.65%)± | | 0.66 | 7-25-2023 | 14,929 | 14,914 |
| FNMA Series 1993-247 Class FM (11th District Cost of Funds+1.20%)± | | 1.66 | 12-25-2023 | 86,761 | 87,842 |
| FNMA Series 1994-14 Class F (11th District Cost of Funds+1.60%)± | | 2.06 | 10-25-2023 | 49,395 | 50,231 |
| FNMA Series 2001-50 Class BA | | 7.00 | 10-25-2041 | 86,373 | 99,232 |
| FNMA Series 2001-63 Class FD (1 Month LIBOR+0.60%)± | | 0.71 | 12-18-2031 | 76,961 | 77,509 |
| FNMA Series 2001-81 Class F (1 Month LIBOR+0.55%)± | | 0.67 | 1-25-2032 | 32,286 | 32,517 |
| FNMA Series 2001-T08 Class A1 | | 7.50 | 7-25-2041 | 80,951 | 96,626 |
| FNMA Series 2001-T10 Class A2 | | 7.50 | 12-25-2041 | 1,369,622 | 1,579,726 |
| FNMA Series 2001-T12 Class A2 | | 7.50 | 8-25-2041 | 112,971 | 135,060 |
| FNMA Series 2001-T12 Class A4 ±± | | 4.02 | 8-25-2041 | 2,556,717 | 2,660,083 |
| FNMA Series 2001-W01 Class AV1 (1 Month LIBOR+0.12%)± | | 0.24 | 8-25-2031 | 38,013 | 37,106 |
| FNMA Series 2001-W03 Class A ±± | | 7.00 | 9-25-2041 | 325,652 | 366,085 |
| FNMA Series 2002-05 Class FD (1 Month LIBOR+0.90%)± | | 1.02 | 2-25-2032 | 64,418 | 65,258 |
| FNMA Series 2002-33 Class A4 ±± | | 5.32 | 11-25-2030 | 95,132 | 101,302 |
| FNMA Series 2002-59 Class F (1 Month LIBOR+0.40%)± | | 0.52 | 9-25-2032 | 181,954 | 182,238 |
| FNMA Series 2002-66 Class A3 ±± | | 3.81 | 4-25-2042 | 5,181,801 | 5,407,430 |
| FNMA Series 2002-T12 Class A3 | | 7.50 | 5-25-2042 | 993,241 | 1,197,811 |
| FNMA Series 2002-T12 Class A5 ±± | | 4.54 | 10-25-2041 | 1,173,641 | 1,241,728 |
| FNMA Series 2002-T18 Class A5 ±± | | 4.28 | 5-25-2042 | 2,279,610 | 2,479,907 |
| FNMA Series 2002-T19 Class A4 ±± | | 4.13 | 3-25-2042 | 141,479 | 155,364 |
| FNMA Series 2002-W01 Class 3A ±± | | 3.58 | 4-25-2042 | 648,964 | 679,227 |
| FNMA Series 2002-W04 Class A6 ±± | | 3.68 | 5-25-2042 | 1,047,223 | 1,106,165 |
| FNMA Series 2003-07 Class A2 ±± | | 3.59 | 5-25-2042 | 473,258 | 485,057 |
| FNMA Series 2003-63 Class A8 ±± | | 3.53 | 1-25-2043 | 865,424 | 904,998 |
| FNMA Series 2003-W02 Class 1A3 | | 7.50 | 7-25-2042 | 264,232 | 319,295 |
The accompanying notes are an integral part of these financial statements.
Wells Fargo Adjustable Rate Government Fund | 17
Portfolio of investments—February 28, 2021 (unaudited)
| | | Interest
rate | Maturity
date | Principal | Value |
| Agency securities (continued) | | | | | |
| FNMA Series 2003-W04 Class 5A ±± | | 3.65% | 10-25-2042 | $ 651,903 | $ 681,419 |
| FNMA Series 2003-W08 Class 4A ±± | | 3.80 | 11-25-2042 | 820,849 | 878,592 |
| FNMA Series 2003-W09 Class A (1 Month LIBOR+0.12%)± | | 0.37 | 6-25-2033 | 1,170,917 | 1,151,131 |
| FNMA Series 2003-W10 Class 2A ±± | | 3.52 | 6-25-2043 | 1,647,703 | 1,731,487 |
| FNMA Series 2003-W18 Class 2A ±± | | 3.70 | 6-25-2043 | 2,378,408 | 2,510,091 |
| FNMA Series 2003-W6 Class 6A ±± | | 3.50 | 8-25-2042 | 795,559 | 831,512 |
| FNMA Series 2004-17 Class FT (1 Month LIBOR+0.40%)± | | 0.52 | 4-25-2034 | 649,610 | 652,257 |
| FNMA Series 2004-T03 Class 1A3 | | 7.00 | 2-25-2044 | 310,194 | 370,270 |
| FNMA Series 2004-T03 Class 2A ±± | | 3.70 | 8-25-2043 | 890,863 | 925,333 |
| FNMA Series 2004-T1 Class 2A ±± | | 3.26 | 8-25-2043 | 1,096,529 | 1,167,711 |
| FNMA Series 2004-W01 Class 2A2 | | 7.00 | 12-25-2033 | 166,835 | 196,924 |
| FNMA Series 2004-W01 Class 3A ±± | | 4.01 | 1-25-2043 | 47,247 | 50,642 |
| FNMA Series 2004-W02 Class 5A | | 7.50 | 3-25-2044 | 65,625 | 76,795 |
| FNMA Series 2004-W12 Class 2A ±± | | 3.67 | 6-25-2044 | 2,530,837 | 2,689,727 |
| FNMA Series 2004-W15 Class 3A ±± | | 3.61 | 6-25-2044 | 3,886,119 | 4,110,285 |
| FNMA Series 2005-25 Class PF (1 Month LIBOR+0.35%)± | | 0.47 | 4-25-2035 | 904,088 | 909,041 |
| FNMA Series 2005-W03 Class 3A ±± | | 3.56 | 4-25-2045 | 728,038 | 793,789 |
| FNMA Series 2006-112 Class LF (1 Month LIBOR+0.55%)± | | 0.67 | 11-25-2036 | 1,164,058 | 1,178,318 |
| FNMA Series 2006-16 Class FA (1 Month LIBOR+0.30%)± | | 0.42 | 3-25-2036 | 658,238 | 660,698 |
| FNMA Series 2006-44 Class FY (1 Month LIBOR+0.57%)± | | 0.69 | 6-25-2036 | 908,153 | 921,401 |
| FNMA Series 2006-W01 Class 3A ±± | | 2.93 | 10-25-2045 | 2,864,442 | 3,001,491 |
| FNMA Series 2007-109 Class PF (1 Month LIBOR+0.65%)± | | 0.77 | 12-25-2037 | 906,693 | 920,731 |
| FNMA Series 2007-95 Class A2 (1 Month LIBOR+0.25%)± | | 0.38 | 8-27-2036 | 182,514 | 178,293 |
| FNMA Series 2008-67 Class FG (1 Month LIBOR+1.00%)± | | 1.12 | 7-25-2038 | 869,922 | 896,080 |
| FNMA Series 2009-11 Class FU (1 Month LIBOR+1.00%)± | | 1.12 | 3-25-2049 | 1,177,613 | 1,188,311 |
| FNMA Series 2010-54 Class AF (1 Month LIBOR+0.56%)± | | 0.68 | 4-25-2037 | 322,653 | 326,946 |
| FNMA Series 2011-21 Class PF (1 Month LIBOR+0.35%)± | | 0.47 | 12-25-2041 | 320,887 | 322,434 |
| FNMA Series 2012-47 Class FW (1 Month LIBOR+1.70%)± | | 1.82 | 5-25-2027 | 199,300 | 204,692 |
| FNMA Series 2013-130 Class CF (1 Month LIBOR+0.25%)± | | 0.37 | 6-25-2043 | 679,749 | 680,734 |
| FNMA Series 2013-23 Class LF (1 Month LIBOR+0.35%)± | | 0.49 | 3-25-2043 | 4,706,756 | 4,734,600 |
| FNMA Series 2013-86 Class GA | | 3.00 | 7-25-2030 | 1,070,660 | 1,076,659 |
| FNMA Series 2014-10 Class CF (1 Month LIBOR+0.30%)± | | 0.44 | 3-25-2044 | 1,248,666 | 1,249,742 |
| FNMA Series 2014-49 Class AF (1 Month LIBOR+0.32%)± | | 0.46 | 8-25-2044 | 186,909 | 186,759 |
| FNMA Series 2015-4 Class FA (1 Month LIBOR+0.35%)± | | 0.49 | 2-25-2045 | 1,588,280 | 1,588,793 |
| FNMA Series 2016-40 Class AF (1 Month LIBOR+0.45%)± | | 0.59 | 7-25-2046 | 568,961 | 569,456 |
| FNMA Series 2016-58 Class FA (1 Month LIBOR+0.48%)± | | 0.62 | 8-25-2046 | 1,049,728 | 1,046,923 |
| FNMA Series 2016-62 Class AF (1 Month LIBOR+0.45%)± | | 0.59 | 9-25-2046 | 996,434 | 1,002,936 |
| FNMA Series 2016-82 Class FM (1 Month LIBOR+0.40%)± | | 0.54 | 11-25-2046 | 2,172,949 | 2,175,082 |
| FNMA Series 2016-87 Class AF (1 Month LIBOR+0.40%)± | | 0.54 | 11-25-2046 | 480,692 | 479,341 |
| FNMA Series 2017-M6 Class F (1 Month LIBOR+0.48%)± | | 0.61 | 4-25-2029 | 2,864,480 | 2,889,623 |
| FNMA Series 2018-39 Class WF (1 Month LIBOR+0.30%)± | | 0.44 | 6-25-2048 | 5,243,337 | 5,254,668 |
| FNMA Series 2018-47 Class PC | | 3.50 | 9-25-2047 | 843,623 | 863,361 |
| FNMA Series 2018-72 Class FB (1 Month LIBOR+0.35%)± | | 0.47 | 10-25-2058 | 3,986,255 | 4,004,359 |
| FNMA Series 2019-25 Class FA (1 Month LIBOR+0.45%)± | | 0.57 | 6-25-2049 | 438,009 | 442,595 |
| FNMA Series 2019-41 Class F (1 Month LIBOR+0.50%)± | | 0.62 | 8-25-2059 | 3,806,114 | 3,842,710 |
| FNMA Series 2019-42 Class MF (1 Month LIBOR+0.40%)± | | 0.54 | 8-25-2059 | 3,118,548 | 3,106,121 |
| FNMA Series 2019-5 Class FE (1 Month LIBOR+0.45%)± | | 0.57 | 3-25-2049 | 726,449 | 735,288 |
| FNMA Series G92-20 Class FB (7 Year Treasury Constant Maturity+0.00%)± | | 0.95 | 4-25-2022 | 353 | 353 |
| FNMA Series G93-1 Class K | | 6.68 | 1-25-2023 | 47,250 | 48,833 |
| GNMA | | 6.45 | 4-20-2025 | 22,997 | 25,285 |
| GNMA | | 6.45 | 9-20-2025 | 24,609 | 28,014 |
| GNMA | | 6.50 | 6-20-2034 | 65,930 | 67,628 |
| GNMA | | 6.50 | 8-20-2034 | 273,214 | 290,552 |
| GNMA | | 6.75 | 2-15-2029 | 34,917 | 38,937 |
The accompanying notes are an integral part of these financial statements.
18 | Wells Fargo Adjustable Rate Government Fund
Portfolio of investments—February 28, 2021 (unaudited)
| | | Interest
rate | Maturity
date | Principal | Value |
| Agency securities (continued) | | | | | |
| GNMA | | 9.00% | 9-20-2024 | $ 584 | $ 593 |
| GNMA | | 9.00 | 11-20-2024 | 77 | 77 |
| GNMA | | 9.00 | 1-20-2025 | 1,933 | 2,025 |
| GNMA | | 9.00 | 2-20-2025 | 5,070 | 5,503 |
| GNMA Series 2004-80 Class FA (1 Month LIBOR+0.40%)± | | 0.51 | 10-20-2034 | 572,615 | 575,089 |
| GNMA Series 2008-65 Class FG (1 Month LIBOR+0.75%)± | | 0.86 | 8-20-2038 | 950,637 | 962,013 |
| GNMA Series 2008-68 Class FA (1 Month LIBOR+0.95%)± | | 1.06 | 8-20-2038 | 1,190,826 | 1,211,598 |
| GNMA Series 2009-50 Class FW (1 Month LIBOR+1.00%)± | | 1.11 | 7-20-2039 | 1,140,331 | 1,163,799 |
| GNMA Series 2009-52 Class FD (1 Month LIBOR+0.95%)± | | 1.06 | 7-16-2039 | 562,518 | 572,597 |
| GNMA Series 2010-25 Class FH (1 Month LIBOR+0.72%)± | | 0.83 | 2-16-2040 | 625,862 | 635,291 |
| GNMA Series 2011-H12 Class FA (1 Month LIBOR+0.49%)± | | 0.63 | 2-20-2061 | 1,259,295 | 1,261,122 |
| GNMA Series 2011-H17 Class FA (1 Month LIBOR+0.53%)± | | 0.67 | 6-20-2061 | 629,932 | 631,616 |
| GNMA Series 2014-H16 Class FL (1 Month LIBOR+0.47%)± | | 0.62 | 7-20-2064 | 1,086,423 | 1,084,677 |
| GNMA Series 2017-130 Class FH (1 Month LIBOR+0.30%)± | | 0.41 | 8-20-2047 | 1,985,192 | 1,987,036 |
| GNMA Series 2017-H11 Class FE (12 Month LIBOR+0.18%)± | | 1.18 | 5-20-2067 | 4,142,589 | 4,111,600 |
| GNMA Series 2017-H11 Class FP (1 Month LIBOR+0.22%)± | | 0.36 | 4-20-2067 | 280,718 | 280,464 |
| GNMA Series 2018-120 Class FL (1 Month LIBOR+0.30%)± | | 0.41 | 9-20-2048 | 985,044 | 983,976 |
| GNMA Series 2018-49 Class FM (1 Month LIBOR+0.25%)± | | 0.36 | 4-20-2048 | 2,568,379 | 2,568,542 |
| GNMA Series 2020-H19 Class FB (1 Month LIBOR+0.45%)± | | 0.56 | 11-20-2070 | 3,626,414 | 3,637,687 |
| Total Agency securities (Cost $337,129,785) | | | | | 339,937,018 |
| Asset-backed securities: 12.86% | | | | | |
| Brazos Education Funding Series 2015-1 Class A (1 Month LIBOR+1.00%)144A± | | 1.12 | 10-25-2056 | 3,137,342 | 3,152,831 |
| ECMC Group Student Loan Trust Series 2018-1A Class A (1 Month LIBOR+0.75%)144A± | | 0.87 | 2-27-2068 | 1,904,321 | 1,907,960 |
| ECMC Group Student Loan Trust Series 2018-2A Class A (1 Month LIBOR+0.80%)144A± | | 0.92 | 9-25-2068 | 4,388,756 | 4,379,605 |
| ECMC Group Student Loan Trust Series 2019-1A Class A1B (1 Month LIBOR+1.00%)144A± | | 1.12 | 7-25-2069 | 2,995,851 | 3,037,714 |
| ECMC Group Student Loan Trust Series 2020-2A Class A (1 Month LIBOR+1.15%)144A± | | 1.27 | 11-25-2069 | 3,964,583 | 4,005,309 |
| ECMC Group Student Loan Trust Series 2020-3A Class A1B (1 Month LIBOR+1.00%)144A± | | 1.12 | 1-27-2070 | 3,386,505 | 3,424,765 |
| EFS Volunteer LLC Series 2010-1 Class A2 (3 Month LIBOR+0.85%)144A± | | 1.07 | 10-25-2035 | 1,068,857 | 1,068,803 |
| Finance of America HECM Buyout 2020 Series HB2 Class A7 144A±± | | 1.71 | 7-25-2030 | 1,612,880 | 1,623,675 |
| Navient Student Loan Trust Series 2017-3A Class A2 (1 Month LIBOR+0.60%)144A± | | 0.73 | 7-26-2066 | 3,023,701 | 3,025,006 |
| Navient Student Loan Trust Series 2018-2A Class A3 (1 Month LIBOR+0.75%)144A± | | 0.87 | 3-25-2067 | 280,000 | 281,174 |
| Navient Student Loan Trust Series 2018-3A Class A2 (1 Month LIBOR+0.42%)144A± | | 0.54 | 3-25-2067 | 2,482,405 | 2,478,264 |
| Navient Student Loan Trust Series 2019-2A Class A2 (1 Month LIBOR+1.00%)144A± | | 1.13 | 2-27-2068 | 4,000,000 | 4,082,353 |
| Navient Student Loan Trust Series 2020-1A Class A1B (1 Month LIBOR+1.05%)144A± | | 1.17 | 6-25-2069 | 3,121,735 | 3,187,205 |
| Navient Student Loan Trust Series 2020-2A Class A1B (1 Month LIBOR+0.90%)144A± | | 1.02 | 8-26-2069 | 1,462,519 | 1,484,037 |
| Navient Student Loan Trust Series 2020-GA Class A 144A | | 1.17 | 9-16-2069 | 2,624,865 | 2,635,867 |
| Nelnet Student Loan Trust Series 2007-1 Class A3 (3 Month LIBOR+0.07%)± | | 0.26 | 5-27-2025 | 641,124 | 639,616 |
| Nelnet Student Loan Trust Series 2019-2A Class A (1 Month LIBOR+0.90%)144A± | | 1.02 | 6-27-2067 | 1,559,390 | 1,562,521 |
The accompanying notes are an integral part of these financial statements.
Wells Fargo Adjustable Rate Government Fund | 19
Portfolio of investments—February 28, 2021 (unaudited)
| | | Interest
rate | Maturity
date | Principal | Value |
| Asset-backed securities (continued) | | | | | |
| Nelnet Student Loan Trust Series 2019-4A Class A (1 Month LIBOR+0.87%)144A± | | 0.99% | 9-26-2067 | $ 943,079 | $ 953,121 |
| Nelnet Student Loan Trust Series 2019-7A Class A1 (1 Month LIBOR+0.50%)144A± | | 0.62 | 1-25-2068 | 1,132,425 | 1,133,744 |
| New Hampshire Higher Education Loan Corporation Series 2020-1 Class A1B (1 Month LIBOR+1.20%)± | | 1.33 | 9-25-2060 | 3,579,644 | 3,687,199 |
| North Texas Higher Education Authority Incorporated Series 2011-1 Class A1 (3 Month LIBOR+1.10%)± | | 1.34 | 4-1-2040 | 3,563,473 | 3,594,404 |
| RAAC Series 2007-SP1 Class A3 (1 Month LIBOR+0.96%)± | | 1.08 | 3-25-2037 | 151,883 | 151,957 |
| SLM Student Loan Trust Series 2004-10 Class A7B (3 Month LIBOR+0.60%)144A± | | 0.82 | 10-25-2029 | 533,383 | 534,113 |
| SLM Student Loan Trust Series 2005-4 Class A3 (3 Month LIBOR+0.12%)± | | 0.34 | 1-25-2027 | 860,794 | 857,465 |
| South Carolina Student Loan Series 2008-1 Class A4 (3 Month LIBOR+1.00%)± | | 1.23 | 9-3-2024 | 319,605 | 321,682 |
| Student Loan Consolidation Center Series 2011-1 Class A (1 Month LIBOR+1.22%)144A± | | 1.34 | 10-25-2027 | 349,316 | 351,423 |
| Towd Point Mortgage Trust Series 2017-5 Class A1 (1 Month LIBOR+0.60%)144A± | | 0.72 | 2-25-2057 | 1,419,810 | 1,419,810 |
| Total Asset-backed securities (Cost $54,420,104) | | | | | 54,981,623 |
| Non-agency mortgage-backed securities: 3.02% | | | | | |
| Angel Oak Mortgage Trust I LLC Series 2020-R1 Class A1 144A±± | | 0.99 | 4-25-2053 | 2,374,168 | 2,383,695 |
| Cascade Funding Mortgage Trust Series 2020-HB4 Class A 144A±± | | 0.95 | 12-26-2030 | 2,169,747 | 2,170,187 |
| GS Mortgage-Backed Securities Trust Series 2020-PJ4 Class A2 144A±± | | 3.00 | 1-25-2051 | 1,499,359 | 1,527,238 |
| JPMorgan Mortgage Trust Series 2016-5 Class A1 144A±± | | 2.59 | 12-25-2046 | 1,872,745 | 1,904,415 |
| Mello Warehouse Securitization Trust Series 2020-2 Class A (1 Month LIBOR+0.80%)144A± | | 0.92 | 11-25-2053 | 1,885,000 | 1,886,585 |
| MFRA Trust Series 2020-NQM3 Class A1 144A±± | | 1.01 | 1-26-2065 | 1,046,897 | 1,046,345 |
| New Residential Mortgage Loan Trust Series 2018-4A Class A1M (1 Month LIBOR+0.90%)144A± | | 1.02 | 1-25-2048 | 2,001,911 | 2,013,776 |
| Total Non-agency mortgage-backed securities (Cost $12,920,227) | | | | | 12,932,241 |
| | | Yield | | Shares | |
| Short-term investments: 5.95% | | | | | |
| Investment companies: 5.95% | | | | | |
| Wells Fargo Government Money Market Fund Select Class ♠∞## | | 0.03 | | 25,463,720 | 25,463,720 |
| Total Short-term investments (Cost $25,463,720) | | | | | 25,463,720 |
| Total investments in securities (Cost $429,933,836) | 101.30% | | | | 433,314,602 |
| Other assets and liabilities, net | (1.30) | | | | (5,551,349) |
| Total net assets | 100.00% | | | | $427,763,253 |
The accompanying notes are an integral part of these financial statements.
20 | Wells Fargo Adjustable Rate Government Fund
Portfolio of investments—February 28, 2021 (unaudited)
| ± | Variable rate investment. The rate shown is the rate in effect at period end. |
| ±± | The coupon of the security is adjusted based on the principal and interest payments received from the underlying pool of mortgages as well as the credit quality and the actual prepayment speed of the underlying mortgages. |
| ♀ | Investment in an interest-only security entitles holders to receive only the interest payments on the underlying mortgages. The principal amount shown is the notional amount of the underlying mortgages. The rate represents the coupon rate. |
| 144A | The security may be resold in transactions exempt from registration, normally to qualified institutional buyers, pursuant to Rule 144A under the Securities Act of 1933. |
| ## | All or a portion of this security is segregated for when-issued securities. |
| ♠ | The issuer of the security is an affiliated person of the Fund as defined in the Investment Company Act of 1940. |
| ∞ | The rate represents the 7-day annualized yield at period end. |
| %% | The security is purchased on a when-issued basis. |
| Abbreviations: |
| FHLMC | Federal Home Loan Mortgage Corporation |
| FNMA | Federal National Mortgage Association |
| GNMA | Government National Mortgage Association |
| LIBOR | London Interbank Offered Rate |
| SOFR | Secured Overnight Financing Rate |
Investments in affiliates
An affiliated investment is an investment in which the Fund owns at least 5% of the outstanding voting shares of the issuer or as a result of other relationships, such as the Fund and the issuer having the same investment manager. Transactions with issuers that were either affiliated persons of the Fund at the beginning of the period or the end of the period were as follows:
| | Value,
beginning of
period | Purchases | Sales
proceeds | Net
realized
gains
(losses) | Net
change in
unrealized
gains
(losses) | Value,
end of
period | % of
net
assets | Shares,
end
of period | Income
from
affiliated
securities |
| Short-term investments | | | | | | | | | |
| Investment companies | | | | | | | | | |
| Wells Fargo Government Money Market Fund Select Class | $49,544,301 | $223,504,172 | $(247,584,753) | $0 | $0 | $25,463,720 | 5.95% | 25,463,720 | $5,162 |
Futures contracts
| Description | Number of
contracts | Expiration
date | Notional
cost | Notional
value | Unrealized
gains | | Unrealized
losses |
| Short | | | | | | | |
| 10-Year U.S. Treasury Notes | (22) | 6-21-2021 | $ (2,944,234) | $ (2,919,812) | $ 24,422 | | $0 |
| 2-Year U.S. Treasury Notes | (427) | 6-30-2021 | (94,322,956) | (94,266,922) | 56,034 | | 0 |
| 5-Year U.S. Treasury Notes | (224) | 6-30-2021 | (27,954,584) | (27,769,000) | 185,584 | | 0 |
| | | | | | $266,040 | | $0 |
The accompanying notes are an integral part of these financial statements.
Wells Fargo Adjustable Rate Government Fund | 21
Statement of assets and liabilities—February 28, 2021 (unaudited)
| | |
| Assets | |
Investments in unaffiliated securities, at value (cost $404,470,116)
| $ 407,850,882 |
Investments in affiliated securites, at value (cost $25,463,720)
| 25,463,720 |
Cash
| 64,033 |
Principal paydown receivable
| 1,011,059 |
Receivable for interest
| 695,513 |
Segregated cash for futures contracts
| 335,000 |
Receivable for Fund shares sold
| 139,936 |
Prepaid expenses and other assets
| 44,359 |
Total assets
| 435,604,502 |
| Liabilities | |
Payable for when-issued transactions
| 7,165,413 |
Payable for Fund shares redeemed
| 370,839 |
Management fee payable
| 99,072 |
Dividends payable
| 41,194 |
Payable for daily variation margin on open futures contracts
| 40,280 |
Administration fees payable
| 32,761 |
Trustees’ fees and expenses payable
| 2,201 |
Distribution fee payable
| 2,194 |
Accrued expenses and other liabilities
| 87,295 |
Total liabilities
| 7,841,249 |
Total net assets
| $427,763,253 |
| Net assets consist of | |
Paid-in capital
| $ 421,788,819 |
Total distributable earnings
| 5,974,434 |
Total net assets
| $427,763,253 |
| Computation of net asset value and offering price per share | |
Net assets – Class A
| $ 102,630,508 |
Shares outstanding – Class A1
| 11,442,848 |
Net asset value per share – Class A
| $8.97 |
Maximum offering price per share – Class A2
| $9.15 |
Net assets – Class C
| $ 3,579,359 |
Shares outstanding – Class C1
| 399,775 |
Net asset value per share – Class C
| $8.95 |
Net assets – Administrator Class
| $ 7,903,067 |
Shares outstanding – Administrator Class1
| 880,952 |
Net asset value per share – Administrator Class
| $8.97 |
Net assets – Institutional Class
| $ 313,650,319 |
Shares outstanding – Institutional Class1
| 34,968,771 |
Net asset value per share – Institutional Class
| $8.97 |
| 1 | The Fund has an unlimited number of authorized shares |
| 2 | Maximum offering price is computed as 100/98 of net asset value. On investments of $50,000 or more, the offering price is reduced. |
The accompanying notes are an integral part of these financial statements.
22 | Wells Fargo Adjustable Rate Government Fund
Statement of operations—six months ended February 28, 2021 (unaudited)
| | |
| Investment income | |
Interest
| $ 3,128,493 |
Income from affiliated securities
| 5,162 |
Total investment income
| 3,133,655 |
| Expenses | |
Management fee
| 768,779 |
| Administration fees | |
Class A
| 84,426 |
Class C
| 3,471 |
Administrator Class
| 3,970 |
Institutional Class
| 128,596 |
| Shareholder servicing fees | |
Class A
| 131,758 |
Class C
| 5,420 |
Administrator Class
| 9,923 |
| Distribution fee | |
Class C
| 16,256 |
Custody and accounting fees
| 16,651 |
Professional fees
| 35,662 |
Registration fees
| 22,542 |
Shareholder report expenses
| 18,667 |
Trustees’ fees and expenses
| 9,557 |
Other fees and expenses
| 18,925 |
Total expenses
| 1,274,603 |
| Less: Fee waivers and/or expense reimbursements | |
Fund-level
| (58,694) |
Class A
| (24,129) |
Class C
| (2,398) |
Administrator Class
| (5,010) |
Net expenses
| 1,184,372 |
Net investment income
| 1,949,283 |
| Realized and unrealized gains (losses) on investments | |
| Net realized gains on | |
Unaffiliated securities
| 2,513,873 |
Futures contracts
| 293,981 |
Net realized gains on investments
| 2,807,854 |
| Net change in unrealized gains (losses) on | |
Unaffiliated securities
| (739,640) |
Futures contracts
| 302,417 |
Net change in unrealized gains (losses) on investments
| (437,223) |
Net realized and unrealized gains (losses) on investments
| 2,370,631 |
Net increase in net assets resulting from operations
| $4,319,914 |
The accompanying notes are an integral part of these financial statements.
Wells Fargo Adjustable Rate Government Fund | 23
Statement of changes in net assets
| | |
| | Six months ended
February 28, 2021
(unaudited) | Year ended
August 31, 2020 |
| Operations | | | | |
Net investment income
| | $ 1,949,283 | | $ 6,105,573 |
Net realized gains on investments
| | 2,807,854 | | 61,759 |
Net change in unrealized gains (losses) on investments
| | (437,223) | | (1,792,315) |
Net increase in net assets resulting from operations
| | 4,319,914 | | 4,375,017 |
| Distributions to shareholders from | | | | |
| Net investment income and net realized gains | | | | |
Class A
| | (386,724) | | (2,146,645) |
Class C
| | (1,135) | | (64,201) |
Administrator Class
| | (34,564) | | (118,284) |
Institutional Class
| | (1,616,168) | | (3,818,289) |
Total distributions to shareholders
| | (2,038,591) | | (6,147,419) |
| Capital share transactions | Shares | | Shares | |
| Proceeds from shares sold | | | | |
Class A
| 1,160,356 | 10,376,867 | 2,808,277 | 25,108,322 |
Class C
| 182,694 | 1,630,023 | 241,187 | 2,157,808 |
Administrator Class
| 14,158 | 126,507 | 341,277 | 3,042,765 |
Institutional Class
| 17,912,526 | 160,240,823 | 20,269,482 | 180,910,886 |
| | | 172,374,220 | | 211,219,781 |
| Reinvestment of distributions | | | | |
Class A
| 36,833 | 329,607 | 207,797 | 1,859,418 |
Class C
| 122 | 1,089 | 6,361 | 56,841 |
Administrator Class
| 3,821 | 34,207 | 13,037 | 116,596 |
Institutional Class
| 156,284 | 1,398,644 | 374,832 | 3,351,646 |
| | | 1,763,547 | | 5,384,501 |
| Payment for shares redeemed | | | | |
Class A
| (2,256,538) | (20,183,046) | (3,727,766) | (33,483,672) |
Class C
| (310,981) | (2,778,971) | (454,968) | (4,072,575) |
Administrator Class
| (42,147) | (376,878) | (43,358) | (388,738) |
Institutional Class
| (15,387,972) | (137,678,237) | (5,966,182) | (53,278,794) |
| | | (161,017,132) | | (91,223,779) |
Net increase in net assets resulting from capital share transactions
| | 13,120,635 | | 125,380,503 |
Total increase in net assets
| | 15,401,958 | | 123,608,101 |
| Net assets | | | | |
Beginning of period
| | 412,361,295 | | 288,753,194 |
End of period
| | $ 427,763,253 | | $412,361,295 |
The accompanying notes are an integral part of these financial statements.
24 | Wells Fargo Adjustable Rate Government Fund
Financial highlights
(For a share outstanding throughout each period)
| | | Year ended August 31 |
| Class A | Six months ended
February 28, 2021
(unaudited) | 2020 | 2019 | 2018 | 2017 | 2016 |
Net asset value, beginning of period
| $8.92 | $8.98 | $8.93 | $8.96 | $9.01 | $9.10 |
Net investment income
| 0.03 | 0.17 | 0.18 1 | 0.10 | 0.06 | 0.04 |
Net realized and unrealized gains (losses) on investments
| 0.05 | (0.06) | 0.05 | (0.01) | (0.04) | (0.06) |
Total from investment operations
| 0.08 | 0.11 | 0.23 | 0.09 | 0.02 | (0.02) |
| Distributions to shareholders from | | | | | | |
Net investment income
| (0.03) | (0.17) | (0.18) | (0.12) | (0.07) | (0.05) |
Net realized gains
| 0.00 | (0.00) 2 | 0.00 | 0.00 | 0.00 | 0.00 |
Tax basis return of capital
| 0.00 | 0.00 | 0.00 | 0.00 | 0.00 | (0.02) |
Total distributions to shareholders
| (0.03) | (0.17) | (0.18) | (0.12) | (0.07) | (0.07) |
Net asset value, end of period
| $8.97 | $8.92 | $8.98 | $8.93 | $8.96 | $9.01 |
Total return3
| 0.93% | 1.25% | 2.64% | 0.98% | 0.23% | (0.19)% |
| Ratios to average net assets (annualized) | | | | | | |
Gross expenses
| 0.81% | 0.88% | 0.88% | 0.83% | 0.80% | 0.78% |
Net expenses
| 0.74% | 0.74% | 0.74% | 0.74% | 0.74% | 0.74% |
Net investment income
| 0.69% | 1.92% | 2.04% | 1.28% | 0.72% | 0.56% |
| Supplemental data | | | | | | |
Portfolio turnover rate
| 40% | 9% | 5% | 3% | 2% | 13% |
Net assets, end of period (000s omitted)
| $102,631 | $111,538 | $118,675 | $103,963 | $153,953 | $172,131 |
| 1 | Calculated based upon average shares outstanding |
| 2 | Amount is less than $0.005. |
| 3 | Total return calculations do not include any sales charges. Returns for periods of less than one year are not annualized. |
The accompanying notes are an integral part of these financial statements.
Wells Fargo Adjustable Rate Government Fund | 25
Financial highlights
(For a share outstanding throughout each period)
| | | Year ended August 31 |
| Class C | Six months ended
February 28, 2021
(unaudited) | 2020 | 2019 | 2018 | 2017 | 2016 |
Net asset value, beginning of period
| $8.91 | $8.97 | $8.93 | $8.96 | $9.01 | $9.10 |
Net investment income (loss)
| 0.00 1,2 | 0.10 1 | 0.10 1 | 0.05 1 | (0.00) 1,3 | (0.02) 1 |
Net realized and unrealized gains (losses) on investments
| 0.04 | (0.06) | 0.06 | (0.03) | (0.05) | (0.07) |
Total from investment operations
| 0.04 | 0.04 | 0.16 | 0.02 | (0.05) | (0.09) |
| Distributions to shareholders from | | | | | | |
Net investment income
| (0.00) 2 | (0.10) | (0.12) | (0.05) | (0.00) 2 | (0.00) 2 |
Net realized gains
| 0.00 | (0.00) 2 | 0.00 | 0.00 | 0.00 | 0.00 |
Tax basis return of capital
| 0.00 | 0.00 | 0.00 | 0.00 | 0.00 | (0.00) 2 |
Total distributions to shareholders
| 0.00 | (0.10) | (0.12) | (0.05) | (0.00) 2 | (0.00) 2 |
Net asset value, end of period
| $8.95 | $8.91 | $8.97 | $8.93 | $8.96 | $9.01 |
Total return4
| 0.47% | 0.50% | 1.76% | 0.23% | (0.52)% | (0.94)% |
| Ratios to average net assets (annualized) | | | | | | |
Gross expenses
| 1.56% | 1.63% | 1.62% | 1.55% | 1.55% | 1.53% |
Net expenses
| 1.42% 5 | 1.49% | 1.49% | 1.49% | 1.49% | 1.49% |
Net investment income (loss)
| 0.02% | 1.17% | 1.13% | 0.54% | (0.04)% | (0.19)% |
| Supplemental data | | | | | | |
Portfolio turnover rate
| 40% | 9% | 5% | 3% | 2% | 13% |
Net assets, end of period (000s omitted)
| $3,579 | $4,702 | $6,594 | $45,693 | $60,766 | $97,452 |
| 1 | Calculated based upon average shares outstanding |
| 2 | Amount is less than $0.005. |
| 3 | Amount is more than $(0.005) |
| 4 | Total return calculations do not include any sales charges. Returns for periods of less than one year are not annualized. |
| 5 | During the six months ended February 28, 2021, class-level expenses were voluntarily waived by the investment manager. Without this voluntary waiver, the net expense ratio would have been 0.07% higher. |
The accompanying notes are an integral part of these financial statements.
26 | Wells Fargo Adjustable Rate Government Fund
Financial highlights
(For a share outstanding throughout each period)
| | | Year ended August 31 |
| Administrator Class | Six months ended
February 28, 2021
(unaudited) | 2020 | 2019 | 2018 | 2017 | 2016 |
Net asset value, beginning of period
| $8.92 | $8.98 | $8.93 | $8.96 | $9.01 | $9.10 |
Net investment income
| 0.04 1 | 0.18 1 | 0.19 1 | 0.13 1 | 0.07 1 | 0.06 |
Net realized and unrealized gains (losses) on investments
| 0.05 | (0.06) | 0.06 | (0.03) | (0.04) | (0.06) |
Total from investment operations
| 0.09 | 0.12 | 0.25 | 0.10 | 0.03 | 0.00 |
| Distributions to shareholders from | | | | | | |
Net investment income
| (0.04) | (0.18) | (0.20) | (0.13) | (0.08) | (0.07) |
Net realized gains
| 0.00 | (0.00) 2 | 0.00 | 0.00 | 0.00 | 0.00 |
Tax basis return of capital
| 0.00 | 0.00 | 0.00 | 0.00 | 0.00 | (0.02) |
Total distributions to shareholders
| (0.04) | (0.18) | (0.20) | (0.13) | (0.08) | (0.09) |
Net asset value, end of period
| $8.97 | $8.92 | $8.98 | $8.93 | $8.96 | $9.01 |
Total return3
| 0.99% | 1.40% | 2.78% | 1.12% | 0.37% | (0.05)% |
| Ratios to average net assets (annualized) | | | | | | |
Gross expenses
| 0.76% | 0.81% | 0.81% | 0.77% | 0.74% | 0.72% |
Net expenses
| 0.60% | 0.60% | 0.60% | 0.60% | 0.60% | 0.60% |
Net investment income
| 0.83% | 1.98% | 2.12% | 1.42% | 0.82% | 0.71% |
| Supplemental data | | | | | | |
Portfolio turnover rate
| 40% | 9% | 5% | 3% | 2% | 13% |
Net assets, end of period (000s omitted)
| $7,903 | $8,076 | $5,337 | $9,140 | $18,805 | $61,658 |
| 1 | Calculated based upon average shares outstanding |
| 2 | Amount is less than $0.005. |
| 3 | Returns for periods of less than one year are not annualized. |
The accompanying notes are an integral part of these financial statements.
Wells Fargo Adjustable Rate Government Fund | 27
Financial highlights
(For a share outstanding throughout each period)
| | | Year ended August 31 |
| Institutional Class | Six months ended
February 28, 2021
(unaudited) | 2020 | 2019 | 2018 | 2017 | 2016 |
Net asset value, beginning of period
| $8.92 | $8.98 | $8.93 | $8.96 | $9.01 | $9.10 |
Net investment income
| 0.04 | 0.19 1 | 0.22 | 0.16 | 0.09 | 0.08 |
Net realized and unrealized gains (losses) on investments
| 0.05 | (0.06) | 0.04 | (0.05) | (0.04) | (0.07) |
Total from investment operations
| 0.09 | 0.13 | 0.26 | 0.11 | 0.05 | 0.01 |
| Distributions to shareholders from | | | | | | |
Net investment income
| (0.04) | (0.19) | (0.21) | (0.14) | (0.10) | (0.07) |
Net realized gains
| 0.00 | (0.00) 2 | 0.00 | 0.00 | 0.00 | 0.00 |
Tax basis return of capital
| 0.00 | 0.00 | 0.00 | 0.00 | 0.00 | (0.03) |
Total distributions to shareholders
| (0.04) | (0.19) | (0.21) | (0.14) | (0.10) | (0.10) |
Net asset value, end of period
| $8.97 | $8.92 | $8.98 | $8.93 | $8.96 | $9.01 |
Total return3
| 1.07% | 1.54% | 2.93% | 1.26% | 0.51% | 0.09% |
| Ratios to average net assets (annualized) | | | | | | |
Gross expenses
| 0.49% | 0.54% | 0.54% | 0.50% | 0.47% | 0.45% |
Net expenses
| 0.46% | 0.46% | 0.46% | 0.46% | 0.46% | 0.45% |
Net investment income
| 0.96% | 2.12% | 2.27% | 1.55% | 0.98% | 0.84% |
| Supplemental data | | | | | | |
Portfolio turnover rate
| 40% | 9% | 5% | 3% | 2% | 13% |
Net assets, end of period (000s omitted)
| $313,650 | $288,045 | $158,147 | $235,078 | $397,529 | $702,617 |
| 1 | Calculated based upon average shares outstanding |
| 2 | Amount is less than $0.005. |
| 3 | Returns for periods of less than one year are not annualized. |
The accompanying notes are an integral part of these financial statements.
28 | Wells Fargo Adjustable Rate Government Fund
Notes to financial statements (unaudited)
1. ORGANIZATION
Wells Fargo Funds Trust (the “Trust”), a Delaware statutory trust organized on March 10, 1999, is an open-end management investment company registered under the Investment Company Act of 1940, as amended (the “1940 Act”). As an investment company, the Trust follows the accounting and reporting guidance in Financial Accounting Standards Board (“FASB”) Accounting Standards Codification Topic 946, Financial Services – Investment Companies. These financial statements report on the Wells Fargo Adjustable Rate Government Fund (the “Fund”) which is a diversified series of the Trust.
On February 23, 2021, Wells Fargo & Company announced that it has entered into a definitive agreement to sell Wells Fargo Asset Management (“WFAM”) to GTCR LLC and Reverence Capital Partners, L.P. WFAM is the trade name used by the asset management businesses of Wells Fargo & Company and includes Wells Fargo Funds Management, LLC, the investment manager to the Fund, Wells Capital Management Incorporated and Wells Fargo Asset Management (International) Limited, both registered investment advisers providing sub-advisory services to certain funds, and Wells Fargo Funds Distributor, LLC, the Fund's principal underwriter. As part of the transaction, Wells Fargo & Company will own a 9.9% equity interest and will continue to serve as an important client and distribution partner. The transaction is expected to close in the second half of 2021, subject to customary closing conditions.
Consummation of the transaction will result in the automatic termination of the Fund's investment management agreement and sub-advisory agreement. The Fund's Board of Trustees will be asked to approve new investment management arrangements with the new company. If approved by the Board, the new investment management arrangements with the new company will be presented to the shareholders of the Fund for approval, and, if approved by shareholders, would take effect upon the closing of the transaction. The transaction is expected to close in the second half of 2021, subject to customary closing conditions.
2. SIGNIFICANT ACCOUNTING POLICIES
The following significant accounting policies, which are consistently followed in the preparation of the financial statements of the Fund, are in conformity with U.S. generally accepted accounting principles which require management to make estimates and assumptions that affect the reported amounts of assets and liabilities, disclosure of contingent assets and liabilities at the date of the financial statements, and the reported amounts of income and expenses during the reporting period. Actual results could differ from those estimates.
Securities valuation
All investments are valued each business day as of the close of regular trading on the New York Stock Exchange (generally 4 p.m. Eastern Time), although the Fund may deviate from this calculation time under unusual or unexpected circumstances.
Debt securities are valued at the evaluated bid price provided by an independent pricing service (e.g. taking into account various factors, including yields, maturities, or credit ratings) or, if a reliable price is not available, the quoted bid price from an independent broker-dealer.
Futures contracts that are listed on a foreign or domestic exchange or market are valued at the official closing price or, if none, the last sales price.
Investments in registered open-end investment companies are valued at net asset value.
Investments which are not valued using any of the methods discussed above are valued at their fair value, as determined in good faith by the Board of Trustees. The Board of Trustees has established a Valuation Committee comprised of the Trustees and has delegated to it the authority to take any actions regarding the valuation of portfolio securities that the Valuation Committee deems necessary or appropriate, including determining the fair value of portfolio securities, unless the determination has been delegated to the Wells Fargo Asset Management Pricing Committee at Wells Fargo Funds Management, LLC (“Funds Management”). The Board of Trustees retains the authority to make or ratify any valuation decisions or approve any changes to the Valuation Procedures as it deems appropriate. On a quarterly basis, the Board of Trustees receives reports on any valuation actions taken by the Valuation Committee or the Wells Fargo Asset Management Pricing Committee which may include items for ratification.
When-issued transactions
The Fund may purchase securities on a forward commitment or when-issued basis. The Fund records a when-issued transaction on the trade date and will segregate assets in an amount at least equal in value to the Fund's commitment to purchase when-issued securities. Securities purchased on a when-issued basis are marked-to-market daily and the Fund begins earning interest on the settlement date. Losses may arise due to changes in the market value of the underlying securities or if the counterparty does not perform under the contract.
Wells Fargo Adjustable Rate Government Fund | 29
Notes to financial statements (unaudited)
Futures contracts
Futures contracts are agreements between the Fund and a counterparty to buy or sell a specific amount of a commodity, financial instrument or currency at a specified price on a specified date. The Fund may buy and sell futures contracts in order to gain exposure to, or protect against, changes in interest rates and is subject to interest rate risk. The primary risks associated with the use of futures contracts are the imperfect correlation between changes in market values of securities held by the Fund and the prices of futures contracts, and the possibility of an illiquid market. Futures contracts are generally entered into on a regulated futures exchange and cleared through a clearinghouse associated with the exchange. With futures contracts, there is minimal counterparty risk to the Fund since futures contracts are exchange traded and the exchange’s clearinghouse, as the counterparty to all exchange traded futures, guarantees the futures contracts against default.
Upon entering into a futures contract, the Fund is required to deposit either cash or securities (initial margin) with the broker in an amount equal to a certain percentage of the contract value. Subsequent payments (variation margin) are paid to or from the broker each day equal to the daily changes in the contract value. Such payments are recorded as unrealized gains or losses and, if any, shown as variation margin receivable (payable) in the Statement of Assets and Liabilities. Should the Fund fail to make requested variation margin payments, the broker can gain access to the initial margin to satisfy the Fund’s payment obligations. When the contracts are closed, a realized gain or loss is recorded in the Statement of Operations.
Mortgage dollar roll transactions
The Fund may engage in mortgage dollar roll transactions through TBA mortgage-backed securities issued by Government National Mortgage Association (GNMA), Federal National Mortgage Association (FNMA) and Federal Home Loan Mortgage Corporation (FHLMC). In a mortgage dollar roll transaction, the Fund sells a mortgage-backed security to a financial institution, such as a bank or broker-dealer and simultaneously agrees to repurchase a substantially similar security from the institution at a later date at an agreed upon price. The mortgage-backed securities that are repurchased will bear the same interest rate as those sold, but generally will be collateralized by different pools of mortgages with different pre-payment histories. During the roll period, the Fund foregoes principal and interest paid on the securities. The Fund is compensated by the difference between the current sales price and the forward price for the future purchase as well as by the earnings on the cash proceeds of the initial sale. Mortgage dollar rolls may be renewed without physical delivery of the securities subject to the contract. The Fund accounts for TBA dollar roll transactions as purchases and sales which, as a result, may increase its portfolio turnover rate.
Security transactions and income recognition
Securities transactions are recorded on a trade date basis. Realized gains or losses are recorded on the basis of identified cost.
Interest income is accrued daily and bond discounts are accreted and premiums are amortized daily. To the extent debt obligations are placed on non-accrual status, any related interest income may be reduced by writing off interest receivables when the collection of all or a portion of interest has been determined to be doubtful based on consistently applied procedures and the fair value has decreased. If the issuer subsequently resumes interest payments or when the collectability of interest is reasonably assured, the debt obligation is removed from non-accrual status. Paydown gains and losses are included in interest income.
Distributions to shareholders
Distributions to shareholders from net investment income are declared daily and paid monthly. Distributions from net realized gains, if any, are recorded on the ex-dividend date and paid at least annually. Such distributions are determined in accordance with income tax regulations and may differ from U.S. generally accepted accounting principles. Dividend sources are estimated at the time of declaration. The tax character of distributions is determined as of the Fund’s fiscal year end. Therefore, a portion of the Fund’s distributions made prior to the Fund’s fiscal year end may be categorized as a tax return of capital at year end.
Federal and other taxes
The Fund intends to continue to qualify as a regulated investment company by distributing substantially all of its investment company taxable income and any net realized capital gains (after reduction for capital loss carryforwards) sufficient to relieve it from all, or substantially all, federal income taxes. Accordingly, no provision for federal income taxes was required.
The Fund’s income and federal excise tax returns and all financial records supporting those returns for the prior three fiscal years are subject to examination by the federal and Delaware revenue authorities. Management has analyzed the Fund's tax positions taken on federal, state, and foreign tax returns for all open tax years and does not believe that there are any uncertain tax positions that require recognition of a tax liability.
30 | Wells Fargo Adjustable Rate Government Fund
Notes to financial statements (unaudited)
As of February 28, 2021, the aggregate cost of all investments for federal income tax purposes was $429,916,790 and the unrealized gains (losses) consisted of:
| Gross unrealized gains | $ 4,667,630 |
| Gross unrealized losses | (1,003,778) |
| Net unrealized gains | $ 3,663,852 |
As of August 31, 2020, the Fund had capital loss carryforwards which consisted of $35,267 in long-term capital losses.
Class allocations
The separate classes of shares offered by the Fund differ principally in applicable sales charges, distribution, shareholder servicing, and administration fees. Class specific expenses are charged directly to that share class. Investment income, common fund-level expenses, and realized and unrealized gains (losses) on investments are allocated daily to each class of shares based on the relative proportion of net assets of each class.
3. FAIR VALUATION MEASUREMENTS
Fair value measurements of investments are determined within a framework that has established a fair value hierarchy based upon the various data inputs utilized in determining the value of the Fund’s investments. The three-level hierarchy gives the highest priority to unadjusted quoted prices in active markets for identical assets or liabilities (Level 1) and the lowest priority to unobservable inputs (Level 3). The Fund’s investments are classified within the fair value hierarchy based on the lowest level of input that is significant to the fair value measurement. The inputs are summarized into three broad levels as follows:
| ■ | Level 1 – quoted prices in active markets for identical securities |
| ■ | Level 2 – other significant observable inputs (including quoted prices for similar securities, interest rates, prepayment speeds, credit risk, etc.) |
| ■ | Level 3 – significant unobservable inputs (including the Fund’s own assumptions in determining the fair value of investments) |
The inputs or methodologies used for valuing investments in securities are not necessarily an indication of the risk associated with investing in those securities.
The following is a summary of the inputs used in valuing the Fund’s assets and liabilities as of February 28, 2021:
| | Quoted prices
(Level 1) | Other significant
observable inputs
(Level 2) | Significant
unobservable inputs
(Level 3) | Total |
| Assets | | | | |
| Investments in: | | | | |
| Agency securities | $ 0 | $ 339,937,018 | $0 | $ 339,937,018 |
| Asset-backed securities | 0 | 54,981,623 | 0 | 54,981,623 |
| Non-agency mortgage-backed securities | 0 | 12,932,241 | 0 | 12,932,241 |
| Short-term investments | | | | |
| Investment companies | 25,463,720 | 0 | 0 | 25,463,720 |
| Total assets | $25,463,720 | $407,850,882 | $0 | $433,314,602 |
| Liabilities | | | | |
| Futures contracts | $ 266,040 | $ 0 | $0 | $ 266,040 |
| Total liabilities | $ 266,040 | $ 0 | $0 | $ 266,040 |
Futures contracts are reported at their cumulative unrealized gains (losses) at measurement date as reported in the table following the Portfolio of Investments. For futures contracts, the current day’s variation margin is reported on the Statement of Assets and Liabilities. All other assets and liabilities are reported at their market value at measurement date.
Additional sector, industry or geographic detail, if any, is included in the Portfolio of Investments.
For the six months ended February 28, 2021, the Fund did not have any transfers into/out of Level 3.
Wells Fargo Adjustable Rate Government Fund | 31
Notes to financial statements (unaudited)
4. TRANSACTIONS WITH AFFILIATES
Management fee
Funds Management, an indirect wholly owned subsidiary of Wells Fargo & Company (“Wells Fargo”), is the manager of the Fund and provides advisory and fund-level administrative services under an investment management agreement. Under the investment management agreement, Funds Management is responsible for, among other services, implementing the investment objectives and strategies of the Fund, supervising the subadviser and providing fund-level administrative services in connection with the Fund’s operations. As compensation for its services under the investment management agreement, Funds Management is entitled to receive a management fee at the following annual rate based on the Fund’s average daily net assets:
| Average daily net assets | Management fee |
| First $1 billion | 0.350% |
| Next $4 billion | 0.325 |
| Next $3 billion | 0.290 |
| Next $2 billion | 0.265 |
| Over $10 billion | 0.255 |
For the six months ended February 28, 2021, the management fee was equivalent to an annual rate of 0.35% of the Fund’s average daily net assets.
Funds Management has retained the services of a subadviser to provide daily portfolio management to the Fund. The fee for subadvisory services is borne by Funds Management. Wells Capital Management Incorporated, an affiliate of Funds Management and an indirect wholly owned subsidiary of Wells Fargo, is the subadviser to the Fund and is entitled to receive a fee from Funds Management at an annual rate starting at 0.20% and declining to 0.10% as the average daily net assets of the Fund increase.
Administration fees
Under a class-level administration agreement, Funds Management provides class-level administrative services to the Fund, which includes paying fees and expenses for services provided by the transfer agent, sub-transfer agents, omnibus account servicers and record-keepers. As compensation for its services under the class-level administration agreement, Funds Management receives an annual fee which is calculated based on the average daily net assets of each class as follows:
| | Class-level
administration fee |
| Class A | 0.16% |
| Class C | 0.16 |
| Administrator Class | 0.10 |
| Institutional Class | 0.08 |
32 | Wells Fargo Adjustable Rate Government Fund
Notes to financial statements (unaudited)
Waivers and/or expense reimbursements
Funds Management has contractually waived and/or reimbursed management and administration fees to the extent necessary to maintain certain net operating expense ratios for the Fund. When each class of the Fund has exceeded its expense cap, Funds Management has waived fees and/or reimbursed expenses from fund-level expenses on a proportionate basis and then from class specific expenses. When only certain classes exceed their expense caps, waivers and/or reimbursements are applied against class specific expenses before fund-level expenses. Funds Management has committed through December 31, 2021 to waive fees and/or reimburse expenses to the extent necessary to cap expenses. Prior to or after the commitment expiration date, the cap may be increased or the commitment to maintain the cap may be terminated only with the approval of the Board of Trustees. In addition to the contractual waivers and/or reimbursements, Funds Management also voluntarily waived class-level expenses during the six months ended February 28, 2021. These voluntary class-level waivers may be discontinued at any time. The contractual expense caps are as follows:
| | Expense ratio caps |
| Class A | 0.74% |
| Class C | 1.49 |
| Administrator Class | 0.60 |
| Institutional Class | 0.46 |
Distribution fee
The Trust has adopted a distribution plan for Class C shares of the Fund pursuant to Rule 12b-1 under the 1940 Act. A distribution fee is charged charged to Class C shares and paid to Wells Fargo Funds Distributor, LLC (“Funds Distributor”), the principal underwriter, at an annual rate of 0.75% of the average daily net assets of Class C shares.
In addition, Funds Distributor is entitled to receive the front-end sales charge from the purchase of Class A shares and a contingent deferred sales charge on the redemption of certain Class A shares. Funds Distributor is also entitled to receive the contingent deferred sales charges from redemptions of Class C shares. For the six months ended February 28, 2021, Funds Distributor received $175 from the sale of Class A shares. No contingent deferred sales charges were incurred by Class A and Class C shares for the six months ended February 28, 2021.
Shareholder servicing fees
The Trust has entered into contracts with one or more shareholder servicing agents, whereby Class A, Class C, and Administrator Class of the Fund are charged a fee at an annual rate of 0.25% of the average daily net assets of each respective class. A portion of these total shareholder servicing fees were paid to affiliates of Wells Fargo.
Interfund transactions
The Fund may purchase or sell portfolio investment securities to certain other Wells Fargo affiliates pursuant to Rule 17a-7 under the 1940 Act and under procedures adopted by the Board of Trustees. The procedures have been designed to ensure that these interfund transactions, which do not incur broker commissions, are effected at current market prices.
5. INVESTMENT PORTFOLIO TRANSACTIONS
Purchases and sales of investments, excluding short-term securities, for the six months ended February 28, 2021 were as follows:
| Purchases at cost | | Sales proceeds |
U.S.
government | Non-U.S.
government | | U.S.
government | Non-U.S.
government |
| $192,328,685 | $61,724,391 | | $157,814,534 | $9,475,757 |
6. DERIVATIVE TRANSACTIONS
During the six months ended February 28, 2021, the Fund entered into futures contracts for duration and curve management. The Fund had an average notional amount of $678,501 in long futures contracts and $114,436,402 in short futures contracts during the six months ended February 28, 2021.
Wells Fargo Adjustable Rate Government Fund | 33
Notes to financial statements (unaudited)
The fair value, realized gains or losses and change in unrealized gains or losses, if any, on derivative instruments are reflected in the corresponding financial statement captions.
7. BANK BORROWINGS
The Trust (excluding the money market funds), Wells Fargo Master Trust and Wells Fargo Variable Trust are parties to a $350,000,000 revolving credit agreement whereby the Fund is permitted to use bank borrowings for temporary or emergency purposes, such as to fund shareholder redemption requests. Interest under the credit agreement is charged to the Fund based on a borrowing rate equal to the higher of the Federal Funds rate in effect on that day plus 1.25% or the overnight LIBOR rate in effect on that day plus 1.25%. In addition, an annual commitment fee equal to 0.25% of the unused balance is allocated to each participating fund.
For the six months ended February 28, 2021, there were no borrowings by the Fund under the agreement.
8. INDEMNIFICATION
Under the Fund's organizational documents, the officers and Trustees have been granted certain indemnification rights against certain liabilities that may arise out of performance of their duties to the Fund. The Fund has entered into a separate agreement with each Trustee that converts indemnification rights currently existing under the Fund’s organizational documents into contractual rights that cannot be changed in the future without the consent of the Trustee. Additionally, in the normal course of business, the Fund may enter into contracts with service providers that contain a variety of indemnification clauses. The Fund’s maximum exposure under these arrangements is dependent on future claims that may be made against the Fund and, therefore, cannot be estimated.
9. CORONAVIRUS (COVID-19) PANDEMIC
On March 11, 2020, the World Health Organization announced that it had made the assessment that coronavirus disease 2019 (“COVID-19”) is a pandemic. The impacts of COVID-19 are affecting the entire global economy, individual companies and investment products, the funds, and the market in general. There is significant uncertainty around the extent and duration of business disruptions related to COVID-19 and the impacts may last for an extended period of time. COVID-19 has led to significant uncertainty and volatility in the financial markets.
34 | Wells Fargo Adjustable Rate Government Fund
Other information (unaudited)
PROXY VOTING INFORMATION
A description of the policies and procedures used to determine how to vote proxies relating to portfolio securities is available without charge, upon request, by calling 1-800-222-8222, visiting our website at wfam.com, or visiting the SEC website at sec.gov. Information regarding how the proxies related to portfolio securities were voted during the most recent 12-month period ended June 30 is available on the website at wfam.com or by visiting the SEC website at sec.gov.
QUARTERLY PORTFOLIO HOLDINGS INFORMATION
The Fund files its complete schedule of portfolio holdings with the SEC for the first and third quarters of each fiscal year as an exhibit to its reports on Form N-PORT. Shareholders may view the filed Form N-PORT by visiting the SEC website at sec.gov.
Wells Fargo Adjustable Rate Government Fund | 35
Other information (unaudited)
BOARD OF TRUSTEES AND OFFICERS
Each of the Trustees and Officers listed in the table below acts in identical capacities for each fund in the Wells Fargo family of funds, which consists of 144 mutual funds comprising the Wells Fargo Funds Trust, Wells Fargo Variable Trust, Wells Fargo Master Trust and four closed-end funds (collectively the “Fund Complex”). This table should be read in conjunction with the Prospectus and the Statement of Additional Information1. The mailing address of each Trustee and Officer is 525 Market Street, 12th Floor, San Francisco, CA 94105. Each Trustee and Officer serves an indefinite term, however, each Trustee serves such term until reaching the mandatory retirement age established by the Trustees.
Independent Trustees
Name and
year of birth | Position held and
length of service* | Principal occupations during past five years or longer | Current other
public company or
investment
company
directorships |
William R. Ebsworth
(Born 1957) | Trustee,
since 2015 | Retired. From 1984 to 2013, equities analyst, portfolio manager, research director and chief investment officer at Fidelity Management and Research Company in Boston, Tokyo, and Hong Kong, and retired in 2013 as Chief Investment Officer of Fidelity Strategic Advisers, Inc. where he led a team of investment professionals managing client assets. Prior thereto, Board member of Hong Kong Securities Clearing Co., Hong Kong Options Clearing Corp., the Thailand International Fund, Ltd., Fidelity Investments Life Insurance Company, and Empire Fidelity Investments Life Insurance Company. Audit Committee Chair and Investment Committee Chair of the Vincent Memorial Hospital Endowment (non-profit organization). Mr. Ebsworth is a CFA® charterholder. | N/A |
Jane A. Freeman
(Born 1953) | Trustee,
since 2015;
Chair Liaison,
since 2018 | Retired. From 2012 to 2014 and 1999 to 2008, Chief Financial Officer of Scientific Learning Corporation. From 2008 to 2012, Ms. Freeman provided consulting services related to strategic business projects. Prior to 1999, Portfolio Manager at Rockefeller & Co. and Scudder, Stevens & Clark. Board member of the Harding Loevner Funds from 1996 to 2014, serving as both Lead Independent Director and chair of the Audit Committee. Board member of the Russell Exchange Traded Funds Trust from 2011 to 2012 and the chair of the Audit Committee. Ms. Freeman is also an inactive Chartered Financial Analyst. | N/A |
Isaiah Harris, Jr.
(Born 1952) | Trustee,
since 2009; Audit
Committee
Chair,
since 2019 | Retired. Chairman of the Board of CIGNA Corporation since 2009, and Director since 2005. From 2003 to 2011, Director of Deluxe Corporation. Prior thereto, President and CEO of BellSouth Advertising and Publishing Corp. from 2005 to 2007, President and CEO of BellSouth Enterprises from 2004 to 2005 and President of BellSouth Consumer Services from 2000 to 2003. Emeritus member of the Iowa State University Foundation Board of Governors. Emeritus Member of the Advisory Board of Iowa State University School of Business. Advisory Board Member, Palm Harbor Academy (private school). Mr. Harris is a certified public accountant (inactive status). | CIGNA Corporation |
Judith M. Johnson
(Born 1949) | Trustee,
since 2008 | Retired. Prior thereto, Chief Executive Officer and Chief Investment Officer of Minneapolis Employees Retirement Fund from 1996 to 2008. Ms. Johnson is an attorney, certified public accountant and a certified managerial accountant. | N/A |
David F. Larcker
(Born 1950) | Trustee,
since 2009 | James Irvin Miller Professor of Accounting at the Graduate School of Business (Emeritus), Stanford University, Director of the Corporate Governance Research Initiative and Senior Faculty of The Rock Center for Corporate Governance since 2006. From 2005 to 2008, Professor of Accounting at the Graduate School of Business, Stanford University. Prior thereto, Ernst & Young Professor of Accounting at The Wharton School, University of Pennsylvania from 1985 to 2005. | N/A |
36 | Wells Fargo Adjustable Rate Government Fund
Other information (unaudited)
Name and
year of birth | Position held and
length of service* | Principal occupations during past five years or longer | Current other
public company or
investment
company
directorships |
Olivia S. Mitchell
(Born 1953) | Trustee,
since 2006;
Nominating and
Governance
Committee Chair,
since 2018 | International Foundation of Employee Benefit Plans Professor, Wharton School of the University of Pennsylvania since 1993. Director of Wharton’s Pension Research Council and Boettner Center on Pensions & Retirement Research, and Research Associate at the National Bureau of Economic Research. Previously, Cornell University Professor from 1978 to 1993. | N/A |
Timothy J. Penny
(Born 1951) | Trustee,
since 1996;
Chair,
since 2018 | President and Chief Executive Officer of Southern Minnesota Initiative Foundation, a non-profit organization, since 2007. Member of the Board of Trustees of NorthStar Education Finance, Inc., a non-profit organization, since 2007. | N/A |
James G. Polisson
(Born 1959) | Trustee,
since 2018 | Retired. Chief Marketing Officer, Source (ETF) UK Services, Ltd, from 2015 to 2017. From 2012 to 2015, Principal of The Polisson Group, LLC, a management consulting, corporate advisory and principal investing company. Chief Executive Officer and Managing Director at Russell Investments, Global Exchange Traded Funds from 2010 to 2012. Managing Director of Barclays Global Investors from 1998 to 2010 and Global Chief Marketing Officer for iShares and Barclays Global Investors from 2000 to 2010. Trustee of the San Francisco Mechanics’ Institute, a non-profit organization, from 2013 to 2015. Board member of the Russell Exchange Traded Fund Trust from 2011 to 2012. Director of Barclays Global Investors Holdings Deutschland GmbH from 2006 to 2009. Mr. Polisson is an attorney and has a retired status with the Massachusetts and District of Columbia Bar Associations. | N/A |
Pamela Wheelock
(Born 1959) | Trustee,
since January
2020; previously
Trustee from
January 2018 to
July 2019 | Board member of the Destination Medical Center Economic Development Agency, Rochester, Minnesota since 2019. Interim President of the McKnight Foundation from January to September 2020. Acting Commissioner, Minnesota Department of Human Services, July 2019 through September 2019. Human Services Manager (part-time), Minnesota Department of Human Services, October 2019 through December 2019. Chief Operating Officer, Twin Cities Habitat for Humanity from 2017 to 2019. Vice President of University Services, University of Minnesota from 2012 to 2016. Prior thereto, on the Board of Directors, Governance Committee and Finance Committee for the Minnesota Philanthropy Partners (Saint Paul Foundation) from 2012 to 2018, Interim Chief Executive Officer of Blue Cross Blue Shield of Minnesota from 2011 to 2012, Chairman of the Board from 2009 to 2012 and Board Director from 2003 to 2015. Vice President, Leadership and Community Engagement, Bush Foundation, Saint Paul, Minnesota (a private foundation) from 2009 to 2011. Executive Vice President and Chief Financial Officer, Minnesota Sports and Entertainment from 2004 to 2009 and Senior Vice President from 2002 to 2004. Executive Vice President of the Minnesota Wild Foundation from 2004 to 2008. Commissioner of Finance, State of Minnesota, from 1999 to 2002. Currently Board Chair of the Minnesota Wild Foundation since 2010. | N/A |
* Length of service dates reflect the Trustee’s commencement of service with the Trust’s predecessor entities, where applicable.
Wells Fargo Adjustable Rate Government Fund | 37
Other information (unaudited)
Officers
Name and
year of birth | Position held and
length of service | Principal occupations during past five years or longer |
Andrew Owen
(Born 1960) | President,
since 2017 | Executive Vice President of Wells Fargo & Company and Head of Affiliated Managers, Wells Fargo Asset Management, since 2014. In addition, Mr. Owen is currently President, Chief Executive Officer and Director of Wells Fargo Funds Management, LLC since 2017. Prior thereto, Executive Vice President responsible for marketing, investments and product development for Wells Fargo Funds Management, LLC, from 2009 to 2014. |
Jeremy DePalma
(Born 1974) | Treasurer,
since 2012
(for certain funds in
the Fund Complex);
since 2021 (for
the remaining funds in the
Fund Complex) | Senior Vice President of Wells Fargo Funds Management, LLC since 2009. Senior Vice President of Evergreen Investment Management Company, LLC from 2008 to 2010 and head of the Fund Reporting and Control Team within Fund Administration from 2005 to 2010. |
Michelle Rhee
(Born 1966) | Chief Legal Officer,
since 2019 | Secretary of Wells Fargo Funds Management, LLC and Chief Legal Counsel of Wells Fargo Asset Management since 2018. Deputy General Counsel of Wells Fargo Bank, N.A. since 2020 and Assistant General Counsel of Wells Fargo Bank, N.A. from 2018 to 2020. Associate General Counsel and Managing Director of Bank of America Corporation from 2004 to 2018. |
Catherine Kennedy
(Born 1969) | Secretary,
since 2019 | Vice President of Wells Fargo Funds Management, LLC and Senior Counsel of the Wells Fargo Legal Department since 2010. Vice President and Senior Counsel of Evergreen Investment Management Company, LLC from 1998 to 2010. |
Michael H. Whitaker
(Born 1967) | Chief Compliance Officer,
since 2016 | Chief Compliance Officer of Wells Fargo Asset Management since 2016. Senior Vice President and Chief Compliance Officer for Fidelity Investments from 2007 to 2016. |
1 The Statement of Additional Information includes additional information about the Trustees and is available, without charge, upon request, by calling 1-800-222-8222 or by visiting the website at wfam.com.
38 | Wells Fargo Adjustable Rate Government Fund
For more information
More information about Wells Fargo Funds is available free upon request. To obtain literature, please write, visit the Fund's website, or call:
Wells Fargo Funds
P.O. Box 219967
Kansas City, MO 64121-9967
Website: wfam.com
Individual investors: 1-800-222-8222
Retail investment professionals: 1-888-877-9275
Institutional investment professionals: 1-866-765-0778
This report and the financial statements contained herein are submitted for the general information of the shareholders of the Fund. If this report is used for promotional purposes, distribution of the report must be accompanied or preceded by a current prospectus. Before investing, please consider the investment objectives, risks, charges, and expenses of the investment. For a current prospectus and, if available, a summary prospectus, containing this information, call 1-800-222-8222 or visit the Fund's website at wfam.com. Read the prospectus carefully before you invest or send money.
Wells Fargo Asset Management (WFAM) is the trade name for certain investment advisory/management firms owned by Wells Fargo & Company. These firms include but are not limited to Wells Capital Management Incorporated and Wells Fargo Funds Management, LLC. Certain products managed by WFAM entities are distributed by Wells Fargo Funds Distributor, LLC (a broker-dealer and Member FINRA).
This material is for general informational and educational purposes only and is NOT intended to provide investment advice or a recommendation of any kind - including a recommendation for any specific investment, strategy, or plan.
INVESTMENT PRODUCTS: NOT FDIC INSURED ■ NO BANK GUARANTEE ■ MAY LOSE VALUE
© 2021 Wells Fargo & Company. All rights reserved.
PAR-0321-00287 04-21
SA215/SAR215 02-21
Semi-Annual Report
February 28, 2021
Wells Fargo
Conservative Income Fund
Reduce clutter.
Save trees.
Sign up for electronic delivery of prospectuses and shareholder reports at wellsfargo.com/ advantagedelivery
The views expressed and any forward-looking statements are as of February 28, 2021, unless otherwise noted, and are those of the Fund's portfolio managers and/or Wells Fargo Asset Management. Discussions of individual securities or the markets generally are not intended as individual recommendations. Future events or results may vary significantly from those expressed in any forward-looking statements. The views expressed are subject to change at any time in response to changing circumstances in the market. Wells Fargo Asset Management and the Fund disclaim any obligation to publicly update or revise any views expressed or forward-looking statements.
INVESTMENT PRODUCTS: NOT FDIC INSURED ■ NO BANK GUARANTEE ■ MAY LOSE VALUE
Wells Fargo Conservative Income Fund | 1
Letter to shareholders (unaudited)
Andrew Owen
President
Wells Fargo Funds
Dear Shareholder:
We are pleased to offer you this semi-annual report for the Wells Fargo Conservative Income Fund for the six-month period that ended February 28, 2021. Global stocks showed robust returns, as the global economy began emerging from the haze of COVID-19. Tailwinds were provided by global stimulus programs, a rapid vaccination rollout, and recovering consumer and corporate sentiment. Bonds also had positive returns, led by high-yield bonds.
For the six-month period, U.S. stocks, based on the S&P 500 Index,1 gained 9.74%. International stocks, as measured by the MSCI ACWI ex USA Index (Net),2 returned 16.65%, while the MSCI EM Index (Net),3 had even stronger performance, with a 22.32% gain. Among bond indexes, the Bloomberg Barclays U.S. Aggregate Bond Index,4 returned (1.55)%, the Bloomberg Barclays Global Aggregate ex-USD Index (unhedged),5 gained 1.41%, and the Bloomberg Barclays Municipal Bond Index,6 returned 0.86% while the ICE BofA U.S. High Yield Index,7 gained 6.14%.
Hope drove the stock markets to new highs.
Stocks grew more volatile in September on mixed economic data. U.S. economic activity continued to grow. However, U.S. unemployment remained elevated at 7.9% in September. With U.S. Congress delaying further fiscal relief and uncertainties surrounding a possible vaccine, doubts crept back into the financial markets. In the U.K., a lack of progress in Brexit talks weighed on markets. China’s economy picked up steam, fueled by increased global demand.
In October, capital markets stepped back from their six-month rally. Market volatility rose in advance of the U.S. election and amid a global increase in COVID-19 infections. Europe introduced tighter restrictions affecting economic activity. U.S. markets looked favorably at the prospect of Democratic control of the federal purse strings, which could lead to additional fiscal stimulus and a boost to economic activity. Meanwhile, China reported 4.9% third-quarter gross domestic product growth.
| 1 | The S&P 500 Index consists of 500 stocks chosen for market size, liquidity, and industry group representation. It is a market-value-weighted index with each stock's weight in the index proportionate to its market value. You cannot invest directly in an index. |
| 2 | The Morgan Stanley Capital International (MSCI) All Country World Index (ACWI) ex USA Index (Net) is a free-float-adjusted market-capitalization-weighted index that is designed to measure the equity market performance of developed and emerging markets, excluding the United States. Source: MSCI. MSCI makes no express or implied warranties or representations and shall have no liability whatsoever with respect to any MSCI data contained herein. The MSCI data may not be further redistributed or used as a basis for other indices or any securities or financial products. This report is not approved, reviewed, or produced by MSCI. You cannot invest directly in an index. |
| 1 | The S&P 500 Index consists of 500 stocks chosen for market size, liquidity, and industry group representation. It is a market-value-weighted index with each stock's weight in the index proportionate to its market value. You cannot invest directly in an index. |
| 3 | The MSCI Emerging Markets (EM) Index (Net) is a free-float-adjusted market-capitalization-weighted index that is designed to measure equity market performance of emerging markets. You cannot invest directly in an index. |
| 1 | The S&P 500 Index consists of 500 stocks chosen for market size, liquidity, and industry group representation. It is a market-value-weighted index with each stock's weight in the index proportionate to its market value. You cannot invest directly in an index. |
| 4 | The Bloomberg Barclays U.S. Aggregate Bond Index is a broad-based benchmark that measures the investment-grade, U.S. dollar-denominated, fixed-rate taxable bond market, including Treasuries, government-related and corporate securities, mortgage-backed securities (agency fixed-rate and hybrid adjustable-rate mortgage pass-throughs), asset-backed securities, and commercial mortgage-backed securities. You cannot invest directly in an index. |
| 1 | The S&P 500 Index consists of 500 stocks chosen for market size, liquidity, and industry group representation. It is a market-value-weighted index with each stock's weight in the index proportionate to its market value. You cannot invest directly in an index. |
| 5 | The Bloomberg Barclays Global Aggregate ex-USD Index (unhedged) is an unmanaged index that provides a broad-based measure of the global investment-grade fixed-income markets excluding the U.S. dollar-denominated debt market. You cannot invest directly in an index. |
| 1 | The S&P 500 Index consists of 500 stocks chosen for market size, liquidity, and industry group representation. It is a market-value-weighted index with each stock's weight in the index proportionate to its market value. You cannot invest directly in an index. |
| 6 | The Bloomberg Barclays Municipal Bond Index is an unmanaged index composed of long-term tax-exempt bonds with a minimum credit rating of Baa. You cannot invest directly in an index. |
| 1 | The S&P 500 Index consists of 500 stocks chosen for market size, liquidity, and industry group representation. It is a market-value-weighted index with each stock's weight in the index proportionate to its market value. You cannot invest directly in an index. |
| 7 | The ICE BofA U.S. High Yield Index is a market-capitalization-weighted index of domestic and Yankee high-yield bonds. The index tracks the performance of high-yield securities traded in the U.S. bond market. You cannot invest directly in an index. Copyright 2021. ICE Data Indices, LLC. All rights reserved. |
2 | Wells Fargo Conservative Income Fund
Letter to shareholders (unaudited)
Global stocks rallied in November, propelled by optimism over three promising COVID-19 vaccines. Reversing recent trends, value stocks outperformed growth stocks and cyclical stocks outpaced technology stocks. However, U.S. unemployment remained elevated, with a net job loss of 10 million since February 2020. The eurozone services Purchasing Managers’ Index, a monthly survey of purchasing managers, contracted sharply while the region’s manufacturing activity grew. The U.S. election results added to the upbeat mood as investors anticipated more consistent policies in the new administration.
Financial markets ended the year with strength on high expectations for a rapid rollout of the COVID-19 vaccines, the successful passage of a $900 billion stimulus package, and rising expectations of additional economic support from a Democratic-led Congress. U.S. economic data were mixed with still-elevated unemployment and weak retail sales but growth in manufacturing output. In contrast, China’s economic expansion continued in both manufacturing and nonmanufacturing. U.S. COVID-19 infection rates continued to rise even as new state and local lockdown measures were implemented.
The year 2021 began with emerging market stocks leading all major asset classes in January, driven by China’s strong economic growth and a broad recovery in corporate earnings, which propelled China’s stock market higher. In the United States, positive news on vaccine trials and January's expansion in both the manufacturing and services sectors was offset by a weak December monthly jobs report. This was compounded by technical factors as some hedge funds were forced to sell stocks to protect themselves against a well-publicized short squeeze coordinated by a group of retail investors. Eurozone sentiment and economic growth were particularly weak, reflecting the impact of a new lockdown with stricter social distancing along with a slow vaccine rollout.
February saw major domestic equity indexes driven higher on the hope of a new stimulus bill, improving COVID-19 vaccination numbers, and the gradual reopening of the economy. Most S&P 500 companies reported better-than-expected earnings, with positive surprises coming from the financials, IT, health care, and materials sectors. Japan saw its economy strengthen as a result of strong export numbers. Meanwhile, crude oil prices continued their climb, rising more than 25% for the year. Domestic government bonds experienced a sharp sell-off in late February as markets priced in a more robust economic recovery and higher growth and inflation expectations.
Don’t let short-term uncertainty derail long-term investment goals.
Periods of investment uncertainty can present challenges, but experience has taught us that maintaining long-term investment goals can be an effective way to plan for the future. To help you create a sound strategy based on your personal goals and risk tolerance, Wells Fargo Funds offers more than 100 mutual funds spanning a wide range of asset classes and investment styles. Although diversification cannot guarantee an investment profit or prevent losses, we believe it can be an effective way to manage investment risk and potentially smooth out overall portfolio performance. We encourage investors to know their investments and to understand that appropriate levels of risk-taking may unlock opportunities.
Thank you for choosing to invest with Wells Fargo Funds. We appreciate your confidence in us and remain committed to helping you meet your financial needs.
Sincerely,
Andrew Owen
President
Wells Fargo Funds
“Global stocks rallied in November, propelled by optimism over three promising COVID-19 vaccines.”
“February saw major domestic equity indexes driven higher on the hope of a new stimulus bill, improving COVID-19 vaccination numbers, and the gradual reopening of the economy.”
For further information about your Fund, contact your investment professional, visit our website at wfam.com, or call us directly at 1-800-222-8222.
Wells Fargo Conservative Income Fund | 3
Letter to shareholders (unaudited)
Preparing for LIBOR Transition
The global financial industry is preparing to transition away from the London Interbank Offered Rate (LIBOR), a key benchmark interest rate, to new alternative rates. LIBOR underpins more than $350 trillion of financial contracts. It is the benchmark rate for a wide spectrum of products ranging from residential mortgages to corporate bonds to derivatives. Regulators have called for a market-wide transition away from LIBOR to successor reference rates by the end of 2021 (extended through June 30, 2023 for most tenors of the U.S. dollar LIBOR), which requires proactive steps be taken by issuers, counterparties, and asset managers to identify impacted products and adopt new reference rates.
The Fund holds at least one security that uses LIBOR as a floating reference rate and has a maturity date after 12-31-2021.
Although the transition process away from LIBOR has become increasingly well-defined in advance of the anticipated discontinuation date, there remains uncertainty regarding the nature of successor reference rates, and any potential effects of the transition away from LIBOR on investment instruments that use it as a benchmark rate. The transition process may result in, among other things, increased volatility or illiquidity in markets for instruments that currently rely on LIBOR and could negatively impact the value of certain instruments held by the Fund.
Wells Fargo Asset Management is monitoring LIBOR exposure closely and has put resources and controls in place to manage this transition effectively. The Fund’s portfolio management team is evaluating LIBOR holdings to understand what happens to those securities when LIBOR ceases to exist, including examining security documentation to identify the presence or absence of fallback language identifying a replacement rate to LIBOR.
While the pace of transition away from LIBOR will differ by asset class and investment strategy, the portfolio management team will monitor market conditions for those holdings to identify and mitigate deterioration or volatility in pricing and liquidity and ensure appropriate actions are taken in a timely manner.
Further information regarding the potential risks associated with the discontinuation of LIBOR can be found in the Fund’s Statement of Additional Information.
4 | Wells Fargo Conservative Income Fund
This page is intentionally left blank.
Performance highlights (unaudited)
| Investment objective | The Fund seeks current income consistent with capital preservation. |
| Manager | Wells Fargo Funds Management, LLC |
| Subadviser | Wells Capital Management Incorporated |
| Portfolio managers | Andrew M. Greenberg, CFA®‡, Anthony J. Melville, CFA®‡, Jeffrey L. Weaver, CFA®‡ |
| Average annual total returns (%) as of February 28, 2021 |
| | | | | | Expense ratios1 (%) |
| | Inception date | 1 year | 5 year | Since
inception | Gross | Net 2 |
| Class A2 (WCIAX)3 | 5-29-2020 | 1.02 | 1.51 | 1.05 | 0.71 | 0.50 |
| Institutional Class (WCIIX) | 5-31-2013 | 1.26 | 1.75 | 1.28 | 0.38 | 0.25 |
| Bloomberg Barclays 6-9 Month Treasury Bill Index4 | – | 0.77 | 1.35 | 0.92 * | – | – |
Figures quoted represent past performance, which is no guarantee of future results, and do not reflect taxes that a shareholder may pay on an investment in a fund. Investment return and principal value of an investment will fluctuate so that an investor’s shares, when redeemed, may be worth more or less than their original cost. Current performance may be lower or higher than the performance data quoted, which assumes the reinvestment of dividends and capital gains. Current month-end performance is available on the Fund’s website, wfam.com.
Index returns do not include transaction costs associated with buying and selling securities, any mutual fund fees or expenses, or any taxes. It is not possible to invest directly in an index.
Class A2 shares and Institutional Class shares are sold without a front-end sales charge or contingent deferred sales charge.
| * | Based on the inception date of the oldest Fund class. |
| 1 | Reflects the expense ratios as stated in the most recent prospectuses. The expense ratios shown are subject to change and may differ from the annualized expense ratios shown in the financial highlights of this report. |
| 2 | The manager has contractually committed through December 31, 2021, to waive fees and/or reimburse expenses to the extent necessary to cap total annual fund operating expenses after fee waivers at 0.50% for Class A2 and 0.25% for Institutional Class. Brokerage commissions, stamp duty fees, interest, taxes, acquired fund fees and expenses (if any), and extraordinary expenses are excluded from the expense caps. Prior to or after the commitment expiration date, the caps may be increased or the commitment to maintain the caps may be terminated only with the approval of the Board of Trustees. Without these caps, the Fund’s returns would have been lower. The expense ratio paid by an investor is the net expense ratio (the total annual fund operating expenses after fee waivers) as stated in the prospectuses. |
| 3 | Historical performance shown for the Class A2 shares prior to their inception reflects the performance of the Institutional Class shares, adjusted to reflect the higher expenses applicable to the Class A2 shares. |
| 4 | The Bloomberg Barclays 6-9 Month Treasury Bill Index includes all publicly issued zero-coupon U.S. Treasury bills that have a remaining maturity of less than nine months and more than six, are rated investment-grade, and have $250 million or more of outstanding face value. You cannot invest directly in an index. |
Bond values fluctuate in response to the financial condition of individual issuers, general market and economic conditions, and changes in interest rates. Changes in market conditions and government policies may lead to periods of heightened volatility in the bond market and reduced liquidity for certain bonds held by the Fund. In general, when interest rates rise, bond values fall and investors may lose principal value. Interest rate changes and their impact on the Fund and its share price can be sudden and unpredictable. The use of derivatives may reduce returns and/or increase volatility. Securities issued by U.S. government agencies or government-sponsored entities may not be guaranteed by the U.S. Treasury. Certain investment strategies tend to increase the total risk of an investment (relative to the broader market). The Fund is exposed to mortgage- and asset-backed securities risk. The U.S. government guarantee applies to certain underlying securities and not to shares of the Fund. Consult the Fund’s prospectus for additional information on these and other risks.
| ‡ | CFA® and Chartered Financial Analyst® are trademarks owned by CFA Institute. |
6 | Wells Fargo Conservative Income Fund
Performance highlights (unaudited)
| Ten largest holdings (%) as of February 28, 20211 |
| Hyundai Auto Lease Securitization Trust Series 2019-B Class A3, 2.04%, 8-15-2022 | 1.53 |
| Ford Credit Auto Owner Trust Series 2020-A Class A3, 1.04%, 8-15-2024 | 1.43 |
| HPEFS Equipment Trust Series 2021-1A Class C, 0.93%, 3-20-2031 | 1.29 |
| GNMA, 4.38%, 8-20-2070 | 1.10 |
| USAA Capital Corporation, 2.00%, 6-1-2021 | 1.06 |
| Enterprise Products Operating LLC , 3.50%, 2-1-2022 | 1.04 |
| Buckeye Ohio Tobacco Settlement Financing Authority, 1.58%, 6-1-2021 | 1.03 |
| Mercedes-Benz Auto Receivables Trust Series 2019-1 Class 3, 1.94%, 3-15-2024 | 1.02 |
| Lloyds Banking Group plc, 3.00%, 1-11-2022 | 1.02 |
| Mizuho Financial Group, 1.06%, 7-16-2023 | 1.02 |
| 1 | Figures represent the percentage of the Fund's net assets. Holdings are subject to change and may have changed since the date specified. |
| Portfolio composition as of February 28, 20211 |
| 1 | Figures represent the percentage of the Fund's long-term investments. These amounts are subject to change and may have changed since the date specified. |
Wells Fargo Conservative Income Fund | 7
Fund expenses (unaudited)
As a shareholder of the Fund, you incur ongoing costs, including management fees, shareholder servicing fees, and other Fund expenses. This example is intended to help you understand your ongoing costs (in dollars) of investing in the Fund and to compare these costs with the ongoing costs of investing in other mutual funds.
The example is based on an investment of $1,000 invested at the beginning of the six-month period and held for the entire period from September 1, 2020 to February 28, 2021.
Actual expenses
The “Actual” line of the table below provides information about actual account values and actual expenses. You may use the information in this line, together with the amount you invested, to estimate the expenses that you paid over the period. Simply divide your account value by $1,000 (for example, an $8,600 account value divided by $1,000 = 8.6), then multiply the result by the number in the “Actual” line under the heading entitled “Expenses paid during period” for your applicable class of shares to estimate the expenses you paid on your account during this period.
Hypothetical example for comparison purposes
The “Hypothetical” line of the table below provides information about hypothetical account values and hypothetical expenses based on the Fund’s actual expense ratio and an assumed rate of return of 5% per year before expenses, which is not the Fund’s actual return. The hypothetical account values and expenses may not be used to estimate the actual ending account balance or expenses you paid for the period. You may use this information to compare the ongoing costs of investing in the Fund and other funds. To do so, compare this 5% hypothetical example with the 5% hypothetical examples that appear in the shareholder reports of the other funds.
Please note that the expenses shown in the table are meant to highlight your ongoing costs. Therefore, the “Hypothetical” line of the table is useful in comparing ongoing costs only and will not help you determine the relative total costs of owning different funds.
| | Beginning
account value
9-1-2020 | Ending
account value
2-28-2021 | Expenses
paid during
the period1 | Annualized net
expense ratio |
| Class A2 | | | | |
| Actual | $1,000.00 | $1,001.46 | $2.48 | 0.50% |
| Hypothetical (5% return before expenses) | $1,000.00 | $1,022.32 | $2.51 | 0.50% |
| Institutional Class | | | | |
| Actual | $1,000.00 | $1,002.63 | $1.29 | 0.26% |
| Hypothetical (5% return before expenses) | $1,000.00 | $1,023.51 | $1.30 | 0.26% |
1 Expenses paid is equal to the annualized net expense ratio of each class multiplied by the average account value over the period, multiplied by the number of days in the most recent fiscal half-year divided by the number of days in the fiscal year (to reflect the one-half-year period).
8 | Wells Fargo Conservative Income Fund
Portfolio of investments—February 28, 2021 (unaudited)
| | | Interest
rate | Maturity
date | Principal | Value |
| Agency securities: 1.80% | | | | | |
| FNMA | | 3.00% | 1-1-2028 | $ 3,284,971 | $ 3,466,152 |
| GNMA ±± | | 4.38 | 8-20-2070 | 5,023,656 | 5,439,587 |
| Total Agency securities (Cost $8,832,957) | | | | | 8,905,739 |
| Asset-backed securities: 23.45% | | | | | |
| AmeriCredit Automobile Receivables Trust Series 2020-1 Class A3 | | 1.11 | 8-19-2024 | 3,400,000 | 3,430,104 |
| BlueMountain CLO Limited Series 2012-2A Class AR2 (3 Month LIBOR+1.05%)144A± | | 1.23 | 11-20-2028 | 4,846,215 | 4,848,216 |
| CarMax Auto Owner Trust Series 2020-1 Class A2 | | 1.87 | 4-17-2023 | 1,593,854 | 1,603,388 |
| CarMax Auto Owner Trust Series 2020-4 Class A2 | | 0.31 | 1-16-2024 | 1,000,000 | 1,000,734 |
| CarMax Auto Owner Trust Series 2021-1 Class A3 | | 0.34 | 12-15-2025 | 2,345,000 | 2,342,299 |
| CCG Receivables Trust Series 2018-2 Class A2 144A | | 3.09 | 12-15-2025 | 753,284 | 759,747 |
| CCG Receivables Trust Series 2020-1 Class A2 144A | | 0.54 | 12-14-2027 | 2,290,000 | 2,294,435 |
| Chesapeake Funding II LLC Series 2020-1A Class A1 144A | | 0.87 | 8-16-2032 | 1,633,072 | 1,646,282 |
| Dell Equipment Finance Trust Series 2019-2 Class A2 144A | | 1.95 | 12-22-2021 | 1,185,563 | 1,191,387 |
| Dorchester Park CLO Limited Series 2016-25A Class AR (3 Month LIBOR+0.90%)144A± | | 1.12 | 4-20-2028 | 3,761,141 | 3,762,130 |
| Enterprise Fleet Financing LLC Series 2020-1 Class A2 144A | | 1.78 | 12-22-2025 | 2,177,881 | 2,212,249 |
| Enterprise Fleet Financing LLC Series 2020-2 Class A2 144A | | 0.61 | 7-20-2026 | 2,185,000 | 2,192,012 |
| Enterprise Fleet Financing LLC Series 2021-1 Class A2 144A | | 0.44 | 12-21-2026 | 1,095,000 | 1,094,159 |
| Evergreen Credit Card Trust Series 2018-1 Class A 144A | | 2.95 | 3-15-2023 | 4,000,000 | 4,005,518 |
| Evergreen Credit Card Trust Series 2019-3 Class B 144A | | 2.36 | 10-16-2023 | 3,750,000 | 3,789,152 |
| Ford Credit Auto Owner Trust Series 2019-B Class A3 | | 2.23 | 10-15-2023 | 1,652,596 | 1,674,588 |
| Ford Credit Auto Owner Trust Series 2020-A Class A3 | | 1.04 | 8-15-2024 | 7,000,000 | 7,070,828 |
| Foursight Capital Automobile Receivables Trust Series 2021-1 Class A2 144A | | 0.40 | 8-15-2024 | 3,225,000 | 3,225,201 |
| GM Financial Automobile Leasing Trust Series 2020 -3 Class A2A | | 0.35 | 11-21-2022 | 1,810,000 | 1,811,433 |
| GM Financial Automobile Leasing Trust Series 2021-1 Class C | | 0.70 | 2-20-2025 | 4,500,000 | 4,492,094 |
| GM Financial Securitized Term Auto Receivables Trust Series 2019-4 Class B | | 2.04 | 2-18-2025 | 3,775,000 | 3,894,833 |
| GM Financial Securitized Term Auto Receivables Trust Series 2020-1 Class A2 | | 1.83 | 1-17-2023 | 339,700 | 340,584 |
| Great America Leasing Receivables Funding LLC Series 2021-1 Class A2 144A | | 0.27 | 6-15-2023 | 2,735,000 | 2,733,958 |
| Hertz Fleet Lease Funding LP Series 2017-1 Class A1 (1 Month LIBOR+0.65%)144A± | | 0.77 | 4-10-2031 | 139,373 | 139,461 |
| HPEFS Equipment Trust Series 2021-1A Class C 144A%% | | 0.93 | 3-20-2031 | 6,400,000 | 6,389,680 |
| Hyundai Auto Lease Securitization Trust Series 2019-B Class A3 144A | | 2.04 | 8-15-2022 | 7,500,000 | 7,553,605 |
| Hyundai Auto Lease Securitization Trust Series 2021-A Class B 144A | | 0.61 | 10-15-2025 | 1,800,000 | 1,797,793 |
| Mercedes-Benz Auto Receivables Trust Series 2019-1 Class 3 | | 1.94 | 3-15-2024 | 5,000,000 | 5,073,584 |
| Mercedes-Benz Auto Receivables Trust Series 2019-1 Class A2A | | 2.04 | 6-15-2022 | 200,342 | 200,854 |
| MMAF Equipment Finance LLC Series 2020-Ba Class A2 144A | | 0.38 | 8-14-2023 | 1,060,000 | 1,060,930 |
| Oscar US Funding Trust Series 2019-2A Class A2 144A | | 2.49 | 8-10-2022 | 106,610 | 106,915 |
| Oscar US Funding Trust Series 2021-1A Class A2 144A | | 0.40 | 3-11-2024 | 1,135,000 | 1,134,574 |
| Penarth Master Issuer plc Series 2019-1A Class A1 (1 Month LIBOR+0.54%)144A± | | 0.65 | 7-18-2023 | 2,000,000 | 2,000,314 |
| Santander Consumer Auto Receivables Trust Series 2020-BA Class A2 144A | | 0.38 | 2-15-2023 | 2,111,060 | 2,112,195 |
| Santander Retail Auto Lease Trust Series 2019-B Class A2A 144A | | 2.29 | 4-20-2022 | 1,286,866 | 1,291,500 |
The accompanying notes are an integral part of these financial statements.
Wells Fargo Conservative Income Fund | 9
Portfolio of investments—February 28, 2021 (unaudited)
| | | Interest
rate | Maturity
date | Principal | Value |
| Asset-backed securities (continued) | | | | | |
| Santander Retail Auto Lease Trust Series 2019-C Class A2A 144A | | 1.89% | 9-20-2022 | $ 1,558,264 | $ 1,567,606 |
| Santander Retail Auto Lease Trust Series 2020-A Class A2 144A | | 1.69 | 1-20-2023 | 359,889 | 363,387 |
| Santander Retail Auto Lease Trust Series 2020-B Class A2 144A | | 0.42 | 11-20-2023 | 1,355,000 | 1,357,240 |
| SoFi Consumer Loan Program Trust Series 2018-4 Class A 144A | | 3.54 | 11-26-2027 | 45,880 | 45,987 |
| SoFi Consumer Loan Program Trust Series 2019-2 Class A 144A | | 3.01 | 4-25-2028 | 275,685 | 278,080 |
| SoFi Consumer Loan Program Trust Series 2020-1 Class A 144A | | 2.02 | 1-25-2029 | 1,492,628 | 1,508,220 |
| Tesla Auto Lease Trust Series 2020-A Class A2 144A | | 0.55 | 5-22-2023 | 1,278,586 | 1,281,438 |
| Toyota Auto Receivables Owner Trust Series 2020-A Class A2 | | 1.67 | 11-15-2022 | 3,368,687 | 3,386,149 |
| Trillium Credit Card Trust II Series 2020-1A Class B 144A | | 2.33 | 12-26-2024 | 1,355,000 | 1,375,892 |
| Venture CDO Limited Series 16-25A Class AR (3 Month LIBOR+1.02%)144A± | | 1.24 | 4-20-2029 | 5,000,000 | 5,000,000 |
| Verizon Owner Trust Series 2018-1A Class A1 144A | | 2.82 | 9-20-2022 | 443,430 | 444,774 |
| Volvo Financial Equipment LLC Series 2020-1A Class A2 144A | | 0.37 | 4-17-2023 | 1,800,000 | 1,801,637 |
| Wheels SPV LLC Series 2020-1A Class A2 144A | | 0.51 | 8-20-2029 | 1,055,000 | 1,057,650 |
| World Omni Auto Lease Trust Series 2020-A Class A2 | | 1.71 | 11-15-2022 | 1,720,527 | 1,734,338 |
| World Omni Auto Lease Trust Series 2020-B Class A2 | | 0.32 | 9-15-2023 | 2,330,928 | 2,331,934 |
| World Omni Auto Receivables Trust Series 2019-A Class A3 | | 2.94 | 5-16-2022 | 2,368,129 | 2,386,374 |
| Total Asset-backed securities (Cost $115,899,800) | | | | | 116,197,442 |
| Corporate bonds and notes: 34.60% | | | | | |
| Consumer discretionary: 1.25% | | | | | |
| Automobiles: 1.06% | | | | | |
| Volkswagen Group of America Incorporated 144A | | 0.75 | 11-23-2022 | 4,200,000 | 4,218,694 |
| Volkswagen Group of America Incorporated 144A | | 4.00 | 11-12-2021 | 1,000,000 | 1,025,359 |
| | | | | | 5,244,053 |
| Textiles, apparel & luxury goods: 0.19% | | | | | |
| Ralph Lauren Corporation | | 1.70 | 6-15-2022 | 940,000 | 956,310 |
| Consumer staples: 1.83% | | | | | |
| Food & staples retailing: 1.83% | | | | | |
| 7-Eleven Incorporated (3 Month LIBOR+0.45%)144A± | | 0.65 | 8-10-2022 | 4,650,000 | 4,655,476 |
| Kroger Company | | 2.95 | 11-1-2021 | 4,350,000 | 4,418,178 |
| | | | | | 9,073,654 |
| Energy: 3.92% | | | | | |
| Oil, gas & consumable fuels: 3.92% | | | | | |
| BP Capital Markets America Incorporated | | 4.74 | 3-11-2021 | 5,000,000 | 5,005,312 |
| Chevron Corporation (3 Month LIBOR+0.90%)± | | 1.10 | 5-11-2023 | 4,525,000 | 4,612,714 |
| Enterprise Products Operating LLC | | 3.50 | 2-1-2022 | 5,000,000 | 5,143,756 |
| Phillips 66 (3 Month LIBOR+0.62%)± | | 0.81 | 2-15-2024 | 3,080,000 | 3,087,334 |
| Pioneer Natural Resource | | 0.75 | 1-15-2024 | 1,565,000 | 1,560,927 |
| | | | | | 19,410,043 |
The accompanying notes are an integral part of these financial statements.
10 | Wells Fargo Conservative Income Fund
Portfolio of investments—February 28, 2021 (unaudited)
| | | Interest
rate | Maturity
date | Principal | Value |
| Financials: 17.79% | | | | | |
| Banks: 3.19% | | | | | |
| Bank of America Corporation (3 Month LIBOR+1.02%)± | | 2.88% | 4-24-2023 | $ 2,000,000 | $ 2,057,137 |
| Bank of America Corporation (3 Month LIBOR+0.79%)± | | 3.00 | 12-20-2023 | 1,000,000 | 1,045,160 |
| Bank of America Corporation | | 5.70 | 1-24-2022 | 1,000,000 | 1,048,663 |
| Citibank NA | | 3.40 | 7-23-2021 | 2,040,000 | 2,060,021 |
| Citigroup Incorporated (U.S. SOFR+0.87%)± | | 2.31 | 11-4-2022 | 1,090,000 | 1,103,307 |
| Citigroup Incorporated | | 2.90 | 12-8-2021 | 2,364,000 | 2,407,272 |
| MUFG Union Bank National Association | | 2.10 | 12-9-2022 | 3,000,000 | 3,087,842 |
| PNC Bank NA | | 2.15 | 4-29-2021 | 2,000,000 | 2,003,054 |
| Truist Financial Corporation | | 2.05 | 5-10-2021 | 1,000,000 | 1,001,910 |
| | | | | | 15,814,366 |
| Capital markets: 3.35% | | | | | |
| Charles Schwab Corporation (3 Month LIBOR+0.32%)± | | 0.50 | 5-21-2021 | 3,040,000 | 3,041,436 |
| Goldman Sachs Group Incorporated | | 0.48 | 1-27-2023 | 3,500,000 | 3,500,706 |
| Goldman Sachs Group Incorporated (U.S. SOFR+0.54%)± | | 0.59 | 11-17-2023 | 1,500,000 | 1,505,423 |
| Goldman Sachs Group Incorporated | | 5.25 | 7-27-2021 | 2,500,000 | 2,550,472 |
| Morgan Stanley | | 4.10 | 5-22-2023 | 3,000,000 | 3,228,418 |
| Morgan Stanley | | 5.50 | 7-28-2021 | 1,500,000 | 1,531,424 |
| State Street Corporation (U.S. SOFR+2.69%)± | | 2.83 | 3-30-2023 | 1,225,000 | 1,259,102 |
| | | | | | 16,616,981 |
| Consumer finance: 4.78% | | | | | |
| American Honda Finance Corporation | | 1.70 | 9-9-2021 | 2,000,000 | 2,015,302 |
| BMW US Capital LLC 144A | | 2.00 | 4-11-2021 | 2,584,000 | 2,585,163 |
| Caterpillar Financial Services Corporation (3 Month LIBOR+0.20%)± | | 0.40 | 11-12-2021 | 3,000,000 | 3,003,564 |
| Caterpillar Financial Services Corporation | | 0.95 | 5-13-2022 | 4,000,000 | 4,032,043 |
| Daimler Finance NA LLC 144A | | 3.75 | 11-5-2021 | 825,000 | 843,761 |
| Daimler Finance NA LLC 144A | | 3.88 | 9-15-2021 | 3,242,000 | 3,303,915 |
| Hyundai Capital America Company 144A | | 0.80 | 1-8-2024 | 2,000,000 | 1,987,183 |
| Toyota Motor Credit Corporation (3 Month LIBOR+0.13%)± | | 0.32 | 8-13-2021 | 1,900,000 | 1,900,709 |
| Toyota Motor Credit Corporation | | 1.15 | 5-26-2022 | 2,000,000 | 2,021,997 |
| Toyota Motor Credit Corporation | | 1.90 | 4-8-2021 | 2,000,000 | 2,003,340 |
| | | | | | 23,696,977 |
| Diversified financial services: 0.82% | | | | | |
| National Rural Utilities Cooperative Finance | | 2.40 | 4-25-2022 | 3,950,000 | 4,037,784 |
| Insurance: 5.65% | | | | | |
| AIG Global Funding (3 Month LIBOR+0.46%)144A± | | 0.71 | 6-25-2021 | 2,600,000 | 2,603,747 |
| Athene Global Funding 144A | | 0.95 | 1-8-2024 | 1,600,000 | 1,603,115 |
| Athene Global Funding 144A | | 1.20 | 10-13-2023 | 3,430,000 | 3,470,623 |
| Athene Global Funding 144A | | 2.80 | 5-26-2023 | 3,000,000 | 3,142,973 |
| Metropolitan Life Global Funding Incorporated 144A | | 1.95 | 9-15-2021 | 4,175,000 | 4,214,096 |
| New York Life Global Funding 144A | | 2.00 | 4-13-2021 | 600,000 | 601,245 |
| Principal Life Global Funding II 144A | | 2.38 | 11-21-2021 | 1,250,000 | 1,267,700 |
| Protective Life Global Funding (3 Month LIBOR+0.52%)144A± | | 0.77 | 6-28-2021 | 5,000,000 | 5,008,437 |
| The Allstate Corporation (3 Month LIBOR+0.43%)± | | 0.68 | 3-29-2021 | 825,000 | 825,326 |
| USAA Capital Corporation 144A | | 2.00 | 6-1-2021 | 5,220,000 | 5,243,374 |
| | | | | | 27,980,636 |
The accompanying notes are an integral part of these financial statements.
Wells Fargo Conservative Income Fund | 11
Portfolio of investments—February 28, 2021 (unaudited)
| | | Interest
rate | Maturity
date | Principal | Value |
| Health care: 2.52% | | | | | |
| Biotechnology: 1.10% | | | | | |
| AbbVie Incorporated (3 Month LIBOR+0.65%)± | | 0.83% | 11-21-2022 | $ 3,000,000 | $ 3,023,489 |
| Gilead Sciences Incorporated (3 Month LIBOR+0.15%)± | | 0.38 | 9-17-2021 | 2,425,000 | 2,426,498 |
| | | | | | 5,449,987 |
| Health care providers & services: 0.74% | | | | | |
| CVS Health Corporation (3 Month LIBOR+0.72%)± | | 0.95 | 3-9-2021 | 3,645,000 | 3,645,547 |
| Pharmaceuticals: 0.68% | | | | | |
| Bayer US Finance LLC 144A | | 3.50 | 6-25-2021 | 3,350,000 | 3,374,709 |
| Industrials: 0.39% | | | | | |
| Road & rail: 0.39% | | | | | |
| Penske Truck Leasing Company LP 144A | | 3.65 | 7-29-2021 | 1,900,000 | 1,919,314 |
| Information technology: 0.47% | | | | | |
| IT services: 0.47% | | | | | |
| Fidelity National Information Services Incorporated %% | | 0.38 | 3-1-2023 | 2,320,000 | 2,319,059 |
| Materials: 0.91% | | | | | |
| Paper & forest products: 0.91% | | | | | |
| Georgia-Pacific LLC 144A | | 3.73 | 7-15-2023 | 4,250,000 | 4,543,130 |
| Real estate: 0.82% | | | | | |
| Real estate management & development: 0.82% | | | | | |
| Simon Property Group LP | | 2.35 | 1-30-2022 | 4,000,000 | 4,052,375 |
| Utilities: 4.70% | | | | | |
| Electric utilities: 2.71% | | | | | |
| American Electric Power (3 Month LIBOR+0.48%)± | | 0.69 | 11-1-2023 | 2,910,000 | 2,914,037 |
| Entergy Louisiana LLC | | 0.62 | 11-17-2023 | 2,100,000 | 2,104,601 |
| Florida Power & Light Company (3 Month LIBOR+0.38%)± | | 0.60 | 7-28-2023 | 2,000,000 | 2,000,084 |
| NextEra Energy Operating Partners LP (3 Month LIBOR+0.27%)± | | 0.45 | 2-22-2023 | 2,400,000 | 2,400,840 |
| Southern Company | | 2.35 | 7-1-2021 | 4,000,000 | 4,019,598 |
| | | | | | 13,439,160 |
| Gas utilities: 0.60% | | | | | |
| CenterPoint Energy (3 Month LIBOR+0.50%)±%% | | 0.68 | 3-2-2023 | 2,965,000 | 2,965,000 |
| Multi-utilities: 1.39% | | | | | |
| Dominion Energy Incorporated (3 Month LIBOR+0.53%)± | | 0.75 | 9-15-2023 | 3,500,000 | 3,507,494 |
| DTE Energy Company | | 0.55 | 11-1-2022 | 3,380,000 | 3,387,008 |
| | | | | | 6,894,502 |
| Total Corporate bonds and notes (Cost $170,891,674) | | | | | 171,433,587 |
| Municipal obligations: 5.94% | | | | | |
| California: 2.30% | | | | | |
| Education revenue: 0.30% | | | | | |
| University of California Series BF | | 0.63 | 5-15-2023 | 1,500,000 | 1,508,175 |
The accompanying notes are an integral part of these financial statements.
12 | Wells Fargo Conservative Income Fund
Portfolio of investments—February 28, 2021 (unaudited)
| | | Interest
rate | Maturity
date | Principal | Value |
| Miscellaneous revenue: 1.56% | | | | | |
| California Earthquake Authority Series B | | 1.23% | 7-1-2021 | $ 1,000,000 | $ 1,003,370 |
| Ontario CA Pension Obligation | | 1.97 | 6-1-2021 | 585,000 | 586,404 |
| Ontario CA Pension Obligation | | 2.07 | 6-1-2022 | 915,000 | 925,907 |
| Pomona California Pension Obligation Series BJ | | 4.00 | 8-1-2023 | 1,000,000 | 1,068,740 |
| San Luis Unit/Westlands Water District Financing Authority (AGM Insured) | | 1.09 | 9-1-2022 | 1,000,000 | 1,010,680 |
| Torrance CA Joint Powers Financing Authority | | 1.29 | 10-1-2022 | 1,000,000 | 1,007,190 |
| Torrance CA Joint Powers Financing Authority | | 1.43 | 10-1-2023 | 1,500,000 | 1,517,805 |
| West Covina CA Public Financing Authoriy Series A | | 1.75 | 8-1-2021 | 595,000 | 598,017 |
| | | | | | 7,718,113 |
| Water & sewer revenue: 0.44% | | | | | |
| El Dorado CA Irrigation District Revenue Refunding Bond Series C | | 0.64 | 3-1-2021 | 1,090,000 | 1,090,000 |
| El Dorado CA Irrigation District Revenue Refunding Bond Series C | | 0.74 | 3-1-2022 | 650,000 | 652,945 |
| El Dorado CA Irrigation District Revenue Unrefunded Bond Series C | | 0.64 | 3-1-2021 | 410,000 | 410,000 |
| | | | | | 2,152,945 |
| | | | | | 11,379,233 |
| Connecticut: 0.27% | | | | | |
| GO revenue: 0.27% | | | | | |
| Connecticut Series A | | 3.00 | 7-1-2021 | 1,350,000 | 1,362,825 |
| Florida: 0.15% | | | | | |
| Education revenue: 0.15% | | | | | |
| Florida Development Finance Corporation Refunding Bond Nova Southeastern University | | 1.65 | 4-1-2021 | 750,000 | 750,383 |
| Illinois: 0.20% | | | | | |
| Airport revenue: 0.20% | | | | | |
| Chicago IL O’Hare International Airport Senior Lien Series D | | 0.96 | 1-1-2023 | 1,000,000 | 1,010,280 |
| New York: 0.84% | | | | | |
| Airport revenue: 0.27% | | | | | |
| Port Authority of New York & New Jersey Series AAA | | 1.09 | 7-1-2023 | 1,305,000 | 1,325,606 |
| Tax revenue: 0.45% | | | | | |
| New York Dormitory Authority Personal Income Tax Revenue Series B ## | | 5.00 | 3-31-2021 | 2,200,000 | 2,208,976 |
| Utilities revenue: 0.12% | | | | | |
| Long Island NY Power Authority Electric System Series C | | 0.66 | 3-1-2022 | 180,000 | 180,180 |
| Long Island NY Power Authority Electric System Series C | | 0.76 | 3-1-2023 | 430,000 | 432,172 |
| | | | | | 612,352 |
| | | | | | 4,146,934 |
| Ohio: 1.03% | | | | | |
| Tobacco revenue: 1.03% | | | | | |
| Buckeye Ohio Tobacco Settlement Financing Authority ## | | 1.58 | 6-1-2021 | 5,065,000 | 5,078,726 |
The accompanying notes are an integral part of these financial statements.
Wells Fargo Conservative Income Fund | 13
Portfolio of investments—February 28, 2021 (unaudited)
| | | Interest
rate | Maturity
date | Principal | Value |
| Pennsylvania: 0.75% | | | | | |
| Education revenue: 0.32% | | | | | |
| Pennsylvania State University Series D ## | | 1.09% | 9-1-2021 | $ 1,560,000 | $ 1,567,254 |
| Tax revenue: 0.43% | | | | | |
| Philadelphia PA School District AMT Series A ## | | 4.00 | 6-30-2021 | 2,100,000 | 2,126,838 |
| | | | | | 3,694,092 |
| Texas: 0.40% | | | | | |
| Airport revenue: 0.20% | | | | | |
| Houston TX Airport System Revenue Refunding Taxable Subordinated Lien Series C | | 0.88 | 7-1-2022 | 1,000,000 | 1,003,500 |
| Education revenue: 0.20% | | | | | |
| Texas Tech University Improvement & Refunding Bonds Financing System | | 0.51 | 2-15-2022 | 1,000,000 | 1,002,120 |
| | | | | | 2,005,620 |
| Total Municipal obligations (Cost $29,275,527) | | | | | 29,428,093 |
| Yankee corporate bonds and notes: 23.00% | | | | | |
| Consumer staples: 0.63% | | | | | |
| Food products: 0.63% | | | | | |
| Danone SA 144A | | 2.08 | 11-2-2021 | 3,100,000 | 3,132,797 |
| Energy: 3.17% | | | | | |
| Energy equipment & services: 0.70% | | | | | |
| Schlumberger Limited 144A | | 2.65 | 11-20-2022 | 3,345,000 | 3,462,424 |
| Oil, gas & consumable fuels: 2.47% | | | | | |
| Enbridge Incorporated (U.S. SOFR+0.40%)± | | 0.42 | 2-17-2023 | 1,000,000 | 1,002,137 |
| Enbridge Incorporated (3 Month LIBOR+0.50%)± | | 0.69 | 2-18-2022 | 4,000,000 | 4,013,992 |
| Shell International Finance BV | | 1.75 | 9-12-2021 | 2,000,000 | 2,016,005 |
| Shell International Finance BV | | 2.38 | 8-21-2022 | 2,000,000 | 2,061,178 |
| Total Capital International SA | | 2.22 | 7-12-2021 | 2,112,000 | 2,123,247 |
| Total Capital SA | | 4.25 | 12-15-2021 | 1,000,000 | 1,031,593 |
| | | | | | 12,248,152 |
| Financials: 18.67% | | | | | |
| Banks: 15.74% | | | | | |
| ABN AMRO Bank NV (3 Month LIBOR+0.57%)144A± | | 0.76 | 8-27-2021 | 5,000,000 | 5,012,650 |
| Barclays Bank plc | | 1.70 | 5-12-2022 | 1,075,000 | 1,091,360 |
| BPCE SA (3 Month LIBOR+1.22%)144A± | | 1.40 | 5-22-2022 | 4,000,000 | 4,046,680 |
| Cooperatieve Rabobank UA (3 Month LIBOR+0.43%)± | | 0.65 | 4-26-2021 | 3,000,000 | 3,002,103 |
| Credit Suisse AG (U.S. SOFR+0.39%)± | | 0.44 | 2-2-2024 | 2,225,000 | 2,230,118 |
| Credit Suisse AG | | 2.10 | 11-12-2021 | 1,000,000 | 1,012,832 |
| Credit Suisse AG | | 2.80 | 4-8-2022 | 4,150,000 | 4,264,348 |
| DNB Bank ASA (3 Month LIBOR+0.62%)144A± | | 0.85 | 12-2-2022 | 500,000 | 504,181 |
| HSBC Holdings plc (3 Month LIBOR+1.06%)± | | 3.26 | 3-13-2023 | 2,000,000 | 2,059,258 |
| Lloyds Banking Group plc (3 Month LIBOR+0.81%)± | | 2.91 | 11-7-2023 | 1,000,000 | 1,038,451 |
| Lloyds Banking Group plc | | 3.00 | 1-11-2022 | 4,959,000 | 5,072,270 |
| Macquarie Bank Limited 144A | | 0.44 | 12-16-2022 | 1,775,000 | 1,778,245 |
The accompanying notes are an integral part of these financial statements.
14 | Wells Fargo Conservative Income Fund
Portfolio of investments—February 28, 2021 (unaudited)
| | | Interest
rate | Maturity
date | Principal | Value |
| Banks (continued) | | | | | |
| Mitsubishi UFJ Financial Group Incorporated (3 Month LIBOR+0.65%)± | | 0.87% | 7-26-2021 | $ 2,735,000 | $ 2,741,707 |
| Mitsubishi UFJ Financial Group Incorporated (3 Month LIBOR+0.70%)± | | 0.93 | 3-7-2022 | 2,060,000 | 2,072,828 |
| Mizuho Financial Group (3 Month LIBOR+0.84%)± | | 1.06 | 7-16-2023 | 5,000,000 | 5,039,438 |
| National Australia Bank Limited | | 3.70 | 11-4-2021 | 1,410,000 | 1,440,964 |
| National Bank of Canada 144A | | 2.15 | 10-7-2022 | 2,165,000 | 2,227,174 |
| Nordea Bank AB 144A | | 1.00 | 6-9-2023 | 2,850,000 | 2,891,199 |
| Santander UK Group Holdings plc | | 2.88 | 8-5-2021 | 3,000,000 | 3,032,761 |
| Santander UK plc (3 Month LIBOR+0.66%)± | | 0.85 | 11-15-2021 | 2,629,000 | 2,640,588 |
| Santander UK plc | | 3.40 | 6-1-2021 | 520,000 | 523,968 |
| Skandinaviska Enskilda Banken (3 Month LIBOR+0.32%)144A± | | 0.55 | 9-1-2023 | 3,000,000 | 3,006,848 |
| Skandinaviska Enskilda Banken (3 Month LIBOR+0.65%)144A± | | 0.86 | 12-12-2022 | 1,250,000 | 1,260,038 |
| Societe Generale SA (3 Month LIBOR+1.33%)144A± | | 1.56 | 4-8-2021 | 5,000,000 | 5,006,675 |
| Sumitomo Mitsui Banking Corporation (3 Month LIBOR+1.14%)± | | 1.36 | 10-19-2021 | 2,815,000 | 2,834,645 |
| Sumitomo Mitsui Trust Bank Limited 144A | | 0.80 | 9-12-2023 | 1,550,000 | 1,566,304 |
| Svenska Handelsbanken AB (3 Month LIBOR+0.47%)± | | 0.65 | 5-24-2021 | 4,000,000 | 4,004,243 |
| Swedbank AB 144A | | 1.30 | 6-2-2023 | 2,225,000 | 2,266,369 |
| United Overseas Bank Limited (3 Month LIBOR+0.48%)144A± | | 0.70 | 4-23-2021 | 1,800,000 | 1,800,968 |
| Westpac Banking Corporation (3 Month LIBOR+1.00%)± | | 1.19 | 5-13-2021 | 2,500,000 | 2,504,900 |
| | | | | | 77,974,113 |
| Capital markets: 1.70% | | | | | |
| UBS AG (U.S. SOFR+0.36%)144A± | | 0.40 | 2-9-2024 | 3,000,000 | 3,007,740 |
| UBS AG 144A | | 1.75 | 4-21-2022 | 2,375,000 | 2,412,871 |
| UBS AG 144A | | 3.00 | 4-15-2021 | 3,000,000 | 3,009,997 |
| | | | | | 8,430,608 |
| Consumer finance: 0.61% | | | | | |
| Hyundai Capital Services 144A | | 2.88 | 3-16-2021 | 3,000,000 | 3,002,850 |
| Thrifts & mortgage finance: 0.62% | | | | | |
| Nationwide Building Society 144A | | 0.55 | 1-22-2024 | 3,100,000 | 3,094,495 |
| Industrials: 0.53% | | | | | |
| Electrical equipment: 0.53% | | | | | |
| Siemens Financieringsmaatschappij NV 144A | | 1.70 | 9-15-2021 | 2,600,000 | 2,620,390 |
| Total Yankee corporate bonds and notes (Cost $113,477,197) | | | | | 113,965,829 |
| Short-term investments: 12.36% | | | | | |
| Commercial paper: 11.86% | | | | | |
| AT&T Incorporated 144A☼ | | 0.37 | 10-19-2021 | 5,000,000 | 4,990,502 |
| Banco Santander SA 144A☼ | | 0.29 | 7-6-2021 | 3,000,000 | 2,998,158 |
| BAT International Finance plc 144A☼ | | 0.31 | 4-22-2021 | 5,000,000 | 4,998,304 |
| Catholic Health Initiatives ☼ | | 0.91 | 3-25-2021 | 3,300,000 | 3,299,755 |
| Concord Minutemen Capital Company 144A¶☼ | | 0.30 | 6-14-2021 | 13,000,000 | 12,992,473 |
| Glencore Funding LLC 144A¶☼ | | 0.24 | 3-16-2021 | 5,000,000 | 4,999,350 |
| Great Bridge Capital Company LLC 144A☼ | | 0.24 | 3-18-2021 | 7,000,000 | 6,999,533 |
| Hyundai Capital America Company 144A☼ | | 0.35 | 3-1-2021 | 3,000,000 | 2,999,963 |
| Sheffield Receivables Company LLC 144A¶☼ | | 0.22 | 4-1-2021 | 2,500,000 | 2,499,667 |
The accompanying notes are an integral part of these financial statements.
Wells Fargo Conservative Income Fund | 15
Portfolio of investments—February 28, 2021 (unaudited)
| | | Interest
rate | Maturity
date | Principal | Value |
| Commercial paper (continued) | | | | | |
| Versailles CDS LLC ☼ | | 0.25% | 4-5-2021 | $ 8,000,000 | $ 7,998,792 |
| VW Credit Incorporated 144A☼ | | 0.24 | 4-15-2021 | 4,000,000 | 3,998,880 |
| | | | | | 58,775,377 |
| | | Yield | | Shares | |
| Investment companies: 0.50% | | | | | |
| Wells Fargo Government Money Market Fund Select Class ♠∞## | | 0.03 | | 2,444,185 | 2,444,185 |
| Total Short-term investments (Cost $61,208,396) | | | | | 61,219,562 |
| Total investments in securities (Cost $499,585,551) | 101.15% | | | | 501,150,252 |
| Other assets and liabilities, net | (1.15) | | | | (5,708,323) |
| Total net assets | 100.00% | | | | $495,441,929 |
| ±± | The coupon of the security is adjusted based on the principal and interest payments received from the underlying pool of mortgages as well as the credit quality and the actual prepayment speed of the underlying mortgages. |
| 144A | The security may be resold in transactions exempt from registration, normally to qualified institutional buyers, pursuant to Rule 144A under the Securities Act of 1933. |
| ± | Variable rate investment. The rate shown is the rate in effect at period end. |
| ## | All or a portion of this security is segregated for when-issued securities. |
| ¶ | Asset-backed commercial paper |
| ♠ | The issuer of the security is an affiliated person of the Fund as defined in the Investment Company Act of 1940. |
| ☼ | Zero coupon security. The rate represents the current yield to maturity. |
| ∞ | The rate represents the 7-day annualized yield at period end. |
| %% | The security is purchased on a when-issued basis. |
| Abbreviations: |
| AGM | Assured Guaranty Municipal |
| AMT | Alternative minimum tax |
| FNMA | Federal National Mortgage Association |
| GNMA | Government National Mortgage Association |
| GO | General obligation |
| LIBOR | London Interbank Offered Rate |
| SOFR | Secured Overnight Financing Rate |
Investments in affiliates
An affiliated investment is an investment in which the Fund owns at least 5% of the outstanding voting shares of the issuer or as a result of other relationships, such as the Fund and the issuer having the same investment manager. Transactions with issuers that were either affiliated persons of the Fund at the beginning of the period or the end of the period were as follows:
| | Value,
beginning of
period | Purchases | Sales
proceeds | Net
realized
gains
(losses) | | Net
change in
unrealized
gains
(losses) | | Value,
end of
period | | % of
net
assets | Shares,
end
of period | Income
from
affiliated
securities |
| Short-term investments | | | | | | | | | | | | |
| Investment companies | | | | | | | | | | | | |
| Securities Lending Cash Investments LLC | $ 0 | $ 4,817,500 | $ (4,817,500) | $0 | | $0 | | $ 0 | | | 0 | $ 34# |
| Wells Fargo Government Money Market Fund Select Class | 588,730 | 185,707,108 | (183,851,653) | 0 | | 0 | | 2,444,185 | | | 2,444,185 | 827 |
| | | | | $0 | | $0 | | $2,444,185 | | 0.50% | | $861 |
The accompanying notes are an integral part of these financial statements.
16 | Wells Fargo Conservative Income Fund
Portfolio of investments—February 28, 2021 (unaudited)
| # | Amount shown represents income before fees and rebates. |
The accompanying notes are an integral part of these financial statements.
Wells Fargo Conservative Income Fund | 17
Statement of assets and liabilities—February 28, 2021 (unaudited)
| | |
| Assets | |
Investments in unaffiliated securities, at value (cost $497,141,366)
| $ 498,706,067 |
Investments in affiliated securites, at value (cost $2,444,185)
| 2,444,185 |
Cash
| 657,763 |
Receivable for investments sold
| 5,664,285 |
Receivable for interest
| 1,509,629 |
Receivable for Fund shares sold
| 54,896 |
Prepaid expenses and other assets
| 26,317 |
Total assets
| 509,063,142 |
| Liabilities | |
Payable for when-issued transactions
| 11,681,710 |
Payable for investments purchased
| 1,500,000 |
Payable for Fund shares redeemed
| 277,683 |
Management fee payable
| 57,810 |
Dividends payable
| 53,955 |
Administration fees payable
| 32,841 |
Trustees’ fees and expenses payable
| 2,183 |
Accrued expenses and other liabilities
| 15,031 |
Total liabilities
| 13,621,213 |
Total net assets
| $495,441,929 |
| Net assets consist of | |
Paid-in capital
| $ 497,011,125 |
Total distributable loss
| (1,569,196) |
Total net assets
| $495,441,929 |
| Computation of net asset value per share | |
Net assets – Class A2
| $ 257,762 |
Shares outstanding – Class A21
| 25,682 |
Net asset value per share – Class A2
| $10.04 |
Net assets – Institutional Class
| $ 495,184,167 |
Shares outstanding – Institutional Class1
| 49,329,129 |
Net asset value per share – Institutional Class
| $10.04 |
| 1 | The Fund has an unlimited number of authorized shares |
The accompanying notes are an integral part of these financial statements.
18 | Wells Fargo Conservative Income Fund
Statement of operations—six months ended February 28, 2021 (unaudited)
| | |
| Investment income | |
Interest
| $ 2,152,451 |
Income from affiliated securities
| 917 |
Total investment income
| 2,153,368 |
| Expenses | |
Management fee
| 589,012 |
| Administration fees | |
Class A2
| 130 |
Institutional Class
| 188,419 |
| Shareholder servicing fees | |
Class A2
| 203 |
Custody and accounting fees
| 12,126 |
Professional fees
| 20,926 |
Registration fees
| 11,699 |
Shareholder report expenses
| 9,294 |
Trustees’ fees and expenses
| 9,556 |
Other fees and expenses
| 6,847 |
Total expenses
| 848,212 |
| Less: Fee waivers and/or expense reimbursements | |
Fund-level
| (230,049) |
Class A2
| (73) |
Net expenses
| 618,090 |
Net investment income
| 1,535,278 |
| Realized and unrealized gains (losses) on investments | |
Net realized gains on investments
| 132,370 |
Net change in unrealized gains (losses) on investments
| (475,494) |
Net realized and unrealized gains (losses) on investments
| (343,124) |
Net increase in net assets resulting from operations
| $1,192,154 |
The accompanying notes are an integral part of these financial statements.
Wells Fargo Conservative Income Fund | 19
Statement of changes in net assets
| | |
| | Six months ended
February 28, 2021
(unaudited) | Year ended
August 31, 2020 |
| Operations | | | | |
Net investment income
| | $ 1,535,278 | | $ 6,678,702 |
Net realized gains (losses) on investments
| | 132,370 | | (1,261,670) |
Net change in unrealized gains (losses) on investments
| | (475,494) | | 1,229,474 |
Net increase in net assets resulting from operations
| | 1,192,154 | | 6,646,506 |
| Distributions to shareholders from | | | | |
| Net investment income and net realized gains | | | | |
Class A2
| | (360) | | (122) 1 |
Institutional Class
| | (1,684,665) | | (6,761,898) |
Total distributions to shareholders
| | (1,685,025) | | (6,762,020) |
| Capital share transactions | Shares | | Shares | |
| Proceeds from shares sold | | | | |
Class A2
| 21,666 | 217,538 | 7,063 1 | 70,834 1 |
Institutional Class
| 27,682,263 | 277,964,993 | 35,880,506 | 359,015,049 |
| | | 278,182,531 | | 359,085,883 |
| Reinvestment of distributions | | | | |
Class A2
| 29 | 292 | 7 1 | 65 1 |
Institutional Class
| 126,198 | 1,267,023 | 570,498 | 5,703,164 |
| | | 1,267,315 | | 5,703,229 |
| Payment for shares redeemed | | | | |
Class A2
| (3,083) | (30,953) | 0 1 | 0 1 |
Institutional Class
| (16,713,293) | (167,807,661) | (31,457,672) | (312,900,963) |
| | | (167,838,614) | | (312,900,963) |
Net increase in net assets resulting from capital share transactions
| | 111,611,232 | | 51,888,149 |
Total increase in net assets
| | 111,118,361 | | 51,772,635 |
| Net assets | | | | |
Beginning of period
| | 384,323,568 | | 332,550,933 |
End of period
| | $ 495,441,929 | | $ 384,323,568 |
| 1 | For the period from May 29, 2020 (commencement of class operations) to August 31, 2020 |
The accompanying notes are an integral part of these financial statements.
20 | Wells Fargo Conservative Income Fund
Financial highlights
(For a share outstanding throughout each period)
| | | Year ended August 31 |
| Class A2 | Six months ended
February 28, 2021
(unaudited) | 2020 1 |
Net asset value, beginning of period
| $10.05 | $10.02 |
Net investment income
| 0.02 | 0.02 |
Net realized and unrealized gains (losses) on investments
| (0.01) | 0.03 |
Total from investment operations
| 0.01 | 0.05 |
| Distributions to shareholders from | | |
Net investment income
| (0.02) | (0.02) |
Net asset value, end of period
| $10.04 | $10.05 |
Total return2
| 0.15% | 0.53% |
| Ratios to average net assets (annualized) | | |
Gross expenses
| 0.69% | 0.70% |
Net expenses
| 0.50% | 0.50% |
Net investment income
| 0.37% | 0.78% |
| Supplemental data | | |
Portfolio turnover rate
| 42% | 102% |
Net assets, end of period (000s omitted)
| $258 | $71 |
| 1 | For the period from May 29, 2020 (commencement of class operations) to August 31, 2020 |
| 2 | Returns for periods of less than one year are not annualized. |
The accompanying notes are an integral part of these financial statements.
Wells Fargo Conservative Income Fund | 21
Financial highlights
(For a share outstanding throughout each period)
| | | Year ended August 31 |
| Institutional Class | Six months ended
February 28, 2021
(unaudited) | 2020 | 2019 | 2018 | 2017 | 2016 |
Net asset value, beginning of period
| $10.05 | $10.00 | $9.99 | $10.01 | $10.01 | $10.00 |
Net investment income
| 0.03 | 0.17 | 0.26 | 0.18 | 0.12 | 0.07 |
Net realized and unrealized gains (losses) on investments
| (0.00) 1 | 0.06 | 0.01 | (0.02) | 0.00 2 | 0.01 |
Total from investment operations
| 0.03 | 0.23 | 0.27 | 0.16 | 0.12 | 0.08 |
| Distributions to shareholders from | | | | | | |
Net investment income
| (0.04) | (0.18) | (0.26) | (0.18) | (0.12) | (0.07) |
Net realized gains
| 0.00 | 0.00 | 0.00 | (0.00) 2 | 0.00 | 0.00 |
Total distributions to shareholders
| (0.04) | (0.18) | (0.26) | (0.18) | (0.12) | (0.07) |
Net asset value, end of period
| $10.04 | $10.05 | $10.00 | $9.99 | $10.01 | $10.01 |
Total return3
| 0.26% | 2.30% | 2.71% | 1.65% | 1.20% | 0.79% |
| Ratios to average net assets (annualized) | | | | | | |
Gross expenses
| 0.36% | 0.38% | 0.37% | 0.37% | 0.36% | 0.36% |
Net expenses
| 0.26% | 0.27% | 0.27% | 0.27% | 0.27% | 0.27% |
Net investment income
| 0.65% | 1.74% | 2.54% | 1.79% | 1.17% | 0.72% |
| Supplemental data | | | | | | |
Portfolio turnover rate
| 42% | 102% | 171% | 197% | 197% | 269% |
Net assets, end of period (000s omitted)
| $495,184 | $384,253 | $332,551 | $400,002 | $419,239 | $547,829 |
| 1 | Amount is more than $(0.005) |
| 2 | Amount is less than $0.005. |
| 3 | Returns for periods of less than one year are not annualized. |
The accompanying notes are an integral part of these financial statements.
22 | Wells Fargo Conservative Income Fund
Notes to financial statements (unaudited)
1. ORGANIZATION
Wells Fargo Funds Trust (the “Trust”), a Delaware statutory trust organized on March 10, 1999, is an open-end management investment company registered under the Investment Company Act of 1940, as amended (the “1940 Act”). As an investment company, the Trust follows the accounting and reporting guidance in Financial Accounting Standards Board (“FASB”) Accounting Standards Codification Topic 946, Financial Services – Investment Companies. These financial statements report on the Wells Fargo Conservative Income Fund (the “Fund”) which is a diversified series of the Trust.
On February 23, 2021, Wells Fargo & Company announced that it has entered into a definitive agreement to sell Wells Fargo Asset Management (“WFAM”) to GTCR LLC and Reverence Capital Partners, L.P. WFAM is the trade name used by the asset management businesses of Wells Fargo & Company and includes Wells Fargo Funds Management, LLC, the investment manager to the Fund, Wells Capital Management Incorporated and Wells Fargo Asset Management (International) Limited, both registered investment advisers providing sub-advisory services to certain funds, and Wells Fargo Funds Distributor, LLC, the Fund's principal underwriter. As part of the transaction, Wells Fargo & Company will own a 9.9% equity interest and will continue to serve as an important client and distribution partner. The transaction is expected to close in the second half of 2021, subject to customary closing conditions.
Consummation of the transaction will result in the automatic termination of the Fund's investment management agreement and sub-advisory agreement. The Fund's Board of Trustees will be asked to approve new investment management arrangements with the new company. If approved by the Board, the new investment management arrangements with the new company will be presented to the shareholders of the Fund for approval, and, if approved by shareholders, would take effect upon the closing of the transaction. The transaction is expected to close in the second half of 2021, subject to customary closing conditions.
2. SIGNIFICANT ACCOUNTING POLICIES
The following significant accounting policies, which are consistently followed in the preparation of the financial statements of the Fund, are in conformity with U.S. generally accepted accounting principles which require management to make estimates and assumptions that affect the reported amounts of assets and liabilities, disclosure of contingent assets and liabilities at the date of the financial statements, and the reported amounts of income and expenses during the reporting period. Actual results could differ from those estimates.
Securities valuation
All investments are valued each business day as of the close of regular trading on the New York Stock Exchange (generally 4 p.m. Eastern Time), although the Fund may deviate from this calculation time under unusual or unexpected circumstances.
Debt securities are valued at the evaluated bid price provided by an independent pricing service (e.g. taking into account various factors, including yields, maturities, or credit ratings) or, if a reliable price is not available, the quoted bid price from an independent broker-dealer.
Investments in registered open-end investment companies are valued at net asset value. Interests in non-registered investment companies that are redeemable at net asset value are fair valued normally at net asset value.
Investments which are not valued using any of the methods discussed above are valued at their fair value, as determined in good faith by the Board of Trustees. The Board of Trustees has established a Valuation Committee comprised of the Trustees and has delegated to it the authority to take any actions regarding the valuation of portfolio securities that the Valuation Committee deems necessary or appropriate, including determining the fair value of portfolio securities, unless the determination has been delegated to the Wells Fargo Asset Management Pricing Committee at Wells Fargo Funds Management, LLC (“Funds Management”). The Board of Trustees retains the authority to make or ratify any valuation decisions or approve any changes to the Valuation Procedures as it deems appropriate. On a quarterly basis, the Board of Trustees receives reports on any valuation actions taken by the Valuation Committee or the Wells Fargo Asset Management Pricing Committee which may include items for ratification.
Securities lending
The Fund may lend its securities from time to time in order to earn additional income in the form of fees or interest on securities received as collateral or the investment of any cash received as collateral. When securities are on loan, the Fund receives interest or dividends on those securities. Cash collateral received in connection with its securities lending transactions is invested in Securities Lending Cash Investments, LLC (the “Securities Lending Fund”). Investments in Securities Lending Fund are valued at the evaluated bid price provided by an independent pricing service. Income earned from investment in the Securities Lending Fund (net of fees and rebates), if any, is included in income from affiliated securities on the Statement of Operations.
Wells Fargo Conservative Income Fund | 23
Notes to financial statements (unaudited)
In a securities lending transaction, the net asset value of the Fund is affected by an increase or decrease in the value of the securities loaned and by an increase or decrease in the value of the instrument in which collateral is invested. The amount of securities lending activity undertaken by the Fund fluctuates from time to time. The Fund has the right under the lending agreement to recover the securities from the borrower on demand. In the event of default or bankruptcy by the borrower, the Fund may be prevented from recovering the loaned securities or gaining access to the collateral or may experience delays or costs in doing so. In such an event, the terms of the agreement allow the unaffiliated securities lending agent to use the collateral to purchase replacement securities on behalf of the Fund or pay the Fund the market value of the loaned securities. The Fund bears the risk of loss with respect to depreciation of its investment of the cash collateral.
When-issued transactions
The Fund may purchase securities on a forward commitment or when-issued basis. The Fund records a when-issued transaction on the trade date and will segregate assets in an amount at least equal in value to the Fund's commitment to purchase when-issued securities. Securities purchased on a when-issued basis are marked-to-market daily and the Fund begins earning interest on the settlement date. Losses may arise due to changes in the market value of the underlying securities or if the counterparty does not perform under the contract.
Security transactions and income recognition
Securities transactions are recorded on a trade date basis. Realized gains or losses are recorded on the basis of identified cost.
Interest income is accrued daily and bond discounts are accreted and premiums are amortized daily. To the extent debt obligations are placed on non-accrual status, any related interest income may be reduced by writing off interest receivables when the collection of all or a portion of interest has been determined to be doubtful based on consistently applied procedures and the fair value has decreased. If the issuer subsequently resumes interest payments or when the collectability of interest is reasonably assured, the debt obligation is removed from non-accrual status. Paydown gains and losses are included in interest income.
Distributions to shareholders
Distributions to shareholders from net investment income are declared daily and paid monthly. Distributions from net realized gains, if any, are recorded on the ex-dividend date and paid at least annually. Such distributions are determined in accordance with income tax regulations and may differ from U.S. generally accepted accounting principles. Dividend sources are estimated at the time of declaration. The tax character of distributions is determined as of the Fund’s fiscal year end. Therefore, a portion of the Fund’s distributions made prior to the Fund’s fiscal year end may be categorized as a tax return of capital at year end.
Federal and other taxes
The Fund intends to continue to qualify as a regulated investment company by distributing substantially all of its investment company taxable income and any net realized capital gains (after reduction for capital loss carryforwards) sufficient to relieve it from all, or substantially all, federal income taxes. Accordingly, no provision for federal income taxes was required.
The Fund’s income and federal excise tax returns and all financial records supporting those returns for the prior three fiscal years are subject to examination by the federal and Delaware revenue authorities. Management has analyzed the Fund's tax positions taken on federal, state, and foreign tax returns for all open tax years and does not believe that there are any uncertain tax positions that require recognition of a tax liability.
As of February 28, 2021, the aggregate cost of all investments for federal income tax purposes was $499,672,375 and the unrealized gains (losses) consisted of:
| Gross unrealized gains | $1,568,405 |
| Gross unrealized losses | (90,528) |
| Net unrealized gains | $1,477,877 |
As of August 31, 2020, the Fund had capital loss carryforwards which consisted of $3,032,650 in short-term capital losses .
24 | Wells Fargo Conservative Income Fund
Notes to financial statements (unaudited)
3. FAIR VALUATION MEASUREMENTS
Fair value measurements of investments are determined within a framework that has established a fair value hierarchy based upon the various data inputs utilized in determining the value of the Fund’s investments. The three-level hierarchy gives the highest priority to unadjusted quoted prices in active markets for identical assets or liabilities (Level 1) and the lowest priority to unobservable inputs (Level 3). The Fund’s investments are classified within the fair value hierarchy based on the lowest level of input that is significant to the fair value measurement. The inputs are summarized into three broad levels as follows:
| ■ | Level 1 – quoted prices in active markets for identical securities |
| ■ | Level 2 – other significant observable inputs (including quoted prices for similar securities, interest rates, prepayment speeds, credit risk, etc.) |
| ■ | Level 3 – significant unobservable inputs (including the Fund’s own assumptions in determining the fair value of investments) |
The inputs or methodologies used for valuing investments in securities are not necessarily an indication of the risk associated with investing in those securities.
The following is a summary of the inputs used in valuing the Fund’s assets and liabilities as of February 28, 2021:
| | Quoted prices
(Level 1) | Other significant
observable inputs
(Level 2) | Significant
unobservable inputs
(Level 3) | Total |
| Assets | | | | |
| Investments in: | | | | |
| Agency securities | $ 0 | $ 8,905,739 | $0 | $ 8,905,739 |
| Asset-backed securities | 0 | 116,197,442 | 0 | 116,197,442 |
| Corporate bonds and notes | 0 | 171,433,587 | 0 | 171,433,587 |
| Municipal obligations | 0 | 29,428,093 | 0 | 29,428,093 |
| Yankee corporate bonds and notes | 0 | 113,965,829 | 0 | 113,965,829 |
| Short-term investments | | | | |
| Commercial paper | 0 | 58,775,377 | 0 | 58,775,377 |
| Investment companies | 2,444,185 | 0 | 0 | 2,444,185 |
| Total assets | $2,444,185 | $498,706,067 | $0 | $501,150,252 |
Additional sector, industry or geographic detail, if any, is included in the Portfolio of Investments.
For the six months ended February 28, 2021, the Fund did not have any transfers into/out of Level 3.
4. TRANSACTIONS WITH AFFILIATES
Management fee
Funds Management, an indirect wholly owned subsidiary of Wells Fargo & Company (“Wells Fargo”), is the manager of the Fund and provides advisory and fund-level administrative services under an investment management agreement. Under the investment management agreement, Funds Management is responsible for, among other services, implementing the investment objectives and strategies of the Fund, supervising the subadviser and providing fund-level administrative services in connection with the Fund’s operations. As compensation for its services under the investment management agreement, Funds Management is entitled to receive a management fee at the following annual rate based on the Fund’s average daily net assets:
| Average daily net assets | Management fee |
| First $1 billion | 0.250% |
| Next $4 billion | 0.225 |
| Next $5 billion | 0.190 |
| Over $10 billion | 0.180 |
For the six months ended February 28, 2021, the management fee was equivalent to an annual rate of 0.25% of the Fund’s average daily net assets.
Wells Fargo Conservative Income Fund | 25
Notes to financial statements (unaudited)
Funds Management has retained the services of a subadviser to provide daily portfolio management to the Fund. The fee for subadvisory services is borne by Funds Management. Wells Capital Management Incorporated ("WellsCap"), an affiliate of Funds Management and an indirect wholly owned subsidiary of Wells Fargo, is the subadviser to the Fund and is entitled to receive a fee from Funds Management at an annual rate starting at 0.10% and declining to 0.05% as the average daily net assets of the Fund increase.
Administration fees
Under a class-level administration agreement, Funds Management provides class-level administrative services to the Fund, which includes paying fees and expenses for services provided by the transfer agent, sub-transfer agents, omnibus account servicers and record-keepers. As compensation for its services under the class-level administration agreement, Funds Management receives an annual fee which is calculated based on the average daily net assets of each class as follows:
| | Class-level
administration fee |
| Class A2 | 0.16% |
| Institutional Class | 0.08 |
Waivers and/or expense reimbursements
Funds Management has contractually waived and/or reimbursed management and administration fees to the extent necessary to maintain certain net operating expense ratios for the Fund. When each class of the Fund has exceeded its expense cap, Funds Management has waived fees and/or reimbursed expenses from fund-level expenses on a proportionate basis and then from class specific expenses. When only certain classes exceed their expense caps, waivers and/or reimbursements are applied against class specific expenses before fund-level expenses. Funds Management has committed through December 31, 2021 to waive fees and/or reimburse expenses to the extent necessary to cap expenses. Prior to or after the commitment expiration date, the cap may be increased or the commitment to maintain the cap may be terminated only with the approval of the Board of Trustees. The contractual expense caps are as follows:
| | Expense ratio caps |
| Class A2 | 0.50% |
| Institutional Class | 0.25 |
Prior to January 1, 2021, Institutional Class shares expenses were capped at 0.27%.
Shareholder servicing fees
The Trust has entered into contracts with one or more shareholder servicing agents, whereby Class A2 shares of the Fund is charged a fee at an annual rate of 0.25% of its average daily net assets. A portion of these total shareholder servicing fees were paid to affiliates of Wells Fargo.
Interfund transactions
The Fund may purchase or sell portfolio investment securities to certain other Wells Fargo affiliates pursuant to Rule 17a-7 under the 1940 Act and under procedures adopted by the Board of Trustees. The procedures have been designed to ensure that these interfund transactions, which do not incur broker commissions, are effected at current market prices.
5. INVESTMENT PORTFOLIO TRANSACTIONS
Purchases and sales of investments, excluding short-term securities, for the six months ended February 28, 2021 were as follows:
| Purchases at cost | | Sales proceeds |
U.S.
government | Non-U.S.
government | | U.S.
government | Non-U.S.
government |
| $12,544,849 | $285,421,892 | | $0 | $169,850,312 |
26 | Wells Fargo Conservative Income Fund
Notes to financial statements (unaudited)
6. SECURITIES LENDING TRANSACTIONS
The Fund lends its securities through an unaffiliated securities lending agent and receives collateral in the form of cash or securities with a value at least equal to the value of the securities on loan. The value of the loaned securities is determined at the close of each business day and any increases or decreases in the required collateral are exchanged between the Fund and the counterparty on the next business day. Cash collateral received is invested in the Securities Lending Fund which seeks to provide a positive return compared to the daily Federal Funds Open Rate by investing in high-quality, U.S. dollar-denominated short-term money market instruments and is exempt from registration under Section 3(c)(7) of the 1940 Act. Securities Lending Fund is managed by Funds Management and is subadvised by WellsCap. Funds Management receives an advisory fee starting at 0.05% and declining to 0.01% as the average daily net assets of the Securities Lending Fund increase. All of the fees received by Funds Management are paid to WellsCap for its services as subadviser.
In the event of counterparty default or the failure of a borrower to return a loaned security, the Fund has the right to use the collateral to offset any losses incurred. As of February 28, 2021, the Fund did not have any securities on loan.
7. BANK BORROWINGS
The Trust (excluding the money market funds), Wells Fargo Master Trust and Wells Fargo Variable Trust are parties to a $350,000,000 revolving credit agreement whereby the Fund is permitted to use bank borrowings for temporary or emergency purposes, such as to fund shareholder redemption requests. Interest under the credit agreement is charged to the Fund based on a borrowing rate equal to the higher of the Federal Funds rate in effect on that day plus 1.25% or the overnight LIBOR rate in effect on that day plus 1.25%. In addition, an annual commitment fee equal to 0.25% of the unused balance is allocated to each participating fund.
For the six months ended February 28, 2021, there were no borrowings by the Fund under the agreement.
8. INDEMNIFICATION
Under the Fund's organizational documents, the officers and Trustees have been granted certain indemnification rights against certain liabilities that may arise out of performance of their duties to the Fund. The Fund has entered into a separate agreement with each Trustee that converts indemnification rights currently existing under the Fund’s organizational documents into contractual rights that cannot be changed in the future without the consent of the Trustee. Additionally, in the normal course of business, the Fund may enter into contracts with service providers that contain a variety of indemnification clauses. The Fund’s maximum exposure under these arrangements is dependent on future claims that may be made against the Fund and, therefore, cannot be estimated.
9. CORONAVIRUS (COVID-19) PANDEMIC
On March 11, 2020, the World Health Organization announced that it had made the assessment that coronavirus disease 2019 (“COVID-19”) is a pandemic. The impacts of COVID-19 are affecting the entire global economy, individual companies and investment products, the funds, and the market in general. There is significant uncertainty around the extent and duration of business disruptions related to COVID-19 and the impacts may last for an extended period of time. COVID-19 has led to significant uncertainty and volatility in the financial markets.
Wells Fargo Conservative Income Fund | 27
Other information (unaudited)
PROXY VOTING INFORMATION
A description of the policies and procedures used to determine how to vote proxies relating to portfolio securities is available without charge, upon request, by calling 1-800-222-8222, visiting our website at wfam.com, or visiting the SEC website at sec.gov. Information regarding how the proxies related to portfolio securities were voted during the most recent 12-month period ended June 30 is available on the website at wfam.com or by visiting the SEC website at sec.gov.
QUARTERLY PORTFOLIO HOLDINGS INFORMATION
The Fund files its complete schedule of portfolio holdings with the SEC for the first and third quarters of each fiscal year as an exhibit to its reports on Form N-PORT. Shareholders may view the filed Form N-PORT by visiting the SEC website at sec.gov.
28 | Wells Fargo Conservative Income Fund
Other information (unaudited)
BOARD OF TRUSTEES AND OFFICERS
Each of the Trustees and Officers listed in the table below acts in identical capacities for each fund in the Wells Fargo family of funds, which consists of 144 mutual funds comprising the Wells Fargo Funds Trust, Wells Fargo Variable Trust, Wells Fargo Master Trust and four closed-end funds (collectively the “Fund Complex”). This table should be read in conjunction with the Prospectus and the Statement of Additional Information1. The mailing address of each Trustee and Officer is 525 Market Street, 12th Floor, San Francisco, CA 94105. Each Trustee and Officer serves an indefinite term, however, each Trustee serves such term until reaching the mandatory retirement age established by the Trustees.
Independent Trustees
Name and
year of birth | Position held and
length of service* | Principal occupations during past five years or longer | Current other
public company or
investment
company
directorships |
William R. Ebsworth
(Born 1957) | Trustee,
since 2015 | Retired. From 1984 to 2013, equities analyst, portfolio manager, research director and chief investment officer at Fidelity Management and Research Company in Boston, Tokyo, and Hong Kong, and retired in 2013 as Chief Investment Officer of Fidelity Strategic Advisers, Inc. where he led a team of investment professionals managing client assets. Prior thereto, Board member of Hong Kong Securities Clearing Co., Hong Kong Options Clearing Corp., the Thailand International Fund, Ltd., Fidelity Investments Life Insurance Company, and Empire Fidelity Investments Life Insurance Company. Audit Committee Chair and Investment Committee Chair of the Vincent Memorial Hospital Endowment (non-profit organization). Mr. Ebsworth is a CFA® charterholder. | N/A |
Jane A. Freeman
(Born 1953) | Trustee,
since 2015;
Chair Liaison,
since 2018 | Retired. From 2012 to 2014 and 1999 to 2008, Chief Financial Officer of Scientific Learning Corporation. From 2008 to 2012, Ms. Freeman provided consulting services related to strategic business projects. Prior to 1999, Portfolio Manager at Rockefeller & Co. and Scudder, Stevens & Clark. Board member of the Harding Loevner Funds from 1996 to 2014, serving as both Lead Independent Director and chair of the Audit Committee. Board member of the Russell Exchange Traded Funds Trust from 2011 to 2012 and the chair of the Audit Committee. Ms. Freeman is also an inactive Chartered Financial Analyst. | N/A |
Isaiah Harris, Jr.
(Born 1952) | Trustee,
since 2009; Audit
Committee
Chair,
since 2019 | Retired. Chairman of the Board of CIGNA Corporation since 2009, and Director since 2005. From 2003 to 2011, Director of Deluxe Corporation. Prior thereto, President and CEO of BellSouth Advertising and Publishing Corp. from 2005 to 2007, President and CEO of BellSouth Enterprises from 2004 to 2005 and President of BellSouth Consumer Services from 2000 to 2003. Emeritus member of the Iowa State University Foundation Board of Governors. Emeritus Member of the Advisory Board of Iowa State University School of Business. Advisory Board Member, Palm Harbor Academy (private school). Mr. Harris is a certified public accountant (inactive status). | CIGNA Corporation |
Judith M. Johnson
(Born 1949) | Trustee,
since 2008 | Retired. Prior thereto, Chief Executive Officer and Chief Investment Officer of Minneapolis Employees Retirement Fund from 1996 to 2008. Ms. Johnson is an attorney, certified public accountant and a certified managerial accountant. | N/A |
David F. Larcker
(Born 1950) | Trustee,
since 2009 | James Irvin Miller Professor of Accounting at the Graduate School of Business (Emeritus), Stanford University, Director of the Corporate Governance Research Initiative and Senior Faculty of The Rock Center for Corporate Governance since 2006. From 2005 to 2008, Professor of Accounting at the Graduate School of Business, Stanford University. Prior thereto, Ernst & Young Professor of Accounting at The Wharton School, University of Pennsylvania from 1985 to 2005. | N/A |
Wells Fargo Conservative Income Fund | 29
Other information (unaudited)
Name and
year of birth | Position held and
length of service* | Principal occupations during past five years or longer | Current other
public company or
investment
company
directorships |
Olivia S. Mitchell
(Born 1953) | Trustee,
since 2006;
Nominating and
Governance
Committee Chair,
since 2018 | International Foundation of Employee Benefit Plans Professor, Wharton School of the University of Pennsylvania since 1993. Director of Wharton’s Pension Research Council and Boettner Center on Pensions & Retirement Research, and Research Associate at the National Bureau of Economic Research. Previously, Cornell University Professor from 1978 to 1993. | N/A |
Timothy J. Penny
(Born 1951) | Trustee,
since 1996;
Chair,
since 2018 | President and Chief Executive Officer of Southern Minnesota Initiative Foundation, a non-profit organization, since 2007. Member of the Board of Trustees of NorthStar Education Finance, Inc., a non-profit organization, since 2007. | N/A |
James G. Polisson
(Born 1959) | Trustee,
since 2018 | Retired. Chief Marketing Officer, Source (ETF) UK Services, Ltd, from 2015 to 2017. From 2012 to 2015, Principal of The Polisson Group, LLC, a management consulting, corporate advisory and principal investing company. Chief Executive Officer and Managing Director at Russell Investments, Global Exchange Traded Funds from 2010 to 2012. Managing Director of Barclays Global Investors from 1998 to 2010 and Global Chief Marketing Officer for iShares and Barclays Global Investors from 2000 to 2010. Trustee of the San Francisco Mechanics’ Institute, a non-profit organization, from 2013 to 2015. Board member of the Russell Exchange Traded Fund Trust from 2011 to 2012. Director of Barclays Global Investors Holdings Deutschland GmbH from 2006 to 2009. Mr. Polisson is an attorney and has a retired status with the Massachusetts and District of Columbia Bar Associations. | N/A |
Pamela Wheelock
(Born 1959) | Trustee,
since January
2020; previously
Trustee from
January 2018 to
July 2019 | Board member of the Destination Medical Center Economic Development Agency, Rochester, Minnesota since 2019. Interim President of the McKnight Foundation from January to September 2020. Acting Commissioner, Minnesota Department of Human Services, July 2019 through September 2019. Human Services Manager (part-time), Minnesota Department of Human Services, October 2019 through December 2019. Chief Operating Officer, Twin Cities Habitat for Humanity from 2017 to 2019. Vice President of University Services, University of Minnesota from 2012 to 2016. Prior thereto, on the Board of Directors, Governance Committee and Finance Committee for the Minnesota Philanthropy Partners (Saint Paul Foundation) from 2012 to 2018, Interim Chief Executive Officer of Blue Cross Blue Shield of Minnesota from 2011 to 2012, Chairman of the Board from 2009 to 2012 and Board Director from 2003 to 2015. Vice President, Leadership and Community Engagement, Bush Foundation, Saint Paul, Minnesota (a private foundation) from 2009 to 2011. Executive Vice President and Chief Financial Officer, Minnesota Sports and Entertainment from 2004 to 2009 and Senior Vice President from 2002 to 2004. Executive Vice President of the Minnesota Wild Foundation from 2004 to 2008. Commissioner of Finance, State of Minnesota, from 1999 to 2002. Currently Board Chair of the Minnesota Wild Foundation since 2010. | N/A |
* Length of service dates reflect the Trustee’s commencement of service with the Trust’s predecessor entities, where applicable.
30 | Wells Fargo Conservative Income Fund
Other information (unaudited)
Officers
Name and
year of birth | Position held and
length of service | Principal occupations during past five years or longer |
Andrew Owen
(Born 1960) | President,
since 2017 | Executive Vice President of Wells Fargo & Company and Head of Affiliated Managers, Wells Fargo Asset Management, since 2014. In addition, Mr. Owen is currently President, Chief Executive Officer and Director of Wells Fargo Funds Management, LLC since 2017. Prior thereto, Executive Vice President responsible for marketing, investments and product development for Wells Fargo Funds Management, LLC, from 2009 to 2014. |
Jeremy DePalma
(Born 1974) | Treasurer,
since 2012
(for certain funds in
the Fund Complex);
since 2021 (for
the remaining funds in the
Fund Complex) | Senior Vice President of Wells Fargo Funds Management, LLC since 2009. Senior Vice President of Evergreen Investment Management Company, LLC from 2008 to 2010 and head of the Fund Reporting and Control Team within Fund Administration from 2005 to 2010. |
Michelle Rhee
(Born 1966) | Chief Legal Officer,
since 2019 | Secretary of Wells Fargo Funds Management, LLC and Chief Legal Counsel of Wells Fargo Asset Management since 2018. Deputy General Counsel of Wells Fargo Bank, N.A. since 2020 and Assistant General Counsel of Wells Fargo Bank, N.A. from 2018 to 2020. Associate General Counsel and Managing Director of Bank of America Corporation from 2004 to 2018. |
Catherine Kennedy
(Born 1969) | Secretary,
since 2019 | Vice President of Wells Fargo Funds Management, LLC and Senior Counsel of the Wells Fargo Legal Department since 2010. Vice President and Senior Counsel of Evergreen Investment Management Company, LLC from 1998 to 2010. |
Michael H. Whitaker
(Born 1967) | Chief Compliance Officer,
since 2016 | Chief Compliance Officer of Wells Fargo Asset Management since 2016. Senior Vice President and Chief Compliance Officer for Fidelity Investments from 2007 to 2016. |
1 The Statement of Additional Information includes additional information about the Trustees and is available, without charge, upon request, by calling 1-800-222-8222 or by visiting the website at wfam.com.
Wells Fargo Conservative Income Fund | 31
For more information
More information about Wells Fargo Funds is available free upon request. To obtain literature, please write, visit the Fund's website, or call:
Wells Fargo Funds
P.O. Box 219967
Kansas City, MO 64121-9967
Website: wfam.com
Individual investors: 1-800-222-8222
Retail investment professionals: 1-888-877-9275
Institutional investment professionals: 1-866-765-0778
This report and the financial statements contained herein are submitted for the general information of the shareholders of the Fund. If this report is used for promotional purposes, distribution of the report must be accompanied or preceded by a current prospectus. Before investing, please consider the investment objectives, risks, charges, and expenses of the investment. For a current prospectus and, if available, a summary prospectus, containing this information, call 1-800-222-8222 or visit the Fund's website at wfam.com. Read the prospectus carefully before you invest or send money.
Wells Fargo Asset Management (WFAM) is the trade name for certain investment advisory/management firms owned by Wells Fargo & Company. These firms include but are not limited to Wells Capital Management Incorporated and Wells Fargo Funds Management, LLC. Certain products managed by WFAM entities are distributed by Wells Fargo Funds Distributor, LLC (a broker-dealer and Member FINRA).
This material is for general informational and educational purposes only and is NOT intended to provide investment advice or a recommendation of any kind - including a recommendation for any specific investment, strategy, or plan.
INVESTMENT PRODUCTS: NOT FDIC INSURED ■ NO BANK GUARANTEE ■ MAY LOSE VALUE
© 2021 Wells Fargo & Company. All rights reserved.
PAR-0321-00289 04-21
SA265/SAR265 02-21
Semi-Annual Report
February 28, 2021
Wells Fargo Core Plus Bond Fund
Reduce clutter.
Save trees.
Sign up for electronic delivery of prospectuses and shareholder reports at wellsfargo.com/ advantagedelivery
The views expressed and any forward-looking statements are as of February 28, 2021, unless otherwise noted, and are those of the Fund's portfolio managers and/or Wells Fargo Asset Management. Discussions of individual securities or the markets generally are not intended as individual recommendations. Future events or results may vary significantly from those expressed in any forward-looking statements. The views expressed are subject to change at any time in response to changing circumstances in the market. Wells Fargo Asset Management and the Fund disclaim any obligation to publicly update or revise any views expressed or forward-looking statements.
INVESTMENT PRODUCTS: NOT FDIC INSURED ■ NO BANK GUARANTEE ■ MAY LOSE VALUE
Wells Fargo Core Plus Bond Fund | 1
Letter to shareholders (unaudited)
Andrew Owen
President
Wells Fargo Funds
Dear Shareholder:
We are pleased to offer you this semi-annual report for the Wells Fargo Core Plus Bond Fund for the six-month period that ended February 28, 2021. Global stocks showed robust returns, as the global economy began emerging from the haze of COVID-19. Tailwinds were provided by global stimulus programs, a rapid vaccination rollout, and recovering consumer and corporate sentiment. Bonds also had positive returns, led by high-yield bonds.
For the six-month period, U.S. stocks, based on the S&P 500 Index,1 gained 9.74%. International stocks, as measured by the MSCI ACWI ex USA Index (Net),2 returned 16.65%, while the MSCI EM Index (Net),3 had even stronger performance, with a 22.32% gain. Among bond indexes, the Bloomberg Barclays U.S. Aggregate Bond Index,4 returned (1.55)%, the Bloomberg Barclays Global Aggregate ex-USD Index (unhedged),5 gained 1.41%, and the Bloomberg Barclays Municipal Bond Index,6 returned 0.86% while the ICE BofA U.S. High Yield Index,7 gained 6.14%.
Hope drove the stock markets to new highs.
Stocks grew more volatile in September on mixed economic data. U.S. economic activity continued to grow. However, U.S. unemployment remained elevated at 7.9% in September. With U.S. Congress delaying further fiscal relief and uncertainties surrounding a possible vaccine, doubts crept back into the financial markets. In the U.K., a lack of progress in Brexit talks weighed on markets. China’s economy picked up steam, fueled by increased global demand.
In October, capital markets stepped back from their six-month rally. Market volatility rose in advance of the U.S. election and amid a global increase in COVID-19 infections. Europe introduced tighter restrictions affecting economic activity. U.S. markets looked favorably at the prospect of Democratic control of the federal purse strings, which could lead to additional fiscal stimulus and a boost to economic activity. Meanwhile, China reported 4.9% third-quarter gross domestic product growth.
| 1 | The S&P 500 Index consists of 500 stocks chosen for market size, liquidity, and industry group representation. It is a market-value-weighted index with each stock's weight in the index proportionate to its market value. You cannot invest directly in an index. |
| 2 | The Morgan Stanley Capital International (MSCI) All Country World Index (ACWI) ex USA Index (Net) is a free-float-adjusted market-capitalization-weighted index that is designed to measure the equity market performance of developed and emerging markets, excluding the United States. Source: MSCI. MSCI makes no express or implied warranties or representations and shall have no liability whatsoever with respect to any MSCI data contained herein. The MSCI data may not be further redistributed or used as a basis for other indices or any securities or financial products. This report is not approved, reviewed, or produced by MSCI. You cannot invest directly in an index. |
| 1 | The S&P 500 Index consists of 500 stocks chosen for market size, liquidity, and industry group representation. It is a market-value-weighted index with each stock's weight in the index proportionate to its market value. You cannot invest directly in an index. |
| 3 | The MSCI Emerging Markets (EM) Index (Net) is a free-float-adjusted market-capitalization-weighted index that is designed to measure equity market performance of emerging markets. You cannot invest directly in an index. |
| 1 | The S&P 500 Index consists of 500 stocks chosen for market size, liquidity, and industry group representation. It is a market-value-weighted index with each stock's weight in the index proportionate to its market value. You cannot invest directly in an index. |
| 4 | The Bloomberg Barclays U.S. Aggregate Bond Index is a broad-based benchmark that measures the investment-grade, U.S. dollar-denominated, fixed-rate taxable bond market, including Treasuries, government-related and corporate securities, mortgage-backed securities (agency fixed-rate and hybrid adjustable-rate mortgage pass-throughs), asset-backed securities, and commercial mortgage-backed securities. You cannot invest directly in an index. |
| 1 | The S&P 500 Index consists of 500 stocks chosen for market size, liquidity, and industry group representation. It is a market-value-weighted index with each stock's weight in the index proportionate to its market value. You cannot invest directly in an index. |
| 5 | The Bloomberg Barclays Global Aggregate ex-USD Index (unhedged) is an unmanaged index that provides a broad-based measure of the global investment-grade fixed-income markets excluding the U.S. dollar-denominated debt market. You cannot invest directly in an index. |
| 1 | The S&P 500 Index consists of 500 stocks chosen for market size, liquidity, and industry group representation. It is a market-value-weighted index with each stock's weight in the index proportionate to its market value. You cannot invest directly in an index. |
| 6 | The Bloomberg Barclays Municipal Bond Index is an unmanaged index composed of long-term tax-exempt bonds with a minimum credit rating of Baa. You cannot invest directly in an index. |
| 1 | The S&P 500 Index consists of 500 stocks chosen for market size, liquidity, and industry group representation. It is a market-value-weighted index with each stock's weight in the index proportionate to its market value. You cannot invest directly in an index. |
| 7 | The ICE BofA U.S. High Yield Index is a market-capitalization-weighted index of domestic and Yankee high-yield bonds. The index tracks the performance of high-yield securities traded in the U.S. bond market. You cannot invest directly in an index. Copyright 2021. ICE Data Indices, LLC. All rights reserved. |
2 | Wells Fargo Core Plus Bond Fund
Letter to shareholders (unaudited)
Global stocks rallied in November, propelled by optimism over three promising COVID-19 vaccines. Reversing recent trends, value stocks outperformed growth stocks and cyclical stocks outpaced technology stocks. However, U.S. unemployment remained elevated, with a net job loss of 10 million since February 2020. The eurozone services Purchasing Managers’ Index, a monthly survey of purchasing managers, contracted sharply while the region’s manufacturing activity grew. The U.S. election results added to the upbeat mood as investors anticipated more consistent policies in the new administration.
Financial markets ended the year with strength on high expectations for a rapid rollout of the COVID-19 vaccines, the successful passage of a $900 billion stimulus package, and rising expectations of additional economic support from a Democratic-led Congress. U.S. economic data were mixed with still-elevated unemployment and weak retail sales but growth in manufacturing output. In contrast, China’s economic expansion continued in both manufacturing and nonmanufacturing. U.S. COVID-19 infection rates continued to rise even as new state and local lockdown measures were implemented.
The year 2021 began with emerging market stocks leading all major asset classes in January, driven by China’s strong economic growth and a broad recovery in corporate earnings, which propelled China’s stock market higher. In the United States, positive news on vaccine trials and January's expansion in both the manufacturing and services sectors was offset by a weak December monthly jobs report. This was compounded by technical factors as some hedge funds were forced to sell stocks to protect themselves against a well-publicized short squeeze coordinated by a group of retail investors. Eurozone sentiment and economic growth were particularly weak, reflecting the impact of a new lockdown with stricter social distancing along with a slow vaccine rollout.
February saw major domestic equity indexes driven higher on the hope of a new stimulus bill, improving COVID-19 vaccination numbers, and the gradual reopening of the economy. Most S&P 500 companies reported better-than-expected earnings, with positive surprises coming from the financials, IT, health care, and materials sectors. Japan saw its economy strengthen as a result of strong export numbers. Meanwhile, crude oil prices continued their climb, rising more than 25% for the year. Domestic government bonds experienced a sharp sell-off in late February as markets priced in a more robust economic recovery and higher growth and inflation expectations.
Don’t let short-term uncertainty derail long-term investment goals.
Periods of investment uncertainty can present challenges, but experience has taught us that maintaining long-term investment goals can be an effective way to plan for the future. To help you create a sound strategy based on your personal goals and risk tolerance, Wells Fargo Funds offers more than 100 mutual funds spanning a wide range of asset classes and investment styles. Although diversification cannot guarantee an investment profit or prevent losses, we believe it can be an effective way to manage investment risk and potentially smooth out overall portfolio performance. We encourage investors to know their investments and to understand that appropriate levels of risk-taking may unlock opportunities.
Thank you for choosing to invest with Wells Fargo Funds. We appreciate your confidence in us and remain committed to helping you meet your financial needs.
Sincerely,
Andrew Owen
President
Wells Fargo Funds
“Global stocks rallied in November, propelled by optimism over three promising COVID-19 vaccines.”
“February saw major domestic equity indexes driven higher on the hope of a new stimulus bill, improving COVID-19 vaccination numbers, and the gradual reopening of the economy.”
For further information about your Fund, contact your investment professional, visit our website at wfam.com, or call us directly at 1-800-222-8222.
Wells Fargo Core Plus Bond Fund | 3
Letter to shareholders (unaudited)
Preparing for LIBOR Transition
The global financial industry is preparing to transition away from the London Interbank Offered Rate (LIBOR), a key benchmark interest rate, to new alternative rates. LIBOR underpins more than $350 trillion of financial contracts. It is the benchmark rate for a wide spectrum of products ranging from residential mortgages to corporate bonds to derivatives. Regulators have called for a market-wide transition away from LIBOR to successor reference rates by the end of 2021 (extended through June 30, 2023 for most tenors of the U.S. dollar LIBOR), which requires proactive steps be taken by issuers, counterparties, and asset managers to identify impacted products and adopt new reference rates.
The Fund holds at least one security that uses LIBOR as a floating reference rate and has a maturity date after 12-31-2021.
Although the transition process away from LIBOR has become increasingly well-defined in advance of the anticipated discontinuation date, there remains uncertainty regarding the nature of successor reference rates, and any potential effects of the transition away from LIBOR on investment instruments that use it as a benchmark rate. The transition process may result in, among other things, increased volatility or illiquidity in markets for instruments that currently rely on LIBOR and could negatively impact the value of certain instruments held by the Fund.
Wells Fargo Asset Management is monitoring LIBOR exposure closely and has put resources and controls in place to manage this transition effectively. The Fund’s portfolio management team is evaluating LIBOR holdings to understand what happens to those securities when LIBOR ceases to exist, including examining security documentation to identify the presence or absence of fallback language identifying a replacement rate to LIBOR.
While the pace of transition away from LIBOR will differ by asset class and investment strategy, the portfolio management team will monitor market conditions for those holdings to identify and mitigate deterioration or volatility in pricing and liquidity and ensure appropriate actions are taken in a timely manner.
Further information regarding the potential risks associated with the discontinuation of LIBOR can be found in the Fund’s Statement of Additional Information.
4 | Wells Fargo Core Plus Bond Fund
This page is intentionally left blank.
Performance highlights (unaudited)
| Investment objective | The Fund seeks total return, consisting of current income and capital appreciation. |
| Manager | Wells Fargo Funds Management, LLC |
| Subadviser | Wells Capital Management Incorporated |
| Portfolio managers | Christopher Y. Kauffman, CFA®‡, Jay N. Mueller, CFA®‡, Janet S. Rilling, CFA®‡, CPA, Michael J. Schueller, CFA®‡, Noah M. Wise, CFA®‡ |
| Average annual total returns (%) as of February 28, 2021 |
| | | Including sales charge | | Excluding sales charge | | Expense ratios1 (%) |
| | Inception date | 1 year | 5 year | 10 year | | 1 year | 5 year | 10 year | | Gross | Net 2 |
| Class A (STYAX) | 7-13-1998 | 1.76 | 4.57 | 4.14 | | 6.53 | 5.54 | 4.62 | | 0.89 | 0.75 |
| Class C (WFIPX) | 7-13-1998 | 4.69 | 4.74 | 3.84 | | 5.69 | 4.74 | 3.84 | | 1.64 | 1.50 |
| Class R6 (STYJX)3 | 10-31-2016 | – | – | – | | 6.92 | 5.92 | 4.97 | | 0.51 | 0.37 |
| Administrator Class (WIPDX) | 7-30-2010 | – | – | – | | 6.58 | 5.65 | 4.75 | | 0.83 | 0.64 |
| Institutional Class (WIPIX) | 7-18-2008 | – | – | – | | 6.79 | 5.87 | 4.94 | | 0.56 | 0.42 |
| Bloomberg Barclays U.S. Aggregate Bond Index4 | – | – | – | – | | 1.38 | 3.55 | 3.58 | | – | – |
Figures quoted represent past performance, which is no guarantee of future results, and do not reflect taxes that a shareholder may pay on an investment in a fund. Investment return and principal value of an investment will fluctuate so that an investor’s shares, when redeemed, may be worth more or less than their original cost. Performance shown without sales charges would be lower if sales charges were reflected. Current performance may be lower or higher than the performance data quoted, which assumes the reinvestment of dividends and capital gains. Current month-end performance is available on the Fund’s website, wfam.com.
Index returns do not include transaction costs associated with buying and selling securities, any mutual fund fees or expenses, or any taxes. It is not possible to invest directly in an index.
For Class A shares, the maximum front-end sales charge is 4.50%. For Class C shares, the maximum contingent deferred sales charge is 1.00%. Performance including a contingent deferred sales charge assumes the sales charge for the corresponding time period. Class R6, Administrator Class, and Institutional Class shares are sold without a front-end sales charge or contingent deferred sales charge.
| 1 | Reflects the expense ratios as stated in the most recent prospectuses, which include the impact of 0.02% in acquired fund fees and expenses. The expense ratios shown are subject to change and may differ from the annualized expense ratios shown in the financial highlights of this report, which do not include acquired fund fees and expenses. |
| 2 | The manager has contractually committed through December 31, 2021, to waive fees and/or reimburse expenses to the extent necessary to cap total annual fund operating expenses after fee waivers at 0.73% for Class A, 1.48% for Class C, 0.35% for Class R6, 0.62% for Administrator Class and 0.40% for Institutional Class. Brokerage commissions, stamp duty fees, interest, taxes, acquired fund fees and expenses (if any), and extraordinary expenses are excluded from the expense caps. Prior to or after the commitment expiration date, the caps may be increased or the commitment to maintain the caps may be terminated only with the approval of the Board of Trustees. Without these caps, the Fund’s returns would have been lower. The expense ratio paid by an investor is the net expense ratio (the total annual fund operating expenses after fee waivers) as stated in the prospectuses. |
| 3 | Historical performance shown for the Class R6 shares prior to their inception reflects the performance of the Institutional Class shares, and includes the higher expenses applicable to Institutional Class shares. If these expenses had not been included, returns for Class R6 shares would be higher. |
| 4 | The Bloomberg Barclays U.S. Aggregate Bond Index is a broad-based benchmark that measures the investment-grade, U.S. dollar–denominated, fixed-rate taxable bond market, including Treasuries, government-related and corporate securities, mortgage-backed securities (agency fixed-rate and hybrid adjustable-rate mortgage pass-throughs), asset-backed securities, and commercial mortgage-backed securities. You cannot invest directly in an index. |
| ‡ | CFA® and Chartered Financial Analyst® are trademarks owned by CFA Institute. |
6 | Wells Fargo Core Plus Bond Fund
Performance highlights (unaudited)
Bond values fluctuate in response to the financial condition of individual issuers, general market and economic conditions, and changes in interest rates. Changes in market conditions and government policies may lead to periods of heightened volatility in the bond market and reduced liquidity for certain bonds held by the Fund. In general, when interest rates rise, bond values fall and investors may lose principal value. Interest rate changes and their impact on the Fund and its share price can be sudden and unpredictable. Loans are subject to risks similar to those associated with other below-investment-grade bond investments, such as credit risk (for example, risk of issuer default), below-investment-grade bond risk (for example, risk of greater volatility in value), and risk that the loan may become illiquid or difficult to price. The use of derivatives may reduce returns and/or increase volatility. Foreign investments are especially volatile and can rise or fall dramatically due to differences in the political and economic conditions of the host country. These risks are generally intensified in emerging markets. Certain investment strategies tend to increase the total risk of an investment (relative to the broader market). The Fund is exposed to high-yield securities risk and mortgage- and asset-backed securities risk. Consult the Fund’s prospectus for additional information on these and other risks.
| Ten largest holdings (%) as of February 28, 20211 |
| FNMA, 2.50%, 7-25-2050 | 4.54 |
| FNMA, 2.00%, 3-11-2051 | 2.67 |
| U.S. Treasury Bond, 1.88%, 2-15-2051 | 1.67 |
| U.S. Treasury Note, 0.38%, 1-31-2026 | 1.57 |
| U.S. Treasury Note, 0.38%, 11-30-2025 | 1.53 |
| U.S. Treasury Note, 0.25%, 10-31-2025 | 1.31 |
| TIPS, 0.13%, 7-15-2030 | 1.02 |
| TVA, 5.88%, 4-1-2036 | 0.73 |
| U.S. Treasury Note, 0.38%, 4-30-2025 | 0.71 |
| TIPS, 0.13%, 1-15-2031 | 0.70 |
| 1 | Figures represent the percentage of the Fund's net assets. Holdings are subject to change and may have changed since the date specified. |
| Portfolio composition as of February 28, 20211 |
| 1 | Figures represent the percentage of the Fund's long-term investments. These amounts are subject to change and may have changed since the date specified. |
Wells Fargo Core Plus Bond Fund | 7
Fund expenses (unaudited)
As a shareholder of the Fund, you incur two types of costs: (1) transaction costs, including sales charges (loads) on purchase payments and contingent deferred sales charges (if any) on redemptions and (2) ongoing costs, including management fees, distribution (12b-1) and/or shareholder servicing fees, and other Fund expenses. This example is intended to help you understand your ongoing costs (in dollars) of investing in the Fund and to compare these costs with the ongoing costs of investing in other mutual funds.
The example is based on an investment of $1,000 invested at the beginning of the six-month period and held for the entire period from September 1, 2020 to February 28, 2021.
Actual expenses
The “Actual” line of the table below provides information about actual account values and actual expenses. You may use the information in this line, together with the amount you invested, to estimate the expenses that you paid over the period. Simply divide your account value by $1,000 (for example, an $8,600 account value divided by $1,000 = 8.6), then multiply the result by the number in the “Actual” line under the heading entitled “Expenses paid during period” for your applicable class of shares to estimate the expenses you paid on your account during this period.
Hypothetical example for comparison purposes
The “Hypothetical” line of the table below provides information about hypothetical account values and hypothetical expenses based on the Fund’s actual expense ratio and an assumed rate of return of 5% per year before expenses, which is not the Fund’s actual return. The hypothetical account values and expenses may not be used to estimate the actual ending account balance or expenses you paid for the period. You may use this information to compare the ongoing costs of investing in the Fund and other funds. To do so, compare this 5% hypothetical example with the 5% hypothetical examples that appear in the shareholder reports of the other funds.
Please note that the expenses shown in the table are meant to highlight your ongoing costs only and do not reflect any transactional costs, such as sales charges (loads) and contingent deferred sales charges. Therefore, the “Hypothetical” line of the table is useful in comparing ongoing costs only and will not help you determine the relative total costs of owning different funds. In addition, if these transactional costs were included, your costs would have been higher.
| | Beginning
account value
9-1-2020 | Ending
account value
2-28-2021 | Expenses
paid during
the period1 | Annualized net
expense ratio |
| Class A | | | | |
| Actual | $1,000.00 | $1,008.56 | $3.59 | 0.72% |
| Hypothetical (5% return before expenses) | $1,000.00 | $1,021.22 | $3.61 | 0.72% |
| Class C | | | | |
| Actual | $1,000.00 | $1,004.89 | $7.36 | 1.48% |
| Hypothetical (5% return before expenses) | $1,000.00 | $1,017.46 | $7.40 | 1.48% |
| Class R6 | | | | |
| Actual | $1,000.00 | $1,010.37 | $1.74 | 0.35% |
| Hypothetical (5% return before expenses) | $1,000.00 | $1,023.06 | $1.76 | 0.35% |
| Administrator Class | | | | |
| Actual | $1,000.00 | $1,008.35 | $3.09 | 0.62% |
| Hypothetical (5% return before expenses) | $1,000.00 | $1,021.72 | $3.11 | 0.62% |
| Institutional Class | | | | |
| Actual | $1,000.00 | $1,009.36 | $1.99 | 0.40% |
| Hypothetical (5% return before expenses) | $1,000.00 | $1,022.81 | $2.01 | 0.40% |
1 Expenses paid is equal to the annualized net expense ratio of each class multiplied by the average account value over the period, multiplied by the number of days in the most recent fiscal half-year divided by the number of days in the fiscal year (to reflect the one-half-year period).
8 | Wells Fargo Core Plus Bond Fund
Portfolio of investments—February 28, 2021 (unaudited)
| | | Interest
rate | Maturity
date | Principal | Value |
| Agency securities: 15.17% | | | | | | |
| FHLB | | 3.00% | 9-1-2034 | $ | 792,144 | $ 835,834 |
| FHLB | | 3.00 | 8-1-2050 | | 2,750,344 | 2,898,560 |
| FHLMC (12 Month LIBOR +1.33%) ± | | 2.01 | 1-1-2036 | | 9,532 | 9,911 |
| FHLMC | | 3.00 | 6-1-2050 | | 1,663,594 | 1,768,550 |
| FHLMC | | 3.00 | 7-1-2050 | | 3,137,646 | 3,335,592 |
| FHLMC | | 3.00 | 8-1-2050 | | 1,477,569 | 1,571,046 |
| FHLMC | | 3.50 | 12-1-2045 | | 1,612,644 | 1,736,573 |
| FHLMC | | 3.50 | 12-1-2045 | | 549,786 | 590,465 |
| FHLMC | | 4.00 | 6-1-2044 | | 1,250,748 | 1,373,522 |
| FHLMC | | 4.00 | 5-1-2049 | | 3,866,402 | 4,148,109 |
| FHLMC | | 5.00 | 6-1-2036 | | 149,332 | 173,693 |
| FHLMC | | 5.00 | 8-1-2040 | | 161,413 | 187,907 |
| FHLMC | | 5.50 | 8-1-2038 | | 34,665 | 40,564 |
| FHLMC | | 5.50 | 12-1-2038 | | 304,842 | 355,858 |
| FHLMC | | 5.50 | 6-1-2040 | | 465,206 | 535,654 |
| FHLMC | | 8.00 | 2-1-2030 | | 140 | 162 |
| FHLMC Series 2015-SC01 Class 1A | | 3.50 | 5-25-2045 | | 323,276 | 322,861 |
| FHLMC Series 4753 Class KB | | 3.50 | 6-15-2042 | | 320,962 | 322,018 |
| FHLMC Series K020 Class X1 ♀±± | | 1.34 | 5-25-2022 | | 12,177,572 | 159,035 |
| FHLMC Series T-42 Class A5 | | 7.50 | 2-25-2042 | | 1,178,257 | 1,446,316 |
| FHLMC Series T-57 Class 2A1 ±± | | 3.81 | 7-25-2043 | | 34,652 | 37,076 |
| FHLMC Series T-59 Class 2A1 ±± | | 3.58 | 10-25-2043 | | 173,859 | 213,260 |
| FNMA ¤ | | 0.00 | 8-6-2038 | | 16,140,000 | 10,380,410 |
| FNMA | | 2.00 | 3-11-2051 | | 50,295,000 | 50,803,844 |
| FNMA (12 Month LIBOR +1.73%) ± | | 2.23 | 9-1-2036 | | 10,035 | 10,595 |
| FNMA | | 2.50 | 7-25-2050 | | 83,540,000 | 86,607,484 |
| FNMA (12 Month LIBOR +1.78%) ± | | 2.52 | 8-1-2036 | | 19,132 | 20,238 |
| FNMA (12 Month LIBOR +1.61%) ± | | 2.52 | 3-1-2046 | | 873,836 | 907,275 |
| FNMA (12 Month LIBOR +1.61%) ± | | 2.53 | 5-1-2046 | | 637,666 | 662,686 |
| FNMA (1 Year Treasury Constant Maturity +2.25%) ± | | 2.67 | 11-1-2038 | | 22,526 | 24,043 |
| FNMA (1 Year Treasury Constant Maturity +2.26%) ± | | 2.75 | 8-1-2036 | | 439,361 | 467,625 |
| FNMA | | 3.00 | 11-1-2045 | | 1,031,331 | 1,090,560 |
| FNMA | | 3.00 | 12-1-2045 | | 2,656,860 | 2,809,659 |
| FNMA | | 3.00 | 12-1-2046 | | 1,316,280 | 1,395,696 |
| FNMA | | 3.00 | 8-1-2050 | | 3,063,436 | 3,231,855 |
| FNMA | | 3.02 | 2-1-2026 | | 3,076,590 | 3,351,109 |
| FNMA | | 3.27 | 7-1-2022 | | 1,146,664 | 1,176,042 |
| FNMA | | 3.48 | 3-1-2029 | | 972,095 | 1,105,037 |
| FNMA | | 3.50 | 10-1-2043 | | 840,943 | 915,803 |
| FNMA | | 3.50 | 4-1-2045 | | 141,934 | 153,089 |
| FNMA | | 3.50 | 8-1-2045 | | 2,722,175 | 2,924,055 |
| FNMA | | 3.50 | 3-1-2048 | | 5,750,561 | 6,121,846 |
| FNMA | | 3.62 | 3-1-2029 | | 443,000 | 507,361 |
| FNMA | | 3.63 | 3-1-2029 | | 1,233,249 | 1,415,320 |
| FNMA | | 3.77 | 3-1-2029 | | 975,060 | 1,128,878 |
| FNMA | | 3.77 | 3-1-2029 | | 1,061,283 | 1,228,086 |
| FNMA | | 3.95 | 9-1-2021 | | 383,102 | 384,128 |
| FNMA | | 4.00 | 2-1-2046 | | 279,366 | 305,767 |
| FNMA | | 4.00 | 4-1-2046 | | 1,572,942 | 1,726,627 |
| FNMA | | 4.00 | 6-1-2048 | | 2,238,409 | 2,413,941 |
| FNMA | | 4.00 | 2-1-2050 | | 3,698,176 | 3,977,899 |
| FNMA | | 4.50 | 11-1-2048 | | 2,486,010 | 2,733,153 |
| FNMA | | 5.00 | 1-1-2024 | | 20,804 | 21,804 |
| FNMA | | 5.00 | 2-1-2036 | | 16,397 | 19,064 |
The accompanying notes are an integral part of these financial statements.
Wells Fargo Core Plus Bond Fund | 9
Portfolio of investments—February 28, 2021 (unaudited)
| | | Interest
rate | Maturity
date | Principal | Value |
| Agency securities (continued) | | | | | | |
| FNMA | | 5.00% | 6-1-2040 | $ | 52,034 | $ 60,544 |
| FNMA | | 5.00 | 8-1-2040 | | 985,248 | 1,146,577 |
| FNMA | | 5.50 | 11-1-2023 | | 16,336 | 17,088 |
| FNMA | | 5.50 | 8-1-2034 | | 61,021 | 71,176 |
| FNMA | | 5.50 | 2-1-2035 | | 18,729 | 21,869 |
| FNMA | | 5.50 | 8-1-2038 | | 94,804 | 105,605 |
| FNMA | | 5.50 | 8-1-2038 | | 174,477 | 194,495 |
| FNMA | | 6.00 | 10-1-2037 | | 347,586 | 416,085 |
| FNMA | | 6.00 | 11-1-2037 | | 21,135 | 25,410 |
| FNMA | | 6.25 | 5-15-2029 | | 5,910,000 | 8,156,229 |
| FNMA | | 6.50 | 7-1-2036 | | 15,959 | 18,559 |
| FNMA | | 6.50 | 7-1-2036 | | 6,239 | 7,360 |
| FNMA | | 6.50 | 11-1-2036 | | 2,284 | 2,565 |
| FNMA | | 6.63 | 11-15-2030 | | 5,015,000 | 7,329,467 |
| FNMA | | 7.00 | 12-1-2022 | | 10,276 | 10,346 |
| FNMA | | 7.00 | 7-1-2036 | | 5,472 | 5,762 |
| FNMA | | 7.00 | 11-1-2037 | | 3,101 | 3,553 |
| FNMA | | 7.50 | 5-1-2038 | | 1,836 | 1,861 |
| FNMA Series 2002-T12 Class A3 | | 7.50 | 5-25-2042 | | 5,068 | 6,111 |
| FNMA Series 2003-W08 Class 4A ±± | | 3.80 | 11-25-2042 | | 96,075 | 102,834 |
| FNMA Series 2003-W14 Class 2A ±± | | 3.07 | 6-25-2045 | | 62,816 | 66,930 |
| FNMA Series 2003-W14 Class 2A ±± | | 3.99 | 1-25-2043 | | 166,409 | 174,625 |
| FNMA Series 2004-W11 Class 1A3 | | 7.00 | 5-25-2044 | | 873,825 | 1,000,494 |
| FNMA Series 2004-W15 Class 1A3 | | 7.00 | 8-25-2044 | | 409,599 | 492,246 |
| GNMA | | 3.00 | 11-20-2045 | | 2,236,977 | 2,365,655 |
| GNMA | | 3.00 | 10-20-2050 | | 8,212,166 | 8,631,114 |
| GNMA | | 3.50 | 9-20-2047 | | 1,554,807 | 1,655,174 |
| GNMA | | 3.50 | 12-20-2047 | | 3,346,725 | 3,576,106 |
| GNMA | | 4.00 | 12-20-2047 | | 1,877,792 | 2,032,474 |
| GNMA | | 4.50 | 8-20-2049 | | 777,341 | 840,500 |
| GNMA | | 5.00 | 7-20-2040 | | 351,679 | 403,941 |
| GNMA | | 7.50 | 12-15-2029 | | 406 | 432 |
| GNMA Series 2008-22 Class XM ♀±± | | 1.15 | 2-16-2050 | | 747,482 | 19,200 |
| International Development Finance Corporation | | 2.12 | 3-20-2024 | | 4,635,000 | 4,768,974 |
| STRIPS ¤ | | 0.00 | 11-15-2027 | | 1,795,000 | 1,657,895 |
| STRIPS ¤ | | 0.00 | 5-15-2044 | | 9,270,000 | 5,544,661 |
| TVA | | 5.88 | 4-1-2036 | | 9,420,000 | 13,948,903 |
| TVA Principal STRIPS ¤ | | 0.00 | 4-1-2056 | | 33,500,000 | 12,247,832 |
| Total Agency securities (Cost $288,049,711) | | | | | | 289,214,197 |
| Asset-backed securities: 8.12% | | | | | | |
| Ally Auto Receivables Trust Series 2019-1 Class A3 | | 2.91 | 9-15-2023 | | 3,541,526 | 3,597,277 |
| American Credit Acceptance Receivables Trust Series 2019-4 Class D 144A | | 2.97 | 12-12-2025 | | 6,000,000 | 6,218,021 |
| Arbys Funding LLC Series 2020-1A Class A2 144A | | 3.24 | 7-30-2050 | | 6,666,500 | 6,787,097 |
| ECMC Group Student Loan Trust Series 2020-3A Class A1B (1 Month LIBOR+1.00%) 144A± | | 1.12 | 1-27-2070 | | 4,837,864 | 4,892,521 |
| Educational Services of America Series 2015-1 Class A (1 Month LIBOR+0.80%) 144A± | | 0.92 | 10-25-2056 | | 751,029 | 748,978 |
| Exeter Automobile Receivables Trust Series 2018-1A Class C1 144A | | 3.03 | 1-17-2023 | | 269,983 | 270,419 |
| Finance of America HECM Buyout 2020 Series HB2 Class A7 144A±± | | 1.71 | 7-25-2030 | | 5,678,373 | 5,716,380 |
| Five Guys Funding LLC Series 17-1A Class A2 144A | | 4.60 | 7-25-2047 | | 1,597,925 | 1,667,467 |
The accompanying notes are an integral part of these financial statements.
10 | Wells Fargo Core Plus Bond Fund
Portfolio of investments—February 28, 2021 (unaudited)
| | | Interest
rate | Maturity
date | Principal | Value |
| Asset-backed securities (continued) | | | | | | |
| Flagship Credit Auto Trust Series 2019-4 Class A 144A | | 2.17% | 6-17-2024 | $ | 2,464,658 | $ 2,495,645 |
| Freedom Financial Trust Series 2021-1CP Class B 144A | | 1.41 | 3-20-2028 | | 2,500,000 | 2,494,464 |
| Gracie Point International Series 2020-B Class A (1 Month LIBOR+1.40%) 144A± | | 1.52 | 5-2-2023 | | 5,859,771 | 5,869,495 |
| Hertz Vehicle Financing LLC Series 2015-3A Class A 144A | | 2.67 | 9-25-2021 | | 337,767 | 338,687 |
| Hertz Vehicle Financing LLC Series 2016-2A Class A 144A | | 2.95 | 3-25-2022 | | 1,129,539 | 1,135,512 |
| Hertz Vehicle Financing LLC Series 2017-2A Class A 144A | | 3.29 | 10-25-2023 | | 457,613 | 460,073 |
| Hertz Vehicle Financing LLC Series 2018-1A Class A 144A | | 3.29 | 2-25-2024 | | 495,950 | 498,587 |
| Hertz Vehicle Financing LLC Series 2018-1A Class B 144A | | 3.60 | 2-25-2024 | | 9,100,000 | 9,135,231 |
| Hertz Vehicle Financing LLC Series 2018-2A Class A 144A | | 3.65 | 6-27-2022 | | 329,023 | 330,761 |
| Hertz Vehicle Financing LLC Series 2019-1A Class A 144A | | 3.71 | 3-25-2023 | | 605,352 | 607,785 |
| Lendmark Funding Trust Series 2018-1A Class A 144A | | 3.81 | 12-21-2026 | | 2,685,000 | 2,704,495 |
| Lendmark Funding Trust Series 2018-2A Class A 144A | | 4.23 | 4-20-2027 | | 600,000 | 613,792 |
| MMAF Equipment Finance LLC Series 2017-AA Class A4 | | 2.41 | 8-16-2024 | | 1,149,359 | 1,160,431 |
| MMAF Equipment Finance LLC Series 2019-A Class A2 144A | | 2.84 | 1-10-2022 | | 151,984 | 152,204 |
| Neighborly Issuer LLC 144A%% | | 3.58 | 4-30-2051 | | 8,000,000 | 8,000,000 |
| Oak Street Investment Grade Net Lease Fund Series 2021-1A Class A3 144A | | 2.80 | 1-20-2051 | | 4,250,000 | 4,318,109 |
| Octane Receivables Trust Series 2020-1A Class A 144A | | 1.71 | 2-20-2025 | | 6,769,342 | 6,834,203 |
| Ocwen Master Advance Receivables Trust Series 2020-T1 Class CT1 144A | | 2.32 | 8-15-2052 | | 1,400,000 | 1,409,784 |
| Oscar US Funding Trust Series 2016-2A Class A4 144A | | 2.99 | 12-15-2023 | | 1,090,098 | 1,092,621 |
| PFS Financing Corporation Series 2021-A Class A 144A | | 0.71 | 4-15-2026 | | 7,290,000 | 7,274,753 |
| Santander Drive Auto Receivables Trust Series 2021-1 Class C | | 0.75 | 2-17-2026 | | 10,200,000 | 10,198,800 |
| ServiceMaster Brands Series 2020-1 Class A2I 144A | | 2.84 | 1-30-2051 | | 3,700,000 | 3,728,490 |
| SLM Student Loan Trust Series 2004-1 Class A4 (3 Month LIBOR+0.26%) ± | | 0.48 | 10-27-2025 | | 774,079 | 770,676 |
| South Carolina Student Loan Corporation Series 2014-1 Class A1 (1 Month LIBOR+0.75%) ± | | 0.87 | 5-1-2030 | | 1,841,518 | 1,841,775 |
| SpringCastle America Funding LLC 144A | | 1.97 | 9-25-2037 | | 5,613,629 | 5,675,347 |
| Student Loan Consolidation Center Series 2011-1 Class A (1 Month LIBOR+1.22%) 144A± | | 1.34 | 10-25-2027 | | 601,400 | 605,026 |
| Towd Point Asset Trust Series 2018-SL1 Class A (1 Month LIBOR+0.60%) 144A± | | 0.72 | 1-25-2046 | | 1,710,823 | 1,699,695 |
| Towd Point Mortgage Trust Series 2015-1 Class A3 144A±± | | 3.25 | 10-25-2053 | | 5,500,000 | 5,630,738 |
| Towd Point Mortgage Trust Series 2015-2 Class 1M2 144A±± | | 3.52 | 11-25-2060 | | 4,530,000 | 4,775,962 |
The accompanying notes are an integral part of these financial statements.
Wells Fargo Core Plus Bond Fund | 11
Portfolio of investments—February 28, 2021 (unaudited)
| | | Interest
rate | Maturity
date | Principal | Value |
| Asset-backed securities (continued) | | | | | | |
| Towd Point Mortgage Trust Series 2015-4 Class A2 144A±± | | 3.75% | 4-25-2055 | $ | 2,675,000 | $ 2,723,294 |
| Towd Point Mortgage Trust Series 2017-4 Class A1 144A±± | | 2.75 | 6-25-2057 | | 1,768,168 | 1,826,182 |
| Towd Point Mortgage Trust Series 2019- MH1 Class A1 144A±± | | 3.00 | 11-25-2058 | | 1,363,595 | 1,397,444 |
| Towd Point Mortgage Trust Series 2019-4 Class M1 144A±± | | 3.50 | 10-25-2059 | | 4,000,000 | 4,202,582 |
| Towd Point Mortgage Trust Series 2019-SJ3 Class A1 144A±± | | 3.00 | 11-25-2059 | | 2,713,000 | 2,737,915 |
| Toyota Auto Receivables Owner Trust Series 2017-D Class A4 | | 2.12 | 2-15-2023 | | 8,088,000 | 8,151,584 |
| Volvo Financial Equipment LLC Series 2018-AA Class A (1 Month LIBOR+0.52%) 144A± | | 0.63 | 7-17-2023 | | 2,590,000 | 2,593,755 |
| Westlake Automobile Receivables Trust Series 2018-3A Class C 144A | | 3.61 | 10-16-2023 | | 5,015,867 | 5,053,903 |
| Westlake Automobile Receivables Trust Series 2019-2A Class A2A 144A | | 2.57 | 2-15-2023 | | 1,029,557 | 1,033,161 |
| Wheels SPV LLC Series 2018-1A Class A2 144A | | 3.06 | 4-20-2027 | | 45,928 | 46,049 |
| Wingstop Funding LLC Series 2020-1A Class A2 144A | | 0.01 | 12-5-2050 | | 3,350,000 | 3,383,768 |
| Total Asset-backed securities (Cost $153,798,398) | | | | | | 154,900,938 |
| | | | | Shares | |
| Common stocks: 0.14% | | | | | | |
| Energy: 0.14% | | | | | | |
| Oil, gas & consumable fuels: 0.14% | | | | | | |
| Denbury Incorporated † | | | | | 37,360 | 1,597,140 |
| Whiting Petroleum Corporation † | | | | | 29,806 | 1,022,346 |
| Total Common stocks (Cost $3,086,340) | | | | | | 2,619,486 |
| | | | | Principal | |
| Corporate bonds and notes: 25.13% | | | | | | |
| Communication services: 2.54% | | | | | | |
| Diversified telecommunication services: 0.41% | | | | | | |
| AT&T Incorporated 144A | | 3.55 | 9-15-2055 | $ | 2,330,000 | 2,139,268 |
| Cablevision Lightpath LLC 144A | | 5.63 | 9-15-2028 | | 1,615,000 | 1,641,244 |
| Frontier Communications 144A | | 5.88 | 10-15-2027 | | 145,000 | 155,150 |
| T-Mobile USA Incorporated 144A | | 3.30 | 2-15-2051 | | 4,225,000 | 3,913,575 |
| | | | | | | 7,849,237 |
| Media: 1.63% | | | | | | |
| CCO Holdings LLC 144A | | 4.50 | 8-15-2030 | | 1,500,000 | 1,553,250 |
| Charter Communications Operating LLC | | 6.48 | 10-23-2045 | | 655,000 | 878,017 |
| Cinemark USA Incorporated | | 4.88 | 6-1-2023 | | 2,000,000 | 1,979,420 |
| Cinemark USA Incorporated | | 5.13 | 12-15-2022 | | 2,000,000 | 1,982,500 |
| Comcast Corporation | | 4.70 | 10-15-2048 | | 1,800,000 | 2,283,553 |
| CSC Holdings LLC 144A | | 5.75 | 1-15-2030 | | 2,000,000 | 2,134,400 |
| Diamond Sports Group LLC 144A | | 5.38 | 8-15-2026 | | 2,000,000 | 1,414,400 |
| Diamond Sports Group LLC 144A« | | 6.63 | 8-15-2027 | | 2,040,000 | 1,050,600 |
| Discovery Communications LLC 144A | | 4.00 | 9-15-2055 | | 2,137,000 | 2,188,787 |
| Gray Television Incorporated 144A | | 4.75 | 10-15-2030 | | 2,000,000 | 2,000,000 |
The accompanying notes are an integral part of these financial statements.
12 | Wells Fargo Core Plus Bond Fund
Portfolio of investments—February 28, 2021 (unaudited)
| | | Interest
rate | Maturity
date | Principal | Value |
| Media (continued) | | | | | | |
| Interpublic Group of Companies Incorporated | | 2.40% | 3-1-2031 | $ | 4,945,000 | $ 4,950,430 |
| Nexstar Broadcasting Incorporated 144A | | 4.75 | 11-1-2028 | | 700,000 | 714,875 |
| Nielsen Finance LLC 144A | | 5.88 | 10-1-2030 | | 2,000,000 | 2,162,500 |
| Scripps Escrow II Incorporated 144A | | 3.88 | 1-15-2029 | | 145,000 | 142,408 |
| Scripps Escrow II Incorporated 144A | | 5.38 | 1-15-2031 | | 2,575,000 | 2,610,406 |
| Townsquare Media Incorporated 144A | | 6.88 | 2-1-2026 | | 3,000,000 | 3,137,535 |
| | | | | | | 31,183,081 |
| Wireless telecommunication services: 0.50% | | | | | | |
| Crown Castle Towers LLC 144A | | 3.22 | 5-15-2042 | | 2,600,000 | 2,617,826 |
| SBA Tower Trust 144A | | 3.72 | 4-9-2048 | | 1,968,000 | 2,006,027 |
| Sprint Spectrum Company 144A | | 4.74 | 9-20-2029 | | 3,930,000 | 4,235,558 |
| Sprint Spectrum Company 144A | | 5.15 | 9-20-2029 | | 530,000 | 614,996 |
| | | | | | | 9,474,407 |
| Consumer discretionary: 2.19% | | | | | | |
| Automobiles: 0.37% | | | | | | |
| Ford Motor Company | | 9.00 | 4-22-2025 | | 4,720,000 | 5,710,138 |
| General Motors Company | | 5.95 | 4-1-2049 | | 985,000 | 1,286,428 |
| | | | | | | 6,996,566 |
| Hotels, restaurants & leisure: 0.87% | | | | | | |
| Carnival Corporation 144A | | 5.75 | 3-1-2027 | | 330,000 | 335,000 |
| Carnival Corporation 144A | | 7.63 | 3-1-2026 | | 950,000 | 998,688 |
| Carnival Corporation 144A | | 11.50 | 4-1-2023 | | 1,000,000 | 1,140,200 |
| Darden Restaurants Incorporated | | 3.85 | 5-1-2027 | | 2,005,000 | 2,182,010 |
| Genting New York LLC 144A | | 3.30 | 2-15-2026 | | 3,920,000 | 3,931,277 |
| Las Vegas Sands Corporation | | 3.90 | 8-8-2029 | | 3,000,000 | 3,197,786 |
| NCL Corporation Limited 144A | | 5.88 | 3-15-2026 | | 135,000 | 135,648 |
| NCL Corporation Limited 144A | | 12.25 | 5-15-2024 | | 2,500,000 | 2,971,875 |
| Royal Caribbean Cruises | | 4.25 | 6-15-2023 | | 1,150,000 | 1,745,334 |
| | | | | | | 16,637,818 |
| Household durables: 0.11% | | | | | | |
| KB Home Company | | 4.80 | 11-15-2029 | | 2,000,000 | 2,150,000 |
| Leisure products: 0.22% | | | | | | |
| Hasbro Incorporated | | 3.50 | 9-15-2027 | | 3,746,000 | 4,074,056 |
| Multiline retail: 0.15% | | | | | | |
| Kohl's Corporation | | 9.50 | 5-15-2025 | | 765,000 | 987,983 |
| Nordstrom Incorporated | | 5.00 | 1-15-2044 | | 1,920,000 | 1,843,719 |
| | | | | | | 2,831,702 |
| Specialty retail: 0.33% | | | | | | |
| Macy's Retail Holdings Incorporated | | 3.88 | 1-15-2022 | | 3,940,000 | 3,958,912 |
| Michaels Stores Incorporated 144A | | 8.00 | 7-15-2027 | | 2,000,000 | 2,135,000 |
| Michaels Stores Incorporated 144A | | 4.75 | 10-1-2027 | | 50,000 | 51,125 |
| Rent-A-Center Incorporated 144A | | 6.38 | 2-15-2029 | | 135,000 | 140,415 |
| | | | | | | 6,285,452 |
The accompanying notes are an integral part of these financial statements.
Wells Fargo Core Plus Bond Fund | 13
Portfolio of investments—February 28, 2021 (unaudited)
| | | Interest
rate | Maturity
date | Principal | Value |
| Textiles, apparel & luxury goods: 0.14% | | | | | | |
| Tapestry Incorporated | | 4.25% | 4-1-2025 | $ | 1,000,000 | $ 1,085,584 |
| Tapestry Incorporated | | 4.13 | 7-15-2027 | | 1,500,000 | 1,646,919 |
| | | | | | | 2,732,503 |
| Consumer staples: 1.09% | | | | | | |
| Beverages: 0.11% | | | | | | |
| Anheuser-Busch InBev Worldwide Incorporated | | 4.60 | 4-15-2048 | | 1,810,000 | 2,099,922 |
| Food & staples retailing: 0.40% | | | | | | |
| 7 Eleven Incorporated 144A | | 0.80 | 2-10-2024 | | 5,245,000 | 5,249,422 |
| PetSmart Incorporated 144A | | 4.75 | 2-15-2028 | | 145,000 | 149,953 |
| PetSmart Incorporated 144A | | 7.75 | 2-15-2029 | | 145,000 | 155,513 |
| Walgreens Boots Alliance ☼ | | 4.10 | 4-15-2050 | | 1,925,000 | 2,024,475 |
| | | | | | | 7,579,363 |
| Food products: 0.42% | | | | | | |
| CHS Incorporated 144A | | 6.00 | 1-15-2029 | | 3,000,000 | 3,180,000 |
| CHS Incorporated 144A | | 6.88 | 4-15-2029 | | 3,000,000 | 3,079,350 |
| Kraft Heinz Foods Company | | 4.88 | 10-1-2049 | | 1,430,000 | 1,674,154 |
| | | | | | | 7,933,504 |
| Tobacco: 0.16% | | | | | | |
| Altria Group Incorporated | | 1.70 | 6-15-2025 | | 2,000,000 | 2,541,642 |
| Reynolds American Incorporated | | 7.00 | 8-4-2041 | | 450,000 | 597,040 |
| | | | | | | 3,138,682 |
| Energy: 4.51% | | | | | | |
| Energy equipment & services: 0.49% | | | | | | |
| Alexander Funding Trust 144A | | 1.84 | 11-15-2023 | | 2,805,000 | 2,851,383 |
| Bristow Group Incorporated 144A | | 6.88 | 3-1-2028 | | 3,000,000 | 3,026,250 |
| Hilcorp Energy Company 144A | | 5.75 | 2-1-2029 | | 225,000 | 229,219 |
| Hilcorp Energy Company 144A | | 6.00 | 2-1-2031 | | 225,000 | 228,663 |
| Hilcorp Energy Company 144A | | 6.25 | 11-1-2028 | | 1,900,000 | 1,983,125 |
| USA Compression Partners LP | | 6.88 | 4-1-2026 | | 1,000,000 | 1,032,500 |
| USA Compression Partners LP | | 6.88 | 9-1-2027 | | 75,000 | 78,750 |
| | | | | | | 9,429,890 |
| Oil, gas & consumable fuels: 4.02% | | | | | | |
| Aethon United 144A | | 8.25 | 2-15-2026 | | 3,000,000 | 3,120,000 |
| Antero Resources Corporation « | | 5.00 | 3-1-2025 | | 1,110,000 | 1,103,895 |
| Antero Resources Corporation 144A | | 8.38 | 7-15-2026 | | 150,000 | 164,063 |
| Apache Corporation | | 5.35 | 7-1-2049 | | 2,250,000 | 2,238,750 |
| Archrock Partners LP 144A | | 6.88 | 4-1-2027 | | 1,300,000 | 1,371,786 |
| Buckeye Partners LP | | 4.13 | 12-1-2027 | | 1,300,000 | 1,305,278 |
| Crestwood Midstream Partners LP 144A | | 5.63 | 5-1-2027 | | 2,300,000 | 2,279,875 |
| DCP Midstream Operating Company | | 5.13 | 5-15-2029 | | 4,000,000 | 4,238,880 |
| EnCana Corporation | | 6.50 | 2-1-2038 | | 836,000 | 1,023,440 |
| Energy Transfer Operating Partners LP | | 6.13 | 12-15-2045 | | 1,330,000 | 1,539,538 |
| EnLink Midstream Partners LP | | 4.15 | 6-1-2025 | | 1,000,000 | 992,500 |
| EnLink Midstream Partners LP | | 5.45 | 6-1-2047 | | 1,100,000 | 910,250 |
| EnLink Midstream Partners LP 144A | | 5.63 | 1-15-2028 | | 145,000 | 146,269 |
| EQT Corporation | | 1.75 | 5-1-2026 | | 1,750,000 | 2,566,537 |
The accompanying notes are an integral part of these financial statements.
14 | Wells Fargo Core Plus Bond Fund
Portfolio of investments—February 28, 2021 (unaudited)
| | | Interest
rate | Maturity
date | Principal | Value |
| Oil, gas & consumable fuels (continued) | | | | | | |
| EQT Corporation | | 3.90% | 10-1-2027 | $ | 2,270,000 | $ 2,354,467 |
| Harvest Midstream LP 144A | | 7.50 | 9-1-2028 | | 2,275,000 | 2,415,766 |
| Indigo Natural Resources LLC 144A | | 5.38 | 2-1-2029 | | 235,000 | 233,825 |
| Marathon Petroleum Corporation | | 4.50 | 4-1-2048 | | 3,295,000 | 3,583,955 |
| Murphy Oil Corporation | | 5.88 | 12-1-2027 | | 2,050,000 | 2,019,250 |
| Nabors Industries Limited « | | 9.00 | 2-1-2025 | | 198,000 | 203,940 |
| Occidental Petroleum Corporation | | 8.88 | 7-15-2030 | | 4,100,000 | 5,240,333 |
| ONEOK Incorporated | | 7.15 | 1-15-2051 | | 2,070,000 | 2,800,694 |
| Phillips 66 Partners LP | | 3.75 | 3-1-2028 | | 5,220,000 | 5,604,787 |
| Plains All American Pipeline LP | | 3.55 | 12-15-2029 | | 1,680,000 | 1,724,840 |
| Plains All American Pipeline LP | | 3.80 | 9-15-2030 | | 3,215,000 | 3,339,138 |
| Plains All American Pipeline LP | | 3.85 | 10-15-2023 | | 3,400,000 | 3,618,266 |
| Range Resources Corporation 144A | | 8.25 | 1-15-2029 | | 150,000 | 161,205 |
| Range Resources Corporation | | 9.25 | 2-1-2026 | | 3,550,000 | 3,863,146 |
| Rockies Express Pipeline LLC 144A | | 4.95 | 7-15-2029 | | 1,975,000 | 2,110,781 |
| Sabine Pass Liquefaction LLC | | 4.50 | 5-15-2030 | | 1,235,000 | 1,412,572 |
| Southwestern Energy Company | | 7.75 | 10-1-2027 | | 1,250,000 | 1,337,500 |
| Tallgrass Energy Partners LP 144A | | 6.00 | 12-31-2030 | | 1,400,000 | 1,392,440 |
| Tallgrass Energy Partners LP 144A | | 7.50 | 10-1-2025 | | 2,445,000 | 2,607,104 |
| Western Midstream Operating LP | | 6.50 | 2-1-2050 | | 225,000 | 258,910 |
| WPX Energy Incorporated | | 5.25 | 10-15-2027 | | 6,895,000 | 7,362,619 |
| | | | | | | 76,646,599 |
| Financials: 5.88% | | | | | | |
| Banks: 1.60% | | | | | | |
| Bank of America Corporation (U.S. SOFR+1.37%) ± | | 1.92 | 10-24-2031 | | 4,000,000 | 3,882,988 |
| Bank of America Corporation (3 Month LIBOR+0.64%) ± | | 2.02 | 2-13-2026 | | 5,000,000 | 5,169,707 |
| Bank of America Corporation (U.S. SOFR+1.93%) ± | | 2.68 | 6-19-2041 | | 1,610,000 | 1,560,853 |
| Bank of America Corporation (3 Month LIBOR+3.90%) ʊ± | | 6.10 | 12-29-2049 | | 2,590,000 | 2,877,749 |
| Citigroup Incorporated (5 Year Treasury Constant Maturity+3.60%) ʊ± | | 4.00 | 12-10-2025 | | 5,000,000 | 5,049,900 |
| Citigroup Incorporated (3 Month LIBOR+4.52%) ± | | 6.25 | 12-29-2049 | | 1,030,000 | 1,174,509 |
| JPMorgan Chase & Company (U.S. SOFR+0.70%) ± | | 1.04 | 2-4-2027 | | 3,165,000 | 3,121,390 |
| JPMorgan Chase & Company (3 Month LIBOR+3.25%) ± | | 5.15 | 12-29-2049 | | 3,625,000 | 3,695,204 |
| PNC Financial Services (3 Month LIBOR+3.30%) ± | | 5.00 | 12-29-2049 | | 565,000 | 618,325 |
| Santander Holdings USA Incorporated | | 3.24 | 10-5-2026 | | 1,125,000 | 1,204,989 |
| Truist Financial Corporation (5 Year Treasury Constant Maturity+4.61%) ʊ± | | 4.95 | 9-2-2025 | | 2,015,000 | 2,166,730 |
| | | | | | | 30,522,344 |
| Capital markets: 0.75% | | | | | | |
| Bank of New York Mellon Corporation (5 Year Treasury Constant Maturity+4.36%) ʊ± | | 4.70 | 9-22-2025 | | 3,100,000 | 3,344,900 |
| Blackstone Holdings Finance Company LLC 144A | | 5.00 | 6-15-2044 | | 1,015,000 | 1,319,013 |
| Charles Schwab Corporation (5 Year Treasury Constant Maturity+4.97%) ʊ± | | 5.38 | 6-2-2025 | | 3,905,000 | 4,256,450 |
| Goldman Sachs Group Incorporated (3 Month LIBOR+0.82%) ± | | 2.88 | 10-31-2022 | | 1,910,000 | 1,940,901 |
| Morgan Stanley (U.S. SOFR+1.43%) ± | | 2.80 | 1-25-2052 | | 3,585,000 | 3,413,017 |
| | | | | | | 14,274,281 |
The accompanying notes are an integral part of these financial statements.
Wells Fargo Core Plus Bond Fund | 15
Portfolio of investments—February 28, 2021 (unaudited)
| | | Interest
rate | Maturity
date | Principal | Value |
| Consumer finance: 1.13% | | | | | | |
| ERAC USA Finance LLC 144A | | 4.50% | 2-15-2045 | $ | 1,695,000 | $ 2,047,040 |
| Ford Motor Credit Company LLC | | 4.00 | 11-13-2030 | | 1,000,000 | 1,022,500 |
| General Motors Financial Company Incorporated | | 2.70 | 8-20-2027 | | 6,210,000 | 6,448,763 |
| Hyundai Capital America 144A | | 2.65 | 2-10-2025 | | 5,810,000 | 6,055,681 |
| Hyundai Capital America Company 144A | | 1.30 | 1-8-2026 | | 4,205,000 | 4,160,324 |
| Springleaf Finance Corporation | | 7.13 | 3-15-2026 | | 1,500,000 | 1,732,500 |
| | | | | | | 21,466,808 |
| Diversified financial services: 0.36% | | | | | | |
| Aviation Capital Group Corporation 144A | | 5.50 | 12-15-2024 | | 1,785,000 | 2,011,140 |
| KKR Group Finance Company LLC 144A | | 5.13 | 6-1-2044 | | 1,960,000 | 2,456,435 |
| WEA Finance LLC 144A | | 2.88 | 1-15-2027 | | 2,390,000 | 2,426,262 |
| | | | | | | 6,893,837 |
| Insurance: 1.72% | | | | | | |
| Athene Global Funding 144A | | 2.55 | 11-19-2030 | | 3,000,000 | 2,951,305 |
| Athene Global Funding 144A | | 2.95 | 11-12-2026 | | 3,550,000 | 3,777,584 |
| Axis Specialty Finance LLC (5 Year Treasury Constant Maturity+3.19%) ± | | 4.90 | 1-15-2040 | | 5,105,000 | 5,245,238 |
| Brighthouse Financial Incorporated | | 4.70 | 6-22-2047 | | 820,000 | 866,457 |
| Guardian Life Insurance Company 144A | | 3.70 | 1-22-2070 | | 1,500,000 | 1,547,859 |
| Guardian Life Insurance Company 144A | | 4.85 | 1-24-2077 | | 1,045,000 | 1,309,067 |
| Metlife Incorporated (5 Year Treasury Constant Maturity+3.58%) ʊ± | | 3.85 | 9-15-2025 | | 7,000,000 | 7,157,500 |
| National Life Global Insurance Company (3 Month LIBOR+3.31%) 144A± | | 5.25 | 7-19-2068 | | 1,668,000 | 1,702,176 |
| New York Life Insurance Company 144A | | 3.75 | 5-15-2050 | | 1,670,000 | 1,856,181 |
| OneAmerica Financial Partners Incorporated 144A | | 4.25 | 10-15-2050 | | 1,635,000 | 1,654,047 |
| PartnerRe Finance II Incorporated (3 Month LIBOR+2.33%) ± | | 2.52 | 12-1-2066 | | 1,345,000 | 1,184,467 |
| Transatlantic Holdings Incorporated | | 8.00 | 11-30-2039 | | 2,329,000 | 3,567,555 |
| | | | | | | 32,819,436 |
| Mortgage REITs: 0.16% | | | | | | |
| Blackstone Mortgage Trust | | 4.38 | 5-5-2022 | | 3,000,000 | 3,046,689 |
| Thrifts & mortgage finance: 0.16% | | | | | | |
| Ladder Capital Finance Holdings LP 144A | | 4.25 | 2-1-2027 | | 525,000 | 506,625 |
| Ladder Capital Finance Holdings LP 144A | | 5.25 | 10-1-2025 | | 2,500,000 | 2,484,375 |
| | | | | | | 2,991,000 |
| Health care: 0.64% | | | | | | |
| Health care providers & services: 0.53% | | | | | | |
| AdaptHealth LLC 144A | | 4.63 | 8-1-2029 | | 195,000 | 195,310 |
| CommonSpirit Health | | 2.95 | 11-1-2022 | | 1,250,000 | 1,300,475 |
| CommonSpirit Health | | 3.82 | 10-1-2049 | | 1,810,000 | 1,971,261 |
| Dignity Health | | 3.81 | 11-1-2024 | | 2,000,000 | 2,179,854 |
| Fresenius Medical Care US Finance III 144A | | 2.38 | 2-16-2031 | | 2,000,000 | 1,947,722 |
| Highmark Incorporated 144A | | 6.13 | 5-15-2041 | | 710,000 | 857,717 |
| Magellan Health Incorporated | | 4.90 | 9-22-2024 | | 1,585,000 | 1,735,575 |
| | | | | | | 10,187,914 |
The accompanying notes are an integral part of these financial statements.
16 | Wells Fargo Core Plus Bond Fund
Portfolio of investments—February 28, 2021 (unaudited)
| | | Interest
rate | Maturity
date | Principal | Value |
| Pharmaceuticals: 0.11% | | | | | | |
| Bausch Health Companies Incorporated 144A | | 5.00% | 1-30-2028 | $ | 2,000,000 | $ 2,040,000 |
| Industrials: 3.24% | | | | | | |
| Aerospace & defense: 0.65% | | | | | | |
| Spirit AeroSystems Holdings Incorporated | | 4.60 | 6-15-2028 | | 1,010,000 | 976,306 |
| The Boeing Company | | 2.20 | 2-4-2026 | | 8,170,000 | 8,187,016 |
| The Boeing Company | | 5.81 | 5-1-2050 | | 2,490,000 | 3,211,977 |
| | | | | | | 12,375,299 |
| Airlines: 1.47% | | | | | | |
| Alaska Airlines 144A | | 4.80 | 2-15-2029 | | 2,742,483 | 3,029,078 |
| Delta Air Lines Incorporated | | 2.00 | 12-10-2029 | | 3,613,634 | 3,655,180 |
| Delta Air Lines Incorporated | | 3.75 | 10-28-2029 | | 1,105,000 | 1,102,149 |
| Delta Air Lines Incorporated 144A | | 4.75 | 10-20-2028 | | 1,850,000 | 2,054,305 |
| Delta Air Lines Incorporated | | 7.38 | 1-15-2026 | | 3,000,000 | 3,513,645 |
| Delta Airlines Pass-Through Certificates Series 2015-B | | 4.25 | 1-30-2025 | | 1,960,927 | 2,007,957 |
| Hawaiian Brand Intellectual Property Limited 144A | | 5.75 | 1-20-2026 | | 2,000,000 | 2,097,880 |
| Jetblue Airways Corporation | | 4.00 | 5-15-2034 | | 2,000,000 | 2,195,941 |
| Mileage Plus Holdings LLC 144A | | 6.50 | 6-20-2027 | | 7,625,000 | 8,330,313 |
| | | | | | | 27,986,448 |
| Construction & engineering: 0.00% | | | | | | |
| Pike Corporation 144A | | 5.50 | 9-1-2028 | | 115,000 | 119,600 |
| Electrical equipment: 0.01% | | | | | | |
| Sensata Technologies Incorporated 144A | | 3.75 | 2-15-2031 | | 180,000 | 180,675 |
| Industrial conglomerates: 0.13% | | | | | | |
| General Electric Company (3 Month LIBOR+3.33%) ± | | 3.52 | 12-29-2049 | | 2,537,000 | 2,418,268 |
| Trading companies & distributors: 0.65% | | | | | | |
| Air Lease Corporation | | 3.38 | 7-1-2025 | | 9,000,000 | 9,567,580 |
| Fortress Transportation & Infrastructure Investors LLC 144A | | 6.50 | 10-1-2025 | | 1,500,000 | 1,560,608 |
| Fortress Transportation & Infrastructure Investors LLC 144A | | 9.75 | 8-1-2027 | | 1,110,000 | 1,266,177 |
| | | | | | | 12,394,365 |
| Transportation infrastructure: 0.33% | | | | | | |
| Toll Road Investors Partnership II LP 144A¤ | | 0.00 | 2-15-2027 | | 1,050,000 | 830,239 |
| Toll Road Investors Partnership II LP 144A¤ | | 0.00 | 2-15-2028 | | 1,150,000 | 856,173 |
| Toll Road Investors Partnership II LP 144A¤ | | 0.01 | 2-15-2026 | | 5,630,000 | 4,686,677 |
| | | | | | | 6,373,089 |
| Information technology: 1.88% | | | | | | |
| Communications equipment: 0.15% | | | | | | |
| CommScope Incorporated 144A | | 8.25 | 3-1-2027 | | 895,000 | 943,097 |
| CommScope Technologies LLC 144A | | 5.00 | 3-15-2027 | | 2,000,000 | 1,959,160 |
| | | | | | | 2,902,257 |
The accompanying notes are an integral part of these financial statements.
Wells Fargo Core Plus Bond Fund | 17
Portfolio of investments—February 28, 2021 (unaudited)
| | | Interest
rate | Maturity
date | Principal | Value |
| Electronic equipment, instruments & components: 0.25% | | | | | | |
| Corning Incorporated | | 3.90% | 11-15-2049 | $ | 2,500,000 | $ 2,813,409 |
| Jabil Incorporated | | 3.00 | 1-15-2031 | | 1,875,000 | 1,915,700 |
| | | | | | | 4,729,109 |
| Semiconductors & semiconductor equipment: 0.48% | | | | | | |
| Microchip Technology Incorporated 144A | | 0.97 | 2-15-2024 | | 9,000,000 | 9,032,445 |
| Software: 0.70% | | | | | | |
| Logan Merger Sub Incorporated 144A | | 5.50 | 9-1-2027 | | 2,500,000 | 2,612,500 |
| MPH Acquisition Holdings Company 144A« | | 5.75 | 11-1-2028 | | 3,000,000 | 2,977,500 |
| ServiceNow Incorporated | | 1.40 | 9-1-2030 | | 8,400,000 | 7,810,836 |
| | | | | | | 13,400,836 |
| Technology hardware, storage & peripherals: 0.30% | | | | | | |
| Dell International LLC / EMC Corporation 144A | | 6.20 | 7-15-2030 | | 3,125,000 | 3,970,356 |
| Diamond 1 Finance Corporation 144A | | 8.35 | 7-15-2046 | | 1,175,000 | 1,797,762 |
| | | | | | | 5,768,118 |
| Materials: 0.10% | | | | | | |
| Containers & packaging: 0.06% | | | | | | |
| Flex Acquisition Company Incorporated 144A | | 6.88 | 1-15-2025 | | 1,000,000 | 1,013,010 |
| Metals & mining: 0.04% | | | | | | |
| Cleveland Cliffs Incorporated | | 5.88 | 6-1-2027 | | 800,000 | 816,768 |
| Real estate: 1.92% | | | | | | |
| Equity REITs: 1.92% | | | | | | |
| American Assets Trust LP | | 3.38 | 2-1-2031 | | 1,000,000 | 1,019,371 |
| American Campus Company | | 2.85 | 2-1-2030 | | 2,215,000 | 2,289,896 |
| Kimco Realty Corporation | | 1.90 | 3-1-2028 | | 1,835,000 | 1,834,395 |
| National Health Investor Company | | 3.00 | 2-1-2031 | | 2,000,000 | 1,941,733 |
| Omega Healthcare Investors Incorporated | | 3.38 | 2-1-2031 | | 2,930,000 | 3,002,717 |
| Omega Healthcare Investors Incorporated | | 4.50 | 1-15-2025 | | 2,130,000 | 2,320,626 |
| Omega Healthcare Investors Incorporated | | 5.25 | 1-15-2026 | | 1,700,000 | 1,931,447 |
| Sabra Health Care LP / Sabra Capital Corporation | | 4.80 | 6-1-2024 | | 6,500,000 | 7,101,365 |
| Service Properties Trust Company | | 3.95 | 1-15-2028 | | 3,000,000 | 2,775,000 |
| Simon Property Group LP | | 1.75 | 2-1-2028 | | 5,000,000 | 4,936,713 |
| Simon Property Group LP | | 3.80 | 7-15-2050 | | 2,880,000 | 3,008,921 |
| Tanger Properties LP | | 3.75 | 12-1-2024 | | 1,600,000 | 1,713,240 |
| WEA Finance LLC 144A | | 4.75 | 9-17-2044 | | 2,610,000 | 2,732,420 |
| | | | | | | 36,607,844 |
| Utilities: 1.14% | | | | | | |
| Electric utilities: 0.84% | | | | | | |
| Basin Electric Power Cooperative 144A | | 4.75 | 4-26-2047 | | 1,315,000 | 1,487,124 |
| NRG Energy Incorporated 144A | | 2.00 | 12-2-2025 | | 4,000,000 | 4,033,508 |
| Oglethorpe Power Corporation 144A | | 3.75 | 8-1-2050 | | 2,320,000 | 2,362,563 |
| Oglethorpe Power Corporation | | 5.05 | 10-1-2048 | | 1,060,000 | 1,282,127 |
| The Southern Company (5 Year Treasury Constant Maturity+3.73%) ± | | 4.00 | 1-15-2051 | | 4,000,000 | 4,176,376 |
| Tucson Electric Power Company | | 4.00 | 6-15-2050 | | 2,415,000 | 2,748,626 |
| | | | | | | 16,090,324 |
The accompanying notes are an integral part of these financial statements.
18 | Wells Fargo Core Plus Bond Fund
Portfolio of investments—February 28, 2021 (unaudited)
| | | Interest
rate | Maturity
date | Principal | Value |
| Gas utilities: 0.30% | | | | | | |
| CenterPoint Energy (3 Month LIBOR+0.50%) ±%% | | 0.68% | 3-2-2023 | $ | 2,865,000 | $ 2,865,000 |
| CenterPoint Energy %% | | 0.70 | 3-2-2023 | | 2,865,000 | 2,862,221 |
| | | | | | | 5,727,221 |
| Total Corporate bonds and notes (Cost $455,744,510) | | | | | | 479,220,767 |
| | | | | Shares | |
| Exchange-traded funds: 0.99% | | | | | | |
| iShares Broad USD High Yield Corporate Bond ETF | | | | | 188,000 | 7,715,520 |
| VanEck Vectors JPMorgan Emerging Markets Local Currency Bond ETF | | | | | 355,100 | 11,263,772 |
| Total Exchange-traded funds (Cost $18,138,162) | | | | | | 18,979,292 |
| | | | | Principal | |
| Foreign corporate bonds and notes: 2.77% | | | | | | |
| Communication services: 0.31% | | | | | | |
| Media: 0.31% | | | | | | |
| Tele Columbus AG 144A | | 3.88 | 5-2-2025 | EUR | 2,320,000 | 2,829,485 |
| Ziggo Bond Company BV 144A | | 3.38 | 2-28-2030 | EUR | 2,500,000 | 2,997,675 |
| Consumer discretionary: 0.27% | | | | | | |
| Auto components: 0.15% | | | | | | |
| HP Pelzer Holding GmbH 144A | | 4.13 | 4-1-2024 | EUR | 2,480,000 | 2,816,804 |
| Automobiles: 0.12% | | | | | | |
| Peugeot SA Company | | 2.00 | 3-20-2025 | EUR | 1,800,000 | 2,297,512 |
| | | | | | | 5,114,316 |
| Consumer staples: 0.82% | | | | | | |
| Food & staples retailing: 0.09% | | | | | | |
| Tasty Bondco 1 SA 144A | | 6.25 | 5-15-2026 | EUR | 1,600,000 | 1,771,506 |
| Food products: 0.26% | | | | | | |
| Danone SA (EUR Swap Annual (vs. 6 Month EURIBOR) 5 Year +1.43%) ʊ± | | 1.75 | 3-23-2023 | EUR | 2,600,000 | 3,199,772 |
| Sigma Holdings Company BV 144A | | 5.75 | 5-15-2026 | EUR | 1,500,000 | 1,759,556 |
| Household products: 0.11% | | | | | | |
| Energizer Gamma Acquisition BV 144A | | 4.63 | 7-15-2026 | EUR | 1,600,000 | 1,986,658 |
| Tobacco: 0.36% | | | | | | |
| BAT International Finance plc | | 2.25 | 1-16-2030 | EUR | 5,250,000 | 6,915,001 |
| | | | | | | 15,632,493 |
| Energy: 0.35% | | | | | | |
| Oil, gas & consumable fuels: 0.35% | | | | | | |
| Eni SpA | | 1.13 | 9-19-2028 | EUR | 3,200,000 | 4,086,195 |
| Total SA (EUR Swap Annual (vs. 6 Month EURIBOR) 5 Year +3.78%) ± | | 3.88 | 12-29-2049 | EUR | 2,000,000 | 2,504,268 |
The accompanying notes are an integral part of these financial statements.
Wells Fargo Core Plus Bond Fund | 19
Portfolio of investments—February 28, 2021 (unaudited)
| | | Interest
rate | Maturity
date | Principal | Value |
| Financials: 0.32% | | | | | | |
| Banks: 0.20% | | | | | | |
| Bankia SA (EUR Swap Annual (vs. 6 Month EURIBOR) 5 Year +5.82%) ʊ± | | 6.00% | 7-18-2022 | EUR | 1,200,000 | $ 1,500,983 |
| Caixa Geral de Depositos SA (EUR Swap Annual (vs. 6 Month EURIBOR) 5 Year +10.93%) ± | | 10.75 | 3-30-2022 | EUR | 1,800,000 | 2,361,171 |
| Diversified financial services: 0.12% | | | | | | |
| LKQ European Holdings BV Company 144A | | 3.63 | 4-1-2026 | EUR | 1,800,000 | 2,204,368 |
| | | | | | | 6,066,522 |
| Health care: 0.18% | | | | | | |
| Pharmaceuticals: 0.18% | | | | | | |
| Takeda Pharmaceutical Company Limited | | 2.00 | 7-9-2040 | EUR | 2,750,000 | 3,537,501 |
| Industrials: 0.32% | | | | | | |
| Commercial services & supplies: 0.08% | | | | | | |
| Paprec Holding SA 144A | | 4.00 | 3-31-2025 | EUR | 1,200,000 | 1,459,009 |
| Containers & packaging: 0.16% | | | | | | |
| Can-Pack SA 144A | | 2.38 | 11-1-2027 | EUR | 2,500,000 | 3,098,247 |
| Electrical equipment: 0.08% | | | | | | |
| Gamma Bidco SpA 144A | | 6.25 | 7-15-2025 | EUR | 1,300,000 | 1,639,099 |
| | | | | | | 6,196,355 |
| Real estate: 0.20% | | | | | | |
| Real estate management & development: 0.20% | | | | | | |
| Akelius Residential Property AB (EURIBOR ICE Swap Rate 11:00am +3.49%) ± | | 3.88 | 10-5-2078 | EUR | 2,500,000 | 3,152,113 |
| ATF Netherlands BV | | 1.50 | 7-15-2024 | EUR | 500,000 | 632,210 |
| Total Foreign corporate bonds and notes (Cost $48,611,972) | | | | | | 52,749,133 |
| Foreign government bonds: 1.60% | | | | | | |
| Brazil | | 10.00 | 1-1-2025 | BRL | 8,600,000 | 1,661,579 |
| Brazil | | 10.00 | 1-1-2029 | BRL | 8,000,000 | 1,562,141 |
| Brazil Government Bond ¤ | | 0.00 | 1-1-2024 | BRL | 57,000,000 | 8,397,816 |
| Hungary | | 1.00 | 11-26-2025 | HUF | 900,000,000 | 2,883,718 |
| Malaysia Government Bond | | 3.88 | 3-14-2025 | MYR | 15,000,000 | 3,948,238 |
| Malaysia Government Bond | | 3.96 | 9-15-2025 | MYR | 15,000,000 | 3,964,744 |
| Mexico | | 3.75 | 2-21-2024 | EUR | 1,000,000 | 1,231,164 |
| Mexico | | 4.75 | 4-27-2032 | USD | 3,615,000 | 4,068,683 |
| Republic of Turkey | | 5.88 | 6-26-2031 | USD | 1,500,000 | 1,485,000 |
| Ukraine 144A | | 7.38 | 9-25-2032 | USD | 1,200,000 | 1,233,662 |
| Total Foreign government bonds (Cost $32,499,502) | | | | | | 30,436,745 |
| Loans: 0.50% | | | | | | |
| Consumer discretionary: 0.04% | | | | | | |
| Hotels, restaurants & leisure: 0.04% | | | | | | |
| Carnival Corporation (1 Month LIBOR+7.50%) ± | | 8.50 | 6-30-2025 | $ | 815,900 | 845,819 |
The accompanying notes are an integral part of these financial statements.
20 | Wells Fargo Core Plus Bond Fund
Portfolio of investments—February 28, 2021 (unaudited)
| | | Interest
rate | Maturity
date | Principal | Value |
| Energy: 0.10% | | | | | | |
| Oil, gas & consumable fuels: 0.10% | | | | | | |
| Apergy Corporation (3 Month LIBOR+5.00%) ± | | 6.00% | 6-3-2027 | $ | 1,852,500 | $ 1,882,603 |
| Health care: 0.06% | | | | | | |
| Health care providers & services: 0.06% | | | | | | |
| Surgery Center Holdings Incorporated (1 Month LIBOR+3.25%) ± | | 4.25 | 9-3-2024 | | 1,209,375 | 1,204,187 |
| Industrials: 0.06% | | | | | | |
| Airlines: 0.06% | | | | | | |
| Mileage Plus Holdings LLC (3 Month LIBOR+5.25%) ± | | 6.25 | 6-25-2027 | | 975,000 | 1,039,652 |
| Information technology: 0.11% | | | | | | |
| Software: 0.11% | | | | | | |
| Sophia LP (3 Month LIBOR+3.75%) ± | | 1.00 | 10-7-2027 | | 2,000,000 | 2,004,380 |
| Materials: 0.13% | | | | | | |
| Paper & forest products: 0.13% | | | | | | |
| Vertical US Newco Incorporated (6 Month LIBOR+4.25%) ± | | 4.48 | 7-30-2027 | | 2,493,750 | 2,513,077 |
| Total Loans (Cost $9,398,492) | | | | | | 9,489,718 |
| Municipal obligations: 0.88% | | | | | | |
| California: 0.19% | | | | | | |
| Airport revenue: 0.10% | | | | | | |
| San Jose CA Series B (AGM Insured) | | 6.60 | 3-1-2041 | | 2,000,000 | 2,004,340 |
| Transportation revenue: 0.09% | | | | | | |
| Alameda CA Corridor Transportation Authority CAB Refunding Bond Subordinated Series B (Ambac Insured)¤ | | 0.00 | 10-1-2028 | | 2,115,000 | 1,722,181 |
| Illinois: 0.41% | | | | | | |
| GO revenue: 0.22% | | | | | | |
| Cook County IL Series B (BAM Insured) | | 6.36 | 11-15-2033 | | 1,745,000 | 2,445,932 |
| Will County IL Lincoln-Way Community High School District #210 Unrefunded CAB (AGM Insured)¤ | | 0.00 | 1-1-2025 | | 1,820,000 | 1,725,069 |
| | | | | | | 4,171,001 |
| Tax revenue: 0.19% | | | | | | |
| Chicago IL Transit Authority Taxable Pension Funding Series A | | 6.90 | 12-1-2040 | | 1,075,000 | 1,530,650 |
| Metropolitan Pier & Exposition Authority Illinois CAB McCormick Place Expansion Project Series 2010-B1 (AGM Insured)¤ | | 0.00 | 6-15-2026 | | 1,975,000 | 1,833,551 |
| Metropolitan Pier & Exposition Authority Illinois CAB McCormick Place Expansion Project Series 2012-B ¤ | | 0.01 | 12-15-2051 | | 765,000 | 258,509 |
| | | | | | | 3,622,710 |
The accompanying notes are an integral part of these financial statements.
Wells Fargo Core Plus Bond Fund | 21
Portfolio of investments—February 28, 2021 (unaudited)
| | | Interest
rate | Maturity
date | Principal | Value |
| Kansas: 0.02% | | | | | | |
| Health revenue: 0.02% | | | | | | |
| Kansas Development Finance Authority Village Shalom Project Series 2018-B | | 4.00% | 11-15-2025 | $ | 310,000 | $ 309,985 |
| Maryland: 0.04% | | | | | | |
| Education revenue: 0.04% | | | | | | |
| Maryland Health & HEFAR Green Street Academy Series B 144A | | 6.75 | 7-1-2023 | | 720,000 | 722,290 |
| Michigan: 0.05% | | | | | | |
| Miscellaneous revenue: 0.05% | | | | | | |
| Michigan Finance Authority Local Government Loan Program Project Series E | | 7.19 | 11-1-2022 | | 855,000 | 921,904 |
| Pennsylvania: 0.17% | | | | | | |
| Education revenue: 0.12% | | | | | | |
| Commonwealth of Pennsylvania Financing Authority Series A | | 4.14 | 6-1-2038 | | 1,995,000 | 2,318,669 |
| Health revenue: 0.05% | | | | | | |
| Quakertown PA General Authority U.S. Department of Agriculture Loan Anticipation Notes Series 2017-B | | 3.80 | 7-1-2021 | | 900,000 | 899,397 |
| Total Municipal obligations (Cost $14,385,923) | | | | | | 16,692,477 |
| Non-agency mortgage-backed securities: 13.08% | | | | | | |
| Agate Bay Mortgage Loan Trust Series 2015-3 Class B3 144A±± | | 3.61 | 4-25-2045 | | 1,427,156 | 1,491,760 |
| American Money Management Corporation Series 2014-14A Class A1R2 (3 Month LIBOR+1.02%)144A± | | 1.24 | 7-25-2029 | | 8,570,000 | 8,571,380 |
| American Money Management Corporation Series 2015-16A Class AR2 (3 Month LIBOR+0.98%)144A± | | 1.11 | 4-14-2029 | | 5,000,000 | 5,000,735 |
| American Money Management Corporation Series 2016-19A Class AR (3 Month LIBOR+1.14%)144A± | | 1.38 | 10-16-2028 | | 2,750,000 | 2,750,652 |
| Angel Oak Mortgage Trust I LLC Series 2019-3 Class A1 144A±± | | 2.93 | 5-25-2059 | | 601,540 | 605,336 |
| Angel Oak Mortgage Trust I LLC Series 2019-4 Class A1 144A±± | | 2.99 | 7-26-2049 | | 5,227,478 | 5,284,143 |
| Angel Oak Mortgage Trust I LLC Series 2020-4 Class A1 144A±± | | 1.47 | 6-25-2065 | | 3,822,363 | 3,859,643 |
| Avery Point CLO Limited Series 2015-7A Class AR2 (3 Month LIBOR+0.96%)144A± | | 1.20 | 1-15-2028 | | 8,075,000 | 8,075,945 |
| Banc of America Funding Corporation Series 2016-R1 Class A1 144A±± | | 2.50 | 3-25-2040 | | 233,932 | 233,770 |
| Benefit Street Partners CLO Limited Series 2016-10A Class A1R (3 Month LIBOR+1.14%)144A± | | 1.38 | 1-15-2029 | | 3,500,000 | 3,500,000 |
| BlueMountain CLO Limited Series 2012-2A Class AR2 (3 Month LIBOR+1.05%)144A± | | 1.23 | 11-20-2028 | | 906,242 | 906,616 |
| BlueMountain CLO Limited Series 2013-1A Class A1R2 (3 Month LIBOR+1.23%)144A± | | 1.45 | 1-20-2029 | | 1,754,467 | 1,755,183 |
| Bojangles Issuer LLC Series 2020-1A Class A2 144A | | 3.83 | 10-20-2050 | | 7,445,000 | 7,726,570 |
| Bunker Hill Loan Depositary Trust Series 2019-3 Class A1 144A | | 2.72 | 11-25-2059 | | 2,704,592 | 2,768,794 |
The accompanying notes are an integral part of these financial statements.
22 | Wells Fargo Core Plus Bond Fund
Portfolio of investments—February 28, 2021 (unaudited)
| | | Interest
rate | Maturity
date | Principal | Value |
| Non-agency mortgage-backed securities (continued) | | | | | | |
| BX Trust Series 2019-OC11 Class A 144A | | 3.20% | 12-9-2041 | $ | 4,975,000 | $ 5,341,359 |
| Cascade Funding Mortgage Trust Series 2018-RM2 Class A 144A±± | | 4.00 | 10-25-2068 | | 438,199 | 457,693 |
| CD Commercial Mortgage Trust Series 2017-6 Class A5 | | 3.46 | 11-13-2050 | | 1,035,000 | 1,146,143 |
| CIFC Funding Limited Series 2012-2RA Class A1 (3 Month LIBOR+0.80%)144A± | | 1.02 | 1-20-2028 | | 2,239,752 | 2,240,341 |
| Citigroup Commercial Mortgage Trust 2017-MDRA Class A 144A | | 3.66 | 7-10-2030 | | 2,000,000 | 2,043,718 |
| Colt Funding LLC Series 2020-1R Class A1 ±± | | 1.26 | 9-25-2065 | | 2,295,168 | 2,306,741 |
| Commercial Mortgage Trust Series 2014-CR15 Class A2 | | 2.93 | 2-10-2047 | | 295,009 | 293,559 |
| Credit Suisse Mortgage Trust Series 2013-IVR2 Class B4 144A±± | | 3.40 | 4-25-2043 | | 2,746,148 | 2,801,454 |
| Credit Suisse Mortgage Trust Series 2021-AFC1 Class A2 144A±± | | 1.07 | 3-25-2056 | | 9,088,500 | 9,088,334 |
| Crown Point Limited Series 2015-3A Class A1AR (3 Month LIBOR+0.91%)144A± | | 1.15 | 12-31-2027 | | 700,625 | 700,791 |
| Crown Point Limited Series 2018-6A Class A1 (3 Month LIBOR+1.17%)144A± | | 1.39 | 10-20-2028 | | 3,145,050 | 3,145,871 |
| CSMLT Trust Series 2015-1 Class B4 144A±± | | 3.83 | 5-25-2045 | | 3,855,337 | 3,923,150 |
| DBWF Mortgage Trust Series 2018-GLKS Class A (1 Month LIBOR+1.03%)144A± | | 1.14 | 12-19-2030 | | 582,684 | 583,737 |
| Deephaven Residential Mortgage Series 2019-2A Class A1 144A±± | | 3.56 | 4-25-2059 | | 1,035,662 | 1,039,789 |
| Deephaven Residential Mortgage Series 2019-4A Class A1 144A±± | | 2.79 | 10-25-2059 | | 1,642,702 | 1,661,976 |
| Dryden Senior Loan Fund Series 2013-28A Class A2LR (3 Month LIBOR+1.65%)144A± | | 1.84 | 8-15-2030 | | 4,000,000 | 4,003,004 |
| Financial Asset Securitization Incorporated Series 1997-NAM2 Class B2 †±± | | 8.00 | 7-25-2027 | | 15,908 | 2 |
| FREMF Mortgage Trust Series 2020-KF76 Class B (1 Month LIBOR+2.75%)144A± | | 2.87 | 1-25-2030 | | 3,965,000 | 3,953,245 |
| FWD Securitization Trust Series 2019-INV1 Class A3 144A±± | | 3.11 | 6-25-2049 | | 2,907,833 | 3,018,012 |
| GB Trust Series 2020-FlLIX (1 Month LIBOR+1.12%)144A± | | 1.23 | 8-15-2037 | | 3,000,000 | 3,023,657 |
| GCAT Series 2019-NQM1 Class A1 144A | | 2.99 | 2-25-2059 | | 4,217,405 | 4,235,803 |
| GCAT Series 2019-NQM2 Class A1 144A | | 2.86 | 9-25-2059 | | 3,004,615 | 3,053,554 |
| GCAT Series 2019-RPl1 Class A1 144A±± | | 2.65 | 10-25-2068 | | 3,874,553 | 4,026,242 |
| Gilbert Park CLO Series 2017-1A Class B (3 Month LIBOR+1.60%)144A± | | 1.84 | 10-15-2030 | | 3,000,000 | 3,000,984 |
| Goldman Sachs Mortgage Securities Trust Series 2019-GSA1 Class C ±± | | 3.81 | 11-10-2052 | | 500,000 | 500,907 |
| Goldman Sachs Mortgage Securities Trust Series 2019-PJ2 Class A4 144A±± | | 4.00 | 11-25-2049 | | 1,150,350 | 1,159,561 |
| Homeward Opportunities Fund I Trust Series 2019-1 Class A1 144A±± | | 3.45 | 1-25-2059 | | 1,148,674 | 1,161,755 |
| Hospitality Mortgage Trust Series 2019 Class A (1 Month LIBOR+1.00%)144A± | | 1.11 | 11-15-2036 | | 2,416,198 | 2,416,198 |
| Imperial Fund LLC Series 2020-NQM1 Class A1 144A±± | | 1.38 | 10-25-2055 | | 2,185,004 | 2,193,508 |
| JPMorgan Chase Commercial Mortgage Securities Trust Series 2012-C8 Class ASB | | 2.38 | 10-15-2045 | | 1,188,743 | 1,205,762 |
| JPMorgan Chase Commercial Mortgage Securities Trust Series 2013-3 Class B4 144A±± | | 3.39 | 7-25-2043 | | 3,616,907 | 3,589,434 |
The accompanying notes are an integral part of these financial statements.
Wells Fargo Core Plus Bond Fund | 23
Portfolio of investments—February 28, 2021 (unaudited)
| | | Interest
rate | Maturity
date | Principal | Value |
| Non-agency mortgage-backed securities (continued) | | | | | | |
| JPMorgan Chase Commercial Mortgage Securities Trust Series 2019-MFP Class A (1 Month LIBOR+0.96%)144A± | | 1.07% | 7-15-2036 | $ | 5,000,000 | $ 4,996,985 |
| JPMorgan Mortgage Trust Series 2014-2 Class B4 144A±± | | 3.41 | 6-25-2029 | | 1,215,000 | 1,251,157 |
| JPMorgan Mortgage Trust Series 2020-1 Class A15 144A±± | | 3.50 | 6-25-2050 | | 3,035,044 | 3,093,063 |
| KKR Financial Holdings LLC (3 Month LIBOR+1.34%)144A± | | 1.58 | 4-15-2029 | | 3,150,000 | 3,150,000 |
| LoanCore Limited Series 2018-CRE1 Class A (1 Month LIBOR+1.13%)144A± | | 1.24 | 5-15-2028 | | 1,442,458 | 1,442,909 |
| Mach One Trust Commercial Mortgage Backed Series 2004-1 Class X 144A♀±± | | 0.78 | 5-28-2040 | | 42,263 | 0 |
| Mello Warehouse Securitization Trust Series 2019-1 Class A (1 Month LIBOR+0.80%)144A± | | 0.92 | 6-25-2052 | | 3,115,000 | 3,117,295 |
| Mello Warehouse Securitization Trust Series 2019-1 Class E (1 Month LIBOR+2.35%)144A± | | 2.48 | 6-25-2052 | | 4,000,000 | 4,001,432 |
| Metlife Securitization Trust 2019-1A Class A1A 144A±± | | 3.75 | 4-25-2058 | | 1,763,773 | 1,832,234 |
| MF1 Limited Series 2020-FL3 Class A (1 Month LIBOR+2.05%)144A± | | 2.16 | 7-15-2035 | | 3,700,000 | 3,739,326 |
| MFRA Trust Series 2020-NQM3 Class A1 144A±± | | 1.01 | 1-26-2065 | | 3,626,907 | 3,624,994 |
| Mill City Mortgage Trust Series 2019 Class M2 144A±± | | 3.25 | 7-25-2059 | | 4,592,000 | 4,789,360 |
| Morgan Stanley Bank of America Merrill Lynch Trust Series 2016-C30 Class B ±± | | 3.31 | 9-15-2049 | | 610,000 | 620,848 |
| Morgan Stanley Capital I Series 2004-RR2 Class X 144A♀±± | | 0.35 | 10-28-2033 | | 1,818 | 4 |
| New Residential Mortgage Loan Trust Series 2019-RPL3 Class M1 144A±± | | 3.25 | 7-25-2059 | | 5,000,000 | 5,219,579 |
| Octagon Investment Partners Series 2017-1A Class A2R (3 Month LIBOR+1.45%)144A± | | 1.56 | 3-17-2030 | | 8,205,000 | 8,205,591 |
| Onslow Bay Financial LLC Series 2020 Class A21 144A±± | | 3.50 | 12-25-2049 | | 2,513,165 | 2,561,502 |
| OZLM Funding Limited Series 2014-8A Class A2RR (3 Month LIBOR+1.80%)144A± | | 2.02 | 10-17-2029 | | 5,400,000 | 5,402,381 |
| Palmer Square Loan Funding Limited Series 2019-2A Class A1 (3 Month LIBOR+0.97%)144A± | | 1.19 | 4-20-2027 | | 1,839,888 | 1,840,370 |
| Residential Mortgage Loan Trust Series 2020-1 Class M1 144A±± | | 3.24 | 2-25-2024 | | 5,000,000 | 5,064,149 |
| Residential Mortgage Loan Trust Series 2021-1R Class A2 144A♦±± | | 1.10 | 1-25-2065 | | 3,500,000 | 3,500,000 |
| Shellpoint Company Originator Trust Series 2016-1 Class B2 144A±± | | 3.61 | 11-25-2046 | | 5,874,687 | 6,152,354 |
| Sound Point CLO Limited Series 2013-2RA Class A1 (3 Month LIBOR+0.95%)144A± | | 1.19 | 4-15-2029 | | 2,825,000 | 2,819,943 |
| Sound Point CLO Limited Series 2015-1RA Class BR (3 Month LIBOR+1.55%)144A± | | 1.73 | 4-15-2030 | | 10,340,000 | 10,343,236 |
| Starwood Mortgage Residential Trust Series 2019-1 Class A1 144A±± | | 2.94 | 6-25-2049 | | 1,660,038 | 1,684,794 |
| Starwood Mortgage Residential Trust Series 2019-INV1 Class A1 144A±± | | 2.61 | 9-27-2049 | | 2,169,657 | 2,211,519 |
| Station Place Securitization Trust Series 2021-WL1 Class A (1 Month LIBOR+0.65%)144A± | | 0.78 | 1-26-2054 | | 6,790,000 | 6,790,000 |
The accompanying notes are an integral part of these financial statements.
24 | Wells Fargo Core Plus Bond Fund
Portfolio of investments—February 28, 2021 (unaudited)
| | | Interest
rate | Maturity
date | Principal | Value |
| Non-agency mortgage-backed securities (continued) | | | | | | |
| TCW Collateralized Loan Obligation Limited Series 2017-1A Class BR (3 Month LIBOR+1.55%)144A± | | 1.76% | 7-29-2029 | $ | 5,545,000 | $ 5,546,980 |
| Towd Point Asset Funding LLC Series 2019-HE1 Class A1 (1 Month LIBOR+0.90%)144A± | | 1.02 | 4-25-2048 | | 1,541,853 | 1,547,469 |
| UBS Commercial Mortgage Trust Series 2017-C5 Class A5 | | 3.47 | 11-15-2050 | | 1,140,000 | 1,252,149 |
| UBS Commercial Mortgage Trust Series 2018-NYCH Class A (1 Month LIBOR+0.85%)144A± | | 0.96 | 2-15-2032 | | 2,930,000 | 2,920,402 |
| Verus Securitization Trust Series 2019-1 Class A1 144A±± | | 3.40 | 12-25-2059 | | 1,171,722 | 1,186,828 |
| Verus Securitization Trust Series 2019-1 Class A1 144A±± | | 3.84 | 2-25-2059 | | 4,320,983 | 4,347,560 |
| Verus Securitization Trust Series 2019-2 Class A1 144A±± | | 3.21 | 5-25-2059 | | 2,275,380 | 2,286,622 |
| Voya CLO Limited Series 2015-2A Class AR (3 Month LIBOR+0.97%)144A± | | 1.19 | 7-23-2027 | | 2,695,903 | 2,696,650 |
| West CLO Limited Series 2014-2A Class A1 (3 Month LIBOR+0.87%)144A± | | 1.09 | 1-16-2027 | | 346,444 | 346,523 |
| Total Non-agency mortgage-backed securities (Cost $247,051,669) | | | | | | 249,433,019 |
| U.S. Treasury securities: 11.08% | | | | | | |
| TIPS | | 0.13 | 7-15-2030 | | 17,691,724 | 19,378,658 |
| TIPS | | 0.13 | 1-15-2031 | | 12,347,034 | 13,457,061 |
| TIPS | | 1.38 | 2-15-2044 | | 3,140,428 | 4,210,075 |
| U.S. Treasury Bond | | 1.25 | 5-15-2050 | | 2,855,000 | 2,305,636 |
| U.S. Treasury Bond | | 1.63 | 11-15-2050 | | 14,600,000 | 12,982,594 |
| U.S. Treasury Bond | | 1.88 | 2-15-2051 | | 33,580,000 | 31,796,063 |
| U.S. Treasury Bond | | 2.25 | 8-15-2049 | | 6,670,000 | 6,861,763 |
| U.S. Treasury Bond | | 2.38 | 11-15-2049 | | 2,105,000 | 2,224,557 |
| U.S. Treasury Note | | 0.25 | 8-31-2025 | | 1,535,000 | 1,509,157 |
| U.S. Treasury Note | | 0.25 | 10-31-2025 | | 25,475,000 | 24,996,349 |
| U.S. Treasury Note | | 0.38 | 4-30-2025 | | 13,685,000 | 13,587,174 |
| U.S. Treasury Note | | 0.38 | 11-30-2025 | | 29,525,000 | 29,106,345 |
| U.S. Treasury Note | | 0.38 | 12-31-2025 | | 6,135,000 | 6,041,537 |
| U.S. Treasury Note | | 0.38 | 1-31-2026 | | 30,390,000 | 29,896,163 |
| U.S. Treasury Note | | 0.63 | 8-15-2030 | | 650,000 | 606,836 |
| U.S. Treasury Note | | 1.13 | 2-15-2031 | | 12,565,000 | 12,256,765 |
| Total U.S. Treasury securities (Cost $215,059,339) | | | | | | 211,216,733 |
| Yankee corporate bonds and notes: 12.74% | | | | | | |
| Communication services: 0.83% | | | | | | |
| Diversified telecommunication services: 0.09% | | | | | | |
| Telefonica Emisiones SAU | | 5.21 | 3-8-2047 | | 1,485,000 | 1,795,895 |
| Interactive media & services: 0.43% | | | | | | |
| Baidu Incorporated | | 2.38 | 10-9-2030 | | 5,000,000 | 4,911,503 |
| Tencent Holdings Limited 144A | | 3.98 | 4-11-2029 | | 3,000,000 | 3,331,352 |
| | | | | | | 8,242,855 |
| Media: 0.06% | | | | | | |
| WPP Finance Limited 2010 | | 3.75 | 9-19-2024 | | 1,054,000 | 1,158,894 |
The accompanying notes are an integral part of these financial statements.
Wells Fargo Core Plus Bond Fund | 25
Portfolio of investments—February 28, 2021 (unaudited)
| | | Interest
rate | Maturity
date | Principal | Value |
| Wireless telecommunication services: 0.25% | | | | | | |
| NTT Finance Corporation 144A%% | | 0.58% | 3-1-2024 | $ | 4,690,000 | $ 4,685,934 |
| Consumer discretionary: 0.59% | | | | | | |
| Automobiles: 0.17% | | | | | | |
| Nissan Motor Company 144A | | 4.81 | 9-17-2030 | | 2,961,000 | 3,304,670 |
| Internet & direct marketing retail: 0.42% | | | | | | |
| Alibaba Group Holding Limited | | 3.25 | 2-9-2061 | | 3,835,000 | 3,673,168 |
| Prosus NV 144A | | 3.83 | 2-8-2051 | | 3,000,000 | 2,724,354 |
| Prosus NV 144A | | 4.03 | 8-3-2050 | | 1,565,000 | 1,506,974 |
| | | | | | | 7,904,496 |
| Consumer staples: 0.31% | | | | | | |
| Beverages: 0.08% | | | | | | |
| Fomento Economico SA | | 3.50 | 1-16-2050 | | 1,580,000 | 1,608,440 |
| Tobacco: 0.23% | | | | | | |
| Imperial Brands Finance plc 144A | | 3.50 | 7-26-2026 | | 4,055,000 | 4,381,969 |
| Energy: 1.62% | | | | | | |
| Oil, gas & consumable fuels: 1.62% | | | | | | |
| Aker BP ASA 144A | | 4.75 | 6-15-2024 | | 6,255,000 | 6,462,233 |
| Baytex Energy Corporation 144A | | 5.63 | 6-1-2024 | | 2,000,000 | 1,840,000 |
| BP Capital Markets plc (5 Year Treasury Constant Maturity+4.40%) ʊ± | | 4.88 | 12-24-2029 | | 4,950,000 | 5,313,825 |
| Comision Federal de Electricidad 144A« | | 3.35 | 2-9-2031 | | 4,085,000 | 4,022,704 |
| Comision Federal de Electricidad 144A | | 4.75 | 2-23-2027 | | 1,140,000 | 1,261,125 |
| Galaxy Pipeline Assets Company 144A | | 2.16 | 3-31-2034 | | 4,995,000 | 4,939,228 |
| Northriver Midstream Finance LP 144A | | 5.63 | 2-15-2026 | | 1,050,000 | 1,088,063 |
| Saudi Arabian Oil Company 144A | | 2.25 | 11-24-2030 | | 3,660,000 | 3,591,918 |
| Total Capital International SA | | 2.99 | 6-29-2041 | | 2,265,000 | 2,281,459 |
| | | | | | | 30,800,555 |
| Financials: 6.90% | | | | | | |
| Banks: 3.64% | | | | | | |
| ABN AMRO Bank NV 144A | | 4.75 | 7-28-2025 | | 1,800,000 | 2,036,700 |
| Banco Bradesco 144A | | 2.85 | 1-27-2023 | | 3,205,000 | 3,264,325 |
| Banco de Bogota SA 144A | | 6.25 | 5-12-2026 | | 1,400,000 | 1,597,750 |
| Banco del Estado de Chile 144A | | 2.70 | 1-9-2025 | | 4,165,000 | 4,403,440 |
| Banco do Brasil SA 144A | | 4.63 | 1-15-2025 | | 1,615,000 | 1,748,238 |
| Banco Industrial SA (5 Year Treasury Constant Maturity+4.44%) 144A± | | 4.88 | 1-29-2031 | | 1,500,000 | 1,530,000 |
| Banco Internacional del Peru 144A | | 3.25 | 10-4-2026 | | 1,600,000 | 1,694,240 |
| Banco Mercantil del Norte SA (5 Year Treasury Constant Maturity+4.97%) 144Aʊ± | | 6.75 | 9-27-2024 | | 1,565,000 | 1,664,769 |
| Banco Safra SA 144A | | 4.13 | 2-8-2023 | | 1,695,000 | 1,759,664 |
| Banco Santander Mexico (5 Year Treasury Constant Maturity+3.00%) 144A± | | 5.95 | 10-1-2028 | | 1,700,000 | 1,851,351 |
| Banistmo SA 144A | | 4.25 | 7-31-2027 | | 4,570,000 | 4,808,234 |
| Banque Ouest Africaine de Developpement 144A | | 5.00 | 7-27-2027 | | 2,520,000 | 2,821,871 |
| Barclays Bank plc (1 Year Treasury Constant Maturity+0.80%) ± | | 1.01 | 12-10-2024 | | 3,710,000 | 3,728,992 |
| BNP Paribas (U.S. SOFR+1.00%) 144A± | | 1.32 | 1-13-2027 | | 5,455,000 | 5,403,207 |
| BPCE SA 144A | | 5.15 | 7-21-2024 | | 1,725,000 | 1,953,497 |
The accompanying notes are an integral part of these financial statements.
26 | Wells Fargo Core Plus Bond Fund
Portfolio of investments—February 28, 2021 (unaudited)
| | | Interest
rate | Maturity
date | Principal | Value |
| Banks (continued) | | | | | | |
| BPCE SA (U.S. SOFR+1.31%) 144A± | | 2.28% | 1-20-2032 | $ | 7,000,000 | $ 6,951,876 |
| Danske Bank 144A | | 5.38 | 1-12-2024 | | 1,705,000 | 1,916,482 |
| Deutsche Bank AG (USD ICE Swap Rate 11:00am NY 5 Year+2.55%) ± | | 4.88 | 12-1-2032 | | 1,750,000 | 1,862,000 |
| Itau Unibanco Holding SA 144A | | 3.25 | 1-24-2025 | | 3,510,000 | 3,641,625 |
| Macquire Bank Limited (5 Year Treasury Constant Maturity+1.70%) 144A±%% | | 3.05 | 3-3-2036 | | 7,875,000 | 7,817,733 |
| Perrigo Finance plc | | 4.90 | 12-15-2044 | | 1,500,000 | 1,558,067 |
| Unicredit SpA (5 Year Treasury Constant Maturity+4.75%) 144A± | | 5.46 | 6-30-2035 | | 3,000,000 | 3,242,319 |
| Westpac Banking Corporation | | 2.96 | 11-16-2040 | | 2,160,000 | 2,139,194 |
| | | | | | | 69,395,574 |
| Capital markets: 0.59% | | | | | | |
| Credit Suisse Group AG (U.S. SOFR+0.98%) 144A± | | 1.31 | 2-2-2027 | | 3,000,000 | 2,957,295 |
| Credit Suisse Group AG (5 Year Treasury Constant Maturity+4.89%) 144Aʊ± | | 5.25 | 2-11-2027 | | 3,500,000 | 3,718,750 |
| Credit Suisse Group Funding Limited (3 Month LIBOR+1.20%) 144A± | | 3.00 | 12-14-2023 | | 1,485,000 | 1,548,870 |
| UBS Group Funding Switzerland AG 144A | | 3.49 | 5-23-2023 | | 1,165,000 | 1,207,834 |
| UBS Group Funding Switzerland AG (USD Swap Semi Annual (vs. 6 Month LIBOR) 5 Year+4.87%) ± | | 7.00 | 12-29-2049 | | 1,650,000 | 1,889,250 |
| | | | | | | 11,321,999 |
| Consumer finance: 0.25% | | | | | | |
| Credito Real SAB de CV 144A | | 8.00 | 1-21-2028 | | 2,000,000 | 2,102,579 |
| Nissan Motor Acceptance Corporation 144A | | 2.65 | 7-13-2022 | | 1,843,000 | 1,884,511 |
| Unifin Financiera SAB de CV 144A | | 9.88 | 1-28-2029 | | 800,000 | 838,000 |
| | | | | | | 4,825,090 |
| Diversified financial services: 0.98% | | | | | | |
| Avolon Holdings Funding Limited 144A | | 2.75 | 2-21-2028 | | 2,000,000 | 1,911,354 |
| Avolon Holdings Funding Limited 144A | | 5.50 | 1-15-2026 | | 2,515,000 | 2,783,299 |
| Banco Nacional de Comercio Exterior SNC 144A | | 4.38 | 10-14-2025 | | 2,350,000 | 2,614,375 |
| Brookfield Finance Incorporated | | 3.50 | 3-30-2051 | | 2,865,000 | 2,864,074 |
| Corporacion Financiera de Desarrollo SA (3 Month LIBOR+5.61%) 144A± | | 5.25 | 7-15-2029 | | 1,185,000 | 1,288,688 |
| DAE Funding LLC 144A | | 3.38 | 3-20-2028 | | 3,205,000 | 3,244,101 |
| GE Capital International Funding Company | | 4.42 | 11-15-2035 | | 3,535,000 | 4,037,106 |
| | | | | | | 18,742,997 |
| Insurance: 1.29% | | | | | | |
| AIA Group Limited 144A | | 3.38 | 4-7-2030 | | 5,640,000 | 6,163,377 |
| Fairfax Financial Holdings Limited | | 4.85 | 4-17-2028 | | 2,780,000 | 3,105,983 |
| Fairfax Financial Holdings Limited | | 4.63 | 4-29-2030 | | 4,700,000 | 5,189,486 |
| Nippon Life Insurance (5 Year Treasury Constant Maturity+2.65%) 144A± | | 2.75 | 1-21-2051 | | 4,595,000 | 4,556,461 |
| Sompo International Holdings Limited | | 7.00 | 7-15-2034 | | 1,330,000 | 1,827,435 |
| Swiss Re Finance (Luxembourg) SA (5 Year Treasury Constant Maturity+3.58%) 144A± | | 5.00 | 4-2-2049 | | 1,600,000 | 1,833,600 |
| Validus Holdings Limited | | 8.88 | 1-26-2040 | | 1,210,000 | 1,926,006 |
| | | | | | | 24,602,348 |
The accompanying notes are an integral part of these financial statements.
Wells Fargo Core Plus Bond Fund | 27
Portfolio of investments—February 28, 2021 (unaudited)
| | | Interest
rate | Maturity
date | Principal | Value |
| Thrifts & mortgage finance: 0.15% | | | | | | |
| Nationwide Building Society (USD ICE Swap Rate 11:00am NY 5 Year+1.85%) 144A± | | 4.13% | 10-18-2032 | $ | 2,500,000 | $ 2,759,063 |
| Health care: 0.04% | | | | | | |
| Pharmaceuticals: 0.04% | | | | | | |
| Teva Pharmaceutical Finance BV | | 2.80 | 7-21-2023 | | 800,000 | 784,000 |
| Industrials: 0.83% | | | | | | |
| Aerospace & defense: 0.16% | | | | | | |
| Bombardier Incorporated 144A | | 7.88 | 4-15-2027 | | 3,500,000 | 3,141,950 |
| Paper & forest products: 0.06% | | | | | | |
| Suzano Austria GmbH | | 3.75 | 1-15-2031 | | 1,000,000 | 1,056,200 |
| Professional services: 0.58% | | | | | | |
| IHS Markit Limited | | 4.25 | 5-1-2029 | | 9,600,000 | 11,046,720 |
| Transportation infrastructure: 0.03% | | | | | | |
| Mexico City Airport Trust 144A | | 5.50 | 7-31-2047 | | 570,000 | 536,228 |
| Information technology: 0.67% | | | | | | |
| Communications equipment: 0.47% | | | | | | |
| Ericsson LM | | 4.13 | 5-15-2022 | | 8,699,000 | 9,006,727 |
| Semiconductors & semiconductor equipment: 0.20% | | | | | | |
| SK Hynix Incorporated 144A | | 2.38 | 1-19-2031 | | 3,820,000 | 3,729,871 |
| Materials: 0.72% | | | | | | |
| Chemicals: 0.72% | | | | | | |
| Orbia Advance Corporation SAB 144A | | 4.88 | 9-19-2022 | | 5,040,000 | 5,327,280 |
| Syngenta Finance NV 144A | | 4.44 | 4-24-2023 | | 8,000,000 | 8,374,682 |
| | | | | | | 13,701,962 |
| Utilities: 0.23% | | | | | | |
| Electric utilities: 0.23% | | | | | | |
| Electricite de France SA 144A | | 4.95 | 10-13-2045 | | 1,130,000 | 1,385,718 |
| Western Power Distributions Holdings Limited 144A | | 7.38 | 12-15-2028 | | 2,265,000 | 3,016,660 |
| | | | | | | 4,402,378 |
| Total Yankee corporate bonds and notes (Cost $235,961,544) | | | | | | 242,936,815 |
| Yankee government bonds: 0.86% | | | | | | |
| Bermuda 144A | | 3.38 | 8-20-2050 | | 1,455,000 | 1,455,000 |
| Bermuda 144A | | 3.72 | 1-25-2027 | | 410,000 | 449,467 |
| Dominican Republic 144A | | 4.50 | 1-30-2030 | | 1,000,000 | 1,010,000 |
| Dominican Republic 144A | | 4.88 | 9-23-2032 | | 1,800,000 | 1,827,000 |
| Provincia de Cordoba 144A | | 6.98 | 12-10-2025 | | 1,781,310 | 1,243,889 |
| Provincia de Santa Fe 144A | | 7.00 | 3-23-2023 | | 2,000,000 | 1,560,020 |
| Republic of Argentina | | 0.13 | 7-9-2030 | | 1,703,981 | 616,841 |
| Republic of Argentina | | 1.00 | 7-9-2029 | | 206,310 | 81,286 |
| Republic of Argentina | | 5.00 | 7-9-2035 | | 1,817,118 | 578,752 |
| Republic of Kenya 144A | | 8.25 | 2-28-2048 | | 750,000 | 827,895 |
| Republic of Paraguay 144A | | 5.40 | 3-30-2050 | | 1,750,000 | 2,013,393 |
| Republic of Senegal 144A | | 6.25 | 5-23-2033 | | 750,000 | 797,538 |
The accompanying notes are an integral part of these financial statements.
28 | Wells Fargo Core Plus Bond Fund
Portfolio of investments—February 28, 2021 (unaudited)
| | | Interest
rate | Maturity
date | Principal | Value |
| Yankee government bonds (continued) | | | | | | |
| Saudi Arabia 144A | | 4.50% | 4-22-2060 | $ | 1,870,000 | $ 2,114,334 |
| Sultanate of Oman 144A | | 6.25 | 1-25-2031 | | 1,700,000 | 1,789,250 |
| Total Yankee government bonds (Cost $16,997,086) | | | | | | 16,364,665 |
| | | Yield | | | Shares | |
| Short-term investments: 14.44% | | | | | | |
| Commercial paper: 1.57% | | | | | | |
| Intesa Sanpaolo Funding LLC ☼ | | 0.17 | | | 15,000,000 | 14,996,501 |
| Walgreens Boots Alliance 144A☼ | | 0.10 | | | 15,000,000 | 14,995,200 |
| | | | | | | 29,991,701 |
| Investment companies: 5.79% | | | | | | |
| Securities Lending Cash Investments LLC ♠∩∞ | | 0.05 | | | 6,037,335 | 6,037,335 |
| Wells Fargo Government Money Market Fund Select Class ♠∞## | | 0.03 | | | 104,340,787 | 104,340,787 |
| | | | | | | 110,378,122 |
| U.S. Treasury securities: 7.08% | | | | | | |
| U.S. Cash Management Bill ☼ | | 0.01 | | | 20,000,000 | 19,998,812 |
| U.S. Treasury Bill ☼ | | 0.01 | | | 30,000,000 | 29,999,644 |
| U.S. Treasury Bill ☼ | | 0.01 | | | 20,000,000 | 19,997,250 |
| U.S. Treasury Bill ☼ | | 0.01 | | | 20,000,000 | 19,994,808 |
| U.S. Treasury Bill ☼ | | 0.03 | | | 45,000,000 | 44,999,973 |
| | | | | | | 134,990,487 |
| Total Short-term investments (Cost $275,361,583) | | | | | | 275,360,310 |
| Total investments in securities (Cost $2,014,144,231) | 107.50% | | | | | 2,049,614,295 |
| Other assets and liabilities, net | (7.50) | | | | | (142,927,693) |
| Total net assets | 100.00% | | | | | $1,906,686,602 |
| ± | Variable rate investment. The rate shown is the rate in effect at period end. |
| ♀ | Investment in an interest-only security entitles holders to receive only the interest payments on the underlying mortgages. The principal amount shown is the notional amount of the underlying mortgages. The rate represents the coupon rate. |
| ±± | The coupon of the security is adjusted based on the principal and interest payments received from the underlying pool of mortgages as well as the credit quality and the actual prepayment speed of the underlying mortgages. |
| ¤ | The security is issued in zero coupon form with no periodic interest payments. |
| 144A | The security may be resold in transactions exempt from registration, normally to qualified institutional buyers, pursuant to Rule 144A under the Securities Act of 1933. |
| † | Non-income-earning security |
| ♦ | The security is fair valued in accordance with procedures approved by the Board of Trustees. |
| ## | All or a portion of this security is segregated for when-issued securities. |
| « | All or a portion of this security is on loan. |
| ♠ | The issuer of the security is an affiliated person of the Fund as defined in the Investment Company Act of 1940. |
| ∩ | The investment is a non-registered investment company purchased with cash collateral received from securities on loan. |
| ☼ | Zero coupon security. The rate represents the current yield to maturity. |
| ∞ | The rate represents the 7-day annualized yield at period end. |
| %% | The security is purchased on a when-issued basis. |
| ʊ | Security is perpetual in nature and has no stated maturity date. The date shown reflects the next call date. |
The accompanying notes are an integral part of these financial statements.
Wells Fargo Core Plus Bond Fund | 29
Portfolio of investments—February 28, 2021 (unaudited)
| Abbreviations: |
| AGM | Assured Guaranty Municipal |
| Ambac | Ambac Financial Group Incorporated |
| BAM | Build America Mutual Assurance Company |
| BRL | Brazilian real |
| CAB | Capital appreciation bond |
| EUR | Euro |
| EURIBOR | Euro Interbank |
| FHLB | Federal Home Loan Bank |
| FHLMC | Federal Home Loan Mortgage Corporation |
| FNMA | Federal National Mortgage Association |
| GNMA | Government National Mortgage Association |
| GO | General obligation |
| HEFAR | Higher Education Facilities Authority Revenue |
| HUF | Hungarian forint |
| LIBOR | London Interbank Offered Rate |
| MYR | Malaysian ringgit |
| SOFR | Secured Overnight Financing Rate |
| STRIPS | Separate trading of registered interest and principal securities |
| TIPS | Treasury inflation-protected securities |
| TVA | Tennessee Valley Authority |
| USD | United States Dollar |
Investments in affiliates
An affiliated investment is an investment in which the Fund owns at least 5% of the outstanding voting shares of the issuer or as a result of other relationships, such as the Fund and the issuer having the same investment manager. Transactions with issuers that were either affiliated persons of the Fund at the beginning of the period or the end of the period were as follows:
| | Value,
beginning of
period | Purchases | Sales
proceeds | Net
realized
gains
(losses) | | Net
change in
unrealized
gains
(losses) | | Value,
end of
period | | % of
net
assets | Shares,
end
of period | Income
from
affiliated
securities |
Short-term
investments | | | | | | | | | | | | |
Investment
companies | | | | | | | | | | | | |
| Securities Lending Cash Investments LLC | $ 263,640 | $406,578,555 | $(400,804,860) | $0 | | $0 | | $ 6,037,335 | | | 6,037,335 | $ 7,767# |
| Wells Fargo Government Money Market Fund Select Class | 94,304,438 | 733,721,668 | (723,685,319) | 0 | | 0 | | 104,340,787 | | | 104,340,787 | 24,571 |
| | | | | $0 | | $0 | | $110,378,122 | | 5.79% | | $32,338 |
| # | Amount shown represents income before fees and rebates. |
The accompanying notes are an integral part of these financial statements.
30 | Wells Fargo Core Plus Bond Fund
Portfolio of investments—February 28, 2021 (unaudited)
Futures contracts
| Description | Number of
contracts | Expiration
date | Notional
cost | Notional
value | Unrealized
gains | | Unrealized
losses |
| Long | | | | | | | |
| 10-Year U.S. Treasury Notes | 339 | 6-21-2021 | $ 45,257,678 | $ 44,991,656 | $ 0 | | $ (266,022) |
| U.S. Long Term Bonds | 110 | 6-21-2021 | 17,670,172 | 17,514,063 | 0 | | (156,109) |
| U.S. Ultra Bond | 189 | 6-21-2021 | 35,969,933 | 35,732,813 | 0 | | (237,120) |
| 2-Year U.S. Treasury Notes | 1,122 | 6-30-2021 | 247,911,195 | 247,699,032 | 0 | | (212,163) |
| 5-Year U.S. Treasury Notes | 185 | 6-30-2021 | 23,125,288 | 22,934,219 | 0 | | (191,069) |
| Short | | | | | | | |
| Euro-BOBL Futures | (135) | 3-8-2021 | (21,994,043) | (21,860,706) | 133,337 | | 0 |
| Euro-Bund Futures | (230) | 3-8-2021 | (49,093,311) | (48,119,651) | 973,660 | | 0 |
| Euro-Schatz Futures | (67) | 3-8-2021 | (9,078,498) | (9,067,698) | 10,800 | | 0 |
| 10-Year Ultra Futures | (277) | 6-21-2021 | (41,034,482) | (40,814,219) | 220,263 | | 0 |
| | | | | | $1,338,060 | | $(1,062,483) |
Forward foreign currency contracts
Currency to be
received | Currency to be
delivered | Counterparty | Settlement
date | Unrealized
gains | | Unrealized
losses |
| 2,085,994,820 JPY | 20,177,105 USD | Citibank | 3-31-2021 | $ 0 | | $ (601,040) |
| 57,164,222 USD | 47,109,985 EUR | Citibank | 3-31-2021 | 284,813 | | 0 |
| 1,300,000 EUR | 1,576,066 USD | Citibank | 3-31-2021 | 0 | | (6,478) |
| 6,482,201 AUD | 5,000,000 USD | Citibank | 3-31-2021 | 0 | | (11,684) |
| 6,365,880 CAD | 5,000,000 USD | Citibank | 3-31-2021 | 2,682 | | 0 |
| 11,145,064 USD | 9,250,000 EUR | Citibank | 3-31-2021 | 0 | | (23,152) |
| 5,009,297 USD | 6,365,880 CAD | Citibank | 3-31-2021 | 6,615 | | 0 |
| 6,400,000 CAD | 4,136,291 EUR | Citibank | 3-31-2021 | 35,443 | | 0 |
| 6,500,000 AUD | 4,135,791 EUR | Citibank | 3-31-2021 | 8,563 | | 0 |
| 5,022,215 USD | 6,482,201 AUD | Citibank | 3-31-2021 | 33,899 | | 0 |
| 20,092,673 USD | 2,085,994,820 JPY | Citibank | 3-31-2021 | 516,608 | | 0 |
| 3,987,588 USD | 3,250,000 EUR | Citibank | 3-31-2021 | 63,619 | | 0 |
| | | | | $952,242 | | $(642,354) |
Centrally cleared credit default swap contracts
| Reference index | Fixed rate
received | Payment
frequency | Maturity
date | Notional
amount | Value | Premiums
paid
(received) | Unrealized
gains | Unrealized
losses |
| Sell Protection | | | | | | | | | |
| Markit iTraxx Europe Crossover | 5.00% | Quarterly | 12-20-2024 | EUR | 3,786,680 | $458,398 | $(37,112) | $495,510 | $0 |
The accompanying notes are an integral part of these financial statements.
Wells Fargo Core Plus Bond Fund | 31
Statement of assets and liabilities—February 28, 2021 (unaudited)
| | |
| Assets | |
Investments in unaffiliated securities (including $5,914,804 of securities loaned), at value (cost $1,903,766,109)
| $ 1,939,236,173 |
Investments in affiliated securites, at value (cost $110,378,122)
| 110,378,122 |
Cash due from broker
| 2,872,600 |
Cash at broker segregated for forward foreign currency contracts
| 500,010 |
Segregated cash for swap contracts
| 336,175 |
Receivable for investments sold
| 32,878,046 |
Receivable for Fund shares sold
| 14,912,645 |
Receivable for interest
| 9,814,767 |
Segregated cash for futures contracts
| 4,720,114 |
Unrealized gains on forward foreign currency contracts
| 952,242 |
Receivable for daily variation margin on open futures contracts
| 608,895 |
Foreign currency, at value (cost $48,839)
| 48,503 |
Receivable for securities lending income, net
| 3,289 |
Principal paydown receivable
| 40 |
Prepaid expenses and other assets
| 181,194 |
Total assets
| 2,117,442,815 |
| Liabilities | |
Payable for when-issued transactions
| 155,825,828 |
Payable for investments purchased
| 42,405,876 |
Payable upon receipt of securities loaned
| 6,037,335 |
Payable for Fund shares redeemed
| 4,665,957 |
Unrealized losses on forward foreign currency contracts
| 642,354 |
Overdraft due to custodian bank
| 468,610 |
Management fee payable
| 427,225 |
Administration fees payable
| 133,863 |
Distribution fee payable
| 20,734 |
Payable for daily variation margin on centrally cleared swaps
| 11,326 |
Trustees’ fees and expenses payable
| 2,064 |
Accrued expenses and other liabilities
| 115,041 |
Total liabilities
| 210,756,213 |
Total net assets
| $1,906,686,602 |
| Net assets consist of | |
Paid-in capital
| $ 1,866,831,828 |
Total distributable earnings
| 39,854,774 |
Total net assets
| $1,906,686,602 |
| Computation of net asset value and offering price per share | |
Net assets – Class A
| $ 283,868,710 |
Shares outstanding – Class A1
| 21,264,779 |
Net asset value per share – Class A
| $13.35 |
Maximum offering price per share – Class A2
| $13.98 |
Net assets – Class C
| $ 36,226,965 |
Shares outstanding – Class C1
| 2,716,048 |
Net asset value per share – Class C
| $13.34 |
Net assets – Class R6
| $ 79,033,412 |
Shares outstanding – Class R61
| 5,911,818 |
Net asset value per share – Class R6
| $13.37 |
Net assets – Administrator Class
| $ 109,744,432 |
Shares outstanding – Administrator Class1
| 8,237,111 |
Net asset value per share – Administrator Class
| $13.32 |
Net assets – Institutional Class
| $ 1,397,813,083 |
Shares outstanding – Institutional Class1
| 104,592,739 |
Net asset value per share – Institutional Class
| $13.36 |
| 1 | The Fund has an unlimited number of authorized shares |
The accompanying notes are an integral part of these financial statements.
32 | Wells Fargo Core Plus Bond Fund
Statement of assets and liabilities—February 28, 2021 (unaudited)
| 2 | Maximum offering price is computed as 100/95.50 of net asset value. On investments of $50,000 or more, the offering price is reduced. |
The accompanying notes are an integral part of these financial statements.
Wells Fargo Core Plus Bond Fund | 33
Statement of operations—six months ended February 28, 2021 (unaudited)
| | |
| Investment income | |
Interest
| $ 20,759,650 |
Dividends
| 1,320,407 |
Income from affiliated securities
| 58,153 |
Total investment income
| 22,138,210 |
| Expenses | |
Management fee
| 3,381,395 |
| Administration fees | |
Class A
| 211,837 |
Class C
| 25,541 |
Class R6
| 11,657 |
Administrator Class
| 48,165 |
Institutional Class
| 450,780 |
| Shareholder servicing fees | |
Class A
| 330,770 |
Class C
| 39,908 |
Administrator Class
| 120,412 |
| Distribution fee | |
Class C
| 119,723 |
Custody and accounting fees
| 29,528 |
Professional fees
| 39,917 |
Registration fees
| 61,417 |
Shareholder report expenses
| 38,378 |
Trustees’ fees and expenses
| 9,557 |
Other fees and expenses
| 17,347 |
Total expenses
| 4,936,332 |
| Less: Fee waivers and/or expense reimbursements | |
Fund-level
| (1,021,486) |
Class A
| (19,509) |
Class C
| (3) |
Administrator Class
| (23,585) |
Net expenses
| 3,871,749 |
Net investment income
| 18,266,461 |
| Realized and unrealized gains (losses) on investments | |
| Net realized gains (losses) on | |
Unaffiliated securities
| 10,244,082 |
Forward foreign currency contracts
| (2,787,010) |
Futures contracts
| (6,772,002) |
Swap contracts
| (22,829) |
Net realized gains on investments
| 662,241 |
| Net change in unrealized gains (losses) on | |
Unaffiliated securities
| (11,458,975) |
Forward foreign currency contracts
| 2,348,009 |
Futures contracts
| 1,374,436 |
Swap contracts
| 79,837 |
Net change in unrealized gains (losses) on investments
| (7,656,693) |
Net realized and unrealized gains (losses) on investments
| (6,994,452) |
Net increase in net assets resulting from operations
| $ 11,272,009 |
The accompanying notes are an integral part of these financial statements.
34 | Wells Fargo Core Plus Bond Fund
Statement of changes in net assets
| | |
| | Six months ended
February 28, 2021
(unaudited) | Year ended
August 31, 2020 |
| Operations | | | | |
Net investment income
| | $ 18,266,461 | | $ 30,099,430 |
Net realized gains on investments
| | 662,241 | | 48,260,799 |
Net change in unrealized gains (losses) on investments
| | (7,656,693) | | 13,371,709 |
Net increase in net assets resulting from operations
| | 11,272,009 | | 91,731,938 |
| Distributions to shareholders from | | | | |
| Net investment income and net realized gains | | | | |
Class A
| | (10,478,122) | | (8,171,769) |
Class C
| | (1,142,293) | | (549,882) |
Class R6
| | (3,180,266) | | (2,452,657) |
Administrator Class
| | (3,900,187) | | (2,263,862) |
Institutional Class
| | (47,337,523) | | (23,463,205) |
Total distributions to shareholders
| | (66,038,391) | | (36,901,375) |
| Capital share transactions | Shares | | Shares | |
| Proceeds from shares sold | | | | |
Class A
| 3,814,500 | 51,996,105 | 3,415,044 | 45,155,629 |
Class C
| 915,082 | 12,482,841 | 1,052,336 | 13,908,235 |
Class R6
| 1,243,512 | 16,963,304 | 1,642,751 | 21,915,029 |
Administrator Class
| 3,016,961 | 41,062,549 | 2,516,024 | 33,041,254 |
Institutional Class
| 52,490,998 | 717,353,656 | 45,235,915 | 595,518,013 |
| | | 839,858,455 | | 709,538,160 |
| Reinvestment of distributions | | | | |
Class A
| 718,850 | 9,743,570 | 579,700 | 7,576,693 |
Class C
| 78,654 | 1,064,770 | 37,616 | 492,207 |
Class R6
| 191,357 | 2,598,388 | 151,605 | 1,988,286 |
Administrator Class
| 287,964 | 3,894,480 | 173,041 | 2,259,572 |
Institutional Class
| 3,184,568 | 43,214,802 | 1,533,691 | 20,105,074 |
| | | 60,516,010 | | 32,421,832 |
| Payment for shares redeemed | | | | |
Class A
| (2,461,417) | (33,599,418) | (3,579,677) | (46,707,885) |
Class C
| (336,647) | (4,600,321) | (420,883) | (5,548,980) |
Class R6
| (1,558,811) | (21,324,453) | (526,084) | (6,893,021) |
Administrator Class
| (893,803) | (12,183,628) | (1,247,359) | (16,107,146) |
Institutional Class
| (11,723,476) | (159,443,154) | (26,157,510) | (337,958,968) |
| | | (231,150,974) | | (413,216,000) |
Net increase in net assets resulting from capital share transactions
| | 669,223,491 | | 328,743,992 |
Total increase in net assets
| | 614,457,109 | | 383,574,555 |
| Net assets | | | | |
Beginning of period
| | 1,292,229,493 | | 908,654,938 |
End of period
| | $1,906,686,602 | | $1,292,229,493 |
The accompanying notes are an integral part of these financial statements.
Wells Fargo Core Plus Bond Fund | 35
Financial highlights
(For a share outstanding throughout each period)
| | | Year ended August 31 |
| Class A | Six months ended
February 28, 2021
(unaudited) | 2020 | 2019 | 2018 | 2017 | 2016 |
Net asset value, beginning of period
| $13.77 | $13.09 | $12.27 | $12.71 | $12.70 | $12.14 |
Net investment income
| 0.13 | 0.34 | 0.37 | 0.34 | 0.36 1 | 0.33 |
Net realized and unrealized gains (losses) on investments
| (0.01) | 0.77 | 0.80 | (0.45) | (0.01) | 0.60 |
Total from investment operations
| 0.12 | 1.11 | 1.17 | (0.11) | 0.35 | 0.93 |
| Distributions to shareholders from | | | | | | |
Net investment income
| (0.16) | (0.36) | (0.35) | (0.33) | (0.33) | (0.33) |
Net realized gains
| (0.38) | (0.07) | 0.00 | 0.00 | (0.01) | (0.04) |
Total distributions to shareholders
| (0.54) | (0.43) | (0.35) | (0.33) | (0.34) | (0.37) |
Net asset value, end of period
| $13.35 | $13.77 | $13.09 | $12.27 | $12.71 | $12.70 |
Total return2
| 0.86% | 8.72% | 9.74% | (0.84)% | 2.78% | 7.78% |
| Ratios to average net assets (annualized) | | | | | | |
Gross expenses
| 0.86% | 0.88% | 0.91% | 0.92% | 0.93% | 0.93% |
Net expenses
| 0.72% | 0.72% | 0.73% | 0.73% | 0.76% | 0.84% |
Net investment income
| 2.08% | 2.60% | 2.99% | 2.63% | 2.88% | 2.76% |
| Supplemental data | | | | | | |
Portfolio turnover rate
| 86% | 130% | 89% | 148% | 199% | 288% |
Net assets, end of period (000s omitted)
| $283,869 | $264,366 | $245,879 | $229,688 | $255,668 | $349,852 |
| 1 | Calculated based upon average shares outstanding |
| 2 | Total return calculations do not include any sales charges. Returns for periods of less than one year are not annualized. |
The accompanying notes are an integral part of these financial statements.
36 | Wells Fargo Core Plus Bond Fund
Financial highlights
(For a share outstanding throughout each period)
| | | Year ended August 31 |
| Class C | Six months ended
February 28, 2021
(unaudited) | 2020 | 2019 | 2018 | 2017 | 2016 |
Net asset value, beginning of period
| $13.77 | $13.09 | $12.26 | $12.71 | $12.70 | $12.14 |
Net investment income
| 0.08 | 0.23 | 0.28 | 0.23 | 0.26 | 0.24 1 |
Net realized and unrealized gains (losses) on investments
| (0.02) | 0.78 | 0.81 | (0.44) | (0.01) | 0.59 |
Total from investment operations
| 0.06 | 1.01 | 1.09 | (0.21) | 0.25 | 0.83 |
| Distributions to shareholders from | | | | | | |
Net investment income
| (0.11) | (0.26) | (0.26) | (0.24) | (0.23) | (0.23) |
Net realized gains
| (0.38) | (0.07) | 0.00 | 0.00 | (0.01) | (0.04) |
Total distributions to shareholders
| (0.49) | (0.33) | (0.26) | (0.24) | (0.24) | (0.27) |
Net asset value, end of period
| $13.34 | $13.77 | $13.09 | $12.26 | $12.71 | $12.70 |
Total return2
| 0.42% | 7.85% | 8.91% | (1.66)% | 2.01% | 6.99% |
| Ratios to average net assets (annualized) | | | | | | |
Gross expenses
| 1.61% | 1.63% | 1.66% | 1.67% | 1.68% | 1.68% |
Net expenses
| 1.48% | 1.48% | 1.48% | 1.48% | 1.51% | 1.59% |
Net investment income
| 1.30% | 1.85% | 2.25% | 1.89% | 2.12% | 2.00% |
| Supplemental data | | | | | | |
Portfolio turnover rate
| 86% | 130% | 89% | 148% | 199% | 288% |
Net assets, end of period (000s omitted)
| $36,227 | $28,342 | $18,195 | $20,550 | $19,036 | $21,216 |
| 1 | Calculated based upon average shares outstanding |
| 2 | Total return calculations do not include any sales charges. Returns for periods of less than one year are not annualized. |
The accompanying notes are an integral part of these financial statements.
Wells Fargo Core Plus Bond Fund | 37
Financial highlights
(For a share outstanding throughout each period)
| | | Year ended August 31 |
| Class R6 | Six months ended
February 28, 2021
(unaudited) | 2020 | 2019 | 2018 | 2017 1 |
Net asset value, beginning of period
| $13.79 | $13.11 | $12.28 | $12.73 | $12.59 |
Net investment income
| 0.17 | 0.39 2 | 0.41 | 0.39 | 0.33 2 |
Net realized and unrealized gains (losses) on investments
| (0.03) | 0.77 | 0.82 | (0.46) | 0.12 |
Total from investment operations
| 0.14 | 1.16 | 1.23 | (0.07) | 0.45 |
| Distributions to shareholders from | | | | | |
Net investment income
| (0.18) | (0.41) | (0.40) | (0.38) | (0.30) |
Net realized gains
| (0.38) | (0.07) | 0.00 | 0.00 | (0.01) |
Total distributions to shareholders
| (0.56) | (0.48) | (0.40) | (0.38) | (0.31) |
Net asset value, end of period
| $13.37 | $13.79 | $13.11 | $12.28 | $12.73 |
Total return3
| 1.04% | 9.10% | 10.14% | (0.55)% | 3.64% |
| Ratios to average net assets (annualized) | | | | | |
Gross expenses
| 0.48% | 0.50% | 0.53% | 0.54% | 0.55% |
Net expenses
| 0.35% | 0.35% | 0.35% | 0.35% | 0.35% |
Net investment income
| 2.45% | 2.98% | 3.36% | 3.05% | 3.12% |
| Supplemental data | | | | | |
Portfolio turnover rate
| 86% | 130% | 89% | 148% | 199% |
Net assets, end of period (000s omitted)
| $79,033 | $83,260 | $62,522 | $45,159 | $31,451 |
| 1 | For the period from October 31, 2016 (commencement of class operations) to August 31, 2017 |
| 2 | Calculated based upon average shares outstanding |
| 3 | Returns for periods of less than one year are not annualized. |
The accompanying notes are an integral part of these financial statements.
38 | Wells Fargo Core Plus Bond Fund
Financial highlights
(For a share outstanding throughout each period)
| | | Year ended August 31 |
| Administrator Class | Six months ended
February 28, 2021
(unaudited) | 2020 | 2019 | 2018 | 2017 | 2016 |
Net asset value, beginning of period
| $13.75 | $13.07 | $12.25 | $12.69 | $12.68 | $12.12 |
Net investment income
| 0.14 | 0.35 | 0.38 | 0.35 | 0.37 | 0.34 |
Net realized and unrealized gains (losses) on investments
| (0.03) | 0.77 | 0.81 | (0.44) | (0.01) | 0.60 |
Total from investment operations
| 0.11 | 1.12 | 1.19 | (0.09) | 0.36 | 0.94 |
| Distributions to shareholders from | | | | | | |
Net investment income
| (0.16) | (0.37) | (0.37) | (0.35) | (0.34) | (0.34) |
Net realized gains
| (0.38) | (0.07) | 0.00 | 0.00 | (0.01) | (0.04) |
Total distributions to shareholders
| (0.54) | (0.44) | (0.37) | (0.35) | (0.35) | (0.38) |
Net asset value, end of period
| $13.32 | $13.75 | $13.07 | $12.25 | $12.69 | $12.68 |
Total return1
| 0.83% | 8.85% | 9.88% | (0.74)% | 2.90% | 7.92% |
| Ratios to average net assets (annualized) | | | | | | |
Gross expenses
| 0.80% | 0.82% | 0.85% | 0.86% | 0.87% | 0.87% |
Net expenses
| 0.62% | 0.62% | 0.62% | 0.62% | 0.66% | 0.72% |
Net investment income
| 2.15% | 2.71% | 3.07% | 2.74% | 2.97% | 2.84% |
| Supplemental data | | | | | | |
Portfolio turnover rate
| 86% | 130% | 89% | 148% | 199% | 288% |
Net assets, end of period (000s omitted)
| $109,744 | $80,099 | $57,316 | $32,241 | $41,806 | $71,133 |
| 1 | Returns for periods of less than one year are not annualized. |
The accompanying notes are an integral part of these financial statements.
Wells Fargo Core Plus Bond Fund | 39
Financial highlights
(For a share outstanding throughout each period)
| | | Year ended August 31 |
| Institutional Class | Six months ended
February 28, 2021
(unaudited) | 2020 | 2019 | 2018 | 2017 | 2016 |
Net asset value, beginning of period
| $13.79 | $13.11 | $12.28 | $12.72 | $12.71 | $12.15 |
Net investment income
| 0.18 | 0.38 | 0.39 | 0.37 1 | 0.38 | 0.36 |
Net realized and unrealized gains (losses) on investments
| (0.05) | 0.77 | 0.83 | (0.44) | 0.01 | 0.60 |
Total from investment operations
| 0.13 | 1.15 | 1.22 | (0.07) | 0.39 | 0.96 |
| Distributions to shareholders from | | | | | | |
Net investment income
| (0.18) | (0.40) | (0.39) | (0.37) | (0.37) | (0.36) |
Net realized gains
| (0.38) | (0.07) | 0.00 | 0.00 | (0.01) | (0.04) |
Total distributions to shareholders
| (0.56) | (0.47) | (0.39) | (0.37) | (0.38) | (0.40) |
Net asset value, end of period
| $13.36 | $13.79 | $13.11 | $12.28 | $12.72 | $12.71 |
Total return2
| 0.94% | 9.05% | 10.17% | (0.52)% | 3.10% | 8.05% |
| Ratios to average net assets (annualized) | | | | | | |
Gross expenses
| 0.53% | 0.55% | 0.58% | 0.59% | 0.60% | 0.60% |
Net expenses
| 0.40% | 0.40% | 0.40% | 0.40% | 0.44% | 0.58% |
Net investment income
| 2.36% | 2.92% | 3.29% | 3.00% | 3.17% | 3.04% |
| Supplemental data | | | | | | |
Portfolio turnover rate
| 86% | 130% | 89% | 148% | 199% | 288% |
Net assets, end of period (000s omitted)
| $1,397,813 | $836,162 | $524,743 | $264,292 | $163,387 | $79,687 |
| 1 | Calculated based upon average shares outstanding |
| 2 | Returns for periods of less than one year are not annualized. |
The accompanying notes are an integral part of these financial statements.
40 | Wells Fargo Core Plus Bond Fund
Notes to financial statements (unaudited)
1. ORGANIZATION
Wells Fargo Funds Trust (the “Trust”), a Delaware statutory trust organized on March 10, 1999, is an open-end management investment company registered under the Investment Company Act of 1940, as amended (the “1940 Act”). As an investment company, the Trust follows the accounting and reporting guidance in Financial Accounting Standards Board (“FASB”) Accounting Standards Codification Topic 946, Financial Services – Investment Companies. These financial statements report on the Wells Fargo Core Plus Bond Fund (the “Fund”) which is a diversified series of the Trust.
On February 23, 2021, Wells Fargo & Company announced that it has entered into a definitive agreement to sell Wells Fargo Asset Management (“WFAM”) to GTCR LLC and Reverence Capital Partners, L.P. WFAM is the trade name used by the asset management businesses of Wells Fargo & Company and includes Wells Fargo Funds Management, LLC, the investment manager to the Fund, Wells Capital Management Incorporated and Wells Fargo Asset Management (International) Limited, both registered investment advisers providing sub-advisory services to certain funds, and Wells Fargo Funds Distributor, LLC, the Fund's principal underwriter. As part of the transaction, Wells Fargo & Company will own a 9.9% equity interest and will continue to serve as an important client and distribution partner. The transaction is expected to close in the second half of 2021, subject to customary closing conditions.
Consummation of the transaction will result in the automatic termination of the Fund's investment management agreement and sub-advisory agreement. The Fund's Board of Trustees will be asked to approve new investment management arrangements with the new company. If approved by the Board, the new investment management arrangements with the new company will be presented to the shareholders of the Fund for approval, and, if approved by shareholders, would take effect upon the closing of the transaction. The transaction is expected to close in the second half of 2021, subject to customary closing conditions.
2. SIGNIFICANT ACCOUNTING POLICIES
The following significant accounting policies, which are consistently followed in the preparation of the financial statements of the Fund, are in conformity with U.S. generally accepted accounting principles which require management to make estimates and assumptions that affect the reported amounts of assets and liabilities, disclosure of contingent assets and liabilities at the date of the financial statements, and the reported amounts of income and expenses during the reporting period. Actual results could differ from those estimates.
Securities valuation
All investments are valued each business day as of the close of regular trading on the New York Stock Exchange (generally 4 p.m. Eastern Time), although the Fund may deviate from this calculation time under unusual or unexpected circumstances.
Debt securities are valued at the evaluated bid price provided by an independent pricing service (e.g. taking into account various factors, including yields, maturities, or credit ratings) or, if a reliable price is not available, the quoted bid price from an independent broker-dealer.
Equity securities and futures contracts that are listed on a foreign or domestic exchange or market are valued at the official closing price or, if none, the last sales price. If no sale occurs on the principal exchange or market that day, a fair value price will be determined in accordance with the Fund’s Valuation Procedures.
The values of securities denominated in foreign currencies are translated into U.S. dollars at rates provided by an independent foreign currency pricing source at a time each business day specified by the Wells Fargo Asset Management Pricing Committee at Wells Fargo Funds Management, LLC (“Funds Management”).
Forward foreign currency contracts are recorded at the forward rate provided by an independent foreign currency pricing source at a time each business day specified by the Wells Fargo Asset Management Pricing Committee.
Swap contracts are valued at the evaluated price provided by an independent pricing service or, if a reliable price is not available, the quoted bid price from an independent broker-dealer.
Investments in registered open-end investment companies are valued at net asset value. Interests in non-registered investment companies that are redeemable at net asset value are fair valued normally at net asset value.
Investments which are not valued using any of the methods discussed above are valued at their fair value, as determined in good faith by the Board of Trustees. The Board of Trustees has established a Valuation Committee comprised of the Trustees and has delegated to it the authority to take any actions regarding the valuation of portfolio securities that the Valuation Committee deems necessary or appropriate, including determining the fair value of portfolio securities, unless the determination has been delegated to the Wells Fargo Asset Management Pricing Committee. The Board of Trustees retains the
Wells Fargo Core Plus Bond Fund | 41
Notes to financial statements (unaudited)
authority to make or ratify any valuation decisions or approve any changes to the Valuation Procedures as it deems appropriate. On a quarterly basis, the Board of Trustees receives reports on any valuation actions taken by the Valuation Committee or the Wells Fargo Asset Management Pricing Committee which may include items for ratification.
Foreign currency translation
The accounting records of the Fund are maintained in U.S. dollars. The values of other assets and liabilities denominated in foreign currencies are translated into U.S. dollars at rates provided by an independent foreign currency pricing source at a time each business day specified by the Wells Fargo Asset Management Pricing Committee. Purchases and sales of securities, and income and expenses are converted at the rate of exchange on the respective dates of such transactions. Net realized foreign exchange gains or losses arise from sales of foreign currencies, currency gains or losses realized between the trade and settlement dates on securities transactions, and the difference between the amounts of dividends, interest and foreign withholding taxes recorded and the U.S. dollar equivalent of the amounts actually paid or received. Net unrealized foreign exchange gains and losses arise from changes in the fair value of assets and liabilities other than investments in securities resulting from changes in exchange rates. The changes in net assets arising from changes in exchange rates of securities and the changes in net assets resulting from changes in market prices of securities are not separately presented. Such changes are included in net realized and unrealized gains or losses from investments.
Securities lending
The Fund may lend its securities from time to time in order to earn additional income in the form of fees or interest on securities received as collateral or the investment of any cash received as collateral. When securities are on loan, the Fund receives interest or dividends on those securities. Cash collateral received in connection with its securities lending transactions is invested in Securities Lending Cash Investments, LLC (the “Securities Lending Fund”). Investments in Securities Lending Fund are valued at the evaluated bid price provided by an independent pricing service. Income earned from investment in the Securities Lending Fund (net of fees and rebates), if any, is included in income from affiliated securities on the Statement of Operations.
In a securities lending transaction, the net asset value of the Fund is affected by an increase or decrease in the value of the securities loaned and by an increase or decrease in the value of the instrument in which collateral is invested. The amount of securities lending activity undertaken by the Fund fluctuates from time to time. The Fund has the right under the lending agreement to recover the securities from the borrower on demand. In the event of default or bankruptcy by the borrower, the Fund may be prevented from recovering the loaned securities or gaining access to the collateral or may experience delays or costs in doing so. In such an event, the terms of the agreement allow the unaffiliated securities lending agent to use the collateral to purchase replacement securities on behalf of the Fund or pay the Fund the market value of the loaned securities. The Fund bears the risk of loss with respect to depreciation of its investment of the cash collateral.
When-issued transactions
The Fund may purchase securities on a forward commitment or when-issued basis. The Fund records a when-issued transaction on the trade date and will segregate assets in an amount at least equal in value to the Fund's commitment to purchase when-issued securities. Securities purchased on a when-issued basis are marked-to-market daily and the Fund begins earning interest on the settlement date. Losses may arise due to changes in the market value of the underlying securities or if the counterparty does not perform under the contract.
Loans
The Fund may invest in direct debt instruments which are interests in amounts owed to lenders by corporate or other borrowers. The loans pay interest at rates which are periodically reset by reference to a base lending rate plus a spread. Investments in loans may be in the form of participations in loans or assignments of all or a portion of loans from third parties. When the Fund purchases participations, it generally has no rights to enforce compliance with the terms of the loan agreement with the borrower. As a result, the Fund assumes the credit risk of both the borrower and the lender that is selling the participation. When the Fund purchases assignments from lenders, it acquires direct rights against the borrower on the loan and may enforce compliance by the borrower with the terms of the loan agreement. Loans may include fully funded term loans or unfunded loan commitments, which are contractual obligations for future funding.
Forward foreign currency contracts
A forward foreign currency contract is an agreement between two parties to purchase or sell a specific currency for an agreed-upon price at a future date. The Fund enters into forward foreign currency contracts to facilitate transactions in foreign-denominated securities and to attempt to minimize the risk to the Fund from adverse changes in the relationship between currencies. Forward foreign currency contracts are recorded at the forward rate and marked-to-market daily. When the contracts are closed, realized gains and losses arising from such transactions are recorded as realized gains or losses on forward
42 | Wells Fargo Core Plus Bond Fund
Notes to financial statements (unaudited)
foreign currency contracts. The Fund is subject to foreign currency risk and may be exposed to risks if the counterparties to the contracts are unable to meet the terms of their contracts or if the value of the foreign currency changes unfavorably. The Fund's maximum risk of loss from counterparty credit risk is the unrealized gains on the contracts. This risk may be mitigated if there is a master netting arrangement between the Fund and the counterparty.
Futures contracts
Futures contracts are agreements between the Fund and a counterparty to buy or sell a specific amount of a commodity, financial instrument or currency at a specified price on a specified date. The Fund may buy and sell futures contracts in order to gain exposure to, or protect against, changes in interest rates and is subject to interest rate risk. The primary risks associated with the use of futures contracts are the imperfect correlation between changes in market values of securities held by the Fund and the prices of futures contracts, and the possibility of an illiquid market. Futures contracts are generally entered into on a regulated futures exchange and cleared through a clearinghouse associated with the exchange. With futures contracts, there is minimal counterparty risk to the Fund since futures contracts are exchange traded and the exchange’s clearinghouse, as the counterparty to all exchange traded futures, guarantees the futures contracts against default.
Upon entering into a futures contract, the Fund is required to deposit either cash or securities (initial margin) with the broker in an amount equal to a certain percentage of the contract value. Subsequent payments (variation margin) are paid to or from the broker each day equal to the daily changes in the contract value. Such payments are recorded as unrealized gains or losses and, if any, shown as variation margin receivable (payable) in the Statement of Assets and Liabilities. Should the Fund fail to make requested variation margin payments, the broker can gain access to the initial margin to satisfy the Fund’s payment obligations. When the contracts are closed, a realized gain or loss is recorded in the Statement of Operations.
Swap contracts
Swap contracts are agreements between the Fund and a counterparty to exchange a series of cash flows over a specified period. Swap agreements are privately negotiated contracts between the Fund that are entered into as bilateral contracts in the OTC market (“OTC swaps”) or centrally cleared (“centrally cleared swaps”) with a central clearinghouse.
The Fund entered into centrally cleared swaps. In a centrally cleared swap, immediately following execution of the swap contract, the swap contract is novated to a central counterparty (the “CCP”) and the Fund’s counterparty on the swap agreement becomes the CCP. Upon entering into a centrally cleared swap, the Fund is required to deposit an initial margin with the broker in the form of cash or securities. Securities deposited as initial margin are designated in the Portfolio of Investments and cash deposited is shown as cash segregated for centrally cleared swaps in the Statement of Assets and Liabilities. Pursuant to the contract, the Fund agrees to receive from or pay to the broker an amount of cash equal to the daily fluctuation in market value of the contract (“variation margin”). The variation margin is recorded as an unrealized gain (or loss) and shown as variation margin receivable (or payable) on centrally cleared swaps in the Statement of Assets and Liabilities. Payments received from (paid to) the counterparty, including at termination, are recorded as realized gains (losses) in the Statement of Operations.
Credit default swaps
The Fund may enter into credit default swaps for hedging or speculative purposes to provide or receive a measure of protection against default on a referenced entity, obligation or index or a basket of single-name issuers or traded indexes. An index credit default swap references all the names in the index, and if a credit event is triggered, the credit event is settled based on that name’s weight in the index. Credit default swaps are agreements in which the protection buyer pays fixed periodic payments to the protection seller in consideration for a promise from the protection seller to make a specific payment should a negative credit event take place with respect to the referenced entity (e.g., bankruptcy, failure to pay, obligation acceleration, repudiation, moratorium or restructuring).
The Fund may enter into credit default swaps as either the seller of protection or the buyer of protection. If the Fund is the buyer of protection and a credit event occurs, the [Fund/Portfolio] will either receive from the seller an amount equal to the notional amount of the swap and deliver the referenced security or underlying securities comprising the index, or receive a net settlement of cash equal to the notional amount of the swap less the recovery value of the security or underlying securities comprising the index. If the Fund is the seller of protection and a credit event occurs, the Fund will either pay the buyer an amount equal to the notional amount of the swap and take delivery of the referenced security or underlying securities comprising the index or pay a net settlement of cash equal to the notional amount of the swap less the recovery value of the security or underlying securities comprising the index.
As the seller of protection, the FundFund is subject to investment exposure on the notional amount of the swap and has assumed the risk of default of the underlying security or index. As the buyer of protection, the [Fund/Portfolio] could be exposed to risks if the seller of the protection defaults on its obligation to perform, or if there are unfavorable changes in the fluctuation of interest rates.
Wells Fargo Core Plus Bond Fund | 43
Notes to financial statements (unaudited)
By entering into credit default swap contracts, the Fund is exposed to credit risk. In addition, certain credit default swap contracts entered into by the Fund provide for conditions that result in events of default or termination that enable the counterparty to the agreement to cause an early termination of the transactions under those agreements.
Security transactions and income recognition
Securities transactions are recorded on a trade date basis. Realized gains or losses are recorded on the basis of identified cost.
Interest income is accrued daily and bond discounts are accreted and premiums are amortized daily. To the extent debt obligations are placed on non-accrual status, any related interest income may be reduced by writing off interest receivables when the collection of all or a portion of interest has been determined to be doubtful based on consistently applied procedures and the fair value has decreased. If the issuer subsequently resumes interest payments or when the collectability of interest is reasonably assured, the debt obligation is removed from non-accrual status.
Dividend income is recognized on the ex-dividend date.
Income dividends and capital gain distributions from investment companies are recorded on the ex-dividend date. Capital gain distributions from investment companies are treated as realized gains.
Distributions to shareholders
Distributions to shareholders are recorded on the ex-dividend date and paid from net investment income monthly and any net realized gains are paid at least annually. Such distributions are determined in accordance with income tax regulations and may differ from U.S. generally accepted accounting principles. Dividend sources are estimated at the time of declaration. The tax character of distributions is determined as of the Fund’s fiscal year end. Therefore, a portion of the Fund’s distributions made prior to the Fund’s fiscal year end may be categorized as a tax return of capital at year end.
Federal and other taxes
The Fund intends to continue to qualify as a regulated investment company by distributing substantially all of its investment company taxable income and any net realized capital gains (after reduction for capital loss carryforwards) sufficient to relieve it from all, or substantially all, federal income taxes. Accordingly, no provision for federal income taxes was required.
The Fund’s income and federal excise tax returns and all financial records supporting those returns for the prior three fiscal years are subject to examination by the federal and Delaware revenue authorities. Management has analyzed the Fund's tax positions taken on federal, state, and foreign tax returns for all open tax years and does not believe that there are any uncertain tax positions that require recognition of a tax liability.
As of February 28, 2021, the aggregate cost of all investments for federal income tax purposes was $2,011,297,826 and the unrealized gains (losses) consisted of:
| Gross unrealized gains | $ 59,871,044 |
| Gross unrealized losses | (20,473,600) |
| Net unrealized gains | $ 39,397,444 |
Class allocations
The separate classes of shares offered by the Fund differ principally in applicable sales charges, distribution, shareholder servicing, and administration fees. Class specific expenses are charged directly to that share class. Investment income, common fund-level expenses, and realized and unrealized gains (losses) on investments are allocated daily to each class of shares based on the relative proportion of net assets of each class.
44 | Wells Fargo Core Plus Bond Fund
Notes to financial statements (unaudited)
3. FAIR VALUATION MEASUREMENTS
Fair value measurements of investments are determined within a framework that has established a fair value hierarchy based upon the various data inputs utilized in determining the value of the Fund’s investments. The three-level hierarchy gives the highest priority to unadjusted quoted prices in active markets for identical assets or liabilities (Level 1) and the lowest priority to unobservable inputs (Level 3). The Fund’s investments are classified within the fair value hierarchy based on the lowest level of input that is significant to the fair value measurement. The inputs are summarized into three broad levels as follows:
| ■ | Level 1 – quoted prices in active markets for identical securities |
| ■ | Level 2 – other significant observable inputs (including quoted prices for similar securities, interest rates, prepayment speeds, credit risk, etc.) |
| ■ | Level 3 – significant unobservable inputs (including the Fund’s own assumptions in determining the fair value of investments) |
The inputs or methodologies used for valuing investments in securities are not necessarily an indication of the risk associated with investing in those securities.
The following is a summary of the inputs used in valuing the Fund’s assets and liabilities as of February 28, 2021:
| | Quoted prices
(Level 1) | Other significant
observable inputs
(Level 2) | Significant
unobservable inputs
(Level 3) | Total |
| Assets | | | | |
| Investments in: | | | | |
| Agency securities | $ 0 | $ 289,214,197 | $ 0 | $ 289,214,197 |
| Asset-backed securities | 0 | 154,900,938 | 0 | 154,900,938 |
| Common stocks | | | | |
| Energy | 2,619,486 | 0 | 0 | 2,619,486 |
| Corporate bonds and notes | 0 | 479,220,767 | 0 | 479,220,767 |
| Exchange-traded funds | 18,979,292 | 0 | 0 | 18,979,292 |
| Foreign corporate bonds and notes | 0 | 52,749,133 | 0 | 52,749,133 |
| Foreign government bonds | 0 | 30,436,745 | 0 | 30,436,745 |
| Loans | 0 | 7,607,115 | 1,882,603 | 9,489,718 |
| Municipal obligations | 0 | 16,692,477 | 0 | 16,692,477 |
| Non-agency mortgage-backed securities | 0 | 249,433,019 | 0 | 249,433,019 |
| U.S. Treasury securities | 211,216,733 | 0 | 0 | 211,216,733 |
| Yankee corporate bonds and notes | 0 | 242,936,815 | 0 | 242,936,815 |
| Yankee government bonds | 0 | 16,364,665 | 0 | 16,364,665 |
| Short-term investments | | | | |
| Commercial paper | 0 | 29,991,701 | 0 | 29,991,701 |
| Investment companies | 110,378,122 | 0 | 0 | 110,378,122 |
| U.S. Treasury securities | 0 | 134,990,487 | 0 | 134,990,487 |
| | 343,193,633 | 1,704,538,059 | 1,882,603 | 2,049,614,295 |
| Futures contracts | 1,338,060 | 0 | 0 | 1,338,060 |
| Forward foreign currency contracts | 0 | 952,242 | 0 | 952,242 |
| Swap | 0 | 495,510 | 0 | 495,510 |
| Total assets | $344,531,693 | $1,705,985,811 | $1,882,603 | $2,052,400,107 |
| Liabilities | | | | |
| Forward foreign currency contracts | $ 0 | $ 642,354 | $ 0 | $ 642,354 |
| Futures contracts | 1,062,483 | 0 | 0 | 1,062,483 |
| Total liabilities | $ 1,062,483 | $ 642,354 | $ 0 | $ 1,704,837 |
Futures contracts, forward foreign currency contracts and swap contracts are reported at their cumulative unrealized gains (losses) at measurement date as reported in the tables following the Portfolio of Investments. For futures contracts and centrally cleared swap contracts, the current day’s variation margin is reported on the Statement of Assets and Liabilities. All other assets and liabilities are reported at their market value at measurement date.
Wells Fargo Core Plus Bond Fund | 45
Notes to financial statements (unaudited)
Additional sector, industry or geographic detail, if any, is included in the Portfolio of Investments.
For the six months ended February 28, 2021, the Fund did not have any transfers into/out of Level 3.
4. TRANSACTIONS WITH AFFILIATES
Management fee
Funds Management, an indirect wholly owned subsidiary of Wells Fargo & Company (“Wells Fargo”), is the manager of the Fund and provides advisory and fund-level administrative services under an investment management agreement. Under the investment management agreement, Funds Management is responsible for, among other services, implementing the investment objectives and strategies of the Fund, supervising the subadviser and providing fund-level administrative services in connection with the Fund’s operations. As compensation for its services under the investment management agreement, Funds Management is entitled to receive a management fee at the following annual rate based on the Fund’s average daily net assets:
| Average daily net assets | Management fee |
| First $500 million | 0.450% |
| Next $500 million | 0.425 |
| Next $2 billion | 0.400 |
| Next $2 billion | 0.375 |
| Next $5 billion | 0.340 |
| Over $10 billion | 0.320 |
For the six months ended February 28, 2021, the management fee was equivalent to an annual rate of 0.42% of the Fund’s average daily net assets.
Funds Management has retained the services of a subadviser to provide daily portfolio management to the Fund. The fee for subadvisory services is borne by Funds Management. Wells Capital Management Incorporated ("WellsCap"), an affiliate of Funds Management and an indirect wholly owned subsidiary of Wells Fargo, is the subadviser to the Fund and is entitled to receive a fee from Funds Management at an annual rate starting at 0.20% and declining to 0.10% as the average daily net assets of the Fund increase.
Administration fees
Under a class-level administration agreement, Funds Management provides class-level administrative services to the Fund, which includes paying fees and expenses for services provided by the transfer agent, sub-transfer agents, omnibus account servicers and record-keepers. As compensation for its services under the class-level administration agreement, Funds Management receives an annual fee which is calculated based on the average daily net assets of each class as follows:
| | Class-level
administration fee |
| Class A | 0.16% |
| Class C | 0.16 |
| Class R6 | 0.03 |
| Administrator Class | 0.10 |
| Institutional Class | 0.08 |
Waivers and/or expense reimbursements
Funds Management has contractually waived and/or reimbursed management and administration fees to the extent necessary to maintain certain net operating expense ratios for the Fund. When each class of the Fund has exceeded its expense cap, Funds Management has waived fees and/or reimbursed expenses from fund-level expenses on a proportionate basis and then from class specific expenses. When only certain classes exceed their expense caps, waivers and/or reimbursements are applied against class specific expenses before fund-level expenses. Funds Management has committed through December 31, 2021 to waive fees and/or reimburse expenses to the extent necessary to cap expenses. Prior to or after the commitment expiration
46 | Wells Fargo Core Plus Bond Fund
Notes to financial statements (unaudited)
date, the cap may be increased or the commitment to maintain the cap may be terminated only with the approval of the Board of Trustees. The contractual expense caps are as follows:
| | Expense ratio caps |
| Class A | 0.73% |
| Class C | 1.48 |
| Class R6 | 0.35 |
| Administrator Class | 0.62 |
| Institutional Class | 0.40 |
Distribution fee
The Trust has adopted a distribution plan for Class C shares of the Fund pursuant to Rule 12b-1 under the 1940 Act. A distribution fee is charged charged to Class C shares and paid to Wells Fargo Funds Distributor, LLC (“Funds Distributor”), the principal underwriter, at an annual rate of 0.75% of the average daily net assets of Class C shares.
In addition, Funds Distributor is entitled to receive the front-end sales charge from the purchase of Class A shares and a contingent deferred sales charge on the redemption of certain Class A shares. Funds Distributor is also entitled to receive the contingent deferred sales charges from redemptions of Class C shares. For the six months ended February 28, 2021, Funds Distributor received $17,342 from the sale of Class A shares and $568 in contingent deferred sales charges from redemptions of Class C shares. Funds Distributor did not receive any contingent deferred sales charges from Class A for the six months ended February 28, 2021.
Shareholder servicing fees
The Trust has entered into contracts with one or more shareholder servicing agents, whereby Class A, Class C, and Administrator Class of the Fund are charged a fee at an annual rate of 0.25% of the average daily net assets of each respective class. A portion of these total shareholder servicing fees were paid to affiliates of Wells Fargo.
Interfund transactions
The Fund may purchase or sell portfolio investment securities to certain other Wells Fargo affiliates pursuant to Rule 17a-7 under the 1940 Act and under procedures adopted by the Board of Trustees. The procedures have been designed to ensure that these interfund transactions, which do not incur broker commissions, are effected at current market prices.
5. INVESTMENT PORTFOLIO TRANSACTIONS
Purchases and sales of investments, excluding short-term securities, for the six months ended February 28, 2021 were as follows:
| Purchases at cost | | Sales proceeds |
U.S.
government | Non-U.S.
government | | U.S.
government | Non-U.S.
government |
| $1,220,404,276 | $710,480,637 | | $970,811,731 | $306,259,610 |
6. SECURITIES LENDING TRANSACTIONS
The Fund lends its securities through an unaffiliated securities lending agent and receives collateral in the form of cash or securities with a value at least equal to the value of the securities on loan. The value of the loaned securities is determined at the close of each business day and any increases or decreases in the required collateral are exchanged between the Fund and the counterparty on the next business day. Cash collateral received is invested in the Securities Lending Fund which seeks to provide a positive return compared to the daily Federal Funds Open Rate by investing in high-quality, U.S. dollar-denominated short-term money market instruments and is exempt from registration under Section 3(c)(7) of the 1940 Act. Securities Lending Fund is managed by Funds Management and is subadvised by WellsCap. Funds Management receives an advisory fee starting at 0.05% and declining to 0.01% as the average daily net assets of the Securities Lending Fund increase. All of the fees received by Funds Management are paid to WellsCap for its services as subadviser.
Wells Fargo Core Plus Bond Fund | 47
Notes to financial statements (unaudited)
In the event of counterparty default or the failure of a borrower to return a loaned security, the Fund has the right to use the collateral to offset any losses incurred. As of February 28, 2021, the Fund had securities lending transactions with the following counterparties which are subject to offset:
| Counterparty | Value of
securities on
loan | Collateral
received1 | Net amount |
| Barclays Capital Incorporated | $ 26,758 | $ (26,758) | $0 |
| Credit Suisse Securities (USA) LLC | 1,672,228 | (1,672,228) | 0 |
| JPMorgan Securities LLC | 578,562 | (578,562) | 0 |
| Morgan Stanley & Company LLC | 3,637,256 | (3,637,256) | 0 |
1 Collateral received within this table is limited to the collateral for the net transaction with the counterparty.
7. DERIVATIVE TRANSACTIONS
During the six months ended February 28, 2021, the Fund entered into futures contracts to speculate on interest rates and to help manage the duration of the portfolio. The Fund also entered into forward foreign currency contracts for economic hedging purposes and entered into credit default swap contracts to hedge risks and/or enhance total returns.
The volume of the Fund's derivative activity during the six months ended February 28, 2021 was as follows:
| Futures contracts | |
| Average notional balance on long futures | $389,609,615 |
| Average notional balance on short futures | 122,890,673 |
| Forward foreign currency contracts | |
| Average contract amounts to buy | $ 7,625,529 |
| Average contract amounts to sell | 10,443,929 |
| Swap contracts | |
| Average notional balance | $ 7,891,004 |
The Fund's swap transactions may contain provisions for early termination in the event the net assets of the Fund declines below specific levels identified by the counterparty. If these levels are triggered, the counterparty may terminate the transaction and seek payment or request full collateralization of the derivative transactions in net liability positions.
A summary of the location of derivative instruments on the financial statements by primary risk exposure is outlined in the following tables.
The fair value of derivative instruments as of February 28, 2021 by risk type was as follows for the Fund:
| | Asset derivatives | | Liability derivatives |
| | Statement of
Assets and Liabilities location | Fair value | | Statement of
Assets and Liabilities location | Fair value |
| Interest rate risk | Unrealized gains on futures contracts | $ 1,338,060* | | Unrealized losses on futures contracts | $ 1,062,483* |
| Foreign currency risk | Unrealized gains on forwards foreign currency contracts | 952,242 | | Unrealized losses on forwards foreign currency contracts | 642,354 |
| Credit risk | Net unrealized gains on swap contracts | 495,510 * | | Net unrealized losses on swap contracts | 0 * |
| | | $2,785,812 | | | $1,704,837 |
* Amount represents the cumulative unrealized gains (losses) as reported in the tables following the Portfolio of Investments. For futures contracts, only the current day's variation margin as of February 28, 2021 is reported separately on the Statement of Assets and Liabilities.
48 | Wells Fargo Core Plus Bond Fund
Notes to financial statements (unaudited)
The effect of derivative instruments on the Statement of Operations for the six months ended February 28, 2021 was as follows for the Fund:
| | Amount of realized gains (losses) on derivatives |
| | Futures
contracts | Forward
foreign
currency
contracts | Swap
contracts | Total |
| Interest rate risk | $ (6,772,002) | $ 0 | $ 0 | $ (6,772,002) |
| Foreign currency risk | 0 | (2,787,010) | 0 | (2,787,010) |
| Credit risk | 0 | 0 | (22,829) | (22,829) |
| | $(6,772,002) | $(2,787,010) | $(22,829) | $(9,581,841) |
| | Change in unrealized gains (losses) on derivatives |
| | Futures
contracts | Forward
foreign
currency
contracts | Swap
contracts | Total |
| Interest rate risk | $ 1,374,436 | $ 0 | $ 0 | $ 1,374,436 |
| Foreign currency risk | 0 | 2,348,009 | 0 | 2,348,009 |
| Credit risk | 0 | 0 | 79,837 | 79,837 |
| | $1,374,436 | $2,348,009 | $79,837 | $3,802,282 |
For certain types of derivative transactions, the Fund has entered into International Swaps and Derivatives Association, Inc. master agreements (“ISDA Master Agreements”) or similar agreements with approved counterparties. The ISDA Master Agreements or similar agreements may have requirements to deliver/deposit securities or cash to/with an exchange or broker-dealer as collateral and allows the Fund to offset, with each counterparty, certain derivative financial instrument’s assets and/or liabilities with collateral held or pledged. Collateral requirements differ by type of derivative. Collateral or margin requirements are set by the broker or exchange clearinghouse for exchange traded derivatives while collateral terms are contract specific for over-the-counter traded derivatives. Cash collateral that has been pledged to cover obligations of the Fund under ISDA Master Agreements or similar agreements, if any, are reported separately in the Statement of Assets and Liabilities. Securities pledged as collateral, if any, are noted in the Portfolio of Investments. With respect to balance sheet offsetting, absent an event of default by the counterparty or a termination of the agreement, the reported amounts of financial assets and financial liabilities in the Statement of Assets and Liabilities are not offset across transactions between the Fund and the applicable counterparty. A reconciliation of the gross amounts on the Statement of Assets and Liabilities to the net amounts by counterparty, including any collateral exposure, for OTC derivatives is as follows:
| Counterparty | Gross amounts
of assets in the
Statement of
Assets and
Liabilities | Amounts
subject to
netting
agreements | Collateral
received | Net amount
of assets |
| Citibank | $952,242 | $642,354 | $309,888 | $0 |
| Counterparty | Gross amounts
of liabilities in the
Statement of
Assets and
Liabilities | Amounts
subject to
netting
agreements | Collateral
pledged | Net amount
of liabilities |
| Citibank | $642,354 | $642,354 | $0 | $0 |
8. BANK BORROWINGS
The Trust (excluding the money market funds), Wells Fargo Master Trust and Wells Fargo Variable Trust are parties to a $350,000,000 revolving credit agreement whereby the Fund is permitted to use bank borrowings for temporary or emergency purposes, such as to fund shareholder redemption requests. Interest under the credit agreement is charged to the Fund based
Wells Fargo Core Plus Bond Fund | 49
Notes to financial statements (unaudited)
on a borrowing rate equal to the higher of the Federal Funds rate in effect on that day plus 1.25% or the overnight LIBOR rate in effect on that day plus 1.25%. In addition, an annual commitment fee equal to 0.25% of the unused balance is allocated to each participating fund.
For the six months ended February 28, 2021, there were no borrowings by the Fund under the agreement.
9. INDEMNIFICATION
Under the Fund's organizational documents, the officers and Trustees have been granted certain indemnification rights against certain liabilities that may arise out of performance of their duties to the Fund. The Fund has entered into a separate agreement with each Trustee that converts indemnification rights currently existing under the Fund’s organizational documents into contractual rights that cannot be changed in the future without the consent of the Trustee. Additionally, in the normal course of business, the Fund may enter into contracts with service providers that contain a variety of indemnification clauses. The Fund’s maximum exposure under these arrangements is dependent on future claims that may be made against the Fund and, therefore, cannot be estimated.
10. CORONAVIRUS (COVID-19) PANDEMIC
On March 11, 2020, the World Health Organization announced that it had made the assessment that coronavirus disease 2019 (“COVID-19”) is a pandemic. The impacts of COVID-19 are affecting the entire global economy, individual companies and investment products, the funds, and the market in general. There is significant uncertainty around the extent and duration of business disruptions related to COVID-19 and the impacts may last for an extended period of time. COVID-19 has led to significant uncertainty and volatility in the financial markets.
50 | Wells Fargo Core Plus Bond Fund
Other information (unaudited)
PROXY VOTING INFORMATION
A description of the policies and procedures used to determine how to vote proxies relating to portfolio securities is available without charge, upon request, by calling 1-800-222-8222, visiting our website at wfam.com, or visiting the SEC website at sec.gov. Information regarding how the proxies related to portfolio securities were voted during the most recent 12-month period ended June 30 is available on the website at wfam.com or by visiting the SEC website at sec.gov.
QUARTERLY PORTFOLIO HOLDINGS INFORMATION
The Fund files its complete schedule of portfolio holdings with the SEC for the first and third quarters of each fiscal year as an exhibit to its reports on Form N-PORT. Shareholders may view the filed Form N-PORT by visiting the SEC website at sec.gov.
Wells Fargo Core Plus Bond Fund | 51
Other information (unaudited)
BOARD OF TRUSTEES AND OFFICERS
Each of the Trustees and Officers listed in the table below acts in identical capacities for each fund in the Wells Fargo family of funds, which consists of 144 mutual funds comprising the Wells Fargo Funds Trust, Wells Fargo Variable Trust, Wells Fargo Master Trust and four closed-end funds (collectively the “Fund Complex”). This table should be read in conjunction with the Prospectus and the Statement of Additional Information1. The mailing address of each Trustee and Officer is 525 Market Street, 12th Floor, San Francisco, CA 94105. Each Trustee and Officer serves an indefinite term, however, each Trustee serves such term until reaching the mandatory retirement age established by the Trustees.
Independent Trustees
Name and
year of birth | Position held and
length of service* | Principal occupations during past five years or longer | Current other
public company or
investment
company
directorships |
William R. Ebsworth
(Born 1957) | Trustee,
since 2015 | Retired. From 1984 to 2013, equities analyst, portfolio manager, research director and chief investment officer at Fidelity Management and Research Company in Boston, Tokyo, and Hong Kong, and retired in 2013 as Chief Investment Officer of Fidelity Strategic Advisers, Inc. where he led a team of investment professionals managing client assets. Prior thereto, Board member of Hong Kong Securities Clearing Co., Hong Kong Options Clearing Corp., the Thailand International Fund, Ltd., Fidelity Investments Life Insurance Company, and Empire Fidelity Investments Life Insurance Company. Audit Committee Chair and Investment Committee Chair of the Vincent Memorial Hospital Endowment (non-profit organization). Mr. Ebsworth is a CFA® charterholder. | N/A |
Jane A. Freeman
(Born 1953) | Trustee,
since 2015;
Chair Liaison,
since 2018 | Retired. From 2012 to 2014 and 1999 to 2008, Chief Financial Officer of Scientific Learning Corporation. From 2008 to 2012, Ms. Freeman provided consulting services related to strategic business projects. Prior to 1999, Portfolio Manager at Rockefeller & Co. and Scudder, Stevens & Clark. Board member of the Harding Loevner Funds from 1996 to 2014, serving as both Lead Independent Director and chair of the Audit Committee. Board member of the Russell Exchange Traded Funds Trust from 2011 to 2012 and the chair of the Audit Committee. Ms. Freeman is also an inactive Chartered Financial Analyst. | N/A |
Isaiah Harris, Jr.
(Born 1952) | Trustee,
since 2009; Audit
Committee
Chair,
since 2019 | Retired. Chairman of the Board of CIGNA Corporation since 2009, and Director since 2005. From 2003 to 2011, Director of Deluxe Corporation. Prior thereto, President and CEO of BellSouth Advertising and Publishing Corp. from 2005 to 2007, President and CEO of BellSouth Enterprises from 2004 to 2005 and President of BellSouth Consumer Services from 2000 to 2003. Emeritus member of the Iowa State University Foundation Board of Governors. Emeritus Member of the Advisory Board of Iowa State University School of Business. Advisory Board Member, Palm Harbor Academy (private school). Mr. Harris is a certified public accountant (inactive status). | CIGNA Corporation |
Judith M. Johnson
(Born 1949) | Trustee,
since 2008 | Retired. Prior thereto, Chief Executive Officer and Chief Investment Officer of Minneapolis Employees Retirement Fund from 1996 to 2008. Ms. Johnson is an attorney, certified public accountant and a certified managerial accountant. | N/A |
David F. Larcker
(Born 1950) | Trustee,
since 2009 | James Irvin Miller Professor of Accounting at the Graduate School of Business (Emeritus), Stanford University, Director of the Corporate Governance Research Initiative and Senior Faculty of The Rock Center for Corporate Governance since 2006. From 2005 to 2008, Professor of Accounting at the Graduate School of Business, Stanford University. Prior thereto, Ernst & Young Professor of Accounting at The Wharton School, University of Pennsylvania from 1985 to 2005. | N/A |
52 | Wells Fargo Core Plus Bond Fund
Other information (unaudited)
Name and
year of birth | Position held and
length of service* | Principal occupations during past five years or longer | Current other
public company or
investment
company
directorships |
Olivia S. Mitchell
(Born 1953) | Trustee,
since 2006;
Nominating and
Governance
Committee Chair,
since 2018 | International Foundation of Employee Benefit Plans Professor, Wharton School of the University of Pennsylvania since 1993. Director of Wharton’s Pension Research Council and Boettner Center on Pensions & Retirement Research, and Research Associate at the National Bureau of Economic Research. Previously, Cornell University Professor from 1978 to 1993. | N/A |
Timothy J. Penny
(Born 1951) | Trustee,
since 1996;
Chair,
since 2018 | President and Chief Executive Officer of Southern Minnesota Initiative Foundation, a non-profit organization, since 2007. Member of the Board of Trustees of NorthStar Education Finance, Inc., a non-profit organization, since 2007. | N/A |
James G. Polisson
(Born 1959) | Trustee,
since 2018 | Retired. Chief Marketing Officer, Source (ETF) UK Services, Ltd, from 2015 to 2017. From 2012 to 2015, Principal of The Polisson Group, LLC, a management consulting, corporate advisory and principal investing company. Chief Executive Officer and Managing Director at Russell Investments, Global Exchange Traded Funds from 2010 to 2012. Managing Director of Barclays Global Investors from 1998 to 2010 and Global Chief Marketing Officer for iShares and Barclays Global Investors from 2000 to 2010. Trustee of the San Francisco Mechanics’ Institute, a non-profit organization, from 2013 to 2015. Board member of the Russell Exchange Traded Fund Trust from 2011 to 2012. Director of Barclays Global Investors Holdings Deutschland GmbH from 2006 to 2009. Mr. Polisson is an attorney and has a retired status with the Massachusetts and District of Columbia Bar Associations. | N/A |
Pamela Wheelock
(Born 1959) | Trustee,
since January
2020; previously
Trustee from
January 2018 to
July 2019 | Board member of the Destination Medical Center Economic Development Agency, Rochester, Minnesota since 2019. Interim President of the McKnight Foundation from January to September 2020. Acting Commissioner, Minnesota Department of Human Services, July 2019 through September 2019. Human Services Manager (part-time), Minnesota Department of Human Services, October 2019 through December 2019. Chief Operating Officer, Twin Cities Habitat for Humanity from 2017 to 2019. Vice President of University Services, University of Minnesota from 2012 to 2016. Prior thereto, on the Board of Directors, Governance Committee and Finance Committee for the Minnesota Philanthropy Partners (Saint Paul Foundation) from 2012 to 2018, Interim Chief Executive Officer of Blue Cross Blue Shield of Minnesota from 2011 to 2012, Chairman of the Board from 2009 to 2012 and Board Director from 2003 to 2015. Vice President, Leadership and Community Engagement, Bush Foundation, Saint Paul, Minnesota (a private foundation) from 2009 to 2011. Executive Vice President and Chief Financial Officer, Minnesota Sports and Entertainment from 2004 to 2009 and Senior Vice President from 2002 to 2004. Executive Vice President of the Minnesota Wild Foundation from 2004 to 2008. Commissioner of Finance, State of Minnesota, from 1999 to 2002. Currently Board Chair of the Minnesota Wild Foundation since 2010. | N/A |
* Length of service dates reflect the Trustee’s commencement of service with the Trust’s predecessor entities, where applicable.
Wells Fargo Core Plus Bond Fund | 53
Other information (unaudited)
Officers
Name and
year of birth | Position held and
length of service | Principal occupations during past five years or longer |
Andrew Owen
(Born 1960) | President,
since 2017 | Executive Vice President of Wells Fargo & Company and Head of Affiliated Managers, Wells Fargo Asset Management, since 2014. In addition, Mr. Owen is currently President, Chief Executive Officer and Director of Wells Fargo Funds Management, LLC since 2017. Prior thereto, Executive Vice President responsible for marketing, investments and product development for Wells Fargo Funds Management, LLC, from 2009 to 2014. |
Jeremy DePalma
(Born 1974) | Treasurer,
since 2012
(for certain funds in
the Fund Complex);
since 2021 (for
the remaining funds in the
Fund Complex) | Senior Vice President of Wells Fargo Funds Management, LLC since 2009. Senior Vice President of Evergreen Investment Management Company, LLC from 2008 to 2010 and head of the Fund Reporting and Control Team within Fund Administration from 2005 to 2010. |
Michelle Rhee
(Born 1966) | Chief Legal Officer,
since 2019 | Secretary of Wells Fargo Funds Management, LLC and Chief Legal Counsel of Wells Fargo Asset Management since 2018. Deputy General Counsel of Wells Fargo Bank, N.A. since 2020 and Assistant General Counsel of Wells Fargo Bank, N.A. from 2018 to 2020. Associate General Counsel and Managing Director of Bank of America Corporation from 2004 to 2018. |
Catherine Kennedy
(Born 1969) | Secretary,
since 2019 | Vice President of Wells Fargo Funds Management, LLC and Senior Counsel of the Wells Fargo Legal Department since 2010. Vice President and Senior Counsel of Evergreen Investment Management Company, LLC from 1998 to 2010. |
Michael H. Whitaker
(Born 1967) | Chief Compliance Officer,
since 2016 | Chief Compliance Officer of Wells Fargo Asset Management since 2016. Senior Vice President and Chief Compliance Officer for Fidelity Investments from 2007 to 2016. |
1 The Statement of Additional Information includes additional information about the Trustees and is available, without charge, upon request, by calling 1-800-222-8222 or by visiting the website at wfam.com.
54 | Wells Fargo Core Plus Bond Fund
For more information
More information about Wells Fargo Funds is available free upon request. To obtain literature, please write, visit the Fund's website, or call:
Wells Fargo Funds
P.O. Box 219967
Kansas City, MO 64121-9967
Website: wfam.com
Individual investors: 1-800-222-8222
Retail investment professionals: 1-888-877-9275
Institutional investment professionals: 1-866-765-0778
This report and the financial statements contained herein are submitted for the general information of the shareholders of the Fund. If this report is used for promotional purposes, distribution of the report must be accompanied or preceded by a current prospectus. Before investing, please consider the investment objectives, risks, charges, and expenses of the investment. For a current prospectus and, if available, a summary prospectus, containing this information, call 1-800-222-8222 or visit the Fund's website at wfam.com. Read the prospectus carefully before you invest or send money.
Wells Fargo Asset Management (WFAM) is the trade name for certain investment advisory/management firms owned by Wells Fargo & Company. These firms include but are not limited to Wells Capital Management Incorporated and Wells Fargo Funds Management, LLC. Certain products managed by WFAM entities are distributed by Wells Fargo Funds Distributor, LLC (a broker-dealer and Member FINRA).
This material is for general informational and educational purposes only and is NOT intended to provide investment advice or a recommendation of any kind - including a recommendation for any specific investment, strategy, or plan.
INVESTMENT PRODUCTS: NOT FDIC INSURED ■ NO BANK GUARANTEE ■ MAY LOSE VALUE
© 2021 Wells Fargo & Company. All rights reserved.
PAR-0321-00291 04-21
SA219/SAR219 02-21
Semi-Annual Report
February 28, 2021
Wells Fargo
Government Securities Fund
Reduce clutter.
Save trees.
Sign up for electronic delivery of prospectuses and shareholder reports at wellsfargo.com/ advantagedelivery
The views expressed and any forward-looking statements are as of February 28, 2021, unless otherwise noted, and are those of the Fund's portfolio managers and/or Wells Fargo Asset Management. Discussions of individual securities or the markets generally are not intended as individual recommendations. Future events or results may vary significantly from those expressed in any forward-looking statements. The views expressed are subject to change at any time in response to changing circumstances in the market. Wells Fargo Asset Management and the Fund disclaim any obligation to publicly update or revise any views expressed or forward-looking statements.
INVESTMENT PRODUCTS: NOT FDIC INSURED ■ NO BANK GUARANTEE ■ MAY LOSE VALUE
Wells Fargo Government Securities Fund | 1
Letter to shareholders (unaudited)
Andrew Owen
President
Wells Fargo Funds
Dear Shareholder:
We are pleased to offer you this semi-annual report for the Wells Fargo Government Securities Fund for the six-month period that ended February 28, 2021. Global stocks showed robust returns, as the global economy began emerging from the haze of COVID-19. Tailwinds were provided by global stimulus programs, a rapid vaccination rollout, and recovering consumer and corporate sentiment. Bonds also had positive returns, led by high-yield bonds.
For the six-month period, U.S. stocks, based on the S&P 500 Index,1 gained 9.74%. International stocks, as measured by the MSCI ACWI ex USA Index (Net),2 returned 16.65%, while the MSCI EM Index (Net),3 had even stronger performance, with a 22.32% gain. Among bond indexes, the Bloomberg Barclays U.S. Aggregate Bond Index,4 returned (1.55)%, the Bloomberg Barclays Global Aggregate ex-USD Index (unhedged),5 gained 1.41%, and the Bloomberg Barclays Municipal Bond Index,6 returned 0.86% while the ICE BofA U.S. High Yield Index,7 gained 6.14%.
Hope drove the stock markets to new highs.
Stocks grew more volatile in September on mixed economic data. U.S. economic activity continued to grow. However, U.S. unemployment remained elevated at 7.9% in September. With U.S. Congress delaying further fiscal relief and uncertainties surrounding a possible vaccine, doubts crept back into the financial markets. In the U.K., a lack of progress in Brexit talks weighed on markets. China’s economy picked up steam, fueled by increased global demand.
In October, capital markets stepped back from their six-month rally. Market volatility rose in advance of the U.S. election and amid a global increase in COVID-19 infections. Europe introduced tighter restrictions affecting economic activity. U.S. markets looked favorably at the prospect of Democratic control of the federal purse strings, which could lead to additional fiscal stimulus and a boost to economic activity. Meanwhile, China reported 4.9% third-quarter gross domestic product growth.
| 1 | The S&P 500 Index consists of 500 stocks chosen for market size, liquidity, and industry group representation. It is a market-value-weighted index with each stock's weight in the index proportionate to its market value. You cannot invest directly in an index. |
| 2 | The Morgan Stanley Capital International (MSCI) All Country World Index (ACWI) ex USA Index (Net) is a free-float-adjusted market-capitalization-weighted index that is designed to measure the equity market performance of developed and emerging markets, excluding the United States. Source: MSCI. MSCI makes no express or implied warranties or representations and shall have no liability whatsoever with respect to any MSCI data contained herein. The MSCI data may not be further redistributed or used as a basis for other indices or any securities or financial products. This report is not approved, reviewed, or produced by MSCI. You cannot invest directly in an index. |
| 1 | The S&P 500 Index consists of 500 stocks chosen for market size, liquidity, and industry group representation. It is a market-value-weighted index with each stock's weight in the index proportionate to its market value. You cannot invest directly in an index. |
| 3 | The MSCI Emerging Markets (EM) Index (Net) is a free-float-adjusted market-capitalization-weighted index that is designed to measure equity market performance of emerging markets. You cannot invest directly in an index. |
| 1 | The S&P 500 Index consists of 500 stocks chosen for market size, liquidity, and industry group representation. It is a market-value-weighted index with each stock's weight in the index proportionate to its market value. You cannot invest directly in an index. |
| 4 | The Bloomberg Barclays U.S. Aggregate Bond Index is a broad-based benchmark that measures the investment-grade, U.S. dollar-denominated, fixed-rate taxable bond market, including Treasuries, government-related and corporate securities, mortgage-backed securities (agency fixed-rate and hybrid adjustable-rate mortgage pass-throughs), asset-backed securities, and commercial mortgage-backed securities. You cannot invest directly in an index. |
| 1 | The S&P 500 Index consists of 500 stocks chosen for market size, liquidity, and industry group representation. It is a market-value-weighted index with each stock's weight in the index proportionate to its market value. You cannot invest directly in an index. |
| 5 | The Bloomberg Barclays Global Aggregate ex-USD Index (unhedged) is an unmanaged index that provides a broad-based measure of the global investment-grade fixed-income markets excluding the U.S. dollar-denominated debt market. You cannot invest directly in an index. |
| 1 | The S&P 500 Index consists of 500 stocks chosen for market size, liquidity, and industry group representation. It is a market-value-weighted index with each stock's weight in the index proportionate to its market value. You cannot invest directly in an index. |
| 6 | The Bloomberg Barclays Municipal Bond Index is an unmanaged index composed of long-term tax-exempt bonds with a minimum credit rating of Baa. You cannot invest directly in an index. |
| 1 | The S&P 500 Index consists of 500 stocks chosen for market size, liquidity, and industry group representation. It is a market-value-weighted index with each stock's weight in the index proportionate to its market value. You cannot invest directly in an index. |
| 7 | The ICE BofA U.S. High Yield Index is a market-capitalization-weighted index of domestic and Yankee high-yield bonds. The index tracks the performance of high-yield securities traded in the U.S. bond market. You cannot invest directly in an index. Copyright 2021. ICE Data Indices, LLC. All rights reserved. |
2 | Wells Fargo Government Securities Fund
Letter to shareholders (unaudited)
Global stocks rallied in November, propelled by optimism over three promising COVID-19 vaccines. Reversing recent trends, value stocks outperformed growth stocks and cyclical stocks outpaced technology stocks. However, U.S. unemployment remained elevated, with a net job loss of 10 million since February 2020. The eurozone services Purchasing Managers’ Index, a monthly survey of purchasing managers, contracted sharply while the region’s manufacturing activity grew. The U.S. election results added to the upbeat mood as investors anticipated more consistent policies in the new administration.
Financial markets ended the year with strength on high expectations for a rapid rollout of the COVID-19 vaccines, the successful passage of a $900 billion stimulus package, and rising expectations of additional economic support from a Democratic-led Congress. U.S. economic data were mixed with still-elevated unemployment and weak retail sales but growth in manufacturing output. In contrast, China’s economic expansion continued in both manufacturing and nonmanufacturing. U.S. COVID-19 infection rates continued to rise even as new state and local lockdown measures were implemented.
The year 2021 began with emerging market stocks leading all major asset classes in January, driven by China’s strong economic growth and a broad recovery in corporate earnings, which propelled China’s stock market higher. In the United States, positive news on vaccine trials and January's expansion in both the manufacturing and services sectors was offset by a weak December monthly jobs report. This was compounded by technical factors as some hedge funds were forced to sell stocks to protect themselves against a well-publicized short squeeze coordinated by a group of retail investors. Eurozone sentiment and economic growth were particularly weak, reflecting the impact of a new lockdown with stricter social distancing along with a slow vaccine rollout.
February saw major domestic equity indexes driven higher on the hope of a new stimulus bill, improving COVID-19 vaccination numbers, and the gradual reopening of the economy. Most S&P 500 companies reported better-than-expected earnings, with positive surprises coming from the financials, IT, health care, and materials sectors. Japan saw its economy strengthen as a result of strong export numbers. Meanwhile, crude oil prices continued their climb, rising more than 25% for the year. Domestic government bonds experienced a sharp sell-off in late February as markets priced in a more robust economic recovery and higher growth and inflation expectations.
Don’t let short-term uncertainty derail long-term investment goals.
Periods of investment uncertainty can present challenges, but experience has taught us that maintaining long-term investment goals can be an effective way to plan for the future. To help you create a sound strategy based on your personal goals and risk tolerance, Wells Fargo Funds offers more than 100 mutual funds spanning a wide range of asset classes and investment styles. Although diversification cannot guarantee an investment profit or prevent losses, we believe it can be an effective way to manage investment risk and potentially smooth out overall portfolio performance. We encourage investors to know their investments and to understand that appropriate levels of risk-taking may unlock opportunities.
Thank you for choosing to invest with Wells Fargo Funds. We appreciate your confidence in us and remain committed to helping you meet your financial needs.
Sincerely,
Andrew Owen
President
Wells Fargo Funds
“Global stocks rallied in November, propelled by optimism over three promising COVID-19 vaccines.”
“February saw major domestic equity indexes driven higher on the hope of a new stimulus bill, improving COVID-19 vaccination numbers, and the gradual reopening of the economy.”
For further information about your Fund, contact your investment professional, visit our website at wfam.com, or call us directly at 1-800-222-8222.
Wells Fargo Government Securities Fund | 3
Letter to shareholders (unaudited)
Preparing for LIBOR Transition
The global financial industry is preparing to transition away from the London Interbank Offered Rate (LIBOR), a key benchmark interest rate, to new alternative rates. LIBOR underpins more than $350 trillion of financial contracts. It is the benchmark rate for a wide spectrum of products ranging from residential mortgages to corporate bonds to derivatives. Regulators have called for a market-wide transition away from LIBOR to successor reference rates by the end of 2021 (extended through June 30, 2023 for most tenors of the U.S. dollar LIBOR), which requires proactive steps be taken by issuers, counterparties, and asset managers to identify impacted products and adopt new reference rates.
The Fund holds at least one security that uses LIBOR as a floating reference rate and has a maturity date after 12-31-2021.
Although the transition process away from LIBOR has become increasingly well-defined in advance of the anticipated discontinuation date, there remains uncertainty regarding the nature of successor reference rates, and any potential effects of the transition away from LIBOR on investment instruments that use it as a benchmark rate. The transition process may result in, among other things, increased volatility or illiquidity in markets for instruments that currently rely on LIBOR and could negatively impact the value of certain instruments held by the Fund.
Wells Fargo Asset Management is monitoring LIBOR exposure closely and has put resources and controls in place to manage this transition effectively. The Fund’s portfolio management team is evaluating LIBOR holdings to understand what happens to those securities when LIBOR ceases to exist, including examining security documentation to identify the presence or absence of fallback language identifying a replacement rate to LIBOR.
While the pace of transition away from LIBOR will differ by asset class and investment strategy, the portfolio management team will monitor market conditions for those holdings to identify and mitigate deterioration or volatility in pricing and liquidity and ensure appropriate actions are taken in a timely manner.
Further information regarding the potential risks associated with the discontinuation of LIBOR can be found in the Fund’s Statement of Additional Information.
4 | Wells Fargo Government Securities Fund
This page is intentionally left blank.
Performance highlights (unaudited)
| Investment objective | The Fund seeks current income. |
| Manager | Wells Fargo Funds Management, LLC |
| Subadviser | Wells Capital Management Incorporated |
| Portfolio managers | Christopher Y. Kauffman, CFA®‡, Jay N. Mueller, CFA®‡, Michal Stanczyk |
| Average annual total returns (%) as of February 28, 2021 |
| | | Including sales charge | | Excluding sales charge | | Expense ratios1 (%) |
| | Inception date | 1 year | 5 year | 10 year | | 1 year | 5 year | 10 year | | Gross | Net 2 |
| Class A (SGVDX) | 8-31-1999 | -3.17 | 1.52 | 2.20 | | 1.39 | 2.46 | 2.67 | | 0.91 | 0.86 |
| Class C (WGSCX) | 12-26-2002 | -0.38 | 1.70 | 1.90 | | 0.62 | 1.70 | 1.90 | | 1.66 | 1.61 |
| Administrator Class (WGSDX) | 4-8-2005 | – | – | – | | 1.50 | 2.66 | 2.88 | | 0.85 | 0.65 |
| Institutional Class (SGVIX) | 8-31-1999 | – | – | – | | 1.67 | 2.84 | 3.05 | | 0.58 | 0.49 |
| Bloomberg Barclays U.S. Aggregate ex Credit Index3 | – | – | – | – | | 0.70 | 2.66 | 2.98 | | – | – |
| Bloomberg Barclays U.S. Government Intermediate Bond Index4 | – | – | – | – | | 1.50 | 2.25 | 2.34 | | – | – |
Figures quoted represent past performance, which is no guarantee of future results, and do not reflect taxes that a shareholder may pay on an investment in a fund. Investment return and principal value of an investment will fluctuate so that an investor’s shares, when redeemed, may be worth more or less than their original cost. Performance shown without sales charges would be lower if sales charges were reflected. Current performance may be lower or higher than the performance data quoted, which assumes the reinvestment of dividends and capital gains. Current month-end performance is available on the Fund’s website, wfam.com.
Index returns do not include transaction costs associated with buying and selling securities, any mutual fund fees or expenses, or any taxes. It is not possible to invest directly in an index.
For Class A shares, the maximum front-end sales charge is 4.50%. For Class C shares, the maximum contingent deferred sales charge is 1.00%. Performance including a contingent deferred sales charge assumes the sales charge for the corresponding time period. Administrator Class and Institutional Class shares are sold without a front-end sales charge or contingent deferred sales charge.
| 1 | Reflects the expense ratios as stated in the most recent prospectuses, which include the impact of 0.01% in acquired fund fees and expenses. The expense ratios shown are subject to change and may differ from the annualized expense ratios shown in the financial highlights of this report, which do not include acquired fund fees and expenses. |
| 2 | The manager has contractually committed through December 31, 2021, to waive fees and/or reimburse expenses to the extent necessary to cap total annual fund operating expenses after fee waivers at 0.85% for Class A, 1.60% for Class C, 0.64% for Administrator Class and 0.48% for Institutional Class. Brokerage commissions, stamp duty fees, interest, taxes, acquired fund fees and expenses (if any), and extraordinary expenses are excluded from the expense caps. Prior to or after the commitment expiration date, the caps may be increased or the commitment to maintain the caps may be terminated only with the approval of the Board of Trustees. Without these caps, the Fund’s returns would have been lower. The expense ratio paid by an investor is the net expense ratio (the total annual fund operating expenses after fee waivers) as stated in the prospectuses. |
| 3 | The Bloomberg Barclays U.S. Aggregate ex Credit Index is composed of the Bloomberg Barclays U.S. Government Index and the Bloomberg Barclays U.S. Mortgage-Backed Securities Index and includes Treasury issues, agency issues, and mortgage-backed securities. You cannot invest directly in an index. |
| 4 | The Bloomberg Barclays Intermediate U.S. Government Bond Index is an unmanaged index composed of U.S. government securities with maturities in the one to 10-year range, including securities issued by the U.S. Treasury and U.S. government agencies. You cannot invest directly in an index. |
| ‡ | CFA® and Chartered Financial Analyst® are trademarks owned by CFA Institute. |
6 | Wells Fargo Government Securities Fund
Performance highlights (unaudited)
Bond values fluctuate in response to the financial condition of individual issuers, general market and economic conditions, and changes in interest rates. Changes in market conditions and government policies may lead to periods of heightened volatility in the bond market and reduced liquidity for certain bonds held by the Fund. In general, when interest rates rise, bond values fall and investors may lose principal value. Interest rate changes and their impact on the Fund and its share price can be sudden and unpredictable. The use of derivatives may reduce returns and/or increase volatility. Securities issued by U.S. government agencies or government sponsored entities may not be guaranteed by the U.S. Treasury. Certain investment strategies tend to increase the total risk of an investment (relative to the broader market). The Fund is exposed to mortgage- and asset-backed securities risk. The U.S. government guarantee applies to certain underlying securities and not to shares of the Fund. Consult the Fund’s prospectus for additional information on these and other risks.
Wells Fargo Government Securities Fund | 7
Performance highlights (unaudited)
| Ten largest holdings (%) as of February 28, 20211 |
| FNMA, 2.50%, 7-25-2050 | 8.16 |
| FNMA, 2.00%, 3-11-2051 | 4.28 |
| State of Israel, 5.50%, 12-4-2023 | 2.90 |
| Resolution Funding Corporation STRIPS, 0.00%, 2-15-2039 | 2.03 |
| U.S. Treasury Note, 0.50%, 2-28-2026 | 2.02 |
| Resolution Funding Corporation STRIPS, 0.00%, 1-15-2030 | 2.01 |
| FNMA, 3.00%, 12-1-2045 | 1.80 |
| FNMA, 6.63%, 11-15-2030 | 1.72 |
| U.S. Treasury Bond, 1.38%, 11-15-2040 | 1.65 |
| TVA, 4.63%, 9-15-2060 | 1.55 |
| 1 | Figures represent the percentage of the Fund's net assets. Holdings are subject to change and may have changed since the date specified. |
| Portfolio composition as of February 28, 20211 |
| 1 | Figures represent the percentage of the Fund's long-term investments. These amounts are subject to change and may have changed since the date specified. |
8 | Wells Fargo Government Securities Fund
Fund expenses (unaudited)
As a shareholder of the Fund, you incur two types of costs: (1) transaction costs, including sales charges (loads) on purchase payments and contingent deferred sales charges (if any) on redemptions and (2) ongoing costs, including management fees, distribution (12b-1) and/or shareholder servicing fees, and other Fund expenses. This example is intended to help you understand your ongoing costs (in dollars) of investing in the Fund and to compare these costs with the ongoing costs of investing in other mutual funds.
The example is based on an investment of $1,000 invested at the beginning of the six-month period and held for the entire period from September 1, 2020 to February 28, 2021.
Actual expenses
The “Actual” line of the table below provides information about actual account values and actual expenses. You may use the information in this line, together with the amount you invested, to estimate the expenses that you paid over the period. Simply divide your account value by $1,000 (for example, an $8,600 account value divided by $1,000 = 8.6), then multiply the result by the number in the “Actual” line under the heading entitled “Expenses paid during period” for your applicable class of shares to estimate the expenses you paid on your account during this period.
Hypothetical example for comparison purposes
The “Hypothetical” line of the table below provides information about hypothetical account values and hypothetical expenses based on the Fund’s actual expense ratio and an assumed rate of return of 5% per year before expenses, which is not the Fund’s actual return. The hypothetical account values and expenses may not be used to estimate the actual ending account balance or expenses you paid for the period. You may use this information to compare the ongoing costs of investing in the Fund and other funds. To do so, compare this 5% hypothetical example with the 5% hypothetical examples that appear in the shareholder reports of the other funds.
Please note that the expenses shown in the table are meant to highlight your ongoing costs only and do not reflect any transactional costs, such as sales charges (loads) and contingent deferred sales charges. Therefore, the “Hypothetical” line of the table is useful in comparing ongoing costs only and will not help you determine the relative total costs of owning different funds. In addition, if these transactional costs were included, your costs would have been higher.
| | Beginning
account value
9-1-2020 | Ending
account value
2-28-2021 | Expenses
paid during
the period1 | Annualized net
expense ratio |
| Class A | | | | |
| Actual | $1,000.00 | $ 991.05 | $4.15 | 0.84% |
| Hypothetical (5% return before expenses) | $1,000.00 | $1,020.63 | $4.21 | 0.84% |
| Class C | | | | |
| Actual | $1,000.00 | $ 987.29 | $7.88 | 1.60% |
| Hypothetical (5% return before expenses) | $1,000.00 | $1,016.86 | $8.00 | 1.60% |
| Administrator Class | | | | |
| Actual | $1,000.00 | $ 992.02 | $3.16 | 0.64% |
| Hypothetical (5% return before expenses) | $1,000.00 | $1,021.62 | $3.21 | 0.64% |
| Institutional Class | | | | |
| Actual | $1,000.00 | $ 992.80 | $2.37 | 0.48% |
| Hypothetical (5% return before expenses) | $1,000.00 | $1,022.41 | $2.41 | 0.48% |
1 Expenses paid is equal to the annualized net expense ratio of each class multiplied by the average account value over the period, multiplied by the number of days in the most recent fiscal half-year divided by the number of days in the fiscal year (to reflect the one-half-year period).
Wells Fargo Government Securities Fund | 9
Portfolio of investments—February 28, 2021 (unaudited)
| | | Interest
rate | Maturity
date | Principal | Value |
| Agency securities: 77.92% | | | | | | |
| FHLB | | 3.00% | 8-1-2050 | $ | 4,992,573 | $ 5,261,624 |
| FHLB | | 5.63 | 3-14-2036 | | 6,020,000 | 9,013,223 |
| FHLMC ¤ | | 0.00 | 3-15-2031 | | 12,190,000 | 10,307,426 |
| FHLMC ¤ | | 0.00 | 11-15-2038 | | 1,575,000 | 1,073,483 |
| FHLMC (12 Month LIBOR +1.91%) ± | | 2.41 | 9-1-2031 | | 2,806 | 2,803 |
| FHLMC (12 Month LIBOR +0.00%) ± | | 2.46 | 1-1-2038 | | 250,244 | 252,280 |
| FHLMC (12 Month LIBOR +1.91%) ± | | 2.53 | 9-1-2031 | | 37,819 | 38,093 |
| FHLMC (12 Month LIBOR +1.71%) ± | | 2.57 | 7-1-2038 | | 943,925 | 996,500 |
| FHLMC | | 2.62 | 12-25-2026 | | 3,735,369 | 3,970,549 |
| FHLMC (1 Year Treasury Constant Maturity +2.25%) ± | | 2.67 | 6-1-2032 | | 17,982 | 18,057 |
| FHLMC | | 2.75 | 3-25-2027 | | 4,711,214 | 4,967,368 |
| FHLMC (1 Year Treasury Constant Maturity +2.14%) ± | | 2.80 | 10-1-2026 | | 84,774 | 84,981 |
| FHLMC | | 2.90 | 4-25-2026 | | 5,452,978 | 5,813,434 |
| FHLMC (1 Year Treasury Constant Maturity +2.40%) ± | | 2.90 | 7-1-2029 | | 20,798 | 20,812 |
| FHLMC | | 3.00 | 6-1-2050 | | 1,365,898 | 1,452,073 |
| FHLMC | | 3.00 | 7-1-2050 | | 2,575,327 | 2,737,798 |
| FHLMC | | 3.00 | 8-1-2050 | | 1,213,717 | 1,290,502 |
| FHLMC (11th District Cost of Funds +1.25%) ± | | 3.08 | 7-1-2032 | | 250,495 | 254,746 |
| FHLMC (3 Year Treasury Constant Maturity +2.21%) ± | | 3.43 | 5-1-2026 | | 17,566 | 17,825 |
| FHLMC | | 3.50 | 8-1-2045 | | 2,583,676 | 2,783,059 |
| FHLMC | | 3.50 | 11-1-2045 | | 4,644,963 | 5,006,034 |
| FHLMC | | 3.50 | 12-1-2045 | | 3,273,026 | 3,524,553 |
| FHLMC | | 3.50 | 12-1-2045 | | 1,000,453 | 1,074,477 |
| FHLMC | | 3.50 | 10-1-2049 | | 5,470,148 | 5,794,228 |
| FHLMC | | 4.00 | 6-1-2044 | | 2,353,824 | 2,584,877 |
| FHLMC | | 4.00 | 5-1-2049 | | 2,554,866 | 2,741,013 |
| FHLMC | | 4.00 | 9-1-2049 | | 683,695 | 733,690 |
| FHLMC | | 4.50 | 3-1-2042 | | 177,316 | 198,085 |
| FHLMC | | 4.50 | 9-1-2044 | | 2,253,469 | 2,517,573 |
| FHLMC | | 4.50 | 9-1-2049 | | 7,319,779 | 7,968,953 |
| FHLMC | | 5.00 | 6-1-2026 | | 603,267 | 632,348 |
| FHLMC | | 5.00 | 8-1-2040 | | 754,213 | 878,008 |
| FHLMC | | 5.50 | 7-1-2035 | | 2,145,595 | 2,487,632 |
| FHLMC | | 5.50 | 12-1-2038 | | 1,220,196 | 1,424,400 |
| FHLMC | | 6.00 | 10-1-2032 | | 18,342 | 22,024 |
| FHLMC (1 Year Treasury Constant Maturity +2.13%) ± | | 6.38 | 1-1-2026 | | 13,279 | 13,286 |
| FHLMC | | 6.50 | 4-1-2021 | | 36 | 36 |
| FHLMC | | 6.50 | 4-1-2022 | | 7,209 | 8,096 |
| FHLMC | | 6.50 | 9-1-2028 | | 10,106 | 11,388 |
| FHLMC | | 6.50 | 7-1-2031 | | 2 | 2 |
| FHLMC | | 7.00 | 12-1-2023 | | 1,025 | 1,085 |
| FHLMC | | 7.00 | 12-1-2026 | | 254 | 276 |
| FHLMC | | 7.00 | 4-1-2029 | | 870 | 1,006 |
| FHLMC | | 7.00 | 5-1-2029 | | 4,720 | 5,498 |
| FHLMC | | 7.00 | 4-1-2032 | | 59,176 | 69,698 |
| FHLMC | | 7.50 | 11-1-2031 | | 63,184 | 70,111 |
| FHLMC | | 7.50 | 4-1-2032 | | 131,819 | 154,184 |
| FHLMC | | 8.00 | 8-1-2023 | | 3,162 | 3,205 |
| FHLMC | | 8.00 | 6-1-2024 | | 1,856 | 1,992 |
| FHLMC | | 8.00 | 6-1-2024 | | 1,650 | 1,658 |
| FHLMC | | 8.00 | 6-1-2024 | | 3,141 | 3,230 |
| FHLMC | | 8.00 | 8-1-2026 | | 8,871 | 10,066 |
| FHLMC | | 8.00 | 11-1-2026 | | 8,153 | 9,279 |
| FHLMC | | 8.00 | 11-1-2028 | | 4,110 | 4,477 |
The accompanying notes are an integral part of these financial statements.
10 | Wells Fargo Government Securities Fund
Portfolio of investments—February 28, 2021 (unaudited)
| | | Interest
rate | Maturity
date | Principal | Value |
| Agency securities (continued) | | | | | | |
| FHLMC | | 8.50% | 12-1-2025 | $ | 5,129 | $ 5,609 |
| FHLMC | | 8.50 | 5-1-2026 | | 735 | 747 |
| FHLMC | | 8.50 | 8-1-2026 | | 3,580 | 3,597 |
| FHLMC | | 9.00 | 4-1-2021 | | 1 | 1 |
| FHLMC | | 9.00 | 8-1-2021 | | 5 | 5 |
| FHLMC | | 9.00 | 7-1-2022 | | 4 | 4 |
| FHLMC | | 9.50 | 5-1-2021 | | 5 | 5 |
| FHLMC | | 9.50 | 9-17-2022 | | 705 | 709 |
| FHLMC | | 9.50 | 4-1-2025 | | 8,656 | 8,780 |
| FHLMC Multifamily Structured Pass-through Series T056 Class A4 | | 6.00 | 5-25-2043 | | 3,506,029 | 4,150,524 |
| FHLMC Multifamily Structured Pass-through Series K075 Class A2 ±± | | 3.65 | 2-25-2028 | | 4,370,000 | 5,025,063 |
| FHLMC Multifamily Structured Pass-through Series KF80 Class AS (30 Day Average U.S. SOFR +0.51%) ± | | 0.59 | 6-25-2030 | | 2,000,000 | 2,019,571 |
| FHLMC Series 2015-SC01 Class 1A | | 3.50 | 5-25-2045 | | 839,048 | 837,971 |
| FHLMC Series 2733 Class FB (1 Month LIBOR +0.60%) ± | | 0.71 | 10-15-2033 | | 299,866 | 303,792 |
| FHLMC Series 2882 Class TF (1 Month LIBOR +0.25%) ± | | 0.36 | 10-15-2034 | | 8,450 | 8,444 |
| FHLMC Series 3070 Class FT (1 Month LIBOR +0.35%) ± | | 0.46 | 11-15-2035 | | 635,721 | 639,961 |
| FHLMC Series 3614 Class QB | | 4.00 | 12-15-2024 | | 877,882 | 918,186 |
| FHLMC Series 3830 Class FD (1 Month LIBOR +0.36%) ± | | 0.47 | 3-15-2041 | | 293,110 | 295,349 |
| FHLMC Series 3906 Class EA | | 3.00 | 5-15-2026 | | 303,976 | 312,996 |
| FHLMC Series 4057 Class FN (1 Month LIBOR +0.35%) ± | | 0.46 | 12-15-2041 | | 255,835 | 257,119 |
| FHLMC Series 4068 Class FK (1 Month LIBOR +0.30%) ± | | 0.41 | 6-15-2040 | | 251,507 | 252,630 |
| FHLMC Series 4093 Class FB (1 Month LIBOR +0.35%) ± | | 0.46 | 7-15-2039 | | 676,483 | 678,100 |
| FHLMC Series 4159 Class AF (1 Month LIBOR +1.18%) ± | | 1.29 | 12-15-2036 | | 279,287 | 286,709 |
| FHLMC Series 4218 Class DF (1 Month LIBOR +0.25%) ± | | 0.36 | 7-15-2042 | | 440,935 | 440,807 |
| FHLMC Series 4409 Class MA | | 3.00 | 1-15-2054 | | 83,086 | 86,107 |
| FHLMC Series 4604 Class PA | | 3.00 | 1-15-2044 | | 1,531,842 | 1,567,935 |
| FHLMC Series 4620 Class AF (1 Month LIBOR +0.44%) ± | | 0.58 | 11-15-2042 | | 2,826,310 | 2,851,943 |
| FHLMC Series K020 Class X1 ±± | | 1.34 | 5-25-2022 | | 40,530,027 | 529,310 |
| FHLMC Series K032 Class A2 ±± | | 3.31 | 5-25-2023 | | 2,800,000 | 2,975,249 |
| FHLMC Series K039 Class A2 | | 3.30 | 7-25-2024 | | 325,000 | 352,837 |
| FHLMC Series K153 Class A3 ±± | | 3.12 | 10-25-2031 | | 160,000 | 179,015 |
| FHLMC Series KF15 Class A (1 Month LIBOR +0.67%) ± | | 0.79 | 2-25-2023 | | 144,742 | 144,631 |
| FHLMC Series KJ14 Class A1 | | 2.20 | 11-25-2023 | | 1,139,803 | 1,178,366 |
| FHLMC Series M036 Class A | | 4.16 | 12-15-2029 | | 3,200,000 | 3,314,912 |
| FHLMC Series T-15 Class A6 (1 Month LIBOR +0.40%) ± | | 0.52 | 11-25-2028 | | 127,541 | 127,571 |
| FHLMC Series T-23 Class A (1 Month LIBOR +0.14%) ± | | 0.27 | 5-25-2030 | | 480,630 | 481,644 |
| FHLMC Series T-35 Class A (1 Month LIBOR +0.28%) ± | | 0.26 | 9-25-2031 | | 541,980 | 537,400 |
| FHLMC Series T-42 Class A6 | | 9.50 | 2-25-2042 | | 637,718 | 806,804 |
| FHLMC Series T-55 Class 2A1 ±± | | 3.50 | 3-25-2043 | | 319,404 | 328,204 |
| FHLMC Series T-57 Class 1A1 | | 6.50 | 7-25-2043 | | 837,222 | 1,020,987 |
| FHLMC Series T-57 Class 2A1 ±± | | 3.81 | 7-25-2043 | | 1,536,432 | 1,643,885 |
| FHLMC Series T-62 Class 1A1 (12 Month Treasury Average +1.20%) ± | | 1.58 | 10-25-2044 | | 731,423 | 738,438 |
| FHLMC Series T-67 Class 1A1C ��± | | 3.16 | 3-25-2036 | | 680,087 | 725,450 |
| FHLMC Series T-67 Class 2A1C ±± | | 3.25 | 3-25-2036 | | 1,053,940 | 1,113,476 |
| FNAM Series 2013-114 Class LM | | 4.00 | 3-25-2042 | | 914,000 | 1,022,152 |
| FNMA ¤ | | 0.00 | 5-15-2030 | | 7,700,000 | 6,644,650 |
| FNMA ¤ | | 0.00 | 8-6-2038 | | 7,450,000 | 4,791,453 |
| FNMA | | 1.38 | 7-1-2030 | | 4,183,902 | 4,149,311 |
| FNMA | | 1.65 | 6-1-2030 | | 1,436,949 | 1,454,216 |
| FNMA | | 1.65 | 7-1-2030 | | 2,434,419 | 2,456,756 |
| FNMA | | 1.66 | 7-1-2032 | | 4,202,777 | 4,205,150 |
The accompanying notes are an integral part of these financial statements.
Wells Fargo Government Securities Fund | 11
Portfolio of investments—February 28, 2021 (unaudited)
| | | Interest
rate | Maturity
date | Principal | Value |
| Agency securities (continued) | | | | | | |
| FNMA (11th District Cost of Funds +1.36%) ± | | 1.86% | 5-1-2023 | $ | 636 | $ 635 |
| FNMA (11th District Cost of Funds +1.25%) ± | | 1.89 | 5-1-2036 | | 591,092 | 582,554 |
| FNMA | | 1.97 | 5-1-2030 | | 4,516,508 | 4,685,733 |
| FNMA | | 2.00 | 3-11-2051 | | 29,690,000 | 29,990,379 |
| FNMA (12 Month LIBOR +1.73%) ± | | 2.23 | 9-1-2036 | | 273,335 | 288,586 |
| FNMA | | 2.32 | 1-1-2026 | | 6,248,038 | 6,637,792 |
| FNMA (11th District Cost of Funds +1.25%) ± | | 2.32 | 9-1-2027 | | 119,147 | 120,650 |
| FNMA (1 Year Treasury Constant Maturity +2.20%) ± | | 2.32 | 11-1-2031 | | 99,067 | 99,644 |
| FNMA (12 Month LIBOR +1.62%) ± | | 2.38 | 8-1-2050 | | 2,051,667 | 2,128,892 |
| FNMA (1 Year Treasury Constant Maturity +2.20%) ± | | 2.43 | 12-1-2034 | | 193,605 | 193,464 |
| FNMA | | 2.50 | 7-25-2050 | | 55,100,000 | 57,123,203 |
| FNMA | | 2.50 | 9-1-2050 | | 610,950 | 633,976 |
| FNMA | | 2.51 | 9-1-2031 | | 5,276,163 | 5,606,511 |
| FNMA (12 Month LIBOR +1.78%) ± | | 2.52 | 8-1-2036 | | 500,195 | 529,112 |
| FNMA (12 Month LIBOR +1.61%) ± | | 2.53 | 5-1-2046 | | 2,388,700 | 2,482,426 |
| FNMA (12 Month LIBOR +1.77%) ± | | 2.56 | 7-1-2044 | | 118,292 | 125,162 |
| FNMA (1 Year Treasury Constant Maturity +2.23%) ± | | 2.57 | 9-1-2031 | | 19,439 | 19,521 |
| FNMA | | 2.60 | 12-1-2023 | | 1,902,491 | 2,001,211 |
| FNMA | | 2.65 | 2-1-2032 | | 2,965,364 | 3,175,964 |
| FNMA | | 2.65 | 2-1-2032 | | 2,306,395 | 2,470,194 |
| FNMA (1 Year Treasury Constant Maturity +2.20%) ± | | 2.65 | 12-1-2040 | | 92,826 | 98,556 |
| FNMA (1 Year Treasury Constant Maturity +2.41%) ± | | 2.72 | 10-1-2027 | | 66,137 | 66,050 |
| FNMA (1 Year Treasury Constant Maturity +2.22%) ± | | 2.72 | 6-1-2032 | | 77,346 | 77,743 |
| FNMA | | 2.75 | 9-1-2031 | | 917,886 | 984,659 |
| FNMA (1 Year Treasury Constant Maturity +2.37%) ± | | 2.78 | 7-1-2026 | | 32,842 | 32,680 |
| FNMA | | 2.86 | 7-1-2029 | | 1,001,832 | 1,092,136 |
| FNMA (1 Year Treasury Constant Maturity +2.23%) ± | | 2.94 | 12-1-2040 | | 21,454 | 21,523 |
| FNMA | | 3.00 | 5-1-2027 | | 679,116 | 716,572 |
| FNMA | | 3.00 | 6-1-2034 | | 5,545,948 | 5,851,831 |
| FNMA | | 3.00 | 4-1-2045 | | 59,056 | 62,237 |
| FNMA | | 3.00 | 11-1-2045 | | 5,108,603 | 5,401,993 |
| FNMA | | 3.00 | 12-1-2045 | | 11,946,822 | 12,633,897 |
| FNMA | | 3.00 | 12-1-2046 | | 431,606 | 457,647 |
| FNMA | | 3.00 | 8-1-2050 | | 5,569,464 | 5,875,653 |
| FNMA | | 3.00 | 9-1-2050 | | 4,906,313 | 5,191,861 |
| FNMA | | 3.02 | 2-1-2026 | | 5,998,640 | 6,533,888 |
| FNMA (11th District Cost of Funds +1.25%) ± | | 3.04 | 5-1-2036 | | 261,067 | 267,803 |
| FNMA (1 Year Treasury Constant Maturity +2.20%) ± | | 3.06 | 9-1-2035 | | 250,595 | 266,203 |
| FNMA (12 Month LIBOR +1.63%) ± | | 3.38 | 4-1-2032 | | 55,144 | 54,984 |
| FNMA | | 3.48 | 3-1-2029 | | 904,048 | 1,027,684 |
| FNMA | | 3.50 | 4-1-2034 | | 7,595,571 | 8,174,225 |
| FNMA | | 3.50 | 2-1-2043 | | 28,978 | 31,107 |
| FNMA | | 3.50 | 2-1-2045 | | 861,584 | 927,462 |
| FNMA | | 3.50 | 4-1-2045 | | 2,842,046 | 3,065,428 |
| FNMA | | 3.50 | 8-1-2045 | | 309,928 | 332,913 |
| FNMA | | 3.50 | 12-1-2045 | | 1,079,769 | 1,159,848 |
| FNMA | | 3.50 | 2-1-2046 | | 1,239,945 | 1,335,738 |
| FNMA | | 3.63 | 3-1-2029 | | 384,774 | 441,580 |
| FNMA | | 3.77 | 3-1-2029 | | 975,060 | 1,128,878 |
| FNMA | | 3.86 | 3-1-2029 | | 824,445 | 959,128 |
| FNMA (6 Month LIBOR +3.13%) ± | | 3.99 | 7-1-2033 | | 127,648 | 127,593 |
| FNMA | | 4.00 | 4-1-2046 | | 8,592,922 | 9,432,498 |
| FNMA | | 4.00 | 3-1-2047 | | 1,281,197 | 1,446,131 |
| FNMA (6 Month LIBOR +0.00%) ± | | 4.23 | 4-1-2033 | | 10,609 | 10,626 |
| FNMA | | 4.50 | 1-1-2026 | | 32,214 | 33,795 |
The accompanying notes are an integral part of these financial statements.
12 | Wells Fargo Government Securities Fund
Portfolio of investments—February 28, 2021 (unaudited)
| | | Interest
rate | Maturity
date | Principal | Value |
| Agency securities (continued) | | | | | | |
| FNMA | | 4.50% | 10-1-2046 | $ | 226,223 | $ 250,068 |
| FNMA | | 4.50 | 9-1-2049 | | 2,371,957 | 2,583,250 |
| FNMA | | 5.00 | 4-1-2023 | | 29,839 | 31,254 |
| FNMA | | 5.00 | 6-1-2023 | | 137,159 | 143,708 |
| FNMA | | 5.00 | 3-1-2034 | | 300,869 | 348,441 |
| FNMA | | 5.00 | 8-1-2040 | | 3,753,156 | 4,367,714 |
| FNMA | | 5.00 | 10-1-2040 | | 459,472 | 534,708 |
| FNMA | | 5.00 | 1-1-2042 | | 313,581 | 362,140 |
| FNMA | | 5.00 | 11-1-2048 | | 705,288 | 780,742 |
| FNMA | | 5.00 | 12-1-2048 | | 770,420 | 853,031 |
| FNMA | | 5.50 | 11-1-2023 | | 24,191 | 25,304 |
| FNMA | | 5.50 | 1-1-2025 | | 8,374 | 8,633 |
| FNMA | | 5.50 | 1-1-2025 | | 40,128 | 41,299 |
| FNMA | | 5.50 | 9-1-2033 | | 1,318,316 | 1,533,340 |
| FNMA | | 5.50 | 9-1-2033 | | 519,873 | 605,093 |
| FNMA | | 5.50 | 8-1-2035 | | 389,260 | 454,277 |
| FNMA | | 5.50 | 1-1-2037 | | 364,695 | 425,889 |
| FNMA | | 5.50 | 4-1-2040 | | 980,738 | 1,144,254 |
| FNMA | | 6.00 | 3-1-2024 | | 29,221 | 32,786 |
| FNMA | | 6.00 | 1-1-2028 | | 549,114 | 616,639 |
| FNMA | | 6.00 | 2-1-2035 | | 796,676 | 887,456 |
| FNMA | | 6.00 | 11-1-2037 | | 272,799 | 327,970 |
| FNMA | | 6.00 | 7-1-2038 | | 99,773 | 119,789 |
| FNMA | | 6.25 | 5-15-2029 | | 5,360,000 | 7,397,189 |
| FNMA | | 6.50 | 1-1-2024 | | 809 | 908 |
| FNMA | | 6.50 | 3-1-2028 | | 9,825 | 10,697 |
| FNMA | | 6.50 | 12-1-2029 | | 126,785 | 142,344 |
| FNMA | | 6.50 | 11-1-2031 | | 26,965 | 30,274 |
| FNMA | | 6.50 | 7-1-2036 | | 242,996 | 282,588 |
| FNMA | | 6.50 | 7-1-2036 | | 173,674 | 204,883 |
| FNMA | | 6.63 | 11-15-2030 | | 8,220,000 | 12,013,603 |
| FNMA | | 7.00 | 11-1-2026 | | 3,012 | 3,242 |
| FNMA | | 7.00 | 1-1-2032 | | 1,328 | 1,391 |
| FNMA | | 7.00 | 2-1-2032 | | 53,586 | 63,038 |
| FNMA | | 7.00 | 10-1-2032 | | 129,111 | 153,243 |
| FNMA | | 7.00 | 2-1-2034 | | 1,660 | 1,926 |
| FNMA | | 7.00 | 4-1-2034 | | 79,396 | 91,737 |
| FNMA | | 7.00 | 1-1-2036 | | 5,913 | 6,469 |
| FNMA | | 7.50 | 9-1-2031 | | 58,036 | 69,238 |
| FNMA | | 7.50 | 2-1-2032 | | 23,955 | 28,107 |
| FNMA | | 7.50 | 10-1-2037 | | 567,667 | 685,984 |
| FNMA | | 8.00 | 5-1-2027 | | 21,431 | 21,695 |
| FNMA | | 8.00 | 6-1-2028 | | 896 | 962 |
| FNMA | | 8.00 | 2-1-2030 | | 24,794 | 25,214 |
| FNMA | | 8.00 | 7-1-2031 | | 615,920 | 705,422 |
| FNMA | | 8.50 | 8-1-2024 | | 2,973 | 2,988 |
| FNMA | | 8.50 | 5-1-2026 | | 51,581 | 56,187 |
| FNMA | | 8.50 | 7-1-2026 | | 13,925 | 14,332 |
| FNMA | | 8.50 | 10-1-2026 | | 39 | 39 |
| FNMA | | 8.50 | 11-1-2026 | | 4,086 | 4,159 |
| FNMA | | 8.50 | 11-1-2026 | | 20,996 | 21,219 |
| FNMA | | 8.50 | 12-1-2026 | | 78,985 | 87,983 |
| FNMA | | 8.50 | 12-1-2026 | | 10,357 | 11,446 |
| FNMA | | 8.50 | 12-1-2026 | | 198 | 199 |
| FNMA | | 8.50 | 2-1-2027 | | 133 | 149 |
The accompanying notes are an integral part of these financial statements.
Wells Fargo Government Securities Fund | 13
Portfolio of investments—February 28, 2021 (unaudited)
| | | Interest
rate | Maturity
date | Principal | Value |
| Agency securities (continued) | | | | | �� | |
| FNMA | | 8.50% | 2-1-2027 | $ | 4,252 | $ 4,271 |
| FNMA | | 8.50 | 3-1-2027 | | 585 | 620 |
| FNMA | | 8.50 | 6-1-2027 | | 41,060 | 42,144 |
| FNMA | | 9.00 | 6-1-2021 | | 4 | 4 |
| FNMA | | 9.00 | 8-1-2021 | | 7 | 7 |
| FNMA | | 9.00 | 10-1-2021 | | 29 | 29 |
| FNMA | | 9.00 | 1-1-2025 | | 9,512 | 10,314 |
| FNMA | | 9.00 | 3-1-2025 | | 1,306 | 1,312 |
| FNMA | | 9.00 | 3-1-2025 | | 483 | 485 |
| FNMA | | 9.00 | 7-1-2028 | | 2,432 | 2,459 |
| FNMA | | 9.50 | 6-1-2022 | | 30 | 30 |
| FNMA | | 9.50 | 7-1-2028 | | 3,722 | 3,740 |
| FNMA 11 ¤ | | 0.00 | 11-15-2030 | | 2,765,000 | 2,351,709 |
| FNMA 2006-50 Class BF (1 Month LIBOR +0.40%) ± | | 0.52 | 6-25-2036 | | 709,823 | 715,015 |
| FNMA 2010-136 Class FA (1 Month LIBOR +0.50%) ± | | 0.62 | 12-25-2040 | | 874,988 | 885,475 |
| FNMA Series 1991-85 Class Z | | 8.00 | 6-25-2021 | | 471 | 474 |
| FNMA Series 1992-45 Class Z | | 8.00 | 4-25-2022 | | 8,547 | 8,801 |
| FNMA Series 2000-T6 Class A2 | | 9.50 | 11-25-2040 | | 507,492 | 579,979 |
| FNMA Series 2001-T10 Class A3 | | 9.50 | 12-25-2041 | | 573,772 | 690,016 |
| FNMA Series 2001-T12 Class A3 | | 9.50 | 8-25-2041 | | 162,783 | 198,125 |
| FNMA Series 2002 Class 5F (1 Month LIBOR +0.35%) ± | | 0.47 | 2-25-2032 | | 273,966 | 274,049 |
| FNMA Series 2002-T1 Class A3 | | 7.50 | 11-25-2031 | | 245,620 | 299,536 |
| FNMA Series 2002-T12 Class A5 ±± | | 4.54 | 10-25-2041 | | 661,889 | 700,287 |
| FNMA Series 2002-T19 Class A1 | | 6.50 | 7-25-2042 | | 2,973,206 | 3,565,821 |
| FNMA Series 2002-T5 Class A1 (1 Month LIBOR +0.24%) ± | | 0.37 | 5-25-2032 | | 309,682 | 308,041 |
| FNMA Series 2002-T6 Class A1 | | 6.50 | 7-25-2042 | | 1,147,914 | 1,365,031 |
| FNMA Series 2002-W4 Class A4 | | 6.25 | 5-25-2042 | | 424,555 | 495,463 |
| FNMA Series 2003-T2 Class A1 (1 Month LIBOR +0.14%) ± | | 0.46 | 3-25-2033 | | 778,266 | 764,269 |
| FNMA Series 2003-W09 Class A (1 Month LIBOR +0.12%) ± | | 0.37 | 6-25-2033 | | 64,345 | 63,258 |
| FNMA Series 2003-W1 Class 1A1 ±± | | 5.15 | 12-25-2042 | | 564,140 | 617,088 |
| FNMA Series 2003-W11 Class A1 ±± | | 3.17 | 6-25-2033 | | 30,865 | 31,377 |
| FNMA Series 2003-W3 Class 1A4 ±± | | 3.66 | 8-25-2042 | | 1,738,441 | 1,850,864 |
| FNMA Series 2003-W5 Class A (1 Month LIBOR +0.11%) ± | | 0.35 | 4-25-2033 | | 207,610 | 203,071 |
| FNMA Series 2003-W6 Class 6A ±± | | 3.50 | 8-25-2042 | | 884,882 | 924,871 |
| FNMA Series 2003-W6 Class PT4 ±± | | 8.30 | 10-25-2042 | | 987,330 | 1,220,950 |
| FNMA Series 2003-W8 Class PT1 ±± | | 9.08 | 12-25-2042 | | 366,890 | 428,963 |
| FNMA Series 2004-T1 Class 1A2 | | 6.50 | 1-25-2044 | | 293,281 | 343,907 |
| FNMA Series 2004-W01 Class 2A2 | | 7.00 | 12-25-2033 | | 815,220 | 962,248 |
| FNMA Series 2004-W15 Class 1A3 | | 7.00 | 8-25-2044 | | 520,382 | 625,382 |
| FNMA Series 2005-71 Class DB | | 4.50 | 8-25-2025 | | 201,780 | 208,034 |
| FNMA Series 2007-101 Class A2 (1 Month LIBOR +0.25%) ± | | 0.34 | 6-27-2036 | | 64,990 | 64,022 |
| FNMA Series 2007-W10 Class 2A ±± | | 6.30 | 8-25-2047 | | 223,029 | 254,891 |
| FNMA Series 2008-17 Class DP | | 4.75 | 2-25-2038 | | 1,230,671 | 1,321,932 |
| FNMA Series 2011-110 Class FE (1 Month LIBOR +0.40%) ± | | 0.52 | 4-25-2041 | | 138,208 | 137,492 |
| FNMA Series 2011-128 Class FK (1 Month LIBOR +0.35%) ± | | 0.47 | 7-25-2041 | | 248,822 | 249,347 |
| FNMA Series 2011-15 Class HI ♀ | | 5.50 | 3-25-2026 | | 8,325 | 65 |
| FNMA Series 2013-17 Class PC | | 2.00 | 3-25-2039 | | 153,778 | 153,906 |
| FNMA Series 2014-17 Class FE (1 Month LIBOR +0.55%) ± | | 0.67 | 4-25-2044 | | 2,050,862 | 2,078,615 |
| FNMA Series 2014-20 Class TM ±± | | 6.95 | 4-25-2044 | | 443,079 | 536,515 |
| FNMA Series 2017-M2 Class A2 ±± | | 2.81 | 2-25-2027 | | 9,904,261 | 10,725,121 |
| FNMA Series 2017-M6 Class F (1 Month LIBOR +0.48%) ± | | 0.61 | 4-25-2029 | | 3,341,893 | 3,371,227 |
The accompanying notes are an integral part of these financial statements.
14 | Wells Fargo Government Securities Fund
Portfolio of investments—February 28, 2021 (unaudited)
| | | Interest
rate | Maturity
date | Principal | Value |
| Agency securities (continued) | | | | | | |
| FNMA Series 2018-M1 Class A2 ±± | | 2.99% | 12-25-2027 | $ | 885,000 | $ 980,699 |
| FNMA Series 2018-M13 Class A2 ±± | | 3.70 | 9-25-2030 | | 460,000 | 541,301 |
| FNMA Series 2019-M5 Class A2 | | 3.27 | 2-25-2029 | | 5,200,000 | 5,797,892 |
| FNMA Series 265 Class 2 | | 9.00 | 3-25-2024 | | 23,133 | 24,857 |
| FNMA Series 4764 Class NK | | 3.50 | 9-15-2043 | | 1,358,508 | 1,380,324 |
| FNMA Series G92-30 Class Z | | 7.00 | 6-25-2022 | | 3,300 | 3,367 |
| FNMA Series G93-39 Class ZQ | | 6.50 | 12-25-2023 | | 398,997 | 422,231 |
| GNMA | | 2.50 | 8-20-2050 | | 195,086 | 202,690 |
| GNMA | | 3.00 | 11-20-2045 | | 5,721,692 | 6,050,821 |
| GNMA | | 3.00 | 10-20-2050 | | 6,949,131 | 7,303,644 |
| GNMA | | 3.50 | 12-20-2047 | | 6,346,508 | 6,781,490 |
| GNMA | | 3.50 | 3-20-2050 | | 4,504,881 | 4,773,444 |
| GNMA | | 4.00 | 11-15-2024 | | 644,343 | 684,346 |
| GNMA | | 4.00 | 12-20-2047 | | 4,482,885 | 4,852,159 |
| GNMA | | 4.25 | 6-20-2036 | | 296,349 | 323,074 |
| GNMA | | 4.50 | 8-20-2049 | | 1,223,240 | 1,322,627 |
| GNMA | | 5.00 | 7-20-2040 | | 689,947 | 792,477 |
| GNMA | | 6.00 | 8-20-2034 | | 68,012 | 75,289 |
| GNMA | | 6.50 | 12-15-2025 | | 5,227 | 5,829 |
| GNMA | | 6.50 | 5-15-2029 | | 478 | 533 |
| GNMA | | 6.50 | 5-15-2031 | | 635 | 708 |
| GNMA | | 6.50 | 9-20-2033 | | 37,767 | 45,211 |
| GNMA | | 7.00 | 12-15-2022 | | 2,970 | 3,001 |
| GNMA | | 7.00 | 5-15-2026 | | 1,107 | 1,192 |
| GNMA | | 7.00 | 3-15-2028 | | 7,687 | 7,722 |
| GNMA | | 7.00 | 4-15-2031 | | 732 | 745 |
| GNMA | | 7.00 | 8-15-2031 | | 16,945 | 17,737 |
| GNMA | | 7.00 | 3-15-2032 | | 12,769 | 13,083 |
| GNMA | | 7.34 | 10-20-2021 | | 2,373 | 2,383 |
| GNMA | | 7.34 | 9-20-2022 | | 1,455 | 1,460 |
| GNMA | | 8.00 | 6-15-2023 | | 1,415 | 1,477 |
| GNMA | | 8.00 | 12-15-2023 | | 71,494 | 75,535 |
| GNMA | | 8.00 | 2-15-2024 | | 333 | 355 |
| GNMA | | 8.00 | 9-15-2024 | | 1,593 | 1,617 |
| GNMA | | 8.00 | 6-15-2025 | | 32 | 32 |
| GNMA Series 2005-23 Class IO ♀±± | | 0.00 | 6-17-2045 | | 1,591,021 | 159 |
| GNMA Series 2006-32 Class XM ♀±± | | 0.11 | 11-16-2045 | | 3,998,247 | 9,120 |
| GNMA Series 2007-69 Class D ±± | | 5.25 | 6-16-2041 | | 199,436 | 206,100 |
| GNMA Series 2008-22 Class XM ♀±± | | 1.15 | 2-16-2050 | | 10,226,844 | 262,689 |
| GNMA Series 2010-158 Class EI ♀ | | 4.00 | 12-16-2025 | | 4,355,735 | 222,044 |
| GNMA Series 2012-12 Class HD | | 2.00 | 5-20-2062 | | 20,096 | 20,520 |
| GNMA Series 2019-H06 Class HI ♀±± | | 1.75 | 4-20-2069 | | 5,404,134 | 247,533 |
| International Development Finance Corporation | | 2.12 | 3-20-2024 | | 8,570,000 | 8,817,714 |
| Overseas Private Investment Corporation ¤ | | 0.00 | 1-17-2026 | | 2,000,000 | 2,159,209 |
| Resolution Funding Corporation STRIPS ¤ | | 0.00 | 1-15-2030 | | 16,245,000 | 14,075,640 |
| Resolution Funding Corporation STRIPS ¤ | | 0.00 | 7-15-2037 | | 7,035,000 | 4,780,166 |
| Resolution Funding Corporation STRIPS ¤ | | 0.00 | 2-15-2039 | | 20,000,000 | 14,179,044 |
| TVA ¤ | | 0.00 | 11-1-2025 | | 6,900,000 | 6,642,417 |
| TVA | | 4.25 | 9-15-2065 | | 2,600,000 | 3,566,539 |
| TVA | | 4.63 | 9-15-2060 | | 7,550,000 | 10,847,899 |
| TVA | | 5.38 | 4-1-2056 | | 5,000,000 | 7,936,370 |
| TVA | | 5.88 | 4-1-2036 | | 4,380,000 | 6,485,796 |
| Total Agency securities (Cost $529,577,389) | | | | | | 545,613,397 |
The accompanying notes are an integral part of these financial statements.
Wells Fargo Government Securities Fund | 15
Portfolio of investments—February 28, 2021 (unaudited)
| | | Interest
rate | Maturity
date | Principal | Value |
| Asset-backed securities: 2.62% | | | | | | |
| American Tower Trust I 144A | | 3.65% | 3-15-2048 | $ | 4,000,000 | $ 4,375,898 |
| Finance of America HECM Buyout 2020 Series HB2 Class A7 144A±± | | 1.71 | 7-25-2030 | | 3,514,303 | 3,537,825 |
| Navient Student Loan Trust Series 2017-3A Class A2 (1 Month LIBOR+0.60%) 144A± | | 0.73 | 7-26-2066 | | 450,867 | 451,062 |
| Navient Student Loan Trust Series 2018-3A Class A2 (1 Month LIBOR+0.42%) 144A± | | 0.54 | 3-25-2067 | | 1,698,674 | 1,695,841 |
| Navient Student Loan Trust Series 2019-2A Class A2 (1 Month LIBOR+1.00%) 144A± | | 1.13 | 2-27-2068 | | 3,050,000 | 3,112,794 |
| Ocwen Master Advance Receivable Trust Series 2020-T1 Class AT1 144A | | 1.28 | 8-15-2052 | | 4,790,000 | 4,823,855 |
| Tesla Auto Lease Trust Series 2018-B Class A 144A | | 3.71 | 8-20-2021 | | 339,880 | 341,719 |
| Total Asset-backed securities (Cost $17,835,992) | | | | | | 18,338,994 |
| Corporate bonds and notes: 0.85% | | | | | | |
| Financials: 0.30% | | | | | | |
| Diversified financial services: 0.30% | | | | | | |
| GTP Acquisition Partners Corporation 144A | | 3.48 | 6-15-2050 | | 2,000,000 | 2,142,803 |
| Industrials: 0.55% | | | | | | |
| Commercial services & supplies: 0.55% | | | | | | |
| Rockfeller Foundation Class B | | 2.49 | 10-1-2050 | | 4,000,000 | 3,839,529 |
| Total Corporate bonds and notes (Cost $6,148,974) | | | | | | 5,982,332 |
| Municipal obligations: 0.18% | | | | | | |
| Texas: 0.18% | | | | | | |
| Education revenue: 0.18% | | | | | | |
| North Texas Higher Education Authority Incorporated Series 2011-1 Class A1 (3 Month LIBOR +1.10%)± | | 1.34 | 4-1-2040 | | 1,272,669 | 1,283,716 |
| Total Municipal obligations (Cost $1,270,345) | | | | | | 1,283,716 |
| Non-agency mortgage-backed securities: 8.62% | | | | | | |
| Angel Oak Mortgage Trust I LLC Series 2020-4 Class A1 144A±± | | 1.47 | 6-25-2065 | | 2,293,418 | 2,315,786 |
| Arroyo Mortgage Trust Series 2019-1 Class A1 144A±± | | 3.81 | 1-25-2049 | | 2,992,235 | 3,095,178 |
| Benchmark Mortgage Trust Series 2018-B1 Class A4 | | 3.40 | 1-15-2051 | | 305,000 | 333,146 |
| Bravo Residential Funding Trust Series 2020-RPL1 Class A1 144A±± | | 2.50 | 5-26-2059 | | 3,672,334 | 3,745,293 |
| BX Trust Series 2019-OC11 Class A 144A | | 3.20 | 12-9-2041 | | 3,030,000 | 3,253,129 |
| CD Commercial Mortgage Trust Series 2014-CR16 Class A3 | | 3.78 | 4-10-2047 | | 2,641,668 | 2,826,959 |
| CD Commercial Mortgage Trust Series 2017-6 Class A5 | | 3.46 | 11-13-2050 | | 2,340,000 | 2,591,281 |
| Goldman Sachs Mortgage Securities Trust Series 2013-G1 Class A2 144A±± | | 3.56 | 4-10-2031 | | 5,349,842 | 5,337,820 |
| Goldman Sachs Mortgage Securities Trust Series 2014-GC24 Class A4 | | 3.67 | 9-10-2047 | | 4,165,000 | 4,460,064 |
| Gracie Point International Series 2020-B Class A (1 Month LIBOR+1.40%)144A± | | 1.52 | 5-2-2023 | | 2,924,886 | 2,929,739 |
| JPMorgan Chase Commercial Mortgage Securities Corporation Series 2015-C28 Class A4 | | 3.23 | 10-15-2048 | | 5,000,000 | 5,416,516 |
| Legacy Mortgage Asset Trust Series 2020-RPL1 Class A1 144A±± | | 3.00 | 9-25-2059 | | 3,961,436 | 4,163,942 |
The accompanying notes are an integral part of these financial statements.
16 | Wells Fargo Government Securities Fund
Portfolio of investments—February 28, 2021 (unaudited)
| | | Interest
rate | Maturity
date | Principal | Value |
| Non-agency mortgage-backed securities (continued) | | | | | | |
| Mello Warehouse Securitization Trust Series 2019-1 Class A (1 Month LIBOR+0.80%)144A± | | 0.92% | 6-25-2052 | $ | 3,000,000 | $ 3,002,210 |
| MMAF Equipment Finance LLC Series 2017-AA Class A4 | | 2.41 | 8-16-2024 | | 2,586,785 | 2,611,704 |
| Morgan Stanley Capital I Trust Series 2011-C2 Class A4 144A | | 4.66 | 6-15-2044 | | 2,106,010 | 2,125,421 |
| New Residential Mortgage Loan Series 2020-NQM2 Class A1 144A±± | | 1.65 | 5-24-2060 | | 1,595,219 | 1,606,170 |
| Starwood Mortgage Residential Trust Series 2019-1 Class A1 144A±± | | 2.94 | 6-25-2049 | | 1,251,597 | 1,270,262 |
| Towd Point Mortgage Trust Series 2015-2 Class 1M2 144A±± | | 3.52 | 11-25-2060 | | 2,780,000 | 2,930,944 |
| Towd Point Mortgage Trust Series 2019-SJ3 Class A1 144A±± | | 3.00 | 11-25-2059 | | 1,653,613 | 1,668,798 |
| UBS Commercial Mortgage Trust Series 2017-C5 Class A5 | | 3.47 | 11-15-2050 | | 2,581,000 | 2,834,910 |
| Vendee Mortgage Trust Series 1995-1 Class 4 ±± | | 8.27 | 2-15-2025 | | 82,510 | 90,980 |
| Vendee Mortgage Trust Series 1995-2C Class 3A | | 8.79 | 6-15-2025 | | 108,222 | 123,007 |
| Vendee Mortgage Trust Series 2011-1 Class DA | | 3.75 | 2-15-2035 | | 35,307 | 35,322 |
| Verus Securitization Trust Series 2019-2 Class A1 144A±± | | 3.21 | 5-25-2059 | | 1,592,766 | 1,600,635 |
| Total Non-agency mortgage-backed securities (Cost $58,971,941) | | | | | | 60,369,216 |
| U.S. Treasury securities: 13.10% | | | | | | |
| TIPS | | 0.13 | 7-15-2030 | | 1,691,457 | 1,852,740 |
| TIPS | | 0.13 | 1-15-2031 | | 4,742,702 | 5,169,082 |
| TIPS | | 1.38 | 2-15-2044 | | 3,067,785 | 4,112,689 |
| U.S. Treasury Bond | | 1.13 | 5-15-2040 | | 2,945,000 | 2,529,939 |
| U.S. Treasury Bond | | 1.38 | 11-15-2040 | | 12,940,000 | 11,573,213 |
| U.S. Treasury Bond | | 1.63 | 11-15-2050 | | 9,140,000 | 8,127,459 |
| U.S. Treasury Bond | | 1.88 | 2-15-2051 | | 7,970,000 | 7,546,594 |
| U.S. Treasury Bond | | 2.38 | 11-15-2049 | | 5,355,000 | 5,659,147 |
| U.S. Treasury Note | | 0.38 | 4-30-2025 | | 8,815,000 | 8,751,987 |
| U.S. Treasury Note | | 0.38 | 11-30-2025 | | 8,810,000 | 8,685,077 |
| U.S. Treasury Note | | 0.38 | 1-31-2026 | | 5,700,000 | 5,607,375 |
| U.S. Treasury Note %% | | 0.50 | 2-28-2026 | | 14,315,000 | 14,165,140 |
| U.S. Treasury Note | | 1.13 | 2-15-2031 | | 8,150,000 | 7,950,070 |
| Total U.S. Treasury securities (Cost $93,990,176) | | | | | | 91,730,512 |
| Yankee corporate bonds and notes: 0.36% | | | | | | |
| Financials: 0.36% | | | | | | |
| Banks: 0.36% | | | | | | |
| Inter-American Development Bank | | 7.00 | 6-15-2025 | | 2,000,000 | 2,519,382 |
| Total Yankee corporate bonds and notes (Cost $2,288,608) | | | | | | 2,519,382 |
| Yankee government bonds: 4.35% | | | | | | |
| State of Israel | | 5.50 | 12-4-2023 | | 17,750,000 | 20,291,838 |
| State of Israel | | 5.50 | 9-18-2033 | | 1,585,000 | 2,238,870 |
| U.S. International Development Finance Corporation | | 2.82 | 3-20-2024 | | 7,605,000 | 7,920,473 |
| Total Yankee government bonds (Cost $30,394,217) | | | | | | 30,451,181 |
The accompanying notes are an integral part of these financial statements.
Wells Fargo Government Securities Fund | 17
Portfolio of investments—February 28, 2021 (unaudited)
| | | Yield | | | Shares | Value |
| Short-term investments: 6.73% | | | | | | |
| Investment companies: 6.73% | | | | | | |
| Wells Fargo Government Money Market Fund Select Class ♠∞## | | 0.03% | | | 47,094,980 | $ 47,094,980 |
| Total Short-term investments (Cost $47,094,980) | | | | | | 47,094,980 |
| Total investments in securities (Cost $787,572,622) | 114.73% | | | | | 803,383,710 |
| Other assets and liabilities, net | (14.73) | | | | | (103,152,370) |
| Total net assets | 100.00% | | | | | $ 700,231,340 |
| ¤ | The security is issued in zero coupon form with no periodic interest payments. |
| ± | Variable rate investment. The rate shown is the rate in effect at period end. |
| ±± | The coupon of the security is adjusted based on the principal and interest payments received from the underlying pool of mortgages as well as the credit quality and the actual prepayment speed of the underlying mortgages. |
| ♀ | Investment in an interest-only security entitles holders to receive only the interest payments on the underlying mortgages. The principal amount shown is the notional amount of the underlying mortgages. The rate represents the coupon rate. |
| 144A | The security may be resold in transactions exempt from registration, normally to qualified institutional buyers, pursuant to Rule 144A under the Securities Act of 1933. |
| ## | All or a portion of this security is segregated for when-issued securities. |
| ♠ | The issuer of the security is an affiliated person of the Fund as defined in the Investment Company Act of 1940. |
| ∞ | The rate represents the 7-day annualized yield at period end. |
| %% | The security is purchased on a when-issued basis. |
| Abbreviations: |
| FHLB | Federal Home Loan Bank |
| FHLMC | Federal Home Loan Mortgage Corporation |
| FNMA | Federal National Mortgage Association |
| GNMA | Government National Mortgage Association |
| LIBOR | London Interbank Offered Rate |
| SOFR | Secured Overnight Financing Rate |
| STRIPS | Separate trading of registered interest and principal securities |
| TIPS | Treasury inflation-protected securities |
| TVA | Tennessee Valley Authority |
Investments in affiliates
An affiliated investment is an investment in which the Fund owns at least 5% of the outstanding voting shares of the issuer or as a result of other relationships, such as the Fund and the issuer having the same investment manager. Transactions with issuers that were either affiliated persons of the Fund at the beginning of the period or the end of the period were as follows:
| | Value,
beginning of
period | Purchases | Sales
proceeds | Net
realized
gains
(losses) | Net
change in
unrealized
gains
(losses) | Value,
end of
period | % of
net
assets | Shares,
end
of period | Income
from
affiliated
securities |
| Short-term investments | | | | | | | | | |
| Investment companies | | | | | | | | | |
| Wells Fargo Government Money Market Fund Select Class | $74,603,629 | $133,240,490 | $(160,749,139) | $0 | $0 | $47,094,980 | 6.73% | 47,094,980 | $10,289 |
The accompanying notes are an integral part of these financial statements.
18 | Wells Fargo Government Securities Fund
Portfolio of investments—February 28, 2021 (unaudited)
Futures contracts
| Description | Number of
contracts | Expiration
date | Notional
cost | Notional
value | Unrealized
gains | | Unrealized
losses |
| Long | | | | | | | |
| 2-Year U.S. Treasury Notes | 288 | 6-30-2021 | $ 63,634,959 | $ 63,580,500 | $ 0 | | $ (54,459) |
| 5-Year U.S. Treasury Notes | 243 | 6-30-2021 | 30,375,377 | 30,124,406 | 0 | | (250,971) |
| Short | | | | | | | |
| 10-Year U.S. Treasury Notes | (159) | 6-21-2021 | (21,278,782) | (21,102,281) | 176,501 | | 0 |
| 10-Year Ultra Futures | (282) | 6-21-2021 | (41,775,177) | (41,550,938) | 224,239 | | 0 |
| U.S. Long Term Bonds | (168) | 6-21-2021 | (26,754,820) | (26,748,750) | 6,070 | | 0 |
| U.S. Ultra Bond | (111) | 6-21-2021 | (20,745,436) | (20,985,938) | 0 | | (240,502) |
| | | | | | $406,810 | | $(545,932) |
The accompanying notes are an integral part of these financial statements.
Wells Fargo Government Securities Fund | 19
Statement of assets and liabilities—February 28, 2021 (unaudited)
| | |
| Assets | |
Investments in unaffiliated securities, at value (cost $740,477,642)
| $ 756,288,730 |
Investments in affiliated securites, at value (cost $47,094,980)
| 47,094,980 |
Cash
| 113,315 |
Receivable for investments sold
| 6,971,411 |
Segregated cash for futures contracts
| 4,213,096 |
Receivable for interest
| 2,571,498 |
Receivable for Fund shares sold
| 611,568 |
Principal paydown receivable
| 173,492 |
Prepaid expenses and other assets
| 20,354 |
Total assets
| 818,058,444 |
| Liabilities | |
Payable for investments purchased
| 101,265,806 |
Payable for when-issued transactions
| 14,165,140 |
Payable for Fund shares redeemed
| 1,097,330 |
Payable for daily variation margin on open futures contracts
| 704,947 |
Management fee payable
| 194,327 |
Dividends payable
| 133,841 |
Administration fees payable
| 61,872 |
Distribution fee payable
| 2,740 |
Trustees’ fees and expenses payable
| 2,028 |
Accrued expenses and other liabilities
| 199,073 |
Total liabilities
| 117,827,104 |
Total net assets
| $700,231,340 |
| Net assets consist of | |
Paid-in capital
| $ 692,943,051 |
Total distributable earnings
| 7,288,289 |
Total net assets
| $700,231,340 |
| Computation of net asset value and offering price per share | |
Net assets – Class A
| $ 269,768,676 |
Shares outstanding – Class A1
| 23,463,494 |
Net asset value per share – Class A
| $11.50 |
Maximum offering price per share – Class A2
| $12.04 |
Net assets – Class C
| $ 4,489,513 |
Shares outstanding – Class C1
| 390,473 |
Net asset value per share – Class C
| $11.50 |
Net assets – Administrator Class
| $ 109,432,193 |
Shares outstanding – Administrator Class1
| 9,522,055 |
Net asset value per share – Administrator Class
| $11.49 |
Net assets – Institutional Class
| $ 316,540,958 |
Shares outstanding – Institutional Class1
| 27,542,450 |
Net asset value per share – Institutional Class
| $11.49 |
| 1 | The Fund has an unlimited number of authorized shares |
| 2 | Maximum offering price is computed as 100/95.50 of net asset value. On investments of $50,000 or more, the offering price is reduced. |
The accompanying notes are an integral part of these financial statements.
20 | Wells Fargo Government Securities Fund
Statement of operations—six months ended February 28, 2021 (unaudited)
| | |
| Investment income | |
Interest
| $ 6,619,546 |
Income from affiliated securities
| 10,289 |
Total investment income
| 6,629,835 |
| Expenses | |
Management fee
| 1,586,981 |
| Administration fees | |
Class A
| 220,410 |
Class C
| 4,931 |
Administrator Class
| 57,950 |
Institutional Class
| 128,028 |
| Shareholder servicing fees | |
Class A
| 344,391 |
Class C
| 7,704 |
Administrator Class
| 144,707 |
| Distribution fee | |
Class C
| 23,112 |
Custody and accounting fees
| 28,890 |
Professional fees
| 35,765 |
Registration fees
| 29,724 |
Shareholder report expenses
| 21,341 |
Trustees’ fees and expenses
| 9,557 |
Other fees and expenses
| 12,241 |
Total expenses
| 2,655,732 |
| Less: Fee waivers and/or expense reimbursements | |
Fund-level
| (175,365) |
Class A
| (17,458) |
Administrator Class
| (55,250) |
Institutional Class
| (64,481) |
Net expenses
| 2,343,178 |
Net investment income
| 4,286,657 |
| Realized and unrealized gains (losses) on investments | |
| Net realized gains on | |
Unaffiliated securities
| 2,376,953 |
Futures contracts
| 8,858,225 |
Net realized gains on investments
| 11,235,178 |
| Net change in unrealized gains (losses) on | |
Unaffiliated securities
| (20,868,261) |
Futures contracts
| (429,604) |
Net change in unrealized gains (losses) on investments
| (21,297,865) |
Net realized and unrealized gains (losses) on investments
| (10,062,687) |
Net decrease in net assets resulting from operations
| $ (5,776,030) |
The accompanying notes are an integral part of these financial statements.
Wells Fargo Government Securities Fund | 21
Statement of changes in net assets
| | |
| | Six months ended
February 28, 2021
(unaudited) | Year ended
August 31, 2020 |
| Operations | | | | |
Net investment income
| | $ 4,286,657 | | $ 10,941,962 |
Net realized gains on investments
| | 11,235,178 | | 15,509,427 |
Net change in unrealized gains (losses) on investments
| | (21,297,865) | | 5,626,871 |
Net increase (decrease) in net assets resulting from operations
| | (5,776,030) | | 32,078,260 |
| Distributions to shareholders from | | | | |
| Net investment income and net realized gains | | | | |
Class A
| | (1,578,849) | | (4,370,123) |
Class C
| | (11,653) | | (91,882) |
Administrator Class
| | (778,572) | | (2,040,552) |
Institutional Class
| | (2,407,673) | | (4,903,457) |
| Tax basis return of capital | | | | |
Class A
| | 0 | | (332,033) |
Class C
| | 0 | | (12,945) |
Administrator Class
| | 0 | | (138,534) |
Institutional Class
| | 0 | | (312,817) |
Total distributions to shareholders
| | (4,776,747) | | (12,202,343) |
| Capital share transactions | Shares | | Shares | |
| Proceeds from shares sold | | | | |
Class A
| 2,224,237 | 25,887,685 | 4,977,612 | 57,271,993 |
Class C
| 64,376 | 749,630 | 431,622 | 4,971,124 |
Administrator Class
| 1,591,999 | 18,502,297 | 4,578,704 | 52,520,201 |
Institutional Class
| 6,452,994 | 74,993,226 | 18,855,445 | 217,274,023 |
| | | 120,132,838 | | 332,037,341 |
| Reinvestment of distributions | | | | |
Class A
| 120,172 | 1,395,404 | 367,990 | 4,202,063 |
Class C
| 882 | 10,244 | 3,761 | 42,977 |
Administrator Class
| 65,904 | 764,893 | 187,125 | 2,137,702 |
Institutional Class
| 156,947 | 1,821,422 | 333,117 | 3,815,534 |
| | | 3,991,963 | | 10,198,276 |
| Payment for shares redeemed | | | | |
Class A
| (2,562,577) | (29,771,254) | (5,711,802) | (65,356,355) |
Class C
| (322,656) | (3,749,409) | (762,500) | (8,814,689) |
Administrator Class
| (2,440,345) | (28,367,002) | (386,661) | (44,337,143) |
Institutional Class
| (7,283,255) | (84,586,913) | (9,584,688) | (110,260,602) |
| | | (146,474,578) | | (228,768,789) |
Net increase (decrease) in net assets resulting from capital share transactions
| | (22,349,777) | | 113,466,828 |
Total increase (decrease) in net assets
| | (32,902,554) | | 133,342,745 |
| Net assets | | | | |
Beginning of period
| | 733,133,894 | | 599,791,149 |
End of period
| | $ 700,231,340 | | $ 733,133,894 |
The accompanying notes are an integral part of these financial statements.
22 | Wells Fargo Government Securities Fund
Financial highlights
(For a share outstanding throughout each period)
| | | Year ended August 31 |
| Class A | Six months ended
February 28, 2021
(unaudited) | 2020 | 2019 | 2018 | 2017 | 2016 |
Net asset value, beginning of period
| $11.67 | $11.31 | $10.65 | $11.01 | $11.51 | $11.22 |
Net investment income
| 0.06 | 0.18 1 | 0.23 | 0.19 | 0.15 | 0.11 1 |
Net realized and unrealized gains (losses) on investments
| (0.16) | 0.38 | 0.68 | (0.35) | (0.22) | 0.34 |
Total from investment operations
| (0.10) | 0.56 | 0.91 | (0.16) | (0.07) | 0.45 |
| Distributions to shareholders from | | | | | | |
Net investment income
| (0.07) | (0.19) | (0.25) | (0.20) | (0.16) | (0.10) |
Net realized gains
| 0.00 | 0.00 | 0.00 | 0.00 | (0.27) | (0.06) |
Tax basis return of capital
| 0.00 | (0.01) | 0.00 | 0.00 | 0.00 | 0.00 |
Total distributions to shareholders
| (0.07) | (0.20) | (0.25) | (0.20) | (0.43) | (0.16) |
Net asset value, end of period
| $11.50 | $11.67 | $11.31 | $10.65 | $11.01 | $11.51 |
Total return2
| (0.89)% | 5.02% | 8.65% | (1.44)% | (0.52)% | 4.03% |
| Ratios to average net assets (annualized) | | | | | | |
Gross expenses
| 0.89% | 0.91% | 0.91% | 0.90% | 0.88% | 0.87% |
Net expenses
| 0.84% | 0.84% | 0.85% | 0.85% | 0.85% | 0.85% |
Net investment income
| 1.01% | 1.56% | 2.20% | 1.86% | 1.38% | 0.94% |
| Supplemental data | | | | | | |
Portfolio turnover rate
| 100% | 111% | 178% | 197% | 299% | 397% |
Net assets, end of period (000s omitted)
| $269,769 | $276,310 | $271,986 | $292,550 | $394,645 | $483,112 |
| 1 | Calculated based upon average shares outstanding |
| 2 | Total return calculations do not include any sales charges. Returns for periods of less than one year are not annualized. |
The accompanying notes are an integral part of these financial statements.
Wells Fargo Government Securities Fund | 23
Financial highlights
(For a share outstanding throughout each period)
| | | Year ended August 31 |
| Class C | Six months ended
February 28, 2021
(unaudited) | 2020 | 2019 | 2018 | 2017 | 2016 |
Net asset value, beginning of period
| $11.67 | $11.31 | $10.65 | $11.01 | $11.51 | $11.21 |
Net investment income
| 0.01 1 | 0.09 1 | 0.15 1 | 0.12 1 | 0.07 1 | 0.02 1 |
Net realized and unrealized gains (losses) on investments
| (0.16) | 0.38 | 0.68 | (0.36) | (0.23) | 0.36 |
Total from investment operations
| (0.15) | 0.47 | 0.83 | (0.24) | (0.16) | 0.38 |
| Distributions to shareholders from | | | | | | |
Net investment income
| (0.02) | (0.10) | (0.17) | (0.12) | (0.07) | (0.02) |
Net realized gains
| 0.00 | 0.00 | 0.00 | 0.00 | (0.27) | (0.06) |
Tax basis return of capital
| 0.00 | (0.01) | 0.00 | 0.00 | 0.00 | 0.00 |
Total distributions to shareholders
| (0.02) | (0.11) | (0.17) | (0.12) | (0.34) | (0.08) |
Net asset value, end of period
| $11.50 | $11.67 | $11.31 | $10.65 | $11.01 | $11.51 |
Total return2
| (1.27)% | 4.24% | 7.84% | (2.18)% | (1.26)% | 3.25% |
| Ratios to average net assets (annualized) | | | | | | |
Gross expenses
| 1.64% | 1.66% | 1.66% | 1.65% | 1.61% | 1.62% |
Net expenses
| 1.60% | 1.60% | 1.60% | 1.60% | 1.60% | 1.60% |
Net investment income
| 0.24% | 0.81% | 1.44% | 1.12% | 0.63% | 0.16% |
| Supplemental data | | | | | | |
Portfolio turnover rate
| 100% | 111% | 178% | 197% | 299% | 397% |
Net assets, end of period (000s omitted)
| $4,490 | $7,560 | $11,026 | $15,508 | $20,132 | $27,085 |
| 1 | Calculated based upon average shares outstanding |
| 2 | Total return calculations do not include any sales charges. Returns for periods of less than one year are not annualized. |
The accompanying notes are an integral part of these financial statements.
24 | Wells Fargo Government Securities Fund
Financial highlights
(For a share outstanding throughout each period)
| | | Year ended August 31 |
| Administrator Class | Six months ended
February 28, 2021
(unaudited) | 2020 | 2019 | 2018 | 2017 | 2016 |
Net asset value, beginning of period
| $11.66 | $11.31 | $10.65 | $11.01 | $11.51 | $11.21 |
Net investment income
| 0.07 1 | 0.20 | 0.26 1 | 0.22 1 | 0.18 1 | 0.13 |
Net realized and unrealized gains (losses) on investments
| (0.16) | 0.37 | 0.67 | (0.35) | (0.23) | 0.36 |
Total from investment operations
| (0.09) | 0.57 | 0.93 | (0.13) | (0.05) | 0.49 |
| Distributions to shareholders from | | | | | | |
Net investment income
| (0.08) | (0.21) | (0.27) | (0.23) | (0.18) | (0.13) |
Net realized gains
| 0.00 | 0.00 | 0.00 | 0.00 | (0.27) | (0.06) |
Tax basis return of capital
| 0.00 | (0.01) | 0.00 | 0.00 | 0.00 | 0.00 |
Total distributions to shareholders
| (0.08) | (0.22) | (0.27) | (0.23) | (0.45) | (0.19) |
Net asset value, end of period
| $11.49 | $11.66 | $11.31 | $10.65 | $11.01 | $11.51 |
Total return2
| (0.80)% | 5.15% | 8.88% | (1.23)% | (0.31)% | 4.34% |
| Ratios to average net assets (annualized) | | | | | | |
Gross expenses
| 0.83% | 0.85% | 0.85% | 0.84% | 0.82% | 0.81% |
Net expenses
| 0.64% | 0.64% | 0.64% | 0.64% | 0.64% | 0.64% |
Net investment income
| 1.21% | 1.75% | 2.42% | 2.07% | 1.60% | 1.13% |
| Supplemental data | | | | | | |
Portfolio turnover rate
| 100% | 111% | 178% | 197% | 299% | 397% |
Net assets, end of period (000s omitted)
| $109,432 | $120,181 | $106,355 | $91,671 | $198,520 | $229,169 |
| 1 | Calculated based upon average shares outstanding |
| 2 | Returns for periods of less than one year are not annualized. |
The accompanying notes are an integral part of these financial statements.
Wells Fargo Government Securities Fund | 25
Financial highlights
(For a share outstanding throughout each period)
| | | Year ended August 31 |
| Institutional Class | Six months ended
February 28, 2021
(unaudited) | 2020 | 2019 | 2018 | 2017 | 2016 |
Net asset value, beginning of period
| $11.66 | $11.31 | $10.65 | $11.00 | $11.50 | $11.21 |
Net investment income
| 0.08 1 | 0.21 1 | 0.27 1 | 0.24 1 | 0.19 1 | 0.15 |
Net realized and unrealized gains (losses) on investments
| (0.16) | 0.38 | 0.68 | (0.35) | (0.22) | 0.35 |
Total from investment operations
| (0.08) | 0.59 | 0.95 | (0.11) | (0.03) | 0.50 |
| Distributions to shareholders from | | | | | | |
Net investment income
| (0.09) | (0.23) | (0.29) | (0.24) | (0.20) | (0.15) |
Net realized gains
| 0.00 | 0.00 | 0.00 | 0.00 | (0.27) | (0.06) |
Tax basis return of capital
| 0.00 | (0.01) | 0.00 | 0.00 | 0.00 | 0.00 |
Total distributions to shareholders
| (0.09) | (0.24) | (0.29) | (0.24) | (0.47) | (0.21) |
Net asset value, end of period
| $11.49 | $11.66 | $11.3 | $10.65 | $11.00 | $11.50 |
Total return2
| (0.72)% | 5.31% | 9.05% | (0.99)% | (0.15)% | 4.42% |
| Ratios to average net assets (annualized) | | | | | | |
Gross expenses
| 0.56% | 0.58% | 0.58% | 0.57% | 0.55% | 0.54% |
Net expenses
| 0.48% | 0.48% | 0.48% | 0.48% | 0.48% | 0.48% |
Net investment income
| 1.37% | 1.87% | 2.56% | 2.22% | 1.75% | 1.28% |
| Supplemental data | | | | | | |
Portfolio turnover rate
| 100% | 111% | 178% | 197% | 299% | 397% |
Net assets, end of period (000s omitted)
| $316,541 | $329,083 | $210,424 | $310,966 | $416,834 | $487,113 |
| 1 | Calculated based upon average shares outstanding |
| 2 | Returns for periods of less than one year are not annualized. |
The accompanying notes are an integral part of these financial statements.
26 | Wells Fargo Government Securities Fund
Notes to financial statements (unaudited)
1. ORGANIZATION
Wells Fargo Funds Trust (the “Trust”), a Delaware statutory trust organized on March 10, 1999, is an open-end management investment company registered under the Investment Company Act of 1940, as amended (the “1940 Act”). As an investment company, the Trust follows the accounting and reporting guidance in Financial Accounting Standards Board (“FASB”) Accounting Standards Codification Topic 946, Financial Services – Investment Companies. These financial statements report on the Wells Fargo Government Securities Fund (the “Fund”) which is a diversified series of the Trust.
On February 23, 2021, Wells Fargo & Company announced that it has entered into a definitive agreement to sell Wells Fargo Asset Management (“WFAM”) to GTCR LLC and Reverence Capital Partners, L.P. WFAM is the trade name used by the asset management businesses of Wells Fargo & Company and includes Wells Fargo Funds Management, LLC, the investment manager to the Fund, Wells Capital Management Incorporated and Wells Fargo Asset Management (International) Limited, both registered investment advisers providing sub-advisory services to certain funds, and Wells Fargo Funds Distributor, LLC, the Fund's principal underwriter. As part of the transaction, Wells Fargo & Company will own a 9.9% equity interest and will continue to serve as an important client and distribution partner. The transaction is expected to close in the second half of 2021, subject to customary closing conditions.
Consummation of the transaction will result in the automatic termination of the Fund's investment management agreement and sub-advisory agreement. The Fund's Board of Trustees will be asked to approve new investment management arrangements with the new company. If approved by the Board, the new investment management arrangements with the new company will be presented to the shareholders of the Fund for approval, and, if approved by shareholders, would take effect upon the closing of the transaction. The transaction is expected to close in the second half of 2021, subject to customary closing conditions.
2. SIGNIFICANT ACCOUNTING POLICIES
The following significant accounting policies, which are consistently followed in the preparation of the financial statements of the Fund, are in conformity with U.S. generally accepted accounting principles which require management to make estimates and assumptions that affect the reported amounts of assets and liabilities, disclosure of contingent assets and liabilities at the date of the financial statements, and the reported amounts of income and expenses during the reporting period. Actual results could differ from those estimates.
Securities valuation
All investments are valued each business day as of the close of regular trading on the New York Stock Exchange (generally 4 p.m. Eastern Time), although the Fund may deviate from this calculation time under unusual or unexpected circumstances.
Debt securities are valued at the evaluated bid price provided by an independent pricing service (e.g. taking into account various factors, including yields, maturities, or credit ratings) or, if a reliable price is not available, the quoted bid price from an independent broker-dealer.
Futures contracts that are listed on a foreign or domestic exchange or market are valued at the official closing price or, if none, the last sales price.
Investments in registered open-end investment companies are valued at net asset value.
Investments which are not valued using any of the methods discussed above are valued at their fair value, as determined in good faith by the Board of Trustees. The Board of Trustees has established a Valuation Committee comprised of the Trustees and has delegated to it the authority to take any actions regarding the valuation of portfolio securities that the Valuation Committee deems necessary or appropriate, including determining the fair value of portfolio securities, unless the determination has been delegated to the Wells Fargo Asset Management Pricing Committee at Wells Fargo Funds Management, LLC (“Funds Management”). The Board of Trustees retains the authority to make or ratify any valuation decisions or approve any changes to the Valuation Procedures as it deems appropriate. On a quarterly basis, the Board of Trustees receives reports on any valuation actions taken by the Valuation Committee or the Wells Fargo Asset Management Pricing Committee which may include items for ratification.
When-issued transactions
The Fund may purchase securities on a forward commitment or when-issued basis. The Fund records a when-issued transaction on the trade date and will segregate assets in an amount at least equal in value to the Fund's commitment to purchase when-issued securities. Securities purchased on a when-issued basis are marked-to-market daily and the Fund begins earning interest on the settlement date. Losses may arise due to changes in the market value of the underlying securities or if the counterparty does not perform under the contract.
Wells Fargo Government Securities Fund | 27
Notes to financial statements (unaudited)
Futures contracts
Futures contracts are agreements between the Fund and a counterparty to buy or sell a specific amount of a commodity, financial instrument or currency at a specified price on a specified date. The Fund may buy and sell futures contracts in order to gain exposure to, or protect against, changes in interest rates and is subject to interest rate risk. The primary risks associated with the use of futures contracts are the imperfect correlation between changes in market values of securities held by the Fund and the prices of futures contracts, and the possibility of an illiquid market. Futures contracts are generally entered into on a regulated futures exchange and cleared through a clearinghouse associated with the exchange. With futures contracts, there is minimal counterparty risk to the Fund since futures contracts are exchange traded and the exchange’s clearinghouse, as the counterparty to all exchange traded futures, guarantees the futures contracts against default.
Upon entering into a futures contract, the Fund is required to deposit either cash or securities (initial margin) with the broker in an amount equal to a certain percentage of the contract value. Subsequent payments (variation margin) are paid to or from the broker each day equal to the daily changes in the contract value. Such payments are recorded as unrealized gains or losses and, if any, shown as variation margin receivable (payable) in the Statement of Assets and Liabilities. Should the Fund fail to make requested variation margin payments, the broker can gain access to the initial margin to satisfy the Fund’s payment obligations. When the contracts are closed, a realized gain or loss is recorded in the Statement of Operations.
Security transactions and income recognition
Securities transactions are recorded on a trade date basis. Realized gains or losses are recorded on the basis of identified cost.
Interest income is accrued daily and bond discounts are accreted and premiums are amortized daily. To the extent debt obligations are placed on non-accrual status, any related interest income may be reduced by writing off interest receivables when the collection of all or a portion of interest has been determined to be doubtful based on consistently applied procedures and the fair value has decreased. If the issuer subsequently resumes interest payments or when the collectability of interest is reasonably assured, the debt obligation is removed from non-accrual status. Paydown gains and losses are included in interest income.
Distributions to shareholders
Distributions to shareholders from net investment income are declared daily and paid monthly. Distributions from net realized gains, if any, are recorded on the ex-dividend date and paid at least annually. Such distributions are determined in accordance with income tax regulations and may differ from U.S. generally accepted accounting principles. Dividend sources are estimated at the time of declaration. The tax character of distributions is determined as of the Fund’s fiscal year end. Therefore, a portion of the Fund’s distributions made prior to the Fund’s fiscal year end may be categorized as a tax return of capital at year end.
Federal and other taxes
The Fund intends to continue to qualify as a regulated investment company by distributing substantially all of its investment company taxable income and any net realized capital gains (after reduction for capital loss carryforwards) sufficient to relieve it from all, or substantially all, federal income taxes. Accordingly, no provision for federal income taxes was required.
The Fund’s income and federal excise tax returns and all financial records supporting those returns for the prior three fiscal years are subject to examination by the federal and Delaware revenue authorities. Management has analyzed the Fund's tax positions taken on federal, state, and foreign tax returns for all open tax years and does not believe that there are any uncertain tax positions that require recognition of a tax liability.
As of February 28, 2021, the aggregate cost of all investments for federal income tax purposes was $801,600,399 and the unrealized gains (losses) consisted of:
| Gross unrealized gains | $ 26,346,872 |
| Gross unrealized losses | (24,702,683) |
| Net unrealized gains | $ 1,644,189 |
As of August 31, 2020, the Fund had capital loss carryforwards which consisted of $4,706,777 in short-term capital losses .
Class allocations
The separate classes of shares offered by the Fund differ principally in applicable sales charges, distribution, shareholder servicing, and administration fees. Class specific expenses are charged directly to that share class. Investment income, common fund-level expenses, and realized and unrealized gains (losses) on investments are allocated daily to each class of shares based on the relative proportion of net assets of each class.
28 | Wells Fargo Government Securities Fund
Notes to financial statements (unaudited)
3. FAIR VALUATION MEASUREMENTS
Fair value measurements of investments are determined within a framework that has established a fair value hierarchy based upon the various data inputs utilized in determining the value of the Fund’s investments. The three-level hierarchy gives the highest priority to unadjusted quoted prices in active markets for identical assets or liabilities (Level 1) and the lowest priority to unobservable inputs (Level 3). The Fund’s investments are classified within the fair value hierarchy based on the lowest level of input that is significant to the fair value measurement. The inputs are summarized into three broad levels as follows:
| ■ | Level 1 – quoted prices in active markets for identical securities |
| ■ | Level 2 – other significant observable inputs (including quoted prices for similar securities, interest rates, prepayment speeds, credit risk, etc.) |
| ■ | Level 3 – significant unobservable inputs (including the Fund’s own assumptions in determining the fair value of investments) |
The inputs or methodologies used for valuing investments in securities are not necessarily an indication of the risk associated with investing in those securities.
The following is a summary of the inputs used in valuing the Fund’s assets and liabilities as of February 28, 2021:
| | Quoted prices
(Level 1) | Other significant
observable inputs
(Level 2) | Significant
unobservable inputs
(Level 3) | Total |
| Assets | | | | |
| Investments in: | | | | |
| Agency securities | $ 0 | $ 545,613,397 | $0 | $ 545,613,397 |
| Asset-backed securities | 0 | 18,338,994 | 0 | 18,338,994 |
| Corporate bonds and notes | 0 | 5,982,332 | 0 | 5,982,332 |
| Municipal obligations | 0 | 1,283,716 | 0 | 1,283,716 |
| Non-agency mortgage-backed securities | 0 | 60,369,216 | 0 | 60,369,216 |
| U.S. Treasury securities | 91,730,512 | 0 | 0 | 91,730,512 |
| Yankee corporate bonds and notes | 0 | 2,519,382 | 0 | 2,519,382 |
| Yankee government bonds | 0 | 30,451,181 | 0 | 30,451,181 |
| Short-term investments | | | | |
| Investment companies | 47,094,980 | 0 | 0 | 47,094,980 |
| | 138,825,492 | 664,558,218 | 0 | 803,383,710 |
| Futures contracts | 406,810 | 0 | 0 | 406,810 |
| Total assets | $139,232,302 | $664,558,218 | $0 | $803,790,520 |
| Liabilities | | | | |
| Futures contracts | $ 545,932 | $ 0 | $0 | $ 545,932 |
| Total liabilities | $ 545,932 | $ 0 | $0 | $ 545,932 |
Futures contracts are reported at their cumulative unrealized gains (losses) at measurement date as reported in the table following the Portfolio of Investments. For futures contracts, the current day’s variation margin is reported on the Statement of Assets and Liabilities. All other assets and liabilities are reported at their market value at measurement date.
Additional sector, industry or geographic detail, if any, is included in the Portfolio of Investments.
For the six months ended February 28, 2021, the Fund did not have any transfers into/out of Level 3.
Wells Fargo Government Securities Fund | 29
Notes to financial statements (unaudited)
4. TRANSACTIONS WITH AFFILIATES
Management fee
Funds Management, an indirect wholly owned subsidiary of Wells Fargo & Company (“Wells Fargo”), is the manager of the Fund and provides advisory and fund-level administrative services under an investment management agreement. Under the investment management agreement, Funds Management is responsible for, among other services, implementing the investment objectives and strategies of the Fund, supervising the subadviser and providing fund-level administrative services in connection with the Fund’s operations. As compensation for its services under the investment management agreement, Funds Management is entitled to receive a management fee at the following annual rate based on the Fund’s average daily net assets:
| Average daily net assets | Management fee |
| First $500 million | 0.450% |
| Next $500 million | 0.425 |
| Next $2 billion | 0.400 |
| Next $2 billion | 0.375 |
| Next $5 billion | 0.340 |
| Over $10 billion | 0.320 |
For the six months ended February 28, 2021, the advisory fee was equivalent to an annual rate of 0.44% of the Fund’s average daily net assets.
Funds Management has retained the services of a subadviser to provide daily portfolio management to the Fund. The fee for subadvisory services is borne by Funds Management. Wells Capital Management Incorporated, an affiliate of Funds Management and an indirect wholly owned subsidiary of Wells Fargo, is the subadviser to the Fund and is entitled to receive a fee from Funds Management at an annual rate starting at 0.20% and declining to 0.10% as the average daily net assets of the Fund increase.
Administration fees
Under a class-level administration agreement, Funds Management provides class-level administrative services to the Fund, which includes paying fees and expenses for services provided by the transfer agent, sub-transfer agents, omnibus account servicers and record-keepers. As compensation for its services under the class-level administration agreement, Funds Management receives an annual fee which is calculated based on the average daily net assets of each class as follows:
| | Class-level
administration fee |
| Class A | 0.16% |
| Class C | 0.16 |
| Administrator Class | 0.10 |
| Institutional Class | 0.08 |
Waivers and/or expense reimbursements
Funds Management has contractually waived and/or reimbursed management and administration fees to the extent necessary to maintain certain net operating expense ratios for the Fund. When each class of the Fund has exceeded its expense cap, Funds Management has waived fees and/or reimbursed expenses from fund-level expenses on a proportionate basis and then from class specific expenses. When only certain classes exceed their expense caps, waivers and/or reimbursements are applied against class specific expenses before fund-level expenses. Funds Management has committed through December 31, 2021 to waive fees and/or reimburse expenses to the extent necessary to cap expenses. Prior to or after the commitment expiration date, the cap may be increased or the commitment to maintain the cap may be terminated only with the approval of the Board of Trustees. The contractual expense caps are as follows:
30 | Wells Fargo Government Securities Fund
Notes to financial statements (unaudited)
| | Expense ratio caps |
| Class A | 0.85% |
| Class C | 1.60 |
| Administrator Class | 0.64 |
| Institutional Class | 0.48 |
Distribution fee
The Trust has adopted a distribution plan for Class C shares of the Fund pursuant to Rule 12b-1 under the 1940 Act. A distribution fee is charged charged to Class C shares and paid to Wells Fargo Funds Distributor, LLC (“Funds Distributor”), the principal underwriter, at an annual rate of 0.75% of the average daily net assets of Class C shares.
In addition, Funds Distributor is entitled to receive the front-end sales charge from the purchase of Class A shares and a contingent deferred sales charge on the redemption of certain Class A shares. Funds Distributor is also entitled to receive the contingent deferred sales charges from redemptions of Class C shares. For the six months ended February 28, 2021, Funds Distributor received $2,477 from the sale of Class A shares and $16 in contingent deferred sales charges from redemptions of Class C shares. Funds Distributor did not receive any contingent deferred sales charges from Class A for the six months ended February 28, 2021.
Shareholder servicing fees
The Trust has entered into contracts with one or more shareholder servicing agents, whereby Class A, Class C, and Administrator Class of the Fund are charged a fee at an annual rate of 0.25% of the average daily net assets of each respective class. A portion of these total shareholder servicing fees were paid to affiliates of Wells Fargo.
Interfund transactions
The Fund may purchase or sell portfolio investment securities to certain other Wells Fargo affiliates pursuant to Rule 17a-7 under the 1940 Act and under procedures adopted by the Board of Trustees. The procedures have been designed to ensure that these interfund transactions, which do not incur broker commissions, are effected at current market prices.
5. INVESTMENT PORTFOLIO TRANSACTIONS
Purchases and sales of investments, excluding short-term securities, for the six months ended February 28, 2021 were as follows:
| Purchases at cost | | Sales proceeds |
U.S.
government | Non-U.S.
government | | U.S.
government | Non-U.S.
government |
| $813,922,054 | $46,443,141 | | $730,625,236 | $16,147,409 |
6. DERIVATIVE TRANSACTIONS
During the six months ended February 28, 2021, the Fund entered into futures contracts to manage duration and yield curve exposures. The Fund had an average notional amount of $127,516,028 in long futures contracts and $102,179,475 in short futures contracts during the six months ended February 28, 2021.
The fair value, realized gains or losses and change in unrealized gains or losses, if any, on derivative instruments are reflected in the corresponding financial statement captions.
7. BANK BORROWINGS
The Trust (excluding the money market funds), Wells Fargo Master Trust and Wells Fargo Variable Trust are parties to a $350,000,000 revolving credit agreement whereby the Fund is permitted to use bank borrowings for temporary or emergency purposes, such as to fund shareholder redemption requests. Interest under the credit agreement is charged to the Fund based on a borrowing rate equal to the higher of the Federal Funds rate in effect on that day plus 1.25% or the overnight LIBOR rate in effect on that day plus 1.25%. In addition, an annual commitment fee equal to 0.25% of the unused balance is allocated to each participating fund.
For the six months ended February 28, 2021, there were no borrowings by the Fund under the agreement.
Wells Fargo Government Securities Fund | 31
Notes to financial statements (unaudited)
8. INDEMNIFICATION
Under the Fund's organizational documents, the officers and Trustees have been granted certain indemnification rights against certain liabilities that may arise out of performance of their duties to the Fund. The Fund has entered into a separate agreement with each Trustee that converts indemnification rights currently existing under the Fund’s organizational documents into contractual rights that cannot be changed in the future without the consent of the Trustee. Additionally, in the normal course of business, the Fund may enter into contracts with service providers that contain a variety of indemnification clauses. The Fund’s maximum exposure under these arrangements is dependent on future claims that may be made against the Fund and, therefore, cannot be estimated.
9. CORONAVIRUS (COVID-19) PANDEMIC
On March 11, 2020, the World Health Organization announced that it had made the assessment that coronavirus disease 2019 (“COVID-19”) is a pandemic. The impacts of COVID-19 are affecting the entire global economy, individual companies and investment products, the funds, and the market in general. There is significant uncertainty around the extent and duration of business disruptions related to COVID-19 and the impacts may last for an extended period of time. COVID-19 has led to significant uncertainty and volatility in the financial markets.
32 | Wells Fargo Government Securities Fund
Other information (unaudited)
PROXY VOTING INFORMATION
A description of the policies and procedures used to determine how to vote proxies relating to portfolio securities is available without charge, upon request, by calling 1-800-222-8222, visiting our website at wfam.com, or visiting the SEC website at sec.gov. Information regarding how the proxies related to portfolio securities were voted during the most recent 12-month period ended June 30 is available on the website at wfam.com or by visiting the SEC website at sec.gov.
QUARTERLY PORTFOLIO HOLDINGS INFORMATION
The Fund files its complete schedule of portfolio holdings with the SEC for the first and third quarters of each fiscal year as an exhibit to its reports on Form N-PORT. Shareholders may view the filed Form N-PORT by visiting the SEC website at sec.gov.
Wells Fargo Government Securities Fund | 33
Other information (unaudited)
BOARD OF TRUSTEES AND OFFICERS
Each of the Trustees and Officers listed in the table below acts in identical capacities for each fund in the Wells Fargo family of funds, which consists of 144 mutual funds comprising the Wells Fargo Funds Trust, Wells Fargo Variable Trust, Wells Fargo Master Trust and four closed-end funds (collectively the “Fund Complex”). This table should be read in conjunction with the Prospectus and the Statement of Additional Information1. The mailing address of each Trustee and Officer is 525 Market Street, 12th Floor, San Francisco, CA 94105. Each Trustee and Officer serves an indefinite term, however, each Trustee serves such term until reaching the mandatory retirement age established by the Trustees.
Independent Trustees
Name and
year of birth | Position held and
length of service* | Principal occupations during past five years or longer | Current other
public company or
investment
company
directorships |
William R. Ebsworth
(Born 1957) | Trustee,
since 2015 | Retired. From 1984 to 2013, equities analyst, portfolio manager, research director and chief investment officer at Fidelity Management and Research Company in Boston, Tokyo, and Hong Kong, and retired in 2013 as Chief Investment Officer of Fidelity Strategic Advisers, Inc. where he led a team of investment professionals managing client assets. Prior thereto, Board member of Hong Kong Securities Clearing Co., Hong Kong Options Clearing Corp., the Thailand International Fund, Ltd., Fidelity Investments Life Insurance Company, and Empire Fidelity Investments Life Insurance Company. Audit Committee Chair and Investment Committee Chair of the Vincent Memorial Hospital Endowment (non-profit organization). Mr. Ebsworth is a CFA® charterholder. | N/A |
Jane A. Freeman
(Born 1953) | Trustee,
since 2015;
Chair Liaison,
since 2018 | Retired. From 2012 to 2014 and 1999 to 2008, Chief Financial Officer of Scientific Learning Corporation. From 2008 to 2012, Ms. Freeman provided consulting services related to strategic business projects. Prior to 1999, Portfolio Manager at Rockefeller & Co. and Scudder, Stevens & Clark. Board member of the Harding Loevner Funds from 1996 to 2014, serving as both Lead Independent Director and chair of the Audit Committee. Board member of the Russell Exchange Traded Funds Trust from 2011 to 2012 and the chair of the Audit Committee. Ms. Freeman is also an inactive Chartered Financial Analyst. | N/A |
Isaiah Harris, Jr.
(Born 1952) | Trustee,
since 2009; Audit
Committee
Chair,
since 2019 | Retired. Chairman of the Board of CIGNA Corporation since 2009, and Director since 2005. From 2003 to 2011, Director of Deluxe Corporation. Prior thereto, President and CEO of BellSouth Advertising and Publishing Corp. from 2005 to 2007, President and CEO of BellSouth Enterprises from 2004 to 2005 and President of BellSouth Consumer Services from 2000 to 2003. Emeritus member of the Iowa State University Foundation Board of Governors. Emeritus Member of the Advisory Board of Iowa State University School of Business. Advisory Board Member, Palm Harbor Academy (private school). Mr. Harris is a certified public accountant (inactive status). | CIGNA Corporation |
Judith M. Johnson
(Born 1949) | Trustee,
since 2008 | Retired. Prior thereto, Chief Executive Officer and Chief Investment Officer of Minneapolis Employees Retirement Fund from 1996 to 2008. Ms. Johnson is an attorney, certified public accountant and a certified managerial accountant. | N/A |
David F. Larcker
(Born 1950) | Trustee,
since 2009 | James Irvin Miller Professor of Accounting at the Graduate School of Business (Emeritus), Stanford University, Director of the Corporate Governance Research Initiative and Senior Faculty of The Rock Center for Corporate Governance since 2006. From 2005 to 2008, Professor of Accounting at the Graduate School of Business, Stanford University. Prior thereto, Ernst & Young Professor of Accounting at The Wharton School, University of Pennsylvania from 1985 to 2005. | N/A |
34 | Wells Fargo Government Securities Fund
Other information (unaudited)
Name and
year of birth | Position held and
length of service* | Principal occupations during past five years or longer | Current other
public company or
investment
company
directorships |
Olivia S. Mitchell
(Born 1953) | Trustee,
since 2006;
Nominating and
Governance
Committee Chair,
since 2018 | International Foundation of Employee Benefit Plans Professor, Wharton School of the University of Pennsylvania since 1993. Director of Wharton’s Pension Research Council and Boettner Center on Pensions & Retirement Research, and Research Associate at the National Bureau of Economic Research. Previously, Cornell University Professor from 1978 to 1993. | N/A |
Timothy J. Penny
(Born 1951) | Trustee,
since 1996;
Chair,
since 2018 | President and Chief Executive Officer of Southern Minnesota Initiative Foundation, a non-profit organization, since 2007. Member of the Board of Trustees of NorthStar Education Finance, Inc., a non-profit organization, since 2007. | N/A |
James G. Polisson
(Born 1959) | Trustee,
since 2018 | Retired. Chief Marketing Officer, Source (ETF) UK Services, Ltd, from 2015 to 2017. From 2012 to 2015, Principal of The Polisson Group, LLC, a management consulting, corporate advisory and principal investing company. Chief Executive Officer and Managing Director at Russell Investments, Global Exchange Traded Funds from 2010 to 2012. Managing Director of Barclays Global Investors from 1998 to 2010 and Global Chief Marketing Officer for iShares and Barclays Global Investors from 2000 to 2010. Trustee of the San Francisco Mechanics’ Institute, a non-profit organization, from 2013 to 2015. Board member of the Russell Exchange Traded Fund Trust from 2011 to 2012. Director of Barclays Global Investors Holdings Deutschland GmbH from 2006 to 2009. Mr. Polisson is an attorney and has a retired status with the Massachusetts and District of Columbia Bar Associations. | N/A |
Pamela Wheelock
(Born 1959) | Trustee,
since January
2020; previously
Trustee from
January 2018 to
July 2019 | Board member of the Destination Medical Center Economic Development Agency, Rochester, Minnesota since 2019. Interim President of the McKnight Foundation from January to September 2020. Acting Commissioner, Minnesota Department of Human Services, July 2019 through September 2019. Human Services Manager (part-time), Minnesota Department of Human Services, October 2019 through December 2019. Chief Operating Officer, Twin Cities Habitat for Humanity from 2017 to 2019. Vice President of University Services, University of Minnesota from 2012 to 2016. Prior thereto, on the Board of Directors, Governance Committee and Finance Committee for the Minnesota Philanthropy Partners (Saint Paul Foundation) from 2012 to 2018, Interim Chief Executive Officer of Blue Cross Blue Shield of Minnesota from 2011 to 2012, Chairman of the Board from 2009 to 2012 and Board Director from 2003 to 2015. Vice President, Leadership and Community Engagement, Bush Foundation, Saint Paul, Minnesota (a private foundation) from 2009 to 2011. Executive Vice President and Chief Financial Officer, Minnesota Sports and Entertainment from 2004 to 2009 and Senior Vice President from 2002 to 2004. Executive Vice President of the Minnesota Wild Foundation from 2004 to 2008. Commissioner of Finance, State of Minnesota, from 1999 to 2002. Currently Board Chair of the Minnesota Wild Foundation since 2010. | N/A |
* Length of service dates reflect the Trustee’s commencement of service with the Trust’s predecessor entities, where applicable.
Wells Fargo Government Securities Fund | 35
Other information (unaudited)
Officers
Name and
year of birth | Position held and
length of service | Principal occupations during past five years or longer |
Andrew Owen
(Born 1960) | President,
since 2017 | Executive Vice President of Wells Fargo & Company and Head of Affiliated Managers, Wells Fargo Asset Management, since 2014. In addition, Mr. Owen is currently President, Chief Executive Officer and Director of Wells Fargo Funds Management, LLC since 2017. Prior thereto, Executive Vice President responsible for marketing, investments and product development for Wells Fargo Funds Management, LLC, from 2009 to 2014. |
Jeremy DePalma
(Born 1974) | Treasurer,
since 2012
(for certain funds in
the Fund Complex);
since 2021 (for
the remaining funds in the
Fund Complex) | Senior Vice President of Wells Fargo Funds Management, LLC since 2009. Senior Vice President of Evergreen Investment Management Company, LLC from 2008 to 2010 and head of the Fund Reporting and Control Team within Fund Administration from 2005 to 2010. |
Michelle Rhee
(Born 1966) | Chief Legal Officer,
since 2019 | Secretary of Wells Fargo Funds Management, LLC and Chief Legal Counsel of Wells Fargo Asset Management since 2018. Deputy General Counsel of Wells Fargo Bank, N.A. since 2020 and Assistant General Counsel of Wells Fargo Bank, N.A. from 2018 to 2020. Associate General Counsel and Managing Director of Bank of America Corporation from 2004 to 2018. |
Catherine Kennedy
(Born 1969) | Secretary,
since 2019 | Vice President of Wells Fargo Funds Management, LLC and Senior Counsel of the Wells Fargo Legal Department since 2010. Vice President and Senior Counsel of Evergreen Investment Management Company, LLC from 1998 to 2010. |
Michael H. Whitaker
(Born 1967) | Chief Compliance Officer,
since 2016 | Chief Compliance Officer of Wells Fargo Asset Management since 2016. Senior Vice President and Chief Compliance Officer for Fidelity Investments from 2007 to 2016. |
1 The Statement of Additional Information includes additional information about the Trustees and is available, without charge, upon request, by calling 1-800-222-8222 or by visiting the website at wfam.com.
36 | Wells Fargo Government Securities Fund
For more information
More information about Wells Fargo Funds is available free upon request. To obtain literature, please write, visit the Fund's website, or call:
Wells Fargo Funds
P.O. Box 219967
Kansas City, MO 64121-9967
Website: wfam.com
Individual investors: 1-800-222-8222
Retail investment professionals: 1-888-877-9275
Institutional investment professionals: 1-866-765-0778
This report and the financial statements contained herein are submitted for the general information of the shareholders of the Fund. If this report is used for promotional purposes, distribution of the report must be accompanied or preceded by a current prospectus. Before investing, please consider the investment objectives, risks, charges, and expenses of the investment. For a current prospectus and, if available, a summary prospectus, containing this information, call 1-800-222-8222 or visit the Fund's website at wfam.com. Read the prospectus carefully before you invest or send money.
Wells Fargo Asset Management (WFAM) is the trade name for certain investment advisory/management firms owned by Wells Fargo & Company. These firms include but are not limited to Wells Capital Management Incorporated and Wells Fargo Funds Management, LLC. Certain products managed by WFAM entities are distributed by Wells Fargo Funds Distributor, LLC (a broker-dealer and Member FINRA).
This material is for general informational and educational purposes only and is NOT intended to provide investment advice or a recommendation of any kind - including a recommendation for any specific investment, strategy, or plan.
INVESTMENT PRODUCTS: NOT FDIC INSURED ■ NO BANK GUARANTEE ■ MAY LOSE VALUE
© 2021 Wells Fargo & Company. All rights reserved.
PAR-0321-00293 04-21
SA216/SAR216 02-21
Semi-Annual Report
February 28, 2021
Wells Fargo High Yield Bond Fund
Reduce clutter.
Save trees.
Sign up for electronic delivery of prospectuses and shareholder reports at wellsfargo.com/ advantagedelivery
The views expressed and any forward-looking statements are as of February 28, 2021, unless otherwise noted, and are those of the Fund's portfolio managers and/or Wells Fargo Asset Management. Discussions of individual securities or the markets generally are not intended as individual recommendations. Future events or results may vary significantly from those expressed in any forward-looking statements. The views expressed are subject to change at any time in response to changing circumstances in the market. Wells Fargo Asset Management and the Fund disclaim any obligation to publicly update or revise any views expressed or forward-looking statements.
INVESTMENT PRODUCTS: NOT FDIC INSURED ■ NO BANK GUARANTEE ■ MAY LOSE VALUE
Wells Fargo High Yield Bond Fund | 1
Letter to shareholders (unaudited)
Andrew Owen
President
Wells Fargo Funds
Dear Shareholder:
We are pleased to offer you this semi-annual report for the Wells Fargo High Yield Bond Fund for the six-month period that ended February 28, 2021. Global stocks showed robust returns, as the global economy began emerging from the haze of COVID-19. Tailwinds were provided by global stimulus programs, a rapid vaccination rollout, and recovering consumer and corporate sentiment. Bonds also had positive returns, led by high-yield bonds.
For the six-month period, U.S. stocks, based on the S&P 500 Index,1 gained 9.74%. International stocks, as measured by the MSCI ACWI ex USA Index (Net),2 returned 16.65%, while the MSCI EM Index (Net),3 had even stronger performance, with a 22.32% gain. Among bond indexes, the Bloomberg Barclays U.S. Aggregate Bond Index,4 returned (1.55)%, the Bloomberg Barclays Global Aggregate ex-USD Index (unhedged),5 gained 1.41%, and the Bloomberg Barclays Municipal Bond Index,6 returned 0.86% while the ICE BofA U.S. High Yield Index,7 gained 6.14%.
Hope drove the stock markets to new highs.
Stocks grew more volatile in September on mixed economic data. U.S. economic activity continued to grow. However, U.S. unemployment remained elevated at 7.9% in September. With U.S. Congress delaying further fiscal relief and uncertainties surrounding a possible vaccine, doubts crept back into the financial markets. In the U.K., a lack of progress in Brexit talks weighed on markets. China’s economy picked up steam, fueled by increased global demand.
In October, capital markets stepped back from their six-month rally. Market volatility rose in advance of the U.S. election and amid a global increase in COVID-19 infections. Europe introduced tighter restrictions affecting economic activity. U.S. markets looked favorably at the prospect of Democratic control of the federal purse strings, which could lead to additional fiscal stimulus and a boost to economic activity. Meanwhile, China reported 4.9% third-quarter gross domestic product growth.
| 1 | The S&P 500 Index consists of 500 stocks chosen for market size, liquidity, and industry group representation. It is a market-value-weighted index with each stock's weight in the index proportionate to its market value. You cannot invest directly in an index. |
| 2 | The Morgan Stanley Capital International (MSCI) All Country World Index (ACWI) ex USA Index (Net) is a free-float-adjusted market-capitalization-weighted index that is designed to measure the equity market performance of developed and emerging markets, excluding the United States. Source: MSCI. MSCI makes no express or implied warranties or representations and shall have no liability whatsoever with respect to any MSCI data contained herein. The MSCI data may not be further redistributed or used as a basis for other indices or any securities or financial products. This report is not approved, reviewed, or produced by MSCI. You cannot invest directly in an index. |
| 1 | The S&P 500 Index consists of 500 stocks chosen for market size, liquidity, and industry group representation. It is a market-value-weighted index with each stock's weight in the index proportionate to its market value. You cannot invest directly in an index. |
| 3 | The MSCI Emerging Markets (EM) Index (Net) is a free-float-adjusted market-capitalization-weighted index that is designed to measure equity market performance of emerging markets. You cannot invest directly in an index. |
| 1 | The S&P 500 Index consists of 500 stocks chosen for market size, liquidity, and industry group representation. It is a market-value-weighted index with each stock's weight in the index proportionate to its market value. You cannot invest directly in an index. |
| 4 | The Bloomberg Barclays U.S. Aggregate Bond Index is a broad-based benchmark that measures the investment-grade, U.S. dollar-denominated, fixed-rate taxable bond market, including Treasuries, government-related and corporate securities, mortgage-backed securities (agency fixed-rate and hybrid adjustable-rate mortgage pass-throughs), asset-backed securities, and commercial mortgage-backed securities. You cannot invest directly in an index. |
| 1 | The S&P 500 Index consists of 500 stocks chosen for market size, liquidity, and industry group representation. It is a market-value-weighted index with each stock's weight in the index proportionate to its market value. You cannot invest directly in an index. |
| 5 | The Bloomberg Barclays Global Aggregate ex-USD Index (unhedged) is an unmanaged index that provides a broad-based measure of the global investment-grade fixed-income markets excluding the U.S. dollar-denominated debt market. You cannot invest directly in an index. |
| 1 | The S&P 500 Index consists of 500 stocks chosen for market size, liquidity, and industry group representation. It is a market-value-weighted index with each stock's weight in the index proportionate to its market value. You cannot invest directly in an index. |
| 6 | The Bloomberg Barclays Municipal Bond Index is an unmanaged index composed of long-term tax-exempt bonds with a minimum credit rating of Baa. You cannot invest directly in an index. |
| 1 | The S&P 500 Index consists of 500 stocks chosen for market size, liquidity, and industry group representation. It is a market-value-weighted index with each stock's weight in the index proportionate to its market value. You cannot invest directly in an index. |
| 7 | The ICE BofA U.S. High Yield Index is a market-capitalization-weighted index of domestic and Yankee high-yield bonds. The index tracks the performance of high-yield securities traded in the U.S. bond market. You cannot invest directly in an index. Copyright 2021. ICE Data Indices, LLC. All rights reserved. |
2 | Wells Fargo High Yield Bond Fund
Letter to shareholders (unaudited)
Global stocks rallied in November, propelled by optimism over three promising COVID-19 vaccines. Reversing recent trends, value stocks outperformed growth stocks and cyclical stocks outpaced technology stocks. However, U.S. unemployment remained elevated, with a net job loss of 10 million since February 2020. The eurozone services Purchasing Managers’ Index, a monthly survey of purchasing managers, contracted sharply while the region’s manufacturing activity grew. The U.S. election results added to the upbeat mood as investors anticipated more consistent policies in the new administration.
Financial markets ended the year with strength on high expectations for a rapid rollout of the COVID-19 vaccines, the successful passage of a $900 billion stimulus package, and rising expectations of additional economic support from a Democratic-led Congress. U.S. economic data were mixed with still-elevated unemployment and weak retail sales but growth in manufacturing output. In contrast, China’s economic expansion continued in both manufacturing and nonmanufacturing. U.S. COVID-19 infection rates continued to rise even as new state and local lockdown measures were implemented.
The year 2021 began with emerging market stocks leading all major asset classes in January, driven by China’s strong economic growth and a broad recovery in corporate earnings, which propelled China’s stock market higher. In the United States, positive news on vaccine trials and January's expansion in both the manufacturing and services sectors was offset by a weak December monthly jobs report. This was compounded by technical factors as some hedge funds were forced to sell stocks to protect themselves against a well-publicized short squeeze coordinated by a group of retail investors. Eurozone sentiment and economic growth were particularly weak, reflecting the impact of a new lockdown with stricter social distancing along with a slow vaccine rollout.
February saw major domestic equity indexes driven higher on the hope of a new stimulus bill, improving COVID-19 vaccination numbers, and the gradual reopening of the economy. Most S&P 500 companies reported better-than-expected earnings, with positive surprises coming from the financials, IT, health care, and materials sectors. Japan saw its economy strengthen as a result of strong export numbers. Meanwhile, crude oil prices continued their climb, rising more than 25% for the year. Domestic government bonds experienced a sharp sell-off in late February as markets priced in a more robust economic recovery and higher growth and inflation expectations.
Don’t let short-term uncertainty derail long-term investment goals.
Periods of investment uncertainty can present challenges, but experience has taught us that maintaining long-term investment goals can be an effective way to plan for the future. To help you create a sound strategy based on your personal goals and risk tolerance, Wells Fargo Funds offers more than 100 mutual funds spanning a wide range of asset classes and investment styles. Although diversification cannot guarantee an investment profit or prevent losses, we believe it can be an effective way to manage investment risk and potentially smooth out overall portfolio performance. We encourage investors to know their investments and to understand that appropriate levels of risk-taking may unlock opportunities.
Thank you for choosing to invest with Wells Fargo Funds. We appreciate your confidence in us and remain committed to helping you meet your financial needs.
Sincerely,
Andrew Owen
President
Wells Fargo Funds
“Global stocks rallied in November, propelled by optimism over three promising COVID-19 vaccines.”
“February saw major domestic equity indexes driven higher on the hope of a new stimulus bill, improving COVID-19 vaccination numbers, and the gradual reopening of the economy.”
For further information about your Fund, contact your investment professional, visit our website at wfam.com, or call us directly at 1-800-222-8222.
Wells Fargo High Yield Bond Fund | 3
Letter to shareholders (unaudited)
Preparing for LIBOR Transition
The global financial industry is preparing to transition away from the London Interbank Offered Rate (LIBOR), a key benchmark interest rate, to new alternative rates. LIBOR underpins more than $350 trillion of financial contracts. It is the benchmark rate for a wide spectrum of products ranging from residential mortgages to corporate bonds to derivatives. Regulators have called for a market-wide transition away from LIBOR to successor reference rates by the end of 2021 (extended through June 30, 2023 for most tenors of the U.S. dollar LIBOR), which requires proactive steps be taken by issuers, counterparties, and asset managers to identify impacted products and adopt new reference rates.
The Fund holds at least one security that uses LIBOR as a floating reference rate and has a maturity date after 12-31-2021.
Although the transition process away from LIBOR has become increasingly well-defined in advance of the anticipated discontinuation date, there remains uncertainty regarding the nature of successor reference rates, and any potential effects of the transition away from LIBOR on investment instruments that use it as a benchmark rate. The transition process may result in, among other things, increased volatility or illiquidity in markets for instruments that currently rely on LIBOR and could negatively impact the value of certain instruments held by the Fund.
Wells Fargo Asset Management is monitoring LIBOR exposure closely and has put resources and controls in place to manage this transition effectively. The Fund’s portfolio management team is evaluating LIBOR holdings to understand what happens to those securities when LIBOR ceases to exist, including examining security documentation to identify the presence or absence of fallback language identifying a replacement rate to LIBOR.
While the pace of transition away from LIBOR will differ by asset class and investment strategy, the portfolio management team will monitor market conditions for those holdings to identify and mitigate deterioration or volatility in pricing and liquidity and ensure appropriate actions are taken in a timely manner.
Further information regarding the potential risks associated with the discontinuation of LIBOR can be found in the Fund’s Statement of Additional Information.
4 | Wells Fargo High Yield Bond Fund
This page is intentionally left blank.
Performance highlights (unaudited)
| Investment objective | The Fund seeks total return, consisting of a high level of current income and capital appreciation. |
| Manager | Wells Fargo Funds Management, LLC |
| Subadviser | Wells Capital Management Incorporated |
| Portfolio managers | Robert Junkin, Margaret D. Patel |
| Average annual total returns (%) as of February 28, 2021 |
| | | Including sales charge | | Excluding sales charge | | Expense ratios1 (%) |
| | Inception date | 1 year | 5 year | 10 year | | 1 year | 5 year | 10 year | | Gross | Net 2 |
| Class A (EKHAX) | 1-20-1998 | 2.59 | 5.45 | 4.86 | | 7.28 | 6.40 | 5.34 | | 1.04 | 0.93 |
| Class C (EKHCX) | 1-21-1998 | 5.79 | 5.67 | 4.59 | | 6.79 | 5.67 | 4.59 | | 1.79 | 1.68 |
| Administrator Class (EKHYX) | 4-14-1998 | – | – | – | | 7.42 | 6.48 | 5.54 | | 0.98 | 0.80 |
| Institutional Class (EKHIX)3 | 10-31-2014 | – | – | – | | 7.70 | 6.82 | 5.68 | | 0.71 | 0.53 |
| ICE BofA U.S. High Yield Constrained Index4 | – | – | – | – | | 8.53 | 8.82 | 6.33 | | – | – |
Figures quoted represent past performance, which is no guarantee of future results, and do not reflect taxes that a shareholder may pay on an investment in a fund. Investment return and principal value of an investment will fluctuate so that an investor’s shares, when redeemed, may be worth more or less than their original cost. Performance shown without sales charges would be lower if sales charges were reflected. Current performance may be lower or higher than the performance data quoted, which assumes the reinvestment of dividends and capital gains. Current month-end performance is available on the Fund’s website, wfam.com.
Index returns do not include transaction costs associated with buying and selling securities, any mutual fund fees or expenses, or any taxes. It is not possible to invest directly in an index.
For Class A shares, the maximum front-end sales charge is 4.50%. For Class C shares, the maximum contingent deferred sales charge is 1.00%. Performance including a contingent deferred sales charge assumes the sales charge for the corresponding time period. Administrator Class and Institutional Class shares are sold without a front-end sales charge or contingent deferred sales charge.
| 1 | Reflects the expense ratios as stated in the most recent prospectuses. The expense ratios shown are subject to change and may differ from the annualized expense ratios shown in the financial highlights of this report. |
| 2 | The manager has contractually committed through December 31, 2021, to waive fees and/or reimburse expenses to the extent necessary to cap total annual fund operating expenses after fee waivers at 0.93% for Class A, 1.68% for Class C, 0.80% for Administrator Class and 0.53% for Institutional Class. Brokerage commissions, stamp duty fees, interest, taxes, acquired fund fees and expenses (if any), and extraordinary expenses are excluded from the expense caps. Prior to or after the commitment expiration date, the caps may be increased or the commitment to maintain the caps may be terminated only with the approval of the Board of Trustees. Without these caps, the Fund’s returns would have been lower. The expense ratio paid by an investor is the net expense ratio (the total annual fund operating expenses after fee waivers) as stated in the prospectuses. |
| 3 | Historical performance shown for the Institutional Class shares prior to their inception reflects the performance of the Administrator Class shares and is not adjusted to reflect the Institutional Class expenses. If these expenses had been included, returns for the Institutional Class shares would be higher. |
| 4 | The ICE BofA U.S. High Yield Constrained Index is a market value-weighted index of all domestic and Yankee high-yield bonds, including deferred interest bonds and payment-in kind securities. Issues included in the index have maturities of one year or more and have a credit rating lower than BBB–/Baa3, but are not in default. The ICE BofA U.S. High Yield Constrained Index limits any individual issuer to a maximum of 2% benchmark exposure. You cannot invest directly in an index. Copyright 2021. ICE Data Indices, LLC. All rights reserved. |
Bond values fluctuate in response to the financial condition of individual issuers, general market and economic conditions, and changes in interest rates. Changes in market conditions and government policies may lead to periods of heightened volatility in the bond market and reduced liquidity for certain bonds held by the Fund. In general, when interest rates rise, bond values fall and investors may lose principal value. Interest rate changes and their impact on the Fund and its share price can be sudden and unpredictable. The use of derivatives may reduce returns and/or increase volatility. High-yield securities have a greater risk of default and tend to be more volatile than higher-rated debt securities. Loans are subject to risks similar to those associated with other below investment-grade bond investments, such as credit risk (for example, risk of issuer default), below investment-grade bond risk (for example, risk of greater volatility in value), and risk that the loan may become illiquid or difficult to price. The Fund is exposed to foreign investment risk. Consult the Fund’s prospectus for additional information on these and other risks.
| ‡ | CFA® and Chartered Financial Analyst® are trademarks owned by CFA Institute. |
6 | Wells Fargo High Yield Bond Fund
Performance highlights (unaudited)
| Ten largest holdings (%) as of February 28, 20211 |
| Ball Corporation, 2.88%, 8-15-2030 | 3.78 |
| Bausch Health Companies Incorporated, 5.25%, 1-30-2030 | 3.55 |
| Methanex Corporation, 5.13%, 10-15-2027 | 3.50 |
| Davita Incorporated, 4.63%, 6-1-2030 | 3.43 |
| Tronox Finance plc, 5.75%, 10-1-2025 | 3.21 |
| AMN Healthcare Incorporated , 4.00%, 4-15-2029 | 3.03 |
| MTS Systems Corporation, 5.75%, 8-15-2027 | 2.82 |
| Hologic Incorporated, 3.25%, 2-15-2029 | 2.72 |
| Post Holdings Incorporated, 5.00%, 8-15-2026 | 2.70 |
| Western Digital Corporation, 4.75%, 2-15-2026 | 2.58 |
| 1 | Figures represent the percentage of the Fund's net assets. Holdings are subject to change and may have changed since the date specified. |
| Credit quality as of February 28, 20211 |
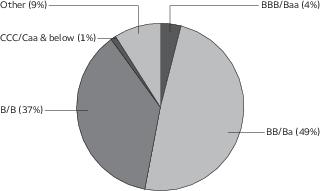
| 1 | The credit quality distribution of portfolio holdings reflected in the chart is based on ratings from Standard & Poor’s, Moody’s Investors Service, and/ or Fitch Ratings Ltd. Credit quality ratings apply to the underlying holdings of the Fund and not to the Fund itself. The percentages of the Fund’s portfolio with the ratings depicted in the chart are calculated based on the market value of fixed income securities held by the Fund. If a security was rated by all three rating agencies, the middle rating was utilized. If rated by two of the three rating agencies, the lower rating was utilized, and if rated by one of the rating agencies, that rating was utilized. Standard & Poor’s rates the creditworthiness of bonds, ranging from AAA (highest) to D (lowest). Ratings from A to CCC may be modified by the addition of a plus (+) or minus (-) sign to show relative standing within the rating categories. Standard & Poor’s rates the creditworthiness of short-term notes from SP-1 (highest) to SP-3 (lowest). Moody’s rates the creditworthiness of bonds, ranging from Aaa (highest) to C (lowest). Ratings Aa to B may be modified by the addition of a number 1 (highest) to 3 (lowest) to show relative standing within the ratings categories. Moody’s rates the creditworthiness of short-term U.S. tax-exempt municipal securities from MIG 1/VMIG 1 (highest) to SG (lowest). Fitch rates the creditworthiness of bonds, ranging from AAA (highest) to D (lowest). Credit quality distribution is subject to change and may have changed since the date specified. |
Wells Fargo High Yield Bond Fund | 7
Fund expenses (unaudited)
As a shareholder of the Fund, you incur two types of costs: (1) transaction costs, including sales charges (loads) on purchase payments and contingent deferred sales charges (if any) on redemptions and (2) ongoing costs, including management fees, distribution (12b-1) and/or shareholder servicing fees, and other Fund expenses. This example is intended to help you understand your ongoing costs (in dollars) of investing in the Fund and to compare these costs with the ongoing costs of investing in other mutual funds.
The example is based on an investment of $1,000 invested at the beginning of the six-month period and held for the entire period from September 1, 2020 to February 28, 2021.
Actual expenses
The “Actual” line of the table below provides information about actual account values and actual expenses. You may use the information in this line, together with the amount you invested, to estimate the expenses that you paid over the period. Simply divide your account value by $1,000 (for example, an $8,600 account value divided by $1,000 = 8.6), then multiply the result by the number in the “Actual” line under the heading entitled “Expenses paid during period” for your applicable class of shares to estimate the expenses you paid on your account during this period.
Hypothetical example for comparison purposes
The “Hypothetical” line of the table below provides information about hypothetical account values and hypothetical expenses based on the Fund’s actual expense ratio and an assumed rate of return of 5% per year before expenses, which is not the Fund’s actual return. The hypothetical account values and expenses may not be used to estimate the actual ending account balance or expenses you paid for the period. You may use this information to compare the ongoing costs of investing in the Fund and other funds. To do so, compare this 5% hypothetical example with the 5% hypothetical examples that appear in the shareholder reports of the other funds.
Please note that the expenses shown in the table are meant to highlight your ongoing costs only and do not reflect any transactional costs, such as sales charges (loads) and contingent deferred sales charges. Therefore, the “Hypothetical” line of the table is useful in comparing ongoing costs only and will not help you determine the relative total costs of owning different funds. In addition, if these transactional costs were included, your costs would have been higher.
| | Beginning
account value
9-1-2020 | Ending
account value
2-28-2021 | Expenses
paid during
the period1 | Annualized net
expense ratio |
| Class A | | | | |
| Actual | $1,000.00 | $1,035.83 | $4.64 | 0.92% |
| Hypothetical (5% return before expenses) | $1,000.00 | $1,020.23 | $4.61 | 0.92% |
| Class C | | | | |
| Actual | $1,000.00 | $1,031.85 | $8.46 | 1.68% |
| Hypothetical (5% return before expenses) | $1,000.00 | $1,016.46 | $8.40 | 1.68% |
| Administrator Class | | | | |
| Actual | $1,000.00 | $1,033.39 | $3.98 | 0.79% |
| Hypothetical (5% return before expenses) | $1,000.00 | $1,020.88 | $3.96 | 0.79% |
| Institutional Class | | | | |
| Actual | $1,000.00 | $1,034.73 | $2.67 | 0.53% |
| Hypothetical (5% return before expenses) | $1,000.00 | $1,022.17 | $2.66 | 0.53% |
1 Expenses paid is equal to the annualized net expense ratio of each class multiplied by the average account value over the period, multiplied by the number of days in the most recent fiscal half-year divided by the number of days in the fiscal year (to reflect the one-half-year period).
8 | Wells Fargo High Yield Bond Fund
Portfolio of investments—February 28, 2021 (unaudited)
| | | | | Shares | Value |
| Common stocks: 9.41% | | | | | |
| Communication services: 0.03% | | | | | |
| Media: 0.03% | | | | | |
| Comcast Corporation Class A | | | | 2,000 | $ 105,440 |
| Health care: 4.26% | | | | | |
| Biotechnology: 3.07% | | | | | |
| AbbVie Incorporated | | | | 75,000 | 8,080,500 |
| Alexion Pharmaceuticals Incorporated † | | | | 8,500 | 1,298,375 |
| Amgen Incorporated | | | | 11,000 | 2,474,120 |
| | | | | | 11,852,995 |
| Health care equipment & supplies: 0.25% | | | | | |
| Abbott Laboratories | | | | 8,000 | 958,240 |
| Health care providers & services: 0.22% | | | | | |
| McKesson Corporation | | | | 5,000 | 847,600 |
| Pharmaceuticals: 0.72% | | | | | |
| Bristol-Myers Squibb Company | | | | 40,000 | 2,453,200 |
| Horizon Therapeutics plc † | | | | 2,000 | 181,820 |
| Merck & Company Incorporated | | | | 2,000 | 145,240 |
| | �� | | | | 2,780,260 |
| Industrials: 0.93% | | | | | |
| Aerospace & defense: 0.28% | | | | | |
| L3Harris Technologies Incorporated | | | | 6,000 | 1,091,460 |
| Machinery: 0.19% | | | | | |
| John Bean Technologies Corporation | | | | 5,000 | 737,850 |
| Professional services: 0.46% | | | | | |
| Leidos Holdings Incorporated | | | | 20,000 | 1,769,000 |
| Information technology: 4.19% | | | | | |
| Electronic equipment, instruments & components: 0.33% | | | | | |
| Amphenol Corporation Class A | | | | 10,000 | 1,256,800 |
| IT services: 0.37% | | | | | |
| Akamai Technologies Incorporated † | | | | 15,000 | 1,417,500 |
| Semiconductors & semiconductor equipment: 2.32% | | | | | |
| Applied Materials Incorporated | | | | 10,000 | 1,181,900 |
| Broadcom Incorporated | | | | 13,000 | 6,108,310 |
| Microchip Technology Incorporated | | | | 2,000 | 305,260 |
| Micron Technology Incorporated † | | | | 15,000 | 1,372,950 |
| | | | | | 8,968,420 |
| Software: 0.54% | | | | | |
| Adobe Incorporated † | | | | 2,000 | 919,340 |
| Microsoft Corporation | | | | 5,000 | 1,161,900 |
| | | | | | 2,081,240 |
The accompanying notes are an integral part of these financial statements.
Wells Fargo High Yield Bond Fund | 9
Portfolio of investments—February 28, 2021 (unaudited)
| | | | | Shares | Value |
| Technology hardware, storage & peripherals: 0.63% | | | | | |
| Apple Incorporated | | | | 20,000 | $ 2,425,200 |
| Total Common stocks (Cost $27,545,296) | | | | | 36,292,005 |
| | | Interest
rate | Maturity
date | Principal | |
| Corporate bonds and notes: 77.22% | | | | | |
| Communication services: 0.56% | | | | | |
| Media: 0.56% | | | | | |
| CCO Holdings LLC 144A | | 5.75% | 2-15-2026 | $ 2,092,000 | 2,162,187 |
| Consumer discretionary: 4.36% | | | | | |
| Auto components: 2.37% | | | | | |
| Dana Holding Corporation | | 5.50 | 12-15-2024 | 1,500,000 | 1,526,250 |
| Speedway Motors Incorporated 144A | | 4.88 | 11-1-2027 | 2,000,000 | 1,995,000 |
| Tenneco Incorporated « | | 5.00 | 7-15-2026 | 6,000,000 | 5,632,500 |
| | | | | | 9,153,750 |
| Hotels, restaurants & leisure: 0.86% | | | | | |
| International Game Technology plc 144A | | 6.50 | 2-15-2025 | 3,000,000 | 3,315,000 |
| Household durables: 1.13% | | | | | |
| Installed Building Company 144A | | 5.75 | 2-1-2028 | 4,110,000 | 4,366,875 |
| Consumer staples: 5.98% | | | | | |
| Food products: 3.51% | | | | | |
| Lamb Weston Holdings Incorporated 144A | | 4.88 | 11-1-2026 | 3,000,000 | 3,108,750 |
| Post Holdings Incorporated 144A | | 5.00 | 8-15-2026 | 10,000,000 | 10,435,000 |
| | | | | | 13,543,750 |
| Household durables: 2.47% | | | | | |
| Spectrum Brands Incorporated 144A | | 3.88 | 3-15-2031 | 9,645,000 | 9,533,986 |
| Energy: 1.36% | | | | | |
| Oil, gas & consumable fuels: 1.36% | | | | | |
| Cheniere Energy Partners LP | | 4.50 | 10-1-2029 | 5,000,000 | 5,262,500 |
| Financials: 2.29% | | | | | |
| Banks: 0.86% | | | | | |
| Bank of America Corporation (3 Month LIBOR+3.90%)± | | 6.10 | 12-29-2049 | 3,000,000 | 3,333,300 |
| Consumer finance: 0.94% | | | | | |
| Navient Corporation | | 5.88 | 10-25-2024 | 1,000,000 | 1,052,500 |
| SLM Corporation | | 5.50 | 1-25-2023 | 2,500,000 | 2,587,500 |
| | | | | | 3,640,000 |
| Insurance: 0.49% | | | | | |
| Genworth Holdings Incorporated | | 4.80 | 2-15-2024 | 2,000,000 | 1,880,000 |
| Health care: 20.57% | | | | | |
| Health care equipment & supplies: 4.70% | | | | | |
| Hologic Incorporated 144A | | 3.25 | 2-15-2029 | 10,500,000 | 10,479,683 |
The accompanying notes are an integral part of these financial statements.
10 | Wells Fargo High Yield Bond Fund
Portfolio of investments—February 28, 2021 (unaudited)
| | | Interest
rate | Maturity
date | Principal | Value |
| Health care equipment & supplies (continued) | | | | | |
| Teleflex Incorporated 144A | | 4.25% | 6-1-2028 | $ 4,000,000 | $ 4,135,000 |
| Teleflex Incorporated | | 4.88 | 6-1-2026 | 3,415,000 | 3,517,450 |
| | | | | | 18,132,133 |
| Health care providers & services: 12.32% | | | | | |
| AMN Healthcare Incorporated 144A | | 4.00 | 4-15-2029 | 11,500,000 | 11,697,800 |
| AMN Healthcare Incorporated 144A | | 4.63 | 10-1-2027 | 2,250,000 | 2,334,375 |
| Catalent Pharma Solutions Incorporated 144A | | 3.13 | 2-15-2029 | 6,250,000 | 6,174,875 |
| Centene Corporation | | 4.63 | 12-15-2029 | 3,000,000 | 3,237,000 |
| Davita Incorporated 144A | | 4.63 | 6-1-2030 | 13,000,000 | 13,227,500 |
| Encompass Health Corporation | | 4.63 | 4-1-2031 | 5,500,000 | 5,842,372 |
| HealthSouth Corporation | | 5.13 | 3-15-2023 | 5,000,000 | 5,000,000 |
| | | | | | 47,513,922 |
| Health care technology: 0.80% | | | | | |
| IQVIA Incorporated | | 5.00 | 10-15-2026 | 3,000,000 | 3,103,875 |
| Life sciences tools & services: 1.70% | | | | | |
| Charles River Laboratories Incorporated 144A | | 5.50 | 4-1-2026 | 6,300,000 | 6,567,750 |
| Pharmaceuticals: 1.05% | | | | | |
| Bausch Health Companies Incorporated 144A | | 5.25 | 2-15-2031 | 4,000,000 | 4,050,000 |
| Industrials: 10.74% | | | | | |
| Aerospace & defense: 4.55% | | | | | |
| Moog Incorporated 144A | | 4.25 | 12-15-2027 | 4,050,000 | 4,161,375 |
| TransDigm Group Incorporated 144A | | 4.63 | 1-15-2029 | 4,000,000 | 3,935,000 |
| TransDigm Group Incorporated | | 6.38 | 6-15-2026 | 9,200,000 | 9,477,653 |
| | | | | | 17,574,028 |
| Commercial services & supplies: 3.68% | | | | | |
| Clean Harbors Incorporated 144A | | 4.88 | 7-15-2027 | 3,000,000 | 3,127,500 |
| Clean Harbors Incorporated 144A | | 5.13 | 7-15-2029 | 4,250,000 | 4,579,375 |
| Stericycle Incorporated 144A | | 5.38 | 7-15-2024 | 6,000,000 | 6,180,000 |
| Stericycle Incorporated 144A | | 3.88 | 1-15-2029 | 300,000 | 302,145 |
| | | | | | 14,189,020 |
| Construction & engineering: 0.85% | | | | | |
| Aecom Company | | 5.13 | 3-15-2027 | 3,000,000 | 3,277,500 |
| Trading companies & distributors: 1.66% | | | | | |
| WESCO Distribution Incorporated | | 5.38 | 6-15-2024 | 6,245,000 | 6,385,513 |
| Information technology: 16.15% | | | | | |
| Communications equipment: 0.91% | | | | | |
| CommScope Technologies Finance LLC 144A | | 6.00 | 6-15-2025 | 3,466,000 | 3,524,402 |
| Electronic equipment, instruments & components: 6.10% | | | | | |
| MTS Systems Corporation 144A | | 5.75 | 8-15-2027 | 10,000,000 | 10,880,000 |
| TTM Technologies Incorporated 144A | | 4.00 | 3-1-2029 | 9,495,000 | 9,601,819 |
| TTM Technologies Incorporated 144A | | 5.63 | 10-1-2025 | 3,000,000 | 3,068,730 |
| | | | | | 23,550,549 |
The accompanying notes are an integral part of these financial statements.
Wells Fargo High Yield Bond Fund | 11
Portfolio of investments—February 28, 2021 (unaudited)
| | | Interest
rate | Maturity
date | Principal | Value |
| Semiconductors & semiconductor equipment: 4.14% | | | | | |
| Broadcom Incorporated | | 4.75% | 4-15-2029 | $ 6,000,000 | $ 6,876,193 |
| Microchip Technology Incorporated 144A | | 4.25 | 9-1-2025 | 8,650,000 | 9,076,328 |
| | | | | | 15,952,521 |
| Software: 2.42% | | | | | |
| Citrix Systems Incorporated | | 3.30 | 3-1-2030 | 2,000,000 | 2,109,992 |
| Fair Isaac Corporation 144A | | 5.25 | 5-15-2026 | 1,000,000 | 1,132,500 |
| NortonLifeLock Incorporated 144A | | 5.00 | 4-15-2025 | 6,000,000 | 6,075,000 |
| | | | | | 9,317,492 |
| Technology hardware, storage & peripherals: 2.58% | | | | | |
| Western Digital Corporation | | 4.75 | 2-15-2026 | 8,995,000 | 9,948,110 |
| Materials: 8.96% | | | | | |
| Chemicals: 3.59% | | | | | |
| Koppers Incorporated 144A | | 6.00 | 2-15-2025 | 3,363,000 | 3,468,094 |
| Olin Corporation | | 5.50 | 8-15-2022 | 3,275,000 | 3,397,813 |
| Tronox Incorporated 144A | | 6.50 | 4-15-2026 | 2,000,000 | 2,067,540 |
| Valvoline Incorporated 144A | | 3.63 | 6-15-2031 | 5,000,000 | 4,925,000 |
| | | | | | 13,858,447 |
| Containers & packaging: 5.37% | | | | | |
| Ball Corporation | | 2.88 | 8-15-2030 | 15,000,000 | 14,568,750 |
| Berry Global Incorporated 144A« | | 4.50 | 2-15-2026 | 6,000,000 | 6,127,500 |
| | | | | | 20,696,250 |
| Real estate: 6.25% | | | | | |
| Equity REITs: 6.25% | | | | | |
| Iron Mountain Incorporated 144A | | 4.50 | 2-15-2031 | 7,500,000 | 7,445,250 |
| Iron Mountain Incorporated 144A | | 4.88 | 9-15-2027 | 500,000 | 521,250 |
| Sabra Health Care LP/Sabra Capital Corporation | | 3.90 | 10-15-2029 | 3,639,000 | 3,791,272 |
| SBA Communications Corporation 144A | | 3.13 | 2-1-2029 | 7,000,000 | 6,809,110 |
| SBA Communications Corporation | | 3.88 | 2-15-2027 | 5,350,000 | 5,545,436 |
| | | | | | 24,112,318 |
| Total Corporate bonds and notes (Cost $292,549,850) | | | | | 297,945,178 |
| Yankee corporate bonds and notes: 15.53% | | | | | |
| Consumer discretionary: 2.41% | | | | | |
| Auto components: 2.41% | | | | | |
| Adient Global Holdings Limited 144A | | 4.88 | 8-15-2026 | 9,210,000 | 9,302,100 |
| Financials: 3.21% | | | | | |
| Diversified financial services: 3.21% | | | | | |
| Tronox Finance plc 144A | | 5.75 | 10-1-2025 | 12,000,000 | 12,392,520 |
| Health care: 3.55% | | | | | |
| Pharmaceuticals: 3.55% | | | | | |
| Bausch Health Companies Incorporated 144A | | 5.25 | 1-30-2030 | 13,450,000 | 13,674,615 |
The accompanying notes are an integral part of these financial statements.
12 | Wells Fargo High Yield Bond Fund
Portfolio of investments—February 28, 2021 (unaudited)
| | | Interest
rate | Maturity
date | Principal | Value |
| Industrials: 0.86% | | | | | |
| Electrical equipment: 0.86% | | | | | |
| Sensata Technologies BV 144A | | 5.63% | 11-1-2024 | $ 3,000,000 | $ 3,307,500 |
| Information technology: 2.00% | | | | | |
| Technology hardware, storage & peripherals: 2.00% | | | | | |
| Seagate HDD 144A | | 3.13 | 7-15-2029 | 1,000,000 | 958,360 |
| Seagate HDD 144A | | 4.09 | 6-1-2029 | 3,273,000 | 3,396,801 |
| Seagate HDD | | 4.88 | 6-1-2027 | 3,018,000 | 3,357,842 |
| | | | | | 7,713,003 |
| Materials: 3.50% | | | | | |
| Chemicals: 3.50% | | | | | |
| Methanex Corporation | | 5.13 | 10-15-2027 | 13,067,000 | 13,513,891 |
| Total Yankee corporate bonds and notes (Cost $58,347,600) | | | | | 59,903,629 |
| | | Yield | | Shares | |
| Short-term investments: 2.14% | | | | | |
| Investment companies: 2.14% | | | | | |
| Securities Lending Cash Investments LLC ♠∩∞ | | 0.05 | | 4,743,850 | 4,743,850 |
| Wells Fargo Government Money Market Fund Select Class ♠∞ | | 0.03 | | 3,520,136 | 3,520,136 |
| Total Short-term investments (Cost $8,263,986) | | | | | 8,263,986 |
| Total investments in securities (Cost $386,706,732) | 104.30% | | | | 402,404,798 |
| Other assets and liabilities, net | (4.30) | | | | (16,592,382) |
| Total net assets | 100.00% | | | | $385,812,416 |
| † | Non-income-earning security |
| 144A | The security may be resold in transactions exempt from registration, normally to qualified institutional buyers, pursuant to Rule 144A under the Securities Act of 1933. |
| ± | Variable rate investment. The rate shown is the rate in effect at period end. |
| « | All or a portion of this security is on loan. |
| ♠ | The issuer of the security is an affiliated person of the Fund as defined in the Investment Company Act of 1940. |
| ∩ | The investment is a non-registered investment company purchased with cash collateral received from securities on loan. |
| ∞ | The rate represents the 7-day annualized yield at period end. |
| Abbreviations: |
| LIBOR | London Interbank Offered Rate |
| REIT | Real estate investment trust |
The accompanying notes are an integral part of these financial statements.
Wells Fargo High Yield Bond Fund | 13
Portfolio of investments—February 28, 2021 (unaudited)
Investments in affiliates
An affiliated investment is an investment in which the Fund owns at least 5% of the outstanding voting shares of the issuer or as a result of other relationships, such as the Fund and the issuer having the same investment manager. Transactions with issuers that were either affiliated persons of the Fund at the beginning of the period or the end of the period were as follows:
| | Value,
beginning of
period | Purchases | Sales
proceeds | Net
realized
gains
(losses) | | Net
change in
unrealized
gains
(losses) | | Value,
end of
period | | % of
net
assets | Shares,
end
of period | Income
from
affiliated
securities |
| Short-term investments | | | | | | | | | | | | |
| Investment companies | | | | | | | | | | | | |
| Securities Lending Cash Investments LLC | $1,738,500 | $17,059,446 | $(14,054,096) | $0 | | $0 | | $ 4,743,850 | | | 4,743,850 | $439 # |
| Wells Fargo Government Money Market Fund Select Class | 526,937 | 65,473,106 | (62,479,907) | 0 | | 0 | | 3,520,136 | | | 3,520,136 | 397 |
| | | | | $0 | | $0 | | $8,263,986 | | 2.14% | | $836 |
| # | Amount shown represents income before fees and rebates. |
The accompanying notes are an integral part of these financial statements.
14 | Wells Fargo High Yield Bond Fund
Statement of assets and liabilities—February 28, 2021 (unaudited)
| | |
| Assets | |
Investments in unaffiliated securities (including $4,642,379 of securities loaned), at value (cost $378,442,746)
| $ 394,140,812 |
Investments in affiliated securites, at value (cost $8,263,986)
| 8,263,986 |
Receivable for investments sold
| 7,257,551 |
Receivable for dividends and interest
| 3,422,153 |
Receivable for Fund shares sold
| 327,765 |
Receivable for securities lending income, net
| 20 |
Prepaid expenses and other assets
| 1,004 |
Total assets
| 413,413,291 |
| Liabilities | |
Payable for investments purchased
| 19,202,494 |
Payable upon receipt of securities loaned
| 4,743,850 |
Payable for Fund shares redeemed
| 3,248,163 |
Management fee payable
| 132,689 |
Dividends payable
| 68,683 |
Administration fees payable
| 39,921 |
Distribution fee payable
| 2,825 |
Trustees’ fees and expenses payable
| 2,274 |
Accrued expenses and other liabilities
| 159,976 |
Total liabilities
| 27,600,875 |
Total net assets
| $385,812,416 |
| Net assets consist of | |
Paid-in capital
| $ 424,744,791 |
Total distributable loss
| (38,932,375) |
Total net assets
| $385,812,416 |
| Computation of net asset value and offering price per share | |
Net assets – Class A
| $ 245,387,730 |
Shares outstanding – Class A1
| 72,467,169 |
Net asset value per share – Class A
| $3.39 |
Maximum offering price per share – Class A2
| $3.55 |
Net assets – Class C
| $ 4,782,313 |
Shares outstanding – Class C1
| 1,408,190 |
Net asset value per share – Class C
| $3.40 |
Net assets – Administrator Class
| $ 18,780,350 |
Shares outstanding – Administrator Class1
| 5,540,030 |
Net asset value per share – Administrator Class
| $3.39 |
Net assets – Institutional Class
| $ 116,862,023 |
Shares outstanding – Institutional Class1
| 34,469,777 |
Net asset value per share – Institutional Class
| $3.39 |
| 1 | The Fund has an unlimited number of authorized shares |
| 2 | Maximum offering price is computed as 100/95.50 of net asset value. On investments of $50,000 or more, the offering price is reduced. |
The accompanying notes are an integral part of these financial statements.
Wells Fargo High Yield Bond Fund | 15
Statement of operations—six months ended February 28, 2021 (unaudited)
| | |
| Investment income | |
Interest
| $ 7,784,571 |
Dividends
| 414,900 |
Income from affiliated securities
| 1,881 |
Total investment income
| 8,201,352 |
| Expenses | |
Management fee
| 1,028,892 |
| Administration fees | |
Class A
| 197,134 |
Class C
| 4,894 |
Administrator Class
| 9,959 |
Institutional Class
| 40,675 |
| Shareholder servicing fees | |
Class A
| 307,873 |
Class C
| 7,647 |
Administrator Class
| 24,844 |
| Distribution fee | |
Class C
| 22,942 |
Custody and accounting fees
| 13,095 |
Professional fees
| 26,315 |
Registration fees
| 28,248 |
Shareholder report expenses
| 19,553 |
Trustees’ fees and expenses
| 9,557 |
Other fees and expenses
| 11,339 |
Total expenses
| 1,752,967 |
| Less: Fee waivers and/or expense reimbursements | |
Fund-level
| (164,686) |
Class A
| (16,313) |
Administrator Class
| (7,810) |
Institutional Class
| (35,120) |
Net expenses
| 1,529,038 |
Net investment income
| 6,672,314 |
| Realized and unrealized gains (losses) on investments | |
Net realized gains on investments
| 2,598,251 |
Net change in unrealized gains (losses) on investments
| 3,742,123 |
Net realized and unrealized gains (losses) on investments
| 6,340,374 |
Net increase in net assets resulting from operations
| $13,012,688 |
The accompanying notes are an integral part of these financial statements.
16 | Wells Fargo High Yield Bond Fund
Statement of changes in net assets
| | |
| | Six months ended
February 28, 2021
(unaudited) | Year ended
August 31, 2020 |
| Operations | | | | |
Net investment income
| | $ 6,672,314 | | $ 14,615,422 |
Payment from affiliate
| | 0 | | 31,431 |
Net realized gains (losses) on investments
| | 2,598,251 | | (14,583,364) |
Net change in unrealized gains (losses) on investments
| | 3,742,123 | | 18,161,495 |
Net increase in net assets resulting from operations
| | 13,012,688 | | 18,224,984 |
| Distributions to shareholders from | | | | |
| Net investment income and net realized gains | | | | |
Class A
| | (4,304,184) | | (10,215,739) |
Class C
| | (83,972) | | (310,197) |
Administrator Class
| | (360,344) | | (956,624) |
Institutional Class
| | (1,967,330) | | (3,097,746) |
Total distributions to shareholders
| | (6,715,830) | | (14,580,306) |
| Capital share transactions | Shares | | Shares | |
| Proceeds from shares sold | | | | |
Class A
| 2,348,040 | 7,934,474 | 4,641,622 | 15,155,503 |
Class C
| 53,258 | 180,839 | 215,082 | 688,486 |
Administrator Class
| 127,478 | 428,134 | 1,596,322 | 5,195,585 |
Institutional Class
| 17,209,957 | 57,467,860 | 10,922,542 | 35,419,171 |
| | | 66,011,307 | | 56,458,745 |
| Reinvestment of distributions | | | | |
Class A
| 1,162,883 | 3,914,275 | 2,842,804 | 9,241,024 |
Class C
| 24,628 | 82,850 | 89,154 | 289,705 |
Administrator Class
| 100,919 | 339,550 | 278,499 | 906,613 |
Institutional Class
| 580,656 | 1,960,105 | 939,820 | 3,063,178 |
| | | 6,296,780 | | 13,500,520 |
| Payment for shares redeemed | | | | |
Class A
| (6,455,622) | (21,725,901) | (15,248,102) | (49,382,003) |
Class C
| (1,142,387) | (3,860,046) | (1,551,285) | (5,081,240) |
Administrator Class
| (1,035,787) | (3,495,525) | (3,020,506) | (9,617,779) |
Institutional Class
| (5,366,929) | (18,139,723) | (12,861,136) | (41,411,140) |
| | | (47,221,195) | | (105,492,162) |
Net increase (decrease) in net assets resulting from capital share transactions
| | 25,086,892 | | (35,532,897) |
Total increase (decrease) in net assets
| | 31,383,750 | | (31,888,219) |
| Net assets | | | | |
Beginning of period
| | 354,428,666 | | 386,316,885 |
End of period
| | $385,812,416 | | $ 354,428,666 |
The accompanying notes are an integral part of these financial statements.
Wells Fargo High Yield Bond Fund | 17
Financial highlights
(For a share outstanding throughout each period)
| | | Year ended August 31 |
| Class A | Six months ended
February 28, 2021
(unaudited) | 2020 | 2019 | 2018 | 2017 | 2016 |
Net asset value, beginning of period
| $3.33 | $3.29 | $3.28 | $3.40 | $3.31 | $3.16 |
Net investment income
| 0.06 | 0.13 | 0.14 | 0.14 | 0.14 | 0.13 |
Payment from affiliate
| 0.00 | 0.00 1 | 0.00 | 0.00 | 0.00 | 0.00 |
Net realized and unrealized gains (losses) on investments
| 0.06 | 0.04 | 0.01 | (0.12) | 0.10 | 0.15 |
Total from investment operations
| 0.12 | 0.17 | 0.15 | 0.02 | 0.24 | 0.28 |
| Distributions to shareholders from | | | | | | |
Net investment income
| (0.06) | (0.13) | (0.14) | (0.13) | (0.15) | (0.13) |
Tax basis return of capital
| 0.00 | 0.00 | 0.00 | (0.01) | 0.00 | 0.00 |
Total distributions to shareholders
| (0.06) | (0.13) | (0.14) | (0.14) | (0.15) | (0.13) |
Net asset value, end of period
| $3.39 | $3.33 | $3.29 | $3.28 | $3.40 | $3.31 |
Total return2
| 3.58% | 5.31% 3 | 4.79% | 0.68% | 7.28% | 9.25% |
| Ratios to average net assets (annualized) | | | | | | |
Gross expenses
| 1.02% | 1.04% | 1.04% | 1.02% | 1.01% | 1.04% |
Net expenses
| 0.92% | 0.93% | 0.93% | 0.93% | 0.93% | 1.01% |
Net investment income
| 3.47% | 4.01% | 4.36% | 4.26% | 4.39% | 4.24% |
| Supplemental data | | | | | | |
Portfolio turnover rate
| 17% | 34% | 26% | 18% | 20% | 75% |
Net assets, end of period (000s omitted)
| $245,388 | $251,410 | $273,553 | $272,170 | $314,156 | $370,560 |
| 1 | Amount is less than $0.005. |
| 2 | Total return calculations do not include any sales charges. Returns for periods of less than one year are not annualized. |
| 3 | During the year ended August 31, 2020, the Fund received a payment from an affiliate that had an impact of less than 0.005% on total return. See Note 4 in the Notes to Financials Statements for additional information. |
The accompanying notes are an integral part of these financial statements.
18 | Wells Fargo High Yield Bond Fund
Financial highlights
(For a share outstanding throughout each period)
| | | Year ended August 31 |
| Class C | Six months ended
February 28, 2021
(unaudited) | 2020 | 2019 | 2018 | 2017 | 2016 |
Net asset value, beginning of period
| $3.34 | $3.29 | $3.28 | $3.40 | $3.31 | $3.16 |
Net investment income
| 0.05 1 | 0.11 1 | 0.12 1 | 0.12 | 0.12 | 0.11 |
Payment from affiliate
| 0.00 | 0.01 | 0.00 | 0.00 | 0.00 | 0.00 |
Net realized and unrealized gains (losses) on investments
| 0.06 | 0.03 | 0.01 | (0.12) | 0.09 | 0.15 |
Total from investment operations
| 0.11 | 0.15 | 0.13 | 0.00 | 0.21 | 0.26 |
| Distributions to shareholders from | | | | | | |
Net investment income
| (0.05) | (0.10) | (0.12) | (0.11) | (0.12) | (0.11) |
Tax basis return of capital
| 0.00 | 0.00 | 0.00 | (0.01) | (0.00) 2 | 0.00 |
Total distributions to shareholders
| (0.05) | (0.10) | (0.12) | (0.12) | (0.12) | (0.11) |
Net asset value, end of period
| $3.40 | $3.34 | $3.29 | $3.28 | $3.40 | $3.31 |
Total return3
| 3.19% | 4.83% 4 | 4.00% | (0.07)% | 6.49% | 8.44% |
| Ratios to average net assets (annualized) | | | | | | |
Gross expenses
| 1.77% | 1.79% | 1.79% | 1.77% | 1.76% | 1.80% |
Net expenses
| 1.68% | 1.68% | 1.68% | 1.68% | 1.68% | 1.77% |
Net investment income
| 2.73% | 3.25% | 3.64% | 3.51% | 3.65% | 3.48% |
| Supplemental data | | | | | | |
Portfolio turnover rate
| 17% | 34% | 26% | 18% | 20% | 75% |
Net assets, end of period (000s omitted)
| $4,782 | $8,265 | $12,220 | $47,811 | $61,734 | $72,908 |
| 1 | Calculated based upon average shares outstanding |
| 2 | Amount is less than $0.005. |
| 3 | Total return calculations do not include any sales charges. Returns for periods of less than one year are not annualized. |
| 4 | During the year ended August 31, 2020, the Fund received a payment from an affiliate that had a 0.31% impact on the total return. See Note 4 in the Notes to Financials Statements for additional information. |
The accompanying notes are an integral part of these financial statements.
Wells Fargo High Yield Bond Fund | 19
Financial highlights
(For a share outstanding throughout each period)
| | | Year ended August 31 |
| Administrator Class | Six months ended
February 28, 2021
(unaudited) | 2020 | 2019 | 2018 | 2017 | 2016 |
Net asset value, beginning of period
| $3.34 | $3.29 | $3.29 | $3.41 | $3.31 | $3.16 |
Net investment income
| 0.06 | 0.13 | 0.15 1 | 0.15 | 0.15 | 0.14 1 |
Net realized and unrealized gains (losses) on investments
| 0.05 | 0.05 | 0.00 | (0.12) | 0.10 | 0.15 |
Total from investment operations
| 0.11 | 0.18 | 0.15 | 0.03 | 0.25 | 0.29 |
| Distributions to shareholders from | | | | | | |
Net investment income
| (0.06) | (0.13) | (0.15) | (0.14) | (0.15) | (0.14) |
Tax basis return of capital
| 0.00 | 0.00 | 0.00 | (0.01) | (0.00) 2 | 0.00 |
Total distributions to shareholders
| (0.06) | (0.13) | (0.15) | (0.15) | (0.15) | (0.14) |
Net asset value, end of period
| $3.39 | $3.34 | $3.29 | $3.29 | $3.41 | $3.31 |
Total return3
| 3.34% | 5.76% | 4.60% | 0.82% | 7.74% | 9.48% |
| Ratios to average net assets (annualized) | | | | | | |
Gross expenses
| 0.96% | 0.99% | 0.98% | 0.96% | 0.95% | 0.98% |
Net expenses
| 0.79% | 0.79% | 0.80% | 0.80% | 0.80% | 0.80% |
Net investment income
| 3.57% | 4.14% | 4.48% | 4.39% | 4.55% | 4.43% |
| Supplemental data | | | | | | |
Portfolio turnover rate
| 17% | 34% | 26% | 18% | 20% | 75% |
Net assets, end of period (000s omitted)
| $18,780 | $21,185 | $24,667 | $23,940 | $31,592 | $76,688 |
| 1 | Calculated based upon average shares outstanding |
| 2 | Amount is less than $0.005. |
| 3 | Returns for periods of less than one year are not annualized. |
The accompanying notes are an integral part of these financial statements.
20 | Wells Fargo High Yield Bond Fund
Financial highlights
(For a share outstanding throughout each period)
| | | Year ended August 31 |
| Institutional Class | Six months ended
February 28, 2021
(unaudited) | 2020 | 2019 | 2018 | 2017 | 2016 |
Net asset value, beginning of period
| $3.34 | $3.29 | $3.28 | $3.41 | $3.31 | $3.17 |
Net investment income
| 0.06 | 0.14 | 0.15 | 0.16 | 0.16 | 0.14 |
Net realized and unrealized gains (losses) on investments
| 0.06 | 0.05 | 0.01 | (0.13) | 0.10 | 0.14 |
Total from investment operations
| 0.12 | 0.19 | 0.16 | 0.03 | 0.26 | 0.28 |
| Distributions to shareholders from | | | | | | |
Net investment income
| (0.07) | (0.14) | (0.15) | (0.15) | (0.16) | (0.14) |
Tax basis return of capital
| 0.00 | 0.00 | 0.00 | (0.01) | (0.00) 1 | 0.00 |
Total distributions to shareholders
| (0.07) | (0.14) | (0.15) | (0.16) | (0.16) | (0.14) |
Net asset value, end of period
| $3.39 | $3.34 | $3.29 | $3.28 | $3.41 | $3.31 |
Total return2
| 3.47% | 6.04% | 5.20% | 0.79% | 8.03% | 9.27% |
| Ratios to average net assets (annualized) | | | | | | |
Gross expenses
| 0.69% | 0.71% | 0.71% | 0.69% | 0.68% | 0.70% |
Net expenses
| 0.53% | 0.53% | 0.53% | 0.53% | 0.53% | 0.61% |
Net investment income
| 3.85% | 4.39% | 4.75% | 4.67% | 4.79% | 4.65% |
| Supplemental data | | | | | | |
Portfolio turnover rate
| 17% | 34% | 26% | 18% | 20% | 75% |
Net assets, end of period (000s omitted)
| $116,862 | $73,568 | $75,877 | $134,770 | $125,991 | $100,023 |
| 1 | Amount is less than $0.005. |
| 2 | Returns for periods of less than one year are not annualized. |
The accompanying notes are an integral part of these financial statements.
Wells Fargo High Yield Bond Fund | 21
Notes to financial statements (unaudited)
1. ORGANIZATION
Wells Fargo Funds Trust (the “Trust”), a Delaware statutory trust organized on March 10, 1999, is an open-end management investment company registered under the Investment Company Act of 1940, as amended (the “1940 Act”). As an investment company, the Trust follows the accounting and reporting guidance in Financial Accounting Standards Board (“FASB”) Accounting Standards Codification Topic 946, Financial Services – Investment Companies. These financial statements report on the Wells Fargo High Yield Bond Fund (the “Fund”) which is a diversified series of the Trust.
On February 23, 2021, Wells Fargo & Company announced that it has entered into a definitive agreement to sell Wells Fargo Asset Management (“WFAM”) to GTCR LLC and Reverence Capital Partners, L.P. WFAM is the trade name used by the asset management businesses of Wells Fargo & Company and includes Wells Fargo Funds Management, LLC, the investment manager to the Fund, Wells Capital Management Incorporated and Wells Fargo Asset Management (International) Limited, both registered investment advisers providing sub-advisory services to certain funds, and Wells Fargo Funds Distributor, LLC, the Fund's principal underwriter. As part of the transaction, Wells Fargo & Company will own a 9.9% equity interest and will continue to serve as an important client and distribution partner. The transaction is expected to close in the second half of 2021, subject to customary closing conditions.
Consummation of the transaction will result in the automatic termination of the Fund's investment management agreement and sub-advisory agreement. The Fund's Board of Trustees will be asked to approve new investment management arrangements with the new company. If approved by the Board, the new investment management arrangements with the new company will be presented to the shareholders of the Fund for approval, and, if approved by shareholders, would take effect upon the closing of the transaction. The transaction is expected to close in the second half of 2021, subject to customary closing conditions.
2. SIGNIFICANT ACCOUNTING POLICIES
The following significant accounting policies, which are consistently followed in the preparation of the financial statements of the Fund, are in conformity with U.S. generally accepted accounting principles which require management to make estimates and assumptions that affect the reported amounts of assets and liabilities, disclosure of contingent assets and liabilities at the date of the financial statements, and the reported amounts of income and expenses during the reporting period. Actual results could differ from those estimates.
Securities valuation
All investments are valued each business day as of the close of regular trading on the New York Stock Exchange (generally 4 p.m. Eastern Time), although the Fund may deviate from this calculation time under unusual or unexpected circumstances.
Debt securities are valued at the evaluated bid price provided by an independent pricing service (e.g. taking into account various factors, including yields, maturities, or credit ratings) or, if a reliable price is not available, the quoted bid price from an independent broker-dealer.
Equity securities that are listed on a foreign or domestic exchange or market are valued at the official closing price or, if none, the last sales price. If no sale occurs on the principal exchange or market that day, a fair value price will be determined in accordance with the Fund’s Valuation Procedures.
Investments in registered open-end investment companies are valued at net asset value. Interests in non-registered investment companies that are redeemable at net asset value are fair valued normally at net asset value.
Investments which are not valued using any of the methods discussed above are valued at their fair value, as determined in good faith by the Board of Trustees. The Board of Trustees has established a Valuation Committee comprised of the Trustees and has delegated to it the authority to take any actions regarding the valuation of portfolio securities that the Valuation Committee deems necessary or appropriate, including determining the fair value of portfolio securities, unless the determination has been delegated to the Wells Fargo Asset Management Pricing Committee at Wells Fargo Funds Management, LLC (“Funds Management”). The Board of Trustees retains the authority to make or ratify any valuation decisions or approve any changes to the Valuation Procedures as it deems appropriate. On a quarterly basis, the Board of Trustees receives reports on any valuation actions taken by the Valuation Committee or the Wells Fargo Asset Management Pricing Committee which may include items for ratification.
Securities lending
The Fund may lend its securities from time to time in order to earn additional income in the form of fees or interest on securities received as collateral or the investment of any cash received as collateral. When securities are on loan, the Fund receives interest or dividends on those securities. Cash collateral received in connection with its securities lending transactions
22 | Wells Fargo High Yield Bond Fund
Notes to financial statements (unaudited)
is invested in Securities Lending Cash Investments, LLC (the “Securities Lending Fund”). Investments in Securities Lending Fund are valued at the evaluated bid price provided by an independent pricing service. Income earned from investment in the Securities Lending Fund (net of fees and rebates), if any, is included in income from affiliated securities on the Statement of Operations.
In a securities lending transaction, the net asset value of the Fund is affected by an increase or decrease in the value of the securities loaned and by an increase or decrease in the value of the instrument in which collateral is invested. The amount of securities lending activity undertaken by the Fund fluctuates from time to time. The Fund has the right under the lending agreement to recover the securities from the borrower on demand. In the event of default or bankruptcy by the borrower, the Fund may be prevented from recovering the loaned securities or gaining access to the collateral or may experience delays or costs in doing so. In such an event, the terms of the agreement allow the unaffiliated securities lending agent to use the collateral to purchase replacement securities on behalf of the Fund or pay the Fund the market value of the loaned securities. The Fund bears the risk of loss with respect to depreciation of its investment of the cash collateral.
Security transactions and income recognition
Securities transactions are recorded on a trade date basis. Realized gains or losses are recorded on the basis of identified cost.
Interest income is accrued daily and bond discounts are accreted and premiums are amortized daily. To the extent debt obligations are placed on non-accrual status, any related interest income may be reduced by writing off interest receivables when the collection of all or a portion of interest has been determined to be doubtful based on consistently applied procedures and the fair value has decreased. If the issuer subsequently resumes interest payments or when the collectability of interest is reasonably assured, the debt obligation is removed from non-accrual status.
Dividend income is recognized on the ex-dividend date.
Distributions to shareholders
Distributions to shareholders from net investment income are declared daily and paid monthly. Distributions from net realized gains, if any, are recorded on the ex-dividend date and paid at least annually. Such distributions are determined in accordance with income tax regulations and may differ from U.S. generally accepted accounting principles. Dividend sources are estimated at the time of declaration. The tax character of distributions is determined as of the Fund’s fiscal year end. Therefore, a portion of the Fund’s distributions made prior to the Fund’s fiscal year end may be categorized as a tax return of capital at year end.
Federal and other taxes
The Fund intends to continue to qualify as a regulated investment company by distributing substantially all of its investment company taxable income and any net realized capital gains (after reduction for capital loss carryforwards) sufficient to relieve it from all, or substantially all, federal income taxes. Accordingly, no provision for federal income taxes was required.
The Fund’s income and federal excise tax returns and all financial records supporting those returns for the prior three fiscal years are subject to examination by the federal and Delaware revenue authorities. Management has analyzed the Fund's tax positions taken on federal, state, and foreign tax returns for all open tax years and does not believe that there are any uncertain tax positions that require recognition of a tax liability.
As of February 28, 2021, the aggregate cost of all investments for federal income tax purposes was $374,750,789 and the unrealized gains (losses) consisted of:
| Gross unrealized gains | $33,486,083 |
| Gross unrealized losses | (5,832,074) |
| Net unrealized gains | $27,654,009 |
As of August 31, 2020, the Fund had capital loss carryforwards which consisted of $16,415,740 in short-term capital losses and $41,199,521 in long-term capital losses.
Class allocations
The separate classes of shares offered by the Fund differ principally in applicable sales charges, distribution, shareholder servicing, and administration fees. Class specific expenses are charged directly to that share class. Investment income, common fund-level expenses, and realized and unrealized gains (losses) on investments are allocated daily to each class of shares based on the relative proportion of net assets of each class.
Wells Fargo High Yield Bond Fund | 23
Notes to financial statements (unaudited)
3. FAIR VALUATION MEASUREMENTS
Fair value measurements of investments are determined within a framework that has established a fair value hierarchy based upon the various data inputs utilized in determining the value of the Fund’s investments. The three-level hierarchy gives the highest priority to unadjusted quoted prices in active markets for identical assets or liabilities (Level 1) and the lowest priority to unobservable inputs (Level 3). The Fund’s investments are classified within the fair value hierarchy based on the lowest level of input that is significant to the fair value measurement. The inputs are summarized into three broad levels as follows:
| ■ | Level 1 – quoted prices in active markets for identical securities |
| ■ | Level 2 – other significant observable inputs (including quoted prices for similar securities, interest rates, prepayment speeds, credit risk, etc.) |
| ■ | Level 3 – significant unobservable inputs (including the Fund’s own assumptions in determining the fair value of investments) |
The inputs or methodologies used for valuing investments in securities are not necessarily an indication of the risk associated with investing in those securities.
The following is a summary of the inputs used in valuing the Fund’s assets and liabilities as of February 28, 2021:
| | Quoted prices
(Level 1) | Other significant
observable inputs
(Level 2) | Significant
unobservable inputs
(Level 3) | Total |
| Assets | | | | |
| Investments in: | | | | |
| Common stocks | | | | |
| Communication services | $ 105,440 | $ 0 | $0 | $ 105,440 |
| Health care | 16,439,095 | 0 | 0 | 16,439,095 |
| Industrials | 3,598,310 | 0 | 0 | 3,598,310 |
| Information technology | 16,149,160 | 0 | 0 | 16,149,160 |
| Corporate bonds and notes | 0 | 297,945,178 | 0 | 297,945,178 |
| Yankee corporate bonds and notes | 0 | 59,903,629 | 0 | 59,903,629 |
| Short-term investments | | | | |
| Investment companies | 8,263,986 | 0 | 0 | 8,263,986 |
| Total assets | $44,555,991 | $357,848,807 | $0 | $402,404,798 |
Additional sector, industry or geographic detail, if any, is included in the Portfolio of Investments.
For the six months ended February 28, 2021, the Fund did not have any transfers into/out of Level 3.
24 | Wells Fargo High Yield Bond Fund
Notes to financial statements (unaudited)
4. TRANSACTIONS WITH AFFILIATES
Management fee
Funds Management, an indirect wholly owned subsidiary of Wells Fargo & Company (“Wells Fargo”), is the manager of the Fund and provides advisory and fund-level administrative services under an investment management agreement. Under the investment management agreement, Funds Management is responsible for, among other services, implementing the investment objectives and strategies of the Fund, supervising the subadviser and providing fund-level administrative services in connection with the Fund’s operations. As compensation for its services under the investment management agreement, Funds Management is entitled to receive a management fee at the following annual rate based on the Fund’s average daily net assets:
| Average daily net assets | Management fee |
| First $500 million | 0.550% |
| Next $500 million | 0.525 |
| Next $2 billion | 0.500 |
| Next $2 billion | 0.475 |
| Next $5 billion | 0.440 |
| Over $10 billion | 0.430 |
For the six months ended February 28, 2021, the management fee was equivalent to an annual rate of 0.55% of the Fund’s average daily net assets.
Funds Management has retained the services of a subadviser to provide daily portfolio management to the Fund. The fee for subadvisory services is borne by Funds Management. Wells Capital Management Incorporated ("WellsCap"), an affiliate of Funds Management and an indirect wholly owned subsidiary of Wells Fargo, is the subadviser to the Fund and is entitled to receive a fee from Funds Management at an annual rate starting at 0.35% and declining to 0.20% as the average daily net assets of the Fund increase.
Administration fees
Under a class-level administration agreement, Funds Management provides class-level administrative services to the Fund, which includes paying fees and expenses for services provided by the transfer agent, sub-transfer agents, omnibus account servicers and record-keepers. As compensation for its services under the class-level administration agreement, Funds Management receives an annual fee which is calculated based on the average daily net assets of each class as follows:
| | Class-level
administration fee |
| Class A | 0.16% |
| Class C | 0.16 |
| Administrator Class | 0.10 |
| Institutional Class | 0.08 |
Waivers and/or expense reimbursements
Funds Management has contractually waived and/or reimbursed management and administration fees to the extent necessary to maintain certain net operating expense ratios for the Fund. When each class of the Fund has exceeded its expense cap, Funds Management has waived fees and/or reimbursed expenses from fund-level expenses on a proportionate basis and then from class specific expenses. When only certain classes exceed their expense caps, waivers and/or reimbursements are applied against class specific expenses before fund-level expenses. Funds Management has committed through December 31, 2021 to waive fees and/or reimburse expenses to the extent necessary to cap expenses. Prior to or after the commitment expiration date, the cap may be increased or the commitment to maintain the cap may be terminated only with the approval of the Board of Trustees. The contractual expense caps are as follows:
Wells Fargo High Yield Bond Fund | 25
Notes to financial statements (unaudited)
| | Expense ratio caps |
| Class A | 0.93% |
| Class C | 1.68 |
| Administrator Class | 0.80 |
| Institutional Class | 0.53 |
Other transactions
On August 14, 2020, Class A and Class C of the Fund was reimbursed by Funds Management in the amount of $79 and $31,352, respectively. The reimbursements were made in connection with resolving certain fee reimbursements.
Distribution fee
The Trust has adopted a distribution plan for Class C shares of the Fund pursuant to Rule 12b-1 under the 1940 Act. A distribution fee is charged charged to Class C shares and paid to Wells Fargo Funds Distributor, LLC (“Funds Distributor”), the principal underwriter, at an annual rate of 0.75% of the average daily net assets of Class C shares.
In addition, Funds Distributor is entitled to receive the front-end sales charge from the purchase of Class A shares and a contingent deferred sales charge on the redemption of certain Class A shares. Funds Distributor is also entitled to receive the contingent deferred sales charges from redemptions of Class C shares. For the six months ended February 28, 2021, Funds Distributor received $456 from the sale of Class A shares. No contingent deferred sales charges were incurred by Class A and Class C shares for the six months ended February 28, 2021.
Shareholder servicing fees
The Trust has entered into contracts with one or more shareholder servicing agents, whereby Class A, Class C, and Administrator Class of the Fund are charged a fee at an annual rate of 0.25% of the average daily net assets of each respective class. A portion of these total shareholder servicing fees were paid to affiliates of Wells Fargo.
Interfund transactions
The Fund may purchase or sell portfolio investment securities to certain other Wells Fargo affiliates pursuant to Rule 17a-7 under the 1940 Act and under procedures adopted by the Board of Trustees. The procedures have been designed to ensure that these interfund transactions, which do not incur broker commissions, are effected at current market prices.
5. INVESTMENT PORTFOLIO TRANSACTIONS
Purchases and sales of investments, excluding U.S. government obligations (if any) and short-term securities, for the six months ended February 28, 2021 were $100,201,676 and $61,698,517, respectively.
6. SECURITIES LENDING TRANSACTIONS
The Fund lends its securities through an unaffiliated securities lending agent and receives collateral in the form of cash or securities with a value at least equal to the value of the securities on loan. The value of the loaned securities is determined at the close of each business day and any increases or decreases in the required collateral are exchanged between the Fund and the counterparty on the next business day. Cash collateral received is invested in the Securities Lending Fund which seeks to provide a positive return compared to the daily Federal Funds Open Rate by investing in high-quality, U.S. dollar-denominated short-term money market instruments and is exempt from registration under Section 3(c)(7) of the 1940 Act. Securities Lending Fund is managed by Funds Management and is subadvised by WellsCap. Funds Management receives an advisory fee starting at 0.05% and declining to 0.01% as the average daily net assets of the Securities Lending Fund increase. All of the fees received by Funds Management are paid to WellsCap for its services as subadviser.
In the event of counterparty default or the failure of a borrower to return a loaned security, the Fund has the right to use the collateral to offset any losses incurred. As of February 28, 2021, the Fund had securities lending transactions with the following counterparties which are subject to offset:
26 | Wells Fargo High Yield Bond Fund
Notes to financial statements (unaudited)
| Counterparty | Value of
securities on
loan | Collateral
received1 | Net amount |
| BNP Paribas Securities Corporation | $1,888,039 | $(1,888,039) | $0 |
| Citigroup Global Markets Incorporated | 819,100 | (819,100) | 0 |
| Credit Suisse Securities (USA) LLC | 1,935,240 | (1,935,240) | 0 |
1 Collateral received within this table is limited to the collateral for the net transaction with the counterparty.
7. BANK BORROWINGS
The Trust (excluding the money market funds), Wells Fargo Master Trust and Wells Fargo Variable Trust are parties to a $350,000,000 revolving credit agreement whereby the Fund is permitted to use bank borrowings for temporary or emergency purposes, such as to fund shareholder redemption requests. Interest under the credit agreement is charged to the Fund based on a borrowing rate equal to the higher of the Federal Funds rate in effect on that day plus 1.25% or the overnight LIBOR rate in effect on that day plus 1.25%. In addition, an annual commitment fee equal to 0.25% of the unused balance is allocated to each participating fund.
For the six months ended February 28, 2021, there were no borrowings by the Fund under the agreement.
8. INDEMNIFICATION
Under the Fund's organizational documents, the officers and Trustees have been granted certain indemnification rights against certain liabilities that may arise out of performance of their duties to the Fund. The Fund has entered into a separate agreement with each Trustee that converts indemnification rights currently existing under the Fund’s organizational documents into contractual rights that cannot be changed in the future without the consent of the Trustee. Additionally, in the normal course of business, the Fund may enter into contracts with service providers that contain a variety of indemnification clauses. The Fund’s maximum exposure under these arrangements is dependent on future claims that may be made against the Fund and, therefore, cannot be estimated.
9. CORONAVIRUS (COVID-19) PANDEMIC
On March 11, 2020, the World Health Organization announced that it had made the assessment that coronavirus disease 2019 (“COVID-19”) is a pandemic. The impacts of COVID-19 are affecting the entire global economy, individual companies and investment products, the funds, and the market in general. There is significant uncertainty around the extent and duration of business disruptions related to COVID-19 and the impacts may last for an extended period of time. COVID-19 has led to significant uncertainty and volatility in the financial markets.
Wells Fargo High Yield Bond Fund | 27
Other information (unaudited)
PROXY VOTING INFORMATION
A description of the policies and procedures used to determine how to vote proxies relating to portfolio securities is available without charge, upon request, by calling 1-800-222-8222, visiting our website at wfam.com, or visiting the SEC website at sec.gov. Information regarding how the proxies related to portfolio securities were voted during the most recent 12-month period ended June 30 is available on the website at wfam.com or by visiting the SEC website at sec.gov.
QUARTERLY PORTFOLIO HOLDINGS INFORMATION
The Fund files its complete schedule of portfolio holdings with the SEC for the first and third quarters of each fiscal year as an exhibit to its reports on Form N-PORT. Shareholders may view the filed Form N-PORT by visiting the SEC website at sec.gov.
28 | Wells Fargo High Yield Bond Fund
Other information (unaudited)
BOARD OF TRUSTEES AND OFFICERS
Each of the Trustees and Officers listed in the table below acts in identical capacities for each fund in the Wells Fargo family of funds, which consists of 144 mutual funds comprising the Wells Fargo Funds Trust, Wells Fargo Variable Trust, Wells Fargo Master Trust and four closed-end funds (collectively the “Fund Complex”). This table should be read in conjunction with the Prospectus and the Statement of Additional Information1. The mailing address of each Trustee and Officer is 525 Market Street, 12th Floor, San Francisco, CA 94105. Each Trustee and Officer serves an indefinite term, however, each Trustee serves such term until reaching the mandatory retirement age established by the Trustees.
Independent Trustees
Name and
year of birth | Position held and
length of service* | Principal occupations during past five years or longer | Current other
public company or
investment
company
directorships |
William R. Ebsworth
(Born 1957) | Trustee,
since 2015 | Retired. From 1984 to 2013, equities analyst, portfolio manager, research director and chief investment officer at Fidelity Management and Research Company in Boston, Tokyo, and Hong Kong, and retired in 2013 as Chief Investment Officer of Fidelity Strategic Advisers, Inc. where he led a team of investment professionals managing client assets. Prior thereto, Board member of Hong Kong Securities Clearing Co., Hong Kong Options Clearing Corp., the Thailand International Fund, Ltd., Fidelity Investments Life Insurance Company, and Empire Fidelity Investments Life Insurance Company. Audit Committee Chair and Investment Committee Chair of the Vincent Memorial Hospital Endowment (non-profit organization). Mr. Ebsworth is a CFA® charterholder. | N/A |
Jane A. Freeman
(Born 1953) | Trustee,
since 2015;
Chair Liaison,
since 2018 | Retired. From 2012 to 2014 and 1999 to 2008, Chief Financial Officer of Scientific Learning Corporation. From 2008 to 2012, Ms. Freeman provided consulting services related to strategic business projects. Prior to 1999, Portfolio Manager at Rockefeller & Co. and Scudder, Stevens & Clark. Board member of the Harding Loevner Funds from 1996 to 2014, serving as both Lead Independent Director and chair of the Audit Committee. Board member of the Russell Exchange Traded Funds Trust from 2011 to 2012 and the chair of the Audit Committee. Ms. Freeman is also an inactive Chartered Financial Analyst. | N/A |
Isaiah Harris, Jr.
(Born 1952) | Trustee,
since 2009; Audit
Committee
Chair,
since 2019 | Retired. Chairman of the Board of CIGNA Corporation since 2009, and Director since 2005. From 2003 to 2011, Director of Deluxe Corporation. Prior thereto, President and CEO of BellSouth Advertising and Publishing Corp. from 2005 to 2007, President and CEO of BellSouth Enterprises from 2004 to 2005 and President of BellSouth Consumer Services from 2000 to 2003. Emeritus member of the Iowa State University Foundation Board of Governors. Emeritus Member of the Advisory Board of Iowa State University School of Business. Advisory Board Member, Palm Harbor Academy (private school). Mr. Harris is a certified public accountant (inactive status). | CIGNA Corporation |
Judith M. Johnson
(Born 1949) | Trustee,
since 2008 | Retired. Prior thereto, Chief Executive Officer and Chief Investment Officer of Minneapolis Employees Retirement Fund from 1996 to 2008. Ms. Johnson is an attorney, certified public accountant and a certified managerial accountant. | N/A |
David F. Larcker
(Born 1950) | Trustee,
since 2009 | James Irvin Miller Professor of Accounting at the Graduate School of Business (Emeritus), Stanford University, Director of the Corporate Governance Research Initiative and Senior Faculty of The Rock Center for Corporate Governance since 2006. From 2005 to 2008, Professor of Accounting at the Graduate School of Business, Stanford University. Prior thereto, Ernst & Young Professor of Accounting at The Wharton School, University of Pennsylvania from 1985 to 2005. | N/A |
Wells Fargo High Yield Bond Fund | 29
Other information (unaudited)
Name and
year of birth | Position held and
length of service* | Principal occupations during past five years or longer | Current other
public company or
investment
company
directorships |
Olivia S. Mitchell
(Born 1953) | Trustee,
since 2006;
Nominating and
Governance
Committee Chair,
since 2018 | International Foundation of Employee Benefit Plans Professor, Wharton School of the University of Pennsylvania since 1993. Director of Wharton’s Pension Research Council and Boettner Center on Pensions & Retirement Research, and Research Associate at the National Bureau of Economic Research. Previously, Cornell University Professor from 1978 to 1993. | N/A |
Timothy J. Penny
(Born 1951) | Trustee,
since 1996;
Chair,
since 2018 | President and Chief Executive Officer of Southern Minnesota Initiative Foundation, a non-profit organization, since 2007. Member of the Board of Trustees of NorthStar Education Finance, Inc., a non-profit organization, since 2007. | N/A |
James G. Polisson
(Born 1959) | Trustee,
since 2018 | Retired. Chief Marketing Officer, Source (ETF) UK Services, Ltd, from 2015 to 2017. From 2012 to 2015, Principal of The Polisson Group, LLC, a management consulting, corporate advisory and principal investing company. Chief Executive Officer and Managing Director at Russell Investments, Global Exchange Traded Funds from 2010 to 2012. Managing Director of Barclays Global Investors from 1998 to 2010 and Global Chief Marketing Officer for iShares and Barclays Global Investors from 2000 to 2010. Trustee of the San Francisco Mechanics’ Institute, a non-profit organization, from 2013 to 2015. Board member of the Russell Exchange Traded Fund Trust from 2011 to 2012. Director of Barclays Global Investors Holdings Deutschland GmbH from 2006 to 2009. Mr. Polisson is an attorney and has a retired status with the Massachusetts and District of Columbia Bar Associations. | N/A |
Pamela Wheelock
(Born 1959) | Trustee,
since January
2020; previously
Trustee from
January 2018 to
July 2019 | Board member of the Destination Medical Center Economic Development Agency, Rochester, Minnesota since 2019. Interim President of the McKnight Foundation from January to September 2020. Acting Commissioner, Minnesota Department of Human Services, July 2019 through September 2019. Human Services Manager (part-time), Minnesota Department of Human Services, October 2019 through December 2019. Chief Operating Officer, Twin Cities Habitat for Humanity from 2017 to 2019. Vice President of University Services, University of Minnesota from 2012 to 2016. Prior thereto, on the Board of Directors, Governance Committee and Finance Committee for the Minnesota Philanthropy Partners (Saint Paul Foundation) from 2012 to 2018, Interim Chief Executive Officer of Blue Cross Blue Shield of Minnesota from 2011 to 2012, Chairman of the Board from 2009 to 2012 and Board Director from 2003 to 2015. Vice President, Leadership and Community Engagement, Bush Foundation, Saint Paul, Minnesota (a private foundation) from 2009 to 2011. Executive Vice President and Chief Financial Officer, Minnesota Sports and Entertainment from 2004 to 2009 and Senior Vice President from 2002 to 2004. Executive Vice President of the Minnesota Wild Foundation from 2004 to 2008. Commissioner of Finance, State of Minnesota, from 1999 to 2002. Currently Board Chair of the Minnesota Wild Foundation since 2010. | N/A |
* Length of service dates reflect the Trustee’s commencement of service with the Trust’s predecessor entities, where applicable.
30 | Wells Fargo High Yield Bond Fund
Other information (unaudited)
Officers
Name and
year of birth | Position held and
length of service | Principal occupations during past five years or longer |
Andrew Owen
(Born 1960) | President,
since 2017 | Executive Vice President of Wells Fargo & Company and Head of Affiliated Managers, Wells Fargo Asset Management, since 2014. In addition, Mr. Owen is currently President, Chief Executive Officer and Director of Wells Fargo Funds Management, LLC since 2017. Prior thereto, Executive Vice President responsible for marketing, investments and product development for Wells Fargo Funds Management, LLC, from 2009 to 2014. |
Jeremy DePalma
(Born 1974) | Treasurer,
since 2012
(for certain funds in
the Fund Complex);
since 2021 (for
the remaining funds in the
Fund Complex) | Senior Vice President of Wells Fargo Funds Management, LLC since 2009. Senior Vice President of Evergreen Investment Management Company, LLC from 2008 to 2010 and head of the Fund Reporting and Control Team within Fund Administration from 2005 to 2010. |
Michelle Rhee
(Born 1966) | Chief Legal Officer,
since 2019 | Secretary of Wells Fargo Funds Management, LLC and Chief Legal Counsel of Wells Fargo Asset Management since 2018. Deputy General Counsel of Wells Fargo Bank, N.A. since 2020 and Assistant General Counsel of Wells Fargo Bank, N.A. from 2018 to 2020. Associate General Counsel and Managing Director of Bank of America Corporation from 2004 to 2018. |
Catherine Kennedy
(Born 1969) | Secretary,
since 2019 | Vice President of Wells Fargo Funds Management, LLC and Senior Counsel of the Wells Fargo Legal Department since 2010. Vice President and Senior Counsel of Evergreen Investment Management Company, LLC from 1998 to 2010. |
Michael H. Whitaker
(Born 1967) | Chief Compliance Officer,
since 2016 | Chief Compliance Officer of Wells Fargo Asset Management since 2016. Senior Vice President and Chief Compliance Officer for Fidelity Investments from 2007 to 2016. |
1 The Statement of Additional Information includes additional information about the Trustees and is available, without charge, upon request, by calling 1-800-222-8222 or by visiting the website at wfam.com.
Wells Fargo High Yield Bond Fund | 31
For more information
More information about Wells Fargo Funds is available free upon request. To obtain literature, please write, visit the Fund's website, or call:
Wells Fargo Funds
P.O. Box 219967
Kansas City, MO 64121-9967
Website: wfam.com
Individual investors: 1-800-222-8222
Retail investment professionals: 1-888-877-9275
Institutional investment professionals: 1-866-765-0778
This report and the financial statements contained herein are submitted for the general information of the shareholders of the Fund. If this report is used for promotional purposes, distribution of the report must be accompanied or preceded by a current prospectus. Before investing, please consider the investment objectives, risks, charges, and expenses of the investment. For a current prospectus and, if available, a summary prospectus, containing this information, call 1-800-222-8222 or visit the Fund's website at wfam.com. Read the prospectus carefully before you invest or send money.
Wells Fargo Asset Management (WFAM) is the trade name for certain investment advisory/management firms owned by Wells Fargo & Company. These firms include but are not limited to Wells Capital Management Incorporated and Wells Fargo Funds Management, LLC. Certain products managed by WFAM entities are distributed by Wells Fargo Funds Distributor, LLC (a broker-dealer and Member FINRA).
This material is for general informational and educational purposes only and is NOT intended to provide investment advice or a recommendation of any kind - including a recommendation for any specific investment, strategy, or plan.
INVESTMENT PRODUCTS: NOT FDIC INSURED ■ NO BANK GUARANTEE ■ MAY LOSE VALUE
© 2021 Wells Fargo & Company. All rights reserved.
PAR-0321-00294 04-21
SA218/SAR218 02-21
Semi-Annual Report
February 28, 2021
Wells Fargo Short Duration Government Bond Fund
Reduce clutter.
Save trees.
Sign up for electronic delivery of prospectuses and shareholder reports at wellsfargo.com/ advantagedelivery
The views expressed and any forward-looking statements are as of February 28, 2021, unless otherwise noted, and are those of the Fund's portfolio managers and/or Wells Fargo Asset Management. Discussions of individual securities or the markets generally are not intended as individual recommendations. Future events or results may vary significantly from those expressed in any forward-looking statements. The views expressed are subject to change at any time in response to changing circumstances in the market. Wells Fargo Asset Management and the Fund disclaim any obligation to publicly update or revise any views expressed or forward-looking statements.
INVESTMENT PRODUCTS: NOT FDIC INSURED ■ NO BANK GUARANTEE ■ MAY LOSE VALUE
Wells Fargo Short Duration Government Bond Fund | 1
Letter to shareholders (unaudited)
Andrew Owen
President
Wells Fargo Funds
Dear Shareholder:
We are pleased to offer you this semi-annual report for the Wells Fargo Short Duration Government Bond Fund for the six-month period that ended February 28, 2021. Global stocks showed robust returns, as the global economy began emerging from the haze of COVID-19. Tailwinds were provided by global stimulus programs, a rapid vaccination rollout, and recovering consumer and corporate sentiment. Bonds also had positive returns, led by high-yield bonds.
For the six-month period, U.S. stocks, based on the S&P 500 Index,1 gained 9.74%. International stocks, as measured by the MSCI ACWI ex USA Index (Net),2 returned 16.65%, while the MSCI EM Index (Net),3 had even stronger performance, with a 22.32% gain. Among bond indexes, the Bloomberg Barclays U.S. Aggregate Bond Index,4 returned (1.55)%, the Bloomberg Barclays Global Aggregate ex-USD Index (unhedged),5 gained 1.41%, and the Bloomberg Barclays Municipal Bond Index,6 returned 0.86% while the ICE BofA U.S. High Yield Index,7 gained 6.14%.
Hope drove the stock markets to new highs.
Stocks grew more volatile in September on mixed economic data. U.S. economic activity continued to grow. However, U.S. unemployment remained elevated at 7.9% in September. With U.S. Congress delaying further fiscal relief and uncertainties surrounding a possible vaccine, doubts crept back into the financial markets. In the U.K., a lack of progress in Brexit talks weighed on markets. China’s economy picked up steam, fueled by increased global demand.
In October, capital markets stepped back from their six-month rally. Market volatility rose in advance of the U.S. election and amid a global increase in COVID-19 infections. Europe introduced tighter restrictions affecting economic activity. U.S. markets looked favorably at the prospect of Democratic control of the federal purse strings, which could lead to additional fiscal stimulus and a boost to economic activity. Meanwhile, China reported 4.9% third-quarter gross domestic product growth.
| 1 | The S&P 500 Index consists of 500 stocks chosen for market size, liquidity, and industry group representation. It is a market-value-weighted index with each stock's weight in the index proportionate to its market value. You cannot invest directly in an index. |
| 2 | The Morgan Stanley Capital International (MSCI) All Country World Index (ACWI) ex USA Index (Net) is a free-float-adjusted market-capitalization-weighted index that is designed to measure the equity market performance of developed and emerging markets, excluding the United States. Source: MSCI. MSCI makes no express or implied warranties or representations and shall have no liability whatsoever with respect to any MSCI data contained herein. The MSCI data may not be further redistributed or used as a basis for other indices or any securities or financial products. This report is not approved, reviewed, or produced by MSCI. You cannot invest directly in an index. |
| 1 | The S&P 500 Index consists of 500 stocks chosen for market size, liquidity, and industry group representation. It is a market-value-weighted index with each stock's weight in the index proportionate to its market value. You cannot invest directly in an index. |
| 3 | The MSCI Emerging Markets (EM) Index (Net) is a free-float-adjusted market-capitalization-weighted index that is designed to measure equity market performance of emerging markets. You cannot invest directly in an index. |
| 1 | The S&P 500 Index consists of 500 stocks chosen for market size, liquidity, and industry group representation. It is a market-value-weighted index with each stock's weight in the index proportionate to its market value. You cannot invest directly in an index. |
| 4 | The Bloomberg Barclays U.S. Aggregate Bond Index is a broad-based benchmark that measures the investment-grade, U.S. dollar-denominated, fixed-rate taxable bond market, including Treasuries, government-related and corporate securities, mortgage-backed securities (agency fixed-rate and hybrid adjustable-rate mortgage pass-throughs), asset-backed securities, and commercial mortgage-backed securities. You cannot invest directly in an index. |
| 1 | The S&P 500 Index consists of 500 stocks chosen for market size, liquidity, and industry group representation. It is a market-value-weighted index with each stock's weight in the index proportionate to its market value. You cannot invest directly in an index. |
| 5 | The Bloomberg Barclays Global Aggregate ex-USD Index (unhedged) is an unmanaged index that provides a broad-based measure of the global investment-grade fixed-income markets excluding the U.S. dollar-denominated debt market. You cannot invest directly in an index. |
| 1 | The S&P 500 Index consists of 500 stocks chosen for market size, liquidity, and industry group representation. It is a market-value-weighted index with each stock's weight in the index proportionate to its market value. You cannot invest directly in an index. |
| 6 | The Bloomberg Barclays Municipal Bond Index is an unmanaged index composed of long-term tax-exempt bonds with a minimum credit rating of Baa. You cannot invest directly in an index. |
| 1 | The S&P 500 Index consists of 500 stocks chosen for market size, liquidity, and industry group representation. It is a market-value-weighted index with each stock's weight in the index proportionate to its market value. You cannot invest directly in an index. |
| 7 | The ICE BofA U.S. High Yield Index is a market-capitalization-weighted index of domestic and Yankee high-yield bonds. The index tracks the performance of high-yield securities traded in the U.S. bond market. You cannot invest directly in an index. Copyright 2021. ICE Data Indices, LLC. All rights reserved. |
2 | Wells Fargo Short Duration Government Bond Fund
Letter to shareholders (unaudited)
Global stocks rallied in November, propelled by optimism over three promising COVID-19 vaccines. Reversing recent trends, value stocks outperformed growth stocks and cyclical stocks outpaced technology stocks. However, U.S. unemployment remained elevated, with a net job loss of 10 million since February 2020. The eurozone services Purchasing Managers’ Index, a monthly survey of purchasing managers, contracted sharply while the region’s manufacturing activity grew. The U.S. election results added to the upbeat mood as investors anticipated more consistent policies in the new administration.
Financial markets ended the year with strength on high expectations for a rapid rollout of the COVID-19 vaccines, the successful passage of a $900 billion stimulus package, and rising expectations of additional economic support from a Democratic-led Congress. U.S. economic data were mixed with still-elevated unemployment and weak retail sales but growth in manufacturing output. In contrast, China’s economic expansion continued in both manufacturing and nonmanufacturing. U.S. COVID-19 infection rates continued to rise even as new state and local lockdown measures were implemented.
The year 2021 began with emerging market stocks leading all major asset classes in January, driven by China’s strong economic growth and a broad recovery in corporate earnings, which propelled China’s stock market higher. In the United States, positive news on vaccine trials and January's expansion in both the manufacturing and services sectors was offset by a weak December monthly jobs report. This was compounded by technical factors as some hedge funds were forced to sell stocks to protect themselves against a well-publicized short squeeze coordinated by a group of retail investors. Eurozone sentiment and economic growth were particularly weak, reflecting the impact of a new lockdown with stricter social distancing along with a slow vaccine rollout.
February saw major domestic equity indexes driven higher on the hope of a new stimulus bill, improving COVID-19 vaccination numbers, and the gradual reopening of the economy. Most S&P 500 companies reported better-than-expected earnings, with positive surprises coming from the financials, IT, health care, and materials sectors. Japan saw its economy strengthen as a result of strong export numbers. Meanwhile, crude oil prices continued their climb, rising more than 25% for the year. Domestic government bonds experienced a sharp sell-off in late February as markets priced in a more robust economic recovery and higher growth and inflation expectations.
Don’t let short-term uncertainty derail long-term investment goals.
Periods of investment uncertainty can present challenges, but experience has taught us that maintaining long-term investment goals can be an effective way to plan for the future. To help you create a sound strategy based on your personal goals and risk tolerance, Wells Fargo Funds offers more than 100 mutual funds spanning a wide range of asset classes and investment styles. Although diversification cannot guarantee an investment profit or prevent losses, we believe it can be an effective way to manage investment risk and potentially smooth out overall portfolio performance. We encourage investors to know their investments and to understand that appropriate levels of risk-taking may unlock opportunities.
Thank you for choosing to invest with Wells Fargo Funds. We appreciate your confidence in us and remain committed to helping you meet your financial needs.
Sincerely,
Andrew Owen
President
Wells Fargo Funds
“Global stocks rallied in November, propelled by optimism over three promising COVID-19 vaccines.”
“February saw major domestic equity indexes driven higher on the hope of a new stimulus bill, improving COVID-19 vaccination numbers, and the gradual reopening of the economy.”
For further information about your Fund, contact your investment professional, visit our website at wfam.com, or call us directly at 1-800-222-8222.
Wells Fargo Short Duration Government Bond Fund | 3
Letter to shareholders (unaudited)
Preparing for LIBOR Transition
The global financial industry is preparing to transition away from the London Interbank Offered Rate (LIBOR), a key benchmark interest rate, to new alternative rates. LIBOR underpins more than $350 trillion of financial contracts. It is the benchmark rate for a wide spectrum of products ranging from residential mortgages to corporate bonds to derivatives. Regulators have called for a market-wide transition away from LIBOR to successor reference rates by the end of 2021 (extended through June 30, 2023 for most tenors of the U.S. dollar LIBOR), which requires proactive steps be taken by issuers, counterparties, and asset managers to identify impacted products and adopt new reference rates.
The Fund holds at least one security that uses LIBOR as a floating reference rate and has a maturity date after 12-31-2021.
Although the transition process away from LIBOR has become increasingly well-defined in advance of the anticipated discontinuation date, there remains uncertainty regarding the nature of successor reference rates, and any potential effects of the transition away from LIBOR on investment instruments that use it as a benchmark rate. The transition process may result in, among other things, increased volatility or illiquidity in markets for instruments that currently rely on LIBOR and could negatively impact the value of certain instruments held by the Fund.
Wells Fargo Asset Management is monitoring LIBOR exposure closely and has put resources and controls in place to manage this transition effectively. The Fund’s portfolio management team is evaluating LIBOR holdings to understand what happens to those securities when LIBOR ceases to exist, including examining security documentation to identify the presence or absence of fallback language identifying a replacement rate to LIBOR.
While the pace of transition away from LIBOR will differ by asset class and investment strategy, the portfolio management team will monitor market conditions for those holdings to identify and mitigate deterioration or volatility in pricing and liquidity and ensure appropriate actions are taken in a timely manner.
Further information regarding the potential risks associated with the discontinuation of LIBOR can be found in the Fund’s Statement of Additional Information.
4 | Wells Fargo Short Duration Government Bond Fund
This page is intentionally left blank.
Performance highlights (unaudited)
| Investment objective | The Fund seeks to provide current income consistent with capital preservation. |
| Manager | Wells Fargo Funds Management, LLC |
| Subadviser | Wells Capital Management Incorporated |
| Portfolio managers | Maulik Bhansali, CFA®‡, Thomas O’Connor, CFA®‡, Jarad Vasquez |
| Average annual total returns (%) as of February 28, 2021 |
| | | Including sales charge | | Excluding sales charge | | Expense ratios1 (%) |
| | Inception date | 1 year | 5 year | 10 year | | 1 year | 5 year | 10 year | | Gross | Net 2 |
| Class A (MSDAX) | 3-11-1996 | -0.46 | 1.13 | 1.05 | | 1.57 | 1.54 | 1.25 | | 0.81 | 0.78 |
| Class C (MSDCX) | 5-31-2002 | -0.19 | 0.78 | 0.51 | | 0.81 | 0.78 | 0.51 | | 1.56 | 1.53 |
| Class R6 (MSDRX)3 | 11-30-2012 | – | – | – | | 1.99 | 1.97 | 1.70 | | 0.43 | 0.37 |
| Administrator Class (MNSGX) | 12-18-1992 | – | – | – | | 1.76 | 1.72 | 1.45 | | 0.75 | 0.60 |
| Institutional Class (WSGIX) | 4-8-2005 | – | – | – | | 1.94 | 1.90 | 1.63 | | 0.48 | 0.42 |
| Bloomberg Barclays U.S. 1-3 Year Government Index4 | – | – | – | – | | 1.65 | 1.77 | 1.31 | | – | – |
Figures quoted represent past performance, which is no guarantee of future results, and do not reflect taxes that a shareholder may pay on an investment in a fund. Investment return and principal value of an investment will fluctuate so that an investor’s shares, when redeemed, may be worth more or less than their original cost. Performance shown without sales charges would be lower if sales charges were reflected. Current performance may be lower or higher than the performance data quoted, which assumes the reinvestment of dividends and capital gains. Current month-end performance is available on the Fund’s website, wfam.com.
Index returns do not include transaction costs associated with buying and selling securities, any mutual fund fees or expenses, or any taxes. It is not possible to invest directly in an index.
For Class A shares, the maximum front-end sales charge is 2.00%. For Class C shares, the maximum contingent deferred sales charge is 1.00%. Performance including a contingent deferred sales charge assumes the sales charge for the corresponding time period. Class R6, Administrator Class, and Institutional Class shares are sold without a front-end sales charge or contingent deferred sales charge.
| 1 | Reflects the expense ratios as stated in the most recent prospectuses. The expense ratios shown are subject to change and may differ from the annualized expense ratios shown in the financial highlights of this report. |
| 2 | The manager has contractually committed through December 31, 2021, to waive fees and/or reimburse expenses to the extent necessary to cap total annual fund operating expenses after fee waivers at 0.78% for Class A, 1.53% for Class C, 0.37% for Class R6, 0.60% for Administrator Class and 0.42% for Institutional Class. Brokerage commissions, stamp duty fees, interest, taxes, acquired fund fees and expenses (if any), and extraordinary expenses are excluded from the expense caps. Prior to or after the commitment expiration date, the caps may be increased or the commitment to maintain the caps may be terminated only with the approval of the Board of Trustees. Without these caps, the Fund’s returns would have been lower. The expense ratio paid by an investor is the net expense ratio (the total annual fund operating expenses after fee waivers) as stated in the prospectuses. |
| 3 | Historical performance shown for the Class R6 shares prior to their inception reflects the performance of the Institutional Class shares, and includes the higher expenses applicable to Institutional Class shares. If these expenses had not been included, returns for Class R6 shares would be higher. |
| 4 | The Bloomberg Barclays U.S. 1–3 Year Government Bond Index is composed of all publicly issued, nonconvertible domestic debt of the U.S. government and its agencies. The index also includes corporate debt guaranteed by the U.S. government. Only notes and bonds with a minimum maturity of one year up to a maximum maturity of 2.9 years are included. You cannot invest directly in an index. |
Bond values fluctuate in response to the financial condition of individual issuers, general market and economic conditions, and changes in interest rates. Changes in market conditions and government policies may lead to periods of heightened volatility in the bond market and reduced liquidity for certain bonds held by the Fund. In general, when interest rates rise, bond values fall and investors may lose principal value. Interest rate changes and their impact on the Fund and its share price can be sudden and unpredictable. Securities issued by U.S. government agencies or government sponsored entities may not be guaranteed by the U.S. Treasury. Certain investment strategies tend to increase the total risk of an investment (relative to the broader market). The Fund is exposed to mortgage- and asset-backed securities risk. The U.S. government guarantee applies to certain underlying securities and not to shares of the Fund. Consult the Fund’s prospectus for additional information on these and other risks.
| ‡ | CFA® and Chartered Financial Analyst® are trademarks owned by CFA Institute. |
6 | Wells Fargo Short Duration Government Bond Fund
Performance highlights (unaudited)
| Ten largest holdings (%) as of February 28, 20211 |
| U.S. Treasury Note, 0.13%, 2-28-2023 | 15.39 |
| U.S. Treasury Note, 0.13%, 10-31-2022 | 9.90 |
| FHLMC, 3.50%, 11-1-2030 | 3.40 |
| U.S. Treasury Note, 0.13%, 9-30-2022 | 3.28 |
| U.S. Treasury Note, 2.13%, 5-15-2022 | 3.25 |
| U.S. Treasury Note, 0.13%, 1-31-2023 | 2.88 |
| U.S. Treasury Note, 0.13%, 7-31-2022 | 2.46 |
| U.S. Treasury Note, 0.13%, 12-31-2022 | 2.22 |
| FHLMC, 3.50%, 2-1-2031 | 2.09 |
| U.S. Treasury Note, 0.13%, 5-31-2022 | 2.04 |
| 1 | Figures represent the percentage of the Fund's net assets. Holdings are subject to change and may have changed since the date specified. |
| Portfolio composition as of February 28, 20211 |
| 1 | Figures represent the percentage of the Fund's long-term investments. These amounts are subject to change and may have changed since the date specified. |
Wells Fargo Short Duration Government Bond Fund | 7
Fund expenses (unaudited)
As a shareholder of the Fund, you incur two types of costs: (1) transaction costs, including sales charges (loads) on purchase payments and contingent deferred sales charges (if any) on redemptions and (2) ongoing costs, including management fees, distribution (12b-1) and/or shareholder servicing fees, and other Fund expenses. This example is intended to help you understand your ongoing costs (in dollars) of investing in the Fund and to compare these costs with the ongoing costs of investing in other mutual funds.
The example is based on an investment of $1,000 invested at the beginning of the six-month period and held for the entire period from September 1, 2020 to February 28, 2021.
Actual expenses
The “Actual” line of the table below provides information about actual account values and actual expenses. You may use the information in this line, together with the amount you invested, to estimate the expenses that you paid over the period. Simply divide your account value by $1,000 (for example, an $8,600 account value divided by $1,000 = 8.6), then multiply the result by the number in the “Actual” line under the heading entitled “Expenses paid during period” for your applicable class of shares to estimate the expenses you paid on your account during this period.
Hypothetical example for comparison purposes
The “Hypothetical” line of the table below provides information about hypothetical account values and hypothetical expenses based on the Fund’s actual expense ratio and an assumed rate of return of 5% per year before expenses, which is not the Fund’s actual return. The hypothetical account values and expenses may not be used to estimate the actual ending account balance or expenses you paid for the period. You may use this information to compare the ongoing costs of investing in the Fund and other funds. To do so, compare this 5% hypothetical example with the 5% hypothetical examples that appear in the shareholder reports of the other funds.
Please note that the expenses shown in the table are meant to highlight your ongoing costs only and do not reflect any transactional costs, such as sales charges (loads) and contingent deferred sales charges. Therefore, the “Hypothetical” line of the table is useful in comparing ongoing costs only and will not help you determine the relative total costs of owning different funds. In addition, if these transactional costs were included, your costs would have been higher.
| | Beginning
account value
9-1-2020 | Ending
account value
2-28-2021 | Expenses
paid during
the period1 | Annualized net
expense ratio |
| Class A | | | | |
| Actual | $1,000.00 | $1,000.57 | $3.87 | 0.78% |
| Hypothetical (5% return before expenses) | $1,000.00 | $1,020.93 | $3.91 | 0.78% |
| Class C | | | | |
| Actual | $1,000.00 | $ 996.85 | $7.58 | 1.53% |
| Hypothetical (5% return before expenses) | $1,000.00 | $1,017.21 | $7.65 | 1.53% |
| Class R6 | | | | |
| Actual | $1,000.00 | $1,002.62 | $1.84 | 0.37% |
| Hypothetical (5% return before expenses) | $1,000.00 | $1,022.96 | $1.86 | 0.37% |
| Administrator Class | | | | |
| Actual | $1,000.00 | $1,001.48 | $2.98 | 0.60% |
| Hypothetical (5% return before expenses) | $1,000.00 | $1,021.82 | $3.01 | 0.60% |
| Institutional Class | | | | |
| Actual | $1,000.00 | $1,002.36 | $2.09 | 0.42% |
| Hypothetical (5% return before expenses) | $1,000.00 | $1,022.71 | $2.11 | 0.42% |
1 Expenses paid is equal to the annualized net expense ratio of each class multiplied by the average account value over the period, multiplied by the number of days in the most recent fiscal half-year divided by the number of days in the fiscal year (to reflect the one-half-year period).
8 | Wells Fargo Short Duration Government Bond Fund
Portfolio of investments—February 28, 2021 (unaudited)
| | | Interest
rate | Maturity
date | Principal | Value |
| Agency securities: 42.29% | | | | | | |
| FHLMC (12 Month LIBOR +1.65%) ± | | 2.35% | 3-1-2043 | $ | 1,122,575 | $ 1,163,154 |
| FHLMC | | 2.50 | 11-1-2028 | | 4,841,625 | 5,120,027 |
| FHLMC (12 Month LIBOR +1.76%) ± | | 2.60 | 12-1-2042 | | 1,555,226 | 1,631,165 |
| FHLMC (12 Month LIBOR +1.64%) ± | | 2.85 | 7-1-2047 | | 3,081,961 | 3,202,788 |
| FHLMC | | 3.00 | 10-1-2032 | | 12,466,989 | 13,423,476 |
| FHLMC (12 Month LIBOR +1.85%) ± | | 3.30 | 5-1-2042 | | 1,041,404 | 1,094,618 |
| FHLMC | | 3.50 | 11-1-2030 | | 26,743,596 | 28,776,220 |
| FHLMC | | 3.50 | 2-1-2031 | | 16,438,963 | 17,679,832 |
| FHLMC | | 3.50 | 3-1-2031 | | 1,464,590 | 1,590,009 |
| FHLMC | | 4.00 | 10-1-2033 | | 506,134 | 567,666 |
| FHLMC | | 4.00 | 1-1-2034 | | 476,943 | 534,757 |
| FHLMC | | 4.00 | 5-15-2039 | | 242,754 | 244,518 |
| FHLMC | | 4.00 | 7-1-2049 | | 5,365,896 | 5,922,616 |
| FHLMC | | 4.50 | 4-1-2031 | | 908,075 | 998,793 |
| FHLMC | | 4.50 | 11-1-2048 | | 4,518,950 | 5,022,972 |
| FHLMC Series 3632 Class PK | | 5.00 | 2-15-2040 | | 2,580,867 | 2,890,423 |
| FHLMC Series 3653 Class AU | | 4.00 | 4-15-2040 | | 699,610 | 748,865 |
| FHLMC Series 4239 Class AB | | 4.00 | 12-15-2039 | | 109,649 | 110,083 |
| FHLMC Series 4426 Class QC | | 1.75 | 7-15-2037 | | 4,169,122 | 4,314,669 |
| FHLMC Series 4891 Class PA | | 3.50 | 7-15-2048 | | 1,328,799 | 1,386,156 |
| FHLMC Series 4940 Class AG | | 3.00 | 5-15-2040 | | 13,735,676 | 14,546,521 |
| FNMA | | 2.00 | 12-1-2030 | | 4,765,183 | 4,941,632 |
| FNMA | | 2.00 | 12-1-2030 | | 3,058,635 | 3,172,032 |
| FNMA | | 2.00 | 10-1-2035 | | 8,253,934 | 8,569,623 |
| FNMA | | 2.00 | 1-1-2036 | | 8,080,611 | 8,367,017 |
| FNMA | | 2.00 | 1-25-2036 | | 16,000,000 | 16,555,136 |
| FNMA | | 2.00 | 2-1-2036 | | 13,521,553 | 14,000,805 |
| FNMA (12 Month LIBOR +1.69%) ± | | 2.42 | 11-1-2042 | | 2,029,086 | 2,121,966 |
| FNMA (12 Month LIBOR +1.56%) ± | | 2.48 | 9-1-2045 | | 1,557,056 | 1,616,376 |
| FNMA | | 2.50 | 2-1-2036 | | 4,689,000 | 5,002,871 |
| FNMA | | 2.50 | 10-1-2050 | | 9,370,683 | 9,807,108 |
| FNMA (12 Month LIBOR +1.59%) ± | | 2.68 | 1-1-2046 | | 1,853,118 | 1,927,326 |
| FNMA (12 Month LIBOR +1.58%) ± | | 2.70 | 2-1-2046 | | 2,272,145 | 2,361,686 |
| FNMA (12 Month LIBOR +1.58%) ± | | 2.76 | 6-1-2045 | | 1,128,625 | 1,171,783 |
| FNMA | | 3.00 | 4-1-2035 | | 5,468,597 | 5,949,873 |
| FNMA | | 3.00 | 12-1-2035 | | 3,366,515 | 3,687,670 |
| FNMA | | 3.50 | 6-1-2035 | | 2,002,684 | 2,220,203 |
| FNMA | | 3.50 | 7-1-2043 | | 3,525,649 | 3,870,981 |
| FNMA (1 Year Treasury Constant Maturity +2.04%) ± | | 3.96 | 3-1-2049 | | 2,973,010 | 3,129,086 |
| FNMA | | 4.00 | 4-1-2032 | | 407,667 | 445,437 |
| FNMA | | 4.00 | 10-1-2033 | | 625,769 | 690,653 |
| FNMA | | 4.00 | 2-1-2034 | | 3,734,069 | 4,084,903 |
| FNMA | | 4.00 | 7-1-2034 | | 921,725 | 1,014,425 |
| FNMA | | 4.50 | 7-1-2048 | | 3,444,670 | 3,818,584 |
| FNMA | | 4.50 | 10-1-2048 | | 9,575,113 | 10,671,795 |
| FNMA | | 4.50 | 11-1-2049 | | 2,141,180 | 2,429,958 |
| FNMA | | 5.00 | 10-1-2040 | | 895,758 | 1,036,907 |
| FNMA | | 5.00 | 5-1-2046 | | 369,244 | 428,641 |
| FNMA | | 5.00 | 1-1-2049 | | 3,638,219 | 4,134,470 |
| FNMA | | 5.00 | 8-1-2049 | | 5,012,035 | 5,701,418 |
| FNMA | | 5.00 | 11-1-2049 | | 4,483,476 | 5,097,971 |
| FNMA | | 5.00 | 12-1-2049 | | 2,044,273 | 2,367,563 |
| FNMA | | 5.50 | 6-1-2049 | | 5,168,109 | 6,014,826 |
| FNMA Series 2009-20 Class DT | | 4.50 | 4-25-2039 | | 1,560,409 | 1,751,196 |
The accompanying notes are an integral part of these financial statements.
Wells Fargo Short Duration Government Bond Fund | 9
Portfolio of investments—February 28, 2021 (unaudited)
| | | Interest
rate | Maturity
date | Principal | Value |
| Agency securities (continued) | | | | | | |
| FNMA Series 2011-14 Class GD | | 4.00% | 4-25-2040 | $ | 1,084,247 | $ 1,110,931 |
| FNMA Series 2013-103 Class H | | 4.50 | 3-25-2038 | | 520,050 | 524,780 |
| FNMA Series 2013-71 Class AC | | 2.00 | 3-25-2038 | | 366,613 | 367,158 |
| FNMA Series 2013-90 Class A | | 4.00 | 11-25-2038 | | 423,285 | 425,249 |
| FNMA Series 2015-57 Class AB | | 3.00 | 8-25-2045 | | 2,261,471 | 2,417,177 |
| FNMA Series 2019-33 Class MA | | 3.50 | 7-25-2055 | | 13,718,244 | 14,357,213 |
| GNMA | | 4.00 | 9-20-2044 | | 1,437,214 | 1,591,617 |
| GNMA | | 4.00 | 12-20-2044 | | 1,747,965 | 1,938,525 |
| GNMA | | 4.00 | 1-20-2045 | | 1,167,098 | 1,294,261 |
| GNMA | | 4.00 | 4-20-2048 | | 4,123,812 | 4,425,669 |
| GNMA | | 4.50 | 3-20-2048 | | 1,128,220 | 1,235,285 |
| GNMA | | 4.50 | 6-20-2048 | | 4,411,928 | 4,804,715 |
| GNMA | | 4.50 | 6-20-2048 | | 1,463,123 | 1,596,175 |
| GNMA | | 4.50 | 8-20-2048 | | 1,605,472 | 1,747,088 |
| GNMA | | 4.50 | 10-20-2048 | | 384,670 | 419,404 |
| GNMA | | 4.50 | 2-20-2049 | | 2,473,965 | 2,709,443 |
| GNMA | | 4.50 | 4-20-2049 | | 618,191 | 676,963 |
| GNMA | | 5.00 | 10-15-2039 | | 638,914 | 745,429 |
| GNMA | | 5.00 | 3-20-2048 | | 1,201,147 | 1,336,306 |
| GNMA | | 5.00 | 6-20-2048 | | 169,700 | 189,885 |
| GNMA | | 5.00 | 6-20-2048 | | 184,867 | 206,508 |
| GNMA | | 5.00 | 7-20-2048 | | 144,202 | 158,176 |
| GNMA | | 5.00 | 9-20-2048 | | 1,043,527 | 1,145,238 |
| GNMA | | 5.00 | 3-20-2049 | | 284,426 | 319,886 |
| GNMA | | 5.00 | 3-20-2049 | | 1,266,540 | 1,416,073 |
| GNMA | | 5.00 | 5-20-2049 | | 2,139,874 | 2,405,360 |
| GNMA | | 5.50 | 1-20-2049 | | 155,702 | 172,485 |
| GNMA | | 5.50 | 5-20-2049 | | 10,900,824 | 12,041,104 |
| GNMA Series 2011-137 Class WA ±± | | 5.57 | 7-20-2040 | | 2,037,078 | 2,383,599 |
| GNMA Series 2012-141 Class WD ±± | | 4.92 | 7-20-2040 | | 1,754,708 | 2,007,068 |
| GNMA Series 2017-99 Class DE | | 2.50 | 7-20-2045 | | 2,236,799 | 2,292,955 |
| GNMA Series 2018-11 Class PC | | 2.75 | 12-20-2047 | | 4,090,794 | 4,273,581 |
| GNMA Series 2018-154 Class WP | | 3.50 | 11-20-2048 | | 406,785 | 428,194 |
| GNMA Series 2018-36 Class KC | | 3.00 | 2-20-2046 | | 1,868,150 | 1,967,096 |
| GNMA Series 2019-132 Class NA | | 3.50 | 9-20-2049 | | 595,674 | 628,268 |
| GNMA Series 2020-11 Class ME | | 2.50 | 2-20-2049 | | 5,289,122 | 5,525,967 |
| GNMA Series 2021-23 Class MG ‡ | | 1.50 | 2-20-2051 | | 16,846,000 | 17,030,253 |
| Total Agency securities (Cost $352,789,691) | | | | | | 357,446,333 |
| Asset-backed securities: 10.01% | | | | | | |
| Avis Budget Rental Car Funding LLC Series 2019-1A Class A 144A | | 3.45 | 3-20-2023 | | 5,965,000 | 6,115,687 |
| Ford Credit Auto Owner Trust Series 2018-2 Class A 144A | | 3.47 | 1-15-2030 | | 4,060,000 | 4,353,120 |
| General Motors Series 2020-2 Class A 144A | | 0.69 | 10-15-2025 | | 2,587,000 | 2,600,550 |
| Navient Student Loan Trust Series 2019-GA Class A 144A | | 2.40 | 10-15-2068 | | 4,226,238 | 4,349,286 |
| Navient Student Loan Trust Series 2020-DA Class A 144A | | 1.69 | 5-15-2069 | | 8,396,952 | 8,511,848 |
| Navient Student Loan Trust Series 2020-GA Class A 144A | | 1.17 | 9-16-2069 | | 3,038,094 | 3,050,827 |
| Navient Student Loan Trust Series 2020-HA Class A 144A | | 1.31 | 1-15-2069 | | 7,152,070 | 7,216,835 |
| Navient Student Loan Trust Series 2020-IA Class A1A 144A | | 1.33 | 4-15-2069 | | 7,368,973 | 7,338,636 |
| Navient Student Loan Trust Series 2021-A Class A 144A | | 0.84 | 5-15-2069 | | 2,041,000 | 2,041,902 |
| Nelnet Student Loan Trust Series 2004-4 Class A5 (3 Month LIBOR+0.16%) ± | | 0.38 | 1-25-2037 | | 3,079,471 | 3,052,219 |
| Nelnet Student Loan Trust Series 2012-1A Class A (1 Month LIBOR+0.80%) 144A± | | 0.92 | 12-27-2039 | | 1,942,994 | 1,940,059 |
The accompanying notes are an integral part of these financial statements.
10 | Wells Fargo Short Duration Government Bond Fund
Portfolio of investments—February 28, 2021 (unaudited)
| | | Interest
rate | Maturity
date | Principal | Value |
| Asset-backed securities (continued) | | | | | | |
| Nelnet Student Loan Trust Series 2016-1A Class A (1 Month LIBOR+0.80%) 144A± | | 0.92% | 9-25-2065 | $ | 4,544,598 | $ 4,534,476 |
| SLC Student Loan Trust Series 2010-1 Class A (3 Month LIBOR+0.88%) ± | | 1.06 | 11-25-2042 | | 909,605 | 914,633 |
| SLM Student Loan Trust Series 2005-6 Class A6 (3 Month LIBOR+0.14%) ± | | 0.36 | 10-27-2031 | | 1,971,540 | 1,948,115 |
| SLM Student Loan Trust Series 2012-3 Class A (1 Month LIBOR+0.65%) ± | | 0.77 | 12-27-2038 | | 4,771,271 | 4,744,638 |
| SMB Private Education Loan Trust Series 2015-A Class A2A 144A | | 2.49 | 6-15-2027 | | 988,948 | 1,000,805 |
| SMB Private Education Loan Trust Series 2015-C Class A2A 144A | | 2.75 | 7-15-2027 | | 1,111,250 | 1,128,538 |
| SMB Private Education Loan Trust Series 2016-B Class A2B (1 Month LIBOR+1.45%) 144A± | | 1.56 | 2-17-2032 | | 1,370,242 | 1,392,459 |
| SMB Private Education Loan Trust Series 2020-BA Class A1A 144A | | 1.29 | 7-15-2053 | | 6,582,647 | 6,610,984 |
| SMB Private Education Loan Trust Series 2021-A Class APT1 144A | | 1.07 | 1-15-2053 | | 6,562,000 | 6,475,146 |
| SoFi Professional Loan Program LLC Series 2016-C Class A1 (1 Month LIBOR+1.10%) 144A± | | 1.22 | 10-27-2036 | | 521,189 | 524,107 |
| SoFi Professional Loan Program LLC Series 2016-D Class A1 (1 Month LIBOR+0.95%) 144A± | | 1.07 | 1-25-2039 | | 1,056,378 | 1,061,880 |
| SoFi Professional Loan Program LLC Series 2016-E Class A1 (1 Month LIBOR+0.85%) 144A± | | 0.97 | 7-25-2039 | | 321,973 | 321,969 |
| SoFi Professional Loan Program LLC Series 2017-A Class A1 (1 Month LIBOR+0.70%) 144A± | | 0.82 | 3-26-2040 | | 563,460 | 563,754 |
| SoFi Professional Loan Program LLC Series 2017-C Class A1 (1 Month LIBOR+0.60%) 144A± | | 0.72 | 7-25-2040 | | 536,878 | 536,089 |
| SoFi Professional Loan Program LLC Series 2017-E Class A2B 144A | | 2.72 | 11-26-2040 | | 773,324 | 786,909 |
| SoFi Professional Loan Program LLC Series 2020-C Class AFX 144A | | 1.95 | 2-15-2046 | | 1,482,002 | 1,513,272 |
| Total Asset-backed securities (Cost $84,240,267) | | | | | | 84,628,743 |
| Non-agency mortgage-backed securities: 5.05% | | | | | | |
| Angel Oak Mortgage Trust Series 2019-2 Class A1 144A±± | | 3.63 | 3-25-2049 | | 849,858 | 869,433 |
| Angel Oak Mortgage Trust Series 2020-5 Class A1 144A±± | | 1.37 | 5-25-2065 | | 2,411,088 | 2,429,257 |
| Bunker Hill Loan Depositary Trust Series 2019-1 Class A1 144A | | 3.61 | 10-26-2048 | | 1,184,775 | 1,185,792 |
| Bunker Hill Loan Depositary Trust Series 2019-2 Class A1 144A | | 2.88 | 7-25-2049 | | 1,407,529 | 1,441,983 |
| Citigroup Commercial Mortgage Trust Series 2014-GC25 Class AAB | | 3.37 | 10-10-2047 | | 411,043 | 429,216 |
| Deephaven Residential Mortgage Trust Series 2020-2 Class A1 144A | | 1.69 | 5-25-2065 | | 1,971,821 | 1,987,033 |
| GCAT Series 2019-NQM1 Class A1 144A | | 2.99 | 2-25-2059 | | 1,156,911 | 1,161,958 |
| Mello Warehouse Securitization Trust Series 2020-1 Class A (1 Month LIBOR+0.90%)± | | 1.02 | 10-25-2053 | | 4,875,000 | 4,876,896 |
| Mello Warehouse Securitization Trust Series 2020-2 Class A (1 Month LIBOR+0.80%)144A± | | 0.92 | 11-25-2053 | | 4,753,000 | 4,756,998 |
| Mello Warehouse Securitization Trust Series 2021-1 A (1 Month LIBOR+0.70%)144A± | | 0.81 | 2-25-2055 | | 4,092,000 | 4,060,675 |
The accompanying notes are an integral part of these financial statements.
Wells Fargo Short Duration Government Bond Fund | 11
Portfolio of investments—February 28, 2021 (unaudited)
| | | Interest
rate | Maturity
date | Principal | Value |
| Non-agency mortgage-backed securities (continued) | | | | | | |
| New Residential Mortgage Loan Trust Series 2019-NQM2 Class A1 144A±± | | 3.60% | 4-25-2049 | $ | 965,944 | $ 975,075 |
| Verus Securitization Trust Series 2019-1 Class A1 144A±± | | 3.84 | 2-25-2059 | | 1,963,109 | 1,975,183 |
| Verus Securitization Trust Series 2019-2 Class A1 144A±± | | 2.91 | 7-25-2059 | | 1,875,142 | 1,917,896 |
| Verus Securitization Trust Series 2019-2 Class A1 144A±± | | 3.21 | 5-25-2059 | | 1,383,431 | 1,390,266 |
| Verus Securitization Trust Series 2019-3 Class A1 144A±± | | 2.69 | 11-25-2059 | | 1,524,321 | 1,565,102 |
| Verus Securitization Trust Series 2019-4 Class A1 144A | | 2.64 | 11-25-2059 | | 1,145,728 | 1,169,925 |
| Verus Securitization Trust Series 2020-2 Class A1 144A±± | | 2.23 | 5-25-2060 | | 2,318,178 | 2,344,795 |
| Verus Securitization Trust Series 2020-5 Class A1 144A | | 1.22 | 5-25-2065 | | 3,303,437 | 3,311,950 |
| Verus Securitization Trust Series 2021-R1 Class A1 144A±± | | 0.82 | 10-25-2063 | | 4,872,075 | 4,875,422 |
| Total Non-agency mortgage-backed securities (Cost $42,498,982) | | | | | | 42,724,855 |
| U.S. Treasury securities: 43.48% | | | | | | |
| U.S. Treasury Note | | 0.13 | 5-31-2022 | | 17,270,000 | 17,272,698 |
| U.S. Treasury Note | | 0.13 | 7-31-2022 | | 20,793,000 | 20,795,437 |
| U.S. Treasury Note | | 0.13 | 9-30-2022 | | 27,740,000 | 27,742,167 |
| U.S. Treasury Note | | 0.13 | 10-31-2022 | | 83,653,000 | 83,653,000 |
| U.S. Treasury Note | | 0.13 | 12-31-2022 | | 18,766,000 | 18,765,267 |
| U.S. Treasury Note | | 0.13 | 1-31-2023 | | 24,358,000 | 24,355,145 |
| U.S. Treasury Note %% | | 0.13 | 2-28-2023 | | 130,108,000 | 130,108,000 |
| U.S. Treasury Note | | 0.13 | 12-15-2023 | | 2,963,000 | 2,952,583 |
| U.S. Treasury Note | | 0.13 | 1-15-2024 | | 8,703,000 | 8,667,644 |
| U.S. Treasury Note | | 0.13 | 2-15-2024 | | 5,814,000 | 5,788,564 |
| U.S. Treasury Note | | 2.13 | 5-15-2022 | | 26,776,000 | 27,428,665 |
| Total U.S. Treasury securities (Cost $367,377,657) | | | | | | 367,529,170 |
| | | Yield | | | Shares | |
| Short-term investments: 16.31% | | | | | | |
| Investment companies: 16.31% | | | | | | |
| Wells Fargo Government Money Market Fund Select Class ♠∞## | | 0.03 | | | 137,820,032 | 137,820,032 |
| Total Short-term investments (Cost $137,820,032) | | | | | | 137,820,032 |
| Total investments in securities (Cost $984,726,629) | 117.14% | | | | | 990,149,133 |
| Other assets and liabilities, net | (17.14) | | | | | (144,877,793) |
| Total net assets | 100.00% | | | | | $ 845,271,340 |
| ± | Variable rate investment. The rate shown is the rate in effect at period end. |
| ±± | The coupon of the security is adjusted based on the principal and interest payments received from the underlying pool of mortgages as well as the credit quality and the actual prepayment speed of the underlying mortgages. |
| ‡ | Security is valued using significant unobservable inputs. |
| 144A | The security may be resold in transactions exempt from registration, normally to qualified institutional buyers, pursuant to Rule 144A under the Securities Act of 1933. |
| ## | All or a portion of this security is segregated for when-issued securities. |
| ♠ | The issuer of the security is an affiliated person of the Fund as defined in the Investment Company Act of 1940. |
| ∞ | The rate represents the 7-day annualized yield at period end. |
| %% | The security is purchased on a when-issued basis. |
The accompanying notes are an integral part of these financial statements.
12 | Wells Fargo Short Duration Government Bond Fund
Portfolio of investments—February 28, 2021 (unaudited)
| Abbreviations: |
| FHLMC | Federal Home Loan Mortgage Corporation |
| FNMA | Federal National Mortgage Association |
| GNMA | Government National Mortgage Association |
| LIBOR | London Interbank Offered Rate |
Investments in affiliates
An affiliated investment is an investment in which the Fund owns at least 5% of the outstanding voting shares of the issuer or as a result of other relationships, such as the Fund and the issuer having the same investment manager. Transactions with issuers that were either affiliated persons of the Fund at the beginning of the period or the end of the period were as follows:
| | Value,
beginning of
period | Purchases | Sales
proceeds | Net
realized
gains
(losses) | Net
change in
unrealized
gains
(losses) | Value,
end of
period | % of
net
assets | Shares,
end
of period | Income
from
affiliated
securities |
Short-term
investments | | | | | | | | | |
Investment
companies | | | | | | | | | |
| Wells Fargo Government Money Market Fund Select Class | $51,203,298 | $701,735,104 | $(615,118,370) | $0 | $0 | $137,820,032 | 16.31% | 137,820,032 | $6,972 |
Futures contracts
| Description | Number of
contracts | Expiration
date | Notional
cost | Notional
value | Unrealized
gains | | Unrealized
losses |
| Long | | | | | | | |
| 2-Year U.S. Treasury Note | 746 | 6-30-2021 | $164,813,571 | $164,691,157 | $ 0 | | $ (122,414) |
| Short | | | | | | | |
| 10-Year Ultra Futures | (212) | 6-30-2021 | (31,533,486) | (31,236,875) | 296,611 | | 0 |
| 5-Year U.S. Treasury Note | (331) | 6-30-2021 | (41,370,524) | (41,033,656) | 336,868 | | 0 |
| | | | | | $633,479 | | $(122,414) |
The accompanying notes are an integral part of these financial statements.
Wells Fargo Short Duration Government Bond Fund | 13
Statement of assets and liabilities—February 28, 2021 (unaudited)
| | |
| Assets | |
Investments in unaffiliated securities, at value (cost $846,906,597)
| $ 852,329,101 |
Investments in affiliated securites, at value (cost $137,820,032)
| 137,820,032 |
Cash
| 127,925 |
Receivable for interest
| 1,274,680 |
Receivable for Fund shares sold
| 878,743 |
Segregated cash for futures contracts
| 692,749 |
Principal paydown receivable
| 363,062 |
Prepaid expenses and other assets
| 36,860 |
Total assets
| 993,523,152 |
| Liabilities | |
Payable for when-issued transactions
| 130,031,518 |
Payable for investments purchased
| 16,730,364 |
Payable for Fund shares redeemed
| 974,278 |
Management fee payable
| 197,521 |
Payable for daily variation margin on open futures contracts
| 101,389 |
Administration fees payable
| 55,763 |
Dividends payable
| 44,842 |
Distribution fee payable
| 4,309 |
Trustees’ fees and expenses payable
| 2,217 |
Accrued expenses and other liabilities
| 109,611 |
Total liabilities
| 148,251,812 |
Total net assets
| $845,271,340 |
| Net assets consist of | |
Paid-in capital
| $ 915,470,442 |
Total distributable loss
| (70,199,102) |
Total net assets
| $845,271,340 |
| Computation of net asset value and offering price per share | |
Net assets – Class A
| $ 86,792,640 |
Shares outstanding – Class A1
| 8,854,089 |
Net asset value per share – Class A
| $9.80 |
Maximum offering price per share – Class A2
| $10.00 |
Net assets – Class C
| $ 7,172,172 |
Shares outstanding – Class C1
| 730,607 |
Net asset value per share – Class C
| $9.82 |
Net assets – Class R6
| $ 40,075,063 |
Shares outstanding – Class R61
| 4,073,317 |
Net asset value per share – Class R6
| $9.84 |
Net assets – Administrator Class
| $ 33,703,944 |
Shares outstanding – Administrator Class1
| 3,431,650 |
Net asset value per share – Administrator Class
| $9.82 |
Net assets – Institutional Class
| $ 677,527,521 |
Shares outstanding – Institutional Class1
| 69,006,818 |
Net asset value per share – Institutional Class
| $9.82 |
| 1 | The Fund has an unlimited number of authorized shares |
| 2 | Maximum offering price is computed as 100/98 of net asset value. On investments of $50,000 or more, the offering price is reduced. |
The accompanying notes are an integral part of these financial statements.
14 | Wells Fargo Short Duration Government Bond Fund
Statement of operations—six months ended February 28, 2021 (unaudited)
| | |
| Investment income | |
Interest
| $ 3,413,474 |
Income from affiliated securities
| 6,972 |
Total investment income
| 3,420,446 |
| Expenses | |
Management fee
| 1,311,161 |
| Administration fees | |
Class A
| 61,791 |
Class C
| 7,006 |
Class R6
| 6,500 |
Administrator Class
| 17,152 |
Institutional Class
| 234,240 |
| Shareholder servicing fees | |
Class A
| 96,549 |
Class C
| 10,948 |
Administrator Class
| 42,837 |
| Distribution fee | |
Class C
| 32,843 |
Custody and accounting fees
| 16,489 |
Professional fees
| 26,685 |
Registration fees
| 37,170 |
Shareholder report expenses
| 24,921 |
Trustees’ fees and expenses
| 9,557 |
Other fees and expenses
| 9,991 |
Total expenses
| 1,945,840 |
| Less: Fee waivers and/or expense reimbursements | |
Fund-level
| (85,204) |
Class A
| (333) |
Class R6
| (4,693) |
Administrator Class
| (11,906) |
Institutional Class
| (63,491) |
Net expenses
| 1,780,213 |
Net investment income
| 1,640,233 |
| Realized and unrealized gains (losses) on investments | |
| Net realized gains on | |
Unaffiliated securities
| 1,572,922 |
Futures contracts
| 1,264,161 |
Net realized gains on investments
| 2,837,083 |
| Net change in unrealized gains (losses) on | |
Unaffiliated securities
| (3,359,959) |
Futures contracts
| 564,188 |
Net change in unrealized gains (losses) on investments
| (2,795,771) |
Net realized and unrealized gains (losses) on investments
| 41,312 |
Net increase in net assets resulting from operations
| $ 1,681,545 |
The accompanying notes are an integral part of these financial statements.
Wells Fargo Short Duration Government Bond Fund | 15
Statement of changes in net assets
| | |
| | Six months ended
February 28, 2021
(unaudited) | Year ended
August 31, 2020 |
| Operations | | | | |
Net investment income
| | $ 1,640,233 | | $ 9,525,096 |
Net realized gains on investments
| | 2,837,083 | | 7,113,797 |
Net change in unrealized gains (losses) on investments
| | (2,795,771) | | 3,953,438 |
Net increase in net assets resulting from operations
| | 1,681,545 | | 20,592,331 |
| Distributions to shareholders from | | | | |
| Net investment income and net realized gains | | | | |
Class A
| | (433,414) | | (688,464) |
Class C
| | (17,765) | | (119,451) |
Class R6
| | (338,218) | | (1,028,202) |
Administrator Class
| | (227,203) | | (861,324) |
Institutional Class
| | (4,341,861) | | (11,227,856) |
Total distributions to shareholders
| | (5,358,461) | | (13,925,297) |
| Capital share transactions | Shares | | Shares | |
| Proceeds from shares sold | | | | |
Class A
| 3,367,432 | 33,112,865 | 4,032,194 | 39,684,604 |
Class C
| 335,020 | 3,303,549 | 431,607 | 4,241,099 |
Class R6
| 520,556 | 5,134,469 | 2,648,245 | 26,044,046 |
Administrator Class
| 166,811 | 1,642,197 | 455,653 | 4,477,225 |
Institutional Class
| 33,747,907 | 332,302,532 | 28,565,351 | 280,049,109 |
| | | 375,495,612 | | 354,496,083 |
| Reinvestment of distributions | | | | |
Class A
| 43,218 | 424,645 | 67,536 | 660,795 |
Class C
| 1,789 | 17,617 | 11,326 | 110,884 |
Class R6
| 28,676 | 282,831 | 90,769 | 891,016 |
Administrator Class
| 22,917 | 225,622 | 87,219 | 854,491 |
Institutional Class
| 413,359 | 4,068,125 | 1,100,654 | 10,779,244 |
| | | 5,018,840 | | 13,296,430 |
| Payment for shares redeemed | | | | |
Class A
| (690,433) | (6,783,072) | (1,008,887) | 9,840,463 |
Class C
| (505,071) | (4,975,899) | (572,969) | (5,611,877) |
Class R6
| (1,368,326) | (13,498,200) | (2,144,187) | (20,987,705) |
Administrator Class
| (432,120) | (4,256,804) | (848,865) | (8,326,143) |
Institutional Class
| (10,935,834) | (107,693,016) | (29,552,849) | (289,715,629) |
| | | (137,206,991) | | (334,481,817) |
Net increase in net assets resulting from capital share transactions
| | 243,307,461 | | 33,310,696 |
Total increase in net assets
| | 239,630,545 | | 39,977,730 |
| Net assets | | | | |
Beginning of period
| | 605,640,795 | | 565,663,065 |
End of period
| | $ 845,271,340 | | $ 605,640,795 |
The accompanying notes are an integral part of these financial statements.
16 | Wells Fargo Short Duration Government Bond Fund
Financial highlights
(For a share outstanding throughout each period)
| | | Year ended August 31 |
| Class A | Six months ended
February 28, 2021
(unaudited) | 2020 | 2019 | 2018 | 2017 | 2016 |
Net asset value, beginning of period
| $9.85 | $9.73 | $9.60 | $9.85 | $9.96 | $10.02 |
Net investment income
| 0.01 | 0.15 | 0.21 | 0.14 | 0.07 | 0.07 |
Net realized and unrealized gains (losses) on investments
| 0.00 1 | 0.18 | 0.16 | (0.20) | (0.03) | 0.02 |
Total from investment operations
| 0.01 | 0.33 | 0.37 | (0.06) | 0.04 | 0.09 |
| Distributions to shareholders from | | | | | | |
Net investment income
| (0.06) | (0.21) | (0.24) | (0.19) | (0.15) | (0.15) |
Net asset value, end of period
| $9.80 | $9.85 | $9.73 | $9.60 | $9.85 | $9.96 |
Total return2
| 0.06% | 3.41% | 3.92% | (0.56)% | 0.45% | 0.90% |
| Ratios to average net assets (annualized) | | | | | | |
Gross expenses
| 0.79% | 0.81% | 0.81% | 0.80% | 0.79% | 0.78% |
Net expenses
| 0.78% | 0.78% | 0.78% | 0.78% | 0.78% | 0.78% |
Net investment income
| 0.13% | 1.32% | 2.22% | 1.36% | 0.79% | 0.70% |
| Supplemental data | | | | | | |
Portfolio turnover rate
| 164% | 395% | 635% | 331% | 348% | 284% |
Net assets, end of period (000s omitted)
| $86,793 | $60,425 | $29,618 | $30,538 | $51,890 | $57,976 |
| 1 | Amount is less than $0.005. |
| 2 | Total return calculations do not include any sales charges. Returns for periods of less than one year are not annualized. |
The accompanying notes are an integral part of these financial statements.
Wells Fargo Short Duration Government Bond Fund | 17
Financial highlights
(For a share outstanding throughout each period)
| | | Year ended August 31 |
| Class C | Six months ended
February 28, 2021
(unaudited) | 2020 | 2019 | 2018 | 2017 | 2016 |
Net asset value, beginning of period
| $9.87 | $9.75 | $9.62 | $9.87 | $9.98 | $10.03 |
Net investment income (loss)
| (0.03) 1 | 0.07 | 0.14 1 | 0.06 1 | 0.00 1,2 | (0.01) |
Net realized and unrealized gains (losses) on investments
| 0.00 2 | 0.18 | 0.16 | (0.19) | (0.03) | 0.03 |
Total from investment operations
| (0.03) | 0.25 | 0.30 | (0.13) | (0.03) | 0.02 |
| Distributions to shareholders from | | | | | | |
Net investment income
| (0.02) | (0.13) | (0.17) | (0.12) | (0.08) | (0.07) |
Net asset value, end of period
| $9.82 | $9.87 | $9.75 | $9.62 | $9.87 | $9.98 |
Total return3
| (0.31)% | 2.64% | 3.14% | (1.30)% | (0.30)% | 0.25% |
| Ratios to average net assets (annualized) | | | | | | |
Gross expenses
| 1.54% | 1.56% | 1.56% | 1.55% | 1.54% | 1.53% |
Net expenses
| 1.53% | 1.53% | 1.53% | 1.53% | 1.53% | 1.53% |
Net investment income (loss)
| (0.59)% | 0.61% | 1.49% | 0.62% | 0.04% | (0.05)% |
| Supplemental data | | | | | | |
Portfolio turnover rate
| 164% | 395% | 635% | 331% | 348% | 284% |
Net assets, end of period (000s omitted)
| $7,172 | $8,868 | $10,032 | $15,093 | $20,026 | $27,454 |
| 1 | Calculated based upon average shares outstanding |
| 2 | Amount is less than $0.005. |
| 3 | Total return calculations do not include any sales charges. Returns for periods of less than one year are not annualized. |
The accompanying notes are an integral part of these financial statements.
18 | Wells Fargo Short Duration Government Bond Fund
Financial highlights
(For a share outstanding throughout each period)
| | | Year ended August 31 |
| Class R6 | Six months ended
February 28, 2021
(unaudited) | 2020 | 2019 | 2018 | 2017 | 2016 |
Net asset value, beginning of period
| $9.89 | $9.77 | $9.64 | $9.89 | $9.99 | $10.05 |
Net investment income
| 0.03 1 | 0.19 | 0.25 1 | 0.16 1 | 0.12 1 | 0.12 |
Net realized and unrealized gains (losses) on investments
| 0.00 2 | 0.18 | 0.16 | (0.17) | (0.02) | 0.01 |
Total from investment operations
| 0.03 | 0.37 | 0.41 | (0.01) | 0.10 | 0.13 |
| Distributions to shareholders from | | | | | | |
Net investment income
| (0.08) | (0.25) | (0.28) | (0.24) | (0.20) | (0.19) |
Net asset value, end of period
| $9.84 | $9.89 | $9.77 | $9.64 | $9.89 | $9.99 |
Total return3
| 0.26% | 3.83% | 4.34% | (0.14)% | 0.96% | 1.32% |
| Ratios to average net assets (annualized) | | | | | | |
Gross expenses
| 0.41% | 0.43% | 0.43% | 0.42% | 0.41% | 0.40% |
Net expenses
| 0.37% | 0.37% | 0.37% | 0.37% | 0.37% | 0.37% |
Net investment income
| 0.55% | 1.77% | 2.62% | 1.64% | 1.19% | 1.11% |
| Supplemental data | | | | | | |
Portfolio turnover rate
| 164% | 395% | 635% | 331% | 348% | 284% |
Net assets, end of period (000s omitted)
| $40,075 | $48,371 | $41,987 | $35,472 | $172,106 | $233,993 |
| 1 | Calculated based upon average shares outstanding |
| 2 | Amount is less than $0.005. |
| 3 | Returns for periods of less than one year are not annualized. |
The accompanying notes are an integral part of these financial statements.
Wells Fargo Short Duration Government Bond Fund | 19
Financial highlights
(For a share outstanding throughout each period)
| | | Year ended August 31 |
| Administrator Class | Six months ended
February 28, 2021
(unaudited) | 2020 | 2019 | 2018 | 2017 | 2016 |
Net asset value, beginning of period
| $9.87 | $9.75 | $9.62 | $9.87 | $9.98 | $10.03 |
Net investment income
| 0.02 1 | 0.16 1 | 0.23 1 | 0.15 1 | 0.08 | 0.08 |
Net realized and unrealized gains (losses) on investments
| (0.01) 2 | 0.19 | 0.16 | (0.19) | (0.02) | 0.04 |
Total from investment operations
| 0.01 | 0.35 | 0.39 | (0.04) | 0.06 | 0.12 |
| Distributions to shareholders from | | | | | | |
Net investment income
| (0.06) | (0.23) | (0.26) | (0.21) | (0.17) | (0.17) |
Net asset value, end of period
| $9.82 | $9.87 | $9.75 | $9.62 | $9.87 | $9.98 |
Total return3
| 0.15% | 3.60% | 4.10% | (0.37)% | 0.63% | 1.18% |
| Ratios to average net assets (annualized) | | | | | | |
Gross expenses
| 0.73% | 0.75% | 0.75% | 0.74% | 0.73% | 0.72% |
Net expenses
| 0.60% | 0.60% | 0.60% | 0.60% | 0.60% | 0.60% |
Net investment income
| 0.32% | 1.54% | 2.41% | 1.56% | 0.96% | 0.87% |
| Supplemental data | | | | | | |
Portfolio turnover rate
| 164% | 395% | 635% | 331% | 348% | 284% |
Net assets, end of period (000s omitted)
| $33,704 | $36,262 | $38,816 | $71,997 | $89,743 | $121,576 |
| 1 | Calculated based upon average shares outstanding |
| 2 | Amount is less than $0.005. |
| 3 | Returns for periods of less than one year are not annualized. |
The accompanying notes are an integral part of these financial statements.
20 | Wells Fargo Short Duration Government Bond Fund
Financial highlights
(For a share outstanding throughout each period)
| | | Year ended August 31 |
| Institutional Class | Six months ended
February 28, 2021
(unaudited) | 2020 | 2019 | 2018 | 2017 | 2016 |
Net asset value, beginning of period
| $9.87 | $9.75 | $9.62 | $9.87 | $9.98 | $10.03 |
Net investment income
| 0.03 | 0.17 | 0.25 | 0.17 | 0.11 | 0.11 |
Net realized and unrealized gains (losses) on investments
| (0.01) | 0.19 | 0.16 | (0.19) | (0.03) | 0.03 |
Total from investment operations
| 0.02 | 0.36 | 0.41 | (0.02) | 0.08 | 0.14 |
| Distributions to shareholders from | | | | | | |
Net investment income
| (0.07) | (0.24) | (0.28) | (0.23) | (0.19) | (0.19) |
Net asset value, end of period
| $9.82 | $9.87 | $9.75 | $9.62 | $9.87 | $9.98 |
Total return1
| 0.24% | 3.78% | 4.29% | (0.20)% | 0.81% | 1.37% |
| Ratios to average net assets (annualized) | | | | | | |
Gross expenses
| 0.46% | 0.48% | 0.48% | 0.47% | 0.46% | 0.45% |
Net expenses
| 0.42% | 0.42% | 0.42% | 0.42% | 0.42% | 0.42% |
Net investment income
| 0.49% | 1.72% | 2.57% | 1.75% | 1.15% | 1.06% |
| Supplemental data | | | | | | |
Portfolio turnover rate
| 164% | 395% | 635% | 331% | 348% | 284% |
Net assets, end of period (000s omitted)
| $677,528 | $451,715 | $445,211 | $493,372 | $579,690 | $664,047 |
| 1 | Returns for periods of less than one year are not annualized. |
The accompanying notes are an integral part of these financial statements.
Wells Fargo Short Duration Government Bond Fund | 21
Notes to financial statements (unaudited)
1. ORGANIZATION
Wells Fargo Funds Trust (the “Trust”), a Delaware statutory trust organized on March 10, 1999, is an open-end management investment company registered under the Investment Company Act of 1940, as amended (the “1940 Act”). As an investment company, the Trust follows the accounting and reporting guidance in Financial Accounting Standards Board (“FASB”) Accounting Standards Codification Topic 946, Financial Services – Investment Companies. These financial statements report on the Wells Fargo Short Duration Government Bond Fund (the “Fund”) which is a diversified series of the Trust.
On February 23, 2021, Wells Fargo & Company announced that it has entered into a definitive agreement to sell Wells Fargo Asset Management (“WFAM”) to GTCR LLC and Reverence Capital Partners, L.P. WFAM is the trade name used by the asset management businesses of Wells Fargo & Company and includes Wells Fargo Funds Management, LLC, the investment manager to the Fund, Wells Capital Management Incorporated and Wells Fargo Asset Management (International) Limited, both registered investment advisers providing sub-advisory services to certain funds, and Wells Fargo Funds Distributor, LLC, the Fund's principal underwriter. As part of the transaction, Wells Fargo & Company will own a 9.9% equity interest and will continue to serve as an important client and distribution partner. The transaction is expected to close in the second half of 2021, subject to customary closing conditions.
Consummation of the transaction will result in the automatic termination of the Fund's investment management agreement and sub-advisory agreement. The Fund's Board of Trustees will be asked to approve new investment management arrangements with the new company. If approved by the Board, the new investment management arrangements with the new company will be presented to the shareholders of the Fund for approval, and, if approved by shareholders, would take effect upon the closing of the transaction. The transaction is expected to close in the second half of 2021, subject to customary closing conditions.
2. SIGNIFICANT ACCOUNTING POLICIES
The following significant accounting policies, which are consistently followed in the preparation of the financial statements of the Fund, are in conformity with U.S. generally accepted accounting principles which require management to make estimates and assumptions that affect the reported amounts of assets and liabilities, disclosure of contingent assets and liabilities at the date of the financial statements, and the reported amounts of income and expenses during the reporting period. Actual results could differ from those estimates.
Securities valuation
All investments are valued each business day as of the close of regular trading on the New York Stock Exchange (generally 4 p.m. Eastern Time), although the Fund may deviate from this calculation time under unusual or unexpected circumstances.
Debt securities are valued at the evaluated bid price provided by an independent pricing service (e.g. taking into account various factors, including yields, maturities, or credit ratings) or, if a reliable price is not available, the quoted bid price from an independent broker-dealer.
Futures contracts that are listed on a foreign or domestic exchange or market are valued at the official closing price or, if none, the last sales price.
Investments in registered open-end investment companies are valued at net asset value.
Investments which are not valued using any of the methods discussed above are valued at their fair value, as determined in good faith by the Board of Trustees. The Board of Trustees has established a Valuation Committee comprised of the Trustees and has delegated to it the authority to take any actions regarding the valuation of portfolio securities that the Valuation Committee deems necessary or appropriate, including determining the fair value of portfolio securities, unless the determination has been delegated to the Wells Fargo Asset Management Pricing Committee at Wells Fargo Funds Management, LLC (“Funds Management”). The Board of Trustees retains the authority to make or ratify any valuation decisions or approve any changes to the Valuation Procedures as it deems appropriate. On a quarterly basis, the Board of Trustees receives reports on any valuation actions taken by the Valuation Committee or the Wells Fargo Asset Management Pricing Committee which may include items for ratification.
Futures contracts
Futures contracts are agreements between the Fund and a counterparty to buy or sell a specific amount of a commodity, financial instrument or currency at a specified price on a specified date. The Fund may buy and sell futures contracts in order to gain exposure to, or protect against, changes in interest rates and is subject to interest rate risk. The primary risks associated with the use of futures contracts are the imperfect correlation between changes in market values of securities held by the Fund and the prices of futures contracts, and the possibility of an illiquid market. Futures contracts are generally entered into on a
22 | Wells Fargo Short Duration Government Bond Fund
Notes to financial statements (unaudited)
regulated futures exchange and cleared through a clearinghouse associated with the exchange. With futures contracts, there is minimal counterparty risk to the Fund since futures contracts are exchange traded and the exchange’s clearinghouse, as the counterparty to all exchange traded futures, guarantees the futures contracts against default.
Upon entering into a futures contract, the Fund is required to deposit either cash or securities (initial margin) with the broker in an amount equal to a certain percentage of the contract value. Subsequent payments (variation margin) are paid to or from the broker each day equal to the daily changes in the contract value. Such payments are recorded as unrealized gains or losses and, if any, shown as variation margin receivable (payable) in the Statement of Assets and Liabilities. Should the Fund fail to make requested variation margin payments, the broker can gain access to the initial margin to satisfy the Fund’s payment obligations. When the contracts are closed, a realized gain or loss is recorded in the Statement of Operations.
When-issued transactions
The Fund may purchase securities on a forward commitment or when-issued basis. The Fund records a when-issued transaction on the trade date and will segregate assets in an amount at least equal in value to the Fund's commitment to purchase when-issued securities. Securities purchased on a when-issued basis are marked-to-market daily and the Fund begins earning interest on the settlement date. Losses may arise due to changes in the market value of the underlying securities or if the counterparty does not perform under the contract.
Security transactions and income recognition
Securities transactions are recorded on a trade date basis. Realized gains or losses are recorded on the basis of identified cost.
Interest income is accrued daily and bond discounts are accreted and premiums are amortized daily. To the extent debt obligations are placed on non-accrual status, any related interest income may be reduced by writing off interest receivables when the collection of all or a portion of interest has been determined to be doubtful based on consistently applied procedures and the fair value has decreased. If the issuer subsequently resumes interest payments or when the collectability of interest is reasonably assured, the debt obligation is removed from non-accrual status. Paydown gains and losses are included in interest income.
Distributions to shareholders
Distributions to shareholders from net investment income are declared daily and paid monthly. Distributions from net realized gains, if any, are recorded on the ex-dividend date and paid at least annually. Such distributions are determined in accordance with income tax regulations and may differ from U.S. generally accepted accounting principles. Dividend sources are estimated at the time of declaration. The tax character of distributions is determined as of the Fund’s fiscal year end. Therefore, a portion of the Fund’s distributions made prior to the Fund’s fiscal year end may be categorized as a tax return of capital at year end.
Federal and other taxes
The Fund intends to continue to qualify as a regulated investment company by distributing substantially all of its investment company taxable income and any net realized capital gains (after reduction for capital loss carryforwards) sufficient to relieve it from all, or substantially all, federal income taxes. Accordingly, no provision for federal income taxes was required.
The Fund’s income and federal excise tax returns and all financial records supporting those returns for the prior three fiscal years are subject to examination by the federal and Delaware revenue authorities. Management has analyzed the Fund's tax positions taken on federal, state, and foreign tax returns for all open tax years and does not believe that there are any uncertain tax positions that require recognition of a tax liability.
As of February 28, 2021, the aggregate cost of all investments for federal income tax purposes was $984,731,247 and the unrealized gains (losses) consisted of:
| Gross unrealized gains | $ 7,322,177 |
| Gross unrealized losses | (1,393,226) |
| Net unrealized gains | $ 5,928,951 |
As of August 31, 2020, the Fund had capital loss carryforwards which consisted of $39,108,647 in short-term capital losses and $36,448,663 in long-term capital losses.
Class allocations
The separate classes of shares offered by the Fund differ principally in applicable sales charges, distribution, shareholder servicing, and administration fees. Class specific expenses are charged directly to that share class. Investment income, common fund-level expenses, and realized and unrealized gains (losses) on investments are allocated daily to each class of shares based
Wells Fargo Short Duration Government Bond Fund | 23
Notes to financial statements (unaudited)
on the relative proportion of net assets of each class.
3. FAIR VALUATION MEASUREMENTS
Fair value measurements of investments are determined within a framework that has established a fair value hierarchy based upon the various data inputs utilized in determining the value of the Fund’s investments. The three-level hierarchy gives the highest priority to unadjusted quoted prices in active markets for identical assets or liabilities (Level 1) and the lowest priority to unobservable inputs (Level 3). The Fund’s investments are classified within the fair value hierarchy based on the lowest level of input that is significant to the fair value measurement. The inputs are summarized into three broad levels as follows:
| ■ | Level 1 – quoted prices in active markets for identical securities |
| ■ | Level 2 – other significant observable inputs (including quoted prices for similar securities, interest rates, prepayment speeds, credit risk, etc.) |
| ■ | Level 3 – significant unobservable inputs (including the Fund’s own assumptions in determining the fair value of investments) |
The inputs or methodologies used for valuing investments in securities are not necessarily an indication of the risk associated with investing in those securities.
The following is a summary of the inputs used in valuing the Fund’s assets and liabilities as of February 28, 2021:
| | Quoted prices
(Level 1) | Other significant
observable inputs
(Level 2) | Significant
unobservable inputs
(Level 3) | Total |
| Assets | | | | |
| Investments in: | | | | |
| Agency securities | $ 0 | $ 340,416,080 | $ 17,030,253 | $ 357,446,333 |
| Asset-backed securities | 0 | 84,628,743 | 0 | 84,628,743 |
| Non-agency mortgage-backed securities | 0 | 42,724,855 | 0 | 42,724,855 |
| U.S. Treasury securities | 367,529,170 | 0 | 0 | 367,529,170 |
| Short-term investments | | | | |
| Investment companies | 137,820,032 | 0 | 0 | 137,820,032 |
| | 505,349,202 | 467,769,678 | 17,030,253 | 990,149,133 |
| Futures contracts | 633,479 | 0 | 0 | 633,479 |
| Total assets | $505,982,681 | $467,769,678 | $17,030,253 | $990,782,612 |
| Liabilities | | | | |
| Futures contracts | $ 122,414 | $ 0 | $ 0 | $ 122,414 |
| Total liabilities | $ 122,414 | $ 0 | $ 0 | $ 122,414 |
The following is a reconciliation of assets in which significant unobservable inputs (Level 3) were used in determining fair value:
| | Agency securities |
| Balance as of August 31, 2020 | $ 0 |
| Accrued discounts (premiums) | 0 |
| Realized gain (loss) | 0 |
| Change in unrealized appreciation (depreciation) | (157,931) |
| Purchases | 17,188,184 |
| Sales | 0 |
| Transfer into Level 3 | 0 |
| Transfer out of Level 3 | 0 |
| Balance as of February 28, 2021 | $17,030,253 |
| Change in unrealized gain (loss) from investments held at February 28, 2021 | $ (157,931) |
The agency security in the Level 3 table was valued using an indicative broker quote. The indicative broker quote was considered a Level 3 input. Quantitative unobservable inputs used by the brokers are often proprietary and not provided to the Fund and
24 | Wells Fargo Short Duration Government Bond Fund
Notes to financial statements (unaudited)
therefore the disclosure that would address these inputs is not included above.
Futures contracts are reported at their cumulative unrealized gains (losses) at measurement date as reported in the table following the Portfolio of Investments. For futures contracts, the current day’s variation margin is reported on the Statement of Assets and Liabilities. All other assets and liabilities are reported at their market value at measurement date.
Additional sector, industry or geographic detail, if any, is included in the Portfolio of Investments.
4. TRANSACTIONS WITH AFFILIATES
Management fee
Funds Management, an indirect wholly owned subsidiary of Wells Fargo & Company (“Wells Fargo”), is the manager of the Fund and provides advisory and fund-level administrative services under an investment management agreement. Under the investment management agreement, Funds Management is responsible for, among other services, implementing the investment objectives and strategies of the Fund, supervising the subadviser and providing fund-level administrative services in connection with the Fund’s operations. As compensation for its services under the investment management agreement, Funds Management is entitled to receive a management fee at the following annual rate based on the Fund’s average daily net assets:
| Average daily net assets | Management fee |
| First $1 billion | 0.350% |
| Next $4 billion | 0.325 |
| Next $3 billion | 0.290 |
| Next $2 billion | 0.265 |
| Over $10 billion | 0.255 |
For the six months ended February 28, 2021, the management fee was equivalent to an annual rate of 0.35% of the Fund’s average daily net assets.
Funds Management has retained the services of a subadviser to provide daily portfolio management to the Fund. The fee for subadvisory services is borne by Funds Management. Wells Capital Management Incorporated, an affiliate of Funds Management and an indirect wholly owned subsidiary of Wells Fargo, is the subadviser to the Fund and is entitled to receive a fee from Funds Management at an annual rate starting at 0.15% and declining to 0.05% as the average daily net assets of the Fund increase.
Administration fees
Under a class-level administration agreement, Funds Management provides class-level administrative services to the Fund, which includes paying fees and expenses for services provided by the transfer agent, sub-transfer agents, omnibus account servicers and record-keepers. As compensation for its services under the class-level administration agreement, Funds Management receives an annual fee which is calculated based on the average daily net assets of each class as follows:
| | Class-level
administration fee |
| Class A | 0.16% |
| Class C | 0.16 |
| Class R6 | 0.03 |
| Administrator Class | 0.10 |
| Institutional Class | 0.08 |
Waivers and/or expense reimbursements
Funds Management has contractually waived and/or reimbursed management and administration fees to the extent necessary to maintain certain net operating expense ratios for the Fund. When each class of the Fund has exceeded its expense cap, Funds Management has waived fees and/or reimbursed expenses from fund-level expenses on a proportionate basis and then from class specific expenses. When only certain classes exceed their expense caps, waivers and/or reimbursements are applied against class specific expenses before fund-level expenses. Funds Management has committed through December 31, 2021 to
Wells Fargo Short Duration Government Bond Fund | 25
Notes to financial statements (unaudited)
waive fees and/or reimburse expenses to the extent necessary to cap expenses. Prior to or after the commitment expiration date, the cap may be increased or the commitment to maintain the cap may be terminated only with the approval of the Board of Trustees. The contractual expense caps are as follows:
| | Expense ratio caps |
| Class A | 0.78% |
| Class C | 1.53 |
| Class R6 | 0.37 |
| Administrator Class | 0.60 |
| Institutional Class | 0.42 |
Distribution fee
The Trust has adopted a distribution plan for Class C shares of the Fund pursuant to Rule 12b-1 under the 1940 Act. A distribution fee is charged charged to Class C shares and paid to Wells Fargo Funds Distributor, LLC (“Funds Distributor”), the principal underwriter, at an annual rate of 0.75% of the average daily net assets of Class C shares.
In addition, Funds Distributor is entitled to receive the front-end sales charge from the purchase of Class A shares and a contingent deferred sales charge on the redemption of certain Class A shares. Funds Distributor is also entitled to receive the contingent deferred sales charges from redemptions of Class C shares. For the six months ended February 28, 2021, Funds Distributor received $1,255 from the sale of Class A shares. No contingent deferred sales charges were incurred by Class A and Class C shares for the six months ended February 28, 2021.
Shareholder servicing fees
The Trust has entered into contracts with one or more shareholder servicing agents, whereby Class A, Class C, and Administrator Class of the Fund are charged a fee at an annual rate of 0.25% of the average daily net assets of each respective class. A portion of these total shareholder servicing fees were paid to affiliates of Wells Fargo.
Interfund transactions
The Fund may purchase or sell portfolio investment securities to certain other Wells Fargo affiliates pursuant to Rule 17a-7 under the 1940 Act and under procedures adopted by the Board of Trustees. The procedures have been designed to ensure that these interfund transactions, which do not incur broker commissions, are effected at current market prices.
5. INVESTMENT PORTFOLIO TRANSACTIONS
Purchases and sales of investments, excluding short-term securities, for the six months ended February 28, 2021 were as follows:
| Purchases at cost | | Sales proceeds |
U.S.
government | Non-U.S.
government | | U.S.
government | Non-U.S.
government |
| $1,489,971,192 | $93,593,762 | | $1,204,228,829 | $29,486,824 |
6. DERIVATIVE TRANSACTIONS
During the six months ended February 28, 2021, the Fund entered into futures contracts to speculate on interest rates and to help manage the duration of the portfolio. The Fund had an average notional amount of $153,777,723 in long futures contracts and $61,945,360 in short futures contracts during the six months ended February 28, 2021.
The fair value, realized gains or losses and change in unrealized gains or losses, if any, on derivative instruments are reflected in the corresponding financial statement captions.
7. BANK BORROWINGS
The Trust (excluding the money market funds), Wells Fargo Master Trust and Wells Fargo Variable Trust are parties to a $350,000,000 revolving credit agreement whereby the Fund is permitted to use bank borrowings for temporary or emergency purposes, such as to fund shareholder redemption requests. Interest under the credit agreement is charged to the Fund based
26 | Wells Fargo Short Duration Government Bond Fund
Notes to financial statements (unaudited)
on a borrowing rate equal to the higher of the Federal Funds rate in effect on that day plus 1.25% or the overnight LIBOR rate in effect on that day plus 1.25%. In addition, an annual commitment fee equal to 0.25% of the unused balance is allocated to each participating fund.
For the six months ended February 28, 2021, there were no borrowings by the Fund under the agreement.
8. INDEMNIFICATION
Under the Fund's organizational documents, the officers and Trustees have been granted certain indemnification rights against certain liabilities that may arise out of performance of their duties to the Fund. The Fund has entered into a separate agreement with each Trustee that converts indemnification rights currently existing under the Fund’s organizational documents into contractual rights that cannot be changed in the future without the consent of the Trustee. Additionally, in the normal course of business, the Fund may enter into contracts with service providers that contain a variety of indemnification clauses. The Fund’s maximum exposure under these arrangements is dependent on future claims that may be made against the Fund and, therefore, cannot be estimated.
9. CORONAVIRUS (COVID-19) PANDEMIC
On March 11, 2020, the World Health Organization announced that it had made the assessment that coronavirus disease 2019 (“COVID-19”) is a pandemic. The impacts of COVID-19 are affecting the entire global economy, individual companies and investment products, the funds, and the market in general. There is significant uncertainty around the extent and duration of business disruptions related to COVID-19 and the impacts may last for an extended period of time. COVID-19 has led to significant uncertainty and volatility in the financial markets.
Wells Fargo Short Duration Government Bond Fund | 27
Other information (unaudited)
PROXY VOTING INFORMATION
A description of the policies and procedures used to determine how to vote proxies relating to portfolio securities is available without charge, upon request, by calling 1-800-222-8222, visiting our website at wfam.com, or visiting the SEC website at sec.gov. Information regarding how the proxies related to portfolio securities were voted during the most recent 12-month period ended June 30 is available on the website at wfam.com or by visiting the SEC website at sec.gov.
QUARTERLY PORTFOLIO HOLDINGS INFORMATION
The Fund files its complete schedule of portfolio holdings with the SEC for the first and third quarters of each fiscal year as an exhibit to its reports on Form N-PORT. Shareholders may view the filed Form N-PORT by visiting the SEC website at sec.gov.
28 | Wells Fargo Short Duration Government Bond Fund
Other information (unaudited)
BOARD OF TRUSTEES AND OFFICERS
Each of the Trustees and Officers listed in the table below acts in identical capacities for each fund in the Wells Fargo family of funds, which consists of 144 mutual funds comprising the Wells Fargo Funds Trust, Wells Fargo Variable Trust, Wells Fargo Master Trust and four closed-end funds (collectively the “Fund Complex”). This table should be read in conjunction with the Prospectus and the Statement of Additional Information1. The mailing address of each Trustee and Officer is 525 Market Street, 12th Floor, San Francisco, CA 94105. Each Trustee and Officer serves an indefinite term, however, each Trustee serves such term until reaching the mandatory retirement age established by the Trustees.
Independent Trustees
Name and
year of birth | Position held and
length of service* | Principal occupations during past five years or longer | Current other
public company or
investment
company
directorships |
William R. Ebsworth
(Born 1957) | Trustee,
since 2015 | Retired. From 1984 to 2013, equities analyst, portfolio manager, research director and chief investment officer at Fidelity Management and Research Company in Boston, Tokyo, and Hong Kong, and retired in 2013 as Chief Investment Officer of Fidelity Strategic Advisers, Inc. where he led a team of investment professionals managing client assets. Prior thereto, Board member of Hong Kong Securities Clearing Co., Hong Kong Options Clearing Corp., the Thailand International Fund, Ltd., Fidelity Investments Life Insurance Company, and Empire Fidelity Investments Life Insurance Company. Audit Committee Chair and Investment Committee Chair of the Vincent Memorial Hospital Endowment (non-profit organization). Mr. Ebsworth is a CFA® charterholder. | N/A |
Jane A. Freeman
(Born 1953) | Trustee,
since 2015;
Chair Liaison,
since 2018 | Retired. From 2012 to 2014 and 1999 to 2008, Chief Financial Officer of Scientific Learning Corporation. From 2008 to 2012, Ms. Freeman provided consulting services related to strategic business projects. Prior to 1999, Portfolio Manager at Rockefeller & Co. and Scudder, Stevens & Clark. Board member of the Harding Loevner Funds from 1996 to 2014, serving as both Lead Independent Director and chair of the Audit Committee. Board member of the Russell Exchange Traded Funds Trust from 2011 to 2012 and the chair of the Audit Committee. Ms. Freeman is also an inactive Chartered Financial Analyst. | N/A |
Isaiah Harris, Jr.
(Born 1952) | Trustee,
since 2009; Audit
Committee
Chair,
since 2019 | Retired. Chairman of the Board of CIGNA Corporation since 2009, and Director since 2005. From 2003 to 2011, Director of Deluxe Corporation. Prior thereto, President and CEO of BellSouth Advertising and Publishing Corp. from 2005 to 2007, President and CEO of BellSouth Enterprises from 2004 to 2005 and President of BellSouth Consumer Services from 2000 to 2003. Emeritus member of the Iowa State University Foundation Board of Governors. Emeritus Member of the Advisory Board of Iowa State University School of Business. Advisory Board Member, Palm Harbor Academy (private school). Mr. Harris is a certified public accountant (inactive status). | CIGNA Corporation |
Judith M. Johnson
(Born 1949) | Trustee,
since 2008 | Retired. Prior thereto, Chief Executive Officer and Chief Investment Officer of Minneapolis Employees Retirement Fund from 1996 to 2008. Ms. Johnson is an attorney, certified public accountant and a certified managerial accountant. | N/A |
David F. Larcker
(Born 1950) | Trustee,
since 2009 | James Irvin Miller Professor of Accounting at the Graduate School of Business (Emeritus), Stanford University, Director of the Corporate Governance Research Initiative and Senior Faculty of The Rock Center for Corporate Governance since 2006. From 2005 to 2008, Professor of Accounting at the Graduate School of Business, Stanford University. Prior thereto, Ernst & Young Professor of Accounting at The Wharton School, University of Pennsylvania from 1985 to 2005. | N/A |
Wells Fargo Short Duration Government Bond Fund | 29
Other information (unaudited)
Name and
year of birth | Position held and
length of service* | Principal occupations during past five years or longer | Current other
public company or
investment
company
directorships |
Olivia S. Mitchell
(Born 1953) | Trustee,
since 2006;
Nominating and
Governance
Committee Chair,
since 2018 | International Foundation of Employee Benefit Plans Professor, Wharton School of the University of Pennsylvania since 1993. Director of Wharton’s Pension Research Council and Boettner Center on Pensions & Retirement Research, and Research Associate at the National Bureau of Economic Research. Previously, Cornell University Professor from 1978 to 1993. | N/A |
Timothy J. Penny
(Born 1951) | Trustee,
since 1996;
Chair,
since 2018 | President and Chief Executive Officer of Southern Minnesota Initiative Foundation, a non-profit organization, since 2007. Member of the Board of Trustees of NorthStar Education Finance, Inc., a non-profit organization, since 2007. | N/A |
James G. Polisson
(Born 1959) | Trustee,
since 2018 | Retired. Chief Marketing Officer, Source (ETF) UK Services, Ltd, from 2015 to 2017. From 2012 to 2015, Principal of The Polisson Group, LLC, a management consulting, corporate advisory and principal investing company. Chief Executive Officer and Managing Director at Russell Investments, Global Exchange Traded Funds from 2010 to 2012. Managing Director of Barclays Global Investors from 1998 to 2010 and Global Chief Marketing Officer for iShares and Barclays Global Investors from 2000 to 2010. Trustee of the San Francisco Mechanics’ Institute, a non-profit organization, from 2013 to 2015. Board member of the Russell Exchange Traded Fund Trust from 2011 to 2012. Director of Barclays Global Investors Holdings Deutschland GmbH from 2006 to 2009. Mr. Polisson is an attorney and has a retired status with the Massachusetts and District of Columbia Bar Associations. | N/A |
Pamela Wheelock
(Born 1959) | Trustee,
since January
2020; previously
Trustee from
January 2018 to
July 2019 | Board member of the Destination Medical Center Economic Development Agency, Rochester, Minnesota since 2019. Interim President of the McKnight Foundation from January to September 2020. Acting Commissioner, Minnesota Department of Human Services, July 2019 through September 2019. Human Services Manager (part-time), Minnesota Department of Human Services, October 2019 through December 2019. Chief Operating Officer, Twin Cities Habitat for Humanity from 2017 to 2019. Vice President of University Services, University of Minnesota from 2012 to 2016. Prior thereto, on the Board of Directors, Governance Committee and Finance Committee for the Minnesota Philanthropy Partners (Saint Paul Foundation) from 2012 to 2018, Interim Chief Executive Officer of Blue Cross Blue Shield of Minnesota from 2011 to 2012, Chairman of the Board from 2009 to 2012 and Board Director from 2003 to 2015. Vice President, Leadership and Community Engagement, Bush Foundation, Saint Paul, Minnesota (a private foundation) from 2009 to 2011. Executive Vice President and Chief Financial Officer, Minnesota Sports and Entertainment from 2004 to 2009 and Senior Vice President from 2002 to 2004. Executive Vice President of the Minnesota Wild Foundation from 2004 to 2008. Commissioner of Finance, State of Minnesota, from 1999 to 2002. Currently Board Chair of the Minnesota Wild Foundation since 2010. | N/A |
* Length of service dates reflect the Trustee’s commencement of service with the Trust’s predecessor entities, where applicable.
30 | Wells Fargo Short Duration Government Bond Fund
Other information (unaudited)
Officers
Name and
year of birth | Position held and
length of service | Principal occupations during past five years or longer |
Andrew Owen
(Born 1960) | President,
since 2017 | Executive Vice President of Wells Fargo & Company and Head of Affiliated Managers, Wells Fargo Asset Management, since 2014. In addition, Mr. Owen is currently President, Chief Executive Officer and Director of Wells Fargo Funds Management, LLC since 2017. Prior thereto, Executive Vice President responsible for marketing, investments and product development for Wells Fargo Funds Management, LLC, from 2009 to 2014. |
Jeremy DePalma
(Born 1974) | Treasurer,
since 2012
(for certain funds in
the Fund Complex);
since 2021 (for
the remaining funds in the
Fund Complex) | Senior Vice President of Wells Fargo Funds Management, LLC since 2009. Senior Vice President of Evergreen Investment Management Company, LLC from 2008 to 2010 and head of the Fund Reporting and Control Team within Fund Administration from 2005 to 2010. |
Michelle Rhee
(Born 1966) | Chief Legal Officer,
since 2019 | Secretary of Wells Fargo Funds Management, LLC and Chief Legal Counsel of Wells Fargo Asset Management since 2018. Deputy General Counsel of Wells Fargo Bank, N.A. since 2020 and Assistant General Counsel of Wells Fargo Bank, N.A. from 2018 to 2020. Associate General Counsel and Managing Director of Bank of America Corporation from 2004 to 2018. |
Catherine Kennedy
(Born 1969) | Secretary,
since 2019 | Vice President of Wells Fargo Funds Management, LLC and Senior Counsel of the Wells Fargo Legal Department since 2010. Vice President and Senior Counsel of Evergreen Investment Management Company, LLC from 1998 to 2010. |
Michael H. Whitaker
(Born 1967) | Chief Compliance Officer,
since 2016 | Chief Compliance Officer of Wells Fargo Asset Management since 2016. Senior Vice President and Chief Compliance Officer for Fidelity Investments from 2007 to 2016. |
1 The Statement of Additional Information includes additional information about the Trustees and is available, without charge, upon request, by calling 1-800-222-8222 or by visiting the website at wfam.com.
Wells Fargo Short Duration Government Bond Fund | 31
For more information
More information about Wells Fargo Funds is available free upon request. To obtain literature, please write, visit the Fund's website, or call:
Wells Fargo Funds
P.O. Box 219967
Kansas City, MO 64121-9967
Website: wfam.com
Individual investors: 1-800-222-8222
Retail investment professionals: 1-888-877-9275
Institutional investment professionals: 1-866-765-0778
This report and the financial statements contained herein are submitted for the general information of the shareholders of the Fund. If this report is used for promotional purposes, distribution of the report must be accompanied or preceded by a current prospectus. Before investing, please consider the investment objectives, risks, charges, and expenses of the investment. For a current prospectus and, if available, a summary prospectus, containing this information, call 1-800-222-8222 or visit the Fund's website at wfam.com. Read the prospectus carefully before you invest or send money.
Wells Fargo Asset Management (WFAM) is the trade name for certain investment advisory/management firms owned by Wells Fargo & Company. These firms include but are not limited to Wells Capital Management Incorporated and Wells Fargo Funds Management, LLC. Certain products managed by WFAM entities are distributed by Wells Fargo Funds Distributor, LLC (a broker-dealer and Member FINRA).
This material is for general informational and educational purposes only and is NOT intended to provide investment advice or a recommendation of any kind - including a recommendation for any specific investment, strategy, or plan.
INVESTMENT PRODUCTS: NOT FDIC INSURED ■ NO BANK GUARANTEE ■ MAY LOSE VALUE
© 2021 Wells Fargo & Company. All rights reserved.
PAR-0321-00295 04-21
SA220/SAR220 2-21
Semi-Annual Report
February 28, 2021
Wells Fargo
Short-Term Bond Plus Fund
Reduce clutter.
Save trees.
Sign up for electronic delivery of prospectuses and shareholder reports at wellsfargo.com/ advantagedelivery
The views expressed and any forward-looking statements are as of February 28, 2021, unless otherwise noted, and are those of the Fund's portfolio managers and/or Wells Fargo Asset Management. Discussions of individual securities or the markets generally are not intended as individual recommendations. Future events or results may vary significantly from those expressed in any forward-looking statements. The views expressed are subject to change at any time in response to changing circumstances in the market. Wells Fargo Asset Management and the Fund disclaim any obligation to publicly update or revise any views expressed or forward-looking statements.
INVESTMENT PRODUCTS: NOT FDIC INSURED ■ NO BANK GUARANTEE ■ MAY LOSE VALUE
Wells Fargo Short-Term Bond Plus Fund | 1
Letter to shareholders (unaudited)
Andrew Owen
President
Wells Fargo Funds
Dear Shareholder:
We are pleased to offer you this semi-annual report for the Wells Fargo Short-Term Bond Plus Fund for the six-month period that ended February 28, 2021. Global stocks showed robust returns, as the global economy began emerging from the haze of COVID-19. Tailwinds were provided by global stimulus programs, a rapid vaccination rollout, and recovering consumer and corporate sentiment. Bonds also had positive returns, led by high-yield bonds.
For the six-month period, U.S. stocks, based on the S&P 500 Index,1 gained 9.74%. International stocks, as measured by the MSCI ACWI ex USA Index (Net),2 returned 16.65%, while the MSCI EM Index (Net),3 had even stronger performance, with a 22.32% gain. Among bond indexes, the Bloomberg Barclays U.S. Aggregate Bond Index,4 returned (1.55)%, the Bloomberg Barclays Global Aggregate ex-USD Index (unhedged),5 gained 1.41%, and the Bloomberg Barclays Municipal Bond Index,6 returned 0.86% while the ICE BofA U.S. High Yield Index,7 gained 6.14%.
Hope drove the stock markets to new highs.
Stocks grew more volatile in September on mixed economic data. U.S. economic activity continued to grow. However, U.S. unemployment remained elevated at 7.9% in September. With U.S. Congress delaying further fiscal relief and uncertainties surrounding a possible vaccine, doubts crept back into the financial markets. In the U.K., a lack of progress in Brexit talks weighed on markets. China’s economy picked up steam, fueled by increased global demand.
In October, capital markets stepped back from their six-month rally. Market volatility rose in advance of the U.S. election and amid a global increase in COVID-19 infections. Europe introduced tighter restrictions affecting economic activity. U.S. markets looked favorably at the prospect of Democratic control of the federal purse strings, which could lead to additional fiscal stimulus and a boost to economic activity. Meanwhile, China reported 4.9% third-quarter gross domestic product growth.
| 1 | The S&P 500 Index consists of 500 stocks chosen for market size, liquidity, and industry group representation. It is a market-value-weighted index with each stock's weight in the index proportionate to its market value. You cannot invest directly in an index. |
| 2 | The Morgan Stanley Capital International (MSCI) All Country World Index (ACWI) ex USA Index (Net) is a free-float-adjusted market-capitalization-weighted index that is designed to measure the equity market performance of developed and emerging markets, excluding the United States. Source: MSCI. MSCI makes no express or implied warranties or representations and shall have no liability whatsoever with respect to any MSCI data contained herein. The MSCI data may not be further redistributed or used as a basis for other indices or any securities or financial products. This report is not approved, reviewed, or produced by MSCI. You cannot invest directly in an index. |
| 1 | The S&P 500 Index consists of 500 stocks chosen for market size, liquidity, and industry group representation. It is a market-value-weighted index with each stock's weight in the index proportionate to its market value. You cannot invest directly in an index. |
| 3 | The MSCI Emerging Markets (EM) Index (Net) is a free-float-adjusted market-capitalization-weighted index that is designed to measure equity market performance of emerging markets. You cannot invest directly in an index. |
| 1 | The S&P 500 Index consists of 500 stocks chosen for market size, liquidity, and industry group representation. It is a market-value-weighted index with each stock's weight in the index proportionate to its market value. You cannot invest directly in an index. |
| 4 | The Bloomberg Barclays U.S. Aggregate Bond Index is a broad-based benchmark that measures the investment-grade, U.S. dollar-denominated, fixed-rate taxable bond market, including Treasuries, government-related and corporate securities, mortgage-backed securities (agency fixed-rate and hybrid adjustable-rate mortgage pass-throughs), asset-backed securities, and commercial mortgage-backed securities. You cannot invest directly in an index. |
| 1 | The S&P 500 Index consists of 500 stocks chosen for market size, liquidity, and industry group representation. It is a market-value-weighted index with each stock's weight in the index proportionate to its market value. You cannot invest directly in an index. |
| 5 | The Bloomberg Barclays Global Aggregate ex-USD Index (unhedged) is an unmanaged index that provides a broad-based measure of the global investment-grade fixed-income markets excluding the U.S. dollar-denominated debt market. You cannot invest directly in an index. |
| 1 | The S&P 500 Index consists of 500 stocks chosen for market size, liquidity, and industry group representation. It is a market-value-weighted index with each stock's weight in the index proportionate to its market value. You cannot invest directly in an index. |
| 6 | The Bloomberg Barclays Municipal Bond Index is an unmanaged index composed of long-term tax-exempt bonds with a minimum credit rating of Baa. You cannot invest directly in an index. |
| 1 | The S&P 500 Index consists of 500 stocks chosen for market size, liquidity, and industry group representation. It is a market-value-weighted index with each stock's weight in the index proportionate to its market value. You cannot invest directly in an index. |
| 7 | The ICE BofA U.S. High Yield Index is a market-capitalization-weighted index of domestic and Yankee high-yield bonds. The index tracks the performance of high-yield securities traded in the U.S. bond market. You cannot invest directly in an index. Copyright 2021. ICE Data Indices, LLC. All rights reserved. |
2 | Wells Fargo Short-Term Bond Plus Fund
Letter to shareholders (unaudited)
Global stocks rallied in November, propelled by optimism over three promising COVID-19 vaccines. Reversing recent trends, value stocks outperformed growth stocks and cyclical stocks outpaced technology stocks. However, U.S. unemployment remained elevated, with a net job loss of 10 million since February 2020. The eurozone services Purchasing Managers’ Index, a monthly survey of purchasing managers, contracted sharply while the region’s manufacturing activity grew. The U.S. election results added to the upbeat mood as investors anticipated more consistent policies in the new administration.
Financial markets ended the year with strength on high expectations for a rapid rollout of the COVID-19 vaccines, the successful passage of a $900 billion stimulus package, and rising expectations of additional economic support from a Democratic-led Congress. U.S. economic data were mixed with still-elevated unemployment and weak retail sales but growth in manufacturing output. In contrast, China’s economic expansion continued in both manufacturing and nonmanufacturing. U.S. COVID-19 infection rates continued to rise even as new state and local lockdown measures were implemented.
The year 2021 began with emerging market stocks leading all major asset classes in January, driven by China’s strong economic growth and a broad recovery in corporate earnings, which propelled China’s stock market higher. In the United States, positive news on vaccine trials and January's expansion in both the manufacturing and services sectors was offset by a weak December monthly jobs report. This was compounded by technical factors as some hedge funds were forced to sell stocks to protect themselves against a well-publicized short squeeze coordinated by a group of retail investors. Eurozone sentiment and economic growth were particularly weak, reflecting the impact of a new lockdown with stricter social distancing along with a slow vaccine rollout.
February saw major domestic equity indexes driven higher on the hope of a new stimulus bill, improving COVID-19 vaccination numbers, and the gradual reopening of the economy. Most S&P 500 companies reported better-than-expected earnings, with positive surprises coming from the financials, IT, health care, and materials sectors. Japan saw its economy strengthen as a result of strong export numbers. Meanwhile, crude oil prices continued their climb, rising more than 25% for the year. Domestic government bonds experienced a sharp sell-off in late February as markets priced in a more robust economic recovery and higher growth and inflation expectations.
Don’t let short-term uncertainty derail long-term investment goals.
Periods of investment uncertainty can present challenges, but experience has taught us that maintaining long-term investment goals can be an effective way to plan for the future. To help you create a sound strategy based on your personal goals and risk tolerance, Wells Fargo Funds offers more than 100 mutual funds spanning a wide range of asset classes and investment styles. Although diversification cannot guarantee an investment profit or prevent losses, we believe it can be an effective way to manage investment risk and potentially smooth out overall portfolio performance. We encourage investors to know their investments and to understand that appropriate levels of risk-taking may unlock opportunities.
Thank you for choosing to invest with Wells Fargo Funds. We appreciate your confidence in us and remain committed to helping you meet your financial needs.
Sincerely,
Andrew Owen
President
Wells Fargo Funds
“Global stocks rallied in November, propelled by optimism over three promising COVID-19 vaccines.”
“February saw major domestic equity indexes driven higher on the hope of a new stimulus bill, improving COVID-19 vaccination numbers, and the gradual reopening of the economy.”
For further information about your Fund, contact your investment professional, visit our website at wfam.com, or call us directly at 1-800-222-8222.
Wells Fargo Short-Term Bond Plus Fund | 3
Letter to shareholders (unaudited)
Preparing for LIBOR Transition
The global financial industry is preparing to transition away from the London Interbank Offered Rate (LIBOR), a key benchmark interest rate, to new alternative rates. LIBOR underpins more than $350 trillion of financial contracts. It is the benchmark rate for a wide spectrum of products ranging from residential mortgages to corporate bonds to derivatives. Regulators have called for a market-wide transition away from LIBOR to successor reference rates by the end of 2021 (extended through June 30, 2023 for most tenors of the U.S. dollar LIBOR), which requires proactive steps be taken by issuers, counterparties, and asset managers to identify impacted products and adopt new reference rates.
The Fund holds at least one security that uses LIBOR as a floating reference rate and has a maturity date after 12-31-2021.
Although the transition process away from LIBOR has become increasingly well-defined in advance of the anticipated discontinuation date, there remains uncertainty regarding the nature of successor reference rates, and any potential effects of the transition away from LIBOR on investment instruments that use it as a benchmark rate. The transition process may result in, among other things, increased volatility or illiquidity in markets for instruments that currently rely on LIBOR and could negatively impact the value of certain instruments held by the Fund.
Wells Fargo Asset Management is monitoring LIBOR exposure closely and has put resources and controls in place to manage this transition effectively. The Fund’s portfolio management team is evaluating LIBOR holdings to understand what happens to those securities when LIBOR ceases to exist, including examining security documentation to identify the presence or absence of fallback language identifying a replacement rate to LIBOR.
While the pace of transition away from LIBOR will differ by asset class and investment strategy, the portfolio management team will monitor market conditions for those holdings to identify and mitigate deterioration or volatility in pricing and liquidity and ensure appropriate actions are taken in a timely manner.
Further information regarding the potential risks associated with the discontinuation of LIBOR can be found in the Fund’s Statement of Additional Information.
4 | Wells Fargo Short-Term Bond Plus Fund
This page is intentionally left blank.
Performance highlights (unaudited)
| Investment objective | The Fund seeks current income consistent with capital preservation. |
| Manager | Wells Fargo Funds Management, LLC |
| Subadviser | Wells Capital Management Incorporated |
| Portfolio managers | Christopher Y. Kauffman, CFA®‡, Jay N. Mueller, CFA®‡, Janet S. Rilling, CFA®‡, CPA, Michael J. Schueller, CFA®‡, Noah M. Wise, CFA®‡ |
| Average annual total returns (%) as of February 28, 2021 |
| | | Including sales charge | | Excluding sales charge | | Expense ratios1 (%) |
| | Inception date | 1 year | 5 year | 10 year | | 1 year | 5 year | 10 year | | Gross | Net 2 |
| Class A (SSTVX) | 8-31-1999 | 2.58 | 2.42 | 1.89 | | 4.67 | 2.84 | 2.10 | | 0.85 | 0.75 |
| Class C (WFSHX) | 3-31-2008 | 2.79 | 2.05 | 1.33 | | 3.79 | 2.05 | 1.33 | | 1.60 | 1.50 |
| Class R6 (SSTYX)3 | 7-31-2018 | – | – | – | | 4.98 | 3.08 | 2.38 | | 0.47 | 0.43 |
| Institutional Class (SSHIX) | 8-31-1999 | – | – | – | | 4.92 | 3.08 | 2.38 | | 0.52 | 0.48 |
| Bloomberg Barclays U.S. 1-3 Year Government/Credit Bond Index4 | – | – | – | – | | 1.94 | 2.09 | 1.58 | | – | – |
Figures quoted represent past performance, which is no guarantee of future results, and do not reflect taxes that a shareholder may pay on an investment in a fund. Investment return and principal value of an investment will fluctuate so that an investor’s shares, when redeemed, may be worth more or less than their original cost. Performance shown without sales charges would be lower if sales charges were reflected. Current performance may be lower or higher than the performance data quoted, which assumes the reinvestment of dividends and capital gains. Current month-end performance is available on the Fund’s website, wfam.com.
Index returns do not include transaction costs associated with buying and selling securities, any mutual fund fees or expenses, or any taxes. It is not possible to invest directly in an index.
For Class A shares, the maximum front-end sales charge is 2.00%. For Class C shares, the maximum contingent deferred sales charge is 1.00%. Performance including a contingent deferred sales charge assumes the sales charge for the corresponding time period. Class R6 and Institutional Class shares are sold without a front-end sales charge or contingent deferred sales charge.
| 1 | Reflects the expense ratios as stated in the most recent prospectuses, which include the impact of 0.03% in acquired fund fees and expenses. The expense ratios shown are subject to change and may differ from the annualized expense ratios shown in the financial highlights of this report, which do not include acquired fund fees and expenses. |
| 2 | The manager has contractually committed through December 31, 2021, to waive fees and/or reimburse expenses to the extent necessary to cap total annual fund operating expenses after fee waivers at 0.72% for Class A, 1.47% for Class C, 0.40% for Class R6 and 0.45% for Institutional Class. Brokerage commissions, stamp duty fees, interest, taxes, acquired fund fees and expenses (if any), and extraordinary expenses are excluded from the expense caps. Prior to or after the commitment expiration date, the caps may be increased or the commitment to maintain the caps may be terminated only with the approval of the Board of Trustees. Without these caps, the Fund’s returns would have been lower. The expense ratio paid by an investor is the net expense ratio (the total annual fund operating expenses after fee waivers) as stated in the prospectuses. |
| 3 | Historical performance shown for the Class R6 shares prior to their inception reflects the performance of the Institutional Class shares, and includes the higher expenses applicable to Institutional Class shares. If these expenses had not been included, returns for Class R6 shares would be higher. |
| 4 | The Bloomberg Barclays U.S. 1-3 Year Government/Credit Bond Index is the one- to three-year component of the Bloomberg Barclays U.S. Government/Credit Bond Index that includes securities in the Government and Credit Indexes. The Government Index includes Treasuries (that is, public obligations of the U.S. Treasury that have remaining maturities of more than one year) and agencies (that is, publicly issued debt of U.S. government agencies, quasi-federal corporations, and corporate or foreign debt guaranteed by the U.S. government). The Credit Index includes publicly issued U.S. corporate and foreign debentures and secured notes that meet specified maturity, liquidity, and quality requirements. You cannot invest directly in an index. |
| ‡ | CFA® and Chartered Financial Analyst® are trademarks owned by CFA Institute. |
6 | Wells Fargo Short-Term Bond Plus Fund
Performance highlights (unaudited)
Bond values fluctuate in response to the financial condition of individual issuers, general market and economic conditions, and changes in interest rates. Changes in market conditions and government policies may lead to periods of heightened volatility in the bond market and reduced liquidity for certain bonds held by the Fund. In general, when interest rates rise, bond values fall and investors may lose principal value. Interest rate changes and their impact on the Fund and its share price can be sudden and unpredictable. Loans are subject to risks similar to those associated with other below-investment-grade bond investments, such as credit risk (for example, risk of issuer default), below investment- grade bond risk (for example, risk of greater volatility in value), and risk that the loan may become illiquid or difficult to price. The use of derivatives may reduce returns and/or increase volatility. Certain investment strategies tend to increase the total risk of an investment (relative to the broader market). Foreign investments are especially volatile and can rise or fall dramatically due to differences in the political and economic conditions of the host country. These risks are generally intensified in emerging markets. The Fund is exposed to high-yield securities risk and mortgage- and asset-backed securities risk. Consult the Fund’s prospectus for additional information on these and other risks.
Wells Fargo Short-Term Bond Plus Fund | 7
Performance highlights (unaudited)
| Ten largest holdings (%) as of February 28, 20211 |
| U.S. Treasury Note, 0.25%, 4-15-2023 | 3.46 |
| Invesco BulletShares 2022 High Yield Corporate Bond ETF | 1.89 |
| FNMA, 2.00%, 1-25-2036 | 1.35 |
| iShares 0-5 Year High Yield Corporate Bond ETF | 1.16 |
| Chase Auto Credit Linked Note Series 2020-1 Class B , 0.99%, 1-25-2028 | 1.01 |
| Drive Auto Receivables Trust Series 2018-4 Class D, 4.09%, 1-15-2026 | 0.84 |
| Invesco BulletShares 2023 High Yield Corporate Bond ETF | 0.83 |
| National Securities Clearing Corporation, 1.50%, 4-23-2025 | 0.78 |
| Santander Drive Auto Receivables Trust Series 2021-1 Class C, 0.75%, 2-17-2026 | 0.71 |
| Valero Energy Corporation, 2.85%, 4-15-2025 | 0.64 |
| 1 | Figures represent the percentage of the Fund's net assets. Holdings are subject to change and may have changed since the date specified. |
| Portfolio composition as of February 28, 20211 |
| 1 | Figures represent the percentage of the Fund's long-term investments. These amounts are subject to change and may have changed since the date specified. |
8 | Wells Fargo Short-Term Bond Plus Fund
Fund expenses (unaudited)
As a shareholder of the Fund, you incur two types of costs: (1) transaction costs, including sales charges (loads) on purchase payments and contingent deferred sales charges (if any) on redemptions and (2) ongoing costs, including management fees, distribution (12b-1) and/or shareholder servicing fees, and other Fund expenses. This example is intended to help you understand your ongoing costs (in dollars) of investing in the Fund and to compare these costs with the ongoing costs of investing in other mutual funds.
The example is based on an investment of $1,000 invested at the beginning of the six-month period and held for the entire period from September 1, 2020 to February 28, 2021.
Actual expenses
The “Actual” line of the table below provides information about actual account values and actual expenses. You may use the information in this line, together with the amount you invested, to estimate the expenses that you paid over the period. Simply divide your account value by $1,000 (for example, an $8,600 account value divided by $1,000 = 8.6), then multiply the result by the number in the “Actual” line under the heading entitled “Expenses paid during period” for your applicable class of shares to estimate the expenses you paid on your account during this period.
Hypothetical example for comparison purposes
The “Hypothetical” line of the table below provides information about hypothetical account values and hypothetical expenses based on the Fund’s actual expense ratio and an assumed rate of return of 5% per year before expenses, which is not the Fund’s actual return. The hypothetical account values and expenses may not be used to estimate the actual ending account balance or expenses you paid for the period. You may use this information to compare the ongoing costs of investing in the Fund and other funds. To do so, compare this 5% hypothetical example with the 5% hypothetical examples that appear in the shareholder reports of the other funds.
Please note that the expenses shown in the table are meant to highlight your ongoing costs only and do not reflect any transactional costs, such as sales charges (loads) and contingent deferred sales charges. Therefore, the “Hypothetical” line of the table is useful in comparing ongoing costs only and will not help you determine the relative total costs of owning different funds. In addition, if these transactional costs were included, your costs would have been higher.
| | Beginning
account value
9-1-2020 | Ending
account value
2-28-2021 | Expenses
paid during
the period1 | Annualized net
expense ratio |
| Class A | | | | |
| Actual | $1,000.00 | $1,015.20 | $3.50 | 0.70% |
| Hypothetical (5% return before expenses) | $1,000.00 | $1,021.32 | $3.51 | 0.70% |
| Class C | | | | |
| Actual | $1,000.00 | $1,011.23 | $7.33 | 1.47% |
| Hypothetical (5% return before expenses) | $1,000.00 | $1,017.50 | $7.35 | 1.47% |
| Class R6 | | | | |
| Actual | $1,000.00 | $1,016.71 | $2.00 | 0.40% |
| Hypothetical (5% return before expenses) | $1,000.00 | $1,022.81 | $2.01 | 0.40% |
| Institutional Class | | | | |
| Actual | $1,000.00 | $1,016.45 | $2.25 | 0.45% |
| Hypothetical (5% return before expenses) | $1,000.00 | $1,022.56 | $2.26 | 0.45% |
1 Expenses paid is equal to the annualized net expense ratio of each class multiplied by the average account value over the period, multiplied by the number of days in the most recent fiscal half-year divided by the number of days in the fiscal year (to reflect the one-half-year period).
Wells Fargo Short-Term Bond Plus Fund | 9
Portfolio of investments—February 28, 2021 (unaudited)
| | | Interest
rate | Maturity
date | Principal | Value |
| Agency securities: 3.11% | | | | | | |
| FHLMC (12 Month LIBOR +1.91%) ± | | 2.41% | 9-1-2031 | $ | 2,104 | $ 2,103 |
| FHLMC (1 Year Treasury Constant Maturity +2.24%) ± | | 2.53 | 4-1-2038 | | 124,395 | 130,921 |
| FHLMC (1 Year Treasury Constant Maturity +2.40%) ± | | 2.90 | 7-1-2029 | | 504 | 504 |
| FHLMC (3 Year Treasury Constant Maturity +2.21%) ± | | 3.43 | 5-1-2026 | | 15,389 | 15,615 |
| FHLMC | | 3.50 | 10-15-2025 | | 219,154 | 230,217 |
| FHLMC (1 Year Treasury Constant Maturity +2.25%) ± | | 3.75 | 4-1-2032 | | 20,694 | 20,918 |
| FHLMC | | 4.00 | 5-1-2025 | | 379,515 | 404,025 |
| FHLMC | | 6.00 | 10-1-2021 | | 7,657 | 7,716 |
| FHLMC | | 9.50 | 12-1-2022 | | 61 | 61 |
| FHLMC Series 2597 Class AE | | 5.50 | 4-15-2033 | | 23,246 | 25,276 |
| FHLMC Series 2642 Class AR | | 4.50 | 7-15-2023 | | 76,879 | 79,257 |
| FHLMC Series 3609 Class LA | | 4.00 | 12-15-2024 | | 41 | 42 |
| FHLMC Series QO04 Class AFL (12 Month Treasury Average +0.74%) ± | | 1.12 | 5-25-2044 | | 502,516 | 502,116 |
| FHLMC Series T-42 Class A6 | | 9.50 | 2-25-2042 | | 257,823 | 326,183 |
| FHLMC Series T-57 Class 2A1 ±± | | 3.81 | 7-25-2043 | | 59,775 | 63,956 |
| FHLMC Series T-59 Class 2A1 ±± | | 3.58 | 10-25-2043 | | 683,687 | 838,628 |
| FHMLC Series 4358 Class DA | | 3.00 | 6-15-2040 | | 743,470 | 749,214 |
| FNMA (1 Year Treasury Constant Maturity +1.27%) ± | | 1.75 | 8-1-2034 | | 124,375 | 124,653 |
| FNMA %% | | 2.00 | 1-25-2036 | | 6,400,000 | 6,622,045 |
| FNMA (1 Year Treasury Constant Maturity +2.20%) ± | | 2.32 | 11-1-2031 | | 33,022 | 33,215 |
| FNMA (12 Month LIBOR +1.77%) ± | | 2.56 | 7-1-2044 | | 399,002 | 422,172 |
| FNMA (1 Year Treasury Constant Maturity +2.26%) ± | | 2.75 | 8-1-2036 | | 659,042 | 701,438 |
| FNMA | | 4.00 | 6-25-2026 | | 245,223 | 266,793 |
| FNMA | | 4.00 | 8-25-2037 | | 162,428 | 168,884 |
| FNMA | | 5.50 | 3-1-2023 | | 101,638 | 104,630 |
| FNMA | | 6.00 | 4-1-2021 | | 15 | 15 |
| FNMA | | 6.00 | 3-1-2033 | | 179,571 | 201,819 |
| FNMA | | 6.50 | 8-1-2031 | | 140,712 | 167,437 |
| FNMA | | 8.00 | 9-1-2023 | | 188 | 189 |
| FNMA | | 9.00 | 11-1-2024 | | 16,250 | 17,714 |
| FNMA Grantor Trust Series 2002-T12 Class A4 | | 9.50 | 5-25-2042 | | 421,325 | 505,962 |
| FNMA Series 2002-T1 Class A4 | | 9.50 | 11-25-2031 | | 22,808 | 28,106 |
| FNMA Series 2003-41 Class PE | | 5.50 | 5-25-2023 | | 72,804 | 75,557 |
| FNMA Series 2003-W11 Class A1 ±± | | 3.17 | 6-25-2033 | | 4,240 | 4,310 |
| FNMA Series 2003-W6 Class 6A ±± | | 3.50 | 8-25-2042 | | 414,198 | 432,916 |
| FNMA Series 2003-W6 Class PT4 ±± | | 8.30 | 10-25-2042 | | 44,931 | 55,562 |
| FNMA Series 2005-84 Class MB | | 5.75 | 10-25-2035 | | 195,761 | 219,821 |
| FNMA Series 2006-W1 Class 2AF2 (1 Month LIBOR +0.19%) ± | | 0.32 | 2-25-2046 | | 858,893 | 845,502 |
| FNMA Series 2010-37 Class A1 | | 5.41 | 5-25-2035 | | 804,319 | 843,357 |
| GNMA | | 4.50 | 4-20-2035 | | 48,608 | 52,493 |
| GNMA | | 8.00 | 12-15-2023 | | 5,492 | 5,802 |
| GNMA | | 9.00 | 11-15-2024 | | 100 | 100 |
| Total Agency securities (Cost $14,858,377) | | | | | | 15,297,244 |
| Asset-backed securities: 9.92% | | | | | | |
| BlueMountain CLO Limited Series 2012-2A Class AR2 (3 Month LIBOR+1.05%) 144A± | | 1.23 | 11-20-2028 | | 1,356,940 | 1,357,501 |
| Chase Auto Credit Linked Note Series 2020-1 Class B 144A | | 0.99 | 1-25-2028 | | 4,966,638 | 4,982,417 |
| Chesapeake Funding II LLC Series 2017-3A Class A1 144A | | 1.91 | 8-15-2029 | | 122,036 | 122,174 |
The accompanying notes are an integral part of these financial statements.
10 | Wells Fargo Short-Term Bond Plus Fund
Portfolio of investments—February 28, 2021 (unaudited)
| | | Interest
rate | Maturity
date | Principal | Value |
| Asset-backed securities (continued) | | | | | | |
| CommonBond Student Loan Trust Series 2018-B-GS Class A1 144A | | 3.56% | 9-25-2045 | $ | 1,630,009 | $ 1,692,338 |
| Drive Auto Receivables Trust Series 2018-3 Class C | | 3.72 | 9-16-2024 | | 103,925 | 104,221 |
| Drive Auto Receivables Trust Series 2018-4 Class D | | 4.09 | 1-15-2026 | | 4,000,000 | 4,141,408 |
| Educational Services of America Incorporated Series 2015-2 Class A (1 Month LIBOR+1.00%) 144A± | | 1.13 | 12-25-2056 | | 629,157 | 635,662 |
| Finance of America HECM Buyout 2020 Series HB2 Class A7 144A±± | | 1.71 | 7-25-2030 | | 2,134,476 | 2,148,763 |
| GM Financial Securitized Term Trust Series 2018-4 Class C | | 3.62 | 6-17-2024 | | 300,000 | 314,467 |
| Hertz Vehicle Financing LLC Series 2015-3A Class B 144A | | 3.71 | 9-25-2021 | | 2,250,000 | 2,255,733 |
| Hertz Vehicle Financing LLC Series 2016-2A Class A 144A | | 2.95 | 3-25-2022 | | 235,857 | 237,104 |
| Hertz Vehicle Financing LLC Series 2017-2A Class A 144A | | 3.29 | 10-25-2023 | | 182,316 | 183,296 |
| Hertz Vehicle Financing LLC Series 2018-1A Class A 144A | | 3.29 | 2-25-2024 | | 197,470 | 198,520 |
| Hertz Vehicle Financing LLC Series 2018-1A Class B 144A | | 3.60 | 2-25-2024 | | 2,690,000 | 2,700,414 |
| Hertz Vehicle Financing LLC Series 2019-1A Class A 144A | | 3.71 | 3-25-2023 | | 417,231 | 418,909 |
| Hertz Vehicle Financing LLC Series 2019-1A Class B 144A | | 4.10 | 3-25-2023 | | 1,500,000 | 1,503,013 |
| MMAF Equipment Finance LLC Series 2019-A Class A2 144A | | 2.84 | 1-10-2022 | | 142,485 | 142,691 |
| Octane Receivables Trust Series 2020-1A Class A 144A | | 1.71 | 2-20-2025 | | 2,314,518 | 2,336,694 |
| Ocwen Master Advance Receivable Trust Series 2020-T1 Class AT1 144A | | 1.28 | 8-15-2052 | | 2,930,000 | 2,950,709 |
| Santander Drive Auto Receivables Trust Series 2017-1 Class D | | 3.17 | 4-17-2023 | | 1,242,996 | 1,251,128 |
| Santander Drive Auto Receivables Trust Series 2021-1 Class C | | 0.75 | 2-17-2026 | | 3,500,000 | 3,499,588 |
| SLC Student Loan Trust Series 2006-2 Class A5 (3 Month LIBOR+0.10%) ± | | 0.32 | 9-15-2026 | | 169,191 | 169,184 |
| SLM Student Loan Trust Series 2011-2 Class A1 (1 Month LIBOR+0.60%) ± | | 0.73 | 11-25-2027 | | 79,900 | 79,934 |
| SLM Student Loan Trust Series 2012-3 Class A (1 Month LIBOR+0.65%) ± | | 0.77 | 12-27-2038 | | 1,579,610 | 1,570,793 |
| SLM Student Loan Trust Series 2013-1 Class A3 (1 Month LIBOR+0.55%) ± | | 0.68 | 5-26-2055 | | 797,043 | 787,842 |
| SLM Student Loan Trust Series 2014-A Class B 144A | | 3.50 | 11-15-2044 | | 2,500,000 | 2,522,938 |
| SoFi Professional Loan Program LLC Series 2016- A Class A1 (1 Month LIBOR+1.75%) 144A± | | 1.88 | 8-25-2036 | | 1,114,146 | 1,127,707 |
| SpringCastle America Funding LLC 144A | | 1.97 | 9-25-2037 | | 1,827,693 | 1,847,787 |
| Student Loan Consolidation Center Series 2011-1 Class A (1 Month LIBOR+1.22%) 144A± | | 1.34 | 10-25-2027 | | 602,480 | 606,113 |
| Tesla Auto Lease Trust Series 2018-B Class A 144A | | 3.71 | 8-20-2021 | | 197,675 | 198,744 |
| Towd Point Asset Funding LLC Series 2019-HE1 Class A1 (1 Month LIBOR+0.90%) 144A± | | 1.02 | 4-25-2048 | | 721,323 | 723,950 |
| Towd Point Asset Trust Series 2018-SL1 Class A (1 Month LIBOR+0.60%) 144A± | | 0.72 | 1-25-2046 | | 1,283,117 | 1,274,771 |
| Volvo Financial Equipment LLC Series 2018-AA Class A (1 Month LIBOR+0.52%) 144A± | | 0.63 | 7-17-2023 | | 2,240,000 | 2,243,247 |
The accompanying notes are an integral part of these financial statements.
Wells Fargo Short-Term Bond Plus Fund | 11
Portfolio of investments—February 28, 2021 (unaudited)
| | | Interest
rate | Maturity
date | Principal | Value |
| Asset-backed securities (continued) | | | | | | |
| Westlake Automobile Receivables Trust Series 2019-2A Class A2A 144A | | 2.57% | 2-15-2023 | $ | 686,371 | $ 688,774 |
| Wheels SPV LLC Series 2018-1A Class A2 144A | | 3.06 | 4-20-2027 | | 39,469 | 39,573 |
| World Omni Automobile Lease Southeast Series 2019-A Class A4 | | 3.01 | 7-15-2024 | | 1,710,000 | 1,738,320 |
| Total Asset-backed securities (Cost $48,619,369) | | | | | | 48,796,427 |
| Corporate bonds and notes: 27.49% | | | | | | |
| Communication services: 1.42% | | | | | | |
| Diversified telecommunication services: 0.57% | | | | | | |
| CyrusOne LP | | 2.90 | 11-15-2024 | | 630,000 | 667,636 |
| T-Mobile USA Incorporated 144A | | 3.50 | 4-15-2025 | | 2,000,000 | 2,162,460 |
| | | | | | | 2,830,096 |
| Media: 0.78% | | | | | | |
| NBCUniversal Enterprise Incorporated 144A | | 5.25 | 12-31-2049 | | 1,655,000 | 1,671,550 |
| QVC Incorporated | | 4.85 | 4-1-2024 | | 2,000,000 | 2,145,000 |
| | | | | | | 3,816,550 |
| Wireless telecommunication services: 0.07% | | | | | | |
| Sprint Spectrum Company LLC 144A | | 3.36 | 3-20-2023 | | 330,000 | 332,475 |
| Consumer discretionary: 3.01% | | | | | | |
| Automobiles: 1.43% | | | | | | |
| Ford Motor Company | | 8.50 | 4-21-2023 | | 845,000 | 944,288 |
| Ford Motor Company | | 9.00 | 4-22-2025 | | 1,730,000 | 2,092,911 |
| General Motors Company | | 6.13 | 10-1-2025 | | 2,150,000 | 2,559,511 |
| Volkswagen Group America Company 144A | | 3.35 | 5-13-2025 | | 1,325,000 | 1,435,665 |
| | | | | | | 7,032,375 |
| Hotels, restaurants & leisure: 0.63% | | | | | | |
| Genting New York LLC 144A | | 3.30 | 2-15-2026 | | 1,080,000 | 1,083,107 |
| Las Vegas Sands Corporation | | 3.20 | 8-8-2024 | | 1,900,000 | 1,994,724 |
| | | | | | | 3,077,831 |
| Household durables: 0.46% | | | | | | |
| Lennar Corporation | | 4.75 | 11-15-2022 | | 251,000 | 263,550 |
| Lennar Corporation | | 5.88 | 11-15-2024 | | 1,770,000 | 2,022,225 |
| | | | | | | 2,285,775 |
| Textiles, apparel & luxury goods: 0.49% | | | | | | |
| Ralph Lauren Corporation | | 1.70 | 6-15-2022 | | 1,380,000 | 1,403,944 |
| Tapestry Incorporated | | 3.00 | 7-15-2022 | | 1,005,000 | 1,031,603 |
| | | | | | | 2,435,547 |
| Consumer staples: 1.63% | | | | | | |
| Food & staples retailing: 0.29% | | | | | | |
| 7 Eleven Incorporated 144A | | 0.80 | 2-10-2024 | | 1,445,000 | 1,446,218 |
| Food products: 0.44% | | | | | | |
| Land O'Lakes Incorporated 144A | | 6.00 | 11-15-2022 | | 2,000,000 | 2,135,514 |
The accompanying notes are an integral part of these financial statements.
12 | Wells Fargo Short-Term Bond Plus Fund
Portfolio of investments—February 28, 2021 (unaudited)
| | | Interest
rate | Maturity
date | Principal | Value |
| Tobacco: 0.90% | | | | | | |
| Altria Group Incorporated | | 1.70% | 6-15-2025 | $ | 1,515,000 | $ 1,925,294 |
| BAT Capital Corporation | | 2.79 | 9-6-2024 | | 2,350,000 | 2,499,810 |
| | | | | | | 4,425,104 |
| Energy: 2.84% | | | | | | |
| Oil, gas & consumable fuels: 2.84% | | | | | | |
| Energy Transfer Operating Company | | 3.60 | 2-1-2023 | | 1,188,000 | 1,247,181 |
| Energy Transfer Partners LP | | 5.20 | 2-1-2022 | | 2,060,000 | 2,119,064 |
| Marathon Petroleum Corporation | | 4.70 | 5-1-2025 | | 2,500,000 | 2,843,513 |
| Oneok Incorporated Company | | 5.85 | 1-15-2026 | | 1,885,000 | 2,231,467 |
| Plains All American Pipeline LP | | 3.85 | 10-15-2023 | | 2,205,000 | 2,346,552 |
| Valero Energy Corporation | | 2.85 | 4-15-2025 | | 3,000,000 | 3,165,704 |
| | | | | | | 13,953,481 |
| Financials: 11.14% | | | | | | |
| Banks: 3.82% | | | | | | |
| Bank of America Corporation (U.S. SOFR+0.74%) ± | | 0.81 | 10-24-2024 | | 3,000,000 | 3,022,734 |
| Bank of America Corporation (3 Month LIBOR+0.94%) ± | | 3.86 | 7-23-2024 | | 1,000,000 | 1,077,307 |
| Citigroup Incorporated (U.S. SOFR+0.69%) ± | | 0.78 | 10-30-2024 | | 2,000,000 | 2,010,290 |
| Credit Suisse NY | | 2.95 | 4-9-2025 | | 2,250,000 | 2,432,552 |
| Deutsche Bank (U.S. SOFR+2.16%) ± | | 2.22 | 9-18-2024 | | 1,500,000 | 1,543,593 |
| JPMorgan Chase & Company (U.S. SOFR+0.70%) ± | | 1.04 | 2-4-2027 | | 835,000 | 823,495 |
| JPMorgan Chase & Company (U.S. SOFR+1.46%) ± | | 1.51 | 6-1-2024 | | 3,000,000 | 3,070,750 |
| JPMorgan Chase & Company (3 Month LIBOR+0.70%) ± | | 3.21 | 4-1-2023 | | 1,080,000 | 1,113,444 |
| Santander Holdings USA Incorporated | | 3.40 | 1-18-2023 | | 2,500,000 | 2,618,271 |
| Synchrony Bank | | 3.65 | 5-24-2021 | | 1,075,000 | 1,080,034 |
| | | | | | | 18,792,470 |
| Capital markets: 1.83% | | | | | | |
| Ameriprise Financial Services Incorporated | | 3.00 | 4-2-2025 | | 2,000,000 | 2,145,319 |
| Goldman Sachs Group Incorporated (U.S. SOFR+0.54%) ± | | 0.63 | 11-17-2023 | | 1,500,000 | 1,504,627 |
| Goldman Sachs Group Incorporated (3 Month LIBOR+0.82%) ± | | 2.88 | 10-31-2022 | | 2,900,000 | 2,946,918 |
| Morgan Stanley (U.S. SOFR+1.99%) ± | | 2.19 | 4-28-2026 | | 2,305,000 | 2,400,197 |
| | | | | | | 8,997,061 |
| Consumer finance: 2.38% | | | | | | |
| BMW US Capital LLC 144A | | 3.90 | 4-9-2025 | | 1,000,000 | 1,107,475 |
| Daimler Finance North America LLC 144A | | 0.75 | 3-1-2024 | | 1,420,000 | 1,422,351 |
| General Motors Financial Company Incorporated | | 1.70 | 8-18-2023 | | 1,000,000 | 1,022,586 |
| Harley Davidson Financial Services Company 144A | | 3.35 | 6-8-2025 | | 1,395,000 | 1,477,539 |
| Hyundai Capital America Company 144A | | 1.30 | 1-8-2026 | | 1,115,000 | 1,103,154 |
| Hyundai Capital America Company 144A | | 2.38 | 2-10-2023 | | 1,695,000 | 1,748,073 |
| Nissan Motor Acceptance Corporation 144A | | 3.88 | 9-21-2023 | | 2,030,000 | 2,181,639 |
| Volkswagen Group of America Finance LLC 144A | | 2.70 | 9-26-2022 | | 1,600,000 | 1,654,840 |
| | | | | | | 11,717,657 |
| Diversified financial services: 1.62% | | | | | | |
| GTP Acquisition Partners Corporation 144A | | 3.48 | 6-15-2050 | | 1,900,000 | 2,035,663 |
The accompanying notes are an integral part of these financial statements.
Wells Fargo Short-Term Bond Plus Fund | 13
Portfolio of investments—February 28, 2021 (unaudited)
| | | Interest
rate | Maturity
date | Principal | Value |
| Diversified financial services (continued) | | | | | | |
| National Securities Clearing Corporation 144A | | 1.50% | 4-23-2025 | $ | 3,750,000 | $ 3,820,206 |
| WEA Finance LLC 144A | | 3.75 | 9-17-2024 | | 2,000,000 | 2,128,408 |
| | | | | | | 7,984,277 |
| Insurance: 1.02% | | | | | | |
| Athene Global Funding 144A | | 2.50 | 1-14-2025 | | 2,705,000 | 2,833,195 |
| OneBeacon US Holdings Incorporated | | 4.60 | 11-9-2022 | | 2,075,000 | 2,203,196 |
| | | | | | | 5,036,391 |
| Mortgage REITs: 0.47% | | | | | | |
| Starwood Property Trust Incorporated | | 5.00 | 12-15-2021 | | 1,500,000 | 1,522,500 |
| Starwood Property Trust Incorporated 144A | | 5.50 | 11-1-2023 | | 750,000 | 781,875 |
| | | | | | | 2,304,375 |
| Health care: 0.73% | | | | | | |
| Health care providers & services: 0.73% | | | | | | |
| Dignity Health | | 3.13 | 11-1-2022 | | 2,255,000 | 2,335,173 |
| Magellan Health Incorporated | | 4.90 | 9-22-2024 | | 1,155,000 | 1,264,725 |
| | | | | | | 3,599,898 |
| Industrials: 2.63% | | | | | | |
| Aerospace & defense: 0.66% | | | | | | |
| The Boeing Company | | 4.51 | 5-1-2023 | | 2,000,000 | 2,145,176 |
| The Boeing Company | | 4.88 | 5-1-2025 | | 1,000,000 | 1,118,002 |
| | | | | | | 3,263,178 |
| Airlines: 0.91% | | | | | | |
| Delta Air Lines incorporated 144A | | 4.50 | 10-20-2025 | | 2,455,000 | 2,622,074 |
| Delta Air Lines Incorporated | | 3.40 | 4-19-2021 | | 1,000,000 | 1,002,178 |
| United Airlines Pass-Through Trust Certificates Series 2020-1 Class B | | 4.88 | 7-15-2027 | | 810,000 | 838,350 |
| | | | | | | 4,462,602 |
| Machinery: 0.58% | | | | | | |
| CNH Industrial Capital LLC | | 1.95 | 7-2-2023 | | 2,750,000 | 2,836,462 |
| Trading companies & distributors: 0.48% | | | | | | |
| Aircastle Limited 144A | | 5.25 | 8-11-2025 | | 700,000 | 766,451 |
| Fortress Transportation & Infrastructure Investors LLC 144A | | 6.75 | 3-15-2022 | | 1,616,000 | 1,615,305 |
| | | | | | | 2,381,756 |
| Information technology: 0.53% | | | | | | |
| Semiconductors & semiconductor equipment: 0.53% | | | | | | |
| Microchip Technology Incorporated 144A | | 0.97 | 2-15-2024 | | 1,000,000 | 1,003,605 |
| Microchip Technology Incorporated 144A | | 2.67 | 9-1-2023 | | 1,525,000 | 1,596,165 |
| | | | | | | 2,599,770 |
| Real estate: 2.56% | | | | | | |
| Equity REITs: 2.56% | | | | | | |
| Omega Healthcare Investors Incorporated | | 4.95 | 4-1-2024 | | 2,210,000 | 2,424,377 |
The accompanying notes are an integral part of these financial statements.
14 | Wells Fargo Short-Term Bond Plus Fund
Portfolio of investments—February 28, 2021 (unaudited)
| | | Interest
rate | Maturity
date | Principal | Value |
| Equity REITs (continued) | | | | | | |
| Sabra Health Care LP / Sabra Capital Corporation | | 4.80% | 6-1-2024 | $ | 2,500,000 | $ 2,731,294 |
| SBA Tower Trust 144A | | 3.45 | 3-15-2048 | | 2,135,000 | 2,261,616 |
| Service Properties Trust | | 4.50 | 6-15-2023 | | 1,500,000 | 1,511,250 |
| Tanger Properties LP | | 3.88 | 12-1-2023 | | 1,485,000 | 1,559,088 |
| Vornado Realty Trust | | 3.50 | 1-15-2025 | | 2,000,000 | 2,123,647 |
| | | | | | | 12,611,272 |
| Utilities: 1.00% | | | | | | |
| Electric utilities: 0.38% | | | | | | |
| Florida Power and Light Company | | 2.85 | 4-1-2025 | | 800,000 | 858,946 |
| NRG Energy Incorporated 144A | | 2.00 | 12-2-2025 | | 1,000,000 | 1,008,377 |
| | | | | | | 1,867,323 |
| Gas utilities: 0.31% | | | | | | |
| CenterPoint Energy (3 Month LIBOR+0.50%) ± | | 0.68 | 3-2-2023 | | 770,000 | 770,000 |
| CenterPoint Energy | | 0.70 | 3-2-2023 | | 765,000 | 764,258 |
| | | | | | | 1,534,258 |
Independent power & renewable electricity producers:
0.31% | | | | | | |
| TerraForm Power Operating LLC 144A | | 4.25 | 1-31-2023 | | 1,500,000 | 1,530,000 |
| Total Corporate bonds and notes (Cost $130,413,651) | | | | | | 135,289,716 |
| | | | | Shares | |
| Exchange-traded funds: 3.88% | | | | | | |
| Invesco BulletShares 2022 High Yield Corporate Bond ETF | | | | | 402,000 | 9,318,360 |
| Invesco BulletShares 2023 High Yield Corporate Bond ETF | | | | | 161,500 | 4,069,800 |
| iShares 0-5 Year High Yield Corporate Bond ETF | | | | | 126,000 | 5,727,960 |
| Total Exchange-traded funds (Cost $18,842,101) | | | | | | 19,116,120 |
| | | | | Principal | |
| Foreign corporate bonds and notes: 0.37% | | | | | | |
| Financials: 0.24% | | | | | | |
| Banks: 0.24% | | | | | | |
| Permanent TSB Group (EUR Swap Annual (vs. 6 Month EURIBOR) 1 Year +2.55%) ± | | 2.13 | 9-26-2024 | EUR | 1,000,000 | 1,215,066 |
| Industrials: 0.13% | | | | | | |
| Electrical equipment: 0.13% | | | | | | |
| Gamma Bidco SpA 144A | | 6.25 | 7-15-2025 | EUR | 500,000 | 630,423 |
| Total Foreign corporate bonds and notes (Cost $1,764,258) | | | | | | 1,845,489 |
| Foreign government bonds: 1.22% | | | | | | |
| Brazil Government Bond ¤ | | 0.00 | 1-1-2024 | BRL | 17,000,000 | 2,504,612 |
| Hungary Government Bond | | 1.50 | 8-23-2023 | HUF | 350,000,000 | 1,174,689 |
| Malaysia Government Bond | | 3.88 | 3-14-2025 | MYR | 3,500,000 | 921,256 |
The accompanying notes are an integral part of these financial statements.
Wells Fargo Short-Term Bond Plus Fund | 15
Portfolio of investments—February 28, 2021 (unaudited)
| | | Interest
rate | Maturity
date | Principal | Value |
| Foreign government bonds (continued) | | | | | | |
| Malaysia Government Bond | | 3.96% | 9-15-2025 | MYR | 3,500,000 | $ 925,107 |
| Republic of Turkey Government Bond | | 4.75 | 1-26-2026 | TRY | 500,000 | 500,850 |
| Total Foreign government bonds (Cost $6,260,437) | | | | | | 6,026,514 |
| Loans: 1.99% | | | | | | |
| Communication services: 0.61% | | | | | | |
| Media: 0.61% | | | | | | |
| CSC Holdings LLC (1 Month LIBOR+2.25%) ± | | 2.39 | 7-17-2025 | $ | 1,989,664 | 1,977,050 |
| Nexstar Broadcasting Incorporated (1 Month LIBOR+2.25%) ±%% | | 2.40 | 1-17-2024 | | 1,000,000 | 998,750 |
| | | | | | | 2,975,800 |
| Financials: 0.20% | | | | | | |
| Diversified financial services: 0.20% | | | | | | |
| Russell Investments US Institutional Holdco Incorporated (5 Month LIBOR+3.00%) ± | | 4.00 | 5-30-2025 | | 1,000,000 | 1,001,880 |
| Health care: 0.19% | | | | | | |
| Pharmaceuticals: 0.19% | | | | | | |
| Valeant Pharmaceuticals International Incorporated (1 Month LIBOR+3.00%) ± | | 3.14 | 6-2-2025 | | 942,823 | 943,652 |
| Industrials: 0.20% | | | | | | |
| Aerospace & defense: 0.20% | | | | | | |
| TransDigm Incorporated (1 Month LIBOR+2.25%) ± | | 2.40 | 8-22-2024 | | 997,481 | 985,013 |
| Materials: 0.79% | | | | | | |
| Containers & packaging: 0.79% | | | | | | |
| Flex Acquisition Company Incorporated (3 Month LIBOR+3.00%) ± | | 3.23 | 12-29-2023 | | 1,976,770 | 1,974,615 |
| Plastipak Packaging Incorporated (1 Month LIBOR+2.50%) ± | | 2.65 | 10-14-2024 | | 1,894,733 | 1,893,843 |
| | | | | | | 3,868,458 |
| Total Loans (Cost $9,622,073) | | | | | | 9,774,803 |
| Municipal obligations: 1.32% | | | | | | |
| Georgia: 0.22% | | | | | | |
| Health revenue: 0.22% | | | | | | |
| Georgia Medical Center Hospital Authority Taxable Refunding Bond | | 4.88 | 8-1-2022 | | 1,000,000 | 1,064,460 |
| Illinois: 0.06% | | | | | | |
| Tax revenue: 0.06% | | | | | | |
| Chicago IL Retiree Health Series B | | 6.30 | 12-1-2021 | | 310,000 | 323,153 |
| Indiana: 0.25% | | | | | | |
| Education revenue: 0.25% | | | | | | |
| Indiana Secondary Market for Education Loans Incorporated (1 Month LIBOR +0.80%)± | | 0.92 | 2-25-2044 | | 1,235,007 | 1,238,502 |
The accompanying notes are an integral part of these financial statements.
16 | Wells Fargo Short-Term Bond Plus Fund
Portfolio of investments—February 28, 2021 (unaudited)
| | | Interest
rate | Maturity
date | Principal | Value |
| New Jersey: 0.42% | | | | | | |
| Miscellaneous revenue: 0.42% | | | | | | |
| New Jersey Transportation Trust Fund Authority System Series B | | 2.55% | 6-15-2023 | $ | 2,000,000 | $ 2,076,880 |
| New York: 0.17% | | | | | | |
| Transportation revenue: 0.17% | | | | | | |
| New York Metropolitan Transportation Authority BAN | | 4.00 | 2-1-2022 | | 795,000 | 817,968 |
| Pennsylvania: 0.20% | | | | | | |
| Miscellaneous revenue: 0.20% | | | | | | |
| Philadelphia PA IDA Pension Funding Series B (Ambac Insured)¤ | | 0.00 | 4-15-2021 | | 970,000 | 969,699 |
| Total Municipal obligations (Cost $6,304,195) | | | | | | 6,490,662 |
| Non-agency mortgage-backed securities: 23.53% | | | | | | |
| Angel Oak Mortgage Trust I LLC Series 2019-3 Class A1 144A±± | | 2.93 | 5-25-2059 | | 434,797 | 437,541 |
| Angel Oak Mortgage Trust I LLC Series 2020-4 Class A1 144A±± | | 1.47 | 6-25-2065 | | 1,528,945 | 1,543,857 |
| Angel Oak Mortgage Trust I LLC Series 2020-R1 Class A1 144A±± | | 0.99 | 4-25-2053 | | 2,374,168 | 2,383,695 |
| Bayview Opportunity Master Fund Trust Series 2017 Class RT5 144A±± | | 3.50 | 5-28-2069 | | 2,414,590 | 2,480,387 |
| Bojangles Issuer LLC Series 2020-1A Class A2 144A | | 3.83 | 10-20-2050 | | 2,225,000 | 2,309,150 |
| Bunker Hill Loan Depositary Trust Series 2019-3 Class A1 144A | | 2.72 | 11-25-2059 | | 1,243,212 | 1,272,723 |
| Cascade Funding Mortgage Trust Series 2018-RM2 Class A 144A±± | | 4.00 | 10-25-2068 | | 376,092 | 392,823 |
| Cascade Funding Mortgage Trust Series 2020-HB4 Class A 144A±± | | 0.95 | 12-26-2030 | | 1,504,672 | 1,504,978 |
| CCG Receivables Trust LLC Series 2018-1 Class A2 144A | | 2.50 | 6-16-2025 | | 18,235 | 18,253 |
| CD Commercial Mortgage Trust Series 2017-CD3 Class A1 | | 1.97 | 2-10-2050 | | 289,027 | 289,827 |
| CGDBB Commercial Mortgage Trust Series 2017-BIOC Class A (1 Month LIBOR+0.79%)144A± | | 0.90 | 7-15-2032 | | 2,603,599 | 2,606,064 |
| Citigroup Commercial Mortgage Trust Series 2016-P5 Class A2 | | 2.40 | 10-10-2049 | | 128,000 | 128,639 |
| Citigroup Commercial Mortgage Trust Series 2017-MDRB Class A (1 Month LIBOR+1.10%)144A± | | 1.21 | 7-15-2030 | | 805,175 | 799,391 |
| Citigroup Mortgage Loan Trust Series 2019-IMC1 Class A3 144A±± | | 3.03 | 7-25-2049 | | 1,593,830 | 1,622,031 |
| Colt Funding LLC Series 2020-1R Class A1 ±± | | 1.26 | 9-25-2065 | | 1,763,454 | 1,772,346 |
| Colt Funding LLC Series 2020-2 Class A1 144A±± | | 1.85 | 3-25-2065 | | 2,055,495 | 2,084,352 |
| Commercial Mortgage Trust Series 2012-CR1 Class ASB | | 3.05 | 5-15-2045 | | 624,605 | 631,734 |
| Commercial Mortgage Trust Series 2012-CR4 Class A | | 3.25 | 10-15-2045 | | 2,000,000 | 2,023,835 |
| Commercial Mortgage Trust Series 2014-CR14 Class B ±± | | 4.62 | 2-10-2047 | | 680,000 | 740,962 |
| Commercial Mortgage Trust Series 2014-LC17 Class A2 | | 3.16 | 10-10-2047 | | 6,200 | 6,198 |
| Commercial Mortgage Trust Series 2015-DC1 Class A3 | | 3.22 | 2-10-2048 | | 1,500,000 | 1,524,218 |
| ContiMortgage Home Equity Trust Series 1996-2 Class IO ♀±± | | 0.00 | 7-15-2027 | | 518,021 | 7,850 |
The accompanying notes are an integral part of these financial statements.
Wells Fargo Short-Term Bond Plus Fund | 17
Portfolio of investments—February 28, 2021 (unaudited)
| | | Interest
rate | Maturity
date | Principal | Value |
| Non-agency mortgage-backed securities (continued) | | | | | | |
| Countrywide Home Loans Mortgage Pass-Through Trust Series 2001-HYB1 Class 2A1 ±± | | 2.01% | 6-19-2031 | $ | 85,400 | $ 86,123 |
| Credit Suisse Mortgage Trust Series 2019-SKLZ Class A (1 Month LIBOR+1.25%)144A± | | 1.36 | 1-15-2034 | | 1,400,000 | 1,399,856 |
| Credit Suisse Mortgage Trust Series 2020-AFC1 Class A3 144A±± | | 2.51 | 2-25-2050 | | 1,975,203 | 2,006,428 |
| Credit Suisse Mortgage Trust Series 2021-AFC1 Class A2 144A±± | | 1.07 | 3-25-2056 | | 2,340,000 | 2,339,957 |
| Crown Point Limited Series 2018-6A Class A1 (3 Month LIBOR+1.17%)144A± | | 1.39 | 10-20-2028 | | 2,111,676 | 2,112,227 |
| CSAIL Commercial Mortgage Trust Series 2016-C5 Class A4 | | 3.49 | 11-15-2048 | | 1,734,694 | 1,854,513 |
| CSAIL Commercial Mortgage Trust Series 2019-C15 Class A1 | | 2.99 | 3-15-2052 | | 306,209 | 314,837 |
| DBWF Mortgage Trust Series 2018-GLKS Class A (1 Month LIBOR+1.03%)144A± | | 1.14 | 12-19-2030 | | 550,000 | 550,994 |
| Deephaven Residential Mortgage Series 2019-4A Class A1 144A±± | | 2.79 | 10-25-2059 | | 766,236 | 775,226 |
| Deutsche Bank UBS Securities Mortgage Trust Series 2011-LC2A Class A4 144A | | 4.54 | 7-10-2044 | | 233,622 | 234,745 |
| EquiFirst Mortgage Loan Trust Series 2003-2 Class 3A3 (1 Month LIBOR+1.13%)± | | 1.24 | 9-25-2033 | | 205,479 | 201,187 |
| Freedom Financial Trust Series 2021-1CP Class A 144A | | 0.66 | 3-20-2028 | | 3,000,000 | 2,997,755 |
| Freedom Financial Trust Series 2021-1CP Class B 144A | | 1.41 | 3-20-2028 | | 750,000 | 748,339 |
| FWD Securitization Trust Series 2020-INV1 Class A3 144A±± | | 2.44 | 1-25-2050 | | 2,194,859 | 2,208,645 |
| Galton Funding Mortgage Trust Series 2020-H1 Class A1 144A±± | | 2.31 | 1-25-2060 | | 1,168,382 | 1,191,674 |
| GCAT Series 2019-NQM1 Class A1 144A | | 2.99 | 2-25-2059 | | 1,540,409 | 1,547,129 |
| GCAT Series 2019-NQM2 Class A1 144A | | 2.86 | 9-25-2059 | | 1,377,635 | 1,400,074 |
| Golden National Mortgage Asset-Backed Certificates Series 1998-GN1 Class M2 | | 1.00 | 2-25-2027 | | 34,322 | 34,520 |
| Goldman Sachs Mortgage Securities Trust Series 2012-ALOH Class A 144A | | 3.55 | 4-10-2034 | | 2,414,000 | 2,459,208 |
| Goldman Sachs Mortgage Securities Trust Series 2013-G1 Class A2 144A±± | | 3.56 | 4-10-2031 | | 530,140 | 528,949 |
| Goldman Sachs Mortgage Securities Trust Series 2014-GC22 Class A3 | | 3.52 | 6-10-2047 | | 2,934,697 | 2,947,143 |
| Gracie Point International Series 2020-B Class A (1 Month LIBOR+1.40%)144A± | | 1.52 | 5-2-2023 | | 1,849,928 | 1,852,998 |
| GSMPS Mortgage Loan Trust Series 1998-1 Class A 144A±± | | 8.00 | 9-19-2027 | | 131,175 | 131,163 |
| Home Equity Asset Trust Series 2003-6 Class M1 (1 Month LIBOR+1.05%)± | | 1.63 | 2-25-2034 | | 675,497 | 673,952 |
| Homeward Opportunities Fund I Trust Series 2019-1 Class A1 144A±± | | 3.45 | 1-25-2059 | | 921,418 | 931,912 |
| Hospitality Mortgage Trust Series 2019 Class A (1 Month LIBOR+1.00%)144A± | | 1.11 | 11-15-2036 | | 1,757,235 | 1,757,235 |
| InTown Hotel Portfolio Trust Series 2018-STAY Class A (1 Month LIBOR+0.95%)144A± | | 1.06 | 1-15-2033 | | 550,000 | 550,660 |
| JPMorgan Chase Commercial Mortgage Securities Trust Series 2012-C8 Class A3 | | 2.83 | 10-15-2045 | | 2,272,322 | 2,333,152 |
| JPMorgan Chase Commercial Mortgage Securities Trust Series 2013-LC11 Class A4 | | 2.69 | 4-15-2046 | | 1,608,504 | 1,659,684 |
The accompanying notes are an integral part of these financial statements.
18 | Wells Fargo Short-Term Bond Plus Fund
Portfolio of investments—February 28, 2021 (unaudited)
| | | Interest
rate | Maturity
date | Principal | Value |
| Non-agency mortgage-backed securities (continued) | | | | | | |
| JPMorgan Chase Commercial Mortgage Securities Trust Series 2018-PHH Class A (1 Month LIBOR+0.91%)144A± | | 2.41% | 6-15-2035 | $ | 566,915 | $ 568,056 |
| JPMorgan Chase Commercial Mortgage Securities Trust Series 2019-MFP Class A (1 Month LIBOR+0.96%)144A± | | 1.07 | 7-15-2036 | | 2,500,000 | 2,498,492 |
| KKR Financial Holdings LLC (3 Month LIBOR+1.34%)144A± | | 1.58 | 4-15-2029 | | 2,250,000 | 2,250,000 |
| Lendmark Funding Trust Series 2018-1A Class A 144A | | 3.81 | 12-21-2026 | | 1,855,000 | 1,868,469 |
| Lendmark Funding Trust Series 2018-2A Class A 144A | | 4.23 | 4-20-2027 | | 160,000 | 163,678 |
| Lendmark Funding Trust Series 2019-2A Class A 144A | | 2.78 | 4-20-2028 | | 3,000,000 | 3,090,374 |
| LoanCore Limited Series 2018-CRE1 Class A (1 Month LIBOR+1.13%)144A± | | 1.24 | 5-15-2028 | | 961,639 | 961,939 |
| Marlette Funding Trust Series 2020-2A Class A 144A | | 1.02 | 9-16-2030 | | 1,100,466 | 1,102,432 |
| Master Mortgages Trust Series 2002-3 Class 4A1 ±± | | 3.81 | 10-25-2032 | | 968 | 983 |
| Mello Warehouse Securitization Trust Series 2019-1 Class A (1 Month LIBOR+0.80%)144A± | | 0.92 | 6-25-2052 | | 2,240,000 | 2,241,650 |
| Mello Warehouse Securitization Trust Series 2019-1 Class E (1 Month LIBOR+2.35%)144A± | | 2.48 | 6-25-2052 | | 1,000,000 | 1,000,358 |
| Mello Warehouse Securitization Trust Series 2020-2 Class A (1 Month LIBOR+0.80%)144A± | | 0.92 | 11-25-2053 | | 1,940,000 | 1,941,632 |
| Mello Warehouse Securitization Trust Series 2021-1 Class B (1 Month LIBOR+0.90%)144A± | | 1.01 | 2-25-2055 | | 1,460,000 | 1,460,146 |
| MF1 Limited Series 2020-FL3 Class A (1 Month LIBOR+2.05%)144A± | | 2.16 | 7-15-2035 | | 1,395,000 | 1,409,827 |
| Morgan Stanley Capital I Trust Series 2016-C30 Class A1 | | 1.39 | 9-15-2049 | | 222,717 | 222,868 |
| New Residential Mortgage Loan Series 2019-6A Class A1B 144A±± | | 3.50 | 9-25-2059 | | 1,248,155 | 1,318,030 |
| Oaktree CLO Limited Series 15-1A Class A1R (3 Month LIBOR+0.87%)144A± | | 1.09 | 10-20-2027 | | 972,466 | 972,722 |
| Octagon Investment Partners Series 2017-1A Class A2R (3 Month LIBOR+1.45%)144A± | | 1.56 | 3-17-2030 | | 2,190,000 | 2,190,158 |
| Palmer Square Loan Funding Limited Series 2018-4A Class A1 (3 Month LIBOR+0.90%)144A± | | 1.09 | 11-15-2026 | | 764,956 | 765,261 |
| PFS Financing Corporation Series 2021-A Class A 144A | | 0.71 | 4-15-2026 | | 1,870,000 | 1,866,089 |
| ReadyCap Commercial Mortgage Trust Series 2019-5 Class A 144A | | 3.78 | 2-25-2052 | | 874,135 | 900,017 |
| Regatta II Funding LP Series 2013-2A Class A1R2 (3 Month LIBOR+1.25%)144A± | | 1.49 | 1-15-2029 | | 2,925,000 | 2,925,690 |
| Residential Mortgage Loan Trust Series 2021-1R Class A2 144A♦±± | | 1.10 | 1-25-2065 | | 1,000,000 | 1,000,000 |
| Sound Point CLO Limited Series 2015-1RA Class BR (3 Month LIBOR+1.55%)144A± | | 1.73 | 4-15-2030 | | 2,660,000 | 2,660,833 |
| Starwood Mortgage Residential Trust Series 2019-1 Class A1 144A±± | | 2.94 | 6-25-2049 | | 926,755 | 940,576 |
| Starwood Mortgage Residential Trust Series 2020-1 Class A3 144A±± | | 2.56 | 2-25-2050 | | 1,452,077 | 1,473,849 |
| Station Place Securitization Trust Series 2021-WL1 Class A (1 Month LIBOR+0.65%)144A± | | 0.78 | 1-26-2054 | | 1,830,000 | 1,830,000 |
| TCW Collateralized Loan Obligation Limited Series 2017-1A Class BR (3 Month LIBOR+1.55%)144A± | | 1.76 | 7-29-2029 | | 2,255,000 | 2,255,805 |
| Towd Point Mortgage Trust Series 2015-4 Class A2 144A±± | | 3.75 | 4-25-2055 | | 1,245,000 | 1,267,477 |
The accompanying notes are an integral part of these financial statements.
Wells Fargo Short-Term Bond Plus Fund | 19
Portfolio of investments—February 28, 2021 (unaudited)
| | | Interest
rate | Maturity
date | Principal | Value |
| Non-agency mortgage-backed securities (continued) | | | | | | |
| Towd Point Mortgage Trust Series 2017-1 Class A1 144A±± | | 2.75% | 10-25-2056 | $ | 2,130,687 | $ 2,169,305 |
| Towd Point Mortgage Trust Series 2017-4 Class A1 144A±± | | 2.75 | 6-25-2057 | | 824,303 | 851,349 |
| Towd Point Mortgage Trust Series 2019- MH1 Class A1 144A±± | | 3.00 | 11-25-2058 | | 606,042 | 621,086 |
| Towd Point Mortgage Trust Series 2019-SJ3 Class A1 144A±± | | 3.00 | 11-25-2059 | | 1,244,915 | 1,256,347 |
| UBS Commercial Mortgage Trust Series 2018-NYCH Class A (1 Month LIBOR+0.85%)144A± | | 0.96 | 2-15-2032 | | 1,680,000 | 1,674,497 |
| Vendee Mortgage Trust Series 2011-1 Class DA | | 3.75 | 2-15-2035 | | 30,018 | 30,031 |
| Verus Securitization Trust Series 2019-1 Class A1 144A±± | | 3.40 | 12-25-2059 | | 990,248 | 1,003,015 |
| Verus Securitization Trust Series 2021-R1 Class A2 144A±± | | 1.06 | 10-25-2063 | | 493,054 | 493,561 |
| Wilshire Funding Corporation Series 1996-3 Class M2 ±± | | 7.17 | 8-25-2032 | | 69,435 | 73,032 |
| Wilshire Funding Corporation Series 1996-3 Class M3 ±± | | 7.17 | 8-25-2032 | | 57,669 | 56,384 |
| Wilshire Funding Corporation Series 1998-2 Class M1 (1 Week LIBOR+2.00%)± | | 2.10 | 12-28-2037 | | 6,838 | 7,011 |
| Total Non-agency mortgage-backed securities (Cost $114,852,506) | | | | | | 115,794,168 |
| U.S. Treasury securities: 3.91% | | | | | | |
| U.S. Treasury Note | | 0.25 | 4-15-2023 | | 17,000,000 | 17,033,203 |
| U.S. Treasury Note | | 0.38 | 12-31-2025 | | 90,000 | 88,629 |
| U.S. Treasury Note | | 0.38 | 1-31-2026 | | 2,150,000 | 2,115,063 |
| Total U.S. Treasury securities (Cost $19,197,813) | | | | | | 19,236,895 |
| Yankee corporate bonds and notes: 17.60% | | | | | | |
| Communication services: 0.50% | | | | | | |
| Interactive media & services: 0.50% | | | | | | |
| Tencent Holdings Limited 144A | | 3.28 | 4-11-2024 | | 2,310,000 | 2,472,528 |
| Consumer discretionary: 1.62% | | | | | | |
| Auto components: 0.52% | | | | | | |
| Toyota Industries Corporation 144A | | 3.11 | 3-12-2022 | | 2,460,000 | 2,523,279 |
| Automobiles: 0.56% | | | | | | |
| Conti Gummi Finance BV | | 1.13 | 9-25-2024 | | 2,000,000 | 2,491,397 |
| Stellantis NV | | 5.25 | 4-15-2023 | | 250,000 | 271,363 |
| | | | | | | 2,762,760 |
| Household durables: 0.54% | | | | | | |
| Panasonic Corporation 144A | | 2.54 | 7-19-2022 | | 2,600,000 | 2,660,781 |
| Energy: 1.47% | | | | | | |
| Oil, gas & consumable fuels: 1.47% | | | | | | |
| Aker BP ASA 144A | | 2.88 | 1-15-2026 | | 1,000,000 | 1,036,891 |
The accompanying notes are an integral part of these financial statements.
20 | Wells Fargo Short-Term Bond Plus Fund
Portfolio of investments—February 28, 2021 (unaudited)
| | | Interest
rate | Maturity
date | Principal | Value |
| Oil, gas & consumable fuels (continued) | | | | | | |
| BP Capital Markets plc (5 Year Treasury Constant Maturity+4.04%) ʊ± | | 4.38% | 6-22-2025 | $ | 3,000,000 | $ 3,162,810 |
| Schlumberger Finance BV | | 1.40 | 9-17-2025 | | 3,000,000 | 3,022,911 |
| | | | | | | 7,222,612 |
| Financials: 12.08% | | | | | | |
| Banks: 8.69% | | | | | | |
| ANZ New Zealand International Company 144A | | 1.90 | 2-13-2023 | | 2,200,000 | 2,266,396 |
| Banco Bradesco 144A | | 2.85 | 1-27-2023 | | 745,000 | 758,790 |
| Banco de Bogota SA 144A | | 5.38 | 2-19-2023 | | 1,500,000 | 1,601,640 |
| Banco Internacional del Peru SAA Interbank 144A | | 3.38 | 1-18-2023 | | 1,305,000 | 1,353,938 |
| Bank of New Zealand 144A%% | | 1.00 | 3-3-2026 | | 2,000,000 | 1,987,089 |
| Banque Federative du Credit Mutuel SA 144A | | 0.65 | 2-27-2024 | | 2,000,000 | 1,999,628 |
| Barclays Bank plc (1 Year Treasury Constant Maturity+0.80%) ± | | 1.01 | 12-10-2024 | | 1,155,000 | 1,160,913 |
| BNP Paribas (U.S. SOFR+1.00%) 144A± | | 1.32 | 1-13-2027 | | 1,545,000 | 1,530,331 |
| BPCE SA (U.S. SOFR+1.52%) 144A± | | 1.65 | 10-6-2026 | | 2,530,000 | 2,549,769 |
| Central American Bank 144A | | 1.14 | 2-9-2026 | | 2,500,000 | 2,485,750 |
| Corporacion Andina de Fomento | | 2.13 | 9-27-2021 | | 3,000,000 | 3,023,280 |
| Credicorp Limited 144A | | 2.75 | 6-17-2025 | | 3,000,000 | 3,102,750 |
| Danske Bank A/S 144A | | 5.00 | 1-12-2022 | | 1,405,000 | 1,458,148 |
| Global Bank Corporation 144A | | 4.50 | 10-20-2021 | | 470,000 | 476,486 |
| HSBC Holdings plc (U.S. SOFR+1.54%) ± | | 1.65 | 4-18-2026 | | 1,140,000 | 1,152,832 |
| Intesa Sanpaolo SpA 144A | | 3.25 | 9-23-2024 | | 2,000,000 | 2,137,497 |
| Mitsubishi UFJ Financial Group Incorporated | | 1.41 | 7-17-2025 | | 2,000,000 | 2,016,993 |
| Mizuho Financial Group (3 Month LIBOR+0.98%) ± | | 2.84 | 7-16-2025 | | 1,000,000 | 1,059,848 |
| NatWest Markets plc 144A | | 2.38 | 5-21-2023 | | 1,375,000 | 1,431,571 |
| Nordea Bank AB 144A | | 3.75 | 8-30-2023 | | 2,000,000 | 2,162,570 |
| Sumitomo Mitsui Financial Group (3 Month LIBOR+0.80%) ± | | 1.02 | 10-16-2023 | | 2,000,000 | 2,032,196 |
| Sumitomo Mitsui Financial Group | | 2.70 | 7-16-2024 | | 2,510,000 | 2,671,947 |
| UniCredit SpA 144A | | 6.57 | 1-14-2022 | | 2,220,000 | 2,324,990 |
| | | | | | | 42,745,352 |
| Capital markets: 0.93% | | | | | | |
| Enel Finance International NV 144A | | 4.25 | 9-14-2023 | | 2,500,000 | 2,723,840 |
| Macquarie Group Limited (U.S. SOFR+1.07%) 144A± | | 1.34 | 1-12-2027 | | 1,885,000 | 1,872,594 |
| | | | | | | 4,596,434 |
| Consumer finance: 0.57% | | | | | | |
| NTT Finance Corporation 144A%% | | 0.37 | 3-3-2023 | | 2,830,000 | 2,830,422 |
| Diversified financial services: 0.84% | | | | | | |
| Avolon Holdings Funding Limited 144A | | 5.50 | 1-15-2026 | | 965,000 | 1,067,946 |
| Banco Latino Americano SA 144A | | 2.38 | 9-14-2025 | | 2,000,000 | 2,046,000 |
| DAE Funding LLC 144A | | 2.63 | 3-20-2025 | | 1,000,000 | 1,012,700 |
| | | | | | | 4,126,646 |
| Insurance: 0.57% | | | | | | |
| Sompo International Holdings Limited | | 4.70 | 10-15-2022 | | 2,628,000 | 2,791,193 |
| Thrifts & mortgage finance: 0.48% | | | | | | |
| Nationwide Building Society 144A | | 1.00 | 8-28-2025 | | 2,360,000 | 2,345,911 |
The accompanying notes are an integral part of these financial statements.
Wells Fargo Short-Term Bond Plus Fund | 21
Portfolio of investments—February 28, 2021 (unaudited)
| | | Interest
rate | Maturity
date | Principal | Value |
| Health care: 0.07% | | | | | | |
| Pharmaceuticals: 0.07% | | | | | | |
| Perrigo Company plc | | 4.00% | 11-15-2023 | $ | 323,000 | $ 351,554 |
| Information technology: 0.46% | | | | | | |
| Communications equipment: 0.42% | | | | | | |
| Ericsson LM | | 4.13 | 5-15-2022 | | 2,000,000 | 2,070,750 |
| Semiconductors & semiconductor equipment: 0.04% | | | | | | |
| SK Hynix Incorporated 144A | | 1.50 | 1-19-2026 | | 200,000 | 199,014 |
| Materials: 0.96% | | | | | | |
| Chemicals: 0.96% | | | | | | |
| Orbia Advance Corporation SAB 144A | | 4.88 | 9-19-2022 | | 1,508,000 | 1,593,956 |
| Park Aerospace Holdings Company 144A | | 5.25 | 8-15-2022 | | 1,000,000 | 1,045,425 |
| Syngenta Finance NV 144A | | 4.44 | 4-24-2023 | | 2,000,000 | 2,093,671 |
| | | | | | | 4,733,052 |
| Real estate: 0.44% | | | | | | |
| Equity REITs: 0.44% | | | | | | |
| Scentre Group Trust 144A | | 3.63 | 1-28-2026 | | 2,000,000 | 2,174,025 |
| Total Yankee corporate bonds and notes (Cost $84,399,407) | | | | | | 86,606,313 |
| | | Yield | | | Shares | |
| Short-term investments: 8.08% | | | | | | |
| Investment companies: 8.08% | | | | | | |
| Securities Lending Cash Investments LLC ♠∩∞ | | 0.05 | | | 838,940 | 838,940 |
| Wells Fargo Government Money Market Fund Select Class ♠∞## | | 0.03 | | | 38,910,163 | 38,910,163 |
| Total Short-term investments (Cost $39,749,103) | | | | | | 39,749,103 |
| Total investments in securities (Cost $494,883,290) | 102.42% | | | | | 504,023,454 |
| Other assets and liabilities, net | (2.42) | | | | | (11,888,668) |
| Total net assets | 100.00% | | | | | $492,134,786 |
| ± | Variable rate investment. The rate shown is the rate in effect at period end. |
| ±± | The coupon of the security is adjusted based on the principal and interest payments received from the underlying pool of mortgages as well as the credit quality and the actual prepayment speed of the underlying mortgages. |
| 144A | The security may be resold in transactions exempt from registration, normally to qualified institutional buyers, pursuant to Rule 144A under the Securities Act of 1933. |
| ¤ | The security is issued in zero coupon form with no periodic interest payments. |
| ♀ | Investment in an interest-only security entitles holders to receive only the interest payments on the underlying mortgages. The principal amount shown is the notional amount of the underlying mortgages. The rate represents the coupon rate. |
| ♦ | The security is fair valued in accordance with procedures approved by the Board of Trustees. |
| ## | All or a portion of this security is segregated for when-issued securities. |
| ♠ | The issuer of the security is an affiliated person of the Fund as defined in the Investment Company Act of 1940. |
| ∩ | The investment is a non-registered investment company purchased with cash collateral received from securities on loan. |
| ∞ | The rate represents the 7-day annualized yield at period end. |
| %% | The security is purchased on a when-issued basis. |
| ʊ | Security is perpetual in nature and has no stated maturity date. The date shown reflects the next call date. |
The accompanying notes are an integral part of these financial statements.
22 | Wells Fargo Short-Term Bond Plus Fund
Portfolio of investments—February 28, 2021 (unaudited)
| Abbreviations: |
| Ambac | Ambac Financial Group Incorporated |
| BAN | Bond anticipation notes |
| BRL | Brazilian real |
| EUR | Euro |
| EURIBOR | Euro Interbank |
| FHLMC | Federal Home Loan Mortgage Corporation |
| FNMA | Federal National Mortgage Association |
| GNMA | Government National Mortgage Association |
| HUF | Hungarian forint |
| IDA | Industrial Development Authority |
| LIBOR | London Interbank Offered Rate |
| MYR | Malaysian ringgit |
| REIT | Real estate investment trust |
| SOFR | Secured Overnight Financing Rate |
| TRY | Turkish lira |
Investments in affiliates
An affiliated investment is an investment in which the Fund owns at least 5% of the outstanding voting shares of the issuer or as a result of other relationships, such as the Fund and the issuer having the same investment manager. Transactions with issuers that were either affiliated persons of the Fund at the beginning of the period or the end of the period were as follows:
| | Value,
beginning of
period | Purchases | Sales
proceeds | Net
realized
gains
(losses) | | Net
change in
unrealized
gains
(losses) | | Value,
end of
period | | % of
net
assets | Shares,
end
of period | Income
from
affiliated
securities |
| Short-term investments | | | | | | | | | | | | |
| Investment companies | | | | | | | | | | | | |
| Securities Lending Cash Investments LLC | $ 0 | $ 32,849,985 | $ (32,011,045) | $0 | | $0 | | $ 838,940 | | | 838,940 | $ 1,990# |
| Wells Fargo Government Money Market Fund Select Class | 19,447,173 | 136,118,824 | (116,655,834) | 0 | | 0 | | 38,910,163 | | | 38,910,163 | 3,292 |
| | | | | $0 | | $0 | | $39,749,103 | | 8.08% | | $5,282 |
| # | Amount shown represents income before fees and rebates. |
Futures contracts
| Description | Number of
contracts | Expiration
date | Notional
cost | Notional
value | Unrealized
gains | | Unrealized
losses |
| Long | | | | | | | |
| 2-Year U.S. Treasury Notes | 603 | 6-30-2021 | $133,235,697 | $133,121,673 | $ 0 | | $ (114,024) |
| Short | | | | | | | |
| Euro-BOBL Futures | (25) | 3-8-2021 | (4,072,971) | (4,048,279) | 24,692 | | 0 |
| 5-Year U.S. Treasury Notes | (442) | 6-30-2021 | (55,112,190) | (54,794,188) | 318,002 | | 0 |
| | | | | | $342,694 | | $(114,024) |
The accompanying notes are an integral part of these financial statements.
Wells Fargo Short-Term Bond Plus Fund | 23
Portfolio of investments—February 28, 2021 (unaudited)
Forward foreign currency contracts
Currency to be
received | Currency to be
delivered | Counterparty | Settlement
date | Unrealized
gains | | Unrealized
losses |
| 1,300,000 CAD | 840,090 EUR | Morgan Stanley | 3-31-2021 | $ 6,145 | | $ 0 |
| 1,300,000 AUD | 827,060 EUR | Morgan Stanley | 3-31-2021 | 3,989 | | 0 |
| 1,300,000 CAD | 840,090 EUR | Morgan Stanley | 3-31-2021 | 1,168 | | 0 |
| 1,300,000 AUD | 827,060 EUR | Morgan Stanley | 3-31-2021 | 0 | | (2,158) |
| 1,273,242 CAD | 1,000,000 USD | Morgan Stanley | 3-31-2021 | 588 | | 0 |
| 1,296,641 AUD | 1,000,000 USD | Morgan Stanley | 3-31-2021 | 0 | | (2,182) |
| 2,891,626 USD | 2,400,000 EUR | Morgan Stanley | 3-31-2021 | 0 | | (6,073) |
| 433,519,691 JPY | 4,193,314 USD | Morgan Stanley | 3-31-2021 | 0 | | (124,938) |
| 1,004,603 USD | 1,296,641 AUD | Morgan Stanley | 3-31-2021 | 6,785 | | 0 |
| 1,002,040 USD | 1,273,242 CAD | Morgan Stanley | 3-31-2021 | 1,452 | | 0 |
| 4,175,717 USD | 433,519,691 JPY | Morgan Stanley | 3-31-2021 | 107,342 | | 0 |
| 7,074,637 USD | 5,830,000 EUR | Morgan Stanley | 3-31-2021 | 35,642 | | 0 |
| 540,000 EUR | 662,761 USD | Morgan Stanley | 3-31-2021 | 0 | | (10,779) |
| | | | | $163,111 | | $(146,130) |
The accompanying notes are an integral part of these financial statements.
24 | Wells Fargo Short-Term Bond Plus Fund
Statement of assets and liabilities—February 28, 2021 (unaudited)
| | |
| Assets | |
Investments in unaffiliated securities (including $821,500 of securities loaned), at value (cost $455,134,187)
| $ 464,274,351 |
Investments in affiliated securites, at value (cost $39,749,103)
| 39,749,103 |
Cash
| 21,872 |
Receivable for Fund shares sold
| 4,608,849 |
Receivable for interest
| 2,245,809 |
Receivable for investments sold
| 2,155,042 |
Segregated cash for futures contracts
| 649,673 |
Unrealized gains on forward foreign currency contracts
| 163,111 |
Receivable for daily variation margin on open futures contracts
| 13,919 |
Principal paydown receivable
| 11,783 |
Receivable for securities lending income, net
| 1,292 |
Prepaid expenses and other assets
| 53,655 |
Total assets
| 513,948,459 |
| Liabilities | |
Payable for when-issued transactions
| 12,499,563 |
Payable for investments purchased
| 7,236,325 |
Payable for Fund shares redeemed
| 845,996 |
Payable upon receipt of securities loaned
| 838,940 |
Unrealized losses on forward foreign currency contracts
| 146,130 |
Management fee payable
| 110,043 |
Administration fees payable
| 39,347 |
Distribution fee payable
| 2,821 |
Trustees’ fees and expenses payable
| 2,288 |
Due to custodian bank, foreign currency, at value (cost $(115))
| 112 |
Accrued expenses and other liabilities
| 92,108 |
Total liabilities
| 21,813,673 |
Total net assets
| $492,134,786 |
| Net assets consist of | |
Paid-in capital
| $ 478,849,343 |
Total distributable earnings
| 13,285,443 |
Total net assets
| $492,134,786 |
| Computation of net asset value and offering price per share | |
Net assets – Class A
| $ 174,911,136 |
Shares outstanding – Class A1
| 19,333,252 |
Net asset value per share – Class A
| $9.05 |
Maximum offering price per share – Class A2
| $9.23 |
Net assets – Class C
| $ 4,829,228 |
Shares outstanding – Class C1
| 534,504 |
Net asset value per share – Class C
| $9.03 |
Net assets – Class R6
| $ 30,813,556 |
Shares outstanding – Class R61
| 3,407,144 |
Net asset value per share – Class R6
| $9.04 |
Net assets – Institutional Class
| $ 281,580,866 |
Shares outstanding – Institutional Class1
| 31,107,661 |
Net asset value per share – Institutional Class
| $9.05 |
| 1 | The Fund has an unlimited number of authorized shares |
| 2 | Maximum offering price is computed as 100/98 of net asset value. On investments of $50,000 or more, the offering price is reduced. |
The accompanying notes are an integral part of these financial statements.
Wells Fargo Short-Term Bond Plus Fund | 25
Statement of operations—six months ended February 28, 2021 (unaudited)
| | |
| Investment income | |
Interest
| $ 5,267,234 |
Dividends
| 379,792 |
Income from affiliated securities
| 13,590 |
Total investment income
| 5,660,616 |
| Expenses | |
Management fee
| 820,368 |
| Administration fees | |
Class A
| 137,548 |
Class C
| 4,125 |
Class R6
| 5,084 |
Institutional Class
| 103,119 |
| Shareholder servicing fees | |
Class A
| 214,918 |
Class C
| 6,445 |
| Distribution fee | |
Class C
| 19,334 |
Custody and accounting fees
| 14,359 |
Professional fees
| 26,136 |
Registration fees
| 31,741 |
Shareholder report expenses
| 28,261 |
Trustees’ fees and expenses
| 9,556 |
Other fees and expenses
| 7,379 |
Total expenses
| 1,428,373 |
| Less: Fee waivers and/or expense reimbursements | |
Fund-level
| (83,654) |
Class A
| (56,368) |
Class C
| (1,164) |
Net expenses
| 1,287,187 |
Net investment income
| 4,373,429 |
| Realized and unrealized gains (losses) on investments | |
| Net realized gains (losses) on | |
Unaffiliated securities
| 3,757,603 |
Forward foreign currency contracts
| (142,486) |
Futures contracts
| 446,641 |
Net realized gains on investments
| 4,061,758 |
| Net change in unrealized gains (losses) on | |
Unaffiliated securities
| (1,242,092) |
Forward foreign currency contracts
| 31,078 |
Futures contracts
| 273,231 |
Net change in unrealized gains (losses) on investments
| (937,783) |
Net realized and unrealized gains (losses) on investments
| 3,123,975 |
Net increase in net assets resulting from operations
| $ 7,497,404 |
The accompanying notes are an integral part of these financial statements.
26 | Wells Fargo Short-Term Bond Plus Fund
Statement of changes in net assets
| | |
| | Six months ended
February 28, 2021
(unaudited) | Year ended
August 31, 2020 |
| Operations | | | | |
Net investment income
| | $ 4,373,429 | | $ 9,967,779 |
Net realized gains on investments
| | 4,061,758 | | 6,969,763 |
Net change in unrealized gains (losses) on investments
| | (937,783) | | 4,701,877 |
Net increase in net assets resulting from operations
| | 7,497,404 | | 21,639,419 |
| Distributions to shareholders from | | | | |
| Net investment income and net realized gains | | | | |
Class A
| | (3,376,266) | | (3,342,219) |
Class C
| | (77,519) | | (77,827) |
Class R6
| | (708,883) | | (712,785) |
Institutional Class
| | (5,446,645) | | (5,649,805) |
Total distributions to shareholders
| | (9,609,313) | | (9,782,636) |
| Capital share transactions | Shares | | Shares | |
| Proceeds from shares sold | | | | |
Class A
| 1,993,261 | 18,095,757 | 3,043,211 | 27,155,906 |
Class C
| 90,105 | 817,125 | 316,697 | 2,810,473 |
Class R6
| 601,611 | 5,459,445 | 2,340,627 | 20,875,367 |
Institutional Class
| 8,801,316 | 79,937,576 | 18,043,261 | 160,187,200 |
| | | 104,309,903 | | 211,028,946 |
| Reinvestment of distributions | | | | |
Class A
| 353,988 | 3,204,551 | 355,241 | 3,151,367 |
Class C
| 8,577 | 77,519 | 8,099 | 71,752 |
Class R6
| 120 | 1,085 | 392 | 3,471 |
Institutional Class
| 443,845 | 4,021,442 | 458,701 | 4,071,268 |
| | | 7,304,597 | | 7,297,858 |
| Payment for shares redeemed | | | | |
Class A
| (1,830,840) | (16,619,519) | (3,856,219) | (34,055,224) |
Class C
| (200,378) | (1,818,355) | (498,113) | (4,403,080) |
Class R6
| (1,081,098) | (9,814,147) | (1,917,157) | (16,957,171) |
Institutional Class
| (5,798,525) | (52,644,344) | (16,460,491) | (145,833,125) |
| | | (80,896,365) | | (201,248,600) |
Net increase in net assets resulting from capital share transactions
| | 30,718,135 | | 17,078,204 |
Total increase in net assets
| | 28,606,226 | | 28,934,987 |
| Net assets | | | | |
Beginning of period
| | 463,528,560 | | 434,593,573 |
End of period
| | $492,134,786 | | $ 463,528,560 |
The accompanying notes are an integral part of these financial statements.
Wells Fargo Short-Term Bond Plus Fund | 27
Financial highlights
(For a share outstanding throughout each period)
| | | Year ended August 31 |
| Class A | Six months ended
February 28, 2021
(unaudited) | 2020 | 2019 | 2018 | 2017 | 2016 |
Net asset value, beginning of period
| $9.09 | $8.84 | $8.65 | $8.77 | $8.78 | $8.77 |
Net investment income
| 0.08 | 0.19 | 0.20 | 0.15 | 0.12 | 0.11 |
Net realized and unrealized gains (losses) on investments
| 0.05 | 0.24 | 0.19 | (0.12) | (0.01) | 0.04 |
Total from investment operations
| 0.13 | 0.43 | 0.39 | 0.03 | 0.11 | 0.15 |
| Distributions to shareholders from | | | | | | |
Net investment income
| (0.07) | (0.18) | (0.20) | (0.15) | (0.12) | (0.11) |
Net realized gains
| (0.10) | 0.00 | 0.00 | 0.00 | 0.00 | (0.03) |
Total distributions to shareholders
| (0.17) | (0.18) | (0.20) | (0.15) | (0.12) | (0.14) |
Net asset value, end of period
| $9.05 | $9.09 | $8.84 | $8.65 | $8.77 | $8.78 |
Total return1
| 1.52% | 4.96% | 4.60% | 0.31% | 1.25% | 1.77% |
| Ratios to average net assets (annualized) | | | | | | |
Gross expenses
| 0.81% | 0.82% | 0.82% | 0.82% | 0.81% | 0.81% |
Net expenses
| 0.70% | 0.71% | 0.72% | 0.72% | 0.72% | 0.72% |
Net investment income
| 1.72% | 2.10% | 2.33% | 1.68% | 1.35% | 1.29% |
| Supplemental data | | | | | | |
Portfolio turnover rate
| 38% | 88% | 43% | 43% | 50% | 59% |
Net assets, end of period (000s omitted)
| $174,911 | $170,975 | $170,345 | $182,179 | $225,797 | $278,802 |
| 1 | Total return calculations do not include any sales charges. Returns for periods of less than one year are not annualized. |
The accompanying notes are an integral part of these financial statements.
28 | Wells Fargo Short-Term Bond Plus Fund
Financial highlights
(For a share outstanding throughout each period)
| | | Year ended August 31 |
| Class C | Six months ended
February 28, 2021
(unaudited) | 2020 | 2019 | 2018 | 2017 | 2016 |
Net asset value, beginning of period
| $9.07 | $8.83 | $8.64 | $8.76 | $8.77 | $8.76 |
Net investment income
| 0.04 | 0.12 | 0.14 | 0.08 | 0.05 | 0.05 |
Net realized and unrealized gains (losses) on investments
| 0.06 | 0.24 | 0.19 | (0.12) | (0.01) | 0.04 |
Total from investment operations
| 0.10 | 0.36 | 0.33 | (0.04) | 0.04 | 0.09 |
| Distributions to shareholders from | | | | | | |
Net investment income
| (0.04) | (0.12) | (0.14) | (0.08) | (0.05) | (0.05) |
Net realized gains
| (0.10) | 0.00 | 0.00 | 0.00 | 0.00 | (0.03) |
Total distributions to shareholders
| (0.14) | (0.12) | (0.14) | (0.08) | (0.05) | (0.08) |
Net asset value, end of period
| $9.03 | $9.07 | $8.83 | $8.64 | $8.76 | $8.77 |
Total return1
| 1.12% | 4.10% | 3.82% | (0.44)% | 0.49% | 1.01% |
| Ratios to average net assets (annualized) | | | | | | |
Gross expenses
| 1.56% | 1.56% | 1.57% | 1.57% | 1.56% | 1.56% |
Net expenses
| 1.47% | 1.47% | 1.47% | 1.47% | 1.47% | 1.47% |
Net investment income
| 0.95% | 1.36% | 1.57% | 0.93% | 0.61% | 0.53% |
| Supplemental data | | | | | | |
Portfolio turnover rate
| 38% | 88% | 43% | 43% | 50% | 59% |
Net assets, end of period (000s omitted)
| $4,829 | $5,773 | $7,146 | $8,588 | $11,361 | $14,204 |
| 1 | Total return calculations do not include any sales charges. Returns for periods of less than one year are not annualized. |
The accompanying notes are an integral part of these financial statements.
Wells Fargo Short-Term Bond Plus Fund | 29
Financial highlights
(For a share outstanding throughout each period)
| | | Year ended August 31 |
| Class R6 | Six months ended
February 28, 2021
(unaudited) | 2020 | 2019 | 2018 1 |
Net asset value, beginning of period
| $9.08 | $8.83 | $8.66 | $8.64 |
Net investment income
| 0.09 | 0.21 | 0.23 | 0.02 2 |
Net realized and unrealized gains on investments
| 0.06 | 0.25 | 0.17 | 0.02 |
Total from investment operations
| 0.15 | 0.46 | 0.40 | 0.04 |
| Distributions to shareholders from | | | | |
Net investment income
| (0.09) | (0.21) | (0.23) | (0.02) |
Net realized gains
| (0.10) | 0.00 | 0.00 | 0.00 |
Total distributions to shareholders
| (0.19) | (0.21) | (0.23) | (0.02) |
Net asset value, end of period
| $9.04 | $9.08 | $8.83 | $8.66 |
Total return3
| 1.67% | 5.28% | 4.69% | 0.42% |
| Ratios to average net assets (annualized) | | | | |
Gross expenses
| 0.43% | 0.44% | 0.44% | 0.44% |
Net expenses
| 0.40% | 0.40% | 0.40% | 0.40% |
Net investment income
| 2.01% | 2.41% | 2.71% | 2.24% |
| Supplemental data | | | | |
Portfolio turnover rate
| 38% | 88% | 43% | 43% |
Net assets, end of period (000s omitted)
| $30,814 | $35,301 | $30,585 | $2,553 |
| 1 | For the period from July 31, 2018 (commencement of class operations) to August 31, 2018 |
| 2 | Calculated based upon average shares outstanding |
| 3 | Returns for periods of less than one year are not annualized. |
The accompanying notes are an integral part of these financial statements.
30 | Wells Fargo Short-Term Bond Plus Fund
Financial highlights
(For a share outstanding throughout each period)
| | | Year ended August 31 |
| Institutional Class | Six months ended
February 28, 2021
(unaudited) | 2020 | 2019 | 2018 | 2017 | 2016 |
Net asset value, beginning of period
| $9.09 | $8.84 | $8.65 | $8.78 | $8.79 | $8.77 |
Net investment income
| 0.09 | 0.21 | 0.23 | 0.17 | 0.14 | 0.13 |
Net realized and unrealized gains (losses) on investments
| 0.06 | 0.24 | 0.19 | (0.13) | (0.01) | 0.05 |
Total from investment operations
| 0.15 | 0.45 | 0.42 | 0.04 | 0.13 | 0.18 |
| Distributions to shareholders from | | | | | | |
Net investment income
| (0.09) | (0.20) | (0.23) | (0.17) | (0.14) | (0.13) |
Net realized gains
| (0.10) | 0.00 | 0.00 | 0.00 | 0.00 | (0.03) |
Total distributions to shareholders
| (0.19) | (0.20) | (0.23) | (0.17) | (0.14) | (0.16) |
Net asset value, end of period
| $9.05 | $9.09 | $8.84 | $8.65 | $8.78 | $8.79 |
Total return1
| 1.64% | 5.23% | 4.88% | 0.46% | 1.49% | 2.14% |
| Ratios to average net assets (annualized) | | | | | | |
Gross expenses
| 0.48% | 0.49% | 0.49% | 0.49% | 0.48% | 0.48% |
Net expenses
| 0.45% | 0.45% | 0.45% | 0.46% | 0.48% | 0.48% |
Net investment income
| 1.96% | 2.37% | 2.60% | 1.95% | 1.59% | 1.51% |
| Supplemental data | | | | | | |
Portfolio turnover rate
| 38% | 88% | 43% | 43% | 50% | 59% |
Net assets, end of period (000s omitted)
| $281,581 | $251,480 | $226,517 | $226,655 | $230,549 | $252,961 |
| 1 | Returns for periods of less than one year are not annualized. |
The accompanying notes are an integral part of these financial statements.
Wells Fargo Short-Term Bond Plus Fund | 31
Notes to financial statements (unaudited)
1. ORGANIZATION
Wells Fargo Funds Trust (the “Trust”), a Delaware statutory trust organized on March 10, 1999, is an open-end management investment company registered under the Investment Company Act of 1940, as amended (the “1940 Act”). As an investment company, the Trust follows the accounting and reporting guidance in Financial Accounting Standards Board (“FASB”) Accounting Standards Codification Topic 946, Financial Services – Investment Companies. These financial statements report on the Wells Fargo Short-Term Bond Plus Fund (the “Fund”) which is a diversified series of the Trust.
On February 23, 2021, Wells Fargo & Company announced that it has entered into a definitive agreement to sell Wells Fargo Asset Management (“WFAM”) to GTCR LLC and Reverence Capital Partners, L.P. WFAM is the trade name used by the asset management businesses of Wells Fargo & Company and includes Wells Fargo Funds Management, LLC, the investment manager to the Fund, Wells Capital Management Incorporated and Wells Fargo Asset Management (International) Limited, both registered investment advisers providing sub-advisory services to certain funds, and Wells Fargo Funds Distributor, LLC, the Fund's principal underwriter. As part of the transaction, Wells Fargo & Company will own a 9.9% equity interest and will continue to serve as an important client and distribution partner. The transaction is expected to close in the second half of 2021, subject to customary closing conditions.
Consummation of the transaction will result in the automatic termination of the Fund's investment management agreement and sub-advisory agreement. The Fund's Board of Trustees will be asked to approve new investment management arrangements with the new company. If approved by the Board, the new investment management arrangements with the new company will be presented to the shareholders of the Fund for approval, and, if approved by shareholders, would take effect upon the closing of the transaction. The transaction is expected to close in the second half of 2021, subject to customary closing conditions.
2. SIGNIFICANT ACCOUNTING POLICIES
The following significant accounting policies, which are consistently followed in the preparation of the financial statements of the Fund, are in conformity with U.S. generally accepted accounting principles which require management to make estimates and assumptions that affect the reported amounts of assets and liabilities, disclosure of contingent assets and liabilities at the date of the financial statements, and the reported amounts of income and expenses during the reporting period. Actual results could differ from those estimates.
Securities valuation
All investments are valued each business day as of the close of regular trading on the New York Stock Exchange (generally 4 p.m. Eastern Time), although the Fund may deviate from this calculation time under unusual or unexpected circumstances.
Debt securities are valued at the evaluated bid price provided by an independent pricing service (e.g. taking into account various factors, including yields, maturities, or credit ratings) or, if a reliable price is not available, the quoted bid price from an independent broker-dealer.
Equity securities and futures contracts that are listed on a foreign or domestic exchange or market are valued at the official closing price or, if none, the last sales price. If no sale occurs on the principal exchange or market that day, a fair value price will be determined in accordance with the Fund’s Valuation Procedures.
The values of securities denominated in foreign currencies are translated into U.S. dollars at rates provided by an independent foreign currency pricing source at a time each business day specified by the Wells Fargo Asset Management Pricing Committee at Wells Fargo Funds Management, LLC (“Funds Management”).
Forward foreign currency contracts are recorded at the forward rate provided by an independent foreign currency pricing source at a time each business day specified by the Wells Fargo Asset Management Pricing Committee.
Investments in registered open-end investment companies are valued at net asset value. Interests in non-registered investment companies that are redeemable at net asset value are fair valued normally at net asset value.
Investments which are not valued using any of the methods discussed above are valued at their fair value, as determined in good faith by the Board of Trustees. The Board of Trustees has established a Valuation Committee comprised of the Trustees and has delegated to it the authority to take any actions regarding the valuation of portfolio securities that the Valuation Committee deems necessary or appropriate, including determining the fair value of portfolio securities, unless the determination has been delegated to the Wells Fargo Asset Management Pricing Committee. The Board of Trustees retains the authority to make or ratify any valuation decisions or approve any changes to the Valuation Procedures as it deems appropriate. On a quarterly basis, the Board of Trustees receives reports on any valuation actions taken by the Valuation Committee or the Wells Fargo Asset Management Pricing Committee which may include items for ratification.
32 | Wells Fargo Short-Term Bond Plus Fund
Notes to financial statements (unaudited)
Foreign currency translation
The accounting records of the Fund are maintained in U.S. dollars. The values of other assets and liabilities denominated in foreign currencies are translated into U.S. dollars at rates provided by an independent foreign currency pricing source at a time each business day specified by the Wells Fargo Asset Management Pricing Committee. Purchases and sales of securities, and income and expenses are converted at the rate of exchange on the respective dates of such transactions. Net realized foreign exchange gains or losses arise from sales of foreign currencies, currency gains or losses realized between the trade and settlement dates on securities transactions, and the difference between the amounts of dividends, interest and foreign withholding taxes recorded and the U.S. dollar equivalent of the amounts actually paid or received. Net unrealized foreign exchange gains and losses arise from changes in the fair value of assets and liabilities other than investments in securities resulting from changes in exchange rates. The changes in net assets arising from changes in exchange rates of securities and the changes in net assets resulting from changes in market prices of securities are not separately presented. Such changes are included in net realized and unrealized gains or losses from investments.
Forward foreign currency contracts
A forward foreign currency contract is an agreement between two parties to purchase or sell a specific currency for an agreed-upon price at a future date. The Fund enters into forward foreign currency contracts to facilitate transactions in foreign-denominated securities and to attempt to minimize the risk to the Fund from adverse changes in the relationship between currencies. Forward foreign currency contracts are recorded at the forward rate and marked-to-market daily. When the contracts are closed, realized gains and losses arising from such transactions are recorded as realized gains or losses on forward foreign currency contracts. The Fund is subject to foreign currency risk and may be exposed to risks if the counterparties to the contracts are unable to meet the terms of their contracts or if the value of the foreign currency changes unfavorably. The Fund's maximum risk of loss from counterparty credit risk is the unrealized gains on the contracts. This risk may be mitigated if there is a master netting arrangement between the Fund and the counterparty.
Securities lending
The Fund may lend its securities from time to time in order to earn additional income in the form of fees or interest on securities received as collateral or the investment of any cash received as collateral. When securities are on loan, the Fund receives interest or dividends on those securities. Cash collateral received in connection with its securities lending transactions is invested in Securities Lending Cash Investments, LLC (the “Securities Lending Fund”). Investments in Securities Lending Fund are valued at the evaluated bid price provided by an independent pricing service. Income earned from investment in the Securities Lending Fund (net of fees and rebates), if any, is included in income from affiliated securities on the Statement of Operations.
In a securities lending transaction, the net asset value of the Fund is affected by an increase or decrease in the value of the securities loaned and by an increase or decrease in the value of the instrument in which collateral is invested. The amount of securities lending activity undertaken by the Fund fluctuates from time to time. The Fund has the right under the lending agreement to recover the securities from the borrower on demand. In the event of default or bankruptcy by the borrower, the Fund may be prevented from recovering the loaned securities or gaining access to the collateral or may experience delays or costs in doing so. In such an event, the terms of the agreement allow the unaffiliated securities lending agent to use the collateral to purchase replacement securities on behalf of the Fund or pay the Fund the market value of the loaned securities. The Fund bears the risk of loss with respect to depreciation of its investment of the cash collateral.
When-issued transactions
The Fund may purchase securities on a forward commitment or when-issued basis. The Fund records a when-issued transaction on the trade date and will segregate assets in an amount at least equal in value to the Fund's commitment to purchase when-issued securities. Securities purchased on a when-issued basis are marked-to-market daily and the Fund begins earning interest on the settlement date. Losses may arise due to changes in the market value of the underlying securities or if the counterparty does not perform under the contract.
Futures contracts
Futures contracts are agreements between the Fund and a counterparty to buy or sell a specific amount of a commodity, financial instrument or currency at a specified price on a specified date. The Fund may buy and sell futures contracts in order to gain exposure to, or protect against, changes in interest rates and is subject to interest rate risk. The primary risks associated with the use of futures contracts are the imperfect correlation between changes in market values of securities held by the Fund and the prices of futures contracts, and the possibility of an illiquid market. Futures contracts are generally entered into on a regulated futures exchange and cleared through a clearinghouse associated with the exchange. With futures contracts, there is minimal counterparty risk to the Fund since futures contracts are exchange traded and the exchange’s clearinghouse, as the counterparty to all exchange traded futures, guarantees the futures contracts against default.
Wells Fargo Short-Term Bond Plus Fund | 33
Notes to financial statements (unaudited)
Upon entering into a futures contract, the Fund is required to deposit either cash or securities (initial margin) with the broker in an amount equal to a certain percentage of the contract value. Subsequent payments (variation margin) are paid to or from the broker each day equal to the daily changes in the contract value. Such payments are recorded as unrealized gains or losses and, if any, shown as variation margin receivable (payable) in the Statement of Assets and Liabilities. Should the Fund fail to make requested variation margin payments, the broker can gain access to the initial margin to satisfy the Fund’s payment obligations. When the contracts are closed, a realized gain or loss is recorded in the Statement of Operations.
Security transactions and income recognition
Securities transactions are recorded on a trade date basis. Realized gains or losses are recorded on the basis of identified cost.
Interest income is accrued daily and bond discounts are accreted and premiums are amortized daily. To the extent debt obligations are placed on non-accrual status, any related interest income may be reduced by writing off interest receivables when the collection of all or a portion of interest has been determined to be doubtful based on consistently applied procedures and the fair value has decreased. If the issuer subsequently resumes interest payments or when the collectability of interest is reasonably assured, the debt obligation is removed from non-accrual status.
Dividend income is recognized on the ex-dividend date.
Income dividends and capital gain distributions from investment companies are recorded on the ex-dividend date. Capital gain distributions from investment companies are treated as realized gains.
Distributions to shareholders
Distributions to shareholders are recorded on the ex-dividend date and paid from net investment income monthly and any net realized gains are paid at least annually. Such distributions are determined in accordance with income tax regulations and may differ from U.S. generally accepted accounting principles. Dividend sources are estimated at the time of declaration. The tax character of distributions is determined as of the Fund’s fiscal year end. Therefore, a portion of the Fund’s distributions made prior to the Fund’s fiscal year end may be categorized as a tax return of capital at year end.
Federal and other taxes
The Fund intends to continue to qualify as a regulated investment company by distributing substantially all of its investment company taxable income and any net realized capital gains (after reduction for capital loss carryforwards) sufficient to relieve it from all, or substantially all, federal income taxes. Accordingly, no provision for federal income taxes was required.
The Fund’s income and federal excise tax returns and all financial records supporting those returns for the prior three fiscal years are subject to examination by the federal and Delaware revenue authorities. Management has analyzed the Fund's tax positions taken on federal, state, and foreign tax returns for all open tax years and does not believe that there are any uncertain tax positions that require recognition of a tax liability.
As of February 28, 2021, the aggregate cost of all investments for federal income tax purposes was $495,134,317 and the unrealized gains (losses) consisted of:
| Gross unrealized gains | $9,840,229 |
| Gross unrealized losses | (705,441) |
| Net unrealized gains | $9,134,788 |
Class allocations
The separate classes of shares offered by the Fund differ principally in applicable sales charges, distribution, shareholder servicing, and administration fees. Class specific expenses are charged directly to that share class. Investment income, common fund-level expenses, and realized and unrealized gains (losses) on investments are allocated daily to each class of shares based on the relative proportion of net assets of each class.
34 | Wells Fargo Short-Term Bond Plus Fund
Notes to financial statements (unaudited)
3. FAIR VALUATION MEASUREMENTS
Fair value measurements of investments are determined within a framework that has established a fair value hierarchy based upon the various data inputs utilized in determining the value of the Fund’s investments. The three-level hierarchy gives the highest priority to unadjusted quoted prices in active markets for identical assets or liabilities (Level 1) and the lowest priority to unobservable inputs (Level 3). The Fund’s investments are classified within the fair value hierarchy based on the lowest level of input that is significant to the fair value measurement. The inputs are summarized into three broad levels as follows:
| ■ | Level 1 – quoted prices in active markets for identical securities |
| ■ | Level 2 – other significant observable inputs (including quoted prices for similar securities, interest rates, prepayment speeds, credit risk, etc.) |
| ■ | Level 3 – significant unobservable inputs (including the Fund’s own assumptions in determining the fair value of investments) |
The inputs or methodologies used for valuing investments in securities are not necessarily an indication of the risk associated with investing in those securities.
The following is a summary of the inputs used in valuing the Fund’s assets and liabilities as of February 28, 2021:
| | Quoted prices
(Level 1) | Other significant
observable inputs
(Level 2) | Significant
unobservable inputs
(Level 3) | Total |
| Assets | | | | |
| Investments in: | | | | |
| Agency securities | $ 0 | $ 15,297,244 | $0 | $ 15,297,244 |
| Asset-backed securities | 0 | 48,796,427 | 0 | 48,796,427 |
| Corporate bonds and notes | 0 | 135,289,716 | 0 | 135,289,716 |
| Exchange-traded funds | 19,116,120 | 0 | 0 | 19,116,120 |
| Foreign corporate bonds and notes | 0 | 1,845,489 | 0 | 1,845,489 |
| Foreign government bonds | 0 | 6,026,514 | 0 | 6,026,514 |
| Loans | 0 | 9,774,803 | 0 | 9,774,803 |
| Municipal obligations | 0 | 6,490,662 | 0 | 6,490,662 |
| Non-agency mortgage-backed securities | 0 | 115,794,168 | 0 | 115,794,168 |
| U.S. Treasury securities | 19,236,895 | 0 | 0 | 19,236,895 |
| Yankee corporate bonds and notes | 0 | 86,606,313 | 0 | 86,606,313 |
| Short-term investments | | | | |
| Investment companies | 39,749,103 | 0 | 0 | 39,749,103 |
| | 78,102,118 | 425,921,336 | 0 | 504,023,454 |
| Futures contracts | 342,694 | 0 | 0 | 342,694 |
| Forward foreign currency contracts | 0 | 163,111 | 0 | 163,111 |
| Total assets | $78,444,812 | $426,084,447 | $0 | $504,529,259 |
| Liabilities | | | | |
| Forward foreign currency contracts | $ 0 | $ 146,130 | $0 | $ 146,130 |
| Futures contracts | 114,024 | 0 | 0 | 114,024 |
| Total liabilities | $ 114,024 | $ 146,130 | $0 | $ 260,154 |
Futures contracts and forward foreign currency contracts are reported at their cumulative unrealized gains (losses) at measurement date as reported in the tables following the Portfolio of Investments. For futures contracts, the current day’s variation margin is reported on the Statement of Assets and Liabilities. All other assets and liabilities are reported at their market value at measurement date.
Additional sector, industry or geographic detail, if any, is included in the Portfolio of Investments.
For the six months ended February 28, 2021, the Fund did not have any transfers into/out of Level 3.
4. TRANSACTIONS WITH AFFILIATES
Wells Fargo Short-Term Bond Plus Fund | 35
Notes to financial statements (unaudited)
Management fee
Funds Management, an indirect wholly owned subsidiary of Wells Fargo & Company (“Wells Fargo”), is the manager of the Fund and provides advisory and fund-level administrative services under an investment management agreement. Under the investment management agreement, Funds Management is responsible for, among other services, implementing the investment objectives and strategies of the Fund, supervising the subadviser and providing fund-level administrative services in connection with the Fund’s operations. As compensation for its services under the investment management agreement, Funds Management is entitled to receive a management fee at the following annual rate based on the Fund’s average daily net assets:
| Average daily net assets | Management fee |
| First $1 billion | 0.350% |
| Next $4 billion | 0.325 |
| Next $3 billion | 0.290 |
| Next $2 billion | 0.265 |
| Over $10 billion | 0.255 |
For the six months ended February 28, 2021, the management fee was equivalent to an annual rate of 0.35% of the Fund’s average daily net assets.
Funds Management has retained the services of a subadviser to provide daily portfolio management to the Fund. The fee for subadvisory services is borne by Funds Management. Wells Capital Management Incorporated ("WellsCap"), an affiliate of Funds Management and an indirect wholly owned subsidiary of Wells Fargo, is the subadviser to the Fund and is entitled to receive a fee from Funds Management at an annual rate starting at 0.15% and declining to 0.05% as the average daily net assets of the Fund increase.
Administration fees
Under a class-level administration agreement, Funds Management provides class-level administrative services to the Fund, which includes paying fees and expenses for services provided by the transfer agent, sub-transfer agents, omnibus account servicers and record-keepers. As compensation for its services under the class-level administration agreement, Funds Management receives an annual fee which is calculated based on the average daily net assets of each class as follows:
| | Class-level
administration fee |
| Class A | 0.16% |
| Class C | 0.16 |
| Class R6 | 0.03 |
| Institutional Class | 0.08 |
Waivers and/or expense reimbursements
Funds Management has contractually waived and/or reimbursed management and administration fees to the extent necessary to maintain certain net operating expense ratios for the Fund. When each class of the Fund has exceeded its expense cap, Funds Management has waived fees and/or reimbursed expenses from fund-level expenses on a proportionate basis and then from class specific expenses. When only certain classes exceed their expense caps, waivers and/or reimbursements are applied against class specific expenses before fund-level expenses. Funds Management has committed through December 31, 2021 to waive fees and/or reimburse expenses to the extent necessary to cap expenses. Prior to or after the commitment expiration date, the cap may be increased or the commitment to maintain the cap may be terminated only with the approval of the Board of Trustees. The contractual expense caps are as follows:
36 | Wells Fargo Short-Term Bond Plus Fund
Notes to financial statements (unaudited)
| | Expense ratio caps |
| Class A | 0.72% |
| Class C | 1.47 |
| Class R6 | 0.40 |
| Institutional Class | 0.45 |
Distribution fee
The Trust has adopted a distribution plan for Class C shares of the Fund pursuant to Rule 12b-1 under the 1940 Act. A distribution fee is charged charged to Class C shares and paid to Wells Fargo Funds Distributor, LLC (“Funds Distributor”), the principal underwriter, at an annual rate of 0.75% of the average daily net assets of Class C shares.
In addition, Funds Distributor is entitled to receive the front-end sales charge from the purchase of Class A shares and a contingent deferred sales charge on the redemption of certain Class A shares. Funds Distributor is also entitled to receive the contingent deferred sales charges from redemptions of Class C shares. For the six months ended February 28, 2021, Funds Distributor received $560 from the sale of Class A shares. No contingent deferred sales charges were incurred by Class A and Class C shares for the six months ended February 28, 2021.
Shareholder servicing fees
The Trust has entered into contracts with one or more shareholder servicing agents, whereby Class A and Class C shares of the Fund are charged a fee at an annual rate of 0.25% of the average daily net assets of each respective class. A portion of these total shareholder servicing fees were paid to affiliates of Wells Fargo.
Interfund transactions
The Fund may purchase or sell portfolio investment securities to certain other Wells Fargo affiliates pursuant to Rule 17a-7 under the 1940 Act and under procedures adopted by the Board of Trustees. The procedures have been designed to ensure that these interfund transactions, which do not incur broker commissions, are effected at current market prices.
5. INVESTMENT PORTFOLIO TRANSACTIONS
Purchases and sales of investments, excluding short-term securities, for the six months ended February 28, 2021 were as follows:
| Purchases at cost | | Sales proceeds |
U.S.
government | Non-U.S.
government | | U.S.
government | Non-U.S.
government |
| $44,485,509 | $178,804,175 | | $45,560,909 | $127,879,652 |
6. SECURITIES LENDING TRANSACTIONS
The Fund lends its securities through an unaffiliated securities lending agent and receives collateral in the form of cash or securities with a value at least equal to the value of the securities on loan. The value of the loaned securities is determined at the close of each business day and any increases or decreases in the required collateral are exchanged between the Fund and the counterparty on the next business day. Cash collateral received is invested in the Securities Lending Fund which seeks to provide a positive return compared to the daily Federal Funds Open Rate by investing in high-quality, U.S. dollar-denominated short-term money market instruments and is exempt from registration under Section 3(c)(7) of the 1940 Act. Securities Lending Fund is managed by Funds Management and is subadvised by WellsCap. Funds Management receives an advisory fee starting at 0.05% and declining to 0.01% as the average daily net assets of the Securities Lending Fund increase. All of the fees received by Funds Management are paid to WellsCap for its services as subadviser.
In the event of counterparty default or the failure of a borrower to return a loaned security, the Fund has the right to use the collateral to offset any losses incurred. As of February 28, 2021, the Fund had securities lending transactions with the following counterparties which are subject to offset:
Wells Fargo Short-Term Bond Plus Fund | 37
Notes to financial statements (unaudited)
| Counterparty | Value of
securities on
loan | Collateral
received1 | Net amount |
| Bank of America Securities Incorporated | $246,862 | $(246,862) | $0 |
| Credit Suisse Securities (USA) LLC | 408,384 | (408,384) | 0 |
| UBS Securities LLC | 166,254 | (166,254) | 0 |
1 Collateral received within this table is limited to the collateral for the net transaction with the counterparty.
7. DERIVATIVE TRANSACTIONS
During the six months ended February 28, 2021, the Fund entered into futures contracts to speculate on interest rates and to help manage the duration of the portfolio and entered into forward foreign currency contracts for economic hedging purposes.
The volume of the Fund's derivative activity during the six months ended February 28, 2021 was as follows:
| Futures contracts | |
| Average notional balance on long futures | $138,333,519 |
| Average notional balance on short futures | 61,088,915 |
| Forward foreign currency contracts | |
| Average contract amounts to buy | $ 7,625,529 |
| Average contract amounts to sell | 10,443,929 |
A summary of the location of derivative instruments on the financial statements by primary risk exposure is outlined in the following tables.
The fair value of derivative instruments as of February 28, 2021 by risk type was as follows for the Fund:
| | Asset derivatives | | Liability derivatives |
| | Statement of
Assets and Liabilities location | Fair value | | Statement of
Assets and Liabilities location | Fair value |
| Interest rate risk | Unrealized gains on futures contracts | $ 342,694* | | Unrealized losses on futures contracts | $ 114,024* |
| Foreign currency risk | Unrealized gains on forward foreign currency contracts | 163,111 | | Unrealized losses on forward foreign currency contracts | 146,130 |
| | | $505,805 | | | $260,154 |
* Amount represents the cumulative unrealized gains (losses) as reported in the tables following the Portfolio of Investments. For futures contracts, only the current day's variation margin as of February 28, 2021 is reported separately on the Statement of Assets and Liabilities.
The effect of derivative instruments on the Statement of Operations for the six months ended February 28, 2021 was as follows for the Fund:
| | Amount of realized gains (losses) on derivatives |
| | Futures
contracts | Forward
foreign
currency
contracts | Total |
| Interest rate risk | $ 446,461 | $ 0 | $ 446,461 |
| Foreign currency risk | 0 | (142,486) | (142,486) |
| | $446,461 | $(142,486) | $ 303,975 |
38 | Wells Fargo Short-Term Bond Plus Fund
Notes to financial statements (unaudited)
| | Change in unrealized gains (losses) on derivatives |
| | Futures
contracts | Forward
foreign
currency
contracts | Total |
| Interest rate risk | $ 273,231 | $ 0 | $ 273,231 |
| Foreign currency risk | 0 | 31,078 | 31,078 |
| | $273,231 | $31,078 | $304,309 |
For certain types of derivative transactions, the Fund has entered into International Swaps and Derivatives Association, Inc. master agreements (“ISDA Master Agreements”) or similar agreements with approved counterparties. The ISDA Master Agreements or similar agreements may have requirements to deliver/deposit securities or cash to/with an exchange or broker-dealer as collateral and allows the Fund to offset, with each counterparty, certain derivative financial instrument’s assets and/or liabilities with collateral held or pledged. Collateral requirements differ by type of derivative. Collateral or margin requirements are set by the broker or exchange clearinghouse for exchange traded derivatives while collateral terms are contract specific for over-the-counter traded derivatives. Cash collateral that has been pledged to cover obligations of the Fund under ISDA Master Agreements or similar agreements, if any, are reported separately in the Statement of Assets and Liabilities. Securities pledged as collateral, if any, are noted in the Portfolio of Investments. With respect to balance sheet offsetting, absent an event of default by the counterparty or a termination of the agreement, the reported amounts of financial assets and financial liabilities in the Statement of Assets and Liabilities are not offset across transactions between the Fund and the applicable counterparty. A reconciliation of the gross amounts on the Statement of Assets and Liabilities to the net amounts by counterparty, including any collateral exposure, for OTC derivatives is as follows:
| Counterparty | Gross amounts
of assets in the
Statement of
Assets and
Liabilities | Amounts
subject to
netting
agreements | Collateral
received | Net amount
of assets |
| Morgan Stanley | $163,111 | $(146,130) | $0 | $16,981 |
| Counterparty | Gross amounts
of assets in the
Statement of
Assets and
Liabilities | Amounts
subject to
netting
agreements | Collateral
pledged | Net amount
of liabilities |
| Morgan Stanley | $146,130 | $(146,130) | $0 | $0 |
8. BANK BORROWINGS
The Trust (excluding the money market funds), Wells Fargo Master Trust and Wells Fargo Variable Trust are parties to a $350,000,000 revolving credit agreement whereby the Fund is permitted to use bank borrowings for temporary or emergency purposes, such as to fund shareholder redemption requests. Interest under the credit agreement is charged to the Fund based on a borrowing rate equal to the higher of the Federal Funds rate in effect on that day plus 1.25% or the overnight LIBOR rate in effect on that day plus 1.25%. In addition, an annual commitment fee equal to 0.25% of the unused balance is allocated to each participating fund.
For the six months ended February 28, 2021, there were no borrowings by the Fund under the agreement.
9. INDEMNIFICATION
Under the Fund's organizational documents, the officers and Trustees have been granted certain indemnification rights against certain liabilities that may arise out of performance of their duties to the Fund. The Fund has entered into a separate agreement with each Trustee that converts indemnification rights currently existing under the Fund’s organizational documents into contractual rights that cannot be changed in the future without the consent of the Trustee. Additionally, in the normal course of business, the Fund may enter into contracts with service providers that contain a variety of indemnification clauses. The Fund’s maximum exposure under these arrangements is dependent on future claims that may be made against the Fund and, therefore, cannot be estimated.
Wells Fargo Short-Term Bond Plus Fund | 39
Notes to financial statements (unaudited)
10. CORONAVIRUS (COVID-19) PANDEMIC
On March 11, 2020, the World Health Organization announced that it had made the assessment that coronavirus disease 2019 (“COVID-19”) is a pandemic. The impacts of COVID-19 are affecting the entire global economy, individual companies and investment products, the funds, and the market in general. There is significant uncertainty around the extent and duration of business disruptions related to COVID-19 and the impacts may last for an extended period of time. COVID-19 has led to significant uncertainty and volatility in the financial markets.
40 | Wells Fargo Short-Term Bond Plus Fund
Other information (unaudited)
PROXY VOTING INFORMATION
A description of the policies and procedures used to determine how to vote proxies relating to portfolio securities is available without charge, upon request, by calling 1-800-222-8222, visiting our website at wfam.com, or visiting the SEC website at sec.gov. Information regarding how the proxies related to portfolio securities were voted during the most recent 12-month period ended June 30 is available on the website at wfam.com or by visiting the SEC website at sec.gov.
QUARTERLY PORTFOLIO HOLDINGS INFORMATION
The Fund files its complete schedule of portfolio holdings with the SEC for the first and third quarters of each fiscal year as an exhibit to its reports on Form N-PORT. Shareholders may view the filed Form N-PORT by visiting the SEC website at sec.gov.
Wells Fargo Short-Term Bond Plus Fund | 41
Other information (unaudited)
BOARD OF TRUSTEES AND OFFICERS
Each of the Trustees and Officers listed in the table below acts in identical capacities for each fund in the Wells Fargo family of funds, which consists of 144 mutual funds comprising the Wells Fargo Funds Trust, Wells Fargo Variable Trust, Wells Fargo Master Trust and four closed-end funds (collectively the “Fund Complex”). This table should be read in conjunction with the Prospectus and the Statement of Additional Information1. The mailing address of each Trustee and Officer is 525 Market Street, 12th Floor, San Francisco, CA 94105. Each Trustee and Officer serves an indefinite term, however, each Trustee serves such term until reaching the mandatory retirement age established by the Trustees.
Independent Trustees
Name and
year of birth | Position held and
length of service* | Principal occupations during past five years or longer | Current other
public company or
investment
company
directorships |
William R. Ebsworth
(Born 1957) | Trustee,
since 2015 | Retired. From 1984 to 2013, equities analyst, portfolio manager, research director and chief investment officer at Fidelity Management and Research Company in Boston, Tokyo, and Hong Kong, and retired in 2013 as Chief Investment Officer of Fidelity Strategic Advisers, Inc. where he led a team of investment professionals managing client assets. Prior thereto, Board member of Hong Kong Securities Clearing Co., Hong Kong Options Clearing Corp., the Thailand International Fund, Ltd., Fidelity Investments Life Insurance Company, and Empire Fidelity Investments Life Insurance Company. Audit Committee Chair and Investment Committee Chair of the Vincent Memorial Hospital Endowment (non-profit organization). Mr. Ebsworth is a CFA® charterholder. | N/A |
Jane A. Freeman
(Born 1953) | Trustee,
since 2015;
Chair Liaison,
since 2018 | Retired. From 2012 to 2014 and 1999 to 2008, Chief Financial Officer of Scientific Learning Corporation. From 2008 to 2012, Ms. Freeman provided consulting services related to strategic business projects. Prior to 1999, Portfolio Manager at Rockefeller & Co. and Scudder, Stevens & Clark. Board member of the Harding Loevner Funds from 1996 to 2014, serving as both Lead Independent Director and chair of the Audit Committee. Board member of the Russell Exchange Traded Funds Trust from 2011 to 2012 and the chair of the Audit Committee. Ms. Freeman is also an inactive Chartered Financial Analyst. | N/A |
Isaiah Harris, Jr.
(Born 1952) | Trustee,
since 2009; Audit
Committee
Chair,
since 2019 | Retired. Chairman of the Board of CIGNA Corporation since 2009, and Director since 2005. From 2003 to 2011, Director of Deluxe Corporation. Prior thereto, President and CEO of BellSouth Advertising and Publishing Corp. from 2005 to 2007, President and CEO of BellSouth Enterprises from 2004 to 2005 and President of BellSouth Consumer Services from 2000 to 2003. Emeritus member of the Iowa State University Foundation Board of Governors. Emeritus Member of the Advisory Board of Iowa State University School of Business. Advisory Board Member, Palm Harbor Academy (private school). Mr. Harris is a certified public accountant (inactive status). | CIGNA Corporation |
Judith M. Johnson
(Born 1949) | Trustee,
since 2008 | Retired. Prior thereto, Chief Executive Officer and Chief Investment Officer of Minneapolis Employees Retirement Fund from 1996 to 2008. Ms. Johnson is an attorney, certified public accountant and a certified managerial accountant. | N/A |
David F. Larcker
(Born 1950) | Trustee,
since 2009 | James Irvin Miller Professor of Accounting at the Graduate School of Business (Emeritus), Stanford University, Director of the Corporate Governance Research Initiative and Senior Faculty of The Rock Center for Corporate Governance since 2006. From 2005 to 2008, Professor of Accounting at the Graduate School of Business, Stanford University. Prior thereto, Ernst & Young Professor of Accounting at The Wharton School, University of Pennsylvania from 1985 to 2005. | N/A |
42 | Wells Fargo Short-Term Bond Plus Fund
Other information (unaudited)
Name and
year of birth | Position held and
length of service* | Principal occupations during past five years or longer | Current other
public company or
investment
company
directorships |
Olivia S. Mitchell
(Born 1953) | Trustee,
since 2006;
Nominating and
Governance
Committee Chair,
since 2018 | International Foundation of Employee Benefit Plans Professor, Wharton School of the University of Pennsylvania since 1993. Director of Wharton’s Pension Research Council and Boettner Center on Pensions & Retirement Research, and Research Associate at the National Bureau of Economic Research. Previously, Cornell University Professor from 1978 to 1993. | N/A |
Timothy J. Penny
(Born 1951) | Trustee,
since 1996;
Chair,
since 2018 | President and Chief Executive Officer of Southern Minnesota Initiative Foundation, a non-profit organization, since 2007. Member of the Board of Trustees of NorthStar Education Finance, Inc., a non-profit organization, since 2007. | N/A |
James G. Polisson
(Born 1959) | Trustee,
since 2018 | Retired. Chief Marketing Officer, Source (ETF) UK Services, Ltd, from 2015 to 2017. From 2012 to 2015, Principal of The Polisson Group, LLC, a management consulting, corporate advisory and principal investing company. Chief Executive Officer and Managing Director at Russell Investments, Global Exchange Traded Funds from 2010 to 2012. Managing Director of Barclays Global Investors from 1998 to 2010 and Global Chief Marketing Officer for iShares and Barclays Global Investors from 2000 to 2010. Trustee of the San Francisco Mechanics’ Institute, a non-profit organization, from 2013 to 2015. Board member of the Russell Exchange Traded Fund Trust from 2011 to 2012. Director of Barclays Global Investors Holdings Deutschland GmbH from 2006 to 2009. Mr. Polisson is an attorney and has a retired status with the Massachusetts and District of Columbia Bar Associations. | N/A |
Pamela Wheelock
(Born 1959) | Trustee,
since January
2020; previously
Trustee from
January 2018 to
July 2019 | Board member of the Destination Medical Center Economic Development Agency, Rochester, Minnesota since 2019. Interim President of the McKnight Foundation from January to September 2020. Acting Commissioner, Minnesota Department of Human Services, July 2019 through September 2019. Human Services Manager (part-time), Minnesota Department of Human Services, October 2019 through December 2019. Chief Operating Officer, Twin Cities Habitat for Humanity from 2017 to 2019. Vice President of University Services, University of Minnesota from 2012 to 2016. Prior thereto, on the Board of Directors, Governance Committee and Finance Committee for the Minnesota Philanthropy Partners (Saint Paul Foundation) from 2012 to 2018, Interim Chief Executive Officer of Blue Cross Blue Shield of Minnesota from 2011 to 2012, Chairman of the Board from 2009 to 2012 and Board Director from 2003 to 2015. Vice President, Leadership and Community Engagement, Bush Foundation, Saint Paul, Minnesota (a private foundation) from 2009 to 2011. Executive Vice President and Chief Financial Officer, Minnesota Sports and Entertainment from 2004 to 2009 and Senior Vice President from 2002 to 2004. Executive Vice President of the Minnesota Wild Foundation from 2004 to 2008. Commissioner of Finance, State of Minnesota, from 1999 to 2002. Currently Board Chair of the Minnesota Wild Foundation since 2010. | N/A |
* Length of service dates reflect the Trustee’s commencement of service with the Trust’s predecessor entities, where applicable.
Wells Fargo Short-Term Bond Plus Fund | 43
Other information (unaudited)
Officers
Name and
year of birth | Position held and
length of service | Principal occupations during past five years or longer |
Andrew Owen
(Born 1960) | President,
since 2017 | Executive Vice President of Wells Fargo & Company and Head of Affiliated Managers, Wells Fargo Asset Management, since 2014. In addition, Mr. Owen is currently President, Chief Executive Officer and Director of Wells Fargo Funds Management, LLC since 2017. Prior thereto, Executive Vice President responsible for marketing, investments and product development for Wells Fargo Funds Management, LLC, from 2009 to 2014. |
Jeremy DePalma
(Born 1974) | Treasurer,
since 2012
(for certain funds in
the Fund Complex);
since 2021 (for
the remaining funds in the
Fund Complex) | Senior Vice President of Wells Fargo Funds Management, LLC since 2009. Senior Vice President of Evergreen Investment Management Company, LLC from 2008 to 2010 and head of the Fund Reporting and Control Team within Fund Administration from 2005 to 2010. |
Michelle Rhee
(Born 1966) | Chief Legal Officer,
since 2019 | Secretary of Wells Fargo Funds Management, LLC and Chief Legal Counsel of Wells Fargo Asset Management since 2018. Deputy General Counsel of Wells Fargo Bank, N.A. since 2020 and Assistant General Counsel of Wells Fargo Bank, N.A. from 2018 to 2020. Associate General Counsel and Managing Director of Bank of America Corporation from 2004 to 2018. |
Catherine Kennedy
(Born 1969) | Secretary,
since 2019 | Vice President of Wells Fargo Funds Management, LLC and Senior Counsel of the Wells Fargo Legal Department since 2010. Vice President and Senior Counsel of Evergreen Investment Management Company, LLC from 1998 to 2010. |
Michael H. Whitaker
(Born 1967) | Chief Compliance Officer,
since 2016 | Chief Compliance Officer of Wells Fargo Asset Management since 2016. Senior Vice President and Chief Compliance Officer for Fidelity Investments from 2007 to 2016. |
1 The Statement of Additional Information includes additional information about the Trustees and is available, without charge, upon request, by calling 1-800-222-8222 or by visiting the website at wfam.com.
44 | Wells Fargo Short-Term Bond Plus Fund
For more information
More information about Wells Fargo Funds is available free upon request. To obtain literature, please write, visit the Fund's website, or call:
Wells Fargo Funds
P.O. Box 219967
Kansas City, MO 64121-9967
Website: wfam.com
Individual investors: 1-800-222-8222
Retail investment professionals: 1-888-877-9275
Institutional investment professionals: 1-866-765-0778
This report and the financial statements contained herein are submitted for the general information of the shareholders of the Fund. If this report is used for promotional purposes, distribution of the report must be accompanied or preceded by a current prospectus. Before investing, please consider the investment objectives, risks, charges, and expenses of the investment. For a current prospectus and, if available, a summary prospectus, containing this information, call 1-800-222-8222 or visit the Fund's website at wfam.com. Read the prospectus carefully before you invest or send money.
Wells Fargo Asset Management (WFAM) is the trade name for certain investment advisory/management firms owned by Wells Fargo & Company. These firms include but are not limited to Wells Capital Management Incorporated and Wells Fargo Funds Management, LLC. Certain products managed by WFAM entities are distributed by Wells Fargo Funds Distributor, LLC (a broker-dealer and Member FINRA).
This material is for general informational and educational purposes only and is NOT intended to provide investment advice or a recommendation of any kind - including a recommendation for any specific investment, strategy, or plan.
INVESTMENT PRODUCTS: NOT FDIC INSURED ■ NO BANK GUARANTEE ■ MAY LOSE VALUE
© 2021 Wells Fargo & Company. All rights reserved.
PAR-0321-00296 04-21
SA221/SAR221 02-21
Semi-Annual Report
February 28, 2021
Wells Fargo
Short-Term High Yield Bond Fund
Reduce clutter.
Save trees.
Sign up for electronic delivery of prospectuses and shareholder reports at wellsfargo.com/ advantagedelivery
INVESTMENT PRODUCTS: NOT FDIC INSURED ■ NO BANK GUARANTEE ■ MAY LOSE VALUE
Wells Fargo Short-Term High Yield Bond Fund | 1
Letter to shareholders (unaudited)
Andrew Owen
President
Wells Fargo Funds
Dear Shareholder:
We are pleased to offer you this semi-annual report for the Wells Fargo Short-Term High Yield Bond Fund for the six-month period that ended February 28, 2021. Global stocks showed robust returns, as the global economy began emerging from the haze of COVID-19. Tailwinds were provided by global stimulus programs, a rapid vaccination rollout, and recovering consumer and corporate sentiment. Bonds also had positive returns, led by high-yield bonds.
For the six-month period, U.S. stocks, based on the S&P 500 Index,1 gained 9.74%. International stocks, as measured by the MSCI ACWI ex USA Index (Net),2 returned 16.65%, while the MSCI EM Index (Net),3 had even stronger performance, with a 22.32% gain. Among bond indexes, the Bloomberg Barclays U.S. Aggregate Bond Index,4 returned (1.55)%, the Bloomberg Barclays Global Aggregate ex-USD Index (unhedged),5 gained 1.41%, and the Bloomberg Barclays Municipal Bond Index,6 returned 0.86% while the ICE BofA U.S. High Yield Index,7 gained 6.14%.
Hope drove the stock markets to new highs.
Stocks grew more volatile in September on mixed economic data. U.S. economic activity continued to grow. However, U.S. unemployment remained elevated at 7.9% in September. With U.S. Congress delaying further fiscal relief and uncertainties surrounding a possible vaccine, doubts crept back into the financial markets. In the U.K., a lack of progress in Brexit talks weighed on markets. China’s economy picked up steam, fueled by increased global demand.
In October, capital markets stepped back from their six-month rally. Market volatility rose in advance of the U.S. election and amid a global increase in COVID-19 infections. Europe introduced tighter restrictions affecting economic activity. U.S. markets looked favorably at the prospect of Democratic control of the federal purse strings, which could lead to additional fiscal stimulus and a boost to economic activity. Meanwhile, China reported 4.9% third-quarter gross domestic product growth.
| 1 | The S&P 500 Index consists of 500 stocks chosen for market size, liquidity, and industry group representation. It is a market-value-weighted index with each stock's weight in the index proportionate to its market value. You cannot invest directly in an index. |
| 2 | The Morgan Stanley Capital International (MSCI) All Country World Index (ACWI) ex USA Index (Net) is a free-float-adjusted market-capitalization-weighted index that is designed to measure the equity market performance of developed and emerging markets, excluding the United States. Source: MSCI. MSCI makes no express or implied warranties or representations and shall have no liability whatsoever with respect to any MSCI data contained herein. The MSCI data may not be further redistributed or used as a basis for other indices or any securities or financial products. This report is not approved, reviewed, or produced by MSCI. You cannot invest directly in an index. |
| 1 | The S&P 500 Index consists of 500 stocks chosen for market size, liquidity, and industry group representation. It is a market-value-weighted index with each stock's weight in the index proportionate to its market value. You cannot invest directly in an index. |
| 3 | The MSCI Emerging Markets (EM) Index (Net) is a free-float-adjusted market-capitalization-weighted index that is designed to measure equity market performance of emerging markets. You cannot invest directly in an index. |
| 1 | The S&P 500 Index consists of 500 stocks chosen for market size, liquidity, and industry group representation. It is a market-value-weighted index with each stock's weight in the index proportionate to its market value. You cannot invest directly in an index. |
| 4 | The Bloomberg Barclays U.S. Aggregate Bond Index is a broad-based benchmark that measures the investment-grade, U.S. dollar-denominated, fixed-rate taxable bond market, including Treasuries, government-related and corporate securities, mortgage-backed securities (agency fixed-rate and hybrid adjustable-rate mortgage pass-throughs), asset-backed securities, and commercial mortgage-backed securities. You cannot invest directly in an index. |
| 1 | The S&P 500 Index consists of 500 stocks chosen for market size, liquidity, and industry group representation. It is a market-value-weighted index with each stock's weight in the index proportionate to its market value. You cannot invest directly in an index. |
| 5 | The Bloomberg Barclays Global Aggregate ex-USD Index (unhedged) is an unmanaged index that provides a broad-based measure of the global investment-grade fixed-income markets excluding the U.S. dollar-denominated debt market. You cannot invest directly in an index. |
| 1 | The S&P 500 Index consists of 500 stocks chosen for market size, liquidity, and industry group representation. It is a market-value-weighted index with each stock's weight in the index proportionate to its market value. You cannot invest directly in an index. |
| 6 | The Bloomberg Barclays Municipal Bond Index is an unmanaged index composed of long-term tax-exempt bonds with a minimum credit rating of Baa. You cannot invest directly in an index. |
| 1 | The S&P 500 Index consists of 500 stocks chosen for market size, liquidity, and industry group representation. It is a market-value-weighted index with each stock's weight in the index proportionate to its market value. You cannot invest directly in an index. |
| 7 | The ICE BofA U.S. High Yield Index is a market-capitalization-weighted index of domestic and Yankee high-yield bonds. The index tracks the performance of high-yield securities traded in the U.S. bond market. You cannot invest directly in an index. Copyright 2021. ICE Data Indices, LLC. All rights reserved. |
2 | Wells Fargo Short-Term High Yield Bond Fund
Letter to shareholders (unaudited)
Global stocks rallied in November, propelled by optimism over three promising COVID-19 vaccines. Reversing recent trends, value stocks outperformed growth stocks and cyclical stocks outpaced technology stocks. However, U.S. unemployment remained elevated, with a net job loss of 10 million since February 2020. The eurozone services Purchasing Managers’ Index, a monthly survey of purchasing managers, contracted sharply while the region’s manufacturing activity grew. The U.S. election results added to the upbeat mood as investors anticipated more consistent policies in the new administration.
Financial markets ended the year with strength on high expectations for a rapid rollout of the COVID-19 vaccines, the successful passage of a $900 billion stimulus package, and rising expectations of additional economic support from a Democratic-led Congress. U.S. economic data were mixed with still-elevated unemployment and weak retail sales but growth in manufacturing output. In contrast, China’s economic expansion continued in both manufacturing and nonmanufacturing. U.S. COVID-19 infection rates continued to rise even as new state and local lockdown measures were implemented.
The year 2021 began with emerging market stocks leading all major asset classes in January, driven by China’s strong economic growth and a broad recovery in corporate earnings, which propelled China’s stock market higher. In the United States, positive news on vaccine trials and January's expansion in both the manufacturing and services sectors was offset by a weak December monthly jobs report. This was compounded by technical factors as some hedge funds were forced to sell stocks to protect themselves against a well-publicized short squeeze coordinated by a group of retail investors. Eurozone sentiment and economic growth were particularly weak, reflecting the impact of a new lockdown with stricter social distancing along with a slow vaccine rollout.
February saw major domestic equity indexes driven higher on the hope of a new stimulus bill, improving COVID-19 vaccination numbers, and the gradual reopening of the economy. Most S&P 500 companies reported better-than-expected earnings, with positive surprises coming from the financials, IT, health care, and materials sectors. Japan saw its economy strengthen as a result of strong export numbers. Meanwhile, crude oil prices continued their climb, rising more than 25% for the year. Domestic government bonds experienced a sharp sell-off in late February as markets priced in a more robust economic recovery and higher growth and inflation expectations.
Don’t let short-term uncertainty derail long-term investment goals.
Periods of investment uncertainty can present challenges, but experience has taught us that maintaining long-term investment goals can be an effective way to plan for the future. To help you create a sound strategy based on your personal goals and risk tolerance, Wells Fargo Funds offers more than 100 mutual funds spanning a wide range of asset classes and investment styles. Although diversification cannot guarantee an investment profit or prevent losses, we believe it can be an effective way to manage investment risk and potentially smooth out overall portfolio performance. We encourage investors to know their investments and to understand that appropriate levels of risk-taking may unlock opportunities.
Thank you for choosing to invest with Wells Fargo Funds. We appreciate your confidence in us and remain committed to helping you meet your financial needs.
Sincerely,
Andrew Owen
President
Wells Fargo Funds
“Global stocks rallied in November, propelled by optimism over three promising COVID-19 vaccines.”
“February saw major domestic equity indexes driven higher on the hope of a new stimulus bill, improving COVID-19 vaccination numbers, and the gradual reopening of the economy.”
For further information about your Fund, contact your investment professional, visit our website at wfam.com, or call us directly at 1-800-222-8222.
Wells Fargo Short-Term High Yield Bond Fund | 3
Letter to shareholders (unaudited)
Preparing for LIBOR Transition
The global financial industry is preparing to transition away from the London Interbank Offered Rate (LIBOR), a key benchmark interest rate, to new alternative rates. LIBOR underpins more than $350 trillion of financial contracts. It is the benchmark rate for a wide spectrum of products ranging from residential mortgages to corporate bonds to derivatives. Regulators have called for a market-wide transition away from LIBOR to successor reference rates by the end of 2021 (extended through June 30, 2023 for most tenors of the U.S. dollar LIBOR), which requires proactive steps be taken by issuers, counterparties, and asset managers to identify impacted products and adopt new reference rates.
The Fund holds at least one security that uses LIBOR as a floating reference rate and has a maturity date after 12-31-2021.
Although the transition process away from LIBOR has become increasingly well-defined in advance of the anticipated discontinuation date, there remains uncertainty regarding the nature of successor reference rates, and any potential effects of the transition away from LIBOR on investment instruments that use it as a benchmark rate. The transition process may result in, among other things, increased volatility or illiquidity in markets for instruments that currently rely on LIBOR and could negatively impact the value of certain instruments held by the Fund.
Wells Fargo Asset Management is monitoring LIBOR exposure closely and has put resources and controls in place to manage this transition effectively. The Fund’s portfolio management team is evaluating LIBOR holdings to understand what happens to those securities when LIBOR ceases to exist, including examining security documentation to identify the presence or absence of fallback language identifying a replacement rate to LIBOR.
While the pace of transition away from LIBOR will differ by asset class and investment strategy, the portfolio management team will monitor market conditions for those holdings to identify and mitigate deterioration or volatility in pricing and liquidity and ensure appropriate actions are taken in a timely manner.
Further information regarding the potential risks associated with the discontinuation of LIBOR can be found in the Fund’s Statement of Additional Information.
4 | Wells Fargo Short-Term High Yield Bond Fund
This page is intentionally left blank.
Performance highlights (unaudited)
| Investment objective | The Fund seeks total return, consisting of a high level of current income and capital appreciation. |
| Manager | Wells Fargo Funds Management, LLC |
| Subadviser | Wells Capital Management Incorporated |
| Portfolio managers | Chris Lee, CFA®‡*, Michael J. Schueller, CFA®‡ |
| Average annual total returns (%) as of February 28, 2021 |
| | | Including sales charge | | Excluding sales charge | | Expense ratios1 (%) |
| | Inception date | 1 year | 5 year | 10 year | | 1 year | 5 year | 10 year | | Gross | Net 2 |
| Class A (SSTHX) | 2-29-2000 | 3.64 | 3.25 | 3.10 | | 6.84 | 3.88 | 3.41 | | 0.95 | 0.82 |
| Class C (WFHYX) | 3-31-2008 | 5.04 | 3.10 | 2.64 | | 6.04 | 3.10 | 2.64 | | 1.70 | 1.57 |
| Administrator Class (WDHYX) | 7-30-2010 | – | – | – | | 7.00 | 4.04 | 3.58 | | 0.89 | 0.66 |
| Institutional Class (STYIX)3 | 11-30-2012 | – | – | – | | 7.16 | 4.20 | 3.69 | | 0.62 | 0.51 |
| ICE BofA High Yield U.S. Corporates, Cash Pay, BB Rated, 1-5 Index4 | – | – | – | – | | 7.91 | 6.33 | 5.54 | | – | – |
Figures quoted represent past performance, which is no guarantee of future results, and do not reflect taxes that a shareholder may pay on an investment in a fund. Investment return and principal value of an investment will fluctuate so that an investor’s shares, when redeemed, may be worth more or less than their original cost. Performance shown without sales charges would be lower if sales charges were reflected. Current performance may be lower or higher than the performance data quoted, which assumes the reinvestment of dividends and capital gains. Current month-end performance is available on the Fund’s website, wfam.com.
Index returns do not include transaction costs associated with buying and selling securities, any mutual fund fees or expenses, or any taxes. It is not possible to invest directly in an index.
For Class A shares, the maximum front-end sales charge is 3.00%. For Class C shares, the maximum contingent deferred sales charge is 1.00%. Performance including a contingent deferred sales charge assumes the sales charge for the corresponding time period. Administrator Class and Institutional Class shares are sold without a front-end sales charge or contingent deferred sales charge.
| 1 | Reflects the expense ratios as stated in the most recent prospectuses, which include the impact of 0.01% in acquired fund fees and expenses. The expense ratios shown are subject to change and may differ from the annualized expense ratios shown in the financial highlights of this report, which do not include acquired fund fees and expenses. |
| 2 | The manager has contractually committed through December 31, 2021, to waive fees and/or reimburse expenses to the extent necessary to cap total annual fund operating expenses after fee waivers at 0.81% for Class A, 1.56% for Class C, 0.65% for Administrator Class and 0.50% for Institutional Class. Brokerage commissions, stamp duty fees, interest, taxes, acquired fund fees and expenses (if any), and extraordinary expenses are excluded from the expense caps. Prior to or after the commitment expiration date, the caps may be increased or the commitment to maintain the caps may be terminated only with the approval of the Board of Trustees. Without these caps, the Fund’s returns would have been lower. The expense ratio paid by an investor is the net expense ratio (the total annual fund operating expenses after fee waivers) as stated in the prospectuses. |
| 3 | Historical performance shown for the Institutional Class shares prior to their inception reflects the performance of the Administrator Class shares and is not adjusted to reflect the Institutional Class expenses. If these expenses had been included, returns for the Institutional Class shares would be higher. |
| 4 | The ICE BofA High Yield U.S. Corporates, Cash Pay, BB Rated, 1-5 Year Index is an unmanaged index that generally tracks the performance of BB rated U.S. dollar-denominated corporate bonds publicly issued in the U.S. domestic market with maturities of one to five years. You cannot invest directly in an index. |
Bond values fluctuate in response to the financial condition of individual issuers, general market and economic conditions, and changes in interest rates. Changes in market conditions and government policies may lead to periods of heightened volatility in the bond market and reduced liquidity for certain bonds held by the Fund. In general, when interest rates rise, bond values fall and investors may lose principal value. Interest rate changes and their impact on the Fund and its share price can be sudden and unpredictable. The use of derivatives may reduce returns and/or increase volatility. Securities issued by U.S. government agencies or government-sponsored entities may not be guaranteed by the U.S. Treasury. Certain investment strategies tend to increase the total risk of an investment (relative to the broader market). The Fund is exposed to mortgage- and asset-backed securities risk. The U.S. government guarantee applies to certain underlying securities and not to shares of the Fund. Consult the Fund’s prospectus for additional information on these and other risks.
| ‡ | CFA® and Chartered Financial Analyst® are trademarks owned by CFA Institute. |
6 | Wells Fargo Short-Term High Yield Bond Fund
Performance highlights (unaudited)
| Ten largest holdings (%) as of February 28, 20211 |
| Magellan Health Incorporated, 4.90%, 9-22-2024 | 1.71 |
| TerraForm Power Operating LLC, 4.25%, 1-31-2023 | 1.53 |
| EnLink Midstream Partners LP, 4.15%, 6-1-2025 | 1.49 |
| Plastipak Holdings Incorporated, 6.25%, 10-15-2025 | 1.44 |
| Air Canada Company, 7.75%, 4-15-2021 | 1.40 |
| Live Nation Entertainment Incorporated, 4.88%, 11-1-2024 | 1.36 |
| Fortress Transportation & Infrastructure Investors LLC, 6.50%, 10-1-2025 | 1.28 |
| Nordstrom Incorporated, 8.75%, 5-15-2025 | 1.26 |
| Alcoa Nederland Holding Company BV, 6.75%, 9-30-2024 | 1.26 |
| Rockies Express Pipeline LLC, 3.60%, 5-15-2025 | 1.25 |
| 1 | Figures represent the percentage of the Fund's net assets. Holdings are subject to change and may have changed since the date specified. |
| Credit quality as of February 28, 20211 |
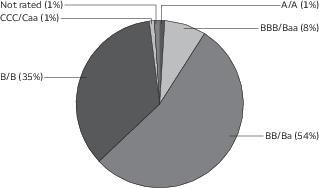
| 1 | The credit quality distribution of portfolio holdings reflected in the chart is based on ratings from Standard & Poor’s, Moody’s Investors Service, and/ or Fitch Ratings Ltd. Credit quality ratings apply to the underlying holdings of the Fund and not to the Fund itself. The percentages of the Fund’s portfolio with the ratings depicted in the chart are calculated based on the market value of fixed income securities held by the Fund. If a security was rated by all three rating agencies, the middle rating was utilized. If rated by two of the three rating agencies, the lower rating was utilized, and if rated by one of the rating agencies, that rating was utilized. Standard & Poor’s rates the creditworthiness of bonds, ranging from AAA (highest) to D (lowest). Ratings from A to CCC may be modified by the addition of a plus (+) or minus (-) sign to show relative standing within the rating categories. Standard & Poor’s rates the creditworthiness of short-term notes from SP-1 (highest) to SP-3 (lowest). Moody’s rates the creditworthiness of bonds, ranging from Aaa (highest) to C (lowest). Ratings Aa to B may be modified by the addition of a number 1 (highest) to 3 (lowest) to show relative standing within the ratings categories. Moody’s rates the creditworthiness of short-term U.S. tax-exempt municipal securities from MIG 1/VMIG 1 (highest) to SG (lowest). Fitch rates the creditworthiness of bonds, ranging from AAA (highest) to D (lowest). Credit quality distribution is subject to change and may have changed since the date specified. |
Wells Fargo Short-Term High Yield Bond Fund | 7
Fund expenses (unaudited)
As a shareholder of the Fund, you incur two types of costs: (1) transaction costs, including sales charges (loads) on purchase payments and contingent deferred sales charges (if any) on redemptions and (2) ongoing costs, including management fees, distribution (12b-1) and/or shareholder servicing fees, and other Fund expenses. This example is intended to help you understand your ongoing costs (in dollars) of investing in the Fund and to compare these costs with the ongoing costs of investing in other mutual funds.
The example is based on an investment of $1,000 invested at the beginning of the six-month period and held for the entire period from September 1, 2020 to February 28, 2021.
Actual expenses
The “Actual” line of the table below provides information about actual account values and actual expenses. You may use the information in this line, together with the amount you invested, to estimate the expenses that you paid over the period. Simply divide your account value by $1,000 (for example, an $8,600 account value divided by $1,000 = 8.6), then multiply the result by the number in the “Actual” line under the heading entitled “Expenses paid during period” for your applicable class of shares to estimate the expenses you paid on your account during this period.
Hypothetical example for comparison purposes
The “Hypothetical” line of the table below provides information about hypothetical account values and hypothetical expenses based on the Fund’s actual expense ratio and an assumed rate of return of 5% per year before expenses, which is not the Fund’s actual return. The hypothetical account values and expenses may not be used to estimate the actual ending account balance or expenses you paid for the period. You may use this information to compare the ongoing costs of investing in the Fund and other funds. To do so, compare this 5% hypothetical example with the 5% hypothetical examples that appear in the shareholder reports of the other funds.
Please note that the expenses shown in the table are meant to highlight your ongoing costs only and do not reflect any transactional costs, such as sales charges (loads) and contingent deferred sales charges. Therefore, the “Hypothetical” line of the table is useful in comparing ongoing costs only and will not help you determine the relative total costs of owning different funds. In addition, if these transactional costs were included, your costs would have been higher.
| | Beginning
account value
9-1-2020 | Ending
account value
2-28-2021 | Expenses
paid during
the period1 | Annualized net
expense ratio |
| Class A | | | | |
| Actual | $1,000.00 | $1,035.72 | $4.04 | 0.80% |
| Hypothetical (5% return before expenses) | $1,000.00 | $1,020.83 | $4.01 | 0.80% |
| Class C | | | | |
| Actual | $1,000.00 | $1,031.84 | $7.86 | 1.56% |
| Hypothetical (5% return before expenses) | $1,000.00 | $1,017.06 | $7.80 | 1.56% |
| Administrator Class | | | | |
| Actual | $1,000.00 | $1,036.51 | $3.28 | 0.65% |
| Hypothetical (5% return before expenses) | $1,000.00 | $1,021.57 | $3.26 | 0.65% |
| Institutional Class | | | | |
| Actual | $1,000.00 | $1,037.29 | $2.53 | 0.50% |
| Hypothetical (5% return before expenses) | $1,000.00 | $1,022.32 | $2.51 | 0.50% |
1 Expenses paid is equal to the annualized net expense ratio of each class multiplied by the average account value over the period, multiplied by the number of days in the most recent fiscal half-year divided by the number of days in the fiscal year (to reflect the one-half-year period).
8 | Wells Fargo Short-Term High Yield Bond Fund
Portfolio of investments—February 28, 2021 (unaudited)
| | | Interest
rate | Maturity
date | Principal | Value |
| Corporate bonds and notes: 68.31% | | | | | |
| Communication services: 7.03% | | | | | |
| Diversified telecommunication services: 2.24% | | | | | |
| CenturyLink Incorporated | | 6.75% | 12-1-2023 | $ 7,000,000 | $ 7,770,000 |
| CommScope Holding Company Incorporated 144A | | 5.50 | 3-1-2024 | 3,370,000 | 3,458,463 |
| Level 3 Financing Incorporated 144A | | 4.63 | 9-15-2027 | 525,000 | 543,218 |
| Level 3 Financing Incorporated | | 5.38 | 5-1-2025 | 3,515,000 | 3,606,390 |
| Lumen Technologies Incorporated | | 7.50 | 4-1-2024 | 3,915,000 | 4,394,588 |
| | | | | | 19,772,659 |
| Entertainment: 1.46% | | | | | |
| Live Nation Entertainment Incorporated 144A | | 4.88 | 11-1-2024 | 11,890,000 | 12,025,308 |
| Live Nation Entertainment Incorporated 144A | | 6.50 | 5-15-2027 | 805,000 | 888,559 |
| | | | | | 12,913,867 |
| Media: 2.80% | | | | | |
| Cinemark USA Incorporated 144A | | 8.75 | 5-1-2025 | 5,635,000 | 6,128,063 |
| CSC Holdings LLC 144A | | 5.50 | 4-15-2027 | 850,000 | 894,370 |
| DISH DBS Corporation | | 5.00 | 3-15-2023 | 4,150,000 | 4,274,500 |
| DISH DBS Corporation | | 5.88 | 7-15-2022 | 4,835,000 | 5,041,358 |
| Townsquare Media Incorporated 144A | | 6.88 | 2-1-2026 | 8,095,000 | 8,466,115 |
| | | | | | 24,804,406 |
| Wireless telecommunication services: 0.53% | | | | | |
| Sprint Corporation | | 7.88 | 9-15-2023 | 4,080,000 | 4,710,564 |
| Consumer discretionary: 14.03% | | | | | |
| Auto components: 1.75% | | | | | |
| Clarios Global LP 144A | | 6.75 | 5-15-2025 | 3,348,000 | 3,594,111 |
| Goodyear Tire & Rubber Company | | 5.00 | 5-31-2026 | 4,624,000 | 4,723,971 |
| Goodyear Tire & Rubber Company | | 5.13 | 11-15-2023 | 7,090,000 | 7,134,313 |
| | | | | | 15,452,395 |
| Automobiles: 1.75% | | | | | |
| Ford Motor Company | | 4.13 | 8-17-2027 | 4,600,000 | 4,841,500 |
| Ford Motor Company | | 8.50 | 4-21-2023 | 8,480,000 | 9,476,400 |
| Ford Motor Company | | 9.00 | 4-22-2025 | 975,000 | 1,179,531 |
| | | | | | 15,497,431 |
| Commercial services & supplies: 0.56% | | | | | |
| Aramark Services Incorporated 144A | | 6.38 | 5-1-2025 | 4,655,000 | 4,916,844 |
| Diversified consumer services: 0.05% | | | | | |
| Service Corporation International | | 8.00 | 11-15-2021 | 445,000 | 465,693 |
| Hotels, restaurants & leisure: 3.25% | | | | | |
| Carnival Corporation 144A | | 9.88 | 8-1-2027 | 400,000 | 460,032 |
| Carnival Corporation 144A | | 11.50 | 4-1-2023 | 5,745,000 | 6,550,449 |
| International Game Technology plc 144A | | 6.25 | 2-15-2022 | 3,781,000 | 3,851,894 |
| NCL Corporation Limited 144A | | 12.25 | 5-15-2024 | 5,160,000 | 6,133,950 |
| Royal Caribbean Cruises Limited 144A | | 9.13 | 6-15-2023 | 5,600,000 | 6,146,000 |
The accompanying notes are an integral part of these financial statements.
Wells Fargo Short-Term High Yield Bond Fund | 9
Portfolio of investments—February 28, 2021 (unaudited)
| | | Interest
rate | Maturity
date | Principal | Value |
| Hotels, restaurants & leisure (continued) | | | | | |
| Royal Caribbean Cruises Limited 144A | | 10.88% | 6-1-2023 | $ 425,000 | $ 481,451 |
| Royal Caribbean Cruises Limited 144A | | 11.50 | 6-1-2025 | 4,395,000 | 5,142,150 |
| | | | | | 28,765,926 |
| Household durables: 1.28% | | | | | |
| KB Home Class B | | 7.50 | 9-15-2022 | 8,055,000 | 8,739,675 |
| Newell Brands Incorporated | | 4.35 | 4-1-2023 | 2,429,000 | 2,553,486 |
| | | | | | 11,293,161 |
| Internet & direct marketing retail: 0.72% | | | | | |
| QVC Incorporated | | 4.38 | 3-15-2023 | 6,070,000 | 6,357,111 |
| Multiline retail: 2.81% | | | | | |
| Macy's Incorporated | | 3.63 | 6-1-2024 | 650,000 | 645,125 |
| Macy's Incorporated | | 4.38 | 9-1-2023 | 2,350,000 | 2,364,688 |
| Macy's Incorporated 144A | | 8.38 | 6-15-2025 | 9,720,000 | 10,740,600 |
| Nordstrom Incorporated 144A | | 8.75 | 5-15-2025 | 9,985,000 | 11,131,380 |
| | | | | | 24,881,793 |
| Specialty retail: 1.78% | | | | | |
| L Brands Incorporated | | 5.63 | 10-15-2023 | 1,520,000 | 1,645,400 |
| L Brands Incorporated 144A | | 9.38 | 7-1-2025 | 5,860,000 | 7,251,750 |
| Penske Automotive Group Incorporated | | 3.50 | 9-1-2025 | 275,000 | 280,500 |
| The Gap Incorporated 144A | | 8.63 | 5-15-2025 | 5,930,000 | 6,611,713 |
| | | | | | 15,789,363 |
| Textiles, apparel & luxury goods: 0.08% | | | | | |
| Levi Strauss & Company | | 5.00 | 5-1-2025 | 725,000 | 742,219 |
| Consumer staples: 0.17% | | | | | |
| Food products: 0.08% | | | | | |
| B&G Foods Incorporated | | 5.25 | 4-1-2025 | 700,000 | 717,780 |
| Personal products: 0.09% | | | | | |
| Edgewell Personal Care Company | | 4.70 | 5-24-2022 | 785,000 | 820,725 |
| Energy: 12.25% | | | | | |
| Energy equipment & services: 0.56% | | | | | |
| Oceaneering International Incorporated | | 4.65 | 11-15-2024 | 3,365,000 | 3,352,381 |
| USA Compression Partners LP | | 6.88 | 4-1-2026 | 275,000 | 283,938 |
| USA Compression Partners LP | | 6.88 | 9-1-2027 | 1,260,000 | 1,323,000 |
| | | | | | 4,959,319 |
| Oil, gas & consumable fuels: 11.69% | | | | | |
| Antero Midstream Company | | 5.38 | 9-15-2024 | 10,170,000 | 10,246,275 |
| Apache Corporation | | 4.63 | 11-15-2025 | 1,535,000 | 1,590,644 |
| Archrock Partners LP 144A | | 6.88 | 4-1-2027 | 250,000 | 263,805 |
| Buckeye Partners LP 144A | | 4.13 | 3-1-2025 | 1,360,000 | 1,384,650 |
| Buckeye Partners LP | | 4.15 | 7-1-2023 | 750,000 | 759,476 |
| Continental Resources Incorporated | | 4.50 | 4-15-2023 | 1,625,000 | 1,668,128 |
| Crestwood Midstream Partners LP | | 5.75 | 4-1-2025 | 4,265,000 | 4,288,671 |
| Crestwood Midstream Partners LP | | 6.25 | 4-1-2023 | 6,905,000 | 6,913,631 |
| DCP Midstream Operating LP | | 5.38 | 7-15-2025 | 8,640,000 | 9,210,586 |
| EnLink Midstream Partners LP | | 4.15 | 6-1-2025 | 13,245,000 | 13,145,663 |
The accompanying notes are an integral part of these financial statements.
10 | Wells Fargo Short-Term High Yield Bond Fund
Portfolio of investments—February 28, 2021 (unaudited)
| | | Interest
rate | Maturity
date | Principal | Value |
| Oil, gas & consumable fuels (continued) | | | | | |
| Enviva Partners LP 144A | | 6.50% | 1-15-2026 | $ 4,060,000 | $ 4,247,775 |
| EQT Corporation | | 7.63 | 2-1-2025 | 1,981,000 | 2,304,339 |
| Occidental Petroleum Corporation (3 Month LIBOR +1.45%)± | | 1.64 | 8-15-2022 | 3,215,000 | 3,142,663 |
| Occidental Petroleum Corporation | | 8.00 | 7-15-2025 | 7,165,000 | 8,315,878 |
| Ovintiv Exploration Incorporated | | 3.90 | 11-15-2021 | 3,520,000 | 3,555,376 |
| Ovintiv Exploration Incorporated | | 5.75 | 1-30-2022 | 2,055,000 | 2,121,912 |
| Rockies Express Pipeline LLC 144A | | 3.60 | 5-15-2025 | 10,825,000 | 11,041,500 |
| Suburban Propane Partners LP | | 5.50 | 6-1-2024 | 9,025,000 | 9,160,375 |
| Tallgrass Energy Partners LP 144A | | 5.50 | 9-15-2024 | 410,000 | 412,050 |
| Tallgrass Energy Partners LP 144A | | 7.50 | 10-1-2025 | 3,245,000 | 3,460,144 |
| Western Gas Partners LP | | 3.95 | 6-1-2025 | 1,500,000 | 1,515,000 |
| Western Gas Partners LP | | 4.00 | 7-1-2022 | 550,000 | 561,000 |
| Western Gas Partners LP | | 4.65 | 7-1-2026 | 4,000,000 | 4,140,880 |
| | | | | | 103,450,421 |
| Financials: 9.39% | | | | | |
| Capital markets: 0.86% | | | | | |
| Blue Cube Spinco Incorporated | | 10.00 | 10-15-2025 | 7,185,000 | 7,601,730 |
| Consumer finance: 2.91% | | | | | |
| Navient Corporation | | 7.25 | 9-25-2023 | 3,375,000 | 3,661,875 |
| SLM Corporation | | 5.50 | 1-25-2023 | 8,900,000 | 9,211,500 |
| Springleaf Finance Corporation | | 6.13 | 3-15-2024 | 2,500,000 | 2,682,825 |
| Springleaf Finance Corporation | | 7.13 | 3-15-2026 | 350,000 | 404,250 |
| Springleaf Finance Corporation | | 8.88 | 6-1-2025 | 8,948,000 | 9,830,273 |
| | | | | | 25,790,723 |
| Diversified financial services: 3.07% | | | | | |
| DAE Funding LLC 144A | | 5.25 | 11-15-2021 | 6,155,000 | 6,262,713 |
| DAE Funding LLC 144A | | 5.75 | 11-15-2023 | 6,350,000 | 6,532,563 |
| LPL Holdings Incorporated 144A | | 5.75 | 9-15-2025 | 8,045,000 | 8,287,959 |
| United Shore Financial Services LLC 144A | | 5.50 | 11-15-2025 | 5,850,000 | 6,127,875 |
| | | | | | 27,211,110 |
| Insurance: 0.14% | | | | | |
| Genworth Mortgage Holding 144A | | 6.50 | 8-15-2025 | 1,115,000 | 1,204,902 |
| Mortgage REITs: 1.16% | | | | | |
| Starwood Property Trust Incorporated | | 4.75 | 3-15-2025 | 6,520,000 | 6,664,581 |
| Starwood Property Trust Incorporated | | 5.00 | 12-15-2021 | 3,308,000 | 3,357,620 |
| Starwood Property Trust Incorporated 144A | | 5.50 | 11-1-2023 | 190,000 | 198,075 |
| | | | | | 10,220,276 |
| Thrifts & mortgage finance: 1.25% | | | | | |
| Ladder Capital Finance Holdings LP 144A | | 5.25 | 3-15-2022 | 10,983,000 | 11,037,915 |
| Health care: 4.93% | | | | | |
| Health care providers & services: 4.63% | | | | | |
| HealthSouth Corporation | | 5.13 | 3-15-2023 | 8,845,000 | 8,845,000 |
| Magellan Health Incorporated | | 4.90 | 9-22-2024 | 13,815,000 | 15,127,425 |
| Molina Healthcare Incorporated | | 5.38 | 11-15-2022 | 6,800,000 | 7,182,500 |
The accompanying notes are an integral part of these financial statements.
Wells Fargo Short-Term High Yield Bond Fund | 11
Portfolio of investments—February 28, 2021 (unaudited)
| | | Interest
rate | Maturity
date | Principal | Value |
| Health care providers & services (continued) | | | | | |
| Select Medical Corporation 144A | | 6.25% | 8-15-2026 | $ 3,040,000 | $ 3,252,800 |
| Tenet Healthcare Corporation | | 4.63 | 7-15-2024 | 6,485,000 | 6,582,275 |
| | | | | | 40,990,000 |
| Life sciences tools & services: 0.30% | | | | | |
| Charles River Laboratories Incorporated 144A | | 5.50 | 4-1-2026 | 2,550,000 | 2,658,375 |
| Industrials: 12.19% | | | | | |
| Aerospace & defense: 1.99% | | | | | |
| RBS Global & Rexnord LLC 144A | | 4.88 | 12-15-2025 | 1,000,000 | 1,026,250 |
| Spirit AeroSystems Holdings Incorporated 144A | | 5.50 | 1-15-2025 | 10,548,000 | 10,966,967 |
| TransDigm Incorporated 144A | | 8.00 | 12-15-2025 | 5,000,000 | 5,443,750 |
| TransDigm Incorporated 144A | | 6.25 | 3-15-2026 | 150,000 | 158,084 |
| | | | | | 17,595,051 |
| Airlines: 3.54% | | | | | |
| American Airlines Group Company 144A | | 5.00 | 6-1-2022 | 5,330,000 | 5,136,788 |
| Delta Air Lines incorporated 144A | | 4.50 | 10-20-2025 | 5,065,000 | 5,409,697 |
| Delta Air Lines Incorporated 144A | | 7.00 | 5-1-2025 | 750,000 | 873,764 |
| Hawaiian Brand Intellectual Property Limited 144A | | 5.75 | 1-20-2026 | 6,345,000 | 6,655,524 |
| Mileage Plus Holdings LLC 144A | | 6.50 | 6-20-2027 | 4,625,000 | 5,052,813 |
| United Airlines Pass-Through Trust Certificates Series 2020-1 Class A | | 5.88 | 4-15-2029 | 6,040,357 | 6,785,820 |
| United Airlines Pass-Through Trust Certificates Series 2020-1 Class B | | 4.88 | 7-15-2027 | 1,405,000 | 1,454,175 |
| | | | | | 31,368,581 |
| Commercial services & supplies: 2.37% | | | | | |
| CoreCivic Incorporated | | 4.63 | 5-1-2023 | 6,812,000 | 6,590,610 |
| Covanta Holding Corporation | | 5.88 | 7-1-2025 | 1,575,000 | 1,626,518 |
| Plastipak Holdings Incorporated 144A | | 6.25 | 10-15-2025 | 12,427,000 | 12,768,743 |
| | | | | | 20,985,871 |
| Construction & engineering: 1.37% | | | | | |
| Great Lakes Dredge & Dock Corporation | | 8.00 | 5-15-2022 | 8,980,000 | 9,060,820 |
| Taylor Morrison Communities Incorporated 144A | | 5.88 | 4-15-2023 | 2,870,000 | 3,042,200 |
| | | | | | 12,103,020 |
| Electronic equipment, instruments & components: 0.16% | | | | | |
| Wesco Distribution Incorporated 144A | | 7.13 | 6-15-2025 | 1,285,000 | 1,390,531 |
| Machinery: 0.31% | | | | | |
| Stevens Holding Company Incorporated 144A | | 6.13 | 10-1-2026 | 175,000 | 188,344 |
| Trimas Corporation 144A | | 4.88 | 10-15-2025 | 2,490,000 | 2,539,800 |
| | | | | | 2,728,144 |
| Road & rail: 0.47% | | | | | |
| Uber Technologies Incorporated 144A | | 8.00 | 11-1-2026 | 3,890,000 | 4,202,562 |
| Trading companies & distributors: 1.98% | | | | | |
| Fortress Transportation & Infrastructure Investors LLC 144A | | 6.50 | 10-1-2025 | 10,936,000 | 11,377,869 |
| Fortress Transportation & Infrastructure Investors LLC 144A | | 6.75 | 3-15-2022 | 6,163,000 | 6,160,350 |
| | | | | | 17,538,219 |
The accompanying notes are an integral part of these financial statements.
12 | Wells Fargo Short-Term High Yield Bond Fund
Portfolio of investments—February 28, 2021 (unaudited)
| | | Interest
rate | Maturity
date | Principal | Value |
| Information technology: 2.68% | | | | | |
| IT services: 1.61% | | | | | |
| Cardtronics Incorporated 144A | | 5.50% | 5-1-2025 | $ 8,624,000 | $ 8,904,280 |
| Sabre GLBL Incorporated 144A | | 9.25 | 4-15-2025 | 4,540,000 | 5,385,575 |
| | | | | | 14,289,855 |
| Software: 0.48% | | | | | |
| NortonLifeLock Incorporated 144A | | 5.00 | 4-15-2025 | 4,235,000 | 4,287,938 |
| Technology hardware, storage & peripherals: 0.59% | | | | | |
| Dell International LLC 144A | | 5.88 | 6-15-2021 | 635,000 | 635,000 |
| Dell International LLC 144A | | 7.13 | 6-15-2024 | 4,400,000 | 4,553,120 |
| | | | | | 5,188,120 |
| Materials: 2.10% | | | | | |
| Chemicals: 0.45% | | | | | |
| Kraton Polymers LLC 144A | | 4.25 | 12-15-2025 | 3,935,000 | 3,984,266 |
| Containers & packaging: 0.74% | | | | | |
| Sealed Air Corporation 144A | | 5.13 | 12-1-2024 | 1,330,000 | 1,454,688 |
| Sealed Air Corporation 144A | | 5.25 | 4-1-2023 | 4,835,000 | 5,103,343 |
| | | | | | 6,558,031 |
| Metals & mining: 0.91% | | | | | |
| Cleveland-Cliffs Incorporated 144A | | 6.75 | 3-15-2026 | 3,715,000 | 3,979,694 |
| Cleveland-Cliffs Incorporated 144A | | 9.88 | 10-17-2025 | 3,442,000 | 4,022,838 |
| | | | | | 8,002,532 |
| Real estate: 1.64% | | | | | |
| Equity REITs: 1.64% | | | | | |
| Service Properties Trust Company | | 4.35 | 10-1-2024 | 10,500,000 | 10,421,250 |
| Service Properties Trust Company | | 7.50 | 9-15-2025 | 3,580,000 | 4,071,020 |
| | | | | | 14,492,270 |
| Utilities: 1.90% | | | | | |
| Electric utilities: 0.31% | | | | | |
| NextEra Energy Operating Partners LP 144A | | 4.25 | 7-15-2024 | 2,575,000 | 2,723,063 |
| Independent power & renewable electricity producers: 1.59% | | | | | |
| NSG Holdings LLC 144A | | 7.75 | 12-15-2025 | 504,190 | 534,441 |
| TerraForm Power Operating LLC 144A | | 4.25 | 1-31-2023 | 13,268,000 | 13,533,362 |
| | | | | | 14,067,803 |
| Total Corporate bonds and notes (Cost $593,641,740) | | | | | 604,532,565 |
| | | | | Shares | |
| Exchange-traded funds: 0.91% | | | | | |
| PIMCO 0-5 Year High Yield Corporate Bond ETF | | | | 82,000 | 8,044,200 |
| Total Exchange-traded funds (Cost $8,043,118) | | | | | 8,044,200 |
The accompanying notes are an integral part of these financial statements.
Wells Fargo Short-Term High Yield Bond Fund | 13
Portfolio of investments—February 28, 2021 (unaudited)
| | | Interest
rate | Maturitydate | Principal | Value |
| Loans: 19.59% | | | | | |
| Communication services: 4.10% | | | | | |
| Media: 3.51% | | | | | |
| CSC Holdings LLC (1 Month LIBOR +2.25%)± | | 2.36% | 1-15-2026 | $ 2,425,500 | $ 2,409,904 |
| CSC Holdings LLC (1 Month LIBOR +2.50%)± | | 2.61 | 4-15-2027 | 10,815,126 | 10,769,487 |
| Diamond Sports Group LLC (1 Month LIBOR +3.25%)± | | 3.37 | 8-24-2026 | 8,723,744 | 6,542,808 |
| Hubbard Radio LLC (3 Month LIBOR +4.25%)ౠ| | 5.25 | 3-28-2025 | 830,000 | 821,700 |
| Nexstar Broadcasting Incorporated (1 Month LIBOR +2.75%)± | | 2.87 | 9-18-2026 | 5,875,000 | 5,880,523 |
| Virgin Media Bristol LLC (1 Month LIBOR +2.50%)± | | 2.61 | 1-31-2028 | 4,615,000 | 4,602,401 |
| | | | | | 31,026,823 |
| Wireless telecommunication services: 0.59% | | | | | |
| SBA Senior Finance II LLC (1 Month LIBOR +1.75%)± | | 1.87 | 4-11-2025 | 5,279,570 | 5,257,237 |
| Consumer discretionary: 1.19% | | | | | |
| Auto components: 0.44% | | | | | |
| Clarios Global LP (1 Month LIBOR +3.50%)144A± | | 3.61 | 4-30-2026 | 3,910,975 | 3,913,439 |
| Hotels, restaurants & leisure: 0.22% | | | | | |
| Carnival Corporation (1 Month LIBOR +7.50%)± | | 8.50 | 6-30-2025 | 1,213,900 | 1,258,414 |
| CCM Merger Incorporated (1 Month LIBOR +3.75%)± | | 4.50 | 11-4-2025 | 720,000 | 723,002 |
| | | | | | 1,981,416 |
| Specialty retail: 0.53% | | | | | |
| Rent-A-Center Incorporated (1 Month LIBOR +4.75%)ౠ| | 4.86 | 1-17-2028 | 1,595,000 | 1,604,969 |
| Sally Beauty Holdings Incorporated (1 Month LIBOR +2.25%)ౠ| | 2.37 | 7-5-2024 | 3,043,299 | 3,043,299 |
| | | | | | 4,648,268 |
| Energy: 0.90% | | | | | |
| Oil, gas & consumable fuels: 0.90% | | | | | |
| Apergy Corporation (3 Month LIBOR +5.00%)ౠ| | 6.00 | 6-3-2027 | 7,814,827 | 7,941,818 |
| Financials: 1.02% | | | | | |
| Diversified financial services: 1.02% | | | | | |
| Delos Finance SARL (3 Month LIBOR +1.75%)± | | 2.00 | 10-6-2023 | 6,905,500 | 6,903,014 |
| Russell Investments US Institutional Holdco Incorporated (5 Month LIBOR +3.00%)± | | 4.00 | 5-30-2025 | 2,145,000 | 2,149,033 |
| | | | | | 9,052,047 |
| Health care: 2.10% | | | | | |
| Health care providers & services: 1.01% | | | | | |
| Select Medical Corporation (6 Month LIBOR +2.25%)± | | 2.53 | 3-6-2025 | 5,319,589 | 5,302,991 |
| Surgery Center Holdings Incorporated (1 Month LIBOR +3.25%)± | | 4.25 | 9-3-2024 | 3,645,000 | 3,629,363 |
| | | | | | 8,932,354 |
The accompanying notes are an integral part of these financial statements.
14 | Wells Fargo Short-Term High Yield Bond Fund
Portfolio of investments—February 28, 2021 (unaudited)
| | | Interest
rate | Maturitydate | Principal | Value |
| Pharmaceuticals: 1.09% | | | | | |
| Endo Finance LLC (3 Month LIBOR +4.25%)± | | 5.00% | 4-29-2024 | $ 2,985,000 | $ 2,963,866 |
| Valeant Pharmaceuticals International Incorporated (1 Month LIBOR +3.00%)± | | 3.14 | 6-2-2025 | 6,646,901 | 6,652,750 |
| | | | | | 9,616,616 |
| Industrials: 5.61% | | | | | |
| Aerospace & defense: 0.80% | | | | | |
| Rexnord LLC (1 Month LIBOR +1.75%)± | | 1.86 | 8-21-2024 | 5,781,250 | 5,772,231 |
| Spirit AeroSystems Holdings Incorporated (1 Month LIBOR +5.25%)ౠ| | 6.00 | 1-15-2025 | 1,315,000 | 1,319,931 |
| | | | | | 7,092,162 |
| Airlines: 1.28% | | | | | |
| Mileage Plus Holdings LLC (3 Month LIBOR +5.25%)± | | 6.25 | 6-25-2027 | 5,085,000 | 5,422,186 |
| SkyMiles IP Limited (3 Month LIBOR +3.75%)± | | 4.75 | 10-20-2027 | 5,555,000 | 5,875,579 |
| | | | | | 11,297,765 |
| Commercial services & supplies: 1.83% | | | | | |
| Aramark Services Incorporated (1 Month LIBOR +1.75%)± | | 1.86 | 3-28-2024 | 3,736,782 | 3,707,822 |
| Aramark Services Incorporated (1 Month LIBOR +1.75%)± | | 1.86 | 3-11-2025 | 6,611,734 | 6,520,822 |
| GFL Environmental Incorporated (1 Month LIBOR +3.50%)± | | 4.00 | 5-30-2025 | 2,625,000 | 2,635,946 |
| KAR Auction Services Incorporated (1 Month LIBOR +2.25%)ౠ| | 2.38 | 9-19-2026 | 3,419,044 | 3,367,758 |
| | | | | | 16,232,348 |
| Construction & engineering: 0.05% | | | | | |
| Pike Corporation (1 Month LIBOR +3.00%)± | | 3.12 | 1-21-2028 | 241,610 | 241,535 |
| Pike Corporation (1 Month LIBOR +3.00%)± | | 3.12 | 1-21-2028 | 183,390 | 183,334 |
| | | | | | 424,869 |
| Machinery: 0.57% | | | | | |
| Alliance Laundry Systems LLC (3 Month LIBOR +3.50%)± | | 4.25 | 10-8-2027 | 720,000 | 722,059 |
| Columbus McKinnon Corporation (3 Month LIBOR +2.50%)ౠ| | 3.50 | 1-31-2024 | 4,271,094 | 4,273,785 |
| | | | | | 4,995,844 |
| Professional services: 0.20% | | | | | |
| The Dun & Bradstreet Corporation (1 Month LIBOR +3.25%)± | | 3.36 | 2-6-2026 | 1,800,465 | 1,802,715 |
| Road & rail: 0.88% | | | | | |
| Uber Technologies Incorporated (1 Month LIBOR +3.50%)± | | 3.61 | 2-16-2027 | 1,130,000 | 1,131,413 |
| Uber Technologies Incorporated (3 Month LIBOR +5.00%)± | | 5.00 | 4-4-2025 | 1,130,000 | 1,130,848 |
| Uber Technologies Incorporated (3 Month LIBOR +5.00%)± | | 5.00 | 4-4-2025 | 5,520,844 | 5,524,985 |
| | | | | | 7,787,246 |
| Information technology: 1.23% | | | | | |
| IT services: 0.28% | | | | | |
| Sabre GLBL Incorporated (1 Month LIBOR +4.00%)144A± | | 4.75 | 12-17-2027 | 2,485,000 | 2,511,416 |
| Semiconductors & semiconductor equipment: 0.95% | | | | | |
| ON Semiconductor Corporation (1 Month LIBOR +2.00%)± | | 2.10 | 9-19-2026 | 8,352,522 | 8,364,048 |
The accompanying notes are an integral part of these financial statements.
Wells Fargo Short-Term High Yield Bond Fund | 15
Portfolio of investments—February 28, 2021 (unaudited)
| | | Interest
rate | Maturitydate | Principal | Value |
| Materials: 3.01% | | | | | |
| Chemicals: 0.32% | | | | | |
| Ineos US Finance LLC (1 Month LIBOR +2.00%)± | | 2.11% | 4-1-2024 | $ 2,891,175 | $ 2,873,394 |
| Containers & packaging: 2.27% | | | | | |
| Flex Acquisition Company Incorporated (3 Month LIBOR +3.00%)± | | 3.23 | 12-29-2023 | 7,722,491 | 7,714,073 |
| Flex Acquisition Company Incorporated ± | | 4.00 | 2-23-2028 | 8,492,229 | 8,473,631 |
| Reynolds Group Holdings Incorporated (1 Month LIBOR +2.75%)± | | 2.86 | 2-5-2023 | 3,915,000 | 3,903,999 |
| | | | | | 20,091,703 |
| Paper & forest products: 0.42% | | | | | |
| Vertical US Newco Incorporated (6 Month LIBOR +4.25%)± | | 4.48 | 7-30-2027 | 3,690,750 | 3,719,353 |
| Utilities: 0.43% | | | | | |
| Electric utilities: 0.43% | | | | | |
| ExGen Renewables IV LLC (3 Month LIBOR +2.75%)± | | 3.75 | 12-15-2027 | 3,780,525 | 3,798,482 |
| Total Loans (Cost $174,955,186) | | | | | 173,361,363 |
| Non-agency mortgage-backed securities: 0.00% | | | | | |
| Salomon Brothers Mortgage Securities VII Series 1994-5 Class B2 ±± | | 3.26 | 4-25-2024 | 15,572 | 14,756 |
| Total Non-agency mortgage-backed securities (Cost $15,422) | | | | | 14,756 |
| Yankee corporate bonds and notes: 8.79% | | | | | |
| Communication services: 0.75% | | | | | |
| Media: 0.75% | | | | | |
| Nielsen Holding and Finance BV 144A | | 5.00 | 2-1-2025 | 2,485,000 | 2,546,814 |
| Nielsen Holding and Finance BV 144A | | 5.50 | 10-1-2021 | 2,400,000 | 2,406,000 |
| Virgin Media Telecommunications Company 144A | | 5.50 | 8-15-2026 | 1,650,000 | 1,717,856 |
| | | | | | 6,670,670 |
| Consumer discretionary: 0.11% | | | | | |
| Automobiles: 0.11% | | | | | |
| Stellantis NV | | 5.25 | 4-15-2023 | 896,000 | 972,563 |
| Consumer staples: 0.34% | | | | | |
| Food products: 0.34% | | | | | |
| Cooke Omega Investments Incorporated 144A | | 8.50 | 12-15-2022 | 2,950,000 | 3,031,125 |
| Energy: 2.31% | | | | | |
| Energy equipment & services: 1.26% | | | | | |
| Alcoa Nederland Holding Company BV 144A | | 6.75 | 9-30-2024 | 10,705,000 | 11,106,438 |
| Oil, gas & consumable fuels: 1.05% | | | | | |
| Northriver Midstream Finance LP 144A | | 5.63 | 2-15-2026 | 8,990,000 | 9,315,888 |
| Financials: 0.77% | | | | | |
| Diversified financial services: 0.77% | | | | | |
| DAE Funding LLC 144A | | 2.63 | 3-20-2025 | 6,710,000 | 6,795,217 |
The accompanying notes are an integral part of these financial statements.
16 | Wells Fargo Short-Term High Yield Bond Fund
Portfolio of investments—February 28, 2021 (unaudited)
| | | Interest
rate | Maturitydate | Principal | Value |
| Health care: 1.20% | | | | | |
| Pharmaceuticals: 1.20% | | | | | |
| Teva Pharmaceutical Finance BV | | 2.80% | 7-21-2023 | $ 7,735,000 | $ 7,580,300 |
| Teva Pharmaceutical Finance BV | | 3.65 | 11-10-2021 | 3,000,000 | 3,022,500 |
| | | | | | 10,602,800 |
| Industrials: 1.40% | | | | | |
| Airlines: 1.40% | | | | | |
| Air Canada Company 144A | | 7.75 | 4-15-2021 | 12,340,000 | 12,420,210 |
| Materials: 1.91% | | | | | |
| Chemicals: 1.07% | | | | | |
| Park Aerospace Holdings Company 144A | | 5.25 | 8-15-2022 | 5,690,000 | 5,948,456 |
| Park Aerospace Holdings Company 144A | | 5.50 | 2-15-2024 | 3,275,000 | 3,564,702 |
| | | | | | 9,513,158 |
| Metals & mining: 0.84% | | | | | |
| Constellium NV Company 144A | | 5.75 | 5-15-2024 | 3,000,000 | 3,041,250 |
| FMG Resources Proprietary Limited 144A | | 4.75 | 5-15-2022 | 4,254,000 | 4,365,668 |
| | | | | | 7,406,918 |
| Total Yankee corporate bonds and notes (Cost $75,775,237) | | | | | 77,834,987 |
| | | Yield | | Shares | |
| Short-term investments: 5.65% | | | | | |
| Investment companies: 5.65% | | | | | |
| Wells Fargo Government Money Market Fund Select Class ♠∞ | | 0.03 | | 50,036,510 | 50,036,510 |
| Total Short-term investments (Cost $50,036,510) | | | | | 50,036,510 |
| Total investments in securities (Cost $902,467,213) | 103.25% | | | | 913,824,381 |
| Other assets and liabilities, net | (3.25) | | | | (28,783,100) |
| Total net assets | 100.00% | | | | $885,041,281 |
| 144A | The security may be resold in transactions exempt from registration, normally to qualified institutional buyers, pursuant to Rule 144A under the Securities Act of 1933. |
| ± | Variable rate investment. The rate shown is the rate in effect at period end. |
| ‡ | Security is valued using significant unobservable inputs. |
| ±± | The coupon of the security is adjusted based on the principal and interest payments received from the underlying pool of mortgages as well as the credit quality and the actual prepayment speed of the underlying mortgages. |
| ♠ | The issuer of the security is an affiliated person of the Fund as defined in the Investment Company Act of 1940. |
| ∞ | The rate represents the 7-day annualized yield at period end. |
| Abbreviations: |
| LIBOR | London Interbank Offered Rate |
| REIT | Real estate investment trust |
The accompanying notes are an integral part of these financial statements.
Wells Fargo Short-Term High Yield Bond Fund | 17
Portfolio of investments—February 28, 2021 (unaudited)
Investments in affiliates
An affiliated investment is an investment in which the Fund owns at least 5% of the outstanding voting shares of the issuer or as a result of other relationships, such as the Fund and the issuer having the same investment manager. Transactions with issuers that were either affiliated persons of the Fund at the beginning of the period or the end of the period were as follows:
| | Value,
beginning of
period | Purchases | Sales
proceeds | Net
realized
gains
(losses) | | Net
change in
unrealized
gains
(losses) | | Value,
end of
period | | % of
net
assets | Shares,
end
of period | Income
from
affiliated
securities |
| Short-term investments | | | | | | | | | | | | |
| Investment companies | | | | | | | | | | | | |
| Securities Lending Cash Investments LLC | $ 991,590 | $ 34,052,849 | $ (35,044,439) | $0 | | $0 | | $ 0 | | | 0 | $ 1,719# |
| Wells Fargo Government Money Market Fund Select Class | 13,625,847 | 317,286,627 | (280,875,964) | 0 | | 0 | | 50,036,510 | | | 50,036,510 | 6,843 |
| | | | | $0 | | $0 | | $50,036,510 | | 5.65% | | $8,562 |
| # | Amount shown represents income before fees and rebates. |
The accompanying notes are an integral part of these financial statements.
18 | Wells Fargo Short-Term High Yield Bond Fund
Statement of assets and liabilities—February 28, 2021 (unaudited)
| | |
| Assets | |
Investments in unaffiliated securities, at value (cost $852,430,703)
| $ 863,787,871 |
Investments in affiliated securites, at value (cost $50,036,510)
| 50,036,510 |
Cash
| 456 |
Receivable for interest
| 12,429,593 |
Receivable for investments sold
| 7,436,250 |
Receivable for Fund shares sold
| 2,156,065 |
Receivable for securities lending income, net
| 416 |
Prepaid expenses and other assets
| 8,201 |
Total assets
| 935,855,362 |
| Liabilities | |
Payable for investments purchased
| 48,261,420 |
Payable for Fund shares redeemed
| 1,784,175 |
Management fee payable
| 246,207 |
Dividends payable
| 227,816 |
Administration fees payable
| 62,749 |
Distribution fee payable
| 19,322 |
Trustees’ fees and expenses payable
| 2,220 |
Accrued expenses and other liabilities
| 210,172 |
Total liabilities
| 50,814,081 |
Total net assets
| $885,041,281 |
| Net assets consist of | |
Paid-in capital
| $ 918,193,357 |
Total distributable loss
| (33,152,076) |
Total net assets
| $885,041,281 |
| Computation of net asset value and offering price per share | |
Net assets – Class A
| $ 115,175,289 |
Shares outstanding – Class A1
| 13,993,051 |
Net asset value per share – Class A
| $8.23 |
Maximum offering price per share – Class A2
| $8.48 |
Net assets – Class C
| $ 32,970,186 |
Shares outstanding – Class C1
| 4,004,531 |
Net asset value per share – Class C
| $8.23 |
Net assets – Administrator Class
| $ 61,131,455 |
Shares outstanding – Administrator Class1
| 7,427,837 |
Net asset value per share – Administrator Class
| $8.23 |
Net assets – Institutional Class
| $ 675,764,351 |
Shares outstanding – Institutional Class1
| 82,219,878 |
Net asset value per share – Institutional Class
| $8.22 |
| 1 | The Fund has an unlimited number of authorized shares |
| 2 | Maximum offering price is computed as 100/97 of net asset value. On investments of $50,000 or more, the offering price is reduced. |
The accompanying notes are an integral part of these financial statements.
Wells Fargo Short-Term High Yield Bond Fund | 19
Statement of operations—six months ended February 28, 2021 (unaudited)
| | |
| Investment income | |
Interest
| $ 17,031,779 |
Income from affiliated securities
| 15,999 |
Total investment income
| 17,047,778 |
| Expenses | |
Management fee
| 1,884,124 |
| Administration fees | |
Class A
| 83,987 |
Class C
| 30,757 |
Administrator Class
| 27,613 |
Institutional Class
| 227,424 |
| Shareholder servicing fees | |
Class A
| 131,221 |
Class C
| 48,049 |
Administrator Class
| 69,022 |
| Distribution fee | |
Class C
| 144,133 |
Custody and accounting fees
| 42,613 |
Professional fees
| 27,097 |
Registration fees
| 36,709 |
Shareholder report expenses
| 26,721 |
Trustees’ fees and expenses
| 9,557 |
Other fees and expenses
| 12,014 |
Total expenses
| 2,801,041 |
| Less: Fee waivers and/or expense reimbursements | |
Fund-level
| (428,879) |
Class A
| (13,905) |
Class C
| (3,715) |
Administrator Class
| (32,034) |
Net expenses
| 2,322,508 |
Net investment income
| 14,725,270 |
| Realized and unrealized gains (losses) on investments | |
Net realized gains on investments
| 4,122,698 |
Net change in unrealized gains (losses) on investments
| 8,651,506 |
Net realized and unrealized gains (losses) on investments
| 12,774,204 |
Net increase in net assets resulting from operations
| $27,499,474 |
The accompanying notes are an integral part of these financial statements.
20 | Wells Fargo Short-Term High Yield Bond Fund
Statement of changes in net assets
| | |
| | Six months ended
February 28, 2021
(unaudited) | Year ended
August 31, 2020 |
| Operations | | | | |
Net investment income
| | $ 14,725,270 | | $ 28,030,698 |
Net realized gains (losses) on investments
| | 4,122,698 | | (8,783,213) |
Net change in unrealized gains (losses) on investments
| | 8,651,506 | | 719,608 |
Net increase in net assets resulting from operations
| | 27,499,474 | | 19,967,093 |
| Distributions to shareholders from | | | | |
| Net investment income and net realized gains | | | | |
Class A
| | (1,903,700) | | (3,365,905) |
Class C
| | (550,372) | | (1,320,606) |
Administrator Class
| | (1,043,556) | | (2,251,888) |
Institutional Class
| | (11,162,375) | | (22,262,821) |
Total distributions to shareholders
| | (14,660,003) | | (29,201,220) |
| Capital share transactions | Shares | | Shares | |
| Proceeds from shares sold | | | | |
Class A
| 3,222,474 | 26,322,521 | 3,568,287 | 28,517,927 |
Class C
| 200,396 | 1,637,446 | 467,805 | 3,751,623 |
Administrator Class
| 1,459,704 | 11,915,797 | 1,535,701 | 12,304,096 |
Institutional Class
| 27,454,164 | 224,843,430 | 31,620,693 | 251,527,794 |
| | | 264,719,194 | | 296,101,440 |
| Reinvestment of distributions | | | | |
Class A
| 222,770 | 1,817,742 | 403,131 | 3,208,961 |
Class C
| 67,347 | 548,430 | 161,523 | 1,286,290 |
Administrator Class
| 127,536 | 1,040,283 | 279,640 | 2,231,101 |
Institutional Class
| 1,199,105 | 9,772,683 | 2,252,068 | 17,917,547 |
| | | 13,179,138 | | 24,643,899 |
| Payment for shares redeemed | | | | |
Class A
| (1,565,664) | (12,787,574) | (4,836,165) | (37,567,439) |
Class C
| (1,956,403) | (15,928,928) | (2,263,342) | (17,866,207) |
Administrator Class
| (638,608) | (5,220,175) | (6,110,858) | (48,807,964) |
Institutional Class
| (15,023,597) | (122,261,098) | (52,343,372) | (408,601,197) |
| | | (156,197,775) | | (512,842,807) |
Net increase (decrease) in net assets resulting from capital share transactions
| | 121,700,557 | | (192,097,468) |
Total increase (decrease) in net assets
| | 134,540,028 | | (201,331,595) |
| Net assets | | | | |
Beginning of period
| | 750,501,253 | | 951,832,848 |
End of period
| | $ 885,041,281 | | $ 750,501,253 |
The accompanying notes are an integral part of these financial statements.
Wells Fargo Short-Term High Yield Bond Fund | 21
Financial highlights
(For a share outstanding throughout each period)
| | | Year ended August 31 |
| Class A | Six months ended
February 28, 2021
(unaudited) | 2020 | 2019 | 2018 | 2017 | 2016 |
Net asset value, beginning of period
| $8.09 | $8.07 | $7.99 | $8.07 | $8.10 | $8.07 |
Net investment income
| 0.15 | 0.26 | 0.25 | 0.24 | 0.23 | 0.24 |
Net realized and unrealized gains (losses) on investments
| 0.14 | 0.02 | 0.09 | (0.08) | (0.03) | 0.03 |
Total from investment operations
| 0.29 | 0.28 | 0.34 | 0.16 | 0.20 | 0.27 |
| Distributions to shareholders from | | | | | | |
Net investment income
| (0.15) | (0.26) | (0.26) | (0.24) | (0.23) | (0.24) |
Net asset value, end of period
| $8.23 | $8.09 | $8.07 | $7.99 | $8.07 | $8.10 |
Total return1
| 3.57% | 3.61% | 4.40% | 2.00% | 2.51% | 3.37% |
| Ratios to average net assets (annualized) | | | | | | |
Gross expenses
| 0.94% | 0.94% | 0.94% | 0.93% | 0.92% | 0.92% |
Net expenses
| 0.80% | 0.81% | 0.81% | 0.81% | 0.81% | 0.81% |
Net investment income
| 3.64% | 3.19% | 3.18% | 2.96% | 2.88% | 2.95% |
| Supplemental data | | | | | | |
Portfolio turnover rate
| 37% | 78% | 44% | 34% | 35% | 32% |
Net assets, end of period (000s omitted)
| $115,175 | $97,985 | $104,671 | $127,024 | $172,151 | $296,817 |
| 1 | Total return calculations do not include any sales charges. Returns for periods of less than one year are not annualized. |
The accompanying notes are an integral part of these financial statements.
22 | Wells Fargo Short-Term High Yield Bond Fund
Financial highlights
(For a share outstanding throughout each period)
| | | Year ended August 31 |
| Class C | Six months ended
February 28, 2021
(unaudited) | 2020 | 2019 | 2018 | 2017 | 2016 |
Net asset value, beginning of period
| $8.09 | $8.07 | $8.00 | $8.07 | $8.10 | $8.07 |
Net investment income
| 0.13 | 0.20 | 0.19 | 0.18 | 0.17 | 0.18 |
Net realized and unrealized gains (losses) on investments
| 0.13 | 0.02 | 0.08 | (0.07) | (0.03) | 0.03 |
Total from investment operations
| 0.26 | 0.22 | 0.27 | 0.11 | 0.14 | 0.21 |
| Distributions to shareholders from | | | | | | |
Net investment income
| (0.12) | (0.20) | (0.20) | 0.18 | (0.17) | (0.18) |
Net asset value, end of period
| $8.23 | $8.09 | $8.07 | $8.00 | $8.07 | $8.10 |
Total return1
| 3.18% | 2.84% | 3.49% | 1.36% | 1.75% | 2.60% |
| Ratios to average net assets (annualized) | | | | | | |
Gross expenses
| 1.69% | 1.69% | 1.69% | 1.68% | 1.67% | 1.67% |
Net expenses
| 1.56% | 1.56% | 1.56% | 1.56% | 1.56% | 1.56% |
Net investment income
| 2.88% | 2.43% | 2.43% | 2.21% | 2.11% | 2.20% |
| Supplemental data | | | | | | |
Portfolio turnover rate
| 37% | 78% | 44% | 34% | 35% | 32% |
Net assets, end of period (000s omitted)
| $32,970 | $46,066 | $59,113 | $77,169 | $111,268 | $123,745 |
| 1 | Total return calculations do not include any sales charges. Returns for periods of less than one year are not annualized. |
The accompanying notes are an integral part of these financial statements.
Wells Fargo Short-Term High Yield Bond Fund | 23
Financial highlights
(For a share outstanding throughout each period)
| | | Year ended August 31 |
| Administrator Class | Six months ended
February 28, 2021
(unaudited) | 2020 | 2019 | 2018 | 2017 | 2016 |
Net asset value, beginning of period
| $8.09 | $8.06 | $7.99 | $8.07 | $8.10 | $8.07 |
Net investment income
| 0.15 | 0.27 | 0.27 | 0.25 | 0.24 | 0.25 |
Net realized and unrealized gains (losses) on investments
| 0.14 | 0.03 | 0.08 | (0.08) | (0.03) | 0.03 |
Total from investment operations
| 0.29 | 0.30 | 0.35 | 0.17 | 0.21 | 0.28 |
| Distributions to shareholders from | | | | | | |
Net investment income
| (0.15) | (0.27) | (0.28) | (0.25) | (0.24) | (0.25) |
Net asset value, end of period
| $8.23 | $8.09 | $8.06 | $7.99 | $8.07 | $8.10 |
Total return1
| 3.65% | 3.90% | 4.44% | 2.16% | 2.68% | 3.54% |
| Ratios to average net assets (annualized) | | | | | | |
Gross expenses
| 0.88% | 0.88% | 0.87% | 0.86% | 0.86% | 0.86% |
Net expenses
| 0.65% | 0.65% | 0.65% | 0.65% | 0.65% | 0.65% |
Net investment income
| 3.80% | 3.29% | 3.34% | 3.13% | 3.03% | 3.11% |
| Supplemental data | | | | | | |
Portfolio turnover rate
| 37% | 78% | 44% | 34% | 35% | 32% |
Net assets, end of period (000s omitted)
| $61,131 | $52,406 | $86,892 | $102,673 | $134,070 | $274,878 |
| 1 | Returns for periods of less than one year are not annualized. |
The accompanying notes are an integral part of these financial statements.
24 | Wells Fargo Short-Term High Yield Bond Fund
Financial highlights
(For a share outstanding throughout each period)
| | | Year ended August 31 |
| Institutional Class | Six months ended
February 28, 2021
(unaudited) | 2020 | 2019 | 2018 | 2017 | 2016 |
Net asset value, beginning of period
| $8.08 | $8.05 | $7.98 | $8.06 | $8.09 | $8.06 |
Net investment income
| 0.15 | 0.29 | 0.28 | 0.27 | 0.25 | 0.26 |
Net realized and unrealized gains (losses) on investments
| 0.15 | 0.03 | 0.08 | (0.08) | (0.02) | 0.03 |
Total from investment operations
| 0.30 | 0.32 | 0.36 | 0.19 | 0.23 | 0.29 |
| Distributions to shareholders from | | | | | | |
Net investment income
| (0.16) | (0.29) | (0.29) | (0.27) | (0.26) | (0.26) |
Net asset value, end of period
| $8.22 | $8.08 | $8.05 | $7.98 | $8.06 | $8.09 |
Total return1
| 3.73% | 4.06% | 4.59% | 2.31% | 2.83% | 3.69% |
| Ratios to average net assets (annualized) | | | | | | |
Gross expenses
| 0.61% | 0.61% | 0.61% | 0.59% | 0.59% | 0.59% |
Net expenses
| 0.50% | 0.50% | 0.50% | 0.50% | 0.50% | 0.50% |
Net investment income
| 3.94% | 3.47% | 3.49% | 3.27% | 3.16% | 3.26% |
| Supplemental data | | | | | | |
Portfolio turnover rate
| 37% | 78% | 44% | 34% | 35% | 32% |
Net assets, end of period (000s omitted)
| $675,764 | $554,044 | $701,157 | $764,680 | $1,010,757 | $735,285 |
| 1 | Returns for periods of less than one year are not annualized. |
The accompanying notes are an integral part of these financial statements.
Wells Fargo Short-Term High Yield Bond Fund | 25
Notes to financial statements (unaudited)
1. ORGANIZATION
Wells Fargo Funds Trust (the “Trust”), a Delaware statutory trust organized on March 10, 1999, is an open-end management investment company registered under the Investment Company Act of 1940, as amended (the “1940 Act”). As an investment company, the Trust follows the accounting and reporting guidance in Financial Accounting Standards Board (“FASB”) Accounting Standards Codification Topic 946, Financial Services – Investment Companies. These financial statements report on the Wells Fargo Short-Term High Yield Bond Fund (the “Fund”) which is a diversified series of the Trust.
On February 23, 2021, Wells Fargo & Company announced that it has entered into a definitive agreement to sell Wells Fargo Asset Management (“WFAM”) to GTCR LLC and Reverence Capital Partners, L.P. WFAM is the trade name used by the asset management businesses of Wells Fargo & Company and includes Wells Fargo Funds Management, LLC, the investment manager to the Fund, Wells Capital Management Incorporated and Wells Fargo Asset Management (International) Limited, both registered investment advisers providing sub-advisory services to certain funds, and Wells Fargo Funds Distributor, LLC, the Fund's principal underwriter. As part of the transaction, Wells Fargo & Company will own a 9.9% equity interest and will continue to serve as an important client and distribution partner. The transaction is expected to close in the second half of 2021, subject to customary closing conditions.
Consummation of the transaction will result in the automatic termination of the Fund's investment management agreement and sub-advisory agreement. The Fund's Board of Trustees will be asked to approve new investment management arrangements with the new company. If approved by the Board, the new investment management arrangements with the new company will be presented to the shareholders of the Fund for approval, and, if approved by shareholders, would take effect upon the closing of the transaction. The transaction is expected to close in the second half of 2021, subject to customary closing conditions.
2. SIGNIFICANT ACCOUNTING POLICIES
The following significant accounting policies, which are consistently followed in the preparation of the financial statements of the Fund, are in conformity with U.S. generally accepted accounting principles which require management to make estimates and assumptions that affect the reported amounts of assets and liabilities, disclosure of contingent assets and liabilities at the date of the financial statements, and the reported amounts of income and expenses during the reporting period. Actual results could differ from those estimates.
Securities valuation
All investments are valued each business day as of the close of regular trading on the New York Stock Exchange (generally 4 p.m. Eastern Time), although the Fund may deviate from this calculation time under unusual or unexpected circumstances.
Debt securities are valued at the evaluated bid price provided by an independent pricing service (e.g. taking into account various factors, including yields, maturities, or credit ratings) or, if a reliable price is not available, the quoted bid price from an independent broker-dealer.
Equity securities that are listed on a foreign or domestic exchange or market are valued at the official closing price or, if none, the last sales price. If no sale occurs on the principal exchange or market that day, a fair value price will be determined in accordance with the Fund’s Valuation Procedures.
Investments in registered open-end investment companies are valued at net asset value. Interests in non-registered investment companies that are redeemable at net asset value are fair valued normally at net asset value.
Investments which are not valued using any of the methods discussed above are valued at their fair value, as determined in good faith by the Board of Trustees. The Board of Trustees has established a Valuation Committee comprised of the Trustees and has delegated to it the authority to take any actions regarding the valuation of portfolio securities that the Valuation Committee deems necessary or appropriate, including determining the fair value of portfolio securities, unless the determination has been delegated to the Wells Fargo Asset Management Pricing Committee at Wells Fargo Funds Management, LLC (“Funds Management”). The Board of Trustees retains the authority to make or ratify any valuation decisions or approve any changes to the Valuation Procedures as it deems appropriate. On a quarterly basis, the Board of Trustees receives reports on any valuation actions taken by the Valuation Committee or the Wells Fargo Asset Management Pricing Committee which may include items for ratification.
Securities lending
The Fund may lend its securities from time to time in order to earn additional income in the form of fees or interest on securities received as collateral or the investment of any cash received as collateral. When securities are on loan, the Fund receives interest or dividends on those securities. Cash collateral received in connection with its securities lending transactions
26 | Wells Fargo Short-Term High Yield Bond Fund
Notes to financial statements (unaudited)
is invested in Securities Lending Cash Investments, LLC (the “Securities Lending Fund”). Investments in Securities Lending Fund are valued at the evaluated bid price provided by an independent pricing service. Income earned from investment in the Securities Lending Fund (net of fees and rebates), if any, is included in income from affiliated securities on the Statement of Operations.
In a securities lending transaction, the net asset value of the Fund is affected by an increase or decrease in the value of the securities loaned and by an increase or decrease in the value of the instrument in which collateral is invested. The amount of securities lending activity undertaken by the Fund fluctuates from time to time. The Fund has the right under the lending agreement to recover the securities from the borrower on demand. In the event of default or bankruptcy by the borrower, the Fund may be prevented from recovering the loaned securities or gaining access to the collateral or may experience delays or costs in doing so. In such an event, the terms of the agreement allow the unaffiliated securities lending agent to use the collateral to purchase replacement securities on behalf of the Fund or pay the Fund the market value of the loaned securities. The Fund bears the risk of loss with respect to depreciation of its investment of the cash collateral.
Loans
The Fund may invest in direct debt instruments which are interests in amounts owed to lenders by corporate or other borrowers. The loans pay interest at rates which are periodically reset by reference to a base lending rate plus a spread. Investments in loans may be in the form of participations in loans or assignments of all or a portion of loans from third parties. When the Fund purchases participations, it generally has no rights to enforce compliance with the terms of the loan agreement with the borrower. As a result, the Fund assumes the credit risk of both the borrower and the lender that is selling the participation. When the Fund purchases assignments from lenders, it acquires direct rights against the borrower on the loan and may enforce compliance by the borrower with the terms of the loan agreement. Loans may include fully funded term loans or unfunded loan commitments, which are contractual obligations for future funding.
Security transactions and income recognition
Securities transactions are recorded on a trade date basis. Realized gains or losses are recorded on the basis of identified cost.
Interest income is accrued daily and bond discounts are accreted and premiums are amortized daily. To the extent debt obligations are placed on non-accrual status, any related interest income may be reduced by writing off interest receivables when the collection of all or a portion of interest has been determined to be doubtful based on consistently applied procedures and the fair value has decreased. If the issuer subsequently resumes interest payments or when the collectability of interest is reasonably assured, the debt obligation is removed from non-accrual status. Paydown gains and losses are included in interest income.
Income dividends and capital gain distributions from investment companies are recorded on the ex-dividend date. Capital gain distributions from investment companies are treated as realized gains.
Distributions to shareholders
Distributions to shareholders from net investment income are declared daily and paid monthly. Distributions from net realized gains, if any, are recorded on the ex-dividend date and paid at least annually. Such distributions are determined in accordance with income tax regulations and may differ from U.S. generally accepted accounting principles. Dividend sources are estimated at the time of declaration. The tax character of distributions is determined as of the Fund’s fiscal year end. Therefore, a portion of the Fund’s distributions made prior to the Fund’s fiscal year end may be categorized as a tax return of capital at year end.
Federal and other taxes
The Fund intends to continue to qualify as a regulated investment company by distributing substantially all of its investment company taxable income and any net realized capital gains (after reduction for capital loss carryforwards) sufficient to relieve it from all, or substantially all, federal income taxes. Accordingly, no provision for federal income taxes was required.
The Fund’s income and federal excise tax returns and all financial records supporting those returns for the prior three fiscal years are subject to examination by the federal and Delaware revenue authorities. Management has analyzed the Fund's tax positions taken on federal, state, and foreign tax returns for all open tax years and does not believe that there are any uncertain tax positions that require recognition of a tax liability.
Wells Fargo Short-Term High Yield Bond Fund | 27
Notes to financial statements (unaudited)
As of February 28, 2021, the aggregate cost of all investments for federal income tax purposes was $903,854,810 and the unrealized gains (losses) consisted of:
| Gross unrealized gains | $14,812,211 |
| Gross unrealized losses | (4,842,640) |
| Net unrealized gains | $ 9,969,571 |
As of August 31, 2020, the Fund had capital loss carryforwards which consisted of $15,482,218 in short-term capital losses and $31,825,898 in long-term capital losses.
Class allocations
The separate classes of shares offered by the Fund differ principally in applicable sales charges, distribution, shareholder servicing, and administration fees. Class specific expenses are charged directly to that share class. Investment income, common fund-level expenses, and realized and unrealized gains (losses) on investments are allocated daily to each class of shares based on the relative proportion of net assets of each class.
3. FAIR VALUATION MEASUREMENTS
Fair value measurements of investments are determined within a framework that has established a fair value hierarchy based upon the various data inputs utilized in determining the value of the Fund’s investments. The three-level hierarchy gives the highest priority to unadjusted quoted prices in active markets for identical assets or liabilities (Level 1) and the lowest priority to unobservable inputs (Level 3). The Fund’s investments are classified within the fair value hierarchy based on the lowest level of input that is significant to the fair value measurement. The inputs are summarized into three broad levels as follows:
| ■ | Level 1 – quoted prices in active markets for identical securities |
| ■ | Level 2 – other significant observable inputs (including quoted prices for similar securities, interest rates, prepayment speeds, credit risk, etc.) |
| ■ | Level 3 – significant unobservable inputs (including the Fund’s own assumptions in determining the fair value of investments) |
The inputs or methodologies used for valuing investments in securities are not necessarily an indication of the risk associated with investing in those securities.
The following is a summary of the inputs used in valuing the Fund’s assets and liabilities as of February 28, 2021:
| | Quoted prices
(Level 1) | Other significant
observable inputs
(Level 2) | Significant
unobservable inputs
(Level 3) | Total |
| Assets | | | | |
| Investments in: | | | | |
| Corporate bonds and notes | $ 0 | $ 604,532,565 | $ 0 | $ 604,532,565 |
| Exchange-traded funds | 8,044,200 | 0 | 0 | 8,044,200 |
| Loans | 0 | 150,988,103 | 22,373,260 | 173,361,363 |
| Non-agency mortgage-backed securities | 0 | 14,756 | 0 | 14,756 |
| Yankee corporate bonds and notes | 0 | 77,834,987 | 0 | 77,834,987 |
| Short-term investments | | | | |
| Investment companies | 50,036,510 | 0 | 0 | 50,036,510 |
| Total assets | $58,080,710 | $833,370,411 | $22,373,260 | $913,824,381 |
Additional sector, industry or geographic detail, if any, is included in the Portfolio of Investments.
28 | Wells Fargo Short-Term High Yield Bond Fund
Notes to financial statements (unaudited)
The following is a reconciliation of assets in which significant unobservable inputs (Level 3) were used in determining fair value:
| | Loans |
| Balance as of August 31, 2020 | $ 18,559,799 |
| Accrued discounts (premiums) | 6,157 |
| Realized gains (losses) | 796 |
| Change in unrealized gains (losses) | 302,514 |
| Purchases | 3,758,806 |
| Sales | (254,812) |
| Transfers into Level 3 | 0 |
| Transfers out of Level 3 | 0 |
| Balance as of February 28, 2021 | $22,373,260 |
| Change in unrealized gains (losses) relating to securities still held at February 28, 2021 | $ 306,628 |
The loan obligations in the Level 3 table were valued using indicative broker quotes. These indicative broker quotes are considered Level 3 inputs. Quantitative unobservable inputs used by the brokers are often proprietary and not provided to the Fund and therefore the disclosure that would address these inputs is not included above.
4. TRANSACTIONS WITH AFFILIATES
Management fee
Funds Management, an indirect wholly owned subsidiary of Wells Fargo & Company (“Wells Fargo”), is the manager of the Fund and provides advisory and fund-level administrative services under an investment management agreement. Under the investment management agreement, Funds Management is responsible for, among other services, implementing the investment objectives and strategies of the Fund, supervising the subadviser and providing fund-level administrative services in connection with the Fund’s operations. As compensation for its services under the investment management agreement, Funds Management is entitled to receive a management fee at the following annual rate based on the Fund’s average daily net assets:
| Average daily net assets | Management fee |
| First $500 million | 0.500% |
| Next $500 million | 0.475 |
| Next $2 billion | 0.450 |
| Next $2 billion | 0.425 |
| Next $5 billion | 0.390 |
| Over $10 billion | 0.380 |
For the six months ended February 28, 2021, the management fee was equivalent to an annual rate of 0.49% of the Fund’s average daily net assets.
Funds Management has retained the services of a subadviser to provide daily portfolio management to the Fund. The fee for subadvisory services is borne by Funds Management. Wells Capital Management Incorporated ("WellsCap"), an affiliate of Funds Management and an indirect wholly owned subsidiary of Wells Fargo, is the subadviser to the Fund and is entitled to receive a fee from Funds Management at an annual rate starting at 0.35% and declining to 0.20% as the average daily net assets of the Fund increase.
Wells Fargo Short-Term High Yield Bond Fund | 29
Notes to financial statements (unaudited)
Administration fees
Under a class-level administration agreement, Funds Management provides class-level administrative services to the Fund, which includes paying fees and expenses for services provided by the transfer agent, sub-transfer agents, omnibus account servicers and record-keepers. As compensation for its services under the class-level administration agreement, Funds Management receives an annual fee which is calculated based on the average daily net assets of each class as follows:
| | Class-level
administration fee |
| Class A | 0.16% |
| Class C | 0.16 |
| Administrator Class | 0.10 |
| Institutional Class | 0.08 |
Waivers and/or expense reimbursements
Funds Management has contractually waived and/or reimbursed management and administration fees to the extent necessary to maintain certain net operating expense ratios for the Fund. When each class of the Fund has exceeded its expense cap, Funds Management has waived fees and/or reimbursed expenses from fund-level expenses on a proportionate basis and then from class specific expenses. When only certain classes exceed their expense caps, waivers and/or reimbursements are applied against class specific expenses before fund-level expenses. Funds Management has committed through December 31, 2021 to waive fees and/or reimburse expenses to the extent necessary to cap expenses. Prior to or after the commitment expiration date, the cap may be increased or the commitment to maintain the cap may be terminated only with the approval of the Board of Trustees. The contractual expense caps are as follows:
| | Expense ratio caps |
| Class A | 0.81% |
| Class C | 1.56 |
| Administrator Class | 0.65 |
| Institutional Class | 0.50 |
Distribution fee
The Trust has adopted a distribution plan for Class C shares of the Fund pursuant to Rule 12b-1 under the 1940 Act. A distribution fee is charged charged to Class C shares and paid to Wells Fargo Funds Distributor, LLC (“Funds Distributor”), the principal underwriter, at an annual rate of 0.75% of the average daily net assets of Class C shares.
In addition, Funds Distributor is entitled to receive the front-end sales charge from the purchase of Class A shares and a contingent deferred sales charge on the redemption of certain Class A shares. Funds Distributor is also entitled to receive the contingent deferred sales charges from redemptions of Class C shares. For the six months ended February 28, 2021, Funds Distributor received $891 from the sale of Class A shares. No contingent deferred sales charges were incurred by Class A and Class C shares for the six months ended February 28, 2021.
Shareholder servicing fees
The Trust has entered into contracts with one or more shareholder servicing agents, whereby Class A, Class C, and Administrator Class of the Fund are charged a fee at an annual rate of 0.25% of the average daily net assets of each respective class. A portion of these total shareholder servicing fees were paid to affiliates of Wells Fargo.
Interfund transactions
The Fund may purchase or sell portfolio investment securities to certain other Wells Fargo affiliates pursuant to Rule 17a-7 under the 1940 Act and under procedures adopted by the Board of Trustees. The procedures have been designed to ensure that these interfund transactions, which do not incur broker commissions, are effected at current market prices. Pursuant to these procedures, the Fund had $59,929,036, $0 and $0 in interfund purchases, sales and net realized gains (losses), respectively, during the six months ended February 28, 2021.
30 | Wells Fargo Short-Term High Yield Bond Fund
Notes to financial statements (unaudited)
5. INVESTMENT PORTFOLIO TRANSACTIONS
Purchases and sales of investments, excluding U.S. government obligations (if any) and short-term securities, for the six months ended February 28, 2021 were $443,474,258 and $281,011,974, respectively.
6. SECURITIES LENDING TRANSACTIONS
The Fund lends its securities through an unaffiliated securities lending agent and receives collateral in the form of cash or securities with a value at least equal to the value of the securities on loan. The value of the loaned securities is determined at the close of each business day and any increases or decreases in the required collateral are exchanged between the Fund and the counterparty on the next business day. Cash collateral received is invested in the Securities Lending Fund which seeks to provide a positive return compared to the daily Federal Funds Open Rate by investing in high-quality, U.S. dollar-denominated short-term money market instruments and is exempt from registration under Section 3(c)(7) of the 1940 Act. Securities Lending Fund is managed by Funds Management and is subadvised by WellsCap. Funds Management receives an advisory fee starting at 0.05% and declining to 0.01% as the average daily net assets of the Securities Lending Fund increase. All of the fees received by Funds Management are paid to WellsCap for its services as subadviser.
In the event of counterparty default or the failure of a borrower to return a loaned security, the Fund has the right to use the collateral to offset any losses incurred. As of February 28, 2021, the Fund did not have any securities on loan.
7. BANK BORROWINGS
The Trust (excluding the money market funds), Wells Fargo Master Trust and Wells Fargo Variable Trust are parties to a $350,000,000 revolving credit agreement whereby the Fund is permitted to use bank borrowings for temporary or emergency purposes, such as to fund shareholder redemption requests. Interest under the credit agreement is charged to the Fund based on a borrowing rate equal to the higher of the Federal Funds rate in effect on that day plus 1.25% or the overnight LIBOR rate in effect on that day plus 1.25%. In addition, an annual commitment fee equal to 0.25% of the unused balance is allocated to each participating fund.
For the six months ended February 28, 2021, there were no borrowings by the Fund under the agreement.
8. INDEMNIFICATION
Under the Fund's organizational documents, the officers and Trustees have been granted certain indemnification rights against certain liabilities that may arise out of performance of their duties to the Fund. The Fund has entered into a separate agreement with each Trustee that converts indemnification rights currently existing under the Fund’s organizational documents into contractual rights that cannot be changed in the future without the consent of the Trustee. Additionally, in the normal course of business, the Fund may enter into contracts with service providers that contain a variety of indemnification clauses. The Fund’s maximum exposure under these arrangements is dependent on future claims that may be made against the Fund and, therefore, cannot be estimated.
9. CORONAVIRUS (COVID-19) PANDEMIC
On March 11, 2020, the World Health Organization announced that it had made the assessment that coronavirus disease 2019 (“COVID-19”) is a pandemic. The impacts of COVID-19 are affecting the entire global economy, individual companies and investment products, the funds, and the market in general. There is significant uncertainty around the extent and duration of business disruptions related to COVID-19 and the impacts may last for an extended period of time. COVID-19 has led to significant uncertainty and volatility in the financial markets.
Wells Fargo Short-Term High Yield Bond Fund | 31
Other information (unaudited)
PROXY VOTING INFORMATION
A description of the policies and procedures used to determine how to vote proxies relating to portfolio securities is available without charge, upon request, by calling 1-800-222-8222, visiting our website at wfam.com, or visiting the SEC website at sec.gov. Information regarding how the proxies related to portfolio securities were voted during the most recent 12-month period ended June 30 is available on the website at wfam.com or by visiting the SEC website at sec.gov.
QUARTERLY PORTFOLIO HOLDINGS INFORMATION
The Fund files its complete schedule of portfolio holdings with the SEC for the first and third quarters of each fiscal year as an exhibit to its reports on Form N-PORT. Shareholders may view the filed Form N-PORT by visiting the SEC website at sec.gov.
32 | Wells Fargo Short-Term High Yield Bond Fund
Other information (unaudited)
BOARD OF TRUSTEES AND OFFICERS
Each of the Trustees and Officers listed in the table below acts in identical capacities for each fund in the Wells Fargo family of funds, which consists of 144 mutual funds comprising the Wells Fargo Funds Trust, Wells Fargo Variable Trust, Wells Fargo Master Trust and four closed-end funds (collectively the “Fund Complex”). This table should be read in conjunction with the Prospectus and the Statement of Additional Information1. The mailing address of each Trustee and Officer is 525 Market Street, 12th Floor, San Francisco, CA 94105. Each Trustee and Officer serves an indefinite term, however, each Trustee serves such term until reaching the mandatory retirement age established by the Trustees.
Independent Trustees
Name and
year of birth | Position held and
length of service* | Principal occupations during past five years or longer | Current other
public company or
investment
company
directorships |
William R. Ebsworth
(Born 1957) | Trustee,
since 2015 | Retired. From 1984 to 2013, equities analyst, portfolio manager, research director and chief investment officer at Fidelity Management and Research Company in Boston, Tokyo, and Hong Kong, and retired in 2013 as Chief Investment Officer of Fidelity Strategic Advisers, Inc. where he led a team of investment professionals managing client assets. Prior thereto, Board member of Hong Kong Securities Clearing Co., Hong Kong Options Clearing Corp., the Thailand International Fund, Ltd., Fidelity Investments Life Insurance Company, and Empire Fidelity Investments Life Insurance Company. Audit Committee Chair and Investment Committee Chair of the Vincent Memorial Hospital Endowment (non-profit organization). Mr. Ebsworth is a CFA® charterholder. | N/A |
Jane A. Freeman
(Born 1953) | Trustee,
since 2015;
Chair Liaison,
since 2018 | Retired. From 2012 to 2014 and 1999 to 2008, Chief Financial Officer of Scientific Learning Corporation. From 2008 to 2012, Ms. Freeman provided consulting services related to strategic business projects. Prior to 1999, Portfolio Manager at Rockefeller & Co. and Scudder, Stevens & Clark. Board member of the Harding Loevner Funds from 1996 to 2014, serving as both Lead Independent Director and chair of the Audit Committee. Board member of the Russell Exchange Traded Funds Trust from 2011 to 2012 and the chair of the Audit Committee. Ms. Freeman is also an inactive Chartered Financial Analyst. | N/A |
Isaiah Harris, Jr.
(Born 1952) | Trustee,
since 2009; Audit
Committee
Chair,
since 2019 | Retired. Chairman of the Board of CIGNA Corporation since 2009, and Director since 2005. From 2003 to 2011, Director of Deluxe Corporation. Prior thereto, President and CEO of BellSouth Advertising and Publishing Corp. from 2005 to 2007, President and CEO of BellSouth Enterprises from 2004 to 2005 and President of BellSouth Consumer Services from 2000 to 2003. Emeritus member of the Iowa State University Foundation Board of Governors. Emeritus Member of the Advisory Board of Iowa State University School of Business. Advisory Board Member, Palm Harbor Academy (private school). Mr. Harris is a certified public accountant (inactive status). | CIGNA Corporation |
Judith M. Johnson
(Born 1949) | Trustee,
since 2008 | Retired. Prior thereto, Chief Executive Officer and Chief Investment Officer of Minneapolis Employees Retirement Fund from 1996 to 2008. Ms. Johnson is an attorney, certified public accountant and a certified managerial accountant. | N/A |
David F. Larcker
(Born 1950) | Trustee,
since 2009 | James Irvin Miller Professor of Accounting at the Graduate School of Business (Emeritus), Stanford University, Director of the Corporate Governance Research Initiative and Senior Faculty of The Rock Center for Corporate Governance since 2006. From 2005 to 2008, Professor of Accounting at the Graduate School of Business, Stanford University. Prior thereto, Ernst & Young Professor of Accounting at The Wharton School, University of Pennsylvania from 1985 to 2005. | N/A |
Wells Fargo Short-Term High Yield Bond Fund | 33
Other information (unaudited)
Name and
year of birth | Position held and
length of service* | Principal occupations during past five years or longer | Current other
public company or
investment
company
directorships |
Olivia S. Mitchell
(Born 1953) | Trustee,
since 2006;
Nominating and
Governance
Committee Chair,
since 2018 | International Foundation of Employee Benefit Plans Professor, Wharton School of the University of Pennsylvania since 1993. Director of Wharton’s Pension Research Council and Boettner Center on Pensions & Retirement Research, and Research Associate at the National Bureau of Economic Research. Previously, Cornell University Professor from 1978 to 1993. | N/A |
Timothy J. Penny
(Born 1951) | Trustee,
since 1996;
Chair,
since 2018 | President and Chief Executive Officer of Southern Minnesota Initiative Foundation, a non-profit organization, since 2007. Member of the Board of Trustees of NorthStar Education Finance, Inc., a non-profit organization, since 2007. | N/A |
James G. Polisson
(Born 1959) | Trustee,
since 2018 | Retired. Chief Marketing Officer, Source (ETF) UK Services, Ltd, from 2015 to 2017. From 2012 to 2015, Principal of The Polisson Group, LLC, a management consulting, corporate advisory and principal investing company. Chief Executive Officer and Managing Director at Russell Investments, Global Exchange Traded Funds from 2010 to 2012. Managing Director of Barclays Global Investors from 1998 to 2010 and Global Chief Marketing Officer for iShares and Barclays Global Investors from 2000 to 2010. Trustee of the San Francisco Mechanics’ Institute, a non-profit organization, from 2013 to 2015. Board member of the Russell Exchange Traded Fund Trust from 2011 to 2012. Director of Barclays Global Investors Holdings Deutschland GmbH from 2006 to 2009. Mr. Polisson is an attorney and has a retired status with the Massachusetts and District of Columbia Bar Associations. | N/A |
Pamela Wheelock
(Born 1959) | Trustee,
since January
2020; previously
Trustee from
January 2018 to
July 2019 | Board member of the Destination Medical Center Economic Development Agency, Rochester, Minnesota since 2019. Interim President of the McKnight Foundation from January to September 2020. Acting Commissioner, Minnesota Department of Human Services, July 2019 through September 2019. Human Services Manager (part-time), Minnesota Department of Human Services, October 2019 through December 2019. Chief Operating Officer, Twin Cities Habitat for Humanity from 2017 to 2019. Vice President of University Services, University of Minnesota from 2012 to 2016. Prior thereto, on the Board of Directors, Governance Committee and Finance Committee for the Minnesota Philanthropy Partners (Saint Paul Foundation) from 2012 to 2018, Interim Chief Executive Officer of Blue Cross Blue Shield of Minnesota from 2011 to 2012, Chairman of the Board from 2009 to 2012 and Board Director from 2003 to 2015. Vice President, Leadership and Community Engagement, Bush Foundation, Saint Paul, Minnesota (a private foundation) from 2009 to 2011. Executive Vice President and Chief Financial Officer, Minnesota Sports and Entertainment from 2004 to 2009 and Senior Vice President from 2002 to 2004. Executive Vice President of the Minnesota Wild Foundation from 2004 to 2008. Commissioner of Finance, State of Minnesota, from 1999 to 2002. Currently Board Chair of the Minnesota Wild Foundation since 2010. | N/A |
* Length of service dates reflect the Trustee’s commencement of service with the Trust’s predecessor entities, where applicable.
34 | Wells Fargo Short-Term High Yield Bond Fund
Other information (unaudited)
Officers
Name and
year of birth | Position held and
length of service | Principal occupations during past five years or longer |
Andrew Owen
(Born 1960) | President,
since 2017 | Executive Vice President of Wells Fargo & Company and Head of Affiliated Managers, Wells Fargo Asset Management, since 2014. In addition, Mr. Owen is currently President, Chief Executive Officer and Director of Wells Fargo Funds Management, LLC since 2017. Prior thereto, Executive Vice President responsible for marketing, investments and product development for Wells Fargo Funds Management, LLC, from 2009 to 2014. |
Jeremy DePalma
(Born 1974) | Treasurer,
since 2012
(for certain funds in
the Fund Complex);
since 2021 (for
the remaining funds in the
Fund Complex) | Senior Vice President of Wells Fargo Funds Management, LLC since 2009. Senior Vice President of Evergreen Investment Management Company, LLC from 2008 to 2010 and head of the Fund Reporting and Control Team within Fund Administration from 2005 to 2010. |
Michelle Rhee
(Born 1966) | Chief Legal Officer,
since 2019 | Secretary of Wells Fargo Funds Management, LLC and Chief Legal Counsel of Wells Fargo Asset Management since 2018. Deputy General Counsel of Wells Fargo Bank, N.A. since 2020 and Assistant General Counsel of Wells Fargo Bank, N.A. from 2018 to 2020. Associate General Counsel and Managing Director of Bank of America Corporation from 2004 to 2018. |
Catherine Kennedy
(Born 1969) | Secretary,
since 2019 | Vice President of Wells Fargo Funds Management, LLC and Senior Counsel of the Wells Fargo Legal Department since 2010. Vice President and Senior Counsel of Evergreen Investment Management Company, LLC from 1998 to 2010. |
Michael H. Whitaker
(Born 1967) | Chief Compliance Officer,
since 2016 | Chief Compliance Officer of Wells Fargo Asset Management since 2016. Senior Vice President and Chief Compliance Officer for Fidelity Investments from 2007 to 2016. |
1 The Statement of Additional Information includes additional information about the Trustees and is available, without charge, upon request, by calling 1-800-222-8222 or by visiting the website at wfam.com.
Wells Fargo Short-Term High Yield Bond Fund | 35
For more information
More information about Wells Fargo Funds is available free upon request. To obtain literature, please write, visit the Fund's website, or call:
Wells Fargo Funds
P.O. Box 219967
Kansas City, MO 64121-9967
Website: wfam.com
Individual investors: 1-800-222-8222
Retail investment professionals: 1-888-877-9275
Institutional investment professionals: 1-866-765-0778
This report and the financial statements contained herein are submitted for the general information of the shareholders of the Fund. If this report is used for promotional purposes, distribution of the report must be accompanied or preceded by a current prospectus. Before investing, please consider the investment objectives, risks, charges, and expenses of the investment. For a current prospectus and, if available, a summary prospectus, containing this information, call 1-800-222-8222 or visit the Fund's website at wfam.com. Read the prospectus carefully before you invest or send money.
Wells Fargo Asset Management (WFAM) is the trade name for certain investment advisory/management firms owned by Wells Fargo & Company. These firms include but are not limited to Wells Capital Management Incorporated and Wells Fargo Funds Management, LLC. Certain products managed by WFAM entities are distributed by Wells Fargo Funds Distributor, LLC (a broker-dealer and Member FINRA).
This material is for general informational and educational purposes only and is NOT intended to provide investment advice or a recommendation of any kind - including a recommendation for any specific investment, strategy, or plan.
INVESTMENT PRODUCTS: NOT FDIC INSURED ■ NO BANK GUARANTEE ■ MAY LOSE VALUE
© 2021 Wells Fargo & Company. All rights reserved.
PAR-0321-00297 04-21
SA222/SAR222 02-21
Semi-Annual Report
February 28, 2021
Wells Fargo
Ultra Short-Term Income Fund
Reduce clutter.
Save trees.
Sign up for electronic delivery of prospectuses and shareholder reports at wellsfargo.com/ advantagedelivery
The views expressed and any forward-looking statements are as of February 28, 2021, unless otherwise noted, and are those of the Fund's portfolio managers and/or Wells Fargo Asset Management. Discussions of individual securities or the markets generally are not intended as individual recommendations. Future events or results may vary significantly from those expressed in any forward-looking statements. The views expressed are subject to change at any time in response to changing circumstances in the market. Wells Fargo Asset Management and the Fund disclaim any obligation to publicly update or revise any views expressed or forward-looking statements.
INVESTMENT PRODUCTS: NOT FDIC INSURED ■ NO BANK GUARANTEE ■ MAY LOSE VALUE
Wells Fargo Ultra Short-Term Income Fund | 1
Letter to shareholders (unaudited)
Andrew Owen
President
Wells Fargo Funds
Dear Shareholder:
We are pleased to offer you this semi-annual report for the Wells Fargo Ultra Short-Term Income Fund for the six-month period that ended February 28, 2021. Global stocks showed robust returns, as the global economy began emerging from the haze of COVID-19. Tailwinds were provided by global stimulus programs, a rapid vaccination rollout, and recovering consumer and corporate sentiment. Bonds also had positive returns, led by high-yield bonds.
For the six-month period, U.S. stocks, based on the S&P 500 Index,1 gained 9.74%. International stocks, as measured by the MSCI ACWI ex USA Index (Net),2 returned 16.65%, while the MSCI EM Index (Net),3 had even stronger performance, with a 22.32% gain. Among bond indexes, the Bloomberg Barclays U.S. Aggregate Bond Index,4 returned (1.55)%, the Bloomberg Barclays Global Aggregate ex-USD Index (unhedged),5 gained 1.41%, and the Bloomberg Barclays Municipal Bond Index,6 returned 0.86% while the ICE BofA U.S. High Yield Index,7 gained 6.14%.
Hope drove the stock markets to new highs.
Stocks grew more volatile in September on mixed economic data. U.S. economic activity continued to grow. However, U.S. unemployment remained elevated at 7.9% in September. With U.S. Congress delaying further fiscal relief and uncertainties surrounding a possible vaccine, doubts crept back into the financial markets. In the U.K., a lack of progress in Brexit talks weighed on markets. China’s economy picked up steam, fueled by increased global demand.
In October, capital markets stepped back from their six-month rally. Market volatility rose in advance of the U.S. election and amid a global increase in COVID-19 infections. Europe introduced tighter restrictions affecting economic activity. U.S. markets looked favorably at the prospect of Democratic control of the federal purse strings, which could lead to additional fiscal stimulus and a boost to economic activity. Meanwhile, China reported 4.9% third-quarter gross domestic product growth.
| 1 | The S&P 500 Index consists of 500 stocks chosen for market size, liquidity, and industry group representation. It is a market-value-weighted index with each stock's weight in the index proportionate to its market value. You cannot invest directly in an index. |
| 2 | The Morgan Stanley Capital International (MSCI) All Country World Index (ACWI) ex USA Index (Net) is a free-float-adjusted market-capitalization-weighted index that is designed to measure the equity market performance of developed and emerging markets, excluding the United States. Source: MSCI. MSCI makes no express or implied warranties or representations and shall have no liability whatsoever with respect to any MSCI data contained herein. The MSCI data may not be further redistributed or used as a basis for other indices or any securities or financial products. This report is not approved, reviewed, or produced by MSCI. You cannot invest directly in an index. |
| 1 | The S&P 500 Index consists of 500 stocks chosen for market size, liquidity, and industry group representation. It is a market-value-weighted index with each stock's weight in the index proportionate to its market value. You cannot invest directly in an index. |
| 3 | The MSCI Emerging Markets (EM) Index (Net) is a free-float-adjusted market-capitalization-weighted index that is designed to measure equity market performance of emerging markets. You cannot invest directly in an index. |
| 1 | The S&P 500 Index consists of 500 stocks chosen for market size, liquidity, and industry group representation. It is a market-value-weighted index with each stock's weight in the index proportionate to its market value. You cannot invest directly in an index. |
| 4 | The Bloomberg Barclays U.S. Aggregate Bond Index is a broad-based benchmark that measures the investment-grade, U.S. dollar-denominated, fixed-rate taxable bond market, including Treasuries, government-related and corporate securities, mortgage-backed securities (agency fixed-rate and hybrid adjustable-rate mortgage pass-throughs), asset-backed securities, and commercial mortgage-backed securities. You cannot invest directly in an index. |
| 1 | The S&P 500 Index consists of 500 stocks chosen for market size, liquidity, and industry group representation. It is a market-value-weighted index with each stock's weight in the index proportionate to its market value. You cannot invest directly in an index. |
| 5 | The Bloomberg Barclays Global Aggregate ex-USD Index (unhedged) is an unmanaged index that provides a broad-based measure of the global investment-grade fixed-income markets excluding the U.S. dollar-denominated debt market. You cannot invest directly in an index. |
| 1 | The S&P 500 Index consists of 500 stocks chosen for market size, liquidity, and industry group representation. It is a market-value-weighted index with each stock's weight in the index proportionate to its market value. You cannot invest directly in an index. |
| 6 | The Bloomberg Barclays Municipal Bond Index is an unmanaged index composed of long-term tax-exempt bonds with a minimum credit rating of Baa. You cannot invest directly in an index. |
| 1 | The S&P 500 Index consists of 500 stocks chosen for market size, liquidity, and industry group representation. It is a market-value-weighted index with each stock's weight in the index proportionate to its market value. You cannot invest directly in an index. |
| 7 | The ICE BofA U.S. High Yield Index is a market-capitalization-weighted index of domestic and Yankee high-yield bonds. The index tracks the performance of high-yield securities traded in the U.S. bond market. You cannot invest directly in an index. Copyright 2021. ICE Data Indices, LLC. All rights reserved. |
2 | Wells Fargo Ultra Short-Term Income Fund
Letter to shareholders (unaudited)
Global stocks rallied in November, propelled by optimism over three promising COVID-19 vaccines. Reversing recent trends, value stocks outperformed growth stocks and cyclical stocks outpaced technology stocks. However, U.S. unemployment remained elevated, with a net job loss of 10 million since February 2020. The eurozone services Purchasing Managers’ Index, a monthly survey of purchasing managers, contracted sharply while the region’s manufacturing activity grew. The U.S. election results added to the upbeat mood as investors anticipated more consistent policies in the new administration.
Financial markets ended the year with strength on high expectations for a rapid rollout of the COVID-19 vaccines, the successful passage of a $900 billion stimulus package, and rising expectations of additional economic support from a Democratic-led Congress. U.S. economic data were mixed with still-elevated unemployment and weak retail sales but growth in manufacturing output. In contrast, China’s economic expansion continued in both manufacturing and nonmanufacturing. U.S. COVID-19 infection rates continued to rise even as new state and local lockdown measures were implemented.
The year 2021 began with emerging market stocks leading all major asset classes in January, driven by China’s strong economic growth and a broad recovery in corporate earnings, which propelled China’s stock market higher. In the United States, positive news on vaccine trials and January's expansion in both the manufacturing and services sectors was offset by a weak December monthly jobs report. This was compounded by technical factors as some hedge funds were forced to sell stocks to protect themselves against a well-publicized short squeeze coordinated by a group of retail investors. Eurozone sentiment and economic growth were particularly weak, reflecting the impact of a new lockdown with stricter social distancing along with a slow vaccine rollout.
February saw major domestic equity indexes driven higher on the hope of a new stimulus bill, improving COVID-19 vaccination numbers, and the gradual reopening of the economy. Most S&P 500 companies reported better-than-expected earnings, with positive surprises coming from the financials, IT, health care, and materials sectors. Japan saw its economy strengthen as a result of strong export numbers. Meanwhile, crude oil prices continued their climb, rising more than 25% for the year. Domestic government bonds experienced a sharp sell-off in late February as markets priced in a more robust economic recovery and higher growth and inflation expectations.
Don’t let short-term uncertainty derail long-term investment goals.
Periods of investment uncertainty can present challenges, but experience has taught us that maintaining long-term investment goals can be an effective way to plan for the future. To help you create a sound strategy based on your personal goals and risk tolerance, Wells Fargo Funds offers more than 100 mutual funds spanning a wide range of asset classes and investment styles. Although diversification cannot guarantee an investment profit or prevent losses, we believe it can be an effective way to manage investment risk and potentially smooth out overall portfolio performance. We encourage investors to know their investments and to understand that appropriate levels of risk-taking may unlock opportunities.
Thank you for choosing to invest with Wells Fargo Funds. We appreciate your confidence in us and remain committed to helping you meet your financial needs.
Sincerely,
Andrew Owen
President
Wells Fargo Funds
“Global stocks rallied in November, propelled by optimism over three promising COVID-19 vaccines.”
“February saw major domestic equity indexes driven higher on the hope of a new stimulus bill, improving COVID-19 vaccination numbers, and the gradual reopening of the economy.”
For further information about your Fund, contact your investment professional, visit our website at wfam.com, or call us directly at 1-800-222-8222.
Wells Fargo Ultra Short-Term Income Fund | 3
Letter to shareholders (unaudited)
Preparing for LIBOR Transition
The global financial industry is preparing to transition away from the London Interbank Offered Rate (LIBOR), a key benchmark interest rate, to new alternative rates. LIBOR underpins more than $350 trillion of financial contracts. It is the benchmark rate for a wide spectrum of products ranging from residential mortgages to corporate bonds to derivatives. Regulators have called for a market-wide transition away from LIBOR to successor reference rates by the end of 2021 (extended through June 30, 2023 for most tenors of the U.S. dollar LIBOR), which requires proactive steps be taken by issuers, counterparties, and asset managers to identify impacted products and adopt new reference rates.
The Fund holds at least one security that uses LIBOR as a floating reference rate and has a maturity date after 12-31-2021.
Although the transition process away from LIBOR has become increasingly well-defined in advance of the anticipated discontinuation date, there remains uncertainty regarding the nature of successor reference rates, and any potential effects of the transition away from LIBOR on investment instruments that use it as a benchmark rate. The transition process may result in, among other things, increased volatility or illiquidity in markets for instruments that currently rely on LIBOR and could negatively impact the value of certain instruments held by the Fund.
Wells Fargo Asset Management is monitoring LIBOR exposure closely and has put resources and controls in place to manage this transition effectively. The Fund’s portfolio management team is evaluating LIBOR holdings to understand what happens to those securities when LIBOR ceases to exist, including examining security documentation to identify the presence or absence of fallback language identifying a replacement rate to LIBOR.
While the pace of transition away from LIBOR will differ by asset class and investment strategy, the portfolio management team will monitor market conditions for those holdings to identify and mitigate deterioration or volatility in pricing and liquidity and ensure appropriate actions are taken in a timely manner.
Further information regarding the potential risks associated with the discontinuation of LIBOR can be found in the Fund’s Statement of Additional Information.
4 | Wells Fargo Ultra Short-Term Income Fund
This page is intentionally left blank.
Performance highlights (unaudited)
| Investment objective | The Fund seeks current income consistent with capital preservation. |
| Manager | Wells Fargo Funds Management, LLC |
| Subadviser | Wells Capital Management Incorporated |
| Portfolio managers | Christopher Y. Kauffman, CFA®‡, Jay N. Mueller, CFA®‡, Michael J. Schueller, CFA®‡, Noah M. Wise, CFA®‡ |
| Average annual total returns (%) as of February 28, 2021 |
| | | Including sales charge | | Excluding sales charge | | Expense ratios1 (%) |
| | Inception date | 1 year | 5 year | 10 year | | 1 year | 5 year | 10 year | | Gross | Net 2 |
| Class A (SADAX) | 8-31-1999 | 0.08 | 1.56 | 1.05 | | 2.13 | 1.97 | 1.26 | | 0.71 | 0.52 |
| Class A2 (WUSNX)3 | 5-29-2020 | – | – | – | | 1.98 | 1.94 | 1.24 | | 0.71 | 0.52 |
| Class C (WUSTX) | 7-18-2008 | 0.35 | 1.21 | 0.50 | | 1.35 | 1.21 | 0.50 | | 1.46 | 1.27 |
| Administrator Class (WUSDX) | 4-8-2005 | – | – | – | | 2.16 | 2.10 | 1.39 | | 0.65 | 0.52 |
| Institutional Class (SADIX) | 8-31-1999 | – | – | – | | 2.39 | 2.29 | 1.59 | | 0.38 | 0.27 |
| Bloomberg Barclays Short-Term U.S.Government/Corporate Bond4 | – | – | – | – | | 0.90 | 1.53 | 0.91 | | – | – |
Figures quoted represent past performance, which is no guarantee of future results, and do not reflect taxes that a shareholder may pay on an investment in a fund. Investment return and principal value of an investment will fluctuate so that an investor’s shares, when redeemed, may be worth more or less than their original cost. Performance shown without sales charges would be lower if sales charges were reflected. Current performance may be lower or higher than the performance data quoted, which assumes the reinvestment of dividends and capital gains. Current month-end performance is available on the Fund’s website, wfam.com.
Index returns do not include transaction costs associated with buying and selling securities, any mutual fund fees or expenses, or any taxes. It is not possible to invest directly in an index.
For Class A shares, the maximum front-end sales charge is 2.00%. For Class C shares, the maximum contingent deferred sales charge is 1.00%. Performance including a contingent deferred sales charge assumes the sales charge for the corresponding time period. Class A2, Administrator Class, and Institutional Class shares are sold without a front-end sales charge or contingent deferred sales charge.
| 1 | Reflects the expense ratios as stated in the most recent prospectuses, which include the impact of 0.02% in acquired fund fees and expenses. The expense ratios shown are subject to change and may differ from the annualized expense ratios shown in the financial highlights of this report, which do not include acquired fund fees and expenses. |
| 2 | The manager has contractually committed through December 31, 2021, to waive fees and/or reimburse expenses to the extent necessary to cap total annual fund operating expenses after fee waivers at 0.50% for Class A, 0.50% for Class A2, 1.25% for Class C, 0.50% for Administrator Class and 0.25% for Institutional Class. Brokerage commissions, stamp duty fees, interest, taxes, acquired fund fees and expenses (if any), and extraordinary expenses are excluded from the expense caps. Prior to or after the commitment expiration date, the caps may be increased or the commitment to maintain the caps may be terminated only with the approval of the Board of Trustees. Without these caps, the Fund’s returns would have been lower. The expense ratio paid by an investor is the net expense ratio (the total annual fund operating expenses after fee waivers) as stated in the prospectuses. |
| 3 | Historical performance shown for the Class A2 shares prior to their inception reflects the performance of the Institutional Class shares, adjusted to reflect the higher expenses applicable to the Class A2 shares. |
| 4 | The Bloomberg Barclays Short-Term Government/Corporate Bond Index contains securities that have fallen out of the Bloomberg Barclays U.S. Government/Credit Bond Index because of the standard minimum one-year-to-maturity constraint. Securities in the Bloomberg Barclays Short-Term Government/Corporate Bond Index must have a maturity from 1 up to (but not including) 12 months. You cannot invest directly in an index. |
| ‡ | CFA® and Chartered Financial Analyst® are trademarks owned by CFA Institute. |
6 | Wells Fargo Ultra Short-Term Income Fund
Performance highlights (unaudited)
Bond values fluctuate in response to the financial condition of individual issuers, general market and economic conditions, and changes in interest rates. Changes in market conditions and government policies may lead to periods of heightened volatility in the bond market and reduced liquidity for certain bonds held by the Fund. In general, when interest rates rise, bond values fall and investors may lose principal value. Interest rate changes and their impact on the Fund and its share price can be sudden and unpredictable. Loans are subject to risks similar to those associated with other below-investment-grade bond investments, such as credit risk (for example, risk of issuer default), below-investment-grade bond risk (for example, risk of greater volatility in value), and risk that the loan may become illiquid or difficult to price. The use of derivatives may reduce returns and/or increase volatility. Foreign investments are especially volatile and can rise or fall dramatically due to differences in the political and economic conditions of the host country. These risks are generally intensified in emerging markets. Certain investment strategies tend to increase the total risk of an investment (relative to the broader market). The Fund is exposed to high-yield securities risk and mortgage- and asset-backed securities risk. Consult the Fund’s prospectus for additional information on these and other risks.
Wells Fargo Ultra Short-Term Income Fund | 7
Performance highlights (unaudited)
| Ten largest holdings (%) as of February 28, 20211 | |
| FNMA, 2.00%, 3-16-2036 | 4.19 |
| AID Iraq Government Bond , 2.15%, 1-18-2022 | 1.53 |
| iShares 0-5 Year High Yield Corporate Bond ETF | 1.41 |
| iShares Short-Term Corporate Bond ETF | 1.26 |
| SPDR Portfolio Short Term Corporate Bond ETF | 1.06 |
| SCF Equipment Trust LLC Series 2021-1A Class A2, 0.42%, 8-20-2026 | 0.88 |
| NextEra Energy Operating Partners LP, 0.45%, 2-22-2023 | 0.80 |
| NTT Finance Corporation , 0.37%, 3-3-2023 | 0.69 |
| Freedom Financial Trust Series 2021-1CP Class A , 0.66%, 3-20-2028 | 0.61 |
| PFS Financing Corporation Series 2020-E Class A, 1.00%, 10-15-2025 | 0.61 |
| 1 | Figures represent the percentage of the Fund's net assets. Holdings are subject to change and may have changed since the date specified. |
| Portfolio composition as of February 28, 20211 |
| 1 | Figures represent the percentage of the Fund's long-term investments. These amounts are subject to change and may have changed since the date specified. |
8 | Wells Fargo Ultra Short-Term Income Fund
Fund expenses (unaudited)
As a shareholder of the Fund, you incur two types of costs: (1) transaction costs, including sales charges (loads) on purchase payments and contingent deferred sales charges (if any) on redemptions and (2) ongoing costs, including management fees, distribution (12b-1) and/or shareholder servicing fees, and other Fund expenses. This example is intended to help you understand your ongoing costs (in dollars) of investing in the Fund and to compare these costs with the ongoing costs of investing in other mutual funds.
The example is based on an investment of $1,000 invested at the beginning of the six-month period and held for the entire period from September 1, 2020 to February 28, 2021.
Actual expenses
The “Actual” line of the table below provides information about actual account values and actual expenses. You may use the information in this line, together with the amount you invested, to estimate the expenses that you paid over the period. Simply divide your account value by $1,000 (for example, an $8,600 account value divided by $1,000 = 8.6), then multiply the result by the number in the “Actual” line under the heading entitled “Expenses paid during period” for your applicable class of shares to estimate the expenses you paid on your account during this period.
Hypothetical example for comparison purposes
The “Hypothetical” line of the table below provides information about hypothetical account values and hypothetical expenses based on the Fund’s actual expense ratio and an assumed rate of return of 5% per year before expenses, which is not the Fund’s actual return. The hypothetical account values and expenses may not be used to estimate the actual ending account balance or expenses you paid for the period. You may use this information to compare the ongoing costs of investing in the Fund and other funds. To do so, compare this 5% hypothetical example with the 5% hypothetical examples that appear in the shareholder reports of the other funds.
Please note that the expenses shown in the table are meant to highlight your ongoing costs only and do not reflect any transactional costs, such as sales charges (loads) and contingent deferred sales charges. Therefore, the “Hypothetical” line of the table is useful in comparing ongoing costs only and will not help you determine the relative total costs of owning different funds. In addition, if these transactional costs were included, your costs would have been higher.
| | Beginning
account value
9-1-2020 | Ending
account value
2-28-2021 | Expenses
paid during
the period1 | Annualized net
expense ratio |
| Class A | | | | |
| Actual | $1,000.00 | $1,007.59 | $2.39 | 0.48% |
| Hypothetical (5% return before expenses) | $1,000.00 | $1,022.41 | $2.41 | 0.48% |
| Class A2 | | | | |
| Actual | $1,000.00 | $1,012.24 | $2.49 | 0.50% |
| Hypothetical (5% return before expenses) | $1,000.00 | $1,022.32 | $2.51 | 0.50% |
| Class C | | | | |
| Actual | $1,000.00 | $1,003.77 | $6.21 | 1.25% |
| Hypothetical (5% return before expenses) | $1,000.00 | $1,018.60 | $6.26 | 1.25% |
| Administrator Class | | | | |
| Actual | $1,000.00 | $1,007.53 | $2.49 | 0.50% |
| Hypothetical (5% return before expenses) | $1,000.00 | $1,022.32 | $2.51 | 0.50% |
| Institutional Class | | | | |
| Actual | $1,000.00 | $1,008.76 | $1.25 | 0.25% |
| Hypothetical (5% return before expenses) | $1,000.00 | $1,023.55 | $1.25 | 0.25% |
1 Expenses paid is equal to the annualized net expense ratio of each class multiplied by the average account value over the period, multiplied by the number of days in the most recent fiscal half-year divided by the number of days in the fiscal year (to reflect the one-half-year period).
Wells Fargo Ultra Short-Term Income Fund | 9
Portfolio of investments—February 28, 2021 (unaudited)
| | | Interest
rate | Maturity
date | Principal | Value |
| Agency securities: 5.92% | | | | | |
| FHLMC (1 Year Treasury Constant Maturity+2.24%)± | | 2.53% | 4-1-2038 | $ 374,934 | $ 394,605 |
| FHLMC (1 Year Treasury Constant Maturity+2.25%)± | | 2.64 | 10-1-2038 | 431,846 | 435,434 |
| FHLMC (1 Year Treasury Constant Maturity+2.25%)± | | 2.67 | 6-1-2032 | 1,389 | 1,395 |
| FHLMC (1 Year Treasury Constant Maturity+2.25%)± | | 2.69 | 11-1-2035 | 1,131,592 | 1,205,964 |
| FHLMC (1 Year Treasury Constant Maturity+2.23%)± | | 2.74 | 3-1-2035 | 433,368 | 461,153 |
| FHLMC (1 Year Treasury Constant Maturity+2.40%)± | | 2.90 | 7-1-2029 | 504 | 504 |
| FHLMC (1 Year Treasury Constant Maturity+2.21%)± | | 3.58 | 5-1-2035 | 126,838 | 135,122 |
| FHLMC (1 Year Treasury Constant Maturity+2.25%)± | | 3.58 | 9-1-2038 | 959,213 | 1,015,575 |
| FHLMC (1 Year Treasury Constant Maturity+2.25%)± | | 3.75 | 4-1-2032 | 49,149 | 49,679 |
| FHLMC (1 Year Treasury Constant Maturity+0.00%)± | | 3.83 | 1-1-2029 | 26,724 | 26,695 |
| FHLMC | | 4.50 | 1-1-2022 | 66 | 69 |
| FHLMC | | 4.50 | 6-1-2024 | 422,081 | 443,611 |
| FHLMC | | 4.50 | 9-1-2026 | 664,180 | 698,171 |
| FHLMC | | 5.50 | 12-1-2022 | 141,233 | 145,771 |
| FHLMC | | 5.50 | 12-1-2023 | 145,343 | 151,363 |
| FHLMC | | 6.00 | 10-1-2021 | 39,094 | 39,363 |
| FHLMC | | 6.00 | 10-1-2021 | 42,793 | 43,124 |
| FHLMC | | 6.00 | 1-1-2024 | 96,722 | 99,296 |
| FHLMC | | 7.00 | 6-1-2031 | 185,106 | 209,576 |
| FHLMC | | 9.50 | 12-1-2022 | 104 | 104 |
| FHLMC | | 10.00 | 11-17-2021 | 262 | 264 |
| FHLMC Series 2611 Class HD | | 5.00 | 5-15-2023 | 190,335 | 197,384 |
| FHLMC Series 2649 Class WL | | 4.00 | 7-15-2023 | 173,481 | 175,209 |
| FHLMC Series 2704 Class BH | | 4.50 | 11-15-2023 | 144,474 | 149,038 |
| FHLMC Series 2881 Class AE | | 5.00 | 8-15-2034 | 95,568 | 98,795 |
| FHLMC Series 2953 Class LD | | 5.00 | 12-15-2034 | 70,072 | 72,399 |
| FHLMC Series 3609 Class LA | | 4.00 | 12-15-2024 | 64 | 65 |
| FHLMC Series 3888 Class NA | | 2.25 | 1-15-2040 | 394,004 | 397,678 |
| FHLMC Series 3924 Class MF (1 Month LIBOR+0.50%)± | | 0.61 | 9-15-2041 | 879,697 | 887,866 |
| FHLMC Series 4172 Class PB | | 1.50 | 7-15-2040 | 95,598 | 96,477 |
| FHLMC Series 4348 Class MH | | 3.00 | 6-15-2039 | 790,479 | 805,952 |
| FHLMC Series 4764 Class BA | | 4.00 | 6-15-2042 | 55,648 | 55,720 |
| FHLMC Series 4889 Class CD | | 3.00 | 4-15-2049 | 1,762,307 | 1,842,459 |
| FHLMC Series 4938 Class BF (1 Month LIBOR+0.50%)± | | 0.62 | 12-25-2049 | 5,744,489 | 5,792,011 |
| FHLMC Series KF15 Class A (1 Month LIBOR+0.67%)± | | 0.79 | 2-25-2023 | 382,577 | 382,286 |
| FHLMC Series QO04 Class AFL (12 Month Treasury Average+0.74%)± | | 1.12 | 5-25-2044 | 1,575,074 | 1,573,819 |
| FHLMC Series T-42 Class A6 | | 9.50 | 2-25-2042 | 495,814 | 627,275 |
| FNMA (6 Month LIBOR+1.38%)± | | 1.75 | 10-1-2031 | 41,956 | 42,258 |
| FNMA (6 Month LIBOR+1.51%)± | | 1.92 | 9-1-2037 | 229,703 | 238,065 |
| FNMA %% | | 2.00 | 1-25-2036 | 101,140,000 | 104,649,150 |
| FNMA (1 Year Treasury Constant Maturity+2.02%)± | | 2.19 | 12-1-2034 | 179,459 | 191,060 |
| FNMA (1 Year Treasury Constant Maturity+2.20%)± | | 2.32 | 11-1-2031 | 47,463 | 47,739 |
| FNMA (1 Year Treasury Constant Maturity+2.26%)± | | 2.38 | 11-1-2035 | 93,204 | 94,123 |
| FNMA (12 Month LIBOR+1.77%)± | | 2.56 | 7-1-2044 | 1,197,004 | 1,266,515 |
| FNMA (1 Year Treasury Constant Maturity+2.36%)± | | 2.62 | 11-1-2034 | 516,906 | 550,986 |
| FNMA (12 Month Treasury Average+2.06%)± | | 2.64 | 8-1-2045 | 216,321 | 225,756 |
| FNMA (1 Year Treasury Constant Maturity+2.20%)± | | 2.65 | 12-1-2040 | 2,095,794 | 2,225,146 |
| FNMA (1 Year Treasury Constant Maturity+2.25%)± | | 2.67 | 11-1-2038 | 531,579 | 567,358 |
| FNMA (1 Year Treasury Constant Maturity+2.31%)± | | 2.70 | 5-1-2036 | 269,472 | 287,132 |
| FNMA (1 Year Treasury Constant Maturity+2.22%)± | | 2.71 | 6-1-2034 | 632,477 | 643,492 |
| FNMA (1 Year Treasury Constant Maturity+2.22%)± | | 2.72 | 6-1-2032 | 64,971 | 65,304 |
| FNMA (1 Year Treasury Constant Maturity+2.26%)± | | 2.75 | 8-1-2036 | 1,120,372 | 1,192,444 |
| FNMA (1 Year Treasury Constant Maturity+2.24%)± | | 2.79 | 7-1-2038 | 1,603,207 | 1,707,528 |
The accompanying notes are an integral part of these financial statements.
10 | Wells Fargo Ultra Short-Term Income Fund
Portfolio of investments—February 28, 2021 (unaudited)
| | | Interest
rate | Maturity
date | Principal | Value |
| Agency securities (continued) | | | | | |
| FNMA (1 Year Treasury Constant Maturity+2.21%)± | | 2.94% | 10-1-2034 | $ 3,938 | $ 4,182 |
| FNMA (1 Year Treasury Constant Maturity+2.23%)± | | 2.94 | 12-1-2040 | 112,635 | 112,997 |
| FNMA (1 Year Treasury Constant Maturity+2.20%)± | | 3.06 | 9-1-2035 | 269,666 | 286,462 |
| FNMA (6 Month LIBOR+0.00%)± | | 4.23 | 4-1-2033 | 707 | 708 |
| FNMA | | 4.50 | 1-1-2027 | 887,224 | 943,013 |
| FNMA | | 5.00 | 5-1-2022 | 22,292 | 23,338 |
| FNMA | | 5.00 | 6-1-2024 | 741,629 | 777,260 |
| FNMA | | 6.00 | 4-1-2021 | 28 | 28 |
| FNMA | | 6.00 | 1-1-2023 | 335,036 | 345,339 |
| FNMA | | 6.50 | 8-1-2031 | 226,388 | 269,386 |
| FNMA | | 9.00 | 10-15-2021 | 26 | 26 |
| FNMA | | 9.00 | 6-1-2024 | 938 | 947 |
| FNMA Series 1991-132 Class Z | | 8.00 | 10-25-2021 | 3,291 | 3,346 |
| FNMA Series 1992-71 Class X | | 8.25 | 5-25-2022 | 4,662 | 4,831 |
| FNMA Series 2000-T6 Class A2 | | 9.50 | 11-25-2040 | 243,737 | 278,551 |
| FNMA Series 2001-T10 Class A3 | | 9.50 | 12-25-2041 | 376,858 | 453,208 |
| FNMA Series 2001-T12 Class A3 | | 9.50 | 8-25-2041 | 357,777 | 435,455 |
| FNMA Series 2002-T1 Class A4 | | 9.50 | 11-25-2031 | 425,487 | 524,325 |
| FNMA Series 2002-W04 Class A6 ±± | | 3.68 | 5-25-2042 | 424,275 | 448,155 |
| FNMA Series 2003-W11 Class A1 ±± | | 3.17 | 6-25-2033 | 10,930 | 11,112 |
| FNMA Series 2003-W3 Class 1A4 ±± | | 3.66 | 8-25-2042 | 24,322 | 25,895 |
| FNMA Series 2007-W2 Class 1A1 (1 Month LIBOR+0.32%)± | | 0.44 | 3-25-2037 | 246,455 | 247,586 |
| FNMA Series 2010-115 Class NC | | 2.75 | 1-25-2039 | 275,687 | 278,868 |
| FNMA Series 2010-25 Class ND | | 3.50 | 3-25-2025 | 286 | 281 |
| FNMA Series 2010-37 Class A1 | | 5.41 | 5-25-2035 | 2,422,989 | 2,540,589 |
| FNMA Series 2010-57 Class DQ | | 3.00 | 6-25-2025 | 73,910 | 75,275 |
| FNMA Series 2013-23 Class LF (1 Month LIBOR+0.35%)± | | 0.49 | 3-25-2043 | 4,458,642 | 4,485,018 |
| FNMA Series 2013-26 Class AK | | 2.50 | 11-25-2038 | 1,653,557 | 1,675,117 |
| FNMA Series 2014-19 Class HA | | 2.00 | 6-25-2040 | 452,508 | 461,311 |
| GNMA | | 7.00 | 6-15-2033 | 299,958 | 364,788 |
| Total Agency securities (Cost $147,645,699) | | | | | 147,782,724 |
| Asset-backed securities: 14.75% | | | | | |
| Ally Master Owner Trust Series 2018-4 Class A | | 3.30 | 7-17-2023 | 11,174,000 | 11,279,376 |
| American Credit Acceptance Receivables Trust Series 2017-2 Class E 144A | | 5.52 | 3-12-2024 | 4,600,000 | 4,609,307 |
| American Credit Acceptance Receivables Trust Series 2018-2 Class D 144A | | 4.07 | 7-10-2024 | 2,013,000 | 2,064,293 |
| American Credit Acceptance Receivables Trust Series 2019-1 Class C 144A | | 3.50 | 4-14-2025 | 2,547,921 | 2,586,634 |
| American Credit Acceptance Receivables Trust Series 2019-2 Class C 144A | | 3.17 | 6-12-2025 | 2,290,000 | 2,325,702 |
| American Credit Acceptance Receivables Trust Series 2019-3 Class C 144A | | 2.76 | 9-12-2025 | 1,227,000 | 1,247,597 |
| American Credit Acceptance Receivables Trust Series 2019-4 Class D 144A | | 2.97 | 12-12-2025 | 10,000,000 | 10,363,368 |
| Chesapeake Funding II LLC Series 2017-3A Class A1 144A | | 1.91 | 8-15-2029 | 360,759 | 361,166 |
| Chesapeake Funding II LLC Series 2018-3A Class A1 144A | | 3.39 | 1-15-2031 | 3,306,838 | 3,399,150 |
| CommonBond Student Loan Trust Series 2018-B-GS Class A1 144A | | 3.56 | 9-25-2045 | 4,962,557 | 5,152,316 |
| Conn's Receivables Funding LLC Series 2020-A Class A 144A | | 1.71 | 6-16-2025 | 4,156,623 | 4,168,432 |
| Consumer Loan Underlying Bond Series 2020-P1 Class A 144A | | 2.26 | 3-15-2028 | 1,900,255 | 1,913,930 |
The accompanying notes are an integral part of these financial statements.
Wells Fargo Ultra Short-Term Income Fund | 11
Portfolio of investments—February 28, 2021 (unaudited)
| | | Interest
rate | Maturity
date | Principal | Value |
| Asset-backed securities (continued) | | | | | |
| Credit Acceptance Auto Loan Series 2019-1A Class A 144A | | 3.33% | 2-15-2028 | $ 4,000,000 | $ 4,059,080 |
| Crossroads Asset Trust Series 2021-A Class A2 144A | | 0.82 | 3-20-2024 | 3,000,000 | 3,000,589 |
| Drive Auto Receivables Trust Series 2017-3 Class D 144A | | 3.53 | 12-15-2023 | 1,568,056 | 1,589,028 |
| Drive Auto Receivables Trust Series 2018-1 Class E 144A | | 5.09 | 6-16-2025 | 5,000,000 | 5,228,199 |
| Drive Auto Receivables Trust Series 2018-4 Class D | | 4.09 | 1-15-2026 | 12,295,000 | 12,729,652 |
| Drive Auto Receivables Trust Series 2019-2 Class C | | 3.42 | 6-16-2025 | 6,500,000 | 6,659,961 |
| DT Auto Owner Trust Series 2017 2A E 144A 144A | | 6.03 | 1-15-2024 | 12,038,515 | 12,214,713 |
| DT Auto Owner Trust Series 2017-3A Class D 144A | | 3.58 | 5-15-2023 | 491,068 | 492,686 |
| DT Auto Owner Trust Series 2017-4A Class D 144A | | 3.47 | 7-17-2023 | 569,444 | 570,939 |
| DT Auto Owner Trust Series 2018-2A Class D 144A | | 4.15 | 3-15-2024 | 4,500,000 | 4,596,344 |
| DT Auto Owner Trust Series 2018-3A Class D 144A | | 4.19 | 7-15-2024 | 5,700,000 | 5,909,586 |
| ECMC Group Student Loan Trust Series 2020-2A Class A (1 Month LIBOR+1.15%)144A± | | 1.27 | 11-25-2069 | 6,890,822 | 6,961,609 |
| Educational Services of America Incorporated Series 2015-2 Class A (1 Month LIBOR+1.00%)144A± | | 1.13 | 12-25-2056 | 663,166 | 670,022 |
| Enterprise Fleet Financing LLC Series 2019-3 Class A2 144A | | 2.06 | 5-20-2025 | 13,134,070 | 13,341,035 |
| Enterprise Fleet Financing LLC Series 2021-1 Class A2 144A | | 0.44 | 12-21-2026 | 9,000,000 | 8,993,092 |
| Exeter Automobile Receivables Trust Series 2016-3A Class D 144A | | 6.40 | 7-17-2023 | 7,500,000 | 7,618,119 |
| Exeter Automobile Receivables Trust Series 2019-2A Class C 144A | | 3.30 | 3-15-2024 | 5,023,000 | 5,109,215 |
| Exeter Automobile Receivables Trust Series 2019-3A Class C 144A | | 2.79 | 5-15-2024 | 8,375,000 | 8,540,853 |
| Exeter Automobile Receivables Trust Series 2020-2A Class A 144A | | 1.13 | 8-15-2023 | 7,347,212 | 7,365,452 |
| Finance of America HECM Buyout 2020 Series HB2 Class A7 144A±± | | 1.71 | 7-25-2030 | 4,982,911 | 5,016,263 |
| Flagship Credit Auto Trust Series 2018-4 Class A 144A | | 3.41 | 5-15-2023 | 413,459 | 416,082 |
| Flagship Credit Auto Trust Series 2019-2 Class A 144A | | 2.83 | 10-16-2023 | 1,310,602 | 1,324,946 |
| Flagship Credit Auto Trust Series 2019-4 Class A 144A | | 2.17 | 6-17-2024 | 3,671,847 | 3,718,012 |
| Ford Credit Auto Lease Trust Series 2018-B Class A4 | | 3.30 | 2-15-2022 | 962,826 | 964,363 |
| FREED ABS Trust Series 2018-2 Class B 144A | | 4.61 | 10-20-2025 | 5,996,434 | 6,063,856 |
| GLS Automobile Receivables Trust Series 2018-1A Class B 144A | | 3.52 | 8-15-2023 | 1,133,226 | 1,148,285 |
| GLS Automobile Receivables Trust Series 2019-1A Class B 144A | | 3.65 | 12-16-2024 | 6,650,000 | 6,752,965 |
| Hertz Vehicle Financing LLC Series 2016-2A Class A 144A | | 2.95 | 3-25-2022 | 1,113,243 | 1,119,130 |
| Hertz Vehicle Financing LLC Series 2017-2A Class A 144A | | 3.29 | 10-25-2023 | 408,387 | 410,583 |
| Hertz Vehicle Financing LLC Series 2018-1A Class A 144A | | 3.29 | 2-25-2024 | 442,260 | 444,611 |
| Hertz Vehicle Financing LLC Series 2018-1A Class B 144A | | 3.60 | 2-25-2024 | 11,600,000 | 11,644,909 |
| Hyundai Auto Lease Securitization Trust Series 2018-B Class A4 | | 3.29 | 1-15-2025 | 6,000,000 | 6,198,123 |
| Hyundai Auto Lease Securitization Trust Series 2019-A Class A3 144A | | 2.98 | 7-15-2022 | 2,401,007 | 2,412,175 |
| MFRA Trust Series 2020-NQM1 Class A1 144A±± | | 1.48 | 3-25-2065 | 4,026,436 | 4,069,273 |
| MMAF Equipment Finance LLC Series 2019-A Class A2 144A | | 2.84 | 1-10-2022 | 235,575 | 235,916 |
| Navient Student Loan Trust Series 2017-3A Class A3 (1 Month LIBOR+1.05%)144A± | | 1.17 | 7-26-2066 | 5,700,000 | 5,811,490 |
| Navient Student Loan Trust Series 2018-CA Class A2 144A | | 3.52 | 6-16-2042 | 2,184,679 | 2,233,066 |
| Neuberger Berman CLO Limited Series 2020-38A Class A (3 Month LIBOR+1.30%)144A± | | 1.52 | 10-20-2032 | 10,000,000 | 10,029,340 |
| Nissan Auto Lease Trust Series 2019-A Class A3 | | 2.76 | 3-15-2022 | 5,915,586 | 5,948,946 |
The accompanying notes are an integral part of these financial statements.
12 | Wells Fargo Ultra Short-Term Income Fund
Portfolio of investments—February 28, 2021 (unaudited)
| | | Interest
rate | Maturity
date | Principal | Value |
| Asset-backed securities (continued) | | | | | |
| Nissan Auto Lease Trust Series 2019-B Class A3 | | 2.27% | 7-15-2022 | $ 4,795,283 | $ 4,824,208 |
| Nissan Auto Lease Trust Series 2020-A Class A2A | | 1.80 | 5-16-2022 | 7,189,453 | 7,213,257 |
| Octane Receivables Trust Series 2020-1A Class A 144A | | 1.71 | 2-20-2025 | 6,943,553 | 7,010,083 |
| Ocwen Master Advance Receivable Trust Series 2020-T1 Class AT1 144A | | 1.28 | 8-15-2052 | 7,280,000 | 7,331,454 |
| Oscar US Funding Trust Series 2016-2A Class A4 144A | | 2.99 | 12-15-2023 | 948,789 | 950,985 |
| Oscar US Funding Trust Series 2021-1A Class A2 144A | | 0.40 | 3-11-2024 | 10,300,000 | 10,296,138 |
| Pagaya Al Debt Selection Trust Series 2020-3 Class A 144A | | 2.10 | 5-17-2027 | 1,875,891 | 1,875,474 |
| Santander Drive Auto Receivables Trust Series 2017-1 Class D | | 3.17 | 4-17-2023 | 3,065,722 | 3,085,778 |
| Santander Drive Auto Receivables Trust Series 2019-3 Class B | | 2.28 | 9-15-2023 | 1,102,000 | 1,107,496 |
| Santander Retail Auto Lease Trust Series 2019-A Class A4 144A | | 2.82 | 5-22-2023 | 12,200,000 | 12,431,807 |
| Santander Retail Auto Lease Trust Series 2019-C Class A2B (1 Month LIBOR+0.34%)144A± | | 0.45 | 9-20-2022 | 5,194,215 | 5,198,727 |
| SLC Student Loan Trust Series 2006-2 Class A5 (3 Month LIBOR+0.10%)± | | 0.32 | 9-15-2026 | 186,592 | 186,584 |
| SLM Student Loan Trust Series 2004-B Class A3 (3 Month LIBOR+0.33%)± | | 0.55 | 3-15-2024 | 9,840,650 | 9,822,688 |
| SLM Student Loan Trust Series 2011-2 Class A1 (1 Month LIBOR+0.60%)± | | 0.73 | 11-25-2027 | 464,218 | 464,416 |
| SLM Student Loan Trust Series 2012-3 Class A (1 Month LIBOR+0.65%)± | | 0.77 | 12-27-2038 | 4,010,837 | 3,988,449 |
| SLM Student Loan Trust Series 2013-1 Class A3 (1 Month LIBOR+0.55%)± | | 0.68 | 5-26-2055 | 4,297,388 | 4,247,783 |
| SLM Student Loan Trust Series 2014-A Class B 144A | | 3.50 | 11-15-2044 | 6,200,000 | 6,256,885 |
| SoFi Consumer Loan Program Trust Series 2016-5 Class B 144A±± | | 4.55 | 9-25-2028 | 2,256,207 | 2,281,234 |
| SoFi Consumer Loan Program Trust Series 2018-2 Class B 144A | | 3.79 | 4-26-2027 | 9,255,974 | 9,411,179 |
| SoFi Professional Loan Program LLC Series 2017-A Class A1 (1 Month LIBOR+0.70%)144A± | | 0.82 | 3-26-2040 | 1,669,635 | 1,670,505 |
| South Texas Higher Education Series 2012-1 Class A2 (3 Month LIBOR+0.85%)± | | 1.08 | 10-1-2024 | 751,283 | 751,951 |
| SpringCastle America Funding LLC 144A | | 1.97 | 9-25-2037 | 5,613,629 | 5,675,347 |
| Student Loan Consolidation Center Series 2011-1 Class A (1 Month LIBOR+1.22%)144A± | | 1.34 | 10-25-2027 | 1,834,810 | 1,845,874 |
| Tesla Auto Lease Trust Series 2018-B Class A 144A | | 3.71 | 8-20-2021 | 512,140 | 514,910 |
| Towd Point Asset Funding LLC Series 2019-HE1 Class A1 (1 Month LIBOR+0.90%)144A± | | 1.02 | 4-25-2048 | 1,825,009 | 1,831,656 |
| Towd Point Asset Trust Series 2018-SL1 Class A (1 Month LIBOR+0.60%)144A± | | 0.72 | 1-25-2046 | 2,566,235 | 2,549,542 |
| United Auto Credit Securitization Series 2018-2 Class E 144A | | 5.26 | 5-10-2023 | 5,000,000 | 5,031,900 |
| Westlake Automobile Receivables Trust Series 2018-2A Class D 144A | | 4.00 | 1-16-2024 | 1,650,000 | 1,676,812 |
| Westlake Automobile Receivables Trust Series 2018-3A Class C 144A | | 3.61 | 10-16-2023 | 5,231,935 | 5,271,610 |
| Westlake Automobile Receivables Trust Series 2019-2A Class A2A 144A | | 2.57 | 2-15-2023 | 1,887,521 | 1,894,129 |
| Wheels SPV LLC Series 2018-1A Class A2 144A | | 3.06 | 4-20-2027 | 97,166 | 97,422 |
| Total Asset-backed securities (Cost $367,192,646) | | | | | 367,880,062 |
The accompanying notes are an integral part of these financial statements.
Wells Fargo Ultra Short-Term Income Fund | 13
Portfolio of investments—February 28, 2021 (unaudited)
| | | Interest
rate | Maturity
date | Principal | Value |
| Corporate bonds and notes: 24.55% | | | | | |
| Communication services: 0.53% | | | | | |
| Media: 0.46% | | | | | |
| NBCUniversal Enterprise Incorporated 144A | | 5.25% | 12-31-2049 | $ 6,000,000 | $ 6,060,000 |
| QVC Incorporated | | 4.85 | 4-1-2024 | 5,000,000 | 5,362,500 |
| | | | | | 11,422,500 |
| Wireless telecommunication services: 0.07% | | | | | |
| Sprint Spectrum Company LLC 144A | | 3.36 | 3-20-2023 | 1,781,250 | 1,794,609 |
| Consumer discretionary: 1.59% | | | | | |
| Automobiles: 0.49% | | | | | |
| Ford Motor Company | | 8.50 | 4-21-2023 | 5,900,000 | 6,593,250 |
| General Motors Company | | 5.40 | 10-2-2023 | 5,000,000 | 5,573,719 |
| | | | | | 12,166,969 |
| Diversified consumer services: 0.02% | | | | | |
| Service Corporation International | | 8.00 | 11-15-2021 | 425,000 | 444,763 |
| Hotels, restaurants & leisure: 0.47% | | | | | |
| Las Vegas Sands Corporation | | 3.20 | 8-8-2024 | 11,100,000 | 11,653,387 |
| Household durables: 0.14% | | | | | |
| Lennar Corporation | | 6.25 | 12-15-2021 | 3,500,000 | 3,543,715 |
| Multiline retail: 0.24% | | | | | |
| Nordstrom Incorporated | | 4.00 | 10-15-2021 | 6,000,000 | 6,070,835 |
| Textiles, apparel & luxury goods: 0.23% | | | | | |
| Ralph Lauren Corporation | | 1.70 | 6-15-2022 | 3,190,000 | 3,245,348 |
| Tapestry Incorporated | | 3.00 | 7-15-2022 | 2,495,000 | 2,561,043 |
| | | | | | 5,806,391 |
| Consumer staples: 0.66% | | | | | |
| Food & staples retailing: 0.53% | | | | | |
| 7 Eleven Incorporated 144A | | 0.80 | 2-10-2024 | 8,310,000 | 8,317,006 |
| Cargill Incorporated 144A | | 0.40 | 2-2-2024 | 5,000,000 | 4,976,376 |
| | | | | | 13,293,382 |
| Food products: 0.13% | | | | | |
| Land O'Lakes Incorporated 144A | | 6.00 | 11-15-2022 | 3,000,000 | 3,203,271 |
| Energy: 2.75% | | | | | |
| Energy equipment & services: 0.50% | | | | | |
| Alexander Funding Trust 144A | | 1.84 | 11-15-2023 | 12,265,000 | 12,467,810 |
| Oil, gas & consumable fuels: 2.25% | | | | | |
| BP Capital Markets America Incorporated | | 2.94 | 4-6-2023 | 1,000,000 | 1,053,628 |
| DCP Midstream Operating LP 144A | | 4.75 | 9-30-2021 | 3,575,000 | 3,604,047 |
| Energy Transfer Partners LP | | 4.20 | 9-15-2023 | 4,866,000 | 5,240,604 |
| Energy Transfer Partners LP | | 5.20 | 2-1-2022 | 2,536,000 | 2,608,711 |
| EQT Corporation « | | 3.00 | 10-1-2022 | 2,750,000 | 2,766,376 |
| Marathon Petroleum Corporation | | 4.50 | 5-1-2023 | 8,000,000 | 8,633,523 |
The accompanying notes are an integral part of these financial statements.
14 | Wells Fargo Ultra Short-Term Income Fund
Portfolio of investments—February 28, 2021 (unaudited)
| | | Interest
rate | Maturity
date | Principal | Value |
| Oil, gas & consumable fuels (continued) | | | | | |
| Ovintiv Exploration Incorporated | | 3.90% | 11-15-2021 | $ 725,000 | $ 732,286 |
| Ovintiv Exploration Incorporated | | 5.75 | 1-30-2022 | 3,355,000 | 3,464,240 |
| Pioneer Natural Resource | | 0.75 | 1-15-2024 | 5,000,000 | 4,986,988 |
| Plains All American Pipeline LP | | 3.85 | 10-15-2023 | 8,971,000 | 9,546,901 |
| The Phillips 66 Company | | 3.70 | 4-6-2023 | 5,000,000 | 5,324,575 |
| Valero Energy Corporation | | 1.20 | 3-15-2024 | 3,000,000 | 3,025,721 |
| Valero Energy Corporation | | 2.70 | 4-15-2023 | 3,000,000 | 3,127,439 |
| Western Midstream Operating LP | | 5.38 | 6-1-2021 | 2,000,000 | 2,000,000 |
| | | | | | 56,115,039 |
| Financials: 9.46% | | | | | |
| Banks: 1.92% | | | | | |
| Bank of America Corporation (U.S. SOFR+0.74%)± | | 0.81 | 10-24-2024 | 12,000,000 | 12,090,935 |
| Bank of America Corporation (3 Month LIBOR+0.94%)± | | 3.86 | 7-23-2024 | 4,894,000 | 5,272,343 |
| Citibank NA (3 Month LIBOR+0.60%)± | | 2.84 | 5-20-2022 | 6,000,000 | 6,032,215 |
| Citigroup Incorporated (U.S. SOFR+0.69%)± | | 0.78 | 10-30-2024 | 8,000,000 | 8,041,161 |
| Deutsche Bank (U.S. SOFR+2.16%)± | | 2.22 | 9-18-2024 | 3,500,000 | 3,601,716 |
| JPMorgan Chase & Company (U.S. SOFR+1.46%)± | | 1.51 | 6-1-2024 | 7,250,000 | 7,420,978 |
| JPMorgan Chase & Company (3 Month LIBOR+0.70%)± | | 3.21 | 4-1-2023 | 2,635,000 | 2,716,597 |
| Synchrony Bank | | 3.65 | 5-24-2021 | 2,650,000 | 2,662,409 |
| | | | | | 47,838,354 |
| Capital markets: 1.75% | | | | | |
| Goldman Sachs Group Incorporated (U.S. SOFR+0.54%)± | | 0.63 | 11-17-2023 | 11,500,000 | 11,535,475 |
| Goldman Sachs Group Incorporated | | 5.75 | 1-24-2022 | 5,000,000 | 5,243,258 |
| IntercontinentalExchange Incorporated | | 0.70 | 6-15-2023 | 5,000,000 | 5,025,035 |
| Morgan Stanley (U.S. SOFR+0.47%)± | | 0.56 | 11-10-2023 | 5,000,000 | 5,006,949 |
| Morgan Stanley | | 2.75 | 5-19-2022 | 9,435,000 | 9,713,635 |
| NASDAQ Incorporated | | 0.45 | 12-21-2022 | 3,000,000 | 3,001,276 |
| State Street Corporation (U.S. SOFR+2.69%)± | | 2.83 | 3-30-2023 | 4,000,000 | 4,111,354 |
| | | | | | 43,636,982 |
| Consumer finance: 3.19% | | | | | |
| American Honda Finance Corporation | | 0.40 | 10-21-2022 | 6,000,000 | 6,007,115 |
| BMW US Capital LLC 144A | | 3.80 | 4-6-2023 | 5,000,000 | 5,339,181 |
| Bunge Limited | | 3.00 | 9-25-2022 | 1,000,000 | 1,034,855 |
| Daimler Finance North America LLC 144A%% | | 0.75 | 3-1-2024 | 8,580,000 | 8,594,208 |
| Daimler Finance North America LLC 144A | | 1.75 | 3-10-2023 | 1,715,000 | 1,755,814 |
| Daimler Finance North America LLC 144A | | 2.85 | 1-6-2022 | 1,220,000 | 1,245,753 |
| General Motors Financial Company Incorporated | | 1.70 | 8-18-2023 | 2,000,000 | 2,045,172 |
| General Motors Financial Company Incorporated | | 4.20 | 11-6-2021 | 6,040,000 | 6,195,373 |
| Hyundai Capital America Company 144A | | 0.80 | 1-8-2024 | 10,000,000 | 9,935,917 |
| Hyundai Capital America Company 144A | | 1.25 | 9-18-2023 | 4,750,000 | 4,800,699 |
| Hyundai Capital America Company 144A | | 2.38 | 2-10-2023 | 1,720,000 | 1,773,856 |
| Navient Corporation | | 6.63 | 7-26-2021 | 4,315,000 | 4,379,725 |
| Navient Corporation | | 7.25 | 9-25-2023 | 4,000,000 | 4,340,000 |
| Nissan Motor Acceptance Corporation 144A | | 1.90 | 9-14-2021 | 2,000,000 | 2,010,725 |
| Nissan Motor Acceptance Corporation 144A | | 3.65 | 9-21-2021 | 4,000,000 | 4,065,942 |
| Onemain Finance Corporation | | 5.63 | 3-15-2023 | 4,550,000 | 4,834,375 |
| The American Express Company (3 Month LIBOR+0.62%)± | | 0.80 | 5-20-2022 | 3,000,000 | 3,018,771 |
| Volkswagen Group of America Finance LLC 144A | | 2.70 | 9-26-2022 | 3,875,000 | 4,007,817 |
| Volkswagen Group of America Finance LLC 144A | | 3.13 | 5-12-2023 | 4,000,000 | 4,215,548 |
| | | | | | 79,600,846 |
The accompanying notes are an integral part of these financial statements.
Wells Fargo Ultra Short-Term Income Fund | 15
Portfolio of investments—February 28, 2021 (unaudited)
| | | Interest
rate | Maturity
date | Principal | Value |
| Diversified financial services: 0.64% | | | | | |
| DAE Funding LLC 144A | | 5.25% | 11-15-2021 | $ 2,185,000 | $ 2,223,238 |
| DAE Funding LLC 144A | | 5.75 | 11-15-2023 | 3,500,000 | 3,600,625 |
| National Securities Clearing Corporation 144A | | 0.40 | 12-7-2023 | 5,000,000 | 5,013,128 |
| National Securities Clearing Corporation 144A | | 1.20 | 4-23-2023 | 5,000,000 | 5,087,002 |
| | | | | | 15,923,993 |
| Insurance: 1.72% | | | | | |
| AIG Global Funding 144A | | 0.45 | 12-8-2023 | 5,000,000 | 5,004,421 |
| AIG Global Funding 144A | | 0.80 | 7-7-2023 | 5,000,000 | 5,046,037 |
| Athene Global Funding 144A | | 1.20 | 10-13-2023 | 5,000,000 | 5,059,217 |
| Athene Global Funding 144A | | 2.80 | 5-26-2023 | 5,000,000 | 5,238,289 |
| Equitable Financial Life Insurance Company 144A | | 0.50 | 11-17-2023 | 8,060,000 | 8,067,979 |
| Protective Life Global Funding 144A« | | 0.47 | 1-12-2024 | 10,000,000 | 9,963,667 |
| Protective Life Global Funding 144A | | 0.63 | 10-13-2023 | 2,000,000 | 2,012,021 |
| WEA Finance LLC Company 144A | | 3.15 | 4-5-2022 | 2,575,000 | 2,633,252 |
| | | | | | 43,024,883 |
| Thrifts & mortgage finance: 0.24% | | | | | |
| Ladder Capital Finance Holdings LP 144A | | 5.25 | 3-15-2022 | 5,980,000 | 6,009,900 |
| Health care: 0.60% | | | | | |
| Biotechnology: 0.20% | | | | | |
| AbbVie Incorporated | | 3.38 | 11-14-2021 | 4,935,000 | 5,038,187 |
| Health care providers & services: 0.20% | | | | | |
| Magellan Health Incorporated | | 4.90 | 9-22-2024 | 4,500,000 | 4,927,500 |
| Pharmaceuticals: 0.20% | | | | | |
| Bristol Myers Squibb Company | | 0.54 | 11-13-2023 | 5,000,000 | 5,011,678 |
| Industrials: 2.15% | | | | | |
| Aerospace & defense: 0.46% | | | | | |
| The Boeing Company | | 1.43 | 2-4-2024 | 5,000,000 | 5,008,771 |
| The Boeing Company | | 4.51 | 5-1-2023 | 6,000,000 | 6,435,528 |
| | | | | | 11,444,299 |
| Air freight & logistics: 0.21% | | | | | |
| FedEx Corporation | | 3.40 | 1-14-2022 | 5,000,000 | 5,133,659 |
| Airlines: 0.24% | | | | | |
| Delta Air Lines Incorporated | | 3.40 | 4-19-2021 | 3,000,000 | 3,006,533 |
| Delta Air Lines Incorporated | | 3.63 | 3-15-2022 | 3,000,000 | 3,046,246 |
| | | | | | 6,052,779 |
| Industrial conglomerates: 0.19% | | | | | |
| General Electric Company (3 Month LIBOR+1.00%)± | | 1.22 | 3-15-2023 | 1,729,000 | 1,747,526 |
| Honeywell International Incorporated | | 0.48 | 8-19-2022 | 3,000,000 | 3,003,727 |
| | | | | | 4,751,253 |
| Machinery: 0.26% | | | | | |
| CNH Industrial Capital LLC | | 1.95 | 7-2-2023 | 6,405,000 | 6,606,378 |
| Trading companies & distributors: 0.79% | | | | | |
| Air Lease Corporation | | 0.70 | 2-15-2024 | 10,000,000 | 9,909,023 |
The accompanying notes are an integral part of these financial statements.
16 | Wells Fargo Ultra Short-Term Income Fund
Portfolio of investments—February 28, 2021 (unaudited)
| | | Interest
rate | Maturity
date | Principal | Value |
| Trading companies & distributors (continued) | | | | | |
| Air Lease Corporation | | 3.38% | 6-1-2021 | $ 3,000,000 | $ 3,021,168 |
| Fortress Transportation & Infrastructure Investors LLC 144A | | 6.75 | 3-15-2022 | 6,747,000 | 6,744,099 |
| | | | | | 19,674,290 |
| Information technology: 1.08% | | | | | |
| IT services: 0.63% | | | | | |
| Fidelity National Information Services Incorporated %% | | 0.38 | 3-1-2023 | 13,500,000 | 13,494,525 |
| Leidos Incorporated 144A | | 2.95 | 5-15-2023 | 2,000,000 | 2,097,360 |
| | | | | | 15,591,885 |
| Semiconductors & semiconductor equipment: 0.35% | | | | | |
| Microchip Technology Incorporated 144A | | 0.97 | 2-15-2024 | 5,000,000 | 5,018,025 |
| Microchip Technology Incorporated 144A | | 2.67 | 9-1-2023 | 3,475,000 | 3,637,164 |
| | | | | | 8,655,189 |
| Technology hardware, storage & peripherals: 0.10% | | | | | |
| Dell International LLC 144A | | 7.13 | 6-15-2024 | 2,505,000 | 2,592,174 |
| Materials: 0.74% | | | | | |
| Chemicals: 0.54% | | | | | |
| LYB International Finance lll (3 Month LIBOR+1.00%)± | | 1.24 | 10-1-2023 | 5,000,000 | 5,017,380 |
| Nutrition & Biosciences Incorporated 144A | | 0.70 | 9-15-2022 | 1,000,000 | 1,004,292 |
| Westlake Chemical Corporation | | 3.60 | 7-15-2022 | 7,269,000 | 7,513,055 |
| | | | | | 13,534,727 |
| Containers & packaging: 0.20% | | | | | |
| Berry Global Incorporated 144A | | 0.95 | 2-15-2024 | 5,000,000 | 5,002,100 |
| Real estate: 0.59% | | | | | |
| Equity REITs: 0.59% | | | | | |
| SBA Tower Trust 144A | | 3.45 | 3-15-2048 | 7,175,000 | 7,600,513 |
| Service Properties Trust | | 4.50 | 6-15-2023 | 3,500,000 | 3,526,250 |
| Tanger Properties LP | | 3.88 | 12-1-2023 | 3,515,000 | 3,690,365 |
| | | | | | 14,817,128 |
| Utilities: 4.40% | | | | | |
| Electric utilities: 2.31% | | | | | |
| American Electric Power | | 0.75 | 11-1-2023 | 7,000,000 | 7,011,225 |
| Entergy Louisiana LLC | | 0.62 | 11-17-2023 | 10,000,000 | 10,021,911 |
| NextEra Energy Operating Partners LP (3 Month LIBOR+0.27%)± | | 0.45 | 2-22-2023 | 20,000,000 | 20,007,000 |
| Southern California Edison Company (3 Month LIBOR+0.27%)± | | 0.50 | 12-3-2021 | 7,000,000 | 7,005,370 |
| The Southern Company | | 0.60 | 2-26-2024 | 13,500,000 | 13,483,760 |
| | | | | | 57,529,266 |
| Gas utilities: 0.77% | | | | | |
| CenterPoint Energy (3 Month LIBOR+0.50%)±%% | | 0.68 | 3-2-2023 | 4,635,000 | 4,635,000 |
The accompanying notes are an integral part of these financial statements.
Wells Fargo Ultra Short-Term Income Fund | 17
Portfolio of investments—February 28, 2021 (unaudited)
| | | Interest
rate | Maturity
date | Principal | Value |
| Gas utilities (continued) | | | | | |
| CenterPoint Energy %% | | 0.70% | 3-2-2023 | $ 4,625,000 | $ 4,620,514 |
| Southern California Gas Company (3 Month LIBOR+0.35%)± | | 0.57 | 9-14-2023 | 10,000,000 | 10,002,124 |
| | | | | | 19,257,638 |
| Independent power & renewable electricity producers: 0.08% | | | | | |
| TerraForm Power Operating LLC 144A | | 4.25 | 1-31-2023 | 2,000,000 | 2,040,000 |
| Multi-utilities: 1.24% | | | | | |
| Consolidated Edison Incorporated | | 0.65 | 12-1-2023 | 5,000,000 | 5,002,759 |
| Consumers Energy Company | | 0.35 | 6-1-2023 | 5,000,000 | 4,999,874 |
| Dominion Energy Incorporated | | 2.72 | 8-15-2021 | 2,700,000 | 2,728,248 |
| DTE Energy Company | | 0.55 | 11-1-2022 | 3,000,000 | 3,006,220 |
| DTE Energy Company | | 2.25 | 11-1-2022 | 5,000,000 | 5,149,753 |
| WEC Energy Group Incorporated | | 0.55 | 9-15-2023 | 10,000,000 | 10,035,021 |
| | | | | | 30,921,875 |
| Total Corporate bonds and notes (Cost $605,982,417) | | | | | 612,599,634 |
| | | | | Shares | |
| Exchange-traded funds: 4.04% | | | | | |
| Invesco BulletShares 2022 High Yield Corporate Bond ETF « | | | | 334,000 | 7,742,120 |
| iShares 0-5 Year High Yield Corporate Bond ETF | | | | 773,000 | 35,140,580 |
| iShares Short-Term Corporate Bond ETF | | | | 572,000 | 31,385,640 |
| SPDR Portfolio Short Term Corporate Bond ETF | | | | 847,800 | 26,587,008 |
| Total Exchange-traded funds (Cost $98,928,987) | | | | | 100,855,348 |
| | | | | Principal | |
| Municipal obligations: 0.32% | | | | | |
| Indiana: 0.11% | | | | | |
| Education revenue: 0.11% | | | | | |
| Indiana Secondary Market for Education Loans Incorporated (1 Month LIBOR+0.80%)± | | 0.92 | 2-25-2044 | $ 2,748,887 | 2,756,666 |
| New Jersey: 0.07% | | | | | |
| Transportation revenue: 0.07% | | | | | |
| New Jersey Transportation Trust Authority Taxable Transportation System Series B | | 2.38 | 6-15-2022 | 1,700,000 | 1,740,188 |
| New York: 0.04% | | | | | |
| Transportation revenue: 0.04% | | | | | |
| New York Metropolitan Transportation Authority BAN | | 4.00 | 2-1-2022 | 790,000 | 812,823 |
| Wisconsin: 0.10% | | | | | |
| Housing revenue: 0.10% | | | | | |
| Wisconsin PFA Affinity Living Group Project (Citizens Bank LOC) | | 3.75 | 2-1-2022 | 2,500,000 | 2,502,025 |
| Total Municipal obligations (Cost $7,702,533) | | | | | 7,811,702 |
| Non-agency mortgage-backed securities: 19.33% | | | | | |
| Affirm Incorporated Series 2021-A Class A 144A | | 0.88 | 8-15-2025 | 10,000,000 | 10,009,763 |
The accompanying notes are an integral part of these financial statements.
18 | Wells Fargo Ultra Short-Term Income Fund
Portfolio of investments—February 28, 2021 (unaudited)
| | | Interest
rate | Maturitydate | Principal | Value |
| Non-agency mortgage-backed securities (continued) | | | | | |
| AIMCO Series 2020-11A Class A1 (3 Month LIBOR+1.38%)144A± | | 1.60% | 10-15-2031 | $ 5,000,000 | $ 5,012,075 |
| American Money Management Corporation Series 2014-14A Class A1R2 (3 Month LIBOR+1.02%)144A± | | 1.24 | 7-25-2029 | 10,780,000 | 10,781,736 |
| Angel Oak Mortgage Trust I LLC Series 2019-3 Class A1 144A±± | | 2.93 | 5-25-2059 | 1,074,329 | 1,081,110 |
| Angel Oak Mortgage Trust I LLC Series 2019-4 Class A1 144A±± | | 2.99 | 7-26-2049 | 2,613,739 | 2,642,071 |
| Angel Oak Mortgage Trust I LLC Series 2020-4 Class A1 144A±± | | 1.47 | 6-25-2065 | 3,057,890 | 3,087,714 |
| Angel Oak Mortgage Trust I LLC Series 2020-R1 Class A1 144A±± | | 0.99 | 4-25-2053 | 9,217,360 | 9,254,346 |
| Avery Point CLO Limited Series 2015-7A Class AR2 (3 Month LIBOR+0.96%)144A± | | 1.20 | 1-15-2028 | 10,460,000 | 10,461,224 |
| Banc of America Funding Corporation Series 2016-R1 Class A1 144A±± | | 2.50 | 3-25-2040 | 497,106 | 496,762 |
| Bayview Opportunity Master Fund Series 2016-SPL2 Class A 144A±± | | 4.00 | 6-28-2053 | 2,353,049 | 2,397,792 |
| Black Diamond CLO Limited Series 2017-1A Class A1A (3 Month LIBOR+1.29%)144A± | | 1.51 | 4-24-2029 | 1,055,000 | 1,053,479 |
| Bravo Residential Funding Trust Series 2020-RPL1 Class A1 144A±± | | 2.50 | 5-26-2059 | 1,808,277 | 1,872,646 |
| Bunker Hill Loan Depositary Trust Series 2019-2 Class A1 144A | | 2.88 | 7-25-2049 | 3,311,678 | 3,392,743 |
| Carlyle C17 CLO Limited Series C17-A Class A1AR (3 Month LIBOR+1.03%)144A± | | 1.24 | 4-30-2031 | 3,000,000 | 3,000,045 |
| Cascade Funding Mortgage Trust Series 2018-RM2 Class A 144A±± | | 4.00 | 10-25-2068 | 924,703 | 965,839 |
| Cascade Funding Mortgage Trust Series 2020-HB4 Class A 144A±± | | 0.95 | 12-26-2030 | 5,759,263 | 5,760,432 |
| CCG Receivables Trust Series 2019-1 Class A2 144A | | 2.80 | 9-14-2026 | 1,186,785 | 1,202,673 |
| CD Commercial Mortgage Trust Series 2017-CD3 Class A1 | | 1.97 | 2-10-2050 | 897,594 | 900,079 |
| CGDBB Commercial Mortgage Trust Series 2017-BIOC Class A (1 Month LIBOR+0.79%)144A± | | 0.90 | 7-15-2032 | 5,115,843 | 5,120,687 |
| Citigroup Commercial Mortgage Trust Series 2015-GC27 Class A3 (1 Month LIBOR+1.10%)± | | 3.06 | 2-10-2048 | 3,819,226 | 3,875,257 |
| Citigroup Commercial Mortgage Trust Series 2017-MDRB Class A (1 Month LIBOR+1.10%)144A± | | 1.21 | 7-15-2030 | 2,365,399 | 2,348,407 |
| Colt Funding LLC Series 2020-1R Class A1 ±± | | 1.26 | 9-25-2065 | 2,230,138 | 2,241,383 |
| Colt Funding LLC Series 2020-2 Class A1 144A±± | | 1.85 | 3-25-2065 | 4,919,134 | 4,988,192 |
| Colt Funding LLC Series 2021-1R Class A1 144A±± | | 0.86 | 5-25-2065 | 8,930,259 | 8,931,119 |
| Commercial Mortgage Trust Series 2014-CR15 Class A2 | | 2.93 | 2-10-2047 | 2,372,757 | 2,361,095 |
| Commercial Mortgage Trust Series 2014-CR16 Class ASB | | 3.65 | 4-10-2047 | 2,371,158 | 2,474,124 |
| Commercial Mortgage Trust Series 2014-LC17 Class A2 | | 3.16 | 10-10-2047 | 21,363 | 21,356 |
| Commercial Mortgage Trust Series 2014-UBS2 Class A3 | | 3.47 | 3-10-2047 | 139,974 | 146,384 |
| Commercial Mortgage Trust Series 2014-UBS5 Class A2 | | 3.03 | 9-10-2047 | 624,342 | 624,390 |
| Countrywide Home Loans Mortgage Pass-Through Trust Series 2001-HYB1 Class 1A1 ±± | | 2.07 | 6-19-2031 | 115,728 | 117,939 |
| Countrywide Home Loans Mortgage Pass-Through Trust Series 2001-HYB1 Class 2A1 ±± | | 2.01 | 6-19-2031 | 72,911 | 73,529 |
| Credit Suisse Mortgage Trust Series 2019-SKLZ Class A (1 Month LIBOR+1.25%)144A± | | 1.36 | 1-15-2034 | 3,600,000 | 3,599,629 |
| Credit Suisse Mortgage Trust Series 2020-AFC1 Class A3 144A±± | | 2.51 | 2-25-2050 | 4,844,257 | 4,920,837 |
| Credit Suisse Mortgage Trust Series 2020-SPT1 Class A1 144A | | 1.62 | 4-25-2065 | 4,458,597 | 4,487,865 |
The accompanying notes are an integral part of these financial statements.
Wells Fargo Ultra Short-Term Income Fund | 19
Portfolio of investments—February 28, 2021 (unaudited)
| | | Interest
rate | Maturitydate | Principal | Value |
| Non-agency mortgage-backed securities (continued) | | | | | |
| Crown Point Limited Series 2015-3A Class A1AR (3 Month LIBOR+0.91%)144A± | | 1.15% | 12-31-2027 | $ 1,970,159 | $ 1,970,626 |
| DBWF Mortgage Trust Series 2018-GLKS Class A (1 Month LIBOR+1.03%)144A± | | 1.14 | 12-19-2030 | 635,000 | 636,148 |
| Deephaven Residential Mortgage Series 2019-4A Class A1 144A±± | | 2.79 | 10-25-2059 | 2,818,672 | 2,851,744 |
| Deephaven Residential Mortgage Series 2020-1 Class A2 144A±± | | 2.49 | 1-25-2060 | 2,119,898 | 2,139,316 |
| Dell Equipment Finance Trust Series 2020-1 Class A2 144A | | 2.26 | 6-22-2022 | 8,774,775 | 8,859,574 |
| DLL Securitization Trust Series 2018-ST2 Class A3 144A | | 3.46 | 1-20-2022 | 937,094 | 940,325 |
| Dryden Senior Loan Fund Series 2013-30A (3 Month LIBOR+0.82%)144A± | | 1.01 | 11-15-2028 | 5,538,645 | 5,539,498 |
| Ellington Financial Mortgage Trust Series 2020-1 Class A1 144A±± | | 2.01 | 5-25-2065 | 1,925,716 | 1,957,146 |
| Ellington Financial Mortgage Trust Series 2021-1 Class A1 144A±± | | 0.80 | 2-25-2066 | 2,000,000 | 1,999,263 |
| EquiFirst Mortgage Loan Trust Series 2003-2 Class 3A3 (1 Month LIBOR+1.13%)± | | 1.24 | 9-25-2033 | 272,072 | 266,390 |
| Freedom Financial Trust Series 2021-1CP Class A 144A | | 0.66 | 3-20-2028 | 15,300,000 | 15,288,548 |
| Galton Funding Mortgage Trust Series 2020-H1 Class A1 144A±± | | 2.31 | 1-25-2060 | 4,395,340 | 4,482,964 |
| GB Trust Series 2020-FlLIX (1 Month LIBOR+1.12%)144A± | | 1.23 | 8-15-2037 | 8,000,000 | 8,063,086 |
| GCAT Series 2019-NQM1 Class A1 144A | | 2.99 | 2-25-2059 | 3,379,552 | 3,394,295 |
| GCAT Series 2019-NQM2 Class A1 144A | | 2.86 | 9-25-2059 | 3,338,115 | 3,392,486 |
| Goldman Sachs Mortgage Securities Trust Series 2013-GC16 Class AAB | | 3.81 | 11-10-2046 | 1,395,761 | 1,458,094 |
| Goldman Sachs Mortgage Securities Trust Series 2014-GC22 Class A3 | | 3.52 | 6-10-2047 | 2,934,697 | 2,947,143 |
| Goldman Sachs Mortgage Securities Trust Series 2020-NQM1 Class A1 144A±± | | 1.38 | 9-27-2060 | 4,137,781 | 4,156,294 |
| GPMT Limited Series 2018-FL1 Class A (1 Month LIBOR+0.90%)144A± | | 1.01 | 11-21-2035 | 861,608 | 862,922 |
| Gracie Point International Series 2020-B Class A (1 Month LIBOR+1.40%)144A± | | 1.52 | 5-2-2023 | 6,369,751 | 6,380,321 |
| GSMPS Mortgage Loan Trust Series 1998-1 Class A 144A±± | | 8.00 | 9-19-2027 | 30,170 | 30,168 |
| Halcyon Loan Advisors Funding Series 2014-3A Class AR (3 Month LIBOR+1.10%)144A± | | 1.32 | 10-22-2025 | 469,763 | 470,149 |
| Homeward Opportunities Fund I Trust Series 2019-1 Class A1 144A±± | | 3.45 | 1-25-2059 | 2,222,974 | 2,248,289 |
| Hospitality Mortgage Trust Series 2019 Class A (1 Month LIBOR+1.00%)144A± | | 1.11 | 11-15-2036 | 3,961,914 | 3,961,913 |
| Imperial Fund LLC Series 2020-NQM1 Class A1 144A±± | | 1.38 | 10-25-2055 | 6,508,522 | 6,533,852 |
| InTown Hotel Portfolio Trust Series 2018-STAY Class A (1 Month LIBOR+0.95%)144A± | | 1.06 | 1-15-2033 | 4,000,000 | 4,004,798 |
| JPMorgan Chase Commercial Mortgage Securities Trust Series 2011-C5 Class A3 | | 4.17 | 8-15-2046 | 1,817,642 | 1,833,631 |
| JPMorgan Chase Commercial Mortgage Securities Trust Series 2018-PHH Class A (1 Month LIBOR+0.91%)144A± | | 2.41 | 6-15-2035 | 3,571,081 | 3,578,265 |
| JPMorgan Chase Commercial Mortgage Securities Trust Series 2019-MFP Class A (1 Month LIBOR+0.96%)144A± | | 1.07 | 7-15-2036 | 5,000,000 | 4,996,985 |
| KKR Financial Holdings LLC (3 Month LIBOR+1.34%)144A± | | 1.58 | 4-15-2029 | 8,000,000 | 8,000,000 |
| LCM LP Series 2013-A Class ARR (3 Month LIBOR+1.14%)144A± | | 1.36 | 7-19-2027 | 6,000,000 | 6,000,672 |
| Legacy Mortgage Asset Trust Series 2020-RPL1 Class A1 144A±± | | 3.00 | 9-25-2059 | 13,004,027 | 13,668,786 |
The accompanying notes are an integral part of these financial statements.
20 | Wells Fargo Ultra Short-Term Income Fund
Portfolio of investments—February 28, 2021 (unaudited)
| | | Interest
rate | Maturitydate | Principal | Value |
| Non-agency mortgage-backed securities (continued) | | | | | |
| Lendmark Funding Trust Series 2018-2A Class A 144A | | 4.23% | 4-20-2027 | $ 3,000,000 | $ 3,068,962 |
| Marlette Funding Trust Series 2019-4A Class A 144A | | 2.39 | 12-17-2029 | 2,786,257 | 2,809,954 |
| Marlette Funding Trust Series 2020-2A Class A 144A | | 1.02 | 9-16-2030 | 4,401,865 | 4,409,730 |
| Master Mortgages Trust Series 2002-3 Class 4A1 ±± | | 3.81 | 10-25-2032 | 1,936 | 1,966 |
| Mello Warehouse Securitization Trust Series 2019-1 Class A (1 Month LIBOR+0.80%)144A± | | 0.92 | 6-25-2052 | 5,065,000 | 5,068,731 |
| Mello Warehouse Securitization Trust Series 2020-1 Class A (1 Month LIBOR+0.90%)± | | 1.02 | 10-25-2053 | 8,500,000 | 8,503,306 |
| Mello Warehouse Securitization Trust Series 2020-2 Class A (1 Month LIBOR+0.80%)144A± | | 0.92 | 11-25-2053 | 7,405,000 | 7,411,228 |
| Mello Warehouse Securitization Trust Series 2021-1 Class B (1 Month LIBOR+0.90%)144A± | | 1.01 | 2-25-2055 | 7,135,000 | 7,135,714 |
| MF1 Limited Series 2020-FL3 Class A (1 Month LIBOR+2.05%)144A± | | 2.16 | 7-15-2035 | 3,255,000 | 3,289,596 |
| MFRA Trust Series 2020-NQM3 Class A1 144A±± | | 1.01 | 1-26-2065 | 4,086,840 | 4,084,685 |
| Mill City Mortgage Loan Trust Series 2017-2 Class A1 144A±± | | 2.75 | 7-25-2059 | 3,284,730 | 3,336,694 |
| Morgan Stanley Capital I Trust Series 2011-C2 Class A4 144A | | 4.66 | 6-15-2044 | 1,343,119 | 1,355,498 |
| Morgan Stanley Capital I Trust Series 2016-C30 Class A1 | | 1.39 | 9-15-2049 | 835,190 | 835,755 |
| Octagon Investment Partners Series 2017-1A Class A1R (3 Month LIBOR+1.00%)144A± | | 1.11 | 3-17-2030 | 11,000,000 | 11,000,792 |
| Onslow Bay Financial LLC Series 2020-EXP1 Class 1A8 144A±± | | 3.50 | 2-25-2060 | 1,460,686 | 1,506,407 |
| OZML Funding Limited Series 2013-3A Class AIRR (3 Month LIBOR+1.18%)144A± | | 1.40 | 1-22-2029 | 4,969,666 | 4,971,013 |
| Palmer Square Loan Funding Limited Series 2018-4A Class A1 (3 Month LIBOR+0.90%)144A± | | 1.09 | 11-15-2026 | 1,934,890 | 1,935,660 |
| PFS Financing Corporation Series 2020-E Class A 144A | | 1.00 | 10-15-2025 | 15,000,000 | 15,117,330 |
| PFS Financing Corporation Series 2021-A Class A 144A | | 0.71 | 4-15-2026 | 9,340,000 | 9,320,465 |
| Prosper Marketplace Issuance Series 2019-1A Class B 144A | | 4.03 | 4-15-2025 | 3,555,780 | 3,572,937 |
| ReadyCap Commercial Mortgage Trust Series 2019-5 Class A 144A | | 3.78 | 2-25-2052 | 2,211,046 | 2,276,515 |
| Residential Mortgage Loan Trust Series 2019-2 Class A1 144A±± | | 2.91 | 5-25-2059 | 2,486,962 | 2,534,991 |
| Residential Mortgage Loan Trust Series 2021-1R Class A1 144A♦±± | | 0.86 | 1-25-2065 | 10,000,000 | 9,999,813 |
| Salomon Brothers Mortgage Securities VII Series 1990-2 Class A ±± | | 2.16 | 11-25-2049 | 105,554 | 105,656 |
| SCF Equipment Trust LLC Series 2021-1A Class A2 144A | | 0.42 | 8-20-2026 | 22,000,000 | 21,992,111 |
| Sequoia Mortgage Trust Series 2017-CH2 Class A10 144A±± | | 4.00 | 12-25-2047 | 476,617 | 478,400 |
| Sound Point CLO Limited Series 2015-1RA Class AR (3 Month LIBOR+1.08%)144A± | | 1.26 | 4-15-2030 | 12,555,000 | 12,558,930 |
| Starwood Mortgage Residential Trust Series 2019-1 Class A1 144A±± | | 2.94 | 6-25-2049 | 2,450,646 | 2,487,192 |
| Starwood Mortgage Residential Trust Series 2019-INV1 Class A1 144A±± | | 2.61 | 9-27-2049 | 2,910,587 | 2,966,746 |
| Starwood Mortgage Residential Trust Series 2020-1 Class A3 144A±± | | 2.56 | 2-25-2050 | 3,560,826 | 3,614,216 |
| Starwood Mortgage Residential Trust Series 2020-2 Class A1 144A±± | | 2.72 | 4-25-2060 | 4,801,976 | 4,889,449 |
| Station Place Securitization Trust Series 2021-WL1 Class A (1 Month LIBOR+0.65%)144A± | | 0.78 | 1-26-2054 | 8,870,000 | 8,870,000 |
The accompanying notes are an integral part of these financial statements.
Wells Fargo Ultra Short-Term Income Fund | 21
Portfolio of investments—February 28, 2021 (unaudited)
| | | Interest
rate | Maturitydate | Principal | Value |
| Non-agency mortgage-backed securities (continued) | | | | | |
| TCW Collateralized Loan Obligation Limited Series 2017-1A Class BR (3 Month LIBOR+1.55%)144A± | | 1.76% | 7-29-2029 | $ 5,540,000 | $ 5,541,978 |
| Towd Point Mortgage Trust Series 2015-4 Class A2 144A±± | | 3.75 | 4-25-2055 | 3,080,000 | 3,135,605 |
| Towd Point Mortgage Trust Series 2016-3 Class A1 144A±± | | 2.25 | 4-25-2056 | 948,541 | 956,155 |
| Towd Point Mortgage Trust Series 2017-1 Class A1 144A±± | | 2.75 | 10-25-2056 | 2,996,239 | 3,050,545 |
| Towd Point Mortgage Trust Series 2017-4 Class A1 144A±± | | 2.75 | 6-25-2057 | 2,034,055 | 2,100,793 |
| Towd Point Mortgage Trust Series 2017-6 Class A1 144A±± | | 2.75 | 10-25-2057 | 2,173,042 | 2,238,025 |
| Towd Point Mortgage Trust Series 2018-2 Class A1 144A±± | | 3.25 | 3-25-2058 | 1,563,418 | 1,635,656 |
| Towd Point Mortgage Trust Series 2018-3 Class A1 144A±± | | 3.75 | 5-25-2058 | 6,169,311 | 6,523,252 |
| Towd Point Mortgage Trust Series 2019-SJ3 Class A1 144A±± | | 3.00 | 11-25-2059 | 3,035,656 | 3,063,534 |
| UBS Commercial Mortgage Trust Series 2012-C1 Class A3 | | 3.40 | 5-10-2045 | 1,347,805 | 1,368,503 |
| UBS Commercial Mortgage Trust Series 2018-NYCH Class A (1 Month LIBOR+0.85%)144A± | | 0.96 | 2-15-2032 | 4,115,000 | 4,101,520 |
| Vendee Mortgage Trust Series 2011-1 Class DA | | 3.75 | 2-15-2035 | 76,410 | 76,442 |
| Venture CDO Limited Series 2015-20A Class AR (3 Month LIBOR+0.82%)144A± | | 1.06 | 4-15-2027 | 3,433,259 | 3,434,076 |
| Verus Securitization Trust Series 2019-1 Class A1 144A±± | | 3.40 | 12-25-2059 | 2,302,958 | 2,332,648 |
| Verus Securitization Trust Series 2020-2 Class A1 144A±± | | 2.23 | 5-25-2060 | 1,417,413 | 1,433,687 |
| Verus Securitization Trust Series 2020-INV1 Class A1 144A±± | | 1.98 | 3-25-2060 | 2,305,785 | 2,346,071 |
| Verus Securitization Trust Series 2021-1 Class A2 144A±± | | 1.05 | 1-25-2066 | 9,000,000 | 8,995,556 |
| Vibrant CLO Limited Series 2017-6A Class A (3 Month LIBOR+1.24%)144A± | | 1.48 | 6-20-2029 | 1,047,500 | 1,047,697 |
| Vista Point Securitization Trust Series 2020-1 Class A1 144A±± | | 1.76 | 3-25-2065 | 4,401,589 | 4,441,629 |
| Wilshire Funding Corporation Series 1996-3 Class M2 ±± | | 7.17 | 8-25-2032 | 114,766 | 120,711 |
| Wilshire Funding Corporation Series 1996-3 Class M3 ±± | | 7.17 | 8-25-2032 | 84,032 | 82,160 |
| Wilshire Funding Corporation Series 1998-2 Class M1 (1 Week LIBOR+2.00%)± | | 2.10 | 12-28-2037 | 130,613 | 133,907 |
| Total Non-agency mortgage-backed securities (Cost $480,702,139) | | | | | 482,289,005 |
| Yankee corporate bonds and notes: 12.67% | | | | | |
| Consumer discretionary: 0.69% | | | | | |
| Auto components: 0.25% | | | | | |
| Toyota Industries Corporation 144A | | 3.11 | 3-12-2022 | 6,145,000 | 6,303,070 |
| Automobiles: 0.22% | | | | | |
| Nissan Motor Company Limited 144A | | 3.04 | 9-15-2023 | 4,500,000 | 4,731,148 |
| Stellantis NV | | 5.25 | 4-15-2023 | 530,000 | 575,289 |
| | | | | | 5,306,437 |
| Household durables: 0.22% | | | | | |
| Panasonic Corporation 144A | | 2.54 | 7-19-2022 | 5,400,000 | 5,526,237 |
The accompanying notes are an integral part of these financial statements.
22 | Wells Fargo Ultra Short-Term Income Fund
Portfolio of investments—February 28, 2021 (unaudited)
| | | Interest
rate | Maturitydate | Principal | Value |
| Consumer staples: 0.18% | | | | | |
| Food & staples retailing: 0.18% | | | | | |
| Seven & I Holdings Company Limited 144A | | 3.35% | 9-17-2021 | $ 4,500,000 | $ 4,574,697 |
| Energy: 1.37% | | | | | |
| Oil, gas & consumable fuels: 1.37% | | | | | |
| Aker BP ASA 144A | | 4.75 | 6-15-2024 | 9,585,000 | 9,902,559 |
| Enbridge Incorporated (U.S. SOFR+0.40%)± | | 0.42 | 2-17-2023 | 3,000,000 | 3,006,411 |
| Reliance Industries Limited 144A | | 5.40 | 2-14-2022 | 6,800,000 | 7,092,878 |
| Saudi Arabian Oil 144A | | 1.25 | 11-24-2023 | 2,000,000 | 2,014,640 |
| Saudi Arabian Oil 144A | | 2.75 | 4-16-2022 | 7,000,000 | 7,157,985 |
| Shell International Finance BV | | 0.38 | 9-15-2023 | 5,000,000 | 5,000,171 |
| | | | | | 34,174,644 |
| Financials: 8.47% | | | | | |
| Banks: 6.89% | | | | | |
| ANZ New Zealand International Company 144A | | 1.90 | 2-13-2023 | 2,800,000 | 2,884,504 |
| Banco Bilbao Vizcaya Argentaria SA | | 0.88 | 9-18-2023 | 5,000,000 | 5,040,860 |
| Banco de Bogota SA 144A | | 5.38 | 2-19-2023 | 1,500,000 | 1,601,640 |
| Banco Santander SA | | 3.50 | 4-11-2022 | 10,020,000 | 10,357,586 |
| Banco Santander SA 144A | | 4.13 | 11-9-2022 | 7,797,000 | 8,177,104 |
| Bank of Montreal | | 0.45 | 12-8-2023 | 4,000,000 | 4,009,743 |
| Bank of Nova Scotia | | 1.63 | 5-1-2023 | 5,000,000 | 5,135,297 |
| Banque Federative du Credit Mutuel SA 144A | | 0.65 | 2-27-2024 | 7,065,000 | 7,063,684 |
| Barclays Bank plc (1 Year Treasury Constant Maturity+0.80%)± | | 1.01 | 12-10-2024 | 5,135,000 | 5,161,287 |
| Barclays Bank plc | | 1.70 | 5-12-2022 | 5,000,000 | 5,076,092 |
| BNP Paribas 144A | | 3.50 | 3-1-2023 | 4,000,000 | 4,238,311 |
| BPCE SA 144A | | 3.00 | 5-22-2022 | 4,000,000 | 4,129,052 |
| Canadian Imperial Bank | | 0.50 | 12-14-2023 | 3,000,000 | 3,002,786 |
| Corporación Andina de Fomento | | 2.38 | 5-12-2023 | 4,860,000 | 5,030,489 |
| Corporación Andina de Fomento | | 4.38 | 6-15-2022 | 5,400,000 | 5,649,804 |
| Credit Suisse AG | | 2.80 | 4-8-2022 | 2,000,000 | 2,055,108 |
| Credit Suisse New York | | 0.50 | 2-2-2024 | 5,000,000 | 4,997,131 |
| Danske Bank A/S 144A | | 5.00 | 1-12-2022 | 8,565,000 | 8,888,994 |
| Global Bank Corporation 144A | | 4.50 | 10-20-2021 | 1,180,000 | 1,196,284 |
| Intesa Sanpaolo SpA 144A | | 3.38 | 1-12-2023 | 1,700,000 | 1,777,621 |
| Lloyds Banking Group plc (1 Year Treasury Constant Maturity+1.10%)± | | 1.33 | 6-15-2023 | 3,215,000 | 3,247,983 |
| Mitsubishi UFJ Financial Group Incorporated (1 Year Treasury Constant Maturity+0.68%)± | | 0.85 | 9-15-2024 | 4,000,000 | 4,028,733 |
| Mizuho Financial Group Incorporated (3 Month LIBOR+0.61%)± | | 0.85 | 9-8-2024 | 6,990,000 | 7,034,925 |
| Mizuho Financial Group Incorporated (3 Month LIBOR+0.99%)± | | 1.24 | 7-10-2024 | 2,420,000 | 2,457,422 |
| National Bank of Canada Company (1 Year Treasury Constant Maturity+0.40%)± | | 0.55 | 11-15-2024 | 10,000,000 | 10,004,885 |
| NatWest Markets plc 144A | | 2.38 | 5-21-2023 | 5,290,000 | 5,507,644 |
| NatWest Markets plc | | 6.13 | 12-15-2022 | 3,000,000 | 3,272,722 |
| Nordea Bank 144A | | 4.25 | 9-21-2022 | 5,400,000 | 5,699,899 |
| Skandinaviska Enskilda Banken AB 144A | | 0.55 | 9-1-2023 | 6,000,000 | 6,009,840 |
| Sumitomo Mitsui Financial Group | | 0.51 | 1-12-2024 | 7,000,000 | 6,998,413 |
| Sumitomo Mitsui Trust Bank Limited 144A | | 0.80 | 9-12-2023 | 7,000,000 | 7,073,632 |
| Swedbank AB 144A | | 1.30 | 6-2-2023 | 2,000,000 | 2,037,186 |
The accompanying notes are an integral part of these financial statements.
Wells Fargo Ultra Short-Term Income Fund | 23
Portfolio of investments—February 28, 2021 (unaudited)
| | | Interest
rate | Maturitydate | Principal | Value |
| Banks (continued) | | | | | |
| Toronto-Dominion Bank (U.S. SOFR+0.45%)± | | 0.51% | 9-28-2023 | $ 3,000,000 | $ 3,017,037 |
| UniCredit SpA 144A | | 6.57 | 1-14-2022 | 9,545,000 | 9,996,410 |
| | | | | | 171,860,108 |
| Capital markets: 0.40% | | | | | |
| UBS Group AG | | 7.63 | 8-17-2022 | 9,000,000 | 9,892,706 |
| Consumer finance: 0.76% | | | | | |
| Hyundai Capital Services 144A | | 3.00 | 8-29-2022 | 1,829,778 | 1,888,718 |
| NTT Finance Corporation 144A%% | | 0.37 | 3-3-2023 | 17,170,000 | 17,172,562 |
| | | | | | 19,061,280 |
| Insurance: 0.30% | | | | | |
| Sompo International Holdings Limited | | 4.70 | 10-15-2022 | 7,000,000 | 7,434,684 |
| Thrifts & mortgage finance: 0.12% | | | | | |
| Nationwide Building Society 144A | | 0.55 | 1-22-2024 | 3,000,000 | 2,994,672 |
| Health care: 0.35% | | | | | |
| Biotechnology: 0.28% | | | | | |
| GlaxoSmithKline Capital Incorporated | | 0.53 | 10-1-2023 | 7,000,000 | 7,018,966 |
| Pharmaceuticals: 0.07% | | | | | |
| Teva Pharmaceutical Finance BV | | 2.20 | 7-21-2021 | 1,669,000 | 1,669,000 |
| Industrials: 0.17% | | | | | |
| Airlines: 0.17% | | | | | |
| AerCap Ireland Limited | | 4.13 | 7-3-2023 | 4,000,000 | 4,254,737 |
| Information technology: 0.56% | | | | | |
| Communications equipment: 0.44% | | | | | |
| Ericsson LM | | 4.13 | 5-15-2022 | 10,628,000 | 11,003,966 |
| Semiconductors & semiconductor equipment: 0.12% | | | | | |
| SK Hynix Incorporated 144A | | 1.00 | 1-19-2024 | 3,000,000 | 2,993,760 |
| Materials: 0.88% | | | | | |
| Chemicals: 0.88% | | | | | |
| Orbia Advance Corporation SAB 144A | | 4.88 | 9-19-2022 | 6,835,000 | 7,224,595 |
| Park Aerospace Holdings Company 144A | | 4.50 | 3-15-2023 | 4,000,000 | 4,183,251 |
| Park Aerospace Holdings Company 144A | | 5.25 | 8-15-2022 | 2,115,000 | 2,211,075 |
| Syngenta Finance NV 144A | | 4.44 | 4-24-2023 | 8,000,000 | 8,374,682 |
| | | | | | 21,993,603 |
| Total Yankee corporate bonds and notes (Cost $313,193,501) | | | | | 316,062,567 |
| Yankee government bonds: 1.69% | | | | | |
| Abu Dhabi Government Class L 144A | | 0.75 | 9-2-2023 | 4,000,000 | 4,010,576 |
| AID Iraq Government Bond | | 2.15 | 1-18-2022 | 37,621,000 | 38,230,460 |
| Total Yankee government bonds (Cost $42,300,418) | | | | | 42,241,036 |
The accompanying notes are an integral part of these financial statements.
24 | Wells Fargo Ultra Short-Term Income Fund
Portfolio of investments—February 28, 2021 (unaudited)
| | | Interest
rate | Maturitydate | Principal | Value |
| Short-term investments: 22.93% | | | | | |
| Commercial paper: 12.24% | | | | | |
| AT&T Incorporated 144A☼ | | 0.33% | 9-23-2021 | $ 20,000,000 | $ 19,965,747 |
| Banco Santander SA 144A☼ | | 0.28 | 9-30-2021 | 20,000,000 | 19,979,000 |
| Black Hills Corporation 144A☼ | | 0.18 | 4-6-2021 | 10,000,000 | 9,997,888 |
| BPCE SA 144A☼ | | 0.26 | 12-7-2021 | 25,000,000 | 24,962,133 |
| Catholic Health Initiatives ☼ | | 0.25 | 9-16-2021 | 10,000,000 | 9,990,068 |
| Duke Energy Corporation 144A☼ | | 0.16 | 4-16-2021 | 20,000,000 | 19,994,229 |
| Glencore Funding LLC 144A☼ | | 0.35 | 8-18-2021 | 20,000,000 | 19,966,361 |
| IntercontinentalExchange Incorporated 144A☼ | | 0.35 | 9-23-2021 | 5,500,000 | 5,480,816 |
| KFW 144A☼ | | 0.19 | 2-14-2022 | 20,000,000 | 19,960,778 |
| Metlife Short Term Fund 144A☼ | | 0.17 | 6-29-2021 | 10,000,000 | 9,995,012 |
| Mizuho Bank Limited 144A☼ | | 0.19 | 9-20-2021 | 25,000,000 | 24,968,671 |
| NatWest Markets plc 144A☼ | | 0.34 | 12-31-2021 | 20,000,000 | 19,946,784 |
| Societe Generale 144A☼ | | 0.22 | 6-10-2021 | 20,000,000 | 19,992,547 |
| Swedbank AB ☼ | | 0.18 | 6-7-2021 | 20,000,000 | 19,992,313 |
| Toronto-Dominion Bank 144A☼ | | 0.15 | 3-29-2021 | 24,150,000 | 24,148,128 |
| United Healthcare Company 144A## | | 0.21 | 3-29-2021 | 20,000,000 | 19,997,916 |
| Walt Disney Company 144A | | 0.26 | 11-15-2021 | 16,000,000 | 15,965,416 |
| | | | | | 305,303,807 |
| | | Yield | | Shares | |
| Investment companies: 8.69% | | | | | |
| Securities Lending Cash Investments LLC ♠∩∞ | | 0.05 | | 5,740,398 | 5,740,398 |
| Wells Fargo Government Money Market Fund Select Class ♠∞## | | 0.03 | | 211,057,105 | 211,057,105 |
| | | | | | 216,797,503 |
| | | Interest
rate | | Principal | |
| U.S. Treasury securities: 2.00% | | | | | |
| U.S. Treasury Bill ☼ | | 0.03 | 3-2-2021 | $ 25,000,000 | 24,999,985 |
| U.S. Treasury Bill ☼ | | 0.04 | 3-4-2021 | 25,000,000 | 24,999,943 |
| | | | | | 49,999,928 |
| Total Short-term investments (Cost $572,074,646) | | | | | 572,101,238 |
| Total investments in securities (Cost $2,635,722,986) | 106.20% | | | | 2,649,623,316 |
| Other assets and liabilities, net | (6.20) | | | | (154,595,339) |
| Total net assets | 100.00% | | | | $2,495,027,977 |
| ± | Variable rate investment. The rate shown is the rate in effect at period end. |
| ±± | The coupon of the security is adjusted based on the principal and interest payments received from the underlying pool of mortgages as well as the credit quality and the actual prepayment speed of the underlying mortgages. |
| 144A | The security may be resold in transactions exempt from registration, normally to qualified institutional buyers, pursuant to Rule 144A under the Securities Act of 1933. |
| ♦ | The security is fair valued in accordance with procedures approved by the Board of Trustees. |
| ## | All or a portion of this security is segregated for when-issued securities. |
| « | All or a portion of this security is on loan. |
| ♠ | The issuer of the security is an affiliated person of the Fund as defined in the Investment Company Act of 1940. |
| ∩ | The investment is a non-registered investment company purchased with cash collateral received from securities on loan. |
| ☼ | Zero coupon security. The rate represents the current yield to maturity. |
| ∞ | The rate represents the 7-day annualized yield at period end. |
| %% | The security is purchased on a when-issued basis. |
The accompanying notes are an integral part of these financial statements.
Wells Fargo Ultra Short-Term Income Fund | 25
Portfolio of investments—February 28, 2021 (unaudited)
| Abbreviations: |
| BAN | Bond anticipation notes |
| FHLMC | Federal Home Loan Mortgage Corporation |
| FNMA | Federal National Mortgage Association |
| GNMA | Government National Mortgage Association |
| LIBOR | London Interbank Offered Rate |
| LOC | Letter of credit |
| PFA | Public Finance Authority |
| SOFR | Secured Overnight Financing Rate |
Investments in affiliates
An affiliated investment is an investment in which the Fund owns at least 5% of the outstanding voting shares of the issuer or as a result of other relationships, such as the Fund and the issuer having the same investment manager. Transactions with issuers that were either affiliated persons of the Fund at the beginning of the period or the end of the period were as follows:
| | Value,
beginning of
period | Purchases | Sales
proceeds | Net
realized
gains
(losses) | | Net
change in
unrealized
gains
(losses) | | Value,
end of
period | | % of
net
assets | Shares,
end
of period | Income
from
affiliated
securities |
Short-term
investments | | | | | | | | | | | | |
Investment
companies | | | | | | | | | | | | |
| Securities Lending Cash Investments LLC | $ 0 | $ 73,925,338 | $ (68,184,940) | $ (56,940) | | $0 | | $ 5,740,398 | | | 5,740,398 | $ 1,286# |
| Wells Fargo Government Money Market Fund Select Class | 181,770,847 | 1,122,829,323 | (1,093,543,065) | 0 | | 0 | | 211,057,105 | | | 211,057,105 | 28,442 |
| | | | | $(56,940) | | $0 | | $216,797,503 | | 8.69% | | $29,728 |
| # | Amount shown represents income before fees and rebates. |
Futures contracts
| Description | Number of
contracts | Expiration
date | Notional
cost | Notional
value | Unrealized
gains | | Unrealized
losses |
| Short | | | | | | | |
| 2-Year U.S. Treasury Notes | (2,305) | 6-30-2021 | $(509,170,448) | $(508,864,768) | $ 305,680 | | $0 |
| 5-Year U.S. Treasury Notes | (870) | 6-30-2021 | (108,573,607) | (107,852,813) | 720,794 | | 0 |
| | | | | | $1,026,474 | | $0 |
The accompanying notes are an integral part of these financial statements.
26 | Wells Fargo Ultra Short-Term Income Fund
Statement of assets and liabilities—February 28, 2021 (unaudited)
| | |
| Assets | |
Investments in unaffiliated securities (including $5,626,599 of securities loaned), at value (cost $2,418,925,483)
| $ 2,432,825,813 |
Investments in affiliated securites, at value (cost $216,797,503)
| 216,797,503 |
Cash
| 1,290,390 |
Cash due from broker
| 1,120,000 |
Receivable for interest
| 7,476,453 |
Receivable for Fund shares sold
| 7,208,461 |
Segregated cash for futures contracts
| 1,958,340 |
Principal paydown receivable
| 66,595 |
Receivable for securities lending income, net
| 1,528 |
Total assets
| 2,668,745,083 |
| Liabilities | |
Payable for when-issued transactions
| 154,262,544 |
Payable for investments purchased
| 6,061,531 |
Payable upon receipt of securities loaned
| 5,740,398 |
Payable for Fund shares redeemed
| 5,460,161 |
Dividends payable
| 1,126,492 |
Management fee payable
| 273,658 |
Payable for daily variation margin on open futures contracts
| 184,887 |
Administration fees payable
| 171,347 |
Distribution fee payable
| 3,635 |
Trustees’ fees and expenses payable
| 2,470 |
Accrued expenses and other liabilities
| 429,983 |
Total liabilities
| 173,717,106 |
Total net assets
| $2,495,027,977 |
| Net assets consist of | |
Paid-in capital
| $ 2,509,046,004 |
Total distributable loss
| (14,018,027) |
Total net assets
| $2,495,027,977 |
| Computation of net asset value and offering price per share | |
Net assets – Class A
| $ 279,975,585 |
Shares outstanding – Class A1
| 32,480,371 |
Net asset value per share – Class A
| $8.62 |
Maximum offering price per share – Class A2
| $8.80 |
Net assets – Class A2
| $ 82,003,908 |
Shares outstanding – Class A21
| 9,520,481 |
Net asset value per share – Class A2
| $8.61 |
Net assets – Class C
| $ 6,500,317 |
Shares outstanding – Class C1
| 754,986 |
Net asset value per share – Class C
| $8.61 |
Net assets – Administrator Class
| $ 19,532,548 |
Shares outstanding – Administrator Class1
| 2,276,260 |
Net asset value per share – Administrator Class
| $8.58 |
Net assets – Institutional Class
| $ 2,107,015,619 |
Shares outstanding – Institutional Class1
| 244,601,217 |
Net asset value per share – Institutional Class
| $8.61 |
| 1 | The Fund has an unlimited number of authorized shares |
| 2 | Maximum offering price is computed as 100/98 of net asset value. On investments of $50,000 or more, the offering price is reduced. |
The accompanying notes are an integral part of these financial statements.
Wells Fargo Ultra Short-Term Income Fund | 27
Statement of operations—six months ended February 28, 2021 (unaudited)
| | |
| Investment income | |
Interest (net of foreign withholding taxes of $868)
| $ 12,444,736 |
Dividends
| 996,639 |
Income from affiliated securities
| 34,322 |
Total investment income
| 13,475,697 |
| Expenses | |
Management fee
| 2,179,047 |
| Administration fees | |
Class A
| 210,420 |
Class A2
| 45,029 |
Class C
| 4,375 |
Administrator Class
| 9,382 |
Institutional Class
| 593,276 |
| Shareholder servicing fees | |
Class A
| 328,762 |
Class A2
| 70,358 |
Class C
| 6,821 |
Administrator Class
| 23,429 |
| Distribution fee | |
Class C
| 20,405 |
Custody and accounting fees
| 27,042 |
Professional fees
| 32,131 |
Registration fees
| 38,201 |
Shareholder report expenses
| 19,088 |
Trustees’ fees and expenses
| 9,557 |
Other fees and expenses
| 11,356 |
Total expenses
| 3,628,679 |
| Less: Fee waivers and/or expense reimbursements | |
Fund-level
| (766,204) |
Class A
| (125,276) |
Class A2
| (21,796) |
Class C
| (2,073) |
Administrator Class
| (1,765) |
Net expenses
| 2,711,565 |
Net investment income
| 10,764,132 |
| Realized and unrealized gains (losses) on investments | |
| Net realized gains (losses) on | |
Unaffiliated securities
| 3,446,724 |
Affiliated securities
| (56,940) |
Futures contracts
| 418,363 |
Net realized gains on investments
| 3,808,147 |
| Net change in unrealized gains (losses) on | |
Unaffiliated securities
| (324,745) |
Futures contracts
| 1,246,431 |
Net change in unrealized gains (losses) on investments
| 921,686 |
Net realized and unrealized gains (losses) on investments
| 4,729,833 |
Net increase in net assets resulting from operations
| $15,493,965 |
The accompanying notes are an integral part of these financial statements.
28 | Wells Fargo Ultra Short-Term Income Fund
Statement of changes in net assets
| | |
| | Six months ended
February 28, 2021
(unaudited) | Year ended
August 31, 2020 |
| Operations | | | | |
Net investment income
| | $ 10,764,132 | | $ 22,903,129 |
Net realized gains (losses) on investments
| | 3,808,147 | | (2,227,885) |
Net change in unrealized gains (losses) on investments
| | 921,686 | | 5,858,585 |
Net increase in net assets resulting from operations
| | 15,493,965 | | 26,533,829 |
| Distributions to shareholders from | | | | |
| Net investment income and net realized gains | | | | |
Class A
| | (1,379,091) | | (3,964,308) |
Class A2
| | (283,744) | | (30,109) 1 |
Class C
| | (7,761) | | (52,076) |
Administrator Class
| | (96,114) | | (305,804) |
Institutional Class
| | (9,411,051) | | (18,189,256) |
Total distributions to shareholders
| | (11,177,761) | | (22,541,553) |
| Capital share transactions | Shares | | Shares | |
| Proceeds from shares sold | | | | |
Class A
| 11,177,944 | 96,192,768 | 8,329,991 | 71,282,611 |
Class A2
| 9,863,548 | 84,855,983 | 3,699,192 1 | 31,741,098 1 |
Class C
| 377,978 | 3,252,285 | 326,075 | 2,771,975 |
Administrator Class
| 1,100,100 | 9,425,364 | 885,043 | 7,527,535 |
Institutional Class
| 182,212,689 | 1,568,127,478 | 97,580,721 | 833,509,510 |
| | | 1,761,853,878 | | 946,832,729 |
| Reinvestment of distributions | | | | |
Class A
| 154,863 | 1,332,931 | 449,530 | 3,833,027 |
Class A2
| 32,958 | 283,579 | 3,494 1 | 30,011 1 |
Class C
| 867 | 7,453 | 6,034 | 51,385 |
Administrator Class
| 11,000 | 94,249 | 35,133 | 298,099 |
Institutional Class
| 513,243 | 4,417,529 | 1,111,053 | 9,469,223 |
| | | 6,135,741 | | 13,681,745 |
| Payment for shares redeemed | | | | |
Class A
| (5,909,248) | (50,875,858) | (6,943,941) | (59,012,666) |
Class A2
| (3,863,641) | (33,248,177) | (215,070) 1 | (1,847,277) 1 |
Class C
| (227,760) | (1,958,806) | (344,149) | (2,912,841) |
Administrator Class
| (629,194) | (5,396,189) | (742,061) | (6,251,836) |
Institutional Class
| (55,040,145) | (473,752,849) | (79,721,788) | (677,493,195) |
| | | (565,231,879) | | (747,517,815) |
Net increase in net assets resulting from capital share transactions
| | 1,202,757,740 | | 212,996,659 |
Total increase in net assets
| | 1,207,073,944 | | 216,988,935 |
| Net assets | | | | |
Beginning of period
| | 1,287,954,033 | | 1,070,965,098 |
End of period
| | $2,495,027,977 | | $1,287,954,033 |
| 1 | For the period from May 29, 2020 (commencement of class operations) to August 31, 2020 |
The accompanying notes are an integral part of these financial statements.
Wells Fargo Ultra Short-Term Income Fund | 29
Financial highlights
(For a share outstanding throughout each period)
| | | Year ended August 31 |
| Class A | Six months ended
February 28, 2021
(unaudited) | 2020 | 2019 | 2018 | 2017 | 2016 |
Net asset value, beginning of period
| $8.60 | $8.54 | $8.46 | $8.48 | $8.49 | $8.46 |
Net investment income
| 0.04 | 0.16 | 0.17 | 0.13 | 0.09 | 0.08 |
Net realized and unrealized gains (losses) on investments
| 0.03 | 0.06 | 0.08 | (0.02) | (0.01) | 0.03 |
Total from investment operations
| 0.07 | 0.22 | 0.25 | 0.11 | 0.08 | 0.11 |
| Distributions to shareholders from | | | | | | |
Net investment income
| (0.05) | (0.16) | (0.17) | (0.13) | (0.09) | (0.08) |
Net asset value, end of period
| $8.62 | $8.60 | $8.54 | $8.46 | $8.48 | $8.49 |
Total return1
| 0.76% | 2.62% | 3.04% | 1.24% | 0.97% | 1.28% |
| Ratios to average net assets (annualized) | | | | | | |
Gross expenses
| 0.66% | 0.77% | 0.80% | 0.80% | 0.79% | 0.79% |
Net expenses
| 0.48% | 0.64% | 0.70% | 0.70% | 0.70% | 0.70% |
Net investment income
| 1.01% | 1.92% | 2.05% | 1.47% | 1.09% | 0.93% |
| Supplemental data | | | | | | |
Portfolio turnover rate
| 47% | 68% | 36% | 55% | 56% | 51% |
Net assets, end of period (000s omitted)
| $279,976 | $232,660 | $215,503 | $243,909 | $274,079 | $319,565 |
| 1 | Total return calculations do not include any sales charges. Returns for periods of less than one year are not annualized. |
The accompanying notes are an integral part of these financial statements.
30 | Wells Fargo Ultra Short-Term Income Fund
Financial highlights
(For a share outstanding throughout each period)
| | | Year ended August 31 |
| Class A2 | Six months ended
February 28, 2021
(unaudited) | 2020 1 |
Net asset value, beginning of period
| $8.59 | $8.52 |
Net investment income
| 0.04 | 0.03 |
Net realized and unrealized gains on investments
| 0.02 | 0.07 |
Total from investment operations
| 0.06 | 0.10 |
| Distributions to shareholders from | | |
Net investment income
| (0.04) | (0.03) |
Net asset value, end of period
| $8.61 | $8.59 |
Total return2
| 0.75% | 1.22% |
| Ratios to average net assets (annualized) | | |
Gross expenses
| 0.66% | 0.66% |
Net expenses
| 0.50% | 0.50% |
Net investment income
| 0.96% | 1.38% |
| Supplemental data | | |
Portfolio turnover rate
| 47% | 68% |
Net assets, end of period (000s omitted)
| $82,004 | $29,971 |
| 1 | For the period from May 29, 2020 (commencement of class operations) to August 31, 2020 |
| 2 | Returns for periods of less than one year are not annualized. |
The accompanying notes are an integral part of these financial statements.
Wells Fargo Ultra Short-Term Income Fund | 31
Financial highlights
(For a share outstanding throughout each period)
| | | Year ended August 31 |
| Class C | Six months ended
February 28, 2021
(unaudited) | 2020 | 2019 | 2018 | 2017 | 2016 |
Net asset value, beginning of period
| $8.59 | $8.54 | $8.46 | $8.47 | $8.48 | $8.45 |
Net investment income
| 0.02 | 0.10 | 0.11 | 0.06 | 0.02 | 0.01 |
Net realized and unrealized gains (losses) on investments
| 0.01 | 0.05 | 0.08 | (0.01) | 0.00 | 0.03 |
Total from investment operations
| 0.03 | 0.15 | 0.19 | 0.05 | 0.02 | 0.04 |
| Distributions to shareholders from | | | | | | |
Net investment income
| (0.01) | (0.10) | (0.11) | (0.06) | (0.03) | (0.01) |
Net asset value, end of period
| $8.61 | $8.59 | $8.54 | $8.46 | $8.47 | $8.48 |
Total return1
| 0.38% | 1.73% | 2.27% | 0.60% | 0.22% | 0.52% |
| Ratios to average net assets (annualized) | | | | | | |
Gross expenses
| 1.41% | 1.51% | 1.55% | 1.55% | 1.54% | 1.54% |
Net expenses
| 1.25% | 1.40% | 1.45% | 1.45% | 1.45% | 1.45% |
Net investment income
| 0.24% | 1.16% | 1.31% | 0.72% | 0.34% | 0.17% |
| Supplemental data | | | | | | |
Portfolio turnover rate
| 47% | 68% | 36% | 55% | 56% | 51% |
Net assets, end of period (000s omitted)
| $6,500 | $5,187 | $5,257 | $5,056 | $5,760 | $7,464 |
| 1 | Total return calculations do not include any sales charges. Returns for periods of less than one year are not annualized. |
The accompanying notes are an integral part of these financial statements.
32 | Wells Fargo Ultra Short-Term Income Fund
Financial highlights
(For a share outstanding throughout each period)
| | | Year ended August 31 |
| Administrator Class | Six months ended
February 28, 2021
(unaudited) | 2020 | 2019 | 2018 | 2017 | 2016 |
Net asset value, beginning of period
| $8.56 | $8.51 | $8.43 | $8.45 | $8.46 | $8.42 |
Net investment income
| 0.04 1 | 0.17 | 0.19 | 0.13 | 0.10 | 0.09 |
Net realized and unrealized gains (losses) on investments
| 0.02 | 0.05 | 0.08 | (0.01) | (0.01) | 0.04 |
Total from investment operations
| 0.06 | 0.22 | 0.27 | 0.12 | 0.09 | 0.13 |
| Distributions to shareholders from | | | | | | |
Net investment income
| (0.04) | (0.17) | (0.19) | (0.14) | (0.10) | (0.09) |
Net asset value, end of period
| $8.58 | $8.56 | $8.51 | $8.43 | $8.45 | $8.46 |
Total return2
| 0.75% | 2.61% | 3.19% | 1.39% | 1.12% | 1.55% |
| Ratios to average net assets (annualized) | | | | | | |
Gross expenses
| 0.60% | 0.71% | 0.74% | 0.74% | 0.73% | 0.73% |
Net expenses
| 0.50% | 0.54% | 0.55% | 0.55% | 0.55% | 0.55% |
Net investment income
| 0.98% | 2.03% | 2.20% | 1.54% | 1.24% | 1.05% |
| Supplemental data | | | | | | |
Portfolio turnover rate
| 47% | 68% | 36% | 55% | 56% | 51% |
Net assets, end of period (000s omitted)
| $19,533 | $15,359 | $13,748 | $15,037 | $27,245 | $26,679 |
| 1 | Calculated based upon average shares outstanding |
| 2 | Returns for periods of less than one year are not annualized. |
The accompanying notes are an integral part of these financial statements.
Wells Fargo Ultra Short-Term Income Fund | 33
Financial highlights
(For a share outstanding throughout each period)
| | | Year ended August 31 |
| Institutional Class | Six months ended
February 28, 2021
(unaudited) | 2020 | 2019 | 2018 | 2017 | 2016 |
Net asset value, beginning of period
| $8.59 | $8.54 | $8.46 | $8.48 | $8.49 | $8.45 |
Net investment income
| 0.05 | 0.19 | 0.20 | 0.15 | 0.12 | 0.11 |
Net realized and unrealized gains (losses) on investments
| 0.03 | 0.05 | 0.08 | (0.02) | (0.01) | 0.04 |
Total from investment operations
| 0.08 | 0.24 | 0.28 | 0.13 | 0.11 | 0.15 |
| Distributions to shareholders from | | | | | | |
Net investment income
| (0.06) | (0.19) | (0.20) | (0.15) | (0.12) | (0.11) |
Net asset value, end of period
| $8.61 | $8.59 | $8.54 | $8.46 | $8.48 | $8.49 |
Total return1
| 0.88% | 2.83% | 3.40% | 1.59% | 1.33% | 1.75% |
| Ratios to average net assets (annualized) | | | | | | |
Gross expenses
| 0.33% | 0.44% | 0.47% | 0.47% | 0.46% | 0.46% |
Net expenses
| 0.25% | 0.32% | 0.35% | 0.35% | 0.35% | 0.35% |
Net investment income
| 1.22% | 2.25% | 2.41% | 1.80% | 1.43% | 1.27% |
| Supplemental data | | | | | | |
Portfolio turnover rate
| 47% | 68% | 36% | 55% | 56% | 51% |
Net assets, end of period (000s omitted)
| $2,107,016 | $1,004,777 | $836,456 | $744,844 | $1,061,908 | $1,197,514 |
| 1 | Returns for periods of less than one year are not annualized. |
The accompanying notes are an integral part of these financial statements.
34 | Wells Fargo Ultra Short-Term Income Fund
Notes to financial statements (unaudited)
1. ORGANIZATION
Wells Fargo Funds Trust (the “Trust”), a Delaware statutory trust organized on March 10, 1999, is an open-end management investment company registered under the Investment Company Act of 1940, as amended (the “1940 Act”). As an investment company, the Trust follows the accounting and reporting guidance in Financial Accounting Standards Board (“FASB”) Accounting Standards Codification Topic 946, Financial Services – Investment Companies. These financial statements report on the Wells Fargo Ultra Short-Term Income Fund (the “Fund”) which is a diversified series of the Trust.
On February 23, 2021, Wells Fargo & Company announced that it has entered into a definitive agreement to sell Wells Fargo Asset Management (“WFAM”) to GTCR LLC and Reverence Capital Partners, L.P. WFAM is the trade name used by the asset management businesses of Wells Fargo & Company and includes Wells Fargo Funds Management, LLC, the investment manager to the Fund, Wells Capital Management Incorporated and Wells Fargo Asset Management (International) Limited, both registered investment advisers providing sub-advisory services to certain funds, and Wells Fargo Funds Distributor, LLC, the Fund's principal underwriter. As part of the transaction, Wells Fargo & Company will own a 9.9% equity interest and will continue to serve as an important client and distribution partner. The transaction is expected to close in the second half of 2021, subject to customary closing conditions.
Consummation of the transaction will result in the automatic termination of the Fund's investment management agreement and sub-advisory agreement. The Fund's Board of Trustees will be asked to approve new investment management arrangements with the new company. If approved by the Board, the new investment management arrangements with the new company will be presented to the shareholders of the Fund for approval, and, if approved by shareholders, would take effect upon the closing of the transaction. The transaction is expected to close in the second half of 2021, subject to customary closing conditions.
2. SIGNIFICANT ACCOUNTING POLICIES
The following significant accounting policies, which are consistently followed in the preparation of the financial statements of the Fund, are in conformity with U.S. generally accepted accounting principles which require management to make estimates and assumptions that affect the reported amounts of assets and liabilities, disclosure of contingent assets and liabilities at the date of the financial statements, and the reported amounts of income and expenses during the reporting period. Actual results could differ from those estimates.
Securities valuation
All investments are valued each business day as of the close of regular trading on the New York Stock Exchange (generally 4 p.m. Eastern Time), although the Fund may deviate from this calculation time under unusual or unexpected circumstances.
Equity securities and futures contracts that are listed on a foreign or domestic exchange or market are valued at the official closing price or, if none, the last sales price. If no sale occurs on the principal exchange or market that day, a fair value price will be determined in accordance with the Fund’s Valuation Procedures.
Debt securities are valued at the evaluated bid price provided by an independent pricing service (e.g. taking into account various factors, including yields, maturities, or credit ratings) or, if a reliable price is not available, the quoted bid price from an independent broker-dealer.
Investments in registered open-end investment companies are valued at net asset value. Interests in non-registered investment companies that are redeemable at net asset value are fair valued normally at net asset value.
Investments which are not valued using any of the methods discussed above are valued at their fair value, as determined in good faith by the Board of Trustees. The Board of Trustees has established a Valuation Committee comprised of the Trustees and has delegated to it the authority to take any actions regarding the valuation of portfolio securities that the Valuation Committee deems necessary or appropriate, including determining the fair value of portfolio securities, unless the determination has been delegated to the Wells Fargo Asset Management Pricing Committee at Wells Fargo Funds Management, LLC (“Funds Management”). The Board of Trustees retains the authority to make or ratify any valuation decisions or approve any changes to the Valuation Procedures as it deems appropriate. On a quarterly basis, the Board of Trustees receives reports on any valuation actions taken by the Valuation Committee or the Wells Fargo Asset Management Pricing Committee which may include items for ratification.
Securities lending
The Fund may lend its securities from time to time in order to earn additional income in the form of fees or interest on securities received as collateral or the investment of any cash received as collateral. When securities are on loan, the Fund receives interest or dividends on those securities. Cash collateral received in connection with its securities lending transactions
Wells Fargo Ultra Short-Term Income Fund | 35
Notes to financial statements (unaudited)
is invested in Securities Lending Cash Investments, LLC (the “Securities Lending Fund”). Investments in Securities Lending Fund are valued at the evaluated bid price provided by an independent pricing service. Income earned from investment in the Securities Lending Fund (net of fees and rebates), if any, is included in income from affiliated securities on the Statement of Operations.
In a securities lending transaction, the net asset value of the Fund is affected by an increase or decrease in the value of the securities loaned and by an increase or decrease in the value of the instrument in which collateral is invested. The amount of securities lending activity undertaken by the Fund fluctuates from time to time. The Fund has the right under the lending agreement to recover the securities from the borrower on demand. In the event of default or bankruptcy by the borrower, the Fund may be prevented from recovering the loaned securities or gaining access to the collateral or may experience delays or costs in doing so. In such an event, the terms of the agreement allow the unaffiliated securities lending agent to use the collateral to purchase replacement securities on behalf of the Fund or pay the Fund the market value of the loaned securities. The Fund bears the risk of loss with respect to depreciation of its investment of the cash collateral.
When-issued transactions
The Fund may purchase securities on a forward commitment or when-issued basis. The Fund records a when-issued transaction on the trade date and will segregate assets in an amount at least equal in value to the Fund's commitment to purchase when-issued securities. Securities purchased on a when-issued basis are marked-to-market daily and the Fund begins earning interest on the settlement date. Losses may arise due to changes in the market value of the underlying securities or if the counterparty does not perform under the contract.
Futures contracts
Futures contracts are agreements between the Fund and a counterparty to buy or sell a specific amount of a commodity, financial instrument or currency at a specified price on a specified date. The Fund may buy and sell futures contracts in order to gain exposure to, or protect against, changes in interest rates and is subject to interest rate risk. The primary risks associated with the use of futures contracts are the imperfect correlation between changes in market values of securities held by the Fund and the prices of futures contracts, and the possibility of an illiquid market. Futures contracts are generally entered into on a regulated futures exchange and cleared through a clearinghouse associated with the exchange. With futures contracts, there is minimal counterparty risk to the Fund since futures contracts are exchange traded and the exchange’s clearinghouse, as the counterparty to all exchange traded futures, guarantees the futures contracts against default.
Upon entering into a futures contract, the Fund is required to deposit either cash or securities (initial margin) with the broker in an amount equal to a certain percentage of the contract value. Subsequent payments (variation margin) are paid to or from the broker each day equal to the daily changes in the contract value. Such payments are recorded as unrealized gains or losses and, if any, shown as variation margin receivable (payable) in the Statement of Assets and Liabilities. Should the Fund fail to make requested variation margin payments, the broker can gain access to the initial margin to satisfy the Fund’s payment obligations. When the contracts are closed, a realized gain or loss is recorded in the Statement of Operations.
Security transactions and income recognition
Securities transactions are recorded on a trade date basis. Realized gains or losses are recorded on the basis of identified cost.
Dividend income is recognized on the ex-dividend date.
Interest income is accrued daily and bond discounts are accreted and premiums are amortized daily. To the extent debt obligations are placed on non-accrual status, any related interest income may be reduced by writing off interest receivables when the collection of all or a portion of interest has been determined to be doubtful based on consistently applied procedures and the fair value has decreased. If the issuer subsequently resumes interest payments or when the collectability of interest is reasonably assured, the debt obligation is removed from non-accrual status.
Income is recorded net of foreign taxes withheld where recovery of such taxes is not assured.
Income dividends and capital gain distributions from investment companies are recorded on the ex-dividend date. Capital gain distributions from investment companies are treated as realized gains.
Distributions to shareholders
Distributions to shareholders from net investment income are declared daily and paid monthly. Distributions from net realized gains, if any, are recorded on the ex-dividend date and paid at least annually. Such distributions are determined in accordance with income tax regulations and may differ from U.S. generally accepted accounting principles. Dividend sources are estimated at the time of declaration. The tax character of distributions is determined as of the Fund’s fiscal year end. Therefore, a portion of the Fund’s distributions made prior to the Fund’s fiscal year end may be categorized as a tax return of capital at year end.
36 | Wells Fargo Ultra Short-Term Income Fund
Notes to financial statements (unaudited)
Federal and other taxes
The Fund intends to continue to qualify as a regulated investment company by distributing substantially all of its investment company taxable income and any net realized capital gains (after reduction for capital loss carryforwards) sufficient to relieve it from all, or substantially all, federal income taxes. Accordingly, no provision for federal income taxes was required.
The Fund’s income and federal excise tax returns and all financial records supporting those returns for the prior three fiscal years are subject to examination by the federal and Delaware revenue authorities. Management has analyzed the Fund's tax positions taken on federal, state, and foreign tax returns for all open tax years and does not believe that there are any uncertain tax positions that require recognition of a tax liability.
As of February 28, 2021, the aggregate cost of all investments for federal income tax purposes was $2,635,790,819 and the unrealized gains (losses) consisted of:
| Gross unrealized gains | $17,409,227 |
| Gross unrealized losses | (2,550,256) |
| Net unrealized gains | $14,858,971 |
As of August 31, 2020, the Fund had capital loss carryforwards which consisted of $3,429,987 in short-term capital losses and $28,918,817 in long-term capital losses.
Class allocations
The separate classes of shares offered by the Fund differ principally in applicable sales charges, distribution, shareholder servicing, and administration fees. Class specific expenses are charged directly to that share class. Investment income, common fund-level expenses, and realized and unrealized gains (losses) on investments are allocated daily to each class of shares based on the relative proportion of net assets of each class.
3. FAIR VALUATION MEASUREMENTS
Fair value measurements of investments are determined within a framework that has established a fair value hierarchy based upon the various data inputs utilized in determining the value of the Fund’s investments. The three-level hierarchy gives the highest priority to unadjusted quoted prices in active markets for identical assets or liabilities (Level 1) and the lowest priority to unobservable inputs (Level 3). The Fund’s investments are classified within the fair value hierarchy based on the lowest level of input that is significant to the fair value measurement. The inputs are summarized into three broad levels as follows:
| ■ | Level 1 – quoted prices in active markets for identical securities |
| ■ | Level 2 – other significant observable inputs (including quoted prices for similar securities, interest rates, prepayment speeds, credit risk, etc.) |
| ■ | Level 3 – significant unobservable inputs (including the Fund’s own assumptions in determining the fair value of investments) |
The inputs or methodologies used for valuing investments in securities are not necessarily an indication of the risk associated with investing in those securities.
Wells Fargo Ultra Short-Term Income Fund | 37
Notes to financial statements (unaudited)
The following is a summary of the inputs used in valuing the Fund’s assets and liabilities as of February 28, 2021:
| | Quoted prices
(Level 1) | Other significant
observable inputs
(Level 2) | Significant
unobservable inputs
(Level 3) | Total |
| Assets | | | | |
| Investments in: | | | | |
| Agency securities | $ 0 | $ 147,782,724 | $0 | $ 147,782,724 |
| Asset-backed securities | 0 | 367,880,062 | 0 | 367,880,062 |
| Corporate bonds and notes | 0 | 612,599,634 | 0 | 612,599,634 |
| Exchange-traded funds | 100,855,348 | 0 | 0 | 100,855,348 |
| Municipal obligations | 0 | 7,811,702 | 0 | 7,811,702 |
| Non-agency mortgage-backed securities | 0 | 482,289,005 | 0 | 482,289,005 |
| Yankee corporate bonds and notes | 0 | 316,062,567 | 0 | 316,062,567 |
| Yankee government bonds | 0 | 42,241,036 | 0 | 42,241,036 |
| Short-term investments | | | | |
| Commercial paper | 0 | 305,303,807 | 0 | 305,303,807 |
| Investment companies | 216,797,503 | 0 | 0 | 216,797,503 |
| U.S. Treasury securities | 0 | 49,999,928 | 0 | 49,999,928 |
| | 317,652,851 | 2,331,970,465 | 0 | 2,649,623,316 |
| Futures contracts | 1,026,474 | 0 | 0 | 1,026,474 |
| Total assets | $318,679,325 | $2,331,970,465 | $0 | $2,650,649,790 |
Futures contracts are reported at their cumulative unrealized gains (losses) at measurement date as reported in the table following the Portfolio of Investments. For futures contracts, the current day’s variation margin is reported on the Statement of Assets and Liabilities. All other assets and liabilities are reported at their market value at measurement date.
Additional sector, industry or geographic detail, if any, is included in the Portfolio of Investments.
For the six months ended February 28, 2021, the Fund did not have any transfers into/out of Level 3.
4. TRANSACTIONS WITH AFFILIATES
Management fee
Funds Management, an indirect wholly owned subsidiary of Wells Fargo & Company (“Wells Fargo”), is the manager of the Fund and provides advisory and fund-level administrative services under an investment management agreement. Under the investment management agreement, Funds Management is responsible for, among other services, implementing the investment objectives and strategies of the Fund, supervising the subadviser and providing fund-level administrative services in connection with the Fund’s operations. As compensation for its services under the investment management agreement, Funds Management is entitled to receive a management fee at the following annual rate based on the Fund’s average daily net assets:
| Average daily net assets | Management fee |
| First $1 billion | 0.250% |
| Next $4 billion | 0.225 |
| Next $5 billion | 0.190 |
| Over $10 billion | 0.180 |
For the six months ended February 28, 2021, the management fee was equivalent to an annual rate of 0.24% of the Fund’s average daily net assets.
Funds Management has retained the services of a subadviser to provide daily portfolio management to the Fund. The fee for subadvisory services is borne by Funds Management. Wells Capital Management Incorporated ("WellsCap"), an affiliate of Funds Management and an indirect wholly owned subsidiary of Wells Fargo, is the subadviser to the Fund and is entitled to receive a fee from Funds Management at an annual rate starting at 0.15% and declining to 0.05% as the average daily net assets of the Fund increase.
38 | Wells Fargo Ultra Short-Term Income Fund
Notes to financial statements (unaudited)
Administration fees
Under a class-level administration agreement, Funds Management provides class-level administrative services to the Fund, which includes paying fees and expenses for services provided by the transfer agent, sub-transfer agents, omnibus account servicers and record-keepers. As compensation for its services under the class-level administration agreement, Funds Management receives an annual fee which is calculated based on the average daily net assets of each class as follows:
| | Class-level
administration fee |
| Class A | 0.16% |
| Class A2 | 0.16 |
| Class C | 0.16 |
| Administrator Class | 0.10 |
| Institutional Class | 0.08 |
Waivers and/or expense reimbursements
Funds Management has contractually waived and/or reimbursed management and administration fees to the extent necessary to maintain certain net operating expense ratios for the Fund. When each class of the Fund has exceeded its expense cap, Funds Management has waived fees and/or reimbursed expenses from fund-level expenses on a proportionate basis and then from class specific expenses. When only certain classes exceed their expense caps, waivers and/or reimbursements are applied against class specific expenses before fund-level expenses. Funds Management has committed through December 31, 2021 to waive fees and/or reimburse expenses to the extent necessary to cap expenses. Prior to or after the commitment expiration date, the cap may be increased or the commitment to maintain the cap may be terminated only with the approval of the Board of Trustees. The contractual expense caps are as follows:
| | Expense ratio caps |
| Class A | 0.50% |
| Class A2 | 0.50 |
| Class C | 1.25 |
| Administrator Class | 0.50 |
| Institutional Class | 0.25 |
Distribution fee
The Trust has adopted a distribution plan for Class C shares of the Fund pursuant to Rule 12b-1 under the 1940 Act. A distribution fee is charged charged to Class C shares and paid to Wells Fargo Funds Distributor, LLC (“Funds Distributor”), the principal underwriter, at an annual rate of 0.75% of the average daily net assets of Class C shares.
In addition, Funds Distributor is entitled to receive the front-end sales charge from the purchase of Class A shares and a contingent deferred sales charge on the redemption of certain Class A shares. Funds Distributor is also entitled to receive the contingent deferred sales charges from redemptions of Class C shares. For the six months ended February 28, 2021, Funds Distributor received $3,484 from the sale of Class A shares. No contingent deferred sales charges were incurred by Class A and Class C shares for the six months ended February 28, 2021.
Shareholder servicing fees
The Trust has entered into contracts with one or more shareholder servicing agents, whereby Class A, Class A2, Class C, and Administrator Class of the Fund are charged a fee at an annual rate of 0.25% of the average daily net assets of each respective class. A portion of these total shareholder servicing fees were paid to affiliates of Wells Fargo.
Interfund transactions
The Fund may purchase or sell portfolio investment securities to certain other Wells Fargo affiliates pursuant to Rule 17a-7 under the 1940 Act and under procedures adopted by the Board of Trustees. The procedures have been designed to ensure that these interfund transactions, which do not incur broker commissions, are effected at current market prices.
Wells Fargo Ultra Short-Term Income Fund | 39
Notes to financial statements (unaudited)
5. INVESTMENT PORTFOLIO TRANSACTIONS
Purchases and sales of investments, excluding short-term securities, for the six months ended February 28, 2021 were as follows:
| Purchases at cost | | Sales proceeds |
U.S.
government | Non-U.S.
government | | U.S.
government | Non-U.S.
government |
| $545,418,590 | $1,374,150,203 | | $431,417,800 | $255,781,184 |
6. SECURITIES LENDING TRANSACTIONS
The Fund lends its securities through an unaffiliated securities lending agent and receives collateral in the form of cash or securities with a value at least equal to the value of the securities on loan. The value of the loaned securities is determined at the close of each business day and any increases or decreases in the required collateral are exchanged between the Fund and the counterparty on the next business day. Cash collateral received is invested in the Securities Lending Fund which seeks to provide a positive return compared to the daily Federal Funds Open Rate by investing in high-quality, U.S. dollar-denominated short-term money market instruments and is exempt from registration under Section 3(c)(7) of the 1940 Act. Securities Lending Fund is managed by Funds Management and is subadvised by WellsCap. Funds Management receives an advisory fee starting at 0.05% and declining to 0.01% as the average daily net assets of the Securities Lending Fund increase. All of the fees received by Funds Management are paid to WellsCap for its services as subadviser.
In the event of counterparty default or the failure of a borrower to return a loaned security, the Fund has the right to use the collateral to offset any losses incurred. As of February 28, 2021, the Fund had securities lending transactions with the following counterparties which are subject to offset:
| Counterparty | Value of
securities on
loan | Collateral
received1 | Net amount |
| Barclays Capital Inc. | $1,982,286 | $(1,982,286) | 0 |
| Citigroup Global Markets Inc. | 3,614,153 | (3,614,153) | 0 |
| Morgan Stanley & Co. LLC | 30,160 | (30,160) | 0 |
1 Collateral received within this table is limited to the collateral for the net transaction with the counterparty.
7. DERIVATIVE TRANSACTIONS
During the six months ended February 28, 2021, the Fund entered into futures contracts to speculate on interest rates and to help manage the duration of the portfolio. The Fund had an average notional amount of $407,098,288 in short futures contracts during the six months ended February 28, 2021.
The fair value, realized gains or losses and change in unrealized gains or losses, if any, on derivative instruments are reflected in the corresponding financial statement captions.
8. BANK BORROWINGS
The Trust (excluding the money market funds), Wells Fargo Master Trust and Wells Fargo Variable Trust are parties to a $350,000,000 revolving credit agreement whereby the Fund is permitted to use bank borrowings for temporary or emergency purposes, such as to fund shareholder redemption requests. Interest under the credit agreement is charged to the Fund based on a borrowing rate equal to the higher of the Federal Funds rate in effect on that day plus 1.25% or the overnight LIBOR rate in effect on that day plus 1.25%. In addition, an annual commitment fee equal to 0.25% of the unused balance is allocated to each participating fund.
For the six months ended February 28, 2021, there were no borrowings by the Fund under the agreement.
9. INDEMNIFICATION
Under the Fund's organizational documents, the officers and Trustees have been granted certain indemnification rights against certain liabilities that may arise out of performance of their duties to the Fund. The Fund has entered into a separate agreement with each Trustee that converts indemnification rights currently existing under the Fund’s organizational
40 | Wells Fargo Ultra Short-Term Income Fund
Notes to financial statements (unaudited)
documents into contractual rights that cannot be changed in the future without the consent of the Trustee. Additionally, in the normal course of business, the Fund may enter into contracts with service providers that contain a variety of indemnification clauses. The Fund’s maximum exposure under these arrangements is dependent on future claims that may be made against the Fund and, therefore, cannot be estimated.
10. CORONAVIRUS (COVID-19) PANDEMIC
On March 11, 2020, the World Health Organization announced that it had made the assessment that coronavirus disease 2019 (“COVID-19”) is a pandemic. The impacts of COVID-19 are affecting the entire global economy, individual companies and investment products, the funds, and the market in general. There is significant uncertainty around the extent and duration of business disruptions related to COVID-19 and the impacts may last for an extended period of time. COVID-19 has led to significant uncertainty and volatility in the financial markets.
Wells Fargo Ultra Short-Term Income Fund | 41
Other information (unaudited)
PROXY VOTING INFORMATION
A description of the policies and procedures used to determine how to vote proxies relating to portfolio securities is available without charge, upon request, by calling 1-800-222-8222, visiting our website at wfam.com, or visiting the SEC website at sec.gov. Information regarding how the proxies related to portfolio securities were voted during the most recent 12-month period ended June 30 is available on the website at wfam.com or by visiting the SEC website at sec.gov.
QUARTERLY PORTFOLIO HOLDINGS INFORMATION
The Fund files its complete schedule of portfolio holdings with the SEC for the first and third quarters of each fiscal year as an exhibit to its reports on Form N-PORT. Shareholders may view the filed Form N-PORT by visiting the SEC website at sec.gov.
42 | Wells Fargo Ultra Short-Term Income Fund
Other information (unaudited)
BOARD OF TRUSTEES AND OFFICERS
Each of the Trustees and Officers listed in the table below acts in identical capacities for each fund in the Wells Fargo family of funds, which consists of 144 mutual funds comprising the Wells Fargo Funds Trust, Wells Fargo Variable Trust, Wells Fargo Master Trust and four closed-end funds (collectively the “Fund Complex”). This table should be read in conjunction with the Prospectus and the Statement of Additional Information1. The mailing address of each Trustee and Officer is 525 Market Street, 12th Floor, San Francisco, CA 94105. Each Trustee and Officer serves an indefinite term, however, each Trustee serves such term until reaching the mandatory retirement age established by the Trustees.
Independent Trustees
Name and
year of birth | Position held and
length of service* | Principal occupations during past five years or longer | Current other
public company or
investment
company
directorships |
William R. Ebsworth
(Born 1957) | Trustee,
since 2015 | Retired. From 1984 to 2013, equities analyst, portfolio manager, research director and chief investment officer at Fidelity Management and Research Company in Boston, Tokyo, and Hong Kong, and retired in 2013 as Chief Investment Officer of Fidelity Strategic Advisers, Inc. where he led a team of investment professionals managing client assets. Prior thereto, Board member of Hong Kong Securities Clearing Co., Hong Kong Options Clearing Corp., the Thailand International Fund, Ltd., Fidelity Investments Life Insurance Company, and Empire Fidelity Investments Life Insurance Company. Audit Committee Chair and Investment Committee Chair of the Vincent Memorial Hospital Endowment (non-profit organization). Mr. Ebsworth is a CFA® charterholder. | N/A |
Jane A. Freeman
(Born 1953) | Trustee,
since 2015;
Chair Liaison,
since 2018 | Retired. From 2012 to 2014 and 1999 to 2008, Chief Financial Officer of Scientific Learning Corporation. From 2008 to 2012, Ms. Freeman provided consulting services related to strategic business projects. Prior to 1999, Portfolio Manager at Rockefeller & Co. and Scudder, Stevens & Clark. Board member of the Harding Loevner Funds from 1996 to 2014, serving as both Lead Independent Director and chair of the Audit Committee. Board member of the Russell Exchange Traded Funds Trust from 2011 to 2012 and the chair of the Audit Committee. Ms. Freeman is also an inactive Chartered Financial Analyst. | N/A |
Isaiah Harris, Jr.
(Born 1952) | Trustee,
since 2009; Audit
Committee
Chair,
since 2019 | Retired. Chairman of the Board of CIGNA Corporation since 2009, and Director since 2005. From 2003 to 2011, Director of Deluxe Corporation. Prior thereto, President and CEO of BellSouth Advertising and Publishing Corp. from 2005 to 2007, President and CEO of BellSouth Enterprises from 2004 to 2005 and President of BellSouth Consumer Services from 2000 to 2003. Emeritus member of the Iowa State University Foundation Board of Governors. Emeritus Member of the Advisory Board of Iowa State University School of Business. Advisory Board Member, Palm Harbor Academy (private school). Mr. Harris is a certified public accountant (inactive status). | CIGNA Corporation |
Judith M. Johnson
(Born 1949) | Trustee,
since 2008 | Retired. Prior thereto, Chief Executive Officer and Chief Investment Officer of Minneapolis Employees Retirement Fund from 1996 to 2008. Ms. Johnson is an attorney, certified public accountant and a certified managerial accountant. | N/A |
David F. Larcker
(Born 1950) | Trustee,
since 2009 | James Irvin Miller Professor of Accounting at the Graduate School of Business (Emeritus), Stanford University, Director of the Corporate Governance Research Initiative and Senior Faculty of The Rock Center for Corporate Governance since 2006. From 2005 to 2008, Professor of Accounting at the Graduate School of Business, Stanford University. Prior thereto, Ernst & Young Professor of Accounting at The Wharton School, University of Pennsylvania from 1985 to 2005. | N/A |
Wells Fargo Ultra Short-Term Income Fund | 43
Other information (unaudited)
Name and
year of birth | Position held and
length of service* | Principal occupations during past five years or longer | Current other
public company or
investment
company
directorships |
Olivia S. Mitchell
(Born 1953) | Trustee,
since 2006;
Nominating and
Governance
Committee Chair,
since 2018 | International Foundation of Employee Benefit Plans Professor, Wharton School of the University of Pennsylvania since 1993. Director of Wharton’s Pension Research Council and Boettner Center on Pensions & Retirement Research, and Research Associate at the National Bureau of Economic Research. Previously, Cornell University Professor from 1978 to 1993. | N/A |
Timothy J. Penny
(Born 1951) | Trustee,
since 1996;
Chair,
since 2018 | President and Chief Executive Officer of Southern Minnesota Initiative Foundation, a non-profit organization, since 2007. Member of the Board of Trustees of NorthStar Education Finance, Inc., a non-profit organization, since 2007. | N/A |
James G. Polisson
(Born 1959) | Trustee,
since 2018 | Retired. Chief Marketing Officer, Source (ETF) UK Services, Ltd, from 2015 to 2017. From 2012 to 2015, Principal of The Polisson Group, LLC, a management consulting, corporate advisory and principal investing company. Chief Executive Officer and Managing Director at Russell Investments, Global Exchange Traded Funds from 2010 to 2012. Managing Director of Barclays Global Investors from 1998 to 2010 and Global Chief Marketing Officer for iShares and Barclays Global Investors from 2000 to 2010. Trustee of the San Francisco Mechanics’ Institute, a non-profit organization, from 2013 to 2015. Board member of the Russell Exchange Traded Fund Trust from 2011 to 2012. Director of Barclays Global Investors Holdings Deutschland GmbH from 2006 to 2009. Mr. Polisson is an attorney and has a retired status with the Massachusetts and District of Columbia Bar Associations. | N/A |
Pamela Wheelock
(Born 1959) | Trustee,
since January
2020; previously
Trustee from
January 2018 to
July 2019 | Board member of the Destination Medical Center Economic Development Agency, Rochester, Minnesota since 2019. Interim President of the McKnight Foundation from January to September 2020. Acting Commissioner, Minnesota Department of Human Services, July 2019 through September 2019. Human Services Manager (part-time), Minnesota Department of Human Services, October 2019 through December 2019. Chief Operating Officer, Twin Cities Habitat for Humanity from 2017 to 2019. Vice President of University Services, University of Minnesota from 2012 to 2016. Prior thereto, on the Board of Directors, Governance Committee and Finance Committee for the Minnesota Philanthropy Partners (Saint Paul Foundation) from 2012 to 2018, Interim Chief Executive Officer of Blue Cross Blue Shield of Minnesota from 2011 to 2012, Chairman of the Board from 2009 to 2012 and Board Director from 2003 to 2015. Vice President, Leadership and Community Engagement, Bush Foundation, Saint Paul, Minnesota (a private foundation) from 2009 to 2011. Executive Vice President and Chief Financial Officer, Minnesota Sports and Entertainment from 2004 to 2009 and Senior Vice President from 2002 to 2004. Executive Vice President of the Minnesota Wild Foundation from 2004 to 2008. Commissioner of Finance, State of Minnesota, from 1999 to 2002. Currently Board Chair of the Minnesota Wild Foundation since 2010. | N/A |
* Length of service dates reflect the Trustee’s commencement of service with the Trust’s predecessor entities, where applicable.
44 | Wells Fargo Ultra Short-Term Income Fund
Other information (unaudited)
Officers
Name and
year of birth | Position held and
length of service | Principal occupations during past five years or longer |
Andrew Owen
(Born 1960) | President,
since 2017 | Executive Vice President of Wells Fargo & Company and Head of Affiliated Managers, Wells Fargo Asset Management, since 2014. In addition, Mr. Owen is currently President, Chief Executive Officer and Director of Wells Fargo Funds Management, LLC since 2017. Prior thereto, Executive Vice President responsible for marketing, investments and product development for Wells Fargo Funds Management, LLC, from 2009 to 2014. |
Jeremy DePalma
(Born 1974) | Treasurer,
since 2012
(for certain funds in
the Fund Complex);
since 2021 (for
the remaining funds in the
Fund Complex) | Senior Vice President of Wells Fargo Funds Management, LLC since 2009. Senior Vice President of Evergreen Investment Management Company, LLC from 2008 to 2010 and head of the Fund Reporting and Control Team within Fund Administration from 2005 to 2010. |
Michelle Rhee
(Born 1966) | Chief Legal Officer,
since 2019 | Secretary of Wells Fargo Funds Management, LLC and Chief Legal Counsel of Wells Fargo Asset Management since 2018. Deputy General Counsel of Wells Fargo Bank, N.A. since 2020 and Assistant General Counsel of Wells Fargo Bank, N.A. from 2018 to 2020. Associate General Counsel and Managing Director of Bank of America Corporation from 2004 to 2018. |
Catherine Kennedy
(Born 1969) | Secretary,
since 2019 | Vice President of Wells Fargo Funds Management, LLC and Senior Counsel of the Wells Fargo Legal Department since 2010. Vice President and Senior Counsel of Evergreen Investment Management Company, LLC from 1998 to 2010. |
Michael H. Whitaker
(Born 1967) | Chief Compliance Officer,
since 2016 | Chief Compliance Officer of Wells Fargo Asset Management since 2016. Senior Vice President and Chief Compliance Officer for Fidelity Investments from 2007 to 2016. |
1 The Statement of Additional Information includes additional information about the Trustees and is available, without charge, upon request, by calling 1-800-222-8222 or by visiting the website at wfam.com.
Wells Fargo Ultra Short-Term Income Fund | 45
For more information
More information about Wells Fargo Funds is available free upon request. To obtain literature, please write, visit the Fund's website, or call:
Wells Fargo Funds
P.O. Box 219967
Kansas City, MO 64121-9967
Website: wfam.com
Individual investors: 1-800-222-8222
Retail investment professionals: 1-888-877-9275
Institutional investment professionals: 1-866-765-0778
This report and the financial statements contained herein are submitted for the general information of the shareholders of the Fund. If this report is used for promotional purposes, distribution of the report must be accompanied or preceded by a current prospectus. Before investing, please consider the investment objectives, risks, charges, and expenses of the investment. For a current prospectus and, if available, a summary prospectus, containing this information, call 1-800-222-8222 or visit the Fund's website at wfam.com. Read the prospectus carefully before you invest or send money.
Wells Fargo Asset Management (WFAM) is the trade name for certain investment advisory/management firms owned by Wells Fargo & Company. These firms include but are not limited to Wells Capital Management Incorporated and Wells Fargo Funds Management, LLC. Certain products managed by WFAM entities are distributed by Wells Fargo Funds Distributor, LLC (a broker-dealer and Member FINRA).
This material is for general informational and educational purposes only and is NOT intended to provide investment advice or a recommendation of any kind - including a recommendation for any specific investment, strategy, or plan.
INVESTMENT PRODUCTS: NOT FDIC INSURED ■ NO BANK GUARANTEE ■ MAY LOSE VALUE
© 2021 Wells Fargo & Company. All rights reserved.
PAR-0321-00298 04-21
SA223/SAR223 02-21
ITEM 2. CODE OF ETHICS
Not applicable.
ITEM 3. AUDIT COMMITTEE FINANCIAL EXPERT
Not applicable.
ITEM 4. PRINCIPAL ACCOUNTANT FEES AND SERVICES
Not applicable.
ITEM 5. AUDIT COMMITTEE OF LISTED REGISTRANTS
Not applicable.
ITEM 6. INVESTMENTS
A Portfolio of Investments for each series of Wells Fargo Funds Trust is included as part of the report to shareholders filed under Item 1 of this Form.
ITEM 7. DISCLOSURE OF PROXY VOTING POLICIES AND PROCEDURES FOR CLOSED-END MANAGEMENT INVESTMENT COMPANIES
Not applicable.
ITEM 8. PORTFOLIO MANAGERS OF CLOSED-END MANAGEMENT INVESTMENT COMPANIES
Not applicable.
ITEM 9. PURCHASES OF EQUITY SECURITIES BY CLOSED-END MANAGEMEENT INVESTMENT COMPANY AND AFFILIATED PURCHASERS
Not applicable.
ITEM 10. SUBMISSION OF MATTERS TO A VOTE OF SECURITY HOLDERS
There have been no material changes to the procedures by which shareholders may recommend nominees to the registrant’s Board of Trustees that have been implemented since the registrant’s last provided disclosure in response to the requirements of this Item.
ITEM 11. CONTROLS AND PROCEDURES
(a) The President and Treasurer have concluded that the Wells Fargo Funds Trust disclosure controls and procedures (as defined in Rule 30a-3(c) under the Investment Company Act of 1940) provide reasonable assurances that material information relating to the registrant is made known to them by the appropriate persons, based on their evaluation of these controls and procedures as of a date within 90 days of the filing of this report.
(b) There were no significant changes in the registrant’s internal controls over financial reporting (as defined in Rule 30a-3(d) under the Investment Company Act of 1940) that occurred during the most recent fiscal half-year of the period covered by this report that materially affected, or is reasonably likely to materially affect, the registrant’s internal control over financial reporting.
ITEM 12. DISCLOSURES OF SECURITIES LENDING ACTIVITES FOR CLOSED-END MANAGEMENT INVESTMENT COMPANIES
Not applicable.
ITEM 13. EXHIBITS
(a)(1) Not applicable.
(a)(2) Certifications pursuant to Section 302 of the Sarbanes-Oxley Act of 2002.
(b) Certifications pursuant to Section 906 of the Sarbanes-Oxley Act of 2002.
SIGNATURES
Pursuant to the requirements of the Securities Exchange Act of 1934 and the Investment Company Act of 1940, the registrant has duly caused this report to be signed on its behalf by the undersigned, thereunto duly authorized.
| | |
| Wells Fargo Funds Trust |
| |
| By: | | |
| | /s/ Andrew Owen |
| |
| | Andrew Owen |
| | President |
| |
| Date: | | April 27, 2021 |
Pursuant to the requirements of the Securities Exchange Act of 1934 and the Investment Company Act of 1940, this report has been signed below by the following persons on behalf of the registrant and in the capacities and on the date indicated.
| | |
| Wells Fargo Funds Trust |
| |
| By: | | |
| | /s/ Andrew Owen |
| |
| | Andrew Owen |
| | President |
| |
| Date: | | April 27, 2021 |
| |
| By: | | |
| | /s/ Jeremy DePalma |
| |
| | Jeremy DePalma |
| | Treasurer |
| |
| Date: | | April 27, 2021 |