UNITED STATES
SECURITIES AND EXCHANGE COMMISSION
Washington, D.C. 20549
FORM N-CSRS
CERTIFIED SHAREHOLDER REPORT OF REGISTERED
MANAGEMENT INVESTMENT COMPANIES
Investment Company Act file number: 811-09253
Allspring Funds Trust
(Exact name of registrant as specified in charter)
525 Market St., San Francisco, CA 94105
(Address of principal executive offices) (Zip code)
Matthew Prasse
Allspring Funds Management, LLC
525 Market St., San Francisco, CA 94105
(Name and address of agent for service)
Registrant’s telephone number, including area code: 800-222-8222
Date of fiscal year end: September 30
Registrant is making a filing for 12 of its series:
Allspring Diversified Capital Builder Fund, Allspring Diversified Income Builder Fund, Allspring Index Asset Allocation Fund, Allspring International Bond Fund, Allspring Income Plus Fund, Allspring Global Investment Grade Credit Fund, Allspring C&B Mid Cap Value Fund, Allspring Common Stock Fund, Allspring Discovery SMID Cap Growth Fund, Allspring Discovery Mid Cap Growth Fund, Allspring Opportunity Fund and Allspring Special Mid Cap Value Fund.
Date of reporting period: March 31, 2022
ITEM 1. REPORT TO STOCKHOLDERS
Semi-Annual Report
March 31, 2022
Allspring
C&B Mid Cap Value Fund
The views expressed and any forward-looking statements are as of March 31, 2022, unless otherwise noted, and are those of the Fund's portfolio managers and/or Allspring Global Investments. Discussions of individual securities or the markets generally are not intended as individual recommendations. Future events or results may vary significantly from those expressed in any forward-looking statements. The views expressed are subject to change at any time in response to changing circumstances in the market. Allspring Global Investments disclaims any obligation to publicly update or revise any views expressed or forward-looking statements.
Allspring C&B Mid Cap Value Fund | 1
Letter to shareholders (unaudited)
Andrew Owen
President
Allspring Funds
Dear Shareholder:
We are pleased to offer you this semi-annual report for Allspring C&B Mid Cap Value Fund for the six-month period that ended March 31, 2022. Global stocks and bonds broadly declined during a challenging period. Despite progress on a global economic recovery from COVID-19, persistently high inflation, concerns regarding anticipated tightening of central bank monetary policy, and turmoil caused by the Russian invasion of Ukraine all led to a retreat from financial market gains made earlier in 2021. Among major indexes, the U.S. large-cap-dominated S&P 500 Index was an exception in escaping a half-year loss.
For the six-month period, U.S. stocks, based on the S&P 500 Index,1 gained 5.92%. International stocks, as measured by the MSCI ACWI ex USA Index (Net),2 returned -3.72%, while the MSCI EM Index (Net) (USD),3 trailed both developed market benchmarks with a return of -8.20%. The Bloomberg U.S. Aggregate Bond Index,4returned -5.92%, the Bloomberg Global Aggregate ex-USD Index (unhedged),5 returned -7.26%, the Bloomberg Municipal Bond Index6 returned -5.55%, and the ICE BofA U.S. High Yield Index,7 lost 3.89%.
Inflationary concerns and the Russian-Ukraine war caused markets to retreat.
Elevated inflation pressures and the ongoing global supply bottleneck continued in October, but strong corporate earnings provided a bright spot in the U.S., the eurozone, and many Asian countries. Government bond yields rose globally as central banks prepared to tighten monetary policy. Commodity prices continued to rise, driven by sharply higher energy costs.
In November, as COVID-19 hospitalizations rose, most major global asset classes declined. Two exceptions were U.S. investment-grade bonds and Treasury Inflation-Protected Securities. President Biden signed a long-awaited $550 billion infrastructure bill to upgrade U.S. roads, bridges, and railways. Meanwhile, the Consumer Price Index8, a measure of domestic inflation conditions, jumped to its highest level in 31 years. While the threat of consistently high inflation led the U.S. Federal Reserve (Fed) to discuss a faster pace of tapering, the Omicron strain created uncertainty. Commodities lost ground for the month, driven by sharp declines in oil prices (and energy costs in general) as well as precious metals.
“Elevated inflation pressures and the ongoing global supply bottleneck continued in October, but strong corporate earnings provided a bright spot in the U.S., the eurozone, and many Asian countries.”
| 1 | The S&P 500 Index consists of 500 stocks chosen for market size, liquidity, and industry group representation. It is a market-value-weighted index with each stock's weight in the index proportionate to its market value. You cannot invest directly in an index. |
| 2 | The Morgan Stanley Capital International (MSCI) All Country World Index (ACWI) ex USA Index (Net) is a free-float-adjusted market-capitalization-weighted index that is designed to measure the equity market performance of developed and emerging markets, excluding the U.S. Source: MSCI. MSCI makes no express or implied warranties or representations and shall have no liability whatsoever with respect to any MSCI data contained herein. The MSCI data may not be further redistributed or used as a basis for other indexes or any securities or financial products. This report is not approved, reviewed, or produced by MSCI. You cannot invest directly in an index. |
| 3 | The MSCI Emerging Markets (EM) Index (Net) (USD) is a free-float-adjusted market-capitalization-weighted index that is designed to measure equity market performance of emerging markets. You cannot invest directly in an index. |
| 4 | The Bloomberg U.S. Aggregate Bond Index is a broad-based benchmark that measures the investment-grade, U.S.-dollar-denominated, fixed-rate taxable bond market, including Treasuries, government-related and corporate securities, mortgage-backed securities (agency fixed-rate and hybrid adjustable-rate mortgage pass-throughs), asset-backed securities, and commercial mortgage-backed securities. You cannot invest directly in an index. |
| 5 | The Bloomberg Global Aggregate ex-USD Index (unhedged) is an unmanaged index that provides a broad-based measure of the global investment-grade fixed-income markets excluding the U.S.-dollar-denominated debt market. You cannot invest directly in an index. |
| 6 | The Bloomberg Municipal Bond Index is an unmanaged index composed of long-term tax-exempt bonds with a minimum credit rating of Baa. You cannot invest directly in an index. |
| 7 | The ICE BofA U.S. High Yield Index is a market-capitalization-weighted index of domestic and Yankee high-yield bonds. The index tracks the performance of high-yield securities traded in the U.S. bond market. You cannot invest directly in an index. Copyright 2022. ICE Data Indices, LLC. All rights reserved. |
| 8 | The Consumer Price Index (CPI) is a measure of the average change over time in the prices paid by urban consumers for a market basket of consumer goods and services. You cannot invest directly in an index. |
2 | Allspring C&B Mid Cap Value Fund
Letter to shareholders (unaudited)
Global volatility lessened in December as data indicated a lower risk of severe disease and death from the Omicron variant. Even so, several countries introduced restrictions on travel and hospitality, among other sectors, in an effort to reduce the spread. In the U.S., data indicated a stable economy overall, with robust corporate earnings. Consumer spending potential looked strong heading into 2022 on elevated household savings and the lowest household debt ratio since 1973. U.S. corporate and high-yield bonds had monthly gains while Treasuries declined. Bonds were strongly affected by the projection of three 25-basis-point (bp; 100 bps equal 1.00%) policy rate hikes in 2022 by senior Federal Open Market Committee members, up from previous projections of just one hike.
In January 2022, the main focus was on potential U.S. interest rate hikes and the Russia-Ukraine conflict. The Fed hinted that a March interest rate hike was likely. Meanwhile, Russia threatened a potential invasion of Ukraine, which could disrupt Russia’s massive energy supplies and drive demand from non-Russian oil-producing countries. Elsewhere overseas, Europe saw food and energy prices spike, leading to rising inflation. Within fixed income, corporate bonds struggled in January, underperforming government bonds, as investors focused on continued elevated inflation and ongoing uncertainty over the U.S. monetary path.
The Russian invasion of Ukraine dominated the financial world in February and March. Equity, bond, and commodities markets were shaken by fear, uncertainty, and an upending of demand-supply dynamics. Major global stock indexes were down in February, along with global bonds overall, with ongoing high levels of volatility in March along with mixed results that favored U.S. large-cap stocks. Prices of commodities spiked, including crude oil, natural gas, wheat, and precious metals, on elevated concerns of supply shortages. All of this fed already-high inflation concerns and added to expectations of more aggressive central bank interest rate hikes. Sweeping sanctions against Russia and corporate pullouts contributed to market volatility. Despite the geopolitical turmoil, the U.S. economic outlook remained largely unchanged, with a healthy job market and signs of economic resilience accompanying higher prices.
Don’t let short-term uncertainty derail long-term investment goals.
Periods of investment uncertainty can present challenges, but experience has taught us that maintaining long-term investment goals can be an effective way to plan for the future. To help you create a sound strategy based on your personal goals and risk tolerance, Allspring Funds offers more than 100 mutual funds spanning a wide range of asset classes and investment styles. Although diversification cannot guarantee an investment profit or prevent losses, we believe it can be an effective way to manage investment risk and potentially smooth out overall portfolio performance. We encourage investors to know their investments and to understand that appropriate levels of risk-taking may unlock opportunities.
Information on transaction closing.
On November 1, 2021, GTCR LLC and Reverence Capital Partners, L.P. announced the beginning of Allspring Global Investments™ with the close of the transaction to acquire Wells Fargo Funds Management, LLC; Wells Capital Management LLC; Galliard Capital Management LLC.; Wells Fargo Asset Management (International) Ltd.; Wells Fargo Asset Management Luxembourg S.A.; and Wells Fargo Funds Distributor, LLC, as well as Wells Fargo Bank, N.A.’s business of acting as trustee to its collective investment trusts and all related Wells Fargo Asset Management legal entities. The transaction closed on November 1, 2021, forming Allspring Global Investments, a privately held asset management firm with $451 billion in AUM1 as of March 31, 2022.
“ The Russian invasion of Ukraine dominated the financial world in February and March. Equity, bond, and commodities markets were shaken by fear, uncertainty, and an upending of demand-supply dynamics.”
| 1 | Figures are as of March 31, 2022, unless otherwise noted. Please note that the assets under management figures provided have been adjusted to eliminate any duplication of reporting among assets directed by multiple investment teams and includes $91.2B from Galliard Capital Management ($74.7B stable value; $16.5B fixed income), an investment advisor that is not part of the Allspring trade name/GIPS firm. |
Allspring C&B Mid Cap Value Fund | 3
Letter to shareholders (unaudited)
For further information about your Fund, contact your investment professional, visit our website at allspringglobal.com, or call us directly at 1-800-222-8222. |
Allspring Global Investments™ is a leading independent asset management firm with a full breadth of investment capabilities across diverse asset classes, serving the needs of its institutional and wealth management clients around the world. Allspring operates across 18 offices globally supported by more than 480 investment professionals. Allspring and its investment teams provide a broad range of differentiated investment products and solutions to help its diverse range of clients meet their investment objectives.
As part of this transition, all mutual funds within the Wells Fargo Funds family were rebranded as Allspring Funds. Each individual fund had “Wells Fargo” removed from its fund name and replaced with “Allspring.” The fund name changes went into effect on December 6, 2021.
Allspring Global Investments™ is the trade name for the asset management firm of Allspring Global Investments Holdings, LLC, a holding company indirectly owned by certain private funds of GTCR LLC and Reverence Capital Partners, L.P.
Thank you for choosing to invest with Allspring Funds. We appreciate your confidence in us and remain committed to helping you meet your financial needs.
Sincerely,
Andrew Owen
President
Allspring Funds
Notice to Shareholders
Russia launched a large-scale invasion of Ukraine on February 24, 2022. As a result of this military action, the United States and many other countries have instituted various economic sanctions against Russian and Belarus individuals and entities. The situation has led to increased financial market volatility and could have severe adverse effects on regional and global economic markets, including the markets for certain securities and commodities, such as oil and natural gas. The extent and duration of the military action, resulting sanctions imposed, other punitive action taken and the resulting market disruptions cannot be easily predicted.
Our solidarity and support goes out to our impacted employees and the people affected in Ukraine and their families. Allspring has a dedicated team of investment professionals actively monitoring the situation for any new developments and the potential impact to our clients and investment products. As the situation remains fluid, we are focused on the assessment of risks, valuation, and liquidity of impacted securities. Please visit our website at allspringglobal.com and click on “Russia-Ukraine Portfolio Impacts” for further information.
4 | Allspring C&B Mid Cap Value Fund
This page is intentionally left blank.
Performance highlights (unaudited)
| Investment objective | The Fund seeks maximum long-term return (current income and capital appreciation), consistent with minimizing risk to principal. |
| Manager | Allspring Funds Management, LLC |
| Subadviser | Cooke & Bieler, L.P. |
| Portfolio managers | Andrew B. Armstrong, CFA®‡, Wesley Lim, CFA®‡, Steve Lyons, CFA®‡, Michael M. Meyer, CFA®‡, Edward W. O'Connor, CFA®‡, R. James O'Neil, CFA®‡, Mehul Trivedi, CFA®‡, William Weber, CFA®‡ |
| Average annual total returns (%) as of March 31, 2022 |
| | | Including sales charge | | Excluding sales charge | | Expense ratios1 (%) |
| | Inception date | 1 year | 5 year | 10 year | | 1 year | 5 year | 10 year | | Gross | Net 2 |
| Class A (CBMAX) | 7-26-2004 | -2.52 | 7.76 | 10.51 | | 3.42 | 9.04 | 11.17 | | 1.26 | 1.26 |
| Class C (CBMCX) | 7-26-2004 | 1.66 | 8.27 | 10.36 | | 2.66 | 8.27 | 10.36 | | 2.01 | 2.01 |
| Class R6 (CBMYX)3 | 7-31-2018 | – | – | – | | 3.89 | 9.51 | 11.58 | | 0.83 | 0.81 |
| Administrator Class (CBMIX) | 7-26-2004 | – | – | – | | 3.53 | 9.15 | 11.26 | | 1.18 | 1.16 |
| Institutional Class (CBMSX) | 7-26-2004 | – | – | – | | 3.80 | 9.43 | 11.54 | | 0.93 | 0.91 |
| Russell Midcap® Value Index4 | – | – | – | – | | 11.45 | 9.99 | 12.01 | | – | – |
Figures quoted represent past performance, which is no guarantee of future results, and do not reflect taxes that a shareholder may pay on an investment in a fund. Investment return and principal value of an investment will fluctuate so that an investor’s shares, when redeemed, may be worth more or less than their original cost. Performance shown without sales charges would be lower if sales charges were reflected. Current performance may be lower or higher than the performance data quoted, which assumes the reinvestment of dividends and capital gains. Current month-end performance is available on the Fund’s website, allspringglobal.com.
Index returns do not include transaction costs associated with buying and selling securities, any mutual fund fees or expenses, or any taxes. It is not possible to invest directly in an index.
For Class A shares, the maximum front-end sales charge is 5.75%. For Class C shares, the maximum contingent deferred sales charge is 1.00%. Performance including a contingent deferred sales charge assumes the sales charge for the corresponding time period. Class R6, Administrator Class and Institutional Class shares are sold without a front-end sales charge or contingent deferred sales charge.
| 1 | Reflects the expense ratios as stated in the most recent prospectuses, which include the impact of 0.01% in acquired fund fees and expenses. The expense ratios shown are subject to change and may differ from the annualized expense ratios shown in the financial highlights of this report, which do not include acquired fund fees and expenses. |
| 2 | The manager has contractually committed through January 31, 2023, to waive fees and/or reimburse expenses to the extent necessary to cap total annual fund operating expenses after fee waivers at 1.25% for Class A, 2.00% for Class C, 0.80% for Class R6, 1.15% for Administrator Class, and 0.90% for Institutional Class. Brokerage commissions, stamp duty fees, interest, taxes, acquired fund fees and expenses (if any), and extraordinary expenses are excluded from the expense caps. Prior to or after the commitment expiration date, the caps may be increased or the commitment to maintain the caps may be terminated only with the approval of the Board of Trustees. Without these caps, the Fund’s returns would have been lower. The expense ratio paid by an investor is the net expense ratio (the total annual fund operating expenses after fee waivers) as stated in the prospectuses. |
| 3 | Historical performance shown for the Class R6 shares prior to their inception reflects the performance of the Institutional Class shares, and includes the higher expenses applicable to the Institutional Class shares. If these expenses had not been included, returns for the Class R6 shares would be higher. |
| 4 | The Russell Midcap® Value Index measures the performance of those Russell Midcap companies with lower price/book ratios and lower forecasted growth values. The stocks are also members of the Russell 1000® Value Index. You cannot invest directly in an index |
Stock values fluctuate in response to the activities of individual companies and general market and economic conditions. Smaller-company stocks tend to be more volatile and less liquid than those of larger companies. Consult the Fund’s prospectus for additional information on these and other risks.
| ‡ | CFA® and Chartered Financial Analyst® are trademarks owned by CFA Institute. |
6 | Allspring C&B Mid Cap Value Fund
Performance highlights (unaudited)
| Ten largest holdings (%) as of March 31, 20221 |
| Helen of Troy Limited | 3.41 |
| Arrow Electronics Incorporated | 3.40 |
| Arch Capital Group Limited | 3.20 |
| Fidelity National Financial Incorporated | 2.89 |
| Gildan Activewear Incorporated | 2.74 |
| State Street Corporation | 2.67 |
| Globe Life Incorporated | 2.63 |
| Gentex Corporation | 2.56 |
| Enovis Corporation | 2.55 |
| Atmos Energy Corporation | 2.49 |
| 1 | Figures represent the percentage of the Fund's net assets. Holdings are subject to change and may have changed since the date specified. |
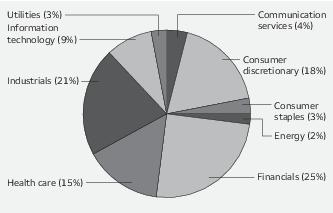
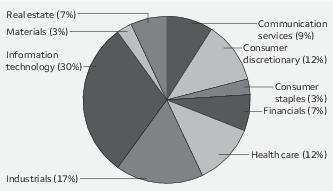
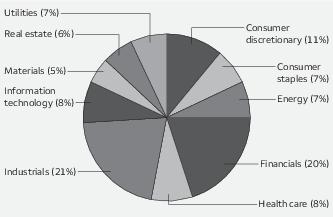
| Sector allocation as of March 31, 20221 |
| 1 | Figures represent the percentage of the Fund's long-term investments. These amounts are subject to change and may have changed since the date specified. |
Allspring C&B Mid Cap Value Fund | 7
Fund expenses (unaudited)
As a shareholder of the Fund, you incur two types of costs: (1) transaction costs, including sales charges (loads) on purchase payments and contingent deferred sales charges (if any) on redemptions and (2) ongoing costs, including management fees, distribution (12b-1) and/or shareholder servicing fees, and other Fund expenses. This example is intended to help you understand your ongoing costs (in dollars) of investing in the Fund and to compare these costs with the ongoing costs of investing in other mutual funds.
The example is based on an investment of $1,000 invested at the beginning of the six-month period and held for the entire period from October 1, 2021 to March 31, 2022.
Actual expenses
The “Actual” line of the table below provides information about actual account values and actual expenses. You may use the information in this line, together with the amount you invested, to estimate the expenses that you paid over the period. Simply divide your account value by $1,000 (for example, an $8,600 account value divided by $1,000 = 8.6), then multiply the result by the number in the “Actual” line under the heading entitled “Expenses paid during period” for your applicable class of shares to estimate the expenses you paid on your account during this period.
Hypothetical example for comparison purposes
The “Hypothetical” line of the table below provides information about hypothetical account values and hypothetical expenses based on the Fund’s actual expense ratio and an assumed rate of return of 5% per year before expenses, which is not the Fund’s actual return. The hypothetical account values and expenses may not be used to estimate the actual ending account balance or expenses you paid for the period. You may use this information to compare the ongoing costs of investing in the Fund and other funds. To do so, compare this 5% hypothetical example with the 5% hypothetical examples that appear in the shareholder reports of the other funds.
Please note that the expenses shown in the table are meant to highlight your ongoing costs only and do not reflect any transactional costs, such as sales charges (loads) and contingent deferred sales charges. Therefore, the “Hypothetical” line of the table is useful in comparing ongoing costs only, and will not help you determine the relative total costs of owning different funds. In addition, if these transactional costs were included, your costs would have been higher.
| | Beginning
account value
10-1-2021 | Ending
account value
3-31-2022 | Expenses
paid during
the period1 | Annualized net
expense ratio |
| Class A | | | | |
| Actual | $1,000.00 | $1,015.44 | $ 6.23 | 1.24% |
| Hypothetical (5% return before expenses) | $1,000.00 | $1,018.75 | $ 6.24 | 1.24% |
| Class C | | | | |
| Actual | $1,000.00 | $1,011.68 | $ 9.98 | 1.99% |
| Hypothetical (5% return before expenses) | $1,000.00 | $1,015.01 | $10.00 | 1.99% |
| Class R6 | | | | |
| Actual | $1,000.00 | $1,017.65 | $ 4.02 | 0.80% |
| Hypothetical (5% return before expenses) | $1,000.00 | $1,020.94 | $ 4.03 | 0.80% |
| Administrator Class | | | | |
| Actual | $1,000.00 | $1,015.92 | $ 5.78 | 1.15% |
| Hypothetical (5% return before expenses) | $1,000.00 | $1,019.20 | $ 5.79 | 1.15% |
| Institutional Class | | | | |
| Actual | $1,000.00 | $1,017.17 | $ 4.53 | 0.90% |
| Hypothetical (5% return before expenses) | $1,000.00 | $1,020.44 | $ 4.53 | 0.90% |
1 Expenses paid is equal to the annualized net expense ratio of each class multiplied by the average account value over the period, multiplied by 182 divided by 365 (to reflect the one-half-year period).
8 | Allspring C&B Mid Cap Value Fund
Portfolio of investments—March 31, 2022 (unaudited)
| | | | | Shares | Value |
| Common stocks: 97.13% | | | | | |
| Communication services: 4.27% | | | | | |
| Entertainment: 1.88% | | | | | |
| Activision Blizzard Incorporated | | | | 158,350 | $ 12,685,419 |
| Media: 2.39% | | | | | |
| Omnicom Group Incorporated | | | | 189,950 | 16,122,956 |
| Consumer discretionary: 17.01% | | | | | |
| Auto components: 2.56% | | | | | |
| Gentex Corporation | | | | 592,068 | 17,270,624 |
| Household durables: 5.04% | | | | | |
| Helen of Troy Limited † | | | | 117,780 | 23,066,035 |
| Whirlpool Corporation | | | | 63,650 | 10,997,447 |
| | | | | | 34,063,482 |
| Leisure products: 1.38% | | | | | |
| Hasbro Incorporated | | | | 113,420 | 9,291,366 |
| Specialty retail: 3.45% | | | | | |
| American Eagle Outfitters Incorporated « | | | | 732,430 | 12,304,824 |
| CarMax Incorporated † | | | | 114,150 | 11,013,192 |
| | | | | | 23,318,016 |
| Textiles, apparel & luxury goods: 4.58% | | | | | |
| Gildan Activewear Incorporated | | | | 493,680 | 18,503,126 |
| HanesBrands Incorporated | | | | 837,458 | 12,469,750 |
| | | | | | 30,972,876 |
| Consumer staples: 2.61% | | | | | |
| Food products: 2.61% | | | | | |
| General Mills Incorporated | | | | 166,400 | 11,268,608 |
| Ingredion Incorporated | | | | 73,320 | 6,389,838 |
| | | | | | 17,658,446 |
| Energy: 1.92% | | | | | |
| Oil, gas & consumable fuels: 1.92% | | | | | |
| The Williams Companies Incorporated | | | | 388,800 | 12,989,808 |
| Financials: 24.90% | | | | | |
| Banks: 0.97% | | | | | |
| Commerce Bancshares Incorporated | | | | 91,302 | 6,536,310 |
| Capital markets: 2.67% | | | | | |
| State Street Corporation | | | | 207,250 | 18,055,620 |
| Consumer finance: 2.49% | | | | | |
| FirstCash Holdings Incorporated | | | | 238,515 | 16,777,145 |
| Insurance: 16.72% | | | | | |
| Alleghany Corporation † | | | | 16,208 | 13,728,176 |
| Arch Capital Group Limited † | | | | 446,285 | 21,609,120 |
The accompanying notes are an integral part of these financial statements.
Allspring C&B Mid Cap Value Fund | 9
Portfolio of investments—March 31, 2022 (unaudited)
| | | | | Shares | Value |
| Insurance (continued) | | | | | |
| Fidelity National Financial Incorporated | | | | 400,277 | $ 19,549,529 |
| Globe Life Incorporated | | | | 176,300 | 17,735,780 |
| Progressive Corporation | | | | 143,494 | 16,356,881 |
| RenaissanceRe Holdings Limited | | | | 81,051 | 12,847,394 |
| The Allstate Corporation | | | | 80,400 | 11,136,204 |
| | | | | | 112,963,084 |
| Thrifts & mortgage finance: 2.05% | | | | | |
| Essent Group Limited | | | | 335,770 | 13,837,082 |
| Health care: 14.19% | | | | | |
| Health care equipment & supplies: 8.92% | | | | | |
| Baxter International Incorporated | | | | 172,250 | 13,356,265 |
| Dentsply Sirona Incorporated | | | | 304,800 | 15,002,256 |
| Enovis Corporation | | | | 433,772 | 17,259,788 |
| Integra LifeSciences Holdings Corporation † | | | | 227,963 | 14,648,902 |
| | | | | | 60,267,211 |
| Health care providers & services: 1.16% | | | | | |
| Laboratory Corporation of America Holdings † | | | | 29,640 | 7,814,882 |
| Life sciences tools & services: 2.05% | | | | | |
| Syneos Health Incorporated † | | | | 171,234 | 13,861,392 |
| Pharmaceuticals: 2.06% | | | | | |
| Perrigo Company plc | | | | 361,310 | 13,885,143 |
| Industrials: 20.95% | | | | | |
| Aerospace & defense: 5.67% | | | | | |
| BWX Technologies Incorporated | | | | 255,230 | 13,746,688 |
| Huntington Ingalls Industries Incorporated | | | | 53,310 | 10,632,146 |
| Woodward Incorporated | | | | 111,650 | 13,946,202 |
| | | | | | 38,325,036 |
| Building products: 1.72% | | | | | |
| Armstrong World Industries Incorporated | | | | 128,740 | 11,587,887 |
| Commercial services & supplies: 2.40% | | | | | |
| IAA Incorporated † | | | | 423,904 | 16,214,326 |
| Electrical equipment: 2.44% | | | | | |
| Acuity Brands Incorporated | | | | 25,680 | 4,861,224 |
| AMETEK Incorporated | | | | 87,060 | 11,594,651 |
| | | | | | 16,455,875 |
| Machinery: 4.50% | | | | | |
| Gates Industrial Corporation plc † | | | | 512,460 | 7,717,648 |
| PACCAR Incorporated | | | | 89,857 | 7,913,706 |
| Stanley Black & Decker Incorporated | | | | 105,740 | 14,781,395 |
| | | | | | 30,412,749 |
| Professional services: 1.92% | | | | | |
| Leidos Holdings Incorporated | | | | 120,380 | 13,003,448 |
The accompanying notes are an integral part of these financial statements.
10 | Allspring C&B Mid Cap Value Fund
Portfolio of investments—March 31, 2022 (unaudited)
| | | | | Shares | Value |
| Trading companies & distributors: 2.30% | | | | | |
| AerCap Holdings NV † | | | | 308,600 | $ 15,516,408 |
| Information technology: 8.79% | | | | | |
| Electronic equipment, instruments & components: 5.32% | | | | | |
| Arrow Electronics Incorporated † | | | | 193,666 | 22,974,598 |
| TE Connectivity Limited | | | | 98,900 | 12,953,922 |
| | | | | | 35,928,520 |
| IT services: 1.63% | | | | | |
| Amdocs Limited | | | | 134,250 | 11,036,693 |
| Semiconductors & semiconductor equipment: 1.84% | | | | | |
| MKS Instruments Incorporated | | | | 82,593 | 12,388,950 |
| Utilities: 2.49% | | | | | |
| Gas utilities: 2.49% | | | | | |
| Atmos Energy Corporation | | | | 140,620 | 16,802,684 |
| Total Common stocks (Cost $524,524,561) | | | | | 656,043,438 |
| | | Yield | | | |
| Short-term investments: 4.74% | | | | | |
| Investment companies: 4.74% | | | | | |
| Allspring Government Money Market Fund Select Class ♠∞ | | 0.18% | | 20,356,811 | 20,356,811 |
| Securities Lending Cash Investments LLC ♠∩∞ | | 0.40 | | 11,677,725 | 11,677,725 |
| Total Short-term investments (Cost $32,034,536) | | | | | 32,034,536 |
| Total investments in securities (Cost $556,559,097) | 101.87% | | | | 688,077,974 |
| Other assets and liabilities, net | (1.87) | | | | (12,602,920) |
| Total net assets | 100.00% | | | | $675,475,054 |
| † | Non-income-earning security |
| « | All or a portion of this security is on loan. |
| ♠ | The issuer of the security is an affiliated person of the Fund as defined in the Investment Company Act of 1940. |
| ∩ | The investment is a non-registered investment company purchased with cash collateral received from securities on loan. |
| ∞ | The rate represents the 7-day annualized yield at period end. |
The accompanying notes are an integral part of these financial statements.
Allspring C&B Mid Cap Value Fund | 11
Portfolio of investments—March 31, 2022 (unaudited)
Investments in affiliates
An affiliated investment is an investment in which the Fund owns at least 5% of the outstanding voting shares of the issuer or as a result of other relationships, such as the Fund and the issuer having the same investment manager. Transactions with issuers that were affiliates of the Fund at the end of the period were as follows:
| | Value,
beginning of
period | Purchases | Sales
proceeds | Net
realized
gains
(losses) | | Net
change in
unrealized
gains
(losses) | | Value,
end of
period | Shares,
end
of period | Income
from
affiliated
securities |
| Short-term investments | | | | | | | | | |
| Allspring Government Money Market Fund Select Class | $6,643,193 | $185,331,910 | $(171,618,292) | $0 | | $0 | | $ 20,356,811 | 20,356,811 | $ 2,410 |
| Securities Lending Cash Investments LLC | 0 | 52,990,410 | (41,312,685) | 0 | | 0 | | 11,677,725 | 11,677,725 | 2,235 # |
| | | | | $0 | | $0 | | $32,034,536 | | $4,645 |
| # | Amount shown represents income before fees and rebates. |
The accompanying notes are an integral part of these financial statements.
12 | Allspring C&B Mid Cap Value Fund
Statement of assets and liabilities—March 31, 2022 (unaudited)
| | |
| Assets | |
Investments in unaffiliated securities (including $11,342,196 of securities loaned), at value (cost $524,524,561)
| $ 656,043,438 |
Investments in affiliated securities, at value (cost $32,034,536)
| 32,034,536 |
Receivable for Fund shares sold
| 881,011 |
Receivable for dividends
| 595,338 |
Receivable for investments sold
| 115,665 |
Receivable for securities lending income, net
| 2,269 |
Prepaid expenses and other assets
| 64,531 |
Total assets
| 689,736,788 |
| Liabilities | |
Payable upon receipt of securities loaned
| 11,677,725 |
Payable for investments purchased
| 1,527,531 |
Payable for Fund shares redeemed
| 486,254 |
Management fee payable
| 446,006 |
Administration fees payable
| 86,506 |
Trustees’ fees and expenses payable
| 2,830 |
Distribution fee payable
| 1,657 |
Accrued expenses and other liabilities
| 33,225 |
Total liabilities
| 14,261,734 |
Total net assets
| $675,475,054 |
| Net assets consist of | |
Paid-in capital
| $ 534,757,952 |
Total distributable earnings
| 140,717,102 |
Total net assets
| $675,475,054 |
| Computation of net asset value and offering price per share | |
Net assets – Class A
| $ 131,785,069 |
Shares outstanding – Class A1
| 2,943,400 |
Net asset value per share – Class A
| $44.77 |
Maximum offering price per share – Class A2
| $47.50 |
Net assets – Class C
| $ 2,602,089 |
Shares outstanding – Class C1
| 63,672 |
Net asset value per share – Class C
| $40.87 |
Net assets – Class R6
| $ 22,262,761 |
Shares outstanding – Class R61
| 492,193 |
Net asset value per share – Class R6
| $45.23 |
Net assets – Administrator Class
| $ 16,948,559 |
Shares outstanding – Administrator Class1
| 373,477 |
Net asset value per share – Administrator Class
| $45.38 |
Net assets – Institutional Class
| $ 501,876,576 |
Shares outstanding – Institutional Class1
| 11,102,169 |
Net asset value per share – Institutional Class
| $45.21 |
| 1 | The Fund has an unlimited number of authorized shares. |
| 2 | Maximum offering price is computed as 100/94.25 of net asset value. On investments of $50,000 or more, the offering price is reduced. |
The accompanying notes are an integral part of these financial statements.
Allspring C&B Mid Cap Value Fund | 13
Statement of operations—six months ended March 31, 2022 (unaudited)
| | |
| Investment income | |
Dividends (net of foreign withholdings taxes of $27,638)
| $ 5,586,570 |
Income from affiliated securities
| 6,048 |
Total investment income
| 5,592,618 |
| Expenses | |
Management fee
| 2,646,914 |
| Administration fees | |
Class A
| 145,666 |
Class C
| 3,688 |
Class R6
| 3,348 |
Administrator Class
| 14,513 |
Institutional Class
| 341,966 |
| Shareholder servicing fees | |
Class A
| 173,412 |
Class C
| 4,388 |
Administrator Class
| 27,819 |
| Distribution fee | |
Class C
| 13,147 |
Custody and accounting fees
| 12,858 |
Professional fees
| 22,960 |
Registration fees
| 52,221 |
Shareholder report expenses
| 41,043 |
Trustees’ fees and expenses
| 10,683 |
Other fees and expenses
| 6,999 |
Total expenses
| 3,521,625 |
| Less: Fee waivers and/or expense reimbursements | |
Class A
| (2,819) |
Class R6
| (1,590) |
Administrator Class
| (1,324) |
Institutional Class
| (35,853) |
Net expenses
| 3,480,039 |
Net investment income
| 2,112,579 |
| Realized and unrealized gains (losses) on investments | |
Net realized gains on investments
| 23,748,311 |
Net change in unrealized gains (losses) on investments
| (14,612,527) |
Net realized and unrealized gains (losses) on investments
| 9,135,784 |
Net increase in net assets resulting from operations
| $ 11,248,363 |
The accompanying notes are an integral part of these financial statements.
14 | Allspring C&B Mid Cap Value Fund
Statement of changes in net assets
| | | | | |
| | Six months ended
March 31, 2022
(unaudited) | Year ended
September 30, 2021 |
| Operations | | | | |
Net investment income
| | $ 2,112,579 | | $ 1,931,547 |
Net realized gains on investments
| | 23,748,311 | | 63,781,946 |
Net change in unrealized gains (losses) on investments
| | (14,612,527) | | 119,031,625 |
Net increase in net assets resulting from operations
| | 11,248,363 | | 184,745,118 |
| Distributions to shareholders from | | | | |
| Net investment income and net realized gains | | | | |
Class A
| | (12,663,809) | | (227,113) |
Class C
| | (414,701) | | 0 |
Class R6
| | (2,090,622) | | (81,410) |
Administrator Class
| | (2,175,381) | | (56,758) |
Institutional Class
| | (48,137,552) | | (1,735,542) |
Total distributions to shareholders
| | (65,482,065) | | (2,100,823) |
| Capital share transactions | Shares | | Shares | |
| Proceeds from shares sold | | | | |
Class A
| 63,484 | 2,985,901 | 266,477 | 11,903,917 |
Class C
| 1,835 | 84,101 | 62,834 | 2,564,058 |
Class R6
| 45,887 | 2,139,621 | 174,904 | 8,622,402 |
Administrator Class
| 29,068 | 1,377,378 | 94,814 | 4,369,994 |
Institutional Class
| 2,755,517 | 128,482,456 | 4,488,272 | 206,320,931 |
| | | 135,069,457 | | 233,781,302 |
| Reinvestment of distributions | | | | |
Class A
| 268,854 | 12,251,625 | 5,249 | 219,839 |
Class C
| 9,954 | 414,701 | 0 | 0 |
Class R6
| 35,855 | 1,655,325 | 1,185 | 50,016 |
Administrator Class
| 46,879 | 2,165,321 | 1,331 | 56,369 |
Institutional Class
| 1,041,927 | 48,045,059 | 41,072 | 1,733,252 |
| | | 64,532,031 | | 2,059,476 |
| Payment for shares redeemed | | | | |
Class A
| (251,055) | (11,739,331) | (459,731) | (20,683,839) |
Class C
| (42,962) | (1,846,121) | (68,723) | (2,762,614) |
Class R6
| (35,761) | (1,693,288) | (79,525) | (3,851,168) |
Administrator Class
| (224,982) | (10,709,959) | (254,333) | (11,616,949) |
Institutional Class
| (3,204,720) | (148,440,069) | (3,100,252) | (134,469,367) |
| | | (174,428,768) | | (173,383,937) |
Net increase in net assets resulting from capital share transactions
| | 25,172,720 | | 62,456,841 |
Total increase (decrease) in net assets
| | (29,060,982) | | 245,101,136 |
| Net assets | | | | |
Beginning of period
| | 704,536,036 | | 459,434,900 |
End of period
| | $ 675,475,054 | | $ 704,536,036 |
The accompanying notes are an integral part of these financial statements.
Allspring C&B Mid Cap Value Fund | 15
Financial highlights
(For a share outstanding throughout each period)
| | | Year ended September 30 |
| Class A | Six months ended
March 31, 2022
(unaudited) | 2021 | 2020 | 2019 | 2018 | 2017 |
Net asset value, beginning of period
| $48.43 | $34.40 | $39.67 | $37.88 | $35.07 | $29.27 |
Net investment income (loss)
| 0.08 1 | 0.03 | 0.10 1 | 0.16 | 0.06 | (0.00) 1,2 |
Net realized and unrealized gains (losses) on investments
| 0.75 | 14.08 | (4.21) | 1.69 | 2.75 | 5.82 |
Total from investment operations
| 0.83 | 14.11 | (4.11) | 1.85 | 2.81 | 5.82 |
| Distributions to shareholders from | | | | | | |
Net investment income
| (0.04) | (0.08) | (0.15) | (0.06) | (0.00) 3 | (0.02) |
Net realized gains
| (4.45) | 0.00 | (1.01) | 0.00 | 0.00 | 0.00 |
Total distributions to shareholders
| (4.49) | (0.08) | (1.16) | (0.06) | (0.00) 3 | (0.02) |
Net asset value, end of period
| $44.77 | $48.43 | $34.40 | $39.67 | $37.88 | $35.07 |
Total return4
| 1.54% | 41.04% | (10.81)% | 4.91% | 8.02% | 19.89% |
| Ratios to average net assets (annualized) | | | | | | |
Gross expenses
| 1.24% | 1.25% | 1.27% | 1.29% | 1.29% | 1.30% |
Net expenses
| 1.24% | 1.24% | 1.25% | 1.25% | 1.25% | 1.25% |
Net investment income (loss)
| 0.32% | 0.05% | 0.29% | 0.43% | 0.16% | (0.00)% |
| Supplemental data | | | | | | |
Portfolio turnover rate
| 24% | 47% | 45% | 42% | 39% | 54% |
Net assets, end of period (000s omitted)
| $131,785 | $138,604 | $104,922 | $106,975 | $111,354 | $115,258 |
| 1 | Calculated based upon average shares outstanding |
| 2 | Amount is more than $(0.005) |
| 3 | Amount is less than $0.005. |
| 4 | Total return calculations do not include any sales charges. Returns for periods of less than one year are not annualized. |
The accompanying notes are an integral part of these financial statements.
16 | Allspring C&B Mid Cap Value Fund
Financial highlights
(For a share outstanding throughout each period)
| | | Year ended September 30 |
| Class C | Six months ended
March 31, 2022
(unaudited) | 2021 | 2020 | 2019 | 2018 | 2017 |
Net asset value, beginning of period
| $44.70 | $31.94 | $36.98 | $35.51 | $33.12 | $27.83 |
Net investment loss
| (0.09) 1 | (0.30) 1 | (0.16) 1 | (0.12) 1 | (0.20) 1 | (0.26) 1 |
Net realized and unrealized gains (losses) on investments
| 0.71 | 13.06 | (3.87) | 1.59 | 2.59 | 5.55 |
Total from investment operations
| 0.62 | 12.76 | (4.03) | 1.47 | 2.39 | 5.29 |
| Distributions to shareholders from | | | | | | |
Net realized gains
| (4.45) | 0.00 | (1.01) | 0.00 | 0.00 | 0.00 |
Net asset value, end of period
| $40.87 | $44.70 | $31.94 | $36.98 | $35.51 | $33.12 |
Total return2
| 1.19% | 39.98% | (11.32)% | 4.14% | 7.22% | 19.01% |
| Ratios to average net assets (annualized) | | | | | | |
Gross expenses
| 1.99% | 1.99% | 2.01% | 2.04% | 2.04% | 2.05% |
Net expenses
| 1.99% | 1.99% | 2.00% | 2.00% | 2.00% | 2.00% |
Net investment loss
| (0.43)% | (0.72)% | (0.47)% | (0.36)% | (0.59)% | (0.74)% |
| Supplemental data | | | | | | |
Portfolio turnover rate
| 24% | 47% | 45% | 42% | 39% | 54% |
Net assets, end of period (000s omitted)
| $2,602 | $4,240 | $3,217 | $4,592 | $8,371 | $8,567 |
| 1 | Calculated based upon average shares outstanding |
| 2 | Total return calculations do not include any sales charges. Returns for periods of less than one year are not annualized. |
The accompanying notes are an integral part of these financial statements.
Allspring C&B Mid Cap Value Fund | 17
Financial highlights
(For a share outstanding throughout each period)
| | | Year ended September 30 |
| Class R6 | Six months ended
March 31, 2022
(unaudited) | 2021 | 2020 | 2019 | 2018 1 |
Net asset value, beginning of period
| $48.97 | $34.77 | $40.06 | $38.27 | $37.39 |
Net investment income
| 0.18 | 0.24 | 0.27 | 0.35 2 | 0.08 2 |
Net realized and unrealized gains (losses) on investments
| 0.77 | 14.20 | (4.25) | 1.67 | 0.80 |
Total from investment operations
| 0.95 | 14.44 | (3.98) | 2.02 | 0.88 |
| Distributions to shareholders from | | | | | |
Net investment income
| (0.24) | (0.24) | (0.30) | (0.23) | 0.00 |
Net realized gains
| (4.45) | 0.00 | (1.01) | 0.00 | 0.00 |
Total distributions to shareholders
| (4.69) | (0.24) | (1.31) | (0.23) | 0.00 |
Net asset value, end of period
| $45.23 | $48.97 | $34.77 | $40.06 | $38.27 |
Total return3
| 1.79% | 41.66% | (10.42)% | 5.39% | 2.35% |
| Ratios to average net assets (annualized) | | | | | |
Gross expenses
| 0.81% | 0.82% | 0.84% | 0.86% | 0.86% |
Net expenses
| 0.80% | 0.80% | 0.80% | 0.80% | 0.80% |
Net investment income
| 0.77% | 0.49% | 0.73% | 0.95% | 1.24% |
| Supplemental data | | | | | |
Portfolio turnover rate
| 24% | 47% | 45% | 42% | 39% |
Net assets, end of period (000s omitted)
| $22,263 | $21,853 | $12,156 | $15,112 | $26 |
| 1 | For the period from July 31, 2018 (commencement of class operations) to September 30, 2018 |
| 2 | Calculated based upon average shares outstanding |
| 3 | Returns for periods of less than one year are not annualized. |
The accompanying notes are an integral part of these financial statements.
18 | Allspring C&B Mid Cap Value Fund
Financial highlights
(For a share outstanding throughout each period)
| | | Year ended September 30 |
| Administrator Class | Six months ended
March 31, 2022
(unaudited) | 2021 | 2020 | 2019 | 2018 | 2017 |
Net asset value, beginning of period
| $49.03 | $34.80 | $40.14 | $38.35 | $35.52 | $29.63 |
Net investment income
| 0.09 1 | 0.07 1 | 0.14 1 | 0.20 1 | 0.10 1 | 0.04 1 |
Net realized and unrealized gains (losses) on investments
| 0.77 | 14.25 | (4.27) | 1.70 | 2.78 | 5.89 |
Total from investment operations
| 0.86 | 14.32 | (4.13) | 1.90 | 2.88 | 5.93 |
| Distributions to shareholders from | | | | | | |
Net investment income
| (0.06) | (0.09) | (0.20) | (0.11) | (0.05) | (0.04) |
Net realized gains
| (4.45) | 0.00 | (1.01) | 0.00 | 0.00 | 0.00 |
Total distributions to shareholders
| (4.51) | (0.09) | (1.21) | (0.11) | (0.05) | (0.04) |
Net asset value, end of period
| $45.38 | $49.03 | $34.80 | $40.14 | $38.35 | $35.52 |
Total return2
| 1.59% | 41.19% | (10.74)% | 5.03% | 8.13% | 20.02% |
| Ratios to average net assets (annualized) | | | | | | |
Gross expenses
| 1.16% | 1.17% | 1.19% | 1.21% | 1.21% | 1.22% |
Net expenses
| 1.15% | 1.15% | 1.15% | 1.15% | 1.15% | 1.15% |
Net investment income
| 0.38% | 0.14% | 0.38% | 0.53% | 0.26% | 0.12% |
| Supplemental data | | | | | | |
Portfolio turnover rate
| 24% | 47% | 45% | 42% | 39% | 54% |
Net assets, end of period (000s omitted)
| $16,949 | $25,617 | $23,691 | $24,036 | $20,960 | $21,267 |
| 1 | Calculated based upon average shares outstanding |
| 2 | Returns for periods of less than one year are not annualized. |
The accompanying notes are an integral part of these financial statements.
Allspring C&B Mid Cap Value Fund | 19
Financial highlights
(For a share outstanding throughout each period)
| | | Year ended September 30 |
| Institutional Class | Six months ended
March 31, 2022
(unaudited) | 2021 | 2020 | 2019 | 2018 | 2017 |
Net asset value, beginning of period
| $48.93 | $34.74 | $40.04 | $38.26 | $35.41 | $29.53 |
Net investment income
| 0.16 1 | 0.19 | 0.23 1 | 0.28 | 0.19 | 0.16 |
Net realized and unrealized gains (losses) on investments
| 0.77 | 14.20 | (4.25) | 1.70 | 2.78 | 5.82 |
Total from investment operations
| 0.93 | 14.39 | (4.02) | 1.98 | 2.97 | 5.98 |
| Distributions to shareholders from | | | | | | |
Net investment income
| (0.20) | (0.20) | (0.27) | (0.20) | (0.12) | (0.10) |
Net realized gains
| (4.45) | 0.00 | (1.01) | 0.00 | 0.00 | 0.00 |
Total distributions to shareholders
| (4.65) | (0.20) | (1.28) | (0.20) | (0.12) | (0.10) |
Net asset value, end of period
| $45.21 | $48.93 | $34.74 | $40.04 | $38.26 | $35.41 |
Total return2
| 1.74% | 41.55% | (10.52)% | 5.29% | 8.41% | 20.30% |
| Ratios to average net assets (annualized) | | | | | | |
Gross expenses
| 0.91% | 0.92% | 0.94% | 0.96% | 0.96% | 0.97% |
Net expenses
| 0.90% | 0.90% | 0.90% | 0.90% | 0.90% | 0.90% |
Net investment income
| 0.67% | 0.39% | 0.64% | 0.79% | 0.56% | 0.37% |
| Supplemental data | | | | | | |
Portfolio turnover rate
| 24% | 47% | 45% | 42% | 39% | 54% |
Net assets, end of period (000s omitted)
| $501,877 | $514,222 | $315,449 | $246,702 | $200,335 | $105,550 |
| 1 | Calculated based upon average shares outstanding |
| 2 | Returns for periods of less than one year are not annualized. |
The accompanying notes are an integral part of these financial statements.
20 | Allspring C&B Mid Cap Value Fund
Notes to financial statements (unaudited)
1. ORGANIZATION
Allspring Funds Trust (the "Trust"), a Delaware statutory trust organized on March 10, 1999, is an open-end management investment company registered under the Investment Company Act of 1940, as amended (the "1940 Act"). As an investment company, the Trust follows the accounting and reporting guidance in Financial Accounting Standards Board ("FASB") Accounting Standards Codification Topic 946, Financial Services – Investment Companies. These financial statements report on the Allspring C&B Mid Cap Value Fund (the "Fund") which is a diversified series of the Trust.
Effective on November 1, 2021, the sale transaction of Wells Fargo Asset Management ("WFAM") by Wells Fargo & Company to GTCR LLC and Reverence Capital Partners, L.P. was closed. In connection with the closing of the transaction, WFAM became known as Allspring Global Investments (“Allspring”) and various entities that provided services to the Fund changed their names to "Allspring", including Allspring Funds Management, LLC, the investment manager to the Fund, Allspring Global Investments, LLC and Allspring Global Investments (UK) Limited, both registered investment advisers providing subadvisory services to certain funds, and Allspring Funds Distributor, LLC, the Fund's principal underwriter. Consummation of the transaction resulted in a new investment management agreement and subadvisory agreement which became effective on the date of the Special Meeting of Shareholders approving the agreements.
2. SIGNIFICANT ACCOUNTING POLICIES
The following significant accounting policies, which are consistently followed in the preparation of the financial statements of the Fund, are in conformity with U.S. generally accepted accounting principles which require management to make estimates and assumptions that affect the reported amounts of assets and liabilities, disclosure of contingent assets and liabilities at the date of the financial statements, and the reported amounts of income and expenses during the reporting period. Actual results could differ from those estimates.
Securities valuation
All investments are valued each business day as of the close of regular trading on the New York Stock Exchange (generally 4 p.m. Eastern Time), although the Fund may deviate from this calculation time under unusual or unexpected circumstances.
Equity securities that are listed on a foreign or domestic exchange or market are valued at the official closing price or, if none, the last sales price. If no sale occurs on the principal exchange or market that day, a fair value price will be determined in accordance with the Fund’s Valuation Procedures.
Investments in registered open-end investment companies are valued at net asset value. Interests in non-registered investment companies that are redeemable at net asset value are fair valued normally at net asset value.
Investments which are not valued using any of the methods discussed above are valued at their fair value, as determined in good faith by the Board of Trustees. The Board of Trustees has established a Valuation Committee comprised of the Trustees and has delegated to it the authority to take any actions regarding the valuation of portfolio securities that the Valuation Committee deems necessary or appropriate, including determining the fair value of portfolio securities, unless the determination has been delegated to the Allspring Global Investments Pricing Committee at Allspring Funds Management, LLC ("Allspring Funds Management"). The Board of Trustees retains the authority to make or ratify any valuation decisions or approve any changes to the Valuation Procedures as it deems appropriate. On a quarterly basis, the Board of Trustees receives reports on any valuation actions taken by the Valuation Committee or the Allspring Global Investments Pricing Committee which may include items for ratification.
Securities lending
The Fund may lend its securities from time to time in order to earn additional income in the form of fees or interest on securities received as collateral or the investment of any cash received as collateral. When securities are on loan, the Fund receives interest or dividends on those securities. Cash collateral received in connection with its securities lending transactions is invested in Securities Lending Cash Investments, LLC (the "Securities Lending Fund"), an affiliated non-registered investment company. Investments in Securities Lending Fund are valued at the evaluated bid price provided by an independent pricing service. Income earned from investment in the Securities Lending Fund (net of fees and rebates), if any, is included in income from affiliated securities on the Statement of Operations.
In a securities lending transaction, the net asset value of the Fund is affected by an increase or decrease in the value of the securities loaned and by an increase or decrease in the value of the instrument in which collateral is invested. The amount of securities lending activity undertaken by the Fund fluctuates from time to time. The Fund has the right under the lending agreement to recover the securities from the borrower on demand. In the event of default or bankruptcy by the borrower, the Fund may be prevented from recovering the loaned securities or gaining access to the collateral or may experience delays or costs in doing so. In such an event, the terms of the agreement allow the unaffiliated securities lending agent to use the
Allspring C&B Mid Cap Value Fund | 21
Notes to financial statements (unaudited)
collateral to purchase replacement securities on behalf of the Fund or pay the Fund the market value of the loaned securities. The Fund bears the risk of loss with respect to depreciation of its investment of the cash collateral.
Security transactions and income recognition
Securities transactions are recorded on a trade date basis. Realized gains or losses are recorded on the basis of identified cost.
Dividend income is recognized on the ex-dividend date. Dividend income is recorded net of foreign taxes withheld where recovery of such taxes is not assured.
Distributions to shareholders
Distributions to shareholders from net investment income and any net realized gains are recorded on the ex-dividend date and paid at least annually. Such distributions are determined in accordance with income tax regulations and may differ from U.S. generally accepted accounting principles. Dividend sources are estimated at the time of declaration. The tax character of distributions is determined as of the Fund's fiscal year end. Therefore, a portion of the Fund's distributions made prior to the Fund’s fiscal year end may be categorized as a tax return of capital at year end.
Federal and other taxes
The Fund intends to continue to qualify as a regulated investment company by distributing substantially all of its investment company taxable income and any net realized capital gains (after reduction for capital loss carryforwards) sufficient to relieve it from all, or substantially all, federal income taxes. Accordingly, no provision for federal income taxes was required.
The Fund’s income and federal excise tax returns and all financial records supporting those returns for the prior three fiscal years are subject to examination by the federal and Delaware revenue authorities. Management has analyzed the Fund's tax positions taken on federal, state, and foreign tax returns for all open tax years and does not believe that there are any uncertain tax positions that require recognition of a tax liability.
As of March 31, 2022, the aggregate cost of all investments for federal income tax purposes was $552,079,870 and the unrealized gains (losses) consisted of:
| Gross unrealized gains | $145,964,119 |
| Gross unrealized losses | (9,966,015) |
| Net unrealized gains | $135,998,104 |
Class allocations
The separate classes of shares offered by the Fund differ principally in applicable sales charges, distribution, shareholder servicing, and administration fees. Class specific expenses are charged directly to that share class. Investment income, common fund-level expenses, and realized and unrealized gains (losses) on investments are allocated daily to each class of shares based on the relative proportion of net assets of each class.
3. FAIR VALUATION MEASUREMENTS
Fair value measurements of investments are determined within a framework that has established a fair value hierarchy based upon the various data inputs utilized in determining the value of the Fund’s investments. The three-level hierarchy gives the highest priority to unadjusted quoted prices in active markets for identical assets or liabilities (Level 1) and the lowest priority to unobservable inputs (Level 3). The Fund’s investments are classified within the fair value hierarchy based on the lowest level of input that is significant to the fair value measurement. The inputs are summarized into three broad levels as follows:
| ■ | Level 1 – quoted prices in active markets for identical securities |
| ■ | Level 2 – other significant observable inputs (including quoted prices for similar securities, interest rates, prepayment speeds, credit risk, etc.) |
| ■ | Level 3 – significant unobservable inputs (including the Fund’s own assumptions in determining the fair value of investments) |
The inputs or methodologies used for valuing investments in securities are not necessarily an indication of the risk associated with investing in those securities.
22 | Allspring C&B Mid Cap Value Fund
Notes to financial statements (unaudited)
The following is a summary of the inputs used in valuing the Fund’s assets and liabilities as of March 31, 2022:
| | Quoted prices
(Level 1) | Other significant
observable inputs
(Level 2) | Significant
unobservable inputs
(Level 3) | Total |
| Assets | | | | |
| Investments in: | | | | |
| Common stocks | | | | |
| Communication services | $ 28,808,375 | $0 | $0 | $ 28,808,375 |
| Consumer discretionary | 114,916,364 | 0 | 0 | 114,916,364 |
| Consumer staples | 17,658,446 | 0 | 0 | 17,658,446 |
| Energy | 12,989,808 | 0 | 0 | 12,989,808 |
| Financials | 168,169,241 | 0 | 0 | 168,169,241 |
| Health care | 95,828,628 | 0 | 0 | 95,828,628 |
| Industrials | 141,515,729 | 0 | 0 | 141,515,729 |
| Information technology | 59,354,163 | 0 | 0 | 59,354,163 |
| Utilities | 16,802,684 | 0 | 0 | 16,802,684 |
| Short-term investments | | | | |
| Investment companies | 32,034,536 | 0 | 0 | 32,034,536 |
| Total assets | $688,077,974 | $0 | $0 | $688,077,974 |
Additional sector, industry or geographic detail, if any, is included in the Portfolio of Investments.
For the six months ended March 31, 2022, the Fund did not have any transfers into/out of Level 3.
4. TRANSACTIONS WITH AFFILIATES AND OTHER EXPENSES
Management fee
Allspring Funds Management, a wholly owned subsidiary of Allspring Global Investments Holdings, LLC, a holding company indirectly owned by certain private funds of GTCR LLC and Reverence Capital Partners, L.P., is the manager of the Fund and provides advisory and fund-level administrative services under an investment management agreement. Under the investment management agreement, Allspring Funds Management is responsible for, among other services, implementing the investment objectives and strategies of the Fund, supervising the subadviser and providing fund-level administrative services in connection with the Fund’s operations. As compensation for its services under the investment management agreement, Allspring Funds Management is entitled to receive a management fee at the following annual rate based on the Fund’s average daily net assets:
| Average daily net assets | Management fee |
| First $500 million | 0.750% |
| Next $500 million | 0.725 |
| Next $1 billion | 0.700 |
| Next $2 billion | 0.675 |
| Next $1 billion | 0.650 |
| Next $5 billion | 0.640 |
| Next $2 billion | 0.630 |
| Next $4 billion | 0.620 |
| Over $16 billion | 0.610 |
For the six months ended March 31, 2022, the management fee was equivalent to an annual rate of 0.74% of the Fund’s average daily net assets.
Allspring Funds Management has retained the services of a subadviser to provide daily portfolio management to the Fund. The fee for subadvisory services is borne by Allspring Funds Management. Cooke & Bieler, L.P., which is not an affiliate of Allspring
Allspring C&B Mid Cap Value Fund | 23
Notes to financial statements (unaudited)
Funds Management, is the subadviser to the Fund and is entitled to receive a fee from Allspring Funds Management at an annual rate starting at 0.45% and declining to 0.35% as the average daily net assets of the Fund increase.
Administration fees
Under a class-level administration agreement, Allspring Funds Management provides class-level administrative services to the Fund, which includes paying fees and expenses for services provided by the transfer agent, sub-transfer agents, omnibus account servicers and record-keepers. As compensation for its services under the class-level administration agreement, Allspring Funds Management receives an annual fee which is calculated based on the average daily net assets of each class as follows:
| | Class-level
administration fee |
| Class A | 0.21% |
| Class C | 0.21 |
| Class R6 | 0.03 |
| Administrator Class | 0.13 |
| Institutional Class | 0.13 |
Waivers and/or expense reimbursements
Allspring Funds Management has contractually committed to waive and/or reimburse management and administration fees to the extent necessary to maintain certain net operating expense ratios for the Fund. When each class of the Fund has exceeded its expense cap, Allspring Funds Management will waive fees and/or reimburse expenses from fund-level expenses on a proportionate basis and then from class specific expenses. When only certain classes exceed their expense caps, waivers and/or reimbursements are applied against class specific expenses before fund-level expenses. Allspring Funds Management has contractually committed through January 31, 2023 to waive fees and/or reimburse expenses to the extent necessary to cap expenses. Prior to or after the commitment expiration date, the caps may be increased or the commitment to maintain the caps may be terminated only with the approval of the Board of Trustees. As of March 31, 2022, the contractual expense caps are as follows:
| | Expense ratio caps |
| Class A | 1.25% |
| Class C | 2.00 |
| Class R6 | 0.80 |
| Administrator Class | 1.15 |
| Institutional Class | 0.90 |
Distribution fee
The Trust has adopted a distribution plan for Class C shares of the Fund pursuant to Rule 12b-1 under the 1940 Act. A distribution fee is charged to Class C shares and paid to Allspring Funds Distributor, LLC ("Allspring Funds Distributor"), the principal underwriter, an affiliate of Allspring Funds Management, at an annual rate of 0.75% of the average daily net assets of Class C shares.
In addition, Allspring Funds Distributor is entitled to receive the front-end sales charge from the purchase of Class A shares and a contingent deferred sales charge on the redemption of certain Class A shares. Allspring Funds Distributor is also entitled to receive the contingent deferred sales charges from redemptions of Class C shares. For the six months ended March 31, 2022, Allspring Funds Distributor received $483 from the sale of Class A shares and $8 in contingent deferred sales charges from redemptions of Class C shares. No contingent deferred sales charges were incurred by Class A shares for the six months ended March 31, 2022.
24 | Allspring C&B Mid Cap Value Fund
Notes to financial statements (unaudited)
Shareholder servicing fees
The Trust has entered into contracts with one or more shareholder servicing agents, whereby Class A, Class C and Administrator Class of the Fund are charged a fee at an annual rate of 0.25% of the average daily net assets of each respective class. A portion of these total shareholder servicing fees were paid to affiliates, and to certain entities that were affiliates of the Fund until November 1, 2021.
Interfund transactions
The Fund may purchase or sell portfolio investment securities to certain affiliates pursuant to Rule 17a-7 under the 1940 Act and under procedures adopted by the Board of Trustees. The procedures have been designed to ensure that these interfund transactions, which do not incur broker commissions, are effected at current market prices.
5. INVESTMENT PORTFOLIO TRANSACTIONS
Purchases and sales of investments, excluding U.S. government obligations (if any) and short-term securities, for the six months ended March 31, 2022 were $165,519,170 and $221,530,810, respectively.
6. SECURITIES LENDING TRANSACTIONS
The Fund lends its securities through an unaffiliated securities lending agent and receives collateral in the form of cash or securities with a value at least equal to the value of the securities on loan. The value of the loaned securities is determined at the close of each business day and any increases or decreases in the required collateral are exchanged between the Fund and the counterparty on the next business day. Cash collateral received is invested in the Securities Lending Fund which seeks to provide a positive return compared to the daily Federal Funds Open Rate by investing in high-quality, U.S. dollar-denominated short-term money market instruments and is exempt from registration under Section 3(c)(7) of the 1940 Act. Securities Lending Fund is managed by Allspring Funds Management and is subadvised by Allspring Global Investments, LLC ("Allspring Investments"), an affiliate of Allspring Funds Management and a wholly owned subsidiary of Allspring Global Investments Holdings, LLC. Allspring Funds Management receives an advisory fee starting at 0.05% and declining to 0.01% as the average daily net assets of the Securities Lending Fund increase. All of the fees received by Allspring Funds Management are paid to Allspring Investments for its services as subadviser.
In the event of counterparty default or the failure of a borrower to return a loaned security, the Fund has the right to use the collateral to offset any losses incurred. As of March 31, 2022, the Fund had securities lending transactions with the following counterparties which are subject to offset:
| Counterparty | Value of
securities on
loan | Collateral
received1 | Net amount |
| Barclays Capital Incorporated | $ 812,004 | $ (812,004) | $0 |
| BNP Paribas Securities Corporation | 8,852,740 | (8,852,740) | 0 |
| JPMorgan Securities LLC | 1,677,452 | (1,677,452) | 0 |
1 Collateral received within this table is limited to the collateral for the net transaction with the counterparty.
7. BANK BORROWINGS
The Trust (excluding the money market funds), Allspring Master Trust and Allspring Variable Trust are parties to a $350,000,000 revolving credit agreement whereby the Fund is permitted to use bank borrowings for temporary or emergency purposes, such as to fund shareholder redemption requests. Interest under the credit agreement is charged to the Fund based on a borrowing rate equal to the higher of the Federal Funds rate in effect on that day plus 1.25% or the overnight bank funding rate in effect on that day plus 1.25%. In addition, an annual commitment fee equal to 0.25% of the unused balance is allocated to each participating fund.
For the six months ended March 31, 2022, there were no borrowings by the Fund under the agreement.
8. CONCENTRATION RISKS
As of the end of the period, the Fund concentrated its portfolio of investments in the financials sector. A fund that invests a substantial portion of its assets in any sector may be more affected by changes in that sector than would be a fund whose investments are not heavily weighted in any sector.
Allspring C&B Mid Cap Value Fund | 25
Notes to financial statements (unaudited)
9. INDEMNIFICATION
Under the Fund's organizational documents, the officers and Trustees have been granted certain indemnification rights against certain liabilities that may arise out of performance of their duties to the Fund. The Fund has entered into a separate agreement with each Trustee that converts indemnification rights currently existing under the Fund’s organizational documents into contractual rights that cannot be changed in the future without the consent of the Trustee. Additionally, in the normal course of business, the Fund may enter into contracts with service providers that contain a variety of indemnification clauses. The Fund’s maximum exposure under these arrangements is dependent on future claims that may be made against the Fund and, therefore, cannot be estimated.
10. CORONAVIRUS (COVID-19) PANDEMIC
On March 11, 2020, the World Health Organization announced that it had made the assessment that coronavirus disease 2019 (“COVID-19”) is a pandemic. The impacts of COVID-19 are affecting the entire global economy, individual companies and investment products, the funds, and the market in general. There is significant uncertainty around the extent and duration of business disruptions related to COVID-19 and the impacts may last for an extended period of time. COVID-19 has led to significant uncertainty and volatility in the financial markets.
26 | Allspring C&B Mid Cap Value Fund
Other information (unaudited)
PROXY VOTING INFORMATION
A description of the policies and procedures used to determine how to vote proxies relating to portfolio securities is available without charge, upon request, by calling 1-800-222-8222, visiting our website at allspringglobal.com, or visiting the SEC website at sec.gov. Information regarding how the proxies related to portfolio securities were voted during the most recent 12-month period ended June 30 is available on the website at allspringglobal.com or by visiting the SEC website at sec.gov.
SPECIAL MEETING OF SHAREHOLDERS
On February 18, 2022, a Special Meeting of Shareholders for the Fund was held to consider the following proposals. The results of the proposals are indicated below.
Proposal 1 – To consider and approve a new investment management agreement with Wells Fargo Funds Management, LLC*.
| Shares voted “For” | | 4,731,522 |
| Shares voted “Against” | | 153,688 |
| Shares voted “Abstain” | | 277,752 |
Proposal 2 – To consider and approve a new subadvisory agreement with Wells Capital Management, LLC**.
| Shares voted “For” | | 4,726,335 |
| Shares voted “Against” | | 137,346 |
| Shares voted “Abstain” | | 299,281 |
* Effective November 1, 2021, known as Allspring Funds Management, LLC.
** Effective November 1, 2021, known as Allspring Global Investments, LLC.
QUARTERLY PORTFOLIO HOLDINGS INFORMATION
The Fund files its complete schedule of portfolio holdings with the SEC for the first and third quarters of each fiscal year as an exhibit to its reports on Form N-PORT. Shareholders may view the filed Form N-PORT by visiting the SEC website at sec.gov.
Allspring C&B Mid Cap Value Fund | 27
Other information (unaudited)
BOARD OF TRUSTEES AND OFFICERS
Each of the Trustees and Officers listed in the table below acts in identical capacities for each fund in the Allspring family of funds, which consists of 138 mutual funds comprising the Allspring Funds Trust, Allspring Variable Trust, Allspring Master Trust and four closed-end funds (collectively the “Fund Complex”). This table should be read in conjunction with the Prospectus and the Statement of Additional Information1. The mailing address of each Trustee and Officer is 525 Market Street, 12th Floor, San Francisco, CA 94105. Each Trustee and Officer serves an indefinite term, however, each Trustee serves such term until reaching the mandatory retirement age established by the Trustees.
Independent Trustees
Name and
year of birth | Position held and
length of service* | Principal occupations during past five years or longer | Current other
public company or
investment
company
directorships |
William R. Ebsworth
(Born 1957) | Trustee,
since 2015 | Retired. From 1984 to 2013, equities analyst, portfolio manager, research director and chief investment officer at Fidelity Management and Research Company in Boston, Tokyo, and Hong Kong, and retired in 2013 as Chief Investment Officer of Fidelity Strategic Advisers, Inc. where he led a team of investment professionals managing client assets. Prior thereto, Board member of Hong Kong Securities Clearing Co., Hong Kong Options Clearing Corp., the Thailand International Fund, Ltd., Fidelity Investments Life Insurance Company, and Empire Fidelity Investments Life Insurance Company. Audit Committee Chair and Investment Committee Chair of the Vincent Memorial Hospital Endowment (non-profit organization). Mr. Ebsworth is a CFA® charterholder. | N/A |
Jane A. Freeman
(Born 1953) | Trustee,
since 2015;
Chair Liaison,
since 2018 | Retired. From 2012 to 2014 and 1999 to 2008, Chief Financial Officer of Scientific Learning Corporation. From 2008 to 2012, Ms. Freeman provided consulting services related to strategic business projects. Prior to 1999, Portfolio Manager at Rockefeller & Co. and Scudder, Stevens & Clark. Board member of the Harding Loevner Funds from 1996 to 2014, serving as both Lead Independent Director and chair of the Audit Committee. Board member of the Russell Exchange Traded Funds Trust from 2011 to 2012 and the chair of the Audit Committee. Ms. Freeman is also an inactive Chartered Financial Analyst. | N/A |
Isaiah Harris, Jr.
(Born 1952) | Trustee,
since 2009; Audit
Committee
Chair,
since 2019 | Retired. Chairman of the Board of CIGNA Corporation from 2009 to 2021, and Director from 2005 to 2008. From 2003 to 2011, Director of Deluxe Corporation. Prior thereto, President and CEO of BellSouth Advertising and Publishing Corp. from 2005 to 2007, President and CEO of BellSouth Enterprises from 2004 to 2005 and President of BellSouth Consumer Services from 2000 to 2003. Emeritus member of the Iowa State University Foundation Board of Governors. Emeritus Member of the Advisory Board of Iowa State University School of Business. Advisory Board Member, Palm Harbor Academy (private school). Advisory Board Member, Fellowship of Christian Athletes. Mr. Harris is a certified public accountant (inactive status). | N/A |
David F. Larcker
(Born 1950) | Trustee,
since 2009 | James Irvin Miller Professor of Accounting at the Graduate School of Business (Emeritus), Stanford University, Director of the Corporate Governance Research Initiative and Senior Faculty of The Rock Center for Corporate Governance since 2006. From 2005 to 2008, Professor of Accounting at the Graduate School of Business, Stanford University. Prior thereto, Ernst & Young Professor of Accounting at The Wharton School, University of Pennsylvania from 1985 to 2005. | N/A |
28 | Allspring C&B Mid Cap Value Fund
Other information (unaudited)
Name and
year of birth | Position held and
length of service* | Principal occupations during past five years or longer | Current other
public company or
investment
company
directorships |
Olivia S. Mitchell
(Born 1953) | Trustee,
since 2006;
Nominating and
Governance
Committee Chair,
since 2018 | International Foundation of Employee Benefit Plans Professor since 1993, Wharton School of the University of Pennsylvania. Director of Wharton’s Pension Research Council and Boettner Center on Pensions & Retirement Research, and Research Associate at the National Bureau of Economic Research. Previously taught at Cornell University from 1978 to 1993. | N/A |
Timothy J. Penny
(Born 1951) | Trustee,
since 1996;
Chair,
since 2018 | President and Chief Executive Officer of Southern Minnesota Initiative Foundation, a non-profit organization, since 2007. Member of the Board of Trustees of NorthStar Education Finance, Inc., a non-profit organization, since 2007. | N/A |
James G. Polisson
(Born 1959) | Trustee,
since 2018 | Retired. Chief Marketing Officer, Source (ETF) UK Services, Ltd, from 2015 to 2017. From 2012 to 2015, Principal of The Polisson Group, LLC, a management consulting, corporate advisory and principal investing company. Chief Executive Officer and Managing Director at Russell Investments, Global Exchange Traded Funds from 2010 to 2012. Managing Director of Barclays Global Investors from 1998 to 2010 and Global Chief Marketing Officer for iShares and Barclays Global Investors from 2000 to 2010. Trustee of the San Francisco Mechanics’ Institute, a non-profit organization, from 2013 to 2015. Board member of the Russell Exchange Traded Fund Trust from 2011 to 2012. Director of Barclays Global Investors Holdings Deutschland GmbH from 2006 to 2009. Mr. Polisson is an attorney and has a retired status with the Massachusetts and District of Columbia Bar Associations. | N/A |
Pamela Wheelock
(Born 1959) | Trustee,
since January
2020; previously
Trustee from
January 2018 to
July 2019 | Board member of the Destination Medical Center Economic Development Agency, Rochester, Minnesota since 2019. Interim President of the McKnight Foundation from January to September 2020. McKnight Foundation Consultant, November 2020 to February 2021. Acting Commissioner, Minnesota Department of Human Services, July 2019 through September 2019. Consultant (part-time), Minnesota Department of Human Services, October 2019 through December 2019. Chief Operating Officer, Twin Cities Habitat for Humanity from 2017 to 2019. Vice President of University Services, University of Minnesota from 2012 to 2016. Prior thereto, on the Board of Directors, Governance Committee and Finance Committee for the Minnesota Philanthropy Partners (Saint Paul Foundation) from 2012 to 2018, Interim Chief Executive Officer of Blue Cross Blue Shield of Minnesota from 2011 to 2012, Chairman of the Board from 2009 to 2012 and Board Director from 2003 to 2015. Vice President, Leadership and Community Engagement, Bush Foundation, Saint Paul, Minnesota (a private foundation) from 2009 to 2011. Executive Vice President and Chief Financial Officer, Minnesota Sports and Entertainment from 2004 to 2009 and Senior Vice President from 2002 to 2004. Executive Vice President of the Minnesota Wild Foundation from 2004 to 2008. Commissioner of Finance, State of Minnesota, from 1999 to 2002. Currently Board Chair of the Minnesota Wild Foundation since 2010. | N/A |
* Length of service dates reflect the Trustee’s commencement of service with the Trust’s predecessor entities, where applicable.
Allspring C&B Mid Cap Value Fund | 29
Other information (unaudited)
Officers2
Name and
year of birth | Position held and
length of service | Principal occupations during past five years or longer |
Andrew Owen
(Born 1960) | President,
since 2017 | President, Chief Executive Officer and Director of Allspring Funds Management, LLC since 2017 and co-president of Galliard Capital Management, LLC, an affiliate of Allspring Funds Management, LLC, since 2019. Prior thereto, Head of Affiliated Managers, Allspring Global Investments, from 2014 to 2019 and Executive Vice President responsible for marketing, investments and product development for Allspring Funds Management, LLC, from 2009 to 2014. In addition, Mr. Owen was an Executive Vice President of Wells Fargo & Company from 2014 to 2021. |
Jeremy DePalma
(Born 1974) | Treasurer,
since 2012
(for certain funds in
the Fund Complex);
since 2021 (for
the remaining funds in the
Fund Complex) | Senior Vice President of Allspring Funds Management, LLC since 2009. Senior Vice President of Evergreen Investment Management Company, LLC from 2008 to 2010 and head of the Fund Reporting and Control Team within Fund Administration from 2005 to 2010. |
Kate McKinley
(Born 1977) | Chief Legal Officer,
since 2021 | Chief Legal Officer of Allspring Global Investments since 2021. Prior thereto, held various roles at State Street Global Advisors beginning in 2010, including serving as Senior Vice President and General Counsel from 2019 to 2021, and Chief Operating Officer of the Institutional Client Group from 2016 - 2019. Prior to working at State Street Global Advisors served as Assistant General Counsel for Bank of America Corporation from 2005 to 2010 and as an Associate at WilmerHale from 2002 to 2005. |
Christopher Baker
(Born 1976) | Chief Compliance Officer, since 2022 | Global Chief Compliance Officer for Allspring Global Investments since 2022. Prior thereto, Chief Compliance Officer for State Street Global Advisors from 2018 to 2021. Senior Compliance Officer for the State Street divisions of Alternative Investment Solutions, Sector Solutions, and Global Marketing from 2015 to 2018. From 2010 to 2015 Vice President, Global Head of Investment and Marketing Compliance for State Street Global Advisors. |
Matthew Prasse
(Born 1983) | Secretary,
since 2021 | Senior Counsel of the Allspring Legal Department since 2021. Senior Counsel of the Wells Fargo Legal Department from 2018 to 2021. Previously, Counsel for Barings LLC from 2015 to 2018. Prior to joining Barings, Associate at Morgan, Lewis & Bockius LLP from 2008 to 2015. |
1 The Statement of Additional Information includes additional information about the Trustees and is available, without charge, upon request, by calling 1-800-222-8222 or by visiting the website at allspringglobal.com.
2 For those Officers with tenures at Allspring Global Investments and/or Allspring Funds Management, LLC that began prior to 2021, such tenures include years of service during which these businesses/entities were known as Wells Fargo Asset Management and Wells Fargo Funds Management, LLC, respectively.
30 | Allspring C&B Mid Cap Value Fund
For more information
More information about Allspring Funds is available free upon request. To obtain literature, please write, visit the Fund's website, or call:
Allspring Funds
P.O. Box 219967
Kansas City, MO 64121-9967
Website: allspringglobal.com
Individual investors: 1-800-222-8222
Retail investment professionals: 1-888-877-9275
Institutional investment professionals: 1-800-260-5969
This report and the financial statements contained herein are submitted for the general information of the shareholders of the Fund. If this report is used for promotional purposes, distribution of the report must be accompanied or preceded by a current prospectus. Before investing, please consider the investment objectives, risks, charges, and expenses of the investment. For a current prospectus and, if available, a summary prospectus, containing this information, call
1-800-222-8222 or visit the Fund's website at allspringglobal.com. Read the prospectus carefully before you invest or send money.
Allspring Global InvestmentsTM is the trade name for the asset management firms of Allspring Global Investments Holdings, LLC, a holding company indirectly owned by certain private funds of GTCR LLC and Reverence Capital Partners, L.P. These firms include but are not limited to Allspring Global Investments, LLC, and Allspring Funds Management, LLC. Certain products managed by Allspring entities are distributed by Allspring Funds Distributor, LLC (a broker-dealer and Member FINRA/SIPC).
This material is for general informational and educational purposes only and is NOT intended to provide investment advice or a recommendation of any kind - including a recommendation for any specific investment, strategy, or plan.
© 2022 Allspring Global Investments Holdings, LLC. All rights reserved.
PAR-0522-00052 05-22
SA228/SAR228 03-22
Semi-Annual Report
March 31, 2022
Allspring Common Stock Fund
The views expressed and any forward-looking statements are as of March 31, 2022, unless otherwise noted, and are those of the Fund's portfolio managers and/or Allspring Global Investments. Discussions of individual securities or the markets generally are not intended as individual recommendations. Future events or results may vary significantly from those expressed in any forward-looking statements. The views expressed are subject to change at any time in response to changing circumstances in the market. Allspring Global Investments disclaims any obligation to publicly update or revise any views expressed or forward-looking statements.
Allspring Common Stock Fund | 1
Letter to shareholders (unaudited)
Andrew Owen
President
Allspring Funds
Dear Shareholder:
We are pleased to offer you this semi-annual report for Allspring Common Stock Fund for the six-month period that ended March 31, 2022. Global stocks and bonds broadly declined during a challenging period. Despite progress on a global economic recovery from COVID-19, persistently high inflation, concerns regarding anticipated tightening of central bank monetary policy, and turmoil caused by the Russian invasion of Ukraine all led to a retreat from financial market gains made earlier in 2021. Among major indexes, the U.S. large-cap-dominated S&P 500 Index was an exception in escaping a half-year loss.
For the six-month period, U.S. stocks, based on the S&P 500 Index,1 gained 5.92%. International stocks, as measured by the MSCI ACWI ex USA Index (Net),2 returned -3.72%, while the MSCI EM Index (Net) (USD),3 trailed both developed market benchmarks with a return of -8.20%. The Bloomberg U.S. Aggregate Bond Index,4returned -5.92%, the Bloomberg Global Aggregate ex-USD Index (unhedged),5 returned -7.26%, the Bloomberg Municipal Bond Index6 returned -5.55%, and the ICE BofA U.S. High Yield Index,7 lost 3.89%.
Inflationary concerns and the Russian-Ukraine war caused markets to retreat.
Elevated inflation pressures and the ongoing global supply bottleneck continued in October, but strong corporate earnings provided a bright spot in the U.S., the eurozone, and many Asian countries. Government bond yields rose globally as central banks prepared to tighten monetary policy. Commodity prices continued to rise, driven by sharply higher energy costs.
In November, as COVID-19 hospitalizations rose, most major global asset classes declined. Two exceptions were U.S. investment-grade bonds and Treasury Inflation-Protected Securities. President Biden signed a long-awaited $550 billion infrastructure bill to upgrade U.S. roads, bridges, and railways. Meanwhile, the Consumer Price Index8, a measure of domestic inflation conditions, jumped to its highest level in 31 years. While the threat of consistently high inflation led the U.S. Federal Reserve (Fed) to discuss a faster pace of tapering, the Omicron strain created uncertainty. Commodities lost ground for the month, driven by sharp declines in oil prices (and energy costs in general) as well as precious metals.
“Elevated inflation pressures and the ongoing global supply bottleneck continued in October, but strong corporate earnings provided a bright spot in the U.S., the eurozone, and many Asian countries.”
| 1 | The S&P 500 Index consists of 500 stocks chosen for market size, liquidity, and industry group representation. It is a market-value-weighted index with each stock's weight in the index proportionate to its market value. You cannot invest directly in an index. |
| 2 | The Morgan Stanley Capital International (MSCI) All Country World Index (ACWI) ex USA Index (Net) is a free-float-adjusted market-capitalization-weighted index that is designed to measure the equity market performance of developed and emerging markets, excluding the U.S. Source: MSCI. MSCI makes no express or implied warranties or representations and shall have no liability whatsoever with respect to any MSCI data contained herein. The MSCI data may not be further redistributed or used as a basis for other indexes or any securities or financial products. This report is not approved, reviewed, or produced by MSCI. You cannot invest directly in an index. |
| 3 | The MSCI Emerging Markets (EM) Index (Net) (USD) is a free-float-adjusted market-capitalization-weighted index that is designed to measure equity market performance of emerging markets. You cannot invest directly in an index. |
| 4 | The Bloomberg U.S. Aggregate Bond Index is a broad-based benchmark that measures the investment-grade, U.S.-dollar-denominated, fixed-rate taxable bond market, including Treasuries, government-related and corporate securities, mortgage-backed securities (agency fixed-rate and hybrid adjustable-rate mortgage pass-throughs), asset-backed securities, and commercial mortgage-backed securities. You cannot invest directly in an index. |
| 5 | The Bloomberg Global Aggregate ex-USD Index (unhedged) is an unmanaged index that provides a broad-based measure of the global investment-grade fixed-income markets excluding the U.S.-dollar-denominated debt market. You cannot invest directly in an index. |
| 6 | The Bloomberg Municipal Bond Index is an unmanaged index composed of long-term tax-exempt bonds with a minimum credit rating of Baa. You cannot invest directly in an index. |
| 7 | The ICE BofA U.S. High Yield Index is a market-capitalization-weighted index of domestic and Yankee high-yield bonds. The index tracks the performance of high-yield securities traded in the U.S. bond market. You cannot invest directly in an index. Copyright 2022. ICE Data Indices, LLC. All rights reserved. |
| 8 | The Consumer Price Index (CPI) is a measure of the average change over time in the prices paid by urban consumers for a market basket of consumer goods and services. You cannot invest directly in an index. |
2 | Allspring Common Stock Fund
Letter to shareholders (unaudited)
Global volatility lessened in December as data indicated a lower risk of severe disease and death from the Omicron variant. Even so, several countries introduced restrictions on travel and hospitality, among other sectors, in an effort to reduce the spread. In the U.S., data indicated a stable economy overall, with robust corporate earnings. Consumer spending potential looked strong heading into 2022 on elevated household savings and the lowest household debt ratio since 1973. U.S. corporate and high-yield bonds had monthly gains while Treasuries declined. Bonds were strongly affected by the projection of three 25-basis-point (bp; 100 bps equal 1.00%) policy rate hikes in 2022 by senior Federal Open Market Committee members, up from previous projections of just one hike.
In January 2022, the main focus was on potential U.S. interest rate hikes and the Russia-Ukraine conflict. The Fed hinted that a March interest rate hike was likely. Meanwhile, Russia threatened a potential invasion of Ukraine, which could disrupt Russia’s massive energy supplies and drive demand from non-Russian oil-producing countries. Elsewhere overseas, Europe saw food and energy prices spike, leading to rising inflation. Within fixed income, corporate bonds struggled in January, underperforming government bonds, as investors focused on continued elevated inflation and ongoing uncertainty over the U.S. monetary path.
The Russian invasion of Ukraine dominated the financial world in February and March. Equity, bond, and commodities markets were shaken by fear, uncertainty, and an upending of demand-supply dynamics. Major global stock indexes were down in February, along with global bonds overall, with ongoing high levels of volatility in March along with mixed results that favored U.S. large-cap stocks. Prices of commodities spiked, including crude oil, natural gas, wheat, and precious metals, on elevated concerns of supply shortages. All of this fed already-high inflation concerns and added to expectations of more aggressive central bank interest rate hikes. Sweeping sanctions against Russia and corporate pullouts contributed to market volatility. Despite the geopolitical turmoil, the U.S. economic outlook remained largely unchanged, with a healthy job market and signs of economic resilience accompanying higher prices.
Don’t let short-term uncertainty derail long-term investment goals.
Periods of investment uncertainty can present challenges, but experience has taught us that maintaining long-term investment goals can be an effective way to plan for the future. To help you create a sound strategy based on your personal goals and risk tolerance, Allspring Funds offers more than 100 mutual funds spanning a wide range of asset classes and investment styles. Although diversification cannot guarantee an investment profit or prevent losses, we believe it can be an effective way to manage investment risk and potentially smooth out overall portfolio performance. We encourage investors to know their investments and to understand that appropriate levels of risk-taking may unlock opportunities.
Information on transaction closing.
On November 1, 2021, GTCR LLC and Reverence Capital Partners, L.P. announced the beginning of Allspring Global Investments™ with the close of the transaction to acquire Wells Fargo Funds Management, LLC; Wells Capital Management LLC; Galliard Capital Management LLC.; Wells Fargo Asset Management (International) Ltd.; Wells Fargo Asset Management Luxembourg S.A.; and Wells Fargo Funds Distributor, LLC, as well as Wells Fargo Bank, N.A.’s business of acting as trustee to its collective investment trusts and all related Wells Fargo Asset Management legal entities. The transaction closed on November 1, 2021, forming Allspring Global Investments, a privately held asset management firm with $451 billion in AUM1 as of March 31, 2022.
“ The Russian invasion of Ukraine dominated the financial world in February and March. Equity, bond, and commodities markets were shaken by fear, uncertainty, and an upending of demand-supply dynamics.”
| 1 | Figures are as of March 31, 2022, unless otherwise noted. Please note that the assets under management figures provided have been adjusted to eliminate any duplication of reporting among assets directed by multiple investment teams and includes $91.2B from Galliard Capital Management ($74.7B stable value; $16.5B fixed income), an investment advisor that is not part of the Allspring trade name/GIPS firm. |
Allspring Common Stock Fund | 3
Letter to shareholders (unaudited)
For further information about your Fund, contact your investment professional, visit our website at allspringglobal.com, or call us directly at 1-800-222-8222. |
Allspring Global Investments™ is a leading independent asset management firm with a full breadth of investment capabilities across diverse asset classes, serving the needs of its institutional and wealth management clients around the world. Allspring operates across 18 offices globally supported by more than 480 investment professionals. Allspring and its investment teams provide a broad range of differentiated investment products and solutions to help its diverse range of clients meet their investment objectives.
As part of this transition, all mutual funds within the Wells Fargo Funds family were rebranded as Allspring Funds. Each individual fund had “Wells Fargo” removed from its fund name and replaced with “Allspring.” The fund name changes went into effect on December 6, 2021.
Allspring Global Investments™ is the trade name for the asset management firm of Allspring Global Investments Holdings, LLC, a holding company indirectly owned by certain private funds of GTCR LLC and Reverence Capital Partners, L.P.
Thank you for choosing to invest with Allspring Funds. We appreciate your confidence in us and remain committed to helping you meet your financial needs.
Sincerely,
Andrew Owen
President
Allspring Funds
Notice to Shareholders
Russia launched a large-scale invasion of Ukraine on February 24, 2022. As a result of this military action, the United States and many other countries have instituted various economic sanctions against Russian and Belarus individuals and entities. The situation has led to increased financial market volatility and could have severe adverse effects on regional and global economic markets, including the markets for certain securities and commodities, such as oil and natural gas. The extent and duration of the military action, resulting sanctions imposed, other punitive action taken and the resulting market disruptions cannot be easily predicted.
Our solidarity and support goes out to our impacted employees and the people affected in Ukraine and their families. Allspring has a dedicated team of investment professionals actively monitoring the situation for any new developments and the potential impact to our clients and investment products. As the situation remains fluid, we are focused on the assessment of risks, valuation, and liquidity of impacted securities. Please visit our website at allspringglobal.com and click on “Russia-Ukraine Portfolio Impacts” for further information.
4 | Allspring Common Stock Fund
This page is intentionally left blank.
Performance highlights (unaudited)
| Investment objective | The Fund seeks long-term capital appreciation. |
| Manager | Allspring Funds Management, LLC |
| Subadviser | Allspring Global Investments, LLC |
| Portfolio managers | Christopher G. Miller, CFA®‡, Garth B. Newport, CFA®‡ |
| Average annual total returns (%) as of March 31, 2022 |
| | | Including sales charge | | Excluding sales charge | | Expense ratios1 (%) |
| | Inception date | 1 year | 5 year | 10 year | | 1 year | 5 year | 10 year | | Gross | Net 2 |
| Class A (SCSAX) | 11-30-2000 | -1.85 | 9.14 | 10.14 | | 4.13 | 10.44 | 10.79 | | 1.25 | 1.25 |
| Class C (STSAX) | 11-30-2000 | 2.40 | 9.69 | 10.00 | | 3.40 | 9.69 | 10.00 | | 2.00 | 2.00 |
| Class R6 (SCSRX)3 | 6-28-2013 | – | – | – | | 4.57 | 10.89 | 11.26 | | 0.82 | 0.82 |
| Administrator Class (SCSDX) | 7-30-2010 | – | – | – | | 4.28 | 10.98 | 11.15 | | 1.17 | 1.10 |
| Institutional Class (SCNSX) | 7-30-2010 | – | – | – | | 4.50 | 10.87 | 11.22 | | 0.92 | 0.85 |
| Russell 2500™ Index4 | – | – | – | – | | 0.34 | 11.57 | 12.09 | | – | – |
Figures quoted represent past performance, which is no guarantee of future results, and do not reflect taxes that a shareholder may pay on an investment in a fund. Investment return and principal value of an investment will fluctuate so that an investor’s shares, when redeemed, may be worth more or less than their original cost. Performance shown without sales charges would be lower if sales charges were reflected. Current performance may be lower or higher than the performance data quoted, which assumes the reinvestment of dividends and capital gains. Current month-end performance is available on the Fund’s website, allspringglobal.com.
Index returns do not include transaction costs associated with buying and selling securities, any mutual fund fees or expenses, or any taxes. It is not possible to invest directly in an index.
For Class A shares, the maximum front-end sales charge is 5.75%. For Class C shares, the maximum contingent deferred sales charge is 1.00%. Performance including a contingent deferred sales charge assumes the sales charge for the corresponding time period. Class R6, Administrator Class and Institutional Class shares are sold without a front-end sales charge or contingent deferred sales charge.
| 1 | Reflects the expense ratios as stated in the most recent prospectuses. The expense ratios shown are subject to change and may differ from the annualized expense ratios shown in the financial highlights of this report. |
| 2 | The manager has contractually committed through January 31, 2023, to waive fees and/or reimburse expenses to the extent necessary to cap total annual fund operating expenses after fee waivers at 1.26% for Class A, 2.01% for Class C, 0.83% for Class R6, 1.10% for Administrator Class, and 0.85% for Institutional Class. Brokerage commissions, stamp duty fees, interest, taxes, acquired fund fees and expenses (if any), and extraordinary expenses are excluded from the expense caps. Prior to or after the commitment expiration date, the caps may be increased or the commitment to maintain the caps may be terminated only with the approval of the Board of Trustees. Without these caps, the Fund’s returns would have been lower. The expense ratio paid by an investor is the net expense ratio (the total annual fund operating expenses after fee waivers) as stated in the prospectuses. |
| 3 | Historical performance shown for the Class R6 shares prior to their inception reflects the performance of the Institutional Class shares, and includes the higher expenses applicable to the Institutional Class shares. If these expenses had not been included, returns for the Class R6 shares would be higher. |
| 4 | The Russell 2500TM Index measures the performance of the 2,500 smallest companies in the Russell 3000® Index, which represents approximately 16% of the total market capitalization of the Russell 3000® Index. You cannot invest directly in an index. |
Stock values fluctuate in response to the activities of individual companies and general market and economic conditions. Smaller-company stocks tend to be more volatile and less liquid than those of larger companies. Certain investment strategies tend to increase the total risk of an investment (relative to the broader market). This fund is exposed to foreign investment risk. Consult the Fund’s prospectus for additional information on these and other risks.
| ‡ | CFA® and Chartered Financial Analyst® are trademarks owned by CFA Institute. |
6 | Allspring Common Stock Fund
Performance highlights (unaudited)
| Ten largest holdings (%) as of March 31, 20221 |
| Carlisle Companies Incorporated | 2.25 |
| Sun Communities Incorporated | 2.04 |
| ON Semiconductor Corporation | 2.00 |
| Atkore Incorporated | 2.00 |
| LivaNova plc | 1.96 |
| Zendesk Incorporated | 1.95 |
| Bio-Rad Laboratories Incorporated Class A | 1.90 |
| Arch Capital Group Limited | 1.79 |
| Revolve Group Incorporated | 1.78 |
| Ashland Global Holdings Incorporated | 1.73 |
| 1 | Figures represent the percentage of the Fund's net assets. Holdings are subject to change and may have changed since the date specified. |
| Sector allocation as of March 31, 20221 |
| 1 | Figures represent the percentage of the Fund's long-term investments. These amounts are subject to change and may have changed since the date specified. |
Allspring Common Stock Fund | 7
Fund expenses (unaudited)
As a shareholder of the Fund, you incur two types of costs: (1) transaction costs, including sales charges (loads) on purchase payments and contingent deferred sales charges (if any) on redemptions and (2) ongoing costs, including management fees, distribution (12b-1) and/or shareholder servicing fees, and other Fund expenses. This example is intended to help you understand your ongoing costs (in dollars) of investing in the Fund and to compare these costs with the ongoing costs of investing in other mutual funds.
The example is based on an investment of $1,000 invested at the beginning of the six-month period and held for the entire period from October 1, 2021 to March 31, 2022.
Actual expenses
The “Actual” line of the table below provides information about actual account values and actual expenses. You may use the information in this line, together with the amount you invested, to estimate the expenses that you paid over the period. Simply divide your account value by $1,000 (for example, an $8,600 account value divided by $1,000 = 8.6), then multiply the result by the number in the “Actual” line under the heading entitled “Expenses paid during period” for your applicable class of shares to estimate the expenses you paid on your account during this period.
Hypothetical example for comparison purposes
The “Hypothetical” line of the table below provides information about hypothetical account values and hypothetical expenses based on the Fund’s actual expense ratio and an assumed rate of return of 5% per year before expenses, which is not the Fund’s actual return. The hypothetical account values and expenses may not be used to estimate the actual ending account balance or expenses you paid for the period. You may use this information to compare the ongoing costs of investing in the Fund and other funds. To do so, compare this 5% hypothetical example with the 5% hypothetical examples that appear in the shareholder reports of the other funds.
Please note that the expenses shown in the table are meant to highlight your ongoing costs only and do not reflect any transactional costs, such as sales charges (loads) and contingent deferred sales charges. Therefore, the “Hypothetical” line of the table is useful in comparing ongoing costs only, and will not help you determine the relative total costs of owning different funds. In addition, if these transactional costs were included, your costs would have been higher.
| | Beginning
account value
10-1-2021 | Ending
account value
3-31-2022 | Expenses
paid during
the period1 | Annualized net
expense ratio |
| Class A | | | | |
| Actual | $1,000.00 | $ 985.91 | $6.09 | 1.23% |
| Hypothetical (5% return before expenses) | $1,000.00 | $1,018.80 | $6.19 | 1.23% |
| Class C | | | | |
| Actual | $1,000.00 | $ 983.09 | $9.34 | 1.89% |
| Hypothetical (5% return before expenses) | $1,000.00 | $1,015.51 | $9.50 | 1.89% |
| Class R6 | | | | |
| Actual | $1,000.00 | $ 987.91 | $4.06 | 0.82% |
| Hypothetical (5% return before expenses) | $1,000.00 | $1,020.84 | $4.13 | 0.82% |
| Administrator Class | | | | |
| Actual | $1,000.00 | $ 986.64 | $5.45 | 1.10% |
| Hypothetical (5% return before expenses) | $1,000.00 | $1,019.45 | $5.54 | 1.10% |
| Institutional Class | | | | |
| Actual | $1,000.00 | $ 987.82 | $4.21 | 0.85% |
| Hypothetical (5% return before expenses) | $1,000.00 | $1,020.69 | $4.28 | 0.85% |
1 Expenses paid is equal to the annualized net expense ratio of each class multiplied by the average account value over the period, multiplied by 182 divided by 365 (to reflect the one-half-year period).
8 | Allspring Common Stock Fund
Portfolio of investments—March 31, 2022 (unaudited)
| | | | | Shares | Value |
| Common stocks: 97.79% | | | | | |
| Communication services: 0.76% | | | | | |
| Interactive media & services: 0.76% | | | | | |
| Bumble Incorporated Class A † | | | | 265,037 | $ 7,680,772 |
| Consumer discretionary: 11.75% | | | | | |
| Auto components: 1.22% | | | | | |
| Dana Incorporated | | | | 704,481 | 12,377,731 |
| Diversified consumer services: 0.69% | | | | | |
| Service Corporation International | | | | 106,752 | 7,026,417 |
| Hotels, restaurants & leisure: 1.33% | | | | | |
| Planet Fitness Incorporated Class A † | | | | 159,586 | 13,481,825 |
| Household durables: 0.97% | | | | | |
| Mohawk Industries Incorporated † | | | | 79,270 | 9,845,334 |
| Internet & direct marketing retail: 2.36% | | | | | |
| Revolve Group Incorporated † | | | | 335,822 | 18,030,283 |
| The RealReal Incorporated † | | | | 813,632 | 5,906,968 |
| | | | | | 23,937,251 |
| Specialty retail: 4.21% | | | | | |
| Burlington Stores Incorporated † | | | | 64,089 | 11,675,093 |
| National Vision Holdings Incorporated † | | | | 244,241 | 10,641,580 |
| Tractor Supply Company | | | | 27,298 | 6,370,534 |
| Ulta Beauty Incorporated † | | | | 35,445 | 14,114,908 |
| | | | | | 42,802,115 |
| Textiles, apparel & luxury goods: 0.97% | | | | | |
| Deckers Outdoor Corporation † | | | | 36,108 | 9,885,287 |
| Consumer staples: 3.82% | | | | | |
| Food products: 1.27% | | | | | |
| Nomad Foods Limited † | | | | 570,091 | 12,872,655 |
| Household products: 1.07% | | | | | |
| Church & Dwight Company Incorporated | | | | 109,259 | 10,858,159 |
| Personal products: 1.48% | | | | | |
| e.l.f. Beauty Incorporated † | | | | 425,515 | 10,991,052 |
| The Honest Company Incorporated † | | | | 786,472 | 4,097,519 |
| | | | | | 15,088,571 |
| Financials: 10.72% | | | | | |
| Banks: 2.28% | | | | | |
| Pinnacle Financial Partners Incorporated | | | | 106,790 | 9,833,223 |
| Webster Financial Corporation | | | | 237,642 | 13,336,469 |
| | | | | | 23,169,692 |
The accompanying notes are an integral part of these financial statements.
Allspring Common Stock Fund | 9
Portfolio of investments—March 31, 2022 (unaudited)
| | | | | Shares | Value |
| Capital markets: 2.06% | | | | | |
| Cboe Global Markets Incorporated | | | | 98,455 | $ 11,265,221 |
| Raymond James Financial Incorporated | | | | 87,409 | 9,607,123 |
| | | | | | 20,872,344 |
| Insurance: 5.49% | | | | | |
| Arch Capital Group Limited † | | | | 375,120 | 18,163,310 |
| Axis Capital Holdings Limited | | | | 272,255 | 16,463,260 |
| CNO Financial Group Incorporated | | | | 330,097 | 8,282,134 |
| Reinsurance Group of America Incorporated | | | | 117,753 | 12,889,243 |
| | | | | | 55,797,947 |
| Thrifts & mortgage finance: 0.89% | | | | | |
| Essent Group Limited | | | | 218,932 | 9,022,188 |
| Health care: 12.06% | | | | | |
| Biotechnology: 0.54% | | | | | |
| Neurocrine Biosciences Incorporated † | | | | 42,910 | 4,022,813 |
| Sage Therapeutics Incorporated † | | | | 45,524 | 1,506,844 |
| | | | | | 5,529,657 |
| Health care equipment & supplies: 4.02% | | | | | |
| Haemonetics Corporation † | | | | 134,979 | 8,533,372 |
| Integer Holdings Corporation † | | | | 154,138 | 12,418,899 |
| LivaNova plc † | | | | 242,436 | 19,838,538 |
| | | | | | 40,790,809 |
| Health care providers & services: 3.11% | | | | | |
| HealthEquity Incorporated † | | | | 233,893 | 15,773,744 |
| Humana Incorporated | | | | 36,270 | 15,783,616 |
| | | | | | 31,557,360 |
| Health care technology: 0.49% | | | | | |
| Schrodinger Incorporated † | | | | 145,640 | 4,969,237 |
| Life sciences tools & services: 3.90% | | | | | |
| Azenta Incorporated | | | | 121,517 | 10,071,329 |
| Bio-Rad Laboratories Incorporated Class A † | | | | 34,251 | 19,291,191 |
| Codexis Incorporated † | | | | 159,484 | 3,288,560 |
| Sotera Health Company † | | | | 322,802 | 6,991,891 |
| | | | | | 39,642,971 |
| Industrials: 24.10% | | | | | |
| Aerospace & defense: 1.47% | | | | | |
| MTU Aero Engines AG | | | | 64,631 | 14,947,853 |
| Building products: 8.05% | | | | | |
| Advanced Drainage Systems Incorporated | | | | 76,730 | 9,116,291 |
| Armstrong World Industries Incorporated | | | | 176,397 | 15,877,494 |
| Carlisle Companies Incorporated | | | | 92,912 | 22,848,919 |
| Masonite International Corporation † | | | | 187,716 | 16,695,461 |
| Tecnoglass Incorporated « | | | | 288,842 | 7,290,372 |
| The AZEK Company Incorporated † | | | | 402,128 | 9,988,860 |
| | | | | | 81,817,397 |
The accompanying notes are an integral part of these financial statements.
10 | Allspring Common Stock Fund
Portfolio of investments—March 31, 2022 (unaudited)
| | | | | Shares | Value |
| Commercial services & supplies: 3.33% | | | | | |
| IAA Incorporated † | | | | 344,176 | $ 13,164,732 |
| Republic Services Incorporated | | | | 88,077 | 11,670,203 |
| Stericycle Incorporated † | | | | 152,898 | 9,008,750 |
| | | | | | 33,843,685 |
| Construction & engineering: 0.97% | | | | | |
| APi Group Corporation † | | | | 466,714 | 9,814,995 |
| Electrical equipment: 4.13% | | | | | |
| Atkore Incorporated † | | | | 206,635 | 20,341,149 |
| Regal Rexnord Corporation | | | | 83,388 | 12,406,467 |
| Sensata Technologies Holding plc † | | | | 180,807 | 9,194,036 |
| | | | | | 41,941,652 |
| Machinery: 1.19% | | | | | |
| Ingersoll Rand Incorporated | | | | 240,641 | 12,116,274 |
| Professional services: 2.19% | | | | | |
| Booz Allen Hamilton Holding Corporation | | | | 130,408 | 11,455,039 |
| Dun & Bradstreet Holdings Incorporated † | | | | 613,523 | 10,748,923 |
| | | | | | 22,203,962 |
| Trading companies & distributors: 2.77% | | | | | |
| Air Lease Corporation | | | | 278,890 | 12,452,439 |
| United Rentals Incorporated † | | | | 44,260 | 15,721,595 |
| | | | | | 28,174,034 |
| Information technology: 19.30% | | | | | |
| Electronic equipment, instruments & components: 1.64% | | | | | |
| Teledyne Technologies Incorporated † | | | | 35,253 | 16,661,625 |
| IT services: 2.16% | | | | | |
| EVO Payments Incorporated Class A † | | | | 552,075 | 12,747,412 |
| Genpact Limited | | | | 210,992 | 9,180,262 |
| | | | | | 21,927,674 |
| Semiconductors & semiconductor equipment: 3.53% | | | | | |
| Marvell Technology Incorporated | | | | 217,238 | 15,578,137 |
| ON Semiconductor Corporation † | | | | 325,087 | 20,353,697 |
| | | | | | 35,931,834 |
| Software: 11.97% | | | | | |
| 8x8 Incorporated † | | | | 576,159 | 7,253,842 |
| Black Knight Incorporated † | | | | 214,440 | 12,435,376 |
| Fair Isaac Corporation † | | | | 27,827 | 12,980,182 |
| Instructure Holdings Incorporated †« | | | | 529,310 | 10,617,959 |
| New Relic Incorporated † | | | | 92,412 | 6,180,515 |
| Pagerduty Incorporated † | | | | 467,613 | 15,987,688 |
| Q2 Holdings Incorporated † | | | | 201,695 | 12,434,497 |
| Riskified Limited Class A †« | | | | 295,571 | 1,785,249 |
| SPS Commerce Incorporated † | | | | 81,754 | 10,726,125 |
| WalkMe Limited †« | | | | 754,376 | 11,383,534 |
| Zendesk Incorporated † | | | | 164,571 | 19,796,246 |
| | | | | | 121,581,213 |
The accompanying notes are an integral part of these financial statements.
Allspring Common Stock Fund | 11
Portfolio of investments—March 31, 2022 (unaudited)
| | | | | Shares | Value |
| Materials: 7.23% | | | | | |
| Chemicals: 4.41% | | | | | |
| Ashland Global Holdings Incorporated | | | | 179,218 | $ 17,636,843 |
| Quaker Chemical Corporation | | | | 58,315 | 10,077,415 |
| Westlake Chemical Corporation | | | | 138,864 | 17,135,818 |
| | | | | | 44,850,076 |
| Containers & packaging: 1.19% | | | | | |
| Crown Holdings Incorporated | | | | 96,373 | 12,055,299 |
| Metals & mining: 1.63% | | | | | |
| Steel Dynamics Incorporated | | | | 198,483 | 16,559,437 |
| Real estate: 8.05% | | | | | |
| Equity REITs: 8.05% | | | | | |
| American Homes 4 Rent Class A | | | | 387,567 | 15,514,307 |
| Life Storage Incorporated | | | | 83,024 | 11,659,060 |
| SBA Communications Corporation | | | | 48,243 | 16,600,416 |
| Sun Communities Incorporated | | | | 118,168 | 20,713,669 |
| VICI Properties Incorporated | | | | 609,531 | 17,347,252 |
| | | | | | 81,834,704 |
| Total Common stocks (Cost $744,556,690) | | | | | 993,470,036 |
| | | | | | |
| Investment companies: 1.01% | | | | | |
| Exchange-traded funds: 1.01% | | | | | |
| SPDR S&P Biotech ETF « | | | | 113,777 | 10,226,277 |
| Total Investment companies (Cost $8,327,059) | | | | | 10,226,277 |
| | | Yield | | | |
| Short-term investments: 3.36% | | | | | |
| Investment companies: 3.36% | | | | | |
| Allspring Government Money Market Fund Select Class ♠∞ | | 0.18% | | 14,115,888 | 14,115,888 |
| Securities Lending Cash Investments LLC ♠∩∞ | | 0.40 | | 20,024,943 | 20,024,943 |
| Total Short-term investments (Cost $34,140,831) | | | | | 34,140,831 |
| Total investments in securities (Cost $787,024,580) | 102.16% | | | | 1,037,837,144 |
| Other assets and liabilities, net | (2.16) | | | | (21,967,554) |
| Total net assets | 100.00% | | | | $1,015,869,590 |
| † | Non-income-earning security |
| « | All or a portion of this security is on loan. |
| ♠ | The issuer of the security is an affiliated person of the Fund as defined in the Investment Company Act of 1940. |
| ∩ | The investment is a non-registered investment company purchased with cash collateral received from securities on loan. |
| ∞ | The rate represents the 7-day annualized yield at period end. |
| Abbreviations: |
| REIT | Real estate investment trust |
The accompanying notes are an integral part of these financial statements.
12 | Allspring Common Stock Fund
Portfolio of investments—March 31, 2022 (unaudited)
Investments in affiliates
An affiliated investment is an investment in which the Fund owns at least 5% of the outstanding voting shares of the issuer or as a result of other relationships, such as the Fund and the issuer having the same investment manager. Transactions with issuers that were affiliates of the Fund at the end of the period were as follows:
| | Value,
beginning of
period | Purchases | Sales
proceeds | Net
realized
gains
(losses) | | Net
change in
unrealized
gains
(losses) | | Value,
end of
period | Shares,
end
of period | Income
from
affiliated
securities |
| Short-term investments | | | | | | | | | |
| Allspring Government Money Market Fund Select Class | $9,767,019 | $135,899,747 | $(131,550,878) | $0 | | $0 | | $ 14,115,888 | 14,115,888 | $ 1,995 |
| Securities Lending Cash Investments LLC | 9,154,560 | 181,454,772 | (170,584,389) | 0 | | 0 | | 20,024,943 | 20,024,943 | 11,880 # |
| | | | | $0 | | $0 | | $34,140,831 | | $13,875 |
| # | Amount shown represents income before fees and rebates. |
The accompanying notes are an integral part of these financial statements.
Allspring Common Stock Fund | 13
Statement of assets and liabilities—March 31, 2022 (unaudited)
| | |
| Assets | |
Investments in unaffiliated securities (including $19,597,193 of securities loaned), at value (cost $752,883,749)
| $ 1,003,696,313 |
Investments in affiliated securities, at value (cost $34,140,831)
| 34,140,831 |
Cash
| 430 |
Receivable for dividends
| 697,403 |
Receivable for Fund shares sold
| 55,841 |
Receivable for securities lending income, net
| 9,220 |
Prepaid expenses and other assets
| 31,155 |
Total assets
| 1,038,631,193 |
| Liabilities | |
Payable upon receipt of securities loaned
| 20,024,943 |
Payable for investments purchased
| 1,347,859 |
Management fee payable
| 649,067 |
Payable for Fund shares redeemed
| 218,731 |
Administration fees payable
| 165,820 |
Trustees’ fees and expenses payable
| 2,935 |
Distribution fee payable
| 461 |
Accrued expenses and other liabilities
| 351,787 |
Total liabilities
| 22,761,603 |
Total net assets
| $1,015,869,590 |
| Net assets consist of | |
Paid-in capital
| $ 704,633,393 |
Total distributable earnings
| 311,236,197 |
Total net assets
| $1,015,869,590 |
| Computation of net asset value and offering price per share | |
Net assets – Class A
| $ 879,671,783 |
Shares outstanding – Class A1
| 43,716,708 |
Net asset value per share – Class A
| $20.12 |
Maximum offering price per share – Class A2
| $21.35 |
Net assets – Class C
| $ 1,803,952 |
Shares outstanding – Class C1
| 161,064 |
Net asset value per share – Class C
| $11.20 |
Net assets – Class R6
| $ 36,363,419 |
Shares outstanding – Class R61
| 1,646,068 |
Net asset value per share – Class R6
| $22.09 |
Net assets – Administrator Class
| $ 2,420,440 |
Shares outstanding – Administrator Class1
| 113,687 |
Net asset value per share – Administrator Class
| $21.29 |
Net assets – Institutional Class
| $ 95,609,996 |
Shares outstanding – Institutional Class1
| 4,349,740 |
Net asset value per share – Institutional Class
| $21.98 |
| 1 | The Fund has an unlimited number of authorized shares. |
| 2 | Maximum offering price is computed as 100/94.25 of net asset value. On investments of $50,000 or more, the offering price is reduced. |
The accompanying notes are an integral part of these financial statements.
14 | Allspring Common Stock Fund
Statement of operations—six months ended March 31, 2022 (unaudited)
| | |
| Investment income | |
Dividends
| $ 3,570,943 |
Income from affiliated securities
| 97,989 |
Total investment income
| 3,668,932 |
| Expenses | |
Management fee
| 4,137,358 |
| Administration fees | |
Class A
| 981,121 |
Class C
| 2,163 |
Class R6
| 5,399 |
Administrator Class
| 1,813 |
Institutional Class
| 65,139 |
| Shareholder servicing fees | |
Class A
| 1,168,001 |
Class C
| 2,569 |
Administrator Class
| 3,479 |
| Distribution fee | |
Class C
| 6,622 |
Custody and accounting fees
| 25,492 |
Professional fees
| 26,683 |
Registration fees
| 32,369 |
Shareholder report expenses
| 20,904 |
Trustees’ fees and expenses
| 10,838 |
Other fees and expenses
| 4,797 |
Total expenses
| 6,494,747 |
| Less: Fee waivers and/or expense reimbursements | |
Class A
| (103,567) |
Class C
| (34) |
Class R6
| (59) |
Administrator Class
| (996) |
Institutional Class
| (36,161) |
Net expenses
| 6,353,930 |
Net investment loss
| (2,684,998) |
| Realized and unrealized gains (losses) on investments | |
Net realized gains on investments
| 94,481,120 |
Net change in unrealized gains (losses) on investments
| (104,820,801) |
Net realized and unrealized gains (losses) on investments
| (10,339,681) |
Net decrease in net assets resulting from operations
| $ (13,024,679) |
The accompanying notes are an integral part of these financial statements.
Allspring Common Stock Fund | 15
Statement of changes in net assets
| | | | | |
| | Six months ended
March 31, 2022
(unaudited) | Year ended
September 30, 2021 |
| Operations | | | | |
Net investment loss
| | $ (2,684,998) | | $ (4,802,352) |
Net realized gains on investments
| | 94,481,120 | | 203,359,423 |
Net change in unrealized gains (losses) on investments
| | (104,820,801) | | 163,798,610 |
Net increase (decrease) in net assets resulting from operations
| | (13,024,679) | | 362,355,681 |
| Distributions to shareholders from | | | | |
| Net investment income and net realized gains | | | | |
Class A
| | (161,912,122) | | (41,250,405) |
Class C
| | (554,558) | | (198,543) |
Class R6
| | (5,673,249) | | (1,470,087) |
Administrator Class
| | (470,882) | | (144,145) |
Institutional Class
| | (16,369,856) | | (4,334,480) |
Total distributions to shareholders
| | (184,980,667) | | (47,397,660) |
| Capital share transactions | Shares | | Shares | |
| Proceeds from shares sold | | | | |
Class A
| 328,446 | 7,129,652 | 498,107 | 11,395,288 |
Class C
| 4,800 | 59,277 | 17,699 | 254,296 |
Class R6
| 163,145 | 3,708,883 | 256,338 | 6,353,621 |
Administrator Class
| 4,268 | 101,939 | 33,690 | 750,889 |
Institutional Class
| 410,374 | 10,185,668 | 612,736 | 14,909,575 |
| | | 21,185,419 | | 33,663,669 |
| Reinvestment of distributions | | | | |
Class A
| 7,213,373 | 154,077,650 | 1,909,343 | 39,351,568 |
Class C
| 44,905 | 534,818 | 14,844 | 194,453 |
Class R6
| 240,353 | 5,629,071 | 65,677 | 1,456,720 |
Administrator Class
| 18,524 | 418,464 | 6,031 | 130,085 |
Institutional Class
| 699,847 | 16,313,433 | 189,157 | 4,178,481 |
| | | 176,973,436 | | 45,311,307 |
| Payment for shares redeemed | | | | |
Class A
| (2,478,374) | (53,458,827) | (4,162,369) | (93,186,950) |
Class C
| (44,250) | (628,014) | (135,039) | (1,857,466) |
Class R6
| (93,437) | (2,233,749) | (427,869) | (10,640,310) |
Administrator Class
| (22,964) | (524,513) | (45,790) | (1,112,388) |
Institutional Class
| (494,775) | (11,642,311) | (3,682,134) | (84,645,028) |
| | | (68,487,414) | | (191,442,142) |
Net increase (decrease) in net assets resulting from capital share transactions
| | 129,671,441 | | (112,467,166) |
Total increase (decrease) in net assets
| | (68,333,905) | | 202,490,855 |
| Net assets | | | | |
Beginning of period
| | 1,084,203,495 | | 881,712,640 |
End of period
| | $1,015,869,590 | | $1,084,203,495 |
The accompanying notes are an integral part of these financial statements.
16 | Allspring Common Stock Fund
Financial highlights
(For a share outstanding throughout each period)
| | | Year ended September 30 |
| Class A | Six months ended
March 31, 2022
(unaudited) | 2021 | 2020 | 2019 | 2018 | 2017 |
Net asset value, beginning of period
| $24.46 | $17.88 | $21.07 | $24.58 | $24.06 | $21.50 |
Net investment loss
| (0.06) | (0.12) | (0.03) | (0.01) | (0.04) | (0.09) |
Net realized and unrealized gains (losses) on investments
| (0.04) | 7.75 | (0.52) | (0.20) | 3.10 | 3.48 |
Total from investment operations
| (0.10) | 7.63 | (0.55) | (0.21) | 3.06 | 3.39 |
| Distributions to shareholders from | | | | | | |
Net investment income
| 0.00 | 0.00 | (0.00) 1 | 0.00 | 0.00 | 0.00 |
Net realized gains
| (4.24) | (1.05) | (2.64) | (3.30) | (2.54) | (0.83) |
Total distributions to shareholders
| (4.24) | (1.05) | (2.64) | (3.30) | (2.54) | (0.83) |
Net asset value, end of period
| $20.12 | $24.46 | $17.88 | $21.07 | $24.58 | $24.06 |
Total return2
| (1.41)% | 43.77% | (3.48)% | 0.91% | 13.62% | 16.10% |
| Ratios to average net assets (annualized) | | | | | | |
Gross expenses
| 1.25% | 1.25% | 1.27% | 1.26% | 1.25% | 1.25% |
Net expenses
| 1.23% | 1.23% | 1.23% | 1.26% | 1.25% | 1.25% |
Net investment loss
| (0.55)% | (0.50)% | (0.14)% | (0.03)% | (0.18)% | (0.38)% |
| Supplemental data | | | | | | |
Portfolio turnover rate
| 23% | 48% | 61% | 40% | 33% | 35% |
Net assets, end of period (000s omitted)
| $879,672 | $945,399 | $722,547 | $870,369 | $971,731 | $942,596 |
| 1 | Amount is less than $0.005. |
| 2 | Total return calculations do not include any sales charges. Returns for periods of less than one year are not annualized. |
The accompanying notes are an integral part of these financial statements.
Allspring Common Stock Fund | 17
Financial highlights
(For a share outstanding throughout each period)
| | | Year ended September 30 |
| Class C | Six months ended
March 31, 2022
(unaudited) | 2021 | 2020 | 2019 | 2018 | 2017 |
Net asset value, beginning of period
| $15.45 | $11.70 | $14.72 | $18.40 | $18.75 | $17.04 |
Net investment loss
| (0.08) 1 | (0.18) 1 | (0.11) 1 | (0.11) 1 | (0.17) 1 | (0.20) 1 |
Payment from affiliate
| 0.00 | 0.00 | 0.05 | 0.00 | 0.00 | 0.00 |
Net realized and unrealized gains (losses) on investments
| 0.07 | 4.98 | (0.32) | (0.27) | 2.36 | 2.74 |
Total from investment operations
| (0.01) | 4.80 | (0.38) | (0.38) | 2.19 | 2.54 |
| Distributions to shareholders from | | | | | | |
Net realized gains
| (4.24) | (1.05) | (2.64) | (3.30) | (2.54) | (0.83) |
Net asset value, end of period
| $11.20 | $15.45 | $11.70 | $14.72 | $18.40 | $18.75 |
Total return2
| (1.69)% | 42.64% | (3.88)% 3 | 0.17% | 12.74% | 15.29% |
| Ratios to average net assets (annualized) | | | | | | |
Gross expenses
| 1.89% | 1.99% | 2.01% | 2.01% | 2.00% | 2.00% |
Net expenses
| 1.89% | 1.99% | 2.01% | 2.01% | 2.00% | 2.00% |
Net investment loss
| (1.22)% | (1.26)% | (0.92)% | (0.78)% | (0.94)% | (1.14)% |
| Supplemental data | | | | | | |
Portfolio turnover rate
| 23% | 48% | 61% | 40% | 33% | 35% |
Net assets, end of period (000s omitted)
| $1,804 | $2,405 | $3,020 | $7,925 | $16,541 | $18,978 |
| 1 | Calculated based upon average shares outstanding |
| 2 | Total return calculations do not include any sales charges. Returns for periods of less than one year are not annualized. |
| 3 | During the year ended September 30, 2020, the Fund received a payment from an affiliate which had a 0.39% impact on the total return. |
The accompanying notes are an integral part of these financial statements.
18 | Allspring Common Stock Fund
Financial highlights
(For a share outstanding throughout each period)
| | | Year ended September 30 |
| Class R6 | Six months ended
March 31, 2022
(unaudited) | 2021 | 2020 | 2019 | 2018 | 2017 |
Net asset value, beginning of period
| $26.41 | $19.16 | $22.39 | $25.80 | $25.03 | $22.25 |
Net investment income (loss)
| (0.02) 1 | (0.02) 1 | 0.05 1 | 0.09 1 | 0.05 1 | 0.01 |
Net realized and unrealized gains (losses) on investments
| (0.06) | 8.32 | (0.56) | (0.20) | 3.26 | 3.60 |
Total from investment operations
| (0.08) | 8.30 | (0.51) | (0.11) | 3.31 | 3.61 |
| Distributions to shareholders from | | | | | | |
Net investment income
| 0.00 | 0.00 | (0.08) | 0.00 | 0.00 | 0.00 |
Net realized gains
| (4.24) | (1.05) | (2.64) | (3.30) | (2.54) | (0.83) |
Total distributions to shareholders
| (4.24) | (1.05) | (2.72) | (3.30) | (2.54) | (0.83) |
Net asset value, end of period
| $22.09 | $26.41 | $19.16 | $22.39 | $25.80 | $25.03 |
Total return2
| (1.21)% | 44.37% | (3.10)% | 1.31% | 14.12% | 16.56% |
| Ratios to average net assets (annualized) | | | | | | |
Gross expenses
| 0.82% | 0.82% | 0.84% | 0.83% | 0.82% | 0.82% |
Net expenses
| 0.82% | 0.82% | 0.83% | 0.83% | 0.82% | 0.82% |
Net investment income (loss)
| (0.13)% | (0.09)% | 0.27% | 0.40% | 0.20% | 0.05% |
| Supplemental data | | | | | | |
Portfolio turnover rate
| 23% | 48% | 61% | 40% | 33% | 35% |
Net assets, end of period (000s omitted)
| $36,363 | $35,280 | $27,628 | $36,069 | $36,477 | $115,641 |
| 1 | Calculated based upon average shares outstanding |
| 2 | Returns for periods of less than one year are not annualized. |
The accompanying notes are an integral part of these financial statements.
Allspring Common Stock Fund | 19
Financial highlights
(For a share outstanding throughout each period)
| | | Year ended September 30 |
| Administrator Class | Six months ended
March 31, 2022
(unaudited) | 2021 | 2020 | 2019 | 2018 | 2017 |
Net asset value, beginning of period
| $25.63 | $18.67 | $21.56 | $25.04 | $24.42 | $21.78 |
Net investment income (loss)
| (0.05) | (0.09) 1 | 0.00 1,2 | 0.03 | (0.01) 1 | (0.06) 1 |
Payment from affiliate
| 0.00 | 0.00 | 0.32 | 0.00 | 0.00 | 0.00 |
Net realized and unrealized gains (losses) on investments
| (0.05) | 8.10 | (0.54) | (0.21) | 3.17 | 3.53 |
Total from investment operations
| (0.10) | 8.01 | (0.22) | (0.18) | 3.16 | 3.47 |
| Distributions to shareholders from | | | | | | |
Net investment income
| 0.00 | 0.00 | (0.03) | 0.00 | 0.00 | 0.00 |
Net realized gains
| (4.24) | (1.05) | (2.64) | (3.30) | (2.54) | (0.83) |
Total distributions to shareholders
| (4.24) | (1.05) | (2.67) | (3.30) | (2.54) | (0.83) |
Net asset value, end of period
| $21.29 | $25.63 | $18.67 | $21.56 | $25.04 | $24.42 |
Total return3
| (1.34)% | 43.96% | (1.68)% 4 | 1.03% | 13.84% | 16.26% |
| Ratios to average net assets (annualized) | | | | | | |
Gross expenses
| 1.17% | 1.17% | 1.17% | 1.18% | 1.17% | 1.17% |
Net expenses
| 1.10% | 1.10% | 1.10% | 1.10% | 1.10% | 1.10% |
Net investment income (loss)
| (0.43)% | (0.36)% | 0.01% | 0.14% | (0.04)% | (0.27)% |
| Supplemental data | | | | | | |
Portfolio turnover rate
| 23% | 48% | 61% | 40% | 33% | 35% |
Net assets, end of period (000s omitted)
| $2,420 | $2,918 | $2,239 | $3,572 | $6,141 | $6,336 |
| 1 | Calculated based upon average shares outstanding |
| 2 | Amount is less than $0.005. |
| 3 | Returns for periods of less than one year are not annualized. |
| 4 | During the year ended September 30, 2020, the Fund received a payment from an affiliate which had a 1.69% impact on the total return. |
The accompanying notes are an integral part of these financial statements.
20 | Allspring Common Stock Fund
Financial highlights
(For a share outstanding throughout each period)
| | | Year ended September 30 |
| Institutional Class | Six months ended
March 31, 2022
(unaudited) | 2021 | 2020 | 2019 | 2018 | 2017 |
Net asset value, beginning of period
| $26.30 | $19.09 | $22.32 | $25.73 | $24.97 | $22.20 |
Net investment income (loss)
| (0.02) 1 | (0.03) 1 | 0.05 1 | 0.08 1 | 0.05 1 | 0.00 1,2 |
Net realized and unrealized gains (losses) on investments
| (0.06) | 8.29 | (0.56) | (0.19) | 3.25 | 3.60 |
Total from investment operations
| (0.08) | 8.26 | (0.51) | (0.11) | 3.30 | 3.60 |
| Distributions to shareholders from | | | | | | |
Net investment income
| 0.00 | 0.00 | (0.08) | 0.00 | 0.00 | 0.00 |
Net realized gains
| (4.24) | (1.05) | (2.64) | (3.30) | (2.54) | (0.83) |
Total distributions to shareholders
| (4.24) | (1.05) | (2.72) | (3.30) | (2.54) | (0.83) |
Net asset value, end of period
| $21.98 | $26.30 | $19.09 | $22.32 | $25.73 | $24.97 |
Total return3
| (1.22)% | 44.32% | (3.13)% | 1.31% | 14.12% | 16.55% |
| Ratios to average net assets (annualized) | | | | | | |
Gross expenses
| 0.92% | 0.92% | 0.94% | 0.93% | 0.92% | 0.92% |
Net expenses
| 0.85% | 0.85% | 0.85% | 0.85% | 0.85% | 0.85% |
Net investment income (loss)
| (0.16)% | (0.14)% | 0.24% | 0.37% | 0.21% | 0.02% |
| Supplemental data | | | | | | |
Portfolio turnover rate
| 23% | 48% | 61% | 40% | 33% | 35% |
Net assets, end of period (000s omitted)
| $95,610 | $98,202 | $126,279 | $159,426 | $172,197 | $167,552 |
| 1 | Calculated based upon average shares outstanding |
| 2 | Amount is less than $0.005. |
| 3 | Returns for periods of less than one year are not annualized. |
The accompanying notes are an integral part of these financial statements.
Allspring Common Stock Fund | 21
Notes to financial statements (unaudited)
1. ORGANIZATION
Allspring Funds Trust (the "Trust"), a Delaware statutory trust organized on March 10, 1999, is an open-end management investment company registered under the Investment Company Act of 1940, as amended (the "1940 Act"). As an investment company, the Trust follows the accounting and reporting guidance in Financial Accounting Standards Board ("FASB") Accounting Standards Codification Topic 946, Financial Services – Investment Companies. These financial statements report on the Allspring Common Stock Fund (the "Fund") which is a diversified series of the Trust.
Effective on November 1, 2021, the sale transaction of Wells Fargo Asset Management ("WFAM") by Wells Fargo & Company to GTCR LLC and Reverence Capital Partners, L.P. was closed. In connection with the closing of the transaction, WFAM became known as Allspring Global Investments (“Allspring”) and various entities that provided services to the Fund changed their names to "Allspring", including Allspring Funds Management, LLC, the investment manager to the Fund, Allspring Global Investments, LLC and Allspring Global Investments (UK) Limited, both registered investment advisers providing subadvisory services to certain funds, and Allspring Funds Distributor, LLC, the Fund's principal underwriter. Consummation of the transaction resulted in a new investment management agreement and subadvisory agreement which became effective on November 1, 2021.
2. SIGNIFICANT ACCOUNTING POLICIES
The following significant accounting policies, which are consistently followed in the preparation of the financial statements of the Fund, are in conformity with U.S. generally accepted accounting principles which require management to make estimates and assumptions that affect the reported amounts of assets and liabilities, disclosure of contingent assets and liabilities at the date of the financial statements, and the reported amounts of income and expenses during the reporting period. Actual results could differ from those estimates.
Securities valuation
All investments are valued each business day as of the close of regular trading on the New York Stock Exchange (generally 4 p.m. Eastern Time), although the Fund may deviate from this calculation time under unusual or unexpected circumstances.
Equity securities that are listed on a foreign or domestic exchange or market are valued at the official closing price or, if none, the last sales price. If no sale occurs on the principal exchange or market that day, a fair value price will be determined in accordance with the Fund’s Valuation Procedures.
The values of securities denominated in foreign currencies are translated into U.S. dollars at rates provided by an independent foreign currency pricing source at a time each business day specified by the Allspring Global Investments Pricing Committee at Allspring Funds Management, LLC ("Allspring Funds Management").
Many securities markets and exchanges outside the U.S. close prior to the close of the New York Stock Exchange and therefore may not fully reflect trading or events that occur after the close of the principal exchange in which the foreign securities are traded, but before the close of the New York Stock Exchange. If such trading or events are expected to materially affect the value of such securities, then fair value pricing procedures approved by the Board of Trustees of the Fund are applied. These procedures take into account multiple factors including movements in U.S. securities markets after foreign exchanges close. Foreign securities that are fair valued under these procedures are categorized as Level 2 and the application of these procedures may result in transfers between Level 1 and Level 2. Depending on market activity, such fair valuations may be frequent. Such fair value pricing may result in net asset values that are higher or lower than net asset values based on the last reported sales price or latest quoted bid price. On March 31, 2022, such fair value pricing was used in pricing certain foreign securities.
Investments in registered open-end investment companies are valued at net asset value. Interests in non-registered investment companies that are redeemable at net asset value are fair valued normally at net asset value.
Investments which are not valued using any of the methods discussed above are valued at their fair value, as determined in good faith by the Board of Trustees. The Board of Trustees has established a Valuation Committee comprised of the Trustees and has delegated to it the authority to take any actions regarding the valuation of portfolio securities that the Valuation Committee deems necessary or appropriate, including determining the fair value of portfolio securities, unless the determination has been delegated to the Allspring Global Investments Pricing Committee. The Board of Trustees retains the authority to make or ratify any valuation decisions or approve any changes to the Valuation Procedures as it deems appropriate. On a quarterly basis, the Board of Trustees receives reports on any valuation actions taken by the Valuation Committee or the Allspring Global Investments Pricing Committee which may include items for ratification.
22 | Allspring Common Stock Fund
Notes to financial statements (unaudited)
Foreign currency translation
The accounting records of the Fund are maintained in U.S. dollars. The values of other assets and liabilities denominated in foreign currencies are translated into U.S. dollars at rates provided by an independent foreign currency pricing source at a time each business day specified by the Allspring Global Investments Pricing Committee. Purchases and sales of securities, and income and expenses are converted at the rate of exchange on the respective dates of such transactions. Net realized foreign exchange gains or losses arise from sales of foreign currencies, currency gains or losses realized between the trade and settlement dates on securities transactions, and the difference between the amounts of dividends, interest and foreign withholding taxes recorded and the U.S. dollar equivalent of the amounts actually paid or received. Net unrealized foreign exchange gains and losses arise from changes in the fair value of assets and liabilities other than investments in securities resulting from changes in exchange rates. The changes in net assets arising from changes in exchange rates of securities and the changes in net assets resulting from changes in market prices of securities are not separately presented. Such changes are included in net realized and unrealized gains or losses from investments.
Securities lending
The Fund may lend its securities from time to time in order to earn additional income in the form of fees or interest on securities received as collateral or the investment of any cash received as collateral. When securities are on loan, the Fund receives interest or dividends on those securities. Cash collateral received in connection with its securities lending transactions is invested in Securities Lending Cash Investments, LLC (the "Securities Lending Fund"), an affiliated non-registered investment company. Investments in Securities Lending Fund are valued at the evaluated bid price provided by an independent pricing service. Income earned from investment in the Securities Lending Fund (net of fees and rebates), if any, is included in income from affiliated securities on the Statement of Operations.
In a securities lending transaction, the net asset value of the Fund is affected by an increase or decrease in the value of the securities loaned and by an increase or decrease in the value of the instrument in which collateral is invested. The amount of securities lending activity undertaken by the Fund fluctuates from time to time. The Fund has the right under the lending agreement to recover the securities from the borrower on demand. In the event of default or bankruptcy by the borrower, the Fund may be prevented from recovering the loaned securities or gaining access to the collateral or may experience delays or costs in doing so. In such an event, the terms of the agreement allow the unaffiliated securities lending agent to use the collateral to purchase replacement securities on behalf of the Fund or pay the Fund the market value of the loaned securities. The Fund bears the risk of loss with respect to depreciation of its investment of the cash collateral.
Security transactions and income recognition
Securities transactions are recorded on a trade date basis. Realized gains or losses are recorded on the basis of identified cost.
Dividend income is recognized on the ex-dividend date, except for certain dividends from foreign securities, which are recorded as soon as the custodian verifies the ex-dividend date.
Income dividends and capital gain distributions from investment companies are recorded on the ex-dividend date. Capital gain distributions from investment companies are treated as realized gains.
Distributions to shareholders
Distributions to shareholders from net investment income and any net realized gains are recorded on the ex-dividend date and paid at least annually. Such distributions are determined in accordance with income tax regulations and may differ from U.S. generally accepted accounting principles. Dividend sources are estimated at the time of declaration. The tax character of distributions is determined as of the Fund's fiscal year end. Therefore, a portion of the Fund's distributions made prior to the Fund’s fiscal year end may be categorized as a tax return of capital at year end.
Federal and other taxes
The Fund intends to continue to qualify as a regulated investment company by distributing substantially all of its investment company taxable income and any net realized capital gains (after reduction for capital loss carryforwards) sufficient to relieve it from all, or substantially all, federal income taxes. Accordingly, no provision for federal income taxes was required.
The Fund’s income and federal excise tax returns and all financial records supporting those returns for the prior three fiscal years are subject to examination by the federal and Delaware revenue authorities. Management has analyzed the Fund's tax positions taken on federal, state, and foreign tax returns for all open tax years and does not believe that there are any uncertain tax positions that require recognition of a tax liability.
Allspring Common Stock Fund | 23
Notes to financial statements (unaudited)
As of March 31, 2022, the aggregate cost of all investments for federal income tax purposes was $789,848,304 and the unrealized gains (losses) consisted of:
| Gross unrealized gains | $308,335,128 |
| Gross unrealized losses | (60,346,288) |
| Net unrealized gains | $247,988,840 |
Class allocations
The separate classes of shares offered by the Fund differ principally in applicable sales charges, distribution, shareholder servicing, and administration fees. Class specific expenses are charged directly to that share class. Investment income, common fund-level expenses, and realized and unrealized gains (losses) on investments are allocated daily to each class of shares based on the relative proportion of net assets of each class.
3. FAIR VALUATION MEASUREMENTS
Fair value measurements of investments are determined within a framework that has established a fair value hierarchy based upon the various data inputs utilized in determining the value of the Fund’s investments. The three-level hierarchy gives the highest priority to unadjusted quoted prices in active markets for identical assets or liabilities (Level 1) and the lowest priority to unobservable inputs (Level 3). The Fund’s investments are classified within the fair value hierarchy based on the lowest level of input that is significant to the fair value measurement. The inputs are summarized into three broad levels as follows:
| ■ | Level 1 – quoted prices in active markets for identical securities |
| ■ | Level 2 – other significant observable inputs (including quoted prices for similar securities, interest rates, prepayment speeds, credit risk, etc.) |
| ■ | Level 3 – significant unobservable inputs (including the Fund’s own assumptions in determining the fair value of investments) |
The inputs or methodologies used for valuing investments in securities are not necessarily an indication of the risk associated with investing in those securities.
The following is a summary of the inputs used in valuing the Fund’s assets and liabilities as of March 31, 2022:
| | Quoted prices
(Level 1) | Other significant
observable inputs
(Level 2) | Significant
unobservable inputs
(Level 3) | Total |
| Assets | | | | |
| Investments in: | | | | |
| Common stocks | | | | |
| Communication services | $ 7,680,772 | $ 0 | $0 | $ 7,680,772 |
| Consumer discretionary | 119,355,960 | 0 | 0 | 119,355,960 |
| Consumer staples | 38,819,385 | 0 | 0 | 38,819,385 |
| Financials | 108,862,171 | 0 | 0 | 108,862,171 |
| Health care | 122,490,034 | 0 | 0 | 122,490,034 |
| Industrials | 229,911,999 | 14,947,853 | 0 | 244,859,852 |
| Information technology | 196,102,346 | 0 | 0 | 196,102,346 |
| Materials | 73,464,812 | 0 | 0 | 73,464,812 |
| Real estate | 81,834,704 | 0 | 0 | 81,834,704 |
| Investment companies | 10,226,277 | 0 | 0 | 10,226,277 |
| Short-term investments | | | | |
| Investment companies | 34,140,831 | 0 | 0 | 34,140,831 |
| Total assets | $1,022,889,291 | $14,947,853 | $0 | $1,037,837,144 |
Additional sector, industry or geographic detail, if any, is included in the Portfolio of Investments.
For the six months ended March 31, 2022, the Fund did not have any transfers into/out of Level 3.
24 | Allspring Common Stock Fund
Notes to financial statements (unaudited)
4. TRANSACTIONS WITH AFFILIATES
Management fee
Allspring Funds Management, a wholly owned subsidiary of Allspring Global Investments Holdings, LLC, a holding company indirectly owned by certain private funds of GTCR LLC and Reverence Capital Partners, L.P., is the manager of the Fund and provides advisory and fund-level administrative services under an investment management agreement. Under the investment management agreement, Allspring Funds Management is responsible for, among other services, implementing the investment objectives and strategies of the Fund, supervising the subadviser and providing fund-level administrative services in connection with the Fund’s operations. As compensation for its services under the investment management agreement, Allspring Funds Management is entitled to receive a management fee at the following annual rate based on the Fund’s average daily net assets:
| Average daily net assets | Management fee |
| First $500 million | 0.800% |
| Next $500 million | 0.750 |
| Next $1 billion | 0.700 |
| Next $2 billion | 0.675 |
| Next $1 billion | 0.650 |
| Next $5 billion | 0.640 |
| Over $10 billion | 0.630 |
For the six months ended March 31, 2022, the management fee was equivalent to an annual rate of 0.77% of the Fund’s average daily net assets.
Allspring Funds Management has retained the services of a subadviser to provide daily portfolio management to the Fund. The fee for subadvisory services is borne by Allspring Funds Management. Allspring Global Investments, LLC ("Allspring Investments"), an affiliate of Allspring Funds Management and a wholly owned subsidiary of Allspring Global Investments Holdings, LLC, is the subadviser to the Fund and is entitled to receive a fee from Allspring Funds Management at an annual rate starting at 0.45% and declining to 0.30% as the average daily net assets of the Fund increase.
Administration fees
Under a class-level administration agreement, Allspring Funds Management provides class-level administrative services to the Fund, which includes paying fees and expenses for services provided by the transfer agent, sub-transfer agents, omnibus account servicers and record-keepers. As compensation for its services under the class-level administration agreement, Allspring Funds Management receives an annual fee which is calculated based on the average daily net assets of each class as follows:
| | Class-level
administration fee |
| Class A | 0.21% |
| Class C | 0.21 |
| Class R6 | 0.03 |
| Administrator Class | 0.13 |
| Institutional Class | 0.13 |
Waivers and/or expense reimbursements
Allspring Funds Management has contractually committed to waive and/or reimburse management and administration fees to the extent necessary to maintain certain net operating expense ratios for the Fund. When each class of the Fund has exceeded its expense cap, Allspring Funds Management will waive fees and/or reimburse expenses from fund-level expenses on a proportionate basis and then from class specific expenses. When only certain classes exceed their expense caps, waivers and/or reimbursements are applied against class specific expenses before fund-level expenses. Allspring Funds Management has contractually committed through January 31, 2023 to waive fees and/or reimburse expenses to the extent necessary to cap expenses. Prior to or after the commitment expiration date, the caps may be increased or the commitment to maintain the
Allspring Common Stock Fund | 25
Notes to financial statements (unaudited)
caps may be terminated only with the approval of the Board of Trustees. As of March 31, 2022, the contractual expense caps are as follows:
| | Expense ratio caps |
| Class A | 1.26% |
| Class C | 2.01 |
| Class R6 | 0.83 |
| Administrator Class | 1.10 |
| Institutional Class | 0.85 |
Distribution fee
The Trust has adopted a distribution plan for Class C shares of the Fund pursuant to Rule 12b-1 under the 1940 Act. A distribution fee is charged to Class C shares and paid to Allspring Funds Distributor, LLC ("Allspring Funds Distributor"), the principal underwriter, an affiliate of Allspring Funds Management, at an annual rate of 0.75% of the average daily net assets of Class C shares.
In addition, Allspring Funds Distributor is entitled to receive the front-end sales charge from the purchase of Class A shares and a contingent deferred sales charge on the redemption of certain Class A shares. Allspring Funds Distributor is also entitled to receive the contingent deferred sales charges from redemptions of Class C shares. For the six months ended March 31, 2022, Allspring Funds Distributor received $1,044 from the sale of Class A shares. No contingent deferred sales charges were incurred by Class A and Class C shares for the six months ended March 31, 2022.
Shareholder servicing fees
The Trust has entered into contracts with one or more shareholder servicing agents, whereby Class A, Class C and Administrator Class of the Fund are charged a fee at an annual rate of 0.25% of the average daily net assets of each respective class. A portion of these total shareholder servicing fees were paid to affiliates, and to certain entities that were affiliates of the Fund until November 1, 2021.
Interfund transactions
The Fund may purchase or sell portfolio investment securities to certain affiliates pursuant to Rule 17a-7 under the 1940 Act and under procedures adopted by the Board of Trustees. The procedures have been designed to ensure that these interfund transactions, which do not incur broker commissions, are effected at current market prices.
5. INVESTMENT PORTFOLIO TRANSACTIONS
Purchases and sales of investments, excluding U.S. government obligations (if any) and short-term securities, for the six months ended March 31, 2022 were $246,755,846 and $308,003,125, respectively.
6. SECURITIES LENDING TRANSACTIONS
The Fund lends its securities through an unaffiliated securities lending agent and receives collateral in the form of cash or securities with a value at least equal to the value of the securities on loan. The value of the loaned securities is determined at the close of each business day and any increases or decreases in the required collateral are exchanged between the Fund and the counterparty on the next business day. Cash collateral received is invested in the Securities Lending Fund which seeks to provide a positive return compared to the daily Federal Funds Open Rate by investing in high-quality, U.S. dollar-denominated short-term money market instruments and is exempt from registration under Section 3(c)(7) of the 1940 Act. Securities Lending Fund is managed by Allspring Funds Management and is subadvised by Allspring Investments. Allspring Funds Management receives an advisory fee starting at 0.05% and declining to 0.01% as the average daily net assets of the Securities Lending Fund increase. All of the fees received by Allspring Funds Management are paid to Allspring Investments for its services as subadviser.
In the event of counterparty default or the failure of a borrower to return a loaned security, the Fund has the right to use the collateral to offset any losses incurred. As of March 31, 2022, the Fund had securities lending transactions with the following counterparties which are subject to offset:
26 | Allspring Common Stock Fund
Notes to financial statements (unaudited)
| Counterparty | Value of
securities on
loan | Collateral
received1 | Net amount |
| Bank of America Securities Incorporated | $ 2,087,966 | $ (2,087,966) | $0 |
| Barclays Capital Incorporated | 1,068,473 | (1,068,473) | 0 |
| Citigroup Global Markets Incorporated | 4,075,807 | (4,075,807) | 0 |
| JPMorgan Securities LLC | 10,739,136 | (10,739,136) | 0 |
| National Financial Services LLC | 1,625,811 | (1,625,811) | 0 |
1 Collateral received within this table is limited to the collateral for the net transaction with the counterparty.
7. BANK BORROWINGS
The Trust (excluding the money market funds), Allspring Master Trust and Allspring Variable Trust are parties to a $350,000,000 revolving credit agreement whereby the Fund is permitted to use bank borrowings for temporary or emergency purposes, such as to fund shareholder redemption requests. Interest under the credit agreement is charged to the Fund based on a borrowing rate equal to the higher of the Federal Funds rate in effect on that day plus 1.25% or the overnight bank funding rate in effect on that day plus 1.25%. In addition, an annual commitment fee equal to 0.25% of the unused balance is allocated to each participating fund.
For the six months ended March 31, 2022, there were no borrowings by the Fund under the agreement.
8. INDEMNIFICATION
Under the Fund's organizational documents, the officers and Trustees have been granted certain indemnification rights against certain liabilities that may arise out of performance of their duties to the Fund. The Fund has entered into a separate agreement with each Trustee that converts indemnification rights currently existing under the Fund’s organizational documents into contractual rights that cannot be changed in the future without the consent of the Trustee. Additionally, in the normal course of business, the Fund may enter into contracts with service providers that contain a variety of indemnification clauses. The Fund’s maximum exposure under these arrangements is dependent on future claims that may be made against the Fund and, therefore, cannot be estimated.
9. CORONAVIRUS (COVID-19) PANDEMIC
On March 11, 2020, the World Health Organization announced that it had made the assessment that coronavirus disease 2019 (“COVID-19”) is a pandemic. The impacts of COVID-19 are affecting the entire global economy, individual companies and investment products, the funds, and the market in general. There is significant uncertainty around the extent and duration of business disruptions related to COVID-19 and the impacts may last for an extended period of time. COVID-19 has led to significant uncertainty and volatility in the financial markets.
Allspring Common Stock Fund | 27
Other information (unaudited)
PROXY VOTING INFORMATION
A description of the policies and procedures used to determine how to vote proxies relating to portfolio securities is available without charge, upon request, by calling 1-800-222-8222, visiting our website at allspringglobal.com, or visiting the SEC website at sec.gov. Information regarding how the proxies related to portfolio securities were voted during the most recent 12-month period ended June 30 is available on the website at allspringglobal.com or by visiting the SEC website at sec.gov.
QUARTERLY PORTFOLIO HOLDINGS INFORMATION
The Fund files its complete schedule of portfolio holdings with the SEC for the first and third quarters of each fiscal year as an exhibit to its reports on Form N-PORT. Shareholders may view the filed Form N-PORT by visiting the SEC website at sec.gov.
28 | Allspring Common Stock Fund
Other information (unaudited)
BOARD OF TRUSTEES AND OFFICERS
Each of the Trustees and Officers listed in the table below acts in identical capacities for each fund in the Allspring family of funds, which consists of 138 mutual funds comprising the Allspring Funds Trust, Allspring Variable Trust, Allspring Master Trust and four closed-end funds (collectively the “Fund Complex”). This table should be read in conjunction with the Prospectus and the Statement of Additional Information1. The mailing address of each Trustee and Officer is 525 Market Street, 12th Floor, San Francisco, CA 94105. Each Trustee and Officer serves an indefinite term, however, each Trustee serves such term until reaching the mandatory retirement age established by the Trustees.
Independent Trustees
Name and
year of birth | Position held and
length of service* | Principal occupations during past five years or longer | Current other
public company or
investment
company
directorships |
William R. Ebsworth
(Born 1957) | Trustee,
since 2015 | Retired. From 1984 to 2013, equities analyst, portfolio manager, research director and chief investment officer at Fidelity Management and Research Company in Boston, Tokyo, and Hong Kong, and retired in 2013 as Chief Investment Officer of Fidelity Strategic Advisers, Inc. where he led a team of investment professionals managing client assets. Prior thereto, Board member of Hong Kong Securities Clearing Co., Hong Kong Options Clearing Corp., the Thailand International Fund, Ltd., Fidelity Investments Life Insurance Company, and Empire Fidelity Investments Life Insurance Company. Audit Committee Chair and Investment Committee Chair of the Vincent Memorial Hospital Endowment (non-profit organization). Mr. Ebsworth is a CFA® charterholder. | N/A |
Jane A. Freeman
(Born 1953) | Trustee,
since 2015;
Chair Liaison,
since 2018 | Retired. From 2012 to 2014 and 1999 to 2008, Chief Financial Officer of Scientific Learning Corporation. From 2008 to 2012, Ms. Freeman provided consulting services related to strategic business projects. Prior to 1999, Portfolio Manager at Rockefeller & Co. and Scudder, Stevens & Clark. Board member of the Harding Loevner Funds from 1996 to 2014, serving as both Lead Independent Director and chair of the Audit Committee. Board member of the Russell Exchange Traded Funds Trust from 2011 to 2012 and the chair of the Audit Committee. Ms. Freeman is also an inactive Chartered Financial Analyst. | N/A |
Isaiah Harris, Jr.
(Born 1952) | Trustee,
since 2009; Audit
Committee
Chair,
since 2019 | Retired. Chairman of the Board of CIGNA Corporation from 2009 to 2021, and Director from 2005 to 2008. From 2003 to 2011, Director of Deluxe Corporation. Prior thereto, President and CEO of BellSouth Advertising and Publishing Corp. from 2005 to 2007, President and CEO of BellSouth Enterprises from 2004 to 2005 and President of BellSouth Consumer Services from 2000 to 2003. Emeritus member of the Iowa State University Foundation Board of Governors. Emeritus Member of the Advisory Board of Iowa State University School of Business. Advisory Board Member, Palm Harbor Academy (private school). Advisory Board Member, Fellowship of Christian Athletes. Mr. Harris is a certified public accountant (inactive status). | N/A |
David F. Larcker
(Born 1950) | Trustee,
since 2009 | James Irvin Miller Professor of Accounting at the Graduate School of Business (Emeritus), Stanford University, Director of the Corporate Governance Research Initiative and Senior Faculty of The Rock Center for Corporate Governance since 2006. From 2005 to 2008, Professor of Accounting at the Graduate School of Business, Stanford University. Prior thereto, Ernst & Young Professor of Accounting at The Wharton School, University of Pennsylvania from 1985 to 2005. | N/A |
Allspring Common Stock Fund | 29
Other information (unaudited)
Name and
year of birth | Position held and
length of service* | Principal occupations during past five years or longer | Current other
public company or
investment
company
directorships |
Olivia S. Mitchell
(Born 1953) | Trustee,
since 2006;
Nominating and
Governance
Committee Chair,
since 2018 | International Foundation of Employee Benefit Plans Professor since 1993, Wharton School of the University of Pennsylvania. Director of Wharton’s Pension Research Council and Boettner Center on Pensions & Retirement Research, and Research Associate at the National Bureau of Economic Research. Previously taught at Cornell University from 1978 to 1993. | N/A |
Timothy J. Penny
(Born 1951) | Trustee,
since 1996;
Chair,
since 2018 | President and Chief Executive Officer of Southern Minnesota Initiative Foundation, a non-profit organization, since 2007. Member of the Board of Trustees of NorthStar Education Finance, Inc., a non-profit organization, since 2007. | N/A |
James G. Polisson
(Born 1959) | Trustee,
since 2018 | Retired. Chief Marketing Officer, Source (ETF) UK Services, Ltd, from 2015 to 2017. From 2012 to 2015, Principal of The Polisson Group, LLC, a management consulting, corporate advisory and principal investing company. Chief Executive Officer and Managing Director at Russell Investments, Global Exchange Traded Funds from 2010 to 2012. Managing Director of Barclays Global Investors from 1998 to 2010 and Global Chief Marketing Officer for iShares and Barclays Global Investors from 2000 to 2010. Trustee of the San Francisco Mechanics’ Institute, a non-profit organization, from 2013 to 2015. Board member of the Russell Exchange Traded Fund Trust from 2011 to 2012. Director of Barclays Global Investors Holdings Deutschland GmbH from 2006 to 2009. Mr. Polisson is an attorney and has a retired status with the Massachusetts and District of Columbia Bar Associations. | N/A |
Pamela Wheelock
(Born 1959) | Trustee,
since January
2020; previously
Trustee from
January 2018 to
July 2019 | Board member of the Destination Medical Center Economic Development Agency, Rochester, Minnesota since 2019. Interim President of the McKnight Foundation from January to September 2020. McKnight Foundation Consultant, November 2020 to February 2021. Acting Commissioner, Minnesota Department of Human Services, July 2019 through September 2019. Consultant (part-time), Minnesota Department of Human Services, October 2019 through December 2019. Chief Operating Officer, Twin Cities Habitat for Humanity from 2017 to 2019. Vice President of University Services, University of Minnesota from 2012 to 2016. Prior thereto, on the Board of Directors, Governance Committee and Finance Committee for the Minnesota Philanthropy Partners (Saint Paul Foundation) from 2012 to 2018, Interim Chief Executive Officer of Blue Cross Blue Shield of Minnesota from 2011 to 2012, Chairman of the Board from 2009 to 2012 and Board Director from 2003 to 2015. Vice President, Leadership and Community Engagement, Bush Foundation, Saint Paul, Minnesota (a private foundation) from 2009 to 2011. Executive Vice President and Chief Financial Officer, Minnesota Sports and Entertainment from 2004 to 2009 and Senior Vice President from 2002 to 2004. Executive Vice President of the Minnesota Wild Foundation from 2004 to 2008. Commissioner of Finance, State of Minnesota, from 1999 to 2002. Currently Board Chair of the Minnesota Wild Foundation since 2010. | N/A |
* Length of service dates reflect the Trustee’s commencement of service with the Trust’s predecessor entities, where applicable.
30 | Allspring Common Stock Fund
Other information (unaudited)
Officers2
Name and
year of birth | Position held and
length of service | Principal occupations during past five years or longer |
Andrew Owen
(Born 1960) | President,
since 2017 | President, Chief Executive Officer and Director of Allspring Funds Management, LLC since 2017 and co-president of Galliard Capital Management, LLC, an affiliate of Allspring Funds Management, LLC, since 2019. Prior thereto, Head of Affiliated Managers, Allspring Global Investments, from 2014 to 2019 and Executive Vice President responsible for marketing, investments and product development for Allspring Funds Management, LLC, from 2009 to 2014. In addition, Mr. Owen was an Executive Vice President of Wells Fargo & Company from 2014 to 2021. |
Jeremy DePalma
(Born 1974) | Treasurer,
since 2012
(for certain funds in
the Fund Complex);
since 2021 (for
the remaining funds in the
Fund Complex) | Senior Vice President of Allspring Funds Management, LLC since 2009. Senior Vice President of Evergreen Investment Management Company, LLC from 2008 to 2010 and head of the Fund Reporting and Control Team within Fund Administration from 2005 to 2010. |
Kate McKinley
(Born 1977) | Chief Legal Officer,
since 2021 | Chief Legal Officer of Allspring Global Investments since 2021. Prior thereto, held various roles at State Street Global Advisors beginning in 2010, including serving as Senior Vice President and General Counsel from 2019 to 2021, and Chief Operating Officer of the Institutional Client Group from 2016 - 2019. Prior to working at State Street Global Advisors served as Assistant General Counsel for Bank of America Corporation from 2005 to 2010 and as an Associate at WilmerHale from 2002 to 2005. |
Christopher Baker
(Born 1976) | Chief Compliance Officer, since 2022 | Global Chief Compliance Officer for Allspring Global Investments since 2022. Prior thereto, Chief Compliance Officer for State Street Global Advisors from 2018 to 2021. Senior Compliance Officer for the State Street divisions of Alternative Investment Solutions, Sector Solutions, and Global Marketing from 2015 to 2018. From 2010 to 2015 Vice President, Global Head of Investment and Marketing Compliance for State Street Global Advisors. |
Matthew Prasse
(Born 1983) | Secretary,
since 2021 | Senior Counsel of the Allspring Legal Department since 2021. Senior Counsel of the Wells Fargo Legal Department from 2018 to 2021. Previously, Counsel for Barings LLC from 2015 to 2018. Prior to joining Barings, Associate at Morgan, Lewis & Bockius LLP from 2008 to 2015. |
1 The Statement of Additional Information includes additional information about the Trustees and is available, without charge, upon request, by calling 1-800-222-8222 or by visiting the website at allspringglobal.com.
2 For those Officers with tenures at Allspring Global Investments and/or Allspring Funds Management, LLC that began prior to 2021, such tenures include years of service during which these businesses/entities were known as Wells Fargo Asset Management and Wells Fargo Funds Management, LLC, respectively.
Allspring Common Stock Fund | 31
For more information
More information about Allspring Funds is available free upon request. To obtain literature, please write, visit the Fund's website, or call:
Allspring Funds
P.O. Box 219967
Kansas City, MO 64121-9967
Website: allspringglobal.com
Individual investors: 1-800-222-8222
Retail investment professionals: 1-888-877-9275
Institutional investment professionals: 1-800-260-5969
This report and the financial statements contained herein are submitted for the general information of the shareholders of the Fund. If this report is used for promotional purposes, distribution of the report must be accompanied or preceded by a current prospectus. Before investing, please consider the investment objectives, risks, charges, and expenses of the investment. For a current prospectus and, if available, a summary prospectus, containing this information, call
1-800-222-8222 or visit the Fund's website at allspringglobal.com. Read the prospectus carefully before you invest or send money.
Allspring Global InvestmentsTM is the trade name for the asset management firms of Allspring Global Investments Holdings, LLC, a holding company indirectly owned by certain private funds of GTCR LLC and Reverence Capital Partners, L.P. These firms include but are not limited to Allspring Global Investments, LLC, and Allspring Funds Management, LLC. Certain products managed by Allspring entities are distributed by Allspring Funds Distributor, LLC (a broker-dealer and Member FINRA/SIPC).
This material is for general informational and educational purposes only and is NOT intended to provide investment advice or a recommendation of any kind - including a recommendation for any specific investment, strategy, or plan.
© 2022 Allspring Global Investments Holdings, LLC. All rights reserved.
PAR-0522-00054 05-22
SA229/SAR229 03-22
Semi-Annual Report
March 31, 2022
Allspring
Discovery SMID Cap Growth Fund
(formerly, Allspring Discovery Fund)
The views expressed and any forward-looking statements are as of March 31, 2022, unless otherwise noted, and are those of the Fund's portfolio managers and/or Allspring Global Investments. Discussions of individual securities or the markets generally are not intended as individual recommendations. Future events or results may vary significantly from those expressed in any forward-looking statements. The views expressed are subject to change at any time in response to changing circumstances in the market. Allspring Global Investments disclaims any obligation to publicly update or revise any views expressed or forward-looking statements.
Allspring Discovery SMID Cap Growth Fund | 1
Letter to shareholders (unaudited)
Andrew Owen
President
Allspring Funds
Dear Shareholder:
We are pleased to offer you this semi-annual report for Allspring Discovery SMID Cap Growth Fund for the six-month period that ended March 31, 2022. Effective May 2, 2022, the Fund changed its name from Allspring Discovery Fund to Allspring Discovery SMID Cap Growth Fund. Global stocks and bonds broadly declined during a challenging period. Despite progress on a global economic recovery from COVID-19, persistently high inflation, concerns regarding anticipated tightening of central bank monetary policy, and turmoil caused by the Russian invasion of Ukraine all led to a retreat from financial market gains made earlier in 2021. Among major indexes, the U.S. large-cap-dominated S&P 500 Index was an exception in escaping a half-year loss.
For the six-month period, U.S. stocks, based on the S&P 500 Index,1 gained 5.92%. International stocks, as measured by the MSCI ACWI ex USA Index (Net),2 returned -3.72%, while the MSCI EM Index (Net) (USD),3 trailed both developed market benchmarks with a return of -8.20%. The Bloomberg U.S. Aggregate Bond Index,4returned -5.92%, the Bloomberg Global Aggregate ex-USD Index (unhedged),5 returned -7.26%, the Bloomberg Municipal Bond Index6 returned -5.55%, and the ICE BofA U.S. High Yield Index,7 lost 3.89%.
Inflationary concerns and the Russian-Ukraine war caused markets to retreat.
Elevated inflation pressures and the ongoing global supply bottleneck continued in October, but strong corporate earnings provided a bright spot in the U.S., the eurozone, and many Asian countries. Government bond yields rose globally as central banks prepared to tighten monetary policy. Commodity prices continued to rise, driven by sharply higher energy costs.
In November, as COVID-19 hospitalizations rose, most major global asset classes declined. Two exceptions were U.S. investment-grade bonds and Treasury Inflation-Protected Securities. President Biden signed a long-awaited $550 billion infrastructure bill to upgrade U.S. roads, bridges, and railways. Meanwhile, the Consumer Price Index8, a measure of domestic inflation conditions, jumped to its highest level in 31 years. While the threat of consistently high inflation led the U.S. Federal Reserve (Fed) to discuss a faster pace of tapering, the Omicron strain created uncertainty. Commodities lost ground for the month, driven by sharp declines in oil prices (and energy costs in general) as well as precious metals.
“Elevated inflation pressures and the ongoing global supply bottleneck continued in October, but strong corporate earnings provided a bright spot in the U.S., the eurozone, and many Asian countries.”
| 1 | The S&P 500 Index consists of 500 stocks chosen for market size, liquidity, and industry group representation. It is a market-value-weighted index with each stock's weight in the index proportionate to its market value. You cannot invest directly in an index. |
| 2 | The Morgan Stanley Capital International (MSCI) All Country World Index (ACWI) ex USA Index (Net) is a free-float-adjusted market-capitalization-weighted index that is designed to measure the equity market performance of developed and emerging markets, excluding the U.S. Source: MSCI. MSCI makes no express or implied warranties or representations and shall have no liability whatsoever with respect to any MSCI data contained herein. The MSCI data may not be further redistributed or used as a basis for other indexes or any securities or financial products. This report is not approved, reviewed, or produced by MSCI. You cannot invest directly in an index. |
| 3 | The MSCI Emerging Markets (EM) Index (Net) (USD) is a free-float-adjusted market-capitalization-weighted index that is designed to measure equity market performance of emerging markets. You cannot invest directly in an index. |
| 4 | The Bloomberg U.S. Aggregate Bond Index is a broad-based benchmark that measures the investment-grade, U.S.-dollar-denominated, fixed-rate taxable bond market, including Treasuries, government-related and corporate securities, mortgage-backed securities (agency fixed-rate and hybrid adjustable-rate mortgage pass-throughs), asset-backed securities, and commercial mortgage-backed securities. You cannot invest directly in an index. |
| 5 | The Bloomberg Global Aggregate ex-USD Index (unhedged) is an unmanaged index that provides a broad-based measure of the global investment-grade fixed-income markets excluding the U.S.-dollar-denominated debt market. You cannot invest directly in an index. |
| 6 | The Bloomberg Municipal Bond Index is an unmanaged index composed of long-term tax-exempt bonds with a minimum credit rating of Baa. You cannot invest directly in an index. |
| 7 | The ICE BofA U.S. High Yield Index is a market-capitalization-weighted index of domestic and Yankee high-yield bonds. The index tracks the performance of high-yield securities traded in the U.S. bond market. You cannot invest directly in an index. Copyright 2022. ICE Data Indices, LLC. All rights reserved. |
| 8 | The Consumer Price Index (CPI) is a measure of the average change over time in the prices paid by urban consumers for a market basket of consumer goods and services. You cannot invest directly in an index. |
2 | Allspring Discovery SMID Cap Growth Fund
Letter to shareholders (unaudited)
Global volatility lessened in December as data indicated a lower risk of severe disease and death from the Omicron variant. Even so, several countries introduced restrictions on travel and hospitality, among other sectors, in an effort to reduce the spread. In the U.S., data indicated a stable economy overall, with robust corporate earnings. Consumer spending potential looked strong heading into 2022 on elevated household savings and the lowest household debt ratio since 1973. U.S. corporate and high-yield bonds had monthly gains while Treasuries declined. Bonds were strongly affected by the projection of three 25-basis-point (bp; 100 bps equal 1.00%) policy rate hikes in 2022 by senior Federal Open Market Committee members, up from previous projections of just one hike.
In January 2022, the main focus was on potential U.S. interest rate hikes and the Russia-Ukraine conflict. The Fed hinted that a March interest rate hike was likely. Meanwhile, Russia threatened a potential invasion of Ukraine, which could disrupt Russia’s massive energy supplies and drive demand from non-Russian oil-producing countries. Elsewhere overseas, Europe saw food and energy prices spike, leading to rising inflation. Within fixed income, corporate bonds struggled in January, underperforming government bonds, as investors focused on continued elevated inflation and ongoing uncertainty over the U.S. monetary path.
The Russian invasion of Ukraine dominated the financial world in February and March. Equity, bond, and commodities markets were shaken by fear, uncertainty, and an upending of demand-supply dynamics. Major global stock indexes were down in February, along with global bonds overall, with ongoing high levels of volatility in March along with mixed results that favored U.S. large-cap stocks. Prices of commodities spiked, including crude oil, natural gas, wheat, and precious metals, on elevated concerns of supply shortages. All of this fed already-high inflation concerns and added to expectations of more aggressive central bank interest rate hikes. Sweeping sanctions against Russia and corporate pullouts contributed to market volatility. Despite the geopolitical turmoil, the U.S. economic outlook remained largely unchanged, with a healthy job market and signs of economic resilience accompanying higher prices.
Don’t let short-term uncertainty derail long-term investment goals.
Periods of investment uncertainty can present challenges, but experience has taught us that maintaining long-term investment goals can be an effective way to plan for the future. To help you create a sound strategy based on your personal goals and risk tolerance, Allspring Funds offers more than 100 mutual funds spanning a wide range of asset classes and investment styles. Although diversification cannot guarantee an investment profit or prevent losses, we believe it can be an effective way to manage investment risk and potentially smooth out overall portfolio performance. We encourage investors to know their investments and to understand that appropriate levels of risk-taking may unlock opportunities.
Information on transaction closing.
On November 1, 2021, GTCR LLC and Reverence Capital Partners, L.P. announced the beginning of Allspring Global Investments™ with the close of the transaction to acquire Wells Fargo Funds Management, LLC; Wells Capital Management LLC; Galliard Capital Management LLC.; Wells Fargo Asset Management (International) Ltd.; Wells Fargo Asset Management Luxembourg S.A.; and Wells Fargo Funds Distributor, LLC, as well as Wells Fargo Bank, N.A.’s business of acting as trustee to its collective investment trusts and all related Wells Fargo Asset Management legal entities. The transaction closed on November 1, 2021, forming Allspring Global Investments, a privately held asset management firm with $451 billion in AUM1 as of March 31, 2022.
“ The Russian invasion of Ukraine dominated the financial world in February and March. Equity, bond, and commodities markets were shaken by fear, uncertainty, and an upending of demand-supply dynamics.”
| 1 | Figures are as of March 31, 2022, unless otherwise noted. Please note that the assets under management figures provided have been adjusted to eliminate any duplication of reporting among assets directed by multiple investment teams and includes $91.2B from Galliard Capital Management ($74.7B stable value; $16.5B fixed income), an investment advisor that is not part of the Allspring trade name/GIPS firm. |
Allspring Discovery SMID Cap Growth Fund | 3
Letter to shareholders (unaudited)
For further information about your Fund, contact your investment professional, visit our website at allspringglobal.com, or call us directly at 1-800-222-8222. |
Allspring Global Investments™ is a leading independent asset management firm with a full breadth of investment capabilities across diverse asset classes, serving the needs of its institutional and wealth management clients around the world. Allspring operates across 18 offices globally supported by more than 480 investment professionals. Allspring and its investment teams provide a broad range of differentiated investment products and solutions to help its diverse range of clients meet their investment objectives.
As part of this transition, all mutual funds within the Wells Fargo Funds family were rebranded as Allspring Funds. Each individual fund had “Wells Fargo” removed from its fund name and replaced with “Allspring.” The fund name changes went into effect on December 6, 2021.
Allspring Global Investments™ is the trade name for the asset management firm of Allspring Global Investments Holdings, LLC, a holding company indirectly owned by certain private funds of GTCR LLC and Reverence Capital Partners, L.P.
Thank you for choosing to invest with Allspring Funds. We appreciate your confidence in us and remain committed to helping you meet your financial needs.
Sincerely,
Andrew Owen
President
Allspring Funds
Notice to Shareholders
Russia launched a large-scale invasion of Ukraine on February 24, 2022. As a result of this military action, the United States and many other countries have instituted various economic sanctions against Russian and Belarus individuals and entities. The situation has led to increased financial market volatility and could have severe adverse effects on regional and global economic markets, including the markets for certain securities and commodities, such as oil and natural gas. The extent and duration of the military action, resulting sanctions imposed, other punitive action taken and the resulting market disruptions cannot be easily predicted.
Our solidarity and support goes out to our impacted employees and the people affected in Ukraine and their families. Allspring has a dedicated team of investment professionals actively monitoring the situation for any new developments and the potential impact to our clients and investment products. As the situation remains fluid, we are focused on the assessment of risks, valuation, and liquidity of impacted securities. Please visit our website at allspringglobal.com and click on “Russia-Ukraine Portfolio Impacts” for further information.
Notice to Shareholders
At a meeting held February 23-24, 2022, the Board of Trustees of the Allspring Funds approved changing the name of the Fund from Allspring Discovery Fund to Allspring Discovery SMID Cap Growth Fund which became effective on May 2, 2022. There was no change to the Fund’s investment process because of the name change.
4 | Allspring Discovery SMID Cap Growth Fund
This page is intentionally left blank.
Performance highlights (unaudited)
| Investment objective | The Fund seeks long-term capital appreciation. |
| Manager | Allspring Funds Management, LLC |
| Subadviser | Allspring Global Investments, LLC |
| Portfolio managers | Michael T. Smith, CFA®‡, Christopher J. Warner, CFA®‡ |
| Average annual total returns (%) as of March 31, 2022 |
| | | Including sales charge | | Excluding sales charge | | Expense ratios1 (%) |
| | Inception date | 1 year | 5 year | 10 year | | 1 year | 5 year | 10 year | | Gross | Net 2 |
| Class A (WFDAX) | 7-31-2007 | -22.93 | 12.28 | 11.34 | | -18.23 | 13.61 | 12.00 | | 1.19 | 1.19 |
| Class C (WDSCX) | 7-31-2007 | -19.81 | 12.78 | 11.17 | | -18.81 | 12.78 | 11.17 | | 1.94 | 1.94 |
| Class R6 (WFDRX)3 | 6-28-2013 | – | – | – | | -17.88 | 14.11 | 12.48 | | 0.76 | 0.76 |
| Administrator Class (WFDDX) | 4-8-2005 | – | – | – | | -18.16 | 13.71 | 12.11 | | 1.11 | 1.11 |
| Institutional Class (WFDSX) | 8-31-2006 | – | – | – | | -17.97 | 13.98 | 12.39 | | 0.86 | 0.86 |
| Russell 2500™ Growth Index4 | – | – | – | – | | -10.12 | 13.22 | 12.69 | | – | – |
Figures quoted represent past performance, which is no guarantee of future results, and do not reflect taxes that a shareholder may pay on an investment in a fund. Investment return and principal value of an investment will fluctuate so that an investor’s shares, when redeemed, may be worth more or less than their original cost. Performance shown without sales charges would be lower if sales charges were reflected. Current performance may be lower or higher than the performance data quoted, which assumes the reinvestment of dividends and capital gains. Current month-end performance is available on the Fund’s website, allspringglobal.com.
Index returns do not include transaction costs associated with buying and selling securities, any mutual fund fees or expenses, or any taxes. It is not possible to invest directly in an index.
For Class A shares, the maximum front-end sales charge is 5.75%. For Class C shares, the maximum contingent deferred sales charge is 1.00%. Performance including a contingent deferred sales charge assumes the sales charge for the corresponding time period. Class R6, Administrator Class and Institutional Class shares are sold without a front-end sales charge or contingent deferred sales charge.
| 1 | Reflects the expense ratios as stated in the most recent prospectuses. The expense ratios shown are subject to change and may differ from the annualized expense ratios shown in the financial highlights of this report. |
| 2 | The manager has contractually committed through January 31, 2023, to waive fees and/or reimburse expenses to the extent necessary to cap total annual fund operating expenses after fee waivers at 1.22% for Class A, 1.97% for Class C, 0.79% for Class R6, 1.14% for Administrator Class, and 0.89% for Institutional Class. Brokerage commissions, stamp duty fees, interest, taxes, acquired fund fees and expenses (if any), and extraordinary expenses are excluded from the expense caps. Prior to or after the commitment expiration date, the caps may be increased or the commitment to maintain the caps may be terminated only with the approval of the Board of Trustees. Without these caps, the Fund’s returns would have been lower. The expense ratio paid by an investor is the net expense ratio (the total annual fund operating expenses after fee waivers) as stated in the prospectuses. |
| 3 | Historical performance shown for the Class R6 shares prior to their inception reflects the performance of the Institutional Class shares, and includes the higher expenses applicable to the Institutional Class shares. If these expenses had not been included, returns for the Class R6 shares would be higher. |
| 4 | The Russell 2500® Growth Index measures the performance of those Russell 2500 companies with higher price/book ratios and higher forecasted growth values. You cannot invest directly in an index. |
Stock values fluctuate in response to the activities of individual companies and general market and economic conditions. Smaller-company stocks tend to be more volatile and less liquid than those of larger companies. Certain investment strategies tend to increase the total risk of an investment (relative to the broader market). This fund is exposed to foreign investment risk. Consult the Fund’s prospectus for additional information on these and other risks.
| ‡ | CFA® and Chartered Financial Analyst® are trademarks owned by CFA Institute. |
6 | Allspring Discovery SMID Cap Growth Fund
Performance highlights (unaudited)
| Ten largest holdings (%) as of March 31, 20221 |
| MongoDB Incorporated | 3.87 |
| Bill.com Holdings Incorporated | 3.24 |
| Teledyne Technologies Incorporated | 2.97 |
| Enphase Energy Incorporated | 2.49 |
| Shockwave Medical Incorporated | 2.48 |
| Globant SA | 2.47 |
| Rexford Industrial Realty Incorporated | 2.42 |
| Five9 Incorporated | 2.26 |
| Inari Medical Incorporated | 2.24 |
| Casella Waste Systems Incorporated Class A | 2.19 |
| 1 | Figures represent the percentage of the Fund's net assets. Holdings are subject to change and may have changed since the date specified. |
| Sector allocation as of March 31, 20221 |
| 1 | Figures represent the percentage of the Fund's long-term investments. These amounts are subject to change and may have changed since the date specified. |
Allspring Discovery SMID Cap Growth Fund | 7
Fund expenses (unaudited)
As a shareholder of the Fund, you incur two types of costs: (1) transaction costs, including sales charges (loads) on purchase payments and contingent deferred sales charges (if any) on redemptions and (2) ongoing costs, including management fees, distribution (12b-1) and/or shareholder servicing fees, and other Fund expenses. This example is intended to help you understand your ongoing costs (in dollars) of investing in the Fund and to compare these costs with the ongoing costs of investing in other mutual funds.
The example is based on an investment of $1,000 invested at the beginning of the six-month period and held for the entire period from October 1, 2021 to March 31, 2022.
Actual expenses
The “Actual” line of the table below provides information about actual account values and actual expenses. You may use the information in this line, together with the amount you invested, to estimate the expenses that you paid over the period. Simply divide your account value by $1,000 (for example, an $8,600 account value divided by $1,000 = 8.6), then multiply the result by the number in the “Actual” line under the heading entitled “Expenses paid during period” for your applicable class of shares to estimate the expenses you paid on your account during this period.
Hypothetical example for comparison purposes
The “Hypothetical” line of the table below provides information about hypothetical account values and hypothetical expenses based on the Fund’s actual expense ratio and an assumed rate of return of 5% per year before expenses, which is not the Fund’s actual return. The hypothetical account values and expenses may not be used to estimate the actual ending account balance or expenses you paid for the period. You may use this information to compare the ongoing costs of investing in the Fund and other funds. To do so, compare this 5% hypothetical example with the 5% hypothetical examples that appear in the shareholder reports of the other funds.
Please note that the expenses shown in the table are meant to highlight your ongoing costs only and do not reflect any transactional costs, such as sales charges (loads) and contingent deferred sales charges. Therefore, the “Hypothetical” line of the table is useful in comparing ongoing costs only, and will not help you determine the relative total costs of owning different funds. In addition, if these transactional costs were included, your costs would have been higher.
| | Beginning
account value
10-1-2021 | Ending
account value
3-31-2022 | Expenses
paid during
the period1 | Annualized net
expense ratio |
| Class A | | | | |
| Actual | $1,000.00 | $ 770.85 | $5.25 | 1.19% |
| Hypothetical (5% return before expenses) | $1,000.00 | $1,019.00 | $5.99 | 1.19% |
| Class C | | | | |
| Actual | $1,000.00 | $ 768.25 | $8.55 | 1.94% |
| Hypothetical (5% return before expenses) | $1,000.00 | $1,015.26 | $9.75 | 1.94% |
| Class R6 | | | | |
| Actual | $1,000.00 | $ 772.59 | $3.40 | 0.77% |
| Hypothetical (5% return before expenses) | $1,000.00 | $1,021.09 | $3.88 | 0.77% |
| Administrator Class | | | | |
| Actual | $1,000.00 | $ 771.12 | $4.86 | 1.10% |
| Hypothetical (5% return before expenses) | $1,000.00 | $1,019.45 | $5.54 | 1.10% |
| Institutional Class | | | | |
| Actual | $1,000.00 | $ 771.98 | $3.84 | 0.87% |
| Hypothetical (5% return before expenses) | $1,000.00 | $1,020.59 | $4.38 | 0.87% |
1 Expenses paid is equal to the annualized net expense ratio of each class multiplied by the average account value over the period, multiplied by 182 divided by 365 (to reflect the one-half-year period).
8 | Allspring Discovery SMID Cap Growth Fund
Portfolio of investments—March 31, 2022 (unaudited)
| | | | | Shares | Value |
| Common stocks: 97.42% | | | | | |
| Communication services: 6.44% | | | | | |
| Entertainment: 1.88% | | | | | |
| Roku Incorporated † | | | | 84,700 | $ 10,610,369 |
| Warner Music Group Corporation Class A | | | | 692,100 | 26,195,985 |
| | | | | | 36,806,354 |
| Interactive media & services: 4.56% | | | | | |
| Bumble Incorporated Class A † | | | | 816,863 | 23,672,690 |
| IAC/InterActiveCorp | | | | 247,315 | 24,800,748 |
| ZoomInfo Technologies Incorporated † | | | | 685,457 | 40,949,201 |
| | | | | | 89,422,639 |
| Consumer discretionary: 11.04% | | | | | |
| Diversified consumer services: 1.17% | | | | | |
| Mister Car Wash Incorporated † | | | | 1,544,766 | 22,847,089 |
| Hotels, restaurants & leisure: 2.95% | | | | | |
| Chipotle Mexican Grill Incorporated † | | | | 25,021 | 39,583,973 |
| Domino's Pizza Incorporated | | | | 44,746 | 18,212,069 |
| | | | | | 57,796,042 |
| Internet & direct marketing retail: 4.37% | | | | | |
| Etsy Incorporated † | | | | 113,018 | 14,045,877 |
| Global-E Online Limited † | | | | 899,300 | 30,378,354 |
| MercadoLibre Incorporated † | | | | 34,632 | 41,194,071 |
| | | | | | 85,618,302 |
| Leisure products: 1.58% | | | | | |
| Callaway Golf Company † | | | | 1,323,591 | 30,998,501 |
| Textiles, apparel & luxury goods: 0.97% | | | | | |
| On Holding AG Class A †« | | | | 754,500 | 19,043,580 |
| Financials: 3.82% | | | | | |
| Banks: 1.22% | | | | | |
| Silvergate Capital Corporation Class A † | | | | 158,995 | 23,939,877 |
| Capital markets: 1.33% | | | | | |
| MarketAxess Holdings Incorporated | | | | 76,610 | 26,062,722 |
| Insurance: 1.27% | | | | | |
| Goosehead Insurance Incorporated Class A | | | | 315,646 | 24,800,306 |
| Health care: 26.56% | | | | | |
| Biotechnology: 2.87% | | | | | |
| Ascendis Pharma AS ADR † | | | | 119,147 | 13,983,092 |
| CRISPR Therapeutics AG † | | | | 124,916 | 7,840,977 |
| Mirati Therapeutics Incorporated † | | | | 115,284 | 9,478,650 |
| ORIC Pharmaceuticals Incorporated † | | | | 445,032 | 2,376,471 |
| Sarepta Therapeutics Incorporated † | | | | 101,300 | 7,913,556 |
The accompanying notes are an integral part of these financial statements.
Allspring Discovery SMID Cap Growth Fund | 9
Portfolio of investments—March 31, 2022 (unaudited)
| | | | | Shares | Value |
| Biotechnology (continued) | | | | | |
| Turning Point Therapeutics Incorporated † | | | | 243,546 | $ 6,539,210 |
| Zentalis Pharmaceuticals Incorporated † | | | | 174,926 | 8,071,086 |
| | | | | | 56,203,042 |
| Health care equipment & supplies: 11.62% | | | | | |
| ABIOMED Incorporated † | | | | 75,844 | 25,122,567 |
| DexCom Incorporated † | | | | 81,139 | 41,510,712 |
| Heska Corporation † | | | | 127,839 | 17,677,577 |
| ICU Medical Incorporated † | | | | 86,000 | 19,147,040 |
| Inari Medical Incorporated † | | | | 484,240 | 43,891,514 |
| Insulet Corporation † | | | | 119,606 | 31,861,842 |
| Shockwave Medical Incorporated † | | | | 234,165 | 48,556,454 |
| | | | | | 227,767,706 |
| Health care providers & services: 3.26% | | | | | |
| Amedisys Incorporated † | | | | 197,253 | 33,984,719 |
| Option Care Health Incorporated † | | | | 1,046,409 | 29,885,441 |
| | | | | | 63,870,160 |
| Health care technology: 2.76% | | | | | |
| Doximity Incorporated Class A † | | | | 353,460 | 18,411,731 |
| Inspire Medical Systems Incorporated † | | | | 138,800 | 35,628,572 |
| | | | | | 54,040,303 |
| Life sciences tools & services: 6.05% | | | | | |
| 10x Genomics Incorporated Class A † | | | | 286,786 | 21,815,816 |
| Azenta Incorporated | | | | 390,000 | 32,323,200 |
| Bio-Rad Laboratories Incorporated Class A † | | | | 47,033 | 26,490,397 |
| Bio-Techne Corporation | | | | 87,700 | 37,977,608 |
| | | | | | 118,607,021 |
| Industrials: 13.89% | | | | | |
| Aerospace & defense: 2.09% | | | | | |
| Axon Enterprise Incorporated † | | | | 297,358 | 40,955,117 |
| Building products: 2.60% | | | | | |
| Advanced Drainage Systems Incorporated | | | | 276,200 | 32,815,322 |
| Trex Company Incorporated † | | | | 277,468 | 18,126,984 |
| | | | | | 50,942,306 |
| Commercial services & supplies: 2.19% | | | | | |
| Casella Waste Systems Incorporated Class A † | | | | 489,266 | 42,884,165 |
| Electrical equipment: 1.98% | | | | | |
| Generac Holdings Incorporated † | | | | 130,801 | 38,881,905 |
| Professional services: 1.22% | | | | | |
| Clarivate plc † | | | | 1,424,063 | 23,867,296 |
| Road & rail: 1.90% | | | | | |
| Saia Incorporated † | | | | 152,748 | 37,243,017 |
| Trading companies & distributors: 1.91% | | | | | |
| SiteOne Landscape Supply Incorporated † | | | | 231,557 | 37,440,451 |
The accompanying notes are an integral part of these financial statements.
10 | Allspring Discovery SMID Cap Growth Fund
Portfolio of investments—March 31, 2022 (unaudited)
| | | | | Shares | Value |
| Information technology: 32.48% | | | | | |
| Electronic equipment, instruments & components: 6.68% | | | | | |
| Cognex Corporation | | | | 469,098 | $ 36,190,911 |
| Novanta Incorporated † | | | | 256,694 | 36,524,989 |
| Teledyne Technologies Incorporated † | | | | 123,272 | 58,262,045 |
| | | | | | 130,977,945 |
| IT services: 9.32% | | | | | |
| Globant SA † | | | | 184,545 | 48,363,708 |
| Marqeta Incorporated † | | | | 1,107,200 | 12,223,488 |
| MongoDB Incorporated † | | | | 170,963 | 75,837,477 |
| StoneCo Limited Class A † | | | | 794,595 | 9,296,762 |
| WNS Holdings Limited ADR † | | | | 432,023 | 36,933,646 |
| | | | | | 182,655,081 |
| Semiconductors & semiconductor equipment: 4.41% | | | | | |
| Enphase Energy Incorporated † | | | | 241,276 | 48,684,671 |
| Impinj Incorporated † | | | | 291,100 | 18,496,494 |
| MKS Instruments Incorporated | | | | 127,497 | 19,124,550 |
| | | | | | 86,305,715 |
| Software: 12.07% | | | | | |
| Bill.com Holdings Incorporated † | | | | 279,514 | 63,390,980 |
| Black Knight Incorporated † | | | | 434,095 | 25,173,169 |
| Crowdstrike Holdings Incorporated Class A † | | | | 183,054 | 41,567,902 |
| Five9 Incorporated † | | | | 401,006 | 44,271,062 |
| HubSpot Incorporated † | | | | 53,100 | 25,219,314 |
| Lightspeed Commerce Incorporated † | | | | 557,819 | 16,996,745 |
| Olo Incorporated Class A † | | | | 1,492,751 | 19,778,951 |
| | | | | | 236,398,123 |
| Real estate: 3.19% | | | | | |
| Equity REITs: 3.19% | | | | | |
| Equity Lifestyle Properties Incorporated | | | | 197,400 | 15,097,152 |
| Rexford Industrial Realty Incorporated | | | | 634,765 | 47,347,121 |
| | | | | | 62,444,273 |
| Total Common stocks (Cost $1,577,514,974) | | | | | 1,908,819,038 |
| | | Yield | | | |
| Short-term investments: 3.82% | | | | | |
| Investment companies: 3.82% | | | | | |
| Allspring Government Money Market Fund Select Class ♠∞ | | 0.18% | | 55,676,568 | 55,676,568 |
| Securities Lending Cash Investments LLC ♠∩∞ | | 0.40 | | 19,210,340 | 19,210,340 |
| Total Short-term investments (Cost $74,886,908) | | | | | 74,886,908 |
| Total investments in securities (Cost $1,652,401,882) | 101.24% | | | | 1,983,705,946 |
| Other assets and liabilities, net | (1.24) | | | | (24,291,524) |
| Total net assets | 100.00% | | | | $1,959,414,422 |
The accompanying notes are an integral part of these financial statements.
Allspring Discovery SMID Cap Growth Fund | 11
Portfolio of investments—March 31, 2022 (unaudited)
| † | Non-income-earning security |
| « | All or a portion of this security is on loan. |
| ♠ | The issuer of the security is an affiliated person of the Fund as defined in the Investment Company Act of 1940. |
| ∩ | The investment is a non-registered investment company purchased with cash collateral received from securities on loan. |
| ∞ | The rate represents the 7-day annualized yield at period end. |
| Abbreviations: |
| ADR | American depositary receipt |
| REIT | Real estate investment trust |
Investments in affiliates
An affiliated investment is an investment in which the Fund owns at least 5% of the outstanding voting shares of the issuer or as a result of other relationships, such as the Fund and the issuer having the same investment manager. Transactions with issuers that were affiliates of the Fund at the end of the period were as follows:
| | Value,
beginning of
period | Purchases | Sales
proceeds | Net
realized
gains
(losses) | | Net
change in
unrealized
gains
(losses) | | Value,
end of
period | Shares,
end
of period | Income
from
affiliated
securities |
| Short-term investments | | | | | | | | | |
| Allspring Government Money Market Fund Select Class | $47,190,964 | $421,206,142 | $(412,720,538) | $0 | | $0 | | $ 55,676,568 | 55,676,568 | $ 6,876 |
| Securities Lending Cash Investments LLC | 40,586,150 | 268,594,797 | (289,970,607) | 0 | | 0 | | 19,210,340 | 19,210,340 | 14,437 # |
| | | | | $0 | | $0 | | $74,886,908 | | $21,313 |
| # | Amount shown represents income before fees and rebates. |
The accompanying notes are an integral part of these financial statements.
12 | Allspring Discovery SMID Cap Growth Fund
Statement of assets and liabilities—March 31, 2022 (unaudited)
| | |
| Assets | |
Investments in unaffiliated securities (including $18,799,041 of securities loaned), at value (cost $1,577,514,974)
| $ 1,908,819,038 |
Investments in affiliated securities, at value (cost $74,886,908)
| 74,886,908 |
Receivable for investments sold
| 7,533,649 |
Receivable for Fund shares sold
| 2,274,814 |
Receivable for dividends
| 203,139 |
Receivable for securities lending income, net
| 17,511 |
Total assets
| 1,993,735,059 |
| Liabilities | |
Payable upon receipt of securities loaned
| 19,210,340 |
Payable for investments purchased
| 11,398,844 |
Payable for Fund shares redeemed
| 1,903,709 |
Management fee payable
| 1,189,566 |
Administration fees payable
| 209,839 |
Distribution fee payable
| 4,323 |
Trustees’ fees and expenses payable
| 3,063 |
Accrued expenses and other liabilities
| 400,953 |
Total liabilities
| 34,320,637 |
Total net assets
| $1,959,414,422 |
| Net assets consist of | |
Paid-in capital
| $ 1,530,348,115 |
Total distributable earnings
| 429,066,307 |
Total net assets
| $1,959,414,422 |
| Computation of net asset value and offering price per share | |
Net assets – Class A
| $ 593,908,666 |
Shares outstanding – Class A1
| 22,620,056 |
Net asset value per share – Class A
| $26.26 |
Maximum offering price per share – Class A2
| $27.86 |
Net assets – Class C
| $ 7,062,110 |
Shares outstanding – Class C1
| 369,814 |
Net asset value per share – Class C
| $19.10 |
Net assets – Class R6
| $ 481,192,623 |
Shares outstanding – Class R61
| 15,338,558 |
Net asset value per share – Class R6
| $31.37 |
Net assets – Administrator Class
| $ 121,290,487 |
Shares outstanding – Administrator Class1
| 4,320,232 |
Net asset value per share – Administrator Class
| $28.07 |
Net assets – Institutional Class
| $ 755,960,536 |
Shares outstanding – Institutional Class1
| 24,452,464 |
Net asset value per share – Institutional Class
| $30.92 |
| 1 | The Fund has an unlimited number of authorized shares. |
| 2 | Maximum offering price is computed as 100/94.25 of net asset value. On investments of $50,000 or more, the offering price is reduced. |
The accompanying notes are an integral part of these financial statements.
Allspring Discovery SMID Cap Growth Fund | 13
Statement of operations—six months ended March 31, 2022 (unaudited)
| | |
| Investment income | |
Dividends
| $ 907,683 |
Securities lending income (including from affiliate), net
| 154,742 |
Income from affiliated securities
| 6,876 |
Total investment income
| 1,069,301 |
| Expenses | |
Management fee
| 8,886,744 |
| Administration fees | |
Class A
| 774,550 |
Class C
| 13,145 |
Class R6
| 91,756 |
Administrator Class
| 104,169 |
Institutional Class
| 602,749 |
| Shareholder servicing fees | |
Class A
| 922,084 |
Class C
| 15,582 |
Administrator Class
| 183,422 |
| Distribution fee | |
Class C
| 46,679 |
Custody and accounting fees
| 51,253 |
Professional fees
| 20,381 |
Registration fees
| 38,102 |
Shareholder report expenses
| 36,645 |
Trustees’ fees and expenses
| 10,683 |
Other fees and expenses
| 15,139 |
Total expenses
| 11,813,083 |
| Less: Fee waivers and/or expense reimbursements | |
Class A
| (52,747) |
Class C
| (4) |
Class R6
| (425) |
Administrator Class
| (34) |
Institutional Class
| (407) |
Net expenses
| 11,759,466 |
Net investment loss
| (10,690,165) |
| Realized and unrealized gains (losses) on investments | |
Net realized gains on investments
| 163,838,102 |
Net change in unrealized gains (losses) on investments
| (784,683,732) |
Net realized and unrealized gains (losses) on investments
| (620,845,630) |
Net decrease in net assets resulting from operations
| $(631,535,795) |
The accompanying notes are an integral part of these financial statements.
14 | Allspring Discovery SMID Cap Growth Fund
Statement of changes in net assets
| | | | | |
| | Six months ended
March 31, 2022
(unaudited) | Year ended
September 30, 2021 |
| Operations | | | | |
Net investment loss
| | $ (10,690,165) | | $ (27,464,974) |
Net realized gains on investments
| | 163,838,102 | | 696,024,556 |
Net change in unrealized gains (losses) on investments
| | (784,683,732) | | 9,749,768 |
Net increase (decrease) in net assets resulting from operations
| | (631,535,795) | | 678,309,350 |
| Distributions to shareholders from | | | | |
| Net investment income and net realized gains | | | | |
Class A
| | (226,994,997) | | (46,293,679) |
Class C
| | (5,111,681) | | (1,627,880) |
Class R6
| | (165,661,045) | | (34,087,214) |
Administrator Class
| | (56,057,581) | | (21,096,480) |
Institutional Class
| | (256,462,316) | | (50,727,287) |
Total distributions to shareholders
| | (710,287,620) | | (153,832,540) |
| Capital share transactions | Shares | | Shares | |
| Proceeds from shares sold | | | | |
Class A
| 885,917 | 28,899,249 | 2,082,528 | 97,194,276 |
Class C
| 21,516 | 561,233 | 62,690 | 2,371,587 |
Class R6
| 2,555,387 | 97,322,775 | 5,528,815 | 289,462,844 |
Administrator Class
| 1,188,895 | 50,728,564 | 3,045,783 | 146,419,615 |
Institutional Class
| 3,023,257 | 117,720,641 | 5,850,906 | 307,371,577 |
| | | 295,232,462 | | 842,819,899 |
| Reinvestment of distributions | | | | |
Class A
| 6,880,085 | 220,025,107 | 1,020,425 | 44,898,707 |
Class C
| 216,385 | 5,043,951 | 45,382 | 1,621,040 |
Class R6
| 4,131,760 | 157,667,968 | 650,728 | 32,464,798 |
Administrator Class
| 1,638,233 | 55,994,841 | 456,861 | 21,079,565 |
Institutional Class
| 6,386,688 | 240,267,206 | 976,337 | 48,231,041 |
| | | 678,999,073 | | 148,295,151 |
| Payment for shares redeemed | | | | |
Class A
| (3,578,905) | (111,042,770) | (3,761,140) | (175,792,261) |
Class C
| (335,512) | (7,855,286) | (507,698) | (19,149,861) |
Class R6
| (5,625,584) | (226,459,634) | (5,193,353) | (275,202,268) |
Administrator Class
| (2,300,518) | (77,474,039) | (8,667,721) | (417,124,132) |
Institutional Class
| (5,351,532) | (193,787,350) | (6,806,949) | (356,339,574) |
| | | (616,619,079) | | (1,243,608,096) |
Net increase (decrease) in net assets resulting from capital share transactions
| | 357,612,456 | | (252,493,046) |
Total increase (decrease) in net assets
| | (984,210,959) | | 271,983,764 |
| Net assets | | | | |
Beginning of period
| | 2,943,625,381 | | 2,671,641,617 |
End of period
| | $1,959,414,422 | | $ 2,943,625,381 |
The accompanying notes are an integral part of these financial statements.
Allspring Discovery SMID Cap Growth Fund | 15
Financial highlights
(For a share outstanding throughout each period)
| | | Year ended September 30 |
| Class A | Six months ended
March 31, 2022
(unaudited) | 2021 | 2020 | 2019 | 2018 | 2017 |
Net asset value, beginning of period
| $47.48 | $39.95 | $33.24 | $38.03 | $36.47 | $29.94 |
Net investment loss
| (0.19) 1 | (0.53) | (0.31) | (0.26) | (0.26) | (0.23) |
Net realized and unrealized gains (losses) on investments
| (8.42) | 10.51 | 11.37 | 0.53 | 7.85 | 7.17 |
Total from investment operations
| (8.61) | 9.98 | 11.06 | 0.27 | 7.59 | 6.94 |
| Distributions to shareholders from | | | | | | |
Net realized gains
| (12.61) | (2.45) | (4.35) | (5.06) | (6.03) | (0.41) |
Net asset value, end of period
| $26.26 | $47.48 | $39.95 | $33.24 | $38.03 | $36.47 |
Total return2
| (22.92)% | 25.48% | 37.49% | 3.81% | 23.86% | 23.42% |
| Ratios to average net assets (annualized) | | | | | | |
Gross expenses
| 1.20% | 1.19% | 1.21% | 1.21% | 1.20% | 1.21% |
Net expenses
| 1.19% | 1.18% | 1.19% | 1.20% | 1.20% | 1.21% |
Net investment loss
| (1.10)% | (1.08)% | (0.91)% | (0.77)% | (0.69)% | (0.70)% |
| Supplemental data | | | | | | |
Portfolio turnover rate
| 33% | 51% | 53% | 71% | 67% | 73% |
Net assets, end of period (000s omitted)
| $593,909 | $875,257 | $762,758 | $627,336 | $676,930 | $607,318 |
| 1 | Calculated based upon average shares outstanding |
| 2 | Total return calculations do not include any sales charges. Returns for periods of less than one year are not annualized. |
The accompanying notes are an integral part of these financial statements.
16 | Allspring Discovery SMID Cap Growth Fund
Financial highlights
(For a share outstanding throughout each period)
| | | Year ended September 30 |
| Class C | Six months ended
March 31, 2022
(unaudited) | 2021 | 2020 | 2019 | 2018 | 2017 |
Net asset value, beginning of period
| $38.31 | $32.88 | $28.27 | $33.46 | $32.99 | $27.32 |
Net investment loss
| (0.25) 1 | (0.70) 1 | (0.45) 1 | (0.41) 1 | (0.46) | (0.42) 1 |
Net realized and unrealized gains (losses) on investments
| (6.35) | 8.58 | 9.41 | 0.28 | 6.96 | 6.50 |
Total from investment operations
| (6.60) | 7.88 | 8.96 | (0.13) | 6.50 | 6.08 |
| Distributions to shareholders from | | | | | | |
Net realized gains
| (12.61) | (2.45) | (4.35) | (5.06) | (6.03) | (0.41) |
Net asset value, end of period
| $19.10 | $38.31 | $32.88 | $28.27 | $33.46 | $32.99 |
Total return2
| (23.17)% | 24.52% | 36.54% | 3.01% | 22.94% | 22.51% |
| Ratios to average net assets (annualized) | | | | | | |
Gross expenses
| 1.94% | 1.94% | 1.96% | 1.95% | 1.95% | 1.96% |
Net expenses
| 1.94% | 1.94% | 1.96% | 1.95% | 1.95% | 1.96% |
Net investment loss
| (1.86)% | (1.84)% | (1.66)% | (1.51)% | (1.45)% | (1.45)% |
| Supplemental data | | | | | | |
Portfolio turnover rate
| 33% | 51% | 53% | 71% | 67% | 73% |
Net assets, end of period (000s omitted)
| $7,062 | $17,909 | $28,509 | $30,982 | $40,860 | $40,070 |
| 1 | Calculated based upon average shares outstanding |
| 2 | Total return calculations do not include any sales charges. Returns for periods of less than one year are not annualized. |
The accompanying notes are an integral part of these financial statements.
Allspring Discovery SMID Cap Growth Fund | 17
Financial highlights
(For a share outstanding throughout each period)
| | | Year ended September 30 |
| Class R6 | Six months ended
March 31, 2022
(unaudited) | 2021 | 2020 | 2019 | 2018 | 2017 |
Net asset value, beginning of period
| $54.02 | $44.98 | $36.76 | $41.26 | $38.93 | $31.80 |
Net investment loss
| (0.14) 1 | (0.35) 1 | (0.18) 1 | (0.12) 1 | (0.10) 1 | (0.08) |
Net realized and unrealized gains (losses) on investments
| (9.90) | 11.84 | 12.75 | 0.68 | 8.46 | 7.62 |
Total from investment operations
| (10.04) | 11.49 | 12.57 | 0.56 | 8.36 | 7.54 |
| Distributions to shareholders from | | | | | | |
Net realized gains
| (12.61) | (2.45) | (4.35) | (5.06) | (6.03) | (0.41) |
Net asset value, end of period
| $31.37 | $54.02 | $44.98 | $36.76 | $41.26 | $38.93 |
Total return2
| (22.74)% | 26.01% | 38.06% | 4.26% | 24.39% | 23.98% |
| Ratios to average net assets (annualized) | | | | | | |
Gross expenses
| 0.77% | 0.76% | 0.78% | 0.77% | 0.78% | 0.78% |
Net expenses
| 0.77% | 0.76% | 0.78% | 0.77% | 0.78% | 0.78% |
Net investment loss
| (0.68)% | (0.66)% | (0.50)% | (0.33)% | (0.26)% | (0.27)% |
| Supplemental data | | | | | | |
Portfolio turnover rate
| 33% | 51% | 53% | 71% | 67% | 73% |
Net assets, end of period (000s omitted)
| $481,193 | $771,279 | $597,851 | $405,610 | $530,879 | $351,268 |
| 1 | Calculated based upon average shares outstanding |
| 2 | Returns for periods of less than one year are not annualized. |
The accompanying notes are an integral part of these financial statements.
18 | Allspring Discovery SMID Cap Growth Fund
Financial highlights
(For a share outstanding throughout each period)
| | | Year ended September 30 |
| Administrator Class | Six months ended
March 31, 2022
(unaudited) | 2021 | 2020 | 2019 | 2018 | 2017 |
Net asset value, beginning of period
| $49.83 | $41.79 | $34.55 | $39.27 | $37.44 | $30.70 |
Net investment loss
| (0.18) 1 | (0.49) 1 | (0.29) 1 | (0.23) 1 | (0.23) | (0.20) 1 |
Net realized and unrealized gains (losses) on investments
| (8.97) | 10.98 | 11.88 | 0.57 | 8.09 | 7.35 |
Total from investment operations
| (9.15) | 10.49 | 11.59 | 0.34 | 7.86 | 7.15 |
| Distributions to shareholders from | | | | | | |
Net realized gains
| (12.61) | (2.45) | (4.35) | (5.06) | (6.03) | (0.41) |
Net asset value, end of period
| $28.07 | $49.83 | $41.79 | $34.55 | $39.27 | $37.44 |
Total return2
| (22.89)% | 25.58% | 37.61% | 3.88% | 23.97% | 23.52% |
| Ratios to average net assets (annualized) | | | | | | |
Gross expenses
| 1.10% | 1.11% | 1.13% | 1.13% | 1.12% | 1.13% |
Net expenses
| 1.10% | 1.11% | 1.13% | 1.13% | 1.12% | 1.13% |
Net investment loss
| (1.01)% | (1.01)% | (0.84)% | (0.70)% | (0.62)% | (0.62)% |
| Supplemental data | | | | | | |
Portfolio turnover rate
| 33% | 51% | 53% | 71% | 67% | 73% |
Net assets, end of period (000s omitted)
| $121,290 | $189,022 | $374,366 | $333,814 | $353,042 | $335,898 |
| 1 | Calculated based upon average shares outstanding |
| 2 | Returns for periods of less than one year are not annualized. |
The accompanying notes are an integral part of these financial statements.
Allspring Discovery SMID Cap Growth Fund | 19
Financial highlights
(For a share outstanding throughout each period)
| | | Year ended September 30 |
| Institutional Class | Six months ended
March 31, 2022
(unaudited) | 2021 | 2020 | 2019 | 2018 | 2017 |
Net asset value, beginning of period
| $53.45 | $44.57 | $36.50 | $41.05 | $38.79 | $31.72 |
Net investment loss
| (0.15) 1 | (0.40) 1 | (0.21) 1 | (0.15) 1 | (0.18) | (0.13) 1 |
Net realized and unrealized gains (losses) on investments
| (9.77) | 11.73 | 12.63 | 0.66 | 8.47 | 7.61 |
Total from investment operations
| (9.92) | 11.33 | 12.42 | 0.51 | 8.29 | 7.48 |
| Distributions to shareholders from | | | | | | |
Net realized gains
| (12.61) | (2.45) | (4.35) | (5.06) | (6.03) | (0.41) |
Net asset value, end of period
| $30.92 | $53.45 | $44.57 | $36.50 | $41.05 | $38.79 |
Total return2
| (22.80)% | 25.91% | 37.91% | 4.15% | 24.25% | 23.88% |
| Ratios to average net assets (annualized) | | | | | | |
Gross expenses
| 0.87% | 0.86% | 0.88% | 0.87% | 0.87% | 0.88% |
Net expenses
| 0.87% | 0.86% | 0.88% | 0.87% | 0.87% | 0.88% |
Net investment loss
| (0.78)% | (0.76)% | (0.58)% | (0.42)% | (0.36)% | (0.37)% |
| Supplemental data | | | | | | |
Portfolio turnover rate
| 33% | 51% | 53% | 71% | 67% | 73% |
Net assets, end of period (000s omitted)
| $755,961 | $1,090,159 | $908,157 | $1,096,888 | $1,352,027 | $1,157,148 |
| 1 | Calculated based upon average shares outstanding |
| 2 | Returns for periods of less than one year are not annualized. |
The accompanying notes are an integral part of these financial statements.
20 | Allspring Discovery SMID Cap Growth Fund
Notes to financial statements (unaudited)
1. ORGANIZATION
Allspring Funds Trust (the "Trust"), a Delaware statutory trust organized on March 10, 1999, is an open-end management investment company registered under the Investment Company Act of 1940, as amended (the "1940 Act"). As an investment company, the Trust follows the accounting and reporting guidance in Financial Accounting Standards Board ("FASB") Accounting Standards Codification Topic 946, Financial Services – Investment Companies. These financial statements report on the Allspring Discovery SMID Cap Growth Fund (formerly, Allspring Discovery Fund)(the "Fund") which is a diversified series of the Trust.
Effective on November 1, 2021, the sale transaction of Wells Fargo Asset Management ("WFAM") by Wells Fargo & Company to GTCR LLC and Reverence Capital Partners, L.P. was closed. In connection with the closing of the transaction, WFAM became known as Allspring Global Investments (“Allspring”) and various entities that provided services to the Fund changed their names to "Allspring", including Allspring Funds Management, LLC, the investment manager to the Fund, Allspring Global Investments, LLC and Allspring Global Investments (UK) Limited, both registered investment advisers providing subadvisory services to certain funds, and Allspring Funds Distributor, LLC, the Fund's principal underwriter. Consummation of the transaction resulted in a new investment management agreement and subadvisory agreement which became effective on November 1, 2021.
2. SIGNIFICANT ACCOUNTING POLICIES
The following significant accounting policies, which are consistently followed in the preparation of the financial statements of the Fund, are in conformity with U.S. generally accepted accounting principles which require management to make estimates and assumptions that affect the reported amounts of assets and liabilities, disclosure of contingent assets and liabilities at the date of the financial statements, and the reported amounts of income and expenses during the reporting period. Actual results could differ from those estimates.
Securities valuation
All investments are valued each business day as of the close of regular trading on the New York Stock Exchange (generally 4 p.m. Eastern Time), although the Fund may deviate from this calculation time under unusual or unexpected circumstances.
Equity securities that are listed on a foreign or domestic exchange or market are valued at the official closing price or, if none, the last sales price. If no sale occurs on the principal exchange or market that day, a fair value price will be determined in accordance with the Fund’s Valuation Procedures.
Investments in registered open-end investment companies are valued at net asset value. Interests in non-registered investment companies that are redeemable at net asset value are fair valued normally at net asset value.
Investments which are not valued using any of the methods discussed above are valued at their fair value, as determined in good faith by the Board of Trustees. The Board of Trustees has established a Valuation Committee comprised of the Trustees and has delegated to it the authority to take any actions regarding the valuation of portfolio securities that the Valuation Committee deems necessary or appropriate, including determining the fair value of portfolio securities, unless the determination has been delegated to the Allspring Global Investments Pricing Committee at Allspring Funds Management, LLC ("Allspring Funds Management"). The Board of Trustees retains the authority to make or ratify any valuation decisions or approve any changes to the Valuation Procedures as it deems appropriate. On a quarterly basis, the Board of Trustees receives reports on any valuation actions taken by the Valuation Committee or the Allspring Global Investments Pricing Committee which may include items for ratification.
Foreign currency translation
The accounting records of the Fund are maintained in U.S. dollars. The values of other assets and liabilities denominated in foreign currencies are translated into U.S. dollars at rates provided by an independent foreign currency pricing source at a time each business day specified by the Allspring Global Investments Pricing Committee. Purchases and sales of securities, and income and expenses are converted at the rate of exchange on the respective dates of such transactions. Net realized foreign exchange gains or losses arise from sales of foreign currencies, currency gains or losses realized between the trade and settlement dates on securities transactions, and the difference between the amounts of dividends, interest and foreign withholding taxes recorded and the U.S. dollar equivalent of the amounts actually paid or received. Net unrealized foreign exchange gains and losses arise from changes in the fair value of assets and liabilities other than investments in securities resulting from changes in exchange rates. The changes in net assets arising from changes in exchange rates of securities and the changes in net assets resulting from changes in market prices of securities are not separately presented. Such changes are included in net realized and unrealized gains or losses from investments.
Allspring Discovery SMID Cap Growth Fund | 21
Notes to financial statements (unaudited)
Securities lending
The Fund may lend its securities from time to time in order to earn additional income in the form of fees or interest on securities received as collateral or the investment of any cash received as collateral. When securities are on loan, the Fund receives interest or dividends on those securities. Cash collateral received in connection with its securities lending transactions is invested in Securities Lending Cash Investments, LLC (the "Securities Lending Fund"), an affiliated non-registered investment company. Investments in Securities Lending Fund are valued at the evaluated bid price provided by an independent pricing service. Income earned from investment in the Securities Lending Fund, if any, is included in securities lending income (including from affiliate) (net of fees and rebates) on the Statement of Operations.
In a securities lending transaction, the net asset value of the Fund is affected by an increase or decrease in the value of the securities loaned and by an increase or decrease in the value of the instrument in which collateral is invested. The amount of securities lending activity undertaken by the Fund fluctuates from time to time. The Fund has the right under the lending agreement to recover the securities from the borrower on demand. In the event of default or bankruptcy by the borrower, the Fund may be prevented from recovering the loaned securities or gaining access to the collateral or may experience delays or costs in doing so. In such an event, the terms of the agreement allow the unaffiliated securities lending agent to use the collateral to purchase replacement securities on behalf of the Fund or pay the Fund the market value of the loaned securities. The Fund bears the risk of loss with respect to depreciation of its investment of the cash collateral.
Security transactions and income recognition
Securities transactions are recorded on a trade date basis. Realized gains or losses are recorded on the basis of identified cost.
Dividend income is recognized on the ex-dividend date.
Distributions to shareholders
Distributions to shareholders from net investment income and any net realized gains are recorded on the ex-dividend date and paid at least annually. Such distributions are determined in accordance with income tax regulations and may differ from U.S. generally accepted accounting principles. Dividend sources are estimated at the time of declaration. The tax character of distributions is determined as of the Fund's fiscal year end. Therefore, a portion of the Fund's distributions made prior to the Fund’s fiscal year end may be categorized as a tax return of capital at year end.
Federal and other taxes
The Fund intends to continue to qualify as a regulated investment company by distributing substantially all of its investment company taxable income and any net realized capital gains (after reduction for capital loss carryforwards) sufficient to relieve it from all, or substantially all, federal income taxes. Accordingly, no provision for federal income taxes was required.
The Fund’s income and federal excise tax returns and all financial records supporting those returns for the prior three fiscal years are subject to examination by the federal and Delaware revenue authorities. Management has analyzed the Fund's tax positions taken on federal, state, and foreign tax returns for all open tax years and does not believe that there are any uncertain tax positions that require recognition of a tax liability.
As of March 31, 2022, the aggregate cost of all investments for federal income tax purposes was $1,647,877,845 and the unrealized gains (losses) consisted of:
| Gross unrealized gains | $ 602,595,618 |
| Gross unrealized losses | (266,767,517) |
| Net unrealized gains | $ 335,828,101 |
Class allocations
The separate classes of shares offered by the Fund differ principally in applicable sales charges, distribution, shareholder servicing, and administration fees. Class specific expenses are charged directly to that share class. Investment income, common fund-level expenses, and realized and unrealized gains (losses) on investments are allocated daily to each class of shares based on the relative proportion of net assets of each class.
22 | Allspring Discovery SMID Cap Growth Fund
Notes to financial statements (unaudited)
3. FAIR VALUATION MEASUREMENTS
Fair value measurements of investments are determined within a framework that has established a fair value hierarchy based upon the various data inputs utilized in determining the value of the Fund’s investments. The three-level hierarchy gives the highest priority to unadjusted quoted prices in active markets for identical assets or liabilities (Level 1) and the lowest priority to unobservable inputs (Level 3). The Fund’s investments are classified within the fair value hierarchy based on the lowest level of input that is significant to the fair value measurement. The inputs are summarized into three broad levels as follows:
| ■ | Level 1 – quoted prices in active markets for identical securities |
| ■ | Level 2 – other significant observable inputs (including quoted prices for similar securities, interest rates, prepayment speeds, credit risk, etc.) |
| ■ | Level 3 – significant unobservable inputs (including the Fund’s own assumptions in determining the fair value of investments) |
The inputs or methodologies used for valuing investments in securities are not necessarily an indication of the risk associated with investing in those securities.
The following is a summary of the inputs used in valuing the Fund’s assets and liabilities as of March 31, 2022:
| | Quoted prices
(Level 1) | Other significant
observable inputs
(Level 2) | Significant
unobservable inputs
(Level 3) | Total |
| Assets | | | | |
| Investments in: | | | | |
| Common stocks | | | | |
| Communication services | $ 126,228,993 | $0 | $0 | $ 126,228,993 |
| Consumer discretionary | 216,303,514 | 0 | 0 | 216,303,514 |
| Financials | 74,802,905 | 0 | 0 | 74,802,905 |
| Health care | 520,488,232 | 0 | 0 | 520,488,232 |
| Industrials | 272,214,257 | 0 | 0 | 272,214,257 |
| Information technology | 636,336,864 | 0 | 0 | 636,336,864 |
| Real estate | 62,444,273 | 0 | 0 | 62,444,273 |
| Short-term investments | | | | |
| Investment companies | 74,886,908 | 0 | 0 | 74,886,908 |
| Total assets | $1,983,705,946 | $0 | $0 | $1,983,705,946 |
Additional sector, industry or geographic detail, if any, is included in the Portfolio of Investments.
For the six months ended March 31, 2022, the Fund did not have any transfers into/out of Level 3.
4. TRANSACTIONS WITH AFFILIATES
Management fee
Allspring Funds Management, a wholly owned subsidiary of Allspring Global Investments Holdings, LLC, a holding company indirectly owned by certain private funds of GTCR LLC and Reverence Capital Partners, L.P., is the manager of the Fund and provides advisory and fund-level administrative services under an investment management agreement. Under the investment management agreement, Allspring Funds Management is responsible for, among other services, implementing the investment objectives and strategies of the Fund, supervising the subadviser and providing fund-level administrative services in connection with the Fund’s operations. As compensation for its services under the investment management agreement, Allspring Funds Management is entitled to receive a management fee at the following annual rate based on the Fund’s average daily net assets:
Allspring Discovery SMID Cap Growth Fund | 23
Notes to financial statements (unaudited)
| Average daily net assets | Management fee |
| First $500 million | 0.800% |
| Next $500 million | 0.750 |
| Next $1 billion | 0.700 |
| Next $2 billion | 0.675 |
| Next $1 billion | 0.650 |
| Next $5 billion | 0.640 |
| Over $10 billion | 0.630 |
For the six months ended March 31, 2022, the management fee was equivalent to an annual rate of 0.73% of the Fund’s average daily net assets.
Allspring Funds Management has retained the services of a subadviser to provide daily portfolio management to the Fund. The fee for subadvisory services is borne by Allspring Funds Management. Allspring Global Investments, LLC ("Allspring Investments"), an affiliate of Allspring Funds Management and a wholly owned subsidiary of Allspring Global Investments Holdings, LLC, is the subadviser to the Fund and is entitled to receive a fee from Allspring Funds Management at an annual rate starting at 0.45% and declining to 0.35% as the average daily net assets of the Fund increase.
Administration fees
Under a class-level administration agreement, Allspring Funds Management provides class-level administrative services to the Fund, which includes paying fees and expenses for services provided by the transfer agent, sub-transfer agents, omnibus account servicers and record-keepers. As compensation for its services under the class-level administration agreement, Allspring Funds Management receives an annual fee which is calculated based on the average daily net assets of each class as follows:
| | Class-level
administration fee |
| Class A | 0.21% |
| Class C | 0.21 |
| Class R6 | 0.03 |
| Administrator Class | 0.13 |
| Institutional Class | 0.13 |
Waivers and/or expense reimbursements
Allspring Funds Management has contractually committed to waive and/or reimburse management and administration fees to the extent necessary to maintain certain net operating expense ratios for the Fund. When each class of the Fund has exceeded its expense cap, Allspring Funds Management will waive fees and/or reimburse expenses from fund-level expenses on a proportionate basis and then from class specific expenses. When only certain classes exceed their expense caps, waivers and/or reimbursements are applied against class specific expenses before fund-level expenses. Allspring Funds Management has contractually committed through January 31, 2023 to waive fees and/or reimburse expenses to the extent necessary to cap expenses. Prior to or after the commitment expiration date, the caps may be increased or the commitment to maintain the caps may be terminated only with the approval of the Board of Trustees. As of March 31, 2022, the contractual expense caps are as follows:
| | Expense ratio caps |
| Class A | 1.22% |
| Class C | 1.97 |
| Class R6 | 0.79 |
| Administrator Class | 1.14 |
| Institutional Class | 0.89 |
24 | Allspring Discovery SMID Cap Growth Fund
Notes to financial statements (unaudited)
Distribution fee
The Trust has adopted a distribution plan for Class C shares of the Fund pursuant to Rule 12b-1 under the 1940 Act. A distribution fee is charged to Class C shares and paid to Allspring Funds Distributor, LLC ("Allspring Funds Distributor"), the principal underwriter, an affiliate of Allspring Funds Management, at an annual rate of 0.75% of the average daily net assets of Class C shares.
In addition, Allspring Funds Distributor is entitled to receive the front-end sales charge from the purchase of Class A shares and a contingent deferred sales charge on the redemption of certain Class A shares. Allspring Funds Distributor is also entitled to receive the contingent deferred sales charges from redemptions of Class C shares. For the six months ended March 31, 2022, Allspring Funds Distributor received $5,260 from the sale of Class A shares and $11 in contingent deferred sales charges from redemptions of Class C shares. No contingent deferred sales charges were incurred by Class A shares for the six months ended March 31, 2022.
Shareholder servicing fees
The Trust has entered into contracts with one or more shareholder servicing agents, whereby Class A, Class C and Administrator Class of the Fund are charged a fee at an annual rate of 0.25% of the average daily net assets of each respective class. A portion of these total shareholder servicing fees were paid to affiliates, and to certain entities that were affiliates of the Fund until November 1, 2021.
Interfund transactions
The Fund may purchase or sell portfolio investment securities to certain affiliates pursuant to Rule 17a-7 under the 1940 Act and under procedures adopted by the Board of Trustees. The procedures have been designed to ensure that these interfund transactions, which do not incur broker commissions, are effected at current market prices.
5. INVESTMENT PORTFOLIO TRANSACTIONS
Purchases and sales of investments, excluding U.S. government obligations (if any) and short-term securities, for the six months ended March 31, 2022 were $813,208,471 and $1,129,749,076, respectively.
6. SECURITIES LENDING TRANSACTIONS
The Fund lends its securities through an unaffiliated securities lending agent and receives collateral in the form of cash or securities with a value at least equal to the value of the securities on loan. The value of the loaned securities is determined at the close of each business day and any increases or decreases in the required collateral are exchanged between the Fund and the counterparty on the next business day. Cash collateral received is invested in the Securities Lending Fund which seeks to provide a positive return compared to the daily Federal Funds Open Rate by investing in high-quality, U.S. dollar-denominated short-term money market instruments and is exempt from registration under Section 3(c)(7) of the 1940 Act. Securities Lending Fund is managed by Allspring Funds Management and is subadvised by Allspring Investments. Allspring Funds Management receives an advisory fee starting at 0.05% and declining to 0.01% as the average daily net assets of the Securities Lending Fund increase. All of the fees received by Allspring Funds Management are paid to Allspring Investments for its services as subadviser.
In the event of counterparty default or the failure of a borrower to return a loaned security, the Fund has the right to use the collateral to offset any losses incurred. As of March 31, 2022, the Fund had securities lending transactions with the following counterparties which are subject to offset:
| Counterparty | Value of
securities on
loan | Collateral
received1 | Net amount |
| Bank of America Securities Incorporated | $ 364,597 | $ (364,597) | $0 |
| Citigroup Global Markets Incorporated | 18,434,444 | (18,434,444) | 0 |
1 Collateral received within this table is limited to the collateral for the net transaction with the counterparty.
7. BANK BORROWINGS
The Trust (excluding the money market funds), Allspring Master Trust and Allspring Variable Trust are parties to a $350,000,000 revolving credit agreement whereby the Fund is permitted to use bank borrowings for temporary or emergency purposes, such as to fund shareholder redemption requests. Interest under the credit agreement is charged to the Fund based
Allspring Discovery SMID Cap Growth Fund | 25
Notes to financial statements (unaudited)
on a borrowing rate equal to the higher of the Federal Funds rate in effect on that day plus 1.25% or the overnight bank funding rate in effect on that day plus 1.25%. In addition, an annual commitment fee equal to 0.25% of the unused balance is allocated to each participating fund.
For the six months ended March 31, 2022, there were no borrowings by the Fund under the agreement.
8. CONCENTRATION RISKS
As of the end of the period, the Fund concentrated its portfolio of investments in the health care and information technology sectors. A fund that invests a substantial portion of its assets in any sector may be more affected by changes in that sector than would be a fund whose investments are not heavily weighted in any sector.
9. INDEMNIFICATION
Under the Fund's organizational documents, the officers and Trustees have been granted certain indemnification rights against certain liabilities that may arise out of performance of their duties to the Fund. The Fund has entered into a separate agreement with each Trustee that converts indemnification rights currently existing under the Fund’s organizational documents into contractual rights that cannot be changed in the future without the consent of the Trustee. Additionally, in the normal course of business, the Fund may enter into contracts with service providers that contain a variety of indemnification clauses. The Fund’s maximum exposure under these arrangements is dependent on future claims that may be made against the Fund and, therefore, cannot be estimated.
10. CORONAVIRUS (COVID-19) PANDEMIC
On March 11, 2020, the World Health Organization announced that it had made the assessment that coronavirus disease 2019 (“COVID-19”) is a pandemic. The impacts of COVID-19 are affecting the entire global economy, individual companies and investment products, the funds, and the market in general. There is significant uncertainty around the extent and duration of business disruptions related to COVID-19 and the impacts may last for an extended period of time. COVID-19 has led to significant uncertainty and volatility in the financial markets.
26 | Allspring Discovery SMID Cap Growth Fund
Other information (unaudited)
PROXY VOTING INFORMATION
A description of the policies and procedures used to determine how to vote proxies relating to portfolio securities is available without charge, upon request, by calling 1-800-222-8222, visiting our website at allspringglobal.com, or visiting the SEC website at sec.gov. Information regarding how the proxies related to portfolio securities were voted during the most recent 12-month period ended June 30 is available on the website at allspringglobal.com or by visiting the SEC website at sec.gov.
QUARTERLY PORTFOLIO HOLDINGS INFORMATION
The Fund files its complete schedule of portfolio holdings with the SEC for the first and third quarters of each fiscal year as an exhibit to its reports on Form N-PORT. Shareholders may view the filed Form N-PORT by visiting the SEC website at sec.gov.
Allspring Discovery SMID Cap Growth Fund | 27
Other information (unaudited)
BOARD OF TRUSTEES AND OFFICERS
Each of the Trustees and Officers listed in the table below acts in identical capacities for each fund in the Allspring family of funds, which consists of 138 mutual funds comprising the Allspring Funds Trust, Allspring Variable Trust, Allspring Master Trust and four closed-end funds (collectively the “Fund Complex”). This table should be read in conjunction with the Prospectus and the Statement of Additional Information1. The mailing address of each Trustee and Officer is 525 Market Street, 12th Floor, San Francisco, CA 94105. Each Trustee and Officer serves an indefinite term, however, each Trustee serves such term until reaching the mandatory retirement age established by the Trustees.
Independent Trustees
Name and
year of birth | Position held and
length of service* | Principal occupations during past five years or longer | Current other
public company or
investment
company
directorships |
William R. Ebsworth
(Born 1957) | Trustee,
since 2015 | Retired. From 1984 to 2013, equities analyst, portfolio manager, research director and chief investment officer at Fidelity Management and Research Company in Boston, Tokyo, and Hong Kong, and retired in 2013 as Chief Investment Officer of Fidelity Strategic Advisers, Inc. where he led a team of investment professionals managing client assets. Prior thereto, Board member of Hong Kong Securities Clearing Co., Hong Kong Options Clearing Corp., the Thailand International Fund, Ltd., Fidelity Investments Life Insurance Company, and Empire Fidelity Investments Life Insurance Company. Audit Committee Chair and Investment Committee Chair of the Vincent Memorial Hospital Endowment (non-profit organization). Mr. Ebsworth is a CFA® charterholder. | N/A |
Jane A. Freeman
(Born 1953) | Trustee,
since 2015;
Chair Liaison,
since 2018 | Retired. From 2012 to 2014 and 1999 to 2008, Chief Financial Officer of Scientific Learning Corporation. From 2008 to 2012, Ms. Freeman provided consulting services related to strategic business projects. Prior to 1999, Portfolio Manager at Rockefeller & Co. and Scudder, Stevens & Clark. Board member of the Harding Loevner Funds from 1996 to 2014, serving as both Lead Independent Director and chair of the Audit Committee. Board member of the Russell Exchange Traded Funds Trust from 2011 to 2012 and the chair of the Audit Committee. Ms. Freeman is also an inactive Chartered Financial Analyst. | N/A |
Isaiah Harris, Jr.
(Born 1952) | Trustee,
since 2009; Audit
Committee
Chair,
since 2019 | Retired. Chairman of the Board of CIGNA Corporation from 2009 to 2021, and Director from 2005 to 2008. From 2003 to 2011, Director of Deluxe Corporation. Prior thereto, President and CEO of BellSouth Advertising and Publishing Corp. from 2005 to 2007, President and CEO of BellSouth Enterprises from 2004 to 2005 and President of BellSouth Consumer Services from 2000 to 2003. Emeritus member of the Iowa State University Foundation Board of Governors. Emeritus Member of the Advisory Board of Iowa State University School of Business. Advisory Board Member, Palm Harbor Academy (private school). Advisory Board Member, Fellowship of Christian Athletes. Mr. Harris is a certified public accountant (inactive status). | N/A |
David F. Larcker
(Born 1950) | Trustee,
since 2009 | James Irvin Miller Professor of Accounting at the Graduate School of Business (Emeritus), Stanford University, Director of the Corporate Governance Research Initiative and Senior Faculty of The Rock Center for Corporate Governance since 2006. From 2005 to 2008, Professor of Accounting at the Graduate School of Business, Stanford University. Prior thereto, Ernst & Young Professor of Accounting at The Wharton School, University of Pennsylvania from 1985 to 2005. | N/A |
28 | Allspring Discovery SMID Cap Growth Fund
Other information (unaudited)
Name and
year of birth | Position held and
length of service* | Principal occupations during past five years or longer | Current other
public company or
investment
company
directorships |
Olivia S. Mitchell
(Born 1953) | Trustee,
since 2006;
Nominating and
Governance
Committee Chair,
since 2018 | International Foundation of Employee Benefit Plans Professor since 1993, Wharton School of the University of Pennsylvania. Director of Wharton’s Pension Research Council and Boettner Center on Pensions & Retirement Research, and Research Associate at the National Bureau of Economic Research. Previously taught at Cornell University from 1978 to 1993. | N/A |
Timothy J. Penny
(Born 1951) | Trustee,
since 1996;
Chair,
since 2018 | President and Chief Executive Officer of Southern Minnesota Initiative Foundation, a non-profit organization, since 2007. Member of the Board of Trustees of NorthStar Education Finance, Inc., a non-profit organization, since 2007. | N/A |
James G. Polisson
(Born 1959) | Trustee,
since 2018 | Retired. Chief Marketing Officer, Source (ETF) UK Services, Ltd, from 2015 to 2017. From 2012 to 2015, Principal of The Polisson Group, LLC, a management consulting, corporate advisory and principal investing company. Chief Executive Officer and Managing Director at Russell Investments, Global Exchange Traded Funds from 2010 to 2012. Managing Director of Barclays Global Investors from 1998 to 2010 and Global Chief Marketing Officer for iShares and Barclays Global Investors from 2000 to 2010. Trustee of the San Francisco Mechanics’ Institute, a non-profit organization, from 2013 to 2015. Board member of the Russell Exchange Traded Fund Trust from 2011 to 2012. Director of Barclays Global Investors Holdings Deutschland GmbH from 2006 to 2009. Mr. Polisson is an attorney and has a retired status with the Massachusetts and District of Columbia Bar Associations. | N/A |
Pamela Wheelock
(Born 1959) | Trustee,
since January
2020; previously
Trustee from
January 2018 to
July 2019 | Board member of the Destination Medical Center Economic Development Agency, Rochester, Minnesota since 2019. Interim President of the McKnight Foundation from January to September 2020. McKnight Foundation Consultant, November 2020 to February 2021. Acting Commissioner, Minnesota Department of Human Services, July 2019 through September 2019. Consultant (part-time), Minnesota Department of Human Services, October 2019 through December 2019. Chief Operating Officer, Twin Cities Habitat for Humanity from 2017 to 2019. Vice President of University Services, University of Minnesota from 2012 to 2016. Prior thereto, on the Board of Directors, Governance Committee and Finance Committee for the Minnesota Philanthropy Partners (Saint Paul Foundation) from 2012 to 2018, Interim Chief Executive Officer of Blue Cross Blue Shield of Minnesota from 2011 to 2012, Chairman of the Board from 2009 to 2012 and Board Director from 2003 to 2015. Vice President, Leadership and Community Engagement, Bush Foundation, Saint Paul, Minnesota (a private foundation) from 2009 to 2011. Executive Vice President and Chief Financial Officer, Minnesota Sports and Entertainment from 2004 to 2009 and Senior Vice President from 2002 to 2004. Executive Vice President of the Minnesota Wild Foundation from 2004 to 2008. Commissioner of Finance, State of Minnesota, from 1999 to 2002. Currently Board Chair of the Minnesota Wild Foundation since 2010. | N/A |
* Length of service dates reflect the Trustee’s commencement of service with the Trust’s predecessor entities, where applicable.
Allspring Discovery SMID Cap Growth Fund | 29
Other information (unaudited)
Officers2
Name and
year of birth | Position held and
length of service | Principal occupations during past five years or longer |
Andrew Owen
(Born 1960) | President,
since 2017 | President, Chief Executive Officer and Director of Allspring Funds Management, LLC since 2017 and co-president of Galliard Capital Management, LLC, an affiliate of Allspring Funds Management, LLC, since 2019. Prior thereto, Head of Affiliated Managers, Allspring Global Investments, from 2014 to 2019 and Executive Vice President responsible for marketing, investments and product development for Allspring Funds Management, LLC, from 2009 to 2014. In addition, Mr. Owen was an Executive Vice President of Wells Fargo & Company from 2014 to 2021. |
Jeremy DePalma
(Born 1974) | Treasurer,
since 2012
(for certain funds in
the Fund Complex);
since 2021 (for
the remaining funds in the
Fund Complex) | Senior Vice President of Allspring Funds Management, LLC since 2009. Senior Vice President of Evergreen Investment Management Company, LLC from 2008 to 2010 and head of the Fund Reporting and Control Team within Fund Administration from 2005 to 2010. |
Kate McKinley
(Born 1977) | Chief Legal Officer,
since 2021 | Chief Legal Officer of Allspring Global Investments since 2021. Prior thereto, held various roles at State Street Global Advisors beginning in 2010, including serving as Senior Vice President and General Counsel from 2019 to 2021, and Chief Operating Officer of the Institutional Client Group from 2016 - 2019. Prior to working at State Street Global Advisors served as Assistant General Counsel for Bank of America Corporation from 2005 to 2010 and as an Associate at WilmerHale from 2002 to 2005. |
Christopher Baker
(Born 1976) | Chief Compliance Officer, since 2022 | Global Chief Compliance Officer for Allspring Global Investments since 2022. Prior thereto, Chief Compliance Officer for State Street Global Advisors from 2018 to 2021. Senior Compliance Officer for the State Street divisions of Alternative Investment Solutions, Sector Solutions, and Global Marketing from 2015 to 2018. From 2010 to 2015 Vice President, Global Head of Investment and Marketing Compliance for State Street Global Advisors. |
Matthew Prasse
(Born 1983) | Secretary,
since 2021 | Senior Counsel of the Allspring Legal Department since 2021. Senior Counsel of the Wells Fargo Legal Department from 2018 to 2021. Previously, Counsel for Barings LLC from 2015 to 2018. Prior to joining Barings, Associate at Morgan, Lewis & Bockius LLP from 2008 to 2015. |
1 The Statement of Additional Information includes additional information about the Trustees and is available, without charge, upon request, by calling 1-800-222-8222 or by visiting the website at allspringglobal.com.
2 For those Officers with tenures at Allspring Global Investments and/or Allspring Funds Management, LLC that began prior to 2021, such tenures include years of service during which these businesses/entities were known as Wells Fargo Asset Management and Wells Fargo Funds Management, LLC, respectively.
30 | Allspring Discovery SMID Cap Growth Fund
For more information
More information about Allspring Funds is available free upon request. To obtain literature, please write, visit the Fund's website, or call:
Allspring Funds
P.O. Box 219967
Kansas City, MO 64121-9967
Website: allspringglobal.com
Individual investors: 1-800-222-8222
Retail investment professionals: 1-888-877-9275
Institutional investment professionals: 1-800-260-5969
This report and the financial statements contained herein are submitted for the general information of the shareholders of the Fund. If this report is used for promotional purposes, distribution of the report must be accompanied or preceded by a current prospectus. Before investing, please consider the investment objectives, risks, charges, and expenses of the investment. For a current prospectus and, if available, a summary prospectus, containing this information, call
1-800-222-8222 or visit the Fund's website at allspringglobal.com. Read the prospectus carefully before you invest or send money.
Allspring Global InvestmentsTM is the trade name for the asset management firms of Allspring Global Investments Holdings, LLC, a holding company indirectly owned by certain private funds of GTCR LLC and Reverence Capital Partners, L.P. These firms include but are not limited to Allspring Global Investments, LLC, and Allspring Funds Management, LLC. Certain products managed by Allspring entities are distributed by Allspring Funds Distributor, LLC (a broker-dealer and Member FINRA/SIPC).
This material is for general informational and educational purposes only and is NOT intended to provide investment advice or a recommendation of any kind - including a recommendation for any specific investment, strategy, or plan.
© 2022 Allspring Global Investments Holdings, LLC. All rights reserved.
PAR-0522-00055 05-22
SA230/SAR230 03-22
Semi-Annual Report
March 31, 2022
Allspring
Discovery Mid Cap Growth Fund
(formerly, Allspring Enterprise Fund)
The views expressed and any forward-looking statements are as of March 31, 2022, unless otherwise noted, and are those of the Fund's portfolio managers and/or Allspring Global Investments. Discussions of individual securities or the markets generally are not intended as individual recommendations. Future events or results may vary significantly from those expressed in any forward-looking statements. The views expressed are subject to change at any time in response to changing circumstances in the market. Allspring Global Investments disclaims any obligation to publicly update or revise any views expressed or forward-looking statements.
Allspring Discovery Mid Cap Growth Fund | 1
Letter to shareholders (unaudited)
Andrew Owen
President
Allspring Funds
Dear Shareholder:
We are pleased to offer you this semi-annual report for Allspring Discovery Mid Cap Growth Fund for the six-month period that ended March 31, 2022. Global stocks and bonds broadly declined during a challenging period. Despite progress on a global economic recovery from COVID-19, persistently high inflation, concerns regarding anticipated tightening of central bank monetary policy, and turmoil caused by the Russian invasion of Ukraine all led to a retreat from financial market gains made earlier in 2021. Among major indexes, the U.S. large-cap-dominated S&P 500 Index was an exception in escaping a half-year loss.
For the six-month period, U.S. stocks, based on the S&P 500 Index,1 gained 5.92%. International stocks, as measured by the MSCI ACWI ex USA Index (Net),2 returned -3.72%, while the MSCI EM Index (Net) (USD),3 trailed both developed market benchmarks with a return of -8.20%. The Bloomberg U.S. Aggregate Bond Index,4returned -5.92%, the Bloomberg Global Aggregate ex-USD Index (unhedged),5 returned -7.26%, the Bloomberg Municipal Bond Index6 returned -5.55%, and the ICE BofA U.S. High Yield Index,7 lost 3.89%.
Inflationary concerns and the Russian-Ukraine war caused markets to retreat.
Elevated inflation pressures and the ongoing global supply bottleneck continued in October, but strong corporate earnings provided a bright spot in the U.S., the eurozone, and many Asian countries. Government bond yields rose globally as central banks prepared to tighten monetary policy. Commodity prices continued to rise, driven by sharply higher energy costs.
In November, as COVID-19 hospitalizations rose, most major global asset classes declined. Two exceptions were U.S. investment-grade bonds and Treasury Inflation-Protected Securities. President Biden signed a long-awaited $550 billion infrastructure bill to upgrade U.S. roads, bridges, and railways. Meanwhile, the Consumer Price Index8, a measure of domestic inflation conditions, jumped to its highest level in 31 years. While the threat of consistently high inflation led the U.S. Federal Reserve (Fed) to discuss a faster pace of tapering, the Omicron strain created uncertainty. Commodities lost ground for the month, driven by sharp declines in oil prices (and energy costs in general) as well as precious metals.
“Elevated inflation pressures and the ongoing global supply bottleneck continued in October, but strong corporate earnings provided a bright spot in the U.S., the eurozone, and many Asian countries.”
| 1 | The S&P 500 Index consists of 500 stocks chosen for market size, liquidity, and industry group representation. It is a market-value-weighted index with each stock's weight in the index proportionate to its market value. You cannot invest directly in an index. |
| 2 | The Morgan Stanley Capital International (MSCI) All Country World Index (ACWI) ex USA Index (Net) is a free-float-adjusted market-capitalization-weighted index that is designed to measure the equity market performance of developed and emerging markets, excluding the U.S. Source: MSCI. MSCI makes no express or implied warranties or representations and shall have no liability whatsoever with respect to any MSCI data contained herein. The MSCI data may not be further redistributed or used as a basis for other indexes or any securities or financial products. This report is not approved, reviewed, or produced by MSCI. You cannot invest directly in an index. |
| 3 | The MSCI Emerging Markets (EM) Index (Net) (USD) is a free-float-adjusted market-capitalization-weighted index that is designed to measure equity market performance of emerging markets. You cannot invest directly in an index. |
| 4 | The Bloomberg U.S. Aggregate Bond Index is a broad-based benchmark that measures the investment-grade, U.S.-dollar-denominated, fixed-rate taxable bond market, including Treasuries, government-related and corporate securities, mortgage-backed securities (agency fixed-rate and hybrid adjustable-rate mortgage pass-throughs), asset-backed securities, and commercial mortgage-backed securities. You cannot invest directly in an index. |
| 5 | The Bloomberg Global Aggregate ex-USD Index (unhedged) is an unmanaged index that provides a broad-based measure of the global investment-grade fixed-income markets excluding the U.S.-dollar-denominated debt market. You cannot invest directly in an index. |
| 6 | The Bloomberg Municipal Bond Index is an unmanaged index composed of long-term tax-exempt bonds with a minimum credit rating of Baa. You cannot invest directly in an index. |
| 7 | The ICE BofA U.S. High Yield Index is a market-capitalization-weighted index of domestic and Yankee high-yield bonds. The index tracks the performance of high-yield securities traded in the U.S. bond market. You cannot invest directly in an index. Copyright 2022. ICE Data Indices, LLC. All rights reserved. |
| 8 | The Consumer Price Index (CPI) is a measure of the average change over time in the prices paid by urban consumers for a market basket of consumer goods and services. You cannot invest directly in an index. |
2 | Allspring Discovery Mid Cap Growth Fund
Letter to shareholders (unaudited)
Global volatility lessened in December as data indicated a lower risk of severe disease and death from the Omicron variant. Even so, several countries introduced restrictions on travel and hospitality, among other sectors, in an effort to reduce the spread. In the U.S., data indicated a stable economy overall, with robust corporate earnings. Consumer spending potential looked strong heading into 2022 on elevated household savings and the lowest household debt ratio since 1973. U.S. corporate and high-yield bonds had monthly gains while Treasuries declined. Bonds were strongly affected by the projection of three 25-basis-point (bp; 100 bps equal 1.00%) policy rate hikes in 2022 by senior Federal Open Market Committee members, up from previous projections of just one hike.
In January 2022, the main focus was on potential U.S. interest rate hikes and the Russia-Ukraine conflict. The Fed hinted that a March interest rate hike was likely. Meanwhile, Russia threatened a potential invasion of Ukraine, which could disrupt Russia’s massive energy supplies and drive demand from non-Russian oil-producing countries. Elsewhere overseas, Europe saw food and energy prices spike, leading to rising inflation. Within fixed income, corporate bonds struggled in January, underperforming government bonds, as investors focused on continued elevated inflation and ongoing uncertainty over the U.S. monetary path.
The Russian invasion of Ukraine dominated the financial world in February and March. Equity, bond, and commodities markets were shaken by fear, uncertainty, and an upending of demand-supply dynamics. Major global stock indexes were down in February, along with global bonds overall, with ongoing high levels of volatility in March along with mixed results that favored U.S. large-cap stocks. Prices of commodities spiked, including crude oil, natural gas, wheat, and precious metals, on elevated concerns of supply shortages. All of this fed already-high inflation concerns and added to expectations of more aggressive central bank interest rate hikes. Sweeping sanctions against Russia and corporate pullouts contributed to market volatility. Despite the geopolitical turmoil, the U.S. economic outlook remained largely unchanged, with a healthy job market and signs of economic resilience accompanying higher prices.
Don’t let short-term uncertainty derail long-term investment goals.
Periods of investment uncertainty can present challenges, but experience has taught us that maintaining long-term investment goals can be an effective way to plan for the future. To help you create a sound strategy based on your personal goals and risk tolerance, Allspring Funds offers more than 100 mutual funds spanning a wide range of asset classes and investment styles. Although diversification cannot guarantee an investment profit or prevent losses, we believe it can be an effective way to manage investment risk and potentially smooth out overall portfolio performance. We encourage investors to know their investments and to understand that appropriate levels of risk-taking may unlock opportunities.
Information on transaction closing.
On November 1, 2021, GTCR LLC and Reverence Capital Partners, L.P. announced the beginning of Allspring Global Investments™ with the close of the transaction to acquire Wells Fargo Funds Management, LLC; Wells Capital Management LLC; Galliard Capital Management LLC.; Wells Fargo Asset Management (International) Ltd.; Wells Fargo Asset Management Luxembourg S.A.; and Wells Fargo Funds Distributor, LLC, as well as Wells Fargo Bank, N.A.’s business of acting as trustee to its collective investment trusts and all related Wells Fargo Asset Management legal entities. The transaction closed on November 1, 2021, forming Allspring Global Investments, a privately held asset management firm with $451 billion in AUM1 as of March 31, 2022.
“ The Russian invasion of Ukraine dominated the financial world in February and March. Equity, bond, and commodities markets were shaken by fear, uncertainty, and an upending of demand-supply dynamics.”
| 1 | Figures are as of March 31, 2022, unless otherwise noted. Please note that the assets under management figures provided have been adjusted to eliminate any duplication of reporting among assets directed by multiple investment teams and includes $91.2B from Galliard Capital Management ($74.7B stable value; $16.5B fixed income), an investment advisor that is not part of the Allspring trade name/GIPS firm. |
Allspring Discovery Mid Cap Growth Fund | 3
Letter to shareholders (unaudited)
For further information about your Fund, contact your investment professional, visit our website at allspringglobal.com, or call us directly at 1-800-222-8222. |
Allspring Global Investments™ is a leading independent asset management firm with a full breadth of investment capabilities across diverse asset classes, serving the needs of its institutional and wealth management clients around the world. Allspring operates across 18 offices globally supported by more than 480 investment professionals. Allspring and its investment teams provide a broad range of differentiated investment products and solutions to help its diverse range of clients meet their investment objectives.
As part of this transition, all mutual funds within the Wells Fargo Funds family were rebranded as Allspring Funds. Each individual fund had “Wells Fargo” removed from its fund name and replaced with “Allspring.” The fund name changes went into effect on December 6, 2021.
Allspring Global Investments™ is the trade name for the asset management firm of Allspring Global Investments Holdings, LLC, a holding company indirectly owned by certain private funds of GTCR LLC and Reverence Capital Partners, L.P.
Thank you for choosing to invest with Allspring Funds. We appreciate your confidence in us and remain committed to helping you meet your financial needs.
Sincerely,
Andrew Owen
President
Allspring Funds
Notice to Shareholders
Russia launched a large-scale invasion of Ukraine on February 24, 2022. As a result of this military action, the United States and many other countries have instituted various economic sanctions against Russian and Belarus individuals and entities. The situation has led to increased financial market volatility and could have severe adverse effects on regional and global economic markets, including the markets for certain securities and commodities, such as oil and natural gas. The extent and duration of the military action, resulting sanctions imposed, other punitive action taken and the resulting market disruptions cannot be easily predicted.
Our solidarity and support goes out to our impacted employees and the people affected in Ukraine and their families. Allspring has a dedicated team of investment professionals actively monitoring the situation for any new developments and the potential impact to our clients and investment products. As the situation remains fluid, we are focused on the assessment of risks, valuation, and liquidity of impacted securities. Please visit our website at allspringglobal.com and click on “Russia-Ukraine Portfolio Impacts” for further information.
Notice to Shareholders
At a meeting held February 23-24, 2022, the Board of Trustees of the Allspring Funds approved changing the name of the Fund from Allspring Enterprise Fund to Allspring Discovery Mid Cap Growth Fund which became effective on May 2, 2022. There was no change to the Fund’s investment process because of the name change.
4 | Allspring Discovery Mid Cap Growth Fund
This page is intentionally left blank.
Performance highlights (unaudited)
| Investment objective | The Fund seeks long-term capital appreciation. |
| Manager | Allspring Funds Management, LLC |
| Subadviser | Allspring Global Investments, LLC |
| Portfolio managers | Michael T. Smith, CFA®‡, Christopher J. Warner, CFA®‡ |
| Average annual total returns (%) as of March 31, 2022 |
| | | Including sales charge | | Excluding sales charge | | Expense ratios1 (%) |
| | Inception date | 1 year | 5 year | 10 year | | 1 year | 5 year | 10 year | | Gross | Net 2 |
| Class A (SENAX) | 2-24-2000 | -17.09 | 14.09 | 11.90 | | -12.03 | 15.45 | 12.57 | | 1.21 | 1.18 |
| Class C (WENCX) | 3-31-2008 | -13.68 | 14.58 | 11.73 | | -12.68 | 14.58 | 11.73 | | 1.96 | 1.93 |
| Class R6 (WENRX)3 | 10-31-2014 | – | – | – | | -11.68 | 15.89 | 12.98 | | 0.78 | 0.78 |
| Administrator Class (SEPKX) | 8-30-2002 | – | – | – | | -11.96 | 15.54 | 12.67 | | 1.13 | 1.10 |
| Institutional Class (WFEIX) | 6-30-2003 | – | – | – | | -11.74 | 15.82 | 12.94 | | 0.88 | 0.85 |
| Russell Midcap® Growth Index4 | – | – | – | – | | -0.89 | 15.10 | 13.52 | | – | – |
Figures quoted represent past performance, which is no guarantee of future results, and do not reflect taxes that a shareholder may pay on an investment in a fund. Investment return and principal value of an investment will fluctuate so that an investor’s shares, when redeemed, may be worth more or less than their original cost. Performance shown without sales charges would be lower if sales charges were reflected. Current performance may be lower or higher than the performance data quoted, which assumes the reinvestment of dividends and capital gains. Current month-end performance is available on the Fund’s website, allspringglobal.com.
Index returns do not include transaction costs associated with buying and selling securities, any mutual fund fees or expenses, or any taxes. It is not possible to invest directly in an index.
For Class A shares, the maximum front-end sales charge is 5.75%. For Class C shares, the maximum contingent deferred sales charge is 1.00%. Performance including a contingent deferred sales charge assumes the sales charge for the corresponding time period. Class R6, Administrator Class and Institutional Class shares are sold without a front-end sales charge or contingent deferred sales charge.
| 1 | Reflects the expense ratios as stated in the most recent prospectuses. The expense ratios shown are subject to change and may differ from the annualized expense ratios shown in the financial highlights of this report. |
| 2 | The manager has contractually committed through January 31, 2023, to waive fees and/or reimburse expenses to the extent necessary to cap total annual fund operating expenses after fee waivers at 1.18% for Class A, 1.93% for Class C, 0.80% for Class R6, 1.10% for Administrator Class, and 0.85% for Institutional Class. Brokerage commissions, stamp duty fees, interest, taxes, acquired fund fees and expenses (if any), and extraordinary expenses are excluded from the expense caps. Prior to or after the commitment expiration date, the caps may be increased or the commitment to maintain the caps may be terminated only with the approval of the Board of Trustees. Without these caps, the Fund’s returns would have been lower. The expense ratio paid by an investor is the net expense ratio (the total annual fund operating expenses after fee waivers) as stated in the prospectuses. |
| 3 | Historical performance shown for the Class R6 shares prior to their inception reflects the performance of the Institutional Class shares, and includes the higher expenses applicable to the Institutional Class shares. If these expenses had not been included, returns for the Class R6 shares would be higher. |
| 4 | The Russell Midcap® Growth Index measures the performance of those Russell Midcap companies with higher price/book ratios and higher forecasted growth values. The stocks are also members of the Russell 1000® Growth index. You cannot invest directly in an index. |
Stock values fluctuate in response to the activities of individual companies and general market and economic conditions. Smaller-company stocks tend to be more volatile and less liquid than those of larger companies. Certain investment strategies tend to increase the total risk of an investment (relative to the broader market). This fund is exposed to foreign investment risk. Consult the Fund’s prospectus for additional information on these and other risks.
| ‡ | CFA® and Chartered Financial Analyst® are trademarks owned by CFA Institute. |
6 | Allspring Discovery Mid Cap Growth Fund
Performance highlights (unaudited)
| Ten largest holdings (%) as of March 31, 20221 |
| Cadence Design Systems Incorporated | 4.29 |
| DexCom Incorporated | 3.75 |
| Chipotle Mexican Grill Incorporated | 3.54 |
| Crowdstrike Holdings Incorporated Class A | 3.36 |
| MongoDB Incorporated | 3.18 |
| Bill.com Holdings Incorporated | 2.87 |
| Teledyne Technologies Incorporated | 2.86 |
| Datadog Incorporated Class A | 2.81 |
| Waste Connections Incorporated | 2.71 |
| Generac Holdings Incorporated | 2.37 |
| 1 | Figures represent the percentage of the Fund's net assets. Holdings are subject to change and may have changed since the date specified. |
| Sector allocation as of March 31, 20221 |
| 1 | Figures represent the percentage of the Fund's long-term investments. These amounts are subject to change and may have changed since the date specified. |
Allspring Discovery Mid Cap Growth Fund | 7
Fund expenses (unaudited)
As a shareholder of the Fund, you incur two types of costs: (1) transaction costs, including sales charges (loads) on purchase payments and contingent deferred sales charges (if any) on redemptions and (2) ongoing costs, including management fees, distribution (12b-1) and/or shareholder servicing fees, and other Fund expenses. This example is intended to help you understand your ongoing costs (in dollars) of investing in the Fund and to compare these costs with the ongoing costs of investing in other mutual funds.
The example is based on an investment of $1,000 invested at the beginning of the six-month period and held for the entire period from October 1, 2021 to March 31, 2022.
Actual expenses
The “Actual” line of the table below provides information about actual account values and actual expenses. You may use the information in this line, together with the amount you invested, to estimate the expenses that you paid over the period. Simply divide your account value by $1,000 (for example, an $8,600 account value divided by $1,000 = 8.6), then multiply the result by the number in the “Actual” line under the heading entitled “Expenses paid during period” for your applicable class of shares to estimate the expenses you paid on your account during this period.
Hypothetical example for comparison purposes
The “Hypothetical” line of the table below provides information about hypothetical account values and hypothetical expenses based on the Fund’s actual expense ratio and an assumed rate of return of 5% per year before expenses, which is not the Fund’s actual return. The hypothetical account values and expenses may not be used to estimate the actual ending account balance or expenses you paid for the period. You may use this information to compare the ongoing costs of investing in the Fund and other funds. To do so, compare this 5% hypothetical example with the 5% hypothetical examples that appear in the shareholder reports of the other funds.
Please note that the expenses shown in the table are meant to highlight your ongoing costs only and do not reflect any transactional costs, such as sales charges (loads) and contingent deferred sales charges. Therefore, the “Hypothetical” line of the table is useful in comparing ongoing costs only, and will not help you determine the relative total costs of owning different funds. In addition, if these transactional costs were included, your costs would have been higher.
| | Beginning
account value
10-1-2021 | Ending
account value
3-31-2022 | Expenses
paid during
the period1 | Annualized net
expense ratio |
| Class A | | | | |
| Actual | $1,000.00 | $ 794.42 | $5.19 | 1.16% |
| Hypothetical (5% return before expenses) | $1,000.00 | $1,019.15 | $5.84 | 1.16% |
| Class C | | | | |
| Actual | $1,000.00 | $ 791.45 | $8.62 | 1.93% |
| Hypothetical (5% return before expenses) | $1,000.00 | $1,015.31 | $9.70 | 1.93% |
| Class R6 | | | | |
| Actual | $1,000.00 | $ 795.97 | $3.54 | 0.79% |
| Hypothetical (5% return before expenses) | $1,000.00 | $1,020.99 | $3.98 | 0.79% |
| Administrator Class | | | | |
| Actual | $1,000.00 | $ 794.70 | $4.88 | 1.09% |
| Hypothetical (5% return before expenses) | $1,000.00 | $1,019.50 | $5.49 | 1.09% |
| Institutional Class | | | | |
| Actual | $1,000.00 | $ 795.62 | $3.81 | 0.85% |
| Hypothetical (5% return before expenses) | $1,000.00 | $1,020.69 | $4.28 | 0.85% |
1 Expenses paid is equal to the annualized net expense ratio of each class multiplied by the average account value over the period, multiplied by 182 divided by 365 (to reflect the one-half-year period).
8 | Allspring Discovery Mid Cap Growth Fund
Portfolio of investments—March 31, 2022 (unaudited)
| | | | | Shares | Value |
| Common stocks: 99.83% | | | | | |
| Communication services: 7.17% | | | | | |
| Entertainment: 2.74% | | | | | |
| Roku Incorporated † | | | | 64,280 | $ 8,052,356 |
| Spotify Technology † | | | | 105,983 | 16,005,553 |
| | | | | | 24,057,909 |
| Interactive media & services: 4.43% | | | | | |
| Match Group Incorporated † | | | | 184,617 | 20,075,253 |
| ZoomInfo Technologies Incorporated † | | | | 314,732 | 18,802,090 |
| | | | | | 38,877,343 |
| Consumer discretionary: 12.87% | | | | | |
| Automobiles: 1.36% | | | | | |
| Ferrari NV | | | | 54,649 | 11,918,400 |
| Hotels, restaurants & leisure: 4.54% | | | | | |
| Chipotle Mexican Grill Incorporated † | | | | 19,615 | 31,031,518 |
| Domino's Pizza Incorporated | | | | 21,700 | 8,832,117 |
| | | | | | 39,863,635 |
| Internet & direct marketing retail: 3.23% | | | | | |
| Global-E Online Limited † | | | | 317,100 | 10,711,638 |
| MercadoLibre Incorporated † | | | | 14,804 | 17,609,062 |
| | | | | | 28,320,700 |
| Leisure products: 1.41% | | | | | |
| Callaway Golf Company † | | | | 527,396 | 12,351,614 |
| Textiles, apparel & luxury goods: 2.33% | | | | | |
| lululemon athletica Incorporated † | | | | 56,134 | 20,501,821 |
| Financials: 1.45% | | | | | |
| Capital markets: 1.45% | | | | | |
| MarketAxess Holdings Incorporated | | | | 37,347 | 12,705,449 |
| Health care: 20.99% | | | | | |
| Health care equipment & supplies: 11.34% | | | | | |
| ABIOMED Incorporated † | | | | 43,590 | 14,438,752 |
| Align Technology Incorporated † | | | | 35,203 | 15,348,507 |
| DexCom Incorporated † | | | | 64,235 | 32,862,626 |
| Inari Medical Incorporated † | | | | 193,136 | 17,505,847 |
| Insulet Corporation † | | | | 72,539 | 19,323,664 |
| | | | | | 99,479,396 |
| Health care providers & services: 1.40% | | | | | |
| Centene Corporation † | | | | 145,900 | 12,283,321 |
| Health care technology: 2.44% | | | | | |
| Doximity Incorporated Class A † | | | | 157,187 | 8,187,871 |
| Inspire Medical Systems Incorporated † | | | | 51,400 | 13,193,866 |
| | | | | | 21,381,737 |
The accompanying notes are an integral part of these financial statements.
Allspring Discovery Mid Cap Growth Fund | 9
Portfolio of investments—March 31, 2022 (unaudited)
| | | | | Shares | Value |
| Life sciences tools & services: 5.81% | | | | | |
| 10x Genomics Incorporated Class A † | | | | 113,954 | $ 8,668,481 |
| Azenta Incorporated | | | | 172,058 | 14,260,167 |
| Bio-Rad Laboratories Incorporated Class A † | | | | 21,787 | 12,271,092 |
| Bio-Techne Corporation | | | | 36,500 | 15,805,960 |
| | | | | | 51,005,700 |
| Industrials: 13.70% | | | | | |
| Aerospace & defense: 1.89% | | | | | |
| Axon Enterprise Incorporated † | | | | 120,540 | 16,601,974 |
| Commercial services & supplies: 2.71% | | | | | |
| Waste Connections Incorporated | | | | 170,229 | 23,780,991 |
| Electrical equipment: 2.37% | | | | | |
| Generac Holdings Incorporated † | | | | 70,050 | 20,823,063 |
| Professional services: 3.56% | | | | | |
| Clarivate plc † | | | | 726,816 | 12,181,436 |
| Equifax Incorporated | | | | 80,323 | 19,044,583 |
| | | | | | 31,226,019 |
| Road & rail: 1.66% | | | | | |
| Saia Incorporated † | | | | 59,520 | 14,512,166 |
| Trading companies & distributors: 1.51% | | | | | |
| SiteOne Landscape Supply Incorporated † | | | | 81,836 | 13,232,063 |
| Information technology: 41.52% | | | | | |
| Electronic equipment, instruments & components: 6.49% | | | | | |
| Cognex Corporation | | | | 184,547 | 14,237,801 |
| Teledyne Technologies Incorporated † | | | | 52,962 | 25,031,430 |
| Zebra Technologies Corporation Class A † | | | | 42,668 | 17,651,752 |
| | | | | | 56,920,983 |
| IT services: 10.10% | | | | | |
| Adyen NV ADR †« | | | | 586,700 | 11,599,059 |
| Globant SA † | | | | 48,300 | 12,657,981 |
| MongoDB Incorporated † | | | | 62,963 | 27,929,757 |
| Snowflake Incorporated Class A † | | | | 49,205 | 11,274,342 |
| Square Incorporated Class A † | | | | 110,596 | 14,996,818 |
| Twilio Incorporated Class A † | | | | 61,549 | 10,143,891 |
| | | | | | 88,601,848 |
| Semiconductors & semiconductor equipment: 3.39% | | | | | |
| Advanced Micro Devices Incorporated † | | | | 130,784 | 14,299,923 |
| Micron Technology Incorporated | | | | 198,105 | 15,430,398 |
| | | | | | 29,730,321 |
| Software: 21.54% | | | | | |
| Atlassian Corporation plc Class A † | | | | 51,676 | 15,183,959 |
| Bill.com Holdings Incorporated † | | | | 111,026 | 25,179,587 |
| Black Knight Incorporated † | | | | 178,568 | 10,355,158 |
| Cadence Design Systems Incorporated † | | | | 229,037 | 37,667,425 |
| Crowdstrike Holdings Incorporated Class A † | | | | 129,814 | 29,478,163 |
| Datadog Incorporated Class A † | | | | 162,946 | 24,681,431 |
The accompanying notes are an integral part of these financial statements.
10 | Allspring Discovery Mid Cap Growth Fund
Portfolio of investments—March 31, 2022 (unaudited)
| | | | | Shares | Value |
| Software (continued) | | | | | |
| Five9 Incorporated † | | | | 166,759 | $ 18,410,194 |
| HubSpot Incorporated † | | | | 24,100 | 11,446,054 |
| Lightspeed Commerce Incorporated †« | | | | 178,289 | 5,432,466 |
| Unity Software Incorporated † | | | | 112,768 | 11,187,713 |
| | | | | | 189,022,150 |
| Real estate: 2.13% | | | | | |
| Equity REITs: 2.13% | | | | | |
| SBA Communications Corporation | | | | 54,400 | 18,719,040 |
| Total Common stocks (Cost $650,046,643) | | | | | 875,917,643 |
| | | Yield | | | |
| Short-term investments: 0.69% | | | | | |
| Investment companies: 0.69% | | | | | |
| Allspring Government Money Market Fund Select Class ♠∞ | | 0.18% | | 2,656,716 | 2,656,716 |
| Securities Lending Cash Investments LLC ♠∩∞ | | 0.40 | | 3,405,650 | 3,405,650 |
| Total Short-term investments (Cost $6,062,366) | | | | | 6,062,366 |
| Total investments in securities (Cost $656,109,009) | 100.52% | | | | 881,980,009 |
| Other assets and liabilities, net | (0.52) | | | | (4,543,674) |
| Total net assets | 100.00% | | | | $877,436,335 |
| † | Non-income-earning security |
| « | All or a portion of this security is on loan. |
| ♠ | The issuer of the security is an affiliated person of the Fund as defined in the Investment Company Act of 1940. |
| ∩ | The investment is a non-registered investment company purchased with cash collateral received from securities on loan. |
| ∞ | The rate represents the 7-day annualized yield at period end. |
| Abbreviations: |
| ADR | American depositary receipt |
| REIT | Real estate investment trust |
Investments in affiliates
An affiliated investment is an investment in which the Fund owns at least 5% of the outstanding voting shares of the issuer or as a result of other relationships, such as the Fund and the issuer having the same investment manager. Transactions with issuers that were affiliates of the Fund at the end of the period were as follows:
| | Value,
beginning of
period | Purchases | Sales
proceeds | Net
realized
gains
(losses) | | Net
change in
unrealized
gains
(losses) | | Value,
end of
period | Shares,
end
of period | Income
from
affiliated
securities |
| Short-term investments | | | | | | | | | |
| Allspring Government Money Market Fund Select Class | $ 5,682,216 | $142,044,704 | $(145,070,204) | $0 | | $0 | | $ 2,656,716 | 2,656,716 | $ 1,753 |
| Securities Lending Cash Investments LLC | 20,181,275 | 45,255,700 | (62,031,325) | 0 | | 0 | | 3,405,650 | 3,405,650 | 1,766 # |
| | | | | $0 | | $0 | | $6,062,366 | | $3,519 |
| # | Amount shown represents income before fees and rebates. |
The accompanying notes are an integral part of these financial statements.
Allspring Discovery Mid Cap Growth Fund | 11
Statement of assets and liabilities—March 31, 2022 (unaudited)
| | |
| Assets | |
Investments in unaffiliated securities (including $3,344,261 of securities loaned), at value (cost $650,046,643)
| $ 875,917,643 |
Investments in affiliated securities, at value (cost $6,062,366)
| 6,062,366 |
Receivable for Fund shares sold
| 41,603 |
Receivable for dividends
| 15,030 |
Receivable for securities lending income, net
| 285 |
Prepaid expenses and other assets
| 88,999 |
Total assets
| 882,125,926 |
| Liabilities | |
Payable upon receipt of securities loaned
| 3,405,650 |
Management fee payable
| 494,017 |
Payable for Fund shares redeemed
| 388,153 |
Administration fees payable
| 135,078 |
Trustees’ fees and expenses payable
| 2,344 |
Distribution fee payable
| 1,091 |
Accrued expenses and other liabilities
| 263,258 |
Total liabilities
| 4,689,591 |
Total net assets
| $877,436,335 |
| Net assets consist of | |
Paid-in capital
| $ 627,349,998 |
Total distributable earnings
| 250,086,337 |
Total net assets
| $877,436,335 |
| Computation of net asset value and offering price per share | |
Net assets – Class A
| $ 741,252,734 |
Shares outstanding – Class A1
| 14,470,679 |
Net asset value per share – Class A
| $51.22 |
Maximum offering price per share – Class A2
| $54.34 |
Net assets – Class C
| $ 1,881,838 |
Shares outstanding – Class C1
| 46,755 |
Net asset value per share – Class C
| $40.25 |
Net assets – Class R6
| $ 72,851,355 |
Shares outstanding – Class R61
| 1,201,645 |
Net asset value per share – Class R6
| $60.63 |
Net assets – Administrator Class
| $ 5,816,627 |
Shares outstanding – Administrator Class1
| 104,310 |
Net asset value per share – Administrator Class
| $55.76 |
Net assets – Institutional Class
| $ 55,633,781 |
Shares outstanding – Institutional Class1
| 923,182 |
Net asset value per share – Institutional Class
| $60.26 |
| 1 | The Fund has an unlimited number of authorized shares. |
| 2 | Maximum offering price is computed as 100/94.25 of net asset value. On investments of $50,000 or more, the offering price is reduced. |
The accompanying notes are an integral part of these financial statements.
12 | Allspring Discovery Mid Cap Growth Fund
Statement of operations—six months ended March 31, 2022 (unaudited)
| | |
| Investment income | |
Dividends (net of foreign withholdings taxes of $11,833)
| $ 358,047 |
Income from affiliated securities
| 15,337 |
Total investment income
| 373,384 |
| Expenses | |
Management fee
| 3,813,987 |
| Administration fees | |
Class A
| 917,907 |
Class C
| 2,316 |
Class R6
| 12,789 |
Administrator Class
| 6,251 |
Institutional Class
| 43,530 |
| Shareholder servicing fees | |
Class A
| 1,092,746 |
Class C
| 2,736 |
Administrator Class
| 11,198 |
| Distribution fee | |
Class C
| 8,201 |
Custody and accounting fees
| 25,129 |
Professional fees
| 25,464 |
Registration fees
| 31,631 |
Shareholder report expenses
| 27,026 |
Trustees’ fees and expenses
| 10,680 |
Other fees and expenses
| 12,015 |
Total expenses
| 6,043,606 |
| Less: Fee waivers and/or expense reimbursements | |
Fund-level
| (57,638) |
Class A
| (201,013) |
Class C
| (199) |
Administrator Class
| (726) |
Institutional Class
| (6,662) |
Net expenses
| 5,777,368 |
Net investment loss
| (5,403,984) |
| Realized and unrealized gains (losses) on investments | |
Net realized gains on investments
| 30,453,547 |
Net change in unrealized gains (losses) on investments
| (259,973,879) |
Net realized and unrealized gains (losses) on investments
| (229,520,332) |
Net decrease in net assets resulting from operations
| $(234,924,316) |
The accompanying notes are an integral part of these financial statements.
Allspring Discovery Mid Cap Growth Fund | 13
Statement of changes in net assets
| | | | | |
| | Six months ended
March 31, 2022
(unaudited) | Year ended
September 30, 2021 |
| Operations | | | | |
Net investment loss
| | $ (5,403,984) | | $ (11,537,800) |
Net realized gains on investments
| | 30,453,547 | | 185,874,437 |
Net change in unrealized gains (losses) on investments
| | (259,973,879) | | 107,974,823 |
Net increase (decrease) in net assets resulting from operations
| | (234,924,316) | | 282,311,460 |
| Distributions to shareholders from | | | | |
| Net investment income and net realized gains | | | | |
Class A
| | (144,445,304) | | (82,781,779) |
Class C
| | (442,606) | | (233,168) |
Class R6
| | (12,175,959) | | (6,340,447) |
Administrator Class
| | (1,511,423) | | (384,491) |
Institutional Class
| | (9,781,443) | | (6,296,069) |
Total distributions to shareholders
| | (168,356,735) | | (96,035,954) |
| Capital share transactions | Shares | | Shares | |
| Proceeds from shares sold | | | | |
Class A
| 151,135 | 10,106,453 | 302,878 | 22,132,413 |
Class C
| 6,491 | 322,801 | 13,961 | 852,693 |
Class R6
| 84,757 | 6,169,693 | 155,238 | 13,159,724 |
Administrator Class
| 39,553 | 2,856,970 | 93,109 | 7,399,371 |
Institutional Class
| 132,509 | 9,382,289 | 270,177 | 22,481,150 |
| | | 28,838,206 | | 66,025,351 |
| Reinvestment of distributions | | | | |
Class A
| 2,181,619 | 136,874,615 | 1,158,617 | 78,565,767 |
Class C
| 8,761 | 432,892 | 4,081 | 228,661 |
Class R6
| 158,244 | 11,736,955 | 78,532 | 6,125,450 |
Administrator Class
| 21,525 | 1,469,697 | 5,171 | 376,713 |
Institutional Class
| 125,545 | 9,257,639 | 76,277 | 5,922,914 |
| | | 159,771,798 | | 91,219,505 |
| Payment for shares redeemed | | | | |
Class A
| (886,235) | (53,851,777) | (1,110,134) | (80,557,204) |
Class C
| (8,696) | (429,282) | (18,934) | (1,146,028) |
Class R6
| (118,100) | (7,837,277) | (139,179) | (11,477,591) |
Administrator Class
| (89,172) | (5,486,868) | (27,224) | (2,158,777) |
Institutional Class
| (232,676) | (16,422,774) | (380,908) | (31,574,560) |
| | | (84,027,978) | | (126,914,160) |
Net increase in net assets resulting from capital share transactions
| | 104,582,026 | | 30,330,696 |
Total increase (decrease) in net assets
| | (298,699,025) | | 216,606,202 |
| Net assets | | | | |
Beginning of period
| | 1,176,135,360 | | 959,529,158 |
End of period
| | $ 877,436,335 | | $1,176,135,360 |
The accompanying notes are an integral part of these financial statements.
14 | Allspring Discovery Mid Cap Growth Fund
Financial highlights
(For a share outstanding throughout each period)
| | | Year ended September 30 |
| Class A | Six months ended
March 31, 2022
(unaudited) | 2021 | 2020 | 2019 | 2018 | 2017 |
Net asset value, beginning of period
| $76.01 | $64.21 | $49.98 | $52.96 | $48.80 | $41.94 |
Net investment loss
| (0.34) 1 | (0.77) 1 | (0.41) 1 | (0.29) | (0.31) | (0.25) |
Net realized and unrealized gains (losses) on investments
| (13.22) | 19.17 | 17.93 | 3.05 | 9.66 | 8.94 |
Total from investment operations
| (13.56) | 18.40 | 17.52 | 2.76 | 9.35 | 8.69 |
| Distributions to shareholders from | | | | | | |
Net realized gains
| (11.23) | (6.60) | (3.29) | (5.74) | (5.19) | (1.83) |
Net asset value, end of period
| $51.22 | $76.01 | $64.21 | $49.98 | $52.96 | $48.80 |
Total return2
| (20.56)% | 29.90% | 37.19% | 8.00% | 20.83% | 21.55% |
| Ratios to average net assets (annualized) | | | | | | |
Gross expenses
| 1.22% | 1.21% | 1.24% | 1.25% | 1.25% | 1.26% |
Net expenses
| 1.16% | 1.17% | 1.16% | 1.18% | 1.18% | 1.18% |
Net investment loss
| (1.09)% | (1.06)% | (0.79)% | (0.59)% | (0.61)% | (0.55)% |
| Supplemental data | | | | | | |
Portfolio turnover rate
| 24% | 41% | 62% | 50% | 62% | 75% |
Net assets, end of period (000s omitted)
| $741,253 | $990,030 | $813,725 | $649,106 | $655,338 | $591,002 |
| 1 | Calculated based upon average shares outstanding |
| 2 | Total return calculations do not include any sales charges. Returns for periods of less than one year are not annualized. |
The accompanying notes are an integral part of these financial statements.
Allspring Discovery Mid Cap Growth Fund | 15
Financial highlights
(For a share outstanding throughout each period)
| | | Year ended September 30 |
| Class C | Six months ended
March 31, 2022
(unaudited) | 2021 | 2020 | 2019 | 2018 | 2017 |
Net asset value, beginning of period
| $62.41 | $54.11 | $42.93 | $46.74 | $43.95 | $38.23 |
Net investment loss
| (0.46) 1 | (1.10) 1 | (0.68) 1 | (0.52) 1 | (0.60) 1 | (0.85) |
Net realized and unrealized gains (losses) on investments
| (10.47) | 16.00 | 15.15 | 2.45 | 8.58 | 8.40 |
Total from investment operations
| (10.93) | 14.90 | 14.47 | 1.93 | 7.98 | 7.55 |
| Distributions to shareholders from | | | | | | |
Net realized gains
| (11.23) | (6.60) | (3.29) | (5.74) | (5.19) | (1.83) |
Net asset value, end of period
| $40.25 | $62.41 | $54.11 | $42.93 | $46.74 | $43.95 |
Total return2
| (20.86)% | 28.92% | 36.13% | 7.20% | 19.93% | 20.66% |
| Ratios to average net assets (annualized) | | | | | | |
Gross expenses
| 1.96% | 1.96% | 1.98% | 2.00% | 2.00% | 2.01% |
Net expenses
| 1.93% | 1.93% | 1.93% | 1.93% | 1.93% | 1.93% |
Net investment loss
| (1.85)% | (1.82)% | (1.55)% | (1.29)% | (1.37)% | (1.13)% |
| Supplemental data | | | | | | |
Portfolio turnover rate
| 24% | 41% | 62% | 50% | 62% | 75% |
Net assets, end of period (000s omitted)
| $1,882 | $2,509 | $2,224 | $2,513 | $7,629 | $8,898 |
| 1 | Calculated based upon average shares outstanding |
| 2 | Total return calculations do not include any sales charges. Returns for periods of less than one year are not annualized. |
The accompanying notes are an integral part of these financial statements.
16 | Allspring Discovery Mid Cap Growth Fund
Financial highlights
(For a share outstanding throughout each period)
| | | Year ended September 30 |
| Class R6 | Six months ended
March 31, 2022
(unaudited) | 2021 | 2020 | 2019 | 2018 | 2017 |
Net asset value, beginning of period
| $87.70 | $72.94 | $56.15 | $58.47 | $53.17 | $45.37 |
Net investment loss
| (0.26) 1 | (0.57) 1 | (0.25) 1 | (0.11) 1 | (0.13) 1 | (0.08) |
Net realized and unrealized gains (losses) on investments
| (15.58) | 21.93 | 20.33 | 3.53 | 10.62 | 9.71 |
Total from investment operations
| (15.84) | 21.36 | 20.08 | 3.42 | 10.49 | 9.63 |
| Distributions to shareholders from | | | | | | |
Net realized gains
| (11.23) | (6.60) | (3.29) | (5.74) | (5.19) | (1.83) |
Net asset value, end of period
| $60.63 | $87.70 | $72.94 | $56.15 | $58.47 | $53.17 |
Total return2
| (20.40)% | 30.41% | 37.69% | 8.41% | 21.30% | 22.01% |
| Ratios to average net assets (annualized) | | | | | | |
Gross expenses
| 0.79% | 0.78% | 0.81% | 0.82% | 0.82% | 0.82% |
Net expenses
| 0.79% | 0.78% | 0.80% | 0.80% | 0.80% | 0.80% |
Net investment loss
| (0.72)% | (0.68)% | (0.43)% | (0.21)% | (0.23)% | (0.17)% |
| Supplemental data | | | | | | |
Portfolio turnover rate
| 24% | 41% | 62% | 50% | 62% | 75% |
Net assets, end of period (000s omitted)
| $72,851 | $94,430 | $71,641 | $52,783 | $48,363 | $35,923 |
| 1 | Calculated based upon average shares outstanding |
| 2 | Returns for periods of less than one year are not annualized. |
The accompanying notes are an integral part of these financial statements.
Allspring Discovery Mid Cap Growth Fund | 17
Financial highlights
(For a share outstanding throughout each period)
| | | Year ended September 30 |
| Administrator Class | Six months ended
March 31, 2022
(unaudited) | 2021 | 2020 | 2019 | 2018 | 2017 |
Net asset value, beginning of period
| $81.70 | $68.54 | $53.10 | $55.82 | $51.12 | $43.81 |
Net investment loss
| (0.35) 1 | (0.79) 1 | (0.40) 1 | (0.25) 1 | (0.28) 1 | (0.20) 1 |
Net realized and unrealized gains (losses) on investments
| (14.36) | 20.55 | 19.13 | 3.27 | 10.17 | 9.34 |
Total from investment operations
| (14.71) | 19.76 | 18.73 | 3.02 | 9.89 | 9.14 |
| Distributions to shareholders from | | | | | | |
Net realized gains
| (11.23) | (6.60) | (3.29) | (5.74) | (5.19) | (1.83) |
Net asset value, end of period
| $55.76 | $81.70 | $68.54 | $53.10 | $55.82 | $51.12 |
Total return2
| (20.53)% | 30.00% | 37.29% | 8.06% | 20.95% | 21.66% |
| Ratios to average net assets (annualized) | | | | | | |
Gross expenses
| 1.12% | 1.13% | 1.15% | 1.16% | 1.16% | 1.18% |
Net expenses
| 1.09% | 1.10% | 1.10% | 1.10% | 1.10% | 1.10% |
Net investment loss
| (1.03)% | (1.00)% | (0.72)% | (0.51)% | (0.53)% | (0.44)% |
| Supplemental data | | | | | | |
Portfolio turnover rate
| 24% | 41% | 62% | 50% | 62% | 75% |
Net assets, end of period (000s omitted)
| $5,817 | $10,818 | $4,205 | $3,687 | $3,687 | $3,705 |
| 1 | Calculated based upon average shares outstanding |
| 2 | Returns for periods of less than one year are not annualized. |
The accompanying notes are an integral part of these financial statements.
18 | Allspring Discovery Mid Cap Growth Fund
Financial highlights
(For a share outstanding throughout each period)
| | | Year ended September 30 |
| Institutional Class | Six months ended
March 31, 2022
(unaudited) | 2021 | 2020 | 2019 | 2018 | 2017 |
Net asset value, beginning of period
| $87.27 | $72.66 | $55.97 | $58.33 | $53.08 | $45.32 |
Net investment loss
| (0.28) 1 | (0.62) | (0.28) 1 | (0.14) 1 | (0.15) 1 | (0.09) 1 |
Net realized and unrealized gains (losses) on investments
| (15.50) | 21.83 | 20.26 | 3.52 | 10.59 | 9.68 |
Total from investment operations
| (15.78) | 21.21 | 19.98 | 3.38 | 10.44 | 9.59 |
| Distributions to shareholders from | | | | | | |
Net realized gains
| (11.23) | (6.60) | (3.29) | (5.74) | (5.19) | (1.83) |
Net asset value, end of period
| $60.26 | $87.27 | $72.66 | $55.97 | $58.33 | $53.08 |
Total return2
| (20.44)% | 30.31% | 37.63% | 8.36% | 21.24% | 21.97% |
| Ratios to average net assets (annualized) | | | | | | |
Gross expenses
| 0.89% | 0.88% | 0.91% | 0.92% | 0.92% | 0.93% |
Net expenses
| 0.85% | 0.85% | 0.85% | 0.85% | 0.85% | 0.85% |
Net investment loss
| (0.78)% | (0.74)% | (0.48)% | (0.26)% | (0.29)% | (0.19)% |
| Supplemental data | | | | | | |
Portfolio turnover rate
| 24% | 41% | 62% | 50% | 62% | 75% |
Net assets, end of period (000s omitted)
| $55,634 | $78,349 | $67,735 | $52,296 | $48,446 | $54,877 |
| 1 | Calculated based upon average shares outstanding |
| 2 | Returns for periods of less than one year are not annualized. |
The accompanying notes are an integral part of these financial statements.
Allspring Discovery Mid Cap Growth Fund | 19
Notes to financial statements (unaudited)
1. ORGANIZATION
Allspring Funds Trust (the "Trust"), a Delaware statutory trust organized on March 10, 1999, is an open-end management investment company registered under the Investment Company Act of 1940, as amended (the "1940 Act"). As an investment company, the Trust follows the accounting and reporting guidance in Financial Accounting Standards Board ("FASB") Accounting Standards Codification Topic 946, Financial Services – Investment Companies. These financial statements report on the Allspring Discovery Mid Cap Growth Fund (formerly, Allspring Enterprise Fund)(the "Fund") which is a diversified series of the Trust.
Effective on November 1, 2021, the sale transaction of Wells Fargo Asset Management ("WFAM") by Wells Fargo & Company to GTCR LLC and Reverence Capital Partners, L.P. was closed. In connection with the closing of the transaction, WFAM became known as Allspring Global Investments (“Allspring”) and various entities that provided services to the Fund changed their names to "Allspring", including Allspring Funds Management, LLC, the investment manager to the Fund, Allspring Global Investments, LLC and Allspring Global Investments (UK) Limited, both registered investment advisers providing subadvisory services to certain funds, and Allspring Funds Distributor, LLC, the Fund's principal underwriter. Consummation of the transaction resulted in a new investment management agreement and subadvisory agreement which became effective on November 1, 2021.
2. SIGNIFICANT ACCOUNTING POLICIES
The following significant accounting policies, which are consistently followed in the preparation of the financial statements of the Fund, are in conformity with U.S. generally accepted accounting principles which require management to make estimates and assumptions that affect the reported amounts of assets and liabilities, disclosure of contingent assets and liabilities at the date of the financial statements, and the reported amounts of income and expenses during the reporting period. Actual results could differ from those estimates.
Securities valuation
All investments are valued each business day as of the close of regular trading on the New York Stock Exchange (generally 4 p.m. Eastern Time), although the Fund may deviate from this calculation time under unusual or unexpected circumstances.
Equity securities that are listed on a foreign or domestic exchange or market are valued at the official closing price or, if none, the last sales price. If no sale occurs on the principal exchange or market that day, a fair value price will be determined in accordance with the Fund’s Valuation Procedures.
Investments in registered open-end investment companies are valued at net asset value. Interests in non-registered investment companies that are redeemable at net asset value are fair valued normally at net asset value.
Investments which are not valued using any of the methods discussed above are valued at their fair value, as determined in good faith by the Board of Trustees. The Board of Trustees has established a Valuation Committee comprised of the Trustees and has delegated to it the authority to take any actions regarding the valuation of portfolio securities that the Valuation Committee deems necessary or appropriate, including determining the fair value of portfolio securities, unless the determination has been delegated to the Allspring Global Investments Pricing Committee at Allspring Funds Management, LLC ("Allspring Funds Management"). The Board of Trustees retains the authority to make or ratify any valuation decisions or approve any changes to the Valuation Procedures as it deems appropriate. On a quarterly basis, the Board of Trustees receives reports on any valuation actions taken by the Valuation Committee or the Allspring Global Investments Pricing Committee which may include items for ratification.
Securities lending
The Fund may lend its securities from time to time in order to earn additional income in the form of fees or interest on securities received as collateral or the investment of any cash received as collateral. When securities are on loan, the Fund receives interest or dividends on those securities. Cash collateral received in connection with its securities lending transactions is invested in Securities Lending Cash Investments, LLC (the "Securities Lending Fund"), an affiliated non-registered investment company. Investments in Securities Lending Fund are valued at the evaluated bid price provided by an independent pricing service. Income earned from investment in the Securities Lending Fund (net of fees and rebates), if any, is included in income from affiliated securities on the Statement of Operations.
In a securities lending transaction, the net asset value of the Fund is affected by an increase or decrease in the value of the securities loaned and by an increase or decrease in the value of the instrument in which collateral is invested. The amount of securities lending activity undertaken by the Fund fluctuates from time to time. The Fund has the right under the lending agreement to recover the securities from the borrower on demand. In the event of default or bankruptcy by the borrower, the Fund may be prevented from recovering the loaned securities or gaining access to the collateral or may experience delays or
20 | Allspring Discovery Mid Cap Growth Fund
Notes to financial statements (unaudited)
costs in doing so. In such an event, the terms of the agreement allow the unaffiliated securities lending agent to use the collateral to purchase replacement securities on behalf of the Fund or pay the Fund the market value of the loaned securities. The Fund bears the risk of loss with respect to depreciation of its investment of the cash collateral.
Security transactions and income recognition
Securities transactions are recorded on a trade date basis. Realized gains or losses are recorded on the basis of identified cost.
Dividend income is recognized on the ex-dividend date. Dividend income is recorded net of foreign taxes withheld where recovery of such taxes is not assured.
Distributions to shareholders
Distributions to shareholders from net investment income and any net realized gains are recorded on the ex-dividend date and paid at least annually. Such distributions are determined in accordance with income tax regulations and may differ from U.S. generally accepted accounting principles. Dividend sources are estimated at the time of declaration. The tax character of distributions is determined as of the Fund's fiscal year end. Therefore, a portion of the Fund's distributions made prior to the Fund’s fiscal year end may be categorized as a tax return of capital at year end.
Federal and other taxes
The Fund intends to continue to qualify as a regulated investment company by distributing substantially all of its investment company taxable income and any net realized capital gains (after reduction for capital loss carryforwards) sufficient to relieve it from all, or substantially all, federal income taxes. Accordingly, no provision for federal income taxes was required.
The Fund’s income and federal excise tax returns and all financial records supporting those returns for the prior three fiscal years are subject to examination by the federal and Delaware revenue authorities. Management has analyzed the Fund's tax positions taken on federal, state, and foreign tax returns for all open tax years and does not believe that there are any uncertain tax positions that require recognition of a tax liability.
As of March 31, 2022, the aggregate cost of all investments for federal income tax purposes was $169,927,655 and the unrealized gains (losses) consisted of:
| Gross unrealized gains | $795,188,655 |
| Gross unrealized losses | (83,136,301) |
| Net unrealized gains | $712,052,354 |
Class allocations
The separate classes of shares offered by the Fund differ principally in applicable sales charges, distribution, shareholder servicing, and administration fees. Class specific expenses are charged directly to that share class. Investment income, common fund-level expenses, and realized and unrealized gains (losses) on investments are allocated daily to each class of shares based on the relative proportion of net assets of each class.
3. FAIR VALUATION MEASUREMENTS
Fair value measurements of investments are determined within a framework that has established a fair value hierarchy based upon the various data inputs utilized in determining the value of the Fund’s investments. The three-level hierarchy gives the highest priority to unadjusted quoted prices in active markets for identical assets or liabilities (Level 1) and the lowest priority to unobservable inputs (Level 3). The Fund’s investments are classified within the fair value hierarchy based on the lowest level of input that is significant to the fair value measurement. The inputs are summarized into three broad levels as follows:
| ■ | Level 1 – quoted prices in active markets for identical securities |
| ■ | Level 2 – other significant observable inputs (including quoted prices for similar securities, interest rates, prepayment speeds, credit risk, etc.) |
| ■ | Level 3 – significant unobservable inputs (including the Fund’s own assumptions in determining the fair value of investments) |
The inputs or methodologies used for valuing investments in securities are not necessarily an indication of the risk associated with investing in those securities.
Allspring Discovery Mid Cap Growth Fund | 21
Notes to financial statements (unaudited)
The following is a summary of the inputs used in valuing the Fund’s assets and liabilities as of March 31, 2022:
| | Quoted prices
(Level 1) | Other significant
observable inputs
(Level 2) | Significant
unobservable inputs
(Level 3) | Total |
| Assets | | | | |
| Investments in: | | | | |
| Common stocks | | | | |
| Communication services | $ 62,935,252 | $0 | $0 | $ 62,935,252 |
| Consumer discretionary | 112,956,170 | 0 | 0 | 112,956,170 |
| Financials | 12,705,449 | 0 | 0 | 12,705,449 |
| Health care | 184,150,154 | 0 | 0 | 184,150,154 |
| Industrials | 120,176,276 | 0 | 0 | 120,176,276 |
| Information technology | 364,275,302 | 0 | 0 | 364,275,302 |
| Real estate | 18,719,040 | 0 | 0 | 18,719,040 |
| Short-term investments | | | | |
| Investment companies | 6,062,366 | 0 | 0 | 6,062,366 |
| Total assets | $881,980,009 | $0 | $0 | $881,980,009 |
Additional sector, industry or geographic detail, if any, is included in the Portfolio of Investments.
For the six months ended March 31, 2022, the Fund did not have any transfers into/out of Level 3.
4. TRANSACTIONS WITH AFFILIATES
Management fee
Allspring Funds Management, a wholly owned subsidiary of Allspring Global Investments Holdings, LLC, a holding company indirectly owned by certain private funds of GTCR LLC and Reverence Capital Partners, L.P., is the manager of the Fund and provides advisory and fund-level administrative services under an investment management agreement. Under the investment management agreement, Allspring Funds Management is responsible for, among other services, implementing the investment objectives and strategies of the Fund, supervising the subadviser and providing fund-level administrative services in connection with the Fund’s operations. As compensation for its services under the investment management agreement, Allspring Funds Management is entitled to receive a management fee at the following annual rate based on the Fund’s average daily net assets:
| Average daily net assets | Management fee |
| First $500 million | 0.750% |
| Next $500 million | 0.725 |
| Next $1 billion | 0.700 |
| Next $2 billion | 0.675 |
| Next $1 billion | 0.650 |
| Next $5 billion | 0.640 |
| Next $2 billion | 0.630 |
| Next $4 billion | 0.620 |
| Over $16 billion | 0.610 |
For the six months ended March 31, 2022, the management fee was equivalent to an annual rate of 0.73% of the Fund’s average daily net assets.
Allspring Funds Management has retained the services of a subadviser to provide daily portfolio management to the Fund. The fee for subadvisory services is borne by Allspring Funds Management. Allspring Global Investments, LLC ("Allspring Investments"), an affiliate of Allspring Funds Management and a wholly owned subsidiary of Allspring Global Investments Holdings, LLC, is the subadviser to the Fund and is entitled to receive a fee from Allspring Funds Management at an annual rate starting at 0.45% and declining to 0.30% as the average daily net assets of the Fund increase.
22 | Allspring Discovery Mid Cap Growth Fund
Notes to financial statements (unaudited)
Administration fees
Under a class-level administration agreement, Allspring Funds Management provides class-level administrative services to the Fund, which includes paying fees and expenses for services provided by the transfer agent, sub-transfer agents, omnibus account servicers and record-keepers. As compensation for its services under the class-level administration agreement, Allspring Funds Management receives an annual fee which is calculated based on the average daily net assets of each class as follows:
| | Class-level
administration fee |
| Class A | 0.21% |
| Class C | 0.21 |
| Class R6 | 0.03 |
| Administrator Class | 0.13 |
| Institutional Class | 0.13 |
Waivers and/or expense reimbursements
Allspring Funds Management has contractually committed to waive and/or reimburse management and administration fees to the extent necessary to maintain certain net operating expense ratios for the Fund. When each class of the Fund has exceeded its expense cap, Allspring Funds Management will waive fees and/or reimburse expenses from fund-level expenses on a proportionate basis and then from class specific expenses. When only certain classes exceed their expense caps, waivers and/or reimbursements are applied against class specific expenses before fund-level expenses. Allspring Funds Management has contractually committed through January 31, 2023 to waive fees and/or reimburse expenses to the extent necessary to cap expenses. Prior to or after the commitment expiration date, the caps may be increased or the commitment to maintain the caps may be terminated only with the approval of the Board of Trustees. As of March 31, 2022, the contractual expense caps are as follows:
| | Expense ratio caps |
| Class A | 1.18% |
| Class C | 1.93 |
| Class R6 | 0.80 |
| Administrator Class | 1.10 |
| Institutional Class | 0.85 |
Distribution fee
The Trust has adopted a distribution plan for Class C shares of the Fund pursuant to Rule 12b-1 under the 1940 Act. A distribution fee is charged to Class C shares and paid to Allspring Funds Distributor, LLC ("Allspring Funds Distributor"), the principal underwriter, an affiliate of Allspring Funds Management, at an annual rate of 0.75% of the average daily net assets of Class C shares.
In addition, Allspring Funds Distributor is entitled to receive the front-end sales charge from the purchase of Class A shares and a contingent deferred sales charge on the redemption of certain Class A shares. Allspring Funds Distributor is also entitled to receive the contingent deferred sales charges from redemptions of Class C shares. For the six months ended March 31, 2022, Allspring Funds Distributor received $3,767 from the sale of Class A shares. No contingent deferred sales charges were incurred by Class A and Class C shares for the six months ended March 31, 2022.
Shareholder servicing fees
The Trust has entered into contracts with one or more shareholder servicing agents, whereby Class A, Class C and Administrator Class of the Fund are charged a fee at an annual rate of 0.25% of the average daily net assets of each respective class. A portion of these total shareholder servicing fees were paid to affiliates, and to certain entities that were affiliates of the Fund until November 1, 2021.
Allspring Discovery Mid Cap Growth Fund | 23
Notes to financial statements (unaudited)
Interfund transactions
The Fund may purchase or sell portfolio investment securities to certain affiliates pursuant to Rule 17a-7 under the 1940 Act and under procedures adopted by the Board of Trustees. The procedures have been designed to ensure that these interfund transactions, which do not incur broker commissions, are effected at current market prices.
5. INVESTMENT PORTFOLIO TRANSACTIONS
Purchases and sales of investments, excluding U.S. government obligations (if any) and short-term securities, for the six months ended March 31, 2022 were $252,020,862 and $321,222,234, respectively.
6. SECURITIES LENDING TRANSACTIONS
The Fund lends its securities through an unaffiliated securities lending agent and receives collateral in the form of cash or securities with a value at least equal to the value of the securities on loan. The value of the loaned securities is determined at the close of each business day and any increases or decreases in the required collateral are exchanged between the Fund and the counterparty on the next business day. Cash collateral received is invested in the Securities Lending Fund which seeks to provide a positive return compared to the daily Federal Funds Open Rate by investing in high-quality, U.S. dollar-denominated short-term money market instruments and is exempt from registration under Section 3(c)(7) of the 1940 Act. Securities Lending Fund is managed by Allspring Funds Management and is subadvised by Allspring Investments. Allspring Funds Management receives an advisory fee starting at 0.05% and declining to 0.01% as the average daily net assets of the Securities Lending Fund increase. All of the fees received by Allspring Funds Management are paid to Allspring Investments for its services as subadviser.
In the event of counterparty default or the failure of a borrower to return a loaned security, the Fund has the right to use the collateral to offset any losses incurred. As of March 31, 2022, the Fund had securities lending transactions with the following counterparties which are subject to offset:
| Counterparty | Value of
securities on
loan | Collateral
received1 | Net amount |
| Bank of America Securities Incorporated | $3,082,517 | $(3,082,517) | $0 |
| UBS Securities LLC | 261,744 | (261,744) | 0 |
1 Collateral received within this table is limited to the collateral for the net transaction with the counterparty.
7. BANK BORROWINGS
The Trust (excluding the money market funds), Allspring Master Trust and Allspring Variable Trust are parties to a $350,000,000 revolving credit agreement whereby the Fund is permitted to use bank borrowings for temporary or emergency purposes, such as to fund shareholder redemption requests. Interest under the credit agreement is charged to the Fund based on a borrowing rate equal to the higher of the Federal Funds rate in effect on that day plus 1.25% or the overnight bank funding rate in effect on that day plus 1.25%. In addition, an annual commitment fee equal to 0.25% of the unused balance is allocated to each participating fund.
For the six months ended March 31, 2022, there were no borrowings by the Fund under the agreement.
8. CONCENTRATION RISKS
As of the end of the period, the Fund concentrated its portfolio of investments in the information technology sector. A fund that invests a substantial portion of its assets in any sector may be more affected by changes in that sector than would be a fund whose investments are not heavily weighted in any sector.
9. INDEMNIFICATION
Under the Fund's organizational documents, the officers and Trustees have been granted certain indemnification rights against certain liabilities that may arise out of performance of their duties to the Fund. The Fund has entered into a separate agreement with each Trustee that converts indemnification rights currently existing under the Fund’s organizational documents into contractual rights that cannot be changed in the future without the consent of the Trustee. Additionally, in the normal course of business, the Fund may enter into contracts with service providers that contain a variety of indemnification clauses. The Fund’s maximum exposure under these arrangements is dependent on future claims that may be made against the Fund and, therefore, cannot be estimated.
24 | Allspring Discovery Mid Cap Growth Fund
Notes to financial statements (unaudited)
10. CORONAVIRUS (COVID-19) PANDEMIC
On March 11, 2020, the World Health Organization announced that it had made the assessment that coronavirus disease 2019 (“COVID-19”) is a pandemic. The impacts of COVID-19 are affecting the entire global economy, individual companies and investment products, the funds, and the market in general. There is significant uncertainty around the extent and duration of business disruptions related to COVID-19 and the impacts may last for an extended period of time. COVID-19 has led to significant uncertainty and volatility in the financial markets.
Allspring Discovery Mid Cap Growth Fund | 25
Other information (unaudited)
PROXY VOTING INFORMATION
A description of the policies and procedures used to determine how to vote proxies relating to portfolio securities is available without charge, upon request, by calling 1-800-222-8222, visiting our website at allspringglobal.com, or visiting the SEC website at sec.gov. Information regarding how the proxies related to portfolio securities were voted during the most recent 12-month period ended June 30 is available on the website at allspringglobal.com or by visiting the SEC website at sec.gov.
QUARTERLY PORTFOLIO HOLDINGS INFORMATION
The Fund files its complete schedule of portfolio holdings with the SEC for the first and third quarters of each fiscal year as an exhibit to its reports on Form N-PORT. Shareholders may view the filed Form N-PORT by visiting the SEC website at sec.gov.
26 | Allspring Discovery Mid Cap Growth Fund
Other information (unaudited)
BOARD OF TRUSTEES AND OFFICERS
Each of the Trustees and Officers listed in the table below acts in identical capacities for each fund in the Allspring family of funds, which consists of 138 mutual funds comprising the Allspring Funds Trust, Allspring Variable Trust, Allspring Master Trust and four closed-end funds (collectively the “Fund Complex”). This table should be read in conjunction with the Prospectus and the Statement of Additional Information1. The mailing address of each Trustee and Officer is 525 Market Street, 12th Floor, San Francisco, CA 94105. Each Trustee and Officer serves an indefinite term, however, each Trustee serves such term until reaching the mandatory retirement age established by the Trustees.
Independent Trustees
Name and
year of birth | Position held and
length of service* | Principal occupations during past five years or longer | Current other
public company or
investment
company
directorships |
William R. Ebsworth
(Born 1957) | Trustee,
since 2015 | Retired. From 1984 to 2013, equities analyst, portfolio manager, research director and chief investment officer at Fidelity Management and Research Company in Boston, Tokyo, and Hong Kong, and retired in 2013 as Chief Investment Officer of Fidelity Strategic Advisers, Inc. where he led a team of investment professionals managing client assets. Prior thereto, Board member of Hong Kong Securities Clearing Co., Hong Kong Options Clearing Corp., the Thailand International Fund, Ltd., Fidelity Investments Life Insurance Company, and Empire Fidelity Investments Life Insurance Company. Audit Committee Chair and Investment Committee Chair of the Vincent Memorial Hospital Endowment (non-profit organization). Mr. Ebsworth is a CFA® charterholder. | N/A |
Jane A. Freeman
(Born 1953) | Trustee,
since 2015;
Chair Liaison,
since 2018 | Retired. From 2012 to 2014 and 1999 to 2008, Chief Financial Officer of Scientific Learning Corporation. From 2008 to 2012, Ms. Freeman provided consulting services related to strategic business projects. Prior to 1999, Portfolio Manager at Rockefeller & Co. and Scudder, Stevens & Clark. Board member of the Harding Loevner Funds from 1996 to 2014, serving as both Lead Independent Director and chair of the Audit Committee. Board member of the Russell Exchange Traded Funds Trust from 2011 to 2012 and the chair of the Audit Committee. Ms. Freeman is also an inactive Chartered Financial Analyst. | N/A |
Isaiah Harris, Jr.
(Born 1952) | Trustee,
since 2009; Audit
Committee
Chair,
since 2019 | Retired. Chairman of the Board of CIGNA Corporation from 2009 to 2021, and Director from 2005 to 2008. From 2003 to 2011, Director of Deluxe Corporation. Prior thereto, President and CEO of BellSouth Advertising and Publishing Corp. from 2005 to 2007, President and CEO of BellSouth Enterprises from 2004 to 2005 and President of BellSouth Consumer Services from 2000 to 2003. Emeritus member of the Iowa State University Foundation Board of Governors. Emeritus Member of the Advisory Board of Iowa State University School of Business. Advisory Board Member, Palm Harbor Academy (private school). Advisory Board Member, Fellowship of Christian Athletes. Mr. Harris is a certified public accountant (inactive status). | N/A |
David F. Larcker
(Born 1950) | Trustee,
since 2009 | James Irvin Miller Professor of Accounting at the Graduate School of Business (Emeritus), Stanford University, Director of the Corporate Governance Research Initiative and Senior Faculty of The Rock Center for Corporate Governance since 2006. From 2005 to 2008, Professor of Accounting at the Graduate School of Business, Stanford University. Prior thereto, Ernst & Young Professor of Accounting at The Wharton School, University of Pennsylvania from 1985 to 2005. | N/A |
Allspring Discovery Mid Cap Growth Fund | 27
Other information (unaudited)
Name and
year of birth | Position held and
length of service* | Principal occupations during past five years or longer | Current other
public company or
investment
company
directorships |
Olivia S. Mitchell
(Born 1953) | Trustee,
since 2006;
Nominating and
Governance
Committee Chair,
since 2018 | International Foundation of Employee Benefit Plans Professor since 1993, Wharton School of the University of Pennsylvania. Director of Wharton’s Pension Research Council and Boettner Center on Pensions & Retirement Research, and Research Associate at the National Bureau of Economic Research. Previously taught at Cornell University from 1978 to 1993. | N/A |
Timothy J. Penny
(Born 1951) | Trustee,
since 1996;
Chair,
since 2018 | President and Chief Executive Officer of Southern Minnesota Initiative Foundation, a non-profit organization, since 2007. Member of the Board of Trustees of NorthStar Education Finance, Inc., a non-profit organization, since 2007. | N/A |
James G. Polisson
(Born 1959) | Trustee,
since 2018 | Retired. Chief Marketing Officer, Source (ETF) UK Services, Ltd, from 2015 to 2017. From 2012 to 2015, Principal of The Polisson Group, LLC, a management consulting, corporate advisory and principal investing company. Chief Executive Officer and Managing Director at Russell Investments, Global Exchange Traded Funds from 2010 to 2012. Managing Director of Barclays Global Investors from 1998 to 2010 and Global Chief Marketing Officer for iShares and Barclays Global Investors from 2000 to 2010. Trustee of the San Francisco Mechanics’ Institute, a non-profit organization, from 2013 to 2015. Board member of the Russell Exchange Traded Fund Trust from 2011 to 2012. Director of Barclays Global Investors Holdings Deutschland GmbH from 2006 to 2009. Mr. Polisson is an attorney and has a retired status with the Massachusetts and District of Columbia Bar Associations. | N/A |
Pamela Wheelock
(Born 1959) | Trustee,
since January
2020; previously
Trustee from
January 2018 to
July 2019 | Board member of the Destination Medical Center Economic Development Agency, Rochester, Minnesota since 2019. Interim President of the McKnight Foundation from January to September 2020. McKnight Foundation Consultant, November 2020 to February 2021. Acting Commissioner, Minnesota Department of Human Services, July 2019 through September 2019. Consultant (part-time), Minnesota Department of Human Services, October 2019 through December 2019. Chief Operating Officer, Twin Cities Habitat for Humanity from 2017 to 2019. Vice President of University Services, University of Minnesota from 2012 to 2016. Prior thereto, on the Board of Directors, Governance Committee and Finance Committee for the Minnesota Philanthropy Partners (Saint Paul Foundation) from 2012 to 2018, Interim Chief Executive Officer of Blue Cross Blue Shield of Minnesota from 2011 to 2012, Chairman of the Board from 2009 to 2012 and Board Director from 2003 to 2015. Vice President, Leadership and Community Engagement, Bush Foundation, Saint Paul, Minnesota (a private foundation) from 2009 to 2011. Executive Vice President and Chief Financial Officer, Minnesota Sports and Entertainment from 2004 to 2009 and Senior Vice President from 2002 to 2004. Executive Vice President of the Minnesota Wild Foundation from 2004 to 2008. Commissioner of Finance, State of Minnesota, from 1999 to 2002. Currently Board Chair of the Minnesota Wild Foundation since 2010. | N/A |
* Length of service dates reflect the Trustee’s commencement of service with the Trust’s predecessor entities, where applicable.
28 | Allspring Discovery Mid Cap Growth Fund
Other information (unaudited)
Officers2
Name and
year of birth | Position held and
length of service | Principal occupations during past five years or longer |
Andrew Owen
(Born 1960) | President,
since 2017 | President, Chief Executive Officer and Director of Allspring Funds Management, LLC since 2017 and co-president of Galliard Capital Management, LLC, an affiliate of Allspring Funds Management, LLC, since 2019. Prior thereto, Head of Affiliated Managers, Allspring Global Investments, from 2014 to 2019 and Executive Vice President responsible for marketing, investments and product development for Allspring Funds Management, LLC, from 2009 to 2014. In addition, Mr. Owen was an Executive Vice President of Wells Fargo & Company from 2014 to 2021. |
Jeremy DePalma
(Born 1974) | Treasurer,
since 2012
(for certain funds in
the Fund Complex);
since 2021 (for
the remaining funds in the
Fund Complex) | Senior Vice President of Allspring Funds Management, LLC since 2009. Senior Vice President of Evergreen Investment Management Company, LLC from 2008 to 2010 and head of the Fund Reporting and Control Team within Fund Administration from 2005 to 2010. |
Kate McKinley
(Born 1977) | Chief Legal Officer,
since 2021 | Chief Legal Officer of Allspring Global Investments since 2021. Prior thereto, held various roles at State Street Global Advisors beginning in 2010, including serving as Senior Vice President and General Counsel from 2019 to 2021, and Chief Operating Officer of the Institutional Client Group from 2016 - 2019. Prior to working at State Street Global Advisors served as Assistant General Counsel for Bank of America Corporation from 2005 to 2010 and as an Associate at WilmerHale from 2002 to 2005. |
Christopher Baker
(Born 1976) | Chief Compliance Officer, since 2022 | Global Chief Compliance Officer for Allspring Global Investments since 2022. Prior thereto, Chief Compliance Officer for State Street Global Advisors from 2018 to 2021. Senior Compliance Officer for the State Street divisions of Alternative Investment Solutions, Sector Solutions, and Global Marketing from 2015 to 2018. From 2010 to 2015 Vice President, Global Head of Investment and Marketing Compliance for State Street Global Advisors. |
Matthew Prasse
(Born 1983) | Secretary,
since 2021 | Senior Counsel of the Allspring Legal Department since 2021. Senior Counsel of the Wells Fargo Legal Department from 2018 to 2021. Previously, Counsel for Barings LLC from 2015 to 2018. Prior to joining Barings, Associate at Morgan, Lewis & Bockius LLP from 2008 to 2015. |
1 The Statement of Additional Information includes additional information about the Trustees and is available, without charge, upon request, by calling 1-800-222-8222 or by visiting the website at allspringglobal.com.
2 For those Officers with tenures at Allspring Global Investments and/or Allspring Funds Management, LLC that began prior to 2021, such tenures include years of service during which these businesses/entities were known as Wells Fargo Asset Management and Wells Fargo Funds Management, LLC, respectively.
Allspring Discovery Mid Cap Growth Fund | 29
For more information
More information about Allspring Funds is available free upon request. To obtain literature, please write, visit the Fund's website, or call:
Allspring Funds
P.O. Box 219967
Kansas City, MO 64121-9967
Website: allspringglobal.com
Individual investors: 1-800-222-8222
Retail investment professionals: 1-888-877-9275
Institutional investment professionals: 1-800-260-5969
This report and the financial statements contained herein are submitted for the general information of the shareholders of the Fund. If this report is used for promotional purposes, distribution of the report must be accompanied or preceded by a current prospectus. Before investing, please consider the investment objectives, risks, charges, and expenses of the investment. For a current prospectus and, if available, a summary prospectus, containing this information, call
1-800-222-8222 or visit the Fund's website at allspringglobal.com. Read the prospectus carefully before you invest or send money.
Allspring Global InvestmentsTM is the trade name for the asset management firms of Allspring Global Investments Holdings, LLC, a holding company indirectly owned by certain private funds of GTCR LLC and Reverence Capital Partners, L.P. These firms include but are not limited to Allspring Global Investments, LLC, and Allspring Funds Management, LLC. Certain products managed by Allspring entities are distributed by Allspring Funds Distributor, LLC (a broker-dealer and Member FINRA/SIPC).
This material is for general informational and educational purposes only and is NOT intended to provide investment advice or a recommendation of any kind - including a recommendation for any specific investment, strategy, or plan.
© 2022 Allspring Global Investments Holdings, LLC. All rights reserved.
PAR-0522-00056 05-22
SA231/SAR231 03-22
Semi-Annual Report
March 31, 2022
Allspring Opportunity Fund
The views expressed and any forward-looking statements are as of March 31, 2022, unless otherwise noted, and are those of the Fund's portfolio managers and/or Allspring Global Investments. Discussions of individual securities or the markets generally are not intended as individual recommendations. Future events or results may vary significantly from those expressed in any forward-looking statements. The views expressed are subject to change at any time in response to changing circumstances in the market. Allspring Global Investments disclaims any obligation to publicly update or revise any views expressed or forward-looking statements.
Allspring Opportunity Fund | 1
Letter to shareholders (unaudited)
Andrew Owen
President
Allspring Funds
Dear Shareholder:
We are pleased to offer you this semi-annual report for Allspring Opportunity Fund for the six-month period that ended March 31, 2022. Global stocks and bonds broadly declined during a challenging period. Despite progress on a global economic recovery from COVID-19, persistently high inflation, concerns regarding anticipated tightening of central bank monetary policy, and turmoil caused by the Russian invasion of Ukraine all led to a retreat from financial market gains made earlier in 2021. Among major indexes, the U.S. large-cap-dominated S&P 500 Index was an exception in escaping a half-year loss.
For the six-month period, U.S. stocks, based on the S&P 500 Index,1 gained 5.92%. International stocks, as measured by the MSCI ACWI ex USA Index (Net),2 returned -3.72%, while the MSCI EM Index (Net) (USD),3 trailed both developed market benchmarks with a return of -8.20%. The Bloomberg U.S. Aggregate Bond Index,4returned -5.92%, the Bloomberg Global Aggregate ex-USD Index (unhedged),5 returned -7.26%, the Bloomberg Municipal Bond Index6 returned -5.55%, and the ICE BofA U.S. High Yield Index,7 lost 3.89%.
Inflationary concerns and the Russian-Ukraine war caused markets to retreat.
Elevated inflation pressures and the ongoing global supply bottleneck continued in October, but strong corporate earnings provided a bright spot in the U.S., the eurozone, and many Asian countries. Government bond yields rose globally as central banks prepared to tighten monetary policy. Commodity prices continued to rise, driven by sharply higher energy costs.
In November, as COVID-19 hospitalizations rose, most major global asset classes declined. Two exceptions were U.S. investment-grade bonds and Treasury Inflation-Protected Securities. President Biden signed a long-awaited $550 billion infrastructure bill to upgrade U.S. roads, bridges, and railways. Meanwhile, the Consumer Price Index8, a measure of domestic inflation conditions, jumped to its highest level in 31 years. While the threat of consistently high inflation led the U.S. Federal Reserve (Fed) to discuss a faster pace of tapering, the Omicron strain created uncertainty. Commodities lost ground for the month, driven by sharp declines in oil prices (and energy costs in general) as well as precious metals.
“Elevated inflation pressures and the ongoing global supply bottleneck continued in October, but strong corporate earnings provided a bright spot in the U.S., the eurozone, and many Asian countries.”
| 1 | The S&P 500 Index consists of 500 stocks chosen for market size, liquidity, and industry group representation. It is a market-value-weighted index with each stock's weight in the index proportionate to its market value. You cannot invest directly in an index. |
| 2 | The Morgan Stanley Capital International (MSCI) All Country World Index (ACWI) ex USA Index (Net) is a free-float-adjusted market-capitalization-weighted index that is designed to measure the equity market performance of developed and emerging markets, excluding the U.S. Source: MSCI. MSCI makes no express or implied warranties or representations and shall have no liability whatsoever with respect to any MSCI data contained herein. The MSCI data may not be further redistributed or used as a basis for other indexes or any securities or financial products. This report is not approved, reviewed, or produced by MSCI. You cannot invest directly in an index. |
| 3 | The MSCI Emerging Markets (EM) Index (Net) (USD) is a free-float-adjusted market-capitalization-weighted index that is designed to measure equity market performance of emerging markets. You cannot invest directly in an index. |
| 4 | The Bloomberg U.S. Aggregate Bond Index is a broad-based benchmark that measures the investment-grade, U.S.-dollar-denominated, fixed-rate taxable bond market, including Treasuries, government-related and corporate securities, mortgage-backed securities (agency fixed-rate and hybrid adjustable-rate mortgage pass-throughs), asset-backed securities, and commercial mortgage-backed securities. You cannot invest directly in an index. |
| 5 | The Bloomberg Global Aggregate ex-USD Index (unhedged) is an unmanaged index that provides a broad-based measure of the global investment-grade fixed-income markets excluding the U.S.-dollar-denominated debt market. You cannot invest directly in an index. |
| 6 | The Bloomberg Municipal Bond Index is an unmanaged index composed of long-term tax-exempt bonds with a minimum credit rating of Baa. You cannot invest directly in an index. |
| 7 | The ICE BofA U.S. High Yield Index is a market-capitalization-weighted index of domestic and Yankee high-yield bonds. The index tracks the performance of high-yield securities traded in the U.S. bond market. You cannot invest directly in an index. Copyright 2022. ICE Data Indices, LLC. All rights reserved. |
| 8 | The Consumer Price Index (CPI) is a measure of the average change over time in the prices paid by urban consumers for a market basket of consumer goods and services. You cannot invest directly in an index. |
2 | Allspring Opportunity Fund
Letter to shareholders (unaudited)
Global volatility lessened in December as data indicated a lower risk of severe disease and death from the Omicron variant. Even so, several countries introduced restrictions on travel and hospitality, among other sectors, in an effort to reduce the spread. In the U.S., data indicated a stable economy overall, with robust corporate earnings. Consumer spending potential looked strong heading into 2022 on elevated household savings and the lowest household debt ratio since 1973. U.S. corporate and high-yield bonds had monthly gains while Treasuries declined. Bonds were strongly affected by the projection of three 25-basis-point (bp; 100 bps equal 1.00%) policy rate hikes in 2022 by senior Federal Open Market Committee members, up from previous projections of just one hike.
In January 2022, the main focus was on potential U.S. interest rate hikes and the Russia-Ukraine conflict. The Fed hinted that a March interest rate hike was likely. Meanwhile, Russia threatened a potential invasion of Ukraine, which could disrupt Russia’s massive energy supplies and drive demand from non-Russian oil-producing countries. Elsewhere overseas, Europe saw food and energy prices spike, leading to rising inflation. Within fixed income, corporate bonds struggled in January, underperforming government bonds, as investors focused on continued elevated inflation and ongoing uncertainty over the U.S. monetary path.
The Russian invasion of Ukraine dominated the financial world in February and March. Equity, bond, and commodities markets were shaken by fear, uncertainty, and an upending of demand-supply dynamics. Major global stock indexes were down in February, along with global bonds overall, with ongoing high levels of volatility in March along with mixed results that favored U.S. large-cap stocks. Prices of commodities spiked, including crude oil, natural gas, wheat, and precious metals, on elevated concerns of supply shortages. All of this fed already-high inflation concerns and added to expectations of more aggressive central bank interest rate hikes. Sweeping sanctions against Russia and corporate pullouts contributed to market volatility. Despite the geopolitical turmoil, the U.S. economic outlook remained largely unchanged, with a healthy job market and signs of economic resilience accompanying higher prices.
Don’t let short-term uncertainty derail long-term investment goals.
Periods of investment uncertainty can present challenges, but experience has taught us that maintaining long-term investment goals can be an effective way to plan for the future. To help you create a sound strategy based on your personal goals and risk tolerance, Allspring Funds offers more than 100 mutual funds spanning a wide range of asset classes and investment styles. Although diversification cannot guarantee an investment profit or prevent losses, we believe it can be an effective way to manage investment risk and potentially smooth out overall portfolio performance. We encourage investors to know their investments and to understand that appropriate levels of risk-taking may unlock opportunities.
Information on transaction closing.
On November 1, 2021, GTCR LLC and Reverence Capital Partners, L.P. announced the beginning of Allspring Global Investments™ with the close of the transaction to acquire Wells Fargo Funds Management, LLC; Wells Capital Management LLC; Galliard Capital Management LLC.; Wells Fargo Asset Management (International) Ltd.; Wells Fargo Asset Management Luxembourg S.A.; and Wells Fargo Funds Distributor, LLC, as well as Wells Fargo Bank, N.A.’s business of acting as trustee to its collective investment trusts and all related Wells Fargo Asset Management legal entities. The transaction closed on November 1, 2021, forming Allspring Global Investments, a privately held asset management firm with $451 billion in AUM1 as of March 31, 2022.
“ The Russian invasion of Ukraine dominated the financial world in February and March. Equity, bond, and commodities markets were shaken by fear, uncertainty, and an upending of demand-supply dynamics.”
| 1 | Figures are as of March 31, 2022, unless otherwise noted. Please note that the assets under management figures provided have been adjusted to eliminate any duplication of reporting among assets directed by multiple investment teams and includes $91.2B from Galliard Capital Management ($74.7B stable value; $16.5B fixed income), an investment advisor that is not part of the Allspring trade name/GIPS firm. |
Allspring Opportunity Fund | 3
Letter to shareholders (unaudited)
For further information about your Fund, contact your investment professional, visit our website at allspringglobal.com, or call us directly at 1-800-222-8222. |
Allspring Global Investments™ is a leading independent asset management firm with a full breadth of investment capabilities across diverse asset classes, serving the needs of its institutional and wealth management clients around the world. Allspring operates across 18 offices globally supported by more than 480 investment professionals. Allspring and its investment teams provide a broad range of differentiated investment products and solutions to help its diverse range of clients meet their investment objectives.
As part of this transition, all mutual funds within the Wells Fargo Funds family were rebranded as Allspring Funds. Each individual fund had “Wells Fargo” removed from its fund name and replaced with “Allspring.” The fund name changes went into effect on December 6, 2021.
Allspring Global Investments™ is the trade name for the asset management firm of Allspring Global Investments Holdings, LLC, a holding company indirectly owned by certain private funds of GTCR LLC and Reverence Capital Partners, L.P.
Thank you for choosing to invest with Allspring Funds. We appreciate your confidence in us and remain committed to helping you meet your financial needs.
Sincerely,
Andrew Owen
President
Allspring Funds
Notice to Shareholders
Russia launched a large-scale invasion of Ukraine on February 24, 2022. As a result of this military action, the United States and many other countries have instituted various economic sanctions against Russian and Belarus individuals and entities. The situation has led to increased financial market volatility and could have severe adverse effects on regional and global economic markets, including the markets for certain securities and commodities, such as oil and natural gas. The extent and duration of the military action, resulting sanctions imposed, other punitive action taken and the resulting market disruptions cannot be easily predicted.
Our solidarity and support goes out to our impacted employees and the people affected in Ukraine and their families. Allspring has a dedicated team of investment professionals actively monitoring the situation for any new developments and the potential impact to our clients and investment products. As the situation remains fluid, we are focused on the assessment of risks, valuation, and liquidity of impacted securities. Please visit our website at allspringglobal.com and click on “Russia-Ukraine Portfolio Impacts” for further information.
4 | Allspring Opportunity Fund
This page is intentionally left blank.
Performance highlights (unaudited)
| Investment objective | The Fund seeks long-term capital appreciation. |
| Manager | Allspring Funds Management, LLC |
| Subadviser | Allspring Global Investments, LLC |
| Portfolio managers | Kurt Gunderson, Christopher G. Miller, CFA®‡ |
| Average annual total returns (%) as of March 31, 2022 |
| | | Including sales charge | | Excluding sales charge | | Expense ratios1 (%) |
| | Inception date | 1 year | 5 year | 10 year | | 1 year | 5 year | 10 year | | Gross | Net 2 |
| Class A (SOPVX) | 2-24-2000 | 2.96 | 12.42 | 11.44 | | 9.25 | 13.76 | 12.10 | | 1.20 | 1.18 |
| Class C (WFOPX) | 3-31-2008 | 7.47 | 13.19 | 11.40 | | 8.47 | 13.19 | 11.40 | | 1.95 | 1.93 |
| Class R6 (WOFRX)3 | 5-29-2020 | – | – | – | | 9.74 | 14.26 | 12.61 | | 0.77 | 0.72 |
| Administrator Class (WOFDX) | 8-30-2002 | – | – | – | | 9.45 | 13.97 | 12.33 | | 1.12 | 1.00 |
| Institutional Class (WOFNX) | 7-30-2010 | – | – | – | | 9.71 | 14.25 | 12.60 | | 0.87 | 0.75 |
| Russell 3000® Index4 | – | – | – | – | | 11.92 | 15.40 | 14.28 | | – | – |
Figures quoted represent past performance, which is no guarantee of future results, and do not reflect taxes that a shareholder may pay on an investment in a fund. Investment return and principal value of an investment will fluctuate so that an investor’s shares, when redeemed, may be worth more or less than their original cost. Performance shown without sales charges would be lower if sales charges were reflected. Current performance may be lower or higher than the performance data quoted, which assumes the reinvestment of dividends and capital gains. Current month-end performance is available on the Fund’s website, allspringglobal.com.
Index returns do not include transaction costs associated with buying and selling securities, any mutual fund fees or expenses, or any taxes. It is not possible to invest directly in an index.
For Class A shares, the maximum front-end sales charge is 5.75%. For Class C shares, the maximum contingent deferred sales charge is 1.00%. Performance including a contingent deferred sales charge assumes the sales charge for the corresponding time period. Class R6, Administrator Class and Institutional Class shares are sold without a front-end sales charge or contingent deferred sales charge.
| 1 | Reflects the expense ratios as stated in the most recent prospectuses. The expense ratios shown are subject to change and may differ from the annualized expense ratios shown in the financial highlights of this report. |
| 2 | The manager has contractually committed through January 31, 2023, to waive fees and/or reimburse expenses to the extent necessary to cap total annual fund operating expenses after fee waivers at 1.18% for Class A, 1.93% for Class C, 0.72% for Class R6, 1.00% for Administrator Class, and 0.75% for Institutional Class. Brokerage commissions, stamp duty fees, interest, taxes, acquired fund fees and expenses (if any), and extraordinary expenses are excluded from the expense caps. Prior to or after the commitment expiration date, the caps may be increased or the commitment to maintain the caps may be terminated only with the approval of the Board of Trustees. Without these caps, the Fund’s returns would have been lower. The expense ratio paid by an investor is the net expense ratio (the total annual fund operating expenses after fee waivers) as stated in the prospectuses. |
| 3 | Historical performance shown for the Class R6 shares prior to their inception reflects the performance of the Institutional Class shares, and includes the higher expenses applicable to the Institutional Class shares. If these expenses had not been included, returns for the Class R6 shares would be higher. |
| 4 | The Russell 3000® Index measures the performance of the 3,000 largest U.S. companies based on total market capitalization, which represents approximately 98% of the investable U.S. equity market. You cannot invest directly in an index. |
Stock values fluctuate in response to the activities of individual companies and general market and economic conditions. Smaller-company stocks tend to be more volatile and less liquid than those of larger companies. Certain investment strategies tend to increase the total risk of an investment (relative to the broader market). This fund is exposed to foreign investment risk. Consult the Fund’s prospectus for additional information on these and other risks.
| ‡ | CFA® and Chartered Financial Analyst® are trademarks owned by CFA Institute. |
6 | Allspring Opportunity Fund
Performance highlights (unaudited)
| Ten largest holdings (%) as of March 31, 20221 |
| Apple Incorporated | 5.02 |
| Alphabet Incorporated Class C | 4.88 |
| Amazon.com Incorporated | 4.29 |
| Salesforce.com Incorporated | 2.95 |
| Texas Instruments Incorporated | 2.68 |
| UnitedHealth Group Incorporated | 2.51 |
| Meta Platforms Incorporated Class A | 2.48 |
| Teledyne Technologies Incorporated | 2.32 |
| MasterCard Incorporated Class A | 2.27 |
| Carlisle Companies Incorporated | 2.09 |
| 1 | Figures represent the percentage of the Fund's net assets. Holdings are subject to change and may have changed since the date specified. |
| Sector allocation as of March 31, 20221 |
| 1 | Figures represent the percentage of the Fund's long-term investments. These amounts are subject to change and may have changed since the date specified. |
Allspring Opportunity Fund | 7
Fund expenses (unaudited)
As a shareholder of the Fund, you incur two types of costs: (1) transaction costs, including sales charges (loads) on purchase payments and contingent deferred sales charges (if any) on redemptions and (2) ongoing costs, including management fees, distribution (12b-1) and/or shareholder servicing fees, and other Fund expenses. This example is intended to help you understand your ongoing costs (in dollars) of investing in the Fund and to compare these costs with the ongoing costs of investing in other mutual funds.
The example is based on an investment of $1,000 invested at the beginning of the six-month period and held for the entire period from October 1, 2021 to March 31, 2022.
Actual expenses
The “Actual” line of the table below provides information about actual account values and actual expenses. You may use the information in this line, together with the amount you invested, to estimate the expenses that you paid over the period. Simply divide your account value by $1,000 (for example, an $8,600 account value divided by $1,000 = 8.6), then multiply the result by the number in the “Actual” line under the heading entitled “Expenses paid during period” for your applicable class of shares to estimate the expenses you paid on your account during this period.
Hypothetical example for comparison purposes
The “Hypothetical” line of the table below provides information about hypothetical account values and hypothetical expenses based on the Fund’s actual expense ratio and an assumed rate of return of 5% per year before expenses, which is not the Fund’s actual return. The hypothetical account values and expenses may not be used to estimate the actual ending account balance or expenses you paid for the period. You may use this information to compare the ongoing costs of investing in the Fund and other funds. To do so, compare this 5% hypothetical example with the 5% hypothetical examples that appear in the shareholder reports of the other funds.
Please note that the expenses shown in the table are meant to highlight your ongoing costs only and do not reflect any transactional costs, such as sales charges (loads) and contingent deferred sales charges. Therefore, the “Hypothetical” line of the table is useful in comparing ongoing costs only, and will not help you determine the relative total costs of owning different funds. In addition, if these transactional costs were included, your costs would have been higher.
| | Beginning
account value
10-1-2021 | Ending
account value
3-31-2022 | Expenses
paid during
the period1 | Annualized net
expense ratio |
| Class A | | | | |
| Actual | $1,000.00 | $ 989.20 | $5.75 | 1.16% |
| Hypothetical (5% return before expenses) | $1,000.00 | $1,019.15 | $5.84 | 1.16% |
| Class C | | | | |
| Actual | $1,000.00 | $ 985.85 | $9.21 | 1.86% |
| Hypothetical (5% return before expenses) | $1,000.00 | $1,015.66 | $9.35 | 1.86% |
| Class R6 | | | | |
| Actual | $1,000.00 | $ 991.48 | $3.57 | 0.72% |
| Hypothetical (5% return before expenses) | $1,000.00 | $1,021.34 | $3.63 | 0.72% |
| Administrator Class | | | | |
| Actual | $1,000.00 | $ 990.09 | $4.86 | 0.98% |
| Hypothetical (5% return before expenses) | $1,000.00 | $1,020.04 | $4.94 | 0.98% |
| Institutional Class | | | | |
| Actual | $1,000.00 | $ 991.15 | $3.72 | 0.75% |
| Hypothetical (5% return before expenses) | $1,000.00 | $1,021.19 | $3.78 | 0.75% |
1 Expenses paid is equal to the annualized net expense ratio of each class multiplied by the average account value over the period, multiplied by 182 divided by 365 (to reflect the one-half-year period).
8 | Allspring Opportunity Fund
Portfolio of investments—March 31, 2022 (unaudited)
| | | | | Shares | Value |
| Common stocks: 98.54% | | | | | |
| Communication services: 9.06% | | | | | |
| Interactive media & services: 7.36% | | | | | |
| Alphabet Incorporated Class C † | | | | 34,564 | $ 96,536,906 |
| Meta Platforms Incorporated Class A † | | | | 221,090 | 49,161,572 |
| | | | | | 145,698,478 |
| Wireless telecommunication services: 1.70% | | | | | |
| T-Mobile US Incorporated † | | | | 262,318 | 33,668,515 |
| Consumer discretionary: 11.74% | | | | | |
| Internet & direct marketing retail: 4.70% | | | | | |
| Amazon.com Incorporated † | | | | 26,049 | 84,918,438 |
| Farfetch Limited Class A † | | | | 537,632 | 8,128,996 |
| | | | | | 93,047,434 |
| Multiline retail: 1.72% | | | | | |
| Dollar General Corporation | | | | 153,278 | 34,124,281 |
| Specialty retail: 4.23% | | | | | |
| Burlington Stores Incorporated † | | | | 130,456 | 23,765,170 |
| The Home Depot Incorporated | | | | 123,351 | 36,922,655 |
| Ulta Beauty Incorporated † | | | | 57,862 | 23,041,806 |
| | | | | | 83,729,631 |
| Textiles, apparel & luxury goods: 1.09% | | | | | |
| Deckers Outdoor Corporation † | | | | 78,763 | 21,562,947 |
| Consumer staples: 2.82% | | | | | |
| Food & staples retailing: 1.57% | | | | | |
| Sysco Corporation | | | | 381,314 | 31,134,288 |
| Household products: 1.25% | | | | | |
| Church & Dwight Company Incorporated | | | | 248,456 | 24,691,557 |
| Financials: 6.71% | | | | | |
| Capital markets: 4.99% | | | | | |
| CME Group Incorporated | | | | 60,272 | 14,336,298 |
| Intercontinental Exchange Incorporated | | | | 247,054 | 32,640,774 |
| S&P Global Incorporated | | | | 65,431 | 26,838,488 |
| The Charles Schwab Corporation | | | | 295,293 | 24,896,153 |
| | | | | | 98,711,713 |
| Insurance: 1.72% | | | | | |
| Marsh & McLennan Companies Incorporated | | | | 200,125 | 34,105,303 |
| Health care: 11.59% | | | | | |
| Health care equipment & supplies: 4.61% | | | | | |
| Boston Scientific Corporation † | | | | 768,750 | 34,047,938 |
| LivaNova plc † | | | | 379,066 | 31,018,971 |
| Medtronic plc | | | | 236,709 | 26,262,864 |
| | | | | | 91,329,773 |
The accompanying notes are an integral part of these financial statements.
Allspring Opportunity Fund | 9
Portfolio of investments—March 31, 2022 (unaudited)
| | | | | Shares | Value |
| Health care providers & services: 2.51% | | | | | |
| UnitedHealth Group Incorporated | | | | 97,449 | $ 49,696,067 |
| Health care technology: 0.50% | | | | | |
| Schrodinger Incorporated † | | | | 289,748 | 9,886,202 |
| Life sciences tools & services: 3.97% | | | | | |
| Agilent Technologies Incorporated | | | | 169,978 | 22,493,184 |
| Bio-Rad Laboratories Incorporated Class A † | | | | 39,388 | 22,184,503 |
| Thermo Fisher Scientific Incorporated | | | | 57,282 | 33,833,613 |
| | | | | | 78,511,300 |
| Industrials: 16.48% | | | | | |
| Aerospace & defense: 1.30% | | | | | |
| MTU Aero Engines AG | | | | 111,327 | 25,747,701 |
| Building products: 3.14% | | | | | |
| Carlisle Companies Incorporated | | | | 168,549 | 41,449,570 |
| The AZEK Company Incorporated † | | | | 837,857 | 20,812,368 |
| | | | | | 62,261,938 |
| Commercial services & supplies: 1.75% | | | | | |
| Republic Services Incorporated | | | | 260,988 | 34,580,910 |
| Electrical equipment: 1.49% | | | | | |
| Regal Rexnord Corporation | | | | 198,041 | 29,464,540 |
| Machinery: 3.56% | | | | | |
| Fortive Corporation | | | | 515,905 | 31,434,092 |
| Ingersoll Rand Incorporated | | | | 350,764 | 17,660,967 |
| SPX Corporation † | | | | 432,593 | 21,374,420 |
| | | | | | 70,469,479 |
| Professional services: 2.17% | | | | | |
| CoStar Group Incorporated † | | | | 258,448 | 17,215,221 |
| Dun & Bradstreet Holdings Incorporated † | | | | 1,471,272 | 25,776,685 |
| | | | | | 42,991,906 |
| Trading companies & distributors: 3.07% | | | | | |
| Air Lease Corporation | | | | 654,190 | 29,209,584 |
| United Rentals Incorporated † | | | | 89,095 | 31,647,435 |
| | | | | | 60,857,019 |
| Information technology: 29.75% | | | | | |
| Electronic equipment, instruments & components: 4.16% | | | | | |
| Amphenol Corporation Class A | | | | 482,995 | 36,393,673 |
| Teledyne Technologies Incorporated † | | | | 97,360 | 46,015,257 |
| | | | | | 82,408,930 |
| IT services: 5.23% | | | | | |
| Fidelity National Information Services Incorporated | | | | 331,012 | 33,240,225 |
| Genpact Limited | | | | 581,125 | 25,284,749 |
| MasterCard Incorporated Class A | | | | 126,010 | 45,033,454 |
| | | | | | 103,558,428 |
The accompanying notes are an integral part of these financial statements.
10 | Allspring Opportunity Fund
Portfolio of investments—March 31, 2022 (unaudited)
| | | | | Shares | Value |
| Semiconductors & semiconductor equipment: 4.17% | | | | | |
| Marvell Technology Incorporated | | | | 411,894 | $ 29,536,919 |
| Texas Instruments Incorporated | | | | 289,444 | 53,107,185 |
| | | | | | 82,644,104 |
| Software: 11.17% | | | | | |
| Fair Isaac Corporation † | | | | 63,226 | 29,492,400 |
| Palo Alto Networks Incorporated † | | | | 50,595 | 31,495,893 |
| Riskified Limited Class A †« | | | | 673,881 | 4,070,241 |
| Salesforce.com Incorporated † | | | | 275,321 | 58,456,155 |
| ServiceNow Incorporated † | | | | 52,475 | 29,222,803 |
| Splunk Incorporated † | | | | 220,056 | 32,702,522 |
| Workday Incorporated Class A † | | | | 149,221 | 35,732,461 |
| | | | | | 221,172,475 |
| Technology hardware, storage & peripherals: 5.02% | | | | | |
| Apple Incorporated | | | | 568,778 | 99,314,327 |
| Materials: 3.61% | | | | | |
| Chemicals: 2.56% | | | | | |
| Ashland Global Holdings Incorporated | | | | 311,172 | 30,622,437 |
| Olin Corporation | | | | 384,129 | 20,082,264 |
| | | | | | 50,704,701 |
| Metals & mining: 1.05% | | | | | |
| Steel Dynamics Incorporated | | | | 248,748 | 20,753,046 |
| Real estate: 6.78% | | | | | |
| Equity REITs: 6.78% | | | | | |
| American Tower Corporation | | | | 127,382 | 32,000,906 |
| Equinix Incorporated | | | | 48,293 | 35,815,055 |
| Sun Communities Incorporated | | | | 178,661 | 31,317,487 |
| VICI Properties Incorporated | | | | 1,233,670 | 35,110,248 |
| | | | | | 134,243,696 |
| Total Common stocks (Cost $1,150,954,954) | | | | | 1,951,070,689 |
| | | Yield | | | |
| Short-term investments: 1.66% | | | | | |
| Investment companies: 1.66% | | | | | |
| Allspring Government Money Market Fund Select Class ♠∞ | | 0.18% | | 29,319,832 | 29,319,832 |
| Securities Lending Cash Investments LLC ♠∩∞ | | 0.40 | | 3,545,750 | 3,545,750 |
| Total Short-term investments (Cost $32,865,582) | | | | | 32,865,582 |
| Total investments in securities (Cost $1,183,820,536) | 100.20% | | | | 1,983,936,271 |
| Other assets and liabilities, net | (0.20) | | | | (3,864,804) |
| Total net assets | 100.00% | | | | $1,980,071,467 |
| † | Non-income-earning security |
| « | All or a portion of this security is on loan. |
| ♠ | The issuer of the security is an affiliated person of the Fund as defined in the Investment Company Act of 1940. |
| ∩ | The investment is a non-registered investment company purchased with cash collateral received from securities on loan. |
| ∞ | The rate represents the 7-day annualized yield at period end. |
The accompanying notes are an integral part of these financial statements.
Allspring Opportunity Fund | 11
Portfolio of investments—March 31, 2022 (unaudited)
| Abbreviations: |
| REIT | Real estate investment trust |
Investments in affiliates
An affiliated investment is an investment in which the Fund owns at least 5% of the outstanding voting shares of the issuer or as a result of other relationships, such as the Fund and the issuer having the same investment manager. Transactions with issuers that were affiliates of the Fund at the end of the period were as follows:
| | Value,
beginning of
period | Purchases | Sales
proceeds | Net
realized
gains
(losses) | | Net
change in
unrealized
gains
(losses) | | Value,
end of
period | Shares,
end
of period | Income
from
affiliated
securities |
| Short-term investments | | | | | | | | | |
| Allspring Government Money Market Fund Select Class | $35,794,530 | $158,519,768 | $(164,994,466) | $0 | | $0 | | $ 29,319,832 | 29,319,832 | $ 5,985 |
| Securities Lending Cash Investments LLC | 0 | 68,513,510 | (64,967,760) | 0 | | 0 | | 3,545,750 | 3,545,750 | 2,143 # |
| | | | | $0 | | $0 | | $32,865,582 | | $8,128 |
| # | Amount shown represents income before fees and rebates. |
The accompanying notes are an integral part of these financial statements.
12 | Allspring Opportunity Fund
Statement of assets and liabilities—March 31, 2022 (unaudited)
| | |
| Assets | |
Investments in unaffiliated securities (including $3,425,740 of securities loaned), at value (cost $1,150,954,954)
| $ 1,951,070,689 |
Investments in affiliated securities, at value (cost $32,865,582)
| 32,865,582 |
Foreign currency, at value (cost $61)
| 59 |
Receivable for dividends
| 2,229,637 |
Receivable for Fund shares sold
| 91,714 |
Receivable for securities lending income, net
| 1,280 |
Prepaid expenses and other assets
| 98,626 |
Total assets
| 1,986,357,587 |
| Liabilities | |
Payable upon receipt of securities loaned
| 3,545,750 |
Management fee payable
| 1,127,485 |
Payable for Fund shares redeemed
| 583,486 |
Shareholder servicing fees payable
| 401,228 |
Administration fees payable
| 324,274 |
Trustees’ fees and expenses payable
| 2,803 |
Distribution fee payable
| 713 |
Accrued expenses and other liabilities
| 300,381 |
Total liabilities
| 6,286,120 |
Total net assets
| $1,980,071,467 |
| Net assets consist of | |
Paid-in capital
| $ 1,081,206,050 |
Total distributable earnings
| 898,865,417 |
Total net assets
| $1,980,071,467 |
| Computation of net asset value and offering price per share | |
Net assets – Class A
| $ 1,680,817,120 |
Shares outstanding – Class A1
| 33,255,453 |
Net asset value per share – Class A
| $50.54 |
Maximum offering price per share – Class A2
| $53.62 |
Net assets – Class C
| $ 1,947,436 |
Shares outstanding – Class C1
| 42,846 |
Net asset value per share – Class C
| $45.45 |
Net assets – Class R6
| $ 34,781 |
Shares outstanding – Class R61
| 590 |
Net asset value per share – Class R6
| $58.95 |
Net assets – Administrator Class
| $ 267,371,074 |
Shares outstanding – Administrator Class1
| 4,666,672 |
Net asset value per share – Administrator Class
| $57.29 |
Net assets – Institutional Class
| $ 29,901,056 |
Shares outstanding – Institutional Class1
| 507,483 |
Net asset value per share – Institutional Class
| $58.92 |
| 1 | The Fund has an unlimited number of authorized shares. |
| 2 | Maximum offering price is computed as 100/94.25 of net asset value. On investments of $50,000 or more, the offering price is reduced. |
The accompanying notes are an integral part of these financial statements.
Allspring Opportunity Fund | 13
Statement of operations—six months ended March 31, 2022 (unaudited)
| | |
| Investment income | |
Dividends
| $ 7,667,770 |
Income from affiliated securities
| 13,483 |
Total investment income
| 7,681,253 |
| Expenses | |
Management fee
| 7,444,177 |
| Administration fees | |
Class A
| 1,854,497 |
Class C
| 2,149 |
Class R6
| 5 |
Administrator Class
| 181,226 |
Institutional Class
| 19,569 |
| Shareholder servicing fees | |
Class A
| 2,207,734 |
Class C
| 2,558 |
Administrator Class
| 345,026 |
| Distribution fee | |
Class C
| 6,827 |
Custody and accounting fees
| 41,772 |
Professional fees
| 26,630 |
Registration fees
| 27,786 |
Shareholder report expenses
| 46,525 |
Trustees’ fees and expenses
| 10,683 |
Other fees and expenses
| 23,716 |
Total expenses
| 12,240,880 |
| Less: Fee waivers and/or expense reimbursements | |
Fund-level
| (147,161) |
Class A
| (206,898) |
Class C
| (25) |
Class R6
| (3) |
Administrator Class
| (109,310) |
Institutional Class
| (8,656) |
Net expenses
| 11,768,827 |
Net investment loss
| (4,087,574) |
| Realized and unrealized gains (losses) on investments | |
Net realized gains on investments
| 124,422,557 |
Net change in unrealized gains (losses) on investments
| (139,051,038) |
Net realized and unrealized gains (losses) on investments
| (14,628,481) |
Net decrease in net assets resulting from operations
| $ (18,716,055) |
The accompanying notes are an integral part of these financial statements.
14 | Allspring Opportunity Fund
Statement of changes in net assets
| | | | | |
| | Six months ended
March 31, 2022
(unaudited) | Year ended
September 30, 2021 |
| Operations | | | | |
Net investment loss
| | $ (4,087,574) | | $ (6,769,361) |
Net realized gains on investments
| | 124,422,557 | | 229,877,061 |
Net change in unrealized gains (losses) on investments
| | (139,051,038) | | 333,757,695 |
Net increase (decrease) in net assets resulting from operations
| | (18,716,055) | | 556,865,395 |
| Distributions to shareholders from | | | | |
| Net investment income and net realized gains | | | | |
Class A
| | (202,195,613) | | (96,777,520) |
Class C
| | (256,382) | | (127,070) |
Class R6
| | (3,523) | | (1,744) |
Administrator Class
| | (28,631,690) | | (13,847,101) |
Institutional Class
| | (3,020,160) | | (1,540,976) |
Total distributions to shareholders
| | (234,107,368) | | (112,294,411) |
| Capital share transactions | Shares | | Shares | |
| Proceeds from shares sold | | | | |
Class A
| 173,170 | 9,400,401 | 269,191 | 14,061,865 |
Class C
| 906 | 46,948 | 3,625 | 174,851 |
Administrator Class
| 20,122 | 1,223,237 | 39,573 | 2,271,942 |
Institutional Class
| 88,351 | 5,608,345 | 95,789 | 5,729,224 |
| | | 16,278,931 | | 22,237,882 |
| Reinvestment of distributions | | | | |
Class A
| 3,616,444 | 196,409,057 | 1,960,933 | 94,208,894 |
Class C
| 5,180 | 253,503 | 2,836 | 125,099 |
Class R6
| 56 | 3,523 | 0 | 0 |
Administrator Class
| 437,730 | 26,929,177 | 245,777 | 13,201,487 |
Institutional Class
| 43,679 | 2,761,828 | 25,255 | 1,390,102 |
| | | 226,357,088 | | 108,925,582 |
| Payment for shares redeemed | | | | |
Class A
| (1,642,371) | (89,162,692) | (2,980,120) | (156,844,219) |
Class C
| (2,856) | (144,021) | (20,605) | (957,879) |
Administrator Class
| (180,265) | (11,134,748) | (348,167) | (20,269,914) |
Institutional Class
| (70,935) | (4,512,697) | (151,404) | (9,034,116) |
| | | (104,954,158) | | (187,106,128) |
Net increase (decrease) in net assets resulting from capital share transactions
| | 137,681,861 | | (55,942,664) |
Total increase (decrease) in net assets
| | (115,141,562) | | 388,628,320 |
| Net assets | | | | |
Beginning of period
| | 2,095,213,029 | | 1,706,584,709 |
End of period
| | $1,980,071,467 | | $2,095,213,029 |
The accompanying notes are an integral part of these financial statements.
Allspring Opportunity Fund | 15
Financial highlights
(For a share outstanding throughout each period)
| | | Year ended September 30 |
| Class A | Six months ended
March 31, 2022
(unaudited) | 2021 | 2020 | 2019 | 2018 | 2017 |
Net asset value, beginning of period
| $57.30 | $45.64 | $43.37 | $46.31 | $45.83 | $41.86 |
Net investment income (loss)
| (0.11) | (0.20) | 0.01 | 0.10 | (0.01) 1 | 0.04 |
Payment from affiliate
| 0.00 | 0.00 | 0.00 2 | 0.00 | 0.00 | 0.00 |
Net realized and unrealized gains (losses) on investments
| (0.05) | 14.95 | 4.85 | 1.54 | 6.41 | 6.60 |
Total from investment operations
| (0.16) | 14.75 | 4.86 | 1.64 | 6.40 | 6.64 |
| Distributions to shareholders from | | | | | | |
Net investment income
| 0.00 | (0.02) | (0.10) | 0.00 | (0.17) | (0.13) |
Net realized gains
| (6.60) | (3.07) | (2.49) | (4.58) | (5.75) | (2.54) |
Total distributions to shareholders
| (6.60) | (3.09) | (2.59) | (4.58) | (5.92) | (2.67) |
Net asset value, end of period
| $50.54 | $57.30 | $45.64 | $43.37 | $46.31 | $45.83 |
Total return3
| (1.08)% | 33.63% | 11.62% 4 | 5.18% | 15.16% | 16.49% |
| Ratios to average net assets (annualized) | | | | | | |
Gross expenses
| 1.19% | 1.20% | 1.21% | 1.21% | 1.20% | 1.21% |
Net expenses
| 1.16% | 1.17% | 1.16% | 1.19% | 1.20% | 1.21% |
Net investment income (loss)
| (0.42)% | (0.37)% | 0.04% | 0.23% | (0.01)% | 0.11% |
| Supplemental data | | | | | | |
Portfolio turnover rate
| 9% | 29% | 43% | 28% | 30% | 43% |
Net assets, end of period (000s omitted)
| $1,680,817 | $1,782,585 | $1,453,975 | $1,461,345 | $1,528,852 | $1,479,457 |
| 1 | Calculated based upon average shares outstanding |
| 2 | Amount is less than $0.005. |
| 3 | Total return calculations do not include any sales charges. Returns for periods of less than one year are not annualized. |
| 4 | During the year ended September 30, 2020, the Fund received a payment from an affiliate that had an impact of less than 0.005% on the total return. |
The accompanying notes are an integral part of these financial statements.
16 | Allspring Opportunity Fund
Financial highlights
(For a share outstanding throughout each period)
| | | Year ended September 30 |
| Class C | Six months ended
March 31, 2022
(unaudited) | 2021 | 2020 | 2019 | 2018 | 2017 |
Net asset value, beginning of period
| $52.32 | $42.19 | $40.02 | $43.43 | $43.46 | $39.99 |
Net investment loss
| (0.27) 1 | (0.55) 1 | (0.28) 1 | (0.26) 1 | (0.43) | (0.26) 1 |
Payment from affiliate
| 0.00 | 0.00 | 0.54 | 0.00 | 0.00 | 0.00 |
Net realized and unrealized gains (losses) on investments
| 0.00 | 13.75 | 4.40 | 1.43 | 6.15 | 6.27 |
Total from investment operations
| (0.27) | 13.20 | 4.66 | 1.17 | 5.72 | 6.01 |
| Distributions to shareholders from | | | | | | |
Net realized gains
| (6.60) | (3.07) | (2.49) | (4.58) | (5.75) | (2.54) |
Net asset value, end of period
| $45.45 | $52.32 | $42.19 | $40.02 | $43.43 | $43.46 |
Total return2
| (1.42)% | 32.65% | 12.13% 3 | 4.37% | 14.31% | 15.62% |
| Ratios to average net assets (annualized) | | | | | | |
Gross expenses
| 1.86% | 1.92% | 1.94% | 1.96% | 1.95% | 1.96% |
Net expenses
| 1.86% | 1.91% | 1.92% | 1.95% | 1.95% | 1.96% |
Net investment loss
| (1.12)% | (1.12)% | (0.71)% | (0.69)% | (0.76)% | (0.64)% |
| Supplemental data | | | | | | |
Portfolio turnover rate
| 9% | 29% | 43% | 28% | 30% | 43% |
Net assets, end of period (000s omitted)
| $1,947 | $2,073 | $2,268 | $3,739 | $31,381 | $33,057 |
| 1 | Calculated based upon average shares outstanding |
| 2 | Total return calculations do not include any sales charges. Returns for periods of less than one year are not annualized. |
| 3 | During the year ended September 30, 2020, the Fund received a payment from an affiliate which had a 1.44% impact on the total return. |
The accompanying notes are an integral part of these financial statements.
Allspring Opportunity Fund | 17
Financial highlights
(For a share outstanding throughout each period)
| | | Year ended September 30 |
| Class R6 | Six months ended
March 31, 2022
(unaudited) | 2021 | 2020 1 |
Net asset value, beginning of period
| $65.66 | $51.83 | $46.84 |
Net investment income
| 0.01 2 | 0.04 | 0.04 |
Net realized and unrealized gains (losses) on investments
| (0.12) | 17.06 | 4.95 |
Total from investment operations
| (0.11) | 17.10 | 4.99 |
| Distributions to shareholders from | | | |
Net investment income
| 0.00 | (0.20) | 0.00 |
Net realized gains
| (6.60) | (3.07) | 0.00 |
Total distributions to shareholders
| (6.60) | (3.27) | 0.00 |
Net asset value, end of period
| $58.95 | $65.66 | $51.83 |
Total return3
| (0.85)% | 34.23% | 10.65% |
| Ratios to average net assets (annualized) | | | |
Gross expenses
| 0.75% | 0.76% | 0.76% |
Net expenses
| 0.72% | 0.72% | 0.72% |
Net investment income
| 0.02% | 0.08% | 0.25% |
| Supplemental data | | | |
Portfolio turnover rate
| 9% | 29% | 43% |
Net assets, end of period (000s omitted)
| $35 | $35 | $28 |
| 1 | For the period from May 29, 2020 (commencement of class operations) to September 30, 2020 |
| 2 | Calculated based upon average shares outstanding |
| 3 | Returns for periods of less than one year are not annualized. |
The accompanying notes are an integral part of these financial statements.
18 | Allspring Opportunity Fund
Financial highlights
(For a share outstanding throughout each period)
| | | Year ended September 30 |
| Administrator Class | Six months ended
March 31, 2022
(unaudited) | 2021 | 2020 | 2019 | 2018 | 2017 |
Net asset value, beginning of period
| $64.07 | $50.68 | $47.85 | $50.50 | $49.45 | $44.93 |
Net investment income (loss)
| (0.07) 1 | (0.10) | 0.18 | 0.21 | 0.07 | 0.15 1 |
Net realized and unrealized gains (losses) on investments
| (0.11) | 16.65 | 5.30 | 1.73 | 6.97 | 7.09 |
Total from investment operations
| (0.18) | 16.55 | 5.48 | 1.94 | 7.04 | 7.24 |
| Distributions to shareholders from | | | | | | |
Net investment income
| 0.00 | (0.09) | (0.16) | (0.01) | (0.24) | (0.18) |
Net realized gains
| (6.60) | (3.07) | (2.49) | (4.58) | (5.75) | (2.54) |
Total distributions to shareholders
| (6.60) | (3.16) | (2.65) | (4.59) | (5.99) | (2.72) |
Net asset value, end of period
| $57.29 | $64.07 | $50.68 | $47.85 | $50.50 | $49.45 |
Total return2
| (0.99)% | 33.87% | 11.85% | 5.37% | 15.38% | 16.74% |
| Ratios to average net assets (annualized) | | | | | | |
Gross expenses
| 1.11% | 1.12% | 1.13% | 1.13% | 1.12% | 1.13% |
Net expenses
| 0.98% | 0.98% | 0.97% | 1.00% | 1.00% | 1.00% |
Net investment income (loss)
| (0.24)% | (0.18)% | 0.22% | 0.42% | 0.19% | 0.31% |
| Supplemental data | | | | | | |
Portfolio turnover rate
| 9% | 29% | 43% | 28% | 30% | 43% |
Net assets, end of period (000s omitted)
| $267,371 | $281,217 | $225,604 | $227,963 | $244,110 | $237,315 |
| 1 | Calculated based upon average shares outstanding |
| 2 | Returns for periods of less than one year are not annualized. |
The accompanying notes are an integral part of these financial statements.
Allspring Opportunity Fund | 19
Financial highlights
(For a share outstanding throughout each period)
| | | Year ended September 30 |
| Institutional Class | Six months ended
March 31, 2022
(unaudited) | 2021 | 2020 | 2019 | 2018 | 2017 |
Net asset value, beginning of period
| $65.64 | $51.83 | $48.89 | $51.50 | $50.30 | $45.63 |
Net investment income (loss)
| (0.00) 1 | 0.03 2 | 0.34 | 0.35 | 0.22 | 0.22 2 |
Net realized and unrealized gains (losses) on investments
| (0.12) | 17.04 | 5.37 | 1.74 | 7.08 | 7.25 |
Total from investment operations
| (0.12) | 17.07 | 5.71 | 2.09 | 7.30 | 7.47 |
| Distributions to shareholders from | | | | | | |
Net investment income
| 0.00 | (0.19) | (0.28) | (0.12) | (0.35) | (0.26) |
Net realized gains
| (6.60) | (3.07) | (2.49) | (4.58) | (5.75) | (2.54) |
Total distributions to shareholders
| (6.60) | (3.26) | (2.77) | (4.70) | (6.10) | (2.80) |
Net asset value, end of period
| $58.92 | $65.64 | $51.83 | $48.89 | $51.50 | $50.30 |
Total return3
| (0.87)% | 34.20% | 12.09% | 5.63% | 15.69% | 17.02% |
| Ratios to average net assets (annualized) | | | | | | |
Gross expenses
| 0.87% | 0.87% | 0.88% | 0.88% | 0.87% | 0.88% |
Net expenses
| 0.75% | 0.75% | 0.75% | 0.75% | 0.75% | 0.75% |
Net investment income
| (0.00)% | 0.05% | 0.44% | 0.66% | 0.44% | 0.47% |
| Supplemental data | | | | | | |
Portfolio turnover rate
| 9% | 29% | 43% | 28% | 30% | 43% |
Net assets, end of period (000s omitted)
| $29,901 | $29,303 | $24,710 | $26,447 | $29,562 | $29,709 |
| 1 | Amount is more than $(0.005) |
| 2 | Calculated based upon average shares outstanding |
| 3 | Returns for periods of less than one year are not annualized. |
The accompanying notes are an integral part of these financial statements.
20 | Allspring Opportunity Fund
Notes to financial statements (unaudited)
1. ORGANIZATION
Allspring Funds Trust (the "Trust"), a Delaware statutory trust organized on March 10, 1999, is an open-end management investment company registered under the Investment Company Act of 1940, as amended (the "1940 Act"). As an investment company, the Trust follows the accounting and reporting guidance in Financial Accounting Standards Board ("FASB") Accounting Standards Codification Topic 946, Financial Services – Investment Companies. These financial statements report on the Allspring Opportunity Fund (the "Fund") which is a diversified series of the Trust.
Effective on November 1, 2021, the sale transaction of Wells Fargo Asset Management ("WFAM") by Wells Fargo & Company to GTCR LLC and Reverence Capital Partners, L.P. was closed. In connection with the closing of the transaction, WFAM became known as Allspring Global Investments (“Allspring”) and various entities that provided services to the Fund changed their names to "Allspring", including Allspring Funds Management, LLC, the investment manager to the Fund, Allspring Global Investments, LLC and Allspring Global Investments (UK) Limited, both registered investment advisers providing subadvisory services to certain funds, and Allspring Funds Distributor, LLC, the Fund's principal underwriter. Consummation of the transaction resulted in a new investment management agreement and subadvisory agreement which became effective on November 1, 2021.
2. SIGNIFICANT ACCOUNTING POLICIES
The following significant accounting policies, which are consistently followed in the preparation of the financial statements of the Fund, are in conformity with U.S. generally accepted accounting principles which require management to make estimates and assumptions that affect the reported amounts of assets and liabilities, disclosure of contingent assets and liabilities at the date of the financial statements, and the reported amounts of income and expenses during the reporting period. Actual results could differ from those estimates.
Securities valuation
All investments are valued each business day as of the close of regular trading on the New York Stock Exchange (generally 4 p.m. Eastern Time), although the Fund may deviate from this calculation time under unusual or unexpected circumstances.
Equity securities that are listed on a foreign or domestic exchange or market are valued at the official closing price or, if none, the last sales price. If no sale occurs on the principal exchange or market that day, a fair value price will be determined in accordance with the Fund’s Valuation Procedures.
The values of securities denominated in foreign currencies are translated into U.S. dollars at rates provided by an independent foreign currency pricing source at a time each business day specified by the Allspring Global Investments Pricing Committee at Allspring Funds Management, LLC ("Allspring Funds Management").
Many securities markets and exchanges outside the U.S. close prior to the close of the New York Stock Exchange and therefore may not fully reflect trading or events that occur after the close of the principal exchange in which the foreign securities are traded, but before the close of the New York Stock Exchange. If such trading or events are expected to materially affect the value of such securities, then fair value pricing procedures approved by the Board of Trustees of the Fund are applied. These procedures take into account multiple factors including movements in U.S. securities markets after foreign exchanges close. Foreign securities that are fair valued under these procedures are categorized as Level 2 and the application of these procedures may result in transfers between Level 1 and Level 2. Depending on market activity, such fair valuations may be frequent. Such fair value pricing may result in net asset values that are higher or lower than net asset values based on the last reported sales price or latest quoted bid price. On March 31, 2022, such fair value pricing was used in pricing certain foreign securities.
Investments in registered open-end investment companies are valued at net asset value. Interests in non-registered investment companies that are redeemable at net asset value are fair valued normally at net asset value.
Investments which are not valued using any of the methods discussed above are valued at their fair value, as determined in good faith by the Board of Trustees. The Board of Trustees has established a Valuation Committee comprised of the Trustees and has delegated to it the authority to take any actions regarding the valuation of portfolio securities that the Valuation Committee deems necessary or appropriate, including determining the fair value of portfolio securities, unless the determination has been delegated to the Allspring Global Investments Pricing Committee. The Board of Trustees retains the authority to make or ratify any valuation decisions or approve any changes to the Valuation Procedures as it deems appropriate. On a quarterly basis, the Board of Trustees receives reports on any valuation actions taken by the Valuation Committee or the Allspring Global Investments Pricing Committee which may include items for ratification.
Allspring Opportunity Fund | 21
Notes to financial statements (unaudited)
Foreign currency translation
The accounting records of the Fund are maintained in U.S. dollars. The values of other assets and liabilities denominated in foreign currencies are translated into U.S. dollars at rates provided by an independent foreign currency pricing source at a time each business day specified by the Allspring Global Investments Pricing Committee. Purchases and sales of securities, and income and expenses are converted at the rate of exchange on the respective dates of such transactions. Net realized foreign exchange gains or losses arise from sales of foreign currencies, currency gains or losses realized between the trade and settlement dates on securities transactions, and the difference between the amounts of dividends, interest and foreign withholding taxes recorded and the U.S. dollar equivalent of the amounts actually paid or received. Net unrealized foreign exchange gains and losses arise from changes in the fair value of assets and liabilities other than investments in securities resulting from changes in exchange rates. The changes in net assets arising from changes in exchange rates of securities and the changes in net assets resulting from changes in market prices of securities are not separately presented. Such changes are included in net realized and unrealized gains or losses from investments.
Securities lending
The Fund may lend its securities from time to time in order to earn additional income in the form of fees or interest on securities received as collateral or the investment of any cash received as collateral. When securities are on loan, the Fund receives interest or dividends on those securities. Cash collateral received in connection with its securities lending transactions is invested in Securities Lending Cash Investments, LLC (the "Securities Lending Fund"), an affiliated non-registered investment company. Investments in Securities Lending Fund are valued at the evaluated bid price provided by an independent pricing service. Income earned from investment in the Securities Lending Fund (net of fees and rebates), if any, is included in income from affiliated securities on the Statement of Operations.
In a securities lending transaction, the net asset value of the Fund is affected by an increase or decrease in the value of the securities loaned and by an increase or decrease in the value of the instrument in which collateral is invested. The amount of securities lending activity undertaken by the Fund fluctuates from time to time. The Fund has the right under the lending agreement to recover the securities from the borrower on demand. In the event of default or bankruptcy by the borrower, the Fund may be prevented from recovering the loaned securities or gaining access to the collateral or may experience delays or costs in doing so. In such an event, the terms of the agreement allow the unaffiliated securities lending agent to use the collateral to purchase replacement securities on behalf of the Fund or pay the Fund the market value of the loaned securities. The Fund bears the risk of loss with respect to depreciation of its investment of the cash collateral.
Security transactions and income recognition
Securities transactions are recorded on a trade date basis. Realized gains or losses are recorded on the basis of identified cost.
Dividend income is recognized on the ex-dividend date, except for certain dividends from foreign securities, which are recorded as soon as the custodian verifies the ex-dividend date.
Distributions to shareholders
Distributions to shareholders from net investment income and any net realized gains are recorded on the ex-dividend date and paid at least annually. Such distributions are determined in accordance with income tax regulations and may differ from U.S. generally accepted accounting principles. Dividend sources are estimated at the time of declaration. The tax character of distributions is determined as of the Fund's fiscal year end. Therefore, a portion of the Fund's distributions made prior to the Fund’s fiscal year end may be categorized as a tax return of capital at year end.
Federal and other taxes
The Fund intends to continue to qualify as a regulated investment company by distributing substantially all of its investment company taxable income and any net realized capital gains (after reduction for capital loss carryforwards) sufficient to relieve it from all, or substantially all, federal income taxes. Accordingly, no provision for federal income taxes was required.
The Fund’s income and federal excise tax returns and all financial records supporting those returns for the prior three fiscal years are subject to examination by the federal and Delaware revenue authorities. Management has analyzed the Fund's tax positions taken on federal, state, and foreign tax returns for all open tax years and does not believe that there are any uncertain tax positions that require recognition of a tax liability.
22 | Allspring Opportunity Fund
Notes to financial statements (unaudited)
As of March 31, 2022, the aggregate cost of all investments for federal income tax purposes was $1,182,557,191 and the unrealized gains (losses) consisted of:
| Gross unrealized gains | $862,936,004 |
| Gross unrealized losses | (61,556,924) |
| Net unrealized gains | $801,379,080 |
Class allocations
The separate classes of shares offered by the Fund differ principally in applicable sales charges, distribution, shareholder servicing, and administration fees. Class specific expenses are charged directly to that share class. Investment income, common fund-level expenses, and realized and unrealized gains (losses) on investments are allocated daily to each class of shares based on the relative proportion of net assets of each class.
3. FAIR VALUATION MEASUREMENTS
Fair value measurements of investments are determined within a framework that has established a fair value hierarchy based upon the various data inputs utilized in determining the value of the Fund’s investments. The three-level hierarchy gives the highest priority to unadjusted quoted prices in active markets for identical assets or liabilities (Level 1) and the lowest priority to unobservable inputs (Level 3). The Fund���s investments are classified within the fair value hierarchy based on the lowest level of input that is significant to the fair value measurement. The inputs are summarized into three broad levels as follows:
| ■ | Level 1 – quoted prices in active markets for identical securities |
| ■ | Level 2 – other significant observable inputs (including quoted prices for similar securities, interest rates, prepayment speeds, credit risk, etc.) |
| ■ | Level 3 – significant unobservable inputs (including the Fund’s own assumptions in determining the fair value of investments) |
The inputs or methodologies used for valuing investments in securities are not necessarily an indication of the risk associated with investing in those securities.
The following is a summary of the inputs used in valuing the Fund’s assets and liabilities as of March 31, 2022:
| | Quoted prices
(Level 1) | Other significant
observable inputs
(Level 2) | Significant
unobservable inputs
(Level 3) | Total |
| Assets | | | | |
| Investments in: | | | | |
| Common stocks | | | | |
| Communication services | $ 179,366,993 | $ 0 | $0 | $ 179,366,993 |
| Consumer discretionary | 232,464,293 | 0 | 0 | 232,464,293 |
| Consumer staples | 55,825,845 | 0 | 0 | 55,825,845 |
| Financials | 132,817,016 | 0 | 0 | 132,817,016 |
| Health care | 229,423,342 | 0 | 0 | 229,423,342 |
| Industrials | 300,625,792 | 25,747,701 | 0 | 326,373,493 |
| Information technology | 589,098,264 | 0 | 0 | 589,098,264 |
| Materials | 71,457,747 | 0 | 0 | 71,457,747 |
| Real estate | 134,243,696 | 0 | 0 | 134,243,696 |
| Short-term investments | | | | |
| Investment companies | 32,865,582 | 0 | 0 | 32,865,582 |
| Total assets | $1,958,188,570 | $25,747,701 | $0 | $1,983,936,271 |
Additional sector, industry or geographic detail, if any, is included in the Portfolio of Investments.
For the six months ended March 31, 2022, the Fund did not have any transfers into/out of Level 3.
Allspring Opportunity Fund | 23
Notes to financial statements (unaudited)
4. TRANSACTIONS WITH AFFILIATES
Management fee
Allspring Funds Management, a wholly owned subsidiary of Allspring Global Investments Holdings, LLC, a holding company indirectly owned by certain private funds of GTCR LLC and Reverence Capital Partners, L.P., is the manager of the Fund and provides advisory and fund-level administrative services under an investment management agreement. Under the investment management agreement, Allspring Funds Management is responsible for, among other services, implementing the investment objectives and strategies of the Fund, supervising the subadviser and providing fund-level administrative services in connection with the Fund’s operations. As compensation for its services under the investment management agreement, Allspring Funds Management is entitled to receive a management fee at the following annual rate based on the Fund’s average daily net assets:
| Average daily net assets | Management fee |
| First $500 million | 0.750% |
| Next $500 million | 0.725 |
| Next $1 billion | 0.700 |
| Next $2 billion | 0.675 |
| Next $1 billion | 0.650 |
| Next $5 billion | 0.640 |
| Next $2 billion | 0.630 |
| Next $4 billion | 0.620 |
| Over $16 billion | 0.610 |
For the six months ended March 31, 2022, the management fee was equivalent to an annual rate of 0.72% of the Fund’s average daily net assets.
Allspring Funds Management has retained the services of a subadviser to provide daily portfolio management to the Fund. The fee for subadvisory services is borne by Allspring Funds Management. Allspring Global Investments, LLC ("Allspring Investments"), an affiliate of Allspring Funds Management and a wholly owned subsidiary of Allspring Global Investments Holdings, LLC, is the subadviser to the Fund and is entitled to receive a fee from Allspring Funds Management at an annual rate starting at 0.45% and declining to 0.30% as the average daily net assets of the Fund increase.
Administration fees
Under a class-level administration agreement, Allspring Funds Management provides class-level administrative services to the Fund, which includes paying fees and expenses for services provided by the transfer agent, sub-transfer agents, omnibus account servicers and record-keepers. As compensation for its services under the class-level administration agreement, Allspring Funds Management receives an annual fee which is calculated based on the average daily net assets of each class as follows:
| | Class-level
administration fee |
| Class A | 0.21% |
| Class C | 0.21 |
| Class R6 | 0.03 |
| Administrator Class | 0.13 |
| Institutional Class | 0.13 |
Waivers and/or expense reimbursements
Allspring Funds Management has contractually committed to waive and/or reimburse management and administration fees to the extent necessary to maintain certain net operating expense ratios for the Fund. When each class of the Fund has exceeded its expense cap, Allspring Funds Management will waive fees and/or reimburse expenses from fund-level expenses on a proportionate basis and then from class specific expenses. When only certain classes exceed their expense caps, waivers and/or reimbursements are applied against class specific expenses before fund-level expenses. Allspring Funds Management has
24 | Allspring Opportunity Fund
Notes to financial statements (unaudited)
contractually committed through January 31, 2023 to waive fees and/or reimburse expenses to the extent necessary to cap expenses. Prior to or after the commitment expiration date, the caps may be increased or the commitment to maintain the caps may be terminated only with the approval of the Board of Trustees. As of March 31, 2022, the contractual expense caps are as follows:
| | Expense ratio caps |
| Class A | 1.18% |
| Class C | 1.93 |
| Class R6 | 0.72 |
| Administrator Class | 1.00 |
| Institutional Class | 0.75 |
Distribution fee
The Trust has adopted a distribution plan for Class C shares of the Fund pursuant to Rule 12b-1 under the 1940 Act. A distribution fee is charged to Class C shares and paid to Allspring Funds Distributor, LLC ("Allspring Funds Distributor"), the principal underwriter, an affiliate of Allspring Funds Management, at an annual rate of 0.75% of the average daily net assets of Class C shares.
In addition, Allspring Funds Distributor is entitled to receive the front-end sales charge from the purchase of Class A shares and a contingent deferred sales charge on the redemption of certain Class A shares. Allspring Funds Distributor is also entitled to receive the contingent deferred sales charges from redemptions of Class C shares. For the six months ended March 31, 2022, Allspring Funds Distributor received $1,445 from the sale of Class A shares and $34 in contingent deferred sales charges from redemptions of Class C shares. No contingent deferred sales charges were incurred by Class A shares for the six months ended March 31, 2022.
Shareholder servicing fees
The Trust has entered into contracts with one or more shareholder servicing agents, whereby Class A, Class C and Administrator Class of the Fund are charged a fee at an annual rate of 0.25% of the average daily net assets of each respective class. A portion of these total shareholder servicing fees were paid to affiliates, and to certain entities that were affiliates of the Fund until November 1, 2021.
Interfund transactions
The Fund may purchase or sell portfolio investment securities to certain affiliates pursuant to Rule 17a-7 under the 1940 Act and under procedures adopted by the Board of Trustees. The procedures have been designed to ensure that these interfund transactions, which do not incur broker commissions, are effected at current market prices.
5. INVESTMENT PORTFOLIO TRANSACTIONS
Purchases and sales of investments, excluding U.S. government obligations (if any) and short-term securities, for the six months ended March 31, 2022 were $193,317,943 and $291,432,702, respectively.
6. SECURITIES LENDING TRANSACTIONS
The Fund lends its securities through an unaffiliated securities lending agent and receives collateral in the form of cash or securities with a value at least equal to the value of the securities on loan. The value of the loaned securities is determined at the close of each business day and any increases or decreases in the required collateral are exchanged between the Fund and the counterparty on the next business day. Cash collateral received is invested in the Securities Lending Fund which seeks to provide a positive return compared to the daily Federal Funds Open Rate by investing in high-quality, U.S. dollar-denominated short-term money market instruments and is exempt from registration under Section 3(c)(7) of the 1940 Act. Securities Lending Fund is managed by Allspring Funds Management and is subadvised by Allspring Investments. Allspring Funds Management receives an advisory fee starting at 0.05% and declining to 0.01% as the average daily net assets of the Securities Lending Fund increase. All of the fees received by Allspring Funds Management are paid to Allspring Investments for its services as subadviser.
Allspring Opportunity Fund | 25
Notes to financial statements (unaudited)
In the event of counterparty default or the failure of a borrower to return a loaned security, the Fund has the right to use the collateral to offset any losses incurred. As of March 31, 2022, the Fund had securities lending transactions with the following counterparties which are subject to offset:
| Counterparty | Value of
securities on
loan | Collateral
received1 | Net amount |
| J.P. Morgan Securities LLC | $3,425,740 | $(3,425,740) | $0 |
7. BANK BORROWINGS
The Trust (excluding the money market funds), Allspring Master Trust and Allspring Variable Trust are parties to a $350,000,000 revolving credit agreement whereby the Fund is permitted to use bank borrowings for temporary or emergency purposes, such as to fund shareholder redemption requests. Interest under the credit agreement is charged to the Fund based on a borrowing rate equal to the higher of the Federal Funds rate in effect on that day plus 1.25% or the overnight bank funding rate in effect on that day plus 1.25%. In addition, an annual commitment fee equal to 0.25% of the unused balance is allocated to each participating fund.
For the six months ended March 31, 2022, there were no borrowings by the Fund under the agreement.
8. CONCENTRATION RISKS
As of the end of the period, the Fund concentrated its portfolio of investments in the information technology sector. A fund that invests a substantial portion of its assets in any sector may be more affected by changes in that sector than would be a fund whose investments are not heavily weighted in any sector.
9. INDEMNIFICATION
Under the Fund's organizational documents, the officers and Trustees have been granted certain indemnification rights against certain liabilities that may arise out of performance of their duties to the Fund. The Fund has entered into a separate agreement with each Trustee that converts indemnification rights currently existing under the Fund’s organizational documents into contractual rights that cannot be changed in the future without the consent of the Trustee. Additionally, in the normal course of business, the Fund may enter into contracts with service providers that contain a variety of indemnification clauses. The Fund’s maximum exposure under these arrangements is dependent on future claims that may be made against the Fund and, therefore, cannot be estimated.
10. CORONAVIRUS (COVID-19) PANDEMIC
On March 11, 2020, the World Health Organization announced that it had made the assessment that coronavirus disease 2019 (“COVID-19”) is a pandemic. The impacts of COVID-19 are affecting the entire global economy, individual companies and investment products, the funds, and the market in general. There is significant uncertainty around the extent and duration of business disruptions related to COVID-19 and the impacts may last for an extended period of time. COVID-19 has led to significant uncertainty and volatility in the financial markets.
26 | Allspring Opportunity Fund
Other information (unaudited)
PROXY VOTING INFORMATION
A description of the policies and procedures used to determine how to vote proxies relating to portfolio securities is available without charge, upon request, by calling 1-800-222-8222, visiting our website at allspringglobal.com, or visiting the SEC website at sec.gov. Information regarding how the proxies related to portfolio securities were voted during the most recent 12-month period ended June 30 is available on the website at allspringglobal.com or by visiting the SEC website at sec.gov.
QUARTERLY PORTFOLIO HOLDINGS INFORMATION
The Fund files its complete schedule of portfolio holdings with the SEC for the first and third quarters of each fiscal year as an exhibit to its reports on Form N-PORT. Shareholders may view the filed Form N-PORT by visiting the SEC website at sec.gov.
Allspring Opportunity Fund | 27
Other information (unaudited)
BOARD OF TRUSTEES AND OFFICERS
Each of the Trustees and Officers listed in the table below acts in identical capacities for each fund in the Allspring family of funds, which consists of 138 mutual funds comprising the Allspring Funds Trust, Allspring Variable Trust, Allspring Master Trust and four closed-end funds (collectively the “Fund Complex”). This table should be read in conjunction with the Prospectus and the Statement of Additional Information1. The mailing address of each Trustee and Officer is 525 Market Street, 12th Floor, San Francisco, CA 94105. Each Trustee and Officer serves an indefinite term, however, each Trustee serves such term until reaching the mandatory retirement age established by the Trustees.
Independent Trustees
Name and
year of birth | Position held and
length of service* | Principal occupations during past five years or longer | Current other
public company or
investment
company
directorships |
William R. Ebsworth
(Born 1957) | Trustee,
since 2015 | Retired. From 1984 to 2013, equities analyst, portfolio manager, research director and chief investment officer at Fidelity Management and Research Company in Boston, Tokyo, and Hong Kong, and retired in 2013 as Chief Investment Officer of Fidelity Strategic Advisers, Inc. where he led a team of investment professionals managing client assets. Prior thereto, Board member of Hong Kong Securities Clearing Co., Hong Kong Options Clearing Corp., the Thailand International Fund, Ltd., Fidelity Investments Life Insurance Company, and Empire Fidelity Investments Life Insurance Company. Audit Committee Chair and Investment Committee Chair of the Vincent Memorial Hospital Endowment (non-profit organization). Mr. Ebsworth is a CFA® charterholder. | N/A |
Jane A. Freeman
(Born 1953) | Trustee,
since 2015;
Chair Liaison,
since 2018 | Retired. From 2012 to 2014 and 1999 to 2008, Chief Financial Officer of Scientific Learning Corporation. From 2008 to 2012, Ms. Freeman provided consulting services related to strategic business projects. Prior to 1999, Portfolio Manager at Rockefeller & Co. and Scudder, Stevens & Clark. Board member of the Harding Loevner Funds from 1996 to 2014, serving as both Lead Independent Director and chair of the Audit Committee. Board member of the Russell Exchange Traded Funds Trust from 2011 to 2012 and the chair of the Audit Committee. Ms. Freeman is also an inactive Chartered Financial Analyst. | N/A |
Isaiah Harris, Jr.
(Born 1952) | Trustee,
since 2009; Audit
Committee
Chair,
since 2019 | Retired. Chairman of the Board of CIGNA Corporation from 2009 to 2021, and Director from 2005 to 2008. From 2003 to 2011, Director of Deluxe Corporation. Prior thereto, President and CEO of BellSouth Advertising and Publishing Corp. from 2005 to 2007, President and CEO of BellSouth Enterprises from 2004 to 2005 and President of BellSouth Consumer Services from 2000 to 2003. Emeritus member of the Iowa State University Foundation Board of Governors. Emeritus Member of the Advisory Board of Iowa State University School of Business. Advisory Board Member, Palm Harbor Academy (private school). Advisory Board Member, Fellowship of Christian Athletes. Mr. Harris is a certified public accountant (inactive status). | N/A |
David F. Larcker
(Born 1950) | Trustee,
since 2009 | James Irvin Miller Professor of Accounting at the Graduate School of Business (Emeritus), Stanford University, Director of the Corporate Governance Research Initiative and Senior Faculty of The Rock Center for Corporate Governance since 2006. From 2005 to 2008, Professor of Accounting at the Graduate School of Business, Stanford University. Prior thereto, Ernst & Young Professor of Accounting at The Wharton School, University of Pennsylvania from 1985 to 2005. | N/A |
28 | Allspring Opportunity Fund
Other information (unaudited)
Name and
year of birth | Position held and
length of service* | Principal occupations during past five years or longer | Current other
public company or
investment
company
directorships |
Olivia S. Mitchell
(Born 1953) | Trustee,
since 2006;
Nominating and
Governance
Committee Chair,
since 2018 | International Foundation of Employee Benefit Plans Professor since 1993, Wharton School of the University of Pennsylvania. Director of Wharton’s Pension Research Council and Boettner Center on Pensions & Retirement Research, and Research Associate at the National Bureau of Economic Research. Previously taught at Cornell University from 1978 to 1993. | N/A |
Timothy J. Penny
(Born 1951) | Trustee,
since 1996;
Chair,
since 2018 | President and Chief Executive Officer of Southern Minnesota Initiative Foundation, a non-profit organization, since 2007. Member of the Board of Trustees of NorthStar Education Finance, Inc., a non-profit organization, since 2007. | N/A |
James G. Polisson
(Born 1959) | Trustee,
since 2018 | Retired. Chief Marketing Officer, Source (ETF) UK Services, Ltd, from 2015 to 2017. From 2012 to 2015, Principal of The Polisson Group, LLC, a management consulting, corporate advisory and principal investing company. Chief Executive Officer and Managing Director at Russell Investments, Global Exchange Traded Funds from 2010 to 2012. Managing Director of Barclays Global Investors from 1998 to 2010 and Global Chief Marketing Officer for iShares and Barclays Global Investors from 2000 to 2010. Trustee of the San Francisco Mechanics’ Institute, a non-profit organization, from 2013 to 2015. Board member of the Russell Exchange Traded Fund Trust from 2011 to 2012. Director of Barclays Global Investors Holdings Deutschland GmbH from 2006 to 2009. Mr. Polisson is an attorney and has a retired status with the Massachusetts and District of Columbia Bar Associations. | N/A |
Pamela Wheelock
(Born 1959) | Trustee,
since January
2020; previously
Trustee from
January 2018 to
July 2019 | Board member of the Destination Medical Center Economic Development Agency, Rochester, Minnesota since 2019. Interim President of the McKnight Foundation from January to September 2020. McKnight Foundation Consultant, November 2020 to February 2021. Acting Commissioner, Minnesota Department of Human Services, July 2019 through September 2019. Consultant (part-time), Minnesota Department of Human Services, October 2019 through December 2019. Chief Operating Officer, Twin Cities Habitat for Humanity from 2017 to 2019. Vice President of University Services, University of Minnesota from 2012 to 2016. Prior thereto, on the Board of Directors, Governance Committee and Finance Committee for the Minnesota Philanthropy Partners (Saint Paul Foundation) from 2012 to 2018, Interim Chief Executive Officer of Blue Cross Blue Shield of Minnesota from 2011 to 2012, Chairman of the Board from 2009 to 2012 and Board Director from 2003 to 2015. Vice President, Leadership and Community Engagement, Bush Foundation, Saint Paul, Minnesota (a private foundation) from 2009 to 2011. Executive Vice President and Chief Financial Officer, Minnesota Sports and Entertainment from 2004 to 2009 and Senior Vice President from 2002 to 2004. Executive Vice President of the Minnesota Wild Foundation from 2004 to 2008. Commissioner of Finance, State of Minnesota, from 1999 to 2002. Currently Board Chair of the Minnesota Wild Foundation since 2010. | N/A |
* Length of service dates reflect the Trustee’s commencement of service with the Trust’s predecessor entities, where applicable.
Allspring Opportunity Fund | 29
Other information (unaudited)
Officers2
Name and
year of birth | Position held and
length of service | Principal occupations during past five years or longer |
Andrew Owen
(Born 1960) | President,
since 2017 | President, Chief Executive Officer and Director of Allspring Funds Management, LLC since 2017 and co-president of Galliard Capital Management, LLC, an affiliate of Allspring Funds Management, LLC, since 2019. Prior thereto, Head of Affiliated Managers, Allspring Global Investments, from 2014 to 2019 and Executive Vice President responsible for marketing, investments and product development for Allspring Funds Management, LLC, from 2009 to 2014. In addition, Mr. Owen was an Executive Vice President of Wells Fargo & Company from 2014 to 2021. |
Jeremy DePalma
(Born 1974) | Treasurer,
since 2012
(for certain funds in
the Fund Complex);
since 2021 (for
the remaining funds in the
Fund Complex) | Senior Vice President of Allspring Funds Management, LLC since 2009. Senior Vice President of Evergreen Investment Management Company, LLC from 2008 to 2010 and head of the Fund Reporting and Control Team within Fund Administration from 2005 to 2010. |
Kate McKinley
(Born 1977) | Chief Legal Officer,
since 2021 | Chief Legal Officer of Allspring Global Investments since 2021. Prior thereto, held various roles at State Street Global Advisors beginning in 2010, including serving as Senior Vice President and General Counsel from 2019 to 2021, and Chief Operating Officer of the Institutional Client Group from 2016 - 2019. Prior to working at State Street Global Advisors served as Assistant General Counsel for Bank of America Corporation from 2005 to 2010 and as an Associate at WilmerHale from 2002 to 2005. |
Christopher Baker
(Born 1976) | Chief Compliance Officer, since 2022 | Global Chief Compliance Officer for Allspring Global Investments since 2022. Prior thereto, Chief Compliance Officer for State Street Global Advisors from 2018 to 2021. Senior Compliance Officer for the State Street divisions of Alternative Investment Solutions, Sector Solutions, and Global Marketing from 2015 to 2018. From 2010 to 2015 Vice President, Global Head of Investment and Marketing Compliance for State Street Global Advisors. |
Matthew Prasse
(Born 1983) | Secretary,
since 2021 | Senior Counsel of the Allspring Legal Department since 2021. Senior Counsel of the Wells Fargo Legal Department from 2018 to 2021. Previously, Counsel for Barings LLC from 2015 to 2018. Prior to joining Barings, Associate at Morgan, Lewis & Bockius LLP from 2008 to 2015. |
1 The Statement of Additional Information includes additional information about the Trustees and is available, without charge, upon request, by calling 1-800-222-8222 or by visiting the website at allspringglobal.com.
2 For those Officers with tenures at Allspring Global Investments and/or Allspring Funds Management, LLC that began prior to 2021, such tenures include years of service during which these businesses/entities were known as Wells Fargo Asset Management and Wells Fargo Funds Management, LLC, respectively.
30 | Allspring Opportunity Fund
For more information
More information about Allspring Funds is available free upon request. To obtain literature, please write, visit the Fund's website, or call:
Allspring Funds
P.O. Box 219967
Kansas City, MO 64121-9967
Website: allspringglobal.com
Individual investors: 1-800-222-8222
Retail investment professionals: 1-888-877-9275
Institutional investment professionals: 1-800-260-5969
This report and the financial statements contained herein are submitted for the general information of the shareholders of the Fund. If this report is used for promotional purposes, distribution of the report must be accompanied or preceded by a current prospectus. Before investing, please consider the investment objectives, risks, charges, and expenses of the investment. For a current prospectus and, if available, a summary prospectus, containing this information, call
1-800-222-8222 or visit the Fund's website at allspringglobal.com. Read the prospectus carefully before you invest or send money.
Allspring Global InvestmentsTM is the trade name for the asset management firms of Allspring Global Investments Holdings, LLC, a holding company indirectly owned by certain private funds of GTCR LLC and Reverence Capital Partners, L.P. These firms include but are not limited to Allspring Global Investments, LLC, and Allspring Funds Management, LLC. Certain products managed by Allspring entities are distributed by Allspring Funds Distributor, LLC (a broker-dealer and Member FINRA/SIPC).
This material is for general informational and educational purposes only and is NOT intended to provide investment advice or a recommendation of any kind - including a recommendation for any specific investment, strategy, or plan.
© 2022 Allspring Global Investments Holdings, LLC. All rights reserved.
PAR-0522-00057 05-22
SA232/SAR232 03-22
Semi-Annual Report
March 31, 2022
Allspring
Special Mid Cap Value Fund
The views expressed and any forward-looking statements are as of March 31, 2022, unless otherwise noted, and are those of the Fund's portfolio managers and/or Allspring Global Investments. Discussions of individual securities or the markets generally are not intended as individual recommendations. Future events or results may vary significantly from those expressed in any forward-looking statements. The views expressed are subject to change at any time in response to changing circumstances in the market. Allspring Global Investments disclaims any obligation to publicly update or revise any views expressed or forward-looking statements.
Allspring Special Mid Cap Value Fund | 1
Letter to shareholders (unaudited)
Andrew Owen
President
Allspring Funds
Dear Shareholder:
We are pleased to offer you this semi-annual report for Allspring Special Mid Cap Value Fund for the six-month period that ended March 31, 2022. Global stocks and bonds broadly declined during a challenging period. Despite progress on a global economic recovery from COVID-19, persistently high inflation, concerns regarding anticipated tightening of central bank monetary policy, and turmoil caused by the Russian invasion of Ukraine all led to a retreat from financial market gains made earlier in 2021. Among major indexes, the U.S. large-cap-dominated S&P 500 Index was an exception in escaping a half-year loss.
For the six-month period, U.S. stocks, based on the S&P 500 Index,1 gained 5.92%. International stocks, as measured by the MSCI ACWI ex USA Index (Net),2 returned -3.72%, while the MSCI EM Index (Net) (USD),3 trailed both developed market benchmarks with a return of -8.20%. The Bloomberg U.S. Aggregate Bond Index,4returned -5.92%, the Bloomberg Global Aggregate ex-USD Index (unhedged),5 returned -7.26%, the Bloomberg Municipal Bond Index6 returned -5.55%, and the ICE BofA U.S. High Yield Index,7 lost 3.89%.
Inflationary concerns and the Russian-Ukraine war caused markets to retreat.
Elevated inflation pressures and the ongoing global supply bottleneck continued in October, but strong corporate earnings provided a bright spot in the U.S., the eurozone, and many Asian countries. Government bond yields rose globally as central banks prepared to tighten monetary policy. Commodity prices continued to rise, driven by sharply higher energy costs.
In November, as COVID-19 hospitalizations rose, most major global asset classes declined. Two exceptions were U.S. investment-grade bonds and Treasury Inflation-Protected Securities. President Biden signed a long-awaited $550 billion infrastructure bill to upgrade U.S. roads, bridges, and railways. Meanwhile, the Consumer Price Index8, a measure of domestic inflation conditions, jumped to its highest level in 31 years. While the threat of consistently high inflation led the U.S. Federal Reserve (Fed) to discuss a faster pace of tapering, the Omicron strain created uncertainty. Commodities lost ground for the month, driven by sharp declines in oil prices (and energy costs in general) as well as precious metals.
“Elevated inflation pressures and the ongoing global supply bottleneck continued in October, but strong corporate earnings provided a bright spot in the U.S., the eurozone, and many Asian countries.”
| 1 | The S&P 500 Index consists of 500 stocks chosen for market size, liquidity, and industry group representation. It is a market-value-weighted index with each stock's weight in the index proportionate to its market value. You cannot invest directly in an index. |
| 2 | The Morgan Stanley Capital International (MSCI) All Country World Index (ACWI) ex USA Index (Net) is a free-float-adjusted market-capitalization-weighted index that is designed to measure the equity market performance of developed and emerging markets, excluding the U.S. Source: MSCI. MSCI makes no express or implied warranties or representations and shall have no liability whatsoever with respect to any MSCI data contained herein. The MSCI data may not be further redistributed or used as a basis for other indexes or any securities or financial products. This report is not approved, reviewed, or produced by MSCI. You cannot invest directly in an index. |
| 3 | The MSCI Emerging Markets (EM) Index (Net) (USD) is a free-float-adjusted market-capitalization-weighted index that is designed to measure equity market performance of emerging markets. You cannot invest directly in an index. |
| 4 | The Bloomberg U.S. Aggregate Bond Index is a broad-based benchmark that measures the investment-grade, U.S.-dollar-denominated, fixed-rate taxable bond market, including Treasuries, government-related and corporate securities, mortgage-backed securities (agency fixed-rate and hybrid adjustable-rate mortgage pass-throughs), asset-backed securities, and commercial mortgage-backed securities. You cannot invest directly in an index. |
| 5 | The Bloomberg Global Aggregate ex-USD Index (unhedged) is an unmanaged index that provides a broad-based measure of the global investment-grade fixed-income markets excluding the U.S.-dollar-denominated debt market. You cannot invest directly in an index. |
| 6 | The Bloomberg Municipal Bond Index is an unmanaged index composed of long-term tax-exempt bonds with a minimum credit rating of Baa. You cannot invest directly in an index. |
| 7 | The ICE BofA U.S. High Yield Index is a market-capitalization-weighted index of domestic and Yankee high-yield bonds. The index tracks the performance of high-yield securities traded in the U.S. bond market. You cannot invest directly in an index. Copyright 2022. ICE Data Indices, LLC. All rights reserved. |
| 8 | The Consumer Price Index (CPI) is a measure of the average change over time in the prices paid by urban consumers for a market basket of consumer goods and services. You cannot invest directly in an index. |
2 | Allspring Special Mid Cap Value Fund
Letter to shareholders (unaudited)
Global volatility lessened in December as data indicated a lower risk of severe disease and death from the Omicron variant. Even so, several countries introduced restrictions on travel and hospitality, among other sectors, in an effort to reduce the spread. In the U.S., data indicated a stable economy overall, with robust corporate earnings. Consumer spending potential looked strong heading into 2022 on elevated household savings and the lowest household debt ratio since 1973. U.S. corporate and high-yield bonds had monthly gains while Treasuries declined. Bonds were strongly affected by the projection of three 25-basis-point (bp; 100 bps equal 1.00%) policy rate hikes in 2022 by senior Federal Open Market Committee members, up from previous projections of just one hike.
In January 2022, the main focus was on potential U.S. interest rate hikes and the Russia-Ukraine conflict. The Fed hinted that a March interest rate hike was likely. Meanwhile, Russia threatened a potential invasion of Ukraine, which could disrupt Russia’s massive energy supplies and drive demand from non-Russian oil-producing countries. Elsewhere overseas, Europe saw food and energy prices spike, leading to rising inflation. Within fixed income, corporate bonds struggled in January, underperforming government bonds, as investors focused on continued elevated inflation and ongoing uncertainty over the U.S. monetary path.
The Russian invasion of Ukraine dominated the financial world in February and March. Equity, bond, and commodities markets were shaken by fear, uncertainty, and an upending of demand-supply dynamics. Major global stock indexes were down in February, along with global bonds overall, with ongoing high levels of volatility in March along with mixed results that favored U.S. large-cap stocks. Prices of commodities spiked, including crude oil, natural gas, wheat, and precious metals, on elevated concerns of supply shortages. All of this fed already-high inflation concerns and added to expectations of more aggressive central bank interest rate hikes. Sweeping sanctions against Russia and corporate pullouts contributed to market volatility. Despite the geopolitical turmoil, the U.S. economic outlook remained largely unchanged, with a healthy job market and signs of economic resilience accompanying higher prices.
Don’t let short-term uncertainty derail long-term investment goals.
Periods of investment uncertainty can present challenges, but experience has taught us that maintaining long-term investment goals can be an effective way to plan for the future. To help you create a sound strategy based on your personal goals and risk tolerance, Allspring Funds offers more than 100 mutual funds spanning a wide range of asset classes and investment styles. Although diversification cannot guarantee an investment profit or prevent losses, we believe it can be an effective way to manage investment risk and potentially smooth out overall portfolio performance. We encourage investors to know their investments and to understand that appropriate levels of risk-taking may unlock opportunities.
Information on transaction closing.
On November 1, 2021, GTCR LLC and Reverence Capital Partners, L.P. announced the beginning of Allspring Global Investments™ with the close of the transaction to acquire Wells Fargo Funds Management, LLC; Wells Capital Management LLC; Galliard Capital Management LLC.; Wells Fargo Asset Management (International) Ltd.; Wells Fargo Asset Management Luxembourg S.A.; and Wells Fargo Funds Distributor, LLC, as well as Wells Fargo Bank, N.A.’s business of acting as trustee to its collective investment trusts and all related Wells Fargo Asset Management legal entities. The transaction closed on November 1, 2021, forming Allspring Global Investments, a privately held asset management firm with $451 billion in AUM1 as of March 31, 2022.
“ The Russian invasion of Ukraine dominated the financial world in February and March. Equity, bond, and commodities markets were shaken by fear, uncertainty, and an upending of demand-supply dynamics.”
| 1 | Figures are as of March 31, 2022, unless otherwise noted. Please note that the assets under management figures provided have been adjusted to eliminate any duplication of reporting among assets directed by multiple investment teams and includes $91.2B from Galliard Capital Management ($74.7B stable value; $16.5B fixed income), an investment advisor that is not part of the Allspring trade name/GIPS firm. |
Allspring Special Mid Cap Value Fund | 3
Letter to shareholders (unaudited)
For further information about your Fund, contact your investment professional, visit our website at allspringglobal.com, or call us directly at 1-800-222-8222. |
Allspring Global Investments™ is a leading independent asset management firm with a full breadth of investment capabilities across diverse asset classes, serving the needs of its institutional and wealth management clients around the world. Allspring operates across 18 offices globally supported by more than 480 investment professionals. Allspring and its investment teams provide a broad range of differentiated investment products and solutions to help its diverse range of clients meet their investment objectives.
As part of this transition, all mutual funds within the Wells Fargo Funds family were rebranded as Allspring Funds. Each individual fund had “Wells Fargo” removed from its fund name and replaced with “Allspring.” The fund name changes went into effect on December 6, 2021.
Allspring Global Investments™ is the trade name for the asset management firm of Allspring Global Investments Holdings, LLC, a holding company indirectly owned by certain private funds of GTCR LLC and Reverence Capital Partners, L.P.
Thank you for choosing to invest with Allspring Funds. We appreciate your confidence in us and remain committed to helping you meet your financial needs.
Sincerely,
Andrew Owen
President
Allspring Funds
Notice to Shareholders
Russia launched a large-scale invasion of Ukraine on February 24, 2022. As a result of this military action, the United States and many other countries have instituted various economic sanctions against Russian and Belarus individuals and entities. The situation has led to increased financial market volatility and could have severe adverse effects on regional and global economic markets, including the markets for certain securities and commodities, such as oil and natural gas. The extent and duration of the military action, resulting sanctions imposed, other punitive action taken and the resulting market disruptions cannot be easily predicted.
Our solidarity and support goes out to our impacted employees and the people affected in Ukraine and their families. Allspring has a dedicated team of investment professionals actively monitoring the situation for any new developments and the potential impact to our clients and investment products. As the situation remains fluid, we are focused on the assessment of risks, valuation, and liquidity of impacted securities. Please visit our website at allspringglobal.com and click on “Russia-Ukraine Portfolio Impacts” for further information.
4 | Allspring Special Mid Cap Value Fund
This page is intentionally left blank.
Performance highlights (unaudited)
| Investment objective | The Fund seeks long-term capital appreciation. |
| Manager | Allspring Funds Management, LLC |
| Subadviser | Allspring Global Investments, LLC |
| Portfolio managers | James M. Tringas, CFA®‡, Bryant VonCronkhite, CFA®‡, CPA, Shane Zweck, CFA®‡ |
| Average annual total returns (%) as of March 31, 2022 |
| | | Including sales charge | | Excluding sales charge | | Expense ratios1 (%) |
| | Inception date | 1 year | 5 year | 10 year | | 1 year | 5 year | 10 year | | Gross | Net 2 |
| Class A (WFPAX) | 7-31-2007 | 6.24 | 9.08 | 11.89 | | 12.72 | 10.38 | 12.55 | | 1.13 | 1.13 |
| Class C (WFPCX) | 7-31-2007 | 10.86 | 9.56 | 11.71 | | 11.86 | 9.56 | 11.71 | | 1.88 | 1.88 |
| Class R (WFHHX)3 | 9-30-2015 | – | – | – | | 12.43 | 10.11 | 12.28 | | 1.38 | 1.38 |
| Class R6 (WFPRX)4 | 6-28-2013 | – | – | – | | 13.19 | 10.86 | 13.05 | | 0.70 | 0.70 |
| Administrator Class (WFMDX) | 4-8-2005 | – | – | – | | 12.82 | 10.47 | 12.66 | | 1.05 | 1.05 |
| Institutional Class (WFMIX) | 4-8-2005 | – | – | – | | 13.09 | 10.75 | 12.96 | | 0.80 | 0.80 |
| Russell Midcap® Value Index5 | – | – | – | – | | 11.45 | 9.99 | 12.01 | | – | – |
Figures quoted represent past performance, which is no guarantee of future results, and do not reflect taxes that a shareholder may pay on an investment in a fund. Investment return and principal value of an investment will fluctuate so that an investor’s shares, when redeemed, may be worth more or less than their original cost. Performance shown without sales charges would be lower if sales charges were reflected. Current performance may be lower or higher than the performance data quoted, which assumes the reinvestment of dividends and capital gains. Current month-end performance is available on the Fund’s website, allspringglobal.com.
Index returns do not include transaction costs associated with buying and selling securities, any mutual fund fees or expenses, or any taxes. It is not possible to invest directly in an index.
For Class A shares, the maximum front-end sales charge is 5.75%. For Class C shares, the maximum contingent deferred sales charge is 1.00%. Performance including a contingent deferred sales charge assumes the sales charge for the corresponding time period. Class R, Class R6, Administrator Class and Institutional Class shares are sold without a front-end sales charge or contingent deferred sales charge.
| 1 | Reflects the expense ratios as stated in the most recent prospectuses. The expense ratios shown are subject to change and may differ from the annualized expense ratios shown in the financial highlights of this report. |
| 2 | The manager has contractually committed through January 31, 2023, to waive fees and/or reimburse expenses to the extent necessary to cap total annual fund operating expenses after fee waivers at 1.16% for Class A, 1.91% for Class C, 1.41% for Class R, 0.73% for Class R6, 1.08% for Administrator Class, and 0.83% for Institutional Class. Brokerage commissions, stamp duty fees, interest, taxes, acquired fund fees and expenses (if any), and extraordinary expenses are excluded from the expense caps. Prior to or after the commitment expiration date, the caps may be increased or the commitment to maintain the caps may be terminated only with the approval of the Board of Trustees. Without these caps, the Fund’s returns would have been lower. The expense ratio paid by an investor is the net expense ratio (the total annual fund operating expenses after fee waivers) as stated in the prospectuses. |
| 3 | Historical performance shown for the Class R shares prior to their inception reflects the performance of the Institutional Class shares, adjusted to reflect the higher expenses applicable to the Class R shares. |
| 4 | Historical performance shown for the Class R6 shares prior to their inception reflects the performance of the Institutional Class shares, and includes the higher expenses applicable to the Institutional Class shares. If these expenses had not been included, returns for the Class R6 shares would be higher. |
| 5 | The Russell Midcap® Value Index measures the performance of those Russell Midcap companies with lower price/book ratios and lower forecasted growth values. The stocks are also members of the Russell 1000® Value Index. You cannot invest directly in an index |
Stock values fluctuate in response to the activities of individual companies and general market and economic conditions. Smaller-company stocks tend to be more volatile and less liquid than those of larger companies. Consult the Fund’s prospectus for additional information on these and other risks.
| ‡ | CFA® and Chartered Financial Analyst® are trademarks owned by CFA Institute. |
6 | Allspring Special Mid Cap Value Fund
Performance highlights (unaudited)
| Ten largest holdings (%) as of March 31, 20221 |
| Carlisle Companies Incorporated | 3.88 |
| Arch Capital Group Limited | 3.21 |
| Republic Services Incorporated | 3.08 |
| Brown & Brown Incorporated | 2.99 |
| Amdocs Limited | 2.82 |
| AerCap Holdings NV | 2.71 |
| CBRE Group Incorporated Class A | 2.66 |
| LKQ Corporation | 2.65 |
| American Electric Power Company Incorporated | 2.54 |
| Reynolds Consumer Products Incorporated | 2.46 |
| 1 | Figures represent the percentage of the Fund's net assets. Holdings are subject to change and may have changed since the date specified. |
| Sector allocation as of March 31, 20221 |
| 1 | Figures represent the percentage of the Fund's long-term investments. These amounts are subject to change and may have changed since the date specified. |
Allspring Special Mid Cap Value Fund | 7
Fund expenses (unaudited)
As a shareholder of the Fund, you incur two types of costs: (1) transaction costs, including sales charges (loads) on purchase payments and contingent deferred sales charges (if any) on redemptions and (2) ongoing costs, including management fees, distribution (12b-1) and/or shareholder servicing fees, and other Fund expenses. This example is intended to help you understand your ongoing costs (in dollars) of investing in the Fund and to compare these costs with the ongoing costs of investing in other mutual funds.
The example is based on an investment of $1,000 invested at the beginning of the six-month period and held for the entire period from October 1, 2021 to March 31, 2022.
Actual expenses
The “Actual” line of the table below provides information about actual account values and actual expenses. You may use the information in this line, together with the amount you invested, to estimate the expenses that you paid over the period. Simply divide your account value by $1,000 (for example, an $8,600 account value divided by $1,000 = 8.6), then multiply the result by the number in the “Actual” line under the heading entitled “Expenses paid during period” for your applicable class of shares to estimate the expenses you paid on your account during this period.
Hypothetical example for comparison purposes
The “Hypothetical” line of the table below provides information about hypothetical account values and hypothetical expenses based on the Fund’s actual expense ratio and an assumed rate of return of 5% per year before expenses, which is not the Fund’s actual return. The hypothetical account values and expenses may not be used to estimate the actual ending account balance or expenses you paid for the period. You may use this information to compare the ongoing costs of investing in the Fund and other funds. To do so, compare this 5% hypothetical example with the 5% hypothetical examples that appear in the shareholder reports of the other funds.
Please note that the expenses shown in the table are meant to highlight your ongoing costs only and do not reflect any transactional costs, such as sales charges (loads) and contingent deferred sales charges. Therefore, the “Hypothetical” line of the table is useful in comparing ongoing costs only, and will not help you determine the relative total costs of owning different funds. In addition, if these transactional costs were included, your costs would have been higher.
| | Beginning
account value
10-1-2021 | Ending
account value
3-31-2022 | Expenses
paid during
the period1 | Annualized net
expense ratio |
| Class A | | | | |
| Actual | $1,000.00 | $1,072.51 | $5.79 | 1.12% |
| Hypothetical (5% return before expenses) | $1,000.00 | $1,019.35 | $5.64 | 1.12% |
| Class C | | | | |
| Actual | $1,000.00 | $1,068.31 | $9.64 | 1.87% |
| Hypothetical (5% return before expenses) | $1,000.00 | $1,015.61 | $9.40 | 1.87% |
| Class R | | | | |
| Actual | $1,000.00 | $1,070.99 | $7.07 | 1.37% |
| Hypothetical (5% return before expenses) | $1,000.00 | $1,018.10 | $6.89 | 1.37% |
| Class R6 | | | | |
| Actual | $1,000.00 | $1,074.79 | $3.57 | 0.69% |
| Hypothetical (5% return before expenses) | $1,000.00 | $1,021.49 | $3.48 | 0.69% |
| Administrator Class | | | | |
| Actual | $1,000.00 | $1,072.90 | $5.37 | 1.04% |
| Hypothetical (5% return before expenses) | $1,000.00 | $1,019.75 | $5.24 | 1.04% |
| Institutional Class | | | | |
| Actual | $1,000.00 | $1,074.35 | $4.09 | 0.79% |
| Hypothetical (5% return before expenses) | $1,000.00 | $1,020.99 | $3.98 | 0.79% |
1 Expenses paid is equal to the annualized net expense ratio of each class multiplied by the average account value over the period, multiplied by 182 divided by 365 (to reflect the one-half-year period).
8 | Allspring Special Mid Cap Value Fund
Portfolio of investments—March 31, 2022 (unaudited)
| | | | | Shares | Value |
| Common stocks: 94.38% | | | | | |
| Consumer discretionary: 10.48% | | | | | |
| Auto components: 2.86% | | | | | |
| Aptiv plc † | | | | 1,019,330 | $ 122,023,994 |
| Lear Corporation | | | | 1,635,800 | 233,248,722 |
| | | | | | 355,272,716 |
| Distributors: 2.65% | | | | | |
| LKQ Corporation | | | | 7,254,700 | 329,435,927 |
| Hotels, restaurants & leisure: 1.14% | | | | | |
| The Wendy's Company | | | | 556,800 | 12,232,896 |
| Yum China Holdings Incorporated | | | | 3,109,700 | 129,176,938 |
| | | | | | 141,409,834 |
| Household durables: 2.66% | | | | | |
| D.R. Horton Incorporated | | | | 3,750,700 | 279,464,657 |
| Helen of Troy Limited † | | | | 263,900 | 51,682,176 |
| | | | | | 331,146,833 |
| Internet & direct marketing retail: 0.06% | | | | | |
| THG Holding plc † | | | | 6,059,169 | 7,273,426 |
| Specialty retail: 1.11% | | | | | |
| Best Buy Company Incorporated | | | | 1,511,000 | 137,349,900 |
| Consumer staples: 6.67% | | | | | |
| Beverages: 2.40% | | | | | |
| Keurig Dr. Pepper Incorporated | | | | 7,885,369 | 298,855,485 |
| Household products: 4.27% | | | | | |
| Church & Dwight Company Incorporated | | | | 2,261,700 | 224,767,746 |
| Reynolds Consumer Products Incorporated | | | | 10,426,500 | 305,913,510 |
| | | | | | 530,681,256 |
| Energy: 6.13% | | | | | |
| Energy equipment & services: 1.17% | | | | | |
| Baker Hughes Incorporated | | | | 1,590,500 | 57,910,105 |
| NOV Incorporated | | | | 4,452,900 | 87,321,369 |
| | | | | | 145,231,474 |
| Oil, gas & consumable fuels: 4.96% | | | | | |
| Devon Energy Corporation | | | | 2,078,500 | 122,901,705 |
| EOG Resources Incorporated | | | | 2,006,900 | 239,282,687 |
| Valero Energy Corporation | | | | 2,509,000 | 254,763,860 |
| | | | | | 616,948,252 |
| Financials: 19.00% | | | | | |
| Banks: 4.24% | | | | | |
| Fifth Third Bancorp | | | | 5,173,700 | 222,676,048 |
| PacWest Bancorp | | | | 1,690,900 | 72,928,517 |
The accompanying notes are an integral part of these financial statements.
Allspring Special Mid Cap Value Fund | 9
Portfolio of investments—March 31, 2022 (unaudited)
| | | | | Shares | Value |
| Banks (continued) | | | | | |
| Regions Financial Corporation | | | | 7,816,600 | $ 173,997,516 |
| Zions Bancorporation | | | | 884,400 | 57,981,264 |
| | | | | | 527,583,345 |
| Capital markets: 1.99% | | | | | |
| LPL Financial Holdings Incorporated | | | | 533,900 | 97,532,852 |
| Pershing Square Tontine Holdings † | | | | 7,534,200 | 149,855,238 |
| | | | | | 247,388,090 |
| Consumer finance: 1.46% | | | | | |
| Discover Financial Services | | | | 1,642,100 | 180,942,999 |
| Insurance: 9.41% | | | | | |
| Arch Capital Group Limited † | | | | 8,230,100 | 398,501,442 |
| Axis Capital Holdings Limited | | | | 420,900 | 25,451,823 |
| Brown & Brown Incorporated | | | | 5,134,000 | 371,034,180 |
| Loews Corporation | | | | 2,738,700 | 177,522,534 |
| The Allstate Corporation | | | | 1,419,300 | 196,587,243 |
| | | | | | 1,169,097,222 |
| Mortgage REITs: 1.90% | | | | | |
| Annaly Capital Management Incorporated | | | | 33,502,399 | 235,856,889 |
| Health care: 7.54% | | | | | |
| Health care equipment & supplies: 3.69% | | | | | |
| Alcon Incorporated « | | | | 3,406,600 | 270,245,578 |
| Zimmer Biomet Holdings Incorporated | | | | 1,475,300 | 188,690,870 |
| | | | | | 458,936,448 |
| Health care providers & services: 3.85% | | | | | |
| Humana Incorporated | | | | 640,600 | 278,769,902 |
| Universal Health Services Incorporated Class B | | | | 1,377,400 | 199,654,130 |
| | | | | | 478,424,032 |
| Industrials: 20.27% | | | | | |
| Building products: 5.08% | | | | | |
| Builders FirstSource Incorporated † | | | | 2,313,400 | 149,306,836 |
| Carlisle Companies Incorporated | | | | 1,960,500 | 482,126,160 |
| | | | | | 631,432,996 |
| Commercial services & supplies: 3.08% | | | | | |
| Republic Services Incorporated | | | | 2,888,400 | 382,713,000 |
| Construction & engineering: 2.25% | | | | | |
| APi Group Corporation † | | | | 2,879,215 | 60,549,912 |
| MasTec Incorporated † | | | | 2,521,700 | 219,640,070 |
| | | | | | 280,189,982 |
| Machinery: 4.46% | | | | | |
| Donaldson Company Incorporated | | | | 3,128,300 | 162,452,619 |
| Gates Industrial Corporation plc † | | | | 8,107,632 | 122,100,938 |
| Stanley Black & Decker Incorporated | | | | 1,926,200 | 269,263,498 |
| | | | | | 553,817,055 |
The accompanying notes are an integral part of these financial statements.
10 | Allspring Special Mid Cap Value Fund
Portfolio of investments—March 31, 2022 (unaudited)
| | | | | Shares | Value |
| Professional services: 2.69% | | | | | |
| Dun & Bradstreet Holdings Incorporated † | | | | 4,009,500 | $ 70,246,440 |
| Jacobs Engineering Group Incorporated | | | | 1,919,100 | 264,471,171 |
| | | | | | 334,717,611 |
| Trading companies & distributors: 2.71% | | | | | |
| AerCap Holdings NV † | | | | 6,698,800 | 336,815,664 |
| Information technology: 7.40% | | | | | |
| Communications equipment: 1.00% | | | | | |
| Juniper Networks Incorporated | | | | 3,347,400 | 124,389,384 |
| IT services: 4.74% | | | | | |
| Amdocs Limited | | | | 4,259,100 | 350,140,611 |
| Euronet Worldwide Incorporated † | | | | 1,831,700 | 238,395,755 |
| | | | | | 588,536,366 |
| Software: 1.66% | | | | | |
| NCR Corporation † | | | | 5,138,700 | 206,524,353 |
| Materials: 4.44% | | | | | |
| Chemicals: 1.70% | | | | | |
| Celanese Corporation Series A | | | | 785,000 | 112,152,950 |
| FMC Corporation | | | | 748,200 | 98,440,674 |
| | | | | | 210,593,624 |
| Construction materials: 0.51% | | | | | |
| Vulcan Materials Company | | | | 344,400 | 63,266,280 |
| Containers & packaging: 0.73% | | | | | |
| AptarGroup Incorporated | | | | 775,900 | 91,168,250 |
| Metals & mining: 1.50% | | | | | |
| Freeport-McMoRan Incorporated | | | | 3,750,900 | 186,569,766 |
| Real estate: 5.49% | | | | | |
| Equity REITs: 2.83% | | | | | |
| American Campus Communities Incorporated | | | | 3,211,005 | 179,719,950 |
| Gaming and Leisure Properties Incorporated | | | | 3,660,400 | 171,782,572 |
| | | | | | 351,502,522 |
| Real estate management & development: 2.66% | | | | | |
| CBRE Group Incorporated Class A † | | | | 3,612,700 | 330,634,304 |
| Utilities: 6.96% | | | | | |
| Electric utilities: 4.96% | | | | | |
| American Electric Power Company Incorporated | | | | 3,163,900 | 315,662,303 |
| FirstEnergy Corporation | | | | 6,565,200 | 301,080,072 |
| | | | | | 616,742,375 |
| Water utilities: 2.00% | | | | | |
| American Water Works Company Incorporated | | | | 1,502,100 | 248,642,613 |
| Total Common stocks (Cost $8,440,793,807) | | | | | 11,730,090,273 |
The accompanying notes are an integral part of these financial statements.
Allspring Special Mid Cap Value Fund | 11
Portfolio of investments—March 31, 2022 (unaudited)
| | | | | Shares | Value |
| Investment companies: 1.23% | | | | | |
| Exchange-traded funds: 1.23% | | | | | |
| SPDR S&P Oil & Gas Exploration & Production ETF « | | | | 1,139,000 | $ 153,252,450 |
| Total Investment companies (Cost $68,128,792) | | | | | 153,252,450 |
| | | | Expiration
date | | |
| Warrants: 0.01% | | | | | |
| Financials: 0.01% | | | | | |
| Capital markets: 0.01% | | | | | |
| Pershing Square Tontine Holdings Limited Class A † | | | 7-24-2025 | 968,690 | 910,569 |
| Diversified financial services: 0.00% | | | | | |
| Liberty Media Acquisition Corporation Class A † | | | 1-22-2026 | 352,604 | 236,245 |
| Total Warrants (Cost $7,126,698) | | | | | 1,146,814 |
| | | Yield | | | |
| Short-term investments: 5.60% | | | | | |
| Investment companies: 5.60% | | | | | |
| Allspring Government Money Market Fund Select Class ♠∞ | | 0.18% | | 551,309,789 | 551,309,789 |
| Securities Lending Cash Investments LLC ♠∩∞ | | 0.40 | | 144,626,575 | 144,626,575 |
| Total Short-term investments (Cost $695,936,364) | | | | | 695,936,364 |
| Total investments in securities (Cost $9,211,985,661) | 101.22% | | | | 12,580,425,901 |
| Other assets and liabilities, net | (1.22) | | | | (152,172,821) |
| Total net assets | 100.00% | | | | $12,428,253,080 |
| † | Non-income-earning security |
| « | All or a portion of this security is on loan. |
| ♠ | The issuer of the security is an affiliated person of the Fund as defined in the Investment Company Act of 1940. |
| ∩ | The investment is a non-registered investment company purchased with cash collateral received from securities on loan. |
| ∞ | The rate represents the 7-day annualized yield at period end. |
| Abbreviations: |
| REIT | Real estate investment trust |
The accompanying notes are an integral part of these financial statements.
12 | Allspring Special Mid Cap Value Fund
Portfolio of investments—March 31, 2022 (unaudited)
Investments in affiliates
An affiliated investment is an investment in which the Fund owns at least 5% of the outstanding voting shares of the issuer or as a result of other relationships, such as the Fund and the issuer having the same investment manager. Transactions with issuers that were affiliates of the Fund at the end of the period were as follows:
| | Value,
beginning of
period | Purchases | Sales
proceeds | Net
realized
gains
(losses) | | Net
change in
unrealized
gains
(losses) | | Value,
end of
period | Shares,
end
of period | Income
from
affiliated
securities |
| Short-term investments | | | | | | | | | |
| Allspring Government Money Market Fund Select Class | $ 65,051,778 | $1,297,083,389 | $(810,825,378) | $0 | | $0 | | $ 551,309,789 | 551,309,789 | $ 73,765 |
| Securities Lending Cash Investments LLC | 123,735,675 | 836,275,936 | (815,385,036) | 0 | | 0 | | 144,626,575 | 144,626,575 | 41,863 # |
| | | | | $0 | | $0 | | $695,936,364 | | $115,628 |
| # | Amount shown represents income before fees and rebates. |
The accompanying notes are an integral part of these financial statements.
Allspring Special Mid Cap Value Fund | 13
Statement of assets and liabilities—March 31, 2022 (unaudited)
| | |
| Assets | |
Investments in unaffiliated securities (including $141,764,094 of securities loaned), at value (cost $8,516,049,297)
| $ 11,884,489,537 |
Investments in affiliated securities, at value (cost $695,936,364)
| 695,936,364 |
Receivable for Fund shares sold
| 18,934,683 |
Receivable for dividends
| 18,190,671 |
Receivable for investments sold
| 12,241,397 |
Receivable for securities lending income, net
| 40,255 |
Prepaid expenses and other assets
| 68,262 |
Total assets
| 12,629,901,169 |
| Liabilities | |
Payable upon receipt of securities loaned
| 144,626,575 |
Payable for Fund shares redeemed
| 25,487,885 |
Payable for investments purchased
| 22,441,080 |
Management fee payable
| 6,861,599 |
Administration fees payable
| 1,204,175 |
Distribution fees payable
| 91,640 |
Trustees’ fees and expenses payable
| 3,055 |
Accrued expenses and other liabilities
| 932,080 |
Total liabilities
| 201,648,089 |
Total net assets
| $12,428,253,080 |
| Net assets consist of | |
Paid-in capital
| $ 8,586,546,003 |
Total distributable earnings
| 3,841,707,077 |
Total net assets
| $12,428,253,080 |
| Computation of net asset value and offering price per share | |
Net assets – Class A
| $ 1,283,239,617 |
Shares outstanding – Class A1
| 26,775,041 |
Net asset value per share – Class A
| $47.93 |
Maximum offering price per share – Class A2
| $50.85 |
Net assets – Class C
| $ 135,348,080 |
Shares outstanding – Class C1
| 2,999,022 |
Net asset value per share – Class C
| $45.13 |
Net assets – Class R
| $ 28,683,498 |
Shares outstanding – Class R1
| 590,149 |
Net asset value per share – Class R
| $48.60 |
Net assets – Class R6
| $ 3,002,544,942 |
Shares outstanding – Class R61
| 60,720,059 |
Net asset value per share – Class R6
| $49.45 |
Net assets – Administrator Class
| $ 369,691,446 |
Shares outstanding – Administrator Class1
| 7,544,975 |
Net asset value per share – Administrator Class
| $49.00 |
Net assets – Institutional Class
| $ 7,608,745,497 |
Shares outstanding – Institutional Class1
| 154,094,826 |
Net asset value per share – Institutional Class
| $49.38 |
| 1 | The Fund has an unlimited number of authorized shares. |
| 2 | Maximum offering price is computed as 100/94.25 of net asset value. On investments of $50,000 or more, the offering price is reduced. |
The accompanying notes are an integral part of these financial statements.
14 | Allspring Special Mid Cap Value Fund
Statement of operations—six months ended March 31, 2022 (unaudited)
| | |
| Investment income | |
Dividends
| $ 99,055,790 |
Income from affiliated securities
| 336,407 |
Total investment income
| 99,392,197 |
| Expenses | |
Management fee
| 40,549,837 |
| Administration fees | |
Class A
| 1,285,904 |
Class C
| 143,546 |
Class R
| 30,877 |
Class R6
| 450,267 |
Administrator Class
| 250,662 |
Institutional Class
| 4,918,416 |
| Shareholder servicing fees | |
Class A
| 1,530,838 |
Class C
| 170,853 |
Class R
| 36,758 |
Administrator Class
| 481,042 |
| Distribution fees | |
Class C
| 512,543 |
Class R
| 36,699 |
Custody and accounting fees
| 173,810 |
Professional fees
| 24,895 |
Registration fees
| 21,224 |
Shareholder report expenses
| 189,941 |
Trustees’ fees and expenses
| 10,683 |
Other fees and expenses
| 46,483 |
Total expenses
| 50,865,278 |
| Less: Fee waivers and/or expense reimbursements | |
Class A
| (20,665) |
Administrator Class
| (130) |
Net expenses
| 50,844,483 |
Net investment income
| 48,547,714 |
| Realized and unrealized gains (losses) on investments | |
| Net realized gains on | |
Unaffiliated securities
| 567,649,616 |
Written options
| 44 |
Net realized gains on investments
| 567,649,660 |
Net change in unrealized gains (losses) on investments
| 252,274,924 |
Net realized and unrealized gains (losses) on investments
| 819,924,584 |
Net increase in net assets resulting from operations
| $868,472,298 |
The accompanying notes are an integral part of these financial statements.
Allspring Special Mid Cap Value Fund | 15
Statement of changes in net assets
| | | | | |
| | Six months ended
March 31, 2022
(unaudited) | Year ended
September 30, 2021 |
| Operations | | | | |
Net investment income
| | $ 48,547,714 | | $ 51,851,723 |
Net realized gains on investments
| | 567,649,660 | | 1,198,851,374 |
Net change in unrealized gains (losses) on investments
| | 252,274,924 | | 2,195,163,927 |
Net increase in net assets resulting from operations
| | 868,472,298 | | 3,445,867,024 |
| Distributions to shareholders from | | | | |
| Net investment income and net realized gains | | | | |
Class A
| | (110,358,404) | | (3,690,728) |
Class C
| | (13,179,402) | | 0 |
Class R
| | (2,629,091) | | (26,900) |
Class R6
| | (285,467,612) | | (18,362,088) |
Administrator Class
| | (35,968,625) | | (1,423,815) |
Institutional Class
| | (709,096,673) | | (40,723,017) |
Total distributions to shareholders
| | (1,156,699,807) | | (64,226,548) |
| Capital share transactions | Shares | | Shares | |
| Proceeds from shares sold | | | | |
Class A
| 4,988,530 | 245,312,159 | 4,786,526 | 219,114,924 |
Class C
| 241,009 | 11,082,835 | 343,992 | 15,066,280 |
Class R
| 55,050 | 2,738,851 | 121,981 | 5,747,947 |
Class R6
| 8,264,033 | 417,688,968 | 17,294,698 | 804,836,030 |
Administrator Class
| 563,433 | 28,291,229 | 3,486,926 | 142,839,440 |
Institutional Class
| 19,055,607 | 960,431,504 | 40,111,359 | 1,892,677,973 |
| | | 1,665,545,546 | | 3,080,282,594 |
| Reinvestment of distributions | | | | |
Class A
| 2,107,085 | 100,816,278 | 81,671 | 3,375,452 |
Class C
| 275,193 | 12,400,183 | 0 | 0 |
Class R
| 54,264 | 2,629,091 | 641 | 26,865 |
Class R6
| 5,339,952 | 264,158,691 | 396,774 | 16,843,042 |
Administrator Class
| 731,733 | 35,793,083 | 33,647 | 1,418,220 |
Institutional Class
| 13,797,049 | 681,214,678 | 914,588 | 38,787,662 |
| | | 1,097,012,004 | | 60,451,241 |
| Payment for shares redeemed | | | | |
Class A
| (3,307,520) | (162,561,969) | (9,325,133) | (400,160,013) |
Class C
| (361,088) | (16,698,048) | (780,392) | (32,978,696) |
Class R
| (97,786) | (4,892,247) | (235,151) | (10,628,060) |
Class R6
| (10,564,377) | (540,258,119) | (17,821,226) | (818,801,519) |
Administrator Class
| (1,506,232) | (75,839,458) | (4,778,979) | (206,239,718) |
Institutional Class
| (21,147,059) | (1,063,815,786) | (41,678,815) | (1,966,093,841) |
| | | (1,864,065,627) | | (3,434,901,847) |
Net increase (decrease) in net assets resulting from capital share transactions
| | 898,491,923 | | (294,168,012) |
Total increase in net assets
| | 610,264,414 | | 3,087,472,464 |
| Net assets | | | | |
Beginning of period
| | 11,817,988,666 | | 8,730,516,202 |
End of period
| | $12,428,253,080 | | $11,817,988,666 |
The accompanying notes are an integral part of these financial statements.
16 | Allspring Special Mid Cap Value Fund
Financial highlights
(For a share outstanding throughout each period)
| | | Year ended September 30 |
| Class A | Six months ended
March 31, 2022
(unaudited) | 2021 | 2020 | 2019 | 2018 | 2017 |
Net asset value, beginning of period
| $49.22 | $35.33 | $39.63 | $37.59 | $37.49 | $33.12 |
Net investment income
| 0.12 1 | 0.13 | 0.18 | 0.26 | 0.15 | 0.33 |
Net realized and unrealized gains (losses) on investments
| 3.43 | 13.91 | (2.85) | 2.54 | 1.50 | 4.42 |
Total from investment operations
| 3.55 | 14.04 | (2.67) | 2.80 | 1.65 | 4.75 |
| Distributions to shareholders from | | | | | | |
Net investment income
| (0.11) | (0.15) | (0.23) | (0.17) | (0.23) | (0.19) |
Net realized gains
| (4.73) | 0.00 | (1.40) | (0.59) | (1.32) | (0.19) |
Total distributions to shareholders
| (4.84) | (0.15) | (1.63) | (0.76) | (1.55) | (0.38) |
Net asset value, end of period
| $47.93 | $49.22 | $35.33 | $39.63 | $37.59 | $37.49 |
Total return2
| 7.25% | 39.83% | (7.22)% | 7.81% | 4.50% | 14.41% |
| Ratios to average net assets (annualized) | | | | | | |
Gross expenses
| 1.12% | 1.13% | 1.14% | 1.15% | 1.15% | 1.18% |
Net expenses
| 1.12% | 1.13% | 1.14% | 1.15% | 1.15% | 1.18% |
Net investment income
| 0.50% | 0.17% | 0.56% | 0.67% | 0.40% | 0.78% |
| Supplemental data | | | | | | |
Portfolio turnover rate
| 12% | 38% | 51% | 37% | 37% | 46% |
Net assets, end of period (000s omitted)
| $1,283,240 | $1,131,411 | $969,508 | $1,003,560 | $1,038,883 | $1,070,690 |
| 1 | Calculated based upon average shares outstanding |
| 2 | Total return calculations do not include any sales charges. Returns for periods of less than one year are not annualized. |
The accompanying notes are an integral part of these financial statements.
Allspring Special Mid Cap Value Fund | 17
Financial highlights
(For a share outstanding throughout each period)
| | | Year ended September 30 |
| Class C | Six months ended
March 31, 2022
(unaudited) | 2021 | 2020 | 2019 | 2018 | 2017 |
Net asset value, beginning of period
| $46.68 | $33.63 | $37.85 | $36.02 | $36.03 | $31.91 |
Net investment income (loss)
| (0.03) | (0.25) 1 | (0.11) | (0.07) | (0.14) | 0.06 |
Net realized and unrealized gains (losses) on investments
| 3.21 | 13.30 | (2.71) | 2.49 | 1.46 | 4.26 |
Total from investment operations
| 3.18 | 13.05 | (2.82) | 2.42 | 1.32 | 4.32 |
| Distributions to shareholders from | | | | | | |
Net investment income
| 0.00 | 0.00 | 0.00 | 0.00 | (0.01) | (0.01) |
Net realized gains
| (4.73) | 0.00 | (1.40) | (0.59) | (1.32) | (0.19) |
Total distributions to shareholders
| (4.73) | 0.00 | (1.40) | (0.59) | (1.33) | (0.20) |
Net asset value, end of period
| $45.13 | $46.68 | $33.63 | $37.85 | $36.02 | $36.03 |
Total return2
| 6.83% | 38.80% | (7.89)% | 7.00% | 3.72% | 13.56% |
| Ratios to average net assets (annualized) | | | | | | |
Gross expenses
| 1.87% | 1.88% | 1.89% | 1.90% | 1.90% | 1.92% |
Net expenses
| 1.87% | 1.88% | 1.89% | 1.90% | 1.90% | 1.92% |
Net investment income (loss)
| (0.27)% | (0.58)% | (0.19)% | (0.09)% | (0.35)% | 0.14% |
| Supplemental data | | | | | | |
Portfolio turnover rate
| 12% | 38% | 51% | 37% | 37% | 46% |
Net assets, end of period (000s omitted)
| $135,348 | $132,741 | $110,318 | $147,086 | $174,839 | $191,954 |
| 1 | Calculated based upon average shares outstanding |
| 2 | Total return calculations do not include any sales charges. Returns for periods of less than one year are not annualized. |
The accompanying notes are an integral part of these financial statements.
18 | Allspring Special Mid Cap Value Fund
Financial highlights
(For a share outstanding throughout each period)
| | | Year ended September 30 |
| Class R | Six months ended
March 31, 2022
(unaudited) | 2021 | 2020 | 2019 | 2018 | 2017 |
Net asset value, beginning of period
| $49.81 | $35.74 | $40.10 | $38.09 | $38.08 | $33.78 |
Net investment income (loss)
| 0.06 | (0.04) 1 | 0.09 | 0.17 | 0.09 | 0.32 |
Net realized and unrealized gains (losses) on investments
| 3.46 | 14.15 | (2.90) | 2.57 | 1.49 | 4.43 |
Total from investment operations
| 3.52 | 14.11 | (2.81) | 2.74 | 1.58 | 4.75 |
| Distributions to shareholders from | | | | | | |
Net investment income
| 0.00 | (0.04) | (0.15) | (0.14) | (0.25) | (0.26) |
Net realized gains
| (4.73) | 0.00 | (1.40) | (0.59) | (1.32) | (0.19) |
Total distributions to shareholders
| (4.73) | (0.04) | (1.55) | (0.73) | (1.57) | (0.45) |
Net asset value, end of period
| $48.60 | $49.81 | $35.74 | $40.10 | $38.09 | $38.08 |
Total return2
| 7.10% | 39.51% | (7.45)% | 7.52% | 4.23% | 14.13% |
| Ratios to average net assets (annualized) | | | | | | |
Gross expenses
| 1.37% | 1.38% | 1.39% | 1.40% | 1.40% | 1.42% |
Net expenses
| 1.37% | 1.38% | 1.39% | 1.40% | 1.40% | 1.42% |
Net investment income (loss)
| 0.23% | (0.08)% | 0.31% | 0.43% | 0.18% | 0.77% |
| Supplemental data | | | | | | |
Portfolio turnover rate
| 12% | 38% | 51% | 37% | 37% | 46% |
Net assets, end of period (000s omitted)
| $28,683 | $28,821 | $24,705 | $31,961 | $24,575 | $14,505 |
| 1 | Calculated based upon average shares outstanding |
| 2 | Returns for periods of less than one year are not annualized. |
The accompanying notes are an integral part of these financial statements.
Allspring Special Mid Cap Value Fund | 19
Financial highlights
(For a share outstanding throughout each period)
| | | Year ended September 30 |
| Class R6 | Six months ended
March 31, 2022
(unaudited) | 2021 | 2020 | 2019 | 2018 | 2017 |
Net asset value, beginning of period
| $50.72 | $36.39 | $40.76 | $38.67 | $38.52 | $34.03 |
Net investment income
| 0.22 | 0.29 | 0.36 | 0.40 | 0.32 1 | 0.50 1 |
Net realized and unrealized gains (losses) on investments
| 3.54 | 14.36 | (2.94) | 2.62 | 1.55 | 4.53 |
Total from investment operations
| 3.76 | 14.65 | (2.58) | 3.02 | 1.87 | 5.03 |
| Distributions to shareholders from | | | | | | |
Net investment income
| (0.30) | (0.32) | (0.39) | (0.34) | (0.40) | (0.35) |
Net realized gains
| (4.73) | 0.00 | (1.40) | (0.59) | (1.32) | (0.19) |
Total distributions to shareholders
| (5.03) | (0.32) | (1.79) | (0.93) | (1.72) | (0.54) |
Net asset value, end of period
| $49.45 | $50.72 | $36.39 | $40.76 | $38.67 | $38.52 |
Total return2
| 7.48% | 40.44% | (6.84)% | 8.28% | 4.95% | 14.88% |
| Ratios to average net assets (annualized) | | | | | | |
Gross expenses
| 0.69% | 0.70% | 0.71% | 0.72% | 0.72% | 0.74% |
Net expenses
| 0.69% | 0.70% | 0.71% | 0.72% | 0.72% | 0.74% |
Net investment income
| 0.91% | 0.60% | 0.99% | 1.12% | 0.85% | 1.37% |
| Supplemental data | | | | | | |
Portfolio turnover rate
| 12% | 38% | 51% | 37% | 37% | 46% |
Net assets, end of period (000s omitted)
| $3,002,545 | $2,925,693 | $2,103,895 | $2,094,860 | $1,493,787 | $906,784 |
| 1 | Calculated based upon average shares outstanding |
| 2 | Returns for periods of less than one year are not annualized. |
The accompanying notes are an integral part of these financial statements.
20 | Allspring Special Mid Cap Value Fund
Financial highlights
(For a share outstanding throughout each period)
| | | Year ended September 30 |
| Administrator Class | Six months ended
March 31, 2022
(unaudited) | 2021 | 2020 | 2019 | 2018 | 2017 |
Net asset value, beginning of period
| $50.22 | $36.02 | $40.35 | $38.23 | $38.12 | $33.67 |
Net investment income
| 0.14 1 | 0.23 | 0.24 1 | 0.27 1 | 0.18 1 | 0.34 1 |
Net realized and unrealized gains (losses) on investments
| 3.50 | 14.13 | (2.93) | 2.61 | 1.52 | 4.52 |
Total from investment operations
| 3.64 | 14.36 | (2.69) | 2.88 | 1.70 | 4.86 |
| Distributions to shareholders from | | | | | | |
Net investment income
| (0.13) | (0.16) | (0.24) | (0.17) | (0.27) | (0.22) |
Net realized gains
| (4.73) | 0.00 | (1.40) | (0.59) | (1.32) | (0.19) |
Total distributions to shareholders
| (4.86) | (0.16) | (1.64) | (0.76) | (1.59) | (0.41) |
Net asset value, end of period
| $49.00 | $50.22 | $36.02 | $40.35 | $38.23 | $38.12 |
Total return2
| 7.29% | 39.96% | (7.15)% | 7.88% | 4.58% | 14.50% |
| Ratios to average net assets (annualized) | | | | | | |
Gross expenses
| 1.04% | 1.05% | 1.06% | 1.07% | 1.07% | 1.09% |
Net expenses
| 1.04% | 1.05% | 1.06% | 1.07% | 1.07% | 1.09% |
Net investment income
| 0.55% | 0.25% | 0.65% | 0.72% | 0.47% | 0.95% |
| Supplemental data | | | | | | |
Portfolio turnover rate
| 12% | 38% | 51% | 37% | 37% | 46% |
Net assets, end of period (000s omitted)
| $369,691 | $389,512 | $324,727 | $604,126 | $978,368 | $1,156,796 |
| 1 | Calculated based upon average shares outstanding |
| 2 | Returns for periods of less than one year are not annualized. |
The accompanying notes are an integral part of these financial statements.
Allspring Special Mid Cap Value Fund | 21
Financial highlights
(For a share outstanding throughout each period)
| | | Year ended September 30 |
| Institutional Class | Six months ended
March 31, 2022
(unaudited) | 2021 | 2020 | 2019 | 2018 | 2017 |
Net asset value, beginning of period
| $50.63 | $36.33 | $40.70 | $38.61 | $38.47 | $34.00 |
Net investment income
| 0.19 | 0.24 | 0.32 | 0.38 1 | 0.26 | 0.41 |
Net realized and unrealized gains (losses) on investments
| 3.55 | 14.35 | (2.94) | 2.60 | 1.56 | 4.58 |
Total from investment operations
| 3.74 | 14.59 | (2.62) | 2.98 | 1.82 | 4.99 |
| Distributions to shareholders from | | | | | | |
Net investment income
| (0.26) | (0.29) | (0.35) | (0.30) | (0.36) | (0.33) |
Net realized gains
| (4.73) | 0.00 | (1.40) | (0.59) | (1.32) | (0.19) |
Total distributions to shareholders
| (4.99) | (0.29) | (1.75) | (0.89) | (1.68) | (0.52) |
Net asset value, end of period
| $49.38 | $50.63 | $36.33 | $40.70 | $38.61 | $38.47 |
Total return2
| 7.43% | 40.30% | (6.93)% | 8.17% | 4.84% | 14.76% |
| Ratios to average net assets (annualized) | | | | | | |
Gross expenses
| 0.79% | 0.80% | 0.81% | 0.82% | 0.82% | 0.84% |
Net expenses
| 0.79% | 0.80% | 0.81% | 0.82% | 0.82% | 0.84% |
Net investment income
| 0.82% | 0.50% | 0.89% | 1.00% | 0.73% | 1.24% |
| Supplemental data | | | | | | |
Portfolio turnover rate
| 12% | 38% | 51% | 37% | 37% | 46% |
Net assets, end of period (000s omitted)
| $7,608,745 | $7,209,810 | $5,197,362 | $5,349,953 | $4,937,901 | $4,595,274 |
| 1 | Calculated based upon average shares outstanding |
| 2 | Returns for periods of less than one year are not annualized. |
The accompanying notes are an integral part of these financial statements.
22 | Allspring Special Mid Cap Value Fund
Notes to financial statements (unaudited)
1. ORGANIZATION
Allspring Funds Trust (the "Trust"), a Delaware statutory trust organized on March 10, 1999, is an open-end management investment company registered under the Investment Company Act of 1940, as amended (the "1940 Act"). As an investment company, the Trust follows the accounting and reporting guidance in Financial Accounting Standards Board ("FASB") Accounting Standards Codification Topic 946, Financial Services – Investment Companies. These financial statements report on the Allspring Special Mid Cap Value Fund (the "Fund") which is a diversified series of the Trust.
Effective on November 1, 2021, the sale transaction of Wells Fargo Asset Management ("WFAM") by Wells Fargo & Company to GTCR LLC and Reverence Capital Partners, L.P. was closed. In connection with the closing of the transaction, WFAM became known as Allspring Global Investments (“Allspring”) and various entities that provided services to the Fund changed their names to "Allspring", including Allspring Funds Management, LLC, the investment manager to the Fund, Allspring Global Investments, LLC and Allspring Global Investments (UK) Limited, both registered investment advisers providing subadvisory services to certain funds, and Allspring Funds Distributor, LLC, the Fund's principal underwriter. Consummation of the transaction resulted in a new investment management agreement and subadvisory agreement which became effective on November 1, 2021.
2. SIGNIFICANT ACCOUNTING POLICIES
The following significant accounting policies, which are consistently followed in the preparation of the financial statements of the Fund, are in conformity with U.S. generally accepted accounting principles which require management to make estimates and assumptions that affect the reported amounts of assets and liabilities, disclosure of contingent assets and liabilities at the date of the financial statements, and the reported amounts of income and expenses during the reporting period. Actual results could differ from those estimates.
Securities valuation
All investments are valued each business day as of the close of regular trading on the New York Stock Exchange (generally 4 p.m. Eastern Time), although the Fund may deviate from this calculation time under unusual or unexpected circumstances.
Equity securities that are listed on a foreign or domestic exchange or market are valued at the official closing price or, if none, the last sales price. If no sale occurs on the principal exchange or market that day, a fair value price will be determined in accordance with the Fund’s Valuation Procedures.
The values of securities denominated in foreign currencies are translated into U.S. dollars at rates provided by an independent foreign currency pricing source at a time each business day specified by the Allspring Global Investments Pricing Committee at Allspring Funds Management, LLC ("Allspring Funds Management").
Many securities markets and exchanges outside the U.S. close prior to the close of the New York Stock Exchange and therefore may not fully reflect trading or events that occur after the close of the principal exchange in which the foreign securities are traded, but before the close of the New York Stock Exchange. If such trading or events are expected to materially affect the value of such securities, then fair value pricing procedures approved by the Board of Trustees of the Fund are applied. These procedures take into account multiple factors including movements in U.S. securities markets after foreign exchanges close. Foreign securities that are fair valued under these procedures are categorized as Level 2 and the application of these procedures may result in transfers between Level 1 and Level 2. Depending on market activity, such fair valuations may be frequent. Such fair value pricing may result in net asset values that are higher or lower than net asset values based on the last reported sales price or latest quoted bid price. On March 31, 2022, such fair value pricing was used in pricing certain foreign securities.
Options that are listed on a foreign or domestic exchange or market are valued at the closing mid-price. Non-listed options are valued at the evaluated price provided by an independent pricing service or, if a reliable price is not available, the quoted bid price from an independent broker-dealer.
Investments in registered open-end investment companies are valued at net asset value. Interests in non-registered investment companies that are redeemable at net asset value are fair valued normally at net asset value.
Investments which are not valued using any of the methods discussed above are valued at their fair value, as determined in good faith by the Board of Trustees. The Board of Trustees has established a Valuation Committee comprised of the Trustees and has delegated to it the authority to take any actions regarding the valuation of portfolio securities that the Valuation Committee deems necessary or appropriate, including determining the fair value of portfolio securities, unless the determination has been delegated to the Allspring Global Investments Pricing Committee. The Board of Trustees retains the authority to make or ratify any valuation decisions or approve any changes to the Valuation Procedures as it deems appropriate.
Allspring Special Mid Cap Value Fund | 23
Notes to financial statements (unaudited)
On a quarterly basis, the Board of Trustees receives reports on any valuation actions taken by the Valuation Committee or the Allspring Global Investments Pricing Committee which may include items for ratification.
Foreign currency translation
The accounting records of the Fund are maintained in U.S. dollars. The values of other assets and liabilities denominated in foreign currencies are translated into U.S. dollars at rates provided by an independent foreign currency pricing source at a time each business day specified by the Allspring Global Investments Pricing Committee. Purchases and sales of securities, and income and expenses are converted at the rate of exchange on the respective dates of such transactions. Net realized foreign exchange gains or losses arise from sales of foreign currencies, currency gains or losses realized between the trade and settlement dates on securities transactions, and the difference between the amounts of dividends, interest and foreign withholding taxes recorded and the U.S. dollar equivalent of the amounts actually paid or received. Net unrealized foreign exchange gains and losses arise from changes in the fair value of assets and liabilities other than investments in securities resulting from changes in exchange rates. The changes in net assets arising from changes in exchange rates of securities and the changes in net assets resulting from changes in market prices of securities are not separately presented. Such changes are included in net realized and unrealized gains or losses from investments.
Securities lending
The Fund may lend its securities from time to time in order to earn additional income in the form of fees or interest on securities received as collateral or the investment of any cash received as collateral. When securities are on loan, the Fund receives interest or dividends on those securities. Cash collateral received in connection with its securities lending transactions is invested in Securities Lending Cash Investments, LLC (the "Securities Lending Fund"), an affiliated non-registered investment company. Investments in Securities Lending Fund are valued at the evaluated bid price provided by an independent pricing service. Income earned from investment in the Securities Lending Fund (net of fees and rebates), if any, is included in income from affiliated securities on the Statement of Operations.
In a securities lending transaction, the net asset value of the Fund is affected by an increase or decrease in the value of the securities loaned and by an increase or decrease in the value of the instrument in which collateral is invested. The amount of securities lending activity undertaken by the Fund fluctuates from time to time. The Fund has the right under the lending agreement to recover the securities from the borrower on demand. In the event of default or bankruptcy by the borrower, the Fund may be prevented from recovering the loaned securities or gaining access to the collateral or may experience delays or costs in doing so. In such an event, the terms of the agreement allow the unaffiliated securities lending agent to use the collateral to purchase replacement securities on behalf of the Fund or pay the Fund the market value of the loaned securities. The Fund bears the risk of loss with respect to depreciation of its investment of the cash collateral.
Options
The Fund may write covered call options or secured put options on individual securities and/or indexes. When the Fund writes an option, an amount equal to the premium received is recorded as a liability and is subsequently adjusted to the current market value of the written option. Premiums received from written options that expire unexercised are recognized as realized gains on the expiration date. For exercised options, the difference between the premium received and the amount paid on effecting a closing purchase transaction, including brokerage commissions, is treated as a realized gain or loss. If a call option is exercised, the premium is added to the proceeds from the sale of the underlying security in calculating the realized gain or loss on the sale. If a put option is exercised, the premium reduces the cost of the security purchased. The Fund, as a writer of an option, bears the market risk of an unfavorable change in the price of the security and/or index underlying the written option.
The Fund may also purchase call or put options. Premiums paid are included in the Statement of Assets and Liabilities as investments, the values of which are subsequently adjusted based on the current market values of the options. Premiums paid for purchased options that expire are recognized as realized losses on the expiration date. Premiums paid for purchased options that are exercised or closed are added to the amount paid or offset against the proceeds received for the underlying security to determine the realized gain or loss. The risk of loss associated with purchased options is limited to the premium paid.
Options traded on an exchange are regulated and terms of the options are standardized. The Fund is subject to equity price risk. Purchased options traded over-the-counter expose the Fund to counterparty risk in the event the counterparty does not perform. This risk can be mitigated by having a master netting arrangement between the Fund and the counterparty and by having the counterparty post collateral to cover the Fund’s exposure to the counterparty.
Security transactions and income recognition
Securities transactions are recorded on a trade date basis. Realized gains or losses are recorded on the basis of identified cost.
24 | Allspring Special Mid Cap Value Fund
Notes to financial statements (unaudited)
Dividend income is recognized on the ex-dividend date, except for certain dividends from foreign securities, which are recorded as soon as the custodian verifies the ex-dividend date.
Income dividends and capital gain distributions from investment companies are recorded on the ex-dividend date. Capital gain distributions from investment companies are treated as realized gains.
Distributions to shareholders
Distributions to shareholders from net investment income and any net realized gains are recorded on the ex-dividend date and paid at least annually. Such distributions are determined in accordance with income tax regulations and may differ from U.S. generally accepted accounting principles. Dividend sources are estimated at the time of declaration. The tax character of distributions is determined as of the Fund's fiscal year end. Therefore, a portion of the Fund's distributions made prior to the Fund’s fiscal year end may be categorized as a tax return of capital at year end.
Federal and other taxes
The Fund intends to continue to qualify as a regulated investment company by distributing substantially all of its investment company taxable income and any net realized capital gains (after reduction for capital loss carryforwards) sufficient to relieve it from all, or substantially all, federal income taxes. Accordingly, no provision for federal income taxes was required.
The Fund’s income and federal excise tax returns and all financial records supporting those returns for the prior three fiscal years are subject to examination by the federal and Delaware revenue authorities. Management has analyzed the Fund's tax positions taken on federal, state, and foreign tax returns for all open tax years and does not believe that there are any uncertain tax positions that require recognition of a tax liability.
As of March 31, 2022, the aggregate cost of all investments for federal income tax purposes was $9,198,565,742 and the unrealized gains (losses) consisted of:
| Gross unrealized gains | $3,527,850,457 |
| Gross unrealized losses | (145,990,298) |
| Net unrealized gains | $3,381,860,159 |
Class allocations
The separate classes of shares offered by the Fund differ principally in applicable sales charges, distribution, shareholder servicing, and administration fees. Class specific expenses are charged directly to that share class. Investment income, common fund-level expenses, and realized and unrealized gains (losses) on investments are allocated daily to each class of shares based on the relative proportion of net assets of each class.
3. FAIR VALUATION MEASUREMENTS
Fair value measurements of investments are determined within a framework that has established a fair value hierarchy based upon the various data inputs utilized in determining the value of the Fund’s investments. The three-level hierarchy gives the highest priority to unadjusted quoted prices in active markets for identical assets or liabilities (Level 1) and the lowest priority to unobservable inputs (Level 3). The Fund’s investments are classified within the fair value hierarchy based on the lowest level of input that is significant to the fair value measurement. The inputs are summarized into three broad levels as follows:
| ■ | Level 1 – quoted prices in active markets for identical securities |
| ■ | Level 2 – other significant observable inputs (including quoted prices for similar securities, interest rates, prepayment speeds, credit risk, etc.) |
| ■ | Level 3 – significant unobservable inputs (including the Fund’s own assumptions in determining the fair value of investments) |
The inputs or methodologies used for valuing investments in securities are not necessarily an indication of the risk associated with investing in those securities.
Allspring Special Mid Cap Value Fund | 25
Notes to financial statements (unaudited)
The following is a summary of the inputs used in valuing the Fund’s assets and liabilities as of March 31, 2022:
| | Quoted prices
(Level 1) | Other significant
observable inputs
(Level 2) | Significant
unobservable inputs
(Level 3) | Total |
| Assets | | | | |
| Investments in: | | | | |
| Common stocks | | | | |
| Consumer discretionary | $ 1,294,615,210 | $ 7,273,426 | $0 | $ 1,301,888,636 |
| Consumer staples | 829,536,741 | 0 | 0 | 829,536,741 |
| Energy | 762,179,726 | 0 | 0 | 762,179,726 |
| Financials | 2,360,868,545 | 0 | 0 | 2,360,868,545 |
| Health care | 937,360,480 | 0 | 0 | 937,360,480 |
| Industrials | 2,519,686,308 | 0 | 0 | 2,519,686,308 |
| Information technology | 919,450,103 | 0 | 0 | 919,450,103 |
| Materials | 551,597,920 | 0 | 0 | 551,597,920 |
| Real estate | 682,136,826 | 0 | 0 | 682,136,826 |
| Utilities | 865,384,988 | 0 | 0 | 865,384,988 |
| Investment companies | 153,252,450 | 0 | 0 | 153,252,450 |
| Warrants | | | | |
| Financials | 0 | 1,146,814 | 0 | 1,146,814 |
| Short-term investments | | | | |
| Investment companies | 695,936,364 | 0 | 0 | 695,936,364 |
| Total assets | $12,572,005,661 | $8,420,240 | $0 | $12,580,425,901 |
Additional sector, industry or geographic detail, if any, is included in the Portfolio of Investments.
For the six months ended March 31, 2022, the Fund did not have any transfers into/out of Level 3.
4. TRANSACTIONS WITH AFFILIATES
Management fee
Allspring Funds Management, a wholly owned subsidiary of Allspring Global Investments Holdings, LLC, a holding company indirectly owned by certain private funds of GTCR LLC and Reverence Capital Partners, L.P., is the manager of the Fund and provides advisory and fund-level administrative services under an investment management agreement. Under the investment management agreement, Allspring Funds Management is responsible for, among other services, implementing the investment objectives and strategies of the Fund, supervising the subadviser and providing fund-level administrative services in connection with the Fund’s operations. As compensation for its services under the investment management agreement, Allspring Funds Management is entitled to receive a management fee at the following annual rate based on the Fund’s average daily net assets:
| Average daily net assets | Management fee |
| First $500 million | 0.750% |
| Next $500 million | 0.725 |
| Next $1 billion | 0.700 |
| Next $2 billion | 0.675 |
| Next $1 billion | 0.650 |
| Next $5 billion | 0.640 |
| Next $2 billion | 0.630 |
| Next $4 billion | 0.620 |
| Over $16 billion | 0.610 |
For the six months ended March 31, 2022, the management fee was equivalent to an annual rate of 0.66% of the Fund’s average daily net assets.
26 | Allspring Special Mid Cap Value Fund
Notes to financial statements (unaudited)
Allspring Funds Management has retained the services of a subadviser to provide daily portfolio management to the Fund. The fee for subadvisory services is borne by Allspring Funds Management. Allspring Global Investments, LLC ("Allspring Investments"), an affiliate of Allspring Funds Management and a wholly owned subsidiary of Allspring Global Investments Holdings, LLC, is the subadviser to the Fund and is entitled to receive a fee from Allspring Funds Management at an annual rate starting at 0.45% and declining to 0.30% as the average daily net assets of the Fund increase.
Administration fees
Under a class-level administration agreement, Allspring Funds Management provides class-level administrative services to the Fund, which includes paying fees and expenses for services provided by the transfer agent, sub-transfer agents, omnibus account servicers and record-keepers. As compensation for its services under the class-level administration agreement, Allspring Funds Management receives an annual fee which is calculated based on the average daily net assets of each class as follows:
| | Class-level
administration fee |
| Class A | 0.21% |
| Class C | 0.21 |
| Class R | 0.21 |
| Class R6 | 0.03 |
| Administrator Class | 0.13 |
| Institutional Class | 0.13 |
Waivers and/or expense reimbursements
Allspring Funds Management has contractually committed to waive and/or reimburse management and administration fees to the extent necessary to maintain certain net operating expense ratios for the Fund. When each class of the Fund has exceeded its expense cap, Allspring Funds Management will waive fees and/or reimburse expenses from fund-level expenses on a proportionate basis and then from class specific expenses. When only certain classes exceed their expense caps, waivers and/or reimbursements are applied against class specific expenses before fund-level expenses. Allspring Funds Management has contractually committed through January 31, 2023 to waive fees and/or reimburse expenses to the extent necessary to cap expenses. Prior to or after the commitment expiration date, the caps may be increased or the commitment to maintain the caps may be terminated only with the approval of the Board of Trustees. As of March 31, 2022, the contractual expense caps are as follows:
| | Expense ratio caps |
| Class A | 1.16% |
| Class C | 1.91 |
| Class R | 1.41 |
| Class R6 | 0.73 |
| Administrator Class | 1.08 |
| Institutional Class | 0.83 |
Distribution fees
The Trust has adopted a distribution plan for Class C and Class R shares of the Fund pursuant to Rule 12b-1 under the 1940 Act. Distribution fees are charged to Class C and Class R shares and paid to Allspring Funds Distributor, LLC ("Allspring Funds Distributor"), the principal underwriter, an affiliate of Allspring Funds Management, at an annual rate of 0.75% of the average daily net assets of Class C shares and 0.25% of the average daily net assets of Class R shares.
In addition, Allspring Funds Distributor is entitled to receive the front-end sales charge from the purchase of Class A shares and a contingent deferred sales charge on the redemption of certain Class A shares. Allspring Funds Distributor is also entitled to receive the contingent deferred sales charges from redemptions of Class C shares. For the six months ended March 31, 2022,
Allspring Special Mid Cap Value Fund | 27
Notes to financial statements (unaudited)
Allspring Funds Distributor received $17,869 from the sale of Class A shares and $433 in contingent deferred sales charges from redemptions of Class C shares. No contingent deferred sales charges were incurred by Class A shares for the six months ended March 31, 2022.
Shareholder servicing fees
The Trust has entered into contracts with one or more shareholder servicing agents, whereby Class A, Class C, Class R, and Administrator Class of the Fund are charged a fee at an annual rate of 0.25% of the average daily net assets of each respective class. A portion of these total shareholder servicing fees were paid to affiliates, and to certain entities that were affiliates of the Fund until November 1, 2021.
Interfund transactions
The Fund may purchase or sell portfolio investment securities to certain affiliates pursuant to Rule 17a-7 under the 1940 Act and under procedures adopted by the Board of Trustees. The procedures have been designed to ensure that these interfund transactions, which do not incur broker commissions, are effected at current market prices.
5. INVESTMENT PORTFOLIO TRANSACTIONS
Purchases and sales of investments, excluding U.S. government obligations (if any) and short-term securities, for the six months ended March 31, 2022 were $1,483,364,152 and $2,167,655,250, respectively.
6. SECURITIES LENDING TRANSACTIONS
The Fund lends its securities through an unaffiliated securities lending agent and receives collateral in the form of cash or securities with a value at least equal to the value of the securities on loan. The value of the loaned securities is determined at the close of each business day and any increases or decreases in the required collateral are exchanged between the Fund and the counterparty on the next business day. Cash collateral received is invested in the Securities Lending Fund which seeks to provide a positive return compared to the daily Federal Funds Open Rate by investing in high-quality, U.S. dollar-denominated short-term money market instruments and is exempt from registration under Section 3(c)(7) of the 1940 Act. Securities Lending Fund is managed by Allspring Funds Management and is subadvised by Allspring Investments. Allspring Funds Management receives an advisory fee starting at 0.05% and declining to 0.01% as the average daily net assets of the Securities Lending Fund increase. All of the fees received by Allspring Funds Management are paid to Allspring Investments for its services as subadviser.
In the event of counterparty default or the failure of a borrower to return a loaned security, the Fund has the right to use the collateral to offset any losses incurred. As of March 31, 2022, the Fund had securities lending transactions with the following counterparties which are subject to offset:
| | Value of
securities on
loan | Collateral
received1 | Net amount |
| Barclays Capital Incorporated | $64,004,850 | $(64,004,850) | $0 |
| BNP Paribas Securities Corporation | 3,714,960 | (3,714,960) | 0 |
| Credit Suisse Securities (USA) LLC | 26,071,500 | (26,071,500) | 0 |
| Citigroup Global Markets Incorporated | 47,092,500 | (47,092,500) | 0 |
| Morgan Stanley & Co. LLC | 880,284 | (880,284) | 0 |
1 Collateral received within this table is limited to the collateral for the net transaction with the counterparty.
7. DERIVATIVE TRANSACTIONS
During the six months ended March 31, 2022, the Fund entered into written options for hedging purposes and had an average of 213 written option contracts.
The fair value, realized gains or losses and change in unrealized gains or losses, if any, on derivative instruments are reflected in the corresponding financial statement captions.
8. BANK BORROWINGS
The Trust (excluding the money market funds), Allspring Master Trust and Allspring Variable Trust are parties to a $350,000,000 revolving credit agreement whereby the Fund is permitted to use bank borrowings for temporary or emergency
28 | Allspring Special Mid Cap Value Fund
Notes to financial statements (unaudited)
purposes, such as to fund shareholder redemption requests. Interest under the credit agreement is charged to the Fund based on a borrowing rate equal to the higher of the Federal Funds rate in effect on that day plus 1.25% or the overnight bank funding rate in effect on that day plus 1.25%. In addition, an annual commitment fee equal to 0.25% of the unused balance is allocated to each participating fund.
For the six months ended March 31, 2022, there were no borrowings by the Fund under the agreement.
9. INDEMNIFICATION
Under the Fund's organizational documents, the officers and Trustees have been granted certain indemnification rights against certain liabilities that may arise out of performance of their duties to the Fund. The Fund has entered into a separate agreement with each Trustee that converts indemnification rights currently existing under the Fund’s organizational documents into contractual rights that cannot be changed in the future without the consent of the Trustee. Additionally, in the normal course of business, the Fund may enter into contracts with service providers that contain a variety of indemnification clauses. The Fund’s maximum exposure under these arrangements is dependent on future claims that may be made against the Fund and, therefore, cannot be estimated.
10. CORONAVIRUS (COVID-19) PANDEMIC
On March 11, 2020, the World Health Organization announced that it had made the assessment that coronavirus disease 2019 (“COVID-19”) is a pandemic. The impacts of COVID-19 are affecting the entire global economy, individual companies and investment products, the funds, and the market in general. There is significant uncertainty around the extent and duration of business disruptions related to COVID-19 and the impacts may last for an extended period of time. COVID-19 has led to significant uncertainty and volatility in the financial markets.
Allspring Special Mid Cap Value Fund | 29
Other information (unaudited)
PROXY VOTING INFORMATION
A description of the policies and procedures used to determine how to vote proxies relating to portfolio securities is available without charge, upon request, by calling 1-800-222-8222, visiting our website at allspringglobal.com, or visiting the SEC website at sec.gov. Information regarding how the proxies related to portfolio securities were voted during the most recent 12-month period ended June 30 is available on the website at allspringglobal.com or by visiting the SEC website at sec.gov.
QUARTERLY PORTFOLIO HOLDINGS INFORMATION
The Fund files its complete schedule of portfolio holdings with the SEC for the first and third quarters of each fiscal year as an exhibit to its reports on Form N-PORT. Shareholders may view the filed Form N-PORT by visiting the SEC website at sec.gov.
30 | Allspring Special Mid Cap Value Fund
Other information (unaudited)
BOARD OF TRUSTEES AND OFFICERS
Each of the Trustees and Officers listed in the table below acts in identical capacities for each fund in the Allspring family of funds, which consists of 138 mutual funds comprising the Allspring Funds Trust, Allspring Variable Trust, Allspring Master Trust and four closed-end funds (collectively the “Fund Complex”). This table should be read in conjunction with the Prospectus and the Statement of Additional Information1. The mailing address of each Trustee and Officer is 525 Market Street, 12th Floor, San Francisco, CA 94105. Each Trustee and Officer serves an indefinite term, however, each Trustee serves such term until reaching the mandatory retirement age established by the Trustees.
Independent Trustees
Name and
year of birth | Position held and
length of service* | Principal occupations during past five years or longer | Current other
public company or
investment
company
directorships |
William R. Ebsworth
(Born 1957) | Trustee,
since 2015 | Retired. From 1984 to 2013, equities analyst, portfolio manager, research director and chief investment officer at Fidelity Management and Research Company in Boston, Tokyo, and Hong Kong, and retired in 2013 as Chief Investment Officer of Fidelity Strategic Advisers, Inc. where he led a team of investment professionals managing client assets. Prior thereto, Board member of Hong Kong Securities Clearing Co., Hong Kong Options Clearing Corp., the Thailand International Fund, Ltd., Fidelity Investments Life Insurance Company, and Empire Fidelity Investments Life Insurance Company. Audit Committee Chair and Investment Committee Chair of the Vincent Memorial Hospital Endowment (non-profit organization). Mr. Ebsworth is a CFA® charterholder. | N/A |
Jane A. Freeman
(Born 1953) | Trustee,
since 2015;
Chair Liaison,
since 2018 | Retired. From 2012 to 2014 and 1999 to 2008, Chief Financial Officer of Scientific Learning Corporation. From 2008 to 2012, Ms. Freeman provided consulting services related to strategic business projects. Prior to 1999, Portfolio Manager at Rockefeller & Co. and Scudder, Stevens & Clark. Board member of the Harding Loevner Funds from 1996 to 2014, serving as both Lead Independent Director and chair of the Audit Committee. Board member of the Russell Exchange Traded Funds Trust from 2011 to 2012 and the chair of the Audit Committee. Ms. Freeman is also an inactive Chartered Financial Analyst. | N/A |
Isaiah Harris, Jr.
(Born 1952) | Trustee,
since 2009; Audit
Committee
Chair,
since 2019 | Retired. Chairman of the Board of CIGNA Corporation from 2009 to 2021, and Director from 2005 to 2008. From 2003 to 2011, Director of Deluxe Corporation. Prior thereto, President and CEO of BellSouth Advertising and Publishing Corp. from 2005 to 2007, President and CEO of BellSouth Enterprises from 2004 to 2005 and President of BellSouth Consumer Services from 2000 to 2003. Emeritus member of the Iowa State University Foundation Board of Governors. Emeritus Member of the Advisory Board of Iowa State University School of Business. Advisory Board Member, Palm Harbor Academy (private school). Advisory Board Member, Fellowship of Christian Athletes. Mr. Harris is a certified public accountant (inactive status). | N/A |
David F. Larcker
(Born 1950) | Trustee,
since 2009 | James Irvin Miller Professor of Accounting at the Graduate School of Business (Emeritus), Stanford University, Director of the Corporate Governance Research Initiative and Senior Faculty of The Rock Center for Corporate Governance since 2006. From 2005 to 2008, Professor of Accounting at the Graduate School of Business, Stanford University. Prior thereto, Ernst & Young Professor of Accounting at The Wharton School, University of Pennsylvania from 1985 to 2005. | N/A |
Allspring Special Mid Cap Value Fund | 31
Other information (unaudited)
Name and
year of birth | Position held and
length of service* | Principal occupations during past five years or longer | Current other
public company or
investment
company
directorships |
Olivia S. Mitchell
(Born 1953) | Trustee,
since 2006;
Nominating and
Governance
Committee Chair,
since 2018 | International Foundation of Employee Benefit Plans Professor since 1993, Wharton School of the University of Pennsylvania. Director of Wharton’s Pension Research Council and Boettner Center on Pensions & Retirement Research, and Research Associate at the National Bureau of Economic Research. Previously taught at Cornell University from 1978 to 1993. | N/A |
Timothy J. Penny
(Born 1951) | Trustee,
since 1996;
Chair,
since 2018 | President and Chief Executive Officer of Southern Minnesota Initiative Foundation, a non-profit organization, since 2007. Member of the Board of Trustees of NorthStar Education Finance, Inc., a non-profit organization, since 2007. | N/A |
James G. Polisson
(Born 1959) | Trustee,
since 2018 | Retired. Chief Marketing Officer, Source (ETF) UK Services, Ltd, from 2015 to 2017. From 2012 to 2015, Principal of The Polisson Group, LLC, a management consulting, corporate advisory and principal investing company. Chief Executive Officer and Managing Director at Russell Investments, Global Exchange Traded Funds from 2010 to 2012. Managing Director of Barclays Global Investors from 1998 to 2010 and Global Chief Marketing Officer for iShares and Barclays Global Investors from 2000 to 2010. Trustee of the San Francisco Mechanics’ Institute, a non-profit organization, from 2013 to 2015. Board member of the Russell Exchange Traded Fund Trust from 2011 to 2012. Director of Barclays Global Investors Holdings Deutschland GmbH from 2006 to 2009. Mr. Polisson is an attorney and has a retired status with the Massachusetts and District of Columbia Bar Associations. | N/A |
Pamela Wheelock
(Born 1959) | Trustee,
since January
2020; previously
Trustee from
January 2018 to
July 2019 | Board member of the Destination Medical Center Economic Development Agency, Rochester, Minnesota since 2019. Interim President of the McKnight Foundation from January to September 2020. McKnight Foundation Consultant, November 2020 to February 2021. Acting Commissioner, Minnesota Department of Human Services, July 2019 through September 2019. Consultant (part-time), Minnesota Department of Human Services, October 2019 through December 2019. Chief Operating Officer, Twin Cities Habitat for Humanity from 2017 to 2019. Vice President of University Services, University of Minnesota from 2012 to 2016. Prior thereto, on the Board of Directors, Governance Committee and Finance Committee for the Minnesota Philanthropy Partners (Saint Paul Foundation) from 2012 to 2018, Interim Chief Executive Officer of Blue Cross Blue Shield of Minnesota from 2011 to 2012, Chairman of the Board from 2009 to 2012 and Board Director from 2003 to 2015. Vice President, Leadership and Community Engagement, Bush Foundation, Saint Paul, Minnesota (a private foundation) from 2009 to 2011. Executive Vice President and Chief Financial Officer, Minnesota Sports and Entertainment from 2004 to 2009 and Senior Vice President from 2002 to 2004. Executive Vice President of the Minnesota Wild Foundation from 2004 to 2008. Commissioner of Finance, State of Minnesota, from 1999 to 2002. Currently Board Chair of the Minnesota Wild Foundation since 2010. | N/A |
* Length of service dates reflect the Trustee’s commencement of service with the Trust’s predecessor entities, where applicable.
32 | Allspring Special Mid Cap Value Fund
Other information (unaudited)
Officers2
Name and
year of birth | Position held and
length of service | Principal occupations during past five years or longer |
Andrew Owen
(Born 1960) | President,
since 2017 | President, Chief Executive Officer and Director of Allspring Funds Management, LLC since 2017 and co-president of Galliard Capital Management, LLC, an affiliate of Allspring Funds Management, LLC, since 2019. Prior thereto, Head of Affiliated Managers, Allspring Global Investments, from 2014 to 2019 and Executive Vice President responsible for marketing, investments and product development for Allspring Funds Management, LLC, from 2009 to 2014. In addition, Mr. Owen was an Executive Vice President of Wells Fargo & Company from 2014 to 2021. |
Jeremy DePalma
(Born 1974) | Treasurer,
since 2012
(for certain funds in
the Fund Complex);
since 2021 (for
the remaining funds in the
Fund Complex) | Senior Vice President of Allspring Funds Management, LLC since 2009. Senior Vice President of Evergreen Investment Management Company, LLC from 2008 to 2010 and head of the Fund Reporting and Control Team within Fund Administration from 2005 to 2010. |
Kate McKinley
(Born 1977) | Chief Legal Officer,
since 2021 | Chief Legal Officer of Allspring Global Investments since 2021. Prior thereto, held various roles at State Street Global Advisors beginning in 2010, including serving as Senior Vice President and General Counsel from 2019 to 2021, and Chief Operating Officer of the Institutional Client Group from 2016 - 2019. Prior to working at State Street Global Advisors served as Assistant General Counsel for Bank of America Corporation from 2005 to 2010 and as an Associate at WilmerHale from 2002 to 2005. |
Christopher Baker
(Born 1976) | Chief Compliance Officer, since 2022 | Global Chief Compliance Officer for Allspring Global Investments since 2022. Prior thereto, Chief Compliance Officer for State Street Global Advisors from 2018 to 2021. Senior Compliance Officer for the State Street divisions of Alternative Investment Solutions, Sector Solutions, and Global Marketing from 2015 to 2018. From 2010 to 2015 Vice President, Global Head of Investment and Marketing Compliance for State Street Global Advisors. |
Matthew Prasse
(Born 1983) | Secretary,
since 2021 | Senior Counsel of the Allspring Legal Department since 2021. Senior Counsel of the Wells Fargo Legal Department from 2018 to 2021. Previously, Counsel for Barings LLC from 2015 to 2018. Prior to joining Barings, Associate at Morgan, Lewis & Bockius LLP from 2008 to 2015. |
1 The Statement of Additional Information includes additional information about the Trustees and is available, without charge, upon request, by calling 1-800-222-8222 or by visiting the website at allspringglobal.com.
2 For those Officers with tenures at Allspring Global Investments and/or Allspring Funds Management, LLC that began prior to 2021, such tenures include years of service during which these businesses/entities were known as Wells Fargo Asset Management and Wells Fargo Funds Management, LLC, respectively.
Allspring Special Mid Cap Value Fund | 33
For more information
More information about Allspring Funds is available free upon request. To obtain literature, please write, visit the Fund's website, or call:
Allspring Funds
P.O. Box 219967
Kansas City, MO 64121-9967
Website: allspringglobal.com
Individual investors: 1-800-222-8222
Retail investment professionals: 1-888-877-9275
Institutional investment professionals: 1-800-260-5969
This report and the financial statements contained herein are submitted for the general information of the shareholders of the Fund. If this report is used for promotional purposes, distribution of the report must be accompanied or preceded by a current prospectus. Before investing, please consider the investment objectives, risks, charges, and expenses of the investment. For a current prospectus and, if available, a summary prospectus, containing this information, call
1-800-222-8222 or visit the Fund's website at allspringglobal.com. Read the prospectus carefully before you invest or send money.
Allspring Global InvestmentsTM is the trade name for the asset management firms of Allspring Global Investments Holdings, LLC, a holding company indirectly owned by certain private funds of GTCR LLC and Reverence Capital Partners, L.P. These firms include but are not limited to Allspring Global Investments, LLC, and Allspring Funds Management, LLC. Certain products managed by Allspring entities are distributed by Allspring Funds Distributor, LLC (a broker-dealer and Member FINRA/SIPC).
This material is for general informational and educational purposes only and is NOT intended to provide investment advice or a recommendation of any kind - including a recommendation for any specific investment, strategy, or plan.
© 2022 Allspring Global Investments Holdings, LLC. All rights reserved.
PAR-0522-00059 05-22
SA234/SAR234 03-22
Semi-Annual Report
March 31, 2022
Allspring
Diversified Capital Builder Fund
The views expressed and any forward-looking statements are as of March 31, 2022, unless otherwise noted, and are those of the Fund's portfolio managers and/or Allspring Global Investments. Discussions of individual securities or the markets generally are not intended as individual recommendations. Future events or results may vary significantly from those expressed in any forward-looking statements. The views expressed are subject to change at any time in response to changing circumstances in the market. Allspring Global Investments disclaims any obligation to publicly update or revise any views expressed or forward-looking statements.
Allspring Diversified Capital Builder Fund | 1
Letter to shareholders (unaudited)
Andrew Owen
President
Allspring Funds
Dear Shareholder:
We are pleased to offer you this semi-annual report for Allspring Diversified Capital Builder Fund for the six-month period that ended March 31, 2022. Global stocks and bonds broadly declined during a challenging period. Despite progress on a global economic recovery from COVID-19, persistently high inflation, concerns regarding anticipated tightening of central bank monetary policy, and turmoil caused by the Russian invasion of Ukraine all led to a retreat from financial market gains made earlier in 2021. Among major indexes, the U.S. large-cap-dominated S&P 500 Index was an exception in escaping a half-year loss.
For the six-month period, U.S. stocks, based on the S&P 500 Index,1 gained 5.92%. International stocks, as measured by the MSCI ACWI ex USA Index (Net),2 returned -3.72%, while the MSCI EM Index (Net) (USD),3 trailed both developed market benchmarks with a return of -8.20%. The Bloomberg U.S. Aggregate Bond Index,4returned -5.92%, the Bloomberg Global Aggregate ex-USD Index (unhedged),5 returned -7.26%, the Bloomberg Municipal Bond Index6 returned -5.55%, and the ICE BofA U.S. High Yield Index,7 lost 3.89%.
Inflationary concerns and the Russian-Ukraine war caused markets to retreat.
Elevated inflation pressures and the ongoing global supply bottleneck continued in October, but strong corporate earnings provided a bright spot in the U.S., the eurozone, and many Asian countries. Government bond yields rose globally as central banks prepared to tighten monetary policy. Commodity prices continued to rise, driven by sharply higher energy costs.
In November, as COVID-19 hospitalizations rose, most major global asset classes declined. Two exceptions were U.S. investment-grade bonds and Treasury Inflation-Protected Securities. President Biden signed a long-awaited $550 billion infrastructure bill to upgrade U.S. roads, bridges, and railways. Meanwhile, the Consumer Price Index8, a measure of domestic inflation conditions, jumped to its highest level in 31 years. While the threat of consistently high inflation led the U.S. Federal Reserve (Fed) to discuss a faster pace of tapering, the Omicron strain created uncertainty. Commodities lost ground for the month, driven by sharp declines in oil prices (and energy costs in general) as well as precious metals.
“Elevated inflation pressures and the ongoing global supply bottleneck continued in October, but strong corporate earnings provided a bright spot in the U.S., the eurozone, and many Asian countries.”
| 1 | The S&P 500 Index consists of 500 stocks chosen for market size, liquidity, and industry group representation. It is a market-value-weighted index with each stock's weight in the index proportionate to its market value. You cannot invest directly in an index. |
| 2 | The Morgan Stanley Capital International (MSCI) All Country World Index (ACWI) ex USA Index (Net) is a free-float-adjusted market-capitalization-weighted index that is designed to measure the equity market performance of developed and emerging markets, excluding the U.S. Source: MSCI. MSCI makes no express or implied warranties or representations and shall have no liability whatsoever with respect to any MSCI data contained herein. The MSCI data may not be further redistributed or used as a basis for other indexes or any securities or financial products. This report is not approved, reviewed, or produced by MSCI. You cannot invest directly in an index. |
| 3 | The MSCI Emerging Markets (EM) Index (Net) (USD) is a free-float-adjusted market-capitalization-weighted index that is designed to measure equity market performance of emerging markets. You cannot invest directly in an index. |
| 4 | The Bloomberg U.S. Aggregate Bond Index is a broad-based benchmark that measures the investment-grade, U.S.-dollar-denominated, fixed-rate taxable bond market, including Treasuries, government-related and corporate securities, mortgage-backed securities (agency fixed-rate and hybrid adjustable-rate mortgage pass-throughs), asset-backed securities, and commercial mortgage-backed securities. You cannot invest directly in an index. |
| 5 | The Bloomberg Global Aggregate ex-USD Index (unhedged) is an unmanaged index that provides a broad-based measure of the global investment-grade fixed-income markets excluding the U.S.-dollar-denominated debt market. You cannot invest directly in an index. |
| 6 | The Bloomberg Municipal Bond Index is an unmanaged index composed of long-term tax-exempt bonds with a minimum credit rating of Baa. You cannot invest directly in an index. |
| 7 | The ICE BofA U.S. High Yield Index is a market-capitalization-weighted index of domestic and Yankee high-yield bonds. The index tracks the performance of high-yield securities traded in the U.S. bond market. You cannot invest directly in an index. Copyright 2022. ICE Data Indices, LLC. All rights reserved. |
| 8 | The Consumer Price Index (CPI) is a measure of the average change over time in the prices paid by urban consumers for a market basket of consumer goods and services. You cannot invest directly in an index. |
2 | Allspring Diversified Capital Builder Fund
Letter to shareholders (unaudited)
Global volatility lessened in December as data indicated a lower risk of severe disease and death from the Omicron variant. Even so, several countries introduced restrictions on travel and hospitality, among other sectors, in an effort to reduce the spread. In the U.S., data indicated a stable economy overall, with robust corporate earnings. Consumer spending potential looked strong heading into 2022 on elevated household savings and the lowest household debt ratio since 1973. U.S. corporate and high-yield bonds had monthly gains while Treasuries declined. Bonds were strongly affected by the projection of three 25-basis-point (bp; 100 bps equal 1.00%) policy rate hikes in 2022 by senior Federal Open Market Committee members, up from previous projections of just one hike.
In January 2022, the main focus was on potential U.S. interest rate hikes and the Russia-Ukraine conflict. The Fed hinted that a March interest rate hike was likely. Meanwhile, Russia threatened a potential invasion of Ukraine, which could disrupt Russia’s massive energy supplies and drive demand from non-Russian oil-producing countries. Elsewhere overseas, Europe saw food and energy prices spike, leading to rising inflation. Within fixed income, corporate bonds struggled in January, underperforming government bonds, as investors focused on continued elevated inflation and ongoing uncertainty over the U.S. monetary path.
The Russian invasion of Ukraine dominated the financial world in February and March. Equity, bond, and commodities markets were shaken by fear, uncertainty, and an upending of demand-supply dynamics. Major global stock indexes were down in February, along with global bonds overall, with ongoing high levels of volatility in March along with mixed results that favored U.S. large-cap stocks. Prices of commodities spiked, including crude oil, natural gas, wheat, and precious metals, on elevated concerns of supply shortages. All of this fed already-high inflation concerns and added to expectations of more aggressive central bank interest rate hikes. Sweeping sanctions against Russia and corporate pullouts contributed to market volatility. Despite the geopolitical turmoil, the U.S. economic outlook remained largely unchanged, with a healthy job market and signs of economic resilience accompanying higher prices.
Don’t let short-term uncertainty derail long-term investment goals.
Periods of investment uncertainty can present challenges, but experience has taught us that maintaining long-term investment goals can be an effective way to plan for the future. To help you create a sound strategy based on your personal goals and risk tolerance, Allspring Funds offers more than 100 mutual funds spanning a wide range of asset classes and investment styles. Although diversification cannot guarantee an investment profit or prevent losses, we believe it can be an effective way to manage investment risk and potentially smooth out overall portfolio performance. We encourage investors to know their investments and to understand that appropriate levels of risk-taking may unlock opportunities.
Information on transaction closing.
On November 1, 2021, GTCR LLC and Reverence Capital Partners, L.P. announced the beginning of Allspring Global Investments™ with the close of the transaction to acquire Wells Fargo Funds Management, LLC; Wells Capital Management LLC; Galliard Capital Management LLC.; Wells Fargo Asset Management (International) Ltd.; Wells Fargo Asset Management Luxembourg S.A.; and Wells Fargo Funds Distributor, LLC, as well as Wells Fargo Bank, N.A.’s business of acting as trustee to its collective investment trusts and all related Wells Fargo Asset Management legal entities. The transaction closed on November 1, 2021, forming Allspring Global Investments, a privately held asset management firm with $451 billion in AUM1 as of March 31, 2022.
“ The Russian invasion of Ukraine dominated the financial world in February and March. Equity, bond, and commodities markets were shaken by fear, uncertainty, and an upending of demand-supply dynamics.”
| 1 | Figures are as of March 31, 2022, unless otherwise noted. Please note that the assets under management figures provided have been adjusted to eliminate any duplication of reporting among assets directed by multiple investment teams and includes $91.2B from Galliard Capital Management ($74.7B stable value; $16.5B fixed income), an investment advisor that is not part of the Allspring trade name/GIPS firm. |
Allspring Diversified Capital Builder Fund | 3
Letter to shareholders (unaudited)
For further information about your Fund, contact your investment professional, visit our website at allspringglobal.com, or call us directly at 1-800-222-8222. |
Allspring Global Investments™ is a leading independent asset management firm with a full breadth of investment capabilities across diverse asset classes, serving the needs of its institutional and wealth management clients around the world. Allspring operates across 18 offices globally supported by more than 480 investment professionals. Allspring and its investment teams provide a broad range of differentiated investment products and solutions to help its diverse range of clients meet their investment objectives.
As part of this transition, all mutual funds within the Wells Fargo Funds family were rebranded as Allspring Funds. Each individual fund had “Wells Fargo” removed from its fund name and replaced with “Allspring.” The fund name changes went into effect on December 6, 2021.
Allspring Global Investments™ is the trade name for the asset management firm of Allspring Global Investments Holdings, LLC, a holding company indirectly owned by certain private funds of GTCR LLC and Reverence Capital Partners, L.P.
Thank you for choosing to invest with Allspring Funds. We appreciate your confidence in us and remain committed to helping you meet your financial needs.
Sincerely,
Andrew Owen
President
Allspring Funds
Notice to Shareholders
Russia launched a large-scale invasion of Ukraine on February 24, 2022. As a result of this military action, the United States and many other countries have instituted various economic sanctions against Russian and Belarus individuals and entities. The situation has led to increased financial market volatility and could have severe adverse effects on regional and global economic markets, including the markets for certain securities and commodities, such as oil and natural gas. The extent and duration of the military action, resulting sanctions imposed, other punitive action taken and the resulting market disruptions cannot be easily predicted.
Our solidarity and support goes out to our impacted employees and the people affected in Ukraine and their families. Allspring has a dedicated team of investment professionals actively monitoring the situation for any new developments and the potential impact to our clients and investment products. As the situation remains fluid, we are focused on the assessment of risks, valuation, and liquidity of impacted securities. Please visit our website at allspringglobal.com and click on “Russia-Ukraine Portfolio Impacts” for further information.
4 | Allspring Diversified Capital Builder Fund
This page is intentionally left blank.
Performance highlights (unaudited)
| Investment objective | The Fund seeks long-term total return, consisting of capital appreciation and current income. |
| Manager | Allspring Funds Management, LLC |
| Subadviser | Allspring Global Investments, LLC |
| Portfolio managers | Robert Junkin, Margaret Patel |
| Average annual total returns (%) as of March 31, 2022 |
| | | Including sales charge | | Excluding sales charge | | Expense ratios1 (%) |
| | Inception date | 1 year | 5 year | 10 year | | 1 year | 5 year | 10 year | | Gross | Net 2 |
| Class A (EKBAX) | 1-20-1998 | 4.87 | 9.67 | 11.41 | | 11.23 | 10.98 | 12.08 | | 1.11 | 1.11 |
| Class C (EKBCX) | 1-22-1998 | 9.43 | 10.17 | 11.25 | | 10.43 | 10.17 | 11.25 | | 1.86 | 1.86 |
| Administrator Class (EKBDX) | 7-30-2010 | – | – | – | | 11.45 | 11.09 | 12.24 | | 1.03 | 1.03 |
| Institutional Class (EKBYX) | 1-26-1998 | – | – | – | | 11.68 | 11.37 | 12.50 | | 0.78 | 0.78 |
| Diversified Capital Builder Blended Index3 | – | – | – | – | | 9.85 | 13.03 | 12.35 | | – | – |
| ICE BofA U.S. Cash Pay High Yield Index4 | – | – | – | – | | -0.28 | 4.55 | 5.68 | | – | – |
| Russell 1000® Index5 | – | – | – | – | | 13.27 | 15.82 | 14.53 | | – | – |
Figures quoted represent past performance, which is no guarantee of future results, and do not reflect taxes that a shareholder may pay on an investment in a fund. Investment return and principal value of an investment will fluctuate so that an investor’s shares, when redeemed, may be worth more or less than their original cost. Performance shown without sales charges would be lower if sales charges were reflected. Current performance may be lower or higher than the performance data quoted, which assumes the reinvestment of dividends and capital gains. Current month-end performance is available on the Fund’s website, allspringglobal.com.
Index returns do not include transaction costs associated with buying and selling securities, any mutual fund fees or expenses, or any taxes. It is not possible to invest directly in an index.
For Class A shares, the maximum front-end sales charge is 5.75%. For Class C shares, the maximum contingent deferred sales charge is 1.00%. Performance including a contingent deferred sales charge assumes the sales charge for the corresponding time period. Administrator Class and Institutional Class shares are sold without a front-end sales charge or contingent deferred sales charge.
| 1 | Reflects the expense ratios as stated in the most recent prospectuses. The expense ratios shown are subject to change and may differ from the annualized expense ratios shown in the financial highlights of this report. |
| 2 | The manager has contractually committed through January 31, 2023, to waive fees and/or reimburse expenses to the extent necessary to cap total annual fund operating expenses after fee waivers at 1.13% for Class A, 1.88% for Class C, 1.05% for Administrator Class, and 0.78% for Institutional Class. Brokerage commissions, stamp duty fees, interest, taxes, acquired fund fees and expenses (if any), and extraordinary expenses are excluded from the expense caps. Prior to or after the commitment expiration date, the caps may be increased or the commitment to maintain the caps may be terminated only with the approval of the Board of Trustees. Without these caps, the Fund’s returns would have been lower. The expense ratio paid by an investor is the net expense ratio (the total annual fund operating expenses after fee waivers) as stated in the prospectuses. |
| 3 | Source: Allspring Funds Management, LLC. The Diversified Capital Builder Blended Index is composed 75% of the Russell 1000® Index and 25% of the ICE BofA U.S. Cash Pay High Yield Index. You cannot invest directly in an index. |
| 4 | The ICE BofA U.S. Cash Pay High Yield Index is an unmanaged market index that provides a broad-based performance measure of the non-investment grade U.S. domestic bond index. You cannot invest directly in an index. Copyright 2022. ICE Data Indices, LLC. All rights reserved. |
| 5 | The Russell 1000® Index measures the performance of the 1,000 largest companies in the Russell 3000® Index, which represents approximately 92% of the total market capitalization of the Russell 3000® Index. You cannot invest directly in an index. |
Balanced funds may invest in stocks and bonds. Stock values fluctuate in response to the activities of individual companies and general market and economic conditions. Bond values fluctuate in response to the financial condition of individual issuers, general market and economic conditions, and changes in interest rates. Changes in market conditions and government policies may lead to periods of heightened volatility in the bond market and reduced liquidity for certain bonds held by the Fund. In general, when interest rates rise, bond values fall and investors may lose principal value. Interest rate changes and their impact on the Fund and its share price can be sudden and unpredictable. Certain investment strategies tend to increase the total risk of an investment (relative to the broader market). This fund is exposed to foreign investment risk, high-yield securities risk, and smaller-company securities risk. Consult the Fund’s prospectus for additional information on these and other risks.
6 | Allspring Diversified Capital Builder Fund
Performance highlights (unaudited)
| Ten largest holdings (%) as of March 31, 20221 |
| AbbVie Incorporated | 6.42 |
| Broadcom Incorporated | 4.78 |
| L3Harris Technologies Incorporated | 4.71 |
| Amphenol Corporation Class A | 3.81 |
| Synopsys Incorporated | 3.74 |
| Advanced Micro Devices Incorporated | 3.36 |
| Leidos Holdings Incorporated | 2.91 |
| Amgen Incorporated | 2.85 |
| Berry Global Group Incorporated | 2.78 |
| Thermo Fisher Scientific Incorporated | 2.49 |
| 1 | Figures represent the percentage of the Fund's net assets. Holdings are subject to change and may have changed since the date specified. |
| Portfolio composition as of March 31, 20221 |
| 1 | Figures represent the percentage of the Fund's long-term investments. These amounts are subject to change and may have changed since the date specified. |
Allspring Diversified Capital Builder Fund | 7
Fund expenses (unaudited)
As a shareholder of the Fund, you incur two types of costs: (1) transaction costs, including sales charges (loads) on purchase payments and contingent deferred sales charges (if any) on redemptions and (2) ongoing costs, including management fees, distribution (12b-1) and/or shareholder servicing fees, and other Fund expenses. This example is intended to help you understand your ongoing costs (in dollars) of investing in the Fund and to compare these costs with the ongoing costs of investing in other mutual funds.
The example is based on an investment of $1,000 invested at the beginning of the six-month period and held for the entire period from October 1, 2021 to March 31, 2022.
Actual expenses
The “Actual” line of the table below provides information about actual account values and actual expenses. You may use the information in this line, together with the amount you invested, to estimate the expenses that you paid over the period. Simply divide your account value by $1,000 (for example, an $8,600 account value divided by $1,000 = 8.6), then multiply the result by the number in the “Actual” line under the heading entitled “Expenses paid during period” for your applicable class of shares to estimate the expenses you paid on your account during this period.
Hypothetical example for comparison purposes
The “Hypothetical” line of the table below provides information about hypothetical account values and hypothetical expenses based on the Fund’s actual expense ratio and an assumed rate of return of 5% per year before expenses, which is not the Fund’s actual return. The hypothetical account values and expenses may not be used to estimate the actual ending account balance or expenses you paid for the period. You may use this information to compare the ongoing costs of investing in the Fund and other funds. To do so, compare this 5% hypothetical example with the 5% hypothetical examples that appear in the shareholder reports of the other funds.
Please note that the expenses shown in the table are meant to highlight your ongoing costs only and do not reflect any transactional costs, such as sales charges (loads) and contingent deferred sales charges. Therefore, the “Hypothetical” line of the table is useful in comparing ongoing costs only, and will not help you determine the relative total costs of owning different funds. In addition, if these transactional costs were included, your costs would have been higher.
| | Beginning
account value
10-1-2021 | Ending
account value
3-31-2022 | Expenses
paid during
the period1 | Annualized net
expense ratio |
| Class A | | | | |
| Actual | $1,000.00 | $1,069.44 | $5.68 | 1.10% |
| Hypothetical (5% return before expenses) | $1,000.00 | $1,019.45 | $5.54 | 1.10% |
| Class C | | | | |
| Actual | $1,000.00 | $1,065.83 | $9.53 | 1.85% |
| Hypothetical (5% return before expenses) | $1,000.00 | $1,015.71 | $9.30 | 1.85% |
| Administrator Class | | | | |
| Actual | $1,000.00 | $1,071.02 | $5.27 | 1.02% |
| Hypothetical (5% return before expenses) | $1,000.00 | $1,019.85 | $5.14 | 1.02% |
| Institutional Class | | | | |
| Actual | $1,000.00 | $1,071.60 | $3.98 | 0.77% |
| Hypothetical (5% return before expenses) | $1,000.00 | $1,021.09 | $3.88 | 0.77% |
1 Expenses paid is equal to the annualized net expense ratio of each class multiplied by the average account value over the period, multiplied by 182 divided by 365 (to reflect the one-half-year period).
8 | Allspring Diversified Capital Builder Fund
Portfolio of investments—March 31, 2022 (unaudited)
| | | | | Shares | Value |
| Common stocks: 84.48% | | | | | |
| Consumer discretionary: 0.29% | | | | | |
| Household durables: 0.29% | | | | | |
| Whirlpool Corporation | | | | 20,000 | $ 3,455,600 |
| Health care: 29.11% | | | | | |
| Biotechnology: 13.04% | | | | | |
| AbbVie Incorporated | | | | 470,000 | 76,191,700 |
| Amgen Incorporated | | | | 140,000 | 33,854,800 |
| Biogen Incorporated † | | | | 10,000 | 2,106,000 |
| Horizon Therapeutics plc † | | | | 212,000 | 22,304,520 |
| Neurocrine Biosciences Incorporated † | | | | 105,000 | 9,843,750 |
| Vertex Pharmaceuticals Incorporated † | | | | 40,000 | 10,438,800 |
| | | | | | 154,739,570 |
| Health care equipment & supplies: 3.03% | | | | | |
| Abbott Laboratories | | | | 180,000 | 21,304,800 |
| Becton Dickinson & Company | | | | 55,000 | 14,630,000 |
| | | | | | 35,934,800 |
| Health care providers & services: 2.45% | | | | | |
| McKesson Corporation | | | | 95,000 | 29,082,350 |
| Life sciences tools & services: 6.99% | | | | | |
| Bio-Rad Laboratories Incorporated Class A † | | | | 15,000 | 8,448,450 |
| Charles River Laboratories International Incorporated † | | | | 20,000 | 5,679,400 |
| Danaher Corporation | | | | 85,000 | 24,933,050 |
| IQVIA Holdings Incorporated † | | | | 50,000 | 11,560,500 |
| Thermo Fisher Scientific Incorporated | | | | 50,000 | 29,532,500 |
| West Pharmaceutical Services Incorporated | | | | 7,000 | 2,874,970 |
| | | | | | 83,028,870 |
| Pharmaceuticals: 3.60% | | | | | |
| Bristol-Myers Squibb Company | | | | 300,000 | 21,909,000 |
| Catalent Incorporated † | | | | 50,000 | 5,545,000 |
| Merck & Company Incorporated | | | | 150,000 | 12,307,500 |
| Merck KGaA ADR | | | | 70,000 | 2,926,700 |
| | | | | | 42,688,200 |
| Industrials: 15.98% | | | | | |
| Aerospace & defense: 5.28% | | | | | |
| Curtiss-Wright Corporation | | | | 45,000 | 6,757,200 |
| L3Harris Technologies Incorporated | | | | 225,000 | 55,905,750 |
| | | | | | 62,662,950 |
| Electrical equipment: 1.63% | | | | | |
| AMETEK Incorporated | | | | 145,000 | 19,311,100 |
| Industrial conglomerates: 0.58% | | | | | |
| Honeywell International Incorporated | | | | 35,000 | 6,810,300 |
| Machinery: 5.58% | | | | | |
| Crane Company | | | | 43,000 | 4,656,040 |
| IDEX Corporation | | | | 80,000 | 15,338,400 |
The accompanying notes are an integral part of these financial statements.
Allspring Diversified Capital Builder Fund | 9
Portfolio of investments—March 31, 2022 (unaudited)
| | | | | Shares | Value |
| Machinery (continued) | | | | | |
| John Bean Technologies Corporation | | | | 175,000 | $ 20,732,250 |
| The Timken Company | | | | 420,000 | 25,494,000 |
| | | | | | 66,220,690 |
| Professional services: 2.91% | | | | | |
| Leidos Holdings Incorporated | | | | 320,000 | 34,566,400 |
| Information technology: 27.73% | | | | | |
| Electronic equipment, instruments & components: 4.83% | | | | | |
| Amphenol Corporation Class A | | | | 600,000 | 45,210,000 |
| Teledyne Technologies Incorporated † | | | | 25,500 | 12,052,065 |
| | | | | | 57,262,065 |
| IT services: 0.71% | | | | | |
| MasterCard Incorporated Class A | | | | 23,500 | 8,398,430 |
| Semiconductors & semiconductor equipment: 14.76% | | | | | |
| Advanced Micro Devices Incorporated † | | | | 365,000 | 39,909,100 |
| Analog Devices Incorporated | | | | 45,000 | 7,433,100 |
| Broadcom Incorporated | | | | 90,000 | 56,671,200 |
| Marvell Technology Incorporated | | | | 75,000 | 5,378,250 |
| Microchip Technology Incorporated | | | | 330,000 | 24,796,200 |
| Micron Technology Incorporated | | | | 210,000 | 16,356,900 |
| NVIDIA Corporation | | | | 27,000 | 7,367,220 |
| Qualcomm Incorporated | | | | 50,000 | 7,641,000 |
| Synaptics Incorporated † | | | | 25,000 | 4,987,500 |
| Texas Instruments Incorporated | | | | 25,000 | 4,587,000 |
| | | | | | 175,127,470 |
| Software: 7.43% | | | | | |
| Adobe Incorporated † | | | | 20,000 | 9,112,400 |
| ANSYS Incorporated † | | | | 30,000 | 9,529,500 |
| Autodesk Incorporated † | | | | 30,000 | 6,430,500 |
| Microsoft Corporation | | | | 61,000 | 18,806,910 |
| Synopsys Incorporated † | | | | 133,000 | 44,324,910 |
| | | | | | 88,204,220 |
| Materials: 11.37% | | | | | |
| Chemicals: 7.53% | | | | | |
| Celanese Corporation Series A | | | | 72,000 | 10,286,640 |
| Eastman Chemical Company | | | | 160,000 | 17,929,600 |
| Huntsman Corporation | | | | 615,000 | 23,068,650 |
| Olin Corporation | | | | 155,000 | 8,103,400 |
| PPG Industries Incorporated | | | | 32,000 | 4,194,240 |
| The Sherwin-Williams Company | | | | 47,500 | 11,856,950 |
| Tronox Holdings plc Class A | | | | 47,300 | 936,067 |
| Westlake Chemical Corporation | | | | 105,000 | 12,957,000 |
| | | | | | 89,332,547 |
| Containers & packaging: 3.84% | | | | | |
| AptarGroup Incorporated | | | | 76,500 | 8,988,750 |
The accompanying notes are an integral part of these financial statements.
10 | Allspring Diversified Capital Builder Fund
Portfolio of investments—March 31, 2022 (unaudited)
| | | | | Shares | Value |
| Containers & packaging (continued) | | | | | |
| Berry Global Group Incorporated † | | | | 570,000 | $ 33,037,200 |
| Sealed Air Corporation | | | | 53,000 | 3,548,880 |
| | | | | | 45,574,830 |
| Total Common stocks (Cost $649,763,546) | | | | | 1,002,400,392 |
| | | Interest
rate | Maturity
date | Principal | |
| Corporate bonds and notes: 12.08% | | | | | |
| Consumer discretionary: 1.09% | | | | | |
| Auto components: 1.09% | | | | | |
| Tenneco Incorporated 144A | | 5.13% | 4-15-2029 | $13,000,000 | 12,919,010 |
| Consumer staples: 1.09% | | | | | |
| Food products: 0.63% | | | | | |
| Post Holdings Incorporated 144A | | 4.50 | 9-15-2031 | 8,435,000 | 7,473,325 |
| Household durables: 0.46% | | | | | |
| Spectrum Brands Incorporated 144A | | 3.88 | 3-15-2031 | 6,200,000 | 5,469,640 |
| Health care: 2.54% | | | | | |
| Health care equipment & supplies: 0.43% | | | | | |
| Hologic Incorporated 144A | | 3.25 | 2-15-2029 | 5,440,000 | 5,079,709 |
| Health care providers & services: 1.73% | | | | | |
| AMN Healthcare Incorporated 144A | | 4.00 | 4-15-2029 | 1,000,000 | 926,300 |
| AMN Healthcare Incorporated 144A | | 4.63 | 10-1-2027 | 1,000,000 | 972,310 |
| Catalent Pharma Solutions Incorporated 144A | | 3.13 | 2-15-2029 | 1,000,000 | 908,915 |
| Davita Incorporated 144A | | 4.63 | 6-1-2030 | 13,550,000 | 12,652,990 |
| Encompass Health Corporation | | 4.63 | 4-1-2031 | 5,500,000 | 5,148,220 |
| | | | | | 20,608,735 |
| Life sciences tools & services: 0.16% | | | | | |
| Charles River Laboratories Incorporated 144A | | 4.00 | 3-15-2031 | 2,000,000 | 1,877,500 |
| Pharmaceuticals: 0.22% | | | | | |
| Bausch Health Companies Incorporated 144A | | 5.25 | 2-15-2031 | 1,500,000 | 1,167,540 |
| Organon Finance 1 LLC 144A | | 5.13 | 4-30-2031 | 1,500,000 | 1,447,500 |
| | | | | | 2,615,040 |
| Industrials: 2.00% | | | | | |
| Aerospace & defense: 0.97% | | | | | |
| TransDigm Group Incorporated | | 4.63 | 1-15-2029 | 9,000,000 | 8,414,730 |
| TransDigm Group Incorporated | | 6.38 | 6-15-2026 | 3,000,000 | 3,027,075 |
| | | | | | 11,441,805 |
| Commercial services & supplies: 0.26% | | | | | |
| ACCO Brands Corporation 144A | | 4.25 | 3-15-2029 | 2,000,000 | 1,846,830 |
| Stericycle Incorporated 144A | | 3.88 | 1-15-2029 | 1,310,000 | 1,218,300 |
| | | | | | 3,065,130 |
The accompanying notes are an integral part of these financial statements.
Allspring Diversified Capital Builder Fund | 11
Portfolio of investments—March 31, 2022 (unaudited)
| | | Interest
rate | Maturity
date | Principal | Value |
| Construction & engineering: 0.77% | | | | | |
| Dycom Industries Incorporated 144A | | 4.50% | 4-15-2029 | $ 9,720,000 | $ 9,161,100 |
| Information technology: 1.45% | | | | | |
| Electronic equipment, instruments & components: 0.69% | | | | | |
| TTM Technologies Incorporated 144A | | 4.00 | 3-1-2029 | 8,890,000 | 8,223,250 |
| IT services: 0.03% | | | | | |
| Gartner Incorporated 144A | | 3.63 | 6-15-2029 | 350,000 | 328,125 |
| Semiconductors & semiconductor equipment: 0.40% | | | | | |
| Synaptics Incorporated 144A | | 4.00 | 6-15-2029 | 5,000,000 | 4,712,500 |
| Software: 0.33% | | | | | |
| Citrix Systems Incorporated | | 3.30 | 3-1-2030 | 4,000,000 | 3,956,470 |
| Materials: 2.79% | | | | | |
| Chemicals: 1.78% | | | | | |
| Koppers Incorporated 144A | | 6.00 | 2-15-2025 | 8,190,000 | 8,026,200 |
| Tronox Incorporated 144A | | 4.63 | 3-15-2029 | 5,310,000 | 4,971,488 |
| Valvoline Incorporated 144A | | 3.63 | 6-15-2031 | 9,495,000 | 8,202,541 |
| | | | | | 21,200,229 |
| Containers & packaging: 1.01% | | | | | |
| Ball Corporation | | 2.88 | 8-15-2030 | 12,000,000 | 10,758,540 |
| Berry Global Incorporated 144A« | | 4.50 | 2-15-2026 | 1,189,000 | 1,189,048 |
| | | | | | 11,947,588 |
| Real estate: 1.04% | | | | | |
| Equity REITs: 1.04% | | | | | |
| Iron Mountain Incorporated 144A | | 4.50 | 2-15-2031 | 12,350,000 | 11,405,349 |
| SBA Communications Corporation | | 3.13 | 2-1-2029 | 1,000,000 | 909,620 |
| | | | | | 12,314,969 |
| Utilities: 0.08% | | | | | |
| Electric utilities: 0.08% | | | | | |
| NRG Energy Incorporated 144A | | 5.25 | 6-15-2029 | 1,000,000 | 977,230 |
| Total Corporate bonds and notes (Cost $155,081,813) | | | | | 143,371,355 |
| Yankee corporate bonds and notes: 2.31% | | | | | |
| Health care: 1.06% | | | | | |
| Pharmaceuticals: 1.06% | | | | | |
| Bausch Health Companies Incorporated 144A | | 5.25 | 1-30-2030 | 16,000,000 | 12,568,640 |
| Industrials: 0.23% | | | | | |
| Electrical equipment: 0.23% | | | | | |
| Sensata Technologies BV 144A | | 4.00 | 4-15-2029 | 2,880,000 | 2,742,422 |
The accompanying notes are an integral part of these financial statements.
12 | Allspring Diversified Capital Builder Fund
Portfolio of investments—March 31, 2022 (unaudited)
| | | Interest
rate | Maturity
date | Principal | Value |
| Information technology: 0.40% | | | | | |
| Technology hardware, storage & peripherals: 0.40% | | | | | |
| Seagate HDD | | 3.13% | 7-15-2029 | $ 1,500,000 | $ 1,346,250 |
| Seagate HDD | | 4.09 | 6-1-2029 | 3,488,000 | 3,383,534 |
| | | | | | 4,729,784 |
| Materials: 0.62% | | | | | |
| Chemicals: 0.62% | | | | | |
| Methanex Corporation | | 5.13 | 10-15-2027 | 4,000,000 | 4,020,000 |
| Methanex Corporation | | 5.25 | 12-15-2029 | 3,293,000 | 3,342,395 |
| | | | | | 7,362,395 |
| Total Yankee corporate bonds and notes (Cost $31,558,168) | | | | | 27,403,241 |
| | | Yield | | Shares | |
| Short-term investments: 0.45% | | | | | |
| Investment companies: 0.45% | | | | | |
| Allspring Government Money Market Fund Select Class ♠∞ | | 0.18 | | 4,418,891 | 4,418,891 |
| Securities Lending Cash Investments LLC ♠∩∞ | | 0.40 | | 918,900 | 918,900 |
| Total Short-term investments (Cost $5,337,791) | | | | | 5,337,791 |
| Total investments in securities (Cost $841,741,318) | 99.32% | | | | 1,178,512,779 |
| Other assets and liabilities, net | 0.68 | | | | 8,118,627 |
| Total net assets | 100.00% | | | | $1,186,631,406 |
| † | Non-income-earning security |
| 144A | The security may be resold in transactions exempt from registration, normally to qualified institutional buyers, pursuant to Rule 144A under the Securities Act of 1933. |
| « | All or a portion of this security is on loan. |
| ♠ | The issuer of the security is an affiliated person of the Fund as defined in the Investment Company Act of 1940. |
| ∩ | The investment is a non-registered investment company purchased with cash collateral received from securities on loan. |
| ∞ | The rate represents the 7-day annualized yield at period end. |
| Abbreviations: |
| ADR | American depositary receipt |
| REIT | Real estate investment trust |
The accompanying notes are an integral part of these financial statements.
Allspring Diversified Capital Builder Fund | 13
Portfolio of investments—March 31, 2022 (unaudited)
Investments in affiliates
An affiliated investment is an investment in which the Fund owns at least 5% of the outstanding voting shares of the issuer or as a result of other relationships, such as the Fund and the issuer having the same investment manager. Transactions with issuers that were affiliates of the Fund at the end of the period were as follows:
| | Value,
beginning of
period | Purchases | Sales
proceeds | Net
realized
gains
(losses) | | Net
change in
unrealized
gains
(losses) | | Value,
end of
period | Shares,
end
of period | Income
from
affiliated
securities |
| Short-term investments | | | | | | | | | |
| Allspring Government Money Market Fund Select Class | $3,420,686 | $82,865,980 | $(81,867,775) | $0 | | $0 | | $ 4,418,891 | 4,418,891 | $ 1,008 |
| Securities Lending Cash Investments LLC | 0 | 3,140,230 | (2,221,330) | 0 | | 0 | | 918,900 | 918,900 | 525 # |
| | | | | $0 | | $0 | | $5,337,791 | | $1,533 |
| # | Amount shown represents income before fees and rebates. |
The accompanying notes are an integral part of these financial statements.
14 | Allspring Diversified Capital Builder Fund
Statement of assets and liabilities—March 31, 2022 (unaudited)
| | |
| Assets | |
Investments in unaffiliated securities (including $900,675 of securities loaned), at value (cost $836,403,527)
| $ 1,173,174,988 |
Investments in affiliated securities, at value (cost $5,337,791)
| 5,337,791 |
Receivable for investments sold
| 19,030,022 |
Receivable for dividends and interest
| 2,578,601 |
Receivable for Fund shares sold
| 690,330 |
Receivable for securities lending income, net
| 781 |
Prepaid expenses and other assets
| 92,318 |
Total assets
| 1,200,904,831 |
| Liabilities | |
Payable for investments purchased
| 11,773,524 |
Payable upon receipt of securities loaned
| 918,900 |
Management fee payable
| 609,105 |
Payable for Fund shares redeemed
| 502,627 |
Administration fees payable
| 182,643 |
Distribution fee payable
| 80,485 |
Trustees’ fees and expenses payable
| 2,739 |
Dividends payable
| 2,360 |
Accrued expenses and other liabilities
| 201,042 |
Total liabilities
| 14,273,425 |
Total net assets
| $1,186,631,406 |
| Net assets consist of | |
Paid-in capital
| $ 800,739,662 |
Total distributable earnings
| 385,891,744 |
Total net assets
| $1,186,631,406 |
| Computation of net asset value and offering price per share | |
Net assets – Class A
| $ 675,300,941 |
Shares outstanding – Class A1
| 53,468,579 |
Net asset value per share – Class A
| $12.63 |
Maximum offering price per share – Class A2
| $13.40 |
Net assets – Class C
| $ 128,528,269 |
Shares outstanding – Class C1
| 10,224,162 |
Net asset value per share – Class C
| $12.57 |
Net assets – Administrator Class
| $ 8,758,587 |
Shares outstanding – Administrator Class1
| 693,726 |
Net asset value per share – Administrator Class
| $12.63 |
Net assets – Institutional Class
| $ 374,043,609 |
Shares outstanding – Institutional Class1
| 29,854,152 |
Net asset value per share – Institutional Class
| $12.53 |
| 1 | The Fund has an unlimited number of authorized shares. |
| 2 | Maximum offering price is computed as 100/94.25 of net asset value. On investments of $50,000 or more, the offering price is reduced. |
The accompanying notes are an integral part of these financial statements.
Allspring Diversified Capital Builder Fund | 15
Statement of operations—six months ended March 31, 2022 (unaudited)
| | |
| Investment income | |
Dividends
| $ 6,943,490 |
Interest
| 3,804,822 |
Income from affiliated securities
| 6,276 |
Total investment income
| 10,754,588 |
| Expenses | |
Management fee
| 3,654,852 |
| Administration fees | |
Class A
| 713,505 |
Class C
| 137,147 |
Administrator Class
| 5,589 |
Institutional Class
| 243,297 |
| Shareholder servicing fees | |
Class A
| 849,411 |
Class C
| 163,271 |
Administrator Class
| 10,748 |
| Distribution fee | |
Class C
| 489,792 |
Custody and accounting fees
| 25,136 |
Professional fees
| 28,120 |
Registration fees
| 36,813 |
Shareholder report expenses
| 59,468 |
Trustees’ fees and expenses
| 10,683 |
Other fees and expenses
| 26,789 |
Total expenses
| 6,454,621 |
| Less: Fee waivers and/or expense reimbursements | |
Class A
| (9,680) |
Institutional Class
| (106) |
Net expenses
| 6,444,835 |
Net investment income
| 4,309,753 |
| Realized and unrealized gains (losses) on investments | |
Net realized gains on investments
| 48,625,801 |
Net change in unrealized gains (losses) on investments
| 26,835,263 |
Net realized and unrealized gains (losses) on investments
| 75,461,064 |
Net increase in net assets resulting from operations
| $79,770,817 |
The accompanying notes are an integral part of these financial statements.
16 | Allspring Diversified Capital Builder Fund
Statement of changes in net assets
| | | | | |
| | Six months ended
March 31, 2022
(unaudited) | Year ended
September 30, 2021 |
| Operations | | | | |
Net investment income
| | $ 4,309,753 | | $ 8,992,566 |
Net realized gains on investments
| | 48,625,801 | | 76,411,912 |
Net change in unrealized gains (losses) on investments
| | 26,835,263 | | 102,334,271 |
Net increase in net assets resulting from operations
| | 79,770,817 | | 187,738,749 |
| Distributions to shareholders from | | | | |
| Net investment income and net realized gains | | | | |
Class A
| | (46,125,355) | | (11,123,408) |
Class C
| | (8,423,434) | | (1,538,817) |
Administrator Class
| | (597,620) | | (132,621) |
Institutional Class
| | (26,037,889) | | (7,100,792) |
Total distributions to shareholders
| | (81,184,298) | | (19,895,638) |
| Capital share transactions | Shares | | Shares | |
| Proceeds from shares sold | | | | |
Class A
| 861,320 | 11,063,881 | 2,656,403 | 32,028,112 |
Class C
| 369,342 | 4,715,998 | 1,126,019 | 13,697,978 |
Administrator Class
| 78,956 | 1,002,357 | 157,581 | 1,930,653 |
Institutional Class
| 2,848,414 | 36,647,647 | 4,135,579 | 50,095,587 |
| | | 53,429,883 | | 97,752,330 |
| Reinvestment of distributions | | | | |
Class A
| 3,429,237 | 44,047,805 | 887,849 | 10,610,267 |
Class C
| 650,758 | 8,310,005 | 128,497 | 1,513,271 |
Administrator Class
| 46,365 | 595,790 | 10,971 | 131,644 |
Institutional Class
| 1,878,325 | 23,954,700 | 544,042 | 6,491,325 |
| | | 76,908,300 | | 18,746,507 |
| Payment for shares redeemed | | | | |
Class A
| (2,874,665) | (37,146,033) | (6,835,939) | (83,812,601) |
Class C
| (907,131) | (11,579,698) | (2,374,486) | (28,773,555) |
Administrator Class
| (82,821) | (1,064,230) | (107,947) | (1,340,542) |
Institutional Class
| (3,464,849) | (44,162,014) | (5,661,351) | (68,312,479) |
| | | (93,951,975) | | (182,239,177) |
Net increase (decrease) in net assets resulting from capital share transactions
| | 36,386,208 | | (65,740,340) |
Total increase in net assets
| | 34,972,727 | | 102,102,771 |
| Net assets | | | | |
Beginning of period
| | 1,151,658,679 | | 1,049,555,908 |
End of period
| | $1,186,631,406 | | $1,151,658,679 |
The accompanying notes are an integral part of these financial statements.
Allspring Diversified Capital Builder Fund | 17
Financial highlights
(For a share outstanding throughout each period)
| | | Year ended September 30 |
| Class A | Six months ended
March 31, 2022
(unaudited) | 2021 | 2020 | 2019 | 2018 | 2017 |
Net asset value, beginning of period
| $12.64 | $10.88 | $10.71 | $10.88 | $10.30 | $9.96 |
Net investment income
| 0.05 | 0.09 | 0.11 | 0.14 | 0.10 | 0.14 1 |
Net realized and unrealized gains (losses) on investments
| 0.84 | 1.87 | 0.63 | 0.37 | 1.06 | 1.12 |
Total from investment operations
| 0.89 | 1.96 | 0.74 | 0.51 | 1.16 | 1.26 |
| Distributions to shareholders from | | | | | | |
Net investment income
| (0.05) | (0.10) | (0.13) | (0.14) | (0.09) | (0.14) |
Net realized gains
| (0.85) | (0.10) | (0.44) | (0.54) | (0.49) | (0.78) |
Total distributions to shareholders
| (0.90) | (0.20) | (0.57) | (0.68) | (0.58) | (0.92) |
Net asset value, end of period
| $12.63 | $12.64 | $10.88 | $10.71 | $10.88 | $10.30 |
Total return2
| 6.94% | 18.18% | 7.26% | 5.60% | 11.72% | 13.62% |
| Ratios to average net assets (annualized) | | | | | | |
Gross expenses
| 1.10% | 1.11% | 1.11% | 1.12% | 1.11% | 1.12% |
Net expenses
| 1.10% | 1.11% | 1.11% | 1.12% | 1.11% | 1.12% |
Net investment income
| 0.70% | 0.76% | 1.09% | 1.38% | 0.96% | 1.43% |
| Supplemental data | | | | | | |
Portfolio turnover rate
| 10% | 28% | 44% | 61% | 31% | 54% |
Net assets, end of period (000s omitted)
| $675,301 | $657,696 | $601,951 | $616,346 | $574,760 | $551,272 |
| 1 | Calculated based upon average shares outstanding |
| 2 | Total return calculations do not include any sales charges. Returns for periods of less than one year are not annualized. |
The accompanying notes are an integral part of these financial statements.
18 | Allspring Diversified Capital Builder Fund
Financial highlights
(For a share outstanding throughout each period)
| | | Year ended September 30 |
| Class C | Six months ended
March 31, 2022
(unaudited) | 2021 | 2020 | 2019 | 2018 | 2017 |
Net asset value, beginning of period
| $12.58 | $10.86 | $10.69 | $10.86 | $10.28 | $9.96 |
Net investment income (loss)
| (0.00) 1 | 0.00 2,3 | 0.03 | 0.06 | 0.02 | 0.08 |
Net realized and unrealized gains (losses) on investments
| 0.84 | 1.86 | 0.63 | 0.37 | 1.06 | 1.11 |
Total from investment operations
| 0.84 | 1.86 | 0.66 | 0.43 | 1.08 | 1.19 |
| Distributions to shareholders from | | | | | | |
Net investment income
| (0.00) 3 | (0.04) | (0.05) | (0.06) | (0.01) | (0.09) |
Net realized gains
| (0.85) | (0.10) | (0.44) | (0.54) | (0.49) | (0.78) |
Total distributions to shareholders
| (0.85) | (0.14) | (0.49) | (0.60) | (0.50) | (0.87) |
Net asset value, end of period
| $12.57 | $12.58 | $10.86 | $10.69 | $10.86 | $10.28 |
Total return4
| 6.58% | 17.25% | 6.44% | 4.81% | 10.88% | 12.85% |
| Ratios to average net assets (annualized) | | | | | | |
Gross expenses
| 1.85% | 1.86% | 1.86% | 1.87% | 1.87% | 1.87% |
Net expenses
| 1.85% | 1.86% | 1.86% | 1.87% | 1.87% | 1.87% |
Net investment income (loss)
| (0.05)% | 0.01% | 0.34% | 0.65% | 0.21% | 0.65% |
| Supplemental data | | | | | | |
Portfolio turnover rate
| 10% | 28% | 44% | 61% | 31% | 54% |
Net assets, end of period (000s omitted)
| $128,528 | $127,209 | $121,947 | $118,297 | $131,601 | $117,346 |
| 1 | Amount is more than $(0.005) |
| 2 | Calculated based upon average shares outstanding |
| 3 | Amount is less than $0.005. |
| 4 | Total return calculations do not include any sales charges. Returns for periods of less than one year are not annualized. |
The accompanying notes are an integral part of these financial statements.
Allspring Diversified Capital Builder Fund | 19
Financial highlights
(For a share outstanding throughout each period)
| | | Year ended September 30 |
| Administrator Class | Six months ended
March 31, 2022
(unaudited) | 2021 | 2020 | 2019 | 2018 | 2017 |
Net asset value, beginning of period
| $12.64 | $10.89 | $10.72 | $10.89 | $10.32 | $9.97 |
Net investment income
| 0.05 1 | 0.10 1 | 0.12 1 | 0.15 1 | 0.11 1 | 0.16 1 |
Net realized and unrealized gains (losses) on investments
| 0.86 | 1.86 | 0.63 | 0.37 | 1.06 | 1.12 |
Total from investment operations
| 0.91 | 1.96 | 0.75 | 0.52 | 1.17 | 1.28 |
| Distributions to shareholders from | | | | | | |
Net investment income
| (0.07) | (0.11) | (0.14) | (0.15) | (0.11) | (0.15) |
Net realized gains
| (0.85) | (0.10) | (0.44) | (0.54) | (0.49) | (0.78) |
Total distributions to shareholders
| (0.92) | (0.21) | (0.58) | (0.69) | (0.60) | (0.93) |
Net asset value, end of period
| $12.63 | $12.64 | $10.89 | $10.72 | $10.89 | $10.32 |
Total return2
| 7.10% | 18.17% | 7.33% | 5.67% | 11.73% | 13.75% |
| Ratios to average net assets (annualized) | | | | | | |
Gross expenses
| 1.02% | 1.03% | 1.03% | 1.04% | 1.03% | 1.04% |
Net expenses
| 1.02% | 1.03% | 1.03% | 1.04% | 1.03% | 1.04% |
Net investment income
| 0.78% | 0.84% | 1.19% | 1.47% | 1.04% | 1.58% |
| Supplemental data | | | | | | |
Portfolio turnover rate
| 10% | 28% | 44% | 61% | 31% | 54% |
Net assets, end of period (000s omitted)
| $8,759 | $8,234 | $6,429 | $9,708 | $13,821 | $10,225 |
| 1 | Calculated based upon average shares outstanding |
| 2 | Returns for periods of less than one year are not annualized. |
The accompanying notes are an integral part of these financial statements.
20 | Allspring Diversified Capital Builder Fund
Financial highlights
(For a share outstanding throughout each period)
| | | Year ended September 30 |
| Institutional Class | Six months ended
March 31, 2022
(unaudited) | 2021 | 2020 | 2019 | 2018 | 2017 |
Net asset value, beginning of period
| $12.54 | $10.79 | $10.64 | $10.81 | $10.25 | $9.90 |
Net investment income
| 0.07 | 0.13 | 0.14 | 0.18 | 0.14 | 0.19 |
Net realized and unrealized gains (losses) on investments
| 0.84 | 1.86 | 0.62 | 0.36 | 1.05 | 1.11 |
Total from investment operations
| 0.91 | 1.99 | 0.76 | 0.54 | 1.19 | 1.30 |
| Distributions to shareholders from | | | | | | |
Net investment income
| (0.07) | (0.14) | (0.17) | (0.17) | (0.14) | (0.17) |
Net realized gains
| (0.85) | (0.10) | (0.44) | (0.54) | (0.49) | (0.78) |
Total distributions to shareholders
| (0.92) | (0.24) | (0.61) | (0.71) | (0.63) | (0.95) |
Net asset value, end of period
| $12.53 | $12.54 | $10.79 | $10.64 | $10.81 | $10.25 |
Total return1
| 7.16% | 18.51% | 7.48% | 5.98% | 12.04% | 14.11% |
| Ratios to average net assets (annualized) | | | | | | |
Gross expenses
| 0.77% | 0.78% | 0.78% | 0.79% | 0.79% | 0.79% |
Net expenses
| 0.77% | 0.78% | 0.78% | 0.78% | 0.78% | 0.78% |
Net investment income
| 1.03% | 1.09% | 1.42% | 1.73% | 1.30% | 1.71% |
| Supplemental data | | | | | | |
Portfolio turnover rate
| 10% | 28% | 44% | 61% | 31% | 54% |
Net assets, end of period (000s omitted)
| $374,044 | $358,519 | $319,229 | $359,278 | $326,283 | $262,754 |
| 1 | Returns for periods of less than one year are not annualized. |
The accompanying notes are an integral part of these financial statements.
Allspring Diversified Capital Builder Fund | 21
Notes to financial statements (unaudited)
1. ORGANIZATION
Allspring Funds Trust (the "Trust"), a Delaware statutory trust organized on March 10, 1999, is an open-end management investment company registered under the Investment Company Act of 1940, as amended (the "1940 Act"). As an investment company, the Trust follows the accounting and reporting guidance in Financial Accounting Standards Board ("FASB") Accounting Standards Codification Topic 946, Financial Services – Investment Companies. These financial statements report on the Allspring Diversified Capital Builder Fund (the "Fund") which is a diversified series of the Trust.
Effective on November 1, 2021, the sale transaction of Wells Fargo Asset Management ("WFAM") by Wells Fargo & Company to GTCR LLC and Reverence Capital Partners, L.P. was closed. In connection with the closing of the transaction, WFAM became known as Allspring Global Investments (“Allspring”) and various entities that provided services to the Fund changed their names to "Allspring", including Allspring Funds Management, LLC, the investment manager to the Fund, Allspring Global Investments, LLC and Allspring Global Investments (UK) Limited, both registered investment advisers providing subadvisory services to certain funds, and Allspring Funds Distributor, LLC, the Fund's principal underwriter. Consummation of the transaction resulted in a new investment management agreement and subadvisory agreement which became effective on November 1, 2021.
2. SIGNIFICANT ACCOUNTING POLICIES
The following significant accounting policies, which are consistently followed in the preparation of the financial statements of the Fund, are in conformity with U.S. generally accepted accounting principles which require management to make estimates and assumptions that affect the reported amounts of assets and liabilities, disclosure of contingent assets and liabilities at the date of the financial statements, and the reported amounts of income and expenses during the reporting period. Actual results could differ from those estimates.
Securities valuation
All investments are valued each business day as of the close of regular trading on the New York Stock Exchange (generally 4 p.m. Eastern Time), although the Fund may deviate from this calculation time under unusual or unexpected circumstances.
Equity securities that are listed on a foreign or domestic exchange or market are valued at the official closing price or, if none, the last sales price. If no sale occurs on the principal exchange or market that day, a fair value price will be determined in accordance with the Fund’s Valuation Procedures.
Debt securities are valued at the evaluated bid price provided by an independent pricing service (e.g. taking into account various factors, including yields, maturities, or credit ratings) or, if a reliable price is not available, the quoted bid price from an independent broker-dealer.
Investments in registered open-end investment companies are valued at net asset value. Interests in non-registered investment companies that are redeemable at net asset value are fair valued normally at net asset value.
Investments which are not valued using any of the methods discussed above are valued at their fair value, as determined in good faith by the Board of Trustees. The Board of Trustees has established a Valuation Committee comprised of the Trustees and has delegated to it the authority to take any actions regarding the valuation of portfolio securities that the Valuation Committee deems necessary or appropriate, including determining the fair value of portfolio securities, unless the determination has been delegated to the Allspring Global Investments Pricing Committee at Allspring Funds Management, LLC ("Allspring Funds Management"). The Board of Trustees retains the authority to make or ratify any valuation decisions or approve any changes to the Valuation Procedures as it deems appropriate. On a quarterly basis, the Board of Trustees receives reports on any valuation actions taken by the Valuation Committee or the Allspring Global Investments Pricing Committee which may include items for ratification.
Securities lending
The Fund may lend its securities from time to time in order to earn additional income in the form of fees or interest on securities received as collateral or the investment of any cash received as collateral. When securities are on loan, the Fund receives interest or dividends on those securities. Cash collateral received in connection with its securities lending transactions is invested in Securities Lending Cash Investments, LLC (the "Securities Lending Fund"), an affiliated non-registered investment company. Investments in Securities Lending Fund are valued at the evaluated bid price provided by an independent pricing service. Income earned from investment in the Securities Lending Fund (net of fees and rebates), if any, is included in income from affiliated securities on the Statement of Operations.
In a securities lending transaction, the net asset value of the Fund is affected by an increase or decrease in the value of the securities loaned and by an increase or decrease in the value of the instrument in which collateral is invested. The amount of
22 | Allspring Diversified Capital Builder Fund
Notes to financial statements (unaudited)
securities lending activity undertaken by the Fund fluctuates from time to time. The Fund has the right under the lending agreement to recover the securities from the borrower on demand. In the event of default or bankruptcy by the borrower, the Fund may be prevented from recovering the loaned securities or gaining access to the collateral or may experience delays or costs in doing so. In such an event, the terms of the agreement allow the unaffiliated securities lending agent to use the collateral to purchase replacement securities on behalf of the Fund or pay the Fund the market value of the loaned securities. The Fund bears the risk of loss with respect to depreciation of its investment of the cash collateral.
Security transactions and income recognition
Securities transactions are recorded on a trade date basis. Realized gains or losses are recorded on the basis of identified cost.
Dividend income is recognized on the ex-dividend date.
Interest income is accrued daily and bond discounts are accreted and premiums are amortized daily. To the extent debt obligations are placed on non-accrual status, any related interest income may be reduced by writing off interest receivables when the collection of all or a portion of interest has been determined to be doubtful based on consistently applied procedures and the fair value has decreased. If the issuer subsequently resumes interest payments or when the collectability of interest is reasonably assured, the debt obligation is removed from non-accrual status.
Distributions to shareholders
Distributions to shareholders are recorded on the ex-dividend date and paid from net investment income quarterly and any net realized gains are paid at least annually. Such distributions are determined in accordance with income tax regulations and may differ from U.S. generally accepted accounting principles. Dividend sources are estimated at the time of declaration. The tax character of distributions is determined as of the Fund's fiscal year end. Therefore, a portion of the Fund's distributions made prior to the Fund’s fiscal year end may be categorized as a tax return of capital at year end.
Federal and other taxes
The Fund intends to continue to qualify as a regulated investment company by distributing substantially all of its investment company taxable income and any net realized capital gains (after reduction for capital loss carryforwards) sufficient to relieve it from all, or substantially all, federal income taxes. Accordingly, no provision for federal income taxes was required.
The Fund’s income and federal excise tax returns and all financial records supporting those returns for the prior three fiscal years are subject to examination by the federal and Delaware revenue authorities. Management has analyzed the Fund's tax positions taken on federal, state, and foreign tax returns for all open tax years and does not believe that there are any uncertain tax positions that require recognition of a tax liability.
As of March 31, 2022, the aggregate cost of all investments for federal income tax purposes was $531,909,937 and the unrealized gains (losses) consisted of:
| Gross unrealized gains | $702,748,160 |
| Gross unrealized losses | (56,145,318) |
| Net unrealized gains | $646,602,842 |
Class allocations
The separate classes of shares offered by the Fund differ principally in applicable sales charges, distribution, shareholder servicing, and administration fees. Class specific expenses are charged directly to that share class. Investment income, common fund-level expenses, and realized and unrealized gains (losses) on investments are allocated daily to each class of shares based on the relative proportion of net assets of each class.
Allspring Diversified Capital Builder Fund | 23
Notes to financial statements (unaudited)
3. FAIR VALUATION MEASUREMENTS
Fair value measurements of investments are determined within a framework that has established a fair value hierarchy based upon the various data inputs utilized in determining the value of the Fund’s investments. The three-level hierarchy gives the highest priority to unadjusted quoted prices in active markets for identical assets or liabilities (Level 1) and the lowest priority to unobservable inputs (Level 3). The Fund’s investments are classified within the fair value hierarchy based on the lowest level of input that is significant to the fair value measurement. The inputs are summarized into three broad levels as follows:
| ■ | Level 1 – quoted prices in active markets for identical securities |
| ■ | Level 2 – other significant observable inputs (including quoted prices for similar securities, interest rates, prepayment speeds, credit risk, etc.) |
| ■ | Level 3 – significant unobservable inputs (including the Fund’s own assumptions in determining the fair value of investments) |
The inputs or methodologies used for valuing investments in securities are not necessarily an indication of the risk associated with investing in those securities.
The following is a summary of the inputs used in valuing the Fund’s assets and liabilities as of March 31, 2022:
| | Quoted prices
(Level 1) | Other significant
observable inputs
(Level 2) | Significant
unobservable inputs
(Level 3) | Total |
| Assets | | | | |
| Investments in: | | | | |
| Common stocks | | | | |
| Consumer discretionary | $ 3,455,600 | $ 0 | $0 | $ 3,455,600 |
| Health care | 345,473,790 | 0 | 0 | 345,473,790 |
| Industrials | 189,571,440 | 0 | 0 | 189,571,440 |
| Information technology | 328,992,185 | 0 | 0 | 328,992,185 |
| Materials | 134,907,377 | 0 | 0 | 134,907,377 |
| Corporate bonds and notes | 0 | 143,371,355 | 0 | 143,371,355 |
| Yankee corporate bonds and notes | 0 | 27,403,241 | 0 | 27,403,241 |
| Short-term investments | | | | |
| Investment companies | 5,337,791 | 0 | 0 | 5,337,791 |
| Total assets | $1,007,738,183 | $170,774,596 | $0 | $1,178,512,779 |
Additional sector, industry or geographic detail, if any, is included in the Portfolio of Investments.
For the six months ended March 31, 2022, the Fund did not have any transfers into/out of Level 3.
4. TRANSACTIONS WITH AFFILIATES
Management fee
Allspring Funds Management, a wholly owned subsidiary of Allspring Global Investments Holdings, LLC, a holding company indirectly owned by certain private funds of GTCR LLC and Reverence Capital Partners, L.P., is the manager of the Fund and provides advisory and fund-level administrative services under an investment management agreement. Under the investment management agreement, Allspring Funds Management is responsible for, among other services, implementing the investment objectives and strategies of the Fund, supervising the subadviser and providing fund-level administrative services in connection with the Fund’s operations. As compensation for its services under the investment management agreement, Allspring Funds Management is entitled to receive a management fee at the following annual rate based on the Fund’s average daily net assets:
24 | Allspring Diversified Capital Builder Fund
Notes to financial statements (unaudited)
| Average daily net assets | Management fee |
| First $500 million | 0.650% |
| Next $500 million | 0.600 |
| Next $2 billion | 0.550 |
| Next $2 billion | 0.525 |
| Next $5 billion | 0.490 |
| Over $10 billion | 0.480 |
For the six months ended March 31, 2022, the management fee was equivalent to an annual rate of 0.61% of the Fund’s average daily net assets.
Allspring Funds Management has retained the services of a subadviser to provide daily portfolio management to the Fund. The fee for subadvisory services is borne by Allspring Funds Management. Allspring Global Investments, LLC ("Allspring Investments"), an affiliate of Allspring Funds Management and a wholly owned subsidiary of Allspring Global Investments Holdings, LLC, is the subadviser to the Fund and is entitled to receive a fee from Allspring Funds Management at an annual rate starting at 0.35% and declining to 0.20% as the average daily net assets of the Fund increase.
Administration fees
Under a class-level administration agreement, Allspring Funds Management provides class-level administrative services to the Fund, which includes paying fees and expenses for services provided by the transfer agent, sub-transfer agents, omnibus account servicers and record-keepers. As compensation for its services under the class-level administration agreement, Allspring Funds Management receives an annual fee which is calculated based on the average daily net assets of each class as follows:
| | Class-level
administration fee |
| Class A | 0.21% |
| Class C | 0.21 |
| Administrator Class | 0.13 |
| Institutional Class | 0.13 |
Waivers and/or expense reimbursements
Allspring Funds Management has contractually committed to waive and/or reimburse management and administration fees to the extent necessary to maintain certain net operating expense ratios for the Fund. When each class of the Fund has exceeded its expense cap, Allspring Funds Management will waive fees and/or reimburse expenses from fund-level expenses on a proportionate basis and then from class specific expenses. When only certain classes exceed their expense caps, waivers and/or reimbursements are applied against class specific expenses before fund-level expenses. Allspring Funds Management has contractually committed through January 31, 2023 to waive fees and/or reimburse expenses to the extent necessary to cap expenses. Prior to or after the commitment expiration date, the caps may be increased or the commitment to maintain the caps may be terminated only with the approval of the Board of Trustees. As of March 31, 2022, the contractual expense caps are as follows:
| | Expense ratio caps |
| Class A | 1.13% |
| Class C | 1.88 |
| Administrator Class | 1.05 |
| Institutional Class | 0.78 |
Allspring Diversified Capital Builder Fund | 25
Notes to financial statements (unaudited)
Distribution fee
The Trust has adopted a distribution plan for Class C shares of the Fund pursuant to Rule 12b-1 under the 1940 Act. A distribution fee is charged to Class C shares and paid to Allspring Funds Distributor, LLC ("Allspring Funds Distributor"), the principal underwriter, an affiliate of Allspring Funds Management, at an annual rate of 0.75% of the average daily net assets of Class C shares.
In addition, Allspring Funds Distributor is entitled to receive the front-end sales charge from the purchase of Class A shares and a contingent deferred sales charge on the redemption of certain Class A shares. Allspring Funds Distributor is also entitled to receive the contingent deferred sales charges from redemptions of Class C shares. For the six months ended March 31, 2022, Allspring Funds Distributor received $12,022 from the sale of Class A shares and $29 in contingent deferred sales charges from redemptions of Class C shares. No contingent deferred sales charges were incurred by Class A shares for the six months ended March 31, 2022.
Shareholder servicing fees
The Trust has entered into contracts with one or more shareholder servicing agents, whereby Class A, Class C and Administrator Class of the Fund are charged a fee at an annual rate of 0.25% of the average daily net assets of each respective class. A portion of these total shareholder servicing fees were paid to affiliates, and to certain entities that were affiliates of the Fund until November 1, 2021.
Interfund transactions
The Fund may purchase or sell portfolio investment securities to certain affiliates pursuant to Rule 17a-7 under the 1940 Act and under procedures adopted by the Board of Trustees. The procedures have been designed to ensure that these interfund transactions, which do not incur broker commissions, are effected at current market prices.
5. INVESTMENT PORTFOLIO TRANSACTIONS
Purchases and sales of investments, excluding U.S. government obligations (if any) and short-term securities, for the six months ended March 31, 2022 were $113,896,493 and $162,977,288, respectively.
6. SECURITIES LENDING TRANSACTIONS
The Fund lends its securities through an unaffiliated securities lending agent and receives collateral in the form of cash or securities with a value at least equal to the value of the securities on loan. The value of the loaned securities is determined at the close of each business day and any increases or decreases in the required collateral are exchanged between the Fund and the counterparty on the next business day. Cash collateral received is invested in the Securities Lending Fund which seeks to provide a positive return compared to the daily Federal Funds Open Rate by investing in high-quality, U.S. dollar-denominated short-term money market instruments and is exempt from registration under Section 3(c)(7) of the 1940 Act. Securities Lending Fund is managed by Allspring Funds Management and is subadvised by Allspring Investments. Allspring Funds Management receives an advisory fee starting at 0.05% and declining to 0.01% as the average daily net assets of the Securities Lending Fund increase. All of the fees received by Allspring Funds Management are paid to Allspring Investments for its services as subadviser.
In the event of counterparty default or the failure of a borrower to return a loaned security, the Fund has the right to use the collateral to offset any losses incurred. As of March 31, 2022, the Fund had securities lending transactions with the following counterparties which are subject to offset:
| Counterparty | Value of
securities on
loan | Collateral
received1 | Net amount |
| Citigroup Global Markets Incorporated | $900,675 | $(900,675) | $0 |
1 Collateral received within this table is limited to the collateral for the net transaction with the counterparty.
7. BANK BORROWINGS
The Trust (excluding the money market funds), Allspring Master Trust and Allspring Variable Trust are parties to a $350,000,000 revolving credit agreement whereby the Fund is permitted to use bank borrowings for temporary or emergency purposes, such as to fund shareholder redemption requests. Interest under the credit agreement is charged to the Fund based
26 | Allspring Diversified Capital Builder Fund
Notes to financial statements (unaudited)
on a borrowing rate equal to the higher of the Federal Funds rate in effect on that day plus 1.25% or the overnight bank funding rate in effect on that day plus 1.25%. In addition, an annual commitment fee equal to 0.25% of the unused balance is allocated to each participating fund.
For the six months ended March 31, 2022, there were no borrowings by the Fund under the agreement.
8. CONCENTRATION RISKS
As of the end of the period, the Fund concentrated its portfolio of investments in the health care and information technology sectors. A fund that invests a substantial portion of its assets in any sector may be more affected by changes in that sector than would be a fund whose investments are not heavily weighted in any sector.
9. INDEMNIFICATION
Under the Fund's organizational documents, the officers and Trustees have been granted certain indemnification rights against certain liabilities that may arise out of performance of their duties to the Fund. The Fund has entered into a separate agreement with each Trustee that converts indemnification rights currently existing under the Fund’s organizational documents into contractual rights that cannot be changed in the future without the consent of the Trustee. Additionally, in the normal course of business, the Fund may enter into contracts with service providers that contain a variety of indemnification clauses. The Fund’s maximum exposure under these arrangements is dependent on future claims that may be made against the Fund and, therefore, cannot be estimated.
10. CORONAVIRUS (COVID-19) PANDEMIC
On March 11, 2020, the World Health Organization announced that it had made the assessment that coronavirus disease 2019 (“COVID-19”) is a pandemic. The impacts of COVID-19 are affecting the entire global economy, individual companies and investment products, the funds, and the market in general. There is significant uncertainty around the extent and duration of business disruptions related to COVID-19 and the impacts may last for an extended period of time. COVID-19 has led to significant uncertainty and volatility in the financial markets.
Allspring Diversified Capital Builder Fund | 27
Other information (unaudited)
PROXY VOTING INFORMATION
A description of the policies and procedures used to determine how to vote proxies relating to portfolio securities is available without charge, upon request, by calling 1-800-222-8222, visiting our website at allspringglobal.com, or visiting the SEC website at sec.gov. Information regarding how the proxies related to portfolio securities were voted during the most recent 12-month period ended June 30 is available on the website at allspringglobal.com or by visiting the SEC website at sec.gov.
QUARTERLY PORTFOLIO HOLDINGS INFORMATION
The Fund files its complete schedule of portfolio holdings with the SEC for the first and third quarters of each fiscal year as an exhibit to its reports on Form N-PORT. Shareholders may view the filed Form N-PORT by visiting the SEC website at sec.gov.
28 | Allspring Diversified Capital Builder Fund
Other information (unaudited)
BOARD OF TRUSTEES AND OFFICERS
Each of the Trustees and Officers listed in the table below acts in identical capacities for each fund in the Allspring family of funds, which consists of 138 mutual funds comprising the Allspring Funds Trust, Allspring Variable Trust, Allspring Master Trust and four closed-end funds (collectively the “Fund Complex”). This table should be read in conjunction with the Prospectus and the Statement of Additional Information1. The mailing address of each Trustee and Officer is 525 Market Street, 12th Floor, San Francisco, CA 94105. Each Trustee and Officer serves an indefinite term, however, each Trustee serves such term until reaching the mandatory retirement age established by the Trustees.
Independent Trustees
Name and
year of birth | Position held and
length of service* | Principal occupations during past five years or longer | Current other
public company or
investment
company
directorships |
William R. Ebsworth
(Born 1957) | Trustee,
since 2015 | Retired. From 1984 to 2013, equities analyst, portfolio manager, research director and chief investment officer at Fidelity Management and Research Company in Boston, Tokyo, and Hong Kong, and retired in 2013 as Chief Investment Officer of Fidelity Strategic Advisers, Inc. where he led a team of investment professionals managing client assets. Prior thereto, Board member of Hong Kong Securities Clearing Co., Hong Kong Options Clearing Corp., the Thailand International Fund, Ltd., Fidelity Investments Life Insurance Company, and Empire Fidelity Investments Life Insurance Company. Audit Committee Chair and Investment Committee Chair of the Vincent Memorial Hospital Endowment (non-profit organization). Mr. Ebsworth is a CFA® charterholder. | N/A |
Jane A. Freeman
(Born 1953) | Trustee,
since 2015;
Chair Liaison,
since 2018 | Retired. From 2012 to 2014 and 1999 to 2008, Chief Financial Officer of Scientific Learning Corporation. From 2008 to 2012, Ms. Freeman provided consulting services related to strategic business projects. Prior to 1999, Portfolio Manager at Rockefeller & Co. and Scudder, Stevens & Clark. Board member of the Harding Loevner Funds from 1996 to 2014, serving as both Lead Independent Director and chair of the Audit Committee. Board member of the Russell Exchange Traded Funds Trust from 2011 to 2012 and the chair of the Audit Committee. Ms. Freeman is also an inactive Chartered Financial Analyst. | N/A |
Isaiah Harris, Jr.
(Born 1952) | Trustee,
since 2009; Audit
Committee
Chair,
since 2019 | Retired. Chairman of the Board of CIGNA Corporation from 2009 to 2021, and Director from 2005 to 2008. From 2003 to 2011, Director of Deluxe Corporation. Prior thereto, President and CEO of BellSouth Advertising and Publishing Corp. from 2005 to 2007, President and CEO of BellSouth Enterprises from 2004 to 2005 and President of BellSouth Consumer Services from 2000 to 2003. Emeritus member of the Iowa State University Foundation Board of Governors. Emeritus Member of the Advisory Board of Iowa State University School of Business. Advisory Board Member, Palm Harbor Academy (private school). Advisory Board Member, Fellowship of Christian Athletes. Mr. Harris is a certified public accountant (inactive status). | N/A |
David F. Larcker
(Born 1950) | Trustee,
since 2009 | James Irvin Miller Professor of Accounting at the Graduate School of Business (Emeritus), Stanford University, Director of the Corporate Governance Research Initiative and Senior Faculty of The Rock Center for Corporate Governance since 2006. From 2005 to 2008, Professor of Accounting at the Graduate School of Business, Stanford University. Prior thereto, Ernst & Young Professor of Accounting at The Wharton School, University of Pennsylvania from 1985 to 2005. | N/A |
Allspring Diversified Capital Builder Fund | 29
Other information (unaudited)
Name and
year of birth | Position held and
length of service* | Principal occupations during past five years or longer | Current other
public company or
investment
company
directorships |
Olivia S. Mitchell
(Born 1953) | Trustee,
since 2006;
Nominating and
Governance
Committee Chair,
since 2018 | International Foundation of Employee Benefit Plans Professor since 1993, Wharton School of the University of Pennsylvania. Director of Wharton’s Pension Research Council and Boettner Center on Pensions & Retirement Research, and Research Associate at the National Bureau of Economic Research. Previously taught at Cornell University from 1978 to 1993. | N/A |
Timothy J. Penny
(Born 1951) | Trustee,
since 1996;
Chair,
since 2018 | President and Chief Executive Officer of Southern Minnesota Initiative Foundation, a non-profit organization, since 2007. Member of the Board of Trustees of NorthStar Education Finance, Inc., a non-profit organization, since 2007. | N/A |
James G. Polisson
(Born 1959) | Trustee,
since 2018 | Retired. Chief Marketing Officer, Source (ETF) UK Services, Ltd, from 2015 to 2017. From 2012 to 2015, Principal of The Polisson Group, LLC, a management consulting, corporate advisory and principal investing company. Chief Executive Officer and Managing Director at Russell Investments, Global Exchange Traded Funds from 2010 to 2012. Managing Director of Barclays Global Investors from 1998 to 2010 and Global Chief Marketing Officer for iShares and Barclays Global Investors from 2000 to 2010. Trustee of the San Francisco Mechanics’ Institute, a non-profit organization, from 2013 to 2015. Board member of the Russell Exchange Traded Fund Trust from 2011 to 2012. Director of Barclays Global Investors Holdings Deutschland GmbH from 2006 to 2009. Mr. Polisson is an attorney and has a retired status with the Massachusetts and District of Columbia Bar Associations. | N/A |
Pamela Wheelock
(Born 1959) | Trustee,
since January
2020; previously
Trustee from
January 2018 to
July 2019 | Board member of the Destination Medical Center Economic Development Agency, Rochester, Minnesota since 2019. Interim President of the McKnight Foundation from January to September 2020. McKnight Foundation Consultant, November 2020 to February 2021. Acting Commissioner, Minnesota Department of Human Services, July 2019 through September 2019. Consultant (part-time), Minnesota Department of Human Services, October 2019 through December 2019. Chief Operating Officer, Twin Cities Habitat for Humanity from 2017 to 2019. Vice President of University Services, University of Minnesota from 2012 to 2016. Prior thereto, on the Board of Directors, Governance Committee and Finance Committee for the Minnesota Philanthropy Partners (Saint Paul Foundation) from 2012 to 2018, Interim Chief Executive Officer of Blue Cross Blue Shield of Minnesota from 2011 to 2012, Chairman of the Board from 2009 to 2012 and Board Director from 2003 to 2015. Vice President, Leadership and Community Engagement, Bush Foundation, Saint Paul, Minnesota (a private foundation) from 2009 to 2011. Executive Vice President and Chief Financial Officer, Minnesota Sports and Entertainment from 2004 to 2009 and Senior Vice President from 2002 to 2004. Executive Vice President of the Minnesota Wild Foundation from 2004 to 2008. Commissioner of Finance, State of Minnesota, from 1999 to 2002. Currently Board Chair of the Minnesota Wild Foundation since 2010. | N/A |
* Length of service dates reflect the Trustee’s commencement of service with the Trust’s predecessor entities, where applicable.
30 | Allspring Diversified Capital Builder Fund
Other information (unaudited)
Officers2
Name and
year of birth | Position held and
length of service | Principal occupations during past five years or longer |
Andrew Owen
(Born 1960) | President,
since 2017 | President, Chief Executive Officer and Director of Allspring Funds Management, LLC since 2017 and co-president of Galliard Capital Management, LLC, an affiliate of Allspring Funds Management, LLC, since 2019. Prior thereto, Head of Affiliated Managers, Allspring Global Investments, from 2014 to 2019 and Executive Vice President responsible for marketing, investments and product development for Allspring Funds Management, LLC, from 2009 to 2014. In addition, Mr. Owen was an Executive Vice President of Wells Fargo & Company from 2014 to 2021. |
Jeremy DePalma
(Born 1974) | Treasurer,
since 2012
(for certain funds in
the Fund Complex);
since 2021 (for
the remaining funds in the
Fund Complex) | Senior Vice President of Allspring Funds Management, LLC since 2009. Senior Vice President of Evergreen Investment Management Company, LLC from 2008 to 2010 and head of the Fund Reporting and Control Team within Fund Administration from 2005 to 2010. |
Kate McKinley
(Born 1977) | Chief Legal Officer,
since 2021 | Chief Legal Officer of Allspring Global Investments since 2021. Prior thereto, held various roles at State Street Global Advisors beginning in 2010, including serving as Senior Vice President and General Counsel from 2019 to 2021, and Chief Operating Officer of the Institutional Client Group from 2016 - 2019. Prior to working at State Street Global Advisors served as Assistant General Counsel for Bank of America Corporation from 2005 to 2010 and as an Associate at WilmerHale from 2002 to 2005. |
Christopher Baker
(Born 1976) | Chief Compliance Officer, since 2022 | Global Chief Compliance Officer for Allspring Global Investments since 2022. Prior thereto, Chief Compliance Officer for State Street Global Advisors from 2018 to 2021. Senior Compliance Officer for the State Street divisions of Alternative Investment Solutions, Sector Solutions, and Global Marketing from 2015 to 2018. From 2010 to 2015 Vice President, Global Head of Investment and Marketing Compliance for State Street Global Advisors. |
Matthew Prasse
(Born 1983) | Secretary,
since 2021 | Senior Counsel of the Allspring Legal Department since 2021. Senior Counsel of the Wells Fargo Legal Department from 2018 to 2021. Previously, Counsel for Barings LLC from 2015 to 2018. Prior to joining Barings, Associate at Morgan, Lewis & Bockius LLP from 2008 to 2015. |
1 The Statement of Additional Information includes additional information about the Trustees and is available, without charge, upon request, by calling 1-800-222-8222 or by visiting the website at allspringglobal.com.
2 For those Officers with tenures at Allspring Global Investments and/or Allspring Funds Management, LLC that began prior to 2021, such tenures include years of service during which these businesses/entities were known as Wells Fargo Asset Management and Wells Fargo Funds Management, LLC, respectively.
Allspring Diversified Capital Builder Fund | 31
For more information
More information about Allspring Funds is available free upon request. To obtain literature, please write, visit the Fund's website, or call:
Allspring Funds
P.O. Box 219967
Kansas City, MO 64121-9967
Website: allspringglobal.com
Individual investors: 1-800-222-8222
Retail investment professionals: 1-888-877-9275
Institutional investment professionals: 1-800-260-5969
This report and the financial statements contained herein are submitted for the general information of the shareholders of the Fund. If this report is used for promotional purposes, distribution of the report must be accompanied or preceded by a current prospectus. Before investing, please consider the investment objectives, risks, charges, and expenses of the investment. For a current prospectus and, if available, a summary prospectus, containing this information, call
1-800-222-8222 or visit the Fund's website at allspringglobal.com. Read the prospectus carefully before you invest or send money.
Allspring Global InvestmentsTM is the trade name for the asset management firms of Allspring Global Investments Holdings, LLC, a holding company indirectly owned by certain private funds of GTCR LLC and Reverence Capital Partners, L.P. These firms include but are not limited to Allspring Global Investments, LLC, and Allspring Funds Management, LLC. Certain products managed by Allspring entities are distributed by Allspring Funds Distributor, LLC (a broker-dealer and Member FINRA/SIPC).
This material is for general informational and educational purposes only and is NOT intended to provide investment advice or a recommendation of any kind - including a recommendation for any specific investment, strategy, or plan.
© 2022 Allspring Global Investments Holdings, LLC. All rights reserved.
PAR-0522-00044 05-22
SA225/SAR225 03-22
Semi-Annual Report
March 31, 2022
Allspring
Diversified Income Builder Fund
The views expressed and any forward-looking statements are as of March 31, 2022, unless otherwise noted, and are those of the Fund's portfolio managers and/or Allspring Global Investments. Discussions of individual securities or the markets generally are not intended as individual recommendations. Future events or results may vary significantly from those expressed in any forward-looking statements. The views expressed are subject to change at any time in response to changing circumstances in the market. Allspring Global Investments disclaims any obligation to publicly update or revise any views expressed or forward-looking statements.
Allspring Diversified Income Builder Fund | 1
Letter to shareholders (unaudited)
Andrew Owen
President
Allspring Funds
Dear Shareholder:
We are pleased to offer you this semi-annual report for Allspring Diversified Income Builder Fund for the six-month period that ended March 31, 2022. Global stocks and bonds broadly declined during a challenging period. Despite progress on a global economic recovery from COVID-19, persistently high inflation, concerns regarding anticipated tightening of central bank monetary policy, and turmoil caused by the Russian invasion of Ukraine all led to a retreat from financial market gains made earlier in 2021. Among major indexes, the U.S. large-cap-dominated S&P 500 Index was an exception in escaping a half-year loss.
For the six-month period, U.S. stocks, based on the S&P 500 Index,1 gained 5.92%. International stocks, as measured by the MSCI ACWI ex USA Index (Net),2 returned -3.72%, while the MSCI EM Index (Net) (USD),3 trailed both developed market benchmarks with a return of -8.20%. The Bloomberg U.S. Aggregate Bond Index,4returned -5.92%, the Bloomberg Global Aggregate ex-USD Index (unhedged),5 returned -7.26%, the Bloomberg Municipal Bond Index6 returned -5.55%, and the ICE BofA U.S. High Yield Index,7 lost 3.89%.
Inflationary concerns and the Russian-Ukraine war caused markets to retreat.
Elevated inflation pressures and the ongoing global supply bottleneck continued in October, but strong corporate earnings provided a bright spot in the U.S., the eurozone, and many Asian countries. Government bond yields rose globally as central banks prepared to tighten monetary policy. Commodity prices continued to rise, driven by sharply higher energy costs.
In November, as COVID-19 hospitalizations rose, most major global asset classes declined. Two exceptions were U.S. investment-grade bonds and Treasury Inflation-Protected Securities. President Biden signed a long-awaited $550 billion infrastructure bill to upgrade U.S. roads, bridges, and railways. Meanwhile, the Consumer Price Index8, a measure of domestic inflation conditions, jumped to its highest level in 31 years. While the threat of consistently high inflation led the U.S. Federal Reserve (Fed) to discuss a faster pace of tapering, the Omicron strain created uncertainty. Commodities lost ground for the month, driven by sharp declines in oil prices (and energy costs in general) as well as precious metals.
“Elevated inflation pressures and the ongoing global supply bottleneck continued in October, but strong corporate earnings provided a bright spot in the U.S., the eurozone, and many Asian countries.”
| 1 | The S&P 500 Index consists of 500 stocks chosen for market size, liquidity, and industry group representation. It is a market-value-weighted index with each stock's weight in the index proportionate to its market value. You cannot invest directly in an index. |
| 2 | The Morgan Stanley Capital International (MSCI) All Country World Index (ACWI) ex USA Index (Net) is a free-float-adjusted market-capitalization-weighted index that is designed to measure the equity market performance of developed and emerging markets, excluding the U.S. Source: MSCI. MSCI makes no express or implied warranties or representations and shall have no liability whatsoever with respect to any MSCI data contained herein. The MSCI data may not be further redistributed or used as a basis for other indexes or any securities or financial products. This report is not approved, reviewed, or produced by MSCI. You cannot invest directly in an index. |
| 3 | The MSCI Emerging Markets (EM) Index (Net) (USD) is a free-float-adjusted market-capitalization-weighted index that is designed to measure equity market performance of emerging markets. You cannot invest directly in an index. |
| 4 | The Bloomberg U.S. Aggregate Bond Index is a broad-based benchmark that measures the investment-grade, U.S.-dollar-denominated, fixed-rate taxable bond market, including Treasuries, government-related and corporate securities, mortgage-backed securities (agency fixed-rate and hybrid adjustable-rate mortgage pass-throughs), asset-backed securities, and commercial mortgage-backed securities. You cannot invest directly in an index. |
| 5 | The Bloomberg Global Aggregate ex-USD Index (unhedged) is an unmanaged index that provides a broad-based measure of the global investment-grade fixed-income markets excluding the U.S.-dollar-denominated debt market. You cannot invest directly in an index. |
| 6 | The Bloomberg Municipal Bond Index is an unmanaged index composed of long-term tax-exempt bonds with a minimum credit rating of Baa. You cannot invest directly in an index. |
| 7 | The ICE BofA U.S. High Yield Index is a market-capitalization-weighted index of domestic and Yankee high-yield bonds. The index tracks the performance of high-yield securities traded in the U.S. bond market. You cannot invest directly in an index. Copyright 2022. ICE Data Indices, LLC. All rights reserved. |
| 8 | The Consumer Price Index (CPI) is a measure of the average change over time in the prices paid by urban consumers for a market basket of consumer goods and services. You cannot invest directly in an index. |
2 | Allspring Diversified Income Builder Fund
Letter to shareholders (unaudited)
Global volatility lessened in December as data indicated a lower risk of severe disease and death from the Omicron variant. Even so, several countries introduced restrictions on travel and hospitality, among other sectors, in an effort to reduce the spread. In the U.S., data indicated a stable economy overall, with robust corporate earnings. Consumer spending potential looked strong heading into 2022 on elevated household savings and the lowest household debt ratio since 1973. U.S. corporate and high-yield bonds had monthly gains while Treasuries declined. Bonds were strongly affected by the projection of three 25-basis-point (bp; 100 bps equal 1.00%) policy rate hikes in 2022 by senior Federal Open Market Committee members, up from previous projections of just one hike.
In January 2022, the main focus was on potential U.S. interest rate hikes and the Russia-Ukraine conflict. The Fed hinted that a March interest rate hike was likely. Meanwhile, Russia threatened a potential invasion of Ukraine, which could disrupt Russia’s massive energy supplies and drive demand from non-Russian oil-producing countries. Elsewhere overseas, Europe saw food and energy prices spike, leading to rising inflation. Within fixed income, corporate bonds struggled in January, underperforming government bonds, as investors focused on continued elevated inflation and ongoing uncertainty over the U.S. monetary path.
The Russian invasion of Ukraine dominated the financial world in February and March. Equity, bond, and commodities markets were shaken by fear, uncertainty, and an upending of demand-supply dynamics. Major global stock indexes were down in February, along with global bonds overall, with ongoing high levels of volatility in March along with mixed results that favored U.S. large-cap stocks. Prices of commodities spiked, including crude oil, natural gas, wheat, and precious metals, on elevated concerns of supply shortages. All of this fed already-high inflation concerns and added to expectations of more aggressive central bank interest rate hikes. Sweeping sanctions against Russia and corporate pullouts contributed to market volatility. Despite the geopolitical turmoil, the U.S. economic outlook remained largely unchanged, with a healthy job market and signs of economic resilience accompanying higher prices.
Don’t let short-term uncertainty derail long-term investment goals.
Periods of investment uncertainty can present challenges, but experience has taught us that maintaining long-term investment goals can be an effective way to plan for the future. To help you create a sound strategy based on your personal goals and risk tolerance, Allspring Funds offers more than 100 mutual funds spanning a wide range of asset classes and investment styles. Although diversification cannot guarantee an investment profit or prevent losses, we believe it can be an effective way to manage investment risk and potentially smooth out overall portfolio performance. We encourage investors to know their investments and to understand that appropriate levels of risk-taking may unlock opportunities.
Information on transaction closing.
On November 1, 2021, GTCR LLC and Reverence Capital Partners, L.P. announced the beginning of Allspring Global Investments™ with the close of the transaction to acquire Wells Fargo Funds Management, LLC; Wells Capital Management LLC; Galliard Capital Management LLC.; Wells Fargo Asset Management (International) Ltd.; Wells Fargo Asset Management Luxembourg S.A.; and Wells Fargo Funds Distributor, LLC, as well as Wells Fargo Bank, N.A.’s business of acting as trustee to its collective investment trusts and all related Wells Fargo Asset Management legal entities. The transaction closed on November 1, 2021, forming Allspring Global Investments, a privately held asset management firm with $451 billion in AUM1 as of March 31, 2022.
“ The Russian invasion of Ukraine dominated the financial world in February and March. Equity, bond, and commodities markets were shaken by fear, uncertainty, and an upending of demand-supply dynamics.”
| 1 | Figures are as of March 31, 2022, unless otherwise noted. Please note that the assets under management figures provided have been adjusted to eliminate any duplication of reporting among assets directed by multiple investment teams and includes $91.2B from Galliard Capital Management ($74.7B stable value; $16.5B fixed income), an investment advisor that is not part of the Allspring trade name/GIPS firm. |
Allspring Diversified Income Builder Fund | 3
Letter to shareholders (unaudited)
For further information about your Fund, contact your investment professional, visit our website at allspringglobal.com, or call us directly at 1-800-222-8222. |
Allspring Global Investments™ is a leading independent asset management firm with a full breadth of investment capabilities across diverse asset classes, serving the needs of its institutional and wealth management clients around the world. Allspring operates across 18 offices globally supported by more than 480 investment professionals. Allspring and its investment teams provide a broad range of differentiated investment products and solutions to help its diverse range of clients meet their investment objectives.
As part of this transition, all mutual funds within the Wells Fargo Funds family were rebranded as Allspring Funds. Each individual fund had “Wells Fargo” removed from its fund name and replaced with “Allspring.” The fund name changes went into effect on December 6, 2021.
Allspring Global Investments™ is the trade name for the asset management firm of Allspring Global Investments Holdings, LLC, a holding company indirectly owned by certain private funds of GTCR LLC and Reverence Capital Partners, L.P.
Thank you for choosing to invest with Allspring Funds. We appreciate your confidence in us and remain committed to helping you meet your financial needs.
Sincerely,
Andrew Owen
President
Allspring Funds
Notice to Shareholders
Russia launched a large-scale invasion of Ukraine on February 24, 2022. As a result of this military action, the United States and many other countries have instituted various economic sanctions against Russian and Belarus individuals and entities. The situation has led to increased financial market volatility and could have severe adverse effects on regional and global economic markets, including the markets for certain securities and commodities, such as oil and natural gas. The extent and duration of the military action, resulting sanctions imposed, other punitive action taken and the resulting market disruptions cannot be easily predicted.
Our solidarity and support goes out to our impacted employees and the people affected in Ukraine and their families. Allspring has a dedicated team of investment professionals actively monitoring the situation for any new developments and the potential impact to our clients and investment products. As the situation remains fluid, we are focused on the assessment of risks, valuation, and liquidity of impacted securities. Please visit our website at allspringglobal.com and click on “Russia-Ukraine Portfolio Impacts” for further information.
4 | Allspring Diversified Income Builder Fund
This page is intentionally left blank.
Performance highlights (unaudited)
| Investment objective | The Fund seeks long-term total return, consisting of current income and capital appreciation. |
| Manager | Allspring Funds Management, LLC |
| Subadviser | Allspring Global Investments, LLC |
| Portfolio managers | Kandarp R. Acharya, CFA®‡, Petros N. Bocray, CFA®‡, FRM# |
| Average annual total returns (%) as of March 31, 2022 |
| | | Including sales charge | | Excluding sales charge | | Expense ratios1 (%) |
| | Inception date | 1 year | 5 year | 10 year | | 1 year | 5 year | 10 year | | Gross | Net 2 |
| Class A (EKSAX) | 4-14-1987 | -6.16 | 3.09 | 5.44 | | -0.37 | 4.32 | 6.08 | | 1.09 | 0.86 |
| Class C (EKSCX) | 2-1-1993 | -2.12 | 3.53 | 5.30 | | -1.12 | 3.53 | 5.30 | | 1.84 | 1.61 |
| Class R6 (EKSRX)3 | 7-31-2018 | – | – | – | | -0.11 | 4.73 | 6.49 | | 0.66 | 0.43 |
| Administrator Class (EKSDX) | 7-30-2010 | – | – | – | | -0.46 | 4.40 | 6.22 | | 1.01 | 0.78 |
| Institutional Class (EKSYX) | 1-13-1997 | – | – | – | | -0.04 | 4.66 | 6.46 | | 0.76 | 0.53 |
| Diversified Income Builder Blended Index4 | – | – | – | – | | 1.05 | 6.87 | 7.66 | | – | – |
| Bloomberg U.S. Aggregate Bond Index5 | – | – | – | – | | -4.15 | 2.14 | 2.24 | | – | – |
| ICE BofA U.S. Cash Pay High Yield Index6 | – | – | – | – | | -0.28 | 4.55 | 5.68 | | – | – |
| MSCI ACWI Index (Net)7 | – | – | – | – | | 7.28 | 11.64 | 10.00 | | – | – |
Figures quoted represent past performance, which is no guarantee of future results, and do not reflect taxes that a shareholder may pay on an investment in a fund. Investment return and principal value of an investment will fluctuate so that an investor’s shares, when redeemed, may be worth more or less than their original cost. Performance shown without sales charges would be lower if sales charges were reflected. Current performance may be lower or higher than the performance data quoted, which assumes the reinvestment of dividends and capital gains. Current month-end performance is available on the Fund’s website, allspringglobal.com.
Index returns do not include transaction costs associated with buying and selling securities, any mutual fund fees or expenses, or any taxes. It is not possible to invest directly in an index.
For Class A shares, the maximum front-end sales charge is 5.75%. For Class C shares, the maximum contingent deferred sales charge is 1.00%. Performance including a contingent deferred sales charge assumes the sales charge for the corresponding time period. Class R6, Administrator Class and Institutional Class shares are sold without a front-end sales charge or contingent deferred sales charge.
| 1 | Reflects the expense ratios as stated in the most recent prospectuses, which include the impact of 0.01% in acquired fund fees and expenses. The expense ratios shown are subject to change and may differ from the annualized expense ratios shown in the financial highlights of this report, which do not include acquired fund fees and expenses. |
| 2 | The manager has contractually committed through January 31, 2023, to waive fees and/or reimburse expenses to the extent necessary to cap total annual fund operating expenses after fee waivers at 0.85% for Class A, 1.60% for Class C, 0.42% for Class R6, 0.77% for Administrator Class, and 0.52% for Institutional Class. Brokerage commissions, stamp duty fees, interest, taxes, acquired fund fees and expenses (if any), and extraordinary expenses are excluded from the expense caps. Prior to or after the commitment expiration date, the caps may be increased or the commitment to maintain the caps may be terminated only with the approval of the Board of Trustees. Without these caps, the Fund’s returns would have been lower. The expense ratio paid by an investor is the net expense ratio (the total annual fund operating expenses after fee waivers) as stated in the prospectuses. |
| 3 | Historical performance shown for the Class R6 shares prior to their inception reflects the performance of the Institutional Class shares, and includes the higher expenses applicable to the Institutional Class shares. If these expenses had not been included, returns for the Class R6 shares would be higher. |
| 4 | Source: Allspring Funds Management, LLC. The Diversified Income Builder Blended Index is composed 60% of the ICE BofA U.S. Cash Pay High Yield Index, 25% of the Morgan Stanley Capital International (MSCI) All Country World Index (ACWI) and 15% of the Bloomberg U.S. Aggregate Bond Index. Prior to February 1, 2020, the Diversified Income Builder Blended Index was composed 65% of the ICE BofA U.S. Cash Pay High Yield Index, and 35% of the Russell 1000® Index. Prior to January 2, 2018, the Diversified Income Builder Blended Index was composed 75% of the ICE BofA U.S. Cash Pay High Yield Index, and 25% the Russell 1000® Index. You cannot invest directly in an index. |
| 5 | The Bloomberg U.S. Aggregate Bond Index is a broad-based benchmark that measures the investment-grade, U.S. dollar–denominated, fixed-rate taxable bond market, including Treasuries, government-related and corporate securities, mortgage-backed securities (agency fixed-rate and hybrid adjustable-rate mortgage pass-throughs), asset-backed securities, and commercial mortgage-backed securities. You cannot invest directly in an index. |
| ‡ | CFA® and Chartered Financial Analyst® are trademarks owned by CFA Institute. |
| # | Mr. Bocray became portfolio manager of the Fund on December 13, 2021. |
6 | Allspring Diversified Income Builder Fund
Performance highlights (unaudited)
Footnotes continued from previous page
| 6 | The ICE BofA U.S. Cash Pay High Yield Index is an unmanaged market index that provides a broad-based performance measure of the non-investment grade U.S. domestic bond index. You cannot invest directly in an index. Copyright 2022. ICE Data Indices, LLC. All rights reserved. |
| 7 | The MSCI ACWI Index (Net) is a free-float-adjusted market-capitalization-weighted index that is designed to measure the equity market performance of developed and emerging markets. Source: MSCI. MSCI makes no express or implied warranties or representations and shall have no liability whatsoever with respect to any MSCI data contained herein. The MSCI data may not be further redistributed or used as a basis for other indices or any securities or financial products. This report is not approved, reviewed, or produced by MSCI. You cannot invest directly in an index. |
Balanced funds may invest in stocks and bonds. Stock values fluctuate in response to the activities of individual companies and general market and economic conditions. Bond values fluctuate in response to the financial condition of individual issuers, general market and economic conditions, and changes in interest rates. Changes in market conditions and government policies may lead to periods of heightened volatility in the bond market and reduced liquidity for certain bonds held by the Fund. In general, when interest rates rise, bond values fall and investors may lose principal value. Interest rate changes and their impact on the Fund and its share price can be sudden and unpredictable. Certain investment strategies tend to increase the total risk of an investment (relative to the broader market). This fund is exposed to foreign investment risk, high-yield securities risk, and smaller-company securities risk. Consult the Fund’s prospectus for additional information on these and other risks.
Allspring Diversified Income Builder Fund | 7
Performance highlights (unaudited)
| Ten largest holdings (%) as of March 31, 20221 |
| Microsoft Corporation | 1.73 |
| Amazon.com Incorporated | 1.33 |
| Alphabet Incorporated Class A | 1.26 |
| Apple Incorporated | 1.18 |
| Occidental Petroleum Corporation | 0.86 |
| Oxford Finance Funding Trust Series 2022-1A Class B | 0.75 |
| ING Groep NV | 0.67 |
| Flexential Issuer LLC Series 2021-1A Class C | 0.66 |
| Lloyds Banking Group plc | 0.66 |
| Societe Generale SA | 0.66 |
| 1 | Figures represent the percentage of the Fund's net assets. Holdings are subject to change and may have changed since the date specified. |
| Portfolio composition as of March 31, 20221 |
| 1 | Figures represent the percentage of the Fund's long-term investments. These amounts are subject to change and may have changed since the date specified. |
8 | Allspring Diversified Income Builder Fund
Fund expenses (unaudited)
As a shareholder of the Fund, you incur two types of costs: (1) transaction costs, including sales charges (loads) on purchase payments and contingent deferred sales charges (if any) on redemptions and (2) ongoing costs, including management fees, distribution (12b-1) and/or shareholder servicing fees, and other Fund expenses. This example is intended to help you understand your ongoing costs (in dollars) of investing in the Fund and to compare these costs with the ongoing costs of investing in other mutual funds.
The example is based on an investment of $1,000 invested at the beginning of the six-month period and held for the entire period from October 1, 2021 to March 31, 2022.
Actual expenses
The “Actual” line of the table below provides information about actual account values and actual expenses. You may use the information in this line, together with the amount you invested, to estimate the expenses that you paid over the period. Simply divide your account value by $1,000 (for example, an $8,600 account value divided by $1,000 = 8.6), then multiply the result by the number in the “Actual” line under the heading entitled “Expenses paid during period” for your applicable class of shares to estimate the expenses you paid on your account during this period.
Hypothetical example for comparison purposes
The “Hypothetical” line of the table below provides information about hypothetical account values and hypothetical expenses based on the Fund’s actual expense ratio and an assumed rate of return of 5% per year before expenses, which is not the Fund’s actual return. The hypothetical account values and expenses may not be used to estimate the actual ending account balance or expenses you paid for the period. You may use this information to compare the ongoing costs of investing in the Fund and other funds. To do so, compare this 5% hypothetical example with the 5% hypothetical examples that appear in the shareholder reports of the other funds.
Please note that the expenses shown in the table are meant to highlight your ongoing costs only and do not reflect any transactional costs, such as sales charges (loads) and contingent deferred sales charges. Therefore, the “Hypothetical” line of the table is useful in comparing ongoing costs only, and will not help you determine the relative total costs of owning different funds. In addition, if these transactional costs were included, your costs would have been higher.
| | Beginning
account value
10-1-2021 | Ending
account value
3-31-2022 | Expenses
paid during
the period1 | Annualized net
expense ratio |
| Class A | | | | |
| Actual | $1,000.00 | $ 965.58 | $4.17 | 0.85% |
| Hypothetical (5% return before expenses) | $1,000.00 | $1,020.69 | $4.28 | 0.85% |
| Class C | | | | |
| Actual | $1,000.00 | $ 962.01 | $7.83 | 1.60% |
| Hypothetical (5% return before expenses) | $1,000.00 | $1,016.95 | $8.05 | 1.60% |
| Class R6 | | | | |
| Actual | $1,000.00 | $ 966.79 | $2.06 | 0.42% |
| Hypothetical (5% return before expenses) | $1,000.00 | $1,022.84 | $2.12 | 0.42% |
| Administrator Class | | | | |
| Actual | $1,000.00 | $ 965.09 | $3.77 | 0.77% |
| Hypothetical (5% return before expenses) | $1,000.00 | $1,021.09 | $3.88 | 0.77% |
| Institutional Class | | | | |
| Actual | $1,000.00 | $ 966.34 | $2.55 | 0.52% |
| Hypothetical (5% return before expenses) | $1,000.00 | $1,022.34 | $2.62 | 0.52% |
1 Expenses paid is equal to the annualized net expense ratio of each class multiplied by the average account value over the period, multiplied by 182 divided by 365 (to reflect the one-half-year period).
Allspring Diversified Income Builder Fund | 9
Portfolio of investments—March 31, 2022 (unaudited)
| | | Interest
rate | Maturity
date | Principal | Value |
| Asset-backed securities: 3.89% | | | | | | |
| ABPCI Direct Lending Fund Series 2022-2A Class C 144A♦‡ | | 8.24% | 3-1-2032 | $ | 3,000,000 | $ 3,000,000 |
| Aqua Finance Trust Series 2019-A Class A 144A | | 3.14 | 7-16-2040 | | 173,040 | 171,138 |
| Avis Budget Rental Car Funding Series 2019-2A Class C 144A | | 4.24 | 9-22-2025 | | 2,000,000 | 2,013,979 |
| BREX Incorporated Series 2022-1 Class A 144A | | 4.63 | 7-15-2025 | | 1,000,000 | 998,481 |
| Cologix Data Centers Issuer Series 2021-1A Class C 144A | | 5.99 | 12-26-2051 | | 2,400,000 | 2,252,787 |
| Driven Brands Funding LLC Series 2019-2A Class A2 144A | | 3.98 | 10-20-2049 | | 782,000 | 754,065 |
| Dryden Senior Loan Fund Series 2019-80A Class DR (U.S. SOFR 3 Month +3.10%) 144A± | | 3.35 | 1-17-2033 | | 3,000,000 | 2,931,111 |
| Mosaic Solar Loans LLC Series 2019-2A Class A 144A | | 2.88 | 9-20-2040 | | 133,877 | 129,819 |
| NMEF Funding LLC Series 2022-A Class D 144A | | 6.75 | 10-16-2028 | | 3,000,000 | 2,930,736 |
| Service Experts Issuer Series 2021-1A Class C 144A | | 5.37 | 2-2-2032 | | 3,000,000 | 2,810,613 |
| SoFi Consumer Loan Program Trust Series 2019-2 Class C 144A | | 3.46 | 4-25-2028 | | 1,347,228 | 1,352,736 |
| Sound Point CLO Limited Series 2022-1A Class D (U.S. SOFR 3 Month +3.30%) 144A± | | 3.58 | 4-25-2035 | | 1,750,000 | 1,726,970 |
| VB-S1 Issuer LLC Series 2022-1A Class F 144A | | 5.27 | 2-15-2052 | | 1,500,000 | 1,462,073 |
| Total Asset-backed securities (Cost $23,042,054) | | | | | | 22,534,508 |
| | | | | Shares | |
| Common stocks: 30.10% | | | | | | |
| Communication services: 3.52% | | | | | | |
| Diversified telecommunication services: 0.38% | | | | | | |
| Indus Towers Limited † | | | | | 50,167 | 146,242 |
| Orange SA | | | | | 84,526 | 1,000,898 |
| PT Telekomunikasi Indonesia Persero Tbk | | | | | 3,025,181 | 962,465 |
| Saudi Telecom Company | | | | | 2,364 | 67,642 |
| | | | | | | 2,177,247 |
| Entertainment: 0.20% | | | | | | |
| Live Nation Entertainment Incorporated †# | | | | | 516 | 60,702 |
| Vivendi SE | | | | | 76,538 | 999,931 |
| Warner Music Group Corporation Class A # | | | | | 3,161 | 119,644 |
| | | | | | | 1,180,277 |
| Interactive media & services: 1.73% | | | | | | |
| Alphabet Incorporated Class A † | | | | | 2,636 | 7,331,639 |
| Alphabet Incorporated Class C †# | | | | | 160 | 446,878 |
| Baidu Incorporated Class A † | | | | | 10,208 | 180,158 |
| CarGurus Incorporated †# | | | | | 720 | 30,571 |
| Meta Platforms Incorporated Class A † | | | | | 4,990 | 1,109,576 |
| ZoomInfo Technologies Incorporated †# | | | | | 15,697 | 937,739 |
| | | | | | | 10,036,561 |
| Media: 0.19% | | | | | | |
| Omnicom Group Incorporated # | | | | | 13,232 | 1,123,132 |
| Wireless telecommunication services: 1.02% | | | | | | |
| America Movil SAB de CV ADR | | | | | 4,417 | 93,420 |
The accompanying notes are an integral part of these financial statements.
10 | Allspring Diversified Income Builder Fund
Portfolio of investments—March 31, 2022 (unaudited)
| | | | | Shares | Value |
| Wireless telecommunication services (continued) | | | | | | |
| SK Telecom Company Limited | | | | | 26,058 | $ 1,218,426 |
| SoftBank Corporation | | | | | 125,700 | 1,466,052 |
| Vodacom Group Limited | | | | | 138,724 | 1,518,963 |
| Vodafone Group plc | | | | | 976,561 | 1,601,349 |
| | | | | | | 5,898,210 |
| Consumer discretionary: 3.85% | | | | | | |
| Automobiles: 0.79% | | | | | | |
| Bayerische Motoren Werke AG | | | | | 13,140 | 1,135,526 |
| General Motors Company †# | | | | | 24,581 | 1,075,173 |
| Guangzhou Automobile Group Company Limited Class H | | | | | 94,000 | 77,510 |
| Hero Motorcorp Limited | | | | | 3,550 | 106,773 |
| Kia Corporation | | | | | 1,826 | 110,597 |
| Tesla Motors Incorporated †# | | | | | 844 | 909,494 |
| Toyota Motor Corporation | | | | | 64,100 | 1,156,236 |
| | | | | | | 4,571,309 |
| Hotels, restaurants & leisure: 0.42% | | | | | | |
| Airbnb Incorporated Class A † | | | | | 1,720 | 295,427 |
| Chipotle Mexican Grill Incorporated †# | | | | | 302 | 477,773 |
| Genting Malaysia Bhd | | | | | 196,000 | 138,320 |
| Kangwon Land Incorporated † | | | | | 4,443 | 101,336 |
| Papa John's International Incorporated # | | | | | 8,376 | 881,825 |
| Planet Fitness Incorporated Class A †# | | | | | 4,604 | 388,946 |
| Starbucks Corporation | | | | | 1,612 | 146,644 |
| | | | | | | 2,430,271 |
| Household durables: 0.18% | | | | | | |
| Barratt Developments plc | | | | | 128,289 | 873,366 |
| Midea Group Company Limited Class A | | | | | 21,299 | 189,971 |
| | | | | | | 1,063,337 |
| Internet & direct marketing retail: 1.40% | | | | | | |
| Alibaba Group Holding Limited † | | | | | 23,000 | 313,874 |
| Amazon.com Incorporated † | | | | | 2,359 | 7,690,222 |
| CarParts.com Incorporated †# | | | | | 7,757 | 51,972 |
| Fiverr International Limited † | | | | | 598 | 45,490 |
| | | | | | | 8,101,558 |
| Multiline retail: 0.19% | | | | | | |
| Target Corporation # | | | | | 5,304 | 1,125,615 |
| Specialty retail: 0.83% | | | | | | |
| China Yongda Automobile Service Holding Company | | | | | 87,000 | 93,992 |
| Chow Tai Fook Jewellery Company Limited | | | | | 46,400 | 83,804 |
| Five Below Incorporated †# | | | | | 4,498 | 712,348 |
| Floor & Decor Holdings Incorporated Class A †# | | | | | 9,774 | 791,694 |
| Jarir Marketing Company | | | | | 1,341 | 70,264 |
| Leslie's Incorporated †# | | | | | 35,845 | 693,959 |
| Mr Price Group Limited | | | | | 4,632 | 68,391 |
| Petco Health & Wellness Company †# | | | | | 62,922 | 1,231,384 |
| Topsports International Holdings Limited 144A | | | | | 115,000 | 95,581 |
The accompanying notes are an integral part of these financial statements.
Allspring Diversified Income Builder Fund | 11
Portfolio of investments—March 31, 2022 (unaudited)
| | | | | Shares | Value |
| Specialty retail (continued) | | | | | | |
| Ulta Beauty Incorporated †# | | | | | 703 | $ 279,949 |
| Williams-Sonoma Incorporated # | | | | | 4,826 | 699,770 |
| | | | | | | 4,821,136 |
| Textiles, apparel & luxury goods: 0.04% | | | | | | |
| lululemon athletica Incorporated †# | | | | | 614 | 224,251 |
| Consumer staples: 0.72% | | | | | | |
| Beverages: 0.02% | | | | | | |
| Ambev SA | | | | | 29,200 | 94,450 |
| Food & staples retailing: 0.45% | | | | | | |
| Costco Wholesale Corporation # | | | | | 2,645 | 1,523,123 |
| Magnit PJSC ♦ | | | | | 1,041 | 0 |
| Tesco plc | | | | | 256,093 | 927,134 |
| Walmart de Mexico SAB de CV | | | | | 38,300 | 156,955 |
| | | | | | | 2,607,212 |
| Food products: 0.05% | | | | | | |
| Inner Mongolia Yili Industrial Group Company Limited Class A | | | | | 20,700 | 119,908 |
| Minerva SA | | | | | 28,524 | 75,848 |
| Tingyi Holding Corporation | | | | | 66,000 | 110,672 |
| | | | | | | 306,428 |
| Personal products: 0.20% | | | | | | |
| L'Oréal SA | | | | | 2,623 | 1,047,744 |
| The Estee Lauder Companies Incorporated Class A # | | | | | 424 | 115,464 |
| | | | | | | 1,163,208 |
| Energy: 1.04% | | | | | | |
| Energy equipment & services: 0.01% | | | | | | |
| China Oilfield Services Limited H Shares | | | | | 74,800 | 75,999 |
| Oil, gas & consumable fuels: 1.03% | | | | | | |
| ConocoPhillips | | | | | 21,005 | 2,100,500 |
| Devon Energy Corporation # | | | | | 24,324 | 1,438,278 |
| Oil & Natural Gas Corporation Limited | | | | | 60,053 | 129,141 |
| Shell plc | | | | | 46,412 | 1,272,092 |
| Total SA | | | | | 19,956 | 1,009,764 |
| | | | | | | 5,949,775 |
| Financials: 4.26% | | | | | | |
| Banks: 1.56% | | | | | | |
| Absa Group Limited | | | | | 10,170 | 131,868 |
| Alinma Bank | | | | | 15,720 | 162,108 |
| Banco Santander Chile SA | | | | | 2,129,197 | 119,909 |
| Bangkok Bank PCL | | | | | 34,000 | 139,303 |
| Bank of Baroda † | | | | | 55,400 | 80,818 |
| Bank of the Philippine Islands | | | | | 33,620 | 64,713 |
| BNP Paribas SA | | | | | 14,584 | 833,397 |
| China Construction Bank Class H | | | | | 305,000 | 228,465 |
| China Merchants Bank Company Limited Class H | | | | | 8,500 | 66,168 |
| CTBC Financial Holding Company Limited | | | | | 210,000 | 214,012 |
The accompanying notes are an integral part of these financial statements.
12 | Allspring Diversified Income Builder Fund
Portfolio of investments—March 31, 2022 (unaudited)
| | | | | Shares | Value |
| Banks (continued) | | | | | | |
| DBS Group Holdings Limited | | | | | 46,200 | $ 1,210,542 |
| Grupo Financiero Banorte SAB de CV | | | | | 11,000 | 82,857 |
| Hana Financial Group Incorporated | | | | | 3,671 | 146,007 |
| KB Financial Group Incorporated | | | | | 30,235 | 1,515,193 |
| KeyCorp # | | | | | 68,660 | 1,536,611 |
| National Commercial Bank | | | | | 9,038 | 170,059 |
| Postal Savings Bank of China Company Limited Class H 144A | | | | | 2,055,000 | 1,654,782 |
| PT Bank Negara Indonesia Persero Tbk | | | | | 153,750 | 87,844 |
| PT Bank Rakyat Indonesia Tbk | | | | | 271,980 | 87,845 |
| Qatar National Bank | | | | | 30,020 | 189,715 |
| RHB Bank Bhd | | | | | 65,300 | 92,561 |
| Standard Bank Group Limited | | | | | 11,366 | 141,210 |
| Tisco Financial Group PCL | | | | | 32,300 | 97,371 |
| | | | | | | 9,053,358 |
| Capital markets: 1.88% | | | | | | |
| Ares Capital Corporation | | | | | 79,196 | 1,659,156 |
| Banco BTG Pactual SA | | | | | 16,804 | 91,907 |
| BlackRock Incorporated | | | | | 1,548 | 1,182,935 |
| China International Capital Corporation Limited Class H 144A | | | | | 48,400 | 106,999 |
| Huatai Securities Company Limited H Shares 144A | | | | | 42,600 | 65,191 |
| ICICI Securities Limited 144A | | | | | 11,818 | 96,521 |
| IGM Financial Incorporated | | | | | 27,306 | 964,769 |
| Intercontinental Exchange Incorporated | | | | | 12,996 | 1,717,032 |
| LPL Financial Holdings Incorporated # | | | | | 3,508 | 640,841 |
| MarketAxess Holdings Incorporated # | | | | | 3,613 | 1,229,143 |
| Oaktree Specialty Lending Company # | | | | | 165,198 | 1,217,509 |
| The Charles Schwab Corporation | | | | | 4,803 | 404,941 |
| Tradeweb Markets Incorporated Class A # | | | | | 17,084 | 1,501,171 |
| | | | | | | 10,878,115 |
| Diversified financial services: 0.32% | | | | | | |
| LIC Housing Finance Limited | | | | | 22,898 | 107,652 |
| ORIX Corporation | | | | | 89,100 | 1,775,990 |
| | | | | | | 1,883,642 |
| Insurance: 0.50% | | | | | | |
| BB Seguridade Participacoes SA | | | | | 262,832 | 1,411,030 |
| Ping An Insurance Group Company Class H | | | | | 11,200 | 78,300 |
| Zurich Insurance Group AG | | | | | 2,854 | 1,409,590 |
| | | | | | | 2,898,920 |
| Health care: 3.33% | | | | | | |
| Biotechnology: 0.65% | | | | | | |
| AbbVie Incorporated | | | | | 13,550 | 2,196,565 |
| Biohaven Pharmaceutical Holding Company † | | | | | 7,277 | 862,834 |
| Horizon Therapeutics plc † | | | | | 3,829 | 402,849 |
| Seagen Incorporated †# | | | | | 1,190 | 171,420 |
| Zhejiang NHU Company Limited | | | | | 33,040 | 164,260 |
| | | | | | | 3,797,928 |
The accompanying notes are an integral part of these financial statements.
Allspring Diversified Income Builder Fund | 13
Portfolio of investments—March 31, 2022 (unaudited)
| | | | | Shares | Value |
| Health care equipment & supplies: 0.59% | | | | | | |
| Boston Scientific Corporation †# | | | | | 15,330 | $ 678,966 |
| Edwards Lifesciences Corporation †# | | | | | 8,674 | 1,021,103 |
| Figs Incorporated Class A †# | | | | | 23,865 | 513,575 |
| Insulet Corporation †# | | | | | 1,693 | 450,998 |
| Outset Medical Incorporated †# | | | | | 16,803 | 762,856 |
| | | | | | | 3,427,498 |
| Health care providers & services: 0.98% | | | | | | |
| CVS Health Corporation | | | | | 18,423 | 1,864,592 |
| HCA Healthcare Incorporated # | | | | | 7,022 | 1,759,854 |
| UnitedHealth Group Incorporated # | | | | | 4,035 | 2,057,729 |
| | | | | | | 5,682,175 |
| Health care technology: 0.06% | | | | | | |
| Veeva Systems Incorporated Class A †# | | | | | 1,511 | 321,027 |
| Life sciences tools & services: 0.21% | | | | | | |
| Bio-Techne Corporation | | | | | 1,074 | 465,085 |
| Codexis Incorporated †# | | | | | 4,177 | 86,130 |
| Repligen Corporation †# | | | | | 3,478 | 654,177 |
| | | | | | | 1,205,392 |
| Pharmaceuticals: 0.84% | | | | | | |
| Bristol-Myers Squibb Company | | | | | 23,561 | 1,720,660 |
| Catalent Incorporated †# | | | | | 5,883 | 652,425 |
| China Medical System Holding Limited | | | | | 591,000 | 921,721 |
| GlaxoSmithKline plc | | | | | 61,896 | 1,339,240 |
| Zoetis Incorporated | | | | | 1,286 | 242,527 |
| | | | | | | 4,876,573 |
| Industrials: 2.13% | | | | | | |
| Airlines: 0.02% | | | | | | |
| Copa Holdings SA Class A † | | | | | 1,361 | 113,834 |
| Building products: 0.06% | | | | | | |
| Johnson Controls International plc # | | | | | 4,396 | 288,246 |
| The AZEK Company Incorporated † | | | | | 2,908 | 72,235 |
| | | | | | | 360,481 |
| Commercial services & supplies: 0.25% | | | | | | |
| ACV Auctions Incorporated Class A † | | | | | 4,416 | 65,401 |
| Casella Waste Systems Incorporated Class A † | | | | | 4,457 | 390,656 |
| Copart Incorporated †# | | | | | 7,749 | 972,267 |
| | | | | | | 1,428,324 |
| Construction & engineering: 0.03% | | | | | | |
| China State Construction International Holdings | | | | | 132,500 | 175,705 |
| Electrical equipment: 0.41% | | | | | | |
| Generac Holdings Incorporated †# | | | | | 2,113 | 628,110 |
| Nari Technology Company Limited | | | | | 15,240 | 75,100 |
| Regal Rexnord Corporation # | | | | | 1,835 | 273,011 |
The accompanying notes are an integral part of these financial statements.
14 | Allspring Diversified Income Builder Fund
Portfolio of investments—March 31, 2022 (unaudited)
| | | | | Shares | Value |
| Electrical equipment (continued) | | | | | | |
| Rockwell Automation Incorporated # | | | | | 474 | $ 132,734 |
| Schneider Electric SE | | | | | 7,437 | 1,248,600 |
| | | | | | | 2,357,555 |
| Industrial conglomerates: 0.28% | | | | | | |
| Siemens AG | | | | | 10,443 | 1,446,014 |
| The Bidvest Group Limited | | | | | 10,411 | 159,380 |
| | | | | | | 1,605,394 |
| Machinery: 0.49% | | | | | | |
| Crane Company | | | | | 11,175 | 1,210,029 |
| Doosan Bobcat Incorporated | | | | | 2,960 | 94,069 |
| Hillenbrand Incorporated # | | | | | 32,771 | 1,447,495 |
| Zoomlion Heavy Industry Science and Technology Company Limited Class H | | | | | 122,200 | 77,150 |
| | | | | | | 2,828,743 |
| Marine: 0.20% | | | | | | |
| Evergreen Marine Corporation (Taiwan) Limited | | | | | 16,000 | 74,371 |
| SITC International Holdings Incorporated | | | | | 315,000 | 1,101,462 |
| | | | | | | 1,175,833 |
| Road & rail: 0.06% | | | | | | |
| J.B. Hunt Transport Services Incorporated # | | | | | 738 | 148,183 |
| Norfolk Southern Corporation | | | | | 242 | 69,023 |
| Union Pacific Corporation # | | | | | 561 | 153,271 |
| | | | | | | 370,477 |
| Trading companies & distributors: 0.30% | | | | | | |
| BOC Aviation Limited 144A | | | | | 11,900 | 93,476 |
| Ferguson plc | | | | | 6,221 | 842,820 |
| Russell Metals Incorporated | | | | | 30,346 | 803,951 |
| | | | | | | 1,740,247 |
| Transportation infrastructure: 0.03% | | | | | | |
| China Merchants Port Holdings Company Limited | | | | | 74,000 | 133,273 |
| International Container Terminal Services Incorporated | | | | | 15,690 | 67,970 |
| | | | | | | 201,243 |
| Information technology: 9.53% | | | | | | |
| Communications equipment: 0.17% | | | | | | |
| Cisco Systems Incorporated # | | | | | 17,531 | 977,529 |
| Electronic equipment, instruments & components: 0.44% | | | | | | |
| Delta Electronics Incorporated | | | | | 7,000 | 64,902 |
| Hon Hai Precision Industry Company Limited | | | | | 42,900 | 157,521 |
| Keysight Technologies Incorporated †# | | | | | 6,969 | 1,100,893 |
| TE Connectivity Limited # | | | | | 8,760 | 1,147,385 |
| Universal Scientific Industrial Shanghai Company Limited Class A | | | | | 26,100 | 49,573 |
| Zebra Technologies Corporation Class A †# | | | | | 147 | 60,814 |
| | | | | | | 2,581,088 |
The accompanying notes are an integral part of these financial statements.
Allspring Diversified Income Builder Fund | 15
Portfolio of investments—March 31, 2022 (unaudited)
| | | | | Shares | Value |
| IT services: 1.50% | | | | | | |
| Accenture plc Class A # | | | | | 4,698 | $ 1,584,307 |
| DigitalOcean Holdings Incorporated †# | | | | | 4,074 | 235,681 |
| Flywire Corporation †# | | | | | 4,118 | 125,928 |
| Infosys Limited ADR | | | | | 10,447 | 260,026 |
| International Business Machines Corporation # | | | | | 9,790 | 1,272,896 |
| MasterCard Incorporated Class A # | | | | | 4,637 | 1,657,171 |
| MongoDB Incorporated †# | | | | | 1,439 | 638,326 |
| Tech Mahindra Limited | | | | | 8,315 | 163,597 |
| Thoughtworks Holding Incorporated †# | | | | | 13,145 | 273,547 |
| Twilio Incorporated Class A † | | | | | 1,184 | 195,135 |
| Visa Incorporated Class A # | | | | | 10,324 | 2,289,553 |
| | | | | | | 8,696,167 |
| Semiconductors & semiconductor equipment: 2.25% | | | | | | |
| Advanced Micro Devices Incorporated †# | | | | | 1,322 | 144,547 |
| Allegro MicroSystems Incorporated †# | | | | | 27,592 | 783,613 |
| Broadcom Incorporated # | | | | | 2,496 | 1,571,681 |
| Enphase Energy Incorporated †# | | | | | 1,210 | 244,154 |
| KLA Corporation # | | | | | 3,936 | 1,440,812 |
| Mediatek Incorporated | | | | | 2,600 | 80,913 |
| Microchip Technology Incorporated | | | | | 16,781 | 1,260,924 |
| Monolithic Power Systems Incorporated # | | | | | 4,227 | 2,052,969 |
| NVIDIA Corporation | | | | | 6,283 | 1,714,379 |
| Qualcomm Incorporated # | | | | | 11,151 | 1,704,096 |
| Taiwan Semiconductor Manufacturing Company Limited | | | | | 51,800 | 1,062,600 |
| Taiwan Semiconductor Manufacturing Company Limited ADR # | | | | | 8,813 | 918,843 |
| United Microelectronics Corporation | | | | | 32,000 | 58,766 |
| | | | | | | 13,038,297 |
| Software: 3.07% | | | | | | |
| Avalara Incorporated †# | | | | | 9,209 | 916,388 |
| Crowdstrike Holdings Incorporated Class A †# | | | | | 1,448 | 328,812 |
| Dynatrace Incorporated †# | | | | | 29,046 | 1,368,067 |
| Freshworks Incorporated Class A † | | | | | 2,253 | 40,374 |
| Jamf Holding Corporation †# | | | | | 14,939 | 520,027 |
| Microsoft Corporation | | | | | 32,587 | 10,046,898 |
| Nutanix Incorporated Class A †# | | | | | 9,456 | 253,610 |
| Olo Incorporated Class A †# | | | | | 21,731 | 287,936 |
| Paycor HCM Incorporated †# | | | | | 14,920 | 434,321 |
| Procore Technologies Incorporated †# | | | | | 4,125 | 239,085 |
| Rapid7 Incorporated †# | | | | | 13,756 | 1,530,217 |
| Salesforce.com Incorporated †# | | | | | 815 | 173,041 |
| ServiceNow Incorporated †# | | | | | 912 | 507,884 |
| The Trade Desk Incorporated †# | | | | | 1,456 | 100,828 |
| Unity Software Incorporated †# | | | | | 4,970 | 493,074 |
| Workiva Incorporated †# | | | | | 3,259 | 384,562 |
| Zendesk Incorporated † | | | | | 1,341 | 161,309 |
| | | | | | | 17,786,433 |
| Technology hardware, storage & peripherals: 2.10% | | | | | | |
| Advantech Company Limited | | | | | 9,300 | 119,167 |
| Apple Incorporated | | | | | 39,142 | 6,834,585 |
| HP Incorporated # | | | | | 26,034 | 945,034 |
The accompanying notes are an integral part of these financial statements.
16 | Allspring Diversified Income Builder Fund
Portfolio of investments—March 31, 2022 (unaudited)
| | | | | Shares | Value |
| Technology hardware, storage & peripherals (continued) | | | | | | |
| Lenovo Group Limited | | | | | 1,020,000 | $ 1,104,921 |
| Logitech International SA | | | | | 17,031 | 1,265,951 |
| Quanta Computer Incorporated | | | | | 21,000 | 64,311 |
| Samsung Electronics Company Limited | | | | | 6,916 | 395,754 |
| Samsung Electronics Company Limited GDR 144A | | | | | 1,027 | 1,447,590 |
| | | | | | | 12,177,313 |
| Materials: 0.68% | | | | | | |
| Chemicals: 0.25% | | | | | | |
| Linde plc # | | | | | 3,550 | 1,133,977 |
| Lomon Billions Group Company Limited | | | | | 16,500 | 59,812 |
| Sociedad Quimica Minera de Chile | | | | | 1,851 | 158,446 |
| Xinyangfeng Agricultural Technology Company Limited | | | | | 27,400 | 73,891 |
| | | | | | | 1,426,126 |
| Metals & mining: 0.23% | | | | | | |
| Alrosa PJSC ♦ | | | | | 42,660 | 0 |
| Baoshan Iron & Steel Company Limited Class A | | | | | 102,900 | 109,178 |
| Companhia Brasileira de Aluminio † | | | | | 19,200 | 80,856 |
| Fortescue Metals Group Limited | | | | | 53,503 | 822,439 |
| Gold Fields Limited ADR | | | | | 4,155 | 64,236 |
| Southern Copper Corporation | | | | | 1,686 | 127,967 |
| Vale SA | | | | | 7,600 | 152,605 |
| | | | | | | 1,357,281 |
| Paper & forest products: 0.20% | | | | | | |
| Louisiana-Pacific Corporation # | | | | | 17,585 | 1,092,380 |
| Nine Dragons Paper Holdings Limited | | | | | 60,000 | 52,101 |
| | | | | | | 1,144,481 |
| Real estate: 0.52% | | | | | | |
| Equity REITs: 0.47% | | | | | | |
| Easterly Government Properties Incorporated | | | | | 50,861 | 1,075,202 |
| Embassy Office Parks REIT | | | | | 24,990 | 122,290 |
| Simon Property Group Incorporated # | | | | | 11,646 | 1,532,148 |
| | | | | | | 2,729,640 |
| Real estate management & development: 0.05% | | | | | | |
| China Resources Land Limited | | | | | 42,350 | 196,087 |
| Supalai PCL | | | | | 105,100 | 68,479 |
| | | | | | | 264,566 |
| Utilities: 0.52% | | | | | | |
| Electric utilities: 0.44% | | | | | | |
| Beijing Jingneng Power Company Class H | | | | | 280,000 | 63,181 |
| EDP Energias do Brasil SA | | | | | 232,734 | 1,149,726 |
| Power Grid Corporation of India Limited | | | | | 80,730 | 230,156 |
| SSE plc | | | | | 49,108 | 1,122,070 |
| | | | | | | 2,565,133 |
| Gas utilities: 0.05% | | | | | | |
| ENN Energy Holdings Limited | | | | | 6,300 | 94,096 |
The accompanying notes are an integral part of these financial statements.
Allspring Diversified Income Builder Fund | 17
Portfolio of investments—March 31, 2022 (unaudited)
| | | | | Shares | Value |
| Gas utilities (continued) | | | | | | |
| Gail India Limited | | | | | 76,088 | $ 155,604 |
| Kunlun Energy Company Limited | | | | | 78,000 | 67,410 |
| | | | | | | 317,110 |
Independent power & renewable electricity
producers: 0.03% | | | | | | |
| China Yangtze Power Company Limited Class A | | | | | 44,500 | 153,844 |
| Total Common stocks (Cost $159,564,526) | | | | | | 174,547,448 |
| | | Interest
rate | Maturity
date | Principal | |
| Corporate bonds and notes: 37.59% | | | | | | |
| Communication services: 6.74% | | | | | | |
| Diversified telecommunication services: 0.31% | | | | | | |
| Cablevision Lightpath LLC 144A | | 5.63% | 9-15-2028 | $ | 350,000 | 319,375 |
| Level 3 Financing Incorporated 144A | | 3.63 | 1-15-2029 | | 400,000 | 350,000 |
| Zayo Group Holdings Incorporated 144A | | 6.13 | 3-1-2028 | | 1,275,000 | 1,141,125 |
| | | | | | | 1,810,500 |
| Entertainment: 0.81% | | | | | | |
| CEC Entertainment LLC 144A | | 6.75 | 5-1-2026 | | 685,000 | 662,316 |
| Live Nation Entertainment Incorporated 144A | | 3.75 | 1-15-2028 | | 1,210,000 | 1,137,255 |
| Live Nation Entertainment Incorporated 144A | | 5.63 | 3-15-2026 | | 745,000 | 758,969 |
| Live Nation Entertainment Incorporated 144A | | 6.50 | 5-15-2027 | | 750,000 | 798,765 |
| Seaworld Parks & Entertainment 144A | | 5.25 | 8-15-2029 | | 1,390,000 | 1,325,699 |
| | | | | | | 4,683,004 |
| Interactive media & services: 0.29% | | | | | | |
| Rackspace Technology Company 144A | | 5.38 | 12-1-2028 | | 1,940,000 | 1,683,241 |
| Media: 5.09% | | | | | | |
| CCO Holdings LLC 144A | | 4.25 | 1-15-2034 | | 405,000 | 351,740 |
| CCO Holdings LLC 144A | | 4.50 | 8-15-2030 | | 1,850,000 | 1,735,841 |
| CCO Holdings LLC 144A | | 5.13 | 5-1-2027 | | 2,335,000 | 2,338,444 |
| Cinemark USA Incorporated 144A | | 5.25 | 7-15-2028 | | 1,080,000 | 1,008,590 |
| Cinemark USA Incorporated 144A | | 5.88 | 3-15-2026 | | 200,000 | 194,000 |
| Cinemark USA Incorporated 144A | | 8.75 | 5-1-2025 | | 575,000 | 601,594 |
| Clear Channel Outdoor Holdings 144A | | 5.13 | 8-15-2027 | | 730,000 | 722,109 |
| Clear Channel Outdoor Holdings 144A | | 7.75 | 4-15-2028 | | 845,000 | 849,419 |
| Covert Mergeco Incorporated 144A | | 4.88 | 12-1-2029 | | 930,000 | 887,871 |
| CSC Holdings LLC 144A | | 4.13 | 12-1-2030 | | 375,000 | 328,824 |
| CSC Holdings LLC 144A | | 6.50 | 2-1-2029 | | 765,000 | 771,074 |
| CSC Holdings LLC 144A | | 7.50 | 4-1-2028 | | 1,515,000 | 1,488,488 |
| DIRECTV Holdings LLC 144A | | 5.75 | 12-1-2028 | | 1,885,000 | 1,783,681 |
| DIRECTV Holdings LLC 144A | | 5.88 | 8-15-2027 | | 860,000 | 846,025 |
| DISH DBS Corporation | | 5.13 | 6-1-2029 | | 485,000 | 413,021 |
| DISH DBS Corporation | | 7.75 | 7-1-2026 | | 405,000 | 402,368 |
| Gray Escrow II Incorporated 144A | | 5.38 | 11-15-2031 | | 3,450,000 | 3,298,942 |
| Lamar Media Corporation | | 4.00 | 2-15-2030 | | 460,000 | 437,575 |
| Match Group Holdings II LLC 144A | | 5.63 | 2-15-2029 | | 1,170,000 | 1,162,407 |
| Nexstar Broadcasting Incorporated 144A | | 4.75 | 11-1-2028 | | 200,000 | 193,750 |
| Nexstar Broadcasting Incorporated 144A | | 5.63 | 7-15-2027 | | 650,000 | 657,930 |
| Outfront Media Capital Corporation 144A | | 4.63 | 3-15-2030 | | 925,000 | 870,656 |
The accompanying notes are an integral part of these financial statements.
18 | Allspring Diversified Income Builder Fund
Portfolio of investments—March 31, 2022 (unaudited)
| | | Interest
rate | Maturity
date | Principal | Value |
| Media (continued) | | | | | | |
| Outfront Media Capital Corporation 144A | | 5.00% | 8-15-2027 | $ | 950,000 | $ 928,701 |
| QVC Incorporated | | 4.38 | 9-1-2028 | | 1,195,000 | 1,090,286 |
| QVC Incorporated | | 4.75 | 2-15-2027 | | 2,425,000 | 2,321,938 |
| QVC Incorporated | | 5.95 | 3-15-2043 | | 500,000 | 420,465 |
| Salem Media Group Incorporated 144A | | 6.75 | 6-1-2024 | | 455,000 | 448,175 |
| Scripps Escrow II Incorporated 144A« | | 5.38 | 1-15-2031 | | 760,000 | 727,700 |
| Scripps Escrow II Incorporated 144A | | 5.88 | 7-15-2027 | | 925,000 | 925,703 |
| Townsquare Media Incorporated 144A | | 6.88 | 2-1-2026 | | 1,275,000 | 1,313,059 |
| | | | | | | 29,520,376 |
| Wireless telecommunication services: 0.24% | | | | | | |
| Sprint Capital Corporation | | 8.75 | 3-15-2032 | | 525,000 | 707,175 |
| T-Mobile USA Incorporated | | 3.50 | 4-15-2031 | | 730,000 | 686,915 |
| | | | | | | 1,394,090 |
| Consumer discretionary: 4.27% | | | | | | |
| Auto components: 0.19% | | | | | | |
| Allison Transmission Incorporated 144A | | 5.88 | 6-1-2029 | | 130,000 | 132,531 |
| Clarios Global LP 144A | | 6.25 | 5-15-2026 | | 194,000 | 199,578 |
| Clarios Global LP 144A | | 6.75 | 5-15-2025 | | 760,000 | 787,003 |
| | | | | | | 1,119,112 |
| Automobiles: 0.11% | | | | | | |
| Ford Motor Company | | 3.25 | 2-12-2032 | | 745,000 | 665,382 |
| Diversified consumer services: 0.17% | | | | | | |
| Grand Canyon University | | 5.13 | 10-1-2028 | | 1,000,000 | 977,200 |
| Hotels, restaurants & leisure: 2.05% | | | | | | |
| Carnival Corporation 144A | | 10.50 | 2-1-2026 | | 190,000 | 211,263 |
| Carnival Corporation 144A | | 4.00 | 8-1-2028 | | 650,000 | 604,500 |
| Carnival Corporation 144A | | 6.00 | 5-1-2029 | | 755,000 | 711,467 |
| Carnival Corporation 144A | | 7.63 | 3-1-2026 | | 585,000 | 588,820 |
| Carnival Corporation 144A | | 9.88 | 8-1-2027 | | 905,000 | 1,000,315 |
| CCM Merger Incorporated 144A | | 6.38 | 5-1-2026 | | 2,750,000 | 2,777,500 |
| NCL Corporation Limited 144A | | 5.88 | 3-15-2026 | | 870,000 | 826,639 |
| NCL Corporation Limited 144A | | 5.88 | 2-15-2027 | | 980,000 | 965,300 |
| NCL Corporation Limited 144A | | 7.75 | 2-15-2029 | | 620,000 | 624,303 |
| Royal Caribbean Cruises Limited 144A | | 5.38 | 7-15-2027 | | 160,000 | 153,725 |
| Royal Caribbean Cruises Limited 144A | | 5.50 | 8-31-2026 | | 215,000 | 208,937 |
| Royal Caribbean Cruises Limited 144A | | 5.50 | 4-1-2028 | | 450,000 | 428,990 |
| Royal Caribbean Cruises Limited 144A | | 9.13 | 6-15-2023 | | 1,620,000 | 1,686,825 |
| Royal Caribbean Cruises Limited 144A | | 10.88 | 6-1-2023 | | 740,000 | 787,419 |
| Six Flags Entertainment Company 144A | | 5.50 | 4-15-2027 | | 285,000 | 284,644 |
| | | | | | | 11,860,647 |
| Household durables: 0.30% | | | | | | |
| Allied Universal Holdco LLC 144A | | 6.63 | 7-15-2026 | | 355,000 | 359,200 |
| WASH Multifamily Acquisition Incorporated 144A | | 5.75 | 4-15-2026 | | 1,355,000 | 1,358,388 |
| | | | | | | 1,717,588 |
| Multiline retail: 0.37% | | | | | | |
| LSF9 Atlantis Holdings LLC 144A | | 7.75 | 2-15-2026 | | 638,000 | 612,904 |
The accompanying notes are an integral part of these financial statements.
Allspring Diversified Income Builder Fund | 19
Portfolio of investments—March 31, 2022 (unaudited)
| | | Interest
rate | Maturity
date | Principal | Value |
| Multiline retail (continued) | | | | | | |
| Macy's Retail Holdings LLC 144A | | 5.88% | 4-1-2029 | $ | 1,365,000 | $ 1,361,588 |
| Macy's Retail Holdings LLC 144A | | 6.13 | 3-15-2032 | | 155,000 | 153,063 |
| | | | | | | 2,127,555 |
| Specialty retail: 0.98% | | | | | | |
| GAP Incorporated 144A | | 3.88 | 10-1-2031 | | 515,000 | 448,617 |
| Group 1 Automotive Incorporated 144A | | 4.00 | 8-15-2028 | | 1,250,000 | 1,164,063 |
| Lithia Motors Incorporated 144A | | 3.88 | 6-1-2029 | | 245,000 | 231,584 |
| Michaels Arts & Crafts Incorporated 144A | | 7.88 | 5-1-2029 | | 1,500,000 | 1,284,375 |
| NMG Holding Company Incorporated 144A | | 7.13 | 4-1-2026 | | 895,000 | 919,165 |
| Rent-A-Center Incorporated 144A« | | 6.38 | 2-15-2029 | | 1,800,000 | 1,647,000 |
| | | | | | | 5,694,804 |
| Textiles, apparel & luxury goods: 0.10% | | | | | | |
| G-III Apparel Group Limited 144A | | 7.88 | 8-15-2025 | | 570,000 | 598,586 |
| Consumer staples: 0.33% | | | | | | |
| Food products: 0.33% | | | | | | |
| CHS Incorporated 144A | | 5.25 | 5-15-2030 | | 490,000 | 470,297 |
| CHS Incorporated 144A | | 6.88 | 4-15-2029 | | 1,460,000 | 1,434,450 |
| | | | | | | 1,904,747 |
| Energy: 6.86% | | | | | | |
| Energy equipment & services: 1.54% | | | | | | |
| Bristow Group Incorporated 144A | | 6.88 | 3-1-2028 | | 2,625,000 | 2,657,813 |
| Hilcorp Energy Company 144A | | 6.25 | 11-1-2028 | | 1,210,000 | 1,216,050 |
| Oceaneering International Incorporated | | 4.65 | 11-15-2024 | | 920,000 | 907,460 |
| Oceaneering International Incorporated | | 6.00 | 2-1-2028 | | 600,000 | 583,584 |
| Pattern Energy Operations LP 144A | | 4.50 | 8-15-2028 | | 2,425,000 | 2,385,739 |
| USA Compression Partners LP | | 6.88 | 4-1-2026 | | 725,000 | 731,525 |
| W.R. Grace Holdings LLC 144A | | 5.63 | 8-15-2029 | | 465,000 | 434,822 |
| | | | | | | 8,916,993 |
| Oil, gas & consumable fuels: 5.32% | | | | | | |
| Aethon United 144A | | 8.25 | 2-15-2026 | | 1,195,000 | 1,240,052 |
| Antero Resources Corporation 144A | | 5.38 | 3-1-2030 | | 680,000 | 694,450 |
| Archrock Partners LP 144A | | 6.25 | 4-1-2028 | | 190,000 | 187,262 |
| Archrock Partners LP 144A | | 6.88 | 4-1-2027 | | 945,000 | 955,603 |
| Buckeye Partners LP 144A | | 4.50 | 3-1-2028 | | 475,000 | 455,031 |
| Buckeye Partners LP | | 5.85 | 11-15-2043 | | 425,000 | 362,287 |
| Cheniere Energy Partners LP 144A | | 3.25 | 1-31-2032 | | 355,000 | 322,798 |
| Cheniere Energy Partners LP | | 4.50 | 10-1-2029 | | 450,000 | 452,250 |
| Cheniere Energy Partners LP 144A | | 5.50 | 6-15-2031 | | 1,775,000 | 1,743,760 |
| Comstock Resources Incorporated 144A | | 5.88 | 1-15-2030 | | 210,000 | 206,913 |
| DCP Midstream Operating Company | | 5.13 | 5-15-2029 | | 255,000 | 262,265 |
| DT Midstream Incorporated 144A | | 4.13 | 6-15-2029 | | 190,000 | 182,173 |
| DT Midstream Incorporated 144A | | 4.38 | 6-15-2031 | | 1,635,000 | 1,565,513 |
| Encino Acquisition Partners Company 144A | | 8.50 | 5-1-2028 | | 1,800,000 | 1,852,722 |
| EnLink Midstream Partners LP | | 5.38 | 6-1-2029 | | 3,080,000 | 3,072,300 |
| EnLink Midstream Partners LP | | 5.45 | 6-1-2047 | | 1,130,000 | 952,025 |
| EnLink Midstream Partners LP | | 5.60 | 4-1-2044 | | 1,175,000 | 1,013,438 |
| Enviva Partners LP 144A | | 6.50 | 1-15-2026 | | 2,005,000 | 2,061,401 |
| Harvest Midstream LP 144A | | 7.50 | 9-1-2028 | | 790,000 | 806,890 |
The accompanying notes are an integral part of these financial statements.
20 | Allspring Diversified Income Builder Fund
Portfolio of investments—March 31, 2022 (unaudited)
| | | Interest
rate | Maturity
date | Principal | Value |
| Oil, gas & consumable fuels (continued) | | | | | | |
| Murphy Oil Corporation | | 5.75% | 8-15-2025 | $ | 415,000 | $ 422,902 |
| Murphy Oil Corporation | | 6.38 | 7-15-2028 | | 865,000 | 899,600 |
| Nabors Industries Incorporated 144A | | 7.38 | 5-15-2027 | | 375,000 | 389,531 |
| New Fortress Energy Incorporated 144A | | 6.50 | 9-30-2026 | | 1,640,000 | 1,624,863 |
| Occidental Petroleum Corporation | | 4.63 | 6-15-2045 | | 1,015,000 | 984,550 |
| Occidental Petroleum Corporation | | 6.45 | 9-15-2036 | | 4,250,000 | 4,992,411 |
| Rockies Express Pipeline LLC 144A | | 6.88 | 4-15-2040 | | 575,000 | 568,370 |
| Southwestern Energy Company | | 4.75 | 2-1-2032 | | 840,000 | 838,950 |
| Tallgrass Energy Partners LP 144A | | 6.00 | 12-31-2030 | | 375,000 | 363,881 |
| Tallgrass Energy Partners LP 144A | | 6.00 | 9-1-2031 | | 230,000 | 221,433 |
| Tallgrass Energy Partners LP 144A | | 7.50 | 10-1-2025 | | 1,000,000 | 1,053,010 |
| Veture Global LNG Incorporated 144A | | 3.88 | 11-1-2033 | | 110,000 | 105,188 |
| | | | | | | 30,853,822 |
| Financials: 8.03% | | | | | | |
| Banks: 1.86% | | | | | | |
| Bank of America Corporation (5 Year Treasury Constant Maturity +2.76%) ʊ± | | 4.38 | 1-27-2027 | | 1,500,000 | 1,409,700 |
| Citigroup Incorporated (U.S. SOFR +3.23%) ʊ± | | 4.70 | 1-30-2025 | | 1,000,000 | 957,500 |
| Citizens Financial Group Incorporated (5 Year Treasury Constant Maturity +5.31%) ʊ± | | 5.65 | 10-6-2025 | | 2,000,000 | 2,080,100 |
| Fifth Third Bancorp (5 Year Treasury Constant Maturity +4.22%) ʊ± | | 4.50 | 9-30-2025 | | 2,000,000 | 1,965,000 |
| JPMorgan Chase & Company (U.S. SOFR +3.13%) ʊ± | | 4.60 | 2-3-2025 | | 1,000,000 | 963,750 |
| SVB Financial Group (10 Year Treasury Constant Maturity +3.06%) ʊ± | | 4.70 | 11-15-2031 | | 1,500,000 | 1,338,750 |
| Truist Financial Corporation (5 Year Treasury Constant Maturity +4.61%) ʊ± | | 4.95 | 9-2-2025 | | 2,000,000 | 2,048,000 |
| | | | | | | 10,762,800 |
| Capital markets: 0.45% | | | | | | |
| Coinbase Global Incorporated 144A | | 3.63 | 10-1-2031 | | 585,000 | 498,713 |
| MSCI Incorporated 144A | | 3.25 | 8-15-2033 | | 320,000 | 287,620 |
| MSCI Incorporated 144A | | 4.00 | 11-15-2029 | | 645,000 | 626,414 |
| Oppenheimer Holdings Incorporated | | 5.50 | 10-1-2025 | | 1,215,000 | 1,211,963 |
| | | | | | | 2,624,710 |
| Consumer finance: 2.81% | | | | | | |
| Acuris Finance U.S. Incorporated 144A | | 5.00 | 5-1-2028 | | 265,000 | 243,469 |
| Discover Financial Services (5 Year Treasury Constant Maturity +5.78%) ʊ± | | 6.13 | 6-23-2025 | | 1,000,000 | 1,040,680 |
| FirstCash Incorporated 144A | | 4.63 | 9-1-2028 | | 405,000 | 376,593 |
| FirstCash Incorporated 144A | | 5.63 | 1-1-2030 | | 725,000 | 696,609 |
| Ford Motor Credit Company LLC | | 4.39 | 1-8-2026 | | 1,725,000 | 1,720,532 |
| Ford Motor Credit Company LLC | | 5.11 | 5-3-2029 | | 2,075,000 | 2,087,305 |
| Ford Motor Credit Company LLC | | 5.13 | 6-16-2025 | | 705,000 | 719,100 |
| LFS Topco LLC 144A | | 5.88 | 10-15-2026 | | 705,000 | 660,938 |
| Navient Corporation | | 5.00 | 3-15-2027 | | 1,055,000 | 1,004,888 |
| Navient Corporation | | 5.50 | 3-15-2029 | | 1,025,000 | 954,531 |
| Navient Corporation | | 5.63 | 8-1-2033 | | 675,000 | 568,350 |
| OneMain Finance Corporation | | 3.50 | 1-15-2027 | | 355,000 | 328,375 |
| PECF USS Intermediate Holding III Corporation 144A | | 8.00 | 11-15-2029 | | 515,000 | 496,975 |
| PRA Group Incorporated 144A | | 5.00 | 10-1-2029 | | 1,515,000 | 1,435,796 |
| PROG Holdings Incorporated 144A | | 6.00 | 11-15-2029 | | 340,000 | 315,350 |
The accompanying notes are an integral part of these financial statements.
Allspring Diversified Income Builder Fund | 21
Portfolio of investments—March 31, 2022 (unaudited)
| | | Interest
rate | Maturity
date | Principal | Value |
| Consumer finance (continued) | | | | | | |
| Rocket Mortgage LLC 144A | | 2.88% | 10-15-2026 | $ | 890,000 | $ 817,149 |
| Rocket Mortgage LLC 144A | | 4.00 | 10-15-2033 | | 915,000 | 801,449 |
| Springleaf Finance Corporation | | 5.38 | 11-15-2029 | | 200,000 | 194,314 |
| Springleaf Finance Corporation | | 6.63 | 1-15-2028 | | 1,000,000 | 1,047,500 |
| Springleaf Finance Corporation | | 7.13 | 3-15-2026 | | 720,000 | 769,601 |
| | | | | | | 16,279,504 |
| Diversified financial services: 0.67% | | | | | | |
| Hat Holdings LLC 144A | | 3.38 | 6-15-2026 | | 370,000 | 351,500 |
| Jefferies Finance LLC 144A | | 5.00 | 8-15-2028 | | 440,000 | 421,291 |
| LPL Holdings Incorporated 144A | | 4.38 | 5-15-2031 | | 1,025,000 | 991,119 |
| LPL Holdings Incorporated 144A | | 4.63 | 11-15-2027 | | 1,100,000 | 1,080,431 |
| United Shore Financial Services LLC 144A | | 5.50 | 11-15-2025 | | 1,050,000 | 1,018,500 |
| | | | | | | 3,862,841 |
| Insurance: 1.03% | | | | | | |
| Amwins Group Incorporated 144A | | 4.88 | 6-30-2029 | | 660,000 | 633,613 |
| AssuredPartners Incorporated 144A | | 5.63 | 1-15-2029 | | 775,000 | 713,310 |
| Broadstreet Partners Incorporated 144A | | 5.88 | 4-15-2029 | | 2,030,000 | 1,892,975 |
| Enact Holdings Incorporated 144A | | 6.50 | 8-15-2025 | | 2,025,000 | 2,089,091 |
| HUB International Limited 144A | | 5.63 | 12-1-2029 | | 125,000 | 119,375 |
| HUB International Limited 144A | | 7.00 | 5-1-2026 | | 280,000 | 283,235 |
| Ryan Specialty Group LLC 144A | | 4.38 | 2-1-2030 | | 245,000 | 231,525 |
| | | | | | | 5,963,124 |
| Mortgage REITs: 0.51% | | | | | | |
| Blackstone Mortgage Trust Incorporated 144A | | 3.75 | 1-15-2027 | | 720,000 | 669,600 |
| Starwood Property Trust Incorporated 144A | | 4.38 | 1-15-2027 | | 1,080,000 | 1,047,600 |
| Starwood Property Trust Incorporated | | 4.75 | 3-15-2025 | | 1,260,000 | 1,275,725 |
| | | | | | | 2,992,925 |
| Thrifts & mortgage finance: 0.70% | | | | | | |
| Ladder Capital Finance Holdings LP 144A | | 4.25 | 2-1-2027 | | 1,225,000 | 1,173,996 |
| Ladder Capital Finance Holdings LP 144A | | 4.75 | 6-15-2029 | | 615,000 | 580,022 |
| Ladder Capital Finance Holdings LP 144A | | 5.25 | 10-1-2025 | | 1,210,000 | 1,205,463 |
| United Wholesale Mortgage LLC 144A | | 5.50 | 4-15-2029 | | 1,260,000 | 1,122,685 |
| | | | | | | 4,082,166 |
| Health care: 2.66% | | | | | | |
| Health care equipment & supplies: 0.37% | | | | | | |
| Avantor Funding Incorporated 144A | | 3.88 | 11-1-2029 | | 250,000 | 235,000 |
| Mozart Debt Merger Sub Incorporated 144A | | 5.25 | 10-1-2029 | | 1,225,000 | 1,138,846 |
| Surgery Center Holdings Incorporated 144A | | 10.00 | 4-15-2027 | | 750,000 | 787,500 |
| | | | | | | 2,161,346 |
| Health care providers & services: 1.79% | | | | | | |
| 180 Medical Incorporated 144A | | 3.88 | 10-15-2029 | | 1,500,000 | 1,417,500 |
| Air Methods Corporation 144A« | | 8.00 | 5-15-2025 | | 1,515,000 | 1,310,475 |
| Davita Incorporated 144A | | 4.63 | 6-1-2030 | | 1,275,000 | 1,190,595 |
| Encompass Health Corporation | | 4.63 | 4-1-2031 | | 3,000,000 | 2,808,120 |
| Mednax Incorporated 144A | | 5.38 | 2-15-2030 | | 640,000 | 617,600 |
| Select Medical Corporation 144A | | 6.25 | 8-15-2026 | | 675,000 | 698,787 |
The accompanying notes are an integral part of these financial statements.
22 | Allspring Diversified Income Builder Fund
Portfolio of investments—March 31, 2022 (unaudited)
| | | Interest
rate | Maturity
date | Principal | Value |
| Health care providers & services (continued) | | | | | | |
| Tenet Healthcare Corporation 144A | | 4.88% | 1-1-2026 | $ | 375,000 | $ 378,281 |
| Toledo Hospital | | 6.02 | 11-15-2048 | | 1,000,000 | 1,142,499 |
| Vizient Incorporated 144A | | 6.25 | 5-15-2027 | | 790,000 | 813,700 |
| | | | | | | 10,377,557 |
| Health care technology: 0.35% | | | | | | |
| IQVIA Incorporated 144A | | 5.00 | 10-15-2026 | | 2,000,000 | 2,035,000 |
| Life sciences tools & services: 0.09% | | | | | | |
| Charles River Laboratories Incorporated 144A | | 4.00 | 3-15-2031 | | 400,000 | 375,500 |
| Charles River Laboratories Incorporated 144A | | 4.25 | 5-1-2028 | | 175,000 | 171,063 |
| | | | | | | 546,563 |
| Pharmaceuticals: 0.06% | | | | | | |
| Bausch Health Companies Incorporated 144A | | 6.13 | 2-1-2027 | | 320,000 | 322,029 |
| Industrials: 3.24% | | | | | | |
| Aerospace & defense: 0.64% | | | | | | |
| Spirit AeroSystems Holdings Incorporated 144A | | 5.50 | 1-15-2025 | | 1,190,000 | 1,192,975 |
| Spirit AeroSystems Holdings Incorporated 144A | | 7.50 | 4-15-2025 | | 230,000 | 238,293 |
| TransDigm Group Incorporated | | 4.63 | 1-15-2029 | | 1,850,000 | 1,729,695 |
| TransDigm Group Incorporated | | 6.38 | 6-15-2026 | | 375,000 | 378,384 |
| TransDigm Group Incorporated 144A | | 6.25 | 3-15-2026 | | 145,000 | 148,863 |
| | | | | | | 3,688,210 |
| Airlines: 0.63% | | | | | | |
| American Airlines Group Incorporated 144A | | 5.75 | 4-20-2029 | | 475,000 | 473,219 |
| Hawaiian Airlines Incorporated | | 3.90 | 7-15-2027 | | 483,891 | 453,905 |
| Hawaiian Brand Intellectual Property Limited 144A | | 5.75 | 1-20-2026 | | 1,945,000 | 1,946,109 |
| Spirit Loyalty Cayman Limited 144A | | 8.00 | 9-20-2025 | | 750,000 | 798,750 |
| | | | | | | 3,671,983 |
| Commercial services & supplies: 0.69% | | | | | | |
| Allied Universal Holdco LLC 144A | | 6.00 | 6-1-2029 | | 1,425,000 | 1,257,085 |
| CoreCivic Incorporated « | | 8.25 | 4-15-2026 | | 1,715,000 | 1,766,450 |
| Northern Light Health | | 5.02 | 7-1-2036 | | 1,000,000 | 971,484 |
| | | | | | | 3,995,019 |
| Construction & engineering: 0.12% | | | | | | |
| Great Lakes Dredge & Dock Company 144A | | 5.25 | 6-1-2029 | | 700,000 | 668,500 |
| Machinery: 0.16% | | | | | | |
| Werner FinCo LP 144A | | 8.75 | 7-15-2025 | | 905,000 | 932,150 |
| Road & rail: 0.51% | | | | | | |
| Uber Technologies Incorporated 144A | | 4.50 | 8-15-2029 | | 2,155,000 | 2,020,313 |
| Uber Technologies Incorporated 144A | | 8.00 | 11-1-2026 | | 905,000 | 961,744 |
| | | | | | | 2,982,057 |
| Trading companies & distributors: 0.49% | | | | | | |
| Fortress Transportation & Infrastructure Investors LLC 144A | | 5.50 | 5-1-2028 | | 1,830,000 | 1,663,745 |
The accompanying notes are an integral part of these financial statements.
Allspring Diversified Income Builder Fund | 23
Portfolio of investments—March 31, 2022 (unaudited)
| | | Interest
rate | Maturity
date | Principal | Value |
| Trading companies & distributors (continued) | | | | | | |
| Fortress Transportation & Infrastructure Investors LLC 144A | | 6.50% | 10-1-2025 | $ | 840,000 | $ 833,700 |
| Fortress Transportation & Infrastructure Investors LLC 144A | | 9.75 | 8-1-2027 | | 350,000 | 365,668 |
| | | | | | | 2,863,113 |
| Information technology: 1.66% | | | | | | |
| Communications equipment: 0.36% | | | | | | |
| CIENA Corporation 144A | | 4.00 | 1-31-2030 | | 475,000 | 457,188 |
| CommScope Technologies LLC 144A | | 5.00 | 3-15-2027 | | 475,000 | 412,573 |
| CommScope Technologies LLC 144A | | 8.25 | 3-1-2027 | | 1,285,000 | 1,249,663 |
| | | | | | | 2,119,424 |
| IT services: 0.54% | | | | | | |
| Sabre GLBL Incorporated 144A | | 7.38 | 9-1-2025 | | 225,000 | 234,952 |
| Sabre GLBL Incorporated 144A | | 9.25 | 4-15-2025 | | 2,600,000 | 2,882,451 |
| | | | | | | 3,117,403 |
| Software: 0.76% | | | | | | |
| MPH Acquisition Holdings LLC 144A | | 5.50 | 9-1-2028 | | 380,000 | 364,274 |
| MPH Acquisition Holdings LLC 144A« | | 5.75 | 11-1-2028 | | 2,515,000 | 2,270,869 |
| NCR Corporation 144A | | 5.13 | 4-15-2029 | | 125,000 | 120,168 |
| NCR Corporation 144A | | 5.75 | 9-1-2027 | | 800,000 | 800,000 |
| NCR Corporation 144A | | 6.13 | 9-1-2029 | | 250,000 | 250,625 |
| SS&C Technologies Incorporated 144A | | 5.50 | 9-30-2027 | | 600,000 | 604,509 |
| | | | | | | 4,410,445 |
| Materials: 1.37% | | | | | | |
| Chemicals: 0.28% | | | | | | |
| Chemours Company 144A | | 4.63 | 11-15-2029 | | 955,000 | 875,363 |
| Olympus Water US Holding Corporation 144A | | 4.25 | 10-1-2028 | | 835,000 | 758,334 |
| | | | | | | 1,633,697 |
| Containers & packaging: 0.51% | | | | | | |
| Ball Corporation | | 2.88 | 8-15-2030 | | 2,525,000 | 2,263,776 |
| Clydesdale Acquisition Holdings Incorporated 144A%% | | 8.75 | 4-15-2030 | | 715,000 | 672,994 |
| | | | | | | 2,936,770 |
| Metals & mining: 0.35% | | | | | | |
| Arches Buyer Incorporated 144A | | 4.25 | 6-1-2028 | | 420,000 | 391,801 |
| Arches Buyer Incorporated 144A | | 6.13 | 12-1-2028 | | 405,000 | 374,362 |
| Cleveland-Cliffs Incorporated 144A | | 4.88 | 3-1-2031 | | 850,000 | 840,438 |
| Cleveland-Cliffs Incorporated | | 5.88 | 6-1-2027 | | 410,000 | 420,547 |
| | | | | | | 2,027,148 |
| Paper & forest products: 0.23% | | | | | | |
| Vertical US Newco Incorporated 144A | | 5.25 | 7-15-2027 | | 1,365,000 | 1,350,026 |
| Real estate: 0.96% | | | | | | |
| Equity REITs: 0.96% | | | | | | |
| Iron Mountain Incorporated 144A | | 4.50 | 2-15-2031 | | 950,000 | 877,335 |
The accompanying notes are an integral part of these financial statements.
24 | Allspring Diversified Income Builder Fund
Portfolio of investments—March 31, 2022 (unaudited)
| | | Interest
rate | Maturity
date | Principal | Value |
| Equity REITs (continued) | | | | | | |
| Iron Mountain Incorporated 144A | | 5.25% | 7-15-2030 | $ | 1,225,000 | $ 1,200,500 |
| Service Properties Trust Company | | 4.75 | 10-1-2026 | | 165,000 | 150,975 |
| Service Properties Trust Company | | 4.95 | 2-15-2027 | | 2,825,000 | 2,610,583 |
| Service Properties Trust Company | | 5.00 | 8-15-2022 | | 720,000 | 716,400 |
| | | | | | | 5,555,793 |
| Utilities: 1.47% | | | | | | |
| Electric utilities: 0.73% | | | | | | |
| NextEra Energy Operating Partners LP 144A | | 4.50 | 9-15-2027 | | 700,000 | 696,749 |
| PG&E Corporation | | 5.25 | 7-1-2030 | | 1,785,000 | 1,731,272 |
| Vistra Operations Company LLC 144A | | 4.38 | 5-1-2029 | | 1,150,000 | 1,086,750 |
| Vistra Operations Company LLC 144A | | 5.63 | 2-15-2027 | | 700,000 | 699,409 |
| | | | | | | 4,214,180 |
Independent power & renewable electricity
producers: 0.74% | | | | | | |
| NSG Holdings LLC 144A | | 7.75 | 12-15-2025 | | 599,910 | 611,908 |
| TerraForm Power Operating LLC 144A | | 5.00 | 1-31-2028 | | 3,680,000 | 3,664,360 |
| | | | | | | 4,276,268 |
| Total Corporate bonds and notes (Cost $227,480,255) | | | | | | 217,980,398 |
| Foreign corporate bonds and notes : 2.63% | | | | | | |
| Financials: 2.63% | | | | | | |
| Banks: 2.63% | | | | | | |
| ABN AMRO Bank NV (EUR Swap Annual (vs. 6 Month EURIBOR) 5 Year +3.90%) ʊ± | | 4.75 | 9-22-2027 | EUR | 3,000,000 | 3,321,929 |
| AIB Group plc (EUR Swap Annual (vs. 6 Month EURIBOR) 5 Year +6.63%) ʊ± | | 6.25 | 6-23-2025 | EUR | 2,000,000 | 2,287,171 |
| Banco Santander SA (EUR Swap Annual (vs. 6 Month EURIBOR) 5 Year +4.53%) ʊ± | | 4.38 | 1-14-2026 | EUR | 3,000,000 | 3,224,782 |
| Bankia SA (EUR Swap Annual (vs. 6 Month EURIBOR) 5 Year +6.22%) ʊ± | | 6.38 | 9-19-2023 | EUR | 3,000,000 | 3,449,442 |
| Commerzbank AG (EUR Swap Annual (vs. 6 Month EURIBOR) 5 Year +6.36%) ʊ± | | 6.13 | 10-9-2025 | EUR | 2,600,000 | 2,947,695 |
| | | | | | | 15,231,019 |
| Total Foreign corporate bonds and notes (Cost $15,840,763) | | | | | | 15,231,019 |
| Loans: 2.99% | | | | | | |
| Communication services: 0.37% | | | | | | |
| Diversified telecommunication services: 0.25% | | | | | | |
| Intelsat Jackson Holdings SA (U.S. SOFR +4.25%) <± | | 4.92 | 2-1-2029 | $ | 1,450,000 | 1,424,176 |
| Media: 0.12% | | | | | | |
| DIRECTV Financing LLC (1 Month LIBOR +5.00%) ± | | 5.75 | 8-2-2027 | | 711,475 | 709,903 |
| Consumer discretionary: 0.21% | | | | | | |
| Auto components: 0.06% | | | | | | |
| Truck Hero Incorporated (1 Month LIBOR +3.25%) ± | | 4.00 | 1-31-2028 | | 372,180 | 360,085 |
The accompanying notes are an integral part of these financial statements.
Allspring Diversified Income Builder Fund | 25
Portfolio of investments—March 31, 2022 (unaudited)
| | | Interest
rate | Maturity
date | Principal | Value |
| Household durables: 0.05% | | | | | | |
| Wilsonart LLC (1 Month LIBOR +3.25%) ± | | 4.26% | 12-31-2026 | $ | 276,489 | $ 269,035 |
| Multiline retail: 0.05% | | | | | | |
| LSF9 Atlantis Holdings LLC (U.S. SOFR +7.25%) <± | | 8.00 | 3-29-2029 | | 300,000 | 294,000 |
| Specialty retail: 0.05% | | | | | | |
| Great Outdoors Group LLC (1 Month LIBOR +3.75%) ± | | 4.50 | 3-6-2028 | | 285,141 | 283,716 |
| Consumer staples: 0.03% | | | | | | |
| Food products: 0.03% | | | | | | |
| Naked Juice LLC (U.S. SOFR +3.25%) <± | | 3.75 | 1-24-2029 | | 146,545 | 143,928 |
| Naked Juice LLC (U.S. SOFR +3.25%) <± | | 3.75 | 1-24-2029 | | 8,455 | 8,304 |
| | | | | | | 152,232 |
| Energy: 0.12% | | | | | | |
| Oil, gas & consumable fuels: 0.12% | | | | | | |
| GIP II Blue Holdings LP (1 Month LIBOR +4.50%) ± | | 5.51 | 9-29-2028 | | 703,238 | 699,721 |
| Financials: 0.87% | | | | | | |
| Consumer finance: 0.03% | | | | | | |
| PMHC II Incorporated (U.S. SOFR +4.25%) <± | | 4.75 | 2-1-2029 | | 200,000 | 190,416 |
| Diversified financial services: 0.36% | | | | | | |
| Mallinckrodt International Finance SA (3 Month LIBOR +5.25%) ± | | 6.00 | 9-24-2024 | | 757,031 | 691,646 |
| Resolute Investment Managers Incorporated (1 Month LIBOR +4.25%) ౠ| | 5.26 | 4-30-2024 | | 297,007 | 294,595 |
| Russell Investments US Institutional Holdco Incorporated (1 Month LIBOR +3.50%) ± | | 4.50 | 5-30-2025 | | 1,100,000 | 1,084,413 |
| | | | | | | 2,070,654 |
| Insurance: 0.41% | | | | | | |
| Asurion LLC (1 Month LIBOR +5.25%) ౠ| | 5.71 | 1-31-2028 | | 980,000 | 959,420 |
| Asurion LLC (1 Month LIBOR +5.25%) ౠ| | 5.71 | 1-20-2029 | | 165,000 | 161,081 |
| HUB International Limited (1 Month LIBOR +3.25%) <± | | 4.00 | 4-25-2025 | | 1,256,826 | 1,247,689 |
| | | | | | | 2,368,190 |
| Mortgage REITs: 0.07% | | | | | | |
| Claros Mortgage Trust Incoporated (U.S. SOFR +4.50%) ± | | 5.00 | 8-9-2026 | | 410,000 | 407,950 |
| Health care: 0.45% | | | | | | |
| Health care equipment & supplies: 0.20% | | | | | | |
| Surgery Center Holdings Incorporated (1 Month LIBOR +3.75%) ± | | 4.50 | 8-31-2026 | | 1,155,729 | 1,145,478 |
| Health care providers & services: 0.14% | | | | | | |
| Padagis LLC (1 Month LIBOR +4.75%) ± | | 5.25 | 7-6-2028 | | 178,824 | 177,148 |
| Press Ganey Holdings Incorporated (1 Month LIBOR +3.75%) <± | | 4.50 | 7-24-2026 | | 478,797 | 474,009 |
| Press Ganey Holdings Incorporated (U.S. SOFR +3.75%) <± | | 4.50 | 7-24-2026 | | 145,000 | 143,188 |
| | | | | | | 794,345 |
The accompanying notes are an integral part of these financial statements.
26 | Allspring Diversified Income Builder Fund
Portfolio of investments—March 31, 2022 (unaudited)
| | | Interest
rate | Maturity
date | Principal | Value |
| Pharmaceuticals: 0.11% | | | | | | |
| Bausch Health Companies Incorporated (U.S. SOFR +5.25%) <± | | 5.75% | 1-27-2027 | $ | 685,000 | $ 677,294 |
| Industrials: 0.60% | | | | | | |
| Airlines: 0.27% | | | | | | |
| Mileage Plus Holdings LLC (1 Month LIBOR +5.25%) ± | | 6.25 | 6-21-2027 | | 1,525,000 | 1,580,281 |
| Commercial services & supplies: 0.23% | | | | | | |
| Polaris Newco LLC (1 Month LIBOR +4.00%) ± | | 4.50 | 6-2-2028 | | 1,209,050 | 1,199,075 |
| Ring Container Technologies (1 Month LIBOR +3.75%) ± | | 4.27 | 8-12-2028 | | 104,738 | 102,971 |
| | | | | | | 1,302,046 |
| Machinery: 0.10% | | | | | | |
| Werner FinCo LP (3 Month LIBOR +4.00%) ± | | 5.01 | 7-24-2024 | | 607,054 | 600,480 |
| Information technology: 0.22% | | | | | | |
| Software: 0.22% | | | | | | |
| Emerald Topco Incorporated (1 Month LIBOR +3.50%) ± | | 3.80 | 7-24-2026 | | 290,747 | 286,522 |
| Nexus Buyer LLC (1 Month LIBOR +6.25%) ± | | 6.75 | 10-29-2029 | | 1,015,000 | 1,002,739 |
| | | | | | | 1,289,261 |
| Real estate: 0.12% | | | | | | |
| Equity REITs: 0.12% | | | | | | |
| The Geo Group Incorporated (3 Month LIBOR +2.00%) ± | | 2.75 | 3-22-2024 | | 772,966 | 719,732 |
| Total Loans (Cost $17,572,245) | | | | | | 17,338,995 |
| Municipal obligations: 2.94% | | | | | | |
| California: 0.56% | | | | | | |
| Education revenue: 0.35% | | | | | | |
| California School Finance Authority Charter School 144A | | 4.25 | 7-1-2025 | | 750,000 | 742,691 |
| California School Finance Authority Charter School 144A | | 5.00 | 6-15-2031 | | 1,350,000 | 1,302,022 |
| | | | | | | 2,044,713 |
| Health revenue: 0.05% | | | | | | |
| California Municipal Finance Authority Series 2019B 144A | | 4.25 | 11-1-2023 | | 310,000 | 308,490 |
| Tobacco revenue: 0.16% | | | | | | |
| Golden State Tobacco Securitization Corporation | | 4.21 | 6-1-2050 | | 1,000,000 | 888,557 |
| Colorado: 0.08% | | | | | | |
| Health revenue: 0.08% | | | | | | |
| Denver CO Health & Hospital Authority Series B | | 5.15 | 12-1-2026 | | 445,000 | 449,785 |
The accompanying notes are an integral part of these financial statements.
Allspring Diversified Income Builder Fund | 27
Portfolio of investments—March 31, 2022 (unaudited)
| | | Interest
rate | Maturity
date | Principal | Value |
| Florida: 0.43% | | | | | | |
| Education revenue: 0.23% | | | | | | |
| Capital Trust Agency Renaissance Charter School Project Series B 144A | | 5.63% | 6-15-2023 | $ | 305,000 | $ 306,473 |
| Florida HEFAR Jacksonville University Project Series A2 144A | | 5.43 | 6-1-2027 | | 1,000,000 | 1,035,820 |
| | | | | | | 1,342,293 |
| Water & sewer revenue: 0.20% | | | | | | |
| Charlotte County IDA Town & Country Utilities Project Series B 144A | | 5.00 | 10-1-2036 | | 1,250,000 | 1,149,515 |
| Georgia: 0.07% | | | | | | |
| Health revenue: 0.07% | | | | | | |
| Cobb County GA Development Authority Presbyterian Village Austell Project Series 2019B 144A | | 5.75 | 12-1-2028 | | 400,000 | 399,694 |
| Guam: 0.11% | | | | | | |
| Airport revenue: 0.11% | | | | | | |
| Guam International Airport Authority Series A | | 4.46 | 10-1-2043 | | 675,000 | 641,692 |
| Illinois: 0.48% | | | | | | |
| Miscellaneous revenue: 0.48% | | | | | | |
| Chicago IL Board of Education Taxable Build America Bonds Series E | | 6.04 | 12-1-2029 | | 1,255,000 | 1,323,908 |
| Chicago IL Certificate of Participation River Point Plaza Redevelopment Project Series A 144A | | 4.84 | 4-15-2028 | | 1,447,000 | 1,460,649 |
| | | | | | | 2,784,557 |
| Indiana: 0.08% | | | | | | |
| Health revenue: 0.08% | | | | | | |
| Knox County IN Good Samaritian Hospital Project Industry Economic Development Series B | | 5.90 | 4-1-2034 | | 480,000 | 489,426 |
| Iowa: 0.21% | | | | | | |
| GO revenue: 0.21% | | | | | | |
| Coralville IA Series C | | 5.00 | 5-1-2030 | | 1,200,000 | 1,212,266 |
| Louisiana: 0.14% | | | | | | |
| Health revenue: 0.14% | | | | | | |
| Louisiana Local Government Environmental Facilities & CDA | | 5.75 | 1-1-2029 | | 845,000 | 825,985 |
| New Jersey: 0.17% | | | | | | |
| Education revenue: 0.17% | | | | | | |
| New Jersey Educational Facilities Authority Georgian Court University Series H | | 4.25 | 7-1-2028 | | 1,000,000 | 977,375 |
| New York: 0.20% | | | | | | |
| Education revenue: 0.09% | | | | | | |
| Yonkers Economic Development Corporation Series 2019B | | 4.50 | 10-15-2024 | | 545,000 | 537,737 |
The accompanying notes are an integral part of these financial statements.
28 | Allspring Diversified Income Builder Fund
Portfolio of investments—March 31, 2022 (unaudited)
| | | Interest
rate | Maturity
date | Principal | Value |
| Health revenue: 0.04% | | | | | | |
| Jefferson County NY Civic Facility Development Corporation Refunding Bond Series B Samaritan Medical Center Obligated Group | | 4.25% | 11-1-2028 | $ | 245,000 | $ 237,470 |
| Utilities revenue: 0.07% | | | | | | |
| New York Energy Research & Development Authority Green Bond Series A | | 4.81 | 4-1-2034 | | 380,000 | 406,579 |
| Oklahoma: 0.09% | | | | | | |
| Health revenue: 0.09% | | | | | | |
| Oklahoma Development Finance Authority | | 5.45 | 8-15-2028 | | 500,000 | 524,348 |
| Texas: 0.11% | | | | | | |
| Industrial development revenue: 0.11% | | | | | | |
| Port Beaumont TX IDA Jefferson Gulf Coast 144A | | 4.10 | 1-1-2028 | | 700,000 | 636,055 |
| Wisconsin: 0.21% | | | | | | |
| Education revenue: 0.21% | | | | | | |
| Burrell College of Osteopathic Medicine Project PFA 144A | | 5.13 | 6-1-2028 | | 1,230,000 | 1,200,293 |
| Total Municipal obligations (Cost $17,209,232) | | | | | | 17,056,830 |
| Non-agency mortgage-backed securities: 5.84% | | | | | | |
| AFN LLC Series 2019-1A Class A2 144A | | 4.46 | 5-20-2049 | | 995,791 | 988,669 |
| Arroyo Mortgage Trust Series 2022-1 Class A3 144A | | 3.65 | 12-25-2056 | | 1,450,000 | 1,388,627 |
| BX Trust Series 2022-LP2 Class E (U.S. SOFR 1 Month +2.61%) 144A± | | 2.91 | 2-15-2039 | | 3,000,000 | 2,928,437 |
| Capital Automotive Real Estate Services Series 1A Class A6 144A | | 3.81 | 2-15-2050 | | 498,021 | 493,223 |
| Citigroup Commercial Mortgage Trust Series 2015-GC27 Class B | | 3.77 | 2-10-2048 | | 2,524,616 | 2,468,617 |
| Credit Suisse Mortgage Trust Series 2021-NQM8 Class M1 144A±± | | 3.26 | 10-25-2066 | | 2,000,000 | 1,839,460 |
| Ellington Financial Mortgage Trust Series 2022-1 Class M1 144A±± | | 3.50 | 1-25-2067 | | 1,750,000 | 1,604,983 |
| Flexential Issuer LLC Series 2021-1A Class C 144A | | 6.93 | 11-27-2051 | | 4,000,000 | 3,851,576 |
| GCAT Series 2021-NQM6 Class M1 144A±± | | 3.41 | 8-25-2066 | | 3,000,000 | 2,811,351 |
| Golub Capital Partners Funding LLC Series2021-2A Class B 144A | | 3.99 | 10-19-2029 | | 500,000 | 473,873 |
| Goodleap Sustainable Home Improvement Series 2022-1GS Class C 144A | | 3.50 | 1-20-2049 | | 3,486,929 | 3,167,500 |
| JPMorgan Mortgage Trust Series 2019-2 Class A3 144A±± | | 4.00 | 8-25-2049 | | 70,921 | 71,093 |
| New Residential Mortgage Loan Trust Series 2022-NQM1 Class M1 144A±± | | 3.60 | 1-25-2026 | | 4,000,000 | 3,723,954 |
| Oxford Finance Funding Trust Series 2022-1A Class B 144A | | 4.10 | 2-15-2030 | | 4,500,000 | 4,347,901 |
| Purewest Funding LLC Series 2021-1 Class A1 144A | | 4.09 | 12-22-2036 | | 886,070 | 857,526 |
| Sequoia Mortgage Trust Series 2018-6 Class A19 144A±± | | 4.00 | 7-25-2048 | | 113,889 | 114,050 |
| Starwood Mortgage Residential Series 2021-6 144A±± | | 3.39 | 11-25-2066 | | 3,000,000 | 2,739,067 |
| Total Non-agency mortgage-backed securities (Cost $35,331,259) | | | | | | 33,869,907 |
The accompanying notes are an integral part of these financial statements.
Allspring Diversified Income Builder Fund | 29
Portfolio of investments—March 31, 2022 (unaudited)
| | | Dividend Yield | | | Shares | Value |
| Preferred stocks: 0.11% | | | | | | |
| Energy: 0.01% | | | | | | |
| Oil, gas & consumable fuels: 0.01% | | | | | | |
| Petroleo Brasil SP ADR | | 7.69% | | | 5,000 | $ 69,900 |
| Financials: 0.02% | | | | | | |
| Banks: 0.02% | | | | | | |
| Itaúsa SA | | 2.59 | | | 52,300 | 118,088 |
| Information technology: 0.06% | | | | | | |
| Technology hardware, storage & peripherals: 0.06% | | | | | | |
| Samsung Electronics Company Limited | | 4.65 | | | 6,434 | 333,380 |
| Materials: 0.02% | | | | | | |
| Chemicals: 0.02% | | | | | | |
| LG Chem Limited | | 2.93 | | | 460 | 103,178 |
| Total Preferred stocks (Cost $623,294) | | | | | | 624,546 |
| | | Interest
rate | Maturity
date | Principal | |
| Yankee corporate bonds and notes: 10.23% | | | | | | |
| Communication services: 0.37% | | | | | | |
| Wireless telecommunication services: 0.37% | | | | | | |
| Connect U.S. Finco LLC 144A | | 6.75 | 10-1-2026 | $ | 795,000 | 808,825 |
| Telesat Canada 144A | | 5.63 | 12-6-2026 | | 230,000 | 175,628 |
| VMED O2 UK Financing I plc 144A | | 4.75 | 7-15-2031 | | 1,225,000 | 1,154,563 |
| | | | | | | 2,139,016 |
| Energy: 0.28% | | | | | | |
| Energy equipment & services: 0.04% | | | | | | |
| Nabors Industries Limited 144A | | 7.25 | 1-15-2026 | | 200,000 | 200,000 |
| Oil, gas & consumable fuels: 0.24% | | | | | | |
| Baytex Energy Corporation 144A | | 8.75 | 4-1-2027 | | 500,000 | 536,250 |
| Northriver Midstream Finance LP 144A | | 5.63 | 2-15-2026 | | 880,000 | 876,256 |
| | | | | | | 1,412,506 |
| Financials: 5.83% | | | | | | |
| Banks: 4.37% | | | | | | |
| Barclays plc (USD Swap Semi Annual (vs. 3 Month LIBOR) 5 Year +4.84%) ʊ± | | 7.75 | 9-15-2023 | | 2,160,000 | 2,238,916 |
| Credit Agricole SA (USD Swap Semi Annual (vs. 3 Month LIBOR) 5 Year +4.90%) 144Aʊ± | | 7.88 | 1-23-2024 | | 1,750,000 | 1,844,063 |
| Credit Agricole SA (USD Swap Semi Annual (vs. 3 Month LIBOR) 5 Year +6.19%) 144Aʊ± | | 8.13 | 12-23-2025 | | 1,750,000 | 1,945,860 |
| Danske Bank AS (7 Year Treasury Constant Maturity +4.13%) ʊ± | | 7.00 | 6-26-2025 | | 2,300,000 | 2,374,750 |
| HSBC Holdings plc (USD ICE Swap Rate 11:00am NY 5 Year +4.37%) ʊ± | | 6.38 | 3-30-2025 | | 2,000,000 | 2,069,340 |
| ING Groep NV (USD ICE Swap Rate 11:00am NY 5 Year +4.20%) ʊ± | | 6.75 | 4-16-2024 | | 3,800,000 | 3,914,319 |
The accompanying notes are an integral part of these financial statements.
30 | Allspring Diversified Income Builder Fund
Portfolio of investments—March 31, 2022 (unaudited)
| | | Interest
rate | Maturity
date | Principal | Value |
| Banks (continued) | | | | | | |
| Lloyds Banking Group plc (USD Swap Semi Annual (vs. 3 Month LIBOR) 5 Year +4.76%) ʊ± | | 7.50% | 6-27-2024 | $ | 3,665,000 | $ 3,848,140 |
| NatWest Group plc (5 Year Treasury Constant Maturity +3.10%) ʊ± | | 4.60 | 6-28-2031 | | 1,500,000 | 1,320,000 |
| Skandinaviska Enskilda Banken AB (5 Year Treasury Constant Maturity +3.46%) ʊ± | | 5.13 | 5-13-2025 | | 2,000,000 | 1,975,824 |
| Societe Generale SA (USD ICE Swap Rate 11:00am NY 5 Year +5.87%) 144Aʊ± | | 8.00 | 9-29-2025 | | 3,535,000 | 3,818,330 |
| | | | | | | 25,349,542 |
| Capital markets: 1.20% | | | | | | |
| Credit Suisse Group AG (USD Swap Semi Annual (vs. 3 Month LIBOR) 5 Year +4.60%) 144Aʊ± | | 7.50 | 12-11-2023 | | 2,395,000 | 2,475,831 |
| Credit Suisse Group AG (5 Year Treasury Constant Maturity +4.89%) 144Aʊ± | | 5.25 | 2-11-2027 | | 1,000,000 | 925,000 |
| UBS Group Funding Switzerland AG (USD Swap Semi Annual (vs. 6 Month LIBOR) 5 Year +4.87%) ʊ± | | 7.00 | 2-19-2025 | | 3,330,000 | 3,526,330 |
| | | | | | | 6,927,161 |
| Diversified financial services: 0.26% | | | | | | |
| Castlelake Aviation Finance 144A | | 5.00 | 4-15-2027 | | 385,000 | 343,613 |
| New Red Finance Incorporated 144A | | 3.88 | 1-15-2028 | | 625,000 | 592,209 |
| New Red Finance Incorporated 144A | | 4.00 | 10-15-2030 | | 650,000 | 586,323 |
| | | | | | | 1,522,145 |
| Health care: 1.39% | | | | | | |
| Biotechnology: 0.35% | | | | | | |
| Grifols Escrow Issuer SA 144A | | 4.75 | 10-15-2028 | | 2,175,000 | 2,047,219 |
| Pharmaceuticals: 1.04% | | | | | | |
| Bausch Health Companies Incorporated 144A | | 4.88 | 6-1-2028 | | 225,000 | 215,438 |
| Bausch Health Companies Incorporated 144A | | 5.25 | 1-30-2030 | | 3,115,000 | 2,446,957 |
| Bausch Health Companies Incorporated 144A | | 6.25 | 2-15-2029 | | 1,180,000 | 967,600 |
| Teva Pharmaceutical Finance Netherlands III BV | | 4.75 | 5-9-2027 | | 115,000 | 110,394 |
| Teva Pharmaceutical Finance Netherlands III BV | | 5.13 | 5-9-2029 | | 1,640,000 | 1,576,401 |
| Teva Pharmaceutical Finance Netherlands III BV | | 6.00 | 4-15-2024 | | 200,000 | 205,000 |
| Teva Pharmaceutical Finance Netherlands III BV « | | 6.75 | 3-1-2028 | | 500,000 | 524,125 |
| | | | | | | 6,045,915 |
| Industrials: 2.16% | | | | | | |
| Aerospace & defense: 0.31% | | | | | | |
| Bombardier Incorporated 144A | | 6.00 | 2-15-2028 | | 115,000 | 107,783 |
| Bombardier Incorporated 144A | | 7.13 | 6-15-2026 | | 170,000 | 166,600 |
| Bombardier Incorporated 144A« | | 7.88 | 4-15-2027 | | 1,520,000 | 1,488,255 |
| | | | | | | 1,762,638 |
| Airlines: 0.63% | | | | | | |
| Air Canada Pass-Through Trust Series 2020-1 Class C 144A | | 10.50 | 7-15-2026 | | 1,805,000 | 2,085,242 |
| VistaJet 144A | | 6.38 | 2-1-2030 | | 1,665,000 | 1,566,540 |
| | | | | | | 3,651,782 |
The accompanying notes are an integral part of these financial statements.
Allspring Diversified Income Builder Fund | 31
Portfolio of investments—March 31, 2022 (unaudited)
| | | Interest
rate | Maturity
date | Principal | Value |
| Electrical equipment: 0.60% | | | | | | |
| Sensata Technologies BV 144A | | 4.00% | 4-15-2029 | $ | 1,910,000 | $ 1,818,759 |
| Sensata Technologies BV 144A | | 5.63 | 11-1-2024 | | 1,605,000 | 1,659,169 |
| | | | | | | 3,477,928 |
| Machinery: 0.21% | | | | | | |
| Vertical Holdco GmbH 144A | | 7.63 | 7-15-2028 | | 1,225,000 | 1,214,281 |
| Trading companies & distributors: 0.41% | | | | | | |
| Carlyle Aviation Elevate Merger Subsidiary Limited 144A | | 7.00 | 10-15-2024 | | 2,670,000 | 2,394,483 |
| Materials: 0.20% | | | | | | |
| Containers & packaging: 0.20% | | | | | | |
| Ardagh Packaging Finance plc 144A | | 4.13 | 8-15-2026 | | 405,000 | 390,187 |
| Ardagh Packaging Finance plc 144A | | 5.25 | 8-15-2027 | | 855,000 | 790,341 |
| | | | | | | 1,180,528 |
| Total Yankee corporate bonds and notes (Cost $60,782,927) | | | | | | 59,325,144 |
| | | Yield | | Shares | |
| Short-term investments: 4.12% | | | | | | |
| Investment companies: 4.12% | | | | | | |
| Allspring Government Money Market Fund Select Class ♠∞## | | 0.18 | | | 17,614,411 | 17,614,411 |
| Securities Lending Cash Investments LLC ♠∩∞ | | 0.40 | | | 6,258,868 | 6,258,868 |
| Total Short-term investments (Cost $23,873,279) | | | | | | 23,873,279 |
| Total investments in securities (Cost $581,319,834) | 100.44% | | | | | 582,382,074 |
| Other assets and liabilities, net | (0.44) | | | | | (2,566,023) |
| Total net assets | 100.00% | | | | | $579,816,051 |
| 144A | The security may be resold in transactions exempt from registration, normally to qualified institutional buyers, pursuant to Rule 144A under the Securities Act of 1933. |
| ♦ | The security is fair valued in accordance with procedures approved by the Board of Trustees. |
| ‡ | Security is valued using significant unobservable inputs. |
| ± | Variable rate investment. The rate shown is the rate in effect at period end. |
| † | Non-income-earning security |
| < | All or a portion of the position represents an unfunded loan commitment. The rate represents the current interest rate if the loan is partially funded. |
| ±± | The coupon of the security is adjusted based on the principal and/or interest payments received from the underlying pool of mortgages as well as the credit quality and the actual prepayment speed of the underlying mortgages. The rate shown is the rate in effect at period end. |
| ## | All or a portion of this security is segregated for when-issued securities and unfunded loans. |
| « | All or a portion of this security is on loan. |
| ♠ | The issuer of the security is an affiliated person of the Fund as defined in the Investment Company Act of 1940. |
| ∩ | The investment is a non-registered investment company purchased with cash collateral received from securities on loan. |
| ∞ | The rate represents the 7-day annualized yield at period end. |
| # | All or a portion of this security is segregated as collateral for investments in derivative instruments. |
| ʊ | Security is perpetual in nature and has no stated maturity date. The date shown reflects the next call date. |
| %% | The security is purchased on a when-issued basis. |
The accompanying notes are an integral part of these financial statements.
32 | Allspring Diversified Income Builder Fund
Portfolio of investments—March 31, 2022 (unaudited)
| Abbreviations: |
| ADR | American depositary receipt |
| CDA | Community Development Authority |
| EUR | Euro |
| EURIBOR | Euro Interbank Offered Rate |
| GDR | Global depositary receipt |
| GO | General obligation |
| HEFAR | Higher Education Facilities Authority Revenue |
| IDA | Industrial Development Authority |
| LIBOR | London Interbank Offered Rate |
| PFA | Public Finance Authority |
| REIT | Real estate investment trust |
| SOFR | Secured Overnight Financing Rate |
Investments in affiliates
An affiliated investment is an investment in which the Fund owns at least 5% of the outstanding voting shares of the issuer or as a result of other relationships, such as the Fund and the issuer having the same investment manager. Transactions with issuers that were affiliates of the Fund at the end of the period were as follows:
| | Value,
beginning of
period | Purchases | Sales
proceeds | Net
realized
gains
(losses) | | Net
change in
unrealized
gains
(losses) | | Value,
end of
period | Shares,
end
of period | Income
from
affiliated
securities |
| Short-term investments | | | | | | | | | |
| Allspring Government Money Market Fund Select Class | $21,839,370 | $132,693,844 | $(136,918,803) | $0 | | $0 | | $ 17,614,411 | 17,614,411 | $ 4,966 |
| Securities Lending Cash Investments LLC | 6,700,880 | 17,288,453 | (17,730,465) | 0 | | 0 | | 6,258,868 | 6,258,868 | 2,417 # |
| | | | | $0 | | $0 | | $23,873,279 | | $7,383 |
| # | Amount shown represents income before fees and rebates. |
Forward foreign currency contracts
Currency to be
received | Currency to be
delivered | Counterparty | Settlement
date | Unrealized
gains | Unrealized
losses |
| 15,204,913 USD | 13,800,000 EUR | Citibank National Association | 6-30-2022 | $0 | $(117,610) |
Futures contracts
| Description | Number of
contracts | Expiration
date | Notional
cost | Notional
value | Unrealized
gains | | Unrealized
losses |
| Long | | | | | | | |
| TOPIX Index Futures | 91 | 6-9-2022 | $ 14,219,370 | $ 14,549,984 | $ 330,614 | | $ 0 |
| Australian Dollar Currency Futures | 158 | 6-13-2022 | 11,642,413 | 11,844,470 | 202,057 | | 0 |
| DAX Index Futures | 21 | 6-17-2022 | 8,579,883 | 8,382,414 | 0 | | (197,469) |
| E-Mini Russell 2000 Index Futures | 147 | 6-17-2022 | 14,505,070 | 15,188,040 | 682,970 | | 0 |
| XAE Energy Index Futures | 156 | 6-17-2022 | 12,140,002 | 12,434,760 | 294,758 | | 0 |
| Short | | | | | | | |
| GBP Currency Futures | (141) | 6-13-2022 | (11,547,905) | (11,571,694) | 0 | | (23,789) |
| E-Mini S&P 500 Index Futures | (138) | 6-17-2022 | (30,027,886) | (31,262,175) | 0 | | (1,234,289) |
| | | | | | $1,510,399 | | $(1,455,547) |
The accompanying notes are an integral part of these financial statements.
Allspring Diversified Income Builder Fund | 33
Portfolio of investments—March 31, 2022 (unaudited)
Centrally cleared credit default swap contracts
| Reference index | Fixed rate
received | Payment
frequency | Maturity
date | Notional
amount | Value | Premiums
paid
(received) | Unrealized
gains | Unrealized
losses |
| Sell Protection | | | | | | | | | |
| Markit CDX North America High Yield Index | 5.00% | Quarterly | 12-20-2025 | USD | 1,000,000 | $63,336 | $67,266 | $0 | $(3,930) |
Written options
| Description | Counterparty | Number of
contracts | Notional
amount | Exercise
price | Expiration
date | Value |
| Call | | | | | | |
| iShares MSCI EAFE ETF | Morgan Stanley Company Incorporated | (727) | $ (5,634,250) | $ 77.50 | 4-1-2022 | $ (6) |
| iShares MSCI EAFE ETF | Morgan Stanley Company Incorporated | (509) | (3,868,400) | 76.00 | 4-1-2022 | (330) |
| iShares MSCI EAFE ETF | Morgan Stanley Company Incorporated | (659) | (5,008,400) | 76.00 | 4-8-2022 | (28,016) |
| iShares MSCI EAFE ETF | Morgan Stanley Company Incorporated | (1,018) | (7,940,400) | 78.00 | 4-14-2022 | (35,314) |
| iShares MSCI EAFE ETF | Morgan Stanley Company Incorporated | (883) | (6,887,400) | 78.00 | 4-22-2022 | (56,420) |
| iShares MSCI Emerging Markets ETF | Morgan Stanley Company Incorporated | (1,244) | (6,033,400) | 48.50 | 4-1-2022 | (1) |
| iShares MSCI Emerging Markets ETF | Morgan Stanley Company Incorporated | (1,909) | (8,972,300) | 47.00 | 4-8-2022 | (56,271) |
| iShares MSCI Emerging Markets ETF | Morgan Stanley Company Incorporated | (795) | (3,975,000) | 50.00 | 4-14-2022 | (7,562) |
| iShares MSCI Emerging Markets ETF | Morgan Stanley Company Incorporated | (1,565) | (7,590,250) | 48.50 | 4-22-2022 | (70,557) |
| Nasdaq 100 Stock Index | Morgan Stanley Company Incorporated | (8) | (12,780,000) | 15,975.00 | 4-1-2022 | (1) |
| Nasdaq 100 Stock Index | Morgan Stanley Company Incorporated | (5) | (7,787,500) | 15,575.00 | 4-8-2022 | (10,400) |
| Nasdaq 100 Stock Index | Morgan Stanley Company Incorporated | (5) | (8,100,000) | 16,200.00 | 4-14-2022 | (3,900) |
| Nasdaq 100 Stock Index | Morgan Stanley Company Incorporated | (8) | (13,360,000) | 16,700.00 | 4-22-2022 | (4,600) |
| Russell 2000 Index | Morgan Stanley Company Incorporated | (21) | (4,872,000) | 2,320.00 | 4-1-2022 | 0 |
| Russell 2000 Index | Morgan Stanley Company Incorporated | (25) | (5,800,000) | 2,320.00 | 4-8-2022 | (375) |
| Russell 2000 Index | Morgan Stanley Company Incorporated | (16) | (3,776,000) | 2,360.00 | 4-14-2022 | (440) |
| Russell 2000 Index | Morgan Stanley Company Incorporated | (25) | (5,487,500) | 2,195.00 | 4-22-2022 | (15,875) |
| S&P 500 Index | Morgan Stanley Company Incorporated | (28) | (13,300,000) | 4,750.00 | 4-1-2022 | (7) |
| S&P 500 Index | Morgan Stanley Company Incorporated | (31) | (14,647,500) | 4,725.00 | 4-8-2022 | (3,565) |
| S&P 500 Index | Morgan Stanley Company Incorporated | (7) | (3,150,000) | 4,500.00 | 4-8-2022 | (51,695) |
| S&P 500 Index | Morgan Stanley Company Incorporated | (26) | (12,610,000) | 4,850.00 | 4-14-2022 | (975) |
| S&P 500 Index | Morgan Stanley Company Incorporated | (15) | (6,967,500) | 4,645.00 | 4-14-2022 | (25,275) |
The accompanying notes are an integral part of these financial statements.
34 | Allspring Diversified Income Builder Fund
Portfolio of investments—March 31, 2022 (unaudited)
Written options (continued)
| Description | Counterparty | Number of
contracts | Notional
amount | Exercise
price | Expiration
date | Value |
| Call (continued) | | | | | | |
| S&P 500 Index | Morgan Stanley Company Incorporated | (29) | $(14,065,000) | $ 4,850.00 | 4-22-2022 | $ (3,190) |
| SPDR Euro STOXX 50 ETF | Morgan Stanley Company Incorporated | (513) | (2,308,500) | 45.00 | 4-14-2022 | (15,840) |
| | | | | | | $(390,615) |
The accompanying notes are an integral part of these financial statements.
Allspring Diversified Income Builder Fund | 35
Statement of assets and liabilities—March 31, 2022 (unaudited)
| | |
| Assets | |
Investments in unaffiliated securities (including $6,135,716 of securities loaned), at value (cost $557,446,555)
| $ 558,508,795 |
Investments in affiliated securities, at value (cost $23,873,279)
| 23,873,279 |
Cash
| 84,744 |
Cash at broker segregated for futures contracts
| 3,426,534 |
Segregated cash for swap contracts
| 67,372 |
Foreign currency, at value (cost $86,868)
| 87,163 |
Receivable for dividends and interest
| 5,533,261 |
Receivable for investments sold
| 2,053,124 |
Receivable for Fund shares sold
| 434,075 |
Receivable for securities lending income, net
| 6,143 |
Prepaid expenses and other assets
| 208,350 |
Total assets
| 594,282,840 |
| Liabilities | |
Payable for investments purchased
| 6,362,050 |
Payable upon receipt of securities loaned
| 6,258,868 |
Payable for Fund shares redeemed
| 571,573 |
Written options at value (premiums received $191,822)
| 390,615 |
Cash collateral due to broker for forward foreign currency contracts
| 330,000 |
Payable for daily variation margin on open futures contracts
| 152,177 |
Management fee payable
| 141,932 |
Unrealized losses on forward foreign currency contracts
| 117,610 |
Administration fees payable
| 79,950 |
Distribution fee payable
| 58,540 |
Trustees’ fees and expenses payable
| 2,241 |
Payable for daily variation margin on centrally cleared swaps
| 1,233 |
Total liabilities
| 14,466,789 |
Total net assets
| $579,816,051 |
| Net assets consist of | |
Paid-in capital
| $ 581,244,095 |
Total distributable loss
| (1,428,044) |
Total net assets
| $579,816,051 |
| Computation of net asset value and offering price per share | |
Net assets – Class A
| $ 199,310,871 |
Shares outstanding – Class A1
| 32,725,922 |
Net asset value per share – Class A
| $6.09 |
Maximum offering price per share – Class A2
| $6.46 |
Net assets – Class C
| $ 91,953,443 |
Shares outstanding – Class C1
| 15,054,978 |
Net asset value per share – Class C
| $6.11 |
Net assets – Class R6
| $ 46,991,206 |
Shares outstanding – Class R61
| 7,920,943 |
Net asset value per share – Class R6
| $5.93 |
Net assets – Administrator Class
| $ 6,591,404 |
Shares outstanding – Administrator Class1
| 1,110,944 |
Net asset value per share – Administrator Class
| $5.93 |
Net assets – Institutional Class
| $ 234,969,127 |
Shares outstanding – Institutional Class1
| 39,644,782 |
Net asset value per share – Institutional Class
| $5.93 |
| 1 | The Fund has an unlimited number of authorized shares. |
| 2 | Maximum offering price is computed as 100/94.25 of net asset value. On investments of $50,000 or more, the offering price is reduced. |
The accompanying notes are an integral part of these financial statements.
36 | Allspring Diversified Income Builder Fund
Statement of operations—six months ended March 31, 2022 (unaudited)
| | |
| Investment income | |
Interest
| $ 10,136,465 |
Dividends (net of foreign withholdings taxes of $84,090)
| 2,432,122 |
Income from affiliated securities
| 51,138 |
Total investment income
| 12,619,725 |
| Expenses | |
Management fee
| 1,680,278 |
| Administration fees | |
Class A
| 223,087 |
Class C
| 104,286 |
Class R6
| 7,212 |
Administrator Class
| 4,725 |
Institutional Class
| 161,997 |
| Shareholder servicing fees | |
Class A
| 265,501 |
Class C
| 123,977 |
Administrator Class
| 9,080 |
| Distribution fee | |
Class C
| 371,892 |
Custody and accounting fees
| 95,722 |
Professional fees
| 35,036 |
Registration fees
| 51,576 |
Shareholder report expenses
| 55,154 |
Trustees’ fees and expenses
| 10,683 |
Other fees and expenses
| 43,887 |
Total expenses
| 3,244,093 |
| Less: Fee waivers and/or expense reimbursements | |
Fund-level
| (769,614) |
Class A
| (2,853) |
Class C
| (1) |
Net expenses
| 2,471,625 |
Net investment income
| 10,148,100 |
| Realized and unrealized gains (losses) on investments | |
| Net realized gains (losses) on | |
Unaffiliated securities
| 15,588,546 |
Forward foreign currency contracts
| 1,288,086 |
Futures contracts
| (4,364,481) |
Swap contracts
| 2,242 |
Written options
| 1,531,253 |
Net realized gains on investments
| 14,045,646 |
| Net change in unrealized gains (losses) on | |
Unaffiliated securities
| (44,463,750) |
Forward foreign currency contracts
| (440,377) |
Futures contracts
| (212,371) |
Swap contracts
| (18,756) |
Written options
| (574,321) |
Net change in unrealized gains (losses) on investments
| (45,709,575) |
Net realized and unrealized gains (losses) on investments
| (31,663,929) |
Net decrease in net assets resulting from operations
| $(21,515,829) |
The accompanying notes are an integral part of these financial statements.
Allspring Diversified Income Builder Fund | 37
Statement of changes in net assets
| | | | | |
| | Six months ended
March 31, 2022
(unaudited) | Year ended
September 30, 2021 |
| Operations | | | | |
Net investment income
| | $ 10,148,100 | | $ 19,765,462 |
Net realized gains on investments
| | 14,045,646 | | 36,160,565 |
Net change in unrealized gains (losses) on investments
| | (45,709,575) | | 14,695,015 |
Net increase (decrease) in net assets resulting from operations
| | (21,515,829) | | 70,621,042 |
| Distributions to shareholders from | | | | |
| Net investment income and net realized gains | | | | |
Class A
| | (3,774,697) | | (7,451,220) |
Class C
| | (1,379,752) | | (2,798,166) |
Class R6
| | (981,164) | | (1,729,358) |
Administrator Class
| | (135,725) | | (272,624) |
Institutional Class
| | (4,959,390) | | (9,569,614) |
Total distributions to shareholders
| | (11,230,728) | | (21,820,982) |
| Capital share transactions | Shares | | Shares | |
| Proceeds from shares sold | | | | |
Class A
| 1,620,963 | 10,340,068 | 4,560,332 | 28,679,644 |
Class C
| 803,205 | 5,115,109 | 1,868,621 | 11,899,641 |
Class R6
| 1,006,137 | 6,236,506 | 7,760,202 | 45,310,282 |
Administrator Class
| 68,240 | 424,523 | 163,088 | 1,005,985 |
Institutional Class
| 5,958,424 | 37,332,276 | 7,920,681 | 48,924,824 |
| | | 59,448,482 | | 135,820,376 |
| Reinvestment of distributions | | | | |
Class A
| 547,328 | 3,485,765 | 1,086,761 | 6,885,370 |
Class C
| 204,076 | 1,304,605 | 416,920 | 2,646,096 |
Class R6
| 158,297 | 980,152 | 278,581 | 1,727,553 |
Administrator Class
| 21,735 | 134,922 | 42,970 | 265,556 |
Institutional Class
| 652,031 | 4,039,677 | 1,264,016 | 7,800,727 |
| | | 9,945,121 | | 19,325,302 |
| Payment for shares redeemed | | | | |
Class A
| (3,472,352) | (22,095,301) | (7,496,998) | (47,424,829) |
Class C
| (2,089,654) | (13,334,934) | (5,575,628) | (35,097,983) |
Class R6
| (837,219) | (5,146,281) | (893,580) | (5,551,330) |
Administrator Class
| (174,476) | (1,066,490) | (365,519) | (2,247,556) |
Institutional Class
| (6,894,763) | (42,552,250) | (13,209,803) | (81,174,463) |
| | | (84,195,256) | | (171,496,161) |
Net decrease in net assets resulting from capital share transactions
| | (14,801,653) | | (16,350,483) |
Total increase (decrease) in net assets
| | (47,548,210) | | 32,449,577 |
| Net assets | | | | |
Beginning of period
| | 627,364,261 | | 594,914,684 |
End of period
| | $579,816,051 | | $ 627,364,261 |
The accompanying notes are an integral part of these financial statements.
38 | Allspring Diversified Income Builder Fund
Financial highlights
(For a share outstanding throughout each period)
| | | Year ended September 30 |
| Class A | Six months ended
March 31, 2022
(unaudited) | 2021 | 2020 | 2019 | 2018 | 2017 |
Net asset value, beginning of period
| $6.42 | $5.95 | $6.06 | $6.33 | $6.42 | $6.13 |
Net investment income
| 0.10 1 | 0.19 1 | 0.21 | 0.22 | 0.21 | 0.20 |
Net realized and unrealized gains (losses) on investments
| (0.32) | 0.49 | (0.12) | 0.02 | (0.01) | 0.35 |
Total from investment operations
| (0.22) | 0.68 | 0.09 | 0.24 | 0.20 | 0.55 |
| Distributions to shareholders from | | | | | | |
Net investment income
| (0.11) | (0.21) | (0.20) | (0.23) | (0.19) | (0.22) |
Net realized gains
| 0.00 | 0.00 | 0.00 | (0.28) | (0.10) | (0.04) |
Total distributions to shareholders
| (0.11) | (0.21) | (0.20) | (0.51) | (0.29) | (0.26) |
Net asset value, end of period
| $6.09 | $6.42 | $5.95 | $6.06 | $6.33 | $6.42 |
Total return2
| (3.44)% | 11.58% | 1.59% | 4.51% | 3.23% | 9.16% |
| Ratios to average net assets (annualized) | | | | | | |
Gross expenses
| 1.10% | 1.08% | 1.07% | 1.05% | 1.04% | 1.05% |
Net expenses
| 0.85% | 0.85% | 0.85% | 0.85% | 0.90% | 1.05% |
Net investment income
| 3.25% | 3.07% | 3.50% | 3.75% | 3.34% | 3.29% |
| Supplemental data | | | | | | |
Portfolio turnover rate
| 61% | 87% | 39% | 43% | 50% | 29% |
Net assets, end of period (000s omitted)
| $199,311 | $218,615 | $213,551 | $251,673 | $231,176 | $220,977 |
| 1 | Calculated based upon average shares outstanding |
| 2 | Total return calculations do not include any sales charges. Returns for periods of less than one year are not annualized. |
The accompanying notes are an integral part of these financial statements.
Allspring Diversified Income Builder Fund | 39
Financial highlights
(For a share outstanding throughout each period)
| | | Year ended September 30 |
| Class C | Six months ended
March 31, 2022
(unaudited) | 2021 | 2020 | 2019 | 2018 | 2017 |
Net asset value, beginning of period
| $6.44 | $5.97 | $6.07 | $6.34 | $6.44 | $6.14 |
Net investment income
| 0.08 | 0.15 | 0.17 | 0.18 | 0.17 | 0.16 |
Net realized and unrealized gains (losses) on investments
| (0.32) | 0.48 | (0.11) | 0.02 | (0.02) | 0.35 |
Total from investment operations
| (0.24) | 0.63 | 0.06 | 0.20 | 0.15 | 0.51 |
| Distributions to shareholders from | | | | | | |
Net investment income
| (0.09) | (0.16) | (0.16) | (0.19) | (0.15) | (0.17) |
Net realized gains
| 0.00 | 0.00 | 0.00 | (0.28) | (0.10) | (0.04) |
Total distributions to shareholders
| (0.09) | (0.16) | (0.16) | (0.47) | (0.25) | (0.21) |
Net asset value, end of period
| $6.11 | $6.44 | $5.97 | $6.07 | $6.34 | $6.44 |
Total return1
| (3.80)% | 10.70% | 0.98% | 3.71% | 2.32% | 8.51% |
| Ratios to average net assets (annualized) | | | | | | |
Gross expenses
| 1.85% | 1.83% | 1.82% | 1.80% | 1.79% | 1.80% |
Net expenses
| 1.60% | 1.60% | 1.60% | 1.60% | 1.65% | 1.80% |
Net investment income
| 2.49% | 2.31% | 2.75% | 2.99% | 2.59% | 2.54% |
| Supplemental data | | | | | | |
Portfolio turnover rate
| 61% | 87% | 39% | 43% | 50% | 29% |
Net assets, end of period (000s omitted)
| $91,953 | $103,956 | $115,929 | $140,722 | $166,750 | $165,513 |
| 1 | Total return calculations do not include any sales charges. Returns for periods of less than one year are not annualized. |
The accompanying notes are an integral part of these financial statements.
40 | Allspring Diversified Income Builder Fund
Financial highlights
(For a share outstanding throughout each period)
| | | Year ended September 30 |
| Class R6 | Six months ended
March 31, 2022
(unaudited) | 2021 | 2020 | 2019 | 2018 1 |
Net asset value, beginning of period
| $6.26 | $5.81 | $5.91 | $6.18 | $6.17 |
Net investment income
| 0.11 | 0.23 | 0.22 | 0.24 2 | 0.02 2 |
Net realized and unrealized gains (losses) on investments
| (0.31) | 0.46 | (0.09) | 0.03 | 0.02 |
Total from investment operations
| (0.20) | 0.69 | 0.13 | 0.27 | 0.04 |
| Distributions to shareholders from | | | | | |
Net investment income
| (0.13) | (0.24) | (0.23) | (0.26) | (0.03) |
Net realized gains
| 0.00 | 0.00 | 0.00 | (0.28) | 0.00 |
Total distributions to shareholders
| (0.13) | (0.24) | (0.23) | (0.54) | (0.03) |
Net asset value, end of period
| $5.93 | $6.26 | $5.81 | $5.91 | $6.18 |
Total return3
| (3.32)% | 11.99% | 2.25% | 5.07% | 0.71% |
| Ratios to average net assets (annualized) | | | | | |
Gross expenses
| 0.67% | 0.65% | 0.64% | 0.61% | 0.64% |
Net expenses
| 0.42% | 0.42% | 0.42% | 0.42% | 0.41% |
Net investment income
| 3.68% | 3.52% | 3.89% | 4.17% | 2.31% |
| Supplemental data | | | | | |
Portfolio turnover rate
| 61% | 87% | 39% | 43% | 50% |
Net assets, end of period (000s omitted)
| $46,991 | $47,544 | $2,605 | $24 | $25 |
| 1 | For the period from July 31, 2018 (commencement of class operations) to September 30, 2018 |
| 2 | Calculated based upon average shares outstanding |
| 3 | Returns for periods of less than one year are not annualized. |
The accompanying notes are an integral part of these financial statements.
Allspring Diversified Income Builder Fund | 41
Financial highlights
(For a share outstanding throughout each period)
| | | Year ended September 30 |
| Administrator Class | Six months ended
March 31, 2022
(unaudited) | 2021 | 2020 | 2019 | 2018 | 2017 |
Net asset value, beginning of period
| $6.26 | $5.81 | $5.91 | $6.19 | $6.29 | $6.00 |
Net investment income
| 0.10 1 | 0.19 1 | 0.21 1 | 0.22 1 | 0.21 1 | 0.21 1 |
Net realized and unrealized gains (losses) on investments
| (0.31) | 0.48 | (0.10) | 0.02 | (0.01) | 0.34 |
Total from investment operations
| (0.21) | 0.67 | 0.11 | 0.24 | 0.20 | 0.55 |
| Distributions to shareholders from | | | | | | |
Net investment income
| (0.12) | (0.22) | (0.21) | (0.24) | (0.20) | (0.22) |
Net realized gains
| 0.00 | 0.00 | 0.00 | (0.28) | (0.10) | (0.04) |
Total distributions to shareholders
| (0.12) | (0.22) | (0.21) | (0.52) | (0.30) | (0.26) |
Net asset value, end of period
| $5.93 | $6.26 | $5.81 | $5.91 | $6.19 | $6.29 |
Total return2
| (3.49)% | 11.61% | 1.89% | 4.52% | 3.21% | 9.45% |
| Ratios to average net assets (annualized) | | | | | | |
Gross expenses
| 1.02% | 1.00% | 0.99% | 0.97% | 0.96% | 0.97% |
Net expenses
| 0.77% | 0.77% | 0.77% | 0.77% | 0.81% | 0.90% |
Net investment income
| 3.32% | 3.15% | 3.57% | 3.77% | 3.40% | 3.51% |
| Supplemental data | | | | | | |
Portfolio turnover rate
| 61% | 87% | 39% | 43% | 50% | 29% |
Net assets, end of period (000s omitted)
| $6,591 | $7,486 | $7,868 | $11,916 | $32,938 | $41,975 |
| 1 | Calculated based upon average shares outstanding |
| 2 | Returns for periods of less than one year are not annualized. |
The accompanying notes are an integral part of these financial statements.
42 | Allspring Diversified Income Builder Fund
Financial highlights
(For a share outstanding throughout each period)
| | | Year ended September 30 |
| Institutional Class | Six months ended
March 31, 2022
(unaudited) | 2021 | 2020 | 2019 | 2018 | 2017 |
Net asset value, beginning of period
| $6.26 | $5.80 | $5.91 | $6.19 | $6.28 | $6.00 |
Net investment income
| 0.11 | 0.21 | 0.22 1 | 0.24 | 0.23 | 0.24 |
Net realized and unrealized gains (losses) on investments
| (0.32) | 0.48 | (0.11) | 0.01 | (0.01) | 0.31 |
Total from investment operations
| (0.21) | 0.69 | 0.11 | 0.25 | 0.22 | 0.55 |
| Distributions to shareholders from | | | | | | |
Net investment income
| (0.12) | (0.23) | (0.22) | (0.25) | (0.21) | (0.23) |
Net realized gains
| 0.00 | 0.00 | 0.00 | (0.28) | (0.10) | (0.04) |
Total distributions to shareholders
| (0.12) | (0.23) | (0.22) | (0.53) | (0.31) | (0.27) |
Net asset value, end of period
| $5.93 | $6.26 | $5.80 | $5.91 | $6.19 | $6.28 |
Total return2
| (3.37)% | 12.08% | 1.98% | 4.80% | 3.62% | 9.49% |
| Ratios to average net assets (annualized) | | | | | | |
Gross expenses
| 0.77% | 0.75% | 0.74% | 0.72% | 0.71% | 0.72% |
Net expenses
| 0.52% | 0.52% | 0.52% | 0.52% | 0.57% | 0.71% |
Net investment income
| 3.58% | 3.40% | 3.83% | 4.07% | 3.67% | 3.60% |
| Supplemental data | | | | | | |
Portfolio turnover rate
| 61% | 87% | 39% | 43% | 50% | 29% |
Net assets, end of period (000s omitted)
| $234,969 | $249,764 | $254,963 | $312,093 | $335,589 | $315,413 |
| 1 | Calculated based upon average shares outstanding |
| 2 | Returns for periods of less than one year are not annualized. |
The accompanying notes are an integral part of these financial statements.
Allspring Diversified Income Builder Fund | 43
Notes to financial statements (unaudited)
1. ORGANIZATION
Allspring Funds Trust (the "Trust"), a Delaware statutory trust organized on March 10, 1999, is an open-end management investment company registered under the Investment Company Act of 1940, as amended (the "1940 Act"). As an investment company, the Trust follows the accounting and reporting guidance in Financial Accounting Standards Board ("FASB") Accounting Standards Codification Topic 946, Financial Services – Investment Companies. These financial statements report on the Allspring Diversified Income Builder Fund (the "Fund") which is a diversified series of the Trust.
Effective on November 1, 2021, the sale transaction of Wells Fargo Asset Management ("WFAM") by Wells Fargo & Company to GTCR LLC and Reverence Capital Partners, L.P. was closed. In connection with the closing of the transaction, WFAM became known as Allspring Global Investments (“Allspring”) and various entities that provided services to the Fund changed their names to "Allspring", including Allspring Funds Management, LLC, the investment manager to the Fund, Allspring Global Investments, LLC and Allspring Global Investments (UK) Limited, both registered investment advisers providing subadvisory services to certain funds, and Allspring Funds Distributor, LLC, the Fund's principal underwriter. Consummation of the transaction resulted in a new investment management agreement and subadvisory agreement which became effective on November 1, 2021.
2. SIGNIFICANT ACCOUNTING POLICIES
The following significant accounting policies, which are consistently followed in the preparation of the financial statements of the Fund, are in conformity with U.S. generally accepted accounting principles which require management to make estimates and assumptions that affect the reported amounts of assets and liabilities, disclosure of contingent assets and liabilities at the date of the financial statements, and the reported amounts of income and expenses during the reporting period. Actual results could differ from those estimates.
Securities valuation
All investments are valued each business day as of the close of regular trading on the New York Stock Exchange (generally 4 p.m. Eastern Time), although the Fund may deviate from this calculation time under unusual or unexpected circumstances.
Debt securities are valued at the evaluated bid price provided by an independent pricing service (e.g. taking into account various factors, including yields, maturities, or credit ratings) or, if a reliable price is not available, the quoted bid price from an independent broker-dealer.
Equity securities and futures contracts that are listed on a foreign or domestic exchange or market are valued at the official closing price or, if none, the last sales price. If no sale occurs on the principal exchange or market that day, a fair value price will be determined in accordance with the Fund’s Valuation Procedures.
The values of securities denominated in foreign currencies are translated into U.S. dollars at rates provided by an independent foreign currency pricing source at a time each business day specified by the Allspring Global Investments Pricing Committee at Allspring Funds Management, LLC ("Allspring Funds Management").
Many securities markets and exchanges outside the U.S. close prior to the close of the New York Stock Exchange and therefore may not fully reflect trading or events that occur after the close of the principal exchange in which the foreign securities are traded, but before the close of the New York Stock Exchange. If such trading or events are expected to materially affect the value of such securities, then fair value pricing procedures approved by the Board of Trustees of the Fund are applied. These procedures take into account multiple factors including movements in U.S. securities markets after foreign exchanges close. Foreign securities that are fair valued under these procedures are categorized as Level 2 and the application of these procedures may result in transfers between Level 1 and Level 2. Depending on market activity, such fair valuations may be frequent. Such fair value pricing may result in net asset values that are higher or lower than net asset values based on the last reported sales price or latest quoted bid price. On March 31, 2022, such fair value pricing was used in pricing certain foreign securities.
Forward foreign currency contracts are recorded at the forward rate provided by an independent foreign currency pricing source at a time each business day specified by the Allspring Global Investments Pricing Committee.
Options that are listed on a foreign or domestic exchange or market are valued at the closing mid-price. Non-listed options and swap contracts are valued at the evaluated price provided by an independent pricing service or, if a reliable price is not available, the quoted bid price from an independent broker-dealer.
Swap contracts are valued at the evaluated price provided by an independent pricing service or, if a reliable price is not available, the quoted bid price from an independent broker-dealer.
44 | Allspring Diversified Income Builder Fund
Notes to financial statements (unaudited)
Investments in registered open-end investment companies are valued at net asset value. Interests in non-registered investment companies that are redeemable at net asset value are fair valued normally at net asset value.
Investments which are not valued using any of the methods discussed above are valued at their fair value, as determined in good faith by the Board of Trustees. The Board of Trustees has established a Valuation Committee comprised of the Trustees and has delegated to it the authority to take any actions regarding the valuation of portfolio securities that the Valuation Committee deems necessary or appropriate, including determining the fair value of portfolio securities, unless the determination has been delegated to the Allspring Global Investments Pricing Committee. The Board of Trustees retains the authority to make or ratify any valuation decisions or approve any changes to the Valuation Procedures as it deems appropriate. On a quarterly basis, the Board of Trustees receives reports on any valuation actions taken by the Valuation Committee or the Allspring Global Investments Pricing Committee which may include items for ratification.
Foreign currency translation
The accounting records of the Fund are maintained in U.S. dollars. The values of other assets and liabilities denominated in foreign currencies are translated into U.S. dollars at rates provided by an independent foreign currency pricing source at a time each business day specified by the Allspring Global Investments Pricing Committee. Purchases and sales of securities, and income and expenses are converted at the rate of exchange on the respective dates of such transactions. Net realized foreign exchange gains or losses arise from sales of foreign currencies, currency gains or losses realized between the trade and settlement dates on securities transactions, and the difference between the amounts of dividends, interest and foreign withholding taxes recorded and the U.S. dollar equivalent of the amounts actually paid or received. Net unrealized foreign exchange gains and losses arise from changes in the fair value of assets and liabilities other than investments in securities resulting from changes in exchange rates. The changes in net assets arising from changes in exchange rates of securities and the changes in net assets resulting from changes in market prices of securities are not separately presented. Such changes are included in net realized and unrealized gains or losses from investments.
Securities lending
The Fund may lend its securities from time to time in order to earn additional income in the form of fees or interest on securities received as collateral or the investment of any cash received as collateral. When securities are on loan, the Fund receives interest or dividends on those securities. Cash collateral received in connection with its securities lending transactions is invested in Securities Lending Cash Investments, LLC (the "Securities Lending Fund"), an affiliated non-registered investment company. Investments in Securities Lending Fund are valued at the evaluated bid price provided by an independent pricing service. Income earned from investment in the Securities Lending Fund (net of fees and rebates), if any, is included in income from affiliated securities on the Statement of Operations.
In a securities lending transaction, the net asset value of the Fund is affected by an increase or decrease in the value of the securities loaned and by an increase or decrease in the value of the instrument in which collateral is invested. The amount of securities lending activity undertaken by the Fund fluctuates from time to time. The Fund has the right under the lending agreement to recover the securities from the borrower on demand. In the event of default or bankruptcy by the borrower, the Fund may be prevented from recovering the loaned securities or gaining access to the collateral or may experience delays or costs in doing so. In such an event, the terms of the agreement allow the unaffiliated securities lending agent to use the collateral to purchase replacement securities on behalf of the Fund or pay the Fund the market value of the loaned securities. The Fund bears the risk of loss with respect to depreciation of its investment of the cash collateral.
When-issued transactions
The Fund may purchase securities on a forward commitment or when-issued basis. The Fund records a when-issued transaction on the trade date and will segregate assets in an amount at least equal in value to the Fund's commitment to purchase when-issued securities. Securities purchased on a when-issued basis are marked-to-market daily and the Fund begins earning interest on the settlement date. Losses may arise due to changes in the market value of the underlying securities or if the counterparty does not perform under the contract.
Loans
The Fund may invest in direct debt instruments which are interests in amounts owed to lenders by corporate or other borrowers. The loans pay interest at rates which are periodically reset by reference to a base lending rate plus a spread. Investments in loans may be in the form of participations in loans or assignments of all or a portion of loans from third parties. When the Fund purchases participations, it generally has no rights to enforce compliance with the terms of the loan agreement with the borrower. As a result, the Fund assumes the credit risk of both the borrower and the lender that is selling the participation. When the Fund purchases assignments from lenders, it acquires direct rights against the borrower on the loan
Allspring Diversified Income Builder Fund | 45
Notes to financial statements (unaudited)
and may enforce compliance by the borrower with the terms of the loan agreement. Loans may include fully funded term loans or unfunded loan commitments, which are contractual obligations for future funding.
Forward foreign currency contracts
A forward foreign currency contract is an agreement between two parties to purchase or sell a specific currency for an agreed-upon price at a future date. The Fund enters into forward foreign currency contracts to facilitate transactions in foreign-denominated securities and to attempt to minimize the risk to the Fund from adverse changes in the relationship between currencies. Forward foreign currency contracts are recorded at the forward rate and marked-to-market daily. When the contracts are closed, realized gains and losses arising from such transactions are recorded as realized gains or losses on forward foreign currency contracts. The Fund is subject to foreign currency risk and may be exposed to risks if the counterparties to the contracts are unable to meet the terms of their contracts or if the value of the foreign currency changes unfavorably. The Fund's maximum risk of loss from counterparty credit risk is the unrealized gains on the contracts. This risk may be mitigated if there is a master netting arrangement between the Fund and the counterparty.
Futures contracts
Futures contracts are agreements between the Fund and a counterparty to buy or sell a specific amount of a commodity, financial instrument or currency at a specified price on a specified date. The Fund may buy and sell futures contracts in order to gain exposure to, or protect against, changes in interest rates, security values and foreign exchange rates and is subject to interest rate risk, equity price risk and foreign currency risk. The primary risks associated with the use of futures contracts are the imperfect correlation between changes in market values of securities held by the Fund and the prices of futures contracts, and the possibility of an illiquid market. Futures contracts are generally entered into on a regulated futures exchange and cleared through a clearinghouse associated with the exchange. With futures contracts, there is minimal counterparty risk to the Fund since futures contracts are exchange traded and the exchange’s clearinghouse, as the counterparty to all exchange traded futures, guarantees the futures contracts against default.
Upon entering into a futures contract, the Fund is required to deposit either cash or securities (initial margin) with the broker in an amount equal to a certain percentage of the contract value. Subsequent payments (variation margin) are paid to or from the broker each day equal to the daily changes in the contract value. Such payments are recorded as unrealized gains or losses and, if any, shown as variation margin receivable (payable) in the Statement of Assets and Liabilities. Should the Fund fail to make requested variation margin payments, the broker can gain access to the initial margin to satisfy the Fund’s payment obligations. When the contracts are closed, a realized gain or loss is recorded in the Statement of Operations.
Options
The Fund may write covered call options or secured put options on individual securities and/or indexes. When the Fund writes an option, an amount equal to the premium received is recorded as a liability and is subsequently adjusted to the current market value of the written option. Premiums received from written options that expire unexercised are recognized as realized gains on the expiration date. For exercised options, the difference between the premium received and the amount paid on effecting a closing purchase transaction, including brokerage commissions, is treated as a realized gain or loss. If a call option is exercised, the premium is added to the proceeds from the sale of the underlying security in calculating the realized gain or loss on the sale. If a put option is exercised, the premium reduces the cost of the security purchased. The Fund, as a writer of an option, bears the market risk of an unfavorable change in the price of the security and/or index underlying the written option.
The Fund may also purchase call or put options. Premiums paid are included in the Statement of Assets and Liabilities as investments, the values of which are subsequently adjusted based on the current market values of the options. Premiums paid for purchased options that expire are recognized as realized losses on the expiration date. Premiums paid for purchased options that are exercised or closed are added to the amount paid or offset against the proceeds received for the underlying security to determine the realized gain or loss. The risk of loss associated with purchased options is limited to the premium paid.
Options traded on an exchange are regulated and terms of the options are standardized. The Fund is subject to equity price risk. Purchased options traded over-the-counter expose the Fund to counterparty risk in the event the counterparty does not perform. This risk can be mitigated by having a master netting arrangement between the Fund and the counterparty and by having the counterparty post collateral to cover the Fund’s exposure to the counterparty.
Swap contracts
Swap contracts are agreements between the Fund and a counterparty to exchange a series of cash flows over a specified period. Swap agreements are privately negotiated contracts between the Fund that are entered into as bilateral contracts in the over-the-counter market or centrally cleared (“centrally cleared swaps”) with a central clearinghouse.
46 | Allspring Diversified Income Builder Fund
Notes to financial statements (unaudited)
The Fund entered into centrally cleared swaps. In a centrally cleared swap, immediately following execution of the swap contract, the swap contract is novated to a central counterparty (the “CCP”) and the Fund’s counterparty on the swap agreement becomes the CCP. Upon entering into a centrally cleared swap, the Fund is required to deposit an initial margin with the broker in the form of cash or securities. Securities deposited as initial margin are designated in the Portfolio of Investments and cash deposited is shown as cash segregated for centrally cleared swaps in the Statement of Assets and Liabilities. Pursuant to the contract, the Fund agrees to receive from or pay to the broker an amount of cash equal to the daily fluctuation in market value of the contract (“variation margin”). The variation margin is recorded as an unrealized gain (or loss) and shown as daily variation margin receivable (or payable) on centrally cleared swaps in the Statement of Assets and Liabilities. Payments received from (paid to) the counterparty are recorded as realized gains (losses) in the Statement of Operations when the contract is closed.
Credit default swaps
The Fund may enter into credit default swaps for hedging or speculative purposes to provide or receive a measure of protection against default on a referenced entity, obligation or index or a basket of single-name issuers or traded indexes. An index credit default swap references all the names in the index, and if a credit event is triggered, the credit event is settled based on that name’s weight in the index. Credit default swaps are agreements in which the protection buyer pays fixed periodic payments to the protection seller in consideration for a promise from the protection seller to make a specific payment should a negative credit event take place with respect to the referenced entity (e.g., bankruptcy, failure to pay, obligation acceleration, repudiation, moratorium or restructuring).
The Fund may enter into credit default swaps as either the seller of protection or the buyer of protection. If the Fund is the buyer of protection and a credit event occurs, the Fund will either receive from the seller an amount equal to the notional amount of the swap and deliver the referenced security or underlying securities comprising the index, or receive a net settlement of cash equal to the notional amount of the swap less the recovery value of the security or underlying securities comprising the index. If the Fund is the seller of protection and a credit event occurs, the Fund will either pay the buyer an amount equal to the notional amount of the swap and take delivery of the referenced security or underlying securities comprising the index or pay a net settlement of cash equal to the notional amount of the swap less the recovery value of the security or underlying securities comprising the index.
As the seller of protection, the Fund is subject to investment exposure on the notional amount of the swap and has assumed the risk of default of the underlying security or index. As the buyer of protection, the Fund could be exposed to risks if the seller of the protection defaults on its obligation to perform, or if there are unfavorable changes in the fluctuation of interest rates.
By entering into credit default swap contracts, the Fund is exposed to credit risk. In addition, certain credit default swap contracts entered into by the Fund provide for conditions that result in events of default or termination that enable the counterparty to the agreement to cause an early termination of the transactions under those agreements.
Security transactions and income recognition
Securities transactions are recorded on a trade date basis. Realized gains or losses are recorded on the basis of identified cost.
Interest income is accrued daily and bond discounts are accreted and premiums are amortized daily. To the extent debt obligations are placed on non-accrual status, any related interest income may be reduced by writing off interest receivables when the collection of all or a portion of interest has been determined to be doubtful based on consistently applied procedures and the fair value has decreased. If the issuer subsequently resumes interest payments or when the collectability of interest is reasonably assured, the debt obligation is removed from non-accrual status. Paydown gains and losses are included in interest income.
Dividend income is recognized on the ex-dividend date, except for certain dividends from foreign securities, which are recorded as soon as the custodian verifies the ex-dividend date.
Income is recorded net of foreign taxes withheld where recovery of such taxes is not assured.
Income dividends and capital gain distributions from investment companies are recorded on the ex-dividend date. Capital gain distributions from investment companies are treated as realized gains.
Distributions to shareholders
Distributions to shareholders are recorded on the ex-dividend date and paid from net investment income monthly and any net realized gains are paid at least annually. Such distributions are determined in accordance with income tax regulations and may differ from U.S. generally accepted accounting principles. Dividend sources are estimated at the time of declaration. The tax
Allspring Diversified Income Builder Fund | 47
Notes to financial statements (unaudited)
character of distributions is determined as of the Fund's fiscal year end. Therefore, a portion of the Fund's distributions made prior to the Fund’s fiscal year end may be categorized as a tax return of capital at year end.
Federal and other taxes
The Fund intends to continue to qualify as a regulated investment company by distributing substantially all of its investment company taxable income and any net realized capital gains (after reduction for capital loss carryforwards) sufficient to relieve it from all, or substantially all, federal income taxes. Accordingly, no provision for federal income taxes was required.
The Fund’s income and federal excise tax returns and all financial records supporting those returns for the prior three fiscal years are subject to examination by the federal and Delaware revenue authorities. Management has analyzed the Fund's tax positions taken on federal, state, and foreign tax returns for all open tax years and does not believe that there are any uncertain tax positions that require recognition of a tax liability.
As of March 31, 2022, the aggregate cost of all investments for federal income tax purposes was $583,074,260 and the unrealized gains (losses) consisted of:
| Gross unrealized gains | $ 27,619,982 |
| Gross unrealized losses | (28,769,471) |
| Net unrealized losses | $ (1,149,489) |
As of September 30, 2021, the Fund had capital losses carryforwards which consisted of $3,968,766 in short-term capital losses and $11,130,394 in long-term capital losses.
Class allocations
The separate classes of shares offered by the Fund differ principally in applicable sales charges, distribution, shareholder servicing, and administration fees. Class specific expenses are charged directly to that share class. Investment income, common fund-level expenses, and realized and unrealized gains (losses) on investments are allocated daily to each class of shares based on the relative proportion of net assets of each class.
3. FAIR VALUATION MEASUREMENTS
Fair value measurements of investments are determined within a framework that has established a fair value hierarchy based upon the various data inputs utilized in determining the value of the Fund’s investments. The three-level hierarchy gives the highest priority to unadjusted quoted prices in active markets for identical assets or liabilities (Level 1) and the lowest priority to unobservable inputs (Level 3). The Fund’s investments are classified within the fair value hierarchy based on the lowest level of input that is significant to the fair value measurement. The inputs are summarized into three broad levels as follows:
| ■ | Level 1 – quoted prices in active markets for identical securities |
| ■ | Level 2 – other significant observable inputs (including quoted prices for similar securities, interest rates, prepayment speeds, credit risk, etc.) |
| ■ | Level 3 – significant unobservable inputs (including the Fund’s own assumptions in determining the fair value of investments) |
The inputs or methodologies used for valuing investments in securities are not necessarily an indication of the risk associated with investing in those securities.
48 | Allspring Diversified Income Builder Fund
Notes to financial statements (unaudited)
The following is a summary of the inputs used in valuing the Fund’s assets and liabilities as of March 31, 2022:
| | Quoted prices
(Level 1) | Other significant
observable inputs
(Level 2) | Significant
unobservable inputs
(Level 3) | Total |
| Assets | | | | |
| Investments in: | | | | |
| Asset-backed securities | $ 0 | $ 19,534,508 | $ 3,000,000 | $ 22,534,508 |
| Common stocks | | | | |
| Communication services | 13,773,162 | 6,642,265 | 0 | 20,415,427 |
| Consumer discretionary | 17,721,936 | 4,615,541 | 0 | 22,337,477 |
| Consumer staples | 1,965,840 | 2,205,458 | 0 | 4,171,298 |
| Energy | 3,538,778 | 2,486,996 | 0 | 6,025,774 |
| Financials | 13,824,524 | 10,889,511 | 0 | 24,714,035 |
| Health care | 16,885,372 | 2,425,221 | 0 | 19,310,593 |
| Industrials | 6,927,826 | 5,430,010 | 0 | 12,357,836 |
| Information technology | 49,221,261 | 6,035,566 | 0 | 55,256,827 |
| Materials | 2,810,467 | 1,117,421 | 0 | 3,927,888 |
| Real estate | 2,607,350 | 386,856 | 0 | 2,994,206 |
| Utilities | 1,149,726 | 1,886,361 | 0 | 3,036,087 |
| Corporate bonds and notes | 0 | 217,980,398 | 0 | 217,980,398 |
| Foreign corporate bonds and notes | 0 | 15,231,019 | 0 | 15,231,019 |
| Loans | 0 | 15,923,899 | 1,415,096 | 17,338,995 |
| Municipal obligations | 0 | 17,056,830 | 0 | 17,056,830 |
| Non-agency mortgage-backed securities | 0 | 33,869,907 | 0 | 33,869,907 |
| Preferred stocks | | | | |
| Energy | 69,900 | 0 | 0 | 69,900 |
| Financials | 118,088 | 0 | 0 | 118,088 |
| Information technology | 0 | 333,380 | 0 | 333,380 |
| Materials | 0 | 103,178 | 0 | 103,178 |
| Yankee corporate bonds and notes | 0 | 59,325,144 | 0 | 59,325,144 |
| Short-term investments | | | | |
| Investment companies | 23,873,279 | 0 | 0 | 23,873,279 |
| | 154,487,509 | 423,479,469 | 4,415,096 | 582,382,074 |
| Futures contracts | 1,510,399 | 0 | 0 | 1,510,399 |
| Total assets | $155,997,908 | $423,479,469 | $4,415,096 | $583,892,473 |
| Liabilities | | | | |
| Forward foreign currency contracts | $ 0 | $ 117,610 | $ 0 | $ 117,610 |
| Futures contracts | 1,455,547 | 0 | 0 | 1,455,547 |
| Swap contracts | 0 | 3,930 | 0 | 3,930 |
| Written options | 120,290 | 270,325 | 0 | 390,615 |
| Total liabilities | $ 1,575,837 | $ 391,865 | $ 0 | $ 1,967,702 |
Futures contracts, forward foreign currency contracts and swap contracts are reported at their cumulative unrealized gains (losses) at measurement date as reported in the tables following the Portfolio of Investments. For futures contracts and centrally cleared swap contracts, the current day’s variation margin is reported on the Statement of Assets and Liabilities. All other assets and liabilities are reported at their market value at measurement date.
Additional sector, industry or geographic detail, if any, is included in the Portfolio of Investments.
For the six months ended March 31, 2022, the Fund had no material transfers into/out of Level 3.
Allspring Diversified Income Builder Fund | 49
Notes to financial statements (unaudited)
4. TRANSACTIONS WITH AFFILIATES
Management fee
Allspring Funds Management, a wholly owned subsidiary of Allspring Global Investments Holdings, LLC, a holding company indirectly owned by certain private funds of GTCR LLC and Reverence Capital Partners, L.P., is the manager of the Fund and provides advisory and fund-level administrative services under an investment management agreement. Under the investment management agreement, Allspring Funds Management is responsible for, among other services, implementing the investment objectives and strategies of the Fund, supervising the subadviser and providing fund-level administrative services in connection with the Fund’s operations. As compensation for its services under the investment management agreement, Allspring Funds Management is entitled to receive a management fee at the following annual rate based on the Fund’s average daily net assets:
| Average daily net assets | Management fee |
| First $500 million | 0.550% |
| Next $500 million | 0.525 |
| Next $2 billion | 0.500 |
| Next $2 billion | 0.475 |
| Next $5 billion | 0.440 |
| Over $10 billion | 0.430 |
For the six months ended March 31, 2022, the management fee was equivalent to an annual rate of 0.55% of the Fund’s average daily net assets.
Allspring Funds Management has retained the services of a subadviser to provide daily portfolio management to the Fund. The fee for subadvisory services is borne by Allspring Funds Management. Allspring Global Investments, LLC ("Allspring Investments"), an affiliate of Allspring Funds Management and a wholly owned subsidiary of Allspring Global Investments Holdings, LLC, is the subadviser to the Fund and is entitled to receive a fee from Allspring Funds Management at an annual rate starting at 0.35% and declining to 0.20% as the average daily net assets of the Fund increase.
Administration fees
Under a class-level administration agreement, Allspring Funds Management provides class-level administrative services to the Fund, which includes paying fees and expenses for services provided by the transfer agent, sub-transfer agents, omnibus account servicers and record-keepers. As compensation for its services under the class-level administration agreement, Allspring Funds Management receives an annual fee which is calculated based on the average daily net assets of each class as follows:
| | Class-level
administration fee |
| Class A | 0.21% |
| Class C | 0.21 |
| Class R6 | 0.03 |
| Administrator Class | 0.13 |
| Institutional Class | 0.13 |
Waivers and/or expense reimbursements
Allspring Funds Management has contractually committed to waive and/or reimburse management and administration fees to the extent necessary to maintain certain net operating expense ratios for the Fund. When each class of the Fund has exceeded its expense cap, Allspring Funds Management will waive fees and/or reimburse expenses from fund-level expenses on a proportionate basis and then from class specific expenses. When only certain classes exceed their expense caps, waivers and/or reimbursements are applied against class specific expenses before fund-level expenses. Allspring Funds Management has contractually committed through January 31, 2023 to waive fees and/or reimburse expenses to the extent necessary to cap expenses. Prior to or after the commitment expiration date, the caps may be increased or the commitment to maintain the
50 | Allspring Diversified Income Builder Fund
Notes to financial statements (unaudited)
caps may be terminated only with the approval of the Board of Trustees. As of March 31, 2022, the contractual expense caps are as follows:
| | Expense ratio caps |
| Class A | 0.85% |
| Class C | 1.60 |
| Class R6 | 0.42 |
| Administrator Class | 0.77 |
| Institutional Class | 0.52 |
Distribution fee
The Trust has adopted a distribution plan for Class C shares of the Fund pursuant to Rule 12b-1 under the 1940 Act. A distribution fee is charged to Class C shares and paid to Allspring Funds Distributor, LLC ("Allspring Funds Distributor"), the principal underwriter, an affiliate of Allspring Funds Management, at an annual rate of 0.75% of the average daily net assets of Class C shares.
In addition, Allspring Funds Distributor is entitled to receive the front-end sales charge from the purchase of Class A shares and a contingent deferred sales charge on the redemption of certain Class A shares. Allspring Funds Distributor is also entitled to receive the contingent deferred sales charges from redemptions of Class C shares. For the six months ended March 31, 2022, Allspring Funds Distributor received $3,831 from the sale of Class A shares and $250 in contingent deferred sales charges from redemptions of Class C shares. No contingent deferred sales charges were incurred by Class A shares for the six months ended March 31, 2022.
Shareholder servicing fees
The Trust has entered into contracts with one or more shareholder servicing agents, whereby Class A, Class C and Administrator Class of the Fund are charged a fee at an annual rate of 0.25% of the average daily net assets of each respective class. A portion of these total shareholder servicing fees were paid to affiliates, and to certain entities that were affiliates of the Fund until November 1, 2021.
Interfund transactions
The Fund may purchase or sell portfolio investment securities to certain affiliates pursuant to Rule 17a-7 under the 1940 Act and under procedures adopted by the Board of Trustees. The procedures have been designed to ensure that these interfund transactions, which do not incur broker commissions, are effected at current market prices. Pursuant to these procedures, the Fund had $0, $17,134,781 and $(1,558,729) in interfund purchases, sales and net realized gains (losses), respectively, during the six months ended March 31, 2022.
5. INVESTMENT PORTFOLIO TRANSACTIONS
Purchases and sales of investments, excluding U.S. government obligations (if any) and short-term securities, for the six months ended March 31, 2022 were $355,720,422 and $359,964,414, respectively.
As of March 31, 2022, the Fund had an unfunded loan commitment of $3,532,895 .
6. SECURITIES LENDING TRANSACTIONS
The Fund lends its securities through an unaffiliated securities lending agent and receives collateral in the form of cash or securities with a value at least equal to the value of the securities on loan. The value of the loaned securities is determined at the close of each business day and any increases or decreases in the required collateral are exchanged between the Fund and the counterparty on the next business day. Cash collateral received is invested in the Securities Lending Fund which seeks to provide a positive return compared to the daily Federal Funds Open Rate by investing in high-quality, U.S. dollar-denominated short-term money market instruments and is exempt from registration under Section 3(c)(7) of the 1940 Act. Securities Lending Fund is managed by Allspring Funds Management and is subadvised by Allspring Investments. Allspring Funds Management receives an advisory fee starting at 0.05% and declining to 0.01% as the average daily net assets of the Securities Lending Fund increase. All of the fees received by Allspring Funds Management are paid to Allspring Investments for its services as subadviser.
Allspring Diversified Income Builder Fund | 51
Notes to financial statements (unaudited)
In the event of counterparty default or the failure of a borrower to return a loaned security, the Fund has the right to use the collateral to offset any losses incurred. As of March 31, 2022, the Fund had securities lending transactions with the following counterparties which are subject to offset:
| Counterparty | Value of
securities on
loan | Collateral
received1 | Net amount |
| Barclays Capital Incorporated | $2,697,573 | $(2,697,573) | $0 |
| BNP Paribas Securities Corporation | 1,613,494 | (1,613,494) | 0 |
| Credit Suisse Securities (USA) LLC | 1,493,884 | (1,493,884) | 0 |
| UBS Securities LLC | 330,765 | (330,765) | 0 |
1 Collateral received within this table is limited to the collateral for the net transaction with the counterparty.
7. DERIVATIVE TRANSACTIONS
During the six months ended March 31, 2022, the Fund entered into futures contracts for economic hedging purposes.. The Fund also entered into forward foreign currency contracts for economic hedging purposes and entered into credit default swap contracts for hedging or cash management purposes.
The volume of the Fund's derivative activity during the six months ended March 31, 2022 was as follows:
| Options | |
| Average number of contracts written | 10,290 |
| Futures contracts | |
| Average notional balance on long futures | $74,104,780 |
| Average notional balance on short futures | 42,855,686 |
| Forward foreign currency contracts | |
| Average contract amounts to buy | $ 2,552,652 |
| Average contract amounts to sell | 19,470,785 |
| Swap contracts | |
| Average notional balance | $ 1,000,000 |
The Fund's swap transactions may contain provisions for early termination in the event the net assets of the Fund declines below specific levels identified by the counterparty. If these levels are triggered, the counterparty may terminate the transaction and seek payment or request full collateralization of the derivative transactions in net liability positions.
A summary of the location of derivative instruments on the financial statements by primary risk exposure is outlined in the following tables.
52 | Allspring Diversified Income Builder Fund
Notes to financial statements (unaudited)
The fair value of derivative instruments as of March 31, 2022 by primary risk type was as follows for the Fund:
| | Asset derivatives | | Liability derivatives |
| | Statement of
Assets and Liabilities location | Fair value | | Statement of
Assets and Liabilities location | Fair value |
| Equity risk | Unrealized gains on futures contracts | $ 1,308,342* | | Unrealized losses on futures contracts | $ 1,431,758* |
| Equity risk | | | | Written options, at value | 390,615 |
| Foreign currency risk | Unrealized gains on forward foreign currency contracts | 0 | | Unrealized losses on forward foreign currency contracts | 117,610 |
| Foreign currency risk | Unrealized gains on futures contracts | 202,057* | | Unrealized losses on futures contracts | 23,789* |
| Credit risk | Net unrealized gains on swap contracts | 0* | | Net unrealized losses on swap contracts | 3,930* |
| | | $1,510,399 | | | $1,967,702 |
* Amount represents the cumulative unrealized gains (losses) as reported in the table following the Portfolio of Investments. For futures contracts and centrally cleared swap contracts, only the current day's variation margin as of March 31, 2022 is reported separately on the Statement of Assets and Liabilities.
The effect of derivative instruments on the Statement of Operations for the six months ended March 31, 2022 was as follows:
| | Amount of realized gains (losses) on derivatives |
| | Forward
foreign
currency
contracts | Futures
contracts | Swap
contracts | Written
options | Total |
| Interest rate risk | $ 0 | $ 337,018 | $ 0 | $ 0 | $ 337,018 |
| Equity risk | 0 | (3,708,022) | 0 | 1,531,253 | (2,176,769) |
| Foreign currency risk | 1,288,086 | (993,477) | 0 | 0 | 294,609 |
| Credit risk | 0 | 0 | 2,242 | 0 | 2,242 |
| | $1,288,086 | $(4,364,481) | $2,242 | $1,531,253 | $(1,542,900) |
| | Change in unrealized gains (losses) on derivatives |
| | Forward
foreign
currency
contracts | Futures
contracts | Swap
contracts | Written
options | Total |
| Interest rate risk | $ 0 | $ (314,878) | $ 0 | $ 0 | $ (314,878) |
| Equity risk | 0 | 301,871 | 0 | (574,321) | (272,450) |
| Foreign currency risk | (440,377) | (199,364) | 0 | 0 | (639,741) |
| Credit risk | 0 | 0 | (18,756) | 0 | (18,756) |
| | $(440,377) | $(212,371) | $(18,756) | $(574,321) | $(1,245,825) |
For certain types of derivative transactions, the Fund has entered into International Swaps and Derivatives Association, Inc. master agreements (“ISDA Master Agreements”) or similar agreements with approved counterparties. The ISDA Master Agreements or similar agreements may have requirements to deliver/deposit securities or cash to/with an exchange or broker-dealer as collateral and allows the Fund to offset, with each counterparty, certain derivative financial instrument’s assets and/or liabilities with collateral held or pledged. Collateral requirements differ by type of derivative. Collateral or margin requirements are set by the broker or exchange clearinghouse for exchange traded derivatives while collateral terms are contract specific for over-the-counter traded derivatives. Cash collateral that has been pledged to cover obligations of the Fund under ISDA Master Agreements or similar agreements, if any, are reported separately in the Statement of Assets and Liabilities. Securities pledged as collateral, if any, are noted in the Portfolio of Investments. With respect to balance sheet offsetting, absent an event of default by the counterparty or a termination of the agreement, the reported amounts of financial assets and financial liabilities in the Statement of Assets and Liabilities are not offset across transactions between the Fund and the applicable counterparty.
Allspring Diversified Income Builder Fund | 53
Notes to financial statements (unaudited)
A reconciliation of the gross amounts on the Statement of Assets and Liabilities to the net amounts by counterparty, including any collateral exposure, for OTC derivatives is as follows:
| Counterparty | Gross amounts
of liabilities in the
Statement of
Assets and
Liabilities | Amounts
subject to
netting
agreements | Collateral
pledged1 | Net amount
of liabilities |
| Citibank National Association | $117,610 | $0 | $(117,610) | $0 |
1 Collateral pledged within this table is limited to the collateral for the net transaction with the counterparty.
8. BANK BORROWINGS
The Trust (excluding the money market funds), Allspring Master Trust and Allspring Variable Trust are parties to a $350,000,000 revolving credit agreement whereby the Fund is permitted to use bank borrowings for temporary or emergency purposes, such as to fund shareholder redemption requests. Interest under the credit agreement is charged to the Fund based on a borrowing rate equal to the higher of the Federal Funds rate in effect on that day plus 1.25% or the overnight bank funding rate in effect on that day plus 1.25%. In addition, an annual commitment fee equal to 0.25% of the unused balance is allocated to each participating fund.
For the six months ended March 31, 2022, there were no borrowings by the Fund under the agreement.
9. INDEMNIFICATION
Under the Fund's organizational documents, the officers and Trustees have been granted certain indemnification rights against certain liabilities that may arise out of performance of their duties to the Fund. The Fund has entered into a separate agreement with each Trustee that converts indemnification rights currently existing under the Fund’s organizational documents into contractual rights that cannot be changed in the future without the consent of the Trustee. Additionally, in the normal course of business, the Fund may enter into contracts with service providers that contain a variety of indemnification clauses. The Fund’s maximum exposure under these arrangements is dependent on future claims that may be made against the Fund and, therefore, cannot be estimated.
10. CORONAVIRUS (COVID-19) PANDEMIC
On March 11, 2020, the World Health Organization announced that it had made the assessment that coronavirus disease 2019 (“COVID-19”) is a pandemic. The impacts of COVID-19 are affecting the entire global economy, individual companies and investment products, the funds, and the market in general. There is significant uncertainty around the extent and duration of business disruptions related to COVID-19 and the impacts may last for an extended period of time. COVID-19 has led to significant uncertainty and volatility in the financial markets.
54 | Allspring Diversified Income Builder Fund
Other information (unaudited)
PROXY VOTING INFORMATION
A description of the policies and procedures used to determine how to vote proxies relating to portfolio securities is available without charge, upon request, by calling 1-800-222-8222, visiting our website at allspringglobal.com, or visiting the SEC website at sec.gov. Information regarding how the proxies related to portfolio securities were voted during the most recent 12-month period ended June 30 is available on the website at allspringglobal.com or by visiting the SEC website at sec.gov.
QUARTERLY PORTFOLIO HOLDINGS INFORMATION
The Fund files its complete schedule of portfolio holdings with the SEC for the first and third quarters of each fiscal year as an exhibit to its reports on Form N-PORT. Shareholders may view the filed Form N-PORT by visiting the SEC website at sec.gov.
Allspring Diversified Income Builder Fund | 55
Other information (unaudited)
BOARD OF TRUSTEES AND OFFICERS
Each of the Trustees and Officers listed in the table below acts in identical capacities for each fund in the Allspring family of funds, which consists of 138 mutual funds comprising the Allspring Funds Trust, Allspring Variable Trust, Allspring Master Trust and four closed-end funds (collectively the “Fund Complex”). This table should be read in conjunction with the Prospectus and the Statement of Additional Information1. The mailing address of each Trustee and Officer is 525 Market Street, 12th Floor, San Francisco, CA 94105. Each Trustee and Officer serves an indefinite term, however, each Trustee serves such term until reaching the mandatory retirement age established by the Trustees.
Independent Trustees
Name and
year of birth | Position held and
length of service* | Principal occupations during past five years or longer | Current other
public company or
investment
company
directorships |
William R. Ebsworth
(Born 1957) | Trustee,
since 2015 | Retired. From 1984 to 2013, equities analyst, portfolio manager, research director and chief investment officer at Fidelity Management and Research Company in Boston, Tokyo, and Hong Kong, and retired in 2013 as Chief Investment Officer of Fidelity Strategic Advisers, Inc. where he led a team of investment professionals managing client assets. Prior thereto, Board member of Hong Kong Securities Clearing Co., Hong Kong Options Clearing Corp., the Thailand International Fund, Ltd., Fidelity Investments Life Insurance Company, and Empire Fidelity Investments Life Insurance Company. Audit Committee Chair and Investment Committee Chair of the Vincent Memorial Hospital Endowment (non-profit organization). Mr. Ebsworth is a CFA® charterholder. | N/A |
Jane A. Freeman
(Born 1953) | Trustee,
since 2015;
Chair Liaison,
since 2018 | Retired. From 2012 to 2014 and 1999 to 2008, Chief Financial Officer of Scientific Learning Corporation. From 2008 to 2012, Ms. Freeman provided consulting services related to strategic business projects. Prior to 1999, Portfolio Manager at Rockefeller & Co. and Scudder, Stevens & Clark. Board member of the Harding Loevner Funds from 1996 to 2014, serving as both Lead Independent Director and chair of the Audit Committee. Board member of the Russell Exchange Traded Funds Trust from 2011 to 2012 and the chair of the Audit Committee. Ms. Freeman is also an inactive Chartered Financial Analyst. | N/A |
Isaiah Harris, Jr.
(Born 1952) | Trustee,
since 2009; Audit
Committee
Chair,
since 2019 | Retired. Chairman of the Board of CIGNA Corporation from 2009 to 2021, and Director from 2005 to 2008. From 2003 to 2011, Director of Deluxe Corporation. Prior thereto, President and CEO of BellSouth Advertising and Publishing Corp. from 2005 to 2007, President and CEO of BellSouth Enterprises from 2004 to 2005 and President of BellSouth Consumer Services from 2000 to 2003. Emeritus member of the Iowa State University Foundation Board of Governors. Emeritus Member of the Advisory Board of Iowa State University School of Business. Advisory Board Member, Palm Harbor Academy (private school). Advisory Board Member, Fellowship of Christian Athletes. Mr. Harris is a certified public accountant (inactive status). | N/A |
David F. Larcker
(Born 1950) | Trustee,
since 2009 | James Irvin Miller Professor of Accounting at the Graduate School of Business (Emeritus), Stanford University, Director of the Corporate Governance Research Initiative and Senior Faculty of The Rock Center for Corporate Governance since 2006. From 2005 to 2008, Professor of Accounting at the Graduate School of Business, Stanford University. Prior thereto, Ernst & Young Professor of Accounting at The Wharton School, University of Pennsylvania from 1985 to 2005. | N/A |
56 | Allspring Diversified Income Builder Fund
Other information (unaudited)
Name and
year of birth | Position held and
length of service* | Principal occupations during past five years or longer | Current other
public company or
investment
company
directorships |
Olivia S. Mitchell
(Born 1953) | Trustee,
since 2006;
Nominating and
Governance
Committee Chair,
since 2018 | International Foundation of Employee Benefit Plans Professor since 1993, Wharton School of the University of Pennsylvania. Director of Wharton’s Pension Research Council and Boettner Center on Pensions & Retirement Research, and Research Associate at the National Bureau of Economic Research. Previously taught at Cornell University from 1978 to 1993. | N/A |
Timothy J. Penny
(Born 1951) | Trustee,
since 1996;
Chair,
since 2018 | President and Chief Executive Officer of Southern Minnesota Initiative Foundation, a non-profit organization, since 2007. Member of the Board of Trustees of NorthStar Education Finance, Inc., a non-profit organization, since 2007. | N/A |
James G. Polisson
(Born 1959) | Trustee,
since 2018 | Retired. Chief Marketing Officer, Source (ETF) UK Services, Ltd, from 2015 to 2017. From 2012 to 2015, Principal of The Polisson Group, LLC, a management consulting, corporate advisory and principal investing company. Chief Executive Officer and Managing Director at Russell Investments, Global Exchange Traded Funds from 2010 to 2012. Managing Director of Barclays Global Investors from 1998 to 2010 and Global Chief Marketing Officer for iShares and Barclays Global Investors from 2000 to 2010. Trustee of the San Francisco Mechanics’ Institute, a non-profit organization, from 2013 to 2015. Board member of the Russell Exchange Traded Fund Trust from 2011 to 2012. Director of Barclays Global Investors Holdings Deutschland GmbH from 2006 to 2009. Mr. Polisson is an attorney and has a retired status with the Massachusetts and District of Columbia Bar Associations. | N/A |
Pamela Wheelock
(Born 1959) | Trustee,
since January
2020; previously
Trustee from
January 2018 to
July 2019 | Board member of the Destination Medical Center Economic Development Agency, Rochester, Minnesota since 2019. Interim President of the McKnight Foundation from January to September 2020. McKnight Foundation Consultant, November 2020 to February 2021. Acting Commissioner, Minnesota Department of Human Services, July 2019 through September 2019. Consultant (part-time), Minnesota Department of Human Services, October 2019 through December 2019. Chief Operating Officer, Twin Cities Habitat for Humanity from 2017 to 2019. Vice President of University Services, University of Minnesota from 2012 to 2016. Prior thereto, on the Board of Directors, Governance Committee and Finance Committee for the Minnesota Philanthropy Partners (Saint Paul Foundation) from 2012 to 2018, Interim Chief Executive Officer of Blue Cross Blue Shield of Minnesota from 2011 to 2012, Chairman of the Board from 2009 to 2012 and Board Director from 2003 to 2015. Vice President, Leadership and Community Engagement, Bush Foundation, Saint Paul, Minnesota (a private foundation) from 2009 to 2011. Executive Vice President and Chief Financial Officer, Minnesota Sports and Entertainment from 2004 to 2009 and Senior Vice President from 2002 to 2004. Executive Vice President of the Minnesota Wild Foundation from 2004 to 2008. Commissioner of Finance, State of Minnesota, from 1999 to 2002. Currently Board Chair of the Minnesota Wild Foundation since 2010. | N/A |
* Length of service dates reflect the Trustee’s commencement of service with the Trust’s predecessor entities, where applicable.
Allspring Diversified Income Builder Fund | 57
Other information (unaudited)
Officers2
Name and
year of birth | Position held and
length of service | Principal occupations during past five years or longer |
Andrew Owen
(Born 1960) | President,
since 2017 | President, Chief Executive Officer and Director of Allspring Funds Management, LLC since 2017 and co-president of Galliard Capital Management, LLC, an affiliate of Allspring Funds Management, LLC, since 2019. Prior thereto, Head of Affiliated Managers, Allspring Global Investments, from 2014 to 2019 and Executive Vice President responsible for marketing, investments and product development for Allspring Funds Management, LLC, from 2009 to 2014. In addition, Mr. Owen was an Executive Vice President of Wells Fargo & Company from 2014 to 2021. |
Jeremy DePalma
(Born 1974) | Treasurer,
since 2012
(for certain funds in
the Fund Complex);
since 2021 (for
the remaining funds in the
Fund Complex) | Senior Vice President of Allspring Funds Management, LLC since 2009. Senior Vice President of Evergreen Investment Management Company, LLC from 2008 to 2010 and head of the Fund Reporting and Control Team within Fund Administration from 2005 to 2010. |
Kate McKinley
(Born 1977) | Chief Legal Officer,
since 2021 | Chief Legal Officer of Allspring Global Investments since 2021. Prior thereto, held various roles at State Street Global Advisors beginning in 2010, including serving as Senior Vice President and General Counsel from 2019 to 2021, and Chief Operating Officer of the Institutional Client Group from 2016 - 2019. Prior to working at State Street Global Advisors served as Assistant General Counsel for Bank of America Corporation from 2005 to 2010 and as an Associate at WilmerHale from 2002 to 2005. |
Christopher Baker
(Born 1976) | Chief Compliance Officer, since 2022 | Global Chief Compliance Officer for Allspring Global Investments since 2022. Prior thereto, Chief Compliance Officer for State Street Global Advisors from 2018 to 2021. Senior Compliance Officer for the State Street divisions of Alternative Investment Solutions, Sector Solutions, and Global Marketing from 2015 to 2018. From 2010 to 2015 Vice President, Global Head of Investment and Marketing Compliance for State Street Global Advisors. |
Matthew Prasse
(Born 1983) | Secretary,
since 2021 | Senior Counsel of the Allspring Legal Department since 2021. Senior Counsel of the Wells Fargo Legal Department from 2018 to 2021. Previously, Counsel for Barings LLC from 2015 to 2018. Prior to joining Barings, Associate at Morgan, Lewis & Bockius LLP from 2008 to 2015. |
1 The Statement of Additional Information includes additional information about the Trustees and is available, without charge, upon request, by calling 1-800-222-8222 or by visiting the website at allspringglobal.com.
2 For those Officers with tenures at Allspring Global Investments and/or Allspring Funds Management, LLC that began prior to 2021, such tenures include years of service during which these businesses/entities were known as Wells Fargo Asset Management and Wells Fargo Funds Management, LLC, respectively.
58 | Allspring Diversified Income Builder Fund
For more information
More information about Allspring Funds is available free upon request. To obtain literature, please write, visit the Fund's website, or call:
Allspring Funds
P.O. Box 219967
Kansas City, MO 64121-9967
Website: allspringglobal.com
Individual investors: 1-800-222-8222
Retail investment professionals: 1-888-877-9275
Institutional investment professionals: 1-800-260-5969
This report and the financial statements contained herein are submitted for the general information of the shareholders of the Fund. If this report is used for promotional purposes, distribution of the report must be accompanied or preceded by a current prospectus. Before investing, please consider the investment objectives, risks, charges, and expenses of the investment. For a current prospectus and, if available, a summary prospectus, containing this information, call
1-800-222-8222 or visit the Fund's website at allspringglobal.com. Read the prospectus carefully before you invest or send money.
Allspring Global InvestmentsTM is the trade name for the asset management firms of Allspring Global Investments Holdings, LLC, a holding company indirectly owned by certain private funds of GTCR LLC and Reverence Capital Partners, L.P. These firms include but are not limited to Allspring Global Investments, LLC, and Allspring Funds Management, LLC. Certain products managed by Allspring entities are distributed by Allspring Funds Distributor, LLC (a broker-dealer and Member FINRA/SIPC).
This material is for general informational and educational purposes only and is NOT intended to provide investment advice or a recommendation of any kind - including a recommendation for any specific investment, strategy, or plan.
© 2022 Allspring Global Investments Holdings, LLC. All rights reserved.
PAR-0522-00045 05-22
SA226/SAR226 03-22
Semi-Annual Report
March 31, 2022
Allspring
Index Asset Allocation Fund
The views expressed and any forward-looking statements are as of March 31, 2022, unless otherwise noted, and are those of the Fund's portfolio managers and/or Allspring Global Investments. Discussions of individual securities or the markets generally are not intended as individual recommendations. Future events or results may vary significantly from those expressed in any forward-looking statements. The views expressed are subject to change at any time in response to changing circumstances in the market. Allspring Global Investments disclaims any obligation to publicly update or revise any views expressed or forward-looking statements.
Allspring Index Asset Allocation Fund | 1
Letter to shareholders (unaudited)
Andrew Owen
President
Allspring Funds
Dear Shareholder:
We are pleased to offer you this semi-annual report for Allspring Index Asset Allocation Fund for the six-month period that ended March 31, 2022. Global stocks and bonds broadly declined during a challenging period. Despite progress on a global economic recovery from COVID-19, persistently high inflation, concerns regarding anticipated tightening of central bank monetary policy, and turmoil caused by the Russian invasion of Ukraine all led to a retreat from financial market gains made earlier in 2021. Among major indexes, the U.S. large-cap-dominated S&P 500 Index was an exception in escaping a half-year loss.
For the six-month period, U.S. stocks, based on the S&P 500 Index,1 gained 5.92%. International stocks, as measured by the MSCI ACWI ex USA Index (Net),2 returned -3.72%, while the MSCI EM Index (Net) (USD),3 trailed both developed market benchmarks with a return of -8.20%. The Bloomberg U.S. Aggregate Bond Index,4returned -5.92%, the Bloomberg Global Aggregate ex-USD Index (unhedged),5 returned -7.26%, the Bloomberg Municipal Bond Index6 returned -5.55%, and the ICE BofA U.S. High Yield Index,7 lost 3.89%.
Inflationary concerns and the Russian-Ukraine war caused markets to retreat.
Elevated inflation pressures and the ongoing global supply bottleneck continued in October, but strong corporate earnings provided a bright spot in the U.S., the eurozone, and many Asian countries. Government bond yields rose globally as central banks prepared to tighten monetary policy. Commodity prices continued to rise, driven by sharply higher energy costs.
In November, as COVID-19 hospitalizations rose, most major global asset classes declined. Two exceptions were U.S. investment-grade bonds and Treasury Inflation-Protected Securities. President Biden signed a long-awaited $550 billion infrastructure bill to upgrade U.S. roads, bridges, and railways. Meanwhile, the Consumer Price Index8, a measure of domestic inflation conditions, jumped to its highest level in 31 years. While the threat of consistently high inflation led the U.S. Federal Reserve (Fed) to discuss a faster pace of tapering, the Omicron strain created uncertainty. Commodities lost ground for the month, driven by sharp declines in oil prices (and energy costs in general) as well as precious metals.
“Elevated inflation pressures and the ongoing global supply bottleneck continued in October, but strong corporate earnings provided a bright spot in the U.S., the eurozone, and many Asian countries.”
| 1 | The S&P 500 Index consists of 500 stocks chosen for market size, liquidity, and industry group representation. It is a market-value-weighted index with each stock's weight in the index proportionate to its market value. You cannot invest directly in an index. |
| 2 | The Morgan Stanley Capital International (MSCI) All Country World Index (ACWI) ex USA Index (Net) is a free-float-adjusted market-capitalization-weighted index that is designed to measure the equity market performance of developed and emerging markets, excluding the U.S. Source: MSCI. MSCI makes no express or implied warranties or representations and shall have no liability whatsoever with respect to any MSCI data contained herein. The MSCI data may not be further redistributed or used as a basis for other indexes or any securities or financial products. This report is not approved, reviewed, or produced by MSCI. You cannot invest directly in an index. |
| 3 | The MSCI Emerging Markets (EM) Index (Net) (USD) is a free-float-adjusted market-capitalization-weighted index that is designed to measure equity market performance of emerging markets. You cannot invest directly in an index. |
| 4 | The Bloomberg U.S. Aggregate Bond Index is a broad-based benchmark that measures the investment-grade, U.S.-dollar-denominated, fixed-rate taxable bond market, including Treasuries, government-related and corporate securities, mortgage-backed securities (agency fixed-rate and hybrid adjustable-rate mortgage pass-throughs), asset-backed securities, and commercial mortgage-backed securities. You cannot invest directly in an index. |
| 5 | The Bloomberg Global Aggregate ex-USD Index (unhedged) is an unmanaged index that provides a broad-based measure of the global investment-grade fixed-income markets excluding the U.S.-dollar-denominated debt market. You cannot invest directly in an index. |
| 6 | The Bloomberg Municipal Bond Index is an unmanaged index composed of long-term tax-exempt bonds with a minimum credit rating of Baa. You cannot invest directly in an index. |
| 7 | The ICE BofA U.S. High Yield Index is a market-capitalization-weighted index of domestic and Yankee high-yield bonds. The index tracks the performance of high-yield securities traded in the U.S. bond market. You cannot invest directly in an index. Copyright 2022. ICE Data Indices, LLC. All rights reserved. |
| 8 | The Consumer Price Index (CPI) is a measure of the average change over time in the prices paid by urban consumers for a market basket of consumer goods and services. You cannot invest directly in an index. |
2 | Allspring Index Asset Allocation Fund
Letter to shareholders (unaudited)
Global volatility lessened in December as data indicated a lower risk of severe disease and death from the Omicron variant. Even so, several countries introduced restrictions on travel and hospitality, among other sectors, in an effort to reduce the spread. In the U.S., data indicated a stable economy overall, with robust corporate earnings. Consumer spending potential looked strong heading into 2022 on elevated household savings and the lowest household debt ratio since 1973. U.S. corporate and high-yield bonds had monthly gains while Treasuries declined. Bonds were strongly affected by the projection of three 25-basis-point (bp; 100 bps equal 1.00%) policy rate hikes in 2022 by senior Federal Open Market Committee members, up from previous projections of just one hike.
In January 2022, the main focus was on potential U.S. interest rate hikes and the Russia-Ukraine conflict. The Fed hinted that a March interest rate hike was likely. Meanwhile, Russia threatened a potential invasion of Ukraine, which could disrupt Russia’s massive energy supplies and drive demand from non-Russian oil-producing countries. Elsewhere overseas, Europe saw food and energy prices spike, leading to rising inflation. Within fixed income, corporate bonds struggled in January, underperforming government bonds, as investors focused on continued elevated inflation and ongoing uncertainty over the U.S. monetary path.
The Russian invasion of Ukraine dominated the financial world in February and March. Equity, bond, and commodities markets were shaken by fear, uncertainty, and an upending of demand-supply dynamics. Major global stock indexes were down in February, along with global bonds overall, with ongoing high levels of volatility in March along with mixed results that favored U.S. large-cap stocks. Prices of commodities spiked, including crude oil, natural gas, wheat, and precious metals, on elevated concerns of supply shortages. All of this fed already-high inflation concerns and added to expectations of more aggressive central bank interest rate hikes. Sweeping sanctions against Russia and corporate pullouts contributed to market volatility. Despite the geopolitical turmoil, the U.S. economic outlook remained largely unchanged, with a healthy job market and signs of economic resilience accompanying higher prices.
Don’t let short-term uncertainty derail long-term investment goals.
Periods of investment uncertainty can present challenges, but experience has taught us that maintaining long-term investment goals can be an effective way to plan for the future. To help you create a sound strategy based on your personal goals and risk tolerance, Allspring Funds offers more than 100 mutual funds spanning a wide range of asset classes and investment styles. Although diversification cannot guarantee an investment profit or prevent losses, we believe it can be an effective way to manage investment risk and potentially smooth out overall portfolio performance. We encourage investors to know their investments and to understand that appropriate levels of risk-taking may unlock opportunities.
Information on transaction closing.
On November 1, 2021, GTCR LLC and Reverence Capital Partners, L.P. announced the beginning of Allspring Global Investments™ with the close of the transaction to acquire Wells Fargo Funds Management, LLC; Wells Capital Management LLC; Galliard Capital Management LLC.; Wells Fargo Asset Management (International) Ltd.; Wells Fargo Asset Management Luxembourg S.A.; and Wells Fargo Funds Distributor, LLC, as well as Wells Fargo Bank, N.A.’s business of acting as trustee to its collective investment trusts and all related Wells Fargo Asset Management legal entities. The transaction closed on November 1, 2021, forming Allspring Global Investments, a privately held asset management firm with $451 billion in AUM1 as of March 31, 2022.
“ The Russian invasion of Ukraine dominated the financial world in February and March. Equity, bond, and commodities markets were shaken by fear, uncertainty, and an upending of demand-supply dynamics.”
| 1 | Figures are as of March 31, 2022, unless otherwise noted. Please note that the assets under management figures provided have been adjusted to eliminate any duplication of reporting among assets directed by multiple investment teams and includes $91.2B from Galliard Capital Management ($74.7B stable value; $16.5B fixed income), an investment advisor that is not part of the Allspring trade name/GIPS firm. |
Allspring Index Asset Allocation Fund | 3
Letter to shareholders (unaudited)
For further information about your Fund, contact your investment professional, visit our website at allspringglobal.com, or call us directly at 1-800-222-8222. |
Allspring Global Investments™ is a leading independent asset management firm with a full breadth of investment capabilities across diverse asset classes, serving the needs of its institutional and wealth management clients around the world. Allspring operates across 18 offices globally supported by more than 480 investment professionals. Allspring and its investment teams provide a broad range of differentiated investment products and solutions to help its diverse range of clients meet their investment objectives.
As part of this transition, all mutual funds within the Wells Fargo Funds family were rebranded as Allspring Funds. Each individual fund had “Wells Fargo” removed from its fund name and replaced with “Allspring.” The fund name changes went into effect on December 6, 2021.
Allspring Global Investments™ is the trade name for the asset management firm of Allspring Global Investments Holdings, LLC, a holding company indirectly owned by certain private funds of GTCR LLC and Reverence Capital Partners, L.P.
Thank you for choosing to invest with Allspring Funds. We appreciate your confidence in us and remain committed to helping you meet your financial needs.
Sincerely,
Andrew Owen
President
Allspring Funds
Notice to Shareholders
Russia launched a large-scale invasion of Ukraine on February 24, 2022. As a result of this military action, the United States and many other countries have instituted various economic sanctions against Russian and Belarus individuals and entities. The situation has led to increased financial market volatility and could have severe adverse effects on regional and global economic markets, including the markets for certain securities and commodities, such as oil and natural gas. The extent and duration of the military action, resulting sanctions imposed, other punitive action taken and the resulting market disruptions cannot be easily predicted.
Our solidarity and support goes out to our impacted employees and the people affected in Ukraine and their families. Allspring has a dedicated team of investment professionals actively monitoring the situation for any new developments and the potential impact to our clients and investment products. As the situation remains fluid, we are focused on the assessment of risks, valuation, and liquidity of impacted securities. Please visit our website at allspringglobal.com and click on “Russia-Ukraine Portfolio Impacts” for further information.
4 | Allspring Index Asset Allocation Fund
This page is intentionally left blank.
Performance highlights (unaudited)
| Investment objective | The Fund seeks long-term total return, consisting of capital appreciation and current income. |
| Manager | Allspring Funds Management, LLC |
| Subadviser | Allspring Global Investments, LLC |
| Portfolio managers | Kandarp R. Acharya, CFA®‡, FRM, Petros N. Bocray, CFA®‡, FRM, Travis Keshemberg, CFA®‡CIPM, FRM# |
| Average annual total returns (%) as of March 31, 2022 |
| | | Including sales charge | | Excluding sales charge | | Expense ratios1 (%) |
| | Inception date | 1 year | 5 year | 10 year | | 1 year | 5 year | 10 year | | Gross | Net 2 |
| Class A (SFAAX) | 11-13-1986 | 0.89 | 8.60 | 9.51 | | 7.06 | 9.90 | 10.16 | | 1.09 | 1.08 |
| Class C (WFALX) | 4-1-1998 | 5.23 | 9.07 | 9.33 | | 6.23 | 9.07 | 9.33 | | 1.84 | 1.83 |
| Administrator Class (WFAIX) | 11-8-1999 | – | – | – | | 7.25 | 10.09 | 10.38 | | 1.01 | 0.90 |
| Institutional Class (WFATX)3 | 10-31-2016 | – | – | – | | 7.41 | 10.26 | 10.47 | | 0.76 | 0.75 |
| Index Asset Allocation Blended Index4 | – | – | – | – | | 7.73 | 10.49 | 10.39 | | – | – |
| Bloomberg U.S. Treasury Index5 | – | – | – | – | | -3.67 | 1.76 | 1.68 | | – | – |
| S&P 500 Index6 | – | – | – | – | | 15.65 | 15.99 | 14.64 | | – | – |
Figures quoted represent past performance, which is no guarantee of future results, and do not reflect taxes that a shareholder may pay on an investment in a fund. Investment return and principal value of an investment will fluctuate so that an investor’s shares, when redeemed, may be worth more or less than their original cost. Performance shown without sales charges would be lower if sales charges were reflected. Current performance may be lower or higher than the performance data quoted, which assumes the reinvestment of dividends and capital gains. Current month-end performance is available on the Fund’s website, allspringglobal.com.
Index returns do not include transaction costs associated with buying and selling securities, any mutual fund fees or expenses, or any taxes. It is not possible to invest directly in an index.
For Class A shares, the maximum front-end sales charge is 5.75%. For Class C shares, the maximum contingent deferred sales charge is 1.00%. Performance including a contingent deferred sales charge assumes the sales charge for the corresponding time period. Administrator Class and Institutional Class shares are sold without a front-end sales charge or contingent deferred sales charge.
| 1 | Reflects the expense ratios as stated in the most recent prospectuses. The expense ratios shown are subject to change and may differ from the annualized expense ratios shown in the financial highlights of this report. |
| 2 | The manager has contractually committed through January 31, 2023, to waive fees and/or reimburse expenses to the extent necessary to cap total annual fund operating expenses after fee waivers at 1.08% for Class A, 1.83% for Class C, 0.90% for Administrator Class, and 0.75% for Institutional Class. Brokerage commissions, stamp duty fees, interest, taxes, acquired fund fees and expenses (if any), and extraordinary expenses are excluded from the expense caps. Prior to or after the commitment expiration date, the caps may be increased or the commitment to maintain the caps may be terminated only with the approval of the Board of Trustees. Without these caps, the Fund’s returns would have been lower. The expense ratio paid by an investor is the net expense ratio (the total annual fund operating expenses after fee waivers) as stated in the prospectuses. |
| 3 | Historical performance shown for the Institutional Class shares prior to their inception reflects the performance of the Administrator Class shares, and includes the higher expenses applicable to the Administrator Class shares. If these expenses had not been included, returns for the Institutional Class shares would be higher. |
| 4 | Source: Allspring Funds Management, LLC. Index Asset Allocation Blended Index is composed 60% of the S&P 500 Index and 40% of the Bloomberg U.S. Treasury Index. Prior to April 1, 2015, the Index Asset Allocation Blended Index was composed 60% of the S&P 500 Index and 40% of the Bloomberg U.S. Treasury 20+ Year Index. You cannot invest directly in an index. |
| 5 | The Bloomberg U.S. Treasury Index is an unmanaged index of prices of U.S. Treasury bonds with maturities of 1 to 30 years. You cannot invest directly in an index. |
| 6 | The S&P 500 Index consists of 500 stocks chosen for market size, liquidity, and industry group representation. It is a market-value weighted index with each stock’s weight in the index proportionate to its market value. You cannot invest directly in an index. |
| ‡ | CFA® and Chartered Financial Analyst® are trademarks owned by CFA Institute. |
| # | Mr. Keshemberg became a portfolio manager of the Fund on March 24, 2022. |
6 | Allspring Index Asset Allocation Fund
Performance highlights (unaudited)
Balanced funds may invest in stocks and bonds. Stock values fluctuate in response to the activities of individual companies and general market and economic conditions. Bond values fluctuate in response to the financial condition of individual issuers, general market and economic conditions, and changes in interest rates. Changes in market conditions and government policies may lead to periods of heightened volatility in the bond market and reduced liquidity for certain bonds held by the Fund. In general, when interest rates rise, bond values fall and investors may lose principal value. Interest rate changes and their impact on the Fund and its share price can be sudden and unpredictable. The use of derivatives may reduce returns and/or increase volatility. Consult the Fund’s prospectus for additional information on these and other risks.
Allspring Index Asset Allocation Fund | 7
Performance highlights (unaudited)
| Ten largest holdings (%) as of March 31, 20221 |
| Apple Incorporated | 4.22 |
| Microsoft Corporation | 3.61 |
| Amazon.com Incorporated | 2.22 |
| Tesla Motors Incorporated | 1.40 |
| Alphabet Incorporated Class A | 1.30 |
| Alphabet Incorporated Class C | 1.21 |
| NVIDIA Corporation | 1.05 |
| Berkshire Hathaway Incorporated Class B | 1.01 |
| Meta Platforms Incorporated Class A | 0.80 |
| UnitedHealth Group Incorporated | 0.75 |
| 1 | Figures represent the percentage of the Fund's net assets. Holdings are subject to change and may have changed since the date specified. |
| Allocation (%) as of March 31, 2022 |
| | Neutral
allocation | Effective
allocation1 |
| Bonds | 40 | 40 |
| Stocks | 60 | 63 |
| Effective Cash | 0 | (3) |
| 1 | Effective allocation reflects the effect of the tactical futures overlay that may be in place. Effective cash, if any, represents the net offset to such future positions. Effective allocations are subject to change and may have changed since the date specified. |
8 | Allspring Index Asset Allocation Fund
Fund expenses (unaudited)
As a shareholder of the Fund, you incur two types of costs: (1) transaction costs, including sales charges (loads) on purchase payments and contingent deferred sales charges (if any) on redemptions and (2) ongoing costs, including management fees, distribution (12b-1) and/or shareholder servicing fees, and other Fund expenses. This example is intended to help you understand your ongoing costs (in dollars) of investing in the Fund and to compare these costs with the ongoing costs of investing in other mutual funds.
The example is based on an investment of $1,000 invested at the beginning of the six-month period and held for the entire period from October 1, 2021 to March 31, 2022.
Actual expenses
The “Actual” line of the table below provides information about actual account values and actual expenses. You may use the information in this line, together with the amount you invested, to estimate the expenses that you paid over the period. Simply divide your account value by $1,000 (for example, an $8,600 account value divided by $1,000 = 8.6), then multiply the result by the number in the “Actual” line under the heading entitled “Expenses paid during period” for your applicable class of shares to estimate the expenses you paid on your account during this period.
Hypothetical example for comparison purposes
The “Hypothetical” line of the table below provides information about hypothetical account values and hypothetical expenses based on the Fund’s actual expense ratio and an assumed rate of return of 5% per year before expenses, which is not the Fund’s actual return. The hypothetical account values and expenses may not be used to estimate the actual ending account balance or expenses you paid for the period. You may use this information to compare the ongoing costs of investing in the Fund and other funds. To do so, compare this 5% hypothetical example with the 5% hypothetical examples that appear in the shareholder reports of the other funds.
Please note that the expenses shown in the table are meant to highlight your ongoing costs only and do not reflect any transactional costs, such as sales charges (loads) and contingent deferred sales charges. Therefore, the “Hypothetical” line of the table is useful in comparing ongoing costs only, and will not help you determine the relative total costs of owning different funds. In addition, if these transactional costs were included, your costs would have been higher.
| | Beginning
account value
10-1-2021 | Ending
account value
3-31-2022 | Expenses
paid during
the period1 | Annualized net
expense ratio |
| Class A | | | | |
| Actual | $1,000.00 | $1,009.14 | $5.41 | 1.08% |
| Hypothetical (5% return before expenses) | $1,000.00 | $1,019.55 | $5.44 | 1.08% |
| Class C | | | | |
| Actual | $1,000.00 | $1,005.29 | $9.15 | 1.83% |
| Hypothetical (5% return before expenses) | $1,000.00 | $1,015.81 | $9.20 | 1.83% |
| Administrator Class | | | | |
| Actual | $1,000.00 | $1,010.10 | $4.51 | 0.90% |
| Hypothetical (5% return before expenses) | $1,000.00 | $1,020.44 | $4.53 | 0.90% |
| Institutional Class | | | | |
| Actual | $1,000.00 | $1,010.78 | $3.76 | 0.75% |
| Hypothetical (5% return before expenses) | $1,000.00 | $1,021.19 | $3.78 | 0.75% |
1 Expenses paid is equal to the annualized net expense ratio of each class multiplied by the average account value over the period, multiplied by 182 divided by 365 (to reflect the one-half-year period).
Allspring Index Asset Allocation Fund | 9
Portfolio of investments—March 31, 2022 (unaudited)
| | | Interest
rate | Maturity
date | Principal | Value |
| Agency securities: 0.00% | | | | | |
| FNMA Series 2002-T1 Class A4 | | 9.50% | 11-25-2031 | $ 22,759 | $ 26,134 |
| Total Agency securities (Cost $22,759) | | | | | 26,134 |
| | | | | Shares | |
| Common stocks: 59.73% | | | | | |
| Communication services: 5.59% | | | | | |
| Diversified telecommunication services: 0.62% | | | | | |
| AT&T Incorporated | | | | 185,553 | 4,384,617 |
| Lumen Technologies Incorporated | | | | 23,794 | 268,158 |
| Verizon Communications Incorporated | | | | 109,087 | 5,556,892 |
| | | | | | 10,209,667 |
| Entertainment: 0.85% | | | | | |
| Activision Blizzard Incorporated | | | | 20,142 | 1,613,576 |
| Electronic Arts Incorporated | | | | 7,265 | 919,095 |
| Live Nation Entertainment Incorporated † | | | | 3,485 | 409,975 |
| Netflix Incorporated † | | | | 11,406 | 4,272,574 |
| Take-Two Interactive Software Incorporated † | | | | 2,960 | 455,070 |
| The Walt Disney Company † | | | | 46,911 | 6,434,313 |
| | | | | | 14,104,603 |
| Interactive media & services: 3.41% | | | | | |
| Alphabet Incorporated Class A † | | | | 7,776 | 21,627,778 |
| Alphabet Incorporated Class C † | | | | 7,185 | 20,067,633 |
| Match Group Incorporated † | | | | 7,345 | 798,695 |
| Meta Platforms Incorporated Class A † | | | | 59,508 | 13,232,199 |
| Twitter Incorporated † | | | | 20,577 | 796,124 |
| | | | | | 56,522,429 |
| Media: 0.59% | | | | | |
| Charter Communications Incorporated Class A † | | | | 3,090 | 1,685,657 |
| Comcast Corporation Class A | | | | 117,143 | 5,484,635 |
| Discovery Incorporated Class A †« | | | | 4,342 | 108,203 |
| Discovery Incorporated Class C † | | | | 7,771 | 194,042 |
| DISH Network Corporation Class A † | | | | 6,445 | 203,984 |
| Fox Corporation Class A | | | | 8,141 | 321,162 |
| Fox Corporation Class B | | | | 3,760 | 136,413 |
| Interpublic Group of Companies Incorporated | | | | 10,133 | 359,215 |
| News Corporation Class A | | | | 10,087 | 223,427 |
| News Corporation Class B | | | | 3,126 | 70,398 |
| Omnicom Group Incorporated | | | | 5,392 | 457,673 |
| ViacomCBS Incorporated Class B | | | | 15,634 | 591,122 |
| | | | | | 9,835,931 |
| Wireless telecommunication services: 0.12% | | | | | |
| T-Mobile US Incorporated † | | | | 15,221 | 1,953,615 |
The accompanying notes are an integral part of these financial statements.
10 | Allspring Index Asset Allocation Fund
Portfolio of investments—March 31, 2022 (unaudited)
| | | | | Shares | Value |
| Consumer discretionary: 7.16% | | | | | |
| Auto components: 0.06% | | | | | |
| Aptiv plc † | | | | 6,962 | $ 833,421 |
| BorgWarner Incorporated | | | | 6,204 | 241,336 |
| | | | | | 1,074,757 |
| Automobiles: 1.60% | | | | | |
| Ford Motor Company | | | | 100,892 | 1,706,084 |
| General Motors Company † | | | | 37,366 | 1,634,389 |
| Tesla Motors Incorporated † | | | | 21,570 | 23,243,832 |
| | | | | | 26,584,305 |
| Distributors: 0.07% | | | | | |
| Genuine Parts Company | | | | 3,686 | 464,510 |
| LKQ Corporation | | | | 6,940 | 315,145 |
| Pool Corporation | | | | 1,039 | 439,341 |
| | | | | | 1,218,996 |
| Hotels, restaurants & leisure: 1.13% | | | | | |
| Booking Holdings Incorporated † | | | | 1,061 | 2,491,705 |
| Caesars Entertainment Incorporated † | | | | 5,491 | 424,784 |
| Carnival Corporation † | | | | 20,858 | 421,749 |
| Chipotle Mexican Grill Incorporated † | | | | 731 | 1,156,464 |
| Darden Restaurants Incorporated | | | | 3,294 | 437,937 |
| Domino's Pizza Incorporated | | | | 939 | 382,182 |
| Expedia Group Incorporated † | | | | 3,877 | 758,613 |
| Hilton Worldwide Holdings Incorporated † | | | | 7,194 | 1,091,618 |
| Las Vegas Sands Corporation † | | | | 8,877 | 345,049 |
| Marriott International Incorporated Class A † | | | | 7,072 | 1,242,904 |
| McDonald's Corporation | | | | 19,340 | 4,782,395 |
| MGM Resorts International | | | | 9,752 | 408,999 |
| Norwegian Cruise Line Holdings Limited † | | | | 10,802 | 236,348 |
| Penn National Gaming Incorporated † | | | | 4,282 | 181,642 |
| Royal Caribbean Cruises Limited † | | | | 5,824 | 487,935 |
| Starbucks Corporation | | | | 29,766 | 2,707,813 |
| Wynn Resorts Limited † | | | | 2,720 | 216,893 |
| Yum! Brands Incorporated | | | | 7,454 | 883,523 |
| | | | | | 18,658,553 |
| Household durables: 0.18% | | | | | |
| D.R. Horton Incorporated | | | | 8,299 | 618,358 |
| Garmin Limited | | | | 3,929 | 466,019 |
| Lennar Corporation Class A | | | | 6,714 | 544,975 |
| Mohawk Industries Incorporated † | | | | 1,405 | 174,501 |
| Newell Rubbermaid Incorporated | | | | 9,807 | 209,968 |
| NVR Incorporated † | | | | 85 | 379,718 |
| PulteGroup Incorporated | | | | 6,412 | 268,663 |
| Whirlpool Corporation | | | | 1,513 | 261,416 |
| | | | | | 2,923,618 |
| Internet & direct marketing retail: 2.30% | | | | | |
| Amazon.com Incorporated † | | | | 11,289 | 36,801,576 |
| eBay Incorporated | | | | 16,121 | 923,088 |
| Etsy Incorporated † | | | | 3,221 | 400,306 |
| | | | | | 38,124,970 |
The accompanying notes are an integral part of these financial statements.
Allspring Index Asset Allocation Fund | 11
Portfolio of investments—March 31, 2022 (unaudited)
| | | | | Shares | Value |
| Leisure products: 0.02% | | | | | |
| Hasbro Incorporated | | | | 3,338 | $ 273,449 |
| Multiline retail: 0.30% | | | | | |
| Dollar General Corporation | | | | 5,983 | 1,331,995 |
| Dollar Tree Incorporated † | | | | 5,831 | 933,835 |
| Target Corporation | | | | 12,388 | 2,628,981 |
| | | | | | 4,894,811 |
| Specialty retail: 1.16% | | | | | |
| Advance Auto Parts Incorporated | | | | 1,609 | 332,999 |
| AutoZone Incorporated † | | | | 533 | 1,089,761 |
| Bath & Body Works Incorporated | | | | 6,583 | 314,667 |
| Best Buy Company Incorporated | | | | 5,540 | 503,586 |
| CarMax Incorporated † | | | | 4,171 | 402,418 |
| Lowe's Companies Incorporated | | | | 17,245 | 3,486,767 |
| O'Reilly Automotive Incorporated † | | | | 1,741 | 1,192,515 |
| Ross Stores Incorporated | | | | 9,070 | 820,472 |
| The Home Depot Incorporated | | | | 26,919 | 8,057,664 |
| The TJX Companies Incorporated | | | | 30,614 | 1,854,596 |
| Tractor Supply Company | | | | 2,951 | 688,675 |
| Ulta Beauty Incorporated † | | | | 1,401 | 557,906 |
| | | | | | 19,302,026 |
| Textiles, apparel & luxury goods: 0.34% | | | | | |
| Nike Incorporated Class B | | | | 32,990 | 4,439,134 |
| PVH Corporation | | | | 1,799 | 137,821 |
| Ralph Lauren Corporation | | | | 1,194 | 135,447 |
| Tapestry Incorporated | | | | 6,788 | 252,174 |
| Under Armour Incorporated Class A † | | | | 4,866 | 82,819 |
| Under Armour Incorporated Class C † | | | | 5,576 | 86,763 |
| VF Corporation | | | | 8,317 | 472,905 |
| | | | | | 5,607,063 |
| Consumer staples: 3.64% | | | | | |
| Beverages: 0.88% | | | | | |
| Brown-Forman Corporation Class B | | | | 4,738 | 317,541 |
| Constellation Brands Incorporated Class A | | | | 4,266 | 982,545 |
| Molson Coors Brewing Company Class B | | | | 4,887 | 260,868 |
| Monster Beverage Corporation † | | | | 9,700 | 775,030 |
| PepsiCo Incorporated | | | | 35,862 | 6,002,582 |
| The Coca-Cola Company | | | | 101,021 | 6,263,302 |
| | | | | | 14,601,868 |
| Food & staples retailing: 0.90% | | | | | |
| Costco Wholesale Corporation | | | | 11,494 | 6,618,820 |
| Sysco Corporation | | | | 13,112 | 1,070,595 |
| The Kroger Company | | | | 17,335 | 994,509 |
| Walgreens Boots Alliance Incorporated | | | | 18,476 | 827,171 |
| Walmart Incorporated | | | | 36,767 | 5,475,342 |
| | | | | | 14,986,437 |
| Food products: 0.58% | | | | | |
| Archer Daniels Midland Company | | | | 14,536 | 1,312,019 |
| Campbell Soup Company | | | | 5,236 | 233,369 |
The accompanying notes are an integral part of these financial statements.
12 | Allspring Index Asset Allocation Fund
Portfolio of investments—March 31, 2022 (unaudited)
| | | | | Shares | Value |
| Food products (continued) | | | | | |
| ConAgra Foods Incorporated | | | | 12,477 | $ 418,853 |
| General Mills Incorporated | | | | 15,669 | 1,061,105 |
| Hormel Foods Corporation | | | | 7,339 | 378,252 |
| Kellogg Company | | | | 6,641 | 428,278 |
| Lamb Weston Holdings Incorporated | | | | 3,772 | 225,981 |
| McCormick & Company Incorporated | | | | 6,521 | 650,796 |
| Mondelez International Incorporated Class A | | | | 36,042 | 2,262,717 |
| The Hershey Company | | | | 3,778 | 818,428 |
| The J.M. Smucker Company | | | | 2,815 | 381,179 |
| The Kraft Heinz Company | | | | 18,438 | 726,273 |
| Tyson Foods Incorporated Class A | | | | 7,580 | 679,395 |
| | | | | | 9,576,645 |
| Household products: 0.80% | | | | | |
| Church & Dwight Company Incorporated | | | | 6,290 | 625,100 |
| Colgate-Palmolive Company | | | | 21,897 | 1,660,450 |
| Kimberly-Clark Corporation | | | | 8,730 | 1,075,187 |
| The Clorox Company | | | | 3,190 | 443,506 |
| The Procter & Gamble Company | | | | 62,363 | 9,529,066 |
| | | | | | 13,333,309 |
| Personal products: 0.10% | | | | | |
| The Estee Lauder Companies Incorporated Class A | | | | 6,007 | 1,635,826 |
| Tobacco: 0.38% | | | | | |
| Altria Group Incorporated | | | | 47,369 | 2,475,030 |
| Philip Morris International Incorporated | | | | 40,271 | 3,783,058 |
| | | | | | 6,258,088 |
| Energy: 2.32% | | | | | |
| Energy equipment & services: 0.20% | | | | | |
| Baker Hughes Incorporated | | | | 23,536 | 856,946 |
| Halliburton Company | | | | 23,393 | 885,893 |
| Schlumberger Limited | | | | 36,114 | 1,491,869 |
| | | | | | 3,234,708 |
| Oil, gas & consumable fuels: 2.12% | | | | | |
| APA Corporation | | | | 9,394 | 388,254 |
| Cabot Oil & Gas Corporation | | | | 20,902 | 563,727 |
| Chevron Corporation | | | | 50,026 | 8,145,734 |
| ConocoPhillips | | | | 33,691 | 3,369,100 |
| Devon Energy Corporation | | | | 16,254 | 961,099 |
| Diamondback Energy Incorporated | | | | 4,389 | 601,644 |
| EOG Resources Incorporated | | | | 15,113 | 1,801,923 |
| Exxon Mobil Corporation | | | | 109,921 | 9,078,375 |
| Hess Corporation | | | | 7,133 | 763,516 |
| Kinder Morgan Incorporated | | | | 50,744 | 959,569 |
| Marathon Oil Corporation | | | | 20,195 | 507,096 |
| Marathon Petroleum Corporation | | | | 15,038 | 1,285,749 |
| Occidental Petroleum Corporation | | | | 22,730 | 1,289,700 |
| ONEOK Incorporated | | | | 11,554 | 816,059 |
| Phillips 66 | | | | 12,234 | 1,056,895 |
| Pioneer Natural Resources Company | | | | 5,890 | 1,472,677 |
The accompanying notes are an integral part of these financial statements.
Allspring Index Asset Allocation Fund | 13
Portfolio of investments—March 31, 2022 (unaudited)
| | | | | Shares | Value |
| Oil, gas & consumable fuels (continued) | | | | | |
| The Williams Companies Incorporated | | | | 31,552 | $ 1,054,152 |
| Valero Energy Corporation | | | | 10,617 | 1,078,050 |
| | | | | | 35,193,319 |
| Financials: 6.64% | | | | | |
| Banks: 2.27% | | | | | |
| Bank of America Corporation | | | | 183,473 | 7,562,757 |
| Citigroup Incorporated | | | | 51,161 | 2,731,997 |
| Citizens Financial Group Incorporated | | | | 10,944 | 496,092 |
| Comerica Incorporated | | | | 3,374 | 305,111 |
| Fifth Third Bancorp | | | | 17,600 | 757,504 |
| First Republic Bank | | | | 4,638 | 751,820 |
| Huntington Bancshares Incorporated | | | | 36,992 | 540,823 |
| JPMorgan Chase & Company | | | | 76,400 | 10,414,848 |
| KeyCorp | | | | 23,955 | 536,113 |
| M&T Bank Corporation | | | | 3,321 | 562,910 |
| People's United Financial Incorporated | | | | 11,040 | 220,690 |
| PNC Financial Services Group Incorporated | | | | 10,869 | 2,004,787 |
| Regions Financial Corporation | | | | 24,360 | 542,254 |
| Signature Bank | | | | 1,602 | 470,171 |
| SVB Financial Group † | | | | 1,505 | 841,972 |
| Truist Financial Corporation | | | | 34,420 | 1,951,614 |
| US Bancorp | | | | 34,801 | 1,849,673 |
| Wells Fargo & Company | | | | 99,996 | 4,845,806 |
| Zions Bancorporation | | | | 3,920 | 256,995 |
| | | | | | 37,643,937 |
| Capital markets: 1.77% | | | | | |
| Ameriprise Financial Incorporated | | | | 2,867 | 861,132 |
| Bank of New York Mellon Corporation | | | | 19,134 | 949,620 |
| BlackRock Incorporated | | | | 3,689 | 2,819,023 |
| Cboe Global Markets Incorporated | | | | 2,762 | 316,028 |
| CME Group Incorporated | | | | 9,289 | 2,209,482 |
| FactSet Research Systems Incorporated | | | | 978 | 424,599 |
| Franklin Resources Incorporated | | | | 7,240 | 202,141 |
| Intercontinental Exchange Incorporated | | | | 14,568 | 1,924,724 |
| Invesco Limited | | | | 8,855 | 204,196 |
| MarketAxess Holdings Incorporated | | | | 979 | 333,056 |
| Moody's Corporation | | | | 4,180 | 1,410,374 |
| Morgan Stanley | | | | 36,621 | 3,200,675 |
| MSCI Incorporated | | | | 2,104 | 1,058,060 |
| Northern Trust Corporation | | | | 5,393 | 628,015 |
| Raymond James Financial Incorporated | | | | 4,848 | 532,844 |
| S&P Global Incorporated | | | | 9,182 | 3,766,273 |
| State Street Corporation | | | | 9,503 | 827,901 |
| T. Rowe Price Group Incorporated | | | | 5,901 | 892,172 |
| The Charles Schwab Corporation | | | | 38,702 | 3,262,966 |
| The Goldman Sachs Group Incorporated | | | | 8,765 | 2,893,327 |
| The NASDAQ Incorporated | | | | 3,031 | 540,124 |
| | | | | | 29,256,732 |
| Consumer finance: 0.34% | | | | | |
| American Express Company | | | | 15,921 | 2,977,227 |
| Capital One Financial Corporation | | | | 10,656 | 1,399,026 |
The accompanying notes are an integral part of these financial statements.
14 | Allspring Index Asset Allocation Fund
Portfolio of investments—March 31, 2022 (unaudited)
| | | | | Shares | Value |
| Consumer finance (continued) | | | | | |
| Discover Financial Services | | | | 7,444 | $ 820,254 |
| Synchrony Financial | | | | 13,371 | 465,445 |
| | | | | | 5,661,952 |
| Diversified financial services: 1.01% | | | | | |
| Berkshire Hathaway Incorporated Class B † | | | | 47,651 | 16,816,514 |
| Insurance: 1.25% | | | | | |
| AFLAC Incorporated | | | | 15,554 | 1,001,522 |
| American International Group Incorporated | | | | 21,500 | 1,349,555 |
| Aon plc Class A | | | | 5,572 | 1,814,410 |
| Arthur J. Gallagher & Company | | | | 5,408 | 944,237 |
| Assurant Incorporated | | | | 1,473 | 267,836 |
| Brown & Brown Incorporated | | | | 6,089 | 440,052 |
| Chubb Limited | | | | 11,177 | 2,390,760 |
| Cincinnati Financial Corporation | | | | 3,891 | 529,020 |
| Everest Reinsurance Group Limited | | | | 1,018 | 306,805 |
| Globe Life Incorporated | | | | 2,403 | 241,742 |
| Lincoln National Corporation | | | | 4,303 | 281,244 |
| Loews Corporation | | | | 5,078 | 329,156 |
| Marsh & McLennan Companies Incorporated | | | | 13,114 | 2,234,888 |
| MetLife Incorporated | | | | 18,166 | 1,276,706 |
| Principal Financial Group Incorporated | | | | 6,288 | 461,602 |
| Progressive Corporation | | | | 15,197 | 1,732,306 |
| Prudential Financial Incorporated | | | | 9,780 | 1,155,703 |
| The Allstate Corporation | | | | 7,265 | 1,006,275 |
| The Hartford Financial Services Group Incorporated | | | | 8,670 | 622,593 |
| The Travelers Companies Incorporated | | | | 6,263 | 1,144,438 |
| W.R. Berkley Corporation | | | | 5,436 | 361,983 |
| Willis Towers Watson plc | | | | 3,156 | 745,510 |
| | | | | | 20,638,343 |
| Health care: 8.15% | | | | | |
| Biotechnology: 1.16% | | | | | |
| AbbVie Incorporated | | | | 45,824 | 7,428,529 |
| Amgen Incorporated | | | | 14,553 | 3,519,206 |
| Biogen Incorporated † | | | | 3,784 | 796,910 |
| Gilead Sciences Incorporated | | | | 32,329 | 1,921,959 |
| Incyte Corporation † | | | | 4,864 | 386,299 |
| Moderna Incorporated † | | | | 8,949 | 1,541,555 |
| Regeneron Pharmaceuticals Incorporated † | | | | 2,747 | 1,918,560 |
| Vertex Pharmaceuticals Incorporated † | | | | 6,568 | 1,714,051 |
| | | | | | 19,227,069 |
| Health care equipment & supplies: 1.73% | | | | | |
| Abbott Laboratories | | | | 45,837 | 5,425,267 |
| ABIOMED Incorporated † | | | | 1,177 | 389,869 |
| Align Technology Incorporated † | | | | 1,895 | 826,220 |
| Baxter International Incorporated | | | | 12,971 | 1,005,771 |
| Becton Dickinson & Company | | | | 7,379 | 1,962,814 |
| Boston Scientific Corporation † | | | | 36,878 | 1,633,327 |
| Dentsply Sirona Incorporated | | | | 5,659 | 278,536 |
| DexCom Incorporated † | | | | 2,512 | 1,285,139 |
| Edwards Lifesciences Corporation † | | | | 16,107 | 1,896,116 |
| Hologic Incorporated † | | | | 6,498 | 499,176 |
The accompanying notes are an integral part of these financial statements.
Allspring Index Asset Allocation Fund | 15
Portfolio of investments—March 31, 2022 (unaudited)
| | | | | Shares | Value |
| Health care equipment & supplies (continued) | | | | | |
| IDEXX Laboratories Incorporated † | | | | 2,196 | $ 1,201,344 |
| Intuitive Surgical Incorporated † | | | | 9,265 | 2,795,065 |
| Medtronic plc | | | | 34,722 | 3,852,406 |
| ResMed Incorporated | | | | 3,790 | 919,113 |
| STERIS plc | | | | 2,590 | 626,184 |
| Stryker Corporation | | | | 8,683 | 2,321,400 |
| Teleflex Incorporated | | | | 1,212 | 430,054 |
| The Cooper Companies Incorporated | | | | 1,279 | 534,098 |
| Zimmer Biomet Holdings Incorporated | | | | 5,411 | 692,067 |
| | | | | | 28,573,966 |
| Health care providers & services: 1.80% | | | | | |
| AmerisourceBergen Corporation | | | | 3,903 | 603,833 |
| Anthem Incorporated | | | | 6,319 | 3,104,019 |
| Cardinal Health Incorporated | | | | 7,168 | 406,426 |
| Centene Corporation † | | | | 15,141 | 1,274,721 |
| Cigna Corporation | | | | 8,378 | 2,007,453 |
| CVS Health Corporation | | | | 33,987 | 3,439,824 |
| DaVita HealthCare Partners Incorporated † | | | | 1,593 | 180,184 |
| HCA Healthcare Incorporated | | | | 6,168 | 1,545,824 |
| Henry Schein Incorporated † | | | | 3,587 | 312,751 |
| Humana Incorporated | | | | 3,338 | 1,452,597 |
| Laboratory Corporation of America Holdings † | | | | 2,408 | 634,893 |
| McKesson Corporation | | | | 3,880 | 1,187,784 |
| Molina Healthcare Incorporated † | | | | 1,510 | 503,721 |
| Quest Diagnostics Incorporated | | | | 3,077 | 421,118 |
| UnitedHealth Group Incorporated | | | | 24,462 | 12,474,886 |
| Universal Health Services Incorporated Class B | | | | 1,888 | 273,666 |
| | | | | | 29,823,700 |
| Health care technology: 0.04% | | | | | |
| Cerner Corporation | | | | 7,616 | 712,553 |
| Life sciences tools & services: 1.10% | | | | | |
| Agilent Technologies Incorporated | | | | 7,751 | 1,025,690 |
| Bio-Rad Laboratories Incorporated Class A † | | | | 559 | 314,846 |
| Bio-Techne Corporation | | | | 1,018 | 440,835 |
| Charles River Laboratories International Incorporated † | | | | 1,305 | 370,581 |
| Danaher Corporation | | | | 16,526 | 4,847,572 |
| Illumina Incorporated † | | | | 4,034 | 1,409,480 |
| IQVIA Holdings Incorporated † | | | | 4,930 | 1,139,865 |
| Mettler-Toledo International Incorporated † | | | | 595 | 817,048 |
| PerkinElmer Incorporated | | | | 3,268 | 570,135 |
| Thermo Fisher Scientific Incorporated | | | | 10,209 | 6,029,946 |
| Waters Corporation † | | | | 1,578 | 489,795 |
| West Pharmaceutical Services Incorporated | | | | 1,930 | 792,670 |
| | | | | | 18,248,463 |
| Pharmaceuticals: 2.32% | | | | | |
| Bristol-Myers Squibb Company | | | | 56,471 | 4,124,077 |
| Catalent Incorporated † | | | | 4,629 | 513,356 |
| Eli Lilly & Company | | | | 20,566 | 5,889,485 |
| Johnson & Johnson | | | | 68,301 | 12,104,986 |
| Merck & Company Incorporated | | | | 65,499 | 5,374,193 |
| Organon & Company | | | | 6,582 | 229,909 |
| Pfizer Incorporated | | | | 144,948 | 7,503,958 |
The accompanying notes are an integral part of these financial statements.
16 | Allspring Index Asset Allocation Fund
Portfolio of investments—March 31, 2022 (unaudited)
| | | | | Shares | Value |
| Pharmaceuticals (continued) | | | | | |
| Viatris Incorporated | | | | 31,033 | $ 337,639 |
| Zoetis Incorporated | | | | 12,253 | 2,310,793 |
| | | | | | 38,388,396 |
| Industrials: 4.70% | | | | | |
| Aerospace & defense: 0.94% | | | | | |
| General Dynamics Corporation | | | | 5,976 | 1,441,292 |
| Howmet Aerospace Incorporated | | | | 9,814 | 352,715 |
| Huntington Ingalls Industries Incorporated | | | | 1,037 | 206,819 |
| L3Harris Technologies Incorporated | | | | 5,082 | 1,262,725 |
| Lockheed Martin Corporation | | | | 6,297 | 2,779,496 |
| Northrop Grumman Corporation | | | | 3,804 | 1,701,225 |
| Raytheon Technologies Corporation | | | | 38,677 | 3,831,730 |
| Textron Incorporated | | | | 5,704 | 424,264 |
| The Boeing Company † | | | | 14,216 | 2,722,364 |
| TransDigm Group Incorporated † | | | | 1,357 | 884,140 |
| | | | | | 15,606,770 |
| Air freight & logistics: 0.38% | | | | | |
| C.H. Robinson Worldwide Incorporated | | | | 3,369 | 362,875 |
| Expeditors International of Washington Incorporated | | | | 4,390 | 452,872 |
| FedEx Corporation | | | | 6,295 | 1,456,600 |
| United Parcel Service Incorporated Class B | | | | 18,891 | 4,051,364 |
| | | | | | 6,323,711 |
| Airlines: 0.13% | | | | | |
| Alaska Air Group Incorporated † | | | | 3,253 | 188,707 |
| American Airlines Group Incorporated † | | | | 16,744 | 305,578 |
| Delta Air Lines Incorporated † | | | | 16,579 | 656,031 |
| Southwest Airlines Company † | | | | 15,384 | 704,587 |
| United Airlines Holdings Incorporated † | | | | 8,395 | 389,192 |
| | | | | | 2,244,095 |
| Building products: 0.25% | | | | | |
| A.O. Smith Corporation | | | | 3,395 | 216,907 |
| Allegion plc | | | | 2,316 | 254,250 |
| Carrier Global Corporation | | | | 22,103 | 1,013,865 |
| Fortune Brands Home & Security Incorporated | | | | 3,495 | 259,609 |
| Johnson Controls International plc | | | | 18,162 | 1,190,882 |
| Masco Corporation | | | | 6,172 | 314,772 |
| Trane Technologies plc | | | | 6,045 | 923,072 |
| | | | | | 4,173,357 |
| Commercial services & supplies: 0.25% | | | | | |
| Cintas Corporation | | | | 2,279 | 969,464 |
| Copart Incorporated † | | | | 5,488 | 688,579 |
| Republic Services Incorporated | | | | 5,418 | 717,885 |
| Rollins Incorporated | | | | 5,881 | 206,129 |
| Waste Management Incorporated | | | | 9,989 | 1,583,257 |
| | | | | | 4,165,314 |
| Construction & engineering: 0.03% | | | | | |
| Quanta Services Incorporated | | | | 3,672 | 483,272 |
The accompanying notes are an integral part of these financial statements.
Allspring Index Asset Allocation Fund | 17
Portfolio of investments—March 31, 2022 (unaudited)
| | | | | Shares | Value |
| Electrical equipment: 0.31% | | | | | |
| AMETEK Incorporated | | | | 5,980 | $ 796,416 |
| Eaton Corporation plc | | | | 10,297 | 1,562,673 |
| Emerson Electric Company | | | | 15,356 | 1,505,656 |
| Generac Holdings Incorporated † | | | | 1,619 | 481,264 |
| Rockwell Automation Incorporated | | | | 3,004 | 841,210 |
| | | | | | 5,187,219 |
| Industrial conglomerates: 0.58% | | | | | |
| 3M Company | | | | 14,741 | 2,194,640 |
| General Electric Company | | | | 28,455 | 2,603,633 |
| Honeywell International Incorporated | | | | 17,723 | 3,448,541 |
| Roper Technologies Incorporated | | | | 2,731 | 1,289,660 |
| | | | | | 9,536,474 |
| Machinery: 0.93% | | | | | |
| Caterpillar Incorporated | | | | 14,032 | 3,126,610 |
| Cummins Incorporated | | | | 3,684 | 755,625 |
| Deere & Company | | | | 7,226 | 3,002,114 |
| Dover Corporation | | | | 3,714 | 582,727 |
| Fortive Corporation | | | | 9,237 | 562,810 |
| IDEX Corporation | | | | 1,967 | 377,133 |
| Illinois Tool Works Incorporated | | | | 7,383 | 1,546,000 |
| Ingersoll Rand Incorporated | | | | 10,568 | 532,099 |
| Nordson Corporation | | | | 1,398 | 317,458 |
| Otis Worldwide Corporation | | | | 10,968 | 843,988 |
| PACCAR Incorporated | | | | 8,981 | 790,957 |
| Parker-Hannifin Corporation | | | | 3,309 | 938,962 |
| Pentair plc | | | | 4,279 | 231,965 |
| Snap-on Incorporated | | | | 1,376 | 282,740 |
| Stanley Black & Decker Incorporated | | | | 4,190 | 585,720 |
| Wabtec Corporation | | | | 4,835 | 464,982 |
| Xylem Incorporated | | | | 4,657 | 397,056 |
| | | | | | 15,338,946 |
| Professional services: 0.19% | | | | | |
| Equifax Incorporated | | | | 3,152 | 747,339 |
| Jacobs Engineering Group Incorporated | | | | 3,344 | 460,837 |
| Leidos Holdings Incorporated | | | | 3,636 | 392,761 |
| Nielsen Holdings plc | | | | 9,293 | 253,141 |
| Robert Half International Incorporated | | | | 2,830 | 323,129 |
| Verisk Analytics Incorporated | | | | 4,178 | 896,724 |
| | | | | | 3,073,931 |
| Road & rail: 0.58% | | | | | |
| CSX Corporation | | | | 57,500 | 2,153,375 |
| J.B. Hunt Transport Services Incorporated | | | | 2,165 | 434,710 |
| Norfolk Southern Corporation | | | | 6,218 | 1,773,498 |
| Old Dominion Freight Line Incorporated | | | | 2,405 | 718,325 |
| Union Pacific Corporation | | | | 16,536 | 4,517,801 |
| | | | | | 9,597,709 |
| Trading companies & distributors: 0.13% | | | | | |
| Fastenal Company | | | | 14,939 | 887,377 |
The accompanying notes are an integral part of these financial statements.
18 | Allspring Index Asset Allocation Fund
Portfolio of investments—March 31, 2022 (unaudited)
| | | | | Shares | Value |
| Trading companies & distributors (continued) | | | | | |
| United Rentals Incorporated † | | | | 1,869 | $ 663,887 |
| W.W. Grainger Incorporated | | | | 1,122 | 578,716 |
| | | | | | 2,129,980 |
| Information technology: 16.70% | | | | | |
| Communications equipment: 0.52% | | | | | |
| Arista Networks Incorporated † | | | | 5,791 | 804,833 |
| Cisco Systems Incorporated | | | | 108,955 | 6,075,331 |
| F5 Networks Incorporated † | | | | 1,566 | 327,216 |
| Juniper Networks Incorporated | | | | 8,431 | 313,296 |
| Motorola Solutions Incorporated | | | | 4,384 | 1,061,805 |
| | | | | | 8,582,481 |
| Electronic equipment, instruments & components: 0.37% | | | | | |
| Amphenol Corporation Class A | | | | 15,483 | 1,166,644 |
| CDW Corporation of Delaware | | | | 3,504 | 626,831 |
| Corning Incorporated | | | | 19,301 | 712,400 |
| IPG Photonics Corporation † | | | | 913 | 100,211 |
| Keysight Technologies Incorporated † | | | | 4,716 | 744,987 |
| TE Connectivity Limited | | | | 8,357 | 1,094,600 |
| Teledyne Technologies Incorporated † | | | | 1,209 | 571,410 |
| Trimble Incorporated † | | | | 6,492 | 468,333 |
| Zebra Technologies Corporation Class A † | | | | 1,364 | 564,287 |
| | | | | | 6,049,703 |
| IT services: 2.54% | | | | | |
| Accenture plc Class A | | | | 16,352 | 5,514,385 |
| Akamai Technologies Incorporated † | | | | 4,218 | 503,587 |
| Automatic Data Processing Incorporated | | | | 10,902 | 2,480,641 |
| Broadridge Financial Solutions Incorporated | | | | 3,020 | 470,244 |
| Cognizant Technology Solutions Corporation Class A | | | | 13,583 | 1,217,988 |
| DXC Technology Company † | | | | 6,311 | 205,928 |
| EPAM Systems Incorporated † | | | | 1,456 | 431,864 |
| Fidelity National Information Services Incorporated | | | | 15,719 | 1,578,502 |
| Fiserv Incorporated † | | | | 15,370 | 1,558,518 |
| FleetCor Technologies Incorporated † | | | | 2,105 | 524,271 |
| Gartner Incorporated † | | | | 2,127 | 632,697 |
| Global Payments Incorporated | | | | 7,363 | 1,007,553 |
| International Business Machines Corporation | | | | 23,203 | 3,016,854 |
| Jack Henry & Associates Incorporated | | | | 1,887 | 371,833 |
| MasterCard Incorporated Class A | | | | 22,315 | 7,974,935 |
| Paychex Incorporated | | | | 8,415 | 1,148,395 |
| PayPal Holdings Incorporated † | | | | 29,679 | 3,432,376 |
| VeriSign Incorporated † | | | | 2,506 | 557,485 |
| Visa Incorporated Class A | | | | 42,864 | 9,505,949 |
| | | | | | 42,134,005 |
| Semiconductors & semiconductor equipment: 3.55% | | | | | |
| Advanced Micro Devices Incorporated † | | | | 41,161 | 4,500,544 |
| Analog Devices Incorporated | | | | 13,544 | 2,237,198 |
| Applied Materials Incorporated | | | | 22,770 | 3,001,086 |
| Broadcom Incorporated | | | | 10,643 | 6,701,684 |
| Enphase Energy Incorporated † | | | | 3,426 | 691,298 |
| Intel Corporation | | | | 104,684 | 5,188,139 |
The accompanying notes are an integral part of these financial statements.
Allspring Index Asset Allocation Fund | 19
Portfolio of investments—March 31, 2022 (unaudited)
| | | | | Shares | Value |
| Semiconductors & semiconductor equipment (continued) | | | | | |
| KLA Corporation | | | | 3,887 | $ 1,422,875 |
| Lam Research Corporation | | | | 3,585 | 1,927,332 |
| Microchip Technology Incorporated | | | | 14,292 | 1,073,901 |
| Micron Technology Incorporated | | | | 27,880 | 2,171,573 |
| Monolithic Power Systems Incorporated | | | | 1,110 | 539,105 |
| NVIDIA Corporation | | | | 64,009 | 17,465,496 |
| NXP Semiconductors NV | | | | 6,835 | 1,265,022 |
| Qorvo Incorporated † | | | | 2,783 | 345,370 |
| Qualcomm Incorporated | | | | 28,765 | 4,395,867 |
| Skyworks Solutions Incorporated | | | | 4,223 | 562,841 |
| Solaredge Technologies Incorporated † | | | | 1,329 | 428,430 |
| Teradyne Incorporated | | | | 4,185 | 494,793 |
| Texas Instruments Incorporated | | | | 23,818 | 4,370,127 |
| | | | | | 58,782,681 |
| Software: 5.33% | | | | | |
| Adobe Incorporated † | | | | 12,190 | 5,554,008 |
| ANSYS Incorporated † | | | | 2,246 | 713,442 |
| Autodesk Incorporated † | | | | 5,683 | 1,218,151 |
| Cadence Design Systems Incorporated † | | | | 7,152 | 1,176,218 |
| Ceridian HCM Holding Incorporated † | | | | 3,503 | 239,465 |
| Citrix Systems Incorporated | | | | 3,229 | 325,806 |
| Fortinet Incorporated † | | | | 3,490 | 1,192,673 |
| Intuit Incorporated | | | | 7,304 | 3,512,055 |
| Microsoft Corporation | | | | 194,095 | 59,841,429 |
| NortonLifeLock Incorporated | | | | 15,073 | 399,736 |
| Oracle Corporation | | | | 40,733 | 3,369,841 |
| Paycom Software Incorporated † | | | | 1,240 | 429,511 |
| PTC Incorporated † | | | | 2,714 | 292,352 |
| Salesforce.com Incorporated † | | | | 25,392 | 5,391,229 |
| ServiceNow Incorporated † | | | | 5,151 | 2,868,540 |
| Synopsys Incorporated † | | | | 3,957 | 1,318,749 |
| Tyler Technologies Incorporated † | | | | 1,060 | 471,583 |
| | | | | | 88,314,788 |
| Technology hardware, storage & peripherals: 4.39% | | | | | |
| Apple Incorporated | | | | 400,420 | 69,917,336 |
| Hewlett Packard Enterprise Company | | | | 33,314 | 556,677 |
| HP Incorporated | | | | 27,708 | 1,005,800 |
| NetApp Incorporated | | | | 5,718 | 474,594 |
| Seagate Technology Holdings plc | | | | 5,184 | 466,042 |
| Western Digital Corporation † | | | | 8,025 | 398,441 |
| | | | | | 72,818,890 |
| Materials: 1.56% | | | | | |
| Chemicals: 1.03% | | | | | |
| Air Products & Chemicals Incorporated | | | | 5,758 | 1,438,982 |
| Albemarle Corporation | | | | 3,016 | 666,988 |
| Celanese Corporation Series A | | | | 2,790 | 398,607 |
| CF Industries Holdings Incorporated | | | | 5,500 | 566,830 |
| Corteva Incorporated | | | | 18,800 | 1,080,624 |
| Dow Incorporated | | | | 19,027 | 1,212,400 |
| DuPont de Nemours Incorporated | | | | 13,232 | 973,611 |
| Eastman Chemical Company | | | | 3,345 | 374,841 |
| Ecolab Incorporated | | | | 6,465 | 1,141,460 |
The accompanying notes are an integral part of these financial statements.
20 | Allspring Index Asset Allocation Fund
Portfolio of investments—March 31, 2022 (unaudited)
| | | | | Shares | Value |
| Chemicals (continued) | | | | | |
| FMC Corporation | | | | 3,260 | $ 428,918 |
| International Flavors & Fragrances Incorporated | | | | 6,568 | 862,575 |
| Linde plc | | | | 13,281 | 4,242,350 |
| LyondellBasell Industries NV Class A | | | | 6,779 | 697,017 |
| PPG Industries Incorporated | | | | 6,151 | 806,212 |
| The Mosaic Company | | | | 9,528 | 633,612 |
| The Sherwin-Williams Company | | | | 6,224 | 1,553,635 |
| | | | | | 17,078,662 |
| Construction materials: 0.07% | | | | | |
| Martin Marietta Materials Incorporated | | | | 1,602 | 616,594 |
| Vulcan Materials Company | | | | 3,425 | 629,173 |
| | | | | | 1,245,767 |
| Containers & packaging: 0.18% | | | | | |
| Amcor plc | | | | 39,220 | 444,363 |
| Avery Dennison Corporation | | | | 2,138 | 371,948 |
| Ball Corporation | | | | 8,413 | 757,170 |
| International Paper Company | | | | 10,008 | 461,869 |
| Packaging Corporation of America | | | | 2,457 | 383,562 |
| Sealed Air Corporation | | | | 3,821 | 255,854 |
| WestRock Company | | | | 6,782 | 318,957 |
| | | | | | 2,993,723 |
| Metals & mining: 0.28% | | | | | |
| Freeport-McMoRan Incorporated | | | | 38,047 | 1,892,458 |
| Newmont Corporation | | | | 20,739 | 1,647,714 |
| Nucor Corporation | | | | 7,027 | 1,044,564 |
| | | | | | 4,584,736 |
| Real estate: 1.63% | | | | | |
| Equity REITs: 1.58% | | | | | |
| Alexandria Real Estate Equities Incorporated | | | | 3,770 | 758,713 |
| American Tower Corporation | | | | 11,828 | 2,971,430 |
| AvalonBay Communities Incorporated | | | | 3,619 | 898,851 |
| Boston Properties Incorporated | | | | 3,675 | 473,340 |
| Crown Castle International Corporation | | | | 11,219 | 2,071,027 |
| Digital Realty Trust Incorporated | | | | 7,351 | 1,042,372 |
| Duke Realty Corporation | | | | 9,876 | 573,401 |
| Equinix Incorporated | | | | 2,332 | 1,729,458 |
| Equity Residential | | | | 8,852 | 795,972 |
| Essex Property Trust Incorporated | | | | 1,690 | 583,861 |
| Extra Space Storage Incorporated | | | | 3,457 | 710,759 |
| Federal Realty Investment Trust | | | | 1,833 | 223,754 |
| Healthpeak Properties Incorporated | | | | 13,965 | 479,418 |
| Host Hotels & Resorts Incorporated | | | | 18,438 | 358,250 |
| Iron Mountain Incorporated | | | | 7,528 | 417,126 |
| Kimco Realty Corporation | | | | 15,921 | 393,249 |
| Mid-America Apartment Communities Incorporated | | | | 2,993 | 626,884 |
| Prologis Incorporated | | | | 19,204 | 3,101,062 |
| Public Storage Incorporated | | | | 3,953 | 1,542,777 |
| Realty Income Corporation | | | | 14,636 | 1,014,275 |
| Regency Centers Corporation | | | | 3,995 | 285,003 |
| SBA Communications Corporation | | | | 2,826 | 972,427 |
The accompanying notes are an integral part of these financial statements.
Allspring Index Asset Allocation Fund | 21
Portfolio of investments—March 31, 2022 (unaudited)
| | | | | Shares | Value |
| Equity REITs (continued) | | | | | |
| Simon Property Group Incorporated | | | | 8,459 | $ 1,112,866 |
| UDR Incorporated | | | | 7,762 | 445,306 |
| Ventas Incorporated | | | | 10,355 | 639,525 |
| Vornado Realty Trust | | | | 4,099 | 185,767 |
| Welltower Incorporated | | | | 11,286 | 1,085,036 |
| Weyerhaeuser Company | | | | 19,302 | 731,546 |
| | | | | | 26,223,455 |
| Real estate management & development: 0.05% | | | | | |
| CBRE Group Incorporated Class A † | | | | 8,659 | 792,472 |
| Utilities: 1.64% | | | | | |
| Electric utilities: 1.03% | | | | | |
| Alliant Energy Corporation | | | | 6,508 | 406,620 |
| American Electric Power Company Incorporated | | | | 13,082 | 1,305,191 |
| Constellation Energy Corporation | | | | 8,484 | 477,225 |
| Duke Energy Corporation | | | | 19,968 | 2,229,627 |
| Edison International | | | | 9,856 | 690,906 |
| Entergy Corporation | | | | 5,216 | 608,968 |
| Evergy Incorporated | | | | 5,957 | 407,101 |
| Eversource Energy | | | | 8,927 | 787,272 |
| Exelon Corporation | | | | 25,448 | 1,212,088 |
| FirstEnergy Corporation | | | | 14,806 | 679,003 |
| NextEra Energy Incorporated | | | | 50,891 | 4,310,977 |
| NRG Energy Incorporated | | | | 6,332 | 242,896 |
| Pinnacle West Capital Corporation | | | | 2,925 | 228,443 |
| PPL Corporation | | | | 19,530 | 557,777 |
| The Southern Company | | | | 27,521 | 1,995,548 |
| Xcel Energy Incorporated | | | | 13,994 | 1,009,947 |
| | | | | | 17,149,589 |
| Gas utilities: 0.02% | | | | | |
| Atmos Energy Corporation | | | | 3,523 | 420,963 |
| Independent power & renewable electricity producers: 0.03% | | | | | |
| AES Corporation | | | | 17,273 | 444,434 |
| Multi-utilities: 0.51% | | | | | |
| Ameren Corporation | | | | 6,702 | 628,380 |
| CenterPoint Energy Incorporated | | | | 16,277 | 498,727 |
| CMS Energy Corporation | | | | 7,527 | 526,438 |
| Consolidated Edison Incorporated | | | | 9,193 | 870,393 |
| Dominion Energy Incorporated | | | | 21,020 | 1,786,069 |
| DTE Energy Company | | | | 5,035 | 665,677 |
| NiSource Incorporated | | | | 10,199 | 324,328 |
| Public Service Enterprise Group Incorporated | | | | 13,134 | 919,380 |
| Sempra Energy | | | | 8,285 | 1,392,874 |
| WEC Energy Group Incorporated | | | | 8,193 | 817,743 |
| | | | | | 8,430,009 |
| Water utilities: 0.05% | | | | | |
| American Water Works Company Incorporated | | | | 4,710 | 779,646 |
| Total Common stocks (Cost $267,477,721) | | | | | 989,787,400 |
The accompanying notes are an integral part of these financial statements.
22 | Allspring Index Asset Allocation Fund
Portfolio of investments—March 31, 2022 (unaudited)
| | | Interest
rate | Maturitydate | Principal | Value |
| Non-agency mortgage-backed securities: 0.00% | | | | | |
| Citigroup Mortgage Loan Trust Incorporated Series 2004-HYB4 Class AA (1 Month LIBOR +0.33%) ± | | 0.79% | 12-25-2034 | $ 3,836 | $ 3,938 |
| Total Non-agency mortgage-backed securities (Cost $3,836) | | | | | 3,938 |
| U.S. Treasury securities: 36.09% | | | | | |
| U.S. Treasury Bond | | 1.13 | 5-15-2040 | 2,251,000 | 1,773,718 |
| U.S. Treasury Bond | | 1.13 | 8-15-2040 | 2,981,000 | 2,336,941 |
| U.S. Treasury Bond | | 1.25 | 5-15-2050 | 3,785,000 | 2,823,078 |
| U.S. Treasury Bond | | 1.38 | 11-15-2040 | 1,746,000 | 1,427,423 |
| U.S. Treasury Bond | | 1.38 | 8-15-2050 | 4,388,000 | 3,377,389 |
| U.S. Treasury Bond | | 1.63 | 11-15-2050 | 4,394,000 | 3,600,677 |
| U.S. Treasury Bond | | 1.75 | 8-15-2041 | 4,938,000 | 4,279,857 |
| U.S. Treasury Bond | | 1.88 | 2-15-2041 | 4,559,000 | 4,059,469 |
| U.S. Treasury Bond | | 1.88 | 2-15-2051 | 4,844,000 | 4,232,634 |
| U.S. Treasury Bond | | 2.00 | 2-15-2050 | 3,135,000 | 2,823,827 |
| U.S. Treasury Bond | | 2.25 | 8-15-2046 | 1,961,000 | 1,834,148 |
| U.S. Treasury Bond | | 2.25 | 8-15-2049 | 3,118,000 | 2,964,780 |
| U.S. Treasury Bond | | 2.38 | 11-15-2049 | 2,096,000 | 2,050,314 |
| U.S. Treasury Bond | | 2.50 | 2-15-2045 | 2,144,000 | 2,088,223 |
| U.S. Treasury Bond | | 2.50 | 2-15-2046 | 1,960,000 | 1,918,963 |
| U.S. Treasury Bond | | 2.50 | 5-15-2046 | 1,949,000 | 1,909,639 |
| U.S. Treasury Bond | | 2.75 | 8-15-2042 | 1,218,000 | 1,238,506 |
| U.S. Treasury Bond | | 2.75 | 11-15-2042 | 1,369,000 | 1,390,284 |
| U.S. Treasury Bond | | 2.75 | 8-15-2047 | 1,864,000 | 1,931,788 |
| U.S. Treasury Bond | | 2.75 | 11-15-2047 | 1,853,000 | 1,922,632 |
| U.S. Treasury Bond | | 2.88 | 5-15-2043 | 1,822,000 | 1,886,197 |
| U.S. Treasury Bond | | 2.88 | 8-15-2045 | 1,430,000 | 1,490,552 |
| U.S. Treasury Bond | | 2.88 | 11-15-2046 | 1,071,000 | 1,126,014 |
| U.S. Treasury Bond | | 2.88 | 5-15-2049 | 2,582,000 | 2,776,659 |
| U.S. Treasury Bond | | 3.00 | 5-15-2042 | 776,000 | 821,863 |
| U.S. Treasury Bond | | 3.00 | 11-15-2044 | 1,951,000 | 2,067,450 |
| U.S. Treasury Bond | | 3.00 | 5-15-2045 | 1,115,000 | 1,184,600 |
| U.S. Treasury Bond | | 3.00 | 11-15-2045 | 834,000 | 889,448 |
| U.S. Treasury Bond | | 3.00 | 2-15-2047 | 1,889,000 | 2,032,520 |
| U.S. Treasury Bond | | 3.00 | 5-15-2047 | 1,921,000 | 2,074,080 |
| U.S. Treasury Bond | | 3.00 | 2-15-2048 | 2,119,000 | 2,308,634 |
| U.S. Treasury Bond | | 3.00 | 8-15-2048 | 2,099,000 | 2,291,846 |
| U.S. Treasury Bond | | 3.00 | 2-15-2049 | 2,614,000 | 2,873,256 |
| U.S. Treasury Bond | | 3.13 | 11-15-2041 | 846,000 | 912,193 |
| U.S. Treasury Bond | | 3.13 | 2-15-2042 | 919,000 | 992,089 |
| U.S. Treasury Bond | | 3.13 | 2-15-2043 | 1,334,000 | 1,435,718 |
| U.S. Treasury Bond | | 3.13 | 8-15-2044 | 1,999,000 | 2,160,950 |
| U.S. Treasury Bond | | 3.13 | 5-15-2048 | 2,283,000 | 2,548,934 |
| U.S. Treasury Bond | | 3.38 | 5-15-2044 | 1,432,000 | 1,607,868 |
| U.S. Treasury Bond | | 3.38 | 11-15-2048 | 2,541,000 | 2,975,352 |
| U.S. Treasury Bond | | 3.50 | 2-15-2039 | 731,000 | 837,509 |
| U.S. Treasury Bond | | 3.63 | 8-15-2043 | 1,504,000 | 1,744,875 |
| U.S. Treasury Bond | | 3.63 | 2-15-2044 | 1,547,000 | 1,799,113 |
| U.S. Treasury Bond | | 3.75 | 8-15-2041 | 929,000 | 1,092,228 |
| U.S. Treasury Bond | | 3.75 | 11-15-2043 | 1,660,000 | 1,963,339 |
| U.S. Treasury Bond | | 3.88 | 8-15-2040 | 946,000 | 1,129,953 |
| U.S. Treasury Bond | | 4.25 | 5-15-2039 | 681,000 | 852,766 |
| U.S. Treasury Bond | | 4.25 | 11-15-2040 | 977,000 | 1,221,021 |
| U.S. Treasury Bond | | 4.38 | 2-15-2038 | 381,000 | 481,980 |
| U.S. Treasury Bond | | 4.38 | 11-15-2039 | 757,000 | 962,307 |
The accompanying notes are an integral part of these financial statements.
Allspring Index Asset Allocation Fund | 23
Portfolio of investments—March 31, 2022 (unaudited)
| | | Interest
rate | Maturitydate | Principal | Value |
| U.S. Treasury securities (continued) | | | | | |
| U.S. Treasury Bond | | 4.38% | 5-15-2040 | $ 1,078,000 | $ 1,371,587 |
| U.S. Treasury Bond | | 4.38 | 5-15-2041 | 842,000 | 1,069,965 |
| U.S. Treasury Bond | | 4.50 | 2-15-2036 | 837,000 | 1,059,099 |
| U.S. Treasury Bond | | 4.50 | 5-15-2038 | 428,000 | 549,211 |
| U.S. Treasury Bond | | 4.50 | 8-15-2039 | 721,000 | 930,625 |
| U.S. Treasury Bond | | 4.63 | 2-15-2040 | 730,000 | 956,471 |
| U.S. Treasury Bond | | 4.75 | 2-15-2037 | 264,000 | 344,438 |
| U.S. Treasury Bond | | 4.75 | 2-15-2041 | 1,084,000 | 1,442,525 |
| U.S. Treasury Bond | | 5.00 | 5-15-2037 | 375,000 | 501,709 |
| U.S. Treasury Bond | | 5.25 | 11-15-2028 | 479,000 | 561,197 |
| U.S. Treasury Bond | | 5.25 | 2-15-2029 | 349,000 | 411,111 |
| U.S. Treasury Bond | | 5.38 | 2-15-2031 | 752,000 | 934,448 |
| U.S. Treasury Bond | | 5.50 | 8-15-2028 | 369,000 | 435,016 |
| U.S. Treasury Bond | | 6.13 | 11-15-2027 | 525,000 | 625,119 |
| U.S. Treasury Bond | | 6.13 | 8-15-2029 | 293,000 | 366,685 |
| U.S. Treasury Bond | | 6.25 | 5-15-2030 | 478,000 | 614,865 |
| U.S. Treasury Bond | | 6.38 | 8-15-2027 | 224,000 | 268,100 |
| U.S. Treasury Bond | | 6.88 | 8-15-2025 | 224,000 | 255,763 |
| U.S. Treasury Note | | 0.13 | 4-30-2022 | 2,499,000 | 2,498,669 |
| U.S. Treasury Note | | 0.13 | 5-31-2022 | 2,659,000 | 2,657,839 |
| U.S. Treasury Note | | 0.13 | 5-15-2023 | 2,501,000 | 2,453,422 |
| U.S. Treasury Note | | 0.13 | 7-15-2023 | 2,396,000 | 2,338,627 |
| U.S. Treasury Note | | 0.13 | 8-15-2023 | 2,616,000 | 2,547,228 |
| U.S. Treasury Note | | 0.13 | 9-15-2023 | 2,914,000 | 2,831,247 |
| U.S. Treasury Note | | 0.13 | 10-15-2023 | 2,974,000 | 2,882,340 |
| U.S. Treasury Note | | 0.13 | 12-15-2023 | 3,018,000 | 2,911,427 |
| U.S. Treasury Note | | 0.13 | 1-15-2024 | 3,281,000 | 3,157,065 |
| U.S. Treasury Note | | 0.13 | 2-15-2024 | 3,940,000 | 3,783,477 |
| U.S. Treasury Note | | 0.25 | 4-15-2023 | 2,385,000 | 2,348,387 |
| U.S. Treasury Note | | 0.25 | 11-15-2023 | 3,497,000 | 3,388,538 |
| U.S. Treasury Note | | 0.25 | 3-15-2024 | 3,929,000 | 3,774,296 |
| U.S. Treasury Note | | 0.25 | 5-15-2024 | 3,937,000 | 3,763,065 |
| U.S. Treasury Note | | 0.25 | 5-31-2025 | 2,714,000 | 2,525,928 |
| U.S. Treasury Note | | 0.25 | 6-30-2025 | 2,925,000 | 2,717,394 |
| U.S. Treasury Note | | 0.25 | 7-31-2025 | 3,039,000 | 2,817,485 |
| U.S. Treasury Note | | 0.25 | 8-31-2025 | 3,153,000 | 2,917,264 |
| U.S. Treasury Note | | 0.25 | 9-30-2025 | 3,464,000 | 3,199,870 |
| U.S. Treasury Note | | 0.25 | 10-31-2025 | 3,586,000 | 3,306,264 |
| U.S. Treasury Note | | 0.38 | 4-15-2024 | 3,919,000 | 3,764,383 |
| U.S. Treasury Note | | 0.38 | 4-30-2025 | 2,591,000 | 2,426,127 |
| U.S. Treasury Note | | 0.38 | 11-30-2025 | 3,685,000 | 3,406,898 |
| U.S. Treasury Note | | 0.38 | 12-31-2025 | 3,794,000 | 3,503,374 |
| U.S. Treasury Note | | 0.38 | 1-31-2026 | 4,058,000 | 3,738,908 |
| U.S. Treasury Note | | 0.38 | 7-31-2027 | 2,771,000 | 2,484,483 |
| U.S. Treasury Note | | 0.38 | 9-30-2027 | 3,141,000 | 2,804,201 |
| U.S. Treasury Note | | 0.50 | 3-15-2023 | 2,052,000 | 2,029,556 |
| U.S. Treasury Note | | 0.50 | 3-31-2025 | 2,469,000 | 2,325,972 |
| U.S. Treasury Note | | 0.50 | 2-28-2026 | 4,104,000 | 3,794,276 |
| U.S. Treasury Note | | 0.50 | 4-30-2027 | 2,015,000 | 1,827,668 |
| U.S. Treasury Note | | 0.50 | 5-31-2027 | 2,282,000 | 2,065,210 |
| U.S. Treasury Note | | 0.50 | 6-30-2027 | 2,520,000 | 2,277,450 |
| U.S. Treasury Note | | 0.50 | 8-31-2027 | 2,918,000 | 2,628,252 |
| U.S. Treasury Note | | 0.50 | 10-31-2027 | 3,418,000 | 3,068,456 |
| U.S. Treasury Note | | 0.63 | 3-31-2027 | 1,681,000 | 1,536,736 |
| U.S. Treasury Note | | 0.63 | 11-30-2027 | 3,631,000 | 3,278,112 |
The accompanying notes are an integral part of these financial statements.
24 | Allspring Index Asset Allocation Fund
Portfolio of investments—March 31, 2022 (unaudited)
| | | Interest
rate | Maturitydate | Principal | Value |
| U.S. Treasury securities (continued) | | | | | |
| U.S. Treasury Note | | 0.63% | 12-31-2027 | $ 3,852,000 | $ 3,472,969 |
| U.S. Treasury Note | | 0.63 | 5-15-2030 | 3,675,000 | 3,204,284 |
| U.S. Treasury Note | | 0.63 | 8-15-2030 | 4,582,000 | 3,979,897 |
| U.S. Treasury Note | | 0.75 | 3-31-2026 | 4,059,000 | 3,785,176 |
| U.S. Treasury Note | | 0.75 | 4-30-2026 | 4,130,000 | 3,846,708 |
| U.S. Treasury Note | | 0.75 | 5-31-2026 | 4,136,000 | 3,846,803 |
| U.S. Treasury Note | | 0.75 | 1-31-2028 | 4,214,000 | 3,822,559 |
| U.S. Treasury Note | | 0.88 | 11-15-2030 | 2,681,000 | 2,374,046 |
| U.S. Treasury Note | | 1.13 | 2-28-2025 | 2,444,000 | 2,349,390 |
| U.S. Treasury Note | | 1.13 | 2-28-2027 | 964,000 | 904,503 |
| U.S. Treasury Note | | 1.13 | 2-29-2028 | 4,178,000 | 3,874,116 |
| U.S. Treasury Note | | 1.13 | 2-15-2031 | 7,183,000 | 6,485,744 |
| U.S. Treasury Note | | 1.25 | 7-31-2023 | 1,829,000 | 1,810,067 |
| U.S. Treasury Note | | 1.25 | 8-31-2024 | 1,400,000 | 1,360,352 |
| U.S. Treasury Note | | 1.25 | 3-31-2028 | 4,152,000 | 3,872,713 |
| U.S. Treasury Note | | 1.25 | 4-30-2028 | 4,224,000 | 3,934,920 |
| U.S. Treasury Note | | 1.25 | 5-31-2028 | 4,167,000 | 3,879,379 |
| U.S. Treasury Note | | 1.25 | 8-15-2031 | 7,687,000 | 6,987,954 |
| U.S. Treasury Note | | 1.38 | 10-15-2022 | 2,223,000 | 2,225,692 |
| U.S. Treasury Note | | 1.38 | 2-15-2023 | 1,589,000 | 1,586,083 |
| U.S. Treasury Note | | 1.38 | 6-30-2023 | 1,733,000 | 1,720,544 |
| U.S. Treasury Note | | 1.38 | 8-31-2023 | 1,817,000 | 1,798,972 |
| U.S. Treasury Note | | 1.38 | 9-30-2023 | 1,778,000 | 1,758,345 |
| U.S. Treasury Note | | 1.38 | 1-31-2025 | 2,372,000 | 2,298,987 |
| U.S. Treasury Note | | 1.38 | 8-31-2026 | 1,787,000 | 1,703,234 |
| U.S. Treasury Note | | 1.50 | 8-15-2022 | 2,254,000 | 2,259,107 |
| U.S. Treasury Note | | 1.50 | 9-15-2022 | 2,264,000 | 2,269,395 |
| U.S. Treasury Note | | 1.50 | 1-15-2023 | 2,250,000 | 2,249,736 |
| U.S. Treasury Note | | 1.50 | 2-28-2023 | 1,635,000 | 1,632,829 |
| U.S. Treasury Note | | 1.50 | 3-31-2023 | 1,679,000 | 1,675,065 |
| U.S. Treasury Note | | 1.50 | 9-30-2024 | 2,442,000 | 2,384,479 |
| U.S. Treasury Note | | 1.50 | 10-31-2024 | 2,391,000 | 2,332,719 |
| U.S. Treasury Note | | 1.50 | 11-30-2024 | 2,394,000 | 2,332,093 |
| U.S. Treasury Note | | 1.50 | 8-15-2026 | 3,430,000 | 3,287,039 |
| U.S. Treasury Note | | 1.50 | 1-31-2027 | 1,873,000 | 1,789,886 |
| U.S. Treasury Note | | 1.50 | 2-15-2030 | 4,305,000 | 4,035,938 |
| U.S. Treasury Note | | 1.63 | 8-15-2022 | 1,250,000 | 1,253,516 |
| U.S. Treasury Note | | 1.63 | 8-31-2022 | 1,827,000 | 1,831,996 |
| U.S. Treasury Note | | 1.63 | 11-15-2022 | 3,435,000 | 3,442,246 |
| U.S. Treasury Note | | 1.63 | 12-15-2022 | 2,239,000 | 2,243,286 |
| U.S. Treasury Note | | 1.63 | 4-30-2023 | 1,711,000 | 1,707,926 |
| U.S. Treasury Note | | 1.63 | 5-31-2023 | 1,714,000 | 1,708,510 |
| U.S. Treasury Note | | 1.63 | 10-31-2023 | 1,824,000 | 1,808,681 |
| U.S. Treasury Note | | 1.63 | 2-15-2026 | 3,342,000 | 3,230,513 |
| U.S. Treasury Note | | 1.63 | 5-15-2026 | 3,385,000 | 3,266,128 |
| U.S. Treasury Note | | 1.63 | 9-30-2026 | 1,851,000 | 1,782,238 |
| U.S. Treasury Note | | 1.63 | 10-31-2026 | 1,800,000 | 1,732,781 |
| U.S. Treasury Note | | 1.63 | 11-30-2026 | 1,912,000 | 1,840,300 |
| U.S. Treasury Note | | 1.63 | 8-15-2029 | 2,854,000 | 2,706,506 |
| U.S. Treasury Note | | 1.63 | 5-15-2031 | 7,512,000 | 7,072,431 |
| U.S. Treasury Note | | 1.75 | 4-30-2022 | 1,612,000 | 1,613,947 |
| U.S. Treasury Note | | 1.75 | 5-15-2022 | 1,448,000 | 1,450,565 |
| U.S. Treasury Note | | 1.75 | 5-31-2022 | 1,819,000 | 1,823,038 |
| U.S. Treasury Note | | 1.75 | 6-15-2022 | 2,235,000 | 2,240,588 |
| U.S. Treasury Note | | 1.75 | 6-30-2022 | 1,819,000 | 1,824,471 |
The accompanying notes are an integral part of these financial statements.
Allspring Index Asset Allocation Fund | 25
Portfolio of investments—March 31, 2022 (unaudited)
| | | Interest
rate | Maturitydate | Principal | Value |
| U.S. Treasury securities (continued) | | | | | |
| U.S. Treasury Note | | 1.75% | 7-15-2022 | $ 2,129,000 | $ 2,135,487 |
| U.S. Treasury Note | | 1.75 | 9-30-2022 | 1,771,000 | 1,777,088 |
| U.S. Treasury Note | | 1.75 | 1-31-2023 | 1,684,000 | 1,686,894 |
| U.S. Treasury Note | | 1.75 | 5-15-2023 | 3,117,000 | 3,112,860 |
| U.S. Treasury Note | | 1.75 | 6-30-2024 | 2,424,000 | 2,388,966 |
| U.S. Treasury Note | | 1.75 | 7-31-2024 | 2,406,000 | 2,368,406 |
| U.S. Treasury Note | | 1.75 | 12-31-2024 | 2,381,000 | 2,333,194 |
| U.S. Treasury Note | | 1.75 | 12-31-2026 | 1,893,000 | 1,831,625 |
| U.S. Treasury Note | | 1.75 | 11-15-2029 | 2,229,000 | 2,132,700 |
| U.S. Treasury Note | | 1.88 | 4-30-2022 | 1,812,000 | 1,814,268 |
| U.S. Treasury Note | | 1.88 | 5-31-2022 | 1,795,000 | 1,799,205 |
| U.S. Treasury Note | | 1.88 | 7-31-2022 | 1,815,000 | 1,821,594 |
| U.S. Treasury Note | | 1.88 | 8-31-2022 | 1,754,000 | 1,760,852 |
| U.S. Treasury Note | | 1.88 | 9-30-2022 | 2,248,000 | 2,257,045 |
| U.S. Treasury Note | | 1.88 | 10-31-2022 | 1,650,000 | 1,656,316 |
| U.S. Treasury Note | | 1.88 | 8-31-2024 | 1,345,000 | 1,326,244 |
| U.S. Treasury Note | | 1.88 | 6-30-2026 | 1,825,000 | 1,778,805 |
| U.S. Treasury Note | | 1.88 | 7-31-2026 | 1,828,000 | 1,781,158 |
| U.S. Treasury Note | | 2.00 | 7-31-2022 | 1,778,000 | 1,785,223 |
| U.S. Treasury Note | | 2.00 | 10-31-2022 | 2,238,000 | 2,248,054 |
| U.S. Treasury Note | | 2.00 | 11-30-2022 | 3,346,000 | 3,360,639 |
| U.S. Treasury Note | | 2.00 | 2-15-2023 | 3,077,000 | 3,087,457 |
| U.S. Treasury Note | | 2.00 | 4-30-2024 | 1,930,000 | 1,915,223 |
| U.S. Treasury Note | | 2.00 | 5-31-2024 | 1,934,000 | 1,917,682 |
| U.S. Treasury Note | | 2.00 | 6-30-2024 | 1,939,000 | 1,921,201 |
| U.S. Treasury Note | | 2.00 | 2-15-2025 | 3,537,000 | 3,487,261 |
| U.S. Treasury Note | | 2.00 | 8-15-2025 | 3,491,000 | 3,429,226 |
| U.S. Treasury Note | | 2.00 | 11-15-2026 | 3,370,000 | 3,296,281 |
| U.S. Treasury Note | | 2.00 | 8-15-2051 | 4,900,000 | 4,420,719 |
| U.S. Treasury Note | | 2.13 | 5-15-2022 | 2,105,000 | 2,109,610 |
| U.S. Treasury Note | | 2.13 | 6-30-2022 | 1,615,000 | 1,621,182 |
| U.S. Treasury Note | | 2.13 | 12-31-2022 | 3,385,000 | 3,402,189 |
| U.S. Treasury Note | | 2.13 | 11-30-2023 | 1,638,000 | 1,635,697 |
| U.S. Treasury Note | | 2.13 | 2-29-2024 | 1,298,000 | 1,293,335 |
| U.S. Treasury Note | | 2.13 | 3-31-2024 | 1,961,000 | 1,952,804 |
| U.S. Treasury Note | | 2.13 | 7-31-2024 | 1,927,000 | 1,913,300 |
| U.S. Treasury Note | | 2.13 | 9-30-2024 | 1,844,000 | 1,828,585 |
| U.S. Treasury Note | | 2.13 | 11-30-2024 | 1,852,000 | 1,833,914 |
| U.S. Treasury Note | | 2.13 | 5-15-2025 | 3,005,000 | 2,968,377 |
| U.S. Treasury Note | | 2.13 | 5-31-2026 | 1,793,000 | 1,764,984 |
| U.S. Treasury Note | | 2.25 | 4-15-2022 | 2,204,000 | 2,205,650 |
| U.S. Treasury Note | | 2.25 | 12-31-2023 | 1,247,000 | 1,246,805 |
| U.S. Treasury Note | | 2.25 | 1-31-2024 | 1,334,000 | 1,332,593 |
| U.S. Treasury Note | | 2.25 | 4-30-2024 | 2,418,000 | 2,411,577 |
| U.S. Treasury Note | | 2.25 | 10-31-2024 | 1,882,000 | 1,870,679 |
| U.S. Treasury Note | | 2.25 | 11-15-2024 | 3,535,000 | 3,513,044 |
| U.S. Treasury Note | | 2.25 | 12-31-2024 | 1,911,000 | 1,898,011 |
| U.S. Treasury Note | | 2.25 | 11-15-2025 | 3,473,000 | 3,437,592 |
| U.S. Treasury Note | | 2.25 | 3-31-2026 | 1,872,000 | 1,852,329 |
| U.S. Treasury Note | | 2.25 | 2-15-2027 | 3,350,000 | 3,314,930 |
| U.S. Treasury Note | | 2.25 | 8-15-2027 | 3,338,000 | 3,302,012 |
| U.S. Treasury Note | | 2.25 | 11-15-2027 | 3,248,000 | 3,210,572 |
| U.S. Treasury Note | | 2.25 | 5-15-2041 | 4,397,000 | 4,150,871 |
| U.S. Treasury Note | | 2.38 | 1-31-2023 | 2,325,000 | 2,340,984 |
| U.S. Treasury Note | | 2.38 | 2-29-2024 | 1,671,000 | 1,672,828 |
The accompanying notes are an integral part of these financial statements.
26 | Allspring Index Asset Allocation Fund
Portfolio of investments—March 31, 2022 (unaudited)
| | | Interest
rate | Maturitydate | Principal | Value |
| U.S. Treasury securities (continued) | | | | | |
| U.S. Treasury Note | | 2.38% | 8-15-2024 | $ 3,101,000 | $ 3,093,853 |
| U.S. Treasury Note | | 2.38 | 4-30-2026 | 1,812,000 | 1,801,454 |
| U.S. Treasury Note | | 2.38 | 5-15-2027 | 3,375,000 | 3,360,498 |
| U.S. Treasury Note | | 2.38 | 5-15-2029 | 3,295,000 | 3,285,475 |
| U.S. Treasury Note | | 2.38 | 5-15-2051 | 4,919,000 | 4,820,236 |
| U.S. Treasury Note | | 2.50 | 3-31-2023 | 2,278,000 | 2,295,441 |
| U.S. Treasury Note | | 2.50 | 8-15-2023 | 2,662,000 | 2,677,286 |
| U.S. Treasury Note | | 2.50 | 1-31-2024 | 1,876,000 | 1,882,302 |
| U.S. Treasury Note | | 2.50 | 5-15-2024 | 3,424,000 | 3,431,089 |
| U.S. Treasury Note | | 2.50 | 1-31-2025 | 1,936,000 | 1,935,546 |
| U.S. Treasury Note | | 2.50 | 2-28-2026 | 1,888,000 | 1,885,345 |
| U.S. Treasury Note | | 2.63 | 2-28-2023 | 2,359,000 | 2,379,641 |
| U.S. Treasury Note | | 2.63 | 6-30-2023 | 2,304,000 | 2,323,080 |
| U.S. Treasury Note | | 2.63 | 12-31-2023 | 2,404,000 | 2,419,307 |
| U.S. Treasury Note | | 2.63 | 3-31-2025 | 1,884,000 | 1,890,035 |
| U.S. Treasury Note | | 2.63 | 12-31-2025 | 1,914,000 | 1,920,804 |
| U.S. Treasury Note | | 2.63 | 1-31-2026 | 1,869,000 | 1,876,082 |
| U.S. Treasury Note | | 2.63 | 2-15-2029 | 3,512,000 | 3,554,254 |
| U.S. Treasury Note | | 2.75 | 4-30-2023 | 2,279,000 | 2,302,146 |
| U.S. Treasury Note | | 2.75 | 5-31-2023 | 2,334,000 | 2,356,611 |
| U.S. Treasury Note | | 2.75 | 7-31-2023 | 2,347,000 | 2,368,728 |
| U.S. Treasury Note | | 2.75 | 8-31-2023 | 2,402,000 | 2,424,050 |
| U.S. Treasury Note | | 2.75 | 11-15-2023 | 3,078,000 | 3,103,730 |
| U.S. Treasury Note | | 2.75 | 2-15-2024 | 2,325,000 | 2,342,801 |
| U.S. Treasury Note | | 2.75 | 2-28-2025 | 1,955,000 | 1,967,906 |
| U.S. Treasury Note | | 2.75 | 6-30-2025 | 1,959,000 | 1,972,009 |
| U.S. Treasury Note | | 2.75 | 8-31-2025 | 2,020,000 | 2,034,519 |
| U.S. Treasury Note | | 2.75 | 2-15-2028 | 4,229,000 | 4,294,417 |
| U.S. Treasury Note | | 2.88 | 9-30-2023 | 2,444,000 | 2,471,209 |
| U.S. Treasury Note | | 2.88 | 10-31-2023 | 2,318,000 | 2,342,719 |
| U.S. Treasury Note | | 2.88 | 11-30-2023 | 2,370,000 | 2,394,811 |
| U.S. Treasury Note | | 2.88 | 4-30-2025 | 1,884,000 | 1,903,429 |
| U.S. Treasury Note | | 2.88 | 5-31-2025 | 1,939,000 | 1,958,844 |
| U.S. Treasury Note | | 2.88 | 7-31-2025 | 1,949,000 | 1,970,317 |
| U.S. Treasury Note | | 2.88 | 11-30-2025 | 1,880,000 | 1,902,031 |
| U.S. Treasury Note | | 2.88 | 5-15-2028 | 4,397,000 | 4,499,539 |
| U.S. Treasury Note | | 2.88 | 8-15-2028 | 4,422,000 | 4,530,995 |
| U.S. Treasury Note | | 3.00 | 9-30-2025 | 1,994,000 | 2,024,767 |
| U.S. Treasury Note | | 3.00 | 10-31-2025 | 1,814,000 | 1,842,556 |
| U.S. Treasury Note | | 3.13 | 11-15-2028 | 3,621,000 | 3,770,225 |
| U.S. Treasury Note | | 6.00 | 2-15-2026 | 445,000 | 502,798 |
| U.S. Treasury Note | | 6.25 | 8-15-2023 | 378,000 | 399,381 |
| U.S. Treasury Note | | 6.50 | 11-15-2026 | 296,000 | 347,650 |
| U.S. Treasury Note | | 6.63 | 2-15-2027 | 215,000 | 255,514 |
| U.S. Treasury Note | | 6.75 | 8-15-2026 | 221,000 | 259,718 |
| U.S. Treasury Note | | 7.13 | 2-15-2023 | 260,000 | 272,309 |
| U.S. Treasury Note | | 7.25 | 8-15-2022 | 261,000 | 267,321 |
| U.S. Treasury Note | | 7.50 | 11-15-2024 | 240,000 | 270,703 |
| U.S. Treasury Note | | 7.63 | 11-15-2022 | 140,000 | 145,534 |
| U.S. Treasury Note | | 7.63 | 2-15-2025 | 216,000 | 246,831 |
| Total U.S. Treasury securities (Cost $613,659,987) | | | | | 598,008,795 |
The accompanying notes are an integral part of these financial statements.
Allspring Index Asset Allocation Fund | 27
Portfolio of investments—March 31, 2022 (unaudited)
| | | Yield | | Shares | Value |
| Short-term investments: 1.73% | | | | | |
| Investment companies: 1.73% | | | | | |
| Allspring Government Money Market Fund Select Class ♠∞ | | 0.18% | | 28,588,605 | $ 28,588,605 |
| Securities Lending Cash Investments LLC ♠∩∞ | | 0.40 | | 112,875 | 112,875 |
| Total Short-term investments (Cost $28,701,480) | | | | | 28,701,480 |
| Total investments in securities (Cost $909,865,783) | 97.55% | | | | 1,616,527,747 |
| Other assets and liabilities, net | 2.45 | | | | 40,556,318 |
| Total net assets | 100.00% | | | | $1,657,084,065 |
| † | Non-income-earning security |
| ± | Variable rate investment. The rate shown is the rate in effect at period end. |
| « | All or a portion of this security is on loan. |
| ♠ | The issuer of the security is an affiliated person of the Fund as defined in the Investment Company Act of 1940. |
| ∩ | The investment is a non-registered investment company purchased with cash collateral received from securities on loan. |
| ∞ | The rate represents the 7-day annualized yield at period end. |
| Abbreviations: |
| FNMA | Federal National Mortgage Association |
| LIBOR | London Interbank Offered Rate |
| REIT | Real estate investment trust |
Investments in affiliates
An affiliated investment is an investment in which the Fund owns at least 5% of the outstanding voting shares of the issuer or as a result of other relationships, such as the Fund and the issuer having the same investment manager. Transactions with issuers that were affiliates of the Fund at the end of the period were as follows:
| | Value,
beginning of
period | Purchases | Sales
proceeds | Net
realized
gains
(losses) | | Net
change in
unrealized
gains
(losses) | | Value,
end of
period | Shares,
end
of period | Income
from
affiliated
securities |
| Short-term investments | | | | | | | | | |
| Allspring Government Money Market Fund Select Class | $37,618,632 | $159,825,071 | $(168,855,098) | $0 | | $0 | | $ 28,588,605 | 28,588,605 | $ 5,977 |
| Securities Lending Cash Investments LLC | 114,180 | 4,699,800 | (4,701,105) | 0 | | 0 | | 112,875 | 112,875 | 100 # |
| | | | | $0 | | $0 | | $28,701,480 | | $6,077 |
| # | Amount shown represents income before fees and rebates. |
The accompanying notes are an integral part of these financial statements.
28 | Allspring Index Asset Allocation Fund
Portfolio of investments—March 31, 2022 (unaudited)
Futures contracts
| Description | Number of
contracts | Expiration
date | Notional
cost | Notional
value | Unrealized
gains | | Unrealized
losses |
| Long | | | | | | | |
| E-Mini S&P 500 Index | 217 | 6-17-2022 | $49,827,176 | $49,158,638 | $0 | | $ (668,538) |
| 10-Year U.S. Treasury Notes | 283 | 6-21-2022 | 35,611,058 | 34,773,625 | 0 | | (837,433) |
| U.S. Long Term Bonds | 55 | 6-21-2022 | 8,419,982 | 8,253,438 | 0 | | (166,544) |
| U.S. Ultra Treasury Bonds | 84 | 6-21-2022 | 15,131,078 | 14,878,500 | 0 | | (252,578) |
| 2-Year U.S. Treasury Notes | 131 | 6-30-2022 | 28,014,992 | 27,761,766 | 0 | | (253,226) |
| 5-Year U.S. Treasury Notes | 333 | 6-30-2022 | 38,809,365 | 38,190,938 | 0 | | (618,427) |
| | | | | | $0 | | $(2,796,746) |
The accompanying notes are an integral part of these financial statements.
Allspring Index Asset Allocation Fund | 29
Statement of assets and liabilities—March 31, 2022 (unaudited)
| | |
| Assets | |
Investments in unaffiliated securities (including $110,510 of securities loaned), at value (cost $881,164,303)
| $ 1,587,826,267 |
Investments in affiliated securities, at value (cost $28,701,480)
| 28,701,480 |
Cash at broker segregated for futures contracts
| 4,539,860 |
Receivable for investments sold
| 34,404,020 |
Receivable for dividends and interest
| 3,227,965 |
Receivable for Fund shares sold
| 1,062,902 |
Receivable for daily variation margin on open futures contracts
| 118,818 |
Receivable for securities lending income, net
| 77 |
Prepaid expenses and other assets
| 352,113 |
Total assets
| 1,660,233,502 |
| Liabilities | |
Payable for Fund shares redeemed
| 891,359 |
Management fee payable
| 778,183 |
Payable for daily variation margin on open futures contracts
| 707,963 |
Shareholder servicing fees payable
| 308,707 |
Administration fees payable
| 257,103 |
Payable upon receipt of securities loaned
| 112,875 |
Distribution fee payable
| 90,549 |
Trustees’ fees and expenses payable
| 2,698 |
Total liabilities
| 3,149,437 |
Total net assets
| $1,657,084,065 |
| Net assets consist of | |
Paid-in capital
| $ 943,204,263 |
Total distributable earnings
| 713,879,802 |
Total net assets
| $1,657,084,065 |
| Computation of net asset value and offering price per share | |
Net assets – Class A
| $ 986,105,544 |
Shares outstanding – Class A1
| 23,677,122 |
Net asset value per share – Class A
| $41.65 |
Maximum offering price per share – Class A2
| $44.19 |
Net assets – Class C
| $ 143,671,170 |
Shares outstanding – Class C1
| 5,704,078 |
Net asset value per share – Class C
| $25.19 |
Net assets – Administrator Class
| $ 353,445,892 |
Shares outstanding – Administrator Class1
| 8,483,129 |
Net asset value per share – Administrator Class
| $41.66 |
Net assets – Institutional Class
| $ 173,861,459 |
Shares outstanding – Institutional Class1
| 4,176,441 |
Net asset value per share – Institutional Class
| $41.63 |
| 1 | The Fund has an unlimited number of authorized shares. |
| 2 | Maximum offering price is computed as 100/94.25 of net asset value. On investments of $50,000 or more, the offering price is reduced. |
The accompanying notes are an integral part of these financial statements.
30 | Allspring Index Asset Allocation Fund
Statement of operations—six months ended March 31, 2022 (unaudited)
| | |
| Investment income | |
Dividends (net of foreign withholdings taxes of $1,513)
| $ 7,370,651 |
Interest
| 5,448,141 |
Income from affiliated securities
| 6,394 |
Total investment income
| 12,825,186 |
| Expenses | |
Management fee
| 5,077,487 |
| Administration fees | |
Class A
| 1,068,979 |
Class C
| 157,979 |
Administrator Class
| 236,958 |
Institutional Class
| 115,236 |
| Shareholder servicing fees | |
Class A
| 1,272,594 |
Class C
| 187,806 |
Administrator Class
| 454,317 |
| Distribution fee | |
Class C
| 563,275 |
Custody and accounting fees
| 54,638 |
Professional fees
| 32,167 |
Registration fees
| 62,574 |
Shareholder report expenses
| 72,399 |
Trustees’ fees and expenses
| 10,682 |
Other fees and expenses
| 96,823 |
Total expenses
| 9,463,914 |
| Less: Fee waivers and/or expense reimbursements | |
Fund-level
| (156,268) |
Class A
| (44,319) |
Class C
| (2) |
Administrator Class
| (101,748) |
Net expenses
| 9,161,577 |
Net investment income
| 3,663,609 |
| Realized and unrealized gains (losses) on investments | |
| Net realized gains (losses) on | |
Unaffiliated securities
| 45,695,374 |
Futures contracts
| (8,154,107) |
Net realized gains on investments
| 37,541,267 |
| Net change in unrealized gains (losses) on | |
Unaffiliated securities
| (28,683,187) |
Futures contracts
| 3,598,412 |
Net change in unrealized gains (losses) on investments
| (25,084,775) |
Net realized and unrealized gains (losses) on investments
| 12,456,492 |
Net increase in net assets resulting from operations
| $ 16,120,101 |
The accompanying notes are an integral part of these financial statements.
Allspring Index Asset Allocation Fund | 31
Statement of changes in net assets
| | | | | |
| | Six months ended
March 31, 2022
(unaudited) | Year ended
September 30, 2021 |
| Operations | | | | |
Net investment income
| | $ 3,663,609 | | $ 7,442,921 |
Net realized gains on investments
| | 37,541,267 | | 100,337,318 |
Net change in unrealized gains (losses) on investments
| | (25,084,775) | | 131,049,261 |
Net increase in net assets resulting from operations
| | 16,120,101 | | 238,829,500 |
| Distributions to shareholders from | | | | |
| Net investment income and net realized gains | | | | |
Class A
| | (59,782,610) | | (30,498,113) |
Class C
| | (8,330,567) | | (4,333,666) |
Administrator Class
| | (21,995,412) | | (9,785,404) |
Institutional Class
| | (11,027,618) | | (5,192,389) |
Total distributions to shareholders
| | (101,136,207) | | (49,809,572) |
| Capital share transactions | Shares | | Shares | |
| Proceeds from shares sold | | | | |
Class A
| 441,111 | 19,118,692 | 1,352,827 | 56,159,764 |
Class C
| 310,469 | 8,178,331 | 953,463 | 24,071,361 |
Administrator Class
| 1,066,459 | 46,626,761 | 2,969,596 | 124,877,966 |
Institutional Class
| 859,500 | 38,005,209 | 1,035,807 | 42,907,365 |
| | | 111,928,993 | | 248,016,456 |
| Reinvestment of distributions | | | | |
Class A
| 1,316,663 | 57,503,104 | 737,326 | 29,412,719 |
Class C
| 303,625 | 8,012,673 | 169,584 | 4,105,876 |
Administrator Class
| 501,573 | 21,935,299 | 244,129 | 9,743,414 |
Institutional Class
| 196,741 | 8,603,924 | 97,312 | 3,879,807 |
| | | 96,055,000 | | 47,141,816 |
| Payment for shares redeemed | | | | |
Class A
| (1,247,229) | (54,194,004) | (2,251,935) | (94,497,079) |
Class C
| (609,066) | (15,988,394) | (1,550,509) | (39,295,545) |
Administrator Class
| (1,272,008) | (55,359,418) | (2,277,568) | (96,108,964) |
Institutional Class
| (660,880) | (28,542,591) | (953,782) | (39,922,465) |
| | | (154,084,407) | | (269,824,053) |
Net increase in net assets resulting from capital share transactions
| | 53,899,586 | | 25,334,219 |
Total increase (decrease) in net assets
| | (31,116,520) | | 214,354,147 |
| Net assets | | | | |
Beginning of period
| | 1,688,200,585 | | 1,473,846,438 |
End of period
| | $1,657,084,065 | | $1,688,200,585 |
The accompanying notes are an integral part of these financial statements.
32 | Allspring Index Asset Allocation Fund
Financial highlights
(For a share outstanding throughout each period)
| | | Year ended September 30 |
| Class A | Six months ended
March 31, 2022
(unaudited) | 2021 | 2020 | 2019 | 2018 | 2017 |
Net asset value, beginning of period
| $43.74 | $38.89 | $35.13 | $34.63 | $31.99 | $29.61 |
Net investment income
| 0.09 | 0.19 | 0.30 | 0.33 | 0.27 | 0.25 |
Net realized and unrealized gains (losses) on investments
| 0.43 | 5.97 | 4.22 | 1.46 | 2.83 | 2.67 |
Total from investment operations
| 0.52 | 6.16 | 4.52 | 1.79 | 3.10 | 2.92 |
| Distributions to shareholders from | | | | | | |
Net investment income
| (0.15) | (0.12) | (0.30) | (0.33) | (0.27) | (0.27) |
Net realized gains
| (2.46) | (1.19) | (0.46) | (0.96) | (0.19) | (0.27) |
Total distributions to shareholders
| (2.61) | (1.31) | (0.76) | (1.29) | (0.46) | (0.54) |
Net asset value, end of period
| $41.65 | $43.74 | $38.89 | $35.13 | $34.63 | $31.99 |
Total return1
| 0.94% | 16.18% | 13.08% | 5.54% | 9.76% | 9.99% |
| Ratios to average net assets (annualized) | | | | | | |
Gross expenses
| 1.09% | 1.09% | 1.10% | 1.11% | 1.08% | 1.09% |
Net expenses
| 1.08% | 1.08% | 1.08% | 1.08% | 1.07% | 1.09% |
Net investment income
| 0.42% | 0.46% | 0.83% | 0.99% | 0.80% | 0.79% |
| Supplemental data | | | | | | |
Portfolio turnover rate
| 5% | 11% | 19% | 14% | 9% | 9% |
Net assets, end of period (000s omitted)
| $986,106 | $1,013,263 | $907,134 | $834,289 | $830,487 | $822,769 |
| 1 | Total return calculations do not include any sales charges. Returns for periods of less than one year are not annualized. |
The accompanying notes are an integral part of these financial statements.
Allspring Index Asset Allocation Fund | 33
Financial highlights
(For a share outstanding throughout each period)
| | | Year ended September 30 |
| Class C | Six months ended
March 31, 2022
(unaudited) | 2021 | 2020 | 2019 | 2018 | 2017 |
Net asset value, beginning of period
| $26.46 | $23.64 | $21.36 | $21.07 | $19.45 | $17.99 |
Net investment income (loss)
| (0.04) | (0.08) | 0.01 | 0.05 | 0.01 | 0.01 |
Net realized and unrealized gains (losses) on investments
| 0.26 | 3.63 | 2.57 | 0.88 | 1.73 | 1.62 |
Total from investment operations
| 0.22 | 3.55 | 2.58 | 0.93 | 1.74 | 1.63 |
| Distributions to shareholders from | | | | | | |
Net investment income
| 0.00 | (0.01) | (0.02) | (0.06) | (0.00) 1 | (0.01) |
Net realized gains
| (1.49) | (0.72) | (0.28) | (0.58) | (0.12) | (0.16) |
Total distributions to shareholders
| (1.49) | (0.73) | (0.30) | (0.64) | (0.12) | (0.17) |
Net asset value, end of period
| $25.19 | $26.46 | $23.64 | $21.36 | $21.07 | $19.45 |
Total return2
| 0.57% | 15.31% | 12.22% | 4.75% | 8.97% | 9.14% |
| Ratios to average net assets (annualized) | | | | | | |
Gross expenses
| 1.84% | 1.84% | 1.85% | 1.86% | 1.83% | 1.84% |
Net expenses
| 1.83% | 1.83% | 1.83% | 1.83% | 1.82% | 1.84% |
Net investment income (loss)
| (0.33)% | (0.29)% | 0.08% | 0.24% | 0.05% | 0.04% |
| Supplemental data | | | | | | |
Portfolio turnover rate
| 5% | 11% | 19% | 14% | 9% | 9% |
Net assets, end of period (000s omitted)
| $143,671 | $150,795 | $144,828 | $144,264 | $153,322 | $152,820 |
| 1 | Amount is less than $0.005. |
| 2 | Total return calculations do not include any sales charges. Returns for periods of less than one year are not annualized. |
The accompanying notes are an integral part of these financial statements.
34 | Allspring Index Asset Allocation Fund
Financial highlights
(For a share outstanding throughout each period)
| | | Year ended September 30 |
| Administrator Class | Six months ended
March 31, 2022
(unaudited) | 2021 | 2020 | 2019 | 2018 | 2017 |
Net asset value, beginning of period
| $43.80 | $38.89 | $35.14 | $34.64 | $31.99 | $29.63 |
Net investment income
| 0.12 | 0.26 | 0.37 | 0.39 | 0.32 | 0.30 |
Net realized and unrealized gains (losses) on investments
| 0.44 | 5.98 | 4.20 | 1.46 | 2.84 | 2.68 |
Total from investment operations
| 0.56 | 6.24 | 4.57 | 1.85 | 3.16 | 2.98 |
| Distributions to shareholders from | | | | | | |
Net investment income
| (0.23) | (0.14) | (0.36) | (0.39) | (0.32) | (0.35) |
Net realized gains
| (2.47) | (1.19) | (0.46) | (0.96) | (0.19) | (0.27) |
Total distributions to shareholders
| (2.70) | (1.33) | (0.82) | (1.35) | (0.51) | (0.62) |
Net asset value, end of period
| $41.66 | $43.80 | $38.89 | $35.14 | $34.64 | $31.99 |
Total return1
| 1.01% | 16.40% | 13.26% | 5.73% | 9.94% | 10.20% |
| Ratios to average net assets (annualized) | | | | | | |
Gross expenses
| 1.01% | 1.01% | 1.02% | 1.03% | 1.00% | 0.99% |
Net expenses
| 0.90% | 0.90% | 0.90% | 0.90% | 0.90% | 0.90% |
Net investment income
| 0.60% | 0.63% | 1.01% | 1.17% | 0.97% | 0.96% |
| Supplemental data | | | | | | |
Portfolio turnover rate
| 5% | 11% | 19% | 14% | 9% | 9% |
Net assets, end of period (000s omitted)
| $353,446 | $358,573 | $281,988 | $229,390 | $216,611 | $268,512 |
| 1 | Returns for periods of less than one year are not annualized. |
The accompanying notes are an integral part of these financial statements.
Allspring Index Asset Allocation Fund | 35
Financial highlights
(For a share outstanding throughout each period)
| | | Year ended September 30 |
| Institutional Class | Six months ended
March 31, 2022
(unaudited) | 2021 | 2020 | 2019 | 2018 | 2017 1 |
Net asset value, beginning of period
| $43.79 | $38.84 | $35.09 | $34.59 | $31.96 | $29.27 |
Net investment income
| 0.15 | 0.33 | 0.42 | 0.44 | 0.39 | 0.35 |
Net realized and unrealized gains (losses) on investments
| 0.45 | 5.97 | 4.21 | 1.46 | 2.81 | 3.03 |
Total from investment operations
| 0.60 | 6.30 | 4.63 | 1.90 | 3.20 | 3.38 |
| Distributions to shareholders from | | | | | | |
Net investment income
| (0.29) | (0.16) | (0.42) | (0.44) | (0.38) | (0.42) |
Net realized gains
| (2.47) | (1.19) | (0.46) | (0.96) | (0.19) | (0.27) |
Total distributions to shareholders
| (2.76) | (1.35) | (0.88) | (1.40) | (0.57) | (0.69) |
Net asset value, end of period
| $41.63 | $43.79 | $38.84 | $35.09 | $34.59 | $31.96 |
Total return2
| 1.10% | 16.57% | 13.44% | 5.89% | 10.11% | 11.70% |
| Ratios to average net assets (annualized) | | | | | | |
Gross expenses
| 0.76% | 0.76% | 0.77% | 0.78% | 0.75% | 0.74% |
Net expenses
| 0.75% | 0.75% | 0.75% | 0.75% | 0.74% | 0.74% |
Net investment income
| 0.75% | 0.79% | 1.16% | 1.32% | 1.13% | 1.08% |
| Supplemental data | | | | | | |
Portfolio turnover rate
| 5% | 11% | 19% | 14% | 9% | 9% |
Net assets, end of period (000s omitted)
| $173,861 | $165,569 | $139,896 | $123,504 | $110,566 | $61,060 |
| 1 | For the period from October 31, 2016 (commencement of class operations) to September 30, 2017 |
| 2 | Returns for periods of less than one year are not annualized. |
The accompanying notes are an integral part of these financial statements.
36 | Allspring Index Asset Allocation Fund
Notes to financial statements (unaudited)
1. ORGANIZATION
Allspring Funds Trust (the "Trust"), a Delaware statutory trust organized on March 10, 1999, is an open-end management investment company registered under the Investment Company Act of 1940, as amended (the "1940 Act"). As an investment company, the Trust follows the accounting and reporting guidance in Financial Accounting Standards Board ("FASB") Accounting Standards Codification Topic 946, Financial Services – Investment Companies. These financial statements report on the Allspring Index Asset Allocation Fund (the "Fund") which is a diversified series of the Trust.
Effective on November 1, 2021, the sale transaction of Wells Fargo Asset Management ("WFAM") by Wells Fargo & Company to GTCR LLC and Reverence Capital Partners, L.P. was closed. In connection with the closing of the transaction, WFAM became known as Allspring Global Investments (“Allspring”) and various entities that provided services to the Fund changed their names to "Allspring", including Allspring Funds Management, LLC, the investment manager to the Fund, Allspring Global Investments, LLC and Allspring Global Investments (UK) Limited, both registered investment advisers providing subadvisory services to certain funds, and Allspring Funds Distributor, LLC, the Fund's principal underwriter. Consummation of the transaction resulted in a new investment management agreement and subadvisory agreement which became effective on November 1, 2021.
2. SIGNIFICANT ACCOUNTING POLICIES
The following significant accounting policies, which are consistently followed in the preparation of the financial statements of the Fund, are in conformity with U.S. generally accepted accounting principles which require management to make estimates and assumptions that affect the reported amounts of assets and liabilities, disclosure of contingent assets and liabilities at the date of the financial statements, and the reported amounts of income and expenses during the reporting period. Actual results could differ from those estimates.
Securities valuation
All investments are valued each business day as of the close of regular trading on the New York Stock Exchange (generally 4 p.m. Eastern Time), although the Fund may deviate from this calculation time under unusual or unexpected circumstances.
Equity securities and futures contracts that are listed on a foreign or domestic exchange or market are valued at the official closing price or, if none, the last sales price. If no sale occurs on the principal exchange or market that day, a fair value price will be determined in accordance with the Fund’s Valuation Procedures.
Debt securities are valued at the evaluated bid price provided by an independent pricing service (e.g. taking into account various factors, including yields, maturities, or credit ratings) or, if a reliable price is not available, the quoted bid price from an independent broker-dealer.
Investments in registered open-end investment companies are valued at net asset value. Interests in non-registered investment companies that are redeemable at net asset value are fair valued normally at net asset value.
Investments which are not valued using any of the methods discussed above are valued at their fair value, as determined in good faith by the Board of Trustees. The Board of Trustees has established a Valuation Committee comprised of the Trustees and has delegated to it the authority to take any actions regarding the valuation of portfolio securities that the Valuation Committee deems necessary or appropriate, including determining the fair value of portfolio securities, unless the determination has been delegated to the Allspring Global Investments Pricing Committee at Allspring Funds Management, LLC ("Allspring Funds Management"). The Board of Trustees retains the authority to make or ratify any valuation decisions or approve any changes to the Valuation Procedures as it deems appropriate. On a quarterly basis, the Board of Trustees receives reports on any valuation actions taken by the Valuation Committee or the Allspring Global Investments Pricing Committee which may include items for ratification.
Securities lending
The Fund may lend its securities from time to time in order to earn additional income in the form of fees or interest on securities received as collateral or the investment of any cash received as collateral. When securities are on loan, the Fund receives interest or dividends on those securities. Cash collateral received in connection with its securities lending transactions is invested in Securities Lending Cash Investments, LLC (the "Securities Lending Fund"), an affiliated non-registered investment company. Investments in Securities Lending Fund are valued at the evaluated bid price provided by an independent pricing service. Income earned from investment in the Securities Lending Fund (net of fees and rebates), if any, is included in income from affiliated securities on the Statement of Operations.
In a securities lending transaction, the net asset value of the Fund is affected by an increase or decrease in the value of the securities loaned and by an increase or decrease in the value of the instrument in which collateral is invested. The amount of
Allspring Index Asset Allocation Fund | 37
Notes to financial statements (unaudited)
securities lending activity undertaken by the Fund fluctuates from time to time. The Fund has the right under the lending agreement to recover the securities from the borrower on demand. In the event of default or bankruptcy by the borrower, the Fund may be prevented from recovering the loaned securities or gaining access to the collateral or may experience delays or costs in doing so. In such an event, the terms of the agreement allow the unaffiliated securities lending agent to use the collateral to purchase replacement securities on behalf of the Fund or pay the Fund the market value of the loaned securities. The Fund bears the risk of loss with respect to depreciation of its investment of the cash collateral.
Futures contracts
Futures contracts are agreements between the Fund and a counterparty to buy or sell a specific amount of a commodity, financial instrument or currency at a specified price on a specified date. The Fund may buy and sell futures contracts in order to gain exposure to, or protect against, changes in interest rates and security values and is subject to interest rate risk and equity price risk. The primary risks associated with the use of futures contracts are the imperfect correlation between changes in market values of securities held by the Fund and the prices of futures contracts, and the possibility of an illiquid market. Futures contracts are generally entered into on a regulated futures exchange and cleared through a clearinghouse associated with the exchange. With futures contracts, there is minimal counterparty risk to the Fund since futures contracts are exchange traded and the exchange’s clearinghouse, as the counterparty to all exchange traded futures, guarantees the futures contracts against default.
Upon entering into a futures contract, the Fund is required to deposit either cash or securities (initial margin) with the broker in an amount equal to a certain percentage of the contract value. Subsequent payments (variation margin) are paid to or from the broker each day equal to the daily changes in the contract value. Such payments are recorded as unrealized gains or losses and, if any, shown as variation margin receivable (payable) in the Statement of Assets and Liabilities. Should the Fund fail to make requested variation margin payments, the broker can gain access to the initial margin to satisfy the Fund’s payment obligations. When the contracts are closed, a realized gain or loss is recorded in the Statement of Operations.
Security transactions and income recognition
Securities transactions are recorded on a trade date basis. Realized gains or losses are recorded on the basis of identified cost.
Dividend income is recognized on the ex-dividend date.
Interest income is accrued daily and bond discounts are accreted and premiums are amortized daily. To the extent debt obligations are placed on non-accrual status, any related interest income may be reduced by writing off interest receivables when the collection of all or a portion of interest has been determined to be doubtful based on consistently applied procedures and the fair value has decreased. If the issuer subsequently resumes interest payments or when the collectability of interest is reasonably assured, the debt obligation is removed from non-accrual status.
Income is recorded net of foreign taxes withheld where recovery of such taxes is not assured.
Distributions to shareholders
Distributions to shareholders are recorded on the ex-dividend date and paid from net investment income quarterly and any net realized gains are paid at least annually. Such distributions are determined in accordance with income tax regulations and may differ from U.S. generally accepted accounting principles. Dividend sources are estimated at the time of declaration. The tax character of distributions is determined as of the Fund's fiscal year end. Therefore, a portion of the Fund's distributions made prior to the Fund’s fiscal year end may be categorized as a tax return of capital at year end.
Federal and other taxes
The Fund intends to continue to qualify as a regulated investment company by distributing substantially all of its investment company taxable income and any net realized capital gains (after reduction for capital loss carryforwards) sufficient to relieve it from all, or substantially all, federal income taxes. Accordingly, no provision for federal income taxes was required.
The Fund’s income and federal excise tax returns and all financial records supporting those returns for the prior three fiscal years are subject to examination by the federal and Delaware revenue authorities. Management has analyzed the Fund's tax positions taken on federal, state, and foreign tax returns for all open tax years and does not believe that there are any uncertain tax positions that require recognition of a tax liability.
38 | Allspring Index Asset Allocation Fund
Notes to financial statements (unaudited)
As of March 31, 2022, the aggregate cost of all investments for federal income tax purposes was $913,473,107 and the unrealized gains (losses) consisted of:
| Gross unrealized gains | $742,488,140 |
| Gross unrealized losses | (42,230,246) |
| Net unrealized gains | $700,257,894 |
Class allocations
The separate classes of shares offered by the Fund differ principally in applicable sales charges, distribution, shareholder servicing, and administration fees. Class specific expenses are charged directly to that share class. Investment income, common fund-level expenses, and realized and unrealized gains (losses) on investments are allocated daily to each class of shares based on the relative proportion of net assets of each class.
3. FAIR VALUATION MEASUREMENTS
Fair value measurements of investments are determined within a framework that has established a fair value hierarchy based upon the various data inputs utilized in determining the value of the Fund’s investments. The three-level hierarchy gives the highest priority to unadjusted quoted prices in active markets for identical assets or liabilities (Level 1) and the lowest priority to unobservable inputs (Level 3). The Fund’s investments are classified within the fair value hierarchy based on the lowest level of input that is significant to the fair value measurement. The inputs are summarized into three broad levels as follows:
| ■ | Level 1 – quoted prices in active markets for identical securities |
| ■ | Level 2 – other significant observable inputs (including quoted prices for similar securities, interest rates, prepayment speeds, credit risk, etc.) |
| ■ | Level 3 – significant unobservable inputs (including the Fund’s own assumptions in determining the fair value of investments) |
The inputs or methodologies used for valuing investments in securities are not necessarily an indication of the risk associated with investing in those securities.
Allspring Index Asset Allocation Fund | 39
Notes to financial statements (unaudited)
The following is a summary of the inputs used in valuing the Fund’s assets and liabilities as of March 31, 2022:
| | Quoted prices
(Level 1) | Other significant
observable inputs
(Level 2) | Significant
unobservable inputs
(Level 3) | Total |
| Assets | | | | |
| Investments in: | | | | |
| Agency securities | $ 0 | $ 26,134 | $0 | $ 26,134 |
| Common stocks | | | | |
| Communication services | 92,626,245 | 0 | 0 | 92,626,245 |
| Consumer discretionary | 118,662,548 | 0 | 0 | 118,662,548 |
| Consumer staples | 60,392,173 | 0 | 0 | 60,392,173 |
| Energy | 38,428,027 | 0 | 0 | 38,428,027 |
| Financials | 110,017,478 | 0 | 0 | 110,017,478 |
| Health care | 134,974,147 | 0 | 0 | 134,974,147 |
| Industrials | 77,860,778 | 0 | 0 | 77,860,778 |
| Information technology | 276,682,548 | 0 | 0 | 276,682,548 |
| Materials | 25,902,888 | 0 | 0 | 25,902,888 |
| Real estate | 27,015,927 | 0 | 0 | 27,015,927 |
| Utilities | 27,224,641 | 0 | 0 | 27,224,641 |
| Non-agency mortgage-backed securities | 0 | 3,938 | 0 | 3,938 |
| U.S. Treasury securities | 598,008,795 | 0 | 0 | 598,008,795 |
| Short-term investments | | | | |
| Investment companies | 28,701,480 | 0 | 0 | 28,701,480 |
| Total assets | $1,616,497,675 | $30,072 | $0 | $1,616,527,747 |
| Liabilities | | | | |
| Futures contracts | $ 2,796,746 | $ 0 | $0 | $ 2,796,746 |
| Total liabilities | $ 2,796,746 | $ 0 | $0 | $ 2,796,746 |
Futures contracts are reported at their cumulative unrealized gains (losses) at measurement date as reported in the table following the Portfolio of Investments. For futures contracts, the current day’s variation margin is reported on the Statement of Assets and Liabilities. All other assets and liabilities are reported at their market value at measurement date.
Additional sector, industry or geographic detail, if any, is included in the Portfolio of Investments.
For the six months ended March 31, 2022, the Fund did not have any transfers into/out of Level 3.
4. TRANSACTIONS WITH AFFILIATES
Management fee
Allspring Funds Management, a wholly owned subsidiary of Allspring Global Investments Holdings, LLC, a holding company indirectly owned by certain private funds of GTCR LLC and Reverence Capital Partners, L.P., is the manager of the Fund and provides advisory and fund-level administrative services under an investment management agreement. Under the investment management agreement, Allspring Funds Management is responsible for, among other services, implementing the investment objectives and strategies of the Fund, supervising the subadviser and providing fund-level administrative services in connection with the Fund’s operations. As compensation for its services under the investment management agreement, Allspring Funds Management is entitled to receive a management fee at the following annual rate based on the Fund’s average daily net assets:
40 | Allspring Index Asset Allocation Fund
Notes to financial statements (unaudited)
| Average daily net assets | Management fee |
| First $500 million | 0.650% |
| Next $500 million | 0.600 |
| Next $2 billion | 0.550 |
| Next $2 billion | 0.525 |
| Next $5 billion | 0.490 |
| Over $10 billion | 0.480 |
For the six months ended March 31, 2022, the management fee was equivalent to an annual rate of 0.59% of the Fund’s average daily net assets.
Allspring Funds Management has retained the services of a subadviser to provide daily portfolio management to the Fund. The fee for subadvisory services is borne by Allspring Funds Management. Allspring Global Investments, LLC ("Allspring Investments"), an affiliate of Allspring Funds Management and a wholly owned subsidiary of Allspring Global Investments Holdings, LLC, is the subadviser to the Fund and is entitled to receive a fee from Allspring Funds Management at an annual rate starting at 0.15% and declining to 0.10% as the average daily net assets of the Fund increase.
Administration fees
Under a class-level administration agreement, Allspring Funds Management provides class-level administrative services to the Fund, which includes paying fees and expenses for services provided by the transfer agent, sub-transfer agents, omnibus account servicers and record-keepers. As compensation for its services under the class-level administration agreement, Allspring Funds Management receives an annual fee which is calculated based on the average daily net assets of each class as follows:
| | Class-level
administration fee |
| Class A | 0.21% |
| Class C | 0.21 |
| Administrator Class | 0.13 |
| Institutional Class | 0.13 |
Waivers and/or expense reimbursements
Allspring Funds Management has contractually committed to waive and/or reimburse management and administration fees to the extent necessary to maintain certain net operating expense ratios for the Fund. When each class of the Fund has exceeded its expense cap, Allspring Funds Management will waive fees and/or reimburse expenses from fund-level expenses on a proportionate basis and then from class specific expenses. When only certain classes exceed their expense caps, waivers and/or reimbursements are applied against class specific expenses before fund-level expenses. Allspring Funds Management has contractually committed through January 31, 2023 to waive fees and/or reimburse expenses to the extent necessary to cap expenses. Prior to or after the commitment expiration date, the caps may be increased or the commitment to maintain the caps may be terminated only with the approval of the Board of Trustees. As of March 31, 2022, the contractual expense caps are as follows:
| | Expense ratio caps |
| Class A | 1.08% |
| Class C | 1.83 |
| Administrator Class | 0.90 |
| Institutional Class | 0.75 |
Allspring Index Asset Allocation Fund | 41
Notes to financial statements (unaudited)
Distribution fee
The Trust has adopted a distribution plan for Class C shares of the Fund pursuant to Rule 12b-1 under the 1940 Act. A distribution fee is charged to Class C shares and paid to Allspring Funds Distributor, LLC ("Allspring Funds Distributor"), the principal underwriter, an affiliate of Allspring Funds Management, at an annual rate of 0.75% of the average daily net assets of Class C shares.
In addition, Allspring Funds Distributor is entitled to receive the front-end sales charge from the purchase of Class A shares and a contingent deferred sales charge on the redemption of certain Class A shares. Allspring Funds Distributor is also entitled to receive the contingent deferred sales charges from redemptions of Class C shares. For the six months ended March 31, 2022, Allspring Funds Distributor received $17,500 from the sale of Class A shares. No contingent deferred sales charges were incurred by Class A and Class C shares for the six months ended March 31, 2022.
Shareholder servicing fees
The Trust has entered into contracts with one or more shareholder servicing agents, whereby Class A, Class C and Administrator Class of the Fund are charged a fee at an annual rate of 0.25% of the average daily net assets of each respective class. A portion of these total shareholder servicing fees were paid to affiliates, and to certain entities that were affiliates of the Fund until November 1, 2021.
Interfund transactions
The Fund may purchase or sell portfolio investment securities to certain affiliates pursuant to Rule 17a-7 under the 1940 Act and under procedures adopted by the Board of Trustees. The procedures have been designed to ensure that these interfund transactions, which do not incur broker commissions, are effected at current market prices.
5. INVESTMENT PORTFOLIO TRANSACTIONS
Purchases and sales of investments, excluding short-term securities, for the six months ended March 31, 2022 were as follows:
| Purchases at cost | | Sales proceeds |
U.S.
government | Non-U.S.
government | | U.S.
government | Non-U.S.
government |
| $55,082,376 | $31,704,213 | | $53,943,746 | $104,149,293 |
6. SECURITIES LENDING TRANSACTIONS
The Fund lends its securities through an unaffiliated securities lending agent and receives collateral in the form of cash or securities with a value at least equal to the value of the securities on loan. The value of the loaned securities is determined at the close of each business day and any increases or decreases in the required collateral are exchanged between the Fund and the counterparty on the next business day. Cash collateral received is invested in the Securities Lending Fund which seeks to provide a positive return compared to the daily Federal Funds Open Rate by investing in high-quality, U.S. dollar-denominated short-term money market instruments and is exempt from registration under Section 3(c)(7) of the 1940 Act. Securities Lending Fund is managed by Allspring Funds Management and is subadvised by Allspring Investments. Allspring Funds Management receives an advisory fee starting at 0.05% and declining to 0.01% as the average daily net assets of the Securities Lending Fund increase. All of the fees received by Allspring Funds Management are paid to Allspring Investments for its services as subadviser.
In the event of counterparty default or the failure of a borrower to return a loaned security, the Fund has the right to use the collateral to offset any losses incurred. As of March 31, 2022, the Fund had securities lending transactions with the following counterparties which are subject to offset:
| Counterparty | Value of
securities on
loan | Collateral
received1 | Net amount |
| BNP Paribas Securities Corporation | $110,510 | $(110,510) | $0 |
1 Collateral received within this table is limited to the collateral for the net transaction with the counterparty.
42 | Allspring Index Asset Allocation Fund
Notes to financial statements (unaudited)
7. DERIVATIVE TRANSACTIONS
During the six months ended March 31, 2022, the Fund entered into futures contracts to manage the duration of the portfolio and to gain market exposure to certain asset classes by implementing tactical asset allocation shifts. The Fund had an average notional amount of $232,344,902 in long futures contracts and $51,547,305 in short futures contracts during the six months ended March 31, 2022.
The fair value of derivative instruments as of March 31, 2022 by primary risk type was as follows for the Fund:
| | Asset derivatives | | Liability derivatives |
| | Statement of
Assets and Liabilities location | Fair value | | Statement of
Assets and Liabilities location | Fair value |
| Interest rate risk | Unrealized gains on futures contracts | $0* | | Unrealized losses on futures contracts | $ 2,128,208* |
| Equity risk | Unrealized gains on futures contracts | 0* | | Unrealized losses on futures contracts | 668,538* |
| | | $0 | | | $2,796,746 |
* Amount represents the cumulative unrealized gains (losses) as reported in the table following the Portfolio of Investments. For futures contracts, only the current day's variation margin as of March 31, 2022 is reported separately on the Statement of Assets and Liabilities.
The effect of derivative instruments on the Statement of Operations for the six months ended March 31, 2022 was as follows:
| | Amount of net realized
gains (losses) on
derivatives | Net change in unrealized
gains (losses) on
derivatives |
| Equity risk | $ (5,427,585) | $ 4,097,995 |
| Interest rate risk | (2,726,522) | (499,583) |
| | $(8,154,107) | $3,598,412 |
8. BANK BORROWINGS
The Trust (excluding the money market funds), Allspring Master Trust and Allspring Variable Trust are parties to a $350,000,000 revolving credit agreement whereby the Fund is permitted to use bank borrowings for temporary or emergency purposes, such as to fund shareholder redemption requests. Interest under the credit agreement is charged to the Fund based on a borrowing rate equal to the higher of the Federal Funds rate in effect on that day plus 1.25% or the overnight bank funding rate in effect on that day plus 1.25%. In addition, an annual commitment fee equal to 0.25% of the unused balance is allocated to each participating fund.
For the six months ended March 31, 2022, there were no borrowings by the Fund under the agreement.
9. INDEMNIFICATION
Under the Fund's organizational documents, the officers and Trustees have been granted certain indemnification rights against certain liabilities that may arise out of performance of their duties to the Fund. The Fund has entered into a separate agreement with each Trustee that converts indemnification rights currently existing under the Fund’s organizational documents into contractual rights that cannot be changed in the future without the consent of the Trustee. Additionally, in the normal course of business, the Fund may enter into contracts with service providers that contain a variety of indemnification clauses. The Fund’s maximum exposure under these arrangements is dependent on future claims that may be made against the Fund and, therefore, cannot be estimated.
10. CORONAVIRUS (COVID-19) PANDEMIC
On March 11, 2020, the World Health Organization announced that it had made the assessment that coronavirus disease 2019 (“COVID-19”) is a pandemic. The impacts of COVID-19 are affecting the entire global economy, individual companies and investment products, the funds, and the market in general. There is significant uncertainty around the extent and duration of business disruptions related to COVID-19 and the impacts may last for an extended period of time. COVID-19 has led to significant uncertainty and volatility in the financial markets.
Allspring Index Asset Allocation Fund | 43
Other information (unaudited)
PROXY VOTING INFORMATION
A description of the policies and procedures used to determine how to vote proxies relating to portfolio securities is available without charge, upon request, by calling 1-800-222-8222, visiting our website at allspringglobal.com, or visiting the SEC website at sec.gov. Information regarding how the proxies related to portfolio securities were voted during the most recent 12-month period ended June 30 is available on the website at allspringglobal.com or by visiting the SEC website at sec.gov.
QUARTERLY PORTFOLIO HOLDINGS INFORMATION
The Fund files its complete schedule of portfolio holdings with the SEC for the first and third quarters of each fiscal year as an exhibit to its reports on Form N-PORT. Shareholders may view the filed Form N-PORT by visiting the SEC website at sec.gov.
44 | Allspring Index Asset Allocation Fund
Other information (unaudited)
BOARD OF TRUSTEES AND OFFICERS
Each of the Trustees and Officers listed in the table below acts in identical capacities for each fund in the Allspring family of funds, which consists of 138 mutual funds comprising the Allspring Funds Trust, Allspring Variable Trust, Allspring Master Trust and four closed-end funds (collectively the “Fund Complex”). This table should be read in conjunction with the Prospectus and the Statement of Additional Information1. The mailing address of each Trustee and Officer is 525 Market Street, 12th Floor, San Francisco, CA 94105. Each Trustee and Officer serves an indefinite term, however, each Trustee serves such term until reaching the mandatory retirement age established by the Trustees.
Independent Trustees
Name and
year of birth | Position held and
length of service* | Principal occupations during past five years or longer | Current other
public company or
investment
company
directorships |
William R. Ebsworth
(Born 1957) | Trustee,
since 2015 | Retired. From 1984 to 2013, equities analyst, portfolio manager, research director and chief investment officer at Fidelity Management and Research Company in Boston, Tokyo, and Hong Kong, and retired in 2013 as Chief Investment Officer of Fidelity Strategic Advisers, Inc. where he led a team of investment professionals managing client assets. Prior thereto, Board member of Hong Kong Securities Clearing Co., Hong Kong Options Clearing Corp., the Thailand International Fund, Ltd., Fidelity Investments Life Insurance Company, and Empire Fidelity Investments Life Insurance Company. Audit Committee Chair and Investment Committee Chair of the Vincent Memorial Hospital Endowment (non-profit organization). Mr. Ebsworth is a CFA® charterholder. | N/A |
Jane A. Freeman
(Born 1953) | Trustee,
since 2015;
Chair Liaison,
since 2018 | Retired. From 2012 to 2014 and 1999 to 2008, Chief Financial Officer of Scientific Learning Corporation. From 2008 to 2012, Ms. Freeman provided consulting services related to strategic business projects. Prior to 1999, Portfolio Manager at Rockefeller & Co. and Scudder, Stevens & Clark. Board member of the Harding Loevner Funds from 1996 to 2014, serving as both Lead Independent Director and chair of the Audit Committee. Board member of the Russell Exchange Traded Funds Trust from 2011 to 2012 and the chair of the Audit Committee. Ms. Freeman is also an inactive Chartered Financial Analyst. | N/A |
Isaiah Harris, Jr.
(Born 1952) | Trustee,
since 2009; Audit
Committee
Chair,
since 2019 | Retired. Chairman of the Board of CIGNA Corporation from 2009 to 2021, and Director from 2005 to 2008. From 2003 to 2011, Director of Deluxe Corporation. Prior thereto, President and CEO of BellSouth Advertising and Publishing Corp. from 2005 to 2007, President and CEO of BellSouth Enterprises from 2004 to 2005 and President of BellSouth Consumer Services from 2000 to 2003. Emeritus member of the Iowa State University Foundation Board of Governors. Emeritus Member of the Advisory Board of Iowa State University School of Business. Advisory Board Member, Palm Harbor Academy (private school). Advisory Board Member, Fellowship of Christian Athletes. Mr. Harris is a certified public accountant (inactive status). | N/A |
David F. Larcker
(Born 1950) | Trustee,
since 2009 | James Irvin Miller Professor of Accounting at the Graduate School of Business (Emeritus), Stanford University, Director of the Corporate Governance Research Initiative and Senior Faculty of The Rock Center for Corporate Governance since 2006. From 2005 to 2008, Professor of Accounting at the Graduate School of Business, Stanford University. Prior thereto, Ernst & Young Professor of Accounting at The Wharton School, University of Pennsylvania from 1985 to 2005. | N/A |
Allspring Index Asset Allocation Fund | 45
Other information (unaudited)
Name and
year of birth | Position held and
length of service* | Principal occupations during past five years or longer | Current other
public company or
investment
company
directorships |
Olivia S. Mitchell
(Born 1953) | Trustee,
since 2006;
Nominating and
Governance
Committee Chair,
since 2018 | International Foundation of Employee Benefit Plans Professor since 1993, Wharton School of the University of Pennsylvania. Director of Wharton’s Pension Research Council and Boettner Center on Pensions & Retirement Research, and Research Associate at the National Bureau of Economic Research. Previously taught at Cornell University from 1978 to 1993. | N/A |
Timothy J. Penny
(Born 1951) | Trustee,
since 1996;
Chair,
since 2018 | President and Chief Executive Officer of Southern Minnesota Initiative Foundation, a non-profit organization, since 2007. Member of the Board of Trustees of NorthStar Education Finance, Inc., a non-profit organization, since 2007. | N/A |
James G. Polisson
(Born 1959) | Trustee,
since 2018 | Retired. Chief Marketing Officer, Source (ETF) UK Services, Ltd, from 2015 to 2017. From 2012 to 2015, Principal of The Polisson Group, LLC, a management consulting, corporate advisory and principal investing company. Chief Executive Officer and Managing Director at Russell Investments, Global Exchange Traded Funds from 2010 to 2012. Managing Director of Barclays Global Investors from 1998 to 2010 and Global Chief Marketing Officer for iShares and Barclays Global Investors from 2000 to 2010. Trustee of the San Francisco Mechanics’ Institute, a non-profit organization, from 2013 to 2015. Board member of the Russell Exchange Traded Fund Trust from 2011 to 2012. Director of Barclays Global Investors Holdings Deutschland GmbH from 2006 to 2009. Mr. Polisson is an attorney and has a retired status with the Massachusetts and District of Columbia Bar Associations. | N/A |
Pamela Wheelock
(Born 1959) | Trustee,
since January
2020; previously
Trustee from
January 2018 to
July 2019 | Board member of the Destination Medical Center Economic Development Agency, Rochester, Minnesota since 2019. Interim President of the McKnight Foundation from January to September 2020. McKnight Foundation Consultant, November 2020 to February 2021. Acting Commissioner, Minnesota Department of Human Services, July 2019 through September 2019. Consultant (part-time), Minnesota Department of Human Services, October 2019 through December 2019. Chief Operating Officer, Twin Cities Habitat for Humanity from 2017 to 2019. Vice President of University Services, University of Minnesota from 2012 to 2016. Prior thereto, on the Board of Directors, Governance Committee and Finance Committee for the Minnesota Philanthropy Partners (Saint Paul Foundation) from 2012 to 2018, Interim Chief Executive Officer of Blue Cross Blue Shield of Minnesota from 2011 to 2012, Chairman of the Board from 2009 to 2012 and Board Director from 2003 to 2015. Vice President, Leadership and Community Engagement, Bush Foundation, Saint Paul, Minnesota (a private foundation) from 2009 to 2011. Executive Vice President and Chief Financial Officer, Minnesota Sports and Entertainment from 2004 to 2009 and Senior Vice President from 2002 to 2004. Executive Vice President of the Minnesota Wild Foundation from 2004 to 2008. Commissioner of Finance, State of Minnesota, from 1999 to 2002. Currently Board Chair of the Minnesota Wild Foundation since 2010. | N/A |
* Length of service dates reflect the Trustee’s commencement of service with the Trust’s predecessor entities, where applicable.
46 | Allspring Index Asset Allocation Fund
Other information (unaudited)
Officers2
Name and
year of birth | Position held and
length of service | Principal occupations during past five years or longer |
Andrew Owen
(Born 1960) | President,
since 2017 | President, Chief Executive Officer and Director of Allspring Funds Management, LLC since 2017 and co-president of Galliard Capital Management, LLC, an affiliate of Allspring Funds Management, LLC, since 2019. Prior thereto, Head of Affiliated Managers, Allspring Global Investments, from 2014 to 2019 and Executive Vice President responsible for marketing, investments and product development for Allspring Funds Management, LLC, from 2009 to 2014. In addition, Mr. Owen was an Executive Vice President of Wells Fargo & Company from 2014 to 2021. |
Jeremy DePalma
(Born 1974) | Treasurer,
since 2012
(for certain funds in
the Fund Complex);
since 2021 (for
the remaining funds in the
Fund Complex) | Senior Vice President of Allspring Funds Management, LLC since 2009. Senior Vice President of Evergreen Investment Management Company, LLC from 2008 to 2010 and head of the Fund Reporting and Control Team within Fund Administration from 2005 to 2010. |
Kate McKinley
(Born 1977) | Chief Legal Officer,
since 2021 | Chief Legal Officer of Allspring Global Investments since 2021. Prior thereto, held various roles at State Street Global Advisors beginning in 2010, including serving as Senior Vice President and General Counsel from 2019 to 2021, and Chief Operating Officer of the Institutional Client Group from 2016 - 2019. Prior to working at State Street Global Advisors served as Assistant General Counsel for Bank of America Corporation from 2005 to 2010 and as an Associate at WilmerHale from 2002 to 2005. |
Christopher Baker
(Born 1976) | Chief Compliance Officer, since 2022 | Global Chief Compliance Officer for Allspring Global Investments since 2022. Prior thereto, Chief Compliance Officer for State Street Global Advisors from 2018 to 2021. Senior Compliance Officer for the State Street divisions of Alternative Investment Solutions, Sector Solutions, and Global Marketing from 2015 to 2018. From 2010 to 2015 Vice President, Global Head of Investment and Marketing Compliance for State Street Global Advisors. |
Matthew Prasse
(Born 1983) | Secretary,
since 2021 | Senior Counsel of the Allspring Legal Department since 2021. Senior Counsel of the Wells Fargo Legal Department from 2018 to 2021. Previously, Counsel for Barings LLC from 2015 to 2018. Prior to joining Barings, Associate at Morgan, Lewis & Bockius LLP from 2008 to 2015. |
1 The Statement of Additional Information includes additional information about the Trustees and is available, without charge, upon request, by calling 1-800-222-8222 or by visiting the website at allspringglobal.com.
2 For those Officers with tenures at Allspring Global Investments and/or Allspring Funds Management, LLC that began prior to 2021, such tenures include years of service during which these businesses/entities were known as Wells Fargo Asset Management and Wells Fargo Funds Management, LLC, respectively.
Allspring Index Asset Allocation Fund | 47
For more information
More information about Allspring Funds is available free upon request. To obtain literature, please write, visit the Fund's website, or call:
Allspring Funds
P.O. Box 219967
Kansas City, MO 64121-9967
Website: allspringglobal.com
Individual investors: 1-800-222-8222
Retail investment professionals: 1-888-877-9275
Institutional investment professionals: 1-800-260-5969
This report and the financial statements contained herein are submitted for the general information of the shareholders of the Fund. If this report is used for promotional purposes, distribution of the report must be accompanied or preceded by a current prospectus. Before investing, please consider the investment objectives, risks, charges, and expenses of the investment. For a current prospectus and, if available, a summary prospectus, containing this information, call
1-800-222-8222 or visit the Fund's website at allspringglobal.com. Read the prospectus carefully before you invest or send money.
Allspring Global InvestmentsTM is the trade name for the asset management firms of Allspring Global Investments Holdings, LLC, a holding company indirectly owned by certain private funds of GTCR LLC and Reverence Capital Partners, L.P. These firms include but are not limited to Allspring Global Investments, LLC, and Allspring Funds Management, LLC. Certain products managed by Allspring entities are distributed by Allspring Funds Distributor, LLC (a broker-dealer and Member FINRA/SIPC).
This material is for general informational and educational purposes only and is NOT intended to provide investment advice or a recommendation of any kind - including a recommendation for any specific investment, strategy, or plan.
© 2022 Allspring Global Investments Holdings, LLC. All rights reserved.
PAR-0522-00046 05-22
SA227/SAR227 03-22
Semi-Annual Report
March 31, 2022
Allspring Global Investment
Grade Credit Fund
The views expressed and any forward-looking statements are as of March 31, 2022, unless otherwise noted, and are those of the Fund's portfolio managers and/or Allspring Global Investments. Discussions of individual securities or the markets generally are not intended as individual recommendations. Future events or results may vary significantly from those expressed in any forward-looking statements. The views expressed are subject to change at any time in response to changing circumstances in the market. Allspring Global Investments disclaims any obligation to publicly update or revise any views expressed or forward-looking statements.
Allspring Global Investment Grade Credit Fund | 1
Letter to shareholders (unaudited)
Andrew Owen
President
Allspring Funds
Dear Shareholder:
We are pleased to offer you this semi-annual report for Allspring Global Investment Grade Credit Fund for the six-month period that ended March 31, 2022. Global stocks and bonds broadly declined during a challenging period. Despite progress on a global economic recovery from COVID-19, persistently high inflation, concerns regarding anticipated tightening of central bank monetary policy, and turmoil caused by the Russian invasion of Ukraine all led to a retreat from financial market gains made earlier in 2021. Among major indexes, the U.S. large-cap-dominated S&P 500 Index was an exception in escaping a half-year loss.
For the six-month period, U.S. stocks, based on the S&P 500 Index,1 gained 5.92%. International stocks, as measured by the MSCI ACWI ex USA Index (Net),2 returned -3.72%, while the MSCI EM Index (Net) (USD),3 trailed both developed market benchmarks with a return of -8.20%. The Bloomberg U.S. Aggregate Bond Index,4returned -5.92%, the Bloomberg Global Aggregate ex-USD Index (unhedged),5 returned -7.26%, the Bloomberg Municipal Bond Index6 returned -5.55%, and the ICE BofA U.S. High Yield Index,7 lost 3.89%.
Inflationary concerns and the Russian-Ukraine war caused markets to retreat.
Elevated inflation pressures and the ongoing global supply bottleneck continued in October, but strong corporate earnings provided a bright spot in the U.S., the eurozone, and many Asian countries. Government bond yields rose globally as central banks prepared to tighten monetary policy. Commodity prices continued to rise, driven by sharply higher energy costs.
In November, as COVID-19 hospitalizations rose, most major global asset classes declined. Two exceptions were U.S. investment-grade bonds and Treasury Inflation-Protected Securities. President Biden signed a long-awaited $550 billion infrastructure bill to upgrade U.S. roads, bridges, and railways. Meanwhile, the Consumer Price Index8, a measure of domestic inflation conditions, jumped to its highest level in 31 years. While the threat of consistently high inflation led the U.S. Federal Reserve (Fed) to discuss a faster pace of tapering, the Omicron strain created uncertainty. Commodities lost ground for the month, driven by sharp declines in oil prices (and energy costs in general) as well as precious metals.
“Elevated inflation pressures and the ongoing global supply bottleneck continued in October, but strong corporate earnings provided a bright spot in the U.S., the eurozone, and many Asian countries.”
| 1 | The S&P 500 Index consists of 500 stocks chosen for market size, liquidity, and industry group representation. It is a market-value-weighted index with each stock's weight in the index proportionate to its market value. You cannot invest directly in an index. |
| 2 | The Morgan Stanley Capital International (MSCI) All Country World Index (ACWI) ex USA Index (Net) is a free-float-adjusted market-capitalization-weighted index that is designed to measure the equity market performance of developed and emerging markets, excluding the U.S. Source: MSCI. MSCI makes no express or implied warranties or representations and shall have no liability whatsoever with respect to any MSCI data contained herein. The MSCI data may not be further redistributed or used as a basis for other indexes or any securities or financial products. This report is not approved, reviewed, or produced by MSCI. You cannot invest directly in an index. |
| 3 | The MSCI Emerging Markets (EM) Index (Net) (USD) is a free-float-adjusted market-capitalization-weighted index that is designed to measure equity market performance of emerging markets. You cannot invest directly in an index. |
| 4 | The Bloomberg U.S. Aggregate Bond Index is a broad-based benchmark that measures the investment-grade, U.S.-dollar-denominated, fixed-rate taxable bond market, including Treasuries, government-related and corporate securities, mortgage-backed securities (agency fixed-rate and hybrid adjustable-rate mortgage pass-throughs), asset-backed securities, and commercial mortgage-backed securities. You cannot invest directly in an index. |
| 5 | The Bloomberg Global Aggregate ex-USD Index (unhedged) is an unmanaged index that provides a broad-based measure of the global investment-grade fixed-income markets excluding the U.S.-dollar-denominated debt market. You cannot invest directly in an index. |
| 6 | The Bloomberg Municipal Bond Index is an unmanaged index composed of long-term tax-exempt bonds with a minimum credit rating of Baa. You cannot invest directly in an index. |
| 7 | The ICE BofA U.S. High Yield Index is a market-capitalization-weighted index of domestic and Yankee high-yield bonds. The index tracks the performance of high-yield securities traded in the U.S. bond market. You cannot invest directly in an index. Copyright 2022. ICE Data Indices, LLC. All rights reserved. |
| 8 | The Consumer Price Index (CPI) is a measure of the average change over time in the prices paid by urban consumers for a market basket of consumer goods and services. You cannot invest directly in an index. |
2 | Allspring Global Investment Grade Credit Fund
Letter to shareholders (unaudited)
Global volatility lessened in December as data indicated a lower risk of severe disease and death from the Omicron variant. Even so, several countries introduced restrictions on travel and hospitality, among other sectors, in an effort to reduce the spread. In the U.S., data indicated a stable economy overall, with robust corporate earnings. Consumer spending potential looked strong heading into 2022 on elevated household savings and the lowest household debt ratio since 1973. U.S. corporate and high-yield bonds had monthly gains while Treasuries declined. Bonds were strongly affected by the projection of three 25-basis-point (bp; 100 bps equal 1.00%) policy rate hikes in 2022 by senior Federal Open Market Committee members, up from previous projections of just one hike.
In January 2022, the main focus was on potential U.S. interest rate hikes and the Russia-Ukraine conflict. The Fed hinted that a March interest rate hike was likely. Meanwhile, Russia threatened a potential invasion of Ukraine, which could disrupt Russia’s massive energy supplies and drive demand from non-Russian oil-producing countries. Elsewhere overseas, Europe saw food and energy prices spike, leading to rising inflation. Within fixed income, corporate bonds struggled in January, underperforming government bonds, as investors focused on continued elevated inflation and ongoing uncertainty over the U.S. monetary path.
The Russian invasion of Ukraine dominated the financial world in February and March. Equity, bond, and commodities markets were shaken by fear, uncertainty, and an upending of demand-supply dynamics. Major global stock indexes were down in February, along with global bonds overall, with ongoing high levels of volatility in March along with mixed results that favored U.S. large-cap stocks. Prices of commodities spiked, including crude oil, natural gas, wheat, and precious metals, on elevated concerns of supply shortages. All of this fed already-high inflation concerns and added to expectations of more aggressive central bank interest rate hikes. Sweeping sanctions against Russia and corporate pullouts contributed to market volatility. Despite the geopolitical turmoil, the U.S. economic outlook remained largely unchanged, with a healthy job market and signs of economic resilience accompanying higher prices.
Don’t let short-term uncertainty derail long-term investment goals.
Periods of investment uncertainty can present challenges, but experience has taught us that maintaining long-term investment goals can be an effective way to plan for the future. To help you create a sound strategy based on your personal goals and risk tolerance, Allspring Funds offers more than 100 mutual funds spanning a wide range of asset classes and investment styles. Although diversification cannot guarantee an investment profit or prevent losses, we believe it can be an effective way to manage investment risk and potentially smooth out overall portfolio performance. We encourage investors to know their investments and to understand that appropriate levels of risk-taking may unlock opportunities.
Information on transaction closing.
On November 1, 2021, GTCR LLC and Reverence Capital Partners, L.P. announced the beginning of Allspring Global Investments™ with the close of the transaction to acquire Wells Fargo Funds Management, LLC; Wells Capital Management LLC; Galliard Capital Management LLC.; Wells Fargo Asset Management (International) Ltd.; Wells Fargo Asset Management Luxembourg S.A.; and Wells Fargo Funds Distributor, LLC, as well as Wells Fargo Bank, N.A.’s business of acting as trustee to its collective investment trusts and all related Wells Fargo Asset Management legal entities. The transaction closed on November 1, 2021, forming Allspring Global Investments, a privately held asset management firm with $451 billion in AUM1 as of March 31, 2022.
“ The Russian invasion of Ukraine dominated the financial world in February and March. Equity, bond, and commodities markets were shaken by fear, uncertainty, and an upending of demand-supply dynamics.”
| 1 | Figures are as of March 31, 2022, unless otherwise noted. Please note that the assets under management figures provided have been adjusted to eliminate any duplication of reporting among assets directed by multiple investment teams and includes $91.2B from Galliard Capital Management ($74.7B stable value; $16.5B fixed income), an investment advisor that is not part of the Allspring trade name/GIPS firm. |
Allspring Global Investment Grade Credit Fund | 3
Letter to shareholders (unaudited)
For further information about your Fund, contact your investment professional, visit our website at allspringglobal.com, or call us directly at 1-800-222-8222. |
Allspring Global Investments™ is a leading independent asset management firm with a full breadth of investment capabilities across diverse asset classes, serving the needs of its institutional and wealth management clients around the world. Allspring operates across 18 offices globally supported by more than 480 investment professionals. Allspring and its investment teams provide a broad range of differentiated investment products and solutions to help its diverse range of clients meet their investment objectives.
As part of this transition, all mutual funds within the Wells Fargo Funds family were rebranded as Allspring Funds. Each individual fund had “Wells Fargo” removed from its fund name and replaced with “Allspring.” The fund name changes went into effect on December 6, 2021.
Allspring Global Investments™ is the trade name for the asset management firm of Allspring Global Investments Holdings, LLC, a holding company indirectly owned by certain private funds of GTCR LLC and Reverence Capital Partners, L.P.
Thank you for choosing to invest with Allspring Funds. We appreciate your confidence in us and remain committed to helping you meet your financial needs.
Sincerely,
Andrew Owen
President
Allspring Funds
Notice to Shareholders
Russia launched a large-scale invasion of Ukraine on February 24, 2022. As a result of this military action, the United States and many other countries have instituted various economic sanctions against Russian and Belarus individuals and entities. The situation has led to increased financial market volatility and could have severe adverse effects on regional and global economic markets, including the markets for certain securities and commodities, such as oil and natural gas. The extent and duration of the military action, resulting sanctions imposed, other punitive action taken and the resulting market disruptions cannot be easily predicted.
Our solidarity and support goes out to our impacted employees and the people affected in Ukraine and their families. Allspring has a dedicated team of investment professionals actively monitoring the situation for any new developments and the potential impact to our clients and investment products. As the situation remains fluid, we are focused on the assessment of risks, valuation, and liquidity of impacted securities. Please visit our website at allspringglobal.com and click on “Russia-Ukraine Portfolio Impacts” for further information.
4 | Allspring Global Investment Grade Credit Fund
This page is intentionally left blank.
Performance highlights (unaudited)
| Investment objective | The Fund seeks total return, consisting of income and capital appreciation. |
| Manager | Allspring Funds Management, LLC |
| Subadvisers | Allspring Global Investments, LLC |
| | Allspring Global Investments (UK) Limited |
| Portfolio managers | Henrietta Pacquement, CFA®‡, Scott M. Smith, CFA®‡, Alex Temple, Jonathan Terry, CFA®‡ |
| Average annual total returns (%) as of March 31, 2022 |
| | | | | Expense ratios1 (%) |
| | Inception date | 1 year | Since inception | Gross | Net 2 |
| Class R6 (WGCRX) | 2-28-2019 | -4.67 | 3.26 | 0.68 | 0.45 |
| Institutional Class (WGCIX) | 2-28-2019 | -4.72 | 3.21 | 0.73 | 0.50 |
| Bloomberg Global Aggregate Credit Index USD (Hedged)3 | – | -4.90 | 2.75 * | – | – |
Figures quoted represent past performance, which is no guarantee of future results, and do not reflect taxes that a shareholder may pay on an investment in a fund. Investment return and principal value of an investment will fluctuate so that an investor’s shares, when redeemed, may be worth more or less than their original cost. Current performance may be lower or higher than the performance data quoted, which assumes the reinvestment of dividends and capital gains. Current month-end performance is available on the Fund's website, allspringglobal.com.
Index returns do not include transaction costs associated with buying and selling securities, any mutual fund fees or expenses, or any taxes. It is not possible to invest directly in an index.
Class R6 and Institutional Class shares are sold without a front-end sales charge or contingent deferred sales charge.
| * | Based on the inception date of the oldest Fund class. |
| 1 | Reflects the expense ratios as stated in the most recent prospectuses. The expense ratios shown are subject to change and may differ from the annualized expense ratios shown in the financial highlights of this report. |
| 2 | The manager has contractually committed through January 31, 2023, to waive fees and/or reimburse expenses to the extent necessary to cap total annual fund operating expenses after fee waivers at 0.45% for Class R6 and 0.50% for Institutional Class. Brokerage commissions, stamp duty fees, interest, taxes, acquired fund fees and expenses (if any), and extraordinary expenses are excluded from the expense caps. Prior to or after the commitment expiration date, the caps may be increased or the commitment to maintain the caps may be terminated only with the approval of the Board of Trustees. Without these caps, the Fund’s returns would have been lower. The expense ratio paid by an investor is the net expense ratio (the total annual fund operating expenses after fee waivers) as stated in the prospectuses. |
| 3 | Bloomberg Global Aggregate Credit Index USD (Hedged) measures the credit sector of the global investment grade fixed-rate bond market, including corporate, government and agency securities, hedged in USD. You cannot invest directly in an index. |
Bond values fluctuate in response to the financial condition of individual issuers, general market and economic conditions, and changes in interest rates. Changes in market conditions and government policies may lead to periods of heightened volatility in the bond market and reduced liquidity for certain bonds held by the Fund. In general, when interest rates rise, bond values fall and investors may lose principal value. Interest rate changes and their impact on the Fund and its share price can be sudden and unpredictable. Foreign investments are especially volatile and can rise or fall dramatically due to differences in the political and economic conditions of the host country. These risks are generally intensified in emerging markets. The use of derivatives may reduce returns and/or increase volatility. Securities issued by U.S. government agencies or government-sponsored entities may not be guaranteed by the U.S. Treasury. Certain investment strategies tend to increase the total risk of an investment (relative to the broader market). This fund is exposed to municipal securities risk, high-yield securities risk, and mortgage- and asset-backed securities risk. Consult the Fund’s prospectus for additional information on these and other risks.
| ‡ | CFA® and Chartered Financial Analyst® are trademarks owned by CFA Institute. |
6 | Allspring Global Investment Grade Credit Fund
Performance highlights (unaudited)
| Ten largest holdings (%) as of March 31, 20221 |
| Bank of America Corporation, 4.13%, 1-22-2024 | 1.65 |
| Morgan Stanley, 3.13%, 7-27-2026 | 1.62 |
| Citigroup Incorporated, 3.30%, 4-27-2025 | 1.51 |
| American International Group Incorporated, 4.75%, 4-1-2048 | 1.46 |
| Energy Transfer Operating Partners LP, 6.25%, 4-15-2049 | 1.29 |
| Verizon Communications Incorporated, 3.40%, 3-22-2041 | 1.20 |
| Cantor Fitzgerald LP, 4.88%, 5-1-2024 | 1.19 |
| British Airways Series 2019-1 Class AA Pass-Through Trust, 3.30%, 6-15-2034 | 1.05 |
| Sabine Pass Liquefaction LLC, 5.75%, 5-15-2024 | 1.04 |
| Motorola Solutions Incorporated, 4.60%, 2-23-2028 | 1.04 |
| 1 | Figures represent the percentage of the Fund's net assets. Holdings are subject to change and may have changed since the date specified. |
| Portfolio composition as of March 31, 20221 |
| 1 | Figures represent the percentage of the Fund's long-term investments. These amounts are subject to change and may have changed since the date specified. |
| Credit quality as of March 31, 20221 |
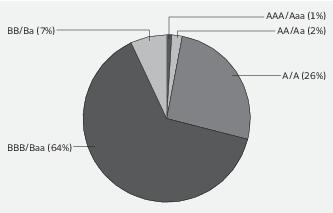
| 1 | The credit quality distribution of portfolio holdings reflected in the chart is based on ratings from Standard & Poor’s, Moody’s Investors Service, and/or Fitch Ratings Ltd. Credit quality ratings apply to the underlying holdings of the Fund and not to the Fund itself. The percentages of the portfolio with the ratings depicted in the chart are calculated based on the market value of fixed income securities held by the Fund. If a security was rated by all three rating agencies, the middle rating was utilized. If rated by two of the three rating agencies, the lower rating was utilized, and if rated by one of the rating agencies, that rating was utilized. Standard & Poor’s rates the creditworthiness of bonds, ranging from AAA (highest) to D (lowest). Ratings from A to CCC may be modified by the addition of a plus (+) or minus (-) sign to show relative standing within the rating categories. Standard & Poor’s rates the creditworthiness of short-term notes from SP-1 (highest) to SP-3 (lowest). Moody’s rates the creditworthiness of bonds, ranging from Aaa (highest) to C (lowest). Ratings Aa to B may be modified by the addition of a number 1 (highest) to 3 (lowest) to show relative standing within the ratings categories. Moody’s rates the creditworthiness of short-term U.S. tax-exempt municipal securities from MIG 1/VMIG 1 (highest) to SG (lowest). Fitch rates the creditworthiness of bonds, ranging from AAA (highest) to D (lowest). Credit quality distribution is subject to change and may have changed since the date specified. |
| Effective maturity distribution as of March 31, 20221 |
| 1 | Figures represent the percentage of the Fund's long-term investments. These amounts are subject to change and may have changed since the date specified. |
Allspring Global Investment Grade Credit Fund | 7
Fund expenses (unaudited)
As a shareholder of the Fund, you incur ongoing costs including management fees and other Fund expenses. This example is intended to help you understand your ongoing costs (in dollars) of investing in the Fund and to compare these costs with the ongoing costs of investing in other mutual funds.
The example is based on an investment of $1,000 invested at the beginning of the six-month period and held for the entire period from October 1, 2021 to March 31, 2022.
Actual expenses
The “Actual” line of the table below provides information about actual account values and actual expenses. You may use the information in this line, together with the amount you invested, to estimate the expenses that you paid over the period. Simply divide your account value by $1,000 (for example, an $8,600 account value divided by $1,000 = 8.6), then multiply the result by the number in the “Actual” line under the heading entitled “Expenses paid during period” for your applicable class of shares to estimate the expenses you paid on your account during this period.
Hypothetical example for comparison purposes
The “Hypothetical” line of the table below provides information about hypothetical account values and hypothetical expenses based on the Fund’s actual expense ratio and an assumed rate of return of 5% per year before expenses, which is not the Fund’s actual return. The hypothetical account values and expenses may not be used to estimate the actual ending account balance or expenses you paid for the period. You may use this information to compare the ongoing costs of investing in the Fund and other funds. To do so, compare this 5% hypothetical example with the 5% hypothetical examples that appear in the shareholder reports of the other funds.
Please note that the expenses shown in the table are meant to highlight your ongoing costs only. Therefore, the “Hypothetical” line of the table is useful in comparing ongoing costs only, and will not help you determine the relative total costs of owning different funds.
| | Beginning
account value
10-1-2021 | Ending
account value
3-31-2022 | Expenses
paid during
the period1 | Annualized net
expense ratio |
| Class R6 | | | | |
| Actual | $1,000.00 | $ 930.99 | $2.17 | 0.45% |
| Hypothetical (5% return before expenses) | $1,000.00 | $1,022.69 | $2.27 | 0.45% |
| Institutional Class | | | | |
| Actual | $1,000.00 | $ 930.74 | $2.41 | 0.50% |
| Hypothetical (5% return before expenses) | $1,000.00 | $1,022.44 | $2.52 | 0.50% |
1 Expenses paid is equal to the annualized net expense ratio of each class multiplied by the average account value over the period, multiplied by 182 divided by 365 (to reflect the one-half-year period).
8 | Allspring Global Investment Grade Credit Fund
Portfolio of investments—March 31, 2022 (unaudited)
| | | Interest
rate | Maturity
date | Principal | Value |
| Asset-backed securities: 1.69% | | | | | | |
| American Airlines Series 2014-1 Class A Pass-Through Trust | | 3.70% | 4-1-2028 | $ | 228,258 | $ 220,327 |
| British Airways Series 2019-1 Class AA Pass-Through Trust 144A | | 3.30 | 6-15-2034 | | 385,416 | 364,272 |
| Total Asset-backed securities (Cost $612,922) | | | | | | 584,599 |
| Corporate bonds and notes: 53.43% | | | | | | |
| Communication services: 7.68% | | | | | | |
| Diversified telecommunication services: 4.85% | | | | | | |
| AT&T Incorporated | | 3.65 | 6-1-2051 | | 300,000 | 272,992 |
| AT&T Incorporated | | 4.25 | 3-1-2027 | | 330,000 | 344,991 |
| T-Mobile USA Incorporated | | 2.55 | 2-15-2031 | | 40,000 | 36,272 |
| T-Mobile USA Incorporated | | 3.30 | 2-15-2051 | | 155,000 | 130,421 |
| T-Mobile USA Incorporated | | 3.75 | 4-15-2027 | | 145,000 | 145,848 |
| Verizon Communications Incorporated | | 3.40 | 3-22-2041 | | 445,000 | 417,150 |
| Verizon Communications Incorporated | | 4.13 | 8-15-2046 | | 325,000 | 333,719 |
| | | | | | | 1,681,393 |
| Media: 2.83% | | | | | | |
| Charter Communications Operating LLC | | 2.80 | 4-1-2031 | | 90,000 | 81,116 |
| Charter Communications Operating LLC | | 4.20 | 3-15-2028 | | 180,000 | 181,892 |
| Charter Communications Operating LLC | | 4.91 | 7-23-2025 | | 55,000 | 57,036 |
| Comcast Corporation | | 3.40 | 4-1-2030 | | 100,000 | 101,305 |
| Magallanes Incorporated 144A | | 5.05 | 3-15-2042 | | 75,000 | 76,502 |
| Magallanes Incorporated 144A | | 5.14 | 3-15-2052 | | 335,000 | 342,737 |
| ViacomCBS Incorporated | | 4.95 | 1-15-2031 | | 130,000 | 138,187 |
| | | | | | | 978,775 |
| Consumer discretionary: 3.04% | | | | | | |
| Automobiles: 0.57% | | | | | | |
| General Motors Company | | 6.13 | 10-1-2025 | | 185,000 | 198,601 |
| Hotels, restaurants & leisure: 1.82% | | | | | | |
| Hyatt Hotels Corporation | | 1.80 | 10-1-2024 | | 315,000 | 303,074 |
| Las Vegas Sands Corporation | | 3.50 | 8-18-2026 | | 150,000 | 141,313 |
| Las Vegas Sands Corporation | | 3.90 | 8-8-2029 | | 130,000 | 119,210 |
| McDonald's Corporation | | 1.45 | 9-1-2025 | | 30,000 | 28,676 |
| McDonald's Corporation | | 4.20 | 4-1-2050 | | 35,000 | 36,537 |
| | | | | | | 628,810 |
| Specialty retail: 0.65% | | | | | | |
| Lowe's Companies Incorporated | | 4.25 | 4-1-2052 | | 70,000 | 72,403 |
| Lowe's Companies Incorporated | | 4.45 | 4-1-2062 | | 145,000 | 150,885 |
| | | | | | | 223,288 |
| Consumer staples: 1.81% | | | | | | |
| Beverages: 0.76% | | | | | | |
| Keurig Dr Pepper Incorporated | | 4.60 | 5-25-2028 | | 250,000 | 263,621 |
| Food products: 0.38% | | | | | | |
| Smithfield Foods Incorporated 144A | | 3.00 | 10-15-2030 | | 145,000 | 131,596 |
The accompanying notes are an integral part of these financial statements.
Allspring Global Investment Grade Credit Fund | 9
Portfolio of investments—March 31, 2022 (unaudited)
| | | Interest
rate | Maturity
date | Principal | Value |
| Tobacco: 0.67% | | | | | | |
| BAT Capital Corporation | | 4.54% | 8-15-2047 | $ | 260,000 | $ 232,021 |
| Energy: 6.88% | | | | | | |
| Oil, gas & consumable fuels: 6.88% | | | | | | |
| BP Capital Markets America Incorporated | | 2.94 | 6-4-2051 | | 345,000 | 294,472 |
| Energy Transfer Operating Partners LP | | 3.75 | 5-15-2030 | | 160,000 | 157,401 |
| Energy Transfer Operating Partners LP | | 6.25 | 4-15-2049 | | 390,000 | 447,516 |
| Exxon Mobil Corporation | | 2.61 | 10-15-2030 | | 260,000 | 250,603 |
| Kinder Morgan Energy Partners LP | | 5.40 | 9-1-2044 | | 200,000 | 215,294 |
| Marathon Petroleum Corporation | | 3.80 | 4-1-2028 | | 220,000 | 221,369 |
| MPLX LP | | 4.00 | 3-15-2028 | | 315,000 | 320,428 |
| Sabine Pass Liquefaction LLC | | 4.50 | 5-15-2030 | | 110,000 | 115,034 |
| Sabine Pass Liquefaction LLC | | 5.75 | 5-15-2024 | | 345,000 | 361,090 |
| | | | | | | 2,383,207 |
| Financials: 16.29% | | | | | | |
| Banks: 5.49% | | | | | | |
| Bank of America Corporation | | 4.13 | 1-22-2024 | | 555,000 | 569,648 |
| Citigroup Incorporated (U.S. SOFR +1.17%) ± | | 2.56 | 5-1-2032 | | 170,000 | 153,301 |
| Citigroup Incorporated | | 3.30 | 4-27-2025 | | 520,000 | 523,574 |
| JPMorgan Chase & Company (U.S. SOFR +1.25%) ± | | 2.58 | 4-22-2032 | | 150,000 | 137,423 |
| JPMorgan Chase & Company (U.S. SOFR +2.52%) ± | | 2.96 | 5-13-2031 | | 145,000 | 135,676 |
| JPMorgan Chase & Company (3 Month LIBOR +1.34%) ± | | 3.78 | 2-1-2028 | | 145,000 | 146,855 |
| Santander Holdings USA Incorporated | | 4.40 | 7-13-2027 | | 230,000 | 233,929 |
| | | | | | | 1,900,406 |
| Capital markets: 6.13% | | | | | | |
| Belrose Funding Trust 144A | | 2.33 | 8-15-2030 | | 185,000 | 162,034 |
| Blackrock Incorporated | | 1.90 | 1-28-2031 | | 35,000 | 31,605 |
| Cantor Fitzgerald LP 144A | | 4.88 | 5-1-2024 | | 400,000 | 412,320 |
| Goldman Sachs Group Incorporated (U.S. SOFR +1.41%) ± | | 3.10 | 2-24-2033 | | 115,000 | 108,398 |
| Intercontinental Exchange Incorporated | | 3.00 | 6-15-2050 | | 140,000 | 122,619 |
| Intercontinental Exchange Incorporated | | 3.75 | 12-1-2025 | | 130,000 | 133,608 |
| Morgan Stanley | | 3.13 | 7-27-2026 | | 565,000 | 560,124 |
| Morgan Stanley | | 3.70 | 10-23-2024 | | 310,000 | 315,563 |
| S&P Global Incorporated | | 1.25 | 8-15-2030 | | 100,000 | 86,157 |
| S&P Global Incorporated | | 2.30 | 8-15-2060 | | 90,000 | 68,046 |
| State Street Corporation | | 2.40 | 1-24-2030 | | 130,000 | 122,800 |
| | | | | | | 2,123,274 |
| Consumer finance: 2.86% | | | | | | |
| Aviation Capital Group Corporation 144A | | 5.50 | 12-15-2024 | | 305,000 | 313,919 |
| Ford Motor Credit Company LLC | | 3.40 | 1-15-2026 | | 155,000 | 150,068 |
| Hyundai Capital America Corporation 144A | | 1.80 | 10-15-2025 | | 295,000 | 275,523 |
| Hyundai Capital America Corporation 144A | | 1.80 | 1-10-2028 | | 85,000 | 75,068 |
| Stellantis Finance US Incorporated 144A | | 2.69 | 9-15-2031 | | 200,000 | 175,552 |
| | | | | | | 990,130 |
| Insurance: 1.81% | | | | | | |
| American International Group Incorporated | | 4.75 | 4-1-2048 | | 440,000 | 504,135 |
The accompanying notes are an integral part of these financial statements.
10 | Allspring Global Investment Grade Credit Fund
Portfolio of investments—March 31, 2022 (unaudited)
| | | Interest
rate | Maturity
date | Principal | Value |
| Insurance (continued) | | | | | | |
| Brighthouse Financial Incorporated | | 4.70% | 6-22-2047 | $ | 77,000 | $ 74,795 |
| Unum Group | | 4.50 | 12-15-2049 | | 50,000 | 46,060 |
| | | | | | | 624,990 |
| Health care: 3.32% | | | | | | |
| Biotechnology: 0.57% | | | | | | |
| AbbVie Incorporated | | 4.25 | 11-21-2049 | | 145,000 | 150,469 |
| Amgen Incorporated | | 4.20 | 2-22-2052 | | 45,000 | 46,539 |
| | | | | | | 197,008 |
| Health care providers & services: 1.76% | | | | | | |
| Anthem Incorporated | | 2.25 | 5-15-2030 | | 20,000 | 18,351 |
| Centene Corporation | | 2.45 | 7-15-2028 | | 210,000 | 191,877 |
| CVS Health Corporation | | 4.25 | 4-1-2050 | | 110,000 | 114,120 |
| CVS Health Corporation | | 4.30 | 3-25-2028 | | 27,000 | 28,244 |
| HCA Incorporated 144A | | 3.63 | 3-15-2032 | | 130,000 | 127,394 |
| HCA Incorporated 144A | | 4.38 | 3-15-2042 | | 130,000 | 128,177 |
| | | | | | | 608,163 |
| Life sciences tools & services: 0.57% | | | | | | |
| Thermo Fisher Scientific Incorporated | | 1.50 | 10-1-2039 | | 200,000 | 198,357 |
| Pharmaceuticals: 0.42% | | | | | | |
| Bristol-Myers Squibb Company | | 2.55 | 11-13-2050 | | 175,000 | 145,265 |
| Industrials: 3.23% | | | | | | |
| Aerospace & defense: 0.82% | | | | | | |
| United Technologies Corporation | | 4.13 | 11-16-2028 | | 270,000 | 282,232 |
| Airlines: 0.63% | | | | | | |
| US Airways Group Incorporated | | 4.63 | 12-3-2026 | | 227,421 | 219,120 |
| Professional services: 0.88% | | | | | | |
| Equifax Incorporated | | 3.10 | 5-15-2030 | | 175,000 | 166,893 |
| Equifax Incorporated | | 2.35 | 9-15-2031 | | 155,000 | 138,637 |
| | | | | | | 305,530 |
| Road & rail: 0.90% | | | | | | |
| Penske Truck Leasing Company LP 144A | | 3.45 | 7-1-2024 | | 240,000 | 240,500 |
| Union Pacific Corporation | | 2.40 | 2-5-2030 | | 75,000 | 70,978 |
| | | | | | | 311,478 |
| Information technology: 6.56% | | | | | | |
| Communications equipment: 1.04% | | | | | | |
| Motorola Solutions Incorporated | | 4.60 | 2-23-2028 | | 350,000 | 359,856 |
| Electronic equipment, instruments & components: 0.42% | | | | | | |
| Jabil Incorporated | | 3.60 | 1-15-2030 | | 150,000 | 145,316 |
| IT services: 1.90% | | | | | | |
| Computershare US Incorporated | | 1.13 | 10-7-2031 | | 200,000 | 198,183 |
| Fiserv Incorporated | | 2.65 | 6-1-2030 | | 45,000 | 41,532 |
The accompanying notes are an integral part of these financial statements.
Allspring Global Investment Grade Credit Fund | 11
Portfolio of investments—March 31, 2022 (unaudited)
| | | Interest
rate | Maturity
date | Principal | Value |
| IT services (continued) | | | | | | |
| Fiserv Incorporated | | 3.50% | 7-1-2029 | $ | 140,000 | $ 137,801 |
| Western Union Company | | 4.25 | 6-9-2023 | | 275,000 | 279,271 |
| | | | | | | 656,787 |
| Semiconductors & semiconductor equipment: 1.58% | | | | | | |
| Intel Corporation | | 2.80 | 8-12-2041 | | 265,000 | 233,969 |
| Marvell Technology Incorporated | | 4.88 | 6-22-2028 | | 80,000 | 83,750 |
| Microchip Technology Incorporated | | 2.67 | 9-1-2023 | | 230,000 | 229,230 |
| | | | | | | 546,949 |
| Software: 1.07% | | | | | | |
| Oracle Corporation | | 2.88 | 3-25-2031 | | 355,000 | 323,686 |
| Oracle Corporation | | 3.60 | 4-1-2050 | | 55,000 | 45,615 |
| | | | | | | 369,301 |
| Technology hardware, storage & peripherals: 0.55% | | | | | | |
| Dell International LLC / EMC Corporation | | 5.45 | 6-15-2023 | | 45,000 | 46,356 |
| Dell International LLC / EMC Corporation | | 6.20 | 7-15-2030 | | 95,000 | 108,267 |
| NetApp Incorporated | | 2.70 | 6-22-2030 | | 40,000 | 36,908 |
| | | | | | | 191,531 |
| Materials: 0.62% | | | | | | |
| Chemicals: 0.62% | | | | | | |
| Westlake Chemical Corporation | | 1.63 | 7-17-2029 | | 200,000 | 213,230 |
| Real estate: 1.93% | | | | | | |
| Equity REITs: 1.11% | | | | | | |
| Equinix Incorporated | | 2.15 | 7-15-2030 | | 275,000 | 240,671 |
| Sabra Health Care LP | | 3.20 | 12-1-2031 | | 110,000 | 98,163 |
| Vornado Realty LP | | 3.40 | 6-1-2031 | | 50,000 | 47,029 |
| | | | | | | 385,863 |
| Real estate management & development: 0.82% | | | | | | |
| Simon Property Group LP | | 1.75 | 2-1-2028 | | 60,000 | 54,659 |
| Simon Property Group LP | | 3.25 | 9-13-2049 | | 255,000 | 228,316 |
| | | | | | | 282,975 |
| Utilities: 2.07% | | | | | | |
| Electric utilities: 2.07% | | | | | | |
| Duke Energy Florida LLC | | 1.75 | 6-15-2030 | | 90,000 | 80,117 |
| New York State Electric & Gas Corporation 144A | | 3.25 | 12-1-2026 | | 145,000 | 143,837 |
| Oglethorpe Power Corporation | | 3.75 | 8-1-2050 | | 125,000 | 117,500 |
| Pacificorp | | 3.50 | 6-15-2029 | | 295,000 | 298,555 |
| Union Electric Company | | 2.95 | 3-15-2030 | | 80,000 | 78,286 |
| | | | | | | 718,295 |
| Total Corporate bonds and notes (Cost $19,028,969) | | | | | | 18,497,368 |
The accompanying notes are an integral part of these financial statements.
12 | Allspring Global Investment Grade Credit Fund
Portfolio of investments—March 31, 2022 (unaudited)
| | | Interest
rate | Maturity
date | Principal | Value |
| Foreign corporate bonds and notes : 26.09% | | | | | | |
| Communication services: 1.02% | | | | | | |
| Diversified telecommunication services: 0.70% | | | | | | |
| Verizon Communications Incorporated | | 2.88% | 1-15-2038 | EUR | 200,000 | $ 241,085 |
| Wireless telecommunication services: 0.32% | | | | | | |
| Tele2 AB | | 2.13 | 5-15-2028 | EUR | 100,000 | 111,855 |
| Consumer discretionary: 0.30% | | | | | | |
| Automobiles: 0.30% | | | | | | |
| Renault SA | | 2.38 | 5-25-2026 | EUR | 100,000 | 104,213 |
| Consumer staples: 1.16% | | | | | | |
| Beverages: 0.61% | | | | | | |
| Coca-Cola Company | | 0.13 | 3-15-2029 | EUR | 100,000 | 101,900 |
| Coca-Cola European Partners plc | | 1.50 | 11-8-2027 | EUR | 100,000 | 110,827 |
| | | | | | | 212,727 |
| Household products: 0.55% | | | | | | |
| Essity AB | | 0.25 | 2-8-2031 | EUR | 200,000 | 189,890 |
| Energy: 2.13% | | | | | | |
| Oil, gas & consumable fuels: 2.13% | | | | | | |
| BP Capital Markets plc (EUR Swap Annual (vs. 6 Month EURIBOR) 5 Year +3.88%) ʊ± | | 3.25 | 3-22-2026 | EUR | 100,000 | 110,895 |
| BP Capital Markets plc (U.S. Treasury 3 Month Bill +4.17%) ʊ± | | 4.25 | 3-22-2027 | GBP | 100,000 | 129,728 |
| National Grid Gas plc | | 1.13 | 1-14-2033 | GBP | 200,000 | 210,356 |
| Shell International Finance BV | | 1.00 | 12-10-2030 | GBP | 150,000 | 172,562 |
| TotalEnergies SE (EUR Swap Annual (vs. 6 Month EURIBOR) 5 Year +2.75%) ± | | 2.71 | 12-29-2049 | EUR | 100,000 | 111,839 |
| | | | | | | 735,380 |
| Financials: 9.76% | | | | | | |
| Banks: 6.16% | | | | | | |
| Argenta Spaarbank NV (EUR Swap Annual (vs. 6 Month EURIBOR) 1 Year +1.10%) ± | | 1.38 | 2-8-2029 | EUR | 200,000 | 209,996 |
| Banco BPM SpA | | 2.50 | 6-21-2024 | EUR | 100,000 | 112,836 |
| Banco de Sabadell SA | | 1.13 | 3-27-2025 | EUR | 100,000 | 106,761 |
| Bankia SA | | 1.13 | 11-12-2026 | EUR | 100,000 | 107,284 |
| Bankinter SA | | 0.63 | 10-6-2027 | EUR | 100,000 | 103,517 |
| Bawag Group AG (EUR Swap Annual (vs. 6 Month EURIBOR) 5 Year +2.30%) ± | | 2.38 | 3-26-2029 | EUR | 100,000 | 110,524 |
| Belfius Bank SA (EUR Swap Annual (vs. 6 Month EURIBOR) 5 Year +1.30%) ± | | 1.25 | 4-6-2034 | EUR | 200,000 | 197,439 |
| BNP Paribas | | 1.25 | 3-19-2025 | EUR | 200,000 | 221,488 |
| BPCE SA (EUR Swap Annual (vs. 6 Month EURIBOR) 5 Year +1.75%) ± | | 1.50 | 1-13-2042 | EUR | 200,000 | 207,333 |
| Credit Agricole Assurances | | 2.00 | 7-17-2030 | EUR | 200,000 | 210,017 |
| Mizuho Financial Group | | 0.80 | 4-15-2030 | EUR | 100,000 | 101,584 |
| Natwest Group plc (GBP Swap Semi Annual (vs. 6 Month LIBOR) 1 Year +1.49%) ± | | 2.88 | 9-19-2026 | GBP | 100,000 | 130,159 |
The accompanying notes are an integral part of these financial statements.
Allspring Global Investment Grade Credit Fund | 13
Portfolio of investments—March 31, 2022 (unaudited)
| | | Interest
rate | Maturity
date | Principal | Value |
| Banks (continued) | | | | | | |
| Raiffeisen Bank International AG (EURIBOR ICE Swap Rate 11:00am +3.15%) ± | | 2.88% | 6-18-2032 | EUR | 100,000 | $ 102,772 |
| Unicredit SpA (EUR Swap Annual (vs. 6 Month EURIBOR) 5 Year +2.80%) ± | | 2.73 | 1-15-2032 | EUR | 200,000 | 208,443 |
| | | | | | | 2,130,153 |
| Capital markets: 1.28% | | | | | | |
| Acciona Energia Financial Company | | 1.38 | 1-26-2032 | EUR | 100,000 | 103,297 |
| Cellnex Finance Company SA | | 2.00 | 2-15-2033 | EUR | 100,000 | 94,259 |
| Credit Suisse Group AG (UK Gilts 1 Year +2.23%) ± | | 2.25 | 6-9-2028 | GBP | 200,000 | 246,396 |
| | | | | | | 443,952 |
| Insurance: 2.32% | | | | | | |
| Berkshire Hathaway Incorporated | | 2.38 | 6-19-2039 | GBP | 100,000 | 121,509 |
| Mandatum Life Insurance Company Limited (3 Month EURIBOR +2.30%) ± | | 1.88 | 10-4-2049 | EUR | 200,000 | 216,829 |
| Munich Re Group (ICE LIBOR GBP 3 Month +4.95%) ± | | 6.63 | 5-26-2042 | GBP | 100,000 | 132,233 |
| Sampo Oyj | | 1.63 | 2-21-2028 | EUR | 100,000 | 111,142 |
| Sampo Oyj (3 Month EURIBOR +4.05%) ± | | 3.38 | 5-23-2049 | EUR | 100,000 | 113,871 |
| Swiss Re Finance (Luxembourg) SA (EURIBOR ICE Swap Rate 11:00am +2.85%) ± | | 2.53 | 4-30-2050 | EUR | 100,000 | 107,959 |
| | | | | | | 803,543 |
| Health care: 2.97% | | | | | | |
| Biotechnology: 0.50% | | | | | | |
| GlaxoSmithKline Capital Incorporated | | 1.63 | 5-12-2035 | GBP | 150,000 | 172,471 |
| Health care equipment & supplies: 1.09% | | | | | | |
| Molnlycke Holding AB | | 0.63 | 1-15-2031 | EUR | 200,000 | 189,886 |
| Motability Operations Group plc | | 2.38 | 7-3-2039 | GBP | 150,000 | 186,182 |
| | | | | | | 376,068 |
| Health care providers & services: 0.46% | | | | | | |
| Fresenius Medical Care AG & Company | | 1.50 | 5-29-2030 | EUR | 150,000 | 158,719 |
| Pharmaceuticals: 0.92% | | | | | | |
| Bayer AG (EURIBOR ICE Swap Rate 11:00am +2.65%) ± | | 2.38 | 11-12-2079 | EUR | 100,000 | 106,700 |
| Bayer AG (EUR Swap Annual (vs. 6 Month EURIBOR) 5 Year +3.11%) ± | | 3.13 | 11-12-2079 | EUR | 100,000 | 105,118 |
| Phoenix PIB Dutch Finance BV | | 2.38 | 8-5-2025 | EUR | 100,000 | 108,195 |
| | | | | | | 320,013 |
| Industrials: 0.91% | | | | | | |
| Aerospace & defense: 0.33% | | | | | | |
| MTU Aero Engines AG | | 3.00 | 7-1-2025 | EUR | 100,000 | 114,947 |
| Commercial services & supplies: 0.58% | | | | | | |
| Rentokil Initial plc | | 0.50 | 10-14-2028 | EUR | 200,000 | 200,070 |
| Information technology: 0.58% | | | | | | |
| Communications equipment: 0.58% | | | | | | |
| Telefonaktiebolaget LM Ericsson | | 1.13 | 2-8-2027 | EUR | 200,000 | 201,831 |
The accompanying notes are an integral part of these financial statements.
14 | Allspring Global Investment Grade Credit Fund
Portfolio of investments—March 31, 2022 (unaudited)
| | | Interest
rate | Maturity
date | Principal | Value |
| Materials: 1.50% | | | | | | |
| Chemicals: 0.95% | | | | | | |
| Arkema SA (EUR Swap Annual (vs. 6 Month EURIBOR) 5 Year +1.57%) ʊ± | | 1.50% | 10-21-2025 | EUR | 100,000 | $ 104,587 |
| Solvay SA (EUR Swap Annual (vs. 6 Month EURIBOR) 5 Year +3.92%) ʊ± | | 4.25 | 12-4-2023 | EUR | 100,000 | 112,284 |
| Syngenta Finance NV | | 3.38 | 4-16-2026 | EUR | 100,000 | 112,659 |
| | | | | | | 329,530 |
| Construction materials: 0.55% | | | | | | |
| Holcim Finance (Luxembourg) SA | | 0.50 | 4-23-2031 | EUR | 200,000 | 191,126 |
| Real estate: 2.30% | | | | | | |
| Equity REITs: 0.60% | | | | | | |
| Castellum Helsinki | | 0.88 | 9-17-2029 | EUR | 100,000 | 93,578 |
| Tritax Big Box REIT plc | | 1.50 | 11-27-2033 | GBP | 100,000 | 112,885 |
| | | | | | | 206,463 |
| Real estate management & development: 1.70% | | | | | | |
| Akelius Residential Property AB (EUR Swap Annual (vs. 6 Month EURIBOR) 5 Year +2.48%) ± | | 2.25 | 5-17-2081 | EUR | 100,000 | 102,688 |
| Grand City Properties SA (EUR Swap Annual (vs. 6 Month EURIBOR) 5 Year +2.18%) ʊ± | | 1.50 | 3-11-2026 | EUR | 100,000 | 98,050 |
| Heimstaden Bostad AB (EUR Swap Annual (vs. 6 Month EURIBOR) 5 Year +3.90%) ʊ± | | 3.63 | 10-14-2027 | EUR | 100,000 | 99,562 |
| LEG Immobilien SE | | 0.75 | 6-30-2031 | EUR | 100,000 | 96,715 |
| Vesteda Finance BV | | 0.75 | 10-18-2031 | EUR | 100,000 | 98,567 |
| Vonovia SE | | 0.75 | 9-1-2032 | EUR | 100,000 | 95,049 |
| | | | | | | 590,631 |
| Utilities: 3.46% | | | | | | |
| Electric utilities: 2.30% | | | | | | |
| Electricite de France SA (EUR Swap Annual (vs. 6 Month EURIBOR) 5 Year +2.86%) ʊ± | | 2.63 | 12-1-2027 | EUR | 200,000 | 198,014 |
| Electricite de France SA | | 5.50 | 10-17-2041 | GBP | 100,000 | 168,215 |
| ESB Finance Designated Activity Company | | 1.13 | 6-11-2030 | EUR | 100,000 | 107,201 |
| Iberdrola International BV (EUR Swap Annual (vs. 6 Month EURIBOR) 5 Year +2.32%) ʊ± | | 1.87 | 1-28-2026 | EUR | 200,000 | 213,783 |
| Reseau de Transport d'Electricite | | 1.88 | 10-23-2037 | EUR | 100,000 | 109,653 |
| | | | | | | 796,866 |
| Gas utilities: 0.56% | | | | | | |
| APT Pipelines Limited | | 2.00 | 7-15-2030 | EUR | 180,000 | 194,410 |
| Multi-utilities: 0.30% | | | | | | |
| Veolia Environnement SA (EUR Swap Annual (vs. 6 Month EURIBOR) 5 Year +2.08%) ʊ± | | 2.00 | 11-15-2027 | EUR | 100,000 | 102,045 |
| Water utilities: 0.30% | | | | | | |
| Thames Water Utilities Finance plc | | 0.88 | 1-31-2028 | EUR | 100,000 | 105,028 |
| Total Foreign corporate bonds and notes (Cost $9,855,883) | | | | | | 9,033,016 |
The accompanying notes are an integral part of these financial statements.
Allspring Global Investment Grade Credit Fund | 15
Portfolio of investments—March 31, 2022 (unaudited)
| | | Interest
rate | Maturity
date | Principal | Value |
| Municipal obligations: 0.47% | | | | | | |
| New Jersey: 0.47% | | | | | | |
| Transportation revenue: 0.47% | | | | | | |
| New Jersey TTFA Transportation System Refunding Bond Series B | | 4.13% | 6-15-2042 | $ | 165,000 | $ 163,213 |
| Total Municipal obligations (Cost $165,000) | | | | | | 163,213 |
| U.S. Treasury securities: 0.81% | | | | | | |
| U.S. Treasury Note | | 1.88 | 2-15-2032 | | 80,000 | 76,825 |
| U.S. Treasury Note | | 1.88 | 11-15-2051 | | 230,000 | 201,753 |
| Total U.S. Treasury securities (Cost $277,575) | | | | | | 278,578 |
| Yankee corporate bonds and notes: 14.57% | | | | | | |
| Communication services: 2.20% | | | | | | |
| Media: 0.48% | | | | | | |
| WPP Finance Limited 2010 | | 3.75 | 9-19-2024 | | 165,000 | 166,696 |
| Wireless telecommunication services: 1.72% | | | | | | |
| Telefonica Emisiones SAU | | 4.10 | 3-8-2027 | | 250,000 | 255,687 |
| Vodafone Group plc | | 4.38 | 5-30-2028 | | 325,000 | 339,868 |
| | | | | | | 595,555 |
| Consumer discretionary: 0.49% | | | | | | |
| Internet & direct marketing retail: 0.49% | | | | | | |
| Prosus NV 144A | | 3.83 | 2-8-2051 | | 230,000 | 167,614 |
| Consumer staples: 1.02% | | | | | | |
| Household products: 1.02% | | | | | | |
| Reckitt Benckiser Treasury Services plc 144A | | 2.75 | 6-26-2024 | | 355,000 | 354,219 |
| Energy: 0.30% | | | | | | |
| Oil, gas & consumable fuels: 0.30% | | | | | | |
| Equinor ASA | | 2.38 | 5-22-2030 | | 30,000 | 28,316 |
| Saudi Arabian Oil Company 144A | | 4.38 | 4-16-2049 | | 75,000 | 76,439 |
| | | | | | | 104,755 |
| Financials: 7.94% | | | | | | |
| Banks: 5.31% | | | | | | |
| Banco Santander SA | | 3.49 | 5-28-2030 | | 200,000 | 193,570 |
| Credit Suisse New York | | 3.63 | 9-9-2024 | | 330,000 | 333,785 |
| HSBC Holdings plc (U.S. SOFR +2.39%) ± | | 2.85 | 6-4-2031 | | 200,000 | 184,846 |
| HSBC Holdings plc | | 4.30 | 3-8-2026 | | 230,000 | 235,997 |
| National Australia Bank 144A | | 2.33 | 8-21-2030 | | 260,000 | 226,171 |
| Natwest Group plc | | 3.88 | 9-12-2023 | | 290,000 | 292,970 |
| Sumitomo Mitsui Financial Group | | 2.13 | 7-8-2030 | | 200,000 | 178,832 |
| Westpac Banking Corporation | | 3.65 | 5-15-2023 | | 190,000 | 192,987 |
| | | | | | | 1,839,158 |
| Capital markets: 0.52% | | | | | | |
| UBS Group AG (1 Year Treasury Constant Maturity +1.10%) 144A± | | 2.75 | 2-11-2033 | | 200,000 | 181,736 |
The accompanying notes are an integral part of these financial statements.
16 | Allspring Global Investment Grade Credit Fund
Portfolio of investments—March 31, 2022 (unaudited)
| | | Interest
rate | Maturity
date | Principal | Value |
| Consumer finance: 0.90% | | | | | | |
| Avolon Holdings Limited 144A | | 4.38% | 5-1-2026 | $ | 315,000 | $ 310,749 |
| Diversified financial services: 0.39% | | | | | | |
| AerCap Ireland Capital | | 3.30 | 1-30-2032 | | 150,000 | 135,219 |
| Insurance: 0.82% | | | | | | |
| Athene Holding Limited | | 3.50 | 1-15-2031 | | 295,000 | 282,359 |
| Information technology: 0.96% | | | | | | |
| Semiconductors & semiconductor equipment: 0.96% | | | | | | |
| NXP BV 144A | | 3.40 | 5-1-2030 | | 85,000 | 82,387 |
| NXP BV 144A | | 3.88 | 6-18-2026 | | 250,000 | 250,803 |
| | | | | | | 333,190 |
| Materials: 0.58% | | | | | | |
| Construction materials: 0.58% | | | | | | |
| Aliaxis Finance SA | | 0.88 | 11-8-2028 | | 200,000 | 198,941 |
| Real estate: 0.81% | | | | | | |
| Equity REITs: 0.81% | | | | | | |
| Scentre Group Trust 2 Company (5 Year Treasury Constant Maturity +4.69%) 144A± | | 5.13 | 9-24-2080 | | 285,000 | 279,656 |
| Utilities: 0.27% | | | | | | |
| Multi-utilities: 0.27% | | | | | | |
| Engie SA | | 1.00 | 10-26-2036 | | 100,000 | 93,761 |
| Total Yankee corporate bonds and notes (Cost $5,296,050) | | | | | | 5,043,608 |
| | | Yield | | Shares | |
| Short-term investments: 1.48% | | | | | | |
| Investment companies: 1.48% | | | | | | |
| Allspring Government Money Market Fund Select Class ♠∞ | | 0.18 | | | 513,114 | 513,114 |
| Total Short-term investments (Cost $513,114) | | | | | | 513,114 |
| Total investments in securities (Cost $35,749,513) | 98.54% | | | | | 34,113,496 |
| Other assets and liabilities, net | 1.46 | | | | | 504,523 |
| Total net assets | 100.00% | | | | | $34,618,019 |
| 144A | The security may be resold in transactions exempt from registration, normally to qualified institutional buyers, pursuant to Rule 144A under the Securities Act of 1933. |
| ± | Variable rate investment. The rate shown is the rate in effect at period end. |
| ♠ | The issuer of the security is an affiliated person of the Fund as defined in the Investment Company Act of 1940. |
| ∞ | The rate represents the 7-day annualized yield at period end. |
| ʊ | Security is perpetual in nature and has no stated maturity date. The date shown reflects the next call date. |
| Abbreviations: |
| EUR | Euro |
| EURIBOR | Euro Interbank Offered Rate |
| GBP | Great British pound |
| LIBOR | London Interbank Offered Rate |
| REIT | Real estate investment trust |
| SOFR | Secured Overnight Financing Rate |
| TTFA | Transportation Trust Fund Authority |
The accompanying notes are an integral part of these financial statements.
Allspring Global Investment Grade Credit Fund | 17
Portfolio of investments—March 31, 2022 (unaudited)
Investments in affiliates
An affiliated investment is an investment in which the Fund owns at least 5% of the outstanding voting shares of the issuer or as a result of other relationships, such as the Fund and the issuer having the same investment manager. Transactions with issuers that were affiliates of the Fund at the end of the period were as follows:
| | Value,
beginning of
period | Purchases | Sales
proceeds | Net
realized
gains
(losses) | Net
change in
unrealized
gains
(losses) | Value,
end of
period | Shares,
end
of period | Income
from
affiliated
securities |
| Short-term investments | | | | | | | |
| Allspring Government Money Market Fund Select Class | $1,613,662 | $6,515,593 | $(7,616,141) | $0 | $0 | $513,114 | 513,114 | $68 |
Forward foreign currency contracts
Currency to be
received | Currency to be
delivered | Counterparty | Settlement
date | Unrealized
gains | | Unrealized
losses |
| 8,450,578 USD | 7,650,000 EUR | State Street Bank & Trust Company | 4-27-2022 | $0 | | $ (17,926) |
| 1,838,380 USD | 1,400,000 GBP | State Street Bank & Trust Company | 4-27-2022 | 0 | | (448) |
| | | | | $0 | | $(18,374) |
The accompanying notes are an integral part of these financial statements.
18 | Allspring Global Investment Grade Credit Fund
Statement of assets and liabilities—March 31, 2022 (unaudited)
| | |
| Assets | |
Investments in unaffiliated securities, at value (cost $35,236,399)
| $ 33,600,382 |
Investments in affiliated securities, at value (cost $513,114)
| 513,114 |
Foreign currency, at value (cost $122,323)
| 121,398 |
Receivable for interest
| 328,111 |
Receivable for investments sold
| 230,027 |
Prepaid expenses and other assets
| 16,213 |
Total assets
| 34,809,245 |
| Liabilities | |
Payable for investments purchased
| 105,334 |
Professional fees payable
| 34,752 |
Unrealized losses on forward foreign currency contracts
| 18,374 |
Custody and accounting fees payable
| 13,587 |
Shareholder report expenses payable
| 12,216 |
Trustees’ fees and expenses payable
| 3,334 |
Management fee payable
| 1,838 |
Administration fees payable
| 898 |
Accrued expenses and other liabilities
| 893 |
Total liabilities
| 191,226 |
Total net assets
| $34,618,019 |
| Net assets consist of | |
Paid-in capital
| $ 35,796,535 |
Total distributable loss
| (1,178,516) |
Total net assets
| $34,618,019 |
| Computation of net asset value per share | |
Net assets – Class R6
| $ 34,593,316 |
Shares outstanding – Class R61
| 3,665,448 |
Net asset value per share – Class R6
| $9.44 |
Net assets – Institutional Class
| $ 24,703 |
Shares outstanding – Institutional Class1
| 2,617 |
Net asset value per share – Institutional Class
| $9.44 |
| 1 | The Fund has an unlimited number of authorized shares. |
The accompanying notes are an integral part of these financial statements.
Allspring Global Investment Grade Credit Fund | 19
Statement of operations—six months ended March 31, 2022 (unaudited)
| | |
| Investment income | |
Interest
| $ 550,413 |
Income from affiliated securities
| 68 |
Total investment income
| 550,481 |
| Expenses | |
Management fee
| 81,405 |
| Administration fees | |
Class R6
| 6,101 |
Institutional Class
| 11 |
Custody and accounting fees
| 8,093 |
Professional fees
| 23,634 |
Registration fees
| 10,299 |
Shareholder report expenses
| 9,764 |
Trustees’ fees and expenses
| 10,681 |
Other fees and expenses
| 981 |
Total expenses
| 150,969 |
| Less: Fee waivers and/or expense reimbursements | |
Fund-level
| (59,382) |
Net expenses
| 91,587 |
Net investment income
| 458,894 |
| Realized and unrealized gains (losses) on investments | |
| Net realized gains (losses) on | |
Unaffiliated securities
| (6,049) |
Forward foreign currency contracts
| 996,709 |
Net realized gains on investments
| 990,660 |
| Net change in unrealized gains (losses) on | |
Unaffiliated securities
| (4,014,497) |
Forward foreign currency contracts
| (188,823) |
Net change in unrealized gains (losses) on investments
| (4,203,320) |
Net realized and unrealized gains (losses) on investments
| (3,212,660) |
Net decrease in net assets resulting from operations
| $(2,753,766) |
The accompanying notes are an integral part of these financial statements.
20 | Allspring Global Investment Grade Credit Fund
Statement of changes in net assets
| | | | | |
| | Six months ended
March 31, 2022
(unaudited) | Year ended
September 30, 2021 |
| Operations | | | | |
Net investment income
| | $ 458,894 | | $ 1,390,147 |
Net realized gains on investments
| | 990,660 | | 2,532,345 |
Net change in unrealized gains (losses) on investments
| | (4,203,320) | | (2,132,176) |
Net increase (decrease) in net assets resulting from operations
| | (2,753,766) | | 1,790,316 |
| Distributions to shareholders from | | | | |
| Net investment income and net realized gains | | | | |
Class R6
| | (2,036,093) | | (3,431,984) |
Institutional Class
| | (1,293) | | (1,386) |
Total distributions to shareholders
| | (2,037,386) | | (3,433,370) |
| Capital share transactions | Shares | | Shares | |
| Proceeds from shares sold | | | | |
Class R6
| 143,383 | 1,454,245 | 1,105,335 | 12,046,379 |
| Reinvestment of distributions | | | | |
Class R6
| 198,510 | 2,020,860 | 217,161 | 2,350,779 |
Institutional Class
| 117 | 1,192 | 0 | 0 |
| | | 2,022,052 | | 2,350,779 |
| Payment for shares redeemed | | | | |
Class R6
| (925,487) | (9,406,360) | (4,117,900) | (44,289,615) |
Net decrease in net assets resulting from capital share transactions
| | (5,930,063) | | (29,892,457) |
Total decrease in net assets
| | (10,721,215) | | (31,535,511) |
| Net assets | | | | |
Beginning of period
| | 45,339,234 | | 76,874,745 |
End of period
| | $ 34,618,019 | | $ 45,339,234 |
The accompanying notes are an integral part of these financial statements.
Allspring Global Investment Grade Credit Fund | 21
Financial highlights
(For a share outstanding throughout each period)
| | | Year ended September 30 |
| Class R6 | Six months ended
March 31, 2022
(unaudited) | 2021 | 2020 | 2019 1 |
Net asset value, beginning of period
| $10.66 | $10.91 | $10.75 | $10.00 |
Net investment income
| 0.11 2 | 0.24 2 | 0.24 2 | 0.13 |
Net realized and unrealized gains (losses) on investments
| (0.81) | 0.07 | 0.39 | 0.73 |
Total from investment operations
| (0.70) | 0.31 | 0.63 | 0.86 |
| Distributions to shareholders from | | | | |
Net investment income
| (0.12) | (0.31) | (0.34) | (0.11) |
Net realized gains
| (0.40) | (0.25) | (0.13) | 0.00 |
Total distributions to shareholders
| (0.52) | (0.56) | (0.47) | (0.11) |
Net asset value, end of period
| $9.44 | $10.66 | $10.91 | $10.75 |
Total return3
| (6.90)% | 2.86% | 6.10% | 8.64% |
| Ratios to average net assets (annualized) | | | | |
Gross expenses
| 0.74% | 0.68% | 0.77% | 0.86% |
Net expenses
| 0.45% | 0.45% | 0.45% | 0.45% |
Net investment income
| 2.25% | 2.22% | 2.29% | 2.34% |
| Supplemental data | | | | |
Portfolio turnover rate
| 13% | 28% | 79% | 36% |
Net assets, end of period (000s omitted)
| $34,593 | $45,313 | $76,847 | $96,835 |
| 1 | For the period from February 28, 2019 (commencement of class operations) to September 30, 2019 |
| 2 | Calculated based upon average shares outstanding |
| 3 | Returns for periods of less than one year are not annualized. |
The accompanying notes are an integral part of these financial statements.
22 | Allspring Global Investment Grade Credit Fund
Financial highlights
(For a share outstanding throughout each period)
| | | Year ended September 30 |
| Institutional Class | Six months ended
March 31, 2022
(unaudited) | 2021 | 2020 | 2019 1 |
Net asset value, beginning of period
| $10.66 | $10.91 | $10.75 | $10.00 |
Net investment income
| 0.11 | 0.23 | 0.24 | 0.14 |
Net realized and unrealized gains (losses) on investments
| (0.81) | 0.07 | 0.38 | 0.72 |
Total from investment operations
| (0.70) | 0.30 | 0.62 | 0.86 |
| Distributions to shareholders from | | | | |
Net investment income
| (0.12) | (0.30) | (0.33) | (0.11) |
Net realized gains
| (0.40) | (0.25) | (0.13) | 0.00 |
Total distributions to shareholders
| (0.52) | (0.55) | (0.46) | (0.11) |
Net asset value, end of period
| $9.44 | $10.66 | $10.91 | $10.75 |
Total return2
| (6.93)% | 2.81% | 6.04% | 8.64% |
| Ratios to average net assets (annualized) | | | | |
Gross expenses
| 0.79% | 0.73% | 0.83% | 0.97% |
Net expenses
| 0.50% | 0.50% | 0.50% | 0.50% |
Net investment income
| 2.22% | 2.18% | 2.24% | 2.34% |
| Supplemental data | | | | |
Portfolio turnover rate
| 13% | 28% | 79% | 36% |
Net assets, end of period (000s omitted)
| $25 | $27 | $27 | $27 |
| 1 | For the period from February 28, 2019 (commencement of class operations) to September 30, 2019 |
| 2 | Returns for periods of less than one year are not annualized. |
The accompanying notes are an integral part of these financial statements.
Allspring Global Investment Grade Credit Fund | 23
Notes to financial statements (unaudited)
1. ORGANIZATION
Allspring Funds Trust (the "Trust"), a Delaware statutory trust organized on March 10, 1999, is an open-end management investment company registered under the Investment Company Act of 1940, as amended (the "1940 Act"). As an investment company, the Trust follows the accounting and reporting guidance in Financial Accounting Standards Board ("FASB") Accounting Standards Codification Topic 946, Financial Services – Investment Companies. These financial statements report on the Allspring Global Investment Grade Credit Fund (the "Fund") which is a diversified series of the Trust.
Effective on November 1, 2021, the sale transaction of Wells Fargo Asset Management ("WFAM") by Wells Fargo & Company to GTCR LLC and Reverence Capital Partners, L.P. was closed. In connection with the closing of the transaction, WFAM became known as Allspring Global Investments (“Allspring”) and various entities that provided services to the Fund changed their names to "Allspring", including Allspring Funds Management, LLC, the investment manager to the Fund, Allspring Global Investments, LLC and Allspring Global Investments (UK) Limited, both registered investment advisers providing subadvisory services to certain funds, and Allspring Funds Distributor, LLC, the Fund's principal underwriter. Consummation of the transaction resulted in a new investment management agreement and subadvisory agreement which became effective on November 1, 2021.
2. SIGNIFICANT ACCOUNTING POLICIES
The following significant accounting policies, which are consistently followed in the preparation of the financial statements of the Fund, are in conformity with U.S. generally accepted accounting principles which require management to make estimates and assumptions that affect the reported amounts of assets and liabilities, disclosure of contingent assets and liabilities at the date of the financial statements, and the reported amounts of income and expenses during the reporting period. Actual results could differ from those estimates.
Securities valuation
All investments are valued each business day as of the close of regular trading on the New York Stock Exchange (generally 4 p.m. Eastern Time), although the Fund may deviate from this calculation time under unusual or unexpected circumstances.
Debt securities are valued at the evaluated bid price provided by an independent pricing service (e.g. taking into account various factors, including yields, maturities, or credit ratings) or, if a reliable price is not available, the quoted bid price from an independent broker-dealer.
The values of securities denominated in foreign currencies are translated into U.S. dollars at rates provided by an independent foreign currency pricing source at a time each business day specified by the Allspring Global Investments Pricing Committee at Allspring Funds Management, LLC ("Allspring Funds Management").
Futures contracts that are listed on a foreign or domestic exchange or market are valued at the official closing price or, if none, the last sales price.
Forward foreign currency contracts are recorded at the forward rate provided by an independent foreign currency pricing source at a time each business day specified by the Allspring Global Investments Pricing Committee.
Investments in registered open-end investment companies are valued at net asset value.
Investments which are not valued using any of the methods discussed above are valued at their fair value, as determined in good faith by the Board of Trustees. The Board of Trustees has established a Valuation Committee comprised of the Trustees and has delegated to it the authority to take any actions regarding the valuation of portfolio securities that the Valuation Committee deems necessary or appropriate, including determining the fair value of portfolio securities, unless the determination has been delegated to the Allspring Global Investments Pricing Committee. The Board of Trustees retains the authority to make or ratify any valuation decisions or approve any changes to the Valuation Procedures as it deems appropriate. On a quarterly basis, the Board of Trustees receives reports on any valuation actions taken by the Valuation Committee or the Allspring Global Investments Pricing Committee which may include items for ratification.
Foreign currency translation
The accounting records of the Fund are maintained in U.S. dollars. The values of other assets and liabilities denominated in foreign currencies are translated into U.S. dollars at rates provided by an independent foreign currency pricing source at a time each business day specified by the Allspring Global Investments Pricing Committee. Purchases and sales of securities, and income and expenses are converted at the rate of exchange on the respective dates of such transactions. Net realized foreign exchange gains or losses arise from sales of foreign currencies, currency gains or losses realized between the trade and settlement dates on securities transactions, and the difference between the amounts of dividends, interest and foreign withholding taxes recorded and the U.S. dollar equivalent of the amounts actually paid or received. Net unrealized foreign
24 | Allspring Global Investment Grade Credit Fund
Notes to financial statements (unaudited)
exchange gains and losses arise from changes in the fair value of assets and liabilities other than investments in securities resulting from changes in exchange rates. The changes in net assets arising from changes in exchange rates of securities and the changes in net assets resulting from changes in market prices of securities are not separately presented. Such changes are included in net realized and unrealized gains or losses from investments.
When-issued transactions
The Fund may purchase securities on a forward commitment or when-issued basis. The Fund records a when-issued transaction on the trade date and will segregate assets in an amount at least equal in value to the Fund's commitment to purchase when-issued securities. Securities purchased on a when-issued basis are marked-to-market daily and the Fund begins earning interest on the settlement date. Losses may arise due to changes in the market value of the underlying securities or if the counterparty does not perform under the contract.
Forward foreign currency contracts
A forward foreign currency contract is an agreement between two parties to purchase or sell a specific currency for an agreed-upon price at a future date. The Fund enters into forward foreign currency contracts to facilitate transactions in foreign-denominated securities and to attempt to minimize the risk to the Fund from adverse changes in the relationship between currencies. Forward foreign currency contracts are recorded at the forward rate and marked-to-market daily. When the contracts are closed, realized gains and losses arising from such transactions are recorded as realized gains or losses on forward foreign currency contracts. The Fund is subject to foreign currency risk and may be exposed to risks if the counterparties to the contracts are unable to meet the terms of their contracts or if the value of the foreign currency changes unfavorably. The Fund's maximum risk of loss from counterparty credit risk is the unrealized gains on the contracts. This risk may be mitigated if there is a master netting arrangement between the Fund and the counterparty.
Futures contracts
Futures contracts are agreements between the Fund and a counterparty to buy or sell a specific amount of a commodity, financial instrument or currency at a specified price on a specified date. The Fund may buy and sell futures contracts in order to gain exposure to, or protect against, changes in interest rates and foreign exchange rates and is subject to interest rate risk and foreign currency risk. The primary risks associated with the use of futures contracts are the imperfect correlation between changes in market values of securities held by the Fund and the prices of futures contracts, and the possibility of an illiquid market. Futures contracts are generally entered into on a regulated futures exchange and cleared through a clearinghouse associated with the exchange. With futures contracts, there is minimal counterparty risk to the Fund since futures contracts are exchange traded and the exchange’s clearinghouse, as the counterparty to all exchange traded futures, guarantees the futures contracts against default.
Upon entering into a futures contract, the Fund is required to deposit either cash or securities (initial margin) with the broker in an amount equal to a certain percentage of the contract value. Subsequent payments (variation margin) are paid to or from the broker each day equal to the daily changes in the contract value. Such payments are recorded as unrealized gains or losses and, if any, shown as variation margin receivable (payable) in the Statement of Assets and Liabilities. Should the Fund fail to make requested variation margin payments, the broker can gain access to the initial margin to satisfy the Fund’s payment obligations. When the contracts are closed, a realized gain or loss is recorded in the Statement of Operations.
Security transactions and income recognition
Securities transactions are recorded on a trade date basis. Realized gains or losses are recorded on the basis of identified cost.
Interest income is accrued daily and bond discounts are accreted and premiums are amortized daily. To the extent debt obligations are placed on non-accrual status, any related interest income may be reduced by writing off interest receivables when the collection of all or a portion of interest has been determined to be doubtful based on consistently applied procedures and the fair value has decreased. If the issuer subsequently resumes interest payments or when the collectability of interest is reasonably assured, the debt obligation is removed from non-accrual status. Paydown gains and losses are included in interest income.
Distributions to shareholders
Distributions to shareholders are recorded on the ex-dividend date and paid from net investment income monthly and any net realized gains are paid at least annually. Such distributions are determined in accordance with income tax regulations and may differ from U.S. generally accepted accounting principles. Dividend sources are estimated at the time of declaration. The tax character of distributions is determined as of the Fund's fiscal year end. Therefore, a portion of the Fund's distributions made prior to the Fund’s fiscal year end may be categorized as a tax return of capital at year end.
Allspring Global Investment Grade Credit Fund | 25
Notes to financial statements (unaudited)
Federal and other taxes
The Fund intends to continue to qualify as a regulated investment company by distributing substantially all of its investment company taxable income and any net realized capital gains (after reduction for capital loss carryforwards) sufficient to relieve it from all, or substantially all, federal income taxes. Accordingly, no provision for federal income taxes was required.
The Fund’s income and federal excise tax returns and all financial records supporting those returns for the prior three fiscal years are subject to examination by the federal and Delaware revenue authorities. Management has analyzed the Fund's tax positions taken on federal, state, and foreign tax returns for all open tax years and does not believe that there are any uncertain tax positions that require recognition of a tax liability.
As of March 31, 2022, the aggregate cost of all investments for federal income tax purposes was $36,200,697 and the unrealized gains (losses) consisted of:
| Gross unrealized gains | $ 412,846 |
| Gross unrealized losses | (2,518,421) |
| Net unrealized losses | $(2,105,575) |
Class allocations
The separate classes of shares offered by the Fund differ principally in administration fees. Class specific expenses are charged directly to that share class. Investment income, common fund-level expenses, and realized and unrealized gains (losses) on investments are allocated daily to each class of shares based on the relative proportion of net assets of each class.
3. FAIR VALUATION MEASUREMENTS
Fair value measurements of investments are determined within a framework that has established a fair value hierarchy based upon the various data inputs utilized in determining the value of the Fund’s investments. The three-level hierarchy gives the highest priority to unadjusted quoted prices in active markets for identical assets or liabilities (Level 1) and the lowest priority to unobservable inputs (Level 3). The Fund’s investments are classified within the fair value hierarchy based on the lowest level of input that is significant to the fair value measurement. The inputs are summarized into three broad levels as follows:
| ■ | Level 1 – quoted prices in active markets for identical securities |
| ■ | Level 2 – other significant observable inputs (including quoted prices for similar securities, interest rates, prepayment speeds, credit risk, etc.) |
| ■ | Level 3 – significant unobservable inputs (including the Fund’s own assumptions in determining the fair value of investments) |
The inputs or methodologies used for valuing investments in securities are not necessarily an indication of the risk associated with investing in those securities.
26 | Allspring Global Investment Grade Credit Fund
Notes to financial statements (unaudited)
The following is a summary of the inputs used in valuing the Fund’s assets and liabilities as of March 31, 2022:
| | Quoted prices
(Level 1) | Other significant
observable inputs
(Level 2) | Significant
unobservable inputs
(Level 3) | Total |
| Assets | | | | |
| Investments in: | | | | |
| Asset-backed securities | $ 0 | $ 584,599 | $0 | $ 584,599 |
| Corporate bonds and notes | 0 | 18,497,368 | 0 | 18,497,368 |
| Foreign corporate bonds and notes | 0 | 9,033,016 | 0 | 9,033,016 |
| Municipal obligations | 0 | 163,213 | 0 | 163,213 |
| U.S. Treasury securities | 278,578 | 0 | 0 | 278,578 |
| Yankee corporate bonds and notes | 0 | 5,043,608 | 0 | 5,043,608 |
| Short-term investments | | | | |
| Investment companies | 513,114 | 0 | 0 | 513,114 |
| Total assets | $791,692 | $33,321,804 | $0 | $34,113,496 |
| Liabilities | | | | |
| Forward foreign currency contracts | $ 0 | $ 18,374 | $0 | $ 18,374 |
| Total liabilities | $ 0 | $ 18,374 | $0 | $ 18,374 |
Forward foreign currency contracts are reported at their cumulative unrealized gains (losses) at measurement date as reported in the table following the Portfolio of Investments. All other assets and liabilities are reported at their market value at measurement date.
Additional sector, industry or geographic detail, if any, is included in the Portfolio of Investments.
For the six months ended March 31, 2022, the Fund did not have any transfers into/out of Level 3.
4. TRANSACTIONS WITH AFFILIATES
Management fee
Allspring Funds Management, a wholly owned subsidiary of Allspring Global Investments Holdings, LLC, a holding company indirectly owned by certain private funds of GTCR LLC and Reverence Capital Partners, L.P., is the manager of the Fund and provides advisory and fund-level administrative services under an investment management agreement. Under the investment management agreement, Allspring Funds Management is responsible for, among other services, implementing the investment objectives and strategies of the Fund, supervising the subadvisers and providing fund-level administrative services in connection with the Fund’s operations. As compensation for its services under the investment management agreement, Allspring Funds Management is entitled to receive a management fee at the following annual rate based on the Fund’s average daily net assets:
| Average daily net assets | Management fee |
| First $500 million | 0.400% |
| Next $500 million | 0.375 |
| Next $2 billion | 0.350 |
| Next $2 billion | 0.325 |
| Next $5 billion | 0.290 |
| Over $10 billion | 0.280 |
For the six months ended March 31, 2022, the management fee was equivalent to an annual rate of 0.40% of the Fund’s average daily net assets.
Allspring Funds Management has retained the services of subadvisers to provide daily portfolio management to the Fund. The fee for subadvisory services is borne by Allspring Funds Management. Allspring Global Investments, LLC and Allspring Global Investments (UK) Limited, each an affiliate of Allspring Funds Management and a wholly owned subsidiary of Allspring Global
Allspring Global Investment Grade Credit Fund | 27
Notes to financial statements (unaudited)
Investments Holdings, LLC, are subadvisers to the Fund and are each entitled to receive a fee from Allspring Funds Management at an annual rate starting at 0.10% and declining to 0.05% as the average daily net assets of the Fund increase.
Administration fees
Under a class-level administration agreement, Allspring Funds Management provides class-level administrative services to the Fund, which includes paying fees and expenses for services provided by the transfer agent, sub-transfer agents, omnibus account servicers and record-keepers. As compensation for its services under the class-level administration agreement, Allspring Funds Management receives an annual fee which is calculated based on the average daily net assets of each class as follows:
| | Class-level
administration fee |
| Class R6 | 0.03% |
| Institutional Class | 0.08 |
Waivers and/or expense reimbursements
Allspring Funds Management has contractually committed to waive and/or reimburse management and administration fees to the extent necessary to maintain certain net operating expense ratios for the Fund. When each class of the Fund has exceeded its expense cap, Allspring Funds Management will waive fees and/or reimburse expenses from fund-level expenses on a proportionate basis and then from class specific expenses. When only certain classes exceed their expense caps, waivers and/or reimbursements are applied against class specific expenses before fund-level expenses. Allspring Funds Management has contractually committed through January 31, 2023 to waive fees and/or reimburse expenses to the extent necessary to cap expenses. Prior to or after the commitment expiration date, the caps may be increased or the commitment to maintain the caps may be terminated only with the approval of the Board of Trustees. As of March 31, 2022, the contractual expense caps are as follows:
| | Expense ratio caps |
| Class R6 | 0.45% |
| Institutional Class | 0.50 |
Interfund transactions
The Fund may purchase or sell portfolio investment securities to certain affiliates pursuant to Rule 17a-7 under the 1940 Act and under procedures adopted by the Board of Trustees. The procedures have been designed to ensure that these interfund transactions, which do not incur broker commissions, are effected at current market prices.
5. INVESTMENT PORTFOLIO TRANSACTIONS
Purchases and sales of investments, excluding short-term securities, for the six months ended March 31, 2022 were as follows:
| Purchases at cost | | Sales proceeds |
U.S.
government | Non-U.S.
government | | U.S.
government | Non-U.S.
government |
| $1,569,062 | $3,673,113 | | $1,957,109 | $9,256,446 |
6. DERIVATIVE TRANSACTIONS
During the six months ended March 31, 2022, the Fund entered into forward foreign currency contracts for economic hedging purposes. The Fund had average contract amounts of $538,597 in forward foreign currency contracts to buy and $13,627,720 in forward foreign currency contracts to sell during the six months ended March 31, 2022.
The fair value, realized gains or losses and change in unrealized gains or losses, if any, on derivative instruments are reflected in the corresponding financial statement captions.
For certain types of derivative transactions, the Fund has entered into International Swaps and Derivatives Association, Inc. master agreements (“ISDA Master Agreements”) or similar agreements with approved counterparties. The ISDA Master Agreements or similar agreements may have requirements to deliver/deposit securities or cash to/with an exchange or broker-
28 | Allspring Global Investment Grade Credit Fund
Notes to financial statements (unaudited)
dealer as collateral and allows the Fund to offset, with each counterparty, certain derivative financial instrument’s assets and/or liabilities with collateral held or pledged. Collateral requirements differ by type of derivative. Collateral or margin requirements are set by the broker or exchange clearinghouse for exchange traded derivatives while collateral terms are contract specific for over-the-counter traded derivatives. Cash collateral that has been pledged to cover obligations of the Fund under ISDA Master Agreements or similar agreements, if any, are reported separately in the Statement of Assets and Liabilities. Securities pledged as collateral, if any, are noted in the Portfolio of Investments. With respect to balance sheet offsetting, absent an event of default by the counterparty or a termination of the agreement, the reported amounts of financial assets and financial liabilities in the Statement of Assets and Liabilities are not offset across transactions between the Fund and the applicable counterparty. A reconciliation of the gross amounts on the Statement of Assets and Liabilities to the net amounts by counterparty, including any collateral exposure, for OTC derivatives is as follows:
| Counterparty | Gross amounts
of liabilities in the
Statement of
Assets and
Liabilities | Amounts
subject to
netting
agreements | Collateral
received | Net amount
of assets |
| State Street Bank & Trust Company | $18,374 | $0 | $0 | $18,374 |
7. BANK BORROWINGS
The Trust (excluding the money market funds), Allspring Master Trust and Allspring Variable Trust are parties to a $350,000,000 revolving credit agreement whereby the Fund is permitted to use bank borrowings for temporary or emergency purposes, such as to fund shareholder redemption requests. Interest under the credit agreement is charged to the Fund based on a borrowing rate equal to the higher of the Federal Funds rate in effect on that day plus 1.25% or the overnight bank funding rate in effect on that day plus 1.25%. In addition, an annual commitment fee equal to 0.25% of the unused balance is allocated to each participating fund.
For the six months ended March 31, 2022, there were no borrowings by the Fund under the agreement.
8. CONCENTRATION RISK
A fund with a concentration of ownership may be more affected by the investment activity of those shareholders than would be a fund that does not have any ownership concentration. As of March 31, 2022, Allspring Funds Management or one of its affiliates owned 100% of the Institutional Class of the Fund.
9. INDEMNIFICATION
Under the Fund's organizational documents, the officers and Trustees have been granted certain indemnification rights against certain liabilities that may arise out of performance of their duties to the Fund. The Fund has entered into a separate agreement with each Trustee that converts indemnification rights currently existing under the Fund’s organizational documents into contractual rights that cannot be changed in the future without the consent of the Trustee. Additionally, in the normal course of business, the Fund may enter into contracts with service providers that contain a variety of indemnification clauses. The Fund’s maximum exposure under these arrangements is dependent on future claims that may be made against the Fund and, therefore, cannot be estimated.
10. CORONAVIRUS (COVID-19) PANDEMIC
On March 11, 2020, the World Health Organization announced that it had made the assessment that coronavirus disease 2019 (“COVID-19”) is a pandemic. The impacts of COVID-19 are affecting the entire global economy, individual companies and investment products, the funds, and the market in general. There is significant uncertainty around the extent and duration of business disruptions related to COVID-19 and the impacts may last for an extended period of time. COVID-19 has led to significant uncertainty and volatility in the financial markets.
Allspring Global Investment Grade Credit Fund | 29
Other information (unaudited)
PROXY VOTING INFORMATION
A description of the policies and procedures used to determine how to vote proxies relating to portfolio securities is available without charge, upon request, by calling 1-800-222-8222, visiting our website at allspringglobal.com, or visiting the SEC website at sec.gov. Information regarding how the proxies related to portfolio securities were voted during the most recent 12-month period ended June 30 is available on the website at allspringglobal.com or by visiting the SEC website at sec.gov.
QUARTERLY PORTFOLIO HOLDINGS INFORMATION
The Fund files its complete schedule of portfolio holdings with the SEC for the first and third quarters of each fiscal year as an exhibit to its reports on Form N-PORT. Shareholders may view the filed Form N-PORT by visiting the SEC website at sec.gov.
30 | Allspring Global Investment Grade Credit Fund
Other information (unaudited)
BOARD OF TRUSTEES AND OFFICERS
Each of the Trustees and Officers listed in the table below acts in identical capacities for each fund in the Allspring family of funds, which consists of 138 mutual funds comprising the Allspring Funds Trust, Allspring Variable Trust, Allspring Master Trust and four closed-end funds (collectively the “Fund Complex”). This table should be read in conjunction with the Prospectus and the Statement of Additional Information1. The mailing address of each Trustee and Officer is 525 Market Street, 12th Floor, San Francisco, CA 94105. Each Trustee and Officer serves an indefinite term, however, each Trustee serves such term until reaching the mandatory retirement age established by the Trustees.
Independent Trustees
Name and
year of birth | Position held and
length of service* | Principal occupations during past five years or longer | Current other
public company or
investment
company
directorships |
William R. Ebsworth
(Born 1957) | Trustee,
since 2015 | Retired. From 1984 to 2013, equities analyst, portfolio manager, research director and chief investment officer at Fidelity Management and Research Company in Boston, Tokyo, and Hong Kong, and retired in 2013 as Chief Investment Officer of Fidelity Strategic Advisers, Inc. where he led a team of investment professionals managing client assets. Prior thereto, Board member of Hong Kong Securities Clearing Co., Hong Kong Options Clearing Corp., the Thailand International Fund, Ltd., Fidelity Investments Life Insurance Company, and Empire Fidelity Investments Life Insurance Company. Audit Committee Chair and Investment Committee Chair of the Vincent Memorial Hospital Endowment (non-profit organization). Mr. Ebsworth is a CFA® charterholder. | N/A |
Jane A. Freeman
(Born 1953) | Trustee,
since 2015;
Chair Liaison,
since 2018 | Retired. From 2012 to 2014 and 1999 to 2008, Chief Financial Officer of Scientific Learning Corporation. From 2008 to 2012, Ms. Freeman provided consulting services related to strategic business projects. Prior to 1999, Portfolio Manager at Rockefeller & Co. and Scudder, Stevens & Clark. Board member of the Harding Loevner Funds from 1996 to 2014, serving as both Lead Independent Director and chair of the Audit Committee. Board member of the Russell Exchange Traded Funds Trust from 2011 to 2012 and the chair of the Audit Committee. Ms. Freeman is also an inactive Chartered Financial Analyst. | N/A |
Isaiah Harris, Jr.
(Born 1952) | Trustee,
since 2009; Audit
Committee
Chair,
since 2019 | Retired. Chairman of the Board of CIGNA Corporation from 2009 to 2021, and Director from 2005 to 2008. From 2003 to 2011, Director of Deluxe Corporation. Prior thereto, President and CEO of BellSouth Advertising and Publishing Corp. from 2005 to 2007, President and CEO of BellSouth Enterprises from 2004 to 2005 and President of BellSouth Consumer Services from 2000 to 2003. Emeritus member of the Iowa State University Foundation Board of Governors. Emeritus Member of the Advisory Board of Iowa State University School of Business. Advisory Board Member, Palm Harbor Academy (private school). Advisory Board Member, Fellowship of Christian Athletes. Mr. Harris is a certified public accountant (inactive status). | N/A |
David F. Larcker
(Born 1950) | Trustee,
since 2009 | James Irvin Miller Professor of Accounting at the Graduate School of Business (Emeritus), Stanford University, Director of the Corporate Governance Research Initiative and Senior Faculty of The Rock Center for Corporate Governance since 2006. From 2005 to 2008, Professor of Accounting at the Graduate School of Business, Stanford University. Prior thereto, Ernst & Young Professor of Accounting at The Wharton School, University of Pennsylvania from 1985 to 2005. | N/A |
Allspring Global Investment Grade Credit Fund | 31
Other information (unaudited)
Name and
year of birth | Position held and
length of service* | Principal occupations during past five years or longer | Current other
public company or
investment
company
directorships |
Olivia S. Mitchell
(Born 1953) | Trustee,
since 2006;
Nominating and
Governance
Committee Chair,
since 2018 | International Foundation of Employee Benefit Plans Professor since 1993, Wharton School of the University of Pennsylvania. Director of Wharton’s Pension Research Council and Boettner Center on Pensions & Retirement Research, and Research Associate at the National Bureau of Economic Research. Previously taught at Cornell University from 1978 to 1993. | N/A |
Timothy J. Penny
(Born 1951) | Trustee,
since 1996;
Chair,
since 2018 | President and Chief Executive Officer of Southern Minnesota Initiative Foundation, a non-profit organization, since 2007. Member of the Board of Trustees of NorthStar Education Finance, Inc., a non-profit organization, since 2007. | N/A |
James G. Polisson
(Born 1959) | Trustee,
since 2018 | Retired. Chief Marketing Officer, Source (ETF) UK Services, Ltd, from 2015 to 2017. From 2012 to 2015, Principal of The Polisson Group, LLC, a management consulting, corporate advisory and principal investing company. Chief Executive Officer and Managing Director at Russell Investments, Global Exchange Traded Funds from 2010 to 2012. Managing Director of Barclays Global Investors from 1998 to 2010 and Global Chief Marketing Officer for iShares and Barclays Global Investors from 2000 to 2010. Trustee of the San Francisco Mechanics’ Institute, a non-profit organization, from 2013 to 2015. Board member of the Russell Exchange Traded Fund Trust from 2011 to 2012. Director of Barclays Global Investors Holdings Deutschland GmbH from 2006 to 2009. Mr. Polisson is an attorney and has a retired status with the Massachusetts and District of Columbia Bar Associations. | N/A |
Pamela Wheelock
(Born 1959) | Trustee,
since January
2020; previously
Trustee from
January 2018 to
July 2019 | Board member of the Destination Medical Center Economic Development Agency, Rochester, Minnesota since 2019. Interim President of the McKnight Foundation from January to September 2020. McKnight Foundation Consultant, November 2020 to February 2021. Acting Commissioner, Minnesota Department of Human Services, July 2019 through September 2019. Consultant (part-time), Minnesota Department of Human Services, October 2019 through December 2019. Chief Operating Officer, Twin Cities Habitat for Humanity from 2017 to 2019. Vice President of University Services, University of Minnesota from 2012 to 2016. Prior thereto, on the Board of Directors, Governance Committee and Finance Committee for the Minnesota Philanthropy Partners (Saint Paul Foundation) from 2012 to 2018, Interim Chief Executive Officer of Blue Cross Blue Shield of Minnesota from 2011 to 2012, Chairman of the Board from 2009 to 2012 and Board Director from 2003 to 2015. Vice President, Leadership and Community Engagement, Bush Foundation, Saint Paul, Minnesota (a private foundation) from 2009 to 2011. Executive Vice President and Chief Financial Officer, Minnesota Sports and Entertainment from 2004 to 2009 and Senior Vice President from 2002 to 2004. Executive Vice President of the Minnesota Wild Foundation from 2004 to 2008. Commissioner of Finance, State of Minnesota, from 1999 to 2002. Currently Board Chair of the Minnesota Wild Foundation since 2010. | N/A |
* Length of service dates reflect the Trustee’s commencement of service with the Trust’s predecessor entities, where applicable.
32 | Allspring Global Investment Grade Credit Fund
Other information (unaudited)
Officers2
Name and
year of birth | Position held and
length of service | Principal occupations during past five years or longer |
Andrew Owen
(Born 1960) | President,
since 2017 | President, Chief Executive Officer and Director of Allspring Funds Management, LLC since 2017 and co-president of Galliard Capital Management, LLC, an affiliate of Allspring Funds Management, LLC, since 2019. Prior thereto, Head of Affiliated Managers, Allspring Global Investments, from 2014 to 2019 and Executive Vice President responsible for marketing, investments and product development for Allspring Funds Management, LLC, from 2009 to 2014. In addition, Mr. Owen was an Executive Vice President of Wells Fargo & Company from 2014 to 2021. |
Jeremy DePalma
(Born 1974) | Treasurer,
since 2012
(for certain funds in
the Fund Complex);
since 2021 (for
the remaining funds in the
Fund Complex) | Senior Vice President of Allspring Funds Management, LLC since 2009. Senior Vice President of Evergreen Investment Management Company, LLC from 2008 to 2010 and head of the Fund Reporting and Control Team within Fund Administration from 2005 to 2010. |
Kate McKinley
(Born 1977) | Chief Legal Officer,
since 2021 | Chief Legal Officer of Allspring Global Investments since 2021. Prior thereto, held various roles at State Street Global Advisors beginning in 2010, including serving as Senior Vice President and General Counsel from 2019 to 2021, and Chief Operating Officer of the Institutional Client Group from 2016 - 2019. Prior to working at State Street Global Advisors served as Assistant General Counsel for Bank of America Corporation from 2005 to 2010 and as an Associate at WilmerHale from 2002 to 2005. |
Christopher Baker
(Born 1976) | Chief Compliance Officer, since 2022 | Global Chief Compliance Officer for Allspring Global Investments since 2022. Prior thereto, Chief Compliance Officer for State Street Global Advisors from 2018 to 2021. Senior Compliance Officer for the State Street divisions of Alternative Investment Solutions, Sector Solutions, and Global Marketing from 2015 to 2018. From 2010 to 2015 Vice President, Global Head of Investment and Marketing Compliance for State Street Global Advisors. |
Matthew Prasse
(Born 1983) | Secretary,
since 2021 | Senior Counsel of the Allspring Legal Department since 2021. Senior Counsel of the Wells Fargo Legal Department from 2018 to 2021. Previously, Counsel for Barings LLC from 2015 to 2018. Prior to joining Barings, Associate at Morgan, Lewis & Bockius LLP from 2008 to 2015. |
1 The Statement of Additional Information includes additional information about the Trustees and is available, without charge, upon request, by calling 1-800-222-8222 or by visiting the website at allspringglobal.com.
2 For those Officers with tenures at Allspring Global Investments and/or Allspring Funds Management, LLC that began prior to 2021, such tenures include years of service during which these businesses/entities were known as Wells Fargo Asset Management and Wells Fargo Funds Management, LLC, respectively.
Allspring Global Investment Grade Credit Fund | 33
Allspring Funds
P.O. Box 219967
Kansas City, MO 64121-9967
Website: allspringglobal.com
Individual investors: 1-800-222-8222
Retail investment professionals: 1-888-877-9275
Institutional investment professionals: 1-800-260-5969
This report and the financial statements contained herein are submitted for the general information of the shareholders of the Fund. If this report is used for promotional purposes, distribution of the report must be accompanied or preceded by a current prospectus. Before investing, please consider the investment objectives, risks, charges, and expenses of the investment. For a current prospectus and, if available, a summary prospectus, containing this information, call
1-800-222-8222 or visit the Fund's website at allspringglobal.com. Read the prospectus carefully before you invest or send money.
Allspring Global InvestmentsTM is the trade name for the asset management firms of Allspring Global Investments Holdings, LLC, a holding company indirectly owned by certain private funds of GTCR LLC and Reverence Capital Partners, L.P. These firms include but are not limited to Allspring Global Investments, LLC, and Allspring Funds Management, LLC. Certain products managed by Allspring entities are distributed by Allspring Funds Distributor, LLC (a broker-dealer and Member FINRA/SIPC).
This material is for general informational and educational purposes only and is NOT intended to provide investment advice or a recommendation of any kind - including a recommendation for any specific investment, strategy, or plan.
© 2022 Allspring Global Investments Holdings, LLC. All rights reserved.
PAR-0522-00051 05-22
SA294/SAR294 03-22
Semi-Annual Report
March 31, 2022
Allspring Income Plus Fund
The views expressed and any forward-looking statements are as of March 31, 2022, unless otherwise noted, and are those of the Fund's portfolio managers and/or Allspring Global Investments. Discussions of individual securities or the markets generally are not intended as individual recommendations. Future events or results may vary significantly from those expressed in any forward-looking statements. The views expressed are subject to change at any time in response to changing circumstances in the market. Allspring Global Investments disclaims any obligation to publicly update or revise any views expressed or forward-looking statements.
Allspring Income Plus Fund | 1
Letter to shareholders (unaudited)
Andrew Owen
President
Allspring Funds
Dear Shareholder:
We are pleased to offer you this semi-annual report for Allspring Income Plus Fund for the six-month period that ended March 31, 2022. Global stocks and bonds broadly declined during a challenging period. Despite progress on a global economic recovery from COVID-19, persistently high inflation, concerns regarding anticipated tightening of central bank monetary policy, and turmoil caused by the Russian invasion of Ukraine all led to a retreat from financial market gains made earlier in 2021. Among major indexes, the U.S. large-cap-dominated S&P 500 Index was an exception in escaping a half-year loss.
For the six-month period, U.S. stocks, based on the S&P 500 Index,1 gained 5.92%. International stocks, as measured by the MSCI ACWI ex USA Index (Net),2 returned -3.72%, while the MSCI EM Index (Net) (USD),3 trailed both developed market benchmarks with a return of -8.20%. The Bloomberg U.S. Aggregate Bond Index,4returned -5.92%, the Bloomberg Global Aggregate ex-USD Index (unhedged),5 returned -7.26%, the Bloomberg Municipal Bond Index6 returned -5.55%, and the ICE BofA U.S. High Yield Index,7 lost 3.89%.
Inflationary concerns and the Russian-Ukraine war caused markets to retreat.
Elevated inflation pressures and the ongoing global supply bottleneck continued in October, but strong corporate earnings provided a bright spot in the U.S., the eurozone, and many Asian countries. Government bond yields rose globally as central banks prepared to tighten monetary policy. Commodity prices continued to rise, driven by sharply higher energy costs.
In November, as COVID-19 hospitalizations rose, most major global asset classes declined. Two exceptions were U.S. investment-grade bonds and Treasury Inflation-Protected Securities. President Biden signed a long-awaited $550 billion infrastructure bill to upgrade U.S. roads, bridges, and railways. Meanwhile, the Consumer Price Index8, a measure of domestic inflation conditions, jumped to its highest level in 31 years. While the threat of consistently high inflation led the U.S. Federal Reserve (Fed) to discuss a faster pace of tapering, the Omicron strain created uncertainty. Commodities lost ground for the month, driven by sharp declines in oil prices (and energy costs in general) as well as precious metals.
“Elevated inflation pressures and the ongoing global supply bottleneck continued in October, but strong corporate earnings provided a bright spot in the U.S., the eurozone, and many Asian countries.”
| 1 | The S&P 500 Index consists of 500 stocks chosen for market size, liquidity, and industry group representation. It is a market-value-weighted index with each stock's weight in the index proportionate to its market value. You cannot invest directly in an index. |
| 2 | The Morgan Stanley Capital International (MSCI) All Country World Index (ACWI) ex USA Index (Net) is a free-float-adjusted market-capitalization-weighted index that is designed to measure the equity market performance of developed and emerging markets, excluding the U.S. Source: MSCI. MSCI makes no express or implied warranties or representations and shall have no liability whatsoever with respect to any MSCI data contained herein. The MSCI data may not be further redistributed or used as a basis for other indexes or any securities or financial products. This report is not approved, reviewed, or produced by MSCI. You cannot invest directly in an index. |
| 3 | The MSCI Emerging Markets (EM) Index (Net) (USD) is a free-float-adjusted market-capitalization-weighted index that is designed to measure equity market performance of emerging markets. You cannot invest directly in an index. |
| 4 | The Bloomberg U.S. Aggregate Bond Index is a broad-based benchmark that measures the investment-grade, U.S.-dollar-denominated, fixed-rate taxable bond market, including Treasuries, government-related and corporate securities, mortgage-backed securities (agency fixed-rate and hybrid adjustable-rate mortgage pass-throughs), asset-backed securities, and commercial mortgage-backed securities. You cannot invest directly in an index. |
| 5 | The Bloomberg Global Aggregate ex-USD Index (unhedged) is an unmanaged index that provides a broad-based measure of the global investment-grade fixed-income markets excluding the U.S.-dollar-denominated debt market. You cannot invest directly in an index. |
| 6 | The Bloomberg Municipal Bond Index is an unmanaged index composed of long-term tax-exempt bonds with a minimum credit rating of Baa. You cannot invest directly in an index. |
| 7 | The ICE BofA U.S. High Yield Index is a market-capitalization-weighted index of domestic and Yankee high-yield bonds. The index tracks the performance of high-yield securities traded in the U.S. bond market. You cannot invest directly in an index. Copyright 2022. ICE Data Indices, LLC. All rights reserved. |
| 8 | The Consumer Price Index (CPI) is a measure of the average change over time in the prices paid by urban consumers for a market basket of consumer goods and services. You cannot invest directly in an index. |
2 | Allspring Income Plus Fund
Letter to shareholders (unaudited)
Global volatility lessened in December as data indicated a lower risk of severe disease and death from the Omicron variant. Even so, several countries introduced restrictions on travel and hospitality, among other sectors, in an effort to reduce the spread. In the U.S., data indicated a stable economy overall, with robust corporate earnings. Consumer spending potential looked strong heading into 2022 on elevated household savings and the lowest household debt ratio since 1973. U.S. corporate and high-yield bonds had monthly gains while Treasuries declined. Bonds were strongly affected by the projection of three 25-basis-point (bp; 100 bps equal 1.00%) policy rate hikes in 2022 by senior Federal Open Market Committee members, up from previous projections of just one hike.
In January 2022, the main focus was on potential U.S. interest rate hikes and the Russia-Ukraine conflict. The Fed hinted that a March interest rate hike was likely. Meanwhile, Russia threatened a potential invasion of Ukraine, which could disrupt Russia’s massive energy supplies and drive demand from non-Russian oil-producing countries. Elsewhere overseas, Europe saw food and energy prices spike, leading to rising inflation. Within fixed income, corporate bonds struggled in January, underperforming government bonds, as investors focused on continued elevated inflation and ongoing uncertainty over the U.S. monetary path.
The Russian invasion of Ukraine dominated the financial world in February and March. Equity, bond, and commodities markets were shaken by fear, uncertainty, and an upending of demand-supply dynamics. Major global stock indexes were down in February, along with global bonds overall, with ongoing high levels of volatility in March along with mixed results that favored U.S. large-cap stocks. Prices of commodities spiked, including crude oil, natural gas, wheat, and precious metals, on elevated concerns of supply shortages. All of this fed already-high inflation concerns and added to expectations of more aggressive central bank interest rate hikes. Sweeping sanctions against Russia and corporate pullouts contributed to market volatility. Despite the geopolitical turmoil, the U.S. economic outlook remained largely unchanged, with a healthy job market and signs of economic resilience accompanying higher prices.
Don’t let short-term uncertainty derail long-term investment goals.
Periods of investment uncertainty can present challenges, but experience has taught us that maintaining long-term investment goals can be an effective way to plan for the future. To help you create a sound strategy based on your personal goals and risk tolerance, Allspring Funds offers more than 100 mutual funds spanning a wide range of asset classes and investment styles. Although diversification cannot guarantee an investment profit or prevent losses, we believe it can be an effective way to manage investment risk and potentially smooth out overall portfolio performance. We encourage investors to know their investments and to understand that appropriate levels of risk-taking may unlock opportunities.
Information on transaction closing.
On November 1, 2021, GTCR LLC and Reverence Capital Partners, L.P. announced the beginning of Allspring Global Investments™ with the close of the transaction to acquire Wells Fargo Funds Management, LLC; Wells Capital Management LLC; Galliard Capital Management LLC.; Wells Fargo Asset Management (International) Ltd.; Wells Fargo Asset Management Luxembourg S.A.; and Wells Fargo Funds Distributor, LLC, as well as Wells Fargo Bank, N.A.’s business of acting as trustee to its collective investment trusts and all related Wells Fargo Asset Management legal entities. The transaction closed on November 1, 2021, forming Allspring Global Investments, a privately held asset management firm with $451 billion in AUM1 as of March 31, 2022.
“ The Russian invasion of Ukraine dominated the financial world in February and March. Equity, bond, and commodities markets were shaken by fear, uncertainty, and an upending of demand-supply dynamics.”
| 1 | Figures are as of March 31, 2022, unless otherwise noted. Please note that the assets under management figures provided have been adjusted to eliminate any duplication of reporting among assets directed by multiple investment teams and includes $91.2B from Galliard Capital Management ($74.7B stable value; $16.5B fixed income), an investment advisor that is not part of the Allspring trade name/GIPS firm. |
Allspring Income Plus Fund | 3
Letter to shareholders (unaudited)
For further information about your Fund, contact your investment professional, visit our website at allspringglobal.com, or call us directly at 1-800-222-8222. |
Allspring Global Investments™ is a leading independent asset management firm with a full breadth of investment capabilities across diverse asset classes, serving the needs of its institutional and wealth management clients around the world. Allspring operates across 18 offices globally supported by more than 480 investment professionals. Allspring and its investment teams provide a broad range of differentiated investment products and solutions to help its diverse range of clients meet their investment objectives.
As part of this transition, all mutual funds within the Wells Fargo Funds family were rebranded as Allspring Funds. Each individual fund had “Wells Fargo” removed from its fund name and replaced with “Allspring.” The fund name changes went into effect on December 6, 2021.
Allspring Global Investments™ is the trade name for the asset management firm of Allspring Global Investments Holdings, LLC, a holding company indirectly owned by certain private funds of GTCR LLC and Reverence Capital Partners, L.P.
Thank you for choosing to invest with Allspring Funds. We appreciate your confidence in us and remain committed to helping you meet your financial needs.
Sincerely,
Andrew Owen
President
Allspring Funds
Notice to Shareholders
Russia launched a large-scale invasion of Ukraine on February 24, 2022. As a result of this military action, the United States and many other countries have instituted various economic sanctions against Russian and Belarus individuals and entities. The situation has led to increased financial market volatility and could have severe adverse effects on regional and global economic markets, including the markets for certain securities and commodities, such as oil and natural gas. The extent and duration of the military action, resulting sanctions imposed, other punitive action taken and the resulting market disruptions cannot be easily predicted.
Our solidarity and support goes out to our impacted employees and the people affected in Ukraine and their families. Allspring has a dedicated team of investment professionals actively monitoring the situation for any new developments and the potential impact to our clients and investment products. As the situation remains fluid, we are focused on the assessment of risks, valuation, and liquidity of impacted securities. Please visit our website at allspringglobal.com and click on “Russia-Ukraine Portfolio Impacts” for further information.
4 | Allspring Income Plus Fund
This page is intentionally left blank.
Performance highlights (unaudited)
| Investment objective | The Fund seeks total return, consisting of a high level of current income and capital appreciation. |
| Manager | Allspring Funds Management, LLC |
| Subadviser | Allspring Global Investments, LLC |
| Portfolio managers | Christopher Kauffman, CFA®‡, Janet Rilling, CFA®‡, Michael Schueller, CFA®‡, Michal Stanczyk, Noah Wise, CFA®‡ |
| Average annual total returns (%) as of March 31, 2022 | |
| | | Including sales charge | | Excluding sales charge | | Expense ratios1 (%) |
| | Inception date | 1 year | 5 year | Since
inception | | 1 year | 5 year | Since
inception | | Gross | Net 2 |
| Class A (WSIAX) | 1-31-2013 | -5.74 | 2.79 | 2.01 | | -1.80 | 3.63 | 2.47 | | 1.09 | 0.92 |
| Class C (WSICX) | 1-31-2013 | -3.53 | 3.01 | 1.78 | | -2.53 | 3.01 | 1.78 | | 1.84 | 1.67 |
| Administrator Class (WSIDX) | 1-31-2013 | – | – | – | | -1.75 | 3.76 | 2.58 | | 1.03 | 0.77 |
| Institutional Class (WSINX) | 1-31-2013 | – | – | – | | -1.52 | 3.95 | 2.78 | | 0.76 | 0.62 |
| Bloomberg U.S. Aggregate Bond Index3 | – | – | – | – | | -4.15 | 2.14 | 2.10 * | | – | – |
Figures quoted represent past performance, which is no guarantee of future results, and do not reflect taxes that a shareholder may pay on an investment in a fund. Investment return and principal value of an investment will fluctuate so that an investor’s shares, when redeemed, may be worth more or less than their original cost. Performance shown without sales charges would be lower if sales charges were reflected. Current performance may be lower or higher than the performance data quoted, which assumes the reinvestment of dividends and capital gains. Current month-end performance is available on the Fund’s website, allspringglobal.com.
Index returns do not include transaction costs associated with buying and selling securities, any mutual fund fees or expenses, or any taxes. It is not possible to invest directly in an index.
For Class A shares, the maximum front-end sales charge is 4.00%. For Class C shares, the maximum contingent deferred sales charge is 1.00%. Performance including a contingent deferred sales charge assumes the sales charge for the corresponding time period. Administrator Class and Institutional Class shares are sold without a front-end sales charge or contingent deferred sales charge.
| * | Based on the inception date of the oldest Fund class. |
| 1 | Reflects the expense ratios as stated in the most recent prospectuses, which include the impact of 0.02% in acquired fund fees and expenses. The expense ratios shown are subject to change and may differ from the annualized expense ratios shown in the financial highlights of this report, which do not include acquired fund fees and expenses. |
| 2 | The manager has contractually committed through January 31, 2023, to waive fees and/or reimburse expenses to the extent necessary to cap total annual fund operating expenses after fee waivers at 0.90% for Class A, 1.65% for Class C, 0.75% for Administrator Class, and 0.60% for Institutional Class. Brokerage commissions, stamp duty fees, interest, taxes, acquired fund fees and expenses (if any), and extraordinary expenses are excluded from the expense caps. Prior to or after the commitment expiration date, the caps may be increased or the commitment to maintain the caps may be terminated only with the approval of the Board of Trustees. Without these caps, the Fund’s returns would have been lower. The expense ratio paid by an investor is the net expense ratio (the total annual fund operating expenses after fee waivers) as stated in the prospectuses. |
| 3 | The Bloomberg U.S. Aggregate Bond Index is a broad-based benchmark that measures the investment-grade, U.S. dollar–denominated, fixed-rate taxable bond market, including Treasuries, government-related and corporate securities, mortgage-backed securities (agency fixed-rate and hybrid adjustable-rate mortgage pass-throughs), asset-backed securities, and commercial mortgage-backed securities. You cannot invest directly in an index. |
| ‡ | CFA® and Chartered Financial Analyst® are trademarks owned by CFA Institute. |
6 | Allspring Income Plus Fund
Performance highlights (unaudited)
Bond values fluctuate in response to the financial condition of individual issuers, general market and economic conditions, and changes in interest rates. Changes in market conditions and government policies may lead to periods of heightened volatility in the bond market and reduced liquidity for certain bonds held by the Fund. In general, when interest rates rise, bond values fall and investors may lose principal value. Interest rate changes and their impact on the Fund and its share price can be sudden and unpredictable. High-yield securities have a greater risk of default and tend to be more volatile than higher-rated debt securities. Loans are subject to risks similar to those associated with other below-investment-grade bond investments, such as credit risk (for example, risk of issuer default), below-investment-grade bond risk (for example, risk of greater volatility in value), and risk that the loan may become illiquid or difficult to price. Foreign investments are especially volatile and can rise or fall dramatically due to differences in the political and economic conditions of the host country. These risks are generally intensified in emerging markets. The use of derivatives may reduce returns and/or increase volatility. Certain investment strategies tend to increase the total risk of an investment (relative to the broader market). This fund is exposed to mortgage- and asset-backed securities risk, regulatory risk, and geographic risk. Consult the Fund’s prospectus for additional information on these and other risks.
Allspring Income Plus Fund | 7
Performance highlights (unaudited)
| Ten largest holdings (%) as of March 31, 20221 |
| U.S. Treasury Note, 1.25%, 12-31-2026 | 1.69 |
| VanEck Vectors JPMorgan Emerging Markets Local Currency Bond ETF | 1.49 |
| U.S. Treasury Note, 0.75%, 3-31-2026 | 1.39 |
| Brazil , 0.00%, 7-1-2024 | 1.22 |
| EQT Corporation , 1.75%, 5-1-2026 | 1.06 |
| Goldman Sachs Mortgage Security Trust Series 2018-LUAU Class B, 1.80%, 11-15-2032 | 0.94 |
| Longtrain Leasing III LLC Series 2015-1A Class A2, 4.06%, 1-15-2045 | 0.90 |
| NRG Energy Incorporated , 4.45%, 6-15-2029 | 0.89 |
| Taco Bell Funding LLC Series 2016-1A Class A2, 4.97%, 5-25-2046 | 0.87 |
| Republic of South Africa, 10.50%, 12-21-2026 | 0.84 |
| 1 | Figures represent the percentage of the Fund's net assets. Holdings are subject to change and may have changed since the date specified. |
| Portfolio composition as of March 31, 20221 |
| 1 | Figures represent the percentage of the Fund's long-term investments. These amounts are subject to change and may have changed since the date specified. |
| Credit quality as of March 31, 20221 |
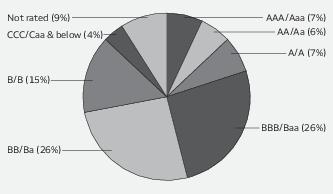
| 1 | The credit quality distribution of portfolio holdings reflected in the chart is based on ratings from Standard & Poor’s, Moody’s Investors Service, and/or Fitch Ratings Ltd. Credit quality ratings apply to the underlying holdings of the Fund and not to the Fund itself. The percentages of the portfolio with the ratings depicted in the chart are calculated based on the market value of fixed income securities held by the Fund. If a security was rated by all three rating agencies, the middle rating was utilized. If rated by two of the three rating agencies, the lower rating was utilized, and if rated by one of the rating agencies, that rating was utilized. Standard & Poor’s rates the creditworthiness of bonds, ranging from AAA (highest) to D (lowest). Ratings from A to CCC may be modified by the addition of a plus (+) or minus (-) sign to show relative standing within the rating categories. Standard & Poor’s rates the creditworthiness of short-term notes from SP-1 (highest) to SP-3 (lowest). Moody’s rates the creditworthiness of bonds, ranging from Aaa (highest) to C (lowest). Ratings Aa to B may be modified by the addition of a number 1 (highest) to 3 (lowest) to show relative standing within the ratings categories. Moody’s rates the creditworthiness of short-term U.S. tax-exempt municipal securities from MIG 1/VMIG 1 (highest) to SG (lowest). Fitch rates the creditworthiness of bonds, ranging from AAA (highest) to D (lowest). Credit quality distribution is subject to change and may have changed since the date specified. |
| Effective maturity distribution as of March 31, 20221 |
| 1 | Figures represent the percentage of the Fund's long-term investments. These amounts are subject to change and may have changed since the date specified. |
8 | Allspring Income Plus Fund
Consolidated fund expenses (unaudited)
As a shareholder of the Fund, you incur two types of costs: (1) transaction costs, including sales charges (loads) on purchase payments and contingent deferred sales charges (if any) on redemptions and (2) ongoing costs, including management fees, distribution (12b-1) and/or shareholder servicing fees, and other Fund expenses. This example is intended to help you understand your ongoing costs (in dollars) of investing in the Fund and to compare these costs with the ongoing costs of investing in other mutual funds.
The example is based on an investment of $1,000 invested at the beginning of the six-month period and held for the entire period from October 1, 2021 to March 31, 2022.
Actual expenses
The “Actual” line of the table below provides information about actual account values and actual expenses. You may use the information in this line, together with the amount you invested, to estimate the expenses that you paid over the period. Simply divide your account value by $1,000 (for example, an $8,600 account value divided by $1,000 = 8.6), then multiply the result by the number in the “Actual” line under the heading entitled “Expenses paid during period” for your applicable class of shares to estimate the expenses you paid on your account during this period.
Hypothetical example for comparison purposes
The “Hypothetical” line of the table below provides information about hypothetical account values and hypothetical expenses based on the Fund’s actual expense ratio and an assumed rate of return of 5% per year before expenses, which is not the Fund’s actual return. The hypothetical account values and expenses may not be used to estimate the actual ending account balance or expenses you paid for the period. You may use this information to compare the ongoing costs of investing in the Fund and other funds. To do so, compare this 5% hypothetical example with the 5% hypothetical examples that appear in the shareholder reports of the other funds.
Please note that the expenses shown in the table are meant to highlight your ongoing costs only and do not reflect any transactional costs, such as sales charges (loads) and contingent deferred sales charges. Therefore, the “Hypothetical” line of the table is useful in comparing ongoing costs only, and will not help you determine the relative total costs of owning different funds. In addition, if these transactional costs were included, your costs would have been higher.
| | Beginning
account value
10-1-2021 | Ending
account value
3-31-2022 | Consolidated
expenses
paid during
the period1 | Annualized net
expense ratio |
| Class A | | | | |
| Actual | $1,000.00 | $ 960.80 | $4.40 | 0.90% |
| Hypothetical (5% return before expenses) | $1,000.00 | $1,020.44 | $4.53 | 0.90% |
| Class C | | | | |
| Actual | $1,000.00 | $ 957.27 | $7.95 | 1.63% |
| Hypothetical (5% return before expenses) | $1,000.00 | $1,016.80 | $8.20 | 1.63% |
| Administrator Class | | | | |
| Actual | $1,000.00 | $ 959.96 | $3.66 | 0.75% |
| Hypothetical (5% return before expenses) | $1,000.00 | $1,021.19 | $3.78 | 0.75% |
| Institutional Class | | | | |
| Actual | $1,000.00 | $ 961.96 | $2.93 | 0.60% |
| Hypothetical (5% return before expenses) | $1,000.00 | $1,021.94 | $3.02 | 0.60% |
1 Consolidated expenses paid is equal to the annualized net expense ratio of each class multiplied by the average account value over the period, multiplied by 182 divided by 365 (to reflect the one-half-year period).
Allspring Income Plus Fund | 9
Consolidated portfolio of investments—March 31, 2022 (unaudited)
| | | Interest
rate | Maturity
date | Principal | Value |
| Asset-backed securities: 8.52% | | | | | | |
| Aqua Finance Trust Series 2019-A Class A 144A | | 3.14% | 7-16-2040 | $ | 360,500 | $ 356,538 |
| Aqua Finance Trust Series 2021-A Class A 144A | | 1.54 | 7-17-2046 | | 693,251 | 660,568 |
| Avis Budget Rental Car Funding LLC Series 2017-1A Class C 144A | | 4.15 | 9-20-2023 | | 1,195,000 | 1,199,316 |
| Brean Asset-Backed Securities Trust 2021-RM2 Class A 144A±± | | 1.75 | 10-25-2061 | | 992,272 | 915,138 |
| Cajun Global LLC Series 2021-1 Class A2 144A | | 3.93 | 11-20-2051 | | 996,250 | 939,568 |
| Coinstar Funding LLC Series 2017-1A Class A2 144A | | 5.22 | 4-25-2047 | | 1,062,038 | 1,056,740 |
| CommonBond Student Loan Trust Series 2018-CGS Class C 144A | | 4.35 | 2-25-2046 | | 85,420 | 85,322 |
| CPS Auto Receivables Trust 2021-A Class D 144A | | 1.16 | 12-15-2026 | | 1,320,000 | 1,265,997 |
| DRB Prime Student Loan Trust Series 2017-C Class C 144A | | 3.29 | 11-25-2042 | | 295,202 | 295,501 |
| Driven Brands Funding LLC Series 2019-2A Class A2 144A | | 3.98 | 10-20-2049 | | 342,125 | 329,903 |
| Dryden Senior Loan Fund Series 2017-50A Class C (3 Month LIBOR +2.25%) 144A± | | 2.49 | 7-15-2030 | | 1,000,000 | 985,884 |
| Mission Lane Master Trust Series 2021 Class A 144A | | 1.59 | 9-15-2026 | | 1,000,000 | 974,982 |
| Pagaya AI Debt Selection Trust Series 2021-3 Class B 144A | | 1.74 | 5-15-2029 | | 1,000,000 | 942,196 |
| SMB Private Education Loan Trust Series 2015-C Class C 144A | | 4.50 | 9-17-2046 | | 290,000 | 288,783 |
| SoFi Consumer Loan Program Trust Series 2018-4 Class D 144A | | 4.76 | 11-26-2027 | | 300,000 | 301,821 |
| SoFi Professional Loan Program LLC Series 2017-E Class B 144A | | 3.49 | 11-26-2040 | | 300,000 | 297,309 |
| Taco Bell Funding LLC Series 2016-1A Class A2 144A | | 4.97 | 5-25-2046 | | 1,428,750 | 1,452,793 |
| Taco Bell Funding LLC Series 2021 Class A2 144A | | 1.95 | 8-25-2051 | | 788,025 | 712,686 |
| United Airlines Pass-Through Trust Certificates Series 2020-1 Class A | | 5.88 | 4-15-2029 | | 236,269 | 244,559 |
| Wingstop Funding LLC Series 2020-1A Class A2 144A | | 2.84 | 12-5-2050 | | 358,200 | 332,222 |
| Zaxby's Funding LLC Series 2021-1A Class A2 144A | | 3.24 | 7-30-2051 | | 696,500 | 642,349 |
| Total Asset-backed securities (Cost $14,840,484) | | | | | | 14,280,175 |
| Convertible debentures: 1.45% | | | | | | |
| Consumer discretionary: 0.39% | | | | | | |
| Hotels, restaurants & leisure: 0.39% | | | | | | |
| Royal Caribbean Group | | 4.25 | 6-15-2023 | | 500,000 | 653,150 |
| Energy: 1.06% | | | | | | |
| Oil, gas & consumable fuels: 1.06% | | | | | | |
| EQT Corporation | | 1.75 | 5-1-2026 | | 750,000 | 1,777,500 |
| Total Convertible debentures (Cost $1,333,167) | | | | | | 2,430,650 |
The accompanying notes are an integral part of these consolidated financial statements.
10 | Allspring Income Plus Fund
Consolidated portfolio of investments—March 31, 2022 (unaudited)
| | | Interest
rate | Maturity
date | Principal | Value |
| Corporate bonds and notes: 29.76% | | | | | | |
| Communication services: 4.07% | | | | | | |
| Diversified telecommunication services: 0.05% | | | | | | |
| Cablevision Lightpath LLC 144A | | 5.63% | 9-15-2028 | $ | 100,000 | $ 91,250 |
| Entertainment: 0.75% | | | | | | |
| CEC Entertainment LLC 144A | | 6.75 | 5-1-2026 | | 250,000 | 241,721 |
| Live Nation Entertainment Incorporated 144A | | 5.63 | 3-15-2026 | | 400,000 | 407,500 |
| Seaworld Parks & Entertainment 144A | | 5.25 | 8-15-2029 | | 635,000 | 605,625 |
| | | | | | | 1,254,846 |
| Media: 2.80% | | | | | | |
| CCO Holdings LLC 144A | | 4.25 | 1-15-2034 | | 500,000 | 434,248 |
| CCO Holdings LLC 144A | | 4.50 | 8-15-2030 | | 175,000 | 164,201 |
| Clear Channel Outdoor Holdings 144A | | 5.13 | 8-15-2027 | | 60,000 | 59,351 |
| Covert Mergeco Incorporated 144A | | 4.88 | 12-1-2029 | | 355,000 | 338,919 |
| CSC Holdings LLC 144A | | 4.63 | 12-1-2030 | | 500,000 | 418,145 |
| DIRECTV Holdings LLC 144A | | 5.75 | 12-1-2028 | | 300,000 | 283,875 |
| DIRECTV Holdings LLC 144A | | 5.88 | 8-15-2027 | | 165,000 | 162,319 |
| Gray Escrow II Incorporated 144A | | 5.38 | 11-15-2031 | | 400,000 | 382,486 |
| Gray Television Incorporated 144A | | 4.75 | 10-15-2030 | | 150,000 | 139,313 |
| Nexstar Broadcasting Incorporated 144A | | 5.63 | 7-15-2027 | | 150,000 | 151,830 |
| Outfront Media Capital Corporation 144A | | 4.63 | 3-15-2030 | | 175,000 | 164,719 |
| QVC Incorporated | | 4.38 | 9-1-2028 | | 190,000 | 173,351 |
| QVC Incorporated | | 4.75 | 2-15-2027 | | 695,000 | 665,463 |
| Salem Media Group Incorporated 144A | | 6.75 | 6-1-2024 | | 95,000 | 93,575 |
| Scripps Escrow II Incorporated 144A | | 5.38 | 1-15-2031 | | 545,000 | 521,838 |
| Scripps Escrow II Incorporated 144A | | 5.88 | 7-15-2027 | | 125,000 | 125,095 |
| Townsquare Media Incorporated 144A | | 6.88 | 2-1-2026 | | 400,000 | 411,940 |
| | | | | | | 4,690,668 |
| Wireless telecommunication services: 0.47% | | | | | | |
| Sprint Capital Corporation | | 8.75 | 3-15-2032 | | 305,000 | 410,835 |
| T-Mobile USA Incorporated | | 3.50 | 4-15-2031 | | 400,000 | 376,392 |
| | | | | | | 787,227 |
| Consumer discretionary: 2.19% | | | | | | |
| Auto components: 0.02% | | | | | | |
| Allison Transmission Incorporated 144A | | 5.88 | 6-1-2029 | | 35,000 | 35,681 |
| Automobiles: 0.24% | | | | | | |
| Ford Motor Company | | 3.25 | 2-12-2032 | | 450,000 | 401,909 |
| Diversified consumer services: 0.05% | | | | | | |
| Howard University | | 5.21 | 10-1-2052 | | 90,000 | 88,131 |
| Hotels, restaurants & leisure: 0.93% | | | | | | |
| Carnival Corporation 144A | | 7.63 | 3-1-2026 | | 360,000 | 362,351 |
| Las Vegas Sands Corporation | | 3.20 | 8-8-2024 | | 1,000,000 | 954,690 |
| Royal Caribbean Cruises Limited 144A | | 5.38 | 7-15-2027 | | 20,000 | 19,216 |
| Royal Caribbean Cruises Limited 144A | | 5.50 | 8-31-2026 | | 125,000 | 121,475 |
| Royal Caribbean Cruises Limited 144A | | 5.50 | 4-1-2028 | | 95,000 | 90,564 |
| | | | | | | 1,548,296 |
The accompanying notes are an integral part of these consolidated financial statements.
Allspring Income Plus Fund | 11
Consolidated portfolio of investments—March 31, 2022 (unaudited)
| | | Interest
rate | Maturity
date | Principal | Value |
| Household durables: 0.05% | | | | | | |
| Allied Universal Holdco LLC 144A | | 6.63% | 7-15-2026 | $ | 85,000 | $ 86,006 |
| Multiline retail: 0.24% | | | | | | |
| Macy's Retail Holdings LLC 144A | | 5.88 | 4-1-2029 | | 400,000 | 399,000 |
| Specialty retail: 0.66% | | | | | | |
| Michaels Arts & Crafts Incorporated 144A | | 7.88 | 5-1-2029 | | 400,000 | 342,500 |
| NMG Holding Company Incorporated 144A | | 7.13 | 4-1-2026 | | 500,000 | 513,500 |
| Rent-A-Center Incorporated 144A | | 6.38 | 2-15-2029 | | 275,000 | 251,625 |
| | | | | | | 1,107,625 |
| Consumer staples: 0.53% | | | | | | |
| Food products: 0.53% | | | | | | |
| CHS Incorporated 144A | | 5.25 | 5-15-2030 | | 70,000 | 67,185 |
| CHS Incorporated 144A | | 6.88 | 4-15-2029 | | 400,000 | 393,000 |
| Kraft Heinz Foods Company | | 4.88 | 10-1-2049 | | 400,000 | 421,452 |
| | | | | | | 881,637 |
| Energy: 4.10% | | | | | | |
| Energy equipment & services: 0.78% | | | | | | |
| Bristow Group Incorporated 144A | | 6.88 | 3-1-2028 | | 500,000 | 506,250 |
| Hilcorp Energy Company 144A | | 5.75 | 2-1-2029 | | 55,000 | 55,033 |
| Hilcorp Energy Company 144A | | 6.00 | 2-1-2031 | | 55,000 | 55,138 |
| Oceaneering International Incorporated | | 6.00 | 2-1-2028 | | 400,000 | 389,056 |
| Pattern Energy Operations LP 144A | | 4.50 | 8-15-2028 | | 300,000 | 295,143 |
| | | | | | | 1,300,620 |
| Oil, gas & consumable fuels: 3.32% | | | | | | |
| Aethon United 144A | | 8.25 | 2-15-2026 | | 500,000 | 518,850 |
| Antero Resources Corporation 144A | | 8.38 | 7-15-2026 | | 23,000 | 25,358 |
| Buckeye Partners LP | | 5.85 | 11-15-2043 | | 100,000 | 85,244 |
| Cheniere Energy Partners LP 144A | | 3.25 | 1-31-2032 | | 270,000 | 245,508 |
| Comstock Resources Incorporated 144A | | 5.88 | 1-15-2030 | | 90,000 | 88,677 |
| DCP Midstream Operating Company | | 5.13 | 5-15-2029 | | 500,000 | 514,245 |
| Encino Acquisition Partners Company 144A | | 8.50 | 5-1-2028 | | 425,000 | 437,448 |
| EnLink Midstream Partners LP | | 5.05 | 4-1-2045 | | 115,000 | 92,863 |
| EnLink Midstream Partners LP | | 5.38 | 6-1-2029 | | 220,000 | 219,450 |
| EnLink Midstream Partners LP | | 5.45 | 6-1-2047 | | 85,000 | 71,613 |
| Murphy Oil Corporation | | 5.75 | 8-15-2025 | | 155,000 | 157,951 |
| Murphy Oil Corporation | | 5.88 | 12-1-2027 | | 200,000 | 203,500 |
| Nabors Industries Incorporated 144A | | 7.38 | 5-15-2027 | | 230,000 | 238,913 |
| New Fortress Energy Incorporated 144A | | 6.50 | 9-30-2026 | | 470,000 | 465,662 |
| Occidental Petroleum Corporation | | 4.63 | 6-15-2045 | | 200,000 | 194,000 |
| Occidental Petroleum Corporation | | 6.20 | 3-15-2040 | | 50,000 | 55,500 |
| Occidental Petroleum Corporation | | 6.45 | 9-15-2036 | | 420,000 | 493,368 |
| Rockies Express Pipeline LLC 144A | | 6.88 | 4-15-2040 | | 340,000 | 336,080 |
| Southwestern Energy Company | | 4.75 | 2-1-2032 | | 100,000 | 99,875 |
| Southwestern Energy Company | | 7.75 | 10-1-2027 | | 225,000 | 238,219 |
| Tallgrass Energy Partners LP 144A | | 6.00 | 12-31-2030 | | 95,000 | 92,183 |
| Veture Global LNG Incorporated 144A | | 3.88 | 11-1-2033 | | 30,000 | 28,688 |
| Western Midstream Operating LP | | 5.30 | 3-1-2048 | | 675,000 | 668,250 |
| | | | | | | 5,571,445 |
The accompanying notes are an integral part of these consolidated financial statements.
12 | Allspring Income Plus Fund
Consolidated portfolio of investments—March 31, 2022 (unaudited)
| | | Interest
rate | Maturity
date | Principal | Value |
| Financials: 10.03% | | | | | | |
| Banks: 2.16% | | | | | | |
| Bank of America Corporation (U.S. SOFR +0.96%) ± | | 1.73% | 7-22-2027 | $ | 1,000,000 | $ 928,685 |
| Bank of America Corporation (3 Month LIBOR +4.55%) ± | | 6.30 | 12-29-2049 | | 265,000 | 281,814 |
| Citigroup Incorporated (5 Year Treasury Constant Maturity +3.42%) ʊ± | | 3.88 | 2-18-2026 | | 750,000 | 706,875 |
| JPMorgan Chase & Company (U.S. SOFR +3.13%) ʊ± | | 4.60 | 2-3-2025 | | 500,000 | 481,875 |
| JPMorgan Chase & Company (3 Month LIBOR +3.25%) ± | | 5.15 | 12-29-2049 | | 350,000 | 351,750 |
| JPMorgan Chase & Company (3 Month LIBOR +3.30%) ± | | 6.00 | 12-31-2049 | | 100,000 | 101,250 |
| PNC Financial Services (3 Month LIBOR +3.30%) ± | | 5.00 | 12-29-2049 | | 250,000 | 250,000 |
| Truist Financial Corporation (5 Year Treasury Constant Maturity +4.61%) ʊ± | | 4.95 | 9-2-2025 | | 500,000 | 512,000 |
| | | | | | | 3,614,249 |
| Capital markets: 2.87% | | | | | | |
| Charles Schwab Corporation (5 Year Treasury Constant Maturity +4.97%) ʊ± | | 5.38 | 6-2-2025 | | 750,000 | 772,500 |
| Coinbase Global Incorporated 144A | | 3.63 | 10-1-2031 | | 165,000 | 140,663 |
| Goldman Sachs Group Incorporated (U.S. SOFR +1.25%) ± | | 2.38 | 7-21-2032 | | 750,000 | 664,277 |
| Goldman Sachs Group Incorporated (5 Year Treasury Constant Maturity +2.97%) ʊ± | | 3.80 | 5-10-2026 | | 1,000,000 | 926,875 |
| Morgan Stanley (U.S. SOFR +1.29%) ± | | 2.94 | 1-21-2033 | | 1,500,000 | 1,406,607 |
| Owl Rock Capital Corporation | | 2.63 | 1-15-2027 | | 1,000,000 | 896,300 |
| | | | | | | 4,807,222 |
| Consumer finance: 1.36% | | | | | | |
| FirstCash Incorporated 144A | | 5.63 | 1-1-2030 | | 95,000 | 91,280 |
| Ford Motor Credit Company LLC | | 4.39 | 1-8-2026 | | 175,000 | 174,547 |
| Ford Motor Credit Company LLC | | 5.11 | 5-3-2029 | | 275,000 | 276,631 |
| General Motors Financial Company (5 Year Treasury Constant Maturity +5.00%) ʊ± | | 5.70 | 9-30-2030 | | 500,000 | 523,850 |
| Navient Corporation | | 5.00 | 3-15-2027 | | 70,000 | 66,675 |
| Navient Corporation | | 5.63 | 8-1-2033 | | 100,000 | 84,200 |
| PRA Group Incorporated 144A | | 5.00 | 10-1-2029 | | 265,000 | 251,146 |
| PROG Holdings Incorporated 144A | | 6.00 | 11-15-2029 | | 85,000 | 78,838 |
| Rocket Mortgage LLC 144A | | 2.88 | 10-15-2026 | | 165,000 | 151,494 |
| Rocket Mortgage LLC 144A | | 4.00 | 10-15-2033 | | 400,000 | 350,360 |
| Springleaf Finance Corporation | | 6.63 | 1-15-2028 | | 225,000 | 235,688 |
| | | | | | | 2,284,709 |
| Diversified financial services: 0.38% | | | | | | |
| LPL Holdings Incorporated 144A | | 4.38 | 5-15-2031 | | 650,000 | 628,514 |
| Insurance: 2.58% | | | | | | |
| Amwins Group Incorporated 144A | | 4.88 | 6-30-2029 | | 80,000 | 76,802 |
| Broadstreet Partners Incorporated 144A | | 5.88 | 4-15-2029 | | 500,000 | 466,250 |
| Guardian Life Insurance Company 144A | | 4.85 | 1-24-2077 | | 200,000 | 228,182 |
| HUB International Limited 144A | | 5.63 | 12-1-2029 | | 30,000 | 28,650 |
| HUB International Limited 144A | | 7.00 | 5-1-2026 | | 45,000 | 45,520 |
The accompanying notes are an integral part of these consolidated financial statements.
Allspring Income Plus Fund | 13
Consolidated portfolio of investments—March 31, 2022 (unaudited)
| | | Interest
rate | Maturity
date | Principal | Value |
| Insurance (continued) | | | | | | |
| Maple Grove Funding Trust 144A | | 4.16% | 8-15-2051 | $ | 900,000 | $ 811,442 |
| Markel Corporation (5 Year Treasury Constant Maturity +5.66%) ʊ± | | 6.00 | 6-2-2025 | | 1,000,000 | 1,035,000 |
| MetLife Incorporated | | 6.40 | 12-15-2066 | | 1,200,000 | 1,292,160 |
| OneAmerica Financial Partners Incorporated 144A | | 4.25 | 10-15-2050 | | 70,000 | 67,385 |
| Prudential Financial Incorporated (5 Year Treasury Constant Maturity +3.04%) ± | | 3.70 | 10-1-2050 | | 270,000 | 247,428 |
| Ryan Specialty Group LLC 144A | | 4.38 | 2-1-2030 | | 35,000 | 33,075 |
| | | | | | | 4,331,894 |
| Mortgage REITs: 0.17% | | | | | | |
| Starwood Property Trust Incorporated 144A | | 4.38 | 1-15-2027 | | 300,000 | 291,000 |
| Thrifts & mortgage finance: 0.51% | | | | | | |
| Ladder Capital Finance Holdings LP 144A | | 4.25 | 2-1-2027 | | 350,000 | 335,427 |
| Ladder Capital Finance Holdings LP 144A | | 4.75 | 6-15-2029 | | 50,000 | 47,156 |
| Ladder Capital Finance Holdings LP 144A | | 5.25 | 10-1-2025 | | 120,000 | 119,550 |
| United Wholesale Mortgage LLC 144A | | 5.50 | 4-15-2029 | | 400,000 | 356,408 |
| | | | | | | 858,541 |
| Health care: 0.50% | | | | | | |
| Health care equipment & supplies: 0.08% | | | | | | |
| Mozart Debt Merger Sub Incorporated 144A | | 5.25 | 10-1-2029 | | 150,000 | 139,451 |
| Health care providers & services: 0.42% | | | | | | |
| AdaptHealth LLC 144A | | 4.63 | 8-1-2029 | | 45,000 | 41,063 |
| Air Methods Corporation 144A | | 8.00 | 5-15-2025 | | 385,000 | 333,025 |
| Select Medical Corporation 144A | | 6.25 | 8-15-2026 | | 205,000 | 212,224 |
| Vizient Incorporated 144A | | 6.25 | 5-15-2027 | | 105,000 | 108,150 |
| | | | | | | 694,462 |
| Industrials: 3.27% | | | | | | |
| Aerospace & defense: 0.17% | | | | | | |
| TransDigm Group Incorporated | | 4.88 | 5-1-2029 | | 300,000 | 281,181 |
| Airlines: 1.25% | | | | | | |
| Alaska Airlines 144A | | 4.80 | 2-15-2029 | | 7 | 7 |
| Delta Air Lines Incorporated 144A | | 4.75 | 10-20-2028 | | 150,000 | 151,148 |
| Delta Airlines Pass-Through Certificates Series 2015-B | | 4.25 | 1-30-2025 | | 452,287 | 453,088 |
| Hawaiian Brand Intellectual Property Limited 144A | | 5.75 | 1-20-2026 | | 395,000 | 395,225 |
| Mileage Plus Holdings LLC 144A | | 6.50 | 6-20-2027 | | 750,000 | 781,875 |
| Spirit Loyalty Cayman Limited 144A | | 8.00 | 9-20-2025 | | 300,000 | 319,500 |
| | | | | | | 2,100,843 |
| Commercial services & supplies: 0.77% | | | | | | |
| Allied Universal Holdco LLC 144A | | 6.00 | 6-1-2029 | | 400,000 | 352,866 |
| CoreCivic Incorporated | | 8.25 | 4-15-2026 | | 910,000 | 937,300 |
| | | | | | | 1,290,166 |
| Industrial conglomerates: 0.57% | | | | | | |
| General Electric Company (3 Month LIBOR +3.33%) ± | | 4.16 | 12-29-2049 | | 1,000,000 | 958,750 |
The accompanying notes are an integral part of these consolidated financial statements.
14 | Allspring Income Plus Fund
Consolidated portfolio of investments—March 31, 2022 (unaudited)
| | | Interest
rate | Maturity
date | Principal | Value |
| Road & rail: 0.07% | | | | | | |
| Uber Technologies Incorporated 144A | | 4.50% | 8-15-2029 | $ | 120,000 | $ 112,500 |
| Trading companies & distributors: 0.35% | | | | | | |
| Fortress Transportation & Infrastructure Investors LLC 144A | | 5.50 | 5-1-2028 | | 430,000 | 390,935 |
| Fortress Transportation & Infrastructure Investors LLC 144A | | 6.50 | 10-1-2025 | | 199,000 | 197,508 |
| | | | | | | 588,443 |
| Transportation infrastructure: 0.09% | | | | | | |
| Toll Road Investors Partnership II LP 144A¤ | | 0.00 | 2-15-2027 | | 200,000 | 156,482 |
| Information technology: 1.18% | | | | | | |
| Communications equipment: 0.33% | | | | | | |
| CIENA Corporation 144A | | 4.00 | 1-31-2030 | | 165,000 | 158,813 |
| CommScope Technologies LLC 144A | | 5.00 | 3-15-2027 | | 200,000 | 173,715 |
| CommScope Technologies LLC 144A | | 8.25 | 3-1-2027 | | 225,000 | 218,813 |
| | | | | | | 551,341 |
| IT services: 0.10% | | | | | | |
| Sabre GLBL Incorporated 144A | | 7.38 | 9-1-2025 | | 15,000 | 15,663 |
| Sabre GLBL Incorporated 144A | | 9.25 | 4-15-2025 | | 135,000 | 149,666 |
| | | | | | | 165,329 |
| Software: 0.30% | | | | | | |
| MPH Acquisition Holdings LLC 144A | | 5.50 | 9-1-2028 | | 105,000 | 100,655 |
| MPH Acquisition Holdings LLC 144A | | 5.75 | 11-1-2028 | | 440,000 | 397,289 |
| | | | | | | 497,944 |
| Technology hardware, storage & peripherals: 0.45% | | | | | | |
| Western Digital Corporation | | 4.75 | 2-15-2026 | | 750,000 | 761,745 |
| Materials: 0.59% | | | | | | |
| Containers & packaging: 0.38% | | | | | | |
| Ball Corporation | | 2.88 | 8-15-2030 | | 400,000 | 358,618 |
| Clydesdale Acquisition Holdings Incorporated 144A%% | | 8.75 | 4-15-2030 | | 300,000 | 282,375 |
| | | | | | | 640,993 |
| Metals & mining: 0.21% | | | | | | |
| Arches Buyer Incorporated 144A | | 6.13 | 12-1-2028 | | 80,000 | 73,948 |
| Cleveland-Cliffs Incorporated | | 5.88 | 6-1-2027 | | 275,000 | 282,074 |
| | | | | | | 356,022 |
| Real estate: 1.48% | | | | | | |
| Equity REITs: 1.48% | | | | | | |
| EPR Properties | | 3.75 | 8-15-2029 | | 500,000 | 468,030 |
| GLP Capital LP | | 4.00 | 1-15-2031 | | 1,000,000 | 969,880 |
| Service Properties Trust Company | | 3.95 | 1-15-2028 | | 50,000 | 42,502 |
| Service Properties Trust Company | | 4.38 | 2-15-2030 | | 50,000 | 41,507 |
| Service Properties Trust Company | | 4.75 | 10-1-2026 | | 25,000 | 22,875 |
| Service Properties Trust Company | | 4.95 | 2-15-2027 | | 325,000 | 300,333 |
| Service Properties Trust Company | | 5.25 | 2-15-2026 | | 50,000 | 46,875 |
The accompanying notes are an integral part of these consolidated financial statements.
Allspring Income Plus Fund | 15
Consolidated portfolio of investments—March 31, 2022 (unaudited)
| | | Interest
rate | Maturity
date | Principal | Value |
| Equity REITs (continued) | | | | | | |
| Simon Property Group LP | | 3.80% | 7-15-2050 | $ | 120,000 | $ 118,337 |
| WEA Finance LLC 144A | | 4.75 | 9-17-2044 | | 500,000 | 470,595 |
| | | | | | | 2,480,934 |
| Utilities: 1.82% | | | | | | |
| Electric utilities: 1.58% | | | | | | |
| NRG Energy Incorporated 144A | | 4.45 | 6-15-2029 | | 1,500,000 | 1,500,614 |
| Oglethorpe Power Corporation | | 4.25 | 4-1-2046 | | 400,000 | 380,098 |
| The Southern Company (5 Year Treasury Constant Maturity +3.73%) ± | | 4.00 | 1-15-2051 | | 500,000 | 483,750 |
| Vistra Operations Company LLC 144A | | 4.38 | 5-1-2029 | | 300,000 | 283,500 |
| | | | | | | 2,647,962 |
Independent power & renewable electricity
producers: 0.24% | | | | | | |
| NSG Holdings LLC 144A | | 7.75 | 12-15-2025 | | 46,471 | 47,401 |
| TerraForm Power Operating LLC 144A | | 4.75 | 1-15-2030 | | 369,000 | 359,886 |
| | | | | | | 407,287 |
| Total Corporate bonds and notes (Cost $51,207,244) | | | | | | 49,892,305 |
| Foreign corporate bonds and notes : 9.47% | | | | | | |
| Communication services: 0.84% | | | | | | |
| Media: 0.84% | | | | | | |
| SES SA Company (EUR Swap Annual (vs. 6 Month EURIBOR) 5 Year +3.19%) ʊ± | | 2.88 | 5-27-2026 | EUR | 575,000 | 588,784 |
| Tele Columbus AG 144A | | 3.88 | 5-2-2025 | EUR | 510,000 | 522,731 |
| Ziggo Bond Company BV 144A | | 3.38 | 2-28-2030 | EUR | 300,000 | 292,880 |
| | | | | | | 1,404,395 |
| Consumer discretionary: 1.41% | | | | | | |
| Auto components: 0.81% | | | | | | |
| Adient Global Holdings 144A | | 3.50 | 8-15-2024 | EUR | 515,000 | 558,438 |
| Adler Pelzer Holding GmbH 144A | | 4.13 | 4-1-2024 | EUR | 800,000 | 803,509 |
| | | | | | | 1,361,947 |
| Automobiles: 0.34% | | | | | | |
| Peugeot SA Company | | 2.00 | 3-20-2025 | EUR | 500,000 | 565,082 |
| Diversified consumer services: 0.26% | | | | | | |
| Intertrust Group BV 144A | | 3.38 | 11-15-2025 | EUR | 400,000 | 441,040 |
| Consumer staples: 2.10% | | | | | | |
| Food & staples retailing: 1.11% | | | | | | |
| Casino Guichard Perracho SA | | 3.58 | 2-7-2025 | EUR | 400,000 | 383,426 |
| Foodco Bondco SL 144A | | 6.25 | 5-15-2026 | EUR | 400,000 | 384,975 |
| Iceland Bondco plc 144A | | 4.38 | 5-15-2028 | GBP | 1,000,000 | 1,096,535 |
| | | | | | | 1,864,936 |
The accompanying notes are an integral part of these consolidated financial statements.
16 | Allspring Income Plus Fund
Consolidated portfolio of investments—March 31, 2022 (unaudited)
| | | Interest
rate | Maturity
date | Principal | Value |
| Food products: 0.53% | | | | | | |
| Danone SA (EUR Swap Annual (vs. 6 Month EURIBOR) 5 Year +1.43%) ʊ± | | 1.75% | 3-23-2023 | EUR | 400,000 | $ 444,876 |
| Sigma Holdings Company BV 144A | | 5.75 | 5-15-2026 | EUR | 500,000 | 450,154 |
| | | | | | | 895,030 |
| Tobacco: 0.46% | | | | | | |
| BAT International Finance plc | | 2.25 | 1-16-2030 | EUR | 750,000 | 764,029 |
| Energy: 0.58% | | | | | | |
| Oil, gas & consumable fuels: 0.58% | | | | | | |
| Eni SpA | | 1.13 | 9-19-2028 | EUR | 800,000 | 849,481 |
| TotalEnergies SE (EUR Swap Annual (vs. 6 Month EURIBOR) 5 Year +3.78%) ± | | 3.88 | 12-29-2049 | EUR | 100,000 | 110,968 |
| | | | | | | 960,449 |
| Financials: 2.33% | | | | | | |
| Banks: 1.43% | | | | | | |
| Asian Development Bank | | 6.20 | 10-6-2026 | INR | 18,450,000 | 238,833 |
| Bankia SA (EUR Swap Annual (vs. 6 Month EURIBOR) 5 Year +5.82%) ʊ± | | 6.00 | 7-18-2022 | EUR | 600,000 | 669,558 |
| Caixa Geral de Depositos SA (EUR Swap Annual (vs. 6 Month EURIBOR) 5 Year +5.50%) ± | | 5.75 | 6-28-2028 | EUR | 400,000 | 460,940 |
| Permanent TSB Group (EUR Swap Annual (vs. 6 Month EURIBOR) 1 Year +2.55%) ± | | 2.13 | 9-26-2024 | EUR | 600,000 | 653,800 |
| Raiffeisen Bank International AG (EURIBOR ICE Swap Rate 11:00am +1.60%) ± | | 1.38 | 6-17-2033 | EUR | 400,000 | 376,687 |
| | | | | | | 2,399,818 |
| Capital markets: 0.35% | | | | | | |
| International Finance Corporation | | 6.30 | 11-25-2024 | INR | 45,000,000 | 589,677 |
| Consumer finance: 0.29% | | | | | | |
| Cellnex Finance Company SA | | 2.00 | 9-15-2032 | EUR | 500,000 | 476,252 |
| Thrifts & mortgage finance: 0.26% | | | | | | |
| Deutsche Pfandbriefbank AG (EUR Swap Annual (vs. 6 Month EURIBOR) 5 Year +2.75%) ± | | 2.88 | 6-28-2027 | EUR | 400,000 | 436,008 |
| Health care: 0.47% | | | | | | |
| Pharmaceuticals: 0.47% | | | | | | |
| Takeda Pharmaceutical Company Limited | | 2.00 | 7-9-2040 | EUR | 750,000 | 783,913 |
| Industrials: 0.69% | | | | | | |
| Commercial services & supplies: 0.56% | | | | | | |
| Paprec Holding SA 144A | | 4.00 | 3-31-2025 | EUR | 450,000 | 499,530 |
| Prosegur Cash SA | | 1.38 | 2-4-2026 | EUR | 400,000 | 434,302 |
| | | | | | | 933,832 |
| Electrical equipment: 0.13% | | | | | | |
| Gamma Bidco SpA 144A | | 6.25 | 7-15-2025 | EUR | 200,000 | 223,186 |
| Materials: 0.30% | | | | | | |
| Containers & packaging: 0.30% | | | | | | |
| Can-Pack SA 144A | | 2.38 | 11-1-2027 | EUR | 500,000 | 507,492 |
The accompanying notes are an integral part of these consolidated financial statements.
Allspring Income Plus Fund | 17
Consolidated portfolio of investments—March 31, 2022 (unaudited)
| | | Interest
rate | Maturity
date | Principal | Value |
| Real estate: 0.75% | | | | | | |
| Equity REITs: 0.58% | | | | | | |
| Aedas Homes Opco SLU 144A | | 4.00% | 8-15-2026 | EUR | 500,000 | $ 542,118 |
| Unibail-Rodamco-Westfield SE (EUR Swap Annual (vs. 6 Month EURIBOR) 5 Year +1.68%) ʊ± | | 2.13 | 10-25-2023 | EUR | 400,000 | 433,743 |
| | | | | | | 975,861 |
| Real estate management & development: 0.17% | | | | | | |
| Akelius Residential Property AB (EURIBOR ICE Swap Rate 11:00am +3.49%) ± | | 3.88 | 10-5-2078 | EUR | 251,000 | 285,305 |
| Total Foreign corporate bonds and notes (Cost $17,065,505) | | | | | | 15,868,252 |
| Foreign government bonds : 4.63% | | | | | | |
| Brazil ¤ | | 0.00 | 1-1-2024 | BRL | 7,000,000 | 1,203,383 |
| Brazil ¤ | | 0.00 | 7-1-2024 | BRL | 12,500,000 | 2,047,545 |
| Colombia | | 7.00 | 5-4-2022 | COP | 2,000,000,000 | 530,766 |
| Indonesia | | 6.50 | 6-15-2025 | IDR | 13,500,000,000 | 978,730 |
| Mexico | | 6.50 | 6-9-2022 | MXN | 13,260,000 | 665,233 |
| Mexico | | 6.50 | 6-9-2022 | MXN | 7,600,000 | 381,280 |
| Republic of South Africa | | 8.75 | 2-28-2048 | ZAR | 9,100,000 | 521,619 |
| Republic of South Africa | | 10.50 | 12-21-2026 | ZAR | 19,000,000 | 1,417,020 |
| Russia | | 6.50 | 2-28-2024 | RUB | 35,000,000 | 12,923 |
| Total Foreign government bonds (Cost $8,268,308) | | | | | | 7,758,499 |
| | | | | Shares | |
| Investment companies: 2.03% | | | | | | |
| Exchange-traded funds: 2.03% | | | | | | |
| Invesco Taxable Municipal Bond ETF | | | | | 30,600 | 907,902 |
| VanEck Vectors JPMorgan Emerging Markets Local Currency Bond ETF | | | | | 92,700 | 2,501,973 |
| Total Investment companies (Cost $3,793,000) | | | | | | 3,409,875 |
| | | | | Principal | |
| Loans: 4.61% | | | | | | |
| Communication services: 1.10% | | | | | | |
| Diversified telecommunication services: 0.29% | | | | | | |
| Intelsat Jackson Holdings SA (U.S. SOFR +4.25%) <± | | 4.92 | 2-1-2029 | $ | 498,750 | 489,867 |
| Media: 0.81% | | | | | | |
| Charter Communications Operating LLC (1 Month LIBOR +1.75%) ± | | 2.21 | 4-30-2025 | | 482,368 | 479,956 |
| Clear Channel Outdoor Holdings (1 Month LIBOR +3.50%) ± | | 3.80 | 8-21-2026 | | 362,387 | 355,864 |
| DIRECTV Financing LLC (1 Month LIBOR +5.00%) ± | | 5.75 | 8-2-2027 | | 382,000 | 381,156 |
The accompanying notes are an integral part of these consolidated financial statements.
18 | Allspring Income Plus Fund
Consolidated portfolio of investments—March 31, 2022 (unaudited)
| | | Interest
rate | Maturity
date | Principal | Value |
| Media (continued) | | | | | | |
| Gray Television Incorporated (3 Month LIBOR +2.50%) ± | | 2.73% | 1-2-2026 | $ | 84,964 | $ 84,221 |
| Nexstar Broadcasting Incorporated (3 Month LIBOR +2.25%) ± | | 2.71 | 1-17-2024 | | 56,234 | 55,902 |
| | | | | | | 1,357,099 |
| Consumer discretionary: 0.63% | | | | | | |
| Auto components: 0.23% | | | | | | |
| Truck Hero Incorporated (1 Month LIBOR +3.25%) ± | | 4.00 | 1-31-2028 | | 396,992 | 384,090 |
| Household durables: 0.17% | | | | | | |
| Wilsonart LLC (1 Month LIBOR +3.25%) ± | | 4.26 | 12-31-2026 | | 296,252 | 288,265 |
| Specialty retail: 0.23% | | | | | | |
| Rent-A-Center Incorporated (1 Month LIBOR +3.25%) ± | | 3.81 | 2-17-2028 | | 397,000 | 388,318 |
| Energy: 0.52% | | | | | | |
| Oil, gas & consumable fuels: 0.52% | | | | | | |
| AL NGPL Holdings LLC (1 Month LIBOR +3.75%) ౠ| | 4.75 | 4-14-2028 | | 382,190 | 379,565 |
| GIP II Blue Holdings LP (1 Month LIBOR +4.50%) ± | | 5.51 | 9-29-2028 | | 498,750 | 496,256 |
| | | | | | | 875,821 |
| Financials: 0.29% | | | | | | |
| Capital markets: 0.12% | | | | | | |
| Nexus Buyer LLC (1 Month LIBOR +3.75%) ± | | 4.21 | 11-9-2026 | | 195,500 | 193,398 |
| Diversified financial services: 0.00% | | | | | | |
| Intelsat Jackson Holdings SA (1 Month LIBOR +5.75%) ± | | 8.25 | 11-27-2023 | | 483 | 474 |
| Insurance: 0.17% | | | | | | |
| Asurion LLC (1 Month LIBOR +5.25%) ౠ| | 5.71 | 1-31-2028 | | 170,000 | 166,430 |
| Asurion LLC (1 Month LIBOR +5.25%) ౠ| | 5.71 | 1-20-2029 | | 130,000 | 126,913 |
| | | | | | | 293,343 |
| Health care: 0.37% | | | | | | |
| Health care equipment & supplies: 0.24% | | | | | | |
| Surgery Center Holdings Incorporated (1 Month LIBOR +3.75%) ± | | 4.50 | 8-31-2026 | | 397,000 | 393,479 |
| Pharmaceuticals: 0.13% | | | | | | |
| Bausch Health Companies Incorporated (3 Month LIBOR +3.00%) ± | | 3.46 | 6-2-2025 | | 225,341 | 223,275 |
| Industrials: 1.03% | | | | | | |
| Airlines: 0.58% | | | | | | |
| AAdvantage Loyalty IP Limited (1 Month LIBOR +4.75%) ౠ| | 5.50 | 4-20-2028 | | 266,000 | 269,075 |
| Mileage Plus Holdings LLC (1 Month LIBOR +5.25%) ± | | 6.25 | 6-21-2027 | | 675,000 | 699,469 |
| | | | | | | 968,544 |
The accompanying notes are an integral part of these consolidated financial statements.
Allspring Income Plus Fund | 19
Consolidated portfolio of investments—March 31, 2022 (unaudited)
| | | Interest
rate | Maturity
date | Principal | Value |
| Commercial services & supplies: 0.27% | | | | | | |
| Polaris Newco LLC (1 Month LIBOR +4.00%) ± | | 4.50% | 6-2-2028 | $ | 457,750 | $ 453,973 |
| Machinery: 0.18% | | | | | | |
| Werner FinCo LP (3 Month LIBOR +4.00%) ± | | 5.01 | 7-24-2024 | | 305,995 | 302,681 |
| Information technology: 0.24% | | | | | | |
| Software: 0.24% | | | | | | |
| Emerald Topco Incorporated (1 Month LIBOR +3.50%) ± | | 3.80 | 7-24-2026 | | 310,829 | 306,313 |
| MPH Acquisition Holdings LLC (1 Month LIBOR +4.25%) ± | | 4.76 | 9-1-2028 | | 100,000 | 96,988 |
| | | | | | | 403,301 |
| Materials: 0.15% | | | | | | |
| Paper & forest products: 0.15% | | | | | | |
| Vertical US Newco Incorporated (1 Month LIBOR +3.50%) ± | | 4.02 | 7-30-2027 | | 246,891 | 244,269 |
| Real estate: 0.28% | | | | | | |
| Equity REITs: 0.28% | | | | | | |
| The Geo Group Incorporated (3 Month LIBOR +2.00%) <± | | 2.75 | 3-22-2024 | | 497,380 | 463,126 |
| Total Loans (Cost $7,820,519) | | | | | | 7,723,323 |
| Municipal obligations: 0.09% | | | | | | |
| Illinois: 0.04% | | | | | | |
| GO revenue: 0.04% | | | | | | |
| Chicago IL Refunding Bonds Taxable Project Series E | | 6.05 | 1-1-2029 | | 5,000 | 5,146 |
| Chicago IL Refunding Bonds Taxable Project Series E | | 6.05 | 1-1-2029 | | 50,000 | 52,754 |
| | | | | | | 57,900 |
| Kansas: 0.01% | | | | | | |
| Health revenue: 0.01% | | | | | | |
| Kansas Development Finance Authority Village Shalom Project Series 2018-B | | 4.00 | 11-15-2025 | | 25,000 | 24,110 |
| Maryland: 0.04% | | | | | | |
| Education revenue: 0.04% | | | | | | |
| Maryland Health & HEFAR Green Street Academy Series B 144A | | 6.75 | 7-1-2023 | | 65,000 | 64,676 |
| Total Municipal obligations (Cost $144,428) | | | | | | 146,686 |
| Non-agency mortgage-backed securities: 13.77% | | | | | | |
| AFN LLC Series 2019-1A Class A2 144A | | 4.46 | 5-20-2049 | | 697,054 | 692,068 |
| APEX Credit CLO LLC Series 2017 Class 2A (3 Month LIBOR +1.60%) 144A± | | 2.53 | 9-20-2029 | | 1,000,000 | 986,983 |
| Apidos CLO Series 2019 Class 3-1-A (3 Month LIBOR +3.10%) 144A± | | 3.34 | 4-15-2031 | | 500,000 | 489,499 |
| BB-UBS Trust Series 2012-TFT Class C 144A±± | | 3.56 | 6-5-2030 | | 150,000 | 134,329 |
The accompanying notes are an integral part of these consolidated financial statements.
20 | Allspring Income Plus Fund
Consolidated portfolio of investments—March 31, 2022 (unaudited)
| | | Interest
rate | Maturity
date | Principal | Value |
| Non-agency mortgage-backed securities (continued) | | | | | | |
| Bojangles Issuer LLC Series 2020-1A Class A2 144A | | 3.83% | 10-20-2050 | $ | 705,000 | $ 689,302 |
| BX Trust Series 2019-11 Class D 144A±± | | 4.08 | 12-9-2041 | | 500,000 | 463,975 |
| BX Trust Series 2021-ARIA Class D (1 Month LIBOR +1.90%) 144A± | | 2.29 | 10-15-2036 | | 550,000 | 537,570 |
| Carlyle Global Market Series 2016-1A Class R2 (3 Month LIBOR +3.35%) 144A± | | 3.60 | 4-20-2034 | | 1,000,000 | 989,517 |
| Carlyle Global Market Series 2017-2A Class R2 (3 Month LIBOR +1.60%) 144A± | | 1.85 | 7-20-2031 | | 750,000 | 737,707 |
| Cascade Funding Mortgage Trust Series 2021-HB7 Class M2 144A±± | | 2.68 | 10-27-2031 | | 1,000,000 | 960,237 |
| CFCRE Commercial Mortgage Trust Series 2016-C7 Class AM | | 4.16 | 12-10-2054 | | 400,000 | 400,484 |
| CIFC Funding Limited Series 2018-1A Class B (3 Month LIBOR +1.40%) 144A± | | 1.64 | 4-18-2031 | | 1,000,000 | 988,300 |
| Foundation Finance Trust Series 2019-1A Class A 144A | | 3.86 | 11-15-2034 | | 278,917 | 281,613 |
| FREMF Mortgage Trust Series 2017-K724 Class B 144A±± | | 3.53 | 12-25-2049 | | 400,000 | 400,388 |
| FREMF Mortgage Trust Series 2020-KF76 Class B (1 Month LIBOR +2.75%) 144A± | | 2.99 | 1-25-2030 | | 366,896 | 363,444 |
| FS Rialto Issuer Limited Series 2021-FL3 Class B (1 Month LIBOR +1.80%) 144A± | | 2.23 | 11-16-2036 | | 1,000,000 | 982,673 |
| Goldman Sachs Mortgage Security Trust Series 2018-LUAU Class B (1 Month LIBOR +1.40%) 144A± | | 1.80 | 11-15-2032 | | 1,600,000 | 1,575,863 |
| JPMorgan Chase & Company Series 2017-6 Class B 144A±± | | 3.79 | 12-25-2048 | | 454,963 | 416,775 |
| Longtrain Leasing III LLC Series 2015-1A Class A2 144A | | 4.06 | 1-15-2045 | | 1,568,304 | 1,503,721 |
| MED Trust Series 2021-MDLN Class B (1 Month LIBOR +1.45%) 144A± | | 1.85 | 11-15-2038 | | 1,000,000 | 982,122 |
| MF1 Multifamily Housing Mortgage Loan Trust Series 2021-FL7 Class C (1 Month LIBOR +2.05%) 144A± | | 2.48 | 10-16-2036 | | 1,000,000 | 970,244 |
| MFRA Trust Series 2020-NQM3 Class M1 144A±± | | 2.65 | 1-26-2065 | | 1,000,000 | 977,626 |
| NBC Funding LLC Series 2021 Class A2 144A | | 2.99 | 7-30-2051 | | 995,000 | 926,831 |
| Neuberger Berman CLO Limited Series 2017-25A Class BR (3 Month LIBOR +1.35%) 144A± | | 1.59 | 10-18-2029 | | 250,000 | 247,601 |
| OneMain Financial Issuance Trust Series 2019-1A Class D 144A | | 4.22 | 2-14-2031 | | 1,100,000 | 1,101,517 |
| Oxford Finance Funding Trust Series 2019-1A Class A2 144A | | 4.46 | 2-15-2027 | | 514,703 | 518,810 |
| Residential Mortgage Loan Trust Series 2019-3 Class A3 144A±± | | 3.04 | 9-25-2059 | | 352,187 | 347,260 |
| SFAVE Commercial Mortgage Securities Trust Series 2015-5AVE Class D 144A±± | | 4.39 | 1-5-2043 | | 700,000 | 472,761 |
| Store Master Funding LLC Series 2014-1A Class A2 144A | | 5.00 | 4-20-2044 | | 96,083 | 96,209 |
| TRK Toorak Mortgage Corporation Series 2021-INV2 Class A2 144A±± | | 2.12 | 11-25-2056 | | 966,257 | 919,087 |
The accompanying notes are an integral part of these consolidated financial statements.
Allspring Income Plus Fund | 21
Consolidated portfolio of investments—March 31, 2022 (unaudited)
| | | Interest
rate | Maturity
date | Principal | Value |
| Non-agency mortgage-backed securities (continued) | | | | | | |
| Verus Securitization Trust Series 2021-8 Class A2 144A±± | | 2.29% | 11-25-2066 | $ | 1,424,471 | $ 1,361,032 |
| Verus Securitization Trust Series 2021-R3 Class A2 144A±± | | 1.28 | 4-25-2064 | | 593,481 | 572,619 |
| Total Non-agency mortgage-backed securities (Cost $23,805,309) | | | | | | 23,088,167 |
| U.S. Treasury securities: 5.66% | | | | | | |
| U.S. Treasury Bond | | 1.88 | 2-15-2041 | | 450,000 | 400,693 |
| U.S. Treasury Note ## | | 0.13 | 1-15-2024 | | 1,150,000 | 1,106,561 |
| U.S. Treasury Note | | 0.75 | 3-31-2026 | | 2,500,000 | 2,331,348 |
| U.S. Treasury Note | | 1.25 | 12-31-2026 | | 3,000,000 | 2,834,399 |
| U.S. Treasury Note | | 1.50 | 1-31-2027 | | 140,000 | 133,788 |
| U.S. Treasury Note | | 1.88 | 2-28-2027 | | 320,000 | 311,425 |
| U.S. Treasury Note | | 2.00 | 8-15-2051 | | 45,000 | 40,598 |
| U.S. Treasury Note | | 2.25 | 5-15-2041 | | 435,000 | 410,650 |
| U.S. Treasury Note | | 2.25 | 2-15-2052 | | 1,000,000 | 959,063 |
| U.S. Treasury Note | | 2.38 | 2-15-2042 | | 1,000,000 | 964,531 |
| Total U.S. Treasury securities (Cost $9,729,005) | | | | | | 9,493,056 |
| Yankee corporate bonds and notes: 10.18% | | | | | | |
| Communication services: 0.23% | | | | | | |
| Wireless telecommunication services: 0.23% | | | | | | |
| VMED O2 UK Financing I plc 144A | | 4.75 | 7-15-2031 | | 400,000 | 377,000 |
| Consumer discretionary: 0.23% | | | | | | |
| Internet & direct marketing retail: 0.23% | | | | | | |
| Prosus NV 144A | | 4.03 | 8-3-2050 | | 500,000 | 377,358 |
| Consumer staples: 0.56% | | | | | | |
| Beverages: 0.56% | | | | | | |
| Coca-Cola Icecek AS 144A | | 4.50 | 1-20-2029 | | 1,000,000 | 939,891 |
| Energy: 1.34% | | | | | | |
| Energy equipment & services: 0.15% | | | | | | |
| Nabors Industries Limited 144A | | 7.25 | 1-15-2026 | | 250,000 | 250,000 |
| Oil, gas & consumable fuels: 1.19% | | | | | | |
| BP Capital Markets plc (5 Year Treasury Constant Maturity +4.40%) ʊ± | | 4.88 | 3-22-2030 | | 325,000 | 325,813 |
| Comision Federal de Electricidad 144A | | 3.35 | 2-9-2031 | | 200,000 | 175,002 |
| Enbridge Incorporated (5 Year Treasury Constant Maturity +5.31%) ± | | 5.75 | 7-15-2080 | | 1,000,000 | 1,035,000 |
| Northriver Midstream Finance LP 144A | | 5.63 | 2-15-2026 | | 220,000 | 219,064 |
| Petroleos Mexicanos | | 6.70 | 2-16-2032 | | 250,000 | 237,500 |
| | | | | | | 1,992,379 |
| Financials: 5.97% | | | | | | |
| Banks: 3.88% | | | | | | |
| African Export Import Bank 144A | | 3.80 | 5-17-2031 | | 200,000 | 184,260 |
| Banco de Bogota SA 144A | | 6.25 | 5-12-2026 | | 400,000 | 409,000 |
| Banco do Brasil SA 144A | | 4.88 | 1-11-2029 | | 375,000 | 377,066 |
The accompanying notes are an integral part of these consolidated financial statements.
22 | Allspring Income Plus Fund
Consolidated portfolio of investments—March 31, 2022 (unaudited)
| | | Interest
rate | Maturity
date | Principal | Value |
| Banks (continued) | | | | | | |
| Banco Internacional del Peru 144A | | 3.25% | 10-4-2026 | $ | 525,000 | $ 518,443 |
| Banco Mercantil del Norte SA (5 Year Treasury Constant Maturity +4.64%) 144Aʊ± | | 5.88 | 1-24-2027 | | 750,000 | 693,750 |
| Credit Agricole SA (USD Swap Semi Annual (vs. 3 Month LIBOR) 5 Year +6.19%) 144Aʊ± | | 8.13 | 12-23-2025 | | 1,000,000 | 1,111,920 |
| Deutsche Bank AG (USD ICE Swap Rate 11:00am NY 5 Year +2.55%) ± | | 4.88 | 12-1-2032 | | 500,000 | 479,970 |
| Intesa Sanpaolo SpA 144A | | 5.71 | 1-15-2026 | | 635,000 | 648,683 |
| Itau Unibanco Holding SA 144A | | 3.25 | 1-24-2025 | | 800,000 | 794,560 |
| NatWest Group plc (5 Year Treasury Constant Maturity +5.63%) ʊ± | | 6.00 | 12-29-2025 | | 700,000 | 714,805 |
| Unicredit SpA (5 Year Treasury Constant Maturity +4.75%) 144A± | | 5.46 | 6-30-2035 | | 600,000 | 573,328 |
| | | | | | | 6,505,785 |
| Capital markets: 0.52% | | | | | | |
| Credit Suisse Group AG (U.S. SOFR +0.98%) 144A± | | 1.31 | 2-2-2027 | | 250,000 | 223,599 |
| Credit Suisse Group AG (5 Year Treasury Constant Maturity +4.89%) 144Aʊ± | | 5.25 | 2-11-2027 | | 500,000 | 462,500 |
| UBS Group AG (5 Year Treasury Constant Maturity +3.40%) 144Aʊ± | | 4.88 | 2-12-2027 | | 200,000 | 192,940 |
| | | | | | | 879,039 |
| Consumer finance: 0.21% | | | | | | |
| Unifin Financiera SAB de CV 144A | | 9.88 | 1-28-2029 | | 600,000 | 352,860 |
| Diversified financial services: 0.72% | | | | | | |
| Castlelake Aviation Finance 144A | | 5.00 | 4-15-2027 | | 105,000 | 93,713 |
| DAE Funding LLC 144A | | 3.38 | 3-20-2028 | | 200,000 | 187,000 |
| Doric Nimrod Air Alpha Pass-Through Trust Certificates Series 2013-1 Class A 144A | | 5.25 | 5-30-2025 | | 932,270 | 925,944 |
| | | | | | | 1,206,657 |
| Insurance: 0.64% | | | | | | |
| Swiss Re Finance (Luxembourg) SA (5 Year Treasury Constant Maturity +3.58%) 144A± | | 5.00 | 4-2-2049 | | 800,000 | 828,000 |
| Validus Holdings Limited | | 8.88 | 1-26-2040 | | 160,000 | 237,084 |
| | | | | | | 1,065,084 |
| Health care: 0.62% | | | | | | |
| Biotechnology: 0.28% | | | | | | |
| Grifols Escrow Issuer SA 144A | | 4.75 | 10-15-2028 | | 500,000 | 470,625 |
| Pharmaceuticals: 0.34% | | | | | | |
| Bausch Health Companies Incorporated 144A | | 5.25 | 1-30-2030 | | 600,000 | 471,324 |
| Bausch Health Companies Incorporated 144A | | 6.25 | 2-15-2029 | | 125,000 | 102,500 |
| | | | | | | 573,824 |
The accompanying notes are an integral part of these consolidated financial statements.
Allspring Income Plus Fund | 23
Consolidated portfolio of investments—March 31, 2022 (unaudited)
| | | Interest
rate | Maturity
date | Principal | Value |
| Industrials: 0.86% | | | | | | |
| Airlines: 0.64% | | | | | | |
| Air Canada Pass-Through Trust Series 2020-1 Class C 144A | | 10.50% | 7-15-2026 | $ | 500,000 | $ 577,629 |
| VistaJet 144A | | 6.38 | 2-1-2030 | | 520,000 | 489,250 |
| | | | | | | 1,066,879 |
| Trading companies & distributors: 0.22% | | | | | | |
| Carlyle Aviation Elevate Merger Subsidiary Limited 144A | | 7.00 | 10-15-2024 | | 420,000 | 376,660 |
| Materials: 0.11% | | | | | | |
| Containers & packaging: 0.11% | | | | | | |
| Ardagh Packaging Finance plc 144A | | 5.25 | 8-15-2027 | | 200,000 | 184,875 |
| Utilities: 0.26% | | | | | | |
| Electric utilities: 0.26% | | | | | | |
| Comision Federal de Electricidad Company 144A | | 3.88 | 7-26-2033 | | 500,000 | 437,500 |
| Total Yankee corporate bonds and notes (Cost $17,819,373) | | | | | | 17,056,416 |
| Yankee government bonds: 2.24% | | | | | | |
| Commonwealth of Bahamas 144A | | 6.00 | 11-21-2028 | | 785,000 | 607,402 |
| Dominican Republic 144A | | 4.50 | 1-30-2030 | | 200,000 | 183,502 |
| Dominican Republic 144A | | 4.88 | 9-23-2032 | | 200,000 | 181,002 |
| Dominican Republic 144A | | 5.50 | 2-22-2029 | | 200,000 | 197,500 |
| Mongolia Government | | 5.63 | 5-1-2023 | | 200,000 | 200,999 |
| Provincia de Cordoba 144A | | 6.98 | 12-10-2025 | | 254,472 | 198,310 |
| Provincia de Cordoba (PIK at 6.88%) 144A¥ | | 5.00 | 2-1-2029 | | 557,619 | 339,534 |
| Provincia de Santa Fe | | 7.00 | 3-23-2023 | | 175,059 | 162,586 |
| Republic of Angola | | 9.50 | 11-12-2025 | | 400,000 | 437,376 |
| Sultanate of Oman 144A | | 6.25 | 1-25-2031 | | 300,000 | 317,502 |
| United Mexican States | | 4.28 | 8-14-2041 | | 1,000,000 | 932,170 |
| Total Yankee government bonds (Cost $4,037,441) | | | | | | 3,757,883 |
| | | Yield | | Shares | |
| Short-term investments: 7.01% | | | | | | |
| Investment companies: 7.01% | | | | | | |
| Allspring Government Money Market Fund Select Class ♠∞##* | | 0.18 | | | 8,876,601 | 8,876,601 |
| Securities Lending Cash Investments LLC ♠∩∞ | | 0.40 | | | 2,871,098 | 2,871,098 |
| Total Short-term investments (Cost $11,747,699) | | | | | | 11,747,699 |
| Total investments in securities (Cost $171,611,482) | 99.42% | | | | | 166,652,986 |
| Other assets and liabilities, net | 0.58 | | | | | 978,250 |
| Total net assets | 100.00% | | | | | $167,631,236 |
The accompanying notes are an integral part of these consolidated financial statements.
24 | Allspring Income Plus Fund
Consolidated portfolio of investments—March 31, 2022 (unaudited)
| 144A | The security may be resold in transactions exempt from registration, normally to qualified institutional buyers, pursuant to Rule 144A under the Securities Act of 1933. |
| ±± | The coupon of the security is adjusted based on the principal and/or interest payments received from the underlying pool of mortgages as well as the credit quality and the actual prepayment speed of the underlying mortgages. The rate shown is the rate in effect at period end. |
| ± | Variable rate investment. The rate shown is the rate in effect at period end. |
| ¤ | The security is issued in zero coupon form with no periodic interest payments. |
| < | All or a portion of the position represents an unfunded loan commitment. The rate represents the current interest rate if the loan is partially funded. |
| ‡ | Security is valued using significant unobservable inputs. |
| ## | All or a portion of this security is segregated for when-issued securities and unfunded loans. |
| ¥ | A payment-in-kind (PIK) security is a security in which the issuer may make interest or dividend payments in cash or additional securities or a combination of both. The rate shown is the rate in effect at period end. |
| * | A portion of the holding represents an investment held in Strategic Income Special Investment (Cayman) Ltd., the consolidated entity. |
| ♠ | The issuer of the security is an affiliated person of the Fund as defined in the Investment Company Act of 1940. |
| ∩ | The investment is a non-registered investment company purchased with cash collateral received from securities on loan. |
| ∞ | The rate represents the 7-day annualized yield at period end. |
| ʊ | Security is perpetual in nature and has no stated maturity date. The date shown reflects the next call date. |
| %% | The security is purchased on a when-issued basis. |
| Abbreviations: |
| BRL | Brazilian real |
| COP | Colombian peso |
| EUR | Euro |
| EURIBOR | Euro Interbank Offered Rate |
| GBP | Great British pound |
| GO | General obligation |
| HEFAR | Higher Education Facilities Authority Revenue |
| IDR | Indonesian rupiah |
| INR | Indian rupee |
| LIBOR | London Interbank Offered Rate |
| MXN | Mexican peso |
| REIT | Real estate investment trust |
| RUB | Russian ruble |
| SOFR | Secured Overnight Financing Rate |
| ZAR | South African rand |
Investments in affiliates
An affiliated investment is an investment in which the Fund owns at least 5% of the outstanding voting shares of the issuer or as a result of other relationships, such as the Fund and the issuer having the same investment manager. Transactions with issuers that were affiliates of the Fund at the end of the period were as follows:
| | Value,
beginning of
period | Purchases | Sales
proceeds | Net
realized
gains
(losses) | | Net
change in
unrealized
gains
(losses) | | Value,
end of
period | Shares,
end
of period | Income
from
affiliated
securities |
| Short-term investments | | | | | | | | | |
| Allspring Government Money Market Fund Select Class | $7,284,117 | $63,360,828 | $(61,768,344) | $0 | | $0 | | $ 8,876,601 | 8,876,601 | $ 1,839 |
| Securities Lending Cash Investments LLC | 7,560,711 | 27,686,882 | (32,376,495) | 0 | | 0 | | 2,871,098 | 2,871,098 | 1,017 # |
| | | | | $0 | | $0 | | $11,747,699 | | $2,856 |
| # | Amount shown represents income before fees and rebates. |
The accompanying notes are an integral part of these consolidated financial statements.
Allspring Income Plus Fund | 25
Consolidated portfolio of investments—March 31, 2022 (unaudited)
Forward foreign currency contracts
Currency to be
received | Currency to be
delivered | Counterparty | Settlement
date | Unrealized
gains | | Unrealized
losses |
| 2,150,000,000 COP | 566,073 USD | Morgan Stanley Incorporated | 4-8-2022 | $ 3,442 | | $ 0 |
| 531,652 USD | 2,150,000,000 COP | Morgan Stanley Incorporated | 4-8-2022 | 0 | | (37,863) |
| 557,949 USD | 2,150,000,000 COP | Morgan Stanley Incorporated | 7-8-2022 | 0 | | (4,031) |
| 17,816,192 USD | 16,170,000 EUR | Citibank National Association | 6-30-2022 | 0 | | (133,701) |
| 7,950,000,000 IDR | 554,780 USD | Morgan Stanley Incorporated | 4-8-2022 | 0 | | (1,345) |
| 550,108 USD | 7,950,000,000 IDR | Morgan Stanley Incorporated | 4-8-2022 | 0 | | (3,327) |
| 551,815 USD | 7,950,000,000 IDR | Morgan Stanley Incorporated | 7-8-2022 | 552 | | 0 |
| 1,058,172 USD | 21,410,000 MXN | Citibank National Association | 6-30-2022 | 0 | | (1,727) |
| 1,280,585 USD | 975,000 GBP | Citibank National Association | 6-30-2022 | 132 | | 0 |
| 3,000,000 RUB | 39,637 USD | Morgan Stanley Incorporated | 4-8-2022 | 0 | | (2,804) |
| 494,658 USD | 37,500,000 RUB | Morgan Stanley Incorporated | 4-8-2022 | 34,240 | | 0 |
| 2,078,838 USD | 31,795,000 ZAR | Citibank National Association | 6-30-2022 | 0 | | (73,287) |
| | | | | $38,366 | | $(258,085) |
Futures contracts
| Description | Number of
contracts | Expiration
date | Notional
cost | Notional
value | Unrealized
gains | | Unrealized
losses |
| Long | | | | | | | |
| 10-Year U.S. Treasury Notes | 12 | 6-21-2022 | $ 1,528,520 | $ 1,474,500 | $ 0 | | $ (54,020) |
| 2-Year U.S. Treasury Notes | 65 | 6-30-2022 | 13,943,655 | 13,774,922 | 0 | | (168,733) |
| 5-Year U.S. Treasury Notes | 161 | 6-30-2022 | 18,897,633 | 18,464,688 | 0 | | (432,945) |
| Short | | | | | | | |
| Euro-Bund Futures | (83) | 6-8-2022 | (15,258,308) | (14,567,960) | 690,348 | | 0 |
| U.S. Long Term Bonds | (11) | 6-21-2022 | (1,696,711) | (1,650,688) | 46,023 | | 0 |
| U.S. Ultra Treasury Bonds | (6) | 6-21-2022 | (1,099,675) | (1,062,750) | 36,925 | | 0 |
| | | | | | $773,296 | | $(655,698) |
Centrally cleared credit default swap contracts
| Reference index | Fixed rate
received | Payment
frequency | Maturity
date | Notional
amount | Value | Premiums
paid
(received) | Unrealized
gains | | Unrealized
losses |
| Buy Protection | | | | | | | | | | |
| Markit iTraxx Europe Crossover* | 5.00% | Quarterly | 6-20-2026 | EUR | 3,000,000 | $ 270,249 | $360,321 | $0 | | $ (90,072) |
| Sell Protection | | | | | | | | | | |
| Markit CDX Emerging Markets Index* | 1.00 | Quarterly | 6-20-2026 | USD | 1,000,000 | (75,352) | (24,589) | 0 | | (50,763) |
| Markit iTraxx Europe Subordinated Financial Index* | 1.00 | Quarterly | 6-20-2026 | EUR | 12,000,000 | (157,123) | (37,052) | 0 | | (120,071) |
| | | | | | | | | $0 | | $(260,906) |
| * | Represents an investment held in Strategic Income Special Investment (Cayman) Ltd., the consolidated entity. |
The accompanying notes are an integral part of these consolidated financial statements.
26 | Allspring Income Plus Fund
Consolidated statement of assets and liabilities—March 31, 2022 (unaudited)
| | |
| Assets | |
Investments in unaffiliated securities (including $2,813,537 of securities loaned), at value (cost $159,863,783)
| $ 154,905,287 |
Investments in affiliated securities, at value (cost $11,747,699)
| 11,747,699 |
Cash at broker segregated for futures contracts
| 1,459,000 |
Segregated cash for swap contracts
| 1,220,698 |
Foreign currency, at value (cost $737,311)
| 807,059 |
Receivable for interest
| 1,534,455 |
Receivable for daily variation margin on centrally cleared swap contracts
| 1,138,445 |
Receivable for investments sold
| 380,690 |
Receivable for Fund shares sold
| 356,374 |
Unrealized gains on forward foreign currency contracts
| 38,366 |
Receivable for daily variation margin on open futures contracts
| 36,305 |
Receivable for securities lending income, net
| 1,638 |
Prepaid expenses and other assets
| 73,823 |
Total assets
| 173,699,839 |
| Liabilities | |
Payable upon receipt of securities loaned
| 2,870,737 |
Payable for daily variation margin on centrally cleared swaps
| 1,145,863 |
Payable for investments purchased
| 1,045,494 |
Overdraft due to custodian bank
| 309,500 |
Unrealized losses on forward foreign currency contracts
| 258,085 |
Payable for daily variation margin on open futures contracts
| 159,105 |
Management fee payable
| 51,456 |
Payable for Fund shares redeemed
| 39,065 |
Administration fees payable
| 12,524 |
Trustees’ fees and expenses payable
| 2,854 |
Distribution fee payable
| 770 |
Accrued expenses and other liabilities
| 173,150 |
Total liabilities
| 6,068,603 |
Total net assets
| $167,631,236 |
| Net assets consist of | |
Paid-in capital
| $ 172,985,618 |
Total distributable loss
| (5,354,382) |
Total net assets
| $167,631,236 |
| Computation of net asset value and offering price per share | |
Net assets – Class A
| $ 15,620,694 |
Shares outstanding – Class A1
| 1,685,764 |
Net asset value per share – Class A
| $9.27 |
Maximum offering price per share – Class A2
| $9.66 |
Net assets – Class C
| $ 1,417,233 |
Shares outstanding – Class C1
| 152,265 |
Net asset value per share – Class C
| $9.31 |
Net assets – Administrator Class
| $ 2,176,316 |
Shares outstanding – Administrator Class1
| 233,058 |
Net asset value per share – Administrator Class
| $9.34 |
Net assets – Institutional Class
| $ 148,416,993 |
Shares outstanding – Institutional Class1
| 16,044,463 |
Net asset value per share – Institutional Class
| $9.25 |
| 1 | The Fund has an unlimited number of authorized shares. |
| 2 | Maximum offering price is computed as 100/96 of net asset value. On investments of $50,000 or more, the offering price is reduced. |
The accompanying notes are an integral part of these consolidated financial statements.
Allspring Income Plus Fund | 27
Consolidated statement of operations— six months ended March 31, 2022 (unaudited)
| | |
| Investment income | |
Interest (net of foreign withholding taxes of $4,446)
| $ 3,072,926 |
Dividends
| 98,816 |
Income from affiliated securities
| 9,606 |
Total investment income
| 3,181,348 |
| Expenses | |
Management fee
| 467,645 |
| Administration fees | |
Class A
| 9,842 |
Class C
| 1,169 |
Administrator Class
| 2,587 |
Institutional Class
| 63,685 |
| Shareholder servicing fees | |
Class A
| 15,378 |
Class C
| 1,750 |
Administrator Class
| 6,468 |
| Distribution fee | |
Class C
| 5,230 |
Custody and accounting fees
| 18,712 |
Professional fees
| 39,055 |
Registration fees
| 35,605 |
Shareholder report expenses
| 19,997 |
Trustees’ fees and expenses
| 10,683 |
Other fees and expenses
| 4,266 |
Total expenses
| 702,072 |
| Less: Fee waivers and/or expense reimbursements | |
Fund-level
| (132,607) |
Class A
| (2,116) |
Class C
| (54) |
Administrator Class
| (3,065) |
Net expenses
| 564,230 |
Net investment income
| 2,617,118 |
| Realized and unrealized gains (losses) on investments | |
| Net realized gains (losses) on | |
Unaffiliated securities
| 294,101 |
Forward foreign currency contracts
| 1,313,151 |
Futures contracts
| (147,823) |
Swap contracts
| 144,184 |
Net realized gains on investments
| 1,603,613 |
| Net change in unrealized gains (losses) on | |
Unaffiliated securities
| (9,928,313) |
Forward foreign currency contracts
| (653,463) |
Futures contracts
| (251,917) |
Swap contracts
| (298,475) |
Net change in unrealized gains (losses) on investments
| (11,132,168) |
Net realized and unrealized gains (losses) on investments
| (9,528,555) |
Net decrease in net assets resulting from operations
| $ (6,911,437) |
The accompanying notes are an integral part of these consolidated financial statements.
28 | Allspring Income Plus Fund
Consolidated statement of changes in net assets
| | | | | |
| | Six months ended
March 31, 2022
(unaudited) | Year ended
September 30, 2021 |
| Operations | | | | |
Net investment income
| | $ 2,617,118 | | $ 5,076,928 |
Net realized gains on investments
| | 1,603,613 | | 4,953,908 |
Net change in unrealized gains (losses) on investments
| | (11,132,168) | | 2,083,547 |
Net increase (decrease) in net assets resulting from operations
| | (6,911,437) | | 12,114,383 |
| Distributions to shareholders from | | | | |
| Net investment income and net realized gains | | | | |
Class A
| | (455,214) | | (57,802) |
Class C
| | (65,123) | | (21,319) |
Administrator Class
| | (328,927) | | (56,511) |
Institutional Class
| | (7,895,034) | | (4,940,534) |
Total distributions to shareholders
| | (8,744,298) | | (5,076,166) |
| Capital share transactions | Shares | | Shares | |
| Proceeds from shares sold | | | | |
Class A
| 1,508,447 | 14,799,684 | 312,028 | 3,153,696 |
Class C
| 52,988 | 515,573 | 85,947 | 870,666 |
Administrator Class
| 289,873 | 2,866,999 | 730,401 | 7,490,893 |
Institutional Class
| 3,993,592 | 38,671,087 | 6,012,484 | 59,960,463 |
| | | 56,853,343 | | 71,475,718 |
| Reinvestment of distributions | | | | |
Class A
| 46,860 | 452,496 | 5,655 | 56,840 |
Class C
| 6,683 | 65,123 | 2,110 | 21,319 |
Administrator Class
| 33,482 | 328,788 | 5,500 | 56,177 |
Institutional Class
| 809,463 | 7,840,581 | 484,051 | 4,849,200 |
| | | 8,686,988 | | 4,983,536 |
| Payment for shares redeemed | | | | |
Class A
| (132,998) | (1,263,626) | (226,650) | (2,282,403) |
Class C
| (34,345) | (325,669) | (27,937) | (276,311) |
Administrator Class
| (797,727) | (7,782,665) | (32,590) | (332,582) |
Institutional Class
| (4,973,237) | (47,858,523) | (5,833,117) | (57,700,488) |
| | | (57,230,483) | | (60,591,784) |
Net increase in net assets resulting from capital share transactions
| | 8,309,848 | | 15,867,470 |
Total increase (decrease) in net assets
| | (7,345,887) | | 22,905,687 |
| Net assets | | | | |
Beginning of period
| | 174,977,123 | | 152,071,436 |
End of period
| | $167,631,236 | | $174,977,123 |
The accompanying notes are an integral part of these consolidated financial statements.
Allspring Income Plus Fund | 29
Consolidated financial highlights
(For a share outstanding throughout each period)
| | | Year ended September 30 |
| Class A | Six months ended
March 31, 2022
(unaudited) | 2021 | 2020 | 2019 | 2018 | 2017 |
Net asset value, beginning of period
| $10.12 | $9.64 | $9.50 | $9.43 | $9.59 | $9.25 |
Net investment income
| 0.13 1 | 0.27 | 0.29 | 0.34 1 | 0.31 1 | 0.33 1 |
Net realized and unrealized gains (losses) on investments
| (0.51) | 0.51 | 0.14 | 0.09 | (0.16) | 0.22 |
Total from investment operations
| (0.38) | 0.78 | 0.43 | 0.43 | 0.15 | 0.55 |
| Distributions to shareholders from | | | | | | |
Net investment income
| (0.22) | (0.30) | (0.29) | (0.36) | (0.31) | (0.21) |
Net realized gains
| (0.25) | 0.00 | 0.00 | 0.00 | 0.00 | 0.00 |
Total distributions to shareholders
| (0.47) | (0.30) | (0.29) | (0.36) | (0.31) | (0.21) |
Net asset value, end of period
| $9.27 | $10.12 | $9.64 | $9.50 | $9.43 | $9.59 |
Total return2
| (3.92)% | 8.18% | 4.60% | 4.66% | 1.59% | 6.05% |
| Ratios to average net assets (annualized) | | | | | | |
Gross expenses
| 1.08% | 1.07% | 1.08% | 1.09% | 1.45% | 1.78% |
Net expenses
| 0.90% | 0.90% | 0.90% | 0.90% | 0.90% | 0.90% |
Net investment income
| 2.81% | 3.00% | 3.43% | 3.65% | 3.26% | 3.47% |
| Supplemental data | | | | | | |
Portfolio turnover rate
| 68% | 128% | 88% | 116% | 50% | 65% |
Net assets, end of period (000s omitted)
| $15,621 | $2,667 | $1,662 | $1,394 | $1,266 | $896 |
| 1 | Calculated based upon average shares outstanding |
| 2 | Total return calculations do not include any sales charges. Returns for periods of less than one year are not annualized. |
The accompanying notes are an integral part of these consolidated financial statements.
30 | Allspring Income Plus Fund
Consolidated financial highlights
(For a share outstanding throughout each period)
| | | Year ended September 30 |
| Class C | Six months ended
March 31, 2022
(unaudited) | 2021 | 2020 | 2019 | 2018 | 2017 |
Net asset value, beginning of period
| $10.16 | $9.68 | $9.49 | $9.41 | $9.57 | $9.22 |
Net investment income
| 0.10 1 | 0.22 | 0.23 | 0.27 | 0.23 | 0.29 |
Payment from affiliate
| 0.00 | 0.00 | 0.07 | 0.00 | 0.00 | 0.00 |
Net realized and unrealized gains (losses) on investments
| (0.52) | 0.49 | 0.12 | 0.10 | (0.15) | 0.18 |
Total from investment operations
| (0.42) | 0.71 | 0.42 | 0.37 | 0.08 | 0.47 |
| Distributions to shareholders from | | | | | | |
Net investment income
| (0.18) | (0.23) | (0.23) | (0.29) | (0.24) | (0.12) |
Net realized gains
| (0.25) | 0.00 | 0.00 | 0.00 | 0.00 | 0.00 |
Total distributions to shareholders
| (0.43) | (0.23) | (0.23) | (0.29) | (0.24) | (0.12) |
Net asset value, end of period
| $9.31 | $10.16 | $9.68 | $9.49 | $9.41 | $9.57 |
Total return2
| (4.27)% | 7.36% | 4.45% 3 | 4.00% | 0.88% | 5.20% |
| Ratios to average net assets (annualized) | | | | | | |
Gross expenses
| 1.79% | 1.82% | 1.83% | 1.84% | 2.20% | 2.59% |
Net expenses
| 1.63% | 1.65% | 1.65% | 1.65% | 1.65% | 1.65% |
Net investment income
| 1.96% | 2.23% | 2.67% | 2.92% | 2.52% | 2.80% |
| Supplemental data | | | | | | |
Portfolio turnover rate
| 68% | 128% | 88% | 116% | 50% | 65% |
Net assets, end of period (000s omitted)
| $1,417 | $1,290 | $647 | $520 | $517 | $403 |
| 1 | Calculated based upon average shares outstanding |
| 2 | Total return calculations do not include any sales charges. Returns for periods of less than one year are not annualized. |
| 3 | During the year ended September 30, 2020, the Fund received a payment from an affiliate which had a 0.79% impact on the total return. |
The accompanying notes are an integral part of these consolidated financial statements.
Allspring Income Plus Fund | 31
Consolidated financial highlights
(For a share outstanding throughout each period)
| | | Year ended September 30 |
| Administrator Class | Six months ended
March 31, 2022
(unaudited) | 2021 | 2020 | 2019 | 2018 | 2017 |
Net asset value, beginning of period
| $10.20 | $9.71 | $9.56 | $9.46 | $9.61 | $9.29 |
Net investment income
| 0.13 1 | 0.29 1 | 0.34 1 | 0.36 1 | 0.33 1 | 0.34 1 |
Net realized and unrealized gains (losses) on investments
| (0.52) | 0.51 | 0.11 | 0.09 | (0.16) | 0.20 |
Total from investment operations
| (0.39) | 0.80 | 0.45 | 0.45 | 0.17 | 0.54 |
| Distributions to shareholders from | | | | | | |
Net investment income
| (0.22) | (0.31) | (0.30) | (0.35) | (0.32) | (0.22) |
Net realized gains
| (0.25) | 0.00 | 0.00 | 0.00 | 0.00 | 0.00 |
Total distributions to shareholders
| (0.47) | (0.31) | (0.30) | (0.35) | (0.32) | (0.22) |
Net asset value, end of period
| $9.34 | $10.20 | $9.71 | $9.56 | $9.46 | $9.61 |
Total return2
| (4.00)% | 8.31% | 4.72% | 4.83% | 1.81% | 5.91% |
| Ratios to average net assets (annualized) | | | | | | |
Gross expenses
| 1.02% | 1.00% | 1.02% | 1.08% | 1.38% | 1.72% |
Net expenses
| 0.75% | 0.75% | 0.75% | 0.75% | 0.75% | 0.75% |
Net investment income
| 2.71% | 2.83% | 3.61% | 3.80% | 3.48% | 3.64% |
| Supplemental data | | | | | | |
Portfolio turnover rate
| 68% | 128% | 88% | 116% | 50% | 65% |
Net assets, end of period (000s omitted)
| $2,176 | $7,215 | $40 | $75 | $5,471 | $562 |
| 1 | Calculated based upon average shares outstanding |
| 2 | Returns for periods of less than one year are not annualized. |
The accompanying notes are an integral part of these consolidated financial statements.
32 | Allspring Income Plus Fund
Consolidated financial highlights
(For a share outstanding throughout each period)
| | | Year ended September 30 |
| Institutional Class | Six months ended
March 31, 2022
(unaudited) | 2021 | 2020 | 2019 | 2018 | 2017 |
Net asset value, beginning of period
| $10.10 | $9.63 | $9.49 | $9.42 | $9.58 | $9.24 |
Net investment income
| 0.14 | 0.33 | 0.36 | 0.37 1 | 0.34 | 0.35 1 |
Net realized and unrealized gains (losses) on investments
| (0.51) | 0.47 | 0.10 | 0.09 | (0.16) | 0.24 |
Total from investment operations
| (0.37) | 0.80 | 0.46 | 0.46 | 0.18 | 0.59 |
| Distributions to shareholders from | | | | | | |
Net investment income
| (0.23) | (0.33) | (0.32) | (0.39) | (0.34) | (0.25) |
Net realized gains
| (0.25) | 0.00 | 0.00 | 0.00 | 0.00 | 0.00 |
Total distributions to shareholders
| (0.48) | (0.33) | (0.32) | (0.39) | (0.34) | (0.25) |
Net asset value, end of period
| $9.25 | $10.10 | $9.63 | $9.49 | $9.42 | $9.58 |
Total return2
| (3.80)% | 8.43% | 4.96% | 5.00% | 1.93% | 6.43% |
| Ratios to average net assets (annualized) | | | | | | |
Gross expenses
| 0.75% | 0.74% | 0.75% | 0.75% | 1.12% | 1.40% |
Net expenses
| 0.60% | 0.60% | 0.60% | 0.60% | 0.60% | 0.60% |
Net investment income
| 2.96% | 3.34% | 3.72% | 3.97% | 3.54% | 3.71% |
| Supplemental data | | | | | | |
Portfolio turnover rate
| 68% | 128% | 88% | 116% | 50% | 65% |
Net assets, end of period (000s omitted)
| $148,417 | $163,806 | $149,722 | $153,414 | $45,175 | $45,862 |
| 1 | Calculated based upon average shares outstanding |
| 2 | Returns for periods of less than one year are not annualized. |
The accompanying notes are an integral part of these consolidated financial statements.
Allspring Income Plus Fund | 33
Notes to consolidated financial statements (unaudited)
1. ORGANIZATION
Allspring Funds Trust (the "Trust"), a Delaware statutory trust organized on March 10, 1999, is an open-end management investment company registered under the Investment Company Act of 1940, as amended (the "1940 Act"). As an investment company, the Trust follows the accounting and reporting guidance in Financial Accounting Standards Board ("FASB") Accounting Standards Codification Topic 946, Financial Services – Investment Companies. These consolidated financial statements report on the Allspring Income Plus Fund (the "Fund") which is a diversified series of the Trust.
Effective on November 1, 2021, the sale transaction of Wells Fargo Asset Management ("WFAM") by Wells Fargo & Company to GTCR LLC and Reverence Capital Partners, L.P. was closed. In connection with the closing of the transaction, WFAM became known as Allspring Global Investments (“Allspring”) and various entities that provided services to the Fund changed their names to "Allspring", including Allspring Funds Management, LLC, the investment manager to the Fund, Allspring Global Investments, LLC and Allspring Global Investments (UK) Limited, both registered investment advisers providing subadvisory services to certain funds, and Allspring Funds Distributor, LLC, the Fund's principal underwriter. Consummation of the transaction resulted in a new investment management agreement and subadvisory agreement which became effective on November 1, 2021.
2. INVESTMENT IN SUBSIDIARY
The Fund invests in Strategic Income Special Investment (Cayman) Ltd. (the “Subsidiary”), a wholly-owned subsidiary incorporated on July 11, 2019 under the laws of the Cayman Islands as an exempted segregated portfolio company with limited liability. As of March 31, 2022, the Subsidiary had $6,811,532 invested in swap contracts and cash equivalents and had $1,220,698 in cash segregated at the broker for the swap contracts which in the aggregate represented 100.62% of its net assets. The Fund is the sole shareholder of the Subsidiary. As of March 31, 2022, the Fund held $7,986,199 in the Subsidiary, representing 4.76% of the Fund’s net assets prior to consolidation.
The consolidated financial statements of the Fund include the financial results of its wholly-owned subsidiary. The Consolidated Portfolio of Investments includes positions of the Fund and the Subsidiary and the consolidated financial statements include the accounts of the Fund and the Subsidiary. Accordingly, all interfund balances and transactions between the Fund and the Subsidiary have been eliminated in consolidation.
3. SIGNIFICANT ACCOUNTING POLICIES
The following significant accounting policies, which are consistently followed in the preparation of the consolidated financial statements of the Fund, are in conformity with U.S. generally accepted accounting principles which require management to make estimates and assumptions that affect the reported amounts of assets and liabilities, disclosure of contingent assets and liabilities at the date of the consolidated financial statements, and the reported amounts of income and expenses during the reporting period. Actual results could differ from those estimates.
Securities valuation
All investments are valued each business day as of the close of regular trading on the New York Stock Exchange (generally 4 p.m. Eastern Time), although the Fund may deviate from this calculation time under unusual or unexpected circumstances.
Debt securities are valued at the evaluated bid price provided by an independent pricing service (e.g. taking into account various factors, including yields, maturities, or credit ratings) or, if a reliable price is not available, the quoted bid price from an independent broker-dealer.
Equity securities and futures contracts that are listed on a foreign or domestic exchange or market are valued at the official closing price or, if none, the last sales price. If no sale occurs on the principal exchange or market that day, a fair value price will be determined in accordance with the Fund’s Valuation Procedures.
The values of securities denominated in foreign currencies are translated into U.S. dollars at rates provided by an independent foreign currency pricing source at a time each business day specified by the Allspring Global Investments Pricing Committee at Allspring Funds Management, LLC ("Allspring Funds Management").
Forward foreign currency contracts are recorded at the forward rate provided by an independent foreign currency pricing source at a time each business day specified by the Allspring Global Investments Pricing Committee.
Swap contracts are valued at the evaluated price provided by an independent pricing service or, if a reliable price is not available, the quoted bid price from an independent broker-dealer.
Investments in registered open-end investment companies are valued at net asset value. Interests in non-registered investment companies that are redeemable at net asset value are fair valued normally at net asset value.
34 | Allspring Income Plus Fund
Notes to consolidated financial statements (unaudited)
Investments which are not valued using any of the methods discussed above are valued at their fair value, as determined in good faith by the Board of Trustees. The Board of Trustees has established a Valuation Committee comprised of the Trustees and has delegated to it the authority to take any actions regarding the valuation of portfolio securities that the Valuation Committee deems necessary or appropriate, including determining the fair value of portfolio securities, unless the determination has been delegated to the Allspring Global Investments Pricing Committee. The Board of Trustees retains the authority to make or ratify any valuation decisions or approve any changes to the Valuation Procedures as it deems appropriate. On a quarterly basis, the Board of Trustees receives reports on any valuation actions taken by the Valuation Committee or the Allspring Global Investments Pricing Committee which may include items for ratification.
Foreign currency translation
The accounting records of the Fund are maintained in U.S. dollars. The values of other assets and liabilities denominated in foreign currencies are translated into U.S. dollars at rates provided by an independent foreign currency pricing source at a time each business day specified by the Allspring Global Investments Pricing Committee. Purchases and sales of securities, and income and expenses are converted at the rate of exchange on the respective dates of such transactions. Net realized foreign exchange gains or losses arise from sales of foreign currencies, currency gains or losses realized between the trade and settlement dates on securities transactions, and the difference between the amounts of dividends, interest and foreign withholding taxes recorded and the U.S. dollar equivalent of the amounts actually paid or received. Net unrealized foreign exchange gains and losses arise from changes in the fair value of assets and liabilities other than investments in securities resulting from changes in exchange rates. The changes in net assets arising from changes in exchange rates of securities and the changes in net assets resulting from changes in market prices of securities are not separately presented. Such changes are included in net realized and unrealized gains or losses from investments.
Securities lending
The Fund may lend its securities from time to time in order to earn additional income in the form of fees or interest on securities received as collateral or the investment of any cash received as collateral. When securities are on loan, the Fund receives interest or dividends on those securities. Cash collateral received in connection with its securities lending transactions is invested in Securities Lending Cash Investments, LLC (the "Securities Lending Fund"), an affiliated non-registered investment company. Investments in Securities Lending Fund are valued at the evaluated bid price provided by an independent pricing service. Income earned from investment in the Securities Lending Fund (net of fees and rebates), if any, is included in income from affiliated securities on the Consolidated Statement of Operations.
In a securities lending transaction, the net asset value of the Fund is affected by an increase or decrease in the value of the securities loaned and by an increase or decrease in the value of the instrument in which collateral is invested. The amount of securities lending activity undertaken by the Fund fluctuates from time to time. The Fund has the right under the lending agreement to recover the securities from the borrower on demand. In the event of default or bankruptcy by the borrower, the Fund may be prevented from recovering the loaned securities or gaining access to the collateral or may experience delays or costs in doing so. In such an event, the terms of the agreement allow the unaffiliated securities lending agent to use the collateral to purchase replacement securities on behalf of the Fund or pay the Fund the market value of the loaned securities. The Fund bears the risk of loss with respect to depreciation of its investment of the cash collateral.
When-issued transactions
The Fund may purchase securities on a forward commitment or when-issued basis. The Fund records a when-issued transaction on the trade date and will segregate assets in an amount at least equal in value to the Fund's commitment to purchase when-issued securities. Securities purchased on a when-issued basis are marked-to-market daily and the Fund begins earning interest on the settlement date. Losses may arise due to changes in the market value of the underlying securities or if the counterparty does not perform under the contract.
Loans
The Fund may invest in direct debt instruments which are interests in amounts owed to lenders by corporate or other borrowers. The loans pay interest at rates which are periodically reset by reference to a base lending rate plus a spread. Investments in loans may be in the form of participations in loans or assignments of all or a portion of loans from third parties. When the Fund purchases participations, it generally has no rights to enforce compliance with the terms of the loan agreement with the borrower. As a result, the Fund assumes the credit risk of both the borrower and the lender that is selling the participation. When the Fund purchases assignments from lenders, it acquires direct rights against the borrower on the loan and may enforce compliance by the borrower with the terms of the loan agreement. Loans may include fully funded term loans or unfunded loan commitments, which are contractual obligations for future funding.
Allspring Income Plus Fund | 35
Notes to consolidated financial statements (unaudited)
Forward foreign currency contracts
A forward foreign currency contract is an agreement between two parties to purchase or sell a specific currency for an agreed-upon price at a future date. The Fund enters into forward foreign currency contracts to facilitate transactions in foreign-denominated securities and to attempt to minimize the risk to the Fund from adverse changes in the relationship between currencies. Forward foreign currency contracts are recorded at the forward rate and marked-to-market daily. When the contracts are closed, realized gains and losses arising from such transactions are recorded as realized gains or losses on forward foreign currency contracts. The Fund is subject to foreign currency risk and may be exposed to risks if the counterparties to the contracts are unable to meet the terms of their contracts or if the value of the foreign currency changes unfavorably. The Fund's maximum risk of loss from counterparty credit risk is the unrealized gains on the contracts. This risk may be mitigated if there is a master netting arrangement between the Fund and the counterparty.
Futures contracts
Futures contracts are agreements between the Fund and a counterparty to buy or sell a specific amount of a commodity, financial instrument or currency at a specified price on a specified date. The Fund may buy and sell futures contracts in order to gain exposure to, or protect against, changes in interest rates and is subject to interest rate risk. The primary risks associated with the use of futures contracts are the imperfect correlation between changes in market values of securities held by the Fund and the prices of futures contracts, and the possibility of an illiquid market. Futures contracts are generally entered into on a regulated futures exchange and cleared through a clearinghouse associated with the exchange. With futures contracts, there is minimal counterparty risk to the Fund since futures contracts are exchange traded and the exchange’s clearinghouse, as the counterparty to all exchange traded futures, guarantees the futures contracts against default.
Upon entering into a futures contract, the Fund is required to deposit either cash or securities (initial margin) with the broker in an amount equal to a certain percentage of the contract value. Subsequent payments (variation margin) are paid to or from the broker each day equal to the daily changes in the contract value. Such payments are recorded as unrealized gains or losses and, if any, shown as variation margin receivable (payable) in the Consolidated Statement of Assets and Liabilities. Should the Fund fail to make requested variation margin payments, the broker can gain access to the initial margin to satisfy the Fund’s payment obligations. When the contracts are closed, a realized gain or loss is recorded in the Consolidated Statement of Operations.
Swap contracts
Swap contracts are agreements between the Fund and a counterparty to exchange a series of cash flows over a specified period. Swap agreements are privately negotiated contracts between the Fund that are entered into as bilateral contracts in the over-the-counter market or centrally cleared (“centrally cleared swaps”) with a central clearinghouse.
The Fund entered into centrally cleared swaps. In a centrally cleared swap, immediately following execution of the swap contract, the swap contract is novated to a central counterparty (the “CCP”) and the Fund’s counterparty on the swap agreement becomes the CCP. Upon entering into a centrally cleared swap, the Fund is required to deposit an initial margin with the broker in the form of cash or securities. Securities deposited as initial margin are designated in the Consolidated Portfolio of Investments and cash deposited is shown as cash segregated for centrally cleared swaps in the Consolidated Statement of Assets and Liabilities. Pursuant to the contract, the Fund agrees to receive from or pay to the broker an amount of cash equal to the daily fluctuation in market value of the contract (“variation margin”). The variation margin is recorded as an unrealized gain (or loss) and shown as daily variation margin receivable (or payable) on centrally cleared swaps in the Consolidated Statement of Assets and Liabilities. Payments received from (paid to) the counterparty are recorded as realized gains (losses) in the Consolidated Statement of Operations when the contract is closed.
Credit default swaps
The Fund may enter into credit default swaps for hedging or speculative purposes to provide or receive a measure of protection against default on a referenced entity, obligation or index or a basket of single-name issuers or traded indexes. An index credit default swap references all the names in the index, and if a credit event is triggered, the credit event is settled based on that name’s weight in the index. Credit default swaps are agreements in which the protection buyer pays fixed periodic payments to the protection seller in consideration for a promise from the protection seller to make a specific payment should a negative credit event take place with respect to the referenced entity (e.g., bankruptcy, failure to pay, obligation acceleration, repudiation, moratorium or restructuring).
The Fund may enter into credit default swaps as either the seller of protection or the buyer of protection. If the Fund is the buyer of protection and a credit event occurs, the Fund will either receive from the seller an amount equal to the notional amount of the swap and deliver the referenced security or underlying securities comprising the index, or receive a net settlement of cash equal to the notional amount of the swap less the recovery value of the security or underlying securities comprising the index. If the Fund is the seller of protection and a credit event occurs, the Fund will either pay the buyer an
36 | Allspring Income Plus Fund
Notes to consolidated financial statements (unaudited)
amount equal to the notional amount of the swap and take delivery of the referenced security or underlying securities comprising the index or pay a net settlement of cash equal to the notional amount of the swap less the recovery value of the security or underlying securities comprising the index.
As the seller of protection, the Fund is subject to investment exposure on the notional amount of the swap and has assumed the risk of default of the underlying security or index. As the buyer of protection, the Fund could be exposed to risks if the seller of the protection defaults on its obligation to perform, or if there are unfavorable changes in the fluctuation of interest rates.
By entering into credit default swap contracts, the Fund is exposed to credit risk. In addition, certain credit default swap contracts entered into by the Fund provide for conditions that result in events of default or termination that enable the counterparty to the agreement to cause an early termination of the transactions under those agreements.
Security transactions and income recognition
Securities transactions are recorded on a trade date basis. Realized gains or losses are recorded on the basis of identified cost.
Interest income is accrued daily and bond discounts are accreted and premiums are amortized daily. To the extent debt obligations are placed on non-accrual status, any related interest income may be reduced by writing off interest receivables when the collection of all or a portion of interest has been determined to be doubtful based on consistently applied procedures and the fair value has decreased. If the issuer subsequently resumes interest payments or when the collectability of interest is reasonably assured, the debt obligation is removed from non-accrual status. Paydown gains and losses are included in interest income.
Dividend income is recognized on the ex-dividend date.
Income is recorded net of foreign taxes withheld where recovery of such taxes is not assured.
Income dividends and capital gain distributions from investment companies are recorded on the ex-dividend date. Capital gain distributions from investment companies are treated as realized gains.
Distributions to shareholders
Distributions to shareholders are recorded on the ex-dividend date and paid from net investment income monthly and any net realized gains are paid at least annually. Such distributions are determined in accordance with income tax regulations and may differ from U.S. generally accepted accounting principles. Dividend sources are estimated at the time of declaration. The tax character of distributions is determined as of the Fund's fiscal year end. Therefore, a portion of the Fund's distributions made prior to the Fund’s fiscal year end may be categorized as a tax return of capital at year end.
Federal and other taxes
The Fund intends to continue to qualify as a regulated investment company by distributing substantially all of its investment company taxable income and any net realized capital gains (after reduction for capital loss carryforwards) sufficient to relieve it from all, or substantially all, federal income taxes. Accordingly, no provision for federal income taxes was required.
The Subsidiary is classified as a controlled foreign corporation under Subchapter N of the Internal Revenue Code. Therefore, the Fund is required to increase its taxable income by its share of the Subsidiary’s income. Net investment losses of the Subsidiary cannot be deducted by the Fund in the current period nor carried forward to offset taxable income in future periods.
The Fund’s income and federal excise tax returns and all financial records supporting those returns for the prior three fiscal years are subject to examination by the federal and Delaware revenue authorities. Management has analyzed the Fund's tax positions taken on federal, state, and foreign tax returns for all open tax years and does not believe that there are any uncertain tax positions that require recognition of a tax liability.
As of March 31, 2022, the aggregate cost of all investments for federal income tax purposes was $172,530,375 and the unrealized gains (losses) consisted of:
| Gross unrealized gains | $ 2,700,040 |
| Gross unrealized losses | (8,847,557) |
| Net unrealized losses | $(6,147,517) |
Allspring Income Plus Fund | 37
Notes to consolidated financial statements (unaudited)
Class allocations
The separate classes of shares offered by the Fund differ principally in applicable sales charges, distribution, shareholder servicing, and administration fees. Class specific expenses are charged directly to that share class. Investment income, common fund-level expenses, and realized and unrealized gains (losses) on investments are allocated daily to each class of shares based on the relative proportion of net assets of each class.
4. FAIR VALUATION MEASUREMENTS
Fair value measurements of investments are determined within a framework that has established a fair value hierarchy based upon the various data inputs utilized in determining the value of the Fund’s investments. The three-level hierarchy gives the highest priority to unadjusted quoted prices in active markets for identical assets or liabilities (Level 1) and the lowest priority to unobservable inputs (Level 3). The Fund’s investments are classified within the fair value hierarchy based on the lowest level of input that is significant to the fair value measurement. The inputs are summarized into three broad levels as follows:
| ■ | Level 1 – quoted prices in active markets for identical securities |
| ■ | Level 2 – other significant observable inputs (including quoted prices for similar securities, interest rates, prepayment speeds, credit risk, etc.) |
| ■ | Level 3 – significant unobservable inputs (including the Fund’s own assumptions in determining the fair value of investments) |
The inputs or methodologies used for valuing investments in securities are not necessarily an indication of the risk associated with investing in those securities.
The following is a summary of the inputs used in valuing the Fund’s assets and liabilities as of March 31, 2022:
| | Quoted prices
(Level 1) | Other significant
observable inputs
(Level 2) | Significant
unobservable inputs
(Level 3) | Total |
| Assets | | | | |
| Investments in: | | | | |
| Asset-backed securities | $ 0 | $ 14,280,175 | $ 0 | $ 14,280,175 |
| Convertible debentures | 0 | 2,430,650 | 0 | 2,430,650 |
| Corporate bonds and notes | 0 | 49,892,305 | 0 | 49,892,305 |
| Foreign corporate bonds and notes | 0 | 15,868,252 | 0 | 15,868,252 |
| Foreign government bonds | 0 | 7,758,499 | 0 | 7,758,499 |
| Investment companies | 3,409,875 | 0 | 0 | 3,409,875 |
| Loans | 0 | 6,781,340 | 941,983 | 7,723,323 |
| Municipal obligations | 0 | 146,686 | 0 | 146,686 |
| Non-agency mortgage-backed securities | 0 | 23,088,167 | 0 | 23,088,167 |
| U.S. Treasury securities | 9,493,056 | 0 | 0 | 9,493,056 |
| Yankee corporate bonds and notes | 0 | 17,056,416 | 0 | 17,056,416 |
| Yankee government bonds | 0 | 3,757,883 | 0 | 3,757,883 |
| Short-term investments | | | | |
| Investment companies | 11,747,699 | 0 | 0 | 11,747,699 |
| | 24,650,630 | 141,060,373 | 941,983 | 166,652,986 |
| Forward foreign currency contracts | 0 | 38,366 | 0 | 38,366 |
| Futures contracts | 773,296 | 0 | 0 | 773,296 |
| Total assets | $25,423,926 | $141,098,739 | $941,983 | $167,464,648 |
| Liabilities | | | | |
| Forward foreign currency contracts | $ 0 | $ 258,085 | $ 0 | $ 258,085 |
| Futures contracts | 655,698 | 0 | 0 | 655,698 |
| Swap contracts | 0 | 260,906 | 0 | 260,906 |
| Total liabilities | $ 655,698 | $ 518,991 | $ 0 | $ 1,174,689 |
Futures contracts, forward foreign currency contracts and swap contracts are reported at their cumulative unrealized gains (losses) at measurement date as reported in the tables following the Consolidated Portfolio of Investments. For futures
38 | Allspring Income Plus Fund
Notes to consolidated financial statements (unaudited)
contracts and centrally cleared swap contracts, the current day’s variation margin is reported on the Consolidated Statement of Assets and Liabilities. All other assets and liabilities are reported at their market value at measurement date.
Additional sector, industry or geographic detail, if any, is included in the Consolidated Portfolio of Investments.
For the six months ended March 31, 2022 the Fund had no material transfers into/out of Level 3.
5. TRANSACTIONS WITH AFFILIATES
Management fee
Allspring Funds Management, a wholly owned subsidiary of Allspring Global Investments Holdings, LLC, a holding company indirectly owned by certain private funds of GTCR LLC and Reverence Capital Partners, L.P., is the manager of the Fund and provides advisory and fund-level administrative services under an investment management agreement. Under the investment management agreement, Allspring Funds Management is responsible for, among other services, implementing the investment objectives and strategies of the Fund, supervising the subadviser and providing fund-level administrative services in connection with the Fund’s operations. As compensation for its services under the investment management agreement, Allspring Funds Management is entitled to receive a management fee at the following annual rate based on the Fund’s average daily net assets:
| Average daily net assets | Management fee |
| First $500 million | 0.525% |
| Next $500 million | 0.500 |
| Next $2 billion | 0.475 |
| Next $2 billion | 0.450 |
| Next $5 billion | 0.415 |
| Over $10 billion | 0.405 |
For the six months ended March 31, 2022, the management fee was equivalent to an annual rate of 0.525% of the Fund’s average daily net assets.
The Subsidiary has entered into a separate advisory contract with Allspring Funds Management to manage the investment and reinvestment of its assets in conformity with its investment objectives and restrictions. Under this agreement, the Subsidiary does not pay Allspring Funds Management a fee for its services.
Allspring Funds Management has retained the services of a subadviser to provide daily portfolio management to the Fund. The fee for subadvisory services is borne by Allspring Funds Management. Allspring Global Investments, LLC ("Allspring Investments"), an affiliate of Allspring Funds Management and a wholly owned subsidiary of Allspring Global Investments Holdings, LLC, is the subadviser to the Fund and is entitled to receive a fee from Allspring Funds Management at an annual rate starting at 0.35% and declining to 0.20% as the average daily net assets of the Fund increase.
Administration fees
Under a class-level administration agreement, Allspring Funds Management provides class-level administrative services to the Fund, which includes paying fees and expenses for services provided by the transfer agent, sub-transfer agents, omnibus account servicers and record-keepers. As compensation for its services under the class-level administration agreement, Allspring Funds Management receives an annual fee which is calculated based on the average daily net assets of each class as follows:
| | Class-level
administration fee |
| Class A | 0.16% |
| Class C | 0.16 |
| Administrator Class | 0.10 |
| Institutional Class | 0.08 |
Allspring Income Plus Fund | 39
Notes to consolidated financial statements (unaudited)
Waivers and/or expense reimbursements
Allspring Funds Management has contractually committed to waive and/or reimburse management and administration fees to the extent necessary to maintain certain net operating expense ratios for the Fund. When each class of the Fund has exceeded its expense cap, Allspring Funds Management will waive fees and/or reimburse expenses from fund-level expenses on a proportionate basis and then from class specific expenses. When only certain classes exceed their expense caps, waivers and/or reimbursements are applied against class specific expenses before fund-level expenses. Allspring Funds Management has contractually committed through January 31, 2023 to waive fees and/or reimburse expenses to the extent necessary to cap expenses. Prior to or after the commitment expiration date, the caps may be increased or the commitment to maintain the caps may be terminated only with the approval of the Board of Trustees. As of March 31, 2022, the contractual expense caps are as follows:
| | Expense ratio caps |
| Class A | 0.90% |
| Class C | 1.65 |
| Administrator Class | 0.75 |
| Institutional Class | 0.60 |
Distribution fee
The Trust has adopted a distribution plan for Class C shares of the Fund pursuant to Rule 12b-1 under the 1940 Act. A distribution fee is charged to Class C shares and paid to Allspring Funds Distributor, LLC ("Allspring Funds Distributor"), the principal underwriter, an affiliate of Allspring Funds Management, at an annual rate of 0.75% of the average daily net assets of Class C shares.
In addition, Allspring Funds Distributor is entitled to receive the front-end sales charge from the purchase of Class A shares and a contingent deferred sales charge on the redemption of certain Class A shares. Allspring Funds Distributor is also entitled to receive the contingent deferred sales charges from redemptions of Class C shares. For the six months ended March 31, 2022, Allspring Funds Distributor received $211 from the sale of Class A shares. No contingent deferred sales charges were incurred by Class A and Class C shares for the six months ended March 31, 2022.
Shareholder servicing fees
The Trust has entered into contracts with one or more shareholder servicing agents, whereby Class A, Class C and Administrator Class of the Fund are charged a fee at an annual rate of 0.25% of the average daily net assets of each respective class. A portion of these total shareholder servicing fees were paid to affiliates, and to certain entities that were affiliates of the Fund until November 1, 2021.
Interfund transactions
The Fund may purchase or sell portfolio investment securities to certain affiliates pursuant to Rule 17a-7 under the 1940 Act and under procedures adopted by the Board of Trustees. The procedures have been designed to ensure that these interfund transactions, which do not incur broker commissions, are effected at current market prices.
6. INVESTMENT PORTFOLIO TRANSACTIONS
Purchases and sales of investments, excluding short-term securities, for the six months ended March 31, 2022 were as follows:
| Purchases at cost | | Sales proceeds |
U.S.
government | Non-U.S.
government | | U.S.
government | Non-U.S.
government |
| $76,168,649 | $40,995,096 | | $98,232,329 | $23,845,357 |
As of March 31, 2022, the Fund had unfunded loan commitments of $716,927.
7. SECURITIES LENDING TRANSACTIONS
The Fund lends its securities through an unaffiliated securities lending agent and receives collateral in the form of cash or securities with a value at least equal to the value of the securities on loan. The value of the loaned securities is determined at the close of each business day and any increases or decreases in the required collateral are exchanged between the Fund and
40 | Allspring Income Plus Fund
Notes to consolidated financial statements (unaudited)
the counterparty on the next business day. Cash collateral received is invested in the Securities Lending Fund which seeks to provide a positive return compared to the daily Federal Funds Open Rate by investing in high-quality, U.S. dollar-denominated short-term money market instruments and is exempt from registration under Section 3(c)(7) of the 1940 Act. Securities Lending Fund is managed by Allspring Funds Management and is subadvised by Allspring Investments. Allspring Funds Management receives an advisory fee starting at 0.05% and declining to 0.01% as the average daily net assets of the Securities Lending Fund increase. All of the fees received by Allspring Funds Management are paid to Allspring Investments for its services as subadviser.
In the event of counterparty default or the failure of a borrower to return a loaned security, the Fund has the right to use the collateral to offset any losses incurred. As of March 31, 2022, the Fund had securities lending transactions with the following counterparties which are subject to offset:
| Counterparty | Value of
securities on
loan | Collateral
received1 | Net amount |
| Bank of America Securities Incorporated | $387,549 | $(387,549) | $0 |
| Barclays Capital Incorporated | 505,949 | (505,949) | 0 |
| BNP Paribas Securities Corporation | 618,774 | (618,774) | 0 |
| Citigroup Global Markets Incorporated | 922,449 | (922,449) | 0 |
| Credit Suisse Securities (USA) LLC | 190,610 | (190,610) | 0 |
| UBS Securities LLC | 188,206 | (188,206) | 0 |
1 Collateral received within this table is limited to the collateral for the net transaction with the counterparty.
8. DERIVATIVE TRANSACTIONS
During the six months ended March 31, 2022, the Fund entered into futures contracts for economic hedging purposes. The Fund also entered into forward foreign currency contracts for economic hedging purposes and entered into swap contracts as a substitute for taking a position in the underlying security or index to potentially enhance the Fund’s total return.
The volume of the Fund's derivative activity during the six months ended March 31, 2022 was as follows:
| Futures contracts | |
| Average notional balance on long futures | $32,653,311 |
| Average notional balance on short futures | 20,665,424 |
| Forward foreign currency contracts | |
| Average contract amounts to buy | $ 4,190,234 |
| Average contract amounts to sell | 27,947,454 |
| Swap contracts | |
| Average notional balance | $33,703,342 |
The Subsidiary's swap transactions may contain provisions for early termination in the event the net assets of the Subsidiary declines below specific levels identified by the counterparty. If these levels are triggered, the counterparty may terminate the transaction and seek payment or request full collateralization of the derivative transactions in net liability positions.
A summary of the location of derivative instruments on the financial statements by primary risk exposure is outlined in the following tables.
Allspring Income Plus Fund | 41
Notes to consolidated financial statements (unaudited)
The fair value of derivative instruments as of March 31, 2022 by primary risk type was as follows for the Fund:
| | Asset derivatives | | Liability derivatives |
| | Consolidated Statement of
Assets and Liabilities location | Fair value | | Consolidated Statement of
Assets and Liabilities location | Fair value |
| Interest rate risk | Unrealized gains on futures contracts | $ 773,296* | | Unrealized losses on futures contracts | $ 655,698* |
| Foreign currency risk | Unrealized gains on forward foreign currency contracts | 38,366 | | Unrealized losses on forward foreign currency contracts | 258,085 |
| Credit risk | Unrealized gains on swaps contracts | 0* | | Unrealized losses on swaps contracts | 260,906* |
| | | $811,662 | | | $1,174,689 |
* Amount represents the cumulative unrealized gains (losses) as reported in the table following the Consolidated Portfolio of Investments. For futures contracts and centrally cleared swap contracts, only the current day's variation margin as of March 31, 2022 is reported separately on the Consolidated Statement of Assets and Liabilities.
The effect of derivative instruments on the Consolidated Statement of Operations for the six months ended March 31, 2022 was as follows:
| | Amount of net realized gains (losses) on derivatives |
| | Forward
foreign
currency
contracts | Futures
contracts | Swap
contracts | Total |
| Interest rate risk | $ 0 | $ (147,823) | $ 0 | $ (147,823) |
| Foreign currency risk | 1,313,151 | 0 | 0 | 1,313,151 |
| Credit risk | 0 | 0 | 144,184 | 144,184 |
| | $1,313,151 | $(147,823) | $144,184 | $1,309,512 |
| | Net change in unrealized gains (losses) on derivatives |
| | Forward
foreign
currency
contracts | Futures
contracts | Swap
contracts | Total |
| Interest rate risk | $ 0 | $ (251,917) | $ 0 | $ (251,917) |
| Foreign currency risk | (653,463) | 0 | 0 | (653,463) |
| Credit risk | 0 | 0 | (298,475) | (298,475) |
| | $(653,463) | $(251,917) | $(298,475) | $(1,203,855) |
For certain types of derivative transactions, the Fund has entered into International Swaps and Derivatives Association, Inc. master agreements (“ISDA Master Agreements”) or similar agreements with approved counterparties. The ISDA Master Agreements or similar agreements may have requirements to deliver/deposit securities or cash to/with an exchange or broker-dealer as collateral and allows the Fund to offset, with each counterparty, certain derivative financial instrument’s assets and/or liabilities with collateral held or pledged. Collateral requirements differ by type of derivative. Collateral or margin requirements are set by the broker or exchange clearinghouse for exchange traded derivatives while collateral terms are contract specific for over-the-counter traded derivatives. Cash collateral that has been pledged to cover obligations of the Fund under ISDA Master Agreements or similar agreements, if any, are reported separately in the Consolidated Statement of Assets and Liabilities. Securities pledged as collateral, if any, are noted in the Consolidated Portfolio of Investments. With respect to balance sheet offsetting, absent an event of default by the counterparty or a termination of the agreement, the reported amounts of financial assets and financial liabilities in the Consolidated Statement of Assets and Liabilities are not offset across transactions between the Fund and the applicable counterparty. A reconciliation of the gross amounts on the Consolidated Statement of Assets and Liabilities to the net amounts by counterparty, including any collateral exposure, for OTC derivatives is as follows:
42 | Allspring Income Plus Fund
Notes to consolidated financial statements (unaudited)
| Counterparty | Gross amounts
of assets in the
Consolidated
Statement of
Assets and
Liabilities | Amounts
subject to
netting
agreements | Collateral
received | Net amount
of assets |
| Citibank National Association | $ 132 | $ (132) | $0 | $0 |
| Morgan Stanley Incorporated | 38,234 | (38,234) | 0 | 0 |
| Counterparty | Gross amounts
of liabilities in the
Consolidated
Statement of
Assets and
Liabilities | Amounts
subject to
netting
agreements | Collateral
pledged | Net amount
of liabilities |
| Citibank National Association | $208,715 | $ (132) | $0 | $208,583 |
| Morgan Stanley Incorporated | 49,370 | (38,234) | 0 | 11,136 |
9. BANK BORROWINGS
The Trust (excluding the money market funds), Allspring Master Trust and Allspring Variable Trust are parties to a $350,000,000 revolving credit agreement whereby the Fund is permitted to use bank borrowings for temporary or emergency purposes, such as to fund shareholder redemption requests. Interest under the credit agreement is charged to the Fund based on a borrowing rate equal to the higher of the Federal Funds rate in effect on that day plus 1.25% or the overnight bank funding rate in effect on that day plus 1.25%. In addition, an annual commitment fee equal to 0.25% of the unused balance is allocated to each participating fund.
For the six months ended March 31, 2022, there were no borrowings by the Fund under the agreement.
10. MARKET RISKS
Russia launched a large-scale invasion of Ukraine on February 24, 2022. As a result of this military action, the United States and many other countries have instituted various economic sanctions against Russian and Belarus individuals and entities. The situation has led to increased financial market volatility and could have severe adverse effects on regional and global economic markets, including the markets for certain securities and commodities, such as oil and natural gas. The extent and duration of the military action, resulting sanctions imposed, other punitive action taken and the resulting market disruptions cannot be easily predicted. As of March 31, 2022, the Fund held less than 0.01% of its total net assets in Russian securities.
11. INDEMNIFICATION
Under the Fund's organizational documents, the officers and Trustees have been granted certain indemnification rights against certain liabilities that may arise out of performance of their duties to the Fund. The Fund has entered into a separate agreement with each Trustee that converts indemnification rights currently existing under the Fund’s organizational documents into contractual rights that cannot be changed in the future without the consent of the Trustee. Additionally, in the normal course of business, the Fund may enter into contracts with service providers that contain a variety of indemnification clauses. The Fund’s maximum exposure under these arrangements is dependent on future claims that may be made against the Fund and, therefore, cannot be estimated.
12. CORONAVIRUS (COVID-19) PANDEMIC
On March 11, 2020, the World Health Organization announced that it had made the assessment that coronavirus disease 2019 (“COVID-19”) is a pandemic. The impacts of COVID-19 are affecting the entire global economy, individual companies and investment products, the funds, and the market in general. There is significant uncertainty around the extent and duration of business disruptions related to COVID-19 and the impacts may last for an extended period of time. COVID-19 has led to significant uncertainty and volatility in the financial markets.
Allspring Income Plus Fund | 43
Other information (unaudited)
PROXY VOTING INFORMATION
A description of the policies and procedures used to determine how to vote proxies relating to portfolio securities is available without charge, upon request, by calling 1-800-222-8222, visiting our website at allspringglobal.com, or visiting the SEC website at sec.gov. Information regarding how the proxies related to portfolio securities were voted during the most recent 12-month period ended June 30 is available on the website at allspringglobal.com or by visiting the SEC website at sec.gov.
QUARTERLY PORTFOLIO HOLDINGS INFORMATION
The Fund files its complete schedule of portfolio holdings with the SEC for the first and third quarters of each fiscal year as an exhibit to its reports on Form N-PORT. Shareholders may view the filed Form N-PORT by visiting the SEC website at sec.gov.
44 | Allspring Income Plus Fund
Other information (unaudited)
BOARD OF TRUSTEES AND OFFICERS
Each of the Trustees and Officers listed in the table below acts in identical capacities for each fund in the Allspring family of funds, which consists of 138 mutual funds comprising the Allspring Funds Trust, Allspring Variable Trust, Allspring Master Trust and four closed-end funds (collectively the “Fund Complex”). This table should be read in conjunction with the Prospectus and the Statement of Additional Information1. The mailing address of each Trustee and Officer is 525 Market Street, 12th Floor, San Francisco, CA 94105. Each Trustee and Officer serves an indefinite term, however, each Trustee serves such term until reaching the mandatory retirement age established by the Trustees.
Independent Trustees
Name and
year of birth | Position held and
length of service* | Principal occupations during past five years or longer | Current other
public company or
investment
company
directorships |
William R. Ebsworth
(Born 1957) | Trustee,
since 2015 | Retired. From 1984 to 2013, equities analyst, portfolio manager, research director and chief investment officer at Fidelity Management and Research Company in Boston, Tokyo, and Hong Kong, and retired in 2013 as Chief Investment Officer of Fidelity Strategic Advisers, Inc. where he led a team of investment professionals managing client assets. Prior thereto, Board member of Hong Kong Securities Clearing Co., Hong Kong Options Clearing Corp., the Thailand International Fund, Ltd., Fidelity Investments Life Insurance Company, and Empire Fidelity Investments Life Insurance Company. Audit Committee Chair and Investment Committee Chair of the Vincent Memorial Hospital Endowment (non-profit organization). Mr. Ebsworth is a CFA® charterholder. | N/A |
Jane A. Freeman
(Born 1953) | Trustee,
since 2015;
Chair Liaison,
since 2018 | Retired. From 2012 to 2014 and 1999 to 2008, Chief Financial Officer of Scientific Learning Corporation. From 2008 to 2012, Ms. Freeman provided consulting services related to strategic business projects. Prior to 1999, Portfolio Manager at Rockefeller & Co. and Scudder, Stevens & Clark. Board member of the Harding Loevner Funds from 1996 to 2014, serving as both Lead Independent Director and chair of the Audit Committee. Board member of the Russell Exchange Traded Funds Trust from 2011 to 2012 and the chair of the Audit Committee. Ms. Freeman is also an inactive Chartered Financial Analyst. | N/A |
Isaiah Harris, Jr.
(Born 1952) | Trustee,
since 2009; Audit
Committee
Chair,
since 2019 | Retired. Chairman of the Board of CIGNA Corporation from 2009 to 2021, and Director from 2005 to 2008. From 2003 to 2011, Director of Deluxe Corporation. Prior thereto, President and CEO of BellSouth Advertising and Publishing Corp. from 2005 to 2007, President and CEO of BellSouth Enterprises from 2004 to 2005 and President of BellSouth Consumer Services from 2000 to 2003. Emeritus member of the Iowa State University Foundation Board of Governors. Emeritus Member of the Advisory Board of Iowa State University School of Business. Advisory Board Member, Palm Harbor Academy (private school). Advisory Board Member, Fellowship of Christian Athletes. Mr. Harris is a certified public accountant (inactive status). | N/A |
David F. Larcker
(Born 1950) | Trustee,
since 2009 | James Irvin Miller Professor of Accounting at the Graduate School of Business (Emeritus), Stanford University, Director of the Corporate Governance Research Initiative and Senior Faculty of The Rock Center for Corporate Governance since 2006. From 2005 to 2008, Professor of Accounting at the Graduate School of Business, Stanford University. Prior thereto, Ernst & Young Professor of Accounting at The Wharton School, University of Pennsylvania from 1985 to 2005. | N/A |
Allspring Income Plus Fund | 45
Other information (unaudited)
Name and
year of birth | Position held and
length of service* | Principal occupations during past five years or longer | Current other
public company or
investment
company
directorships |
Olivia S. Mitchell
(Born 1953) | Trustee,
since 2006;
Nominating and
Governance
Committee Chair,
since 2018 | International Foundation of Employee Benefit Plans Professor since 1993, Wharton School of the University of Pennsylvania. Director of Wharton’s Pension Research Council and Boettner Center on Pensions & Retirement Research, and Research Associate at the National Bureau of Economic Research. Previously taught at Cornell University from 1978 to 1993. | N/A |
Timothy J. Penny
(Born 1951) | Trustee,
since 1996;
Chair,
since 2018 | President and Chief Executive Officer of Southern Minnesota Initiative Foundation, a non-profit organization, since 2007. Member of the Board of Trustees of NorthStar Education Finance, Inc., a non-profit organization, since 2007. | N/A |
James G. Polisson
(Born 1959) | Trustee,
since 2018 | Retired. Chief Marketing Officer, Source (ETF) UK Services, Ltd, from 2015 to 2017. From 2012 to 2015, Principal of The Polisson Group, LLC, a management consulting, corporate advisory and principal investing company. Chief Executive Officer and Managing Director at Russell Investments, Global Exchange Traded Funds from 2010 to 2012. Managing Director of Barclays Global Investors from 1998 to 2010 and Global Chief Marketing Officer for iShares and Barclays Global Investors from 2000 to 2010. Trustee of the San Francisco Mechanics’ Institute, a non-profit organization, from 2013 to 2015. Board member of the Russell Exchange Traded Fund Trust from 2011 to 2012. Director of Barclays Global Investors Holdings Deutschland GmbH from 2006 to 2009. Mr. Polisson is an attorney and has a retired status with the Massachusetts and District of Columbia Bar Associations. | N/A |
Pamela Wheelock
(Born 1959) | Trustee,
since January
2020; previously
Trustee from
January 2018 to
July 2019 | Board member of the Destination Medical Center Economic Development Agency, Rochester, Minnesota since 2019. Interim President of the McKnight Foundation from January to September 2020. McKnight Foundation Consultant, November 2020 to February 2021. Acting Commissioner, Minnesota Department of Human Services, July 2019 through September 2019. Consultant (part-time), Minnesota Department of Human Services, October 2019 through December 2019. Chief Operating Officer, Twin Cities Habitat for Humanity from 2017 to 2019. Vice President of University Services, University of Minnesota from 2012 to 2016. Prior thereto, on the Board of Directors, Governance Committee and Finance Committee for the Minnesota Philanthropy Partners (Saint Paul Foundation) from 2012 to 2018, Interim Chief Executive Officer of Blue Cross Blue Shield of Minnesota from 2011 to 2012, Chairman of the Board from 2009 to 2012 and Board Director from 2003 to 2015. Vice President, Leadership and Community Engagement, Bush Foundation, Saint Paul, Minnesota (a private foundation) from 2009 to 2011. Executive Vice President and Chief Financial Officer, Minnesota Sports and Entertainment from 2004 to 2009 and Senior Vice President from 2002 to 2004. Executive Vice President of the Minnesota Wild Foundation from 2004 to 2008. Commissioner of Finance, State of Minnesota, from 1999 to 2002. Currently Board Chair of the Minnesota Wild Foundation since 2010. | N/A |
* Length of service dates reflect the Trustee’s commencement of service with the Trust’s predecessor entities, where applicable.
46 | Allspring Income Plus Fund
Other information (unaudited)
Officers2
Name and
year of birth | Position held and
length of service | Principal occupations during past five years or longer |
Andrew Owen
(Born 1960) | President,
since 2017 | President, Chief Executive Officer and Director of Allspring Funds Management, LLC since 2017 and co-president of Galliard Capital Management, LLC, an affiliate of Allspring Funds Management, LLC, since 2019. Prior thereto, Head of Affiliated Managers, Allspring Global Investments, from 2014 to 2019 and Executive Vice President responsible for marketing, investments and product development for Allspring Funds Management, LLC, from 2009 to 2014. In addition, Mr. Owen was an Executive Vice President of Wells Fargo & Company from 2014 to 2021. |
Jeremy DePalma
(Born 1974) | Treasurer,
since 2012
(for certain funds in
the Fund Complex);
since 2021 (for
the remaining funds in the
Fund Complex) | Senior Vice President of Allspring Funds Management, LLC since 2009. Senior Vice President of Evergreen Investment Management Company, LLC from 2008 to 2010 and head of the Fund Reporting and Control Team within Fund Administration from 2005 to 2010. |
Kate McKinley
(Born 1977) | Chief Legal Officer,
since 2021 | Chief Legal Officer of Allspring Global Investments since 2021. Prior thereto, held various roles at State Street Global Advisors beginning in 2010, including serving as Senior Vice President and General Counsel from 2019 to 2021, and Chief Operating Officer of the Institutional Client Group from 2016 - 2019. Prior to working at State Street Global Advisors served as Assistant General Counsel for Bank of America Corporation from 2005 to 2010 and as an Associate at WilmerHale from 2002 to 2005. |
Christopher Baker
(Born 1976) | Chief Compliance Officer, since 2022 | Global Chief Compliance Officer for Allspring Global Investments since 2022. Prior thereto, Chief Compliance Officer for State Street Global Advisors from 2018 to 2021. Senior Compliance Officer for the State Street divisions of Alternative Investment Solutions, Sector Solutions, and Global Marketing from 2015 to 2018. From 2010 to 2015 Vice President, Global Head of Investment and Marketing Compliance for State Street Global Advisors. |
Matthew Prasse
(Born 1983) | Secretary,
since 2021 | Senior Counsel of the Allspring Legal Department since 2021. Senior Counsel of the Wells Fargo Legal Department from 2018 to 2021. Previously, Counsel for Barings LLC from 2015 to 2018. Prior to joining Barings, Associate at Morgan, Lewis & Bockius LLP from 2008 to 2015. |
1 The Statement of Additional Information includes additional information about the Trustees and is available, without charge, upon request, by calling 1-800-222-8222 or by visiting the website at allspringglobal.com.
2 For those Officers with tenures at Allspring Global Investments and/or Allspring Funds Management, LLC that began prior to 2021, such tenures include years of service during which these businesses/entities were known as Wells Fargo Asset Management and Wells Fargo Funds Management, LLC, respectively.
Allspring Income Plus Fund | 47
For more information
More information about Allspring Funds is available free upon request. To obtain literature, please write, visit the Fund's website, or call:
Allspring Funds
P.O. Box 219967
Kansas City, MO 64121-9967
Website: allspringglobal.com
Individual investors: 1-800-222-8222
Retail investment professionals: 1-888-877-9275
Institutional investment professionals: 1-800-260-5969
This report and the financial statements contained herein are submitted for the general information of the shareholders of the Fund. If this report is used for promotional purposes, distribution of the report must be accompanied or preceded by a current prospectus. Before investing, please consider the investment objectives, risks, charges, and expenses of the investment. For a current prospectus and, if available, a summary prospectus, containing this information, call
1-800-222-8222 or visit the Fund's website at allspringglobal.com. Read the prospectus carefully before you invest or send money.
Allspring Global InvestmentsTM is the trade name for the asset management firms of Allspring Global Investments Holdings, LLC, a holding company indirectly owned by certain private funds of GTCR LLC and Reverence Capital Partners, L.P. These firms include but are not limited to Allspring Global Investments, LLC, and Allspring Funds Management, LLC. Certain products managed by Allspring entities are distributed by Allspring Funds Distributor, LLC (a broker-dealer and Member FINRA/SIPC).
This material is for general informational and educational purposes only and is NOT intended to provide investment advice or a recommendation of any kind - including a recommendation for any specific investment, strategy, or plan.
© 2022 Allspring Global Investments Holdings, LLC. All rights reserved.
PAR-0522-00048 05-22
SA263/SAR263 03-22
Semi-Annual Report
March 31, 2022
Allspring International Bond Fund
The views expressed and any forward-looking statements are as of March 31, 2022, unless otherwise noted, and are those of the Fund's portfolio managers and/or Allspring Global Investments. Discussions of individual securities or the markets generally are not intended as individual recommendations. Future events or results may vary significantly from those expressed in any forward-looking statements. The views expressed are subject to change at any time in response to changing circumstances in the market. Allspring Global Investments disclaims any obligation to publicly update or revise any views expressed or forward-looking statements.
Allspring International Bond Fund | 1
Letter to shareholders (unaudited)
Andrew Owen
President
Allspring Funds
Dear Shareholder:
We are pleased to offer you this semi-annual report for Allspring International Bond Fund for the six-month period that ended March 31, 2022. Global stocks and bonds broadly declined during a challenging period. Despite progress on a global economic recovery from COVID-19, persistently high inflation, concerns regarding anticipated tightening of central bank monetary policy, and turmoil caused by the Russian invasion of Ukraine all led to a retreat from financial market gains made earlier in 2021. Among major indexes, the U.S. large-cap-dominated S&P 500 Index was an exception in escaping a half-year loss.
For the six-month period, U.S. stocks, based on the S&P 500 Index,1 gained 5.92%. International stocks, as measured by the MSCI ACWI ex USA Index (Net),2 returned -3.72%, while the MSCI EM Index (Net) (USD),3 trailed both developed market benchmarks with a return of -8.20%. The Bloomberg U.S. Aggregate Bond Index,4returned -5.92%, the Bloomberg Global Aggregate ex-USD Index (unhedged),5 returned -7.26%, the Bloomberg Municipal Bond Index6 returned -5.55%, and the ICE BofA U.S. High Yield Index,7 lost 3.89%.
Inflationary concerns and the Russian-Ukraine war caused markets to retreat.
Elevated inflation pressures and the ongoing global supply bottleneck continued in October, but strong corporate earnings provided a bright spot in the U.S., the eurozone, and many Asian countries. Government bond yields rose globally as central banks prepared to tighten monetary policy. Commodity prices continued to rise, driven by sharply higher energy costs.
In November, as COVID-19 hospitalizations rose, most major global asset classes declined. Two exceptions were U.S. investment-grade bonds and Treasury Inflation-Protected Securities. President Biden signed a long-awaited $550 billion infrastructure bill to upgrade U.S. roads, bridges, and railways. Meanwhile, the Consumer Price Index8, a measure of domestic inflation conditions, jumped to its highest level in 31 years. While the threat of consistently high inflation led the U.S. Federal Reserve (Fed) to discuss a faster pace of tapering, the Omicron strain created uncertainty. Commodities lost ground for the month, driven by sharp declines in oil prices (and energy costs in general) as well as precious metals.
“Elevated inflation pressures and the ongoing global supply bottleneck continued in October, but strong corporate earnings provided a bright spot in the U.S., the eurozone, and many Asian countries.”
| 1 | The S&P 500 Index consists of 500 stocks chosen for market size, liquidity, and industry group representation. It is a market-value-weighted index with each stock's weight in the index proportionate to its market value. You cannot invest directly in an index. |
| 2 | The Morgan Stanley Capital International (MSCI) All Country World Index (ACWI) ex USA Index (Net) is a free-float-adjusted market-capitalization-weighted index that is designed to measure the equity market performance of developed and emerging markets, excluding the U.S. Source: MSCI. MSCI makes no express or implied warranties or representations and shall have no liability whatsoever with respect to any MSCI data contained herein. The MSCI data may not be further redistributed or used as a basis for other indexes or any securities or financial products. This report is not approved, reviewed, or produced by MSCI. You cannot invest directly in an index. |
| 3 | The MSCI Emerging Markets (EM) Index (Net) (USD) is a free-float-adjusted market-capitalization-weighted index that is designed to measure equity market performance of emerging markets. You cannot invest directly in an index. |
| 4 | The Bloomberg U.S. Aggregate Bond Index is a broad-based benchmark that measures the investment-grade, U.S.-dollar-denominated, fixed-rate taxable bond market, including Treasuries, government-related and corporate securities, mortgage-backed securities (agency fixed-rate and hybrid adjustable-rate mortgage pass-throughs), asset-backed securities, and commercial mortgage-backed securities. You cannot invest directly in an index. |
| 5 | The Bloomberg Global Aggregate ex-USD Index (unhedged) is an unmanaged index that provides a broad-based measure of the global investment-grade fixed-income markets excluding the U.S.-dollar-denominated debt market. You cannot invest directly in an index. |
| 6 | The Bloomberg Municipal Bond Index is an unmanaged index composed of long-term tax-exempt bonds with a minimum credit rating of Baa. You cannot invest directly in an index. |
| 7 | The ICE BofA U.S. High Yield Index is a market-capitalization-weighted index of domestic and Yankee high-yield bonds. The index tracks the performance of high-yield securities traded in the U.S. bond market. You cannot invest directly in an index. Copyright 2022. ICE Data Indices, LLC. All rights reserved. |
| 8 | The Consumer Price Index (CPI) is a measure of the average change over time in the prices paid by urban consumers for a market basket of consumer goods and services. You cannot invest directly in an index. |
2 | Allspring International Bond Fund
Letter to shareholders (unaudited)
Global volatility lessened in December as data indicated a lower risk of severe disease and death from the Omicron variant. Even so, several countries introduced restrictions on travel and hospitality, among other sectors, in an effort to reduce the spread. In the U.S., data indicated a stable economy overall, with robust corporate earnings. Consumer spending potential looked strong heading into 2022 on elevated household savings and the lowest household debt ratio since 1973. U.S. corporate and high-yield bonds had monthly gains while Treasuries declined. Bonds were strongly affected by the projection of three 25-basis-point (bp; 100 bps equal 1.00%) policy rate hikes in 2022 by senior Federal Open Market Committee members, up from previous projections of just one hike.
In January 2022, the main focus was on potential U.S. interest rate hikes and the Russia-Ukraine conflict. The Fed hinted that a March interest rate hike was likely. Meanwhile, Russia threatened a potential invasion of Ukraine, which could disrupt Russia’s massive energy supplies and drive demand from non-Russian oil-producing countries. Elsewhere overseas, Europe saw food and energy prices spike, leading to rising inflation. Within fixed income, corporate bonds struggled in January, underperforming government bonds, as investors focused on continued elevated inflation and ongoing uncertainty over the U.S. monetary path.
The Russian invasion of Ukraine dominated the financial world in February and March. Equity, bond, and commodities markets were shaken by fear, uncertainty, and an upending of demand-supply dynamics. Major global stock indexes were down in February, along with global bonds overall, with ongoing high levels of volatility in March along with mixed results that favored U.S. large-cap stocks. Prices of commodities spiked, including crude oil, natural gas, wheat, and precious metals, on elevated concerns of supply shortages. All of this fed already-high inflation concerns and added to expectations of more aggressive central bank interest rate hikes. Sweeping sanctions against Russia and corporate pullouts contributed to market volatility. Despite the geopolitical turmoil, the U.S. economic outlook remained largely unchanged, with a healthy job market and signs of economic resilience accompanying higher prices.
Don’t let short-term uncertainty derail long-term investment goals.
Periods of investment uncertainty can present challenges, but experience has taught us that maintaining long-term investment goals can be an effective way to plan for the future. To help you create a sound strategy based on your personal goals and risk tolerance, Allspring Funds offers more than 100 mutual funds spanning a wide range of asset classes and investment styles. Although diversification cannot guarantee an investment profit or prevent losses, we believe it can be an effective way to manage investment risk and potentially smooth out overall portfolio performance. We encourage investors to know their investments and to understand that appropriate levels of risk-taking may unlock opportunities.
Information on transaction closing.
On November 1, 2021, GTCR LLC and Reverence Capital Partners, L.P. announced the beginning of Allspring Global Investments™ with the close of the transaction to acquire Wells Fargo Funds Management, LLC; Wells Capital Management LLC; Galliard Capital Management LLC.; Wells Fargo Asset Management (International) Ltd.; Wells Fargo Asset Management Luxembourg S.A.; and Wells Fargo Funds Distributor, LLC, as well as Wells Fargo Bank, N.A.’s business of acting as trustee to its collective investment trusts and all related Wells Fargo Asset Management legal entities. The transaction closed on November 1, 2021, forming Allspring Global Investments, a privately held asset management firm with $451 billion in AUM1 as of March 31, 2022.
“ The Russian invasion of Ukraine dominated the financial world in February and March. Equity, bond, and commodities markets were shaken by fear, uncertainty, and an upending of demand-supply dynamics.”
| 1 | Figures are as of March 31, 2022, unless otherwise noted. Please note that the assets under management figures provided have been adjusted to eliminate any duplication of reporting among assets directed by multiple investment teams and includes $91.2B from Galliard Capital Management ($74.7B stable value; $16.5B fixed income), an investment advisor that is not part of the Allspring trade name/GIPS firm. |
Allspring International Bond Fund | 3
Letter to shareholders (unaudited)
For further information about your Fund, contact your investment professional, visit our website at allspringglobal.com, or call us directly at 1-800-222-8222. |
Allspring Global Investments™ is a leading independent asset management firm with a full breadth of investment capabilities across diverse asset classes, serving the needs of its institutional and wealth management clients around the world. Allspring operates across 18 offices globally supported by more than 480 investment professionals. Allspring and its investment teams provide a broad range of differentiated investment products and solutions to help its diverse range of clients meet their investment objectives.
As part of this transition, all mutual funds within the Wells Fargo Funds family were rebranded as Allspring Funds. Each individual fund had “Wells Fargo” removed from its fund name and replaced with “Allspring.” The fund name changes went into effect on December 6, 2021.
Allspring Global Investments™ is the trade name for the asset management firm of Allspring Global Investments Holdings, LLC, a holding company indirectly owned by certain private funds of GTCR LLC and Reverence Capital Partners, L.P.
Thank you for choosing to invest with Allspring Funds. We appreciate your confidence in us and remain committed to helping you meet your financial needs.
Sincerely,
Andrew Owen
President
Allspring Funds
Notice to Shareholders
Russia launched a large-scale invasion of Ukraine on February 24, 2022. As a result of this military action, the United States and many other countries have instituted various economic sanctions against Russian and Belarus individuals and entities. The situation has led to increased financial market volatility and could have severe adverse effects on regional and global economic markets, including the markets for certain securities and commodities, such as oil and natural gas. The extent and duration of the military action, resulting sanctions imposed, other punitive action taken and the resulting market disruptions cannot be easily predicted.
Our solidarity and support goes out to our impacted employees and the people affected in Ukraine and their families. Allspring has a dedicated team of investment professionals actively monitoring the situation for any new developments and the potential impact to our clients and investment products. As the situation remains fluid, we are focused on the assessment of risks, valuation, and liquidity of impacted securities. Please visit our website at allspringglobal.com and click on “Russia-Ukraine Portfolio Impacts” for further information.
4 | Allspring International Bond Fund
This page is intentionally left blank.
Performance highlights (unaudited)
| Investment objective | The Fund seeks total return, consisting of income and capital appreciation. |
| Manager | Allspring Funds Management, LLC |
| Subadviser | Allspring Global Investments (UK) Limited |
| Portfolio managers | Michael Lee, Henrietta Pacquement, CFA®‡†, Alex Perrin, Lauren van Biljon, CFA®‡ |
| Average annual total returns (%) as of March 31, 2022 |
| | | Including sales charge | | Excluding sales charge | | Expense ratios1 (%) |
| | Inception date | 1 year | 5 year | 10 year | | 1 year | 5 year | 10 year | | Gross | Net 2 |
| Class A (ESIYX) | 9-30-2003 | -16.62 | -0.96 | -1.06 | | -12.71 | -0.04 | -0.60 | | 1.22 | 1.03 |
| Class C (ESIVX) | 9-30-2003 | -14.39 | -0.69 | -1.30 | | -13.39 | -0.69 | -1.30 | | 1.97 | 1.78 |
| Class R6 (ESIRX)3 | 11-30-2012 | – | – | – | | -12.35 | 0.33 | -0.22 | | 0.84 | 0.65 |
| Administrator Class (ESIDX) | 7-30-2010 | – | – | – | | -12.55 | 0.15 | -0.42 | | 1.16 | 0.85 |
| Institutional Class (ESICX) | 12-15-1993 | – | – | – | | -12.37 | 0.30 | -0.27 | | 0.89 | 0.70 |
| Bloomberg Global Aggregate ex-USD Index4 | – | – | – | – | | -7.89 | 1.27 | 0.06 | | – | – |
Figures quoted represent past performance, which is no guarantee of future results, and do not reflect taxes that a shareholder may pay on an investment in a fund. Investment return and principal value of an investment will fluctuate so that an investor’s shares, when redeemed, may be worth more or less than their original cost. Performance shown without sales charges would be lower if sales charges were reflected. Current performance may be lower or higher than the performance data quoted, which assumes the reinvestment of dividends and capital gains. Current month-end performance is available on the Fund’s website, allspringglobal.com.
Index returns do not include transaction costs associated with buying and selling securities, any mutual fund fees or expenses, or any taxes. It is not possible to invest directly in an index.
For Class A shares, the maximum front-end sales charge is 4.50%. For Class C shares, the maximum contingent deferred sales charge is 1.00%. Performance including a contingent deferred sales charge assumes the sales charge for the corresponding time period. Class R6, Administrator Class and Institutional Class shares are sold without a front-end sales charge or contingent deferred sales charge.
| 1 | Reflects the expense ratios as stated in the most recent prospectuses. The expense ratios shown are subject to change and may differ from the annualized expense ratios shown in the financial highlights of this report. |
| 2 | The manager has contractually committed through January 31, 2023, to waive fees and/or reimburse expenses to the extent necessary to cap total annual fund operating expenses after fee waivers at 1.03% for Class A, 1.78% for Class C, 0.65% for Class R6, 0.85% for Administrator Class, and 0.70% for Institutional Class. Brokerage commissions, stamp duty fees, interest, taxes, acquired fund fees and expenses (if any), and extraordinary expenses are excluded from the expense caps. Prior to or after the commitment expiration date, the caps may be increased or the commitment to maintain the caps may be terminated only with the approval of the Board of Trustees. Without these caps, the Fund’s returns would have been lower. The expense ratio paid by an investor is the net expense ratio (the total annual fund operating expenses after fee waivers) as stated in the prospectuses. |
| 3 | Historical performance shown for the Class R6 shares prior to their inception reflects the performance of the Institutional Class shares, and includes the higher expenses applicable to the Institutional Class shares. If these expenses had not been included, returns for the Class R6 shares would be higher. |
| 4 | The Bloomberg Global Aggregate ex-USD Index is an unmanaged index that provides a broad-based measure of the global investment grade fixed income markets excluding the U.S. dollar denominated debt market. You cannot invest directly in an index. |
Bond values fluctuate in response to the financial condition of individual issuers, general market and economic conditions, and changes in interest rates. Changes in market conditions and government policies may lead to periods of heightened volatility in the bond market and reduced liquidity for certain bonds held by the Fund. In general, when interest rates rise, bond values fall and investors may lose principal value. Interest rate changes and their impact on the Fund and its share price can be sudden and unpredictable. Foreign investments are especially volatile and can rise or fall dramatically due to differences in the political and economic conditions of the host country. These risks are generally intensified in emerging markets. The use of derivatives may reduce returns and/or increase volatility. Securities issued by U.S. government agencies or government-sponsored entities may not be guaranteed by the U.S. Treasury. Certain investment strategies tend to increase the total risk of an investment (relative to the broader market). This fund is exposed to high-yield securities risk and geographic risk. Consult the Fund’s prospectus for additional information on these and other risks.
| ‡ | CFA® and Chartered Financial Analyst® are trademarks owned by CFA Institute. |
| † | Ms. Pacquement became a portfolio manager of the Fund on February 22, 2022. |
6 | Allspring International Bond Fund
Performance highlights (unaudited)
| Ten largest holdings (%) as of March 31, 20221 |
| China Government Bond, 3.03%, 3-11-2026 | 8.54 |
| Canada, 1.90%, 3-15-2031 | 4.72 |
| Network Rail Infrastructure Finance plc, 4.75%, 11-29-2035 | 4.54 |
| China Government Bond, 3.02%, 5-27-2031 | 4.34 |
| Spain Bonos y Obligaciones del Estado, 1.25%, 10-31-2030 | 3.56 |
| Italy Buoni Poliennali del Tesoro, 0.60%, 8-1-2031 | 3.43 |
| Japan Bonds, 0.10%, 12-20-2031 | 3.01 |
| Czech Republic Bonds , 1.75%, 6-23-2032 | 2.88 |
| Australian Government , 2.75%, 11-21-2028 | 2.64 |
| France, 0.00%, 11-25-2031 | 2.59 |
| 1 | Figures represent the percentage of the Fund's net assets. Holdings are subject to change and may have changed since the date specified. |
| Portfolio allocation as of March 31, 20221 |
| 1 | Figures represent the percentage of the Fund's long-term investments. These amounts are subject to change and may have changed since the date specified. |
| Effective maturity distribution as of March 31, 20221 |
| 1 | Figures represent the percentage of the Fund's long-term investments. These amounts are subject to change and may have changed since the date specified. |
Allspring International Bond Fund | 7
Fund expenses (unaudited)
As a shareholder of the Fund, you incur two types of costs: (1) transaction costs, including sales charges (loads) on purchase payments and contingent deferred sales charges (if any) on redemptions and (2) ongoing costs, including management fees, distribution (12b-1) and/or shareholder servicing fees, and other Fund expenses. This example is intended to help you understand your ongoing costs (in dollars) of investing in the Fund and to compare these costs with the ongoing costs of investing in other mutual funds.
The example is based on an investment of $1,000 invested at the beginning of the six-month period and held for the entire period from October 1, 2021 to March 31, 2022.
Actual expenses
The “Actual” line of the table below provides information about actual account values and actual expenses. You may use the information in this line, together with the amount you invested, to estimate the expenses that you paid over the period. Simply divide your account value by $1,000 (for example, an $8,600 account value divided by $1,000 = 8.6), then multiply the result by the number in the “Actual” line under the heading entitled “Expenses paid during period” for your applicable class of shares to estimate the expenses you paid on your account during this period.
Hypothetical example for comparison purposes
The “Hypothetical” line of the table below provides information about hypothetical account values and hypothetical expenses based on the Fund’s actual expense ratio and an assumed rate of return of 5% per year before expenses, which is not the Fund’s actual return. The hypothetical account values and expenses may not be used to estimate the actual ending account balance or expenses you paid for the period. You may use this information to compare the ongoing costs of investing in the Fund and other funds. To do so, compare this 5% hypothetical example with the 5% hypothetical examples that appear in the shareholder reports of the other funds.
Please note that the expenses shown in the table are meant to highlight your ongoing costs only and do not reflect any transactional costs, such as sales charges (loads) and contingent deferred sales charges. Therefore, the “Hypothetical” line of the table is useful in comparing ongoing costs only, and will not help you determine the relative total costs of owning different funds. In addition, if these transactional costs were included, your costs would have been higher.
| | Beginning
account value
10-1-2021 | Ending
account value
3-31-2022 | Expenses
paid during
the period1 | Annualized net
expense ratio |
| Class A | | | | |
| Actual | $1,000.00 | $ 885.24 | $4.84 | 1.03% |
| Hypothetical (5% return before expenses) | $1,000.00 | $1,019.80 | $5.19 | 1.03% |
| Class C | | | | |
| Actual | $1,000.00 | $ 882.01 | $8.35 | 1.78% |
| Hypothetical (5% return before expenses) | $1,000.00 | $1,016.06 | $8.95 | 1.78% |
| Class R6 | | | | |
| Actual | $1,000.00 | $ 886.71 | $3.06 | 0.65% |
| Hypothetical (5% return before expenses) | $1,000.00 | $1,021.69 | $3.28 | 0.65% |
| Administrator Class | | | | |
| Actual | $1,000.00 | $ 885.93 | $4.00 | 0.85% |
| Hypothetical (5% return before expenses) | $1,000.00 | $1,020.69 | $4.28 | 0.85% |
| Institutional Class | | | | |
| Actual | $1,000.00 | $ 886.94 | $3.29 | 0.70% |
| Hypothetical (5% return before expenses) | $1,000.00 | $1,021.44 | $3.53 | 0.70% |
1 Expenses paid is equal to the annualized net expense ratio of each class multiplied by the average account value over the period, multiplied by 182 divided by 365 (to reflect the one-half-year period).
8 | Allspring International Bond Fund
Portfolio of investments—March 31, 2022 (unaudited)
| | | Interest
rate | Maturity
date | | Principal | Value |
| Corporate bonds and notes: 4.10% | | | | | | |
| United States: 4.10% | | | | | | |
| American Tower Corporation (Real estate, Equity REITs) | | 3.80% | 8-15-2029 | $ | 300,000 | $ 298,540 |
| Amgen Incorporated (Health care, Biotechnology) | | 3.00 | 2-22-2029 | | 250,000 | 245,417 |
| Anthem Incorporated (Health care, Health care providers & services) | | 2.55 | 3-15-2031 | | 325,000 | 303,592 |
| Bank of America Corporation (3 Month LIBOR +1.21%) (Financials, Banks) ± | | 3.97 | 2-7-2030 | | 300,000 | 304,842 |
| Berry Global Incorporated (Materials, Containers & packaging) | | 1.02 | 1-15-2025 | | 275,000 | 293,227 |
| BP Capital Markets America Incorporated (Energy, Oil, gas & consumable fuels) | | 1.75 | 8-10-2030 | | 400,000 | 353,768 |
| Broadcom Incorporated (Information technology, Semiconductors & semiconductor equipment) 144A | | 4.15 | 4-15-2032 | | 150,000 | 149,672 |
| Citigroup Incorporated (Financials, Banks) | | 3.20 | 10-21-2026 | | 150,000 | 148,817 |
| General Motors Financial Company Incorporated (Financials, Consumer finance) | | 3.10 | 1-12-2032 | | 500,000 | 449,408 |
| GSK Consumer Healthcare Company (Health care, Health care providers & services) 144A | | 3.63 | 3-24-2032 | | 500,000 | 499,530 |
| IQVIA Incorporated (Health care, Health care providers & services) | | 2.88 | 6-15-2028 | | 225,000 | 239,572 |
| Lowe's Companies Incorporated (Consumer discretionary, Specialty retail) | | 3.75 | 4-1-2032 | | 250,000 | 252,750 |
| Magallanes Incorporated (Communication services, Media) 144A | | 4.28 | 3-15-2032 | | 350,000 | 351,557 |
| Motorola Solutions Incorporated (Information technology, Communications equipment) | | 2.75 | 5-24-2031 | | 500,000 | 452,391 |
| T Mobile USA Incorporated (Communication services, Media) | | 3.88 | 4-15-2030 | | 300,000 | 301,152 |
| Thermo Fisher Scientific Incorporated (Health care, Life sciences tools & services) | | 1.13 | 10-18-2033 | | 350,000 | 358,090 |
| Verizon Communications Incorporated (Communication services, Diversified telecommunication services) 144A | | 2.36 | 3-15-2032 | | 400,000 | 361,286 |
| Total Corporate bonds and notes (Cost $5,658,065) | | | | | | 5,363,611 |
| Foreign corporate bonds and notes: 12.22% | | | | | | |
| Belgium: 0.28% | | | | | | |
| Anheuser-Busch InBev SA (Consumer staples, Beverages) | | 2.88 | 4-2-2032 | EUR | 300,000 | 366,632 |
| France: 0.32% | | | | | | |
| Altice France SA (Communication services, Diversified telecommunication services) | | 4.13 | 1-15-2029 | EUR | 200,000 | 200,231 |
| SPCM SA (Materials, Chemicals) | | 2.00 | 2-1-2026 | EUR | 200,000 | 214,598 |
| | | | | | | 414,829 |
| Germany: 0.42% | | | | | | |
| Cheplapharm Arzneimittel (Health care, Pharmaceuticals) | | 4.38 | 1-15-2028 | EUR | 100,000 | 109,247 |
The accompanying notes are an integral part of these financial statements.
Allspring International Bond Fund | 9
Portfolio of investments—March 31, 2022 (unaudited)
| | | Interest
rate | Maturity
date | | Principal | Value |
| Germany: 0.42% (continued) | | | | | | |
| PCF GmBH (Materials, Paper & forest products) | | 4.75% | 4-15-2026 | EUR | 200,000 | $ 212,203 |
| Rebecca Bidco (Consumer discretionary, Diversified consumer services) | | 5.75 | 7-15-2025 | EUR | 200,000 | 222,456 |
| | | | | | | 543,906 |
| Ireland: 0.08% | | | | | | |
| Smurfit Kappa Treasury Company (Materials, Paper & forest products) | | 1.50 | 9-15-2027 | EUR | 100,000 | 108,793 |
| Italy: 0.55% | | | | | | |
| Brunello Bidco SpA (Information technology, Software) | | 3.50 | 2-15-2028 | EUR | 100,000 | 104,126 |
| Gamma Bidco SpA (Industrials, Electrical equipment) | | 6.25 | 7-15-2025 | EUR | 200,000 | 223,186 |
| Kedrion SpA (Health care, Biotechnology) | | 3.38 | 5-15-2026 | EUR | 150,000 | 162,874 |
| Zoncolan Bidco SpA (Materials, Paper & forest products) 144A | | 4.88 | 10-21-2028 | EUR | 225,000 | 232,728 |
| | | | | | | 722,914 |
| Japan: 1.82% | | | | | | |
| Japan Expressway Holding and Debt Repayment Agency (Financials, Diversified financial services) | | 0.24 | 5-30-2036 | JPY | 300,000,000 | 2,383,727 |
| Luxembourg: 1.94% | | | | | | |
| ContourGlobal Power Holdings SA (Utilities, Electric utilities) | | 2.75 | 1-1-2026 | EUR | 200,000 | 208,475 |
| European Investment Bank (Financials, Banks) ¤ | | 0.00 | 1-18-2033 | JPY | 290,000,000 | 2,223,854 |
| PLT VII Finance (Financials, Diversified financial services) | | 4.63 | 1-5-2026 | EUR | 100,000 | 109,071 |
| | | | | | | 2,541,400 |
| Netherlands: 0.69% | | | | | | |
| American Medical systems Europe BV (Health care, Health care providers & services) | | 1.63 | 3-8-2031 | EUR | 300,000 | 323,070 |
| United Group BV (Communication services, Media) | | 3.13 | 2-15-2026 | EUR | 225,000 | 231,814 |
| VZ Vendor Financing BV (Financials, Diversified financial services) | | 2.88 | 1-15-2029 | EUR | 250,000 | 249,160 |
| Ziggo Bond Company BV (Communication services, Media) | | 3.38 | 2-28-2030 | EUR | 100,000 | 97,627 |
| | | | | | | 901,671 |
| Spain: 0.08% | | | | | | |
| Aedas Homes Opco SLU (Real estate, Equity REITs) | | 4.00 | 8-15-2026 | EUR | 100,000 | 108,424 |
| Sweden: 0.29% | | | | | | |
| Verisure Holding AB (Industrials, Commercial services & supplies) | | 3.25 | 2-15-2027 | EUR | 150,000 | 155,566 |
| Verisure Holding AB (Industrials, Commercial services & supplies) | | 3.88 | 7-15-2026 | EUR | 200,000 | 215,719 |
| | | | | | | 371,285 |
| United Kingdom: 5.75% | | | | | | |
| AA Bond Company Limited (Consumer discretionary, Diversified consumer services) | | 6.50 | 1-31-2026 | GBP | 125,000 | 160,667 |
The accompanying notes are an integral part of these financial statements.
10 | Allspring International Bond Fund
Portfolio of investments—March 31, 2022 (unaudited)
| | | Interest
rate | Maturity
date | | Principal | Value |
| United Kingdom: 5.75% (continued) | | | | | | |
| BCP Modular V Services Holding (Industrials, Lease Revenue) 144A | | 4.75% | 11-30-2028 | EUR | 200,000 | $ 211,724 |
| Galaxy Bidco Limited (Financials, Insurance) | | 6.50 | 7-31-2026 | GBP | 200,000 | 258,132 |
| INEOS Finance plc (Financials, Diversified financial services) | | 3.38 | 3-31-2026 | EUR | 200,000 | 216,281 |
| INEOS Quattro Finance 2 plc (Financials, Diversified financial services) | | 2.50 | 1-15-2026 | EUR | 100,000 | 104,319 |
| Network Rail Infrastructure Finance plc (Industrials, Transportation infrastructure) | | 4.75 | 11-29-2035 | GBP | 3,450,000 | 5,942,451 |
| Pinewood Finance Company Limited (Financials, Diversified financial services) | | 3.25 | 9-30-2025 | GBP | 100,000 | 127,096 |
| Playtech plc (Consumer discretionary, Hotels, restaurants & leisure) | | 3.75 | 10-12-2023 | EUR | 175,000 | 193,946 |
| Virgin Media Secured Finance plc (Communication services, Media) | | 4.25 | 1-15-2030 | GBP | 250,000 | 300,908 |
| | | | | | | 7,515,524 |
| Total Foreign corporate bonds and notes (Cost $17,730,443) | | | | | | 15,979,105 |
| Foreign government bonds: 80.59% | | | | | | |
| Australian Government | | 1.75 | 6-21-2051 | AUD | 4,300,000 | 2,308,507 |
| Australian Government | | 2.75 | 11-21-2028 | AUD | 4,600,000 | 3,446,995 |
| Brazil Government Bond | | 10.00 | 1-1-2023 | BRL | 1,500,000 | 309,706 |
| Brazil Government Bond | | 10.00 | 1-1-2025 | BRL | 3,000,000 | 610,700 |
| Brazil Government Bond | | 10.00 | 1-1-2029 | BRL | 2,075,000 | 407,805 |
| Canada | | 0.50 | 12-1-2050 | CAD | 2,933,858 | 2,317,657 |
| Canada | | 1.50 | 12-1-2031 | CAD | 1,450,000 | 1,070,575 |
| Canada 144A | | 1.90 | 3-15-2031 | CAD | 8,350,000 | 6,172,114 |
| China Government Bond | | 3.02 | 5-27-2031 | CNY | 35,600,000 | 5,676,716 |
| China Government Bond | | 3.03 | 3-11-2026 | CNY | 69,700,000 | 11,170,304 |
| Colombia | | 6.00 | 4-28-2028 | COP | 1,435,000,000 | 321,164 |
| Czech Republic Bonds | | 0.25 | 2-10-2027 | CZK | 4,000,000 | 150,310 |
| Czech Republic Bonds | | 1.75 | 6-23-2032 | CZK | 99,500,000 | 3,765,105 |
| France ¤ | | 0.00 | 11-25-2031 | EUR | 3,350,000 | 3,389,820 |
| France ¤ | | 0.00 | 5-25-2032 | EUR | 2,675,000 | 2,682,022 |
| Hungary | | 1.50 | 4-22-2026 | HUF | 1,065,000,000 | 2,648,787 |
| Hungary | | 1.50 | 8-26-2026 | HUF | 54,000,000 | 132,264 |
| Hungary | | 2.25 | 4-20-2033 | HUF | 150,000,000 | 318,166 |
| Indonesia | | 6.50 | 6-15-2025 | IDR | 7,300,000,000 | 529,239 |
| Italy Buoni Poliennali del Tesoro ¤ | | 0.00 | 4-1-2026 | EUR | 1,400,000 | 1,481,001 |
| Italy Buoni Poliennali del Tesoro 144A | | 0.60 | 8-1-2031 | EUR | 4,575,000 | 4,478,409 |
| Italy Buoni Poliennali del Tesoro | | 0.95 | 6-1-2032 | EUR | 3,000,000 | 2,992,125 |
| Italy Buoni Poliennali del Tesoro 144A | | 1.50 | 4-30-2045 | EUR | 2,500,000 | 2,351,666 |
| Japan Bonds | | 0.10 | 9-20-2031 | JPY | 210,000,000 | 1,708,894 |
| Japan Bonds | | 0.10 | 12-20-2031 | JPY | 485,000,000 | 3,940,476 |
| Korea Treasury Bond | | 1.88 | 6-10-2029 | KRW | 1,920,000,000 | 1,467,034 |
| Korea Treasury Bond | | 2.38 | 12-10-2031 | KRW | 1,600,000,000 | 1,249,447 |
| Malaysia Government Bond | | 3.90 | 11-30-2026 | MYR | 1,100,000 | 266,914 |
| Mexico | | 5.75 | 3-5-2026 | MXN | 8,400,000 | 384,094 |
| Mexico | | 8.00 | 11-7-2047 | MXN | 8,030,000 | 384,637 |
| Mexico | | 8.50 | 5-31-2029 | MXN | 7,715,000 | 390,374 |
| New South Wales | | 1.50 | 2-20-2032 | AUD | 2,400,000 | 1,536,014 |
| New South Wales | | 3.00 | 5-20-2027 | AUD | 2,040,000 | 1,535,719 |
| New Zealand Government Bond | | 1.50 | 5-15-2031 | NZD | 2,800,000 | 1,676,879 |
| New Zealand Government Bond | | 3.50 | 4-14-2033 | NZD | 2,800,000 | 1,986,784 |
The accompanying notes are an integral part of these financial statements.
Allspring International Bond Fund | 11
Portfolio of investments—March 31, 2022 (unaudited)
| | | Interest
rate | Maturity
date | | Principal | Value |
| Foreign government bonds: 80.59% (continued) | | | | | | |
| Norway 144A | | 1.50% | 2-19-2026 | NOK | 17,700,000 | $ 1,935,380 |
| Norway 144A | | 2.13 | 5-18-2032 | NOK | 17,250,000 | 1,884,522 |
| Poland | | 0.25 | 10-25-2026 | PLN | 775,000 | 145,879 |
| Poland | | 1.25 | 10-25-2030 | PLN | 16,025,000 | 2,808,165 |
| Poland | | 1.75 | 4-25-2032 | PLN | 3,200,000 | 560,833 |
| Poland | | 2.50 | 1-25-2023 | PLN | 1,000,000 | 233,441 |
| Poland | | 2.75 | 10-25-2029 | PLN | 425,000 | 85,885 |
| Queensland Treasury Corporation 144A | | 1.50 | 8-20-2032 | AUD | 2,500,000 | 1,585,275 |
| Queensland Treasury Corporation 144A | | 2.75 | 8-20-2027 | AUD | 2,000,000 | 1,486,009 |
| Republic of Peru | | 6.35 | 8-12-2028 | PEN | 600,000 | 162,611 |
| Republic of South Africa | | 8.75 | 2-28-2048 | ZAR | 25,750,000 | 1,476,010 |
| Republic of South Africa | | 8.75 | 2-28-2048 | ZAR | 8,035,000 | 460,573 |
| Republic of South Africa | | 10.50 | 12-21-2026 | ZAR | 25,435,000 | 1,896,942 |
| Romania | | 3.25 | 6-24-2026 | RON | 650,000 | 131,024 |
| Romania | | 3.65 | 9-24-2031 | RON | 6,700,000 | 1,239,731 |
| Romania | | 4.85 | 4-22-2026 | RON | 4,900,000 | 1,056,654 |
| Romania | | 5.00 | 2-12-2029 | RON | 4,175,000 | 878,081 |
| Russia | | 4.50 | 7-16-2025 | RUB | 296,800,000 | 109,588 |
| Russia | | 6.50 | 2-28-2024 | RUB | 20,000,000 | 7,385 |
| Spain Bonos y Obligaciones del Estado ¤ | | 0.00 | 1-31-2026 | EUR | 1,150,000 | 1,238,654 |
| Spain Bonos y Obligaciones del Estado 144A | | 1.25 | 10-31-2030 | EUR | 4,195,000 | 4,655,800 |
| United Kingdom Gilt Bond | | 0.13 | 3-22-2051 | GBP | 918,179 | 2,176,344 |
| United Kingdom Gilt Bond | | 0.88 | 7-31-2033 | GBP | 2,325,000 | 2,800,734 |
| United Kingdom Gilt Bond | | 1.25 | 7-31-2051 | GBP | 950,000 | 1,099,097 |
| Total Foreign government bonds (Cost $117,893,137) | | | | | | 105,373,040 |
| U.S. Treasury securities: 0.96% | | | | | | |
| U.S. Treasury Note | | 1.88 | 2-15-2032 | $ | 1,300,000 | 1,248,406 |
| Total U.S. Treasury securities (Cost $1,248,615) | | | | | | 1,248,406 |
| Yankee corporate bonds and notes: 0.31% | | | | | | |
| France: 0.31% | | | | | | |
| Electricite de France SA (Utilities, Electric utilities) | | 4.50 | 9-21-2028 | | 400,000 | 409,520 |
| Total Yankee corporate bonds and notes (Cost $427,819) | | | | | | 409,520 |
| Yankee government bonds: 0.32% | | | | | | |
| British Columbia | | 1.30 | 1-29-2031 | | 475,000 | 424,330 |
| Total Yankee government bonds (Cost $474,370) | | | | | | 424,330 |
| | | Yield | | | Shares | |
| Short-term investments: 3.93% | | | | | | |
| Investment companies: 3.93% | | | | | | |
| Allspring Government Money Market Fund Select Class ♠∞ | | 0.18 | | | 5,137,372 | 5,137,372 |
| Total Short-term investments (Cost $5,137,372) | | | | | | 5,137,372 |
| Total investments in securities (Cost $148,569,821) | 102.43% | | | | | 133,935,384 |
| Other assets and liabilities, net | (2.43) | | | | | (3,176,577) |
| Total net assets | 100.00% | | | | | $130,758,807 |
The accompanying notes are an integral part of these financial statements.
12 | Allspring International Bond Fund
Portfolio of investments—March 31, 2022 (unaudited)
| ± | Variable rate investment. The rate shown is the rate in effect at period end. |
| 144A | The security may be resold in transactions exempt from registration, normally to qualified institutional buyers, pursuant to Rule 144A under the Securities Act of 1933. |
| ¤ | The security is issued in zero coupon form with no periodic interest payments. |
| ♠ | The issuer of the security is an affiliated person of the Fund as defined in the Investment Company Act of 1940. |
| ∞ | The rate represents the 7-day annualized yield at period end. |
| Abbreviations: |
| AUD | Australian dollar |
| BRL | Brazilian real |
| CAD | Canadian dollar |
| CNY | China yuan |
| COP | Colombian peso |
| CZK | Czech Republic koruna |
| EUR | Euro |
| GBP | Great British pound |
| HUF | Hungarian forint |
| IDR | Indonesian rupiah |
| JPY | Japanese yen |
| KRW | Republic of Korea won |
| LIBOR | London Interbank Offered Rate |
| MXN | Mexican peso |
| MYR | Malaysian ringgit |
| NOK | Norwegian krone |
| NZD | New Zealand dollar |
| PEN | Peruvian sol |
| PLN | Polish zloty |
| REIT | Real estate investment trust |
| RON | Romanian lei |
| RUB | Russian ruble |
| ZAR | South African rand |
Investments in affiliates
An affiliated investment is an investment in which the Fund owns at least 5% of the outstanding voting shares of the issuer or as a result of other relationships, such as the Fund and the issuer having the same investment manager. Transactions with issuers that were affiliates of the Fund at the end of the period were as follows:
| | Value,
beginning of
period | Purchases | Sales
proceeds | Net
realized
gains
(losses) | Net
change in
unrealized
gains
(losses) | Value,
end of
period | Shares,
end
of period | Income
from
affiliated
securities |
| Short-term investments | | | | | | | |
| Allspring Government Money Market Fund Select Class | $1,463,638 | $24,103,272 | $(20,429,538) | $0 | $0 | $5,137,372 | 5,137,372 | $330 |
The accompanying notes are an integral part of these financial statements.
Allspring International Bond Fund | 13
Portfolio of investments—March 31, 2022 (unaudited)
Forward foreign currency contracts
Currency to be
received | Currency to be
delivered | Counterparty | Settlement
date | Unrealized
gains | Unrealized
losses |
| 6,277,946 USD | 8,700,000 AUD | State Street Bank & Trust Company | 4-14-2022 | $ 0 | $ (232,977) |
| 3,363,075 USD | 75,800,000 CZK | State Street Bank & Trust Company | 6-27-2022 | 0 | (38,834) |
| 155,287 USD | 3,500,000 CZK | State Street Bank & Trust Company | 6-27-2022 | 0 | (1,793) |
| 10,513,276 USD | 69,000,000 DKK | State Street Bank & Trust Company | 4-11-2022 | 249,856 | 0 |
| 39,300,000 DKK | 5,986,920 USD | State Street Bank & Trust Company | 4-11-2022 | 0 | (141,233) |
| 29,700,000 DKK | 4,512,169 USD | State Street Bank & Trust Company | 4-11-2022 | 0 | (94,436) |
| 18,580,000 EUR | 21,020,817 USD | State Street Bank & Trust Company | 4-12-2022 | 0 | (462,175) |
| 9,064,056 USD | 8,000,000 EUR | State Street Bank & Trust Company | 4-12-2022 | 212,111 | 0 |
| 972,467 USD | 850,000 EUR | State Street Bank & Trust Company | 4-12-2022 | 31,948 | 0 |
| 3,250,000 EUR | 3,697,265 USD | State Street Bank & Trust Company | 4-12-2022 | 0 | (101,162) |
| 3,806,327 USD | 3,400,000 EUR | State Street Bank & Trust Company | 4-12-2022 | 44,251 | 0 |
| 2,802,895 USD | 3,825,000 AUD | State Street Bank & Trust Company | 4-14-2022 | 0 | (59,666) |
| 2,250,000 EUR | 2,453,015 USD | State Street Bank & Trust Company | 4-12-2022 | 36,594 | 0 |
| 2,925,000 EUR | 3,188,864 USD | State Street Bank & Trust Company | 4-12-2022 | 47,628 | 0 |
| 3,350,000 EUR | 3,679,241 USD | State Street Bank & Trust Company | 4-12-2022 | 27,511 | 0 |
| 1,100,000 EUR | 1,209,263 USD | State Street Bank & Trust Company | 4-12-2022 | 7,879 | 0 |
| 9,242,490 USD | 6,825,000 GBP | State Street Bank & Trust Company | 4-12-2022 | 277,455 | 0 |
| 3,252,194 USD | 2,400,000 GBP | State Street Bank & Trust Company | 4-12-2022 | 99,654 | 0 |
| 5,000,000 GBP | 6,579,820 USD | State Street Bank & Trust Company | 4-12-2022 | 0 | (12,028) |
| 200,000 GBP | 261,639 USD | State Street Bank & Trust Company | 4-12-2022 | 1,072 | 0 |
| 3,150,936 USD | 2,400,000 GBP | State Street Bank & Trust Company | 4-12-2022 | 0 | (1,604) |
| 1,400,000 GBP | 1,841,428 USD | State Street Bank & Trust Company | 4-13-2022 | 0 | (2,457) |
| 575,000 AUD | 430,954 USD | State Street Bank & Trust Company | 4-14-2022 | 0 | (634) |
| 167,652 USD | 53,000,000 HUF | State Street Bank & Trust Company | 4-11-2022 | 8,205 | 0 |
| 2,422,487 USD | 870,000,000 HUF | State Street Bank & Trust Company | 4-11-2022 | 0 | (194,846) |
| 2,176,000,000 JPY | 19,005,545 USD | State Street Bank & Trust Company | 5-31-2022 | 0 | (1,107,843) |
| 150,000,000 JPY | 1,232,162 USD | State Street Bank & Trust Company | 5-31-2022 | 1,595 | 0 |
The accompanying notes are an integral part of these financial statements.
14 | Allspring International Bond Fund
Portfolio of investments—March 31, 2022 (unaudited)
Forward foreign currency contracts (continued)
Currency to be
received | Currency to be
delivered | Counterparty | Settlement
date | Unrealized
gains | | Unrealized
losses |
| 434,200 USD | 8,950,000 MXN | State Street Bank & Trust Company | 6-27-2022 | $ 0 | | $ (9,107) |
| 2,160,000 MYR | 512,760 USD | State Street Bank & Trust Company | 4-21-2022 | 651 | | 0 |
| 3,879,703 USD | 34,675,000 NOK | State Street Bank & Trust Company | 6-13-2022 | 0 | | (57,016) |
| 1,200,000 NOK | 138,504 USD | State Street Bank & Trust Company | 6-13-2022 | 0 | | (2,266) |
| 3,788,828 USD | 5,540,000 NZD | State Street Bank & Trust Company | 4-14-2022 | 0 | | (50,236) |
| 200,000 NZD | 138,756 USD | State Street Bank & Trust Company | 4-14-2022 | 0 | | (162) |
| 89,033 USD | 500,000 BRL | State Street Bank & Trust Company | 4-26-2022 | 0 | | (15,341) |
| 63,463 USD | 350,000 BRL | State Street Bank & Trust Company | 4-26-2022 | 0 | | (9,598) |
| 94,280 USD | 450,000 BRL | State Street Bank & Trust Company | 4-26-2022 | 344 | | 0 |
| 3,504,746 USD | 4,450,000 CAD | State Street Bank & Trust Company | 6-14-2022 | 0 | | (54,177) |
| 860,000 CAD | 687,291 USD | State Street Bank & Trust Company | 6-14-2022 | 500 | | 0 |
| 2,400,000 CNY | 374,561 USD | State Street Bank & Trust Company | 5-10-2022 | 2,992 | | 0 |
| 2,908,276 USD | 13,275,000 PLN | State Street Bank & Trust Company | 6-10-2022 | 0 | | (230,507) |
| 13,275,000 PLN | 3,136,667 USD | State Street Bank & Trust Company | 6-10-2022 | 2,116 | | 0 |
| 433,509 USD | 33,900,000 RUB | State Street Bank & Trust Company | 4-20-2022 | 23,182 | | 0 |
| 14,900,000 RUB | 192,246 USD | State Street Bank & Trust Company | 4-20-2022 | 0 | | (11,895) |
| 19,000,000 RUB | 187,192 USD | State Street Bank & Trust Company | 4-20-2022 | 42,785 | | 0 |
| 18,900,000 THB | 573,525 USD | State Street Bank & Trust Company | 4-28-2022 | 0 | | (5,057) |
| 1,300,000 TRY | 90,750 USD | State Street Bank & Trust Company | 4-28-2022 | 0 | | (3,815) |
| 2,749,538 USD | 42,300,000 ZAR | State Street Bank & Trust Company | 4-28-2022 | 0 | | (136,387) |
| 406,256 USD | 6,250,000 ZAR | State Street Bank & Trust Company | 4-28-2022 | 0 | | (20,152) |
| | | | | $1,118,329 | | $(3,057,404) |
The accompanying notes are an integral part of these financial statements.
Allspring International Bond Fund | 15
Statement of assets and liabilities—March 31, 2022 (unaudited)
| | |
| Assets | |
Investments in unaffiliated securities, at value (cost $143,432,449)
| $ 128,798,012 |
Investments in affiliated securities, at value (cost $5,137,372)
| 5,137,372 |
Foreign currency, at value (cost $351,065)
| 349,875 |
Unrealized gains on forward foreign currency contracts
| 1,118,329 |
Receivable for interest
| 908,073 |
Receivable for Fund shares sold
| 186,827 |
Prepaid expenses and other assets
| 93,280 |
Total assets
| 136,591,768 |
| Liabilities | |
Unrealized losses on forward foreign currency contracts
| 3,057,404 |
Payable for investments purchased
| 2,650,977 |
Payable for Fund shares redeemed
| 44,984 |
Management fee payable
| 41,076 |
Administration fees payable
| 9,701 |
Trustees’ fees and expenses payable
| 2,062 |
Distribution fee payable
| 148 |
Accrued expenses and other liabilities
| 26,609 |
Total liabilities
| 5,832,961 |
Total net assets
| $130,758,807 |
| Net assets consist of | |
Paid-in capital
| $ 154,209,556 |
Total distributable loss
| (23,450,749) |
Total net assets
| $130,758,807 |
| Computation of net asset value and offering price per share | |
Net assets – Class A
| $ 6,298,341 |
Shares outstanding – Class A1
| 656,215 |
Net asset value per share – Class A
| $9.60 |
Maximum offering price per share – Class A2
| $10.05 |
Net assets – Class C
| $ 234,682 |
Shares outstanding – Class C1
| 25,735 |
Net asset value per share – Class C
| $9.12 |
Net assets – Class R6
| $ 2,562,648 |
Shares outstanding – Class R61
| 260,167 |
Net asset value per share – Class R6
| $9.85 |
Net assets – Administrator Class
| $ 34,763,471 |
Shares outstanding – Administrator Class1
| 3,580,496 |
Net asset value per share – Administrator Class
| $9.71 |
Net assets – Institutional Class
| $ 86,899,665 |
Shares outstanding – Institutional Class1
| 8,861,447 |
Net asset value per share – Institutional Class
| $9.81 |
| 1 | The Fund has an unlimited number of authorized shares. |
| 2 | Maximum offering price is computed as 100/95.50 of net asset value. On investments of $50,000 or more, the offering price is reduced. |
The accompanying notes are an integral part of these financial statements.
16 | Allspring International Bond Fund
Statement of operations—six months ended March 31, 2022 (unaudited)
| | |
| Investment income | |
Interest (net of foreign withholding taxes of $7,511)
| $ 1,675,643 |
Income from affiliated securities
| 330 |
Total investment income
| 1,675,973 |
| Expenses | |
Management fee
| 415,992 |
| Administration fees | |
Class A
| 6,182 |
Class C
| 206 |
Class R6
| 442 |
Administrator Class
| 18,759 |
Institutional Class
| 36,085 |
| Shareholder servicing fees | |
Class A
| 9,655 |
Class C
| 319 |
Administrator Class
| 46,898 |
| Distribution fee | |
Class C
| 956 |
Custody and accounting fees
| 17,639 |
Professional fees
| 32,039 |
Registration fees
| 41,158 |
Shareholder report expenses
| 23,114 |
Trustees’ fees and expenses
| 10,684 |
Other fees and expenses
| 10,318 |
Total expenses
| 670,446 |
| Less: Fee waivers and/or expense reimbursements | |
Fund-level
| (119,676) |
Class A
| (36) |
Administrator Class
| (23,909) |
Net expenses
| 526,825 |
Net investment income
| 1,149,148 |
| Realized and unrealized gains (losses) on investments | |
| Net realized losses on | |
Unaffiliated securities
| (3,838,740) |
Forward foreign currency contracts
| (1,011,529) |
Net realized losses on investments
| (4,850,269) |
| Net change in unrealized gains (losses) on | |
Unaffiliated securities (net of deferred foreign capital gain tax refund of $(1,365))
| (10,791,113) |
Forward foreign currency contracts
| (1,717,138) |
Net change in unrealized gains (losses) on investments
| (12,508,251) |
Net realized and unrealized gains (losses) on investments
| (17,358,520) |
Net decrease in net assets resulting from operations
| $(16,209,372) |
The accompanying notes are an integral part of these financial statements.
Allspring International Bond Fund | 17
Statement of changes in net assets
| | | | | |
| | Six months ended
March 31, 2022
(unaudited) | Year ended
September 30, 2021 |
| Operations | | | | |
Net investment income
| | $ 1,149,148 | | $ 1,647,142 |
Net realized gains (losses) on investments
| | (4,850,269) | | 1,935,771 |
Net change in unrealized gains (losses) on investments
| | (12,508,251) | | (6,007,801) |
Net decrease in net assets resulting from operations
| | (16,209,372) | | (2,424,888) |
| Distributions to shareholders from | | | | |
| Net investment income and net realized gains | | | | |
Class A
| | (10,524) | | (63,228) |
Class R6
| | (9,965) | | (37,383) |
Administrator Class
| | (67,210) | | (249,475) |
Institutional Class
| | (245,781) | | (768,614) |
| Tax basis return of capital | | | | |
Class A
| | 0 | | (12,789) |
Class R6
| | 0 | | (5,780) |
Administrator Class
| | 0 | | (54,442) |
Institutional Class
| | 0 | | (190,437) |
Total distributions to shareholders
| | (333,480) | | (1,382,148) |
| Capital share transactions | Shares | | Shares | |
| Proceeds from shares sold | | | | |
Class A
| 18,198 | 190,675 | 114,005 | 1,290,909 |
Class C
| 298 | 2,951 | 2,291 | 24,570 |
Class R6
| 86,730 | 952,587 | 468 | 5,399 |
Administrator Class
| 296,328 | 3,112,496 | 824,508 | 9,449,557 |
Institutional Class
| 1,553,271 | 16,235,193 | 4,402,502 | 50,976,013 |
| | | 20,493,902 | | 61,746,448 |
| Reinvestment of distributions | | | | |
Class A
| 930 | 9,909 | 6,553 | 72,767 |
Class R6
| 300 | 3,281 | 1,278 | 14,677 |
Administrator Class
| 4,433 | 47,744 | 18,773 | 210,813 |
Institutional Class
| 21,939 | 238,697 | 82,329 | 935,208 |
| | | 299,631 | | 1,233,465 |
| Payment for shares redeemed | | | | |
Class A
| (329,082) | (3,524,868) | (168,968) | (1,906,557) |
Class C
| (592) | (5,991) | (42,961) | (456,314) |
Class R6
| (66,400) | (689,121) | (292,184) | (3,364,244) |
Administrator Class
| (299,582) | (3,215,344) | (323,132) | (3,696,482) |
Institutional Class
| (1,005,843) | (10,740,132) | (1,255,497) | (14,512,169) |
| | | (18,175,456) | | (23,935,766) |
Net increase in net assets resulting from capital share transactions
| | 2,618,077 | | 39,044,147 |
Total increase (decrease) in net assets
| | (13,924,775) | | 35,237,111 |
| Net assets | | | | |
Beginning of period
| | 144,683,582 | | 109,446,471 |
End of period
| | $130,758,807 | | $144,683,582 |
The accompanying notes are an integral part of these financial statements.
18 | Allspring International Bond Fund
Financial highlights
(For a share outstanding throughout each period)
| | | Year ended September 30 |
| Class A | Six months ended
March 31, 2022
(unaudited) | 2021 | 2020 | 2019 | 2018 | 2017 |
Net asset value, beginning of period
| $10.86 | $11.08 | $10.45 | $9.69 | $10.31 | $10.77 |
Net investment income
| 0.07 1 | 0.10 1 | 0.18 1 | 0.32 1 | 0.27 1 | 0.26 1 |
Payment from affiliate
| 0.00 | 0.00 | 0.00 2 | 0.00 | 0.00 | 0.00 |
Net realized and unrealized gains (losses) on investments
| (1.31) | (0.24) | 0.45 | 0.44 | (0.89) | (0.57) |
Total from investment operations
| (1.24) | (0.14) | 0.63 | 0.76 | (0.62) | (0.31) |
| Distributions to shareholders from | | | | | | |
Net investment income
| (0.02) | (0.07) | 0.00 | 0.00 | 0.00 | 0.00 |
Net realized gains
| 0.00 | 0.00 | 0.00 | 0.00 | 0.00 | (0.15) |
Tax basis return of capital
| 0.00 | (0.01) | 0.00 | 0.00 | 0.00 | 0.00 |
Total distributions to shareholders
| (0.02) | (0.08) | 0.00 | 0.00 | 0.00 | (0.15) |
Net asset value, end of period
| $9.60 | $10.86 | $11.08 | $10.45 | $9.69 | $10.31 |
Total return3
| (11.48)% | (1.30)% | 6.03% 4 | 7.84% | (6.01)% | (2.78)% |
| Ratios to average net assets (annualized) | | | | | | |
Gross expenses
| 1.20% | 1.22% | 1.50% | 1.30% | 1.08% | 1.03% |
Net expenses
| 1.03% | 1.03% | 1.03% | 1.03% | 1.03% | 1.03% |
Net investment income
| 1.38% | 0.90% | 1.68% | 3.21% | 2.75% | 2.61% |
| Supplemental data | | | | | | |
Portfolio turnover rate
| 50% | 77% | 158% | 129% | 99% | 68% |
Net assets, end of period (000s omitted)
| $6,298 | $10,492 | $11,237 | $12,329 | $44,519 | $69,885 |
| 1 | Calculated based upon average shares outstanding |
| 2 | Amount is less than $0.005. |
| 3 | Total return calculations do not include any sales charges. Returns for periods of less than one year are not annualized. |
| 4 | During the year ended September 30, 2020, the Fund received a payment from an affiliate that had an impact of less than 0.005% on total return. |
The accompanying notes are an integral part of these financial statements.
Allspring International Bond Fund | 19
Financial highlights
(For a share outstanding throughout each period)
| | | Year ended September 30 |
| Class C | Six months ended
March 31, 2022
(unaudited) | 2021 | 2020 | 2019 | 2018 | 2017 |
Net asset value, beginning of period
| $10.34 | $10.56 | $9.98 | $9.32 | $10.00 | $10.52 |
Net investment income
| 0.03 1 | 0.02 1 | 0.09 1 | 0.24 1 | 0.19 1 | 0.18 1 |
Payment from affiliate
| 0.00 | 0.00 | 0.06 | 0.00 | 0.00 | 0.00 |
Net realized and unrealized gains (losses) on investments
| (1.25) | (0.24) | 0.43 | 0.42 | (0.87) | (0.55) |
Total from investment operations
| (1.22) | (0.22) | 0.58 | 0.66 | (0.68) | (0.37) |
| Distributions to shareholders from | | | | | | |
Net realized gains
| 0.00 | 0.00 | 0.00 | 0.00 | 0.00 | (0.15) |
Net asset value, end of period
| $9.12 | $10.34 | $10.56 | $9.98 | $9.32 | $10.00 |
Total return2
| (11.80)% | (2.08)% | 5.81% 3 | 7.08% | (6.80)% | (3.43)% |
| Ratios to average net assets (annualized) | | | | | | |
Gross expenses
| 1.95% | 1.98% | 2.25% | 2.04% | 1.83% | 1.78% |
Net expenses
| 1.78% | 1.78% | 1.78% | 1.78% | 1.78% | 1.78% |
Net investment income
| 0.64% | 0.16% | 0.94% | 2.51% | 2.00% | 1.88% |
| Supplemental data | | | | | | |
Portfolio turnover rate
| 50% | 77% | 158% | 129% | 99% | 68% |
Net assets, end of period (000s omitted)
| $235 | $269 | $704 | $1,027 | $2,652 | $3,493 |
| 1 | Calculated based upon average shares outstanding |
| 2 | Total return calculations do not include any sales charges. Returns for periods of less than one year are not annualized. |
| 3 | During the year ended September 30, 2020, the Fund received a payment from an affiliate which had a 0.58% impact on the total return. |
The accompanying notes are an integral part of these financial statements.
20 | Allspring International Bond Fund
Financial highlights
(For a share outstanding throughout each period)
| | | Year ended September 30 |
| Class R6 | Six months ended
March 31, 2022
(unaudited) | 2021 | 2020 | 2019 | 2018 | 2017 |
Net asset value, beginning of period
| $11.14 | $11.36 | $10.68 | $9.86 | $10.45 | $10.88 |
Net investment income
| 0.10 1 | 0.15 1 | 0.23 1 | 0.37 1 | 0.31 1 | 0.30 1 |
Net realized and unrealized gains (losses) on investments
| (1.36) | (0.25) | 0.45 | 0.45 | (0.90) | (0.58) |
Total from investment operations
| (1.26) | (0.10) | 0.68 | 0.82 | (0.59) | (0.28) |
| Distributions to shareholders from | | | | | | |
Net investment income
| (0.03) | (0.11) | 0.00 | 0.00 | 0.00 | 0.00 |
Net realized gains
| 0.00 | 0.00 | 0.00 | 0.00 | 0.00 | (0.15) |
Tax basis return of capital
| 0.00 | (0.01) | 0.00 | 0.00 | 0.00 | 0.00 |
Total distributions to shareholders
| (0.03) | (0.12) | 0.00 | 0.00 | 0.00 | (0.15) |
Net asset value, end of period
| $9.85 | $11.14 | $11.36 | $10.68 | $9.86 | $10.45 |
Total return2
| (11.33)% | (0.89)% | 6.37% | 8.32% | (5.65)% | (2.48)% |
| Ratios to average net assets (annualized) | | | | | | |
Gross expenses
| 0.82% | 0.85% | 1.13% | 0.90% | 0.72% | 0.65% |
Net expenses
| 0.65% | 0.65% | 0.65% | 0.65% | 0.65% | 0.65% |
Net investment income
| 1.77% | 1.27% | 2.08% | 3.68% | 3.18% | 3.01% |
| Supplemental data | | | | | | |
Portfolio turnover rate
| 50% | 77% | 158% | 129% | 99% | 68% |
Net assets, end of period (000s omitted)
| $2,563 | $2,668 | $6,020 | $8,979 | $49,749 | $30,876 |
| 1 | Calculated based upon average shares outstanding |
| 2 | Returns for periods of less than one year are not annualized. |
The accompanying notes are an integral part of these financial statements.
Allspring International Bond Fund | 21
Financial highlights
(For a share outstanding throughout each period)
| | | Year ended September 30 |
| Administrator Class | Six months ended
March 31, 2022
(unaudited) | 2021 | 2020 | 2019 | 2018 | 2017 |
Net asset value, beginning of period
| $10.98 | $11.19 | $10.53 | $9.75 | $10.36 | $10.80 |
Net investment income
| 0.08 1 | 0.12 1 | 0.20 1 | 0.34 1 | 0.29 1 | 0.28 1 |
Net realized and unrealized gains (losses) on investments
| (1.33) | (0.24) | 0.46 | 0.44 | (0.90) | (0.57) |
Total from investment operations
| (1.25) | (0.12) | 0.66 | 0.78 | (0.61) | (0.29) |
| Distributions to shareholders from | | | | | | |
Net investment income
| (0.02) | (0.07) | 0.00 | 0.00 | 0.00 | 0.00 |
Net realized gains
| 0.00 | 0.00 | 0.00 | 0.00 | 0.00 | (0.15) |
Tax basis return of capital
| 0.00 | (0.02) | 0.00 | 0.00 | 0.00 | 0.00 |
Total distributions to shareholders
| (0.02) | (0.09) | 0.00 | 0.00 | 0.00 | (0.15) |
Net asset value, end of period
| $9.71 | $10.98 | $11.19 | $10.53 | $9.75 | $10.36 |
Total return2
| (11.41)% | (1.11)% | 6.27% | 8.00% | (5.89)% | (2.59)% |
| Ratios to average net assets (annualized) | | | | | | |
Gross expenses
| 1.14% | 1.16% | 1.44% | 1.24% | 1.01% | 0.97% |
Net expenses
| 0.85% | 0.85% | 0.85% | 0.85% | 0.85% | 0.85% |
Net investment income
| 1.57% | 1.09% | 1.87% | 3.37% | 2.93% | 2.80% |
| Supplemental data | | | | | | |
Portfolio turnover rate
| 50% | 77% | 158% | 129% | 99% | 68% |
Net assets, end of period (000s omitted)
| $34,763 | $39,296 | $34,221 | $18,213 | $27,911 | $41,045 |
| 1 | Calculated based upon average shares outstanding |
| 2 | Returns for periods of less than one year are not annualized. |
The accompanying notes are an integral part of these financial statements.
22 | Allspring International Bond Fund
Financial highlights
(For a share outstanding throughout each period)
| | | Year ended September 30 |
| Institutional Class | Six months ended
March 31, 2022
(unaudited) | 2021 | 2020 | 2019 | 2018 | 2017 |
Net asset value, beginning of period
| $11.09 | $11.31 | $10.64 | $9.83 | $10.43 | $10.86 |
Net investment income
| 0.09 1 | 0.14 1 | 0.22 1 | 0.37 1 | 0.31 1 | 0.29 1 |
Net realized and unrealized gains (losses) on investments
| (1.34) | (0.24) | 0.45 | 0.44 | (0.91) | (0.57) |
Total from investment operations
| (1.25) | (0.10) | 0.67 | 0.81 | (0.60) | (0.28) |
| Distributions to shareholders from | | | | | | |
Net investment income
| (0.03) | (0.09) | 0.00 | 0.00 | 0.00 | 0.00 |
Net realized gains
| 0.00 | 0.00 | 0.00 | 0.00 | 0.00 | (0.15) |
Tax basis return of capital
| 0.00 | (0.03) | 0.00 | 0.00 | 0.00 | 0.00 |
Total distributions to shareholders
| (0.03) | (0.12) | 0.00 | 0.00 | 0.00 | (0.15) |
Net asset value, end of period
| $9.81 | $11.09 | $11.31 | $10.64 | $9.83 | $10.43 |
Total return2
| (11.31)% | (0.93)% | 6.30% | 8.24% | (5.75)% | (2.48)% |
| Ratios to average net assets (annualized) | | | | | | |
Gross expenses
| 0.87% | 0.89% | 1.17% | 0.95% | 0.74% | 0.70% |
Net expenses
| 0.70% | 0.70% | 0.70% | 0.70% | 0.70% | 0.70% |
Net investment income
| 1.72% | 1.23% | 2.04% | 3.61% | 3.06% | 2.96% |
| Supplemental data | | | | | | |
Portfolio turnover rate
| 50% | 77% | 158% | 129% | 99% | 68% |
Net assets, end of period (000s omitted)
| $86,900 | $91,959 | $57,264 | $77,727 | $245,633 | $443,888 |
| 1 | Calculated based upon average shares outstanding |
| 2 | Returns for periods of less than one year are not annualized. |
The accompanying notes are an integral part of these financial statements.
Allspring International Bond Fund | 23
Notes to financial statements (unaudited)
1. ORGANIZATION
Allspring Funds Trust (the "Trust"), a Delaware statutory trust organized on March 10, 1999, is an open-end management investment company registered under the Investment Company Act of 1940, as amended (the "1940 Act"). As an investment company, the Trust follows the accounting and reporting guidance in Financial Accounting Standards Board ("FASB") Accounting Standards Codification Topic 946, Financial Services – Investment Companies. These financial statements report on the Allspring International Bond Fund (the "Fund") which is a diversified series of the Trust.
Effective on November 1, 2021, the sale transaction of Wells Fargo Asset Management ("WFAM") by Wells Fargo & Company to GTCR LLC and Reverence Capital Partners, L.P. was closed. In connection with the closing of the transaction, WFAM became known as Allspring Global Investments (“Allspring”) and various entities that provided services to the Fund changed their names to "Allspring", including Allspring Funds Management, LLC, the investment manager to the Fund, Allspring Global Investments, LLC and Allspring Global Investments (UK) Limited, both registered investment advisers providing subadvisory services to certain funds, and Allspring Funds Distributor, LLC, the Fund's principal underwriter. Consummation of the transaction resulted in a new investment management agreement and subadvisory agreement which became effective on November 1, 2021.
2. SIGNIFICANT ACCOUNTING POLICIES
The following significant accounting policies, which are consistently followed in the preparation of the financial statements of the Fund, are in conformity with U.S. generally accepted accounting principles which require management to make estimates and assumptions that affect the reported amounts of assets and liabilities, disclosure of contingent assets and liabilities at the date of the financial statements, and the reported amounts of income and expenses during the reporting period. Actual results could differ from those estimates.
Securities valuation
All investments are valued each business day as of the close of regular trading on the New York Stock Exchange (generally 4 p.m. Eastern Time), although the Fund may deviate from this calculation time under unusual or unexpected circumstances.
Debt securities are valued at the evaluated bid price provided by an independent pricing service (e.g. taking into account various factors, including yields, maturities, or credit ratings) or, if a reliable price is not available, the quoted bid price from an independent broker-dealer.
The values of securities denominated in foreign currencies are translated into U.S. dollars at rates provided by an independent foreign currency pricing source at a time each business day specified by the Allspring Global Investments Pricing Committee at Allspring Funds Management, LLC ("Allspring Funds Management").
Forward foreign currency contracts are recorded at the forward rate provided by an independent foreign currency pricing source at a time each business day specified by the Allspring Global Investments Pricing Committee.
Investments in registered open-end investment companies are valued at net asset value.
Investments which are not valued using any of the methods discussed above are valued at their fair value, as determined in good faith by the Board of Trustees. The Board of Trustees has established a Valuation Committee comprised of the Trustees and has delegated to it the authority to take any actions regarding the valuation of portfolio securities that the Valuation Committee deems necessary or appropriate, including determining the fair value of portfolio securities, unless the determination has been delegated to the Allspring Global Investments Pricing Committee. The Board of Trustees retains the authority to make or ratify any valuation decisions or approve any changes to the Valuation Procedures as it deems appropriate. On a quarterly basis, the Board of Trustees receives reports on any valuation actions taken by the Valuation Committee or the Allspring Global Investments Pricing Committee which may include items for ratification.
Foreign currency translation
The accounting records of the Fund are maintained in U.S. dollars. The values of other assets and liabilities denominated in foreign currencies are translated into U.S. dollars at rates provided by an independent foreign currency pricing source at a time each business day specified by the Allspring Global Investments Pricing Committee. Purchases and sales of securities, and income and expenses are converted at the rate of exchange on the respective dates of such transactions. Net realized foreign exchange gains or losses arise from sales of foreign currencies, currency gains or losses realized between the trade and settlement dates on securities transactions, and the difference between the amounts of dividends, interest and foreign withholding taxes recorded and the U.S. dollar equivalent of the amounts actually paid or received. Net unrealized foreign exchange gains and losses arise from changes in the fair value of assets and liabilities other than investments in securities resulting from changes in exchange rates. The changes in net assets arising from changes in exchange rates of securities and
24 | Allspring International Bond Fund
Notes to financial statements (unaudited)
the changes in net assets resulting from changes in market prices of securities are not separately presented. Such changes are included in net realized and unrealized gains or losses from investments.
Forward foreign currency contracts
A forward foreign currency contract is an agreement between two parties to purchase or sell a specific currency for an agreed-upon price at a future date. The Fund enters into forward foreign currency contracts to facilitate transactions in foreign-denominated securities and to attempt to minimize the risk to the Fund from adverse changes in the relationship between currencies. Forward foreign currency contracts are recorded at the forward rate and marked-to-market daily. When the contracts are closed, realized gains and losses arising from such transactions are recorded as realized gains or losses on forward foreign currency contracts. The Fund is subject to foreign currency risk and may be exposed to risks if the counterparties to the contracts are unable to meet the terms of their contracts or if the value of the foreign currency changes unfavorably. The Fund's maximum risk of loss from counterparty credit risk is the unrealized gains on the contracts. This risk may be mitigated if there is a master netting arrangement between the Fund and the counterparty.
Security transactions and income recognition
Securities transactions are recorded on a trade date basis. Realized gains or losses are recorded on the basis of identified cost.
Interest income is accrued daily and bond discounts are accreted and premiums are amortized daily. To the extent debt obligations are placed on non-accrual status, any related interest income may be reduced by writing off interest receivables when the collection of all or a portion of interest has been determined to be doubtful based on consistently applied procedures and the fair value has decreased. If the issuer subsequently resumes interest payments or when the collectability of interest is reasonably assured, the debt obligation is removed from non-accrual status. Interest income is recorded net of foreign taxes withheld where recovery of such taxes is not assured.
Distributions to shareholders
Distributions to shareholders are recorded on the ex-dividend date and paid from net investment income quarterly and any net realized gains are paid at least annually. Such distributions are determined in accordance with income tax regulations and may differ from U.S. generally accepted accounting principles. Dividend sources are estimated at the time of declaration. The tax character of distributions is determined as of the Fund's fiscal year end. Therefore, a portion of the Fund's distributions made prior to the Fund’s fiscal year end may be categorized as a tax return of capital at year end.
Federal and other taxes
The Fund intends to continue to qualify as a regulated investment company by distributing substantially all of its investment company taxable income and any net realized capital gains (after reduction for capital loss carryforwards) sufficient to relieve it from all, or substantially all, federal income taxes. Accordingly, no provision for federal income taxes was required.
The Fund’s income and federal excise tax returns and all financial records supporting those returns for the prior three fiscal years are subject to examination by the federal and Delaware revenue authorities. Management has analyzed the Fund's tax positions taken on federal, state, and foreign tax returns for all open tax years and does not believe that there are any uncertain tax positions that require recognition of a tax liability.
As of March 31, 2022, the aggregate cost of all investments for federal income tax purposes was $148,044,616 and the unrealized gains (losses) consisted of:
| Gross unrealized gains | $ 2,346,504 |
| Gross unrealized losses | (18,394,811) |
| Net unrealized losses | $(16,048,307) |
As of September 30, 2021, the Fund had capital loss carryforwards which consisted of $763,237 in short-term capital losses and $2,386,946 in long-term capital losses.
Class allocations
The separate classes of shares offered by the Fund differ principally in applicable sales charges, distribution, shareholder servicing, and administration fees. Class specific expenses are charged directly to that share class. Investment income, common fund-level expenses, and realized and unrealized gains (losses) on investments are allocated daily to each class of shares based on the relative proportion of net assets of each class.
Allspring International Bond Fund | 25
Notes to financial statements (unaudited)
3. FAIR VALUATION MEASUREMENTS
Fair value measurements of investments are determined within a framework that has established a fair value hierarchy based upon the various data inputs utilized in determining the value of the Fund’s investments. The three-level hierarchy gives the highest priority to unadjusted quoted prices in active markets for identical assets or liabilities (Level 1) and the lowest priority to unobservable inputs (Level 3). The Fund’s investments are classified within the fair value hierarchy based on the lowest level of input that is significant to the fair value measurement. The inputs are summarized into three broad levels as follows:
| ■ | Level 1 – quoted prices in active markets for identical securities |
| ■ | Level 2 – other significant observable inputs (including quoted prices for similar securities, interest rates, prepayment speeds, credit risk, etc.) |
| ■ | Level 3 – significant unobservable inputs (including the Fund’s own assumptions in determining the fair value of investments) |
The inputs or methodologies used for valuing investments in securities are not necessarily an indication of the risk associated with investing in those securities.
The following is a summary of the inputs used in valuing the Fund’s assets and liabilities as of March 31, 2022:
| | Quoted prices
(Level 1) | Other significant
observable inputs
(Level 2) | Significant
unobservable inputs
(Level 3) | Total |
| Assets | | | | |
| Investments in: | | | | |
| Corporate bonds and notes | $ 0 | $ 5,363,611 | $0 | $ 5,363,611 |
| Foreign corporate bonds and notes | 0 | 15,979,105 | 0 | 15,979,105 |
| Foreign government bonds | 0 | 105,373,040 | 0 | 105,373,040 |
| U.S. Treasury securities | 1,248,406 | 0 | 0 | 1,248,406 |
| Yankee corporate bonds and notes | 0 | 409,520 | 0 | 409,520 |
| Yankee government bonds | 0 | 424,330 | 0 | 424,330 |
| Short-term investments | | | | |
| Investment companies | 5,137,372 | 0 | 0 | 5,137,372 |
| | 6,385,778 | 127,549,606 | 0 | 133,935,384 |
| Forward foreign currency contracts | 0 | 1,118,329 | 0 | 1,118,329 |
| Total assets | $6,385,778 | $128,667,935 | $0 | $135,053,713 |
| Liabilities | | | | |
| Forward foreign currency contracts | $ 0 | $ 3,057,404 | $0 | $ 3,057,404 |
| Total liabilities | $ 0 | $ 3,057,404 | $0 | $ 3,057,404 |
Forward foreign currency contracts are reported at their cumulative unrealized gains (losses) at measurement date as reported in the table following the Portfolio of Investments. All other assets and liabilities are reported at their market value at measurement date.
Additional sector, industry or geographic detail, if any, is included in the Portfolio of Investments.
For the six months ended March 31, 2022, the Fund did not have any transfers into/out of Level 3.
4. TRANSACTIONS WITH AFFILIATES
Management fee
Allspring Funds Management, a wholly owned subsidiary of Allspring Global Investments Holdings, LLC, a holding company indirectly owned by certain private funds of GTCR LLC and Reverence Capital Partners, L.P., is the manager of the Fund and provides advisory and fund-level administrative services under an investment management agreement. Under the investment management agreement, Allspring Funds Management is responsible for, among other services, implementing the investment objectives and strategies of the Fund, supervising the subadviser and providing fund-level administrative services in connection
26 | Allspring International Bond Fund
Notes to financial statements (unaudited)
with the Fund’s operations. As compensation for its services under the investment management agreement, Allspring Funds Management is entitled to receive a management fee at the following annual rate based on the Fund’s average daily net assets:
| Average daily net assets | Management fee |
| First $500 million | 0.600% |
| Next $500 million | 0.575 |
| Next $2 billion | 0.550 |
| Next $2 billion | 0.525 |
| Next $5 billion | 0.490 |
| Over $10 billion | 0.480 |
For the six months ended March 31, 2022, the management fee was equivalent to an annual rate of 0.60% of the Fund’s average daily net assets.
Allspring Funds Management has retained the services of a subadviser to provide daily portfolio management to the Fund. The fee for subadvisory services is borne by Allspring Funds Management. Allspring Global Investments (UK) Limited, an affiliate of Allspring Funds Management and a wholly owned subsidiary of Allspring Global Investments Holdings, LLC, is the subadviser to the Fund and is entitled to receive a fee from Allspring Funds Management at an annual rate starting at 0.35% and declining to 0.20% as the average daily net assets of the Fund increase.
Administration fees
Under a class-level administration agreement, Allspring Funds Management provides class-level administrative services to the Fund, which includes paying fees and expenses for services provided by the transfer agent, sub-transfer agents, omnibus account servicers and record-keepers. As compensation for its services under the class-level administration agreement, Allspring Funds Management receives an annual fee which is calculated based on the average daily net assets of each class as follows:
| | Class-level
administration fee |
| Class A | 0.16% |
| Class C | 0.16 |
| Class R6 | 0.03 |
| Administrator Class | 0.10 |
| Institutional Class | 0.08 |
Waivers and/or expense reimbursements
Allspring Funds Management has contractually committed to waive and/or reimburse management and administration fees to the extent necessary to maintain certain net operating expense ratios for the Fund. When each class of the Fund has exceeded its expense cap, Allspring Funds Management will waive fees and/or reimburse expenses from fund-level expenses on a proportionate basis and then from class specific expenses. When only certain classes exceed their expense caps, waivers and/or reimbursements are applied against class specific expenses before fund-level expenses. Allspring Funds Management has contractually committed through January 31, 2023 to waive fees and/or reimburse expenses to the extent necessary to cap expenses. Prior to or after the commitment expiration date, the caps may be increased or the commitment to maintain the caps may be terminated only with the approval of the Board of Trustees. As of March 31, 2022, the contractual expense caps are as follows:
Allspring International Bond Fund | 27
Notes to financial statements (unaudited)
| | Expense ratio caps |
| Class A | 1.03% |
| Class C | 1.78 |
| Class R6 | 0.65 |
| Administrator Class | 0.85 |
| Institutional Class | 0.70 |
Distribution fee
The Trust has adopted a distribution plan for Class C shares of the Fund pursuant to Rule 12b-1 under the 1940 Act. A distribution fee is charged to Class C shares and paid to Allspring Funds Distributor, LLC ("Allspring Funds Distributor"), the principal underwriter, an affiliate of Allspring Funds Management, at an annual rate of 0.75% of the average daily net assets of Class C shares.
In addition, Allspring Funds Distributor is entitled to receive the front-end sales charge from the purchase of Class A shares and a contingent deferred sales charge on the redemption of certain Class A shares. Allspring Funds Distributor is also entitled to receive the contingent deferred sales charges from redemptions of Class C shares. For the six months ended March 31, 2022, Allspring Funds Distributor received $80 from the sale of Class A shares. No contingent deferred sales charges were incurred by Class A and Class C shares for the six months ended March 31, 2022.
Shareholder servicing fees
The Trust has entered into contracts with one or more shareholder servicing agents, whereby Class A, Class C and Administrator Class of the Fund are charged a fee at an annual rate of 0.25% of the average daily net assets of each respective class. A portion of these total shareholder servicing fees were paid to affiliates, and to certain entities that were affiliates of the Fund until November 1, 2021.
Interfund transactions
The Fund may purchase or sell portfolio investment securities to certain affiliates pursuant to Rule 17a-7 under the 1940 Act and under procedures adopted by the Board of Trustees. The procedures have been designed to ensure that these interfund transactions, which do not incur broker commissions, are effected at current market prices.
5. INVESTMENT PORTFOLIO TRANSACTIONS
Purchases and sales of investments, excluding short-term securities, for the six months ended March 31, 2022 were as follows:
| Purchases at cost | | Sales proceeds |
U.S.
government | Non-U.S.
government | | U.S.
government | Non-U.S.
government |
| $1,248,615 | $68,388,285 | | $970,387 | $67,171,814 |
6. DERIVATIVE TRANSACTIONS
During the six months ended March 31, 2022, the Fund entered into forward foreign currency contracts for economic hedging purposes. The Fund had average contract amounts of $58,925,226 in forward foreign currency contracts to buy and $50,722,194 in forward foreign currency contracts to sell during the six months ended March 31, 2022.
The fair value, realized gains or losses and change in unrealized gains or losses, if any, on derivative instruments are reflected in the corresponding financial statement captions.
For certain types of derivative transactions, the Fund has entered into International Swaps and Derivatives Association, Inc. master agreements (“ISDA Master Agreements”) or similar agreements with approved counterparties. The ISDA Master Agreements or similar agreements may have requirements to deliver/deposit securities or cash to/with an exchange or broker-dealer as collateral and allows the Fund to offset, with each counterparty, certain derivative financial instrument’s assets and/or liabilities with collateral held or pledged. Collateral requirements differ by type of derivative. Collateral or margin requirements are set by the broker or exchange clearinghouse for exchange traded derivatives while collateral terms are contract specific for over-the-counter traded derivatives. Cash collateral that has been pledged to cover obligations of the Fund under ISDA Master Agreements or similar agreements, if any, are reported separately in the Statement of Assets and Liabilities. Securities pledged as collateral, if any, are noted in the Portfolio of Investments. With respect to balance sheet offsetting, absent an event of
28 | Allspring International Bond Fund
Notes to financial statements (unaudited)
default by the counterparty or a termination of the agreement, the reported amounts of financial assets and financial liabilities in the Statement of Assets and Liabilities are not offset across transactions between the Fund and the applicable counterparty. A reconciliation of the gross amounts on the Statement of Assets and Liabilities to the net amounts by counterparty, including any collateral exposure, for OTC derivatives is as follows:
| Counterparty | Gross amounts
of assets in the
Statement of
Assets and
Liabilities | Amounts
subject to
netting
agreements | Collateral
received | Net amount
of assets |
| State Street Bank & Trust Company | $1,118,329 | $(1,118,329) | $0 | $0 |
| Counterparty | Gross amounts
of assets in the
Statement of
Assets and
Liabilities | Amounts
subject to
netting
agreements | Collateral
pledged | Net amount
of liabilities |
| State Street Bank & Trust Company | $3,057,404 | $(1,118,329) | $0 | $1,939,075 |
7. BANK BORROWINGS
The Trust (excluding the money market funds), Allspring Master Trust and Allspring Variable Trust are parties to a $350,000,000 revolving credit agreement whereby the Fund is permitted to use bank borrowings for temporary or emergency purposes, such as to fund shareholder redemption requests. Interest under the credit agreement is charged to the Fund based on a borrowing rate equal to the higher of the Federal Funds rate in effect on that day plus 1.25% or the overnight bank funding rate in effect on that day plus 1.25%. In addition, an annual commitment fee equal to 0.25% of the unused balance is allocated to each participating fund.
For the six months ended March 31, 2022, there were no borrowings by the Fund under the agreement.
8. INDEMNIFICATION
Under the Fund's organizational documents, the officers and Trustees have been granted certain indemnification rights against certain liabilities that may arise out of performance of their duties to the Fund. The Fund has entered into a separate agreement with each Trustee that converts indemnification rights currently existing under the Fund’s organizational documents into contractual rights that cannot be changed in the future without the consent of the Trustee. Additionally, in the normal course of business, the Fund may enter into contracts with service providers that contain a variety of indemnification clauses. The Fund’s maximum exposure under these arrangements is dependent on future claims that may be made against the Fund and, therefore, cannot be estimated.
9. CORONAVIRUS (COVID-19) PANDEMIC
On March 11, 2020, the World Health Organization announced that it had made the assessment that coronavirus disease 2019 (“COVID-19”) is a pandemic. The impacts of COVID-19 are affecting the entire global economy, individual companies and investment products, the funds, and the market in general. There is significant uncertainty around the extent and duration of business disruptions related to COVID-19 and the impacts may last for an extended period of time. COVID-19 has led to significant uncertainty and volatility in the financial markets.
Allspring International Bond Fund | 29
Other information (unaudited)
PROXY VOTING INFORMATION
A description of the policies and procedures used to determine how to vote proxies relating to portfolio securities is available without charge, upon request, by calling 1-800-222-8222, visiting our website at allspringglobal.com, or visiting the SEC website at sec.gov. Information regarding how the proxies related to portfolio securities were voted during the most recent 12-month period ended June 30 is available on the website at allspringglobal.com or by visiting the SEC website at sec.gov.
QUARTERLY PORTFOLIO HOLDINGS INFORMATION
The Fund files its complete schedule of portfolio holdings with the SEC for the first and third quarters of each fiscal year as an exhibit to its reports on Form N-PORT. Shareholders may view the filed Form N-PORT by visiting the SEC website at sec.gov.
30 | Allspring International Bond Fund
Other information (unaudited)
BOARD OF TRUSTEES AND OFFICERS
Each of the Trustees and Officers listed in the table below acts in identical capacities for each fund in the Allspring family of funds, which consists of 138 mutual funds comprising the Allspring Funds Trust, Allspring Variable Trust, Allspring Master Trust and four closed-end funds (collectively the “Fund Complex”). This table should be read in conjunction with the Prospectus and the Statement of Additional Information1. The mailing address of each Trustee and Officer is 525 Market Street, 12th Floor, San Francisco, CA 94105. Each Trustee and Officer serves an indefinite term, however, each Trustee serves such term until reaching the mandatory retirement age established by the Trustees.
Independent Trustees
Name and
year of birth | Position held and
length of service* | Principal occupations during past five years or longer | Current other
public company or
investment
company
directorships |
William R. Ebsworth
(Born 1957) | Trustee,
since 2015 | Retired. From 1984 to 2013, equities analyst, portfolio manager, research director and chief investment officer at Fidelity Management and Research Company in Boston, Tokyo, and Hong Kong, and retired in 2013 as Chief Investment Officer of Fidelity Strategic Advisers, Inc. where he led a team of investment professionals managing client assets. Prior thereto, Board member of Hong Kong Securities Clearing Co., Hong Kong Options Clearing Corp., the Thailand International Fund, Ltd., Fidelity Investments Life Insurance Company, and Empire Fidelity Investments Life Insurance Company. Audit Committee Chair and Investment Committee Chair of the Vincent Memorial Hospital Endowment (non-profit organization). Mr. Ebsworth is a CFA® charterholder. | N/A |
Jane A. Freeman
(Born 1953) | Trustee,
since 2015;
Chair Liaison,
since 2018 | Retired. From 2012 to 2014 and 1999 to 2008, Chief Financial Officer of Scientific Learning Corporation. From 2008 to 2012, Ms. Freeman provided consulting services related to strategic business projects. Prior to 1999, Portfolio Manager at Rockefeller & Co. and Scudder, Stevens & Clark. Board member of the Harding Loevner Funds from 1996 to 2014, serving as both Lead Independent Director and chair of the Audit Committee. Board member of the Russell Exchange Traded Funds Trust from 2011 to 2012 and the chair of the Audit Committee. Ms. Freeman is also an inactive Chartered Financial Analyst. | N/A |
Isaiah Harris, Jr.
(Born 1952) | Trustee,
since 2009; Audit
Committee
Chair,
since 2019 | Retired. Chairman of the Board of CIGNA Corporation from 2009 to 2021, and Director from 2005 to 2008. From 2003 to 2011, Director of Deluxe Corporation. Prior thereto, President and CEO of BellSouth Advertising and Publishing Corp. from 2005 to 2007, President and CEO of BellSouth Enterprises from 2004 to 2005 and President of BellSouth Consumer Services from 2000 to 2003. Emeritus member of the Iowa State University Foundation Board of Governors. Emeritus Member of the Advisory Board of Iowa State University School of Business. Advisory Board Member, Palm Harbor Academy (private school). Advisory Board Member, Fellowship of Christian Athletes. Mr. Harris is a certified public accountant (inactive status). | N/A |
David F. Larcker
(Born 1950) | Trustee,
since 2009 | James Irvin Miller Professor of Accounting at the Graduate School of Business (Emeritus), Stanford University, Director of the Corporate Governance Research Initiative and Senior Faculty of The Rock Center for Corporate Governance since 2006. From 2005 to 2008, Professor of Accounting at the Graduate School of Business, Stanford University. Prior thereto, Ernst & Young Professor of Accounting at The Wharton School, University of Pennsylvania from 1985 to 2005. | N/A |
Allspring International Bond Fund | 31
Other information (unaudited)
Name and
year of birth | Position held and
length of service* | Principal occupations during past five years or longer | Current other
public company or
investment
company
directorships |
Olivia S. Mitchell
(Born 1953) | Trustee,
since 2006;
Nominating and
Governance
Committee Chair,
since 2018 | International Foundation of Employee Benefit Plans Professor since 1993, Wharton School of the University of Pennsylvania. Director of Wharton’s Pension Research Council and Boettner Center on Pensions & Retirement Research, and Research Associate at the National Bureau of Economic Research. Previously taught at Cornell University from 1978 to 1993. | N/A |
Timothy J. Penny
(Born 1951) | Trustee,
since 1996;
Chair,
since 2018 | President and Chief Executive Officer of Southern Minnesota Initiative Foundation, a non-profit organization, since 2007. Member of the Board of Trustees of NorthStar Education Finance, Inc., a non-profit organization, since 2007. | N/A |
James G. Polisson
(Born 1959) | Trustee,
since 2018 | Retired. Chief Marketing Officer, Source (ETF) UK Services, Ltd, from 2015 to 2017. From 2012 to 2015, Principal of The Polisson Group, LLC, a management consulting, corporate advisory and principal investing company. Chief Executive Officer and Managing Director at Russell Investments, Global Exchange Traded Funds from 2010 to 2012. Managing Director of Barclays Global Investors from 1998 to 2010 and Global Chief Marketing Officer for iShares and Barclays Global Investors from 2000 to 2010. Trustee of the San Francisco Mechanics’ Institute, a non-profit organization, from 2013 to 2015. Board member of the Russell Exchange Traded Fund Trust from 2011 to 2012. Director of Barclays Global Investors Holdings Deutschland GmbH from 2006 to 2009. Mr. Polisson is an attorney and has a retired status with the Massachusetts and District of Columbia Bar Associations. | N/A |
Pamela Wheelock
(Born 1959) | Trustee,
since January
2020; previously
Trustee from
January 2018 to
July 2019 | Board member of the Destination Medical Center Economic Development Agency, Rochester, Minnesota since 2019. Interim President of the McKnight Foundation from January to September 2020. McKnight Foundation Consultant, November 2020 to February 2021. Acting Commissioner, Minnesota Department of Human Services, July 2019 through September 2019. Consultant (part-time), Minnesota Department of Human Services, October 2019 through December 2019. Chief Operating Officer, Twin Cities Habitat for Humanity from 2017 to 2019. Vice President of University Services, University of Minnesota from 2012 to 2016. Prior thereto, on the Board of Directors, Governance Committee and Finance Committee for the Minnesota Philanthropy Partners (Saint Paul Foundation) from 2012 to 2018, Interim Chief Executive Officer of Blue Cross Blue Shield of Minnesota from 2011 to 2012, Chairman of the Board from 2009 to 2012 and Board Director from 2003 to 2015. Vice President, Leadership and Community Engagement, Bush Foundation, Saint Paul, Minnesota (a private foundation) from 2009 to 2011. Executive Vice President and Chief Financial Officer, Minnesota Sports and Entertainment from 2004 to 2009 and Senior Vice President from 2002 to 2004. Executive Vice President of the Minnesota Wild Foundation from 2004 to 2008. Commissioner of Finance, State of Minnesota, from 1999 to 2002. Currently Board Chair of the Minnesota Wild Foundation since 2010. | N/A |
* Length of service dates reflect the Trustee’s commencement of service with the Trust’s predecessor entities, where applicable.
32 | Allspring International Bond Fund
Other information (unaudited)
Officers2
Name and
year of birth | Position held and
length of service | Principal occupations during past five years or longer |
Andrew Owen
(Born 1960) | President,
since 2017 | President, Chief Executive Officer and Director of Allspring Funds Management, LLC since 2017 and co-president of Galliard Capital Management, LLC, an affiliate of Allspring Funds Management, LLC, since 2019. Prior thereto, Head of Affiliated Managers, Allspring Global Investments, from 2014 to 2019 and Executive Vice President responsible for marketing, investments and product development for Allspring Funds Management, LLC, from 2009 to 2014. In addition, Mr. Owen was an Executive Vice President of Wells Fargo & Company from 2014 to 2021. |
Jeremy DePalma
(Born 1974) | Treasurer,
since 2012
(for certain funds in
the Fund Complex);
since 2021 (for
the remaining funds in the
Fund Complex) | Senior Vice President of Allspring Funds Management, LLC since 2009. Senior Vice President of Evergreen Investment Management Company, LLC from 2008 to 2010 and head of the Fund Reporting and Control Team within Fund Administration from 2005 to 2010. |
Kate McKinley
(Born 1977) | Chief Legal Officer,
since 2021 | Chief Legal Officer of Allspring Global Investments since 2021. Prior thereto, held various roles at State Street Global Advisors beginning in 2010, including serving as Senior Vice President and General Counsel from 2019 to 2021, and Chief Operating Officer of the Institutional Client Group from 2016 - 2019. Prior to working at State Street Global Advisors served as Assistant General Counsel for Bank of America Corporation from 2005 to 2010 and as an Associate at WilmerHale from 2002 to 2005. |
Christopher Baker
(Born 1976) | Chief Compliance Officer, since 2022 | Global Chief Compliance Officer for Allspring Global Investments since 2022. Prior thereto, Chief Compliance Officer for State Street Global Advisors from 2018 to 2021. Senior Compliance Officer for the State Street divisions of Alternative Investment Solutions, Sector Solutions, and Global Marketing from 2015 to 2018. From 2010 to 2015 Vice President, Global Head of Investment and Marketing Compliance for State Street Global Advisors. |
Matthew Prasse
(Born 1983) | Secretary,
since 2021 | Senior Counsel of the Allspring Legal Department since 2021. Senior Counsel of the Wells Fargo Legal Department from 2018 to 2021. Previously, Counsel for Barings LLC from 2015 to 2018. Prior to joining Barings, Associate at Morgan, Lewis & Bockius LLP from 2008 to 2015. |
1 The Statement of Additional Information includes additional information about the Trustees and is available, without charge, upon request, by calling 1-800-222-8222 or by visiting the website at allspringglobal.com.
2 For those Officers with tenures at Allspring Global Investments and/or Allspring Funds Management, LLC that began prior to 2021, such tenures include years of service during which these businesses/entities were known as Wells Fargo Asset Management and Wells Fargo Funds Management, LLC, respectively.
Allspring International Bond Fund | 33
For more information
More information about Allspring Funds is available free upon request. To obtain literature, please write, visit the Fund's website, or call:
Allspring Funds
P.O. Box 219967
Kansas City, MO 64121-9967
Website: allspringglobal.com
Individual investors: 1-800-222-8222
Retail investment professionals: 1-888-877-9275
Institutional investment professionals: 1-800-260-5969
This report and the financial statements contained herein are submitted for the general information of the shareholders of the Fund. If this report is used for promotional purposes, distribution of the report must be accompanied or preceded by a current prospectus. Before investing, please consider the investment objectives, risks, charges, and expenses of the investment. For a current prospectus and, if available, a summary prospectus, containing this information, call
1-800-222-8222 or visit the Fund's website at allspringglobal.com. Read the prospectus carefully before you invest or send money.
Allspring Global InvestmentsTM is the trade name for the asset management firms of Allspring Global Investments Holdings, LLC, a holding company indirectly owned by certain private funds of GTCR LLC and Reverence Capital Partners, L.P. These firms include but are not limited to Allspring Global Investments, LLC, and Allspring Funds Management, LLC. Certain products managed by Allspring entities are distributed by Allspring Funds Distributor, LLC (a broker-dealer and Member FINRA/SIPC).
This material is for general informational and educational purposes only and is NOT intended to provide investment advice or a recommendation of any kind - including a recommendation for any specific investment, strategy, or plan.
© 2022 Allspring Global Investments Holdings, LLC. All rights reserved.
PAR-0522-00047 05-22
SA235/SAR235 03-22
ITEM 2. CODE OF ETHICS
Not applicable.
ITEM 3. AUDIT COMMITTEE FINANCIAL EXPERT
Not applicable.
ITEM 4. PRINCIPAL ACCOUNTANT FEES AND SERVICES
Not applicable.
ITEM 5. AUDIT COMMITTEE OF LISTED REGISTRANTS
Not applicable.
ITEM 6. INVESTMENTS
A Portfolio of Investments for each series of Allspring Funds Trust is included as part of the report to shareholders filed under Item 1 of this Form.
ITEM 7. DISCLOSURE OF PROXY VOTING POLICIES AND PROCEDURES FOR CLOSED-END MANAGEMENT INVESTMENT COMPANIES
Not applicable.
ITEM 8. PORTFOLIO MANAGERS OF CLOSED-END MANAGEMENT INVESTMENT COMPANIES
Not applicable.
ITEM 9. PURCHASES OF EQUITY SECURITIES BY CLOSED-END MANAGEMEENT INVESTMENT COMPANY AND AFFILIATED PURCHASERS
Not applicable.
ITEM 10. SUBMISSION OF MATTERS TO A VOTE OF SECURITY HOLDERS
There have been no material changes to the procedures by which shareholders may recommend nominees to the registrant’s Board of Trustees that have been implemented since the registrant’s last provided disclosure in response to the requirements of this Item.
ITEM 11. CONTROLS AND PROCEDURES
(a) The President and Treasurer have concluded that the Allspring Funds Trust disclosure controls and procedures (as defined in Rule 30a-3(c) under the Investment Company Act of 1940) provide reasonable assurances that material information relating to the registrant is made known to them by the appropriate persons, based on their evaluation of these controls and procedures as of a date within 90 days of the filing of this report.
(b) There were no significant changes in the registrant’s internal controls over financial reporting (as defined in Rule 30a-3(d) under the Investment Company Act of 1940) that occurred during the most recent fiscal half-year of the period covered by this report that materially affected, or is reasonably likely to materially affect, the registrant’s internal control over financial reporting.
ITEM 12. DISCLOSURES OF SECURITIES LENDING ACTIVITES FOR CLOSED-END MANAGEMENT INVESTMENT COMPANIES
Not applicable.
ITEM 13. EXHIBITS
(a)(1) Not applicable.
(a)(2) Certifications pursuant to Section 302 of the Sarbanes-Oxley Act of 2002.
(b) Certifications pursuant to Section 906 of the Sarbanes-Oxley Act of 2002.
SIGNATURES
Pursuant to the requirements of the Securities Exchange Act of 1934 and the Investment Company Act of 1940, the registrant has duly caused this report to be signed on its behalf by the undersigned, thereunto duly authorized.
| | |
| Allspring Funds Trust |
| |
| By: | | /s/ Andrew Owen |
| | Andrew Owen |
| | President |
|
| Date: May 25, 2022 |
Pursuant to the requirements of the Securities Exchange Act of 1934 and the Investment Company Act of 1940, this report has been signed below by the following persons on behalf of the registrant and in the capacities and on the date indicated.
| | |
| Allspring Funds Trust |
| |
| By: | | /s/ Andrew Owen |
| | Andrew Owen |
| | President |
|
| Date: May 25, 2022 |
|
| |
| By: | | /s/ Jeremy DePalma |
| | Jeremy DePalma |
| | Treasurer |
|
| Date: May 25, 2022 |