UNITED STATES
SECURITIES AND EXCHANGE COMMISSION
Washington, D.C. 20549
FORM N-CSRS
CERTIFIED SHAREHOLDER REPORT OF REGISTERED
MANAGEMENT INVESTMENT COMPANIES
Investment Company Act file number: 811-09253
Allspring Funds Trust
(Exact name of registrant as specified in charter)
525 Market St., San Francisco, CA 94105
(Address of principal executive offices) (Zip code)
Matthew Prasse
Allspring Funds Management, LLC
525 Market St., San Francisco, CA 94105
(Name and address of agent for service)
Registrant’s telephone number, including area code: 800-222-8222
Date of fiscal year end: December 31
Registrant is making a filing for 2 of its series:
Allspring Managed Account CoreBuilder® Shares - Series M and Allspring Managed Account CoreBuilder® Shares - Series SM.
Date of reporting period: June 30, 2022
| ITEM 1. | REPORT TO STOCKHOLDERS |
Semi-Annual Report
June 30, 2022
Allspring Managed Account
| ■ | Allspring Managed Account CoreBuilder® Shares – Series M |
The views expressed and any forward-looking statements are as of June 30, 2022, unless otherwise noted, and are those of the Fund's portfolio managers and/or Allspring Global Investments. Discussions of individual securities or the markets generally are not intended as individual recommendations. Future events or results may vary significantly from those expressed in any forward-looking statements. The views expressed are subject to change at any time in response to changing circumstances in the market. Allspring Global Investments disclaims any obligation to publicly update or revise any views expressed or forward-looking statements.
Allspring Managed Account | 1
Notice to Shareholders
Russia launched a large-scale invasion of Ukraine on February 24, 2022. As a result of this military action, the United States and many other countries have instituted various economic sanctions against Russian and Belarus individuals and entities. The situation has led to increased financial market volatility and has had severe adverse effects on regional and global economic markets, including the markets for certain securities and commodities, such as oil and natural gas. The extent and duration of the military action, resulting sanctions imposed, other punitive action taken and the resulting market disruptions cannot be easily predicted.
Our solidarity and support goes out to our impacted employees and the people affected in Ukraine and their families. Allspring has a dedicated team of investment professionals actively monitoring the situation for any new developments and the potential impact to our clients and investment products. As the situation remains fluid, we are focused on the assessment of risks, valuation, and liquidity of impacted securities. Please visit our website at allspringglobal.com and click on “Russia-Ukraine Updates” for further information.
2 | Allspring Managed Account
This page is intentionally left blank.
Performance highlights (unaudited)
| Investment objective | The Fund seeks total return, consisting of current income and capital appreciation. |
| Manager | Allspring Funds Management, LLC |
| Subadviser | Allspring Global Investments, LLC |
| Portfolio managers | Terry J. Goode, Robert J. Miller, Adrian Van Poppel, Nicholos Venditti |
| Average annual total returns (%) as of June 30, 2022 |
| | | | | | Expense ratios1 (%) |
| | Inception date | 1 year | 5 year | 10 year | Gross | Net 2 |
| Allspring Managed Account CoreBuilder Shares - Series M (WFCMX) | 4-14-2008 | -8.28 | 2.26 | 3.55 | 0.00 | 0.00 |
| Bloomberg Municipal Bond Index3 | – | -8.57 | 1.51 | 2.38 | – | – |
Figures quoted represent past performance, which is no guarantee of future results, and do not reflect taxes that a shareholder may pay on an investment in a fund. Investment return and principal value of an investment will fluctuate so that an investor’s shares, when redeemed, may be worth more or less than their original cost. Current performance may be lower or higher than the performance data quoted, which assumes the reinvestment of dividends and capital gains. Current month-end performance is available by calling 1-888-877-9275.
Index returns do not include transaction costs associated with buying and selling securities, any mutual fund fees or expenses, or any taxes. It is not possible to invest directly in an index.
Shares are sold without a front-end sales charge or contingent deferred sales charge.
| 1 | Reflects the expense ratios as stated in the most recent prospectus. The expense ratios shown are subject to change and may differ from the annualized expense ratios shown in the financial highlights of this report. |
| 2 | Generally, no ordinary fees or expenses are charged to the Fund. Allspring Funds Management, LLC has contractually committed to irrevocably absorb and pay or reimburse all ordinary operating expenses of the Fund, except portfolio transactions or other investment related costs (e.g., commissions), fees payable for services provided by the Fund’s securities lending agent (if any), interest, taxes, leverage expenses and other expenses not incurred in the ordinary course of the Fund’s business. This commitment has an indefinite term. |
| 3 | The Bloomberg Municipal Bond Index is an unmanaged index composed of long-term tax-exempt bonds with a minimum credit rating of Baa. You cannot invest directly in an index. |
Bond values fluctuate in response to the financial condition of individual issuers, general market and economic conditions, and changes in interest rates. Changes in market conditions and government policies may lead to periods of heightened volatility in the bond market and reduced liquidity for certain bonds held by the Fund. In general, when interest rates rise, bond values fall and investors may lose principal value. Interest rate changes and their impact on the Fund and its share price can be sudden and unpredictable. The use of derivatives may reduce returns and/or increase volatility. Certain investment strategies tend to increase the total risk of an investment (relative to the broader market). This fund is exposed to high-yield securities risk and municipal securities risk. Consult the Fund’s prospectus for additional information on these and other risks. A portion of the Fund’s income may be subject to federal, state, and/or local income taxes or the Alternative Minimum Tax (AMT). Any capital gains distributions may be taxable.
CoreBuilder Shares are a series of investment options within the separately managed accounts advised or subadvised by Allspring Funds Management, LLC. The shares are fee-waived mutual funds that enable certain separately managed account investors to achieve greater diversification than smaller managed accounts might otherwise achieve.
Please remember that shares of the Fund may be purchased only by or on behalf of separately managed account clients where Allspring Funds Management, LLC has an agreement to serve as investment adviser or subadviser to the account with the separately managed account sponsor (typically a registered investment adviser or broker/dealer) or directly with the client.
4 | Allspring Managed Account
Performance highlights (unaudited)
| Credit quality as of June 30, 20221 |
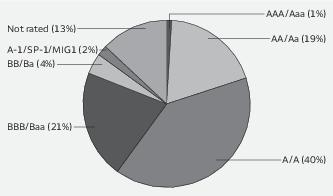
| 1 | The credit quality distribution of portfolio holdings reflected in the chart is based on ratings from Standard & Poor’s, Moody’s Investors Service, and/or Fitch Ratings Ltd. Credit quality ratings apply to the underlying holdings of the Fund and not to the Fund itself. The percentages of the portfolio with the ratings depicted in the chart are calculated based on the market value of fixed income securities held by the Fund. If a security was rated by all three rating agencies, the middle rating was utilized. If rated by two of the three rating agencies, the lower rating was utilized, and if rated by one of the rating agencies, that rating was utilized. Standard & Poor’s rates the creditworthiness of bonds, ranging from AAA (highest) to D (lowest). Ratings from A to CCC may be modified by the addition of a plus (+) or minus (-) sign to show relative standing within the rating categories. Standard & Poor’s rates the creditworthiness of short-term notes from SP-1 (highest) to SP-3 (lowest). Moody’s rates the creditworthiness of bonds, ranging from Aaa (highest) to C (lowest). Ratings Aa to B may be modified by the addition of a number 1 (highest) to 3 (lowest) to show relative standing within the ratings categories. Moody’s rates the creditworthiness of short-term U.S. tax-exempt municipal securities from MIG 1/VMIG 1 (highest) to SG (lowest). Fitch rates the creditworthiness of bonds, ranging from AAA (highest) to D (lowest). Credit quality distribution is subject to change and may have changed since the date specified. |
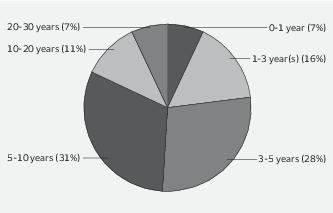
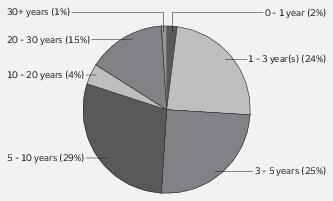
| Effective maturity distribution as of June 30, 20221 |
| 1 | Figures represent the percentage of the Fund's long-term investments. These amounts are subject to change and may have changed since the date specified. |
Allspring Managed Account | 5
Fund expenses (unaudited)
As a shareholder of the Fund, you incur ongoing costs and other Fund expenses. This example is intended to help you understand your ongoing costs (in dollars) of investing in the Fund and to compare these costs with the ongoing costs of investing in other mutual funds.
The example is based on an investment of $1,000 invested at the beginning of the six-month period and held for the entire period from January 1, 2022 to June 30, 2022.
Actual expenses
The “Actual” line of the table below provides information about actual account values and actual expenses. You may use the information in this line, together with the amount you invested, to estimate the expenses that you paid over the period. Simply divide your account value by $1,000 (for example, an $8,600 account value divided by $1,000 = 8.6), then multiply the result by the number in the “Actual” line under the heading entitled “Expenses paid during period” for your applicable class of shares to estimate the expenses you paid on your account during this period.
Hypothetical example for comparison purposes
The “Hypothetical” line of the table below provides information about hypothetical account values and hypothetical expenses based on the Fund’s actual expense ratio and an assumed rate of return of 5% per year before expenses, which is not the Fund’s actual return. The hypothetical account values and expenses may not be used to estimate the actual ending account balance or expenses you paid for the period. You may use this information to compare the ongoing costs of investing in the Fund and other funds. To do so, compare this 5% hypothetical example with the 5% hypothetical examples that appear in the shareholder reports of the other funds.
Please note that the expenses shown in the table are meant to highlight your ongoing costs only. Therefore, the “Hypothetical” line of the table is useful in comparing ongoing costs only, and will not help you determine the relative total costs of owning different funds.
| | Beginning
account value
1-1-2022 | Ending
account value
6-30-2022 | Expenses
paid during
the period1 | Annualized net
expense ratio |
| Actual | $1,000.00 | $ 910.56 | $0.00* | 0.00%* |
| Hypothetical (5% return before expenses) | $1,000.00 | $1,024.79 | $0.00* | 0.00%* |
1 Expenses paid is equal to the annualized net expense ratio multiplied by the average account value over the period, multiplied by 181 divided by 365 (to reflect the one-half-year period).
* Generally, no ordinary fees or expenses are charged to the Fund. Allspring Funds Management, LLC has contractually committed to irrevocably absorb and pay or reimburse all ordinary operating expenses of the Fund, except portfolio transactions or other investment related costs (e.g., commissions), fees payable for services provided by the Fund’s securities lending agent (if any), interest, taxes, leverage expenses and other expenses not incurred in the ordinary course of the Fund’s business. This commitment has an indefinite term.
6 | Allspring Managed Account
Portfolio of investments—June 30, 2022 (unaudited)
| | | Interest
rate | Maturity
date | Principal | Value |
| Municipal obligations: 95.74% | | | | | |
| Alabama: 0.83% | | | | | |
| Utilities revenue: 0.55% | | | | | |
| Southeast Alabama Energy Authority Commodity Supply Project #2 Series B | | 4.00% | 12-1-2051 | $ 1,000,000 | $ 995,568 |
| Southeast Alabama Gas Supply District Project #2 Series B (1 Month LIBOR +0.85%) ± | | 1.56 | 6-1-2049 | 2,925,000 | 2,882,267 |
| | | | | | 3,877,835 |
| Water & sewer revenue: 0.28% | | | | | |
| Jefferson County AL CAB Series B (AGM Insured) ¤ | | 0.00 | 10-1-2026 | 1,350,000 | 1,152,676 |
| Jefferson County AL Sewer Revenue Senior Lien (AGM Insured) | | 5.50 | 10-1-2053 | 760,000 | 797,938 |
| | | | | | 1,950,614 |
| | | | | | 5,828,449 |
| Alaska: 0.27% | | | | | |
| Health revenue: 0.27% | | | | | |
| Alaska Industrial Development & Export Authority Series A | | 5.00 | 10-1-2032 | 1,740,000 | 1,871,706 |
| Arizona: 2.91% | | | | | |
| Education revenue: 1.86% | | | | | |
| Arizona IDA Education Revenue Candeo Schools Incorporated Project Series 2020A (State School District Credit Program Insured) | | 4.00 | 7-1-2047 | 650,000 | 616,625 |
| Arizona IDA Education Revenue Series 2021A | | 4.00 | 7-1-2041 | 1,000,000 | 875,477 |
| Florence AZ IDA Legacy Traditional School Project Queen Creek & Casa Grande Campuses | | 5.00 | 7-1-2023 | 145,000 | 147,291 |
| La Paz County AZ IDA Educational Facility Imagine Schools West Middle Project Series A 144A | | 4.90 | 6-15-2028 | 405,000 | 398,437 |
| La Paz County AZ IDA Educational Facility Imagine Schools West Middle Project Series A 144A | | 5.75 | 6-15-2038 | 1,000,000 | 989,682 |
| Maricopa County AZ IDA Horizon Community Learning Center Project | | 5.00 | 7-1-2035 | 3,000,000 | 3,003,394 |
| Pima County AZ IDA Educational Facility Desert Heights Charter School | | 7.00 | 5-1-2034 | 1,000,000 | 1,036,089 |
| Pima County AZ IDA Facility Revenue Refunding Bond Series 2022 144A | | 4.00 | 6-15-2031 | 1,045,000 | 982,580 |
| Pima County AZ IDA Noah Webster Schools Project Series A | | 6.75 | 12-15-2033 | 1,120,000 | 1,163,736 |
| Pima County AZ IDA Paideia Academies Project 144A | | 5.00 | 7-1-2025 | 305,000 | 305,848 |
| Pima County AZ IDA Paideia Academies Project 144A | | 6.00 | 7-1-2035 | 1,475,000 | 1,501,962 |
| Pima County AZ IDA Paideia Academies Project 144A | | 6.13 | 7-1-2045 | 2,000,000 | 2,021,402 |
| | | | | | 13,042,523 |
| GO revenue: 0.07% | | | | | |
| Verrado AZ Community Facilities District #1 144A | | 5.00 | 7-15-2022 | 500,000 | 500,002 |
| Health revenue: 0.13% | | | | | |
| Tempe AZ IDA Series 2021A | | 4.00 | 12-1-2030 | 495,000 | 457,175 |
| Tempe AZ IDA Series 2021A | | 4.00 | 12-1-2031 | 470,000 | 426,158 |
| | | | | | 883,333 |
The accompanying notes are an integral part of these financial statements.
Allspring Managed Account | 7
Portfolio of investments—June 30, 2022 (unaudited)
| | | Interest
rate | Maturity
date | Principal | Value |
| Industrial development revenue: 0.05% | | | | | |
| Maricopa County AZ PCR Refunding Bonds Series A | | 2.40% | 6-1-2035 | $ 500,000 | $ 387,752 |
| Tax revenue: 0.18% | | | | | |
| City of San Luis AZ Pledged Excise Tax Series A (BAM Insured) | | 5.00 | 7-1-2038 | 1,200,000 | 1,253,936 |
| Utilities revenue: 0.62% | | | | | |
| Salt River Agricultural Improvement & Power Project Series A | | 5.00 | 12-1-2045 | 2,000,000 | 2,104,301 |
| Salt Verde Financial Corporation Gas Revenue Bond Series 2007-1 | | 5.00 | 12-1-2032 | 2,055,000 | 2,218,881 |
| | | | | | 4,323,182 |
| | | | | | 20,390,728 |
| California: 3.43% | | | | | |
| Airport revenue: 1.88% | | | | | |
| San Francisco CA City & County Airport Commission San Francisco International Airport Series B | | 5.00 | 5-1-2046 | 10,000,000 | 10,316,522 |
| San Jose CA Airport Revenue Refunding Bond AMT Series A | | 5.00 | 3-1-2033 | 1,695,000 | 1,844,224 |
| San Jose CA Airport Revenue Refunding Bond AMT Series A | | 5.00 | 3-1-2035 | 1,000,000 | 1,043,405 |
| | | | | | 13,204,151 |
| Education revenue: 0.15% | | | | | |
| California Municipal Finance Authority Charter School Albert Einstein Academies Project Series A | | 7.13 | 8-1-2043 | 1,000,000 | 1,056,200 |
| GO revenue: 0.49% | | | | | |
| Compton CA Community College District Election of 2002 CAB Series C ¤ | | 0.00 | 8-1-2029 | 500,000 | 389,178 |
| Hawthorne CA School District CAB Series C (NPFGC Insured) ¤ | | 0.00 | 11-1-2025 | 100,000 | 90,151 |
| Los Angeles CA Unified School District Series R | | 4.00 | 7-1-2044 | 3,000,000 | 2,961,663 |
| | | | | | 3,440,992 |
| Health revenue: 0.17% | | | | | |
| California HFFA Stanford Health Care Series A | | 4.00 | 8-15-2050 | 1,000,000 | 955,210 |
| University of California Regents Medical Center Unrefunded Bond Series J | | 5.25 | 5-15-2038 | 220,000 | 226,008 |
| | | | | | 1,181,218 |
| Housing revenue: 0.13% | | | | | |
| California Community Housing Agency Essential Housing Revenue Serenity at Larkspur Series C 144A | | 5.00 | 2-1-2050 | 500,000 | 457,437 |
| California HFA Municipal Certificate of Participation Series 2 Class A | | 4.00 | 3-20-2033 | 480,399 | 474,898 |
| | | | | | 932,335 |
The accompanying notes are an integral part of these financial statements.
8 | Allspring Managed Account
Portfolio of investments—June 30, 2022 (unaudited)
| | | Interest
rate | Maturity
date | Principal | Value |
| Miscellaneous revenue: 0.23% | | | | | |
| Anaheim CA PFA Convention Center Expansion Project Series A | | 5.00% | 5-1-2046 | $ 1,000,000 | $ 1,053,528 |
| San Diego CA PFA Capital Improvement Project Series B | | 5.00 | 10-15-2029 | 500,000 | 540,020 |
| | | | | | 1,593,548 |
| Transportation revenue: 0.30% | | | | | |
| Riverside County CA Transportation Commission Toll Revenue 2021 Series B-1 | | 4.00 | 6-1-2046 | 2,250,000 | 2,109,631 |
| Water & sewer revenue: 0.08% | | | | | |
| Los Angeles CA Department of Water & Power Series A | | 5.00 | 7-1-2039 | 500,000 | 524,358 |
| | | | | | 24,042,433 |
| Colorado: 2.89% | | | | | |
| Education revenue: 0.42% | | | | | |
| Colorado ECFA Charter School Banning Lewis Ranch Academy Project Series A | | 6.00 | 12-15-2037 | 1,375,000 | 1,488,949 |
| Colorado ECFA Charter School Community Leadership Academy Second Campus Project | | 7.00 | 8-1-2033 | 405,000 | 417,568 |
| Colorado ECFA Charter School Rocky Mountain Classical Academy Project Series A | | 8.13 | 9-1-2048 | 1,000,000 | 1,069,420 |
| | | | | | 2,975,937 |
| GO revenue: 0.72% | | | | | |
| Broadway Station Metropolitan District #3 | | 5.00 | 12-1-2039 | 749,000 | 737,869 |
| Colorado Aviation Station North Metropolitan District #2 Limited Series A | | 5.00 | 12-1-2039 | 750,000 | 703,175 |
| Colorado Aviation Station North Metropolitan District #2 Refunding & Improvement Bonds Limited Tax Series A | | 5.00 | 12-1-2048 | 850,000 | 758,094 |
| Douglas County CO Rampart Range Metropolitan District #5 Series 2021 | | 4.00 | 12-1-2036 | 1,000,000 | 872,882 |
| Southlands CO Metropolitan District #1 Series A-2 | | 5.00 | 12-1-2047 | 650,000 | 611,690 |
| Thompson Crossing Metropolitan District #4 | | 5.00 | 12-1-2039 | 1,400,000 | 1,374,406 |
| | | | | | 5,058,116 |
| Health revenue: 0.72% | | | | | |
| Colorado Health Facilities Authority CommonSpirit Health Series A2 | | 5.00 | 8-1-2044 | 3,000,000 | 3,064,626 |
| Colorado Health Facilities Authority Revenue Bonds Hospital Advent Health Obligated Group Series A | | 4.00 | 11-15-2043 | 2,000,000 | 1,973,926 |
| | | | | | 5,038,552 |
| Industrial development revenue: 0.37% | | | | | |
| Denver CO Convention Center Hotel Authority Senior Revenue Refunding Bonds Series 2016 | | 5.00 | 12-1-2033 | 2,500,000 | 2,568,576 |
| Miscellaneous revenue: 0.66% | | | | | |
| Colorado Certificate of Participation Rural Colorado Series A | | 4.00 | 12-15-2038 | 2,000,000 | 1,971,366 |
The accompanying notes are an integral part of these financial statements.
Allspring Managed Account | 9
Portfolio of investments—June 30, 2022 (unaudited)
| | | Interest
rate | Maturity
date | Principal | Value |
| Miscellaneous revenue (continued) | | | | | |
| Regents of the University of Colorado Certificate of Participation Series A | | 5.00% | 11-1-2028 | $ 1,000,000 | $ 1,042,062 |
| Westminster CO Public Schools Certificate of Participation Series 2019 (AGM Insured) | | 5.00 | 12-1-2048 | 1,500,000 | 1,612,847 |
| | | | | | 4,626,275 |
| | | | | | 20,267,456 |
| Connecticut: 1.71% | | | | | |
| Education revenue: 0.61% | | | | | |
| Connecticut State HEFAR Trinity College Series R | | 5.00 | 6-1-2035 | 850,000 | 923,534 |
| Connecticut State HEFAR Trinity College Series R | | 5.00 | 6-1-2036 | 880,000 | 954,544 |
| University of Connecticut Series A | | 5.00 | 2-15-2041 | 2,200,000 | 2,393,413 |
| | | | | | 4,271,491 |
| GO revenue: 0.71% | | | | | |
| Bridgeport CT Series A | | 5.00 | 6-1-2035 | 1,000,000 | 1,111,827 |
| Hamden CT (BAM Insured) | | 5.00 | 8-15-2024 | 450,000 | 474,494 |
| Hamden CT (BAM Insured) | | 5.00 | 8-15-2025 | 275,000 | 288,914 |
| Hamden CT Series A (BAM Insured) | | 4.00 | 8-1-2039 | 500,000 | 500,728 |
| Hamden CT Series A (BAM Insured) | | 5.00 | 8-1-2035 | 500,000 | 539,176 |
| Hartford CT Series 2013B | | 5.00 | 4-1-2028 | 2,055,000 | 2,092,697 |
| | | | | | 5,007,836 |
| Health revenue: 0.39% | | | | | |
| Connecticut HEFA Revenue Nuvance Health Series A | | 4.00 | 7-1-2041 | 860,000 | 771,766 |
| Connecticut HEFA Revenue Stamford Hospital Series M | | 4.00 | 7-1-2040 | 2,150,000 | 1,922,831 |
| | | | | | 2,694,597 |
| | | | | | 11,973,924 |
| Delaware: 0.29% | | | | | |
| Education revenue: 0.23% | | | | | |
| Delaware EDA Odyssey Charter School Incorporated Project Series A 144A | | 7.00 | 9-1-2045 | 1,500,000 | 1,572,467 |
| Transportation revenue: 0.06% | | | | | |
| Delaware River & Bay Authority Revenue Bonds Refunding Series 2022 %% | | 5.00 | 1-1-2037 | 400,000 | 446,110 |
| | | | | | 2,018,577 |
| District of Columbia: 0.23% | | | | | |
| Airport revenue: 0.23% | | | | | |
| Metropolitan Washington Airports Authority Series 2021A | | 5.00 | 10-1-2046 | 1,500,000 | 1,597,481 |
| Florida: 5.97% | | | | | |
| Airport revenue: 3.59% | | | | | |
| Broward County FL Airport System Revenue Bond AMT Series 2015A | | 5.00 | 10-1-2036 | 4,500,000 | 4,668,179 |
| Broward County FL Port Facilities Revenue Bond Series 2019B | | 4.00 | 9-1-2037 | 7,490,000 | 7,533,062 |
| Jacksonville FL Port Authority Series B | | 5.00 | 11-1-2040 | 2,625,000 | 2,857,486 |
The accompanying notes are an integral part of these financial statements.
10 | Allspring Managed Account
Portfolio of investments—June 30, 2022 (unaudited)
| | | Interest
rate | Maturity
date | Principal | Value |
| Airport revenue (continued) | | | | | |
| Jacksonville FL Port Authority Series B | | 5.00% | 11-1-2044 | $ 5,500,000 | $ 5,948,253 |
| Miami-Dade County FL Aviation Refunding Bond AMT Series A | | 5.00 | 10-1-2049 | 3,000,000 | 3,111,790 |
| Miami-Dade County FL Seaport AMT Series B | | 6.00 | 10-1-2033 | 1,000,000 | 1,048,550 |
| | | | | | 25,167,320 |
| Education revenue: 0.55% | | | | | |
| Florida Development Finance Corporation Educational Facilities Renaissance Charter School Project Series A | | 8.50 | 6-15-2044 | 1,000,000 | 1,062,164 |
| Florida Higher Educational Facilities Financing Authority Jacksonville University 144A | | 4.50 | 6-1-2033 | 1,300,000 | 1,251,620 |
| Miami-Dade County FL IDA Youth Co-Op Charter School Project Series 2015A 144A | | 5.75 | 9-15-2035 | 1,500,000 | 1,525,187 |
| | | | | | 3,838,971 |
| Health revenue: 0.77% | | | | | |
| Atlantic Beach FL HCFR Fleet Landing Project Series B | | 5.63 | 11-15-2043 | 1,500,000 | 1,522,342 |
| Holmes County FL Hospital Corporation Doctors Memorial Hospital Project | | 6.00 | 11-1-2038 | 250,000 | 235,627 |
| Jacksonville FL HCFR Brooks Rehabilitation | | 4.00 | 11-1-2045 | 1,500,000 | 1,343,780 |
| Tampa FL Hospital Revenue H Lee Moffitt Cancer Center Project | | 5.00 | 7-1-2030 | 225,000 | 248,249 |
| Tampa FL Hospital Revenue H Lee Moffitt Cancer Center Project | | 5.00 | 7-1-2031 | 450,000 | 492,573 |
| Tampa FL Hospital Revenue H Lee Moffitt Cancer Center Project | | 5.00 | 7-1-2032 | 250,000 | 270,868 |
| Tampa FL Hospital Revenue H Lee Moffitt Cancer Center Project | | 5.00 | 7-1-2033 | 250,000 | 269,882 |
| Tampa FL Hospital Revenue H Lee Moffitt Cancer Center Project | | 5.00 | 7-1-2035 | 475,000 | 507,256 |
| Tampa FL Hospital Revenue H Lee Moffitt Cancer Center Project | | 5.00 | 7-1-2036 | 475,000 | 506,424 |
| | | | | | 5,397,001 |
| Transportation revenue: 0.58% | | | | | |
| Florida State Department of Transportation Sunshine Bridge (AGM Insured) | | 4.00 | 7-1-2037 | 4,000,000 | 4,047,582 |
| Utilities revenue: 0.08% | | | | | |
| Lakeland FL Energy System Revenue Bond Series 2021 | | 5.00 | 10-1-2048 | 500,000 | 597,126 |
| Water & sewer revenue: 0.40% | | | | | |
| Orange County FL Water and Wastewater Revenue Utility | | 5.00 | 10-1-2040 | 1,090,000 | 1,214,427 |
| Wildwood FL Utility Dependent District Series 2021 (BAM Insured) | | 5.00 | 10-1-2038 | 1,455,000 | 1,638,109 |
| | | | | | 2,852,536 |
| | | | | | 41,900,536 |
The accompanying notes are an integral part of these financial statements.
Allspring Managed Account | 11
Portfolio of investments—June 30, 2022 (unaudited)
| | | Interest
rate | Maturity
date | Principal | Value |
| Georgia: 2.40% | | | | | |
| Energy revenue: 0.27% | | | | | |
| Municipal Electric Authority of Georgia Plant Vogtle Units 3 & 4 Project M | | 5.00% | 1-1-2036 | $ 800,000 | $ 844,803 |
| Municipal Electric Authority of Georgia Project One Subordinated Bond Series A | | 5.00 | 1-1-2044 | 1,000,000 | 1,036,479 |
| | | | | | 1,881,282 |
| Health revenue: 0.15% | | | | | |
| Fulton County GA Development Authority Hospital WellStar Health System Series A | | 5.00 | 4-1-2042 | 1,000,000 | 1,048,965 |
| Industrial development revenue: 0.13% | | | | | |
| Atlanta GA Development Authority Tuff Yamacraw LLC Project Series A (Ambac Insured) | | 5.00 | 1-1-2027 | 50,000 | 53,139 |
| George L Smith II Georgia World Congress Center Authority Convention Center Hotel Series B 144A | | 5.00 | 1-1-2054 | 1,000,000 | 855,573 |
| | | | | | 908,712 |
| Utilities revenue: 1.85% | | | | | |
| Burke County GA Development Authority Georgia Power Company Plant Vogtle Project Series 2 | | 2.93 | 11-1-2048 | 5,000,000 | 4,984,751 |
| Main Street Natural Gas Incorporated Georgia Gas Project Series C | | 4.00 | 5-1-2052 | 1,500,000 | 1,501,695 |
| Main Street Natural Gas Incorporated Georgia Gas Project Subordinate Bond Series A (Royal Bank of Canada LIQ) | | 4.00 | 4-1-2048 | 1,700,000 | 1,729,783 |
| Main Street Natural Gas Incorporated Georgia Gas Project Subordinate Bond Series B (1 Month LIBOR +0.75%) ± | | 1.46 | 4-1-2048 | 4,800,000 | 4,765,380 |
| | | | | | 12,981,609 |
| | | | | | 16,820,568 |
| Guam: 0.20% | | | | | |
| Tax revenue: 0.13% | | | | | |
| Guam Government Business Privilege Tax Revenue Refunding Bonds Series F | | 4.00 | 1-1-2042 | 1,000,000 | 882,295 |
| Water & sewer revenue: 0.07% | | | | | |
| Guam Government Waterworks Authority Water & Wastewater System Project Series 2013 | | 5.25 | 7-1-2022 | 500,000 | 500,000 |
| | | | | | 1,382,295 |
| Hawaii: 0.29% | | | | | |
| Airport revenue: 0.29% | | | | | |
| Hawaii Airports System Revenue Series A | | 5.00 | 7-1-2048 | 2,000,000 | 2,077,419 |
| Idaho: 0.19% | | | | | |
| Education revenue: 0.19% | | | | | |
| Idaho Housing & Finance Association Idaho Arts Charter School Series A 144A | | 5.00 | 12-1-2036 | 900,000 | 919,519 |
| Idaho Housing & Finance Association Legacy Public Charter School Incorporated Project Series A | | 5.85 | 5-1-2033 | 390,000 | 393,452 |
| | | | | | 1,312,971 |
The accompanying notes are an integral part of these financial statements.
12 | Allspring Managed Account
Portfolio of investments—June 30, 2022 (unaudited)
| | | Interest
rate | Maturity
date | Principal | Value |
| Illinois: 15.65% | | | | | |
| Airport revenue: 1.54% | | | | | |
| Chicago IL Midway Airport Second Lien Refunding Bonds Series A | | 5.50% | 1-1-2031 | $ 4,500,000 | $ 4,544,950 |
| Chicago IL O'Hare International Airport AMT Senior Lien Series C | | 5.50 | 1-1-2044 | 1,100,000 | 1,112,122 |
| Chicago IL O'Hare International Airport AMT Series A | | 5.00 | 1-1-2048 | 2,000,000 | 2,076,151 |
| Chicago IL O'Hare International Airport Customer Facility Charge Senior Lien Series D | | 5.75 | 1-1-2043 | 1,500,000 | 1,513,282 |
| Chicago IL O'Hare International Airport Senior Lien Series D | | 5.25 | 1-1-2032 | 1,000,000 | 1,012,382 |
| Chicago IL O'Hare International Airport Transportation Infrastructure Properties Obligated Group | | 5.00 | 7-1-2038 | 500,000 | 515,361 |
| | | | | | 10,774,248 |
| Education revenue: 0.41% | | | | | |
| Illinois Finance Authority Wesley University | | 5.00 | 9-1-2036 | 2,345,000 | 2,417,628 |
| Southern Illinois University Housing and Auxiliary Facilities System Refunding Revenue Series A (BAM Insured) | | 4.00 | 4-1-2031 | 450,000 | 452,026 |
| | | | | | 2,869,654 |
| GO revenue: 6.15% | | | | | |
| Chicago IL Board of Education Series 2021A | | 5.00 | 12-1-2035 | 4,250,000 | 4,376,180 |
| Chicago IL CAB City Colleges (NPFGC Insured) ¤ | | 0.00 | 1-1-2027 | 6,000,000 | 5,081,151 |
| Chicago IL City Colleges Capital Improvement Project CAB (NPFGC Insured) ¤ | | 0.00 | 1-1-2031 | 800,000 | 558,399 |
| Chicago IL Emergency Telephone System Project (NPFGC Insured) | | 5.50 | 1-1-2023 | 195,000 | 198,496 |
| Chicago IL Park District Limited Tax Park Bonds Series 2016A | | 5.00 | 1-1-2030 | 1,000,000 | 1,054,524 |
| Chicago IL Park District Limited Tax Park Bonds Series 2016A | | 5.00 | 1-1-2031 | 1,000,000 | 1,051,862 |
| Chicago IL Park District Limited Tax Park Bonds Series 2016A | | 5.00 | 1-1-2032 | 1,225,000 | 1,285,983 |
| Chicago IL Park District Limited Tax Park Bonds Series 2016A | | 5.00 | 1-1-2035 | 1,000,000 | 1,045,734 |
| Chicago IL Park District Unlimited Tax Refunding Bonds Series 2016A | | 5.00 | 11-15-2028 | 1,655,000 | 1,773,736 |
| Chicago IL Park District Unlimited Tax Refunding Bonds Series 2016E | | 5.00 | 11-15-2029 | 1,735,000 | 1,853,063 |
| Chicago IL Series 2021A | | 5.00 | 1-1-2034 | 2,500,000 | 2,591,966 |
| Chicago IL Series A | | 5.00 | 1-1-2027 | 2,000,000 | 2,115,045 |
| Chicago IL Series A | | 6.00 | 1-1-2038 | 3,500,000 | 3,757,259 |
| Cook County IL School District #144 Prairie Hills CAB Refunding Bond Series C (AGM Insured) ¤ | | 0.00 | 12-1-2025 | 675,000 | 605,329 |
| Cook County IL School District #159 CAB Prerefunded Bond (AGM Insured) ¤ | | 0.00 | 12-1-2023 | 455,000 | 442,130 |
| Cook County IL School District #159 CAB Unrefunded Bond (AGM Insured) ¤ | | 0.00 | 12-1-2023 | 160,000 | 154,227 |
| Illinois Series 2014 (AGM Insured) | | 5.00 | 4-1-2026 | 1,130,000 | 1,173,504 |
| Illinois Series 2016 | | 5.00 | 11-1-2025 | 2,000,000 | 2,117,672 |
| Illinois Series B | | 5.00 | 10-1-2031 | 2,000,000 | 2,146,254 |
| Kane, Cook & DuPage Counties IL Series A | | 5.00 | 1-1-2034 | 1,000,000 | 1,040,970 |
| Kane, Cook & DuPage Counties IL Series D | | 5.00 | 1-1-2034 | 1,700,000 | 1,769,649 |
| Village Bolingbrook IL (AGM Insured) | | 5.00 | 1-1-2031 | 500,000 | 531,327 |
The accompanying notes are an integral part of these financial statements.
Allspring Managed Account | 13
Portfolio of investments—June 30, 2022 (unaudited)
| | | Interest
rate | Maturity
date | Principal | Value |
| GO revenue (continued) | | | | | |
| Will County IL Community High School CAB Refunding Bond Series B (BAM Insured) ¤ | | 0.00% | 1-1-2033 | $ 1,625,000 | $ 1,074,020 |
| Will County IL Community High School Refunding Bond Series B (BAM Insured) | | 5.00 | 1-1-2030 | 1,000,000 | 1,010,742 |
| Will County IL Crete-Monee Community High School District #201 Series B (AGM Insured) | | 4.00 | 1-1-2032 | 715,000 | 735,388 |
| Will County IL Crete-Monee Community High School District #201 Series B (AGM Insured) | | 4.00 | 1-1-2033 | 745,000 | 764,035 |
| Will County IL Crete-Monee Community High School District #201 Series B (AGM Insured) | | 4.00 | 1-1-2035 | 475,000 | 486,453 |
| Will County IL Lincoln-Way Community High School District #210 CAB Refunding Bond Series B (BAM Insured) ¤ | | 0.00 | 1-1-2027 | 1,030,000 | 894,087 |
| Will County IL Lincoln-Way Community High School District #210 CAB Refunding Bond Series B (BAM Insured) ¤ | | 0.00 | 1-1-2028 | 475,000 | 396,072 |
| Winnebago County IL Series A (AGM Insured) | | 4.00 | 12-30-2025 | 1,035,000 | 1,084,143 |
| | | | | | 43,169,400 |
| Health revenue: 0.12% | | | | | |
| Illinois Finance Authority Health Services Facility Lease Revenue Provident Group UIC Surgery Center | | 4.00 | 10-1-2050 | 1,000,000 | 859,385 |
| Housing revenue: 0.28% | | | | | |
| Illinois Housing Development Authority Social Bonds Series D (GNMA/FNMA/FHLMC Insured, Bank of Montreal SPA) ø | | 0.95 | 4-1-2045 | 2,000,000 | 2,000,000 |
| Miscellaneous revenue: 1.10% | | | | | |
| Chicago IL Certificate of Participation River Point Plaza Redevelopment Project Series A 144A | | 4.84 | 4-15-2028 | 1,809,000 | 1,823,155 |
| Illinois Finance Authority Rogers Park Montessori School | | 5.00 | 2-1-2024 | 185,000 | 186,564 |
| Illinois Refunding Bonds Series 2016 | | 5.00 | 2-1-2026 | 1,000,000 | 1,062,067 |
| Illinois Series 2013 | | 5.50 | 7-1-2025 | 1,250,000 | 1,281,798 |
| Illinois Series 2013 | | 5.50 | 7-1-2033 | 1,000,000 | 1,020,935 |
| Illinois Series 2014 | | 5.00 | 5-1-2025 | 870,000 | 901,652 |
| Illinois Series B | | 5.25 | 7-1-2028 | 400,000 | 408,574 |
| Illinois Sports Facilities Authority | | 5.00 | 6-15-2029 | 1,000,000 | 1,022,316 |
| | | | | | 7,707,061 |
| Tax revenue: 3.18% | | | | | |
| Cook County IL Sales Tax Bond Series 2021A | | 5.00 | 11-15-2037 | 1,625,000 | 1,748,238 |
| Illinois Series A | | 4.00 | 1-1-2029 | 1,000,000 | 1,000,779 |
| Illinois Sports Facilities Authority State Tax Supported (AGM Insured) | | 5.25 | 6-15-2031 | 2,500,000 | 2,608,243 |
| Illinois Sports Facilities Authority State Tax Supported Refunding Bond (AGM Insured) | | 5.00 | 6-15-2028 | 1,500,000 | 1,563,404 |
| Metropolitan Pier & Exposition Authority CAB McCormick Place Expansion Project Series A (NPFGC Insured) ¤ | | 0.00 | 12-15-2030 | 11,000,000 | 7,868,163 |
| Metropolitan Pier & Exposition Authority CAB McCormick Place Expansion Project Series B (NPFGC Insured) ¤ | | 0.00 | 6-15-2029 | 1,950,000 | 1,496,976 |
| Metropolitan Pier & Exposition Authority CAB McCormick Place Expansion Project Series B1 (AGM Insured) ¤ | | 0.00 | 6-15-2027 | 5,150,000 | 4,381,897 |
The accompanying notes are an integral part of these financial statements.
14 | Allspring Managed Account
Portfolio of investments—June 30, 2022 (unaudited)
| | | Interest
rate | Maturity
date | Principal | Value |
| Tax revenue (continued) | | | | | |
| Metropolitan Pier & Exposition Authority Revenue Refunding Bonds McCormick Place Expansion Project Series A | | 4.00% | 12-15-2042 | $ 750,000 | $ 670,577 |
| Sales Tax Securitization Corporation Second Lien Sales Tax | | 4.00 | 1-1-2038 | 1,000,000 | 965,166 |
| | | | | | 22,303,443 |
| Transportation revenue: 1.00% | | | | | |
| Illinois Toll Highway Authority | | 5.00 | 1-1-2031 | 1,500,000 | 1,708,446 |
| Illinois Toll Highway Authority Senior Series A | | 5.00 | 1-1-2043 | 2,000,000 | 2,177,745 |
| Illinois Toll Highway Authority Senior Series B | | 5.00 | 1-1-2039 | 1,030,000 | 1,054,764 |
| Illinois Toll Highway Authority Series B | | 5.00 | 1-1-2028 | 1,830,000 | 2,054,477 |
| | | | | | 6,995,432 |
| Water & sewer revenue: 1.87% | | | | | |
| Chicago IL Wastewater Second Lien Transmission Revenue Project Bonds Series 2014 | | 5.00 | 1-1-2025 | 1,985,000 | 2,057,913 |
| Chicago IL Wastewater Transmission Second Lien Series 2012 | | 5.00 | 1-1-2027 | 1,000,000 | 1,001,581 |
| Chicago IL Water Revenue Refunding Bond Second Lien | | 5.00 | 11-1-2025 | 2,600,000 | 2,748,336 |
| Chicago IL Water Revenue Second Lien Project | | 5.00 | 11-1-2026 | 2,750,000 | 2,861,417 |
| Chicago IL Waterworks Second Lien Series 2004 | | 5.00 | 11-1-2027 | 2,250,000 | 2,390,267 |
| Chicago IL Waterworks Second Lien Series 2012 | | 5.00 | 11-1-2030 | 1,000,000 | 1,006,852 |
| Chicago IL Waterworks Second Lien Series 2017-2 (AGM Insured) | | 5.00 | 11-1-2037 | 1,000,000 | 1,072,896 |
| | | | | | 13,139,262 |
| | | | | | 109,817,885 |
| Indiana: 1.55% | | | | | |
| Education revenue: 0.22% | | | | | |
| Indiana Finance Authority Educational Facilities Multipurpose DePauw University Project Series 2022A | | 5.00 | 7-1-2047 | 1,500,000 | 1,529,711 |
| Health revenue: 0.76% | | | | | |
| Indiana Finance Authority Health System Franciscan Alliance Incorporated Obligated Group Series C | | 4.00 | 11-1-2034 | 5,360,000 | 5,370,374 |
| Industrial development revenue: 0.15% | | | | | |
| Indiana Finance Authority Ohio River Bridges East End Crossing Project Series A | | 5.00 | 7-1-2035 | 1,000,000 | 1,029,119 |
| Miscellaneous revenue: 0.42% | | | | | |
| Indianapolis IN Local Public Improvement Series 2015E | | 5.00 | 1-1-2035 | 2,675,000 | 2,928,632 |
| | | | | | 10,857,836 |
| Kansas: 0.60% | | | | | |
| Tax revenue: 0.60% | | | | | |
| Wyandotte County & Kansas City KS Special Obligation Vacation Village Project Area 4 Major Multi-Sport Athletic Complex Project CAB Series 2015 144A¤ | | 0.00 | 9-1-2034 | 15,015,000 | 4,226,578 |
The accompanying notes are an integral part of these financial statements.
Allspring Managed Account | 15
Portfolio of investments—June 30, 2022 (unaudited)
| | | Interest
rate | Maturity
date | Principal | Value |
| Kentucky: 1.68% | | | | | |
| Transportation revenue: 0.14% | | | | | |
| Kentucky Public Transportation Infrastructure Authority Downtown Crossing Project CAB Series B ¤ | | 0.00% | 7-1-2029 | $ 1,400,000 | $ 1,028,942 |
| Utilities revenue: 1.54% | | | | | |
| Kentucky Public Energy Authority Gas Supply Series A-1 | | 4.00 | 12-1-2049 | 9,020,000 | 9,140,249 |
| Paducah KY Electric Plant (AGM Insured) | | 5.00 | 10-1-2035 | 1,510,000 | 1,660,377 |
| | | | | | 10,800,626 |
| | | | | | 11,829,568 |
| Louisiana: 0.61% | | | | | |
| Airport revenue: 0.10% | | | | | |
| Port New Orleans LA Board Commuters Port Facility Revenue AMT Series E | | 5.00 | 4-1-2038 | 640,000 | 680,421 |
| Industrial development revenue: 0.13% | | | | | |
| St. John the Baptist Parish LA Series A | | 2.20 | 6-1-2037 | 1,000,000 | 929,685 |
| Water & sewer revenue: 0.38% | | | | | |
| Greater Ouachita Water Company (BAM Insured) | | 4.00 | 9-1-2033 | 600,000 | 635,570 |
| Greater Ouachita Water Company (BAM Insured) | | 4.00 | 9-1-2034 | 500,000 | 528,555 |
| Greater Ouachita Water Company (BAM Insured) | | 4.00 | 9-1-2035 | 500,000 | 525,952 |
| Greater Ouachita Water Company (BAM Insured) | | 4.00 | 9-1-2036 | 565,000 | 589,678 |
| Greater Ouachita Water Company (BAM Insured) | | 4.00 | 9-1-2037 | 415,000 | 429,710 |
| | | | | | 2,709,465 |
| | | | | | 4,319,571 |
| Maine: 0.05% | | | | | |
| Airport revenue: 0.05% | | | | | |
| Portland ME General Airport | | 5.00 | 7-1-2022 | 150,000 | 150,000 |
| Portland ME General Airport | | 5.00 | 7-1-2023 | 175,000 | 179,887 |
| | | | | | 329,887 |
| Maryland: 1.98% | | | | | |
| Airport revenue: 0.48% | | | | | |
| Maryland State Economic Development Corporation | | 4.00 | 7-1-2039 | 1,100,000 | 997,561 |
| Maryland State Economic Development Corporation | | 4.00 | 7-1-2044 | 750,000 | 651,663 |
| Maryland State Economic Development Corporation | | 5.00 | 7-1-2024 | 645,000 | 661,874 |
| Maryland State Economic Development Corporation | | 5.00 | 7-1-2027 | 800,000 | 835,237 |
| Maryland State Economic Development Corporation | | 5.00 | 7-1-2029 | 220,000 | 229,923 |
| | | | | | 3,376,258 |
| Education revenue: 0.78% | | | | | |
| Prince George's County MD Chesapeake Lighthouse Charter School Project Series 2016-A | | 5.75 | 8-1-2033 | 1,000,000 | 1,018,204 |
| Prince George's County MD Chesapeake Lighthouse Charter School Project Series 2016-A | | 7.00 | 8-1-2046 | 1,500,000 | 1,579,404 |
| Prince George's County MD Chesapeake Lighthouse Charter School Project Series 2018-A2 | | 6.00 | 8-1-2048 | 2,825,000 | 2,885,261 |
| | | | | | 5,482,869 |
The accompanying notes are an integral part of these financial statements.
16 | Allspring Managed Account
Portfolio of investments—June 30, 2022 (unaudited)
| | | Interest
rate | Maturity
date | Principal | Value |
| Health revenue: 0.72% | | | | | |
| Maryland HEFAR Adventist Healthcare Series 2021B | | 4.00% | 1-1-2051 | $ 5,000,000 | $ 4,519,744 |
| Maryland HEFAR Frederick Health System | | 4.00 | 7-1-2040 | 550,000 | 525,553 |
| | | | | | 5,045,297 |
| | | | | | 13,904,424 |
| Massachusetts: 0.67% | | | | | |
| Miscellaneous revenue: 0.14% | | | | | |
| Massachusetts Refunding Bond Series D | | 4.00 | 11-1-2040 | 1,000,000 | 997,506 |
| Tax revenue: 0.53% | | | | | |
| Massachusetts School Building Authority Series A | | 5.00 | 11-15-2034 | 1,470,000 | 1,603,334 |
| Massachusetts School Building Authority Series D | | 5.00 | 8-15-2037 | 2,000,000 | 2,112,635 |
| | | | | | 3,715,969 |
| | | | | | 4,713,475 |
| Michigan: 3.50% | | | | | |
| Education revenue: 0.06% | | | | | |
| Western Michigan University | | 5.25 | 11-15-2031 | 400,000 | 418,654 |
| Health revenue: 0.14% | | | | | |
| Michigan Finance Authority Hospital Revenue & Refunding Bonds Series 2015 | | 5.00 | 11-15-2045 | 1,000,000 | 1,018,639 |
| Miscellaneous revenue: 0.27% | | | | | |
| Michigan Finance Authority Charter Company Wayne Criminal Justice Center Project | | 4.00 | 11-1-2048 | 2,000,000 | 1,898,338 |
| Tax revenue: 0.58% | | | | | |
| Michigan Finance Authority Local Government Loan Program Public Lighting Authority Refunding Bonds Series B | | 5.00 | 7-1-2039 | 4,000,000 | 4,044,571 |
| Water & sewer revenue: 2.45% | | | | | |
| Great Lakes Michigan Water Authority Sewage Disposal System Series 2016-C | | 5.00 | 7-1-2036 | 3,560,000 | 3,788,097 |
| Great Lakes Michigan Water Authority Water Supply System Series 2016-D | | 4.00 | 7-1-2032 | 4,000,000 | 4,094,868 |
| Great Lakes Michigan Water Authority Water Supply System Series 2016-D (AGM Insured) | | 4.00 | 7-1-2033 | 4,000,000 | 4,101,855 |
| Michigan Finance Authority Local Government Loan Program Series D | | 5.00 | 7-1-2030 | 4,000,000 | 4,145,130 |
| Michigan Finance Authority Local Government Loan Program Series D4 | | 5.00 | 7-1-2029 | 1,000,000 | 1,038,047 |
| | | | | | 17,167,997 |
| | | | | | 24,548,199 |
| Minnesota: 1.47% | | | | | |
| Education revenue: 0.04% | | | | | |
| Independence MN Charter School Lease Series A | | 4.25 | 7-1-2026 | 300,000 | 293,010 |
The accompanying notes are an integral part of these financial statements.
Allspring Managed Account | 17
Portfolio of investments—June 30, 2022 (unaudited)
| | | Interest
rate | Maturity
date | Principal | Value |
| GO revenue: 1.43% | | | | | |
| JPMorgan Chase Puttable Tax-Exempt Receipts Trust Series 5027 (JPMorgan Chase & Company LIQ) 144Aø | | 1.09% | 3-20-2024 | $10,000,000 | $ 10,000,000 |
| | | | | | 10,293,010 |
| Mississippi: 0.88% | | | | | |
| Miscellaneous revenue: 0.47% | | | | | |
| Mississippi City of Jackson Convention Center Series A (Municipal Government Guaranty Insured) | | 5.00 | 3-1-2026 | 3,050,000 | 3,270,311 |
| Resource recovery revenue: 0.28% | | | | | |
| Mississippi Business Finance Corporation AMT Waste Pro USA Incorporated Project 144A | | 5.00 | 2-1-2036 | 2,000,000 | 1,997,072 |
| Water & sewer revenue: 0.13% | | | | | |
| Mississippi Development Bank Special Obligation Bonds Series 2012A Jackson Water & Sewer System Project (AGM Insured) | | 5.00 | 9-1-2030 | 915,000 | 917,836 |
| | | | | | 6,185,219 |
| Missouri: 0.74% | | | | | |
| Miscellaneous revenue: 0.74% | | | | | |
| Kansas City MO IDA Series B (AGM Insured) | | 5.00 | 3-1-2049 | 5,000,000 | 5,190,939 |
| Nebraska: 0.30% | | | | | |
| Utilities revenue: 0.30% | | | | | |
| Central Plains Energy Nebraska Gas Project #1 (Royal Bank of Canada LIQ) | | 4.00 | 12-1-2049 | 2,080,000 | 2,136,731 |
| Nevada: 0.92% | | | | | |
| GO revenue: 0.86% | | | | | |
| Clark County NV School District Limited Tax Building Series A (AGM Insured) | | 4.00 | 6-15-2040 | 750,000 | 751,049 |
| Clark County NV School District Series A (AGM Insured) | | 4.00 | 6-15-2035 | 2,000,000 | 2,056,246 |
| Clark County NV Series A | | 5.00 | 5-1-2048 | 3,000,000 | 3,218,131 |
| | | | | | 6,025,426 |
| Industrial development revenue: 0.06% | | | | | |
| Clark County NV Southern California Edison Company Project | | 2.10 | 6-1-2031 | 500,000 | 412,426 |
| | | | | | 6,437,852 |
| New Hampshire: 0.88% | | | | | |
| Housing revenue: 0.27% | | | | | |
| New Hampshire National Finance Authority Municipal Certificates Series A | | 4.13 | 1-20-2034 | 1,931,738 | 1,900,372 |
| Water & sewer revenue: 0.61% | | | | | |
| New Hampshire Business Authority Water Facility Pennichuck Water Works Incorporated Project Series A | | 5.00 | 1-1-2026 | 1,000,000 | 1,063,902 |
| New Hampshire Business Authority Water Facility Pennichuck Water Works Incorporated Project Series A | | 5.00 | 1-1-2027 | 845,000 | 916,226 |
The accompanying notes are an integral part of these financial statements.
18 | Allspring Managed Account
Portfolio of investments—June 30, 2022 (unaudited)
| | | Interest
rate | Maturity
date | Principal | Value |
| Water & sewer revenue (continued) | | | | | |
| New Hampshire Business Authority Water Facility Pennichuck Water Works Incorporated Project Series A | | 5.00% | 1-1-2028 | $ 480,000 | $ 520,460 |
| New Hampshire Business Authority Water Facility Pennichuck Water Works Incorporated Project Series A | | 5.00 | 1-1-2028 | 1,690,000 | 1,797,995 |
| | | | | | 4,298,583 |
| | | | | | 6,198,955 |
| New Jersey: 4.90% | | | | | |
| Education revenue: 1.25% | | | | | |
| Atlantic County NJ Improvement Authority Stockton University Series A (AGM Insured) | | 4.00 | 7-1-2041 | 530,000 | 513,170 |
| New Jersey EDA | | 5.00 | 3-1-2027 | 160,000 | 162,661 |
| New Jersey EDA Hatikvah International Academy Charter School Project Series A 144A | | 5.00 | 7-1-2027 | 500,000 | 501,090 |
| New Jersey EDA Hatikvah International Academy Charter School Project Series A 144A | | 5.25 | 7-1-2037 | 1,500,000 | 1,412,393 |
| New Jersey EDA School Facilities Construction Project Series NN | | 5.00 | 3-1-2028 | 5,000,000 | 5,112,758 |
| New Jersey Educational Facilities Authority Higher Education Facilities Trust Fund | | 5.00 | 6-15-2025 | 1,000,000 | 1,035,480 |
| | | | | | 8,737,552 |
| GO revenue: 0.36% | | | | | |
| Newark NJ Qualified General Improvement Series A | | 5.00 | 7-15-2025 | 2,355,000 | 2,499,210 |
| Housing revenue: 1.22% | | | | | |
| New Jersey Housing and Mortgage Finance Agency Series B | | 3.30 | 10-1-2025 | 3,470,000 | 3,490,439 |
| New Jersey Housing and Mortgage Finance Agency Series B | | 3.40 | 4-1-2026 | 3,500,000 | 3,537,499 |
| New Jersey Housing and Mortgage Finance Agency Series B | | 3.45 | 10-1-2026 | 1,535,000 | 1,555,502 |
| | | | | | 8,583,440 |
| Tax revenue: 0.77% | | | | | |
| New Jersey EDA Motor Vehicle Surcharge Unrefunded Bonds Series A (NPFGC Insured) | | 5.25 | 7-1-2026 | 205,000 | 222,038 |
| New Jersey Garden State Preservation Trust Open & Farmland Series A (AGM Insured) | | 5.75 | 11-1-2028 | 1,500,000 | 1,681,554 |
| New Jersey TTFA Series AA | | 4.00 | 6-15-2039 | 2,250,000 | 2,200,329 |
| New Jersey TTFA Series AA | | 5.00 | 6-15-2040 | 1,250,000 | 1,320,850 |
| | | | | | 5,424,771 |
| Transportation revenue: 1.13% | | | | | |
| New Jersey TTFA CAB Series A ¤ | | 0.00 | 12-15-2031 | 2,500,000 | 1,696,123 |
| New Jersey TTFA Series A | | 4.00 | 6-15-2042 | 750,000 | 707,174 |
| New Jersey TTFA Series A | | 5.00 | 6-15-2029 | 2,000,000 | 2,140,525 |
| New Jersey TTFA Series AA | | 4.00 | 6-15-2045 | 2,000,000 | 1,853,376 |
| New Jersey TTFA Series AA | | 5.00 | 6-15-2045 | 1,500,000 | 1,530,916 |
| | | | | | 7,928,114 |
The accompanying notes are an integral part of these financial statements.
Allspring Managed Account | 19
Portfolio of investments—June 30, 2022 (unaudited)
| | | Interest
rate | Maturity
date | Principal | Value |
| Water & sewer revenue: 0.17% | | | | | |
| New Jersey EDA | | 2.20% | 10-1-2039 | $ 1,350,000 | $ 1,191,338 |
| | | | | | 34,364,425 |
| New Mexico: 0.79% | | | | | |
| Utilities revenue: 0.79% | | | | | |
| New Mexico Municipal Energy Acquisition Authority Gas Supply Revenue Refunding & Acquisition Bond Subordinated Series A (Royal Bank of Canada LIQ) | | 5.00 | 11-1-2039 | 5,240,000 | 5,521,589 |
| New York: 6.25% | | | | | |
| Airport revenue: 0.58% | | | | | |
| New York Transportation Development Corporation Special Facility Revenue Terminal 4 JFK International Airport | | 5.00 | 12-1-2033 | 1,000,000 | 1,053,323 |
| New York Transportation Development Corporation Special Facility Revenue Terminal 4 JFK International Airport | | 5.00 | 12-1-2034 | 2,000,000 | 2,112,125 |
| Port Authority of New York and New Jersey Consolidated Series 221 | | 4.00 | 7-15-2040 | 1,000,000 | 946,769 |
| | | | | | 4,112,217 |
| Education revenue: 1.72% | | | | | |
| City of Troy NY Capital Resource Corporation Revenue Refunding Bonds | | 4.00 | 9-1-2030 | 500,000 | 516,246 |
| City of Troy NY Capital Resource Corporation Revenue Refunding Bonds | | 4.00 | 9-1-2032 | 350,000 | 354,639 |
| Hempstead NY Local Development Corporation Education Revenue Refunding Bond Academy Charter School Project | | 5.66 | 2-1-2044 | 4,585,000 | 4,624,073 |
| Hempstead NY Local Development Corporation The Academy Charter School Project Series A | | 4.45 | 2-1-2041 | 1,155,000 | 950,470 |
| Hempstead NY Local Development Corporation The Academy Charter School Project Series A | | 4.60 | 2-1-2051 | 1,915,000 | 1,496,472 |
| Hempstead NY Local Development Corporation The Academy Charter School Project Series A | | 6.24 | 2-1-2047 | 3,500,000 | 3,644,827 |
| Monroe County NY IDA Refunding Bond Monroe Community College Association (AGM Insured) | | 5.00 | 1-15-2038 | 500,000 | 514,740 |
| | | | | | 12,101,467 |
| Health revenue: 0.31% | | | | | |
| Broome County NY Local Development Corporation Revenue United Health Services Hospitals Incorporated Project (AGM Insured) | | 4.00 | 4-1-2038 | 1,250,000 | 1,236,895 |
| Dutchess County NY Local Development Corporation Series B | | 4.00 | 7-1-2049 | 515,000 | 458,752 |
| Westchester County NY Local Development Corporation Purchase Senior Learning Community Incorporated 144A | | 2.88 | 7-1-2026 | 500,000 | 466,985 |
| | | | | | 2,162,632 |
| Industrial development revenue: 0.80% | | | | | |
| New York Liberty Development Corporation Refunding Bonds 4 World Trade Center Project | | 2.80 | 9-15-2069 | 1,000,000 | 903,397 |
The accompanying notes are an integral part of these financial statements.
20 | Allspring Managed Account
Portfolio of investments—June 30, 2022 (unaudited)
| | | Interest
rate | Maturity
date | Principal | Value |
| Industrial development revenue (continued) | | | | | |
| New York Transportation Development Corporation Special Delta Air Lines Incorporated LaGuardia | | 5.00% | 1-1-2031 | $ 1,135,000 | $ 1,158,420 |
| New York Transportation Development Corporation Special Facility AMT Revenue Delta Air Lines Incorporated LaGuardia Airport Terminals C&D Redevelopment | | 5.00 | 10-1-2035 | 3,500,000 | 3,539,695 |
| | | | | | 5,601,512 |
| Miscellaneous revenue: 0.06% | | | | | |
| New York Western Regional Off Track Betting Corporation 144A | | 4.13 | 12-1-2041 | 500,000 | 394,310 |
| Tax revenue: 0.83% | | | | | |
| New York Dormitory Authority Series A | | 4.00 | 3-15-2042 | 1,500,000 | 1,468,248 |
| New York Urban Development Corporation Series 2020C | | 4.00 | 3-15-2042 | 3,000,000 | 2,928,605 |
| New York Urban Development Corporation Series 2020E | | 4.00 | 3-15-2043 | 1,500,000 | 1,458,346 |
| | | | | | 5,855,199 |
| Transportation revenue: 1.20% | | | | | |
| New York Metropolitan Transportation Authority Refunding Bond Subordinated Series C1 | | 5.25 | 11-15-2031 | 3,000,000 | 3,152,412 |
| New York Metropolitan Transportation Authority Series C | | 5.00 | 11-15-2034 | 3,000,000 | 3,139,259 |
| New York Metropolitan Transportation Authority Series C | | 5.25 | 11-15-2030 | 2,000,000 | 2,109,386 |
| | | | | | 8,401,057 |
| Water & sewer revenue: 0.75% | | | | | |
| New York NY Municipal Water Finance Authority 2nd General Resolution Series FF | | 4.00 | 6-15-2041 | 4,895,000 | 4,859,391 |
| Western Nassau County NY Water Authority Series B | | 5.00 | 4-1-2025 | 355,000 | 382,886 |
| | | | | | 5,242,277 |
| | | | | | 43,870,671 |
| Ohio: 3.28% | | | | | |
| Airport revenue: 0.31% | | | | | |
| Port of Greater Cincinnati Development Authority | | 4.38 | 6-15-2056 | 2,340,000 | 2,166,643 |
| Health revenue: 1.60% | | | | | |
| Cleveland Cuyahoga County OH Port Authority Economic Development Center for Dialysis Care Project Series A | | 5.00 | 12-1-2037 | 2,700,000 | 2,763,188 |
| Lucas County OH Hospital Revenue Promedica Healthcare Obligation | | 5.25 | 11-15-2048 | 5,000,000 | 4,786,045 |
| Middleburg Heights OH Hospital Revenue Refunding Bonds Facilities Southwest General Health Center | | 4.00 | 8-1-2041 | 2,000,000 | 1,880,720 |
| Montgomery County OH Hospital Revenue Refunding Bonds | | 4.00 | 11-15-2039 | 2,000,000 | 1,784,776 |
| | | | | | 11,214,729 |
| Industrial development revenue: 0.27% | | | | | |
| Ohio Air Quality Development Authority Ohio Valley Electric Corporation Series A | | 2.88 | 2-1-2026 | 2,000,000 | 1,915,283 |
The accompanying notes are an integral part of these financial statements.
Allspring Managed Account | 21
Portfolio of investments—June 30, 2022 (unaudited)
| | | Interest
rate | Maturity
date | Principal | Value |
| Miscellaneous revenue: 0.61% | | | | | |
| Ohio Private Activity Bond AMT Portsmouth Bypass Project (AGM Insured) | | 5.00% | 12-31-2035 | $ 2,000,000 | $ 2,093,675 |
| Ohio Private Activity Bond Series A (AGM Insured) | | 5.00 | 12-31-2029 | 2,070,000 | 2,185,048 |
| | | | | | 4,278,723 |
| Utilities revenue: 0.49% | | | | | |
| Lancaster OH Port Authority Gas Supply Series A (Royal Bank of Canada LIQ) | | 5.00 | 8-1-2049 | 1,920,000 | 2,013,733 |
| Ohio Air Quality Development Authority Ohio Valley Electric Corporation Project Series 2019A | | 3.25 | 9-1-2029 | 1,500,000 | 1,405,401 |
| | | | | | 3,419,134 |
| | | | | | 22,994,512 |
| Oklahoma: 2.00% | | | | | |
| Airport revenue: 0.87% | | | | | |
| Oklahoma City OK Airport Trust AMT Junior Lien Thirty Third Series | | 5.00 | 7-1-2037 | 3,805,000 | 3,998,307 |
| Tulsa OK Airports Improvement Trust Series A (AGM Insured) | | 5.25 | 6-1-2048 | 2,000,000 | 2,095,879 |
| | | | | | 6,094,186 |
| Miscellaneous revenue: 1.13% | | | | | |
| Custer County OK EDA Series E | | 4.00 | 12-1-2031 | 3,250,000 | 3,338,459 |
| Garfield County OK Educational Facilities Authority Enid Public Schools Project | | 5.00 | 9-1-2027 | 1,895,000 | 2,061,959 |
| Muskogee OK Industrial Trust Educational Facilities Lease Muskogee Public Schools Project | | 4.00 | 9-1-2030 | 2,000,000 | 2,056,694 |
| Pontotoc County OK Education Facilities Authority Ada Public Schools Project | | 4.00 | 9-1-2040 | 500,000 | 486,804 |
| | | | | | 7,943,916 |
| | | | | | 14,038,102 |
| Oregon: 0.41% | | | | | |
| Health revenue: 0.41% | | | | | |
| Medford OR Hospital Facilities Authority Revenue Refunding Asante Projects Series A | | 5.00 | 8-15-2045 | 2,750,000 | 2,875,019 |
| Pennsylvania: 7.50% | | | | | |
| Airport revenue: 1.18% | | | | | |
| Allegheny County PA Airport Authority Series 2021A (AGM Insured) | | 4.00 | 1-1-2046 | 3,715,000 | 3,501,199 |
| Philadelphia PA Airport Revenue Bond Series 2020C | | 4.00 | 7-1-2036 | 1,630,000 | 1,581,761 |
| Philadelphia PA Airport Revenue Bond Series 2020C | | 4.00 | 7-1-2040 | 655,000 | 621,963 |
| Philadelphia PA Airport Series B | | 5.00 | 7-1-2042 | 2,500,000 | 2,584,832 |
| | | | | | 8,289,755 |
| Education revenue: 0.62% | | | | | |
| Allegheny County PA IDA Propel Charter School Sunrise Project | | 5.25 | 7-15-2023 | 90,000 | 90,909 |
The accompanying notes are an integral part of these financial statements.
22 | Allspring Managed Account
Portfolio of investments—June 30, 2022 (unaudited)
| | | Interest
rate | Maturity
date | Principal | Value |
| Education revenue (continued) | | | | | |
| East Hempfield Township PA IDA Student Services Incorporated Student Housing Project Millersville University | | 5.00% | 7-1-2023 | $ 760,000 | $ 784,026 |
| Philadelphia PA IDA 1st Philadelphia Preparatory Charter School Project Series A | | 7.00 | 6-15-2033 | 1,000,000 | 1,064,047 |
| Philadelphia PA IDA Southwest Leadership Academy Series A | | 6.47 | 11-1-2037 | 2,500,000 | 2,438,141 |
| | | | | | 4,377,123 |
| GO revenue: 1.58% | | | | | |
| Allegheny County PA Series C-72 | | 5.25 | 12-1-2032 | 1,000,000 | 1,047,771 |
| Armstrong PA School District Series A (BAM Insured) | | 4.00 | 3-15-2037 | 1,000,000 | 1,006,705 |
| North Pocono PA School District Notes Series A (AGM Insured) | | 4.00 | 9-15-2028 | 2,500,000 | 2,698,698 |
| Philadelphia PA Refunding Bond Series A | | 5.25 | 7-15-2033 | 1,010,000 | 1,061,990 |
| Philadelphia PA School District Series F | | 5.00 | 9-1-2036 | 3,000,000 | 3,149,823 |
| Philadelphia PA School District Series F | | 5.00 | 9-1-2037 | 1,000,000 | 1,048,762 |
| Philadelphia PA School District Unrefunded Bond Series F | | 5.00 | 9-1-2030 | 1,000,000 | 1,093,041 |
| | | | | | 11,106,790 |
| Health revenue: 0.64% | | | | | |
| Bucks County PA IDA Hospital Revenue | | 4.00 | 8-15-2035 | 450,000 | 447,641 |
| Bucks County PA IDA Hospital Revenue | | 4.00 | 8-15-2036 | 900,000 | 887,789 |
| Bucks County PA IDA Hospital Revenue | | 4.00 | 8-15-2037 | 2,285,000 | 2,232,555 |
| Pennsylvania EDFA Series A-1 | | 4.00 | 4-15-2045 | 1,000,000 | 936,106 |
| | | | | | 4,504,091 |
| Industrial development revenue: 0.73% | | | | | |
| Pennsylvania EDFA Bridges FinCo LP | | 5.00 | 12-31-2034 | 5,000,000 | 5,109,767 |
| Miscellaneous revenue: 1.71% | | | | | |
| Pennsylvania Commonwealth Financing Authority Series B-1 (AGM Insured) | | 5.00 | 6-1-2025 | 500,000 | 537,899 |
| Philadelphia PA IDA | | 5.00 | 12-1-2037 | 1,500,000 | 1,638,264 |
| Philadelphia PA IDA Cultural & Commercial Corridors Program Series A | | 5.00 | 12-1-2025 | 1,995,000 | 2,148,373 |
| Philadelphia PA Municipal Authority Revenue Refunding Bond City Agreement Juvenile Justice Services Center | | 5.00 | 4-1-2033 | 2,355,000 | 2,562,491 |
| Philadelphia PA Public School Building Authority Prerefunded Bond Series A | | 5.00 | 6-1-2036 | 190,000 | 210,944 |
| State Public School Building Authority Project Series 2016-A | | 5.00 | 6-1-2036 | 4,525,000 | 4,878,127 |
| | | | | | 11,976,098 |
| Tax revenue: 0.17% | | | | | |
| Pennsylvania Turnpike Commission Series B | | 5.00 | 12-1-2043 | 1,115,000 | 1,176,010 |
| Transportation revenue: 0.69% | | | | | |
| Lancaster PA Parking Authority Series A (BAM Insured) | | 4.00 | 9-1-2041 | 1,500,000 | 1,509,941 |
| Pennsylvania Turnpike Commission Series A-1 | | 5.00 | 12-1-2047 | 1,000,000 | 1,057,676 |
The accompanying notes are an integral part of these financial statements.
Allspring Managed Account | 23
Portfolio of investments—June 30, 2022 (unaudited)
| | | Interest
rate | Maturity
date | Principal | Value |
| Transportation revenue (continued) | | | | | |
| Pennsylvania Turnpike Commission Subordinate Bond Series A | | 4.00% | 12-1-2045 | $ 1,000,000 | $ 935,814 |
| Pennsylvania Turnpike Commission Subordinate Bond Series E | | 6.38 | 12-1-2038 | 1,150,000 | 1,326,149 |
| | | | | | 4,829,580 |
| Water & sewer revenue: 0.18% | | | | | |
| Philadelphia PA Water & Sewer Series B | | 5.00 | 7-1-2032 | 1,145,000 | 1,221,521 |
| | | | | | 52,590,735 |
| South Carolina: 0.10% | | | | | |
| Resource recovery revenue: 0.10% | | | | | |
| South Carolina Jobs EDA † | | 8.00 | 12-6-2029 | 115,000 | 95,033 |
| South Carolina Jobs EDA Solid Waste Disposal AMT RePower South Berkeley LLC Project Green Bond 144A† | | 6.00 | 2-1-2035 | 1,500,000 | 600,000 |
| | | | | | 695,033 |
| Tennessee: 0.58% | | | | | |
| Utilities revenue: 0.58% | | | | | |
| Tennergy Corporation Tennessee Gas Series A | | 4.00 | 12-1-2051 | 4,050,000 | 4,072,521 |
| Texas: 6.04% | | | | | |
| Airport revenue: 0.72% | | | | | |
| Austin TX Airport System AMT | | 5.00 | 11-15-2044 | 2,500,000 | 2,572,801 |
| Port of Houston TX Series 2021 | | 4.00 | 10-1-2039 | 2,500,000 | 2,494,204 |
| | | | | | 5,067,005 |
| Education revenue: 1.35% | | | | | |
| Arlington TX Higher Education Finance Corporation Universal Academy Project Series A | | 7.13 | 3-1-2044 | 1,250,000 | 1,289,587 |
| Clifton TX Higher Education Finance Corporation International Leadership Series A | | 5.75 | 8-15-2038 | 1,000,000 | 1,012,687 |
| Clifton TX Higher Education Finance Corporation International Leadership Texas Series D | | 6.00 | 8-15-2038 | 2,500,000 | 2,553,011 |
| Clifton TX Higher Education Finance Corporation International Leadership Texas Series D | | 6.13 | 8-15-2048 | 2,250,000 | 2,292,767 |
| Clifton TX Higher Educational Finance Corporation International Leadership Series A | | 5.50 | 8-15-2035 | 2,000,000 | 2,016,339 |
| Clifton TX Higher Educational Finance Corporation Uplift Education Project Series A | | 3.10 | 12-1-2022 | 330,000 | 330,912 |
| | | | | | 9,495,303 |
| GO revenue: 1.00% | | | | | |
| El Paso County TX Hospital District | | 5.00 | 8-15-2029 | 1,555,000 | 1,589,920 |
| Houston TX Public Improvement Refunding Bonds Series A | | 5.00 | 3-1-2029 | 1,000,000 | 1,104,194 |
| Palestine TX Certificate of Obligation (AGM Insured) | | 4.00 | 2-15-2051 | 3,625,000 | 3,386,403 |
| Port Isabel TX Series 2019 144A | | 5.10 | 2-15-2049 | 485,000 | 494,996 |
| Temple TX College District Series 2021 | | 3.00 | 7-1-2027 | 400,000 | 409,282 |
| | | | | | 6,984,795 |
The accompanying notes are an integral part of these financial statements.
24 | Allspring Managed Account
Portfolio of investments—June 30, 2022 (unaudited)
| | | Interest
rate | Maturity
date | Principal | Value |
| Miscellaneous revenue: 0.80% | | | | | |
| Lewisville TX Combination Contract Castle Hills Public Improvement Bonds District #6 144A | | 6.00% | 9-1-2037 | $ 5,390,000 | $ 5,590,259 |
| Tax revenue: 0.16% | | | | | |
| Old Spanish Trail Alameda Corridors RDA (BAM Insured) | | 4.00 | 9-1-2035 | 1,070,000 | 1,112,429 |
| Transportation revenue: 0.75% | | | | | |
| Central Texas Regional Mobility Authority Revenue Refunding Senior Lien Series B | | 4.00 | 1-1-2038 | 550,000 | 533,869 |
| Central Texas Regional Mobility Authority Senior Lien Series A | | 5.00 | 1-1-2049 | 1,000,000 | 1,049,478 |
| Texas Private Activity Bond Surface Transportation Corporation Project NTE Mobility Partners Segments LLC | | 4.00 | 12-31-2037 | 2,500,000 | 2,294,363 |
| Texas Private Activity Bond Surface Transportation Corporation Project NTE Mobility Partners Segments LLC | | 7.00 | 12-31-2038 | 1,300,000 | 1,343,818 |
| | | | | | 5,221,528 |
| Utilities revenue: 1.07% | | | | | |
| Lower Colorado TX River Authority Series A (AGM Insured) | | 4.00 | 5-15-2040 | 7,500,000 | 7,528,067 |
| Water & sewer revenue: 0.19% | | | | | |
| Upper Trinity TX Regional Water District (BAM Insured) | | 5.00 | 8-1-2028 | 750,000 | 810,563 |
| Upper Trinity TX Regional Water District (BAM Insured) | | 5.00 | 8-1-2029 | 500,000 | 537,937 |
| | | | | | 1,348,500 |
| | | | | | 42,347,886 |
| Utah: 1.27% | | | | | |
| Airport revenue: 0.30% | | | | | |
| Salt Lake City UT AMT Series A | | 5.00 | 7-1-2043 | 1,000,000 | 1,049,969 |
| Salt Lake City UT AMT Series A | | 5.25 | 7-1-2048 | 1,000,000 | 1,049,646 |
| | | | | | 2,099,615 |
| Education revenue: 0.97% | | | | | |
| Utah Charter School Finance Authority Christian School Early Light Academy Project 144A | | 4.50 | 7-15-2027 | 510,000 | 503,677 |
| Utah Charter School Finance Authority Freedom Academy Foundation Project 144A | | 5.25 | 6-15-2037 | 3,000,000 | 3,035,021 |
| Utah Charter School Finance Authority Refunding Bond Freedom Academy Foundation Project 144A | | 5.38 | 6-15-2048 | 1,500,000 | 1,508,021 |
| Utah Charter School Finance Authority Refunding Bond Summit Academy Incorporated Series A (CSCE Insured) | | 5.00 | 4-15-2039 | 700,000 | 758,509 |
| Utah Charter School Finance Authority Wallace Stegner Academy Project 144A | | 3.63 | 6-15-2029 | 370,000 | 343,124 |
| Utah Charter School Finance Authority Wallace Stegner Academy Project 144A | | 5.00 | 6-15-2039 | 675,000 | 647,418 |
| | | | | | 6,795,770 |
| | | | | | 8,895,385 |
The accompanying notes are an integral part of these financial statements.
Allspring Managed Account | 25
Portfolio of investments—June 30, 2022 (unaudited)
| | | Interest
rate | Maturity
date | Principal | Value |
| Virginia: 0.11% | | | | | |
| Health revenue: 0.05% | | | | | |
| Roanoke VA EDA Residential Care Facility Revenue Richfield Living | | 5.00% | 9-1-2050 | $ 500,000 | $ 350,715 |
| Transportation revenue: 0.06% | | | | | |
| Virginia Small Business Financing Authority Series 2022 | | 4.00 | 1-1-2040 | 500,000 | 463,140 |
| | | | | | 813,855 |
| Washington: 3.09% | | | | | |
| Airport revenue: 1.06% | | | | | |
| Port of Seattle WA AMT Intermediate Lien | | 4.00 | 4-1-2044 | 3,500,000 | 3,223,104 |
| Port of Seattle WA AMT Intermediate Lien | | 5.00 | 4-1-2044 | 3,000,000 | 3,148,628 |
| Port of Seattle WA AMT Intermediate Lien | | 5.00 | 8-1-2046 | 1,000,000 | 1,056,304 |
| | | | | | 7,428,036 |
| GO revenue: 1.39% | | | | | |
| King County WA Public Hospital District #1 Series 2016 | | 5.00 | 12-1-2036 | 475,000 | 503,225 |
| King County WA Public Hospital District #1 Valley Medical Center Refunding Bond | | 5.00 | 12-1-2035 | 5,500,000 | 5,854,534 |
| Washington Series 2022-C | | 5.00 | 2-1-2044 | 3,000,000 | 3,379,229 |
| | | | | | 9,736,988 |
| Health revenue: 0.64% | | | | | |
| Washington HCFR Authority Catholic Health Initiatives Series 2013B-2 (SIFMA Municipal Swap +1.40%) ± | | 2.38 | 1-1-2035 | 2,000,000 | 2,007,885 |
| Washington HCFR Catholic Health Initiatives Series A | | 5.00 | 1-1-2029 | 1,300,000 | 1,400,468 |
| Washington Health Care Facilities Authority Revenue Seattle Cancer Care Alliance Series A | | 5.00 | 9-1-2036 | 365,000 | 390,459 |
| Washington Health Care Facilities Authority Revenue Seattle Cancer Care Alliance Series A | | 5.00 | 9-1-2037 | 670,000 | 715,408 |
| | | | | | 4,514,220 |
| | | | | | 21,679,244 |
| Wisconsin: 6.33% | | | | | |
| Airport revenue: 0.37% | | | | | |
| Wisconsin PFA Airport Facilities Series C | | 5.00 | 7-1-2042 | 2,585,000 | 2,586,782 |
| Education revenue: 2.24% | | | | | |
| Wisconsin PFA Carolina International School Series A 144A | | 7.20 | 8-1-2048 | 1,000,000 | 1,026,006 |
| Wisconsin PFA Educational Revenue Series 2021A 144A | | 4.00 | 7-1-2041 | 3,895,000 | 3,045,208 |
| Wisconsin PFA Hotel/Conference Center Series 2021A 144A | | 4.00 | 9-1-2041 | 2,000,000 | 1,665,013 |
| Wisconsin PFA Lease Development University of Kansas Campus Development Project | | 5.00 | 3-1-2046 | 4,500,000 | 4,735,538 |
| Wisconsin PFA Pine Lake Preparatory 144A | | 4.95 | 3-1-2030 | 1,370,000 | 1,405,668 |
| Wisconsin PFA Research Triangle High School Project Series 2015-A 144A | | 5.63 | 7-1-2045 | 1,790,000 | 1,819,203 |
The accompanying notes are an integral part of these financial statements.
26 | Allspring Managed Account
Portfolio of investments—June 30, 2022 (unaudited)
| | | Interest
rate | Maturity
date | Principal | Value |
| Education revenue (continued) | | | | | |
| Wisconsin PFA Research Triangle High School Project Series A 144A | | 4.38% | 7-1-2025 | $ 235,000 | $ 235,535 |
| Wisconsin PFA Research Triangle High School Project Series A 144A | | 5.38 | 7-1-2035 | 1,730,000 | 1,756,900 |
| | | | | | 15,689,071 |
| Health revenue: 2.03% | | | | | |
| Wisconsin HEFA Revenue Marshfield Clinic Health System (AGM Insured) | | 4.00 | 2-15-2034 | 700,000 | 706,120 |
| Wisconsin HEFA Revenue Marshfield Clinic Health System (AGM Insured) | | 4.00 | 2-15-2035 | 500,000 | 502,028 |
| Wisconsin HEFA Revenue Marshfield Clinic Health System (AGM Insured) | | 4.00 | 2-15-2036 | 600,000 | 598,477 |
| Wisconsin HEFA Revenue Marshfield Clinic Health System (AGM Insured) | | 4.00 | 2-15-2037 | 550,000 | 546,583 |
| Wisconsin HEFA Revenue Rogers Memorial Hospital Incorporated Series B | | 5.00 | 7-1-2038 | 750,000 | 774,866 |
| Wisconsin HEFA Rogers Memorial Hospital Incorporated Series A | | 5.00 | 7-1-2044 | 1,050,000 | 1,077,888 |
| Wisconsin HEFA Series 2021B | | 4.00 | 9-15-2036 | 525,000 | 478,051 |
| Wisconsin HEFA Series 2021B | | 4.00 | 9-15-2041 | 510,000 | 448,649 |
| Wisconsin PFA Series A | | 4.00 | 10-1-2049 | 10,000,000 | 9,077,540 |
| | | | | | 14,210,202 |
| Industrial development revenue: 0.20% | | | | | |
| Wisconsin PFA Series 2022A 144A | | 5.50 | 2-1-2042 | 1,500,000 | 1,432,807 |
| Miscellaneous revenue: 0.35% | | | | | |
| Wisconsin PFA Capital Improvements Series 2018 | | 5.00 | 7-1-2041 | 2,280,000 | 2,457,552 |
| Tax revenue: 1.14% | | | | | |
| Mount Pleasant WI Series A | | 5.00 | 4-1-2043 | 5,000,000 | 5,453,998 |
| Mount Pleasant WI Series A | | 5.00 | 4-1-2048 | 330,000 | 349,865 |
| Mount Pleasant WI Series A | | 5.00 | 4-1-2048 | 2,090,000 | 2,215,814 |
| | | | | | 8,019,677 |
| | | | | | 44,396,091 |
| Total Municipal obligations (Cost $702,736,650) | | | | | 671,629,740 |
| | | Yield | | Shares | |
| Short-term investments: 4.01% | | | | | |
| Investment companies: 4.01% | | | | | |
| Allspring Municipal Cash Management Money Market Fund Institutional Class ♠∞## | | 0.85 | | 28,144,414 | 28,161,301 |
| Total Short-term investments (Cost $28,160,244) | | | | | 28,161,301 |
| Total investments in securities (Cost $730,896,894) | 99.75% | | | | 699,791,041 |
| Other assets and liabilities, net | 0.25 | | | | 1,742,293 |
| Total net assets | 100.00% | | | | $701,533,334 |
The accompanying notes are an integral part of these financial statements.
Allspring Managed Account | 27
Portfolio of investments—June 30, 2022 (unaudited)
| ± | Variable rate investment. The rate shown is the rate in effect at period end. |
| ¤ | The security is issued in zero coupon form with no periodic interest payments. |
| 144A | The security may be resold in transactions exempt from registration, normally to qualified institutional buyers, pursuant to Rule 144A under the Securities Act of 1933. |
| ø | Variable rate demand notes are subject to a demand feature which reduces the effective maturity. The maturity date shown represents the final maturity date of the security. The interest rate is determined and reset by the issuer daily, weekly, or monthly depending upon the terms of the security. The rate shown is the rate in effect at period end. |
| † | Non-income-earning security |
| ## | All or a portion of this security is segregated for when-issued securities. |
| ♠ | The issuer of the security is an affiliated person of the Fund as defined in the Investment Company Act of 1940. |
| ∞ | The rate represents the 7-day annualized yield at period end. |
| %% | The security is purchased on a when-issued basis. |
| Abbreviations: |
| AGM | Assured Guaranty Municipal |
| Ambac | Ambac Financial Group Incorporated |
| AMT | Alternative minimum tax |
| BAM | Build America Mutual Assurance Company |
| CAB | Capital appreciation bond |
| ECFA | Educational & Cultural Facilities Authority |
| EDA | Economic Development Authority |
| EDFA | Economic Development Finance Authority |
| GO | General obligation |
| HCFR | Healthcare facilities revenue |
| HEFA | Health & Educational Facilities Authority |
| HEFAR | Higher Education Facilities Authority Revenue |
| HFA | Housing Finance Authority |
| HFFA | Health Facilities Financing Authority |
| IDA | Industrial Development Authority |
| LIBOR | London Interbank Offered Rate |
| LIQ | Liquidity agreement |
| NPFGC | National Public Finance Guarantee Corporation |
| PCR | Pollution control revenue |
| PFA | Public Finance Authority |
| RDA | Redevelopment Authority |
| SIFMA | Securities Industry and Financial Markets Association |
| SPA | Standby purchase agreement |
| TTFA | Transportation Trust Fund Authority |
Investments in affiliates
An affiliated investment is an investment in which the Fund owns at least 5% of the outstanding voting shares of the issuer or as a result of other relationships, such as the Fund and the issuer having the same investment manager. Transactions with issuers that were affiliates of the Fund at the end of the period were as follows:
| | Value,
beginning of
period | Purchases | Sales
proceeds | Net
realized
gains
(losses) | Net
change in
unrealized
gains
(losses) | Value,
end of
period | Shares,
end
of period | Income
from
affiliated
securities |
| Short-term investments | | | | | | | |
| Allspring Municipal Cash Management Money Market Fund Institutional Class | $11,666,359 | $148,307,088 | $(131,814,042) | $3,190 | $(1,294) | $28,161,301 | 28,144,414 | $21,580 |
The accompanying notes are an integral part of these financial statements.
28 | Allspring Managed Account
Statement of assets and liabilities—June 30, 2022 (unaudited)
| | |
| Assets | |
Investments in unaffiliated securities, at value (cost $702,736,650)
| $ 671,629,740 |
Investments in affiliated securities, at value (cost $28,160,244)
| 28,161,301 |
Cash
| 125,000 |
Receivable for interest
| 8,384,427 |
Receivable for Fund shares sold
| 2,985,307 |
Receivable for investments sold
| 570,000 |
Receivable from manager
| 2,873 |
Prepaid expenses and other assets
| 173,417 |
Total assets
| 712,032,065 |
| Liabilities | |
Payable for Fund shares redeemed
| 7,953,929 |
Dividends payable
| 2,042,898 |
Payable for when-issued transactions
| 501,904 |
Total liabilities
| 10,498,731 |
Total net assets
| $701,533,334 |
| Net assets consist of | |
Paid-in capital
| $ 751,661,523 |
Total distributable loss
| (50,128,189) |
Total net assets
| $701,533,334 |
| Computation of net asset value per share | |
Net assets
| $ 701,533,334 |
Share outstanding 1
| 63,106,843 |
Net asset value per share
| $11.12 |
| 1 | The Fund has an unlimited number of authorized shares. |
The accompanying notes are an integral part of these financial statements.
Allspring Managed Account | 29
Statement of operations—six months ended June 30, 2022 (unaudited)
| | |
| Investment income | |
Interest
| $ 13,039,346 |
Income from affiliated securities
| 21,580 |
Total investment income
| 13,060,926 |
| Expenses | |
Custody and accounting fees
| 19,583 |
Professional fees
| 7,189 |
Registration fees
| 39,077 |
Shareholder report expenses
| 9,528 |
Trustees’ fees and expenses
| 9,846 |
Other fees and expenses
| 9,056 |
Total expenses
| 94,279 |
Less: Fee waivers and/or expense reimbursements
| (94,279) |
Net expenses
| 0 |
Net investment income
| 13,060,926 |
| Realized and unrealized gains (losses) on investments | |
| Net realized gains (losses) on | |
Unaffiliated securities
| (3,800,467) |
Affiliated securities
| 3,190 |
Net realized losses on investments
| (3,797,277) |
| Net change in unrealized gains (losses) on | |
Unaffiliated securities
| (86,290,210) |
Affiliated securities
| (1,294) |
Net change in unrealized gains (losses) on investments
| (86,291,504) |
Net realized and unrealized gains (losses) on investments
| (90,088,781) |
Net decrease in net assets resulting from operations
| $(77,027,855) |
The accompanying notes are an integral part of these financial statements.
30 | Allspring Managed Account
Statement of changes in net assets
| | | | | |
| | Six months ended
June 30, 2022
(unaudited) | Year ended
December 31, 2021 |
| Operations | | | | |
Net investment income
| | $ 13,060,926 | | $ 27,397,595 |
Net realized gains (losses) on investments
| | (3,797,277) | | 845,801 |
Net change in unrealized gains (losses) on investments
| | (86,291,504) | | (3,959,276) |
Net increase (decrease) in net assets resulting from operations
| | (77,027,855) | | 24,284,120 |
| Distributions to shareholders from | | | | |
Net investment income and net realized gains
| | (13,059,537) | | (27,407,495) |
| Capital share transactions | Shares | | Shares | |
Proceeds from shares sold
| 8,767,423 | 100,345,541 | 16,917,397 | 211,011,034 |
Payment for shares redeemed
| (17,189,296) | (197,453,124) | (15,061,995) | (187,730,732) |
Net increase (decrease) in net assets resulting from capital share transactions
| | (97,107,583) | | 23,280,302 |
Total increase (decrease) in net assets
| | (187,194,975) | | 20,156,927 |
| Net assets | | | | |
Beginning of period
| | 888,728,309 | | 868,571,382 |
End of period
| | $ 701,533,334 | | $ 888,728,309 |
The accompanying notes are an integral part of these financial statements.
Allspring Managed Account | 31
Financial highlights
(For a share outstanding throughout each period)
| | | Year ended December 31 |
| | Six months ended
June 30, 2022
(unaudited) | 2021 | 2020 | 2019 | 2018 | 2017 |
Net asset value, beginning of period
| $12.42 | $12.47 | $12.36 | $11.79 | $11.91 | $11.51 |
Net investment income
| 0.19 | 0.39 | 0.40 | 0.41 | 0.43 | 0.40 |
Net realized and unrealized gains (losses) on investments
| (1.30) | (0.05) | 0.11 | 0.57 | (0.13) | 0.40 |
Total from investment operations
| (1.11) | 0.34 | 0.51 | 0.98 | 0.30 | 0.80 |
| Distributions to shareholders from | | | | | | |
Net investment income
| (0.19) | (0.39) | (0.40) | (0.41) | (0.42) | (0.40) |
Net asset value, end of period
| $11.12 | $12.42 | $12.47 | $12.36 | $11.79 | $11.91 |
Total return1
| (8.94)% | 2.73% | 4.19% | 8.42% | 2.63% | 7.02% |
| Ratios to average net assets (annualized) | | | | | | |
Gross expenses
| 0.02% | 0.02% | 0.03% | 0.02% | 0.03% | 0.04% |
Net expenses
| 0.00% 2 | 0.00% 2 | 0.00% 2 | 0.00% 2 | 0.00% 2 | 0.00% 2 |
Net investment income
| 3.38% | 3.10% | 3.23% | 3.37% | 3.62% | 3.39% |
| Supplemental data | | | | | | |
Portfolio turnover rate
| 7% | 9% | 19% | 7% | 28% | 19% |
Net assets, end of period (000s omitted)
| $701,533 | $888,728 | $868,571 | $858,102 | $656,446 | $618,341 |
| 1 | Returns for periods of less than one year are not annualized. |
| 2 | The manager has contractually committed to irrevocably absorb and pay or reimburse all ordinary operating expenses of the Fund, except portfolio transactions or other investment-related costs (e.g., commissions), fees payable for services provided by the Fund’s securities lending agent (if any), interest, taxes, leverage expenses, and others expenses not incurred in the ordinary course of the Fund’s business. This commitment has an indefinite term. |
The accompanying notes are an integral part of these financial statements.
32 | Allspring Managed Account
Notes to financial statements (unaudited)
1. ORGANIZATION
Allspring Funds Trust (the “Trust”), a Delaware statutory trust organized on March 10, 1999, is an open-end management investment company registered under the Investment Company Act of 1940, as amended (the “1940 Act”). As an investment company, the Trust follows the accounting and reporting guidance in Financial Accounting Standards Board (“FASB”) Accounting Standards Codification Topic 946, Financial Services – Investment Companies. These financial statements report on the Allspring Managed Account CoreBuilder Shares - Series M (the “Fund”) which is a diversified series of the Trust.
The Fund is a special purpose municipal bond fund that is used in combination with selected individual securities to effectively model institutional-level investment strategies. The Fund is intended to help enable certain separately managed account investors to achieve greater diversification than small managed accounts might otherwise achieve.
Effective on November 1, 2021, the sale transaction of Wells Fargo Asset Management ("WFAM") by Wells Fargo & Company to GTCR LLC and Reverence Capital Partners, L.P. was closed. In connection with the closing of the transaction, WFAM became known as Allspring Global Investments (“Allspring”) and various entities that provided services to the Fund changed their names to "Allspring", including Allspring Funds Management, LLC, the investment manager to the Fund, Allspring Global Investments, LLC and Allspring Global Investments (UK) Limited, both registered investment advisers providing subadvisory services to certain funds, and Allspring Funds Distributor, LLC. Consummation of the transaction resulted in a new investment management agreement and subadvisory agreement became effective on November 1, 2021.
2. SIGNIFICANT ACCOUNTING POLICIES
The following significant accounting policies, which are consistently followed in the preparation of the financial statements of the Fund, are in conformity with U.S. generally accepted accounting principles which require management to make estimates and assumptions that affect the reported amounts of assets and liabilities, disclosure of contingent assets and liabilities at the date of the financial statements, and the reported amounts of income and expenses during the reporting period. Actual results could differ from those estimates.
Securities valuation
All investments are valued each business day as of the close of regular trading on the New York Stock Exchange (generally 4 p.m. Eastern Time), although the Fund may deviate from this calculation time under unusual or unexpected circumstances.
Debt securities are valued at the evaluated bid price provided by an independent pricing service (e.g. taking into account various factors, including yields, maturities, or credit ratings) or, if a reliable price is not available, the quoted bid price from an independent broker-dealer.
Investments in registered open-end investment companies are valued at net asset value.
Investments which are not valued using any of the methods discussed above are valued at their fair value, as determined in good faith by the Board of Trustees. The Board of Trustees has established a Valuation Committee comprised of the Trustees and has delegated to it the authority to take any actions regarding the valuation of portfolio securities that the Valuation Committee deems necessary or appropriate, including determining the fair value of portfolio securities, unless the determination has been delegated to the Allspring Global Investments Pricing Committee at Allspring Funds Management, LLC ("Allspring Funds Management"). The Board of Trustees retains the authority to make or ratify any valuation decisions or approve any changes to the Valuation Procedures as it deems appropriate. On a quarterly basis, the Board of Trustees receives reports on any valuation actions taken by the Valuation Committee or the Allspring Global Investments Pricing Committee which may include items for ratification.
When-issued transactions
The Fund may purchase securities on a forward commitment or when-issued basis. The Fund records a when-issued transaction on the trade date and will segregate assets in an amount at least equal in value to the Fund's commitment to purchase when-issued securities. Securities purchased on a when-issued basis are marked-to-market daily and the Fund begins earning interest on the settlement date. Losses may arise due to changes in the market value of the underlying securities or if the counterparty does not perform under the contract.
Security transactions and income recognition
Securities transactions are recorded on a trade date basis. Realized gains or losses are recorded on the basis of identified cost.
Interest income is accrued daily and bond discounts are accreted and premiums are amortized daily. To the extent debt obligations are placed on non-accrual status, any related interest income may be reduced by writing off interest receivables when the collection of all or a portion of interest has been determined to be doubtful based on consistently applied procedures
Allspring Managed Account | 33
Notes to financial statements (unaudited)
and the fair value has decreased. If the issuer subsequently resumes interest payments or when the collectability of interest is reasonably assured, the debt obligation is removed from non-accrual status.
Distributions to shareholders
Distributions to shareholders from net investment income are declared daily and paid monthly. Distributions from net realized gains, if any, are recorded on the ex-dividend date and paid at least annually. Such distributions are determined in accordance with income tax regulations and may differ from U.S. generally accepted accounting principles. Dividend sources are estimated at the time of declaration. The tax character of distributions is determined as of the Fund's fiscal year end. Therefore, a portion of the Fund's distributions made prior to the Fund’s fiscal year end may be categorized as a tax return of capital at year end.
Federal and other taxes
The Fund intends to continue to qualify as a regulated investment company by distributing substantially all of its investment company taxable and tax-exempt income and any net realized capital gains (after reduction for capital loss carryforwards) sufficient to relieve it from all, or substantially all, federal income taxes. Accordingly, no provision for federal income taxes was required.
The Fund’s income and federal excise tax returns and all financial records supporting those returns for the prior three fiscal years are subject to examination by the federal and Delaware revenue authorities. Management has analyzed the Fund's tax positions taken on federal, state, and foreign tax returns, as applicable, for all open tax years and does not believe that there are any uncertain tax positions that require recognition of a tax liability.
As of June 30, 2022, the aggregate cost of all investments for federal income tax purposes was $730,896,895 and the unrealized gains (losses) consisted of:
| Gross unrealized gains | $ 6,224,737 |
| Gross unrealized losses | (37,330,591) |
| Net unrealized losses | $(31,105,854) |
As of December 31, 2021, the Fund had capital loss carryforwards which consisted of $9,762,169 in short-term capital losses and $5,459,591 in long-term capital losses.
3. FAIR VALUATION MEASUREMENTS
Fair value measurements of investments are determined within a framework that has established a fair value hierarchy based upon the various data inputs utilized in determining the value of the Fund’s investments. The three-level hierarchy gives the highest priority to unadjusted quoted prices in active markets for identical assets or liabilities (Level 1) and the lowest priority to unobservable inputs (Level 3). The Fund’s investments are classified within the fair value hierarchy based on the lowest level of input that is significant to the fair value measurement. The inputs are summarized into three broad levels as follows:
| ■ | Level 1 – quoted prices in active markets for identical securities |
| ■ | Level 2 – other significant observable inputs (including quoted prices for similar securities, interest rates, prepayment speeds, credit risk, etc.) |
| ■ | Level 3 – significant unobservable inputs (including the Fund’s own assumptions in determining the fair value of investments) |
The inputs or methodologies used for valuing investments in securities are not necessarily an indication of the risk associated with investing in those securities.
34 | Allspring Managed Account
Notes to financial statements (unaudited)
The following is a summary of the inputs used in valuing the Fund’s assets and liabilities as of June 30, 2022:
| | Quoted prices
(Level 1) | Other significant
observable inputs
(Level 2) | Significant
unobservable inputs
(Level 3) | Total |
| Assets | | | | |
| Investments in: | | | | |
| Municipal obligations | $ 0 | $ 671,629,740 | $0 | $ 671,629,740 |
| Short-term investments | | | | |
| Investment companies | 28,161,301 | 0 | 0 | 28,161,301 |
| Total assets | $28,161,301 | $671,629,740 | $0 | $699,791,041 |
Additional sector, industry or geographic detail, if any, is included in the Portfolio of Investments.
For the six months ended June 30, 2022, the Fund did not have any transfers into/out of Level 3.
4. TRANSACTIONS WITH AFFILIATES
The Trust has entered into an investment management contract with Allspring Funds Management, a wholly owned subsidiary of Allspring Global Investments Holdings, LLC, a holding company indirectly owned by certain private funds of GTCR LLC and Reverence Capital Partners, L.P. The manager is responsible for implementing investment policies and guidelines and for supervising the subadviser, who is responsible for day-to-day portfolio management of the Fund. For providing these services, Allspring Funds Management does not receive a fee from the Fund but is entitled to receive fees from separately managed account sponsors of the wrap-fee programs. Out of these fees, Allspring Funds Management pays Allspring Global Investments, LLC, an affiliate of Allspring Funds Management and a wholly owned subsidiary of Allspring Global Investments Holdings, LLC, for its services as the subadviser to the Fund.
Generally, no ordinary operating fees or expenses are charged to the Fund. Allspring Funds Management has contractually committed to irrevocably absorb and pay or reimburse all ordinary operating expenses of the Fund, except portfolio transactions or other investment-related costs (e.g., commissions), fees payable for services provided by the Fund’s securities lending agent (if any), interest, taxes, leverage expenses, and other expenses not incurred in the ordinary course of the Fund’s business. This commitment has an indefinite term.
Interfund transactions
The Fund may purchase or sell portfolio investment securities to certain affiliates pursuant to Rule 17a-7 under the 1940 Act and under procedures adopted by the Board of Trustees. The procedures have been designed to ensure that these interfund transactions, which do not incur broker commissions, are effected at current market prices. Pursuant to these procedures, the Fund had $2,000,000, $12,117,300 and $18,969 in interfund purchases, sales and net realized gains (losses), respectively, during the six months ended June 30, 2022.
5. INVESTMENT PORTFOLIO TRANSACTIONS
Purchases and sales of investments, excluding U.S. government obligations (if any) and short-term securities, for the six months ended June 30, 2022 were $52,801,592 and $185,590,612, respectively.
6. BANK BORROWINGS
The Trust (excluding the money market funds), Allspring Master Trust and Allspring Variable Trust are parties to a $350,000,000 revolving credit agreement whereby the Fund is permitted to use bank borrowings for temporary or emergency purposes, such as to fund shareholder redemption requests. Interest under the credit agreement is charged to the Fund based on a borrowing rate equal to the higher of the Federal Funds rate in effect on that day plus 1.25% or the overnight bank funding rate in effect on that day plus 1.25%. In addition, an annual commitment fee equal to 0.20% (0.25% prior to June 7, 2022) of the unused balance is allocated to each participating fund.
For the six months ended June 30, 2022, there were no borrowings by the Fund under the agreement.
Allspring Managed Account | 35
Notes to financial statements (unaudited)
7. CONCENTRATION RISK
Concentration risk exists when a shareholder owns a large amount of shares of the Fund. A fund with a concentration of ownership may be more affected by the investment activity of those shareholders than would be a fund that does not have any ownership concentration. As of June 30, 2022, two unaffiliated shareholders owned in aggregate 53% of the Fund.
8. INDEMNIFICATION
Under the Fund's organizational documents, the officers and Trustees have been granted certain indemnification rights against certain liabilities that may arise out of performance of their duties to the Fund. The Fund has entered into a separate agreement with each Trustee that converts indemnification rights currently existing under the Fund’s organizational documents into contractual rights that cannot be changed in the future without the consent of the Trustee. Additionally, in the normal course of business, the Fund may enter into contracts with service providers that contain a variety of indemnification clauses. The Fund’s maximum exposure under these arrangements is dependent on future claims that may be made against the Fund and, therefore, cannot be estimated.
9. CORONAVIRUS (COVID-19) PANDEMIC
On March 11, 2020, the World Health Organization announced that it had made the assessment that coronavirus disease 2019 (“COVID-19”) is a pandemic. The impacts of COVID-19 are affecting the entire global economy, individual companies and investment products, the funds, and the market in general. There is significant uncertainty around the extent and duration of business disruptions related to COVID-19 and the impacts may last for an extended period of time. COVID-19 has led to significant uncertainty and volatility in the financial markets.
36 | Allspring Managed Account
Other information (unaudited)
PROXY VOTING INFORMATION
A description of the policies and procedures used to determine how to vote proxies relating to portfolio securities is available without charge, upon request, by calling 1-800-877-9275, visiting our website at allspringglobal.com, or visiting the SEC website at sec.gov. Information regarding how the proxies related to portfolio securities were voted during the most recent 12-month period ended June 30 is available on the website at allspringglobal.com or by visiting the SEC website at sec.gov.
QUARTERLY PORTFOLIO HOLDINGS INFORMATION
The Fund files its complete schedule of portfolio holdings with the SEC for the first and third quarters of each fiscal year as an exhibit to its reports on Form N-PORT. Shareholders may view the filed Form N-PORT by visiting the SEC website at sec.gov.
Allspring Managed Account | 37
Other information (unaudited)
BOARD OF TRUSTEES AND OFFICERS
Each of the Trustees and Officers listed in the table below acts in identical capacities for each fund in the Allspring family of funds, which consists of 136 mutual funds comprising the Allspring Funds Trust, Allspring Variable Trust, Allspring Master Trust and four closed-end funds (collectively the “Fund Complex”). This table should be read in conjunction with the Prospectus and the Statement of Additional Information1. The mailing address of each Trustee and Officer is 525 Market Street, 12th Floor, San Francisco, CA 94105. Each Trustee and Officer serves an indefinite term, however, each Trustee serves such term until reaching the mandatory retirement age established by the Trustees.
Independent Trustees
Name and
year of birth | Position held and
length of service* | Principal occupations during past five years or longer | Current other
public company or
investment
company
directorships |
William R. Ebsworth
(Born 1957) | Trustee,
since 2015 | Retired. From 1984 to 2013, equities analyst, portfolio manager, research director and chief investment officer at Fidelity Management and Research Company in Boston, Tokyo, and Hong Kong, and retired in 2013 as Chief Investment Officer of Fidelity Strategic Advisers, Inc. where he led a team of investment professionals managing client assets. Prior thereto, Board member of Hong Kong Securities Clearing Co., Hong Kong Options Clearing Corp., the Thailand International Fund, Ltd., Fidelity Investments Life Insurance Company, and Empire Fidelity Investments Life Insurance Company. Audit Committee Chair and Investment Committee Chair of the Vincent Memorial Hospital Endowment (non-profit organization). Mr. Ebsworth is a CFA® charterholder. | N/A |
Jane A. Freeman
(Born 1953) | Trustee,
since 2015;
Chair Liaison,
since 2018 | Retired. From 2012 to 2014 and 1999 to 2008, Chief Financial Officer of Scientific Learning Corporation. From 2008 to 2012, Ms. Freeman provided consulting services related to strategic business projects. Prior to 1999, Portfolio Manager at Rockefeller & Co. and Scudder, Stevens & Clark. Board member of the Harding Loevner Funds from 1996 to 2014, serving as both Lead Independent Director and chair of the Audit Committee. Board member of the Russell Exchange Traded Funds Trust from 2011 to 2012 and the chair of the Audit Committee. Ms. Freeman is also an inactive Chartered Financial Analyst. | N/A |
Isaiah Harris, Jr.
(Born 1952) | Trustee,
since 2009; Audit
Committee
Chair,
since 2019 | Retired. Chairman of the Board of CIGNA Corporation from 2009 to 2021, and Director from 2005 to 2008. From 2003 to 2011, Director of Deluxe Corporation. Prior thereto, President and CEO of BellSouth Advertising and Publishing Corp. from 2005 to 2007, President and CEO of BellSouth Enterprises from 2004 to 2005 and President of BellSouth Consumer Services from 2000 to 2003. Emeritus member of the Iowa State University Foundation Board of Governors. Emeritus Member of the Advisory Board of Iowa State University School of Business. Advisory Board Member, Palm Harbor Academy (private school). Advisory Board Member, Fellowship of Christian Athletes. Mr. Harris is a certified public accountant (inactive status). | N/A |
David F. Larcker
(Born 1950) | Trustee,
since 2009 | James Irvin Miller Professor of Accounting at the Graduate School of Business (Emeritus), Stanford University, Director of the Corporate Governance Research Initiative and Senior Faculty of The Rock Center for Corporate Governance since 2006. From 2005 to 2008, Professor of Accounting at the Graduate School of Business, Stanford University. Prior thereto, Ernst & Young Professor of Accounting at The Wharton School, University of Pennsylvania from 1985 to 2005. | N/A |
38 | Allspring Managed Account
Other information (unaudited)
Name and
year of birth | Position held and
length of service* | Principal occupations during past five years or longer | Current other
public company or
investment
company
directorships |
Olivia S. Mitchell
(Born 1953) | Trustee,
since 2006;
Nominating and
Governance
Committee Chair,
since 2018 | International Foundation of Employee Benefit Plans Professor since 1993, Wharton School of the University of Pennsylvania. Director of Wharton’s Pension Research Council and Boettner Center on Pensions & Retirement Research, and Research Associate at the National Bureau of Economic Research. Previously taught at Cornell University from 1978 to 1993. | N/A |
Timothy J. Penny
(Born 1951) | Trustee,
since 1996;
Chair,
since 2018 | President and Chief Executive Officer of Southern Minnesota Initiative Foundation, a non-profit organization, since 2007. Member of the Board of Trustees of NorthStar Education Finance, Inc., a non-profit organization, since 2007. | N/A |
James G. Polisson
(Born 1959) | Trustee,
since 2018 | Retired. Chief Marketing Officer, Source (ETF) UK Services, Ltd, from 2015 to 2017. From 2012 to 2015, Principal of The Polisson Group, LLC, a management consulting, corporate advisory and principal investing company. Chief Executive Officer and Managing Director at Russell Investments, Global Exchange Traded Funds from 2010 to 2012. Managing Director of Barclays Global Investors from 1998 to 2010 and Global Chief Marketing Officer for iShares and Barclays Global Investors from 2000 to 2010. Trustee of the San Francisco Mechanics’ Institute, a non-profit organization, from 2013 to 2015. Board member of the Russell Exchange Traded Fund Trust from 2011 to 2012. Director of Barclays Global Investors Holdings Deutschland GmbH from 2006 to 2009. Mr. Polisson is an attorney and has a retired status with the Massachusetts and District of Columbia Bar Associations. | N/A |
Pamela Wheelock
(Born 1959) | Trustee,
since January
2020; previously
Trustee from
January 2018 to
July 2019 | Board member of the Destination Medical Center Economic Development Agency, Rochester, Minnesota since 2019. Interim President of the McKnight Foundation from January to September 2020. McKnight Foundation Consultant, November 2020 to February 2021. Acting Commissioner, Minnesota Department of Human Services, July 2019 through September 2019. Consultant (part-time), Minnesota Department of Human Services, October 2019 through December 2019. Chief Operating Officer, Twin Cities Habitat for Humanity from 2017 to 2019. Vice President of University Services, University of Minnesota from 2012 to 2016. Prior thereto, on the Board of Directors, Governance Committee and Finance Committee for the Minnesota Philanthropy Partners (Saint Paul Foundation) from 2012 to 2018, Interim Chief Executive Officer of Blue Cross Blue Shield of Minnesota from 2011 to 2012, Chairman of the Board from 2009 to 2012 and Board Director from 2003 to 2015. Vice President, Leadership and Community Engagement, Bush Foundation, Saint Paul, Minnesota (a private foundation) from 2009 to 2011. Executive Vice President and Chief Financial Officer, Minnesota Sports and Entertainment from 2004 to 2009 and Senior Vice President from 2002 to 2004. Executive Vice President of the Minnesota Wild Foundation from 2004 to 2008. Commissioner of Finance, State of Minnesota, from 1999 to 2002. Currently Board Chair of the Minnesota Wild Foundation since 2010. | N/A |
* Length of service dates reflect the Trustee’s commencement of service with the Trust’s predecessor entities, where applicable.
Allspring Managed Account | 39
Other information (unaudited)
Officers2
Name and
year of birth | Position held and
length of service | Principal occupations during past five years or longer |
Andrew Owen
(Born 1960) | President,
since 2017 | President, Chief Executive Officer and Director of Allspring Funds Management, LLC since 2017 and co-president of Galliard Capital Management, LLC, an affiliate of Allspring Funds Management, LLC, since 2019. Prior thereto, Head of Affiliated Managers, Allspring Global Investments, from 2014 to 2019 and Executive Vice President responsible for marketing, investments and product development for Allspring Funds Management, LLC, from 2009 to 2014. In addition, Mr. Owen was an Executive Vice President of Wells Fargo & Company from 2014 to 2021. |
Jeremy DePalma
(Born 1974) | Treasurer,
since 2012
(for certain funds in
the Fund Complex);
since 2021 (for
the remaining funds in the
Fund Complex) | Senior Vice President of Allspring Funds Management, LLC since 2009. Senior Vice President of Evergreen Investment Management Company, LLC from 2008 to 2010 and head of the Fund Reporting and Control Team within Fund Administration from 2005 to 2010. |
Kate McKinley
(Born 1977) | Chief Legal Officer,
since 2021 | Chief Legal Officer of Allspring Global Investments since 2021. Prior thereto, held various roles at State Street Global Advisors beginning in 2010, including serving as Senior Vice President and General Counsel from 2019 to 2021, and Chief Operating Officer of the Institutional Client Group from 2016 - 2019. Prior to working at State Street Global Advisors served as Assistant General Counsel for Bank of America Corporation from 2005 to 2010 and as an Associate at WilmerHale from 2002 to 2005. |
Christopher Baker
(Born 1976) | Chief Compliance Officer, since 2022 | Global Chief Compliance Officer for Allspring Global Investments since 2022. Prior thereto, Chief Compliance Officer for State Street Global Advisors from 2018 to 2021. Senior Compliance Officer for the State Street divisions of Alternative Investment Solutions, Sector Solutions, and Global Marketing from 2015 to 2018. From 2010 to 2015 Vice President, Global Head of Investment and Marketing Compliance for State Street Global Advisors. |
Matthew Prasse
(Born 1983) | Secretary,
since 2021 | Senior Counsel of the Allspring Legal Department since 2021. Senior Counsel of the Wells Fargo Legal Department from 2018 to 2021. Previously, Counsel for Barings LLC from 2015 to 2018. Prior to joining Barings, Associate at Morgan, Lewis & Bockius LLP from 2008 to 2015. |
1 The Statement of Additional Information includes additional information about the Trustees and is available, without charge, upon request, by calling 1-800-222-8222 or by visiting the website at allspringglobal.com.
2 For those Officers with tenures at Allspring Global Investments and/or Allspring Funds Management, LLC that began prior to 2021, such tenures include years of service during which these businesses/entities were known as Wells Fargo Asset Management and Wells Fargo Funds Management, LLC, respectively.
40 | Allspring Managed Account
Other information (unaudited)
LIQUIDITY RISK MANAGEMENT PROGRAM
In accordance with Rule 22e-4 under the Investment Company Act of 1940, as amended (the “Liquidity Rule”), Allspring Funds Trust (the “Trust”) has adopted and implemented a liquidity risk management program (the “Program”) on behalf of each of its series (other than the series that operate as money market funds), including the Fund, which is reasonably designed to assess and manage the Fund's liquidity risk. “Liquidity risk” is defined under the Liquidity Rule as the risk that the Fund is unable to meet redemption requests without significantly diluting remaining investors’ interests in the Fund. The Trust’s Board of Trustees (the “Board”) previously approved the designation of Allspring Funds Management, LLC (“Allspring Funds Management”), the Fund's investment manager, to administer the Program, and Allspring Funds Management has established a Liquidity Risk Management Council (the "Council") composed of personnel from multiple departments within Allspring Funds Management and its affiliates to assist Allspring Funds Management in the administration of the Program.
The Program is comprised of various components designed to support the assessment and/or management of liquidity risk, including: (1) the periodic assessment (no less frequently than annually) of certain factors that influence the Fund's liquidity risk; (2) the periodic classification (no less frequently than monthly) of the Fund's investments into one of four liquidity categories that reflect an estimate of their liquidity under current market conditions; (3) a 15% limit on the acquisition of “illiquid investments” (as defined under the Liquidity Rule); (4) to the extent the Fund does not invest primarily in “highly liquid investments” (as defined under the Liquidity Rule), the determination of a minimum percentage of the Fund's assets that generally will be invested in highly liquid investments (an “HLIM”); (5) if the Fund has established an HLIM, the periodic review (no less frequently than annually) of the HLIM and the adoption of policies and procedures for responding to a shortfall of the Fund's “highly liquid investments” below its HLIM; and (6) periodic reporting to the Board.
At a meeting of the Board held on May 24-25, 2022, the Board received and reviewed a written report (the “Report”) from Allspring Funds Management that, among other things, addressed the operation of the Program and assessed its adequacy and effectiveness for the period from January 1, 2021 through December 31, 2021 (the “Reporting Period”). Other than extended foreign market holidays, no significant liquidity events impacting the Funds were noted in the Report. In addition, other than corporate-related changes to the Program, there were no material changes to the Program during the Reporting Period.
Allspring Funds Management determined in the Report that the Program has been implemented and operates effectively to manage each Fund’s, including the Fund’s, liquidity risk, and Allspring Funds Management continues to believe that the Program has been and continues to be adequately and effectively implemented to monitor and, as applicable, respond to the Fund’s liquidity developments.
There can be no assurance that the Program will achieve its objectives under all circumstances in the future. Please refer to the Fund’s prospectus for more information regarding the Fund’s exposure to liquidity risk and other risks to which an investment in the Fund may be subject.
Allspring Managed Account | 41
For more information
More information about Allspring Funds is available free upon request. To obtain literature, please write, visit the Fund's website, or call:
Allspring Funds
Attn: Managed Account Services
P.O. Box 1450
Milwaukee, WI 53201
Website: allspringglobal.com
Telephone: 1-888-877-9275
This report and the financial statements contained herein are submitted for the general information of the shareholders of the Fund. If this report is used for promotional purposes, distribution of the report must be accompanied or preceded by a current prospectus. Before investing, please consider the investment objectives, risks, charges, and expenses of the investment. For a current prospectus and, if available, a summary prospectus, containing this information, call
1-888-877-9275 or visit the Fund's website at allspringglobal.com. Read the prospectus carefully before you invest or send money.
Allspring Global InvestmentsTM is the trade name for the asset management firms of Allspring Global Investments Holdings, LLC, a holding company indirectly owned by certain private funds of GTCR LLC and Reverence Capital Partners, L.P. These firms include but are not limited to Allspring Global Investments, LLC, and Allspring Funds Management, LLC. Certain products managed by Allspring entities are distributed by Allspring Funds Distributor, LLC (a broker-dealer and Member FINRA/SIPC).
This material is for general informational and educational purposes only and is NOT intended to provide investment advice or a recommendation of any kind - including a recommendation for any specific investment, strategy, or plan.
© 2022 Allspring Global Investments Holdings, LLC. All rights reserved.
PAR-0722-00679 08-22
SCBM/SAR130 06-22
Semi-Annual Report
June 30, 2022
Allspring Managed Account
| ■ | Allspring Managed Account CoreBuilder® Shares – Series SM |
The views expressed and any forward-looking statements are as of June 30, 2022, unless otherwise noted, and are those of the Fund's portfolio managers and/or Allspring Global Investments. Discussions of individual securities or the markets generally are not intended as individual recommendations. Future events or results may vary significantly from those expressed in any forward-looking statements. The views expressed are subject to change at any time in response to changing circumstances in the market. Allspring Global Investments disclaims any obligation to publicly update or revise any views expressed or forward-looking statements.
Allspring Managed Account | 1
Notice to Shareholders
Russia launched a large-scale invasion of Ukraine on February 24, 2022. As a result of this military action, the United States and many other countries have instituted various economic sanctions against Russian and Belarus individuals and entities. The situation has led to increased financial market volatility and has had severe adverse effects on regional and global economic markets, including the markets for certain securities and commodities, such as oil and natural gas. The extent and duration of the military action, resulting sanctions imposed, other punitive action taken and the resulting market disruptions cannot be easily predicted.
Our solidarity and support goes out to our impacted employees and the people affected in Ukraine and their families. Allspring has a dedicated team of investment professionals actively monitoring the situation for any new developments and the potential impact to our clients and investment products. As the situation remains fluid, we are focused on the assessment of risks, valuation, and liquidity of impacted securities. Please visit our website at allspringglobal.com and click on “Russia-Ukraine Updates” for further information.
2 | Allspring Managed Account
This page is intentionally left blank.
Performance highlights (unaudited)
| Investment objective | The Fund seeks total return, consisting of current income and capital appreciation. |
| Manager | Allspring Funds Management, LLC |
| Subadviser | Allspring Global Investments, LLC |
| Portfolio managers | Terry J. Goode, Robert J. Miller, Adrian Van Poppel, Nicholos Venditti |
| Average annual total returns (%) as of June 30, 2022 |
| | | | | Expense ratios1 (%) |
| | Inception date | 1 year | Since inception | Gross | Net 2 |
| Allspring Managed Account CoreBuilder Shares - Series SM (WFCSX) | 5-26-2021 | -9.55 | -8.72 | 0.00 | 0.00 |
| Bloomberg Municipal Bond Index3 | – | -8.57 | -7.61 ¤ | – | – |
Figures quoted represent past performance, which is no guarantee of future results, and do not reflect taxes that a shareholder may pay on an investment in a fund. Investment return and principal value of an investment will fluctuate so that an investor’s shares, when redeemed, may be worth more or less than their original cost. Current performance may be lower or higher than the performance data quoted, which assumes the reinvestment of dividends and capital gains. Current month-end performance is available by calling 1-888-877-9275.
Index returns do not include transaction costs associated with buying and selling securities, any mutual fund fees or expenses, or any taxes. It is not possible to invest directly in an index.
Shares are sold without a front-end sales charge or contingent deferred sales charge.
| ¤ | Based on the Fund's inception date. |
| 1 | Reflects the expense ratios as stated in the most recent prospectus. The expense ratios shown are subject to change and may differ from the annualized expense ratios shown in the financial highlights of this report. |
| 2 | Generally, no ordinary fees or expenses are charged to the Fund. Allspring Funds Management, LLC has contractually committed to irrevocably absorb and pay or reimburse all ordinary operating expenses of the Fund, except portfolio transactions or other investment related costs (e.g., commissions), fees payable for services provided by the Fund’s securities lending agent (if any), interest, taxes, leverage expenses and other expenses not incurred in the ordinary course of the Fund’s business. This commitment has an indefinite term. |
| 3 | The Bloomberg Municipal Bond Index is an unmanaged index composed of long-term tax-exempt bonds with a minimum credit rating of Baa. You cannot invest directly in an index. |
Bond values fluctuate in response to the financial condition of individual issuers, general market and economic conditions, and changes in interest rates. Changes in market conditions and government policies may lead to periods of heightened volatility in the bond market and reduced liquidity for certain bonds held by the Fund. In general, when interest rates rise, bond values fall and investors may lose principal value. Interest rate changes and their impact on the Fund and its share price can be sudden and unpredictable. The use of derivatives may reduce returns and/or increase volatility. Certain investment strategies tend to increase the total risk of an investment (relative to the broader market). This fund is exposed to high-yield securities risk and municipal securities risk. Consult the Fund’s prospectus for additional information on these and other risks. A portion of the Fund’s income may be subject to federal, state, and/or local income taxes or the alternative minimum tax. Any capital gains distributions may be taxable.
CoreBuilder Shares are a series of investment options within the separately managed accounts advised or subadvised by Allspring Funds Management, LLC. The shares are fee-waived mutual funds that enable certain separately managed account investors to achieve greater diversification than smaller managed accounts might otherwise achieve.
Investing in environmental, social, and governance (ESG) carries the risk that, under certain market conditions, the investments may underperform products that invest in a broader array of investments. In addition, some ESG investments may be dependent on government tax incentives and subsidies and on political support for certain environmental technologies and companies. The ESG sector also may have challenges such as a limited number of issuers and liquidity in the market, including a robust secondary market. Investing primarily in responsible investments carries the risk that, under certain market conditions, an investment may underperform funds that do not use a responsible investment strategy.
Please remember that shares of the Fund may be purchased only by or on behalf of separately managed account clients where Allspring Funds Management, LLC has an agreement to serve as investment adviser or subadviser to the account with the separately managed account sponsor (typically a registered investment adviser or broker/dealer) or directly with the client.
4 | Allspring Managed Account
Performance highlights (unaudited)
| Credit quality as of June 30, 20221 |
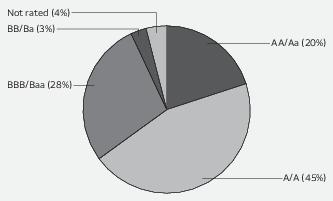
| 1 | The credit quality distribution of portfolio holdings reflected in the chart is based on ratings from Standard & Poor’s, Moody’s Investors Service, and/or Fitch Ratings Ltd. Credit quality ratings apply to the underlying holdings of the Fund and not to the Fund itself. The percentages of the portfolio with the ratings depicted in the chart are calculated based on the market value of fixed income securities held by the Fund. If a security was rated by all three rating agencies, the middle rating was utilized. If rated by two of the three rating agencies, the lower rating was utilized, and if rated by one of the rating agencies, that rating was utilized. Standard & Poor’s rates the creditworthiness of bonds, ranging from AAA (highest) to D (lowest). Ratings from A to CCC may be modified by the addition of a plus (+) or minus (-) sign to show relative standing within the rating categories. Standard & Poor’s rates the creditworthiness of short-term notes from SP-1 (highest) to SP-3 (lowest). Moody’s rates the creditworthiness of bonds, ranging from Aaa (highest) to C (lowest). Ratings Aa to B may be modified by the addition of a number 1 (highest) to 3 (lowest) to show relative standing within the ratings categories. Moody’s rates the creditworthiness of short-term U.S. tax-exempt municipal securities from MIG 1/VMIG 1 (highest) to SG (lowest). Fitch rates the creditworthiness of bonds, ranging from AAA (highest) to D (lowest). Credit quality distribution is subject to change and may have changed since the date specified. |
| Effective maturity distribution as of June 30, 20221 |
| 1 | Figures represent the percentage of the Fund's long-term investments. These amounts are subject to change and may have changed since the date specified. |
Allspring Managed Account | 5
Fund expenses (unaudited)
As a shareholder of the Fund, you incur ongoing costs and other Fund expenses. This example is intended to help you understand your ongoing costs (in dollars) of investing in the Fund and to compare these costs with the ongoing costs of investing in other mutual funds.
The example is based on an investment of $1,000 invested at the beginning of the six-month period and held for the entire period from January 1, 2022 to June 30, 2022.
Actual expenses
The “Actual” line of the table below provides information about actual account values and actual expenses. You may use the information in this line, together with the amount you invested, to estimate the expenses that you paid over the period. Simply divide your account value by $1,000 (for example, an $8,600 account value divided by $1,000 = 8.6), then multiply the result by the number in the “Actual” line under the heading entitled “Expenses paid during period” for your applicable class of shares to estimate the expenses you paid on your account during this period.
Hypothetical example for comparison purposes
The “Hypothetical” line of the table below provides information about hypothetical account values and hypothetical expenses based on the Fund’s actual expense ratio and an assumed rate of return of 5% per year before expenses, which is not the Fund’s actual return. The hypothetical account values and expenses may not be used to estimate the actual ending account balance or expenses you paid for the period. You may use this information to compare the ongoing costs of investing in the Fund and other funds. To do so, compare this 5% hypothetical example with the 5% hypothetical examples that appear in the shareholder reports of the other funds.
Please note that the expenses shown in the table are meant to highlight your ongoing costs only. Therefore, the “Hypothetical” line of the table is useful in comparing ongoing costs only, and will not help you determine the relative total costs of owning different funds.
| | Beginning
account value
1-1-2022 | Ending
account value
6-30-2022 | Expenses
paid during
the period1 | Annualized net
expense ratio |
| Actual | $1,000.00 | $ 905.50 | $0.00* | 0.00%* |
| Hypothetical (5% return before expenses) | $1,000.00 | $1,024.79 | $0.00* | 0.00%* |
1 Expenses paid is equal to the annualized net expense ratio multiplied by the average account value over the period, multiplied by 181 divided by 365 (to reflect the one-half-year period).
* Generally, no ordinary fees or expenses are charged to the Fund. Allspring Funds Management, LLC has contractually committed to irrevocably absorb and pay or reimburse all ordinary operating expenses of the Fund, except portfolio transactions or other investment related costs (e.g., commissions), fees payable for services provided by the Fund’s securities lending agent (if any), interest, taxes, leverage expenses and other expenses not incurred in the ordinary course of the Fund’s business. This commitment has an indefinite term.
6 | Allspring Managed Account
Portfolio of investments—June 30, 2022 (unaudited)
| | | Interest
rate | Maturity
date | Principal | Value |
| Municipal obligations: 97.68% | | | | | |
| Arizona: 6.97% | | | | | |
| Education revenue: 3.51% | | | | | |
| Arizona IDA Education Revenue Kipp NYC Public Charter Schools | | 5.00% | 7-1-2027 | $ 60,000 | $ 62,505 |
| Arizona IDA Education Revenue Kipp NYC Public Charter Schools | | 5.00 | 7-1-2028 | 60,000 | 62,455 |
| Arizona IDA Education Revenue Kipp NYC Public Charter Schools | | 5.00 | 7-1-2029 | 65,000 | 67,653 |
| Arizona IDA Education Revenue Kipp NYC Public Charter Schools | | 5.00 | 7-1-2030 | 65,000 | 67,577 |
| Arizona IDA Education Revenue Kipp NYC Public Charter Schools | | 5.00 | 7-1-2031 | 70,000 | 72,536 |
| Arizona IDA Education Revenue Kipp NYC Public Charter Schools | | 5.00 | 7-1-2032 | 325,000 | 335,457 |
| Arizona IDA Education Revenue Refunding Bond Doral Academy Northern Nevada Series A 144A | | 4.00 | 7-15-2027 | 125,000 | 122,544 |
| | | | | | 790,727 |
| Health revenue: 3.46% | | | | | |
| Arizona IDA Hospital Revenue Phoenix Childrens Hospital Series A | | 5.00 | 2-1-2024 | 300,000 | 313,790 |
| Maricopa County AZ IDA Honorhealth Project Series A | | 4.00 | 9-1-2051 | 500,000 | 465,222 |
| | | | | | 779,012 |
| | | | | | 1,569,739 |
| California: 4.29% | | | | | |
| GO revenue: 1.33% | | | | | |
| Sacramento CA City Unified School Refunding Bond | | 5.00 | 7-1-2022 | 300,000 | 300,000 |
| Utilities revenue: 2.96% | | | | | |
| California Community Choice Financing Authority Clean Energy Project Revenue Series B 2 (SIFMA Municipal Swap +0.45%) ± | | 1.43 | 2-1-2052 | 700,000 | 666,407 |
| | | | | | 966,407 |
| Colorado: 0.52% | | | | | |
| Education revenue: 0.52% | | | | | |
| Colorado ECFA Charter School New Summit Charter 144A | | 4.00 | 7-1-2031 | 125,000 | 116,899 |
| Connecticut: 4.83% | | | | | |
| Education revenue: 0.59% | | | | | |
| Connecticut HEFA Trinity College Series S | | 5.00 | 6-1-2029 | 120,000 | 132,972 |
| Health revenue: 4.24% | | | | | |
| Connecticut HEFA Hartford Healthcare Series A | | 5.00 | 7-1-2025 | 725,000 | 772,592 |
| Connecticut HEFA Stamford Hospital Series M | | 5.00 | 7-1-2024 | 175,000 | 182,140 |
| | | | | | 954,732 |
| | | | | | 1,087,704 |
Allspring Managed Account | 7
Portfolio of investments—June 30, 2022 (unaudited)
| | | Interest
rate | Maturity
date | Principal | Value |
| Florida: 4.02% | | | | | |
| Education revenue: 0.41% | | | | | |
| Florida Development Finance Corporation Global Outreach Charter Project 144A | | 4.00% | 6-30-2056 | $ 125,000 | $ 92,128 |
| Health revenue: 3.61% | | | | | |
| Florida Development Finance Corporation HCFR Lakeland Regional Health System | | 5.00 | 11-15-2026 | 750,000 | 814,455 |
| | | | | | 906,583 |
| Georgia: 1.45% | | | | | |
| Education revenue: 0.99% | | | | | |
| Georgia Private College & University Authority Mercer University Project | | 5.00 | 10-1-2028 | 200,000 | 221,978 |
| Utilities revenue: 0.46% | | | | | |
| Municipal Electric Authority Georgia Plant Vogtle Units 3 & 4 Project Series A | | 5.00 | 1-1-2024 | 100,000 | 104,022 |
| | | | | | 326,000 |
| Illinois: 8.83% | | | | | |
| Education revenue: 1.17% | | | | | |
| Illinois Finance Authority Revenue Acero Charter Schools Incorporated 144A | | 4.00 | 10-1-2035 | 125,000 | 113,107 |
| Illinois Finance Authority Revenue Learn Charter School Project | | 4.00 | 11-1-2027 | 150,000 | 151,179 |
| | | | | | 264,286 |
| Health revenue: 4.59% | | | | | |
| Illinois Finance Authority Revenue Advocate Health Care | | 5.00 | 8-1-2023 | 1,000,000 | 1,034,286 |
| Miscellaneous revenue: 3.07% | | | | | |
| Chicago IL Transit Authority Federal Transit Administration Capital Grant Receipts | | 5.00 | 6-1-2029 | 625,000 | 691,745 |
| | | | | | 1,990,317 |
| Indiana: 1.75% | | | | | |
| Water & sewer revenue: 1.75% | | | | | |
| Indiana Finance Authority Wastewater Utility Revenue First Lien Communications Workers of America Authority Project Series A | | 5.00 | 10-1-2023 | 380,000 | 394,300 |
| Kentucky: 1.00% | | | | | |
| Health revenue: 1.00% | | | | | |
| Hazard KY Appalachian Regional Healthcare Revenue | | 4.00 | 7-1-2051 | 250,000 | 226,247 |
| Louisiana: 2.25% | | | | | |
| Education revenue: 2.25% | | | | | |
| Louisiana Public Facilities Authority Refunding Bonds Loyola University Project | | 4.00 | 10-1-2051 | 575,000 | 506,628 |
8 | Allspring Managed Account
Portfolio of investments—June 30, 2022 (unaudited)
| | | Interest
rate | Maturity
date | Principal | Value |
| Maryland: 2.03% | | | | | |
| Education revenue: 1.16% | | | | | |
| Prince Georges County MD Chesapeake Lighthouse Charter 144A | | 6.50% | 8-1-2035 | $ 250,000 | $ 260,860 |
| Housing revenue: 0.87% | | | | | |
| Maryland CDA Department of Housing & Community Multifamily Development Woodside Gardens Series A 144A | | 1.33 | 1-1-2024 | 200,000 | 196,779 |
| | | | | | 457,639 |
| Massachusetts: 0.60% | | | | | |
| Education revenue: 0.60% | | | | | |
| Massachusetts Development Finance Agency Revenue Simmons Collateral Series H (AGC Insured) | | 5.25 | 10-1-2033 | 125,000 | 135,644 |
| Michigan: 6.82% | | | | | |
| Education revenue: 2.56% | | | | | |
| Central Michigan University General Revenue | | 5.00 | 10-1-2026 | 175,000 | 190,954 |
| Universal Academy Michigan Public School Revenue Refunding Bond | | 2.00 | 12-1-2026 | 425,000 | 385,820 |
| | | | | | 576,774 |
| GO revenue: 4.26% | | | | | |
| Redford MI Union School District # 1 Series 1 (Qualified School Board Loan Fund Insured) | | 5.00 | 11-1-2029 | 845,000 | 959,678 |
| | | | | | 1,536,452 |
| Mississippi: 2.20% | | | | | |
| Miscellaneous revenue: 2.20% | | | | | |
| Mississippi Development Bank Special Obligation Gulfport Mississippi Public Improvement Project | | 4.00 | 9-1-2022 | 200,000 | 200,838 |
| Mississippi Development Bank Special Obligation Gulfport Mississippi Public Improvement Project | | 5.00 | 9-1-2023 | 285,000 | 295,332 |
| | | | | | 496,170 |
| Missouri: 0.70% | | | | | |
| Health revenue: 0.70% | | | | | |
| Missouri HEFA Lake Regional Health System | | 5.00 | 2-15-2025 | 150,000 | 157,248 |
| New Hampshire: 2.43% | | | | | |
| Health revenue: 2.43% | | | | | |
| New Hampshire HEFA Concord Hospital Project Series A | | 5.00 | 10-1-2028 | 500,000 | 547,506 |
| New Jersey: 3.95% | | | | | |
| Miscellaneous revenue: 3.33% | | | | | |
| New Jersey EDA School Facilities Construction Series Q | | 4.00 | 6-15-2034 | 750,000 | 750,696 |
| Transportation revenue: 0.62% | | | | | |
| New Jersey Transportation Trust Fund CAB Transportation System Series A ¤ | | 0.00 | 12-15-2032 | 215,000 | 138,505 |
| | | | | | 889,201 |
Allspring Managed Account | 9
Portfolio of investments—June 30, 2022 (unaudited)
| | | Interest
rate | Maturity
date | Principal | Value |
| New York: 8.98% | | | | | |
| Education revenue: 5.16% | | | | | |
| Build New York City Resource Corporation Academic Leadership Charter Project | | 4.00% | 6-15-2036 | $ 400,000 | $ 370,720 |
| Build New York City Resource Corporation New World Preparatory Charter School Project | | 4.00 | 6-15-2031 | 300,000 | 280,008 |
| New York Dormitory Authority Revenues Non Fordham University Series A | | 5.00 | 7-1-2041 | 285,000 | 300,186 |
| Saint Lawrence County NY IDA Civic Development Corporation Clarkson University Project Series A | | 5.00 | 9-1-2040 | 100,000 | 106,344 |
| Saint Lawrence County NY IDA Civic Development Corporation Clarkson University Project Series A | | 5.00 | 9-1-2041 | 100,000 | 106,139 |
| | | | | | 1,163,397 |
| Transportation revenue: 1.95% | | | | | |
| New York Metropolitan Transportation Authority Revenue Transportation Climate Bond Certified | | 4.00 | 11-15-2047 | 500,000 | 440,145 |
| Water & sewer revenue: 1.87% | | | | | |
| Buffalo NY Sewer Authority Green Bonds | | 5.00 | 6-15-2031 | 175,000 | 197,761 |
| Western Nassau County NY Water Authority Series A Green Bonds | | 4.00 | 4-1-2041 | 225,000 | 222,204 |
| | | | | | 419,965 |
| | | | | | 2,023,507 |
| North Carolina: 3.78% | | | | | |
| Education revenue: 1.68% | | | | | |
| North Carolina Capital Facilities Finance Agency Educational Facilities Revenue Refunding Bond Campbell University Series A | | 5.00 | 10-1-2027 | 350,000 | 379,226 |
| Miscellaneous revenue: 2.10% | | | | | |
| Fayetteville State University Revenue Refunding Bond Limited Obligation Student Housing Project (AGM Insured) 144A | | 5.00 | 4-1-2025 | 445,000 | 473,338 |
| | | | | | 852,564 |
| North Dakota: 2.43% | | | | | |
| Health revenue: 1.26% | | | | | |
| Grand Forks ND Health Care System Revenue Altru Health System | | 5.00 | 12-1-2024 | 270,000 | 283,457 |
| Miscellaneous revenue: 1.17% | | | | | |
| University of North Dakota Certificate of Participation Housing Infrastructure Project Series A (AGM Insured) | | 5.00 | 6-1-2024 | 250,000 | 263,138 |
| | | | | | 546,595 |
10 | Allspring Managed Account
Portfolio of investments—June 30, 2022 (unaudited)
| | | Interest
rate | Maturity
date | Principal | Value |
| Ohio: 1.79% | | | | | |
| Education revenue: 0.93% | | | | | |
| Northeast Ohio Medical University General Receipts Refunding Bond Series B (BAM Insured) | | 5.00% | 12-1-2023 | $ 100,000 | $ 104,119 |
| Northeast Ohio Medical University General Receipts Refunding Bond Series B (BAM Insured) | | 5.00 | 12-1-2024 | 100,000 | 105,534 |
| | | | | | 209,653 |
| Housing revenue: 0.86% | | | | | |
| Columbus OH Metropolitan Housing Authority General Revenue | | 1.00 | 8-1-2024 | 200,000 | 193,994 |
| | | | | | 403,647 |
| Oklahoma: 3.28% | | | | | |
| Transportation revenue: 3.28% | | | | | |
| Oklahoma Turnpike Authority Second Senior Revenue Bonds Series C | | 5.00 | 1-1-2047 | 705,000 | 740,245 |
| Pennsylvania: 13.47% | | | | | |
| Education revenue: 4.07% | | | | | |
| Montgomery County PA IDA Germantown Academy Project | | 4.00 | 10-1-2046 | 400,000 | 349,473 |
| Pennsylvania HEFAR Drexel University | | 5.00 | 5-1-2026 | 445,000 | 477,558 |
| Pennsylvania HEFAR Widener University Series A | | 4.00 | 7-15-2046 | 100,000 | 90,046 |
| | | | | | 917,077 |
| Health revenue: 3.23% | | | | | |
| Lehigh County PA General Purpose Authority Revenue Good Shepherd Group Series A | | 4.00 | 11-1-2027 | 700,000 | 727,722 |
| Transportation revenue: 3.87% | | | | | |
| Pennsylvania Turnpike Commission Subordinated Revenue Refunding Bonds | | 5.00 | 6-1-2028 | 275,000 | 295,276 |
| Pennsylvania Turnpike Commission Subordinated Revenue Refunding Bonds Series B-1 | | 5.00 | 6-1-2030 | 535,000 | 577,162 |
| | | | | | 872,438 |
| Water & sewer revenue: 2.30% | | | | | |
| Philadelphia PA Water & Wastewater Revenue Bonds Series C | | 5.00 | 10-1-2023 | 500,000 | 518,941 |
| | | | | | 3,036,178 |
| Rhode Island: 2.62% | | | | | |
| Education revenue: 2.62% | | | | | |
| Rhode Island HEFA Providence College Project Series A | | 4.00 | 11-1-2050 | 645,000 | 589,646 |
| Texas: 2.95% | | | | | |
| Education revenue: 2.05% | | | | | |
| Odessa College District Revenue Consolidated Fund (AGM Insured) | | 4.00 | 7-1-2025 | 440,000 | 461,108 |
Allspring Managed Account | 11
Portfolio of investments—June 30, 2022 (unaudited)
| | | Interest
rate | Maturity
date | Principal | Value |
| Water & sewer revenue: 0.90% | | | | | |
| Upper Trinity Regional Water District Regional Treated Water Supply Project (BAM Insured) | | 4.00% | 8-1-2038 | $ 200,000 | $ 203,862 |
| | | | | | 664,970 |
| Washington: 1.77% | | | | | |
| Housing revenue: 0.67% | | | | | |
| King County WA Housing Authority Workforce Housing Preservation Pooled Revenue Refunding Bond | | 3.00 | 10-1-2025 | 150,000 | 151,586 |
| Utilities revenue: 1.10% | | | | | |
| Seattle WA Municipal Light & Power Refunding Bond Series B (SIFMA Municipal Swap +0.25%) ± | | 1.23 | 5-1-2045 | 250,000 | 247,077 |
| | | | | | 398,663 |
| Wisconsin: 1.97% | | | | | |
| Education revenue: 0.89% | | | | | |
| PFA Wisconsin Education Revenue Coral Academy of Science | | 4.00 | 7-1-2024 | 100,000 | 100,504 |
| PFA Wisconsin Education Revenue Coral Academy of Science | | 4.00 | 7-1-2025 | 100,000 | 100,002 |
| | | | | | 200,506 |
| Health revenue: 1.08% | | | | | |
| PFA Wisconsin Hospital Revenue Carson Valley Medical Center Series A | | 3.00 | 12-1-2026 | 250,000 | 242,993 |
| | | | | | 443,499 |
| Total Municipal obligations (Cost $24,658,922) | | | | | 22,010,198 |
| | | Yield | | Shares | |
| Short-term investments: 1.20% | | | | | |
| Investment companies: 1.20% | | | | | |
| Allspring Municipal Cash Management Money Market Fund Institutional Class ♠∞ | | 0.85 | | 270,940 | 271,103 |
| Total Short-term investments (Cost $271,092) | | | | | 271,103 |
| Total investments in securities (Cost $24,930,014) | 98.88% | | | | 22,281,301 |
| Other assets and liabilities, net | 1.12 | | | | 251,991 |
| Total net assets | 100.00% | | | | $22,533,292 |
| 144A | The security may be resold in transactions exempt from registration, normally to qualified institutional buyers, pursuant to Rule 144A under the Securities Act of 1933. |
| ± | Variable rate investment. The rate shown is the rate in effect at period end. |
| ¤ | The security is issued in zero coupon form with no periodic interest payments. |
| ♠ | The issuer of the security is an affiliated person of the Fund as defined in the Investment Company Act of 1940. |
| ∞ | The rate represents the 7-day annualized yield at period end. |
12 | Allspring Managed Account
Portfolio of investments—June 30, 2022 (unaudited)
| Abbreviations: |
| AGC | Assured Guaranty Corporation |
| AGM | Assured Guaranty Municipal |
| BAM | Build America Mutual Assurance Company |
| CAB | Capital appreciation bond |
| CDA | Community Development Authority |
| ECFA | Educational & Cultural Facilities Authority |
| EDA | Economic Development Authority |
| GO | General obligation |
| HCFR | Healthcare facilities revenue |
| HEFA | Health & Educational Facilities Authority |
| HEFAR | Higher Education Facilities Authority Revenue |
| IDA | Industrial Development Authority |
| PFA | Public Finance Authority |
| SIFMA | Securities Industry and Financial Markets Association |
Investments in affiliates
An affiliated investment is an investment in which the Fund owns at least 5% of the outstanding voting shares of the issuer or as a result of other relationships, such as the Fund and the issuer having the same investment manager. Transactions with issuers that were affiliates of the Fund at the end of the period were as follows:
| | Value,
beginning of
period | Purchases | Sales
proceeds | Net
realized
gains
(losses) | Net
change in
unrealized
gains
(losses) | Value,
end of
period | Shares,
end
of period | Income
from
affiliated
securities |
| Short-term investments | | | | | | | |
| Allspring Municipal Cash Management Money Market Fund Institutional Class | $144,685 | $520,745 | $(394,336) | $7 | $2 | $271,103 | 270,940 | $267 |
Allspring Managed Account | 13
Statement of assets and liabilities—June 30, 2022 (unaudited)
| | |
| Assets | |
Investments in unaffiliated securities, at value (cost $24,658,922)
| $ 22,010,198 |
Investments in affiliated securities, at value (cost $271,092)
| 271,103 |
Receivable for interest
| 245,803 |
Receivable from manager
| 41 |
Prepaid expenses and other assets
| 6,171 |
Total assets
| 22,533,316 |
| Liabilities | |
Accrued expenses and other liabilities
| 24 |
Total liabilities
| 24 |
Total net assets
| $22,533,292 |
| Net assets consist of | |
Paid-in capital
| $ 25,194,931 |
Total distributable loss
| (2,661,639) |
Total net assets
| $22,533,292 |
| Computation of net asset value per share | |
Net assets
| $ 22,533,292 |
Share outstanding 1
| 1,260,359 |
Net asset value per share
| $17.88 |
| 1 | The Fund has an unlimited number of authorized shares. |
The accompanying notes are an integral part of these financial statements.
14 | Allspring Managed Account
Statement of operations—six months ended June 30, 2022 (unaudited)
| | |
| Investment income | |
Interest
| $ 144,614 |
Income from affiliated securities
| 267 |
Total investment income
| 144,881 |
| Expenses | |
Custody and accounting fees
| 3,205 |
Professional fees
| 7,189 |
Registration fees
| 10,482 |
Shareholder report expenses
| 7,232 |
Trustees’ fees and expenses
| 9,846 |
Other fees and expenses
| 1,476 |
Total expenses
| 39,430 |
Less: Fee waivers and/or expense reimbursements
| (39,430) |
Net expenses
| 0 |
Net investment income
| 144,881 |
| Realized and unrealized gains (losses) on investments | |
| Net realized gains (losses) on | |
Unaffiliated securities
| (12,405) |
Affiliated securities
| 7 |
Net realized losses on investments
| (12,398) |
| Net change in unrealized gains (losses) on | |
Unaffiliated securities
| (2,487,990) |
Affiliated securities
| 2 |
Net change in unrealized gains (losses) on investments
| (2,487,988) |
Net realized and unrealized gains (losses) on investments
| (2,500,386) |
Net decrease in net assets resulting from operations
| $(2,355,505) |
The accompanying notes are an integral part of these financial statements.
Allspring Managed Account | 15
Statement of changes in net assets
| | | | | |
| | Six months ended
June 30, 2022
(unaudited) | Year ended
December 31, 20211 |
| Operations | | | | |
Net investment income
| | $ 144,881 | | $ 140,736 |
Net realized gains (losses) on investments
| | (12,398) | | 3,905 |
Net change in unrealized gains (losses) on investments
| | (2,487,988) | | (160,725) |
Net decrease in net assets resulting from operations
| | (2,355,505) | | (16,084) |
| Distributions to shareholders from | | | | |
Net investment income and net realized gains
| | (145,481) | | (144,569) |
| Capital share transactions | Shares | | Shares | |
Proceeds from shares sold
| 0 | 0 | 1,250,000 | 25,000,000 |
Reinvestment of distributions
| 7,870 | 145,481 | 2,489 | 49,450 |
Net increase in net assets resulting from capital share transactions
| | 145,481 | | 25,049,450 |
Total increase (decrease) in net assets
| | (2,355,505) | | 24,888,797 |
| Net assets | | | | |
Beginning of period
| | 24,888,797 | | 0 |
End of period
| | $22,533,292 | | $24,888,797 |
| 1 | For the period from May 26, 2021 (commencement of operations) to December 31, 2021 |
The accompanying notes are an integral part of these financial statements.
16 | Allspring Managed Account
Financial highlights
(For a share outstanding throughout each period)
| | | Year ended December 31 |
| | Six months ended
June 30, 2022
(unaudited) | 2021 1 |
Net asset value, beginning of period
| $19.87 | $20.00 |
Net investment income
| 0.11 | 0.12 |
Net realized and unrealized gains (losses) on investments
| (1.99) | (0.13) |
Total from investment operations
| (1.88) | (0.01) |
| Distributions to shareholders from | | |
Net investment income
| (0.11) | (0.12) |
Net realized gains
| 0.00 | (0.00) 2 |
Total distributions to shareholders
| (0.11) | (0.12) |
Net asset value, end of period
| $17.88 | $19.87 |
Total return3
| 9.45% | (0.07)% |
| Ratios to average net assets (annualized) | | |
Gross expenses
| 0.34% | 0.88% |
Net expenses4
| 0.00% | 0.00% |
Net investment income
| 1.26% | 0.94% |
| Supplemental data | | |
Portfolio turnover rate
| 5% | 14% |
Net assets, end of period (000s omitted)
| $22,533 | $24,889 |
| 1 | For the period from May 26, 2021 (commencement of operations) to December 31, 2021 |
| 2 | Amount is less than $0.005. |
| 3 | Returns for periods of less than one year are not annualized. |
| 4 | The manager has contractually committed to irrevocably absorb and pay or reimburse all ordinary operating expenses of the Fund, except portfolio transactions or other investment-related costs (e.g., commissions), fees payable for services provided by the Fund’s securities lending agent (if any), interest, taxes, leverage expenses, and others expenses not incurred in the ordinary course of the Fund’s business. This commitment has an indefinite term. |
The accompanying notes are an integral part of these financial statements.
Allspring Managed Account | 17
Notes to financial statements (unaudited)
1. ORGANIZATION
Allspring Funds Trust (the “Trust”), a Delaware statutory trust organized on March 10, 1999, is an open-end management investment company registered under the Investment Company Act of 1940, as amended (the “1940 Act”). As an investment company, the Trust follows the accounting and reporting guidance in Financial Accounting Standards Board (“FASB”) Accounting Standards Codification Topic 946, Financial Services – Investment Companies. These financial statements report on the Allspring Managed Account CoreBuilder Shares - Series SM (the “Fund”) which is a diversified series of the Trust.
The Fund is a special purpose fund invested primarily in municipal securities determined to have a positive ESG impact and is intended to be used in combination with selected individual securities to effectively model institutional-level investment strategies. The Fund is intended to help enable certain separately managed account investors to achieve greater diversification than smaller managed accounts might otherwise achieve.
Effective on November 1, 2021, the sale transaction of Wells Fargo Asset Management ("WFAM") by Wells Fargo & Company to GTCR LLC and Reverence Capital Partners, L.P. was closed. In connection with the closing of the transaction, WFAM became known as Allspring Global Investments (“Allspring”) and various entities that provided services to the Fund changed their names to "Allspring", including Allspring Funds Management, LLC, the investment manager to the Fund, Allspring Global Investments, LLC and Allspring Global Investments (UK) Limited, both registered investment advisers providing subadvisory services to certain funds, and Allspring Funds Distributor, LLC.
2. SIGNIFICANT ACCOUNTING POLICIES
The following significant accounting policies, which are consistently followed in the preparation of the financial statements of the Fund, are in conformity with U.S. generally accepted accounting principles which require management to make estimates and assumptions that affect the reported amounts of assets and liabilities, disclosure of contingent assets and liabilities at the date of the financial statements, and the reported amounts of income and expenses during the reporting period. Actual results could differ from those estimates.
Securities valuation
All investments are valued each business day as of the close of regular trading on the New York Stock Exchange (generally 4 p.m. Eastern Time), although the Fund may deviate from this calculation time under unusual or unexpected circumstances.
Debt securities are valued at the evaluated bid price provided by an independent pricing service (e.g. taking into account various factors, including yields, maturities, or credit ratings) or, if a reliable price is not available, the quoted bid price from an independent broker-dealer.
Investments in registered open-end investment companies are valued at net asset value.
Investments which are not valued using any of the methods discussed above are valued at their fair value, as determined in good faith by the Board of Trustees. The Board of Trustees has established a Valuation Committee comprised of the Trustees and has delegated to it the authority to take any actions regarding the valuation of portfolio securities that the Valuation Committee deems necessary or appropriate, including determining the fair value of portfolio securities, unless the determination has been delegated to the Allspring Global Investments Pricing Committee at Allspring Funds Management, LLC ("Allspring Funds Management"). The Board of Trustees retains the authority to make or ratify any valuation decisions or approve any changes to the Valuation Procedures as it deems appropriate. On a quarterly basis, the Board of Trustees receives reports on any valuation actions taken by the Valuation Committee or the Allspring Global Investments Pricing Committee which may include items for ratification.
When-issued transactions
The Fund may purchase securities on a forward commitment or when-issued basis. The Fund records a when-issued transaction on the trade date and will segregate assets in an amount at least equal in value to the Fund's commitment to purchase when-issued securities. Securities purchased on a when-issued basis are marked-to-market daily and the Fund begins earning interest on the settlement date. Losses may arise due to changes in the market value of the underlying securities or if the counterparty does not perform under the contract.
Security transactions and income recognition
Securities transactions are recorded on a trade date basis. Realized gains or losses are recorded on the basis of identified cost.
Interest income is accrued daily and bond discounts are accreted and premiums are amortized daily. To the extent debt obligations are placed on non-accrual status, any related interest income may be reduced by writing off interest receivables when the collection of all or a portion of interest has been determined to be doubtful based on consistently applied procedures
18 | Allspring Managed Account
Notes to financial statements (unaudited)
and the fair value has decreased. If the issuer subsequently resumes interest payments or when the collectability of interest is reasonably assured, the debt obligation is removed from non-accrual status.
Distributions to shareholders
Distributions to shareholders from net investment income are declared daily and paid monthly. Distributions from net realized gains, if any, are recorded on the ex-dividend date and paid at least annually. Such distributions are determined in accordance with income tax regulations and may differ from U.S. generally accepted accounting principles. Dividend sources are estimated at the time of declaration. The tax character of distributions is determined as of the Fund's fiscal year end. Therefore, a portion of the Fund's distributions made prior to the Fund’s fiscal year end may be categorized as a tax return of capital at year end.
Federal and other taxes
The Fund intends to continue to qualify as a regulated investment company by distributing substantially all of its investment company taxable and tax-exempt income and any net realized capital gains (after reduction for capital loss carryforwards) sufficient to relieve it from all, or substantially all, federal income taxes. Accordingly, no provision for federal income taxes was required.
The Fund’s income and federal excise tax returns and all financial records supporting those returns for the fiscal years since commencement of operations are subject to examination by the federal and Delaware revenue authorities. Management has analyzed the Fund’s tax positions taken on federal, state, and foreign tax returns, as applicable, for all open tax years and does not believe that there are any uncertain tax positions that require recognition of a tax liability.
As of June 30, 2022, the aggregate cost of all investments for federal income tax purposes was $24,930,014 and the unrealized gains (losses) consisted of:
| Gross unrealized gains | $ 11 |
| Gross unrealized losses | (2,648,724) |
| Net unrealized losses | $(2,648,713) |
3. FAIR VALUATION MEASUREMENTS
Fair value measurements of investments are determined within a framework that has established a fair value hierarchy based upon the various data inputs utilized in determining the value of the Fund’s investments. The three-level hierarchy gives the highest priority to unadjusted quoted prices in active markets for identical assets or liabilities (Level 1) and the lowest priority to unobservable inputs (Level 3). The Fund’s investments are classified within the fair value hierarchy based on the lowest level of input that is significant to the fair value measurement. The inputs are summarized into three broad levels as follows:
| ■ | Level 1 – quoted prices in active markets for identical securities |
| ■ | Level 2 – other significant observable inputs (including quoted prices for similar securities, interest rates, prepayment speeds, credit risk, etc.) |
| ■ | Level 3 – significant unobservable inputs (including the Fund’s own assumptions in determining the fair value of investments) |
The inputs or methodologies used for valuing investments in securities are not necessarily an indication of the risk associated with investing in those securities.
The following is a summary of the inputs used in valuing the Fund’s assets and liabilities as of June 30, 2022:
| | Quoted prices
(Level 1) | Other significant
observable inputs
(Level 2) | Significant
unobservable inputs
(Level 3) | Total |
| Assets | | | | |
| Investments in: | | | | |
| Municipal obligations | $ 0 | $ 22,010,198 | $0 | $ 22,010,198 |
| Short-term investments | | | | |
| Investment companies | 271,103 | 0 | 0 | 271,103 |
| Total assets | $271,103 | $22,010,198 | $0 | $22,281,301 |
Additional sector, industry or geographic detail, if any, is included in the Portfolio of Investments.
Allspring Managed Account | 19
Notes to financial statements (unaudited)
For the six months ended June 30, 2022, the Fund did not have any transfers into/out of Level 3.
4. TRANSACTIONS WITH AFFILIATES
The Trust has entered into an investment management contract with Allspring Funds Management, a wholly owned subsidiary of Allspring Global Investments Holdings, LLC, a holding company indirectly owned by certain private funds of GTCR LLC and Reverence Capital Partners, L.P. The manager is responsible for implementing investment policies and guidelines and for supervising the subadviser, who is responsible for day-to-day portfolio management of the Fund. For providing these services, Allspring Funds Management does not receive a fee from the Fund but is entitled to receive fees from separately managed account sponsors of the wrap-fee programs. Out of these fees, Allspring Funds Management pays Allspring Global Investments, LLC, an affiliate of Allspring Funds Management and a wholly owned subsidiary of Allspring Global Investments Holdings, LLC, for its services as the subadviser to the Fund.
Generally, no ordinary operating fees or expenses are charged to the Fund. Allspring Funds Management has contractually committed to irrevocably absorb and pay or reimburse all ordinary operating expenses of the Fund, except portfolio transactions or other investment-related costs (e.g., commissions), fees payable for services provided by the Fund’s securities lending agent (if any), interest, taxes, leverage expenses, and other expenses not incurred in the ordinary course of the Fund’s business. This commitment has an indefinite term.
Interfund transactions
The Fund may purchase or sell portfolio investment securities to certain affiliates pursuant to Rule 17a-7 under the 1940 Act and under procedures adopted by the Board of Trustees. The procedures have been designed to ensure that these interfund transactions, which do not incur broker commissions, are effected at current market prices.
5. INVESTMENT PORTFOLIO TRANSACTIONS
Purchases and sales of investments, excluding U.S. government obligations (if any) and short-term securities, for the six months ended June 30, 2022 were $1,255,280 and $1,147,690, respectively.
6. BANK BORROWINGS
The Trust (excluding the money market funds), Allspring Master Trust and Allspring Variable Trust are parties to a $350,000,000 revolving credit agreement whereby the Fund is permitted to use bank borrowings for temporary or emergency purposes, such as to fund shareholder redemption requests. Interest under the credit agreement is charged to the Fund based on a borrowing rate equal to the higher of the Federal Funds rate in effect on that day plus 1.25% or the overnight bank funding rate in effect on that day plus 1.25%. In addition, an annual commitment fee equal to 0.20% (0.25% prior to June 7, 2022) of the unused balance is allocated to each participating fund.
For the six months ended June 30, 2022, there were no borrowings by the Fund under the agreement.
7. CONCENTRATION RISK
Concentration risk exists when a shareholder owns a large amount of shares of the Fund. A fund with a concentration of ownership may be more affected by the investment activity of those shareholders than would be a fund that does not have any ownership concentration. As of June 30, 2022, Allspring Funds Management or one of its affiliates owned 100% of the Fund.
8. INDEMNIFICATION
Under the Fund's organizational documents, the officers and Trustees have been granted certain indemnification rights against certain liabilities that may arise out of performance of their duties to the Fund. The Fund has entered into a separate agreement with each Trustee that converts indemnification rights currently existing under the Fund’s organizational documents into contractual rights that cannot be changed in the future without the consent of the Trustee. Additionally, in the normal course of business, the Fund may enter into contracts with service providers that contain a variety of indemnification clauses. The Fund’s maximum exposure under these arrangements is dependent on future claims that may be made against the Fund and, therefore, cannot be estimated.
9. CORONAVIRUS (COVID-19) PANDEMIC
On March 11, 2020, the World Health Organization announced that it had made the assessment that coronavirus disease 2019 (“COVID-19”) is a pandemic. The impacts of COVID-19 are affecting the entire global economy, individual companies and investment products, the funds, and the market in general. There is significant uncertainty around the extent and duration of
20 | Allspring Managed Account
Notes to financial statements (unaudited)
business disruptions related to COVID-19 and the impacts may last for an extended period of time. COVID-19 has led to significant uncertainty and volatility in the financial markets.
Allspring Managed Account | 21
Other information (unaudited)
PROXY VOTING INFORMATION
A description of the policies and procedures used to determine how to vote proxies relating to portfolio securities is available without charge, upon request, by calling 1-800-222-8222, visiting our website at allspringglobal.com, or visiting the SEC website at sec.gov. Information regarding how the proxies related to portfolio securities were voted during the most recent 12-month period ended June 30 is available on the website at allspringglobal.com or by visiting the SEC website at sec.gov.
QUARTERLY PORTFOLIO HOLDINGS INFORMATION
The Fund files its complete schedule of portfolio holdings with the SEC for the first and third quarters of each fiscal year as an exhibit to its reports on Form N-PORT. Shareholders may view the filed Form N-PORT by visiting the SEC website at sec.gov.
22 | Allspring Managed Account
Other information (unaudited)
BOARD OF TRUSTEES AND OFFICERS
Each of the Trustees and Officers listed in the table below acts in identical capacities for each fund in the Allspring family of funds, which consists of 136 mutual funds comprising the Allspring Funds Trust, Allspring Variable Trust, Allspring Master Trust and four closed-end funds (collectively the “Fund Complex”). This table should be read in conjunction with the Prospectus and the Statement of Additional Information1. The mailing address of each Trustee and Officer is 525 Market Street, 12th Floor, San Francisco, CA 94105. Each Trustee and Officer serves an indefinite term, however, each Trustee serves such term until reaching the mandatory retirement age established by the Trustees.
Independent Trustees
Name and
year of birth | Position held and
length of service* | Principal occupations during past five years or longer | Current other
public company or
investment
company
directorships |
William R. Ebsworth
(Born 1957) | Trustee,
since 2015 | Retired. From 1984 to 2013, equities analyst, portfolio manager, research director and chief investment officer at Fidelity Management and Research Company in Boston, Tokyo, and Hong Kong, and retired in 2013 as Chief Investment Officer of Fidelity Strategic Advisers, Inc. where he led a team of investment professionals managing client assets. Prior thereto, Board member of Hong Kong Securities Clearing Co., Hong Kong Options Clearing Corp., the Thailand International Fund, Ltd., Fidelity Investments Life Insurance Company, and Empire Fidelity Investments Life Insurance Company. Audit Committee Chair and Investment Committee Chair of the Vincent Memorial Hospital Endowment (non-profit organization). Mr. Ebsworth is a CFA® charterholder. | N/A |
Jane A. Freeman
(Born 1953) | Trustee,
since 2015;
Chair Liaison,
since 2018 | Retired. From 2012 to 2014 and 1999 to 2008, Chief Financial Officer of Scientific Learning Corporation. From 2008 to 2012, Ms. Freeman provided consulting services related to strategic business projects. Prior to 1999, Portfolio Manager at Rockefeller & Co. and Scudder, Stevens & Clark. Board member of the Harding Loevner Funds from 1996 to 2014, serving as both Lead Independent Director and chair of the Audit Committee. Board member of the Russell Exchange Traded Funds Trust from 2011 to 2012 and the chair of the Audit Committee. Ms. Freeman is also an inactive Chartered Financial Analyst. | N/A |
Isaiah Harris, Jr.
(Born 1952) | Trustee,
since 2009; Audit
Committee
Chair,
since 2019 | Retired. Chairman of the Board of CIGNA Corporation from 2009 to 2021, and Director from 2005 to 2008. From 2003 to 2011, Director of Deluxe Corporation. Prior thereto, President and CEO of BellSouth Advertising and Publishing Corp. from 2005 to 2007, President and CEO of BellSouth Enterprises from 2004 to 2005 and President of BellSouth Consumer Services from 2000 to 2003. Emeritus member of the Iowa State University Foundation Board of Governors. Emeritus Member of the Advisory Board of Iowa State University School of Business. Advisory Board Member, Palm Harbor Academy (private school). Advisory Board Member, Fellowship of Christian Athletes. Mr. Harris is a certified public accountant (inactive status). | N/A |
David F. Larcker
(Born 1950) | Trustee,
since 2009 | James Irvin Miller Professor of Accounting at the Graduate School of Business (Emeritus), Stanford University, Director of the Corporate Governance Research Initiative and Senior Faculty of The Rock Center for Corporate Governance since 2006. From 2005 to 2008, Professor of Accounting at the Graduate School of Business, Stanford University. Prior thereto, Ernst & Young Professor of Accounting at The Wharton School, University of Pennsylvania from 1985 to 2005. | N/A |
Allspring Managed Account | 23
Other information (unaudited)
Name and
year of birth | Position held and
length of service* | Principal occupations during past five years or longer | Current other
public company or
investment
company
directorships |
Olivia S. Mitchell
(Born 1953) | Trustee,
since 2006;
Nominating and
Governance
Committee Chair,
since 2018 | International Foundation of Employee Benefit Plans Professor since 1993, Wharton School of the University of Pennsylvania. Director of Wharton’s Pension Research Council and Boettner Center on Pensions & Retirement Research, and Research Associate at the National Bureau of Economic Research. Previously taught at Cornell University from 1978 to 1993. | N/A |
Timothy J. Penny
(Born 1951) | Trustee,
since 1996;
Chair,
since 2018 | President and Chief Executive Officer of Southern Minnesota Initiative Foundation, a non-profit organization, since 2007. Member of the Board of Trustees of NorthStar Education Finance, Inc., a non-profit organization, since 2007. | N/A |
James G. Polisson
(Born 1959) | Trustee,
since 2018 | Retired. Chief Marketing Officer, Source (ETF) UK Services, Ltd, from 2015 to 2017. From 2012 to 2015, Principal of The Polisson Group, LLC, a management consulting, corporate advisory and principal investing company. Chief Executive Officer and Managing Director at Russell Investments, Global Exchange Traded Funds from 2010 to 2012. Managing Director of Barclays Global Investors from 1998 to 2010 and Global Chief Marketing Officer for iShares and Barclays Global Investors from 2000 to 2010. Trustee of the San Francisco Mechanics’ Institute, a non-profit organization, from 2013 to 2015. Board member of the Russell Exchange Traded Fund Trust from 2011 to 2012. Director of Barclays Global Investors Holdings Deutschland GmbH from 2006 to 2009. Mr. Polisson is an attorney and has a retired status with the Massachusetts and District of Columbia Bar Associations. | N/A |
Pamela Wheelock
(Born 1959) | Trustee,
since January
2020; previously
Trustee from
January 2018 to
July 2019 | Board member of the Destination Medical Center Economic Development Agency, Rochester, Minnesota since 2019. Interim President of the McKnight Foundation from January to September 2020. McKnight Foundation Consultant, November 2020 to February 2021. Acting Commissioner, Minnesota Department of Human Services, July 2019 through September 2019. Consultant (part-time), Minnesota Department of Human Services, October 2019 through December 2019. Chief Operating Officer, Twin Cities Habitat for Humanity from 2017 to 2019. Vice President of University Services, University of Minnesota from 2012 to 2016. Prior thereto, on the Board of Directors, Governance Committee and Finance Committee for the Minnesota Philanthropy Partners (Saint Paul Foundation) from 2012 to 2018, Interim Chief Executive Officer of Blue Cross Blue Shield of Minnesota from 2011 to 2012, Chairman of the Board from 2009 to 2012 and Board Director from 2003 to 2015. Vice President, Leadership and Community Engagement, Bush Foundation, Saint Paul, Minnesota (a private foundation) from 2009 to 2011. Executive Vice President and Chief Financial Officer, Minnesota Sports and Entertainment from 2004 to 2009 and Senior Vice President from 2002 to 2004. Executive Vice President of the Minnesota Wild Foundation from 2004 to 2008. Commissioner of Finance, State of Minnesota, from 1999 to 2002. Currently Board Chair of the Minnesota Wild Foundation since 2010. | N/A |
* Length of service dates reflect the Trustee’s commencement of service with the Trust’s predecessor entities, where applicable.
24 | Allspring Managed Account
Other information (unaudited)
Officers2
Name and
year of birth | Position held and
length of service | Principal occupations during past five years or longer |
Andrew Owen
(Born 1960) | President,
since 2017 | President, Chief Executive Officer and Director of Allspring Funds Management, LLC since 2017 and co-president of Galliard Capital Management, LLC, an affiliate of Allspring Funds Management, LLC, since 2019. Prior thereto, Head of Affiliated Managers, Allspring Global Investments, from 2014 to 2019 and Executive Vice President responsible for marketing, investments and product development for Allspring Funds Management, LLC, from 2009 to 2014. In addition, Mr. Owen was an Executive Vice President of Wells Fargo & Company from 2014 to 2021. |
Jeremy DePalma
(Born 1974) | Treasurer,
since 2012
(for certain funds in
the Fund Complex);
since 2021 (for
the remaining funds in the
Fund Complex) | Senior Vice President of Allspring Funds Management, LLC since 2009. Senior Vice President of Evergreen Investment Management Company, LLC from 2008 to 2010 and head of the Fund Reporting and Control Team within Fund Administration from 2005 to 2010. |
Kate McKinley
(Born 1977) | Chief Legal Officer,
since 2021 | Chief Legal Officer of Allspring Global Investments since 2021. Prior thereto, held various roles at State Street Global Advisors beginning in 2010, including serving as Senior Vice President and General Counsel from 2019 to 2021, and Chief Operating Officer of the Institutional Client Group from 2016 - 2019. Prior to working at State Street Global Advisors served as Assistant General Counsel for Bank of America Corporation from 2005 to 2010 and as an Associate at WilmerHale from 2002 to 2005. |
Christopher Baker
(Born 1976) | Chief Compliance Officer, since 2022 | Global Chief Compliance Officer for Allspring Global Investments since 2022. Prior thereto, Chief Compliance Officer for State Street Global Advisors from 2018 to 2021. Senior Compliance Officer for the State Street divisions of Alternative Investment Solutions, Sector Solutions, and Global Marketing from 2015 to 2018. From 2010 to 2015 Vice President, Global Head of Investment and Marketing Compliance for State Street Global Advisors. |
Matthew Prasse
(Born 1983) | Secretary,
since 2021 | Senior Counsel of the Allspring Legal Department since 2021. Senior Counsel of the Wells Fargo Legal Department from 2018 to 2021. Previously, Counsel for Barings LLC from 2015 to 2018. Prior to joining Barings, Associate at Morgan, Lewis & Bockius LLP from 2008 to 2015. |
1 The Statement of Additional Information includes additional information about the Trustees and is available, without charge, upon request, by calling 1-800-222-8222 or by visiting the website at allspringglobal.com.
2 For those Officers with tenures at Allspring Global Investments and/or Allspring Funds Management, LLC that began prior to 2021, such tenures include years of service during which these businesses/entities were known as Wells Fargo Asset Management and Wells Fargo Funds Management, LLC, respectively.
Allspring Managed Account | 25
Other information (unaudited)
LIQUIDITY RISK MANAGEMENT PROGRAM
In accordance with Rule 22e-4 under the Investment Company Act of 1940, as amended (the “Liquidity Rule”), Allspring Funds Trust (the “Trust”) has adopted and implemented a liquidity risk management program (the “Program”) on behalf of each of its series (other than the series that operate as money market funds), including the Fund, which is reasonably designed to assess and manage the Fund's liquidity risk. “Liquidity risk” is defined under the Liquidity Rule as the risk that the Fund is unable to meet redemption requests without significantly diluting remaining investors’ interests in the Fund. The Trust’s Board of Trustees (the “Board”) previously approved the designation of Allspring Funds Management, LLC (“Allspring Funds Management”), the Fund's investment manager, to administer the Program, and Allspring Funds Management has established a Liquidity Risk Management Council (the "Council") composed of personnel from multiple departments within Allspring Funds Management and its affiliates to assist Allspring Funds Management in the administration of the Program.
The Program is comprised of various components designed to support the assessment and/or management of liquidity risk, including: (1) the periodic assessment (no less frequently than annually) of certain factors that influence the Fund's liquidity risk; (2) the periodic classification (no less frequently than monthly) of the Fund's investments into one of four liquidity categories that reflect an estimate of their liquidity under current market conditions; (3) a 15% limit on the acquisition of “illiquid investments” (as defined under the Liquidity Rule); (4) to the extent the Fund does not invest primarily in “highly liquid investments” (as defined under the Liquidity Rule), the determination of a minimum percentage of the Fund's assets that generally will be invested in highly liquid investments (an “HLIM”); (5) if the Fund has established an HLIM, the periodic review (no less frequently than annually) of the HLIM and the adoption of policies and procedures for responding to a shortfall of the Fund's “highly liquid investments” below its HLIM; and (6) periodic reporting to the Board.
At a meeting of the Board held on May 24-25, 2022, the Board received and reviewed a written report (the “Report”) from Allspring Funds Management that, among other things, addressed the operation of the Program and assessed its adequacy and effectiveness for the period from January 1, 2021 through December 31, 2021 (the “Reporting Period”). Other than extended foreign market holidays, no significant liquidity events impacting the Funds were noted in the Report. In addition, other than corporate-related changes to the Program, there were no material changes to the Program during the Reporting Period.
Allspring Funds Management determined in the Report that the Program has been implemented and operates effectively to manage each Fund’s, including the Fund’s, liquidity risk, and Allspring Funds Management continues to believe that the Program has been and continues to be adequately and effectively implemented to monitor and, as applicable, respond to the Fund’s liquidity developments.
There can be no assurance that the Program will achieve its objectives under all circumstances in the future. Please refer to the Fund’s prospectus for more information regarding the Fund’s exposure to liquidity risk and other risks to which an investment in the Fund may be subject.
26 | Allspring Managed Account
For more information
More information about Allspring Funds is available free upon request. To obtain literature, please write, visit the Fund's website, or call:
Allspring Funds
Attn: Managed Account Services
P.O. Box 1450
Milwaukee, WI 53201
Website: allspringglobal.com
Telephone: 1-888-877-9275
This report and the financial statements contained herein are submitted for the general information of the shareholders of the Fund. If this report is used for promotional purposes, distribution of the report must be accompanied or preceded by a current prospectus. Before investing, please consider the investment objectives, risks, charges, and expenses of the investment. For a current prospectus and, if available, a summary prospectus, containing this information, call
1-888-877-9275 or visit the Fund's website at allspringglobal.com. Read the prospectus carefully before you invest or send money.
Allspring Global InvestmentsTM is the trade name for the asset management firms of Allspring Global Investments Holdings, LLC, a holding company indirectly owned by certain private funds of GTCR LLC and Reverence Capital Partners, L.P. These firms include but are not limited to Allspring Global Investments, LLC, and Allspring Funds Management, LLC. Certain products managed by Allspring entities are distributed by Allspring Funds Distributor, LLC (a broker-dealer and Member FINRA/SIPC).
This material is for general informational and educational purposes only and is NOT intended to provide investment advice or a recommendation of any kind - including a recommendation for any specific investment, strategy, or plan.
© 2022 Allspring Global Investments Holdings, LLC. All rights reserved.
PAR-0722-00682 08-22
SCBSM/SAR131 06-22
Not applicable.
| ITEM 3. | AUDIT COMMITTEE FINANCIAL EXPERT |
Not applicable.
| ITEM 4. | PRINCIPAL ACCOUNTANT FEES AND SERVICES |
Not applicable.
| ITEM 5. | AUDIT COMMITTEE OF LISTED REGISTRANTS |
Not applicable.
A Portfolio of Investments for each series of Allspring Funds Trust is included as part of the report to shareholders filed under Item 1 of this Form.
| ITEM 7. | DISCLOSURE OF PROXY VOTING POLICIES AND PROCEDURES FOR CLOSED-END MANAGEMENT INVESTMENT COMPANIES |
Not applicable.
| ITEM 8. | PORTFOLIO MANAGERS OF CLOSED-END MANAGEMENT INVESTMENT COMPANIES |
Not applicable.
| ITEM 9. | PURCHASES OF EQUITY SECURITIES BY CLOSED-END MANAGEMEENT INVESTMENT COMPANY AND AFFILIATED PURCHASERS |
Not applicable.
| ITEM 10. | SUBMISSION OF MATTERS TO A VOTE OF SECURITY HOLDERS |
There have been no material changes to the procedures by which shareholders may recommend nominees to the registrant’s Board of Trustees that have been implemented since the registrant’s last provided disclosure in response to the requirements of this Item.
| ITEM 11. | CONTROLS AND PROCEDURES |
(a) The President and Treasurer have concluded that the Allspring Funds Trust disclosure controls and procedures (as defined in Rule 30a-3(c) under the Investment Company Act of 1940) provide reasonable assurances that material information relating to the registrant is made known to them by the appropriate persons, based on their evaluation of these controls and procedures as of a date within 90 days of the filing of this report.
(b) There were no significant changes in the registrant’s internal controls over financial reporting (as defined in Rule 30a-3(d) under the Investment Company Act of 1940) that occurred during the most recent fiscal half-year of the period covered by this report that materially affected, or is reasonably likely to materially affect, the registrant’s internal control over financial reporting.
| ITEM 12. | DISCLOSURES OF SECURITIES LENDING ACTIVITES FOR CLOSED-END MANAGEMENT INVESTMENT COMPANIES |
Not applicable.
(a)(1) Not applicable.
(a)(2) Certifications pursuant to Section 302 of the Sarbanes-Oxley Act of 2002.
(b) Certifications pursuant to Section 906 of the Sarbanes-Oxley Act of 2002.
SIGNATURES
Pursuant to the requirements of the Securities Exchange Act of 1934 and the Investment Company Act of 1940, the registrant has duly caused this report to be signed on its behalf by the undersigned, thereunto duly authorized.
| | |
| Allspring Funds Trust |
| |
| By: | | /s/ Andrew Owen |
| | Andrew Owen President |
| Date: | | August 25, 2022 |
Pursuant to the requirements of the Securities Exchange Act of 1934 and the Investment Company Act of 1940, this report has been signed below by the following persons on behalf of the registrant and in the capacities and on the date indicated.
| | |
| Allspring Funds Trust |
| |
| By: | | /s/ Andrew Owen |
| | Andrew Owen President |
| Date: | | August 25, 2022 |
| | |
By: | | /s/ Jeremy DePalma |
| | Jeremy DePalma Treasurer |
Date: | | August 25, 2022 |