UNITED STATES
SECURITIES AND EXCHANGE COMMISSION
Washington, D.C. 20549
FORM N-CSRS
CERTIFIED SHAREHOLDER REPORT OF REGISTERED
MANAGEMENT INVESTMENT COMPANIES
Investment Company Act file number: 811-09253
Allspring Funds Trust
(Exact name of registrant as specified in charter)
525 Market St., San Francisco, CA 94105
(Address of principal executive offices) (Zip code)
Matthew Prasse
Allspring Funds Management, LLC
525 Market St., San Francisco, CA 94105
(Name and address of agent for service)
Registrant’s telephone number, including area code: 800-222-8222
Date of fiscal year end: March 31
Registrant is making a filing for 7 of its series:
Allspring Disciplined Small Cap Fund, Allspring Discovery Innovation Fund, Allspring Discovery Small Cap Growth Fund, Allspring Precious Metals Fund, Allspring Small Cap Fund, Allspring Special Small Cap Value Fund, Allspring Utility and Telecommunications Fund.
Date of reporting period: September 30, 2022
ITEM 1. REPORT TO STOCKHOLDERS
Semi-Annual Report
September 30, 2022
Allspring
Disciplined Small Cap Fund
The views expressed and any forward-looking statements are as of September 30, 2022, unless otherwise noted, and are those of the Fund's portfolio managers and/or Allspring Global Investments. Discussions of individual securities or the markets generally are not intended as individual recommendations. Future events or results may vary significantly from those expressed in any forward-looking statements. The views expressed are subject to change at any time in response to changing circumstances in the market. Allspring Global Investments disclaims any obligation to publicly update or revise any views expressed or forward-looking statements.
Allspring Disciplined Small Cap Fund | 1
Letter to shareholders (unaudited)
Andrew Owen
President
Allspring Funds
Dear Shareholder:
We are pleased to offer you this semi-annual report for Allspring Disciplined Small Cap Fund for the six-month period that ended September 30, 2022. Globally, stocks and bonds experienced heightened volatility through the extremely difficult period. Non-U.S. securities fared the worst as the global economy faced multiple challenges and the strength of the U.S. dollar eroded already-poor returns of non-U.S.-dollar-denominated assets. Bonds had historically poor performance, with major fixed income indexes falling substantially for the six-month period.
Earlier tailwinds provided by global stimulus programs, vaccination rollouts, and recovering consumer and corporate sentiment were wiped away by the highest rate of inflation in four decades, the impact of ongoing aggressive central bank rate hikes and the prospect of more, plus the global reverberations of the Russia-Ukraine war. The already-significant global supply chain disruptions were compounded by China’s COVID-19 lockdowns.
For the six-month period, both stocks and bonds registered major losses, with even U.S. bonds suffering deep losses and other assets faring worse. For the period, U.S. stocks, based on the S&P 500 Index,1 lost 20.20%. International stocks, as measured by the MSCI ACWI ex USA Index (Net),2 returned -22.27%, while the MSCI EM Index (Net) (USD)3 declined 21.70%. Among bond indexes, the Bloomberg U.S. Aggregate Bond Index,4 returned -9.22%, the Bloomberg Global Aggregate ex-USD Index (unhedged),5 returned -18.89%, the Bloomberg Municipal Bond Index6 declined 6.30%, and the ICE BofA U.S. High Yield Index7 fell 10.56%.
| 1 | The S&P 500 Index consists of 500 stocks chosen for market size, liquidity, and industry group representation. It is a market-value-weighted index with each stock's weight in the index proportionate to its market value. You cannot invest directly in an index. |
| 2 | The Morgan Stanley Capital International (MSCI) All Country World Index (ACWI) ex USA Index (Net) is a free-float-adjusted market-capitalization-weighted index that is designed to measure the equity market performance of developed and emerging markets, excluding the U.S. Source: MSCI. MSCI makes no express or implied warranties or representations and shall have no liability whatsoever with respect to any MSCI data contained herein. The MSCI data may not be further redistributed or used as a basis for other indexes or any securities or financial products. This report is not approved, reviewed, or produced by MSCI. You cannot invest directly in an index. |
| 3 | The MSCI Emerging Markets (EM) Index (Net) (USD) is a free-float-adjusted market-capitalization-weighted index that is designed to measure equity market performance of emerging markets. You cannot invest directly in an index. |
| 4 | The Bloomberg U.S. Aggregate Bond Index is a broad-based benchmark that measures the investment-grade, U.S.-dollar-denominated, fixed-rate taxable bond market, including Treasuries, government-related and corporate securities, mortgage-backed securities (agency fixed-rate and hybrid adjustable-rate mortgage pass-throughs), asset-backed securities, and commercial mortgage-backed securities. You cannot invest directly in an index. |
| 5 | The Bloomberg Global Aggregate ex-USD Index (unhedged) is an unmanaged index that provides a broad-based measure of the global investment-grade fixed-income markets excluding the U.S.-dollar-denominated debt market. You cannot invest directly in an index. |
| 6 | The Bloomberg Municipal Bond Index is an unmanaged index composed of long-term tax-exempt bonds with a minimum credit rating of Baa. You cannot invest directly in an index. |
| 7 | The ICE BofA U.S. High Yield Index is a market-capitalization-weighted index of domestic and Yankee high-yield bonds. The index tracks the performance of high-yield securities traded in the U.S. bond market. You cannot invest directly in an index. Copyright 2022. ICE Data Indices, LLC. All rights reserved. |
2 | Allspring Disciplined Small Cap Fund
Letter to shareholders (unaudited)
Rising inflation, COVID, and the Russian invasion of Ukraine drove market performance.
Just before the six-month reporting period began, global financial markets had been rocked by the Russian invasion of Ukraine and resulting spike in volatility. In April, the market misery continued, with broad and deep losses, as both the S&P 500 Index and MSCI ACWI (Net)1 fell 8% or more for the month. The Chinese economy struggled through a strict lockdown as the government tried to contain a major COVID-19 outbreak. The ensuing global ripple effect compounded existing supply shortages. This was exacerbated by the impact of the Russia-Ukraine war on global commodities. Meanwhile, U.S. annual inflation raged at 8.5%, its highest level since 1981, and investors braced themselves for aggressive Federal Reserve (Fed) monetary tightening moves.
Market volatility continued in May, although markets recovered ground late in the month. Value stocks outperformed growth stocks. The concerns that had dominated markets for months continued, including high inflation and geopolitical tensions that added to high crude oil, gasoline, and food prices. In response, the Fed raised the federal funds rate by 0.50%, with widescale expectations of multiple rate hikes to come. Meanwhile, highly contagious COVID-19 variants persisted. However, labor markets in the U.S., the U.K., and Europe remained strong. U.S. retail sales for April, released in May, indicated a fourth consecutive monthly increase, reflecting continued consumer resilience.
A dreadful year in financial markets continued in June with stocks posting further losses en route to their worst first half of a year in 50 years. Bonds didn’t fare much better. Driving the losses were the same factors that have been at play: rising global inflation and fears of recession as central banks increase rates to try to curb inflation, which climbed above 9% in June in the U.S. The Fed raised its short-term rate by another 0.75% in June. Meanwhile, U.S. economic data showed resilience as the U.S. unemployment rate held steady at 3.6% and the housing market was only marginally affected, so far, by sharply higher mortgage rates.
Markets rebounded in July, led by U.S. stocks. While evidence began to point to an economic slowdown after two consecutive quarters of declining gross domestic product (economic contraction), the U.S. labor market remained surprisingly strong: July nonfarm payrolls grew by more than 500,000 and U.S. unemployment dipped to 3.5%. Meanwhile, crude oil and retail gasoline prices, major contributors to recent overall inflation, fell substantially from earlier highs. And while U.S. home prices rose, sales fell as houses became less affordable with mortgage rates at a 13-year high. The Fed raised the federal funds rate another 0.75% in July—to a range of 2.25% to 2.50%—and forecasts pointed to continued rate increases.
August was yet another broadly challenging month for financial markets, with more red ink flowing. High inflation persisted, cresting 9% in the eurozone and remaining above 8% in the U.S. despite the Fed’s aggressive monetary policy and a major drop in global crude oil and gasoline prices from their June peak. One positive note in the U.S. was the resilience of the country’s jobs market. However, the Fed’s job was clearly not complete. One longer-term bright spot was the U.S. Congress’s passage of the Inflation Reduction Act. Its primary stated goals include include to reduce inflation (though not immediately) by curbing the deficit, capping health care spending by seniors, and investing in domestic sources of clean energy.
“ Just before the six-month reporting period began, global financial markets had been rocked by the Russian invasion of Ukraine and resulting spike in volatility. In April, the market misery continued, with broad and deep losses, as both the S&P 500 Index and MSCI ACWI (Net) fell 8% or more for the month.”
| 1 | The MSCI ACWI (Net) is a free-float-adjusted market-capitalization-weighted index that is designed to measure the equity market performance of developed and emerging markets. You cannot invest directly in an index. |
Allspring Disciplined Small Cap Fund | 3
Letter to shareholders (unaudited)
The market misery continued in September. There was nowhere to hide as all asset classes suffered major losses at the hands of persistent inflation. Central banks kept up their battle against rapidly rising prices with more rate hikes. The strength of the U.S. dollar made things even more difficult for investors holding assets in other currencies. U.S. mortgage rates jumped to near 7% on 30-year fixed-rate mortgages; the decreased housing affordability began to cool demand somewhat. The U.K. experienced a sharp sell-off of government bonds and the British pound in September as investors panicked in response to a new government budget that was seen as financially unsound. The market meltdown forced the Bank of England to step in and buy long-dated government bonds. The drama continued into the next fiscal year.
Don’t let short-term uncertainty derail long-term investment goals.
Periods of investment uncertainty can present challenges, but experience has taught us that maintaining long-term investment goals can be an effective way to plan for the future. To help you create a sound strategy based on your personal goals and risk tolerance, Allspring Funds offers more than 100 mutual funds spanning a wide range of asset classes and investment styles. Although diversification cannot guarantee an investment profit or prevent losses, we believe it can be an effective way to manage investment risk and potentially smooth out overall portfolio performance. We encourage investors to know their investments and to understand that appropriate levels of risk-taking may unlock opportunities.
Thank you for choosing to invest with Allspring Funds. We appreciate your confidence in us and remain committed to helping you meet your financial needs.
Sincerely,
Andrew Owen
President
Allspring Funds
For further information about your fund, contact your investment professional, visit our website at allspringglobal.com, or call us directly at 1-800-222-8222.
4 | Allspring Disciplined Small Cap Fund
This page is intentionally left blank.
Performance highlights (unaudited)
| Investment objective | The Fund seeks long-term capital appreciation. |
| Manager | Allspring Funds Management, LLC |
| Subadviser | Allspring Global Investments, LLC |
| Portfolio managers | Justin P. Carr, CFA®‡, Robert M. Wicentowski, CFA®‡ |
| Average annual total returns (%) as of September 30, 2022 |
| | | Including sales charge | | Excluding sales charge | | Expense ratios1 (%) |
| | Inception date | 1 year | 5 year | 10 year | | 1 year | 5 year | 10 year | | Gross | Net 2 |
| Class A (WDSAX)3 | 7-31-2018 | -23.21 | 0.85 | 7.31 | | -18.52 | 2.06 | 7.94 | | 1.75 | 0.93 |
| Class R6 (WSCJX)4 | 10-31-2016 | – | – | – | | -18.23 | 2.17 | 8.09 | | 1.32 | 0.50 |
| Administrator Class (NVSOX) | 8-1-1993 | – | – | – | | -18.50 | 1.90 | 7.86 | | 1.67 | 0.85 |
| Institutional Class (WSCOX)5 | 10-31-2014 | – | – | – | | -18.34 | 2.14 | 8.07 | | 1.42 | 0.60 |
| Russell 2000® Index6 | – | – | – | – | | -23.50 | 3.55 | 8.55 | | – | – |
Figures quoted represent past performance, which is no guarantee of future results, and do not reflect taxes that a shareholder may pay on an investment in a fund. Investment return and principal value of an investment will fluctuate so that an investor’s shares, when redeemed, may be worth more or less than their original cost. Performance shown without sales charges would be lower if sales charges were reflected. Current performance may be lower or higher than the performance data quoted, which assumes the reinvestment of dividends and capital gains. Current month-end performance is available on the Fund’s website, allspringglobal.com.
Index returns do not include transaction costs associated with buying and selling securities, any mutual fund fees or expenses, or any taxes. It is not possible to invest directly in an index.
For Class A shares, the maximum front-end sales charge is 5.75%. Class R6, Administrator Class and Institutional Class shares are sold without a front-end sales charge or contingent deferred sales charge.
| 1 | Reflects the expense ratios as stated in the most recent prospectuses. The expense ratios shown are subject to change and may differ from the annualized expense ratios shown in the financial highlights of this report. |
| 2 | The manager has contractually committed through July 31, 2023, to waive fees and/or reimburse expenses to the extent necessary to cap total annual fund operating expenses after fee waivers at 0.93% for Class A, 0.50% for Class R6, 0.85% for Administrator Class, and 0.60% for Institutional Class. Brokerage commissions, stamp duty fees, interest, taxes, acquired fund fees and expenses (if any), and extraordinary expenses are excluded from the expense caps. Prior to or after the commitment expiration date, the caps may be increased or the commitment to maintain the caps may be terminated only with the approval of the Board of Trustees. Without these caps, the Fund’s returns would have been lower. The expense ratio paid by an investor is the net expense ratio (the total annual fund operating expenses after fee waivers) as stated in the prospectuses. |
| 3 | Historical performance shown for the Class A shares prior to their inception reflects the performance of the Administrator Class shares, and is adjusted to reflect the higher expenses and sales charges of the Class A shares. |
| 4 | Historical performance shown for the Class R6 shares prior to their inception reflects the performance of the Institutional Class shares, and includes the higher expenses applicable to the Institutional Class shares. If these expenses had not been included, returns for the Class R6 shares would be higher. |
| 5 | Historical performance shown for the Institutional Class shares prior to their inception reflects the performance of the Administrator Class shares, and includes the higher expenses applicable to the Administrator Class shares. If these expenses had not been included, returns for the Institutional Class shares would be higher. |
| 6 | The Russell 2000® Index measures the performance of the 2,000 smallest companies in the Russell 3000® Index, which represents approximately 8% of the total market capitalization of the Russell 3000® Index. You cannot invest directly in an index. |
Stock values fluctuate in response to the activities of individual companies and general market and economic conditions. Smaller-company stocks tend to be more volatile and less liquid than those of larger companies. The use of derivatives may reduce returns and/or increase volatility. Consult the Fund’s prospectus for additional information on these and other risks.
| ‡ | CFA® and Chartered Financial Analyst® are trademarks owned by CFA Institute. |
6 | Allspring Disciplined Small Cap Fund
Performance highlights (unaudited)
| Ten largest holdings (%) as of September 30, 20221 |
| Forma Therapeutics Holdings | 1.02 |
| EMCOR Group Incorporated | 0.91 |
| Option Care Health Incorporated | 0.86 |
| Lantheus Holdings Incorporated | 0.84 |
| SPS Commerce Incorporated | 0.82 |
| AMN Healthcare Services Incorporated | 0.78 |
| Mueller Industries Incorporated | 0.77 |
| Atkore Incorporated | 0.76 |
| WESCO International Incorporated | 0.76 |
| International Money Express Incorporated | 0.74 |
| 1 | Figures represent the percentage of the Fund's net assets. Holdings are subject to change and may have changed since the date specified. |
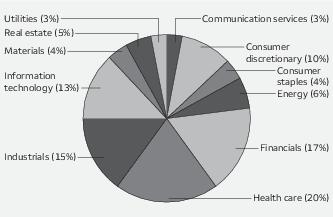
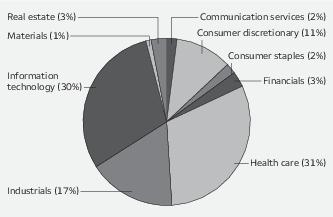
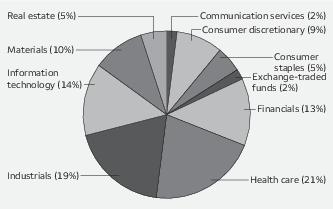
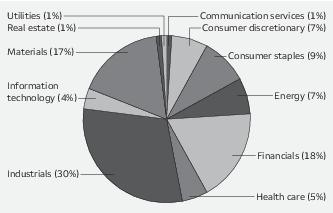
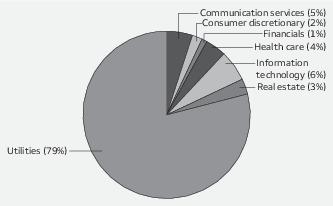
| Sector allocation as of September 30, 20221 |
| 1 | Figures represent the percentage of the Fund's long-term investments. Allocations are subject to change and may have changed since the date specified. |
Allspring Disciplined Small Cap Fund | 7
Fund expenses (unaudited)
As a shareholder of the Fund, you incur two types of costs: (1) transaction costs, including sales charges (loads) on purchase payments and contingent deferred sales charges (if any) on redemptions and (2) ongoing costs, including management fees, shareholder servicing fees, and other Fund expenses. This example is intended to help you understand your ongoing costs (in dollars) of investing in the Fund and to compare these costs with the ongoing costs of investing in other mutual funds.
The example is based on an investment of $1,000 invested at the beginning of the six-month period and held for the entire period from April 1, 2022 to September 30, 2022.
Actual expenses
The “Actual” line of the table below provides information about actual account values and actual expenses. You may use the information in this line, together with the amount you invested, to estimate the expenses that you paid over the period. Simply divide your account value by $1,000 (for example, an $8,600 account value divided by $1,000 = 8.6), then multiply the result by the number in the “Actual” line under the heading entitled “Expenses paid during period” for your applicable class of shares to estimate the expenses you paid on your account during this period.
Hypothetical example for comparison purposes
The “Hypothetical” line of the table below provides information about hypothetical account values and hypothetical expenses based on the Fund’s actual expense ratio and an assumed rate of return of 5% per year before expenses, which is not the Fund’s actual return. The hypothetical account values and expenses may not be used to estimate the actual ending account balance or expenses you paid for the period. You may use this information to compare the ongoing costs of investing in the Fund and other funds. To do so, compare this 5% hypothetical example with the 5% hypothetical examples that appear in the shareholder reports of the other funds.
Please note that the expenses shown in the table are meant to highlight your ongoing costs only and do not reflect any transactional costs, such as sales charges (loads) and contingent deferred sales charges. Therefore, the “Hypothetical” line of the table is useful in comparing ongoing costs only, and will not help you determine the relative total costs of owning different funds. In addition, if these transactional costs were included, your costs would have been higher.
| | Beginning
account value
4-1-2022 | Ending
account value
9-30-2022 | Expenses
paid during
the period1 | Annualized net
expense ratio |
| Class A | | | | |
| Actual | $1,000.00 | $ 822.34 | $4.11 | 0.90% |
| Hypothetical (5% return before expenses) | $1,000.00 | $1,020.56 | $4.56 | 0.90% |
| Class R6 | | | | |
| Actual | $1,000.00 | $ 823.88 | $2.29 | 0.50% |
| Hypothetical (5% return before expenses) | $1,000.00 | $1,022.56 | $2.54 | 0.50% |
| Administrator Class | | | | |
| Actual | $1,000.00 | $ 822.68 | $3.88 | 0.85% |
| Hypothetical (5% return before expenses) | $1,000.00 | $1,020.81 | $4.31 | 0.85% |
| Institutional Class | | | | |
| Actual | $1,000.00 | $ 823.23 | $2.74 | 0.60% |
| Hypothetical (5% return before expenses) | $1,000.00 | $1,022.06 | $3.04 | 0.60% |
1 Expenses paid is equal to the annualized net expense ratio of each class multiplied by the average account value over the period, multiplied by 183 divided by 365 (to reflect the one-half-year period).
8 | Allspring Disciplined Small Cap Fund
Portfolio of investments—September 30, 2022 (unaudited)
| | | | | Shares | Value |
| Common stocks: 96.69% | | | | | |
| Communication services: 2.62% | | | | | |
| Diversified telecommunication services: 0.58% | | | | | |
| Charge Enterprises Incorporated † | | | | 13,555 | $ 23,857 |
| Echostar Corporation Class A † | | | | 4,173 | 68,729 |
| | | | | | 92,586 |
| Interactive media & services: 0.42% | | | | | |
| QuinStreet Incorporated † | | | | 1,558 | 16,359 |
| Ziff Davis Incorporated | | | | 724 | 49,580 |
| | | | | | 65,939 |
| Media: 1.49% | | | | | |
| Entravision Communications Corporation Class A | | | | 10,420 | 41,367 |
| Gray Television Incorporated | | | | 3,695 | 52,912 |
| Magnite Incorporated † | | | | 1,161 | 7,628 |
| Nexstar Media Group Incorporated Class A | | | | 545 | 90,933 |
| Sinclair Broadcast Group Incorporated Class A | | | | 900 | 16,281 |
| TechTarget Incorporated † | | | | 466 | 27,587 |
| | | | | | 236,708 |
| Wireless telecommunication services: 0.13% | | | | | |
| Gogo Incorporated † | | | | 1,711 | 20,737 |
| Consumer discretionary: 9.81% | | | | | |
| Auto components: 0.70% | | | | | |
| Dana Incorporated | | | | 3,903 | 44,611 |
| Gentherm Incorporated † | | | | 356 | 17,704 |
| Standard Motor Products Incorporated | | | | 864 | 28,080 |
| The Goodyear Tire & Rubber Company † | | | | 2,035 | 20,533 |
| | | | | | 110,928 |
| Diversified consumer services: 1.97% | | | | | |
| Chegg Incorporated † | | | | 2,666 | 56,173 |
| Perdoceo Education Corporation † | | | | 4,173 | 42,982 |
| Stride Incorporated † | | | | 2,692 | 113,145 |
| Vivint Smart Home Incorporated † | | | | 15,119 | 99,483 |
| | | | | | 311,783 |
| Hotels, restaurants & leisure: 1.73% | | | | | |
| Bloomin' Brands Incorporated | | | | 5,149 | 94,381 |
| Brinker International Incorporated † | | | | 3,852 | 96,223 |
| International Game Technology plc | | | | 3,853 | 60,877 |
| Wingstop Incorporated | | | | 188 | 23,579 |
| | | | | | 275,060 |
| Household durables: 1.75% | | | | | |
| Helen of Troy Limited † | | | | 292 | 28,160 |
| Installed Building Products Incorporated | | | | 311 | 25,188 |
| KB Home Incorporated | | | | 1,184 | 30,689 |
| M/I Homes Incorporated † | | | | 1,022 | 37,027 |
| Meritage Corporation † | | | | 653 | 45,886 |
| Skyline Champion Corporation † | | | | 383 | 20,249 |
| Sonos Incorporated † | | | | 706 | 9,813 |
The accompanying notes are an integral part of these financial statements.
Allspring Disciplined Small Cap Fund | 9
Portfolio of investments—September 30, 2022 (unaudited)
| | | | | Shares | Value |
| Household durables (continued) | | | | | |
| Taylor Morrison Home Corporation † | | | | 2,943 | $ 68,631 |
| Universal Electronics Incorporated † | | | | 616 | 12,117 |
| | | | | | 277,760 |
| Internet & direct marketing retail: 0.32% | | | | | |
| Overstock.com Incorporated † | | | | 972 | 23,668 |
| Revolve Group Incorporated † | | | | 1,221 | 26,483 |
| | | | | | 50,151 |
| Specialty retail: 2.49% | | | | | |
| American Eagle Outfitters Incorporated | | | | 1,499 | 14,585 |
| Asbury Automotive Group Incorporated † | | | | 585 | 88,394 |
| Big 5 Sporting Goods Corporation « | | | | 8,270 | 88,820 |
| Genesco Incorporated † | | | | 531 | 20,879 |
| Hibbett Incorporated | | | | 1,901 | 94,689 |
| ODP Corporation † | | | | 1,067 | 37,505 |
| Zumiez Incorporated † | | | | 2,358 | 50,768 |
| | | | | | 395,640 |
| Textiles, apparel & luxury goods: 0.85% | | | | | |
| Crocs Incorporated † | | | | 665 | 45,659 |
| G-III Apparel Group Limited † | | | | 2,489 | 37,211 |
| Steven Madden Limited | | | | 1,931 | 51,500 |
| | | | | | 134,370 |
| Consumer staples: 3.65% | | | | | |
| Beverages: 0.66% | | | | | |
| Coca Cola Bottling Corporation | | | | 99 | 40,761 |
| Duckhorn Portfolio Incorporated † | | | | 4,369 | 63,045 |
| | | | | | 103,806 |
| Food & staples retailing: 1.33% | | | | | |
| Sprouts Farmers Market Incorporated † | | | | 765 | 21,229 |
| The Andersons Incorporated | | | | 1,616 | 50,144 |
| The Chef's Warehouse Incorporated † | | | | 1,761 | 51,016 |
| United Natural Foods Incorporated † | | | | 2,593 | 89,121 |
| | | | | | 211,510 |
| Food products: 0.60% | | | | | |
| John B. Sanfilippo & Son Incorporated | | | | 373 | 28,247 |
| SunOpta Incorporated † | | | | 1,335 | 12,149 |
| The Simply Good Foods Company † | | | | 1,725 | 55,183 |
| | | | | | 95,579 |
| Personal products: 1.06% | | | | | |
| Bellring Brands Incorporated † | | | | 2,421 | 49,897 |
| Medifast Incorporated | | | | 522 | 56,564 |
| USANA Health Sciences Incorporated † | | | | 1,102 | 61,767 |
| | | | | | 168,228 |
| Energy: 6.14% | | | | | |
| Energy equipment & services: 1.21% | | | | | |
| Nabors Industries Limited † | | | | 356 | 36,116 |
The accompanying notes are an integral part of these financial statements.
10 | Allspring Disciplined Small Cap Fund
Portfolio of investments—September 30, 2022 (unaudited)
| | | | | Shares | Value |
| Energy equipment & services (continued) | | | | | |
| Nextier Oilfield Solutions Incorporated † | | | | 9,168 | $ 67,843 |
| Noble Corporation plc † | | | | 868 | 25,675 |
| Oceaneering International Incorporated † | | | | 4,275 | 34,029 |
| US Silica Holdings Incorporated † | | | | 2,575 | 28,196 |
| | | | | | 191,859 |
| Oil, gas & consumable fuels: 4.93% | | | | | |
| Arch Resources Incorporated | | | | 289 | 34,275 |
| Callon Petroleum Company † | | | | 360 | 12,604 |
| Chord Energy Corporation | | | | 338 | 46,228 |
| Civitas Resources Incorporated | | | | 620 | 35,582 |
| CVR Energy Incorporated | | | | 1,860 | 53,903 |
| Laredo Petroleum Incorporated † | | | | 1,288 | 80,951 |
| Matador Resources Company | | | | 1,003 | 49,067 |
| PBF Energy Incorporated Class A † | | | | 1,679 | 59,034 |
| PDC Energy Incorporated | | | | 508 | 29,357 |
| Peabody Energy Corporation † | | | | 4,014 | 99,627 |
| Ranger Oil Corporation Class A | | | | 2,503 | 78,719 |
| SM Energy Company | | | | 2,881 | 108,354 |
| Southwestern Energy Company † | | | | 5,999 | 36,714 |
| W&T Offshore Incorporated † | | | | 4,488 | 26,300 |
| World Fuel Services Corporation | | | | 1,373 | 32,183 |
| | | | | | 782,898 |
| Financials: 16.26% | | | | | |
| Banks: 10.03% | | | | | |
| Bank of N.T. Butterfield & Son Limited | | | | 2,496 | 81,020 |
| BankUnited Incorporated | | | | 2,341 | 79,992 |
| Brookline Bancorp Incorporated | | | | 4,190 | 48,814 |
| CNB Financial Corporation | | | | 2,404 | 56,662 |
| Customers Bancorp Incorporated † | | | | 1,588 | 46,814 |
| Enterprise Financial Service Corporation | | | | 954 | 42,014 |
| Financial Institutions Incorporated | | | | 1,922 | 46,263 |
| First Bancorp of North Carolina | | | | 1,657 | 60,613 |
| First Bancorp of Puerto Rico | | | | 6,230 | 85,226 |
| First Bank | | | | 2,376 | 32,480 |
| First Foundation Incorporated | | | | 2,192 | 39,763 |
| First Interstate BancSystem Class A | | | | 1,427 | 57,579 |
| First Merchants Corporation | | | | 1,418 | 54,848 |
| Great Southern Bancorp Incorporated | | | | 1,097 | 62,606 |
| Hancock Whitney Corporation | | | | 1,621 | 74,258 |
| Hanmi Financial Corporation | | | | 3,344 | 79,186 |
| Hilltop Holdings Incorporated | | | | 2,457 | 61,056 |
| NBT Bancorp Incorporated | | | | 1,998 | 75,824 |
| OFG Bancorp | | | | 2,763 | 69,434 |
| Preferred Bank | | | | 1,097 | 71,557 |
| RBB Bancorp | | | | 3,183 | 66,143 |
| Silvergate Capital Corporation Class A † | | | | 616 | 46,416 |
| The Bancorp Incorporated † | | | | 2,943 | 64,687 |
| TriCo Bancshares | | | | 1,850 | 82,603 |
| Univest Financial Corporation | | | | 1,647 | 38,672 |
| Westamerica Bancorporation | | | | 1,288 | 67,350 |
| | | | | | 1,591,880 |
The accompanying notes are an integral part of these financial statements.
Allspring Disciplined Small Cap Fund | 11
Portfolio of investments—September 30, 2022 (unaudited)
| | | | | Shares | Value |
| Capital markets: 1.46% | | | | | |
| Artisan Partners Asset Management Incorporated Class A | | | | 1,288 | $ 34,686 |
| Evercore Partners Incorporated Class A | | | | 837 | 68,843 |
| Open Lending Corporation Class A † | | | | 2,587 | 20,799 |
| PJT Partners Incorporated Class A | | | | 526 | 35,147 |
| Stifel Financial Corporation | | | | 1,378 | 71,532 |
| | | | | | 231,007 |
| Consumer finance: 1.13% | | | | | |
| Atlanticus Holdings Corporation † | | | | 1,405 | 36,853 |
| Enova International Incorporated † | | | | 1,926 | 56,374 |
| Green Dot Corporation Class A † | | | | 1,751 | 33,234 |
| LendingClub Corporation † | | | | 3,858 | 42,631 |
| PROG Holdings Incorporated † | | | | 743 | 11,130 |
| | | | | | 180,222 |
| Insurance: 2.37% | | | | | |
| American Equity Investment Life Holding Company | | | | 2,566 | 95,686 |
| CNO Financial Group Incorporated | | | | 5,031 | 90,407 |
| Genworth Financial Incorporated Class A † | | | | 15,065 | 52,728 |
| Palomar Holdings Incorporated † | | | | 255 | 21,349 |
| Selective Insurance Group Incorporated | | | | 653 | 53,154 |
| Stewart Information Services Corporation | | | | 1,440 | 62,842 |
| | | | | | 376,166 |
| Thrifts & mortgage finance: 1.27% | | | | | |
| Essent Group Limited | | | | 2,557 | 89,163 |
| MGIC Investment Corporation | | | | 4,195 | 53,780 |
| Radian Group Incorporated | | | | 2,268 | 43,750 |
| Walker & Dunlop Incorporated | | | | 171 | 14,318 |
| | | | | | 201,011 |
| Health care: 19.25% | | | | | |
| Biotechnology: 8.40% | | | | | |
| Aduro Biotech Incorporated ♦† | | | | 4,415 | 0 |
| Agenus Incorporated † | | | | 8,770 | 17,979 |
| Alector Incorporated † | | | | 4,893 | 46,288 |
| ALX Oncology Holdings Incorporated † | | | | 3,605 | 34,500 |
| Amicus Therapeutics Incorporated † | | | | 3,749 | 39,140 |
| Arcus Biosciences Incorporated † | | | | 2,341 | 61,241 |
| Arrowhead Pharmaceuticals Incorporated † | | | | 716 | 23,664 |
| Bridgebio Pharma Incorporated † | | | | 2,439 | 24,244 |
| Cullinan Oncology Incorporated † | | | | 2,354 | 30,178 |
| Cytokinetics Incorporated † | | | | 1,548 | 75,001 |
| Dynavax Technologies Corporation † | | | | 5,752 | 60,051 |
| Erasca Incorporated †« | | | | 5,305 | 41,379 |
| Forma Therapeutics Holdings † | | | | 8,107 | 161,735 |
| Gossamer Bio Incorporated † | | | | 3,376 | 40,444 |
| Halozyme Therapeutics Incorporated † | | | | 2,113 | 83,548 |
| Icosavax Incorporated †« | | | | 6,117 | 19,330 |
| Immunovant Incorporated † | | | | 10,609 | 59,198 |
| Intellia Therapeutics Incorporated † | | | | 698 | 39,060 |
| Intercept Pharmaceuticals Incorporated † | | | | 3,227 | 45,017 |
| Iteos Therapeutics Incorporated † | | | | 2,346 | 44,691 |
| Kezar Life Sciences Incorporated † | | | | 4,276 | 36,816 |
The accompanying notes are an integral part of these financial statements.
12 | Allspring Disciplined Small Cap Fund
Portfolio of investments—September 30, 2022 (unaudited)
| | | | | Shares | Value |
| Biotechnology (continued) | | | | | |
| Kiniksa Pharmaceuticals Limited Class A † | | | | 4,664 | $ 59,886 |
| Kodiak Sciences Incorporated † | | | | 4,203 | 32,531 |
| Kymera Therapeutics Incorporated † | | | | 802 | 17,460 |
| Ligand Pharmaceuticals Incorporated † | | | | 274 | 23,594 |
| Organogenesis Holdings Incorporated Class A † | | | | 3,492 | 11,314 |
| Protagonist Therapeutics Incorporated † | | | | 1,485 | 12,519 |
| Prothena Corporation plc † | | | | 1,822 | 110,468 |
| Regenxbio Incorporated † | | | | 754 | 19,928 |
| Sana Biotechnology Incorporated † | | | | 7,088 | 42,528 |
| Ultragenyx Pharmaceutical Incorporated † | | | | 472 | 19,546 |
| | | | | | 1,333,278 |
| Health care equipment & supplies: 3.04% | | | | | |
| Axonics Incorporated † | | | | 774 | 54,521 |
| Globus Medical Incorporated Class A † | | | | 518 | 30,857 |
| Lantheus Holdings Incorporated † | | | | 1,894 | 133,205 |
| LivaNova plc † | | | | 1,068 | 54,222 |
| Omnicell Incorporated † | | | | 531 | 46,213 |
| Outset Medical Incorporated † | | | | 887 | 14,130 |
| Shockwave Medical Incorporated † | | | | 203 | 56,448 |
| STAAR Surgical Company † | | | | 724 | 51,078 |
| Surmodics Incorporated † | | | | 1,395 | 42,408 |
| | | | | | 483,082 |
| Health care providers & services: 4.41% | | | | | |
| AMN Healthcare Services Incorporated † | | | | 1,165 | 123,443 |
| Apollo Medical Holdings Incorporated † | | | | 531 | 20,709 |
| Cross Country Healthcare Incorporated † | | | | 1,306 | 37,051 |
| Fulgent Genetics Incorporated † | | | | 472 | 17,993 |
| Modivcare Incorporated † | | | | 500 | 49,840 |
| Option Care Health Incorporated † | | | | 4,356 | 137,083 |
| Owens & Minor Incorporated | | | | 1,692 | 40,777 |
| Progyny Incorporated † | | | | 1,362 | 50,476 |
| Select Medical Holdings Corporation | | | | 1,432 | 31,647 |
| Tenet Healthcare Corporation † | | | | 1,827 | 94,237 |
| The Ensign Group Incorporated | | | | 1,206 | 95,877 |
| | | | | | 699,133 |
| Health care technology: 0.53% | | | | | |
| Computer Programs & Systems Incorporated † | | | | 1,718 | 47,898 |
| NextGen Healthcare Incorporated † | | | | 2,048 | 36,250 |
| | | | | | 84,148 |
| Life sciences tools & services: 0.21% | | | | | |
| Abcellera Biologics Incorporated † | | | | 3,418 | 33,804 |
| Pharmaceuticals: 2.66% | | | | | |
| Amneal Pharmaceuticals Incorporated † | | | | 16,388 | 33,104 |
| Amphastar Pharmaceuticals Incorporated † | | | | 1,720 | 48,332 |
| Corcept Therapeutics Incorporated † | | | | 2,575 | 66,023 |
| Fulcrum Therapeutics Incorporated † | | | | 2,498 | 20,209 |
| Harmony Biosciences Holdings † | | | | 678 | 30,029 |
| Intra-Cellular Therapies Incorporated † | | | | 1,265 | 58,860 |
| Pacira Biosciences Incorporated † | | | | 639 | 33,988 |
The accompanying notes are an integral part of these financial statements.
Allspring Disciplined Small Cap Fund | 13
Portfolio of investments—September 30, 2022 (unaudited)
| | | | | Shares | Value |
| Pharmaceuticals (continued) | | | | | |
| Prestige Consumer Healthcare Incorporated † | | | | 1,661 | $ 82,768 |
| Tarsus Pharmaceuticals Incorporated † | | | | 2,803 | 47,987 |
| | | | | | 421,300 |
| Industrials: 14.27% | | | | | |
| Aerospace & defense: 0.78% | | | | | |
| Moog Incorporated Class A | | | | 774 | 54,451 |
| Vectrus Incorporated † | | | | 1,964 | 69,526 |
| | | | | | 123,977 |
| Building products: 0.28% | | | | | |
| Simpson Manufacturing Company Incorporated | | | | 571 | 44,766 |
| Commercial services & supplies: 0.49% | | | | | |
| Ennis Incorporated | | | | 1,931 | 38,871 |
| SP Plus Corporation † | | | | 1,255 | 39,307 |
| | | | | | 78,178 |
| Construction & engineering: 2.40% | | | | | |
| Comfort Systems Incorporated | | | | 874 | 85,066 |
| EMCOR Group Incorporated | | | | 1,251 | 144,465 |
| MasTec Incorporated † | | | | 792 | 50,292 |
| MYR Group Incorporated † | | | | 936 | 79,307 |
| Primoris Services Corporation | | | | 1,323 | 21,499 |
| | | | | | 380,629 |
| Electrical equipment: 1.76% | | | | | |
| Atkore Incorporated † | | | | 1,553 | 120,839 |
| Bloom Energy Corporation Class A † | | | | 1,191 | 23,808 |
| Encore Wire Corporation | | | | 1,013 | 117,042 |
| Enovix Corporation † | | | | 973 | 17,840 |
| | | | | | 279,529 |
| Machinery: 2.77% | | | | | |
| Alamo Group Incorporated | | | | 571 | 69,816 |
| Hillenbrand Incorporated | | | | 2,867 | 105,276 |
| Mueller Industries Incorporated | | | | 2,063 | 122,625 |
| Nikola Corporation † | | | | 2,454 | 8,638 |
| Titan International Incorporated † | | | | 4,345 | 52,748 |
| Watts Water Technologies Incorporated | | | | 633 | 79,587 |
| | | | | | 438,690 |
| Marine: 0.41% | | | | | |
| Matson Incorporated | | | | 1,062 | 65,334 |
| Professional services: 1.72% | | | | | |
| CBIZ Incorporated † | | | | 775 | 33,155 |
| Insperity Incorporated | | | | 536 | 54,720 |
| Kelly Services Incorporated Class A | | | | 4,217 | 57,309 |
| Science Applications International Corporation | | | | 500 | 44,215 |
| TriNet Group Incorporated † | | | | 1,170 | 83,327 |
| | | | | | 272,726 |
The accompanying notes are an integral part of these financial statements.
14 | Allspring Disciplined Small Cap Fund
Portfolio of investments—September 30, 2022 (unaudited)
| | | | | Shares | Value |
| Road & rail: 0.62% | | | | | |
| Arcbest Corporation | | | | 1,350 | $ 98,186 |
| Trading companies & distributors: 3.04% | | | | | |
| Applied Industrial Technologies Incorporated | | | | 1,008 | 103,602 |
| Boise Cascade Company | | | | 1,440 | 85,622 |
| GMS Incorporated † | | | | 423 | 16,924 |
| Rush Enterprises Incorporated Class A | | | | 1,765 | 77,413 |
| Titan Machinery Incorporated † | | | | 2,760 | 77,998 |
| WESCO International Incorporated † | | | | 1,008 | 120,335 |
| | | | | | 481,894 |
| Information technology: 12.78% | | | | | |
| Electronic equipment, instruments & components: 2.08% | | | | | |
| Advanced Energy Industries Incorporated | | | | 576 | 44,588 |
| Fabrinet † | | | | 517 | 49,348 |
| Insight Enterprises Incorporated † | | | | 995 | 81,998 |
| Plexus Corporation † | | | | 512 | 44,831 |
| Sanmina Corporation † | | | | 2,363 | 108,887 |
| | | | | | 329,652 |
| IT services: 2.48% | | | | | |
| Evertec Incorporated | | | | 1,418 | 44,454 |
| ExlService Holdings Incorporated † | | | | 188 | 27,704 |
| Hackett Group Incorporated | | | | 3,938 | 69,781 |
| International Money Express Incorporated † | | | | 5,153 | 117,437 |
| Marqeta Incorporated Class A † | | | | 5,630 | 40,086 |
| Maximus Incorporated | | | | 649 | 37,558 |
| Perficient Incorporated † | | | | 693 | 45,059 |
| TTEC Holdings Incorporated | | | | 274 | 12,141 |
| | | | | | 394,220 |
| Semiconductors & semiconductor equipment: 3.57% | | | | | |
| Axcelis Technologies Incorporated † | | | | 443 | 26,828 |
| Diodes Incorporated † | | | | 1,121 | 72,764 |
| FormFactor Incorporated † | | | | 1,027 | 25,726 |
| Ichor Holdings Limited † | | | | 1,081 | 26,171 |
| Maxlinear Incorporated † | | | | 982 | 32,033 |
| MKS Instruments Incorporated | | | | 261 | 21,569 |
| Onto Innovation Incorporated † | | | | 982 | 62,897 |
| Photronics Incorporated † | | | | 2,629 | 38,436 |
| Rambus Incorporated † | | | | 1,913 | 48,628 |
| Sitime Corporation † | | | | 279 | 21,966 |
| Smart Global Holdings Incorporated † | | | | 4,010 | 63,639 |
| SunPower Corporation † | | | | 662 | 15,252 |
| Synaptics Incorporated † | | | | 486 | 48,119 |
| Ultra Clean Holdings Incorporated † | | | | 2,395 | 61,671 |
| | | | | | 565,699 |
| Software: 4.65% | | | | | |
| A10 Networks Incorporated | | | | 6,107 | 81,038 |
| Adeia Incorporated | | | | 4,285 | 60,590 |
| Amplitude Incorporated Class A † | | | | 2,843 | 43,981 |
| Arlo Technologies Incorporated † | | | | 7,017 | 32,559 |
| Clear Secure Incorporated Class A † | | | | 1,396 | 31,913 |
| eGain Corporation † | | | | 5,351 | 39,330 |
The accompanying notes are an integral part of these financial statements.
Allspring Disciplined Small Cap Fund | 15
Portfolio of investments—September 30, 2022 (unaudited)
| | | | | Shares | Value |
| Software (continued) | | | | | |
| InterDigital Incorporated | | | | 1,130 | $ 45,675 |
| JFrog Limited † | | | | 1,715 | 37,919 |
| Rimini Street Incorporated † | | | | 11,457 | 53,390 |
| SPS Commerce Incorporated † | | | | 1,048 | 130,193 |
| Tenable Holdings Incorporated † | | | | 810 | 28,188 |
| Upland Software Incorporated † | | | | 2,035 | 16,545 |
| Verint Systems Incorporated | | | | 963 | 32,338 |
| Workiva Incorporated † | | | | 343 | 26,685 |
| Zeta Global Holdings Corporation Class A † | | | | 11,709 | 77,396 |
| | | | | | 737,740 |
| Materials: 3.64% | | | | | |
| Chemicals: 1.33% | | | | | |
| Advansix Incorporated | | | | 1,998 | 64,136 |
| Futurefuel Corporation | | | | 2,804 | 16,936 |
| Kooper Holdings Incorporated | | | | 1,242 | 25,809 |
| Minerals Technologies Incorporated | | | | 1,102 | 54,450 |
| Tronox Holdings plc Class A | | | | 4,105 | 50,286 |
| | | | | | 211,617 |
| Containers & packaging: 0.78% | | | | | |
| Greif Incorporated Class A | | | | 1,044 | 62,191 |
| Myers Industries Incorporated | | | | 3,745 | 61,680 |
| | | | | | 123,871 |
| Metals & mining: 1.53% | | | | | |
| Arconic Corporation † | | | | 1,485 | 25,304 |
| Commercial Metals Company | | | | 3,015 | 106,972 |
| Ryerson Holding Corporation | | | | 1,091 | 28,082 |
| Schnitzer Steel Industries Incorporated Class A | | | | 1,872 | 53,277 |
| Suncoke Energy Incorporated | | | | 4,996 | 29,027 |
| | | | | | 242,662 |
| Real estate: 5.28% | | | | | |
| Equity REITs: 4.87% | | | | | |
| Acadia Realty Trust | | | | 3,313 | 41,810 |
| Armada Hoffler Properties Incorporated | | | | 2,331 | 24,196 |
| Braemar Hotels & Resorts Incorporated | | | | 12,934 | 55,616 |
| BRT Apartments Corporation REIT | | | | 2,565 | 52,095 |
| CareTrust REIT Incorporated | | | | 2,322 | 42,051 |
| DiamondRock Hospitality | | | | 2,005 | 15,058 |
| Easterly Government Properties Incorporated | | | | 2,543 | 40,103 |
| Getty Realty Corporation | | | | 1,036 | 27,858 |
| Global Medical REIT Incorporated | | | | 1,990 | 16,955 |
| Global Net Lease Incorporated | | | | 7,179 | 76,456 |
| iStar Financial Incorporated | | | | 3,795 | 35,142 |
| National Health Investors Incorporated | | | | 526 | 29,735 |
| NexPoint Residential Trust Incorporated | | | | 1,359 | 62,799 |
| Piedmont Office Realty Trust Incorporated Class A | | | | 4,222 | 44,584 |
| STAG Industrial Incorporated | | | | 3,520 | 100,074 |
| The Macerich Company | | | | 1,305 | 10,362 |
The accompanying notes are an integral part of these financial statements.
16 | Allspring Disciplined Small Cap Fund
Portfolio of investments—September 30, 2022 (unaudited)
| | | | | Shares | Value |
| Equity REITs (continued) | | | | | |
| Uniti Group Incorporated | | | | 3,497 | $ 24,304 |
| Urban Edge Properties | | | | 5,531 | 73,784 |
| | | | | | 772,982 |
| Real estate management & development: 0.41% | | | | | |
| Newmark Group Incorporated Class A | | | | 7,945 | 64,037 |
| Utilities: 2.99% | | | | | |
| Electric utilities: 1.15% | | | | | |
| Otter Tail Corporation | | | | 1,754 | 107,906 |
| Portland General Electric Company | | | | 1,692 | 73,534 |
| | | | | | 181,440 |
| Gas utilities: 0.65% | | | | | |
| Brookfield Infrastructure Corporation Class A | | | | 1,477 | 60,114 |
| New Jersey Resources Corporation | | | | 1,111 | 42,996 |
| | | | | | 103,110 |
| Independent power & renewable electricity producers: 0.48% | | | | | |
| Brookfield Renewable Corporation Class A | | | | 719 | 23,497 |
| Clearway Energy Incorporated Class A | | | | 1,819 | 52,933 |
| | | | | | 76,430 |
| Multi-utilities: 0.59% | | | | | |
| Black Hills Corporation | | | | 558 | 37,793 |
| Northwestern Corporation | | | | 1,143 | 56,327 |
| | | | | | 94,120 |
| Water utilities: 0.12% | | | | | |
| York Water Company | | | | 482 | 18,523 |
| Total Common stocks (Cost $15,116,511) | | | | | 15,340,585 |
| | | Yield | | | |
| Short-term investments: 3.78% | | | | | |
| Investment companies: 3.78% | | | | | |
| Allspring Government Money Market Fund Select Class ♠∞ | | 2.75% | | 453,061 | 453,061 |
| Securities Lending Cash Investments LLC ♠∩∞ | | 3.08 | | 147,359 | 147,359 |
| Total Short-term investments (Cost $600,420) | | | | | 600,420 |
| Total investments in securities (Cost $15,716,931) | 100.47% | | | | 15,941,005 |
| Other assets and liabilities, net | (0.47) | | | | (75,039) |
| Total net assets | 100.00% | | | | $15,865,966 |
| † | Non-income-earning security |
| ♦ | The security is fair valued in accordance with procedures approved by the Board of Trustees. |
| « | All or a portion of this security is on loan. |
| ♠ | The issuer of the security is an affiliated person of the Fund as defined in the Investment Company Act of 1940. |
| ∩ | The investment is a non-registered investment company purchased with cash collateral received from securities on loan. |
| ∞ | The rate represents the 7-day annualized yield at period end. |
| Abbreviations: |
| REIT | Real estate investment trust |
The accompanying notes are an integral part of these financial statements.
Allspring Disciplined Small Cap Fund | 17
Portfolio of investments—September 30, 2022 (unaudited)
Investments in affiliates
An affiliated investment is an investment in which the Fund owns at least 5% of the outstanding voting shares of the issuer or as a result of other relationships, such as the Fund and the issuer having the same investment manager. Transactions with issuers that were affiliates of the Fund at the end of the period were as follows:
| | Value,
beginning of
period | Purchases | Sales
proceeds | Net
realized
gains
(losses) | | Net
change in
unrealized
gains
(losses) | | Value,
end of
period | Shares,
end
of period | Income
from
affiliated
securities |
| Short-term investments | | | | | | | | | |
| Allspring Government Money Market Fund Select Class | $561,734 | $1,857,694 | $(1,966,367) | $0 | | $0 | | $ 453,061 | 453,061 | $ 2,786 |
| Securities Lending Cash Investments LLC | 360,950 | 1,157,063 | (1,370,654) | 0 | | 0 | | 147,359 | 147,359 | 1,388 # |
| | | | | $0 | | $0 | | $600,420 | | $4,174 |
| # | Amount shown represents income before fees and rebates. |
Futures contracts
| Description | Number of
contracts | Expiration
date | Notional
cost | Notional
value | Unrealized
gains | Unrealized
losses |
| Long | | | | | | |
| Micro E-Mini Russell 2000 Index | 56 | 12-16-2022 | $531,980 | $467,544 | $0 | $(64,436) |
The accompanying notes are an integral part of these financial statements.
18 | Allspring Disciplined Small Cap Fund
Statement of assets and liabilities—September 30, 2022 (unaudited)
| | |
| Assets | |
Investments in unaffiliated securities (including $143,613 of securities loaned), at value (cost $15,116,511)
| $ 15,340,585 |
Investments in affiliated securities, at value (cost $600,420)
| 600,420 |
Cash
| 516 |
Cash at broker segregated for futures contracts
| 49,500 |
Receivable for dividends
| 11,314 |
Receivable from manager
| 10,122 |
Receivable for Fund shares sold
| 8,925 |
Receivable for securities lending income, net
| 555 |
Prepaid expenses and other assets
| 34,662 |
Total assets
| 16,056,599 |
| Liabilities | |
Payable upon receipt of securities loaned
| 147,359 |
Professional fees payable
| 17,145 |
Custody and accounting fees payable
| 13,292 |
Payable for daily variation margin on open futures contracts
| 3,447 |
Trustees’ fees and expenses payable
| 3,331 |
Administration fees payable
| 1,942 |
Payable for Fund shares redeemed
| 92 |
Accrued expenses and other liabilities
| 4,025 |
Total liabilities
| 190,633 |
Total net assets
| $15,865,966 |
| Net assets consist of | |
Paid-in capital
| $ 14,951,114 |
Total distributable earnings
| 914,852 |
Total net assets
| $15,865,966 |
| Computation of net asset value and offering price per share | |
Net assets – Class A
| $ 533,656 |
Shares outstanding – Class A1
| 54,929 |
Net asset value per share – Class A
| $9.72 |
Maximum offering price per share – Class A2
| $10.31 |
Net assets – Class R6
| $ 206,099 |
Shares outstanding – Class R61
| 21,499 |
Net asset value per share – Class R6
| $9.59 |
Net assets – Administrator Class
| $ 14,310,516 |
Shares outstanding – Administrator Class1
| 1,483,509 |
Net asset value per share – Administrator Class
| $9.65 |
Net assets – Institutional Class
| $ 815,695 |
Shares outstanding – Institutional Class1
| 84,622 |
Net asset value per share – Institutional Class
| $9.64 |
| 1 | The Fund has an unlimited number of authorized shares. |
| 2 | Maximum offering price is computed as 100/94.25 of net asset value. On investments of $50,000 or more, the offering price is reduced. |
The accompanying notes are an integral part of these financial statements.
Allspring Disciplined Small Cap Fund | 19
Statement of operations—six months ended September 30, 2022 (unaudited)
| | |
| Investment income | |
Dividends (net of foreign withholdings taxes of $413)
| $ 123,206 |
Income from affiliated securities
| 4,828 |
Total investment income
| 128,034 |
| Expenses | |
Management fee
| 47,011 |
| Administration fees | |
Class A
| 634 |
Class R6
| 33 |
Administrator Class
| 11,037 |
Institutional Class
| 649 |
| Shareholder servicing fees | |
Class A
| 754 |
Administrator Class
| 21,224 |
Custody and accounting fees
| 14,017 |
Professional fees
| 25,548 |
Registration fees
| 30,835 |
Shareholder report expenses
| 10,307 |
Trustees’ fees and expenses
| 11,176 |
Other fees and expenses
| 6,772 |
Total expenses
| 179,997 |
| Less: Fee waivers and/or expense reimbursements | |
Fund-level
| (101,451) |
Class A
| (119) |
Class R6
| (11) |
Administrator Class
| (83) |
Net expenses
| 78,333 |
Net investment income
| 49,701 |
| Realized and unrealized gains (losses) on investments | |
| Net realized gains (losses) on | |
Unaffiliated securities
| 982,808 |
Futures contracts
| (22,669) |
Net realized gains on investments
| 960,139 |
| Net change in unrealized gains (losses) on | |
Unaffiliated securities
| (4,766,334) |
Futures contracts
| (94,541) |
Net change in unrealized gains (losses) on investments
| (4,860,875) |
Net realized and unrealized gains (losses) on investments
| (3,900,736) |
Net decrease in net assets resulting from operations
| $(3,851,035) |
The accompanying notes are an integral part of these financial statements.
20 | Allspring Disciplined Small Cap Fund
Statement of changes in net assets
| | | | | |
| | Six months ended
September 30, 2022
(unaudited) | Year ended
March 31, 2022 |
| Operations | | | | |
Net investment income
| | $ 49,701 | | $ 35,192 |
Net realized gains on investments
| | 960,139 | | 2,783,921 |
Net change in unrealized gains (losses) on investments
| | (4,860,875) | | (2,322,678) |
Net increase (decrease) in net assets resulting from operations
| | (3,851,035) | | 496,435 |
| Distributions to shareholders from | | | | |
| Net investment income and net realized gains | | | | |
Class R6
| | 0 | | (248) |
Administrator Class
| | 0 | | (35,284) |
Institutional Class
| | 0 | | (9,783) |
Total distributions to shareholders
| | 0 | | (45,315) |
| Capital share transactions | Shares | | Shares | |
| Proceeds from shares sold | | | | |
Class A
| 1,801 | 19,523 | 36,903 | 451,068 |
Class R6
| 1,807 | 18,248 | 8,565 | 101,266 |
Administrator Class
| 48,035 | 527,117 | 88,246 | 1,054,709 |
Institutional Class
| 688 | 7,147 | 11,224 | 134,580 |
| | | 572,035 | | 1,741,623 |
| Reinvestment of distributions | | | | |
Class R6
| 0 | 0 | 21 | 248 |
Administrator Class
| 0 | 0 | 2,936 | 35,233 |
Institutional Class
| 0 | 0 | 817 | 9,783 |
| | | 0 | | 45,264 |
| Payment for shares redeemed | | | | |
Class A
| (2,911) | (29,571) | (65,850) | (791,179) |
Class R6
| (570) | (6,187) | (1,858) | (22,060) |
Administrator Class
| (351,150) | (3,687,088) | (402,466) | (4,858,565) |
Institutional Class
| (17,878) | (185,150) | (57,438) | (686,236) |
| | | (3,907,996) | | (6,358,040) |
Net decrease in net assets resulting from capital share transactions
| | (3,335,961) | | (4,571,153) |
Total decrease in net assets
| | (7,186,996) | | (4,120,033) |
| Net assets | | | | |
Beginning of period
| | 23,052,962 | | 27,172,995 |
End of period
| | $15,865,966 | | $23,052,962 |
The accompanying notes are an integral part of these financial statements.
Allspring Disciplined Small Cap Fund | 21
Financial highlights
(For a share outstanding throughout each period)
| | | Year ended March 31 |
| Class A | Six months ended
September 30, 2022
(unaudited) | 2022 | 2021 | 2020 | 2019 1 |
Net asset value, beginning of period
| $11.82 | $11.67 | $6.12 | $8.39 | $23.70 |
Net investment income (loss)
| 0.03 | 0.01 2 | (0.05) 2 | (0.00) 2,3 | 0.02 |
Net realized and unrealized gains (losses) on investments
| (2.13) | 0.14 | 5.60 | (2.22) | (3.37) |
Total from investment operations
| (2.10) | 0.15 | 5.55 | (2.22) | (3.35) |
| Distributions to shareholders from | | | | | |
Net investment income
| 0.00 | 0.00 | 0.00 | (0.05) | (0.04) |
Net realized gains
| 0.00 | 0.00 | 0.00 | 0.00 | (11.92) |
Total distributions to shareholders
| 0.00 | 0.00 | 0.00 | (0.05) | (11.96) |
Net asset value, end of period
| $9.72 | $11.82 | $11.67 | $6.12 | $8.39 |
Total return4
| (17.77)% | 1.29% | 90.69% | (26.67)% | (11.52)% |
| Ratios to average net assets (annualized) | | | | | |
Gross expenses
| 2.02% | 1.74% | 1.81% | 1.40% | 1.14% |
Net expenses
| 0.90% | 0.91% | 0.93% | 0.93% | 0.92% |
Net investment income (loss)
| 0.50% | 0.05% | (0.53)% | (0.05)% | 0.16% |
| Supplemental data | | | | | |
Portfolio turnover rate
| 28% | 39% | 48% | 67% | 176% |
Net assets, end of period (000s omitted)
| $534 | $662 | $991 | $102 | $34 |
| 1 | For the period from July 31, 2018 (commencement of class operations) to March 31, 2019 |
| 2 | Calculated based upon average shares outstanding |
| 3 | Amount is more than $(0.005) |
| 4 | Total return calculations do not include any sales charges. Returns for periods of less than one year are not annualized. |
The accompanying notes are an integral part of these financial statements.
22 | Allspring Disciplined Small Cap Fund
Financial highlights
(For a share outstanding throughout each period)
| | | Year ended March 31 |
| Class R6 | Six months ended
September 30, 2022
(unaudited) | 2022 | 2021 | 2020 | 2019 | 2018 |
Net asset value, beginning of period
| $11.64 | $11.45 | $6.15 | $8.50 | $22.63 | $23.82 |
Net investment income
| 0.05 1 | 0.06 1 | 0.04 1 | 0.08 1 | 0.06 | 0.07 |
Net realized and unrealized gains (losses) on investments
| (2.10) | 0.14 | 5.51 | (2.35) | (2.19) | 2.08 |
Total from investment operations
| (2.05) | 0.20 | 5.55 | (2.27) | (2.13) | 2.15 |
| Distributions to shareholders from | | | | | | |
Net investment income
| 0.00 | (0.01) | (0.25) | (0.08) | (0.08) | (0.06) |
Net realized gains
| 0.00 | 0.00 | 0.00 | 0.00 | (11.92) | (3.28) |
Total distributions to shareholders
| 0.00 | (0.01) | (0.25) | (0.08) | (12.00) | (3.34) |
Net asset value, end of period
| $9.59 | $11.64 | $11.45 | $6.15 | $8.50 | $22.63 |
Total return2
| (17.61)% | 1.76% | 90.71% | (27.03)% | (6.75)% | 8.95% |
| Ratios to average net assets (annualized) | | | | | | |
Gross expenses
| 1.59% | 1.32% | 1.42% | 0.89% | 0.82% | 1.06% |
Net expenses
| 0.50% | 0.50% | 0.50% | 0.50% | 0.64% | 0.85% |
Net investment income
| 0.90% | 0.49% | 0.51% | 0.95% | 0.48% | 0.14% |
| Supplemental data | | | | | | |
Portfolio turnover rate
| 28% | 39% | 48% | 67% | 176% | 48% |
Net assets, end of period (000s omitted)
| $206 | $236 | $155 | $141 | $4,014 | $23,871 |
| 1 | Calculated based upon average shares outstanding |
| 2 | Returns for periods of less than one year are not annualized. |
The accompanying notes are an integral part of these financial statements.
Allspring Disciplined Small Cap Fund | 23
Financial highlights
(For a share outstanding throughout each period)
| | | Year ended March 31 |
| Administrator Class | Six months ended
September 30, 2022
(unaudited) | 2022 | 2021 | 2020 | 2019 | 2018 |
Net asset value, beginning of period
| $11.73 | $11.59 | $6.10 | $8.40 | $22.53 | $23.79 |
Net investment income
| 0.03 1 | 0.02 | 0.02 | 0.02 1 | 0.03 1 | 0.06 |
Net realized and unrealized gains (losses) on investments
| (2.11) | 0.14 | 5.47 | (2.27) | (2.21) | 2.00 |
Total from investment operations
| (2.08) | 0.16 | 5.49 | (2.25) | (2.18) | 2.06 |
| Distributions to shareholders from | | | | | | |
Net investment income
| 0.00 | (0.02) | (0.00) 2 | (0.05) | (0.03) | (0.04) |
Net realized gains
| 0.00 | 0.00 | 0.00 | 0.00 | (11.92) | (3.28) |
Total distributions to shareholders
| 0.00 | (0.02) | (0.00) 2 | (0.05) | (11.95) | (3.32) |
Net asset value, end of period
| $9.65 | $11.73 | $11.59 | $6.10 | $8.40 | $22.53 |
Total return3
| (17.73)% 4 | 1.37% | 90.04% | (26.99)% | (7.01)% | 8.52% |
| Ratios to average net assets (annualized) | | | | | | |
Gross expenses
| 1.93% | 1.67% | 1.75% | 1.25% | 1.13% | 1.30% |
Net expenses
| 0.85% | 0.85% | 0.85% | 0.85% | 0.95% | 1.20% |
Net investment income
| 0.51% | 0.12% | 0.17% | 0.27% | 0.16% | 0.12% |
| Supplemental data | | | | | | |
Portfolio turnover rate
| 28% | 39% | 48% | 67% | 176% | 48% |
Net assets, end of period (000s omitted)
| $14,311 | $20,963 | $24,318 | $17,049 | $49,911 | $91,506 |
| 1 | Calculated based upon average shares outstanding |
| 2 | Amount is less than $0.005. |
| 3 | Returns for periods of less than one year are not annualized. |
| 4 | During the six months ended September 30, 2022, the Fund received payments from a service provider which had a 0.17% impact on the total return. |
The accompanying notes are an integral part of these financial statements.
24 | Allspring Disciplined Small Cap Fund
Financial highlights
(For a share outstanding throughout each period)
| | | Year ended March 31 |
| Institutional Class | Six months ended
September 30, 2022
(unaudited) | 2022 | 2021 | 2020 | 2019 | 2018 |
Net asset value, beginning of period
| $11.71 | $11.60 | $6.10 | $8.48 | $22.61 | $23.82 |
Net investment income
| 0.04 1 | 0.04 1 | 0.04 1 | 0.06 1 | 0.07 1 | 0.09 |
Net realized and unrealized gains (losses) on investments
| (2.11) | 0.16 | 5.47 | (2.28) | (2.22) | 2.03 |
Total from investment operations
| (2.07) | 0.20 | 5.51 | (2.22) | (2.15) | 2.12 |
| Distributions to shareholders from | | | | | | |
Net investment income
| 0.00 | (0.09) | (0.01) | (0.16) | (0.06) | (0.05) |
Net realized gains
| 0.00 | 0.00 | 0.00 | 0.00 | (11.92) | (3.28) |
Total distributions to shareholders
| 0.00 | (0.09) | (0.01) | (0.16) | (11.98) | (3.33) |
Net asset value, end of period
| $9.64 | $11.71 | $11.60 | $6.10 | $8.48 | $22.61 |
Total return2
| (17.68)% | 1.68% | 90.34% | (26.80)% | (6.79)% | 8.81% |
| Ratios to average net assets (annualized) | | | | | | |
Gross expenses
| 1.68% | 1.42% | 1.51% | 0.94% | 0.89% | 1.07% |
Net expenses
| 0.60% | 0.60% | 0.60% | 0.60% | 0.71% | 0.95% |
Net investment income
| 0.77% | 0.36% | 0.47% | 0.69% | 0.41% | 0.37% |
| Supplemental data | | | | | | |
Portfolio turnover rate
| 28% | 39% | 48% | 67% | 176% | 48% |
Net assets, end of period (000s omitted)
| $816 | $1,192 | $1,708 | $1,586 | $25,658 | $67,798 |
| 1 | Calculated based upon average shares outstanding |
| 2 | Returns for periods of less than one year are not annualized. |
The accompanying notes are an integral part of these financial statements.
Allspring Disciplined Small Cap Fund | 25
Notes to financial statements (unaudited)
1. ORGANIZATION
Allspring Funds Trust (the "Trust"), a Delaware statutory trust organized on March 10, 1999, is an open-end management investment company registered under the Investment Company Act of 1940, as amended (the "1940 Act"). As an investment company, the Trust follows the accounting and reporting guidance in Financial Accounting Standards Board ("FASB") Accounting Standards Codification Topic 946, Financial Services – Investment Companies. These financial statements report on the Allspring Disciplined Small Cap Fund (the "Fund") which is a diversified series of the Trust.
2. SIGNIFICANT ACCOUNTING POLICIES
The following significant accounting policies, which are consistently followed in the preparation of the financial statements of the Fund, are in conformity with U.S. generally accepted accounting principles which require management to make estimates and assumptions that affect the reported amounts of assets and liabilities, disclosure of contingent assets and liabilities at the date of the financial statements, and the reported amounts of income and expenses during the reporting period. Actual results could differ from those estimates.
Securities valuation
All investments are valued each business day as of the close of regular trading on the New York Stock Exchange (generally 4 p.m. Eastern Time), although the Fund may deviate from this calculation time under unusual or unexpected circumstances.
Equity securities and futures contracts that are listed on a foreign or domestic exchange or market are valued at the official closing price or, if none, the last sales price.
Investments in registered open-end investment companies are valued at net asset value. Interests in non-registered investment companies that are redeemable at net asset value are fair valued normally at net asset value.
Investments which are not valued using the methods discussed above are valued at their fair value, as determined in good faith by Allspring Funds Management, LLC ("Allspring Funds Management"), which was named the valuation designee by the Board of Trustees. As the valuation designee, Allspring Funds Management is responsible for day-to-day valuation activities for the Allspring Funds. In connection with these responsibilities, Allspring Funds Management has established a Valuation Committee and has delegated to it the authority to take any actions regarding the valuation of portfolio securities that the Valuation Committee deems necessary or appropriate, including determining the fair value of portfolio securities. On a quarterly basis, the Board of Trustees receives reports of valuation actions taken by the Valuation Committee. On at least an annual basis, the Board of Trustees receives an assessment of the adequacy and effectiveness of Allspring Funds Management's process for determining the fair value of the portfolio of investments.
Securities lending
The Fund may lend its securities from time to time in order to earn additional income in the form of fees or interest on securities received as collateral or the investment of any cash received as collateral. When securities are on loan, the Fund receives interest or dividends on those securities. Cash collateral received in connection with its securities lending transactions is invested in Securities Lending Cash Investments, LLC (the "Securities Lending Fund"), an affiliated non-registered investment company. Investments in Securities Lending Fund are valued at the evaluated bid price provided by an independent pricing service. Income earned from investment in the Securities Lending Fund (net of fees and rebates), if any, is included in income from affiliated securities on the Statement of Operations.
In a securities lending transaction, the net asset value of the Fund is affected by an increase or decrease in the value of the securities loaned and by an increase or decrease in the value of the instrument in which collateral is invested. The amount of securities lending activity undertaken by the Fund fluctuates from time to time. The Fund has the right under the lending agreement to recover the securities from the borrower on demand. In the event of default or bankruptcy by the borrower, the Fund may be prevented from recovering the loaned securities or gaining access to the collateral or may experience delays or costs in doing so. In such an event, the terms of the agreement allow the unaffiliated securities lending agent to use the collateral to purchase replacement securities on behalf of the Fund or pay the Fund the market value of the loaned securities. The Fund bears the risk of loss with respect to depreciation of its investment of the cash collateral.
Futures contracts
Futures contracts are agreements between the Fund and a counterparty to buy or sell a specific amount of a commodity, financial instrument or currency at a specified price on a specified date. The Fund may buy and sell futures contracts in order to gain exposure to, or protect against, changes in security values and is subject to equity price risk. The primary risks associated with the use of futures contracts are the imperfect correlation between changes in market values of securities held by the Fund and the prices of futures contracts, and the possibility of an illiquid market. Futures contracts are generally entered into on a
26 | Allspring Disciplined Small Cap Fund
Notes to financial statements (unaudited)
regulated futures exchange and cleared through a clearinghouse associated with the exchange. With futures contracts, there is minimal counterparty risk to the Fund since futures contracts are exchange traded and the exchange’s clearinghouse, as the counterparty to all exchange traded futures, guarantees the futures contracts against default.
Upon entering into a futures contract, the Fund is required to deposit either cash or securities (initial margin) with the broker in an amount equal to a certain percentage of the contract value. Subsequent payments (variation margin) are paid to or from the broker each day equal to the daily changes in the contract value. Such payments are recorded as unrealized gains or losses and, if any, shown as variation margin receivable (payable) in the Statement of Assets and Liabilities. Should the Fund fail to make requested variation margin payments, the broker can gain access to the initial margin to satisfy the Fund’s payment obligations. When the contracts are closed, a realized gain or loss is recorded in the Statement of Operations.
Security transactions and income recognition
Securities transactions are recorded on a trade date basis. Realized gains or losses are recorded on the basis of identified cost.
Dividend income is recognized on the ex-dividend date. Dividend income is recorded net of foreign taxes withheld where recovery of such taxes is not assured.
Distributions to shareholders
Distributions to shareholders from net investment income and any net realized gains are recorded on the ex-dividend date and paid at least annually. Such distributions are determined in accordance with income tax regulations and may differ from U.S. generally accepted accounting principles. Dividend sources are estimated at the time of declaration. The tax character of distributions is determined as of the Fund's fiscal year end. Therefore, a portion of the Fund's distributions made prior to the Fund’s fiscal year end may be categorized as a tax return of capital at year end.
Federal and other taxes
The Fund intends to continue to qualify as a regulated investment company by distributing substantially all of its investment company taxable income and any net realized capital gains (after reduction for capital loss carryforwards) sufficient to relieve it from all, or substantially all, federal income taxes. Accordingly, no provision for federal income taxes was required.
The Fund’s income and federal excise tax returns and all financial records supporting those returns for the prior three fiscal years are subject to examination by the federal and Delaware revenue authorities. Management has analyzed the Fund's tax positions taken on federal, state, and foreign tax returns, as applicable, for all open tax years and does not believe that there are any uncertain tax positions that require recognition of a tax liability.
As of September 30, 2022, the aggregate cost of all investments for federal income tax purposes was $15,760,587 and the unrealized gains (losses) consisted of:
| Gross unrealized gains | $ 2,419,488 |
| Gross unrealized losses | (2,303,506) |
| Net unrealized gains | $ 115,982 |
Class allocations
The separate classes of shares offered by the Fund differ principally in applicable sales charges, shareholder servicing and administration fees. Class specific expenses are charged directly to that share class. Investment income, common fund-level expenses, and realized and unrealized gains (losses) on investments are allocated daily to each class of shares based on the relative proportion of net assets of each class.
Allspring Disciplined Small Cap Fund | 27
Notes to financial statements (unaudited)
3. FAIR VALUATION MEASUREMENTS
Fair value measurements of investments are determined within a framework that has established a fair value hierarchy based upon the various data inputs utilized in determining the value of the Fund’s investments. The three-level hierarchy gives the highest priority to unadjusted quoted prices in active markets for identical assets or liabilities (Level 1) and the lowest priority to unobservable inputs (Level 3). The Fund’s investments are classified within the fair value hierarchy based on the lowest level of input that is significant to the fair value measurement. The inputs are summarized into three broad levels as follows:
| ■ | Level 1 – quoted prices in active markets for identical securities |
| ■ | Level 2 – other significant observable inputs (including quoted prices for similar securities, interest rates, prepayment speeds, credit risk, etc.) |
| ■ | Level 3 – significant unobservable inputs (including the Fund’s own assumptions in determining the fair value of investments) |
The inputs or methodologies used for valuing investments in securities are not necessarily an indication of the risk associated with investing in those securities.
The following is a summary of the inputs used in valuing the Fund’s assets and liabilities as of September 30, 2022:
| | Quoted prices
(Level 1) | Other significant
observable inputs
(Level 2) | Significant
unobservable inputs
(Level 3) | Total |
| Assets | | | | |
| Investments in: | | | | |
| Common stocks | | | | |
| Communication services | $ 415,970 | $0 | $0 | $ 415,970 |
| Consumer discretionary | 1,555,692 | 0 | 0 | 1,555,692 |
| Consumer staples | 579,123 | 0 | 0 | 579,123 |
| Energy | 974,757 | 0 | 0 | 974,757 |
| Financials | 2,580,286 | 0 | 0 | 2,580,286 |
| Health care | 3,054,745 | 0 | 0 | 3,054,745 |
| Industrials | 2,263,909 | 0 | 0 | 2,263,909 |
| Information technology | 2,027,311 | 0 | 0 | 2,027,311 |
| Materials | 578,150 | 0 | 0 | 578,150 |
| Real estate | 837,019 | 0 | 0 | 837,019 |
| Utilities | 473,623 | 0 | 0 | 473,623 |
| Short-term investments | | | | |
| Investment companies | 600,420 | 0 | 0 | 600,420 |
| Total assets | $15,941,005 | $0 | $0 | $15,941,005 |
| Liabilities | | | | |
| Futures contracts | $ 64,436 | $0 | $0 | $ 64,436 |
| Total liabilities | $ 64,436 | $0 | $0 | $ 64,436 |
Futures contracts are reported at their cumulative unrealized gains (losses) at measurement date as reported in the table following the Portfolio of Investments. For futures contracts, the current day’s variation margin is reported on the Statement of Assets and Liabilities. All other assets and liabilities are reported at their market value at measurement date.
Additional sector, industry or geographic detail, if any, is included in the Portfolio of Investments.
For the six months ended September 30, 2022, the Fund did not have any transfers into/out of Level 3.
4. TRANSACTIONS WITH AFFILIATES
Management fee
Allspring Funds Management, a wholly owned subsidiary of Allspring Global Investments Holdings, LLC, a holding company indirectly owned by certain private funds of GTCR LLC and Reverence Capital Partners, L.P., is the manager of the Fund and provides advisory and fund-level administrative services under an investment management agreement. Under the investment management agreement, Allspring Funds Management is responsible for, among other services, implementing the investment
28 | Allspring Disciplined Small Cap Fund
Notes to financial statements (unaudited)
objectives and strategies of the Fund, supervising the subadviser and providing fund-level administrative services in connection with the Fund’s operations. As compensation for its services under the investment management agreement, Allspring Funds Management is entitled to receive a management fee at the following annual rate based on the Fund’s average daily net assets:
| Average daily net assets | Management fee |
| First $1 billion | 0.500% |
| Next $4 billion | 0.475 |
| Next $5 billion | 0.440 |
| Over $10 billion | 0.430 |
For the six months ended September 30, 2022, the management fee was equivalent to an annual rate of 0.50% of the Fund’s average daily net assets.
Allspring Funds Management has retained the services of a subadviser to provide daily portfolio management to the Fund. The fee for subadvisory services is borne by Allspring Funds Management. Allspring Global Investments, LLC ("Allspring Investments"), an affiliate of Allspring Funds Management and a wholly owned subsidiary of Allspring Global Investments Holdings, LLC, is the subadviser to the Fund and is entitled to receive a fee from Allspring Funds Management at an annual rate starting at 0.35% and declining to 0.25% as the average daily net assets of the Fund increase.
Administration fees
Under a class-level administration agreement, Allspring Funds Management provides class-level administrative services to the Fund, which includes paying fees and expenses for services provided by the transfer agent, sub-transfer agents, omnibus account servicers and record-keepers. As compensation for its services under the class-level administration agreement, Allspring Funds Management receives an annual fee which is calculated based on the average daily net assets of each class as follows:
| | Class-level
administration fee |
| Class A | 0.21% |
| Class R6 | 0.03 |
| Administrator Class | 0.13 |
| Institutional Class | 0.13 |
Waivers and/or expense reimbursements
Allspring Funds Management has contractually committed to waive and/or reimburse management and administration fees to the extent necessary to maintain certain net operating expense ratios for the Fund. When each class of the Fund has exceeded its expense cap, Allspring Funds Management will waive fees and/or reimburse expenses from fund-level expenses on a proportionate basis and then from class specific expenses. When only certain classes exceed their expense caps, waivers and/or reimbursements are applied against class specific expenses before fund-level expenses. Allspring Funds Management has contractually committed through July 31, 2023 to waive fees and/or reimburse expenses to the extent necessary to cap expenses. Prior to or after the commitment expiration date, the caps may be increased or the commitment to maintain the caps may be terminated only with the approval of the Board of Trustees. As of September 30, 2022, the contractual expense caps are as follows:
| | Expense ratio caps |
| Class A | 0.93% |
| Class R6 | 0.50 |
| Administrator Class | 0.85 |
| Institutional Class | 0.60 |
Allspring Disciplined Small Cap Fund | 29
Notes to financial statements (unaudited)
Sales charges
Allspring Funds Distributor, LLC ("Allspring Funds Distributor"), an affiliate of Allspring Funds Management, the principal underwriter, is entitled to receive the front-end sales charge from the purchase of Class A shares and a contingent deferred sales charge on the redemption of certain Class A shares. Allspring Funds Distributor did not receive any front-end or contingent deferred sales charges from Class A shares for the six months ended September 30, 2022.
Shareholder servicing fees
The Trust has entered into contracts with one or more shareholder servicing agents, whereby Class A and Administrator Class are charged a fee at an annual rate of 0.25% of the average daily net assets of each respective class. A portion of these total shareholder servicing fees were paid to affiliates.
Interfund transactions
The Fund may purchase or sell portfolio investment securities to certain affiliates pursuant to Rule 17a-7 under the 1940 Act and under procedures adopted by the Board of Trustees. The procedures have been designed to ensure that these interfund transactions, which do not incur broker commissions, are effected at current market prices.
5. INVESTMENT PORTFOLIO TRANSACTIONS
Purchases and sales of investments, excluding U.S. government obligations (if any) and short-term securities, for the six months ended September 30, 2022 were $5,073,809 and $8,316,660, respectively.
6. SECURITIES LENDING TRANSACTIONS
The Fund lends its securities through an unaffiliated securities lending agent and receives collateral in the form of cash or securities with a value at least equal to the value of the securities on loan. The value of the loaned securities is determined at the close of each business day and any increases or decreases in the required collateral are exchanged between the Fund and the counterparty on the next business day. Cash collateral received is invested in the Securities Lending Fund which seeks to provide a positive return compared to the daily Federal Funds Open Rate by investing in high-quality, U.S. dollar-denominated short-term money market instruments and is exempt from registration under Section 3(c)(7) of the 1940 Act. Securities Lending Fund is managed by Allspring Funds Management and is subadvised by Allspring Investments. Allspring Funds Management receives an advisory fee starting at 0.05% and declining to 0.01% as the average daily net assets of the Securities Lending Fund increase. All of the fees received by Allspring Funds Management are paid to Allspring Investments for its services as subadviser.
In the event of counterparty default or the failure of a borrower to return a loaned security, the Fund has the right to use the collateral to offset any losses incurred. As of September 30, 2022, the Fund had securities lending transactions with the following counterparties which are subject to offset:
| Counterparty | Value of
securities on
loan | Collateral
received1 | Net amount |
| National Financial Services LLC | $ 18,231 | $ (18,231) | $0 |
| Morgan Stanley & Co. LLC | 125,382 | (125,382) | 0 |
1 Collateral received within this table is limited to the collateral for the net transaction with the counterparty.
7. DERIVATIVE TRANSACTIONS
During the six months ended September 30, 2022, the Fund entered into futures contracts for economic hedging purposes. The Fund had an average notional amount of $457,452 in long futures contracts during the six months ended September 30, 2022.
The fair value, realized gains or losses and change in unrealized gains or losses, if any, on derivative instruments are reflected in the corresponding financial statement captions.
8. BANK BORROWINGS
The Trust (excluding the money market funds), Allspring Master Trust and Allspring Variable Trust are parties to a $350,000,000 revolving credit agreement whereby the Fund is permitted to use bank borrowings for temporary or emergency purposes, such as to fund shareholder redemption requests. Interest under the credit agreement is charged to the Fund based
30 | Allspring Disciplined Small Cap Fund
Notes to financial statements (unaudited)
on a borrowing rate equal to the higher of the Federal Funds rate or the overnight bank funding rate in effect on that day plus a spread. In addition, an annual commitment fee equal based on the unused balance is allocated to each participating fund.
For the six months ended September 30, 2022, there were no borrowings by the Fund under the agreement.
9. INDEMNIFICATION
Under the Fund's organizational documents, the officers and Trustees have been granted certain indemnification rights against certain liabilities that may arise out of performance of their duties to the Fund. The Fund has entered into a separate agreement with each Trustee that converts indemnification rights currently existing under the Fund’s organizational documents into contractual rights that cannot be changed in the future without the consent of the Trustee. Additionally, in the normal course of business, the Fund may enter into contracts with service providers that contain a variety of indemnification clauses. The Fund’s maximum exposure under these arrangements is dependent on future claims that may be made against the Fund and, therefore, cannot be estimated.
10. CORONAVIRUS (COVID-19) PANDEMIC
On March 11, 2020, the World Health Organization announced that it had made the assessment that coronavirus disease 2019 (“COVID-19”) is a pandemic. The impacts of COVID-19 are affecting the entire global economy, individual companies and investment products, the funds, and the market in general. There is significant uncertainty around the extent and duration of business disruptions related to COVID-19 and the impacts may last for an extended period of time. COVID-19 has led to significant uncertainty and volatility in the financial markets.
Allspring Disciplined Small Cap Fund | 31
Other information (unaudited)
PROXY VOTING INFORMATION
A description of the policies and procedures used to determine how to vote proxies relating to portfolio securities is available without charge, upon request, by calling 1-800-222-8222, visiting our website at allspringglobal.com, or visiting the SEC website at sec.gov. Information regarding how the proxies related to portfolio securities were voted during the most recent 12-month period ended June 30 is available on the website at allspringglobal.com or by visiting the SEC website at sec.gov.
QUARTERLY PORTFOLIO HOLDINGS INFORMATION
The Fund files its complete schedule of portfolio holdings with the SEC for the first and third quarters of each fiscal year as an exhibit to its reports on Form N-PORT. Shareholders may view the filed Form N-PORT by visiting the SEC website at sec.gov.
32 | Allspring Disciplined Small Cap Fund
Other information (unaudited)
BOARD OF TRUSTEES AND OFFICERS
Each of the Trustees and Officers listed in the table below acts in identical capacities for each fund in the Allspring family of funds, which consists of 124 mutual funds comprising the Allspring Funds Trust, Allspring Variable Trust, Allspring Master Trust and four closed-end funds (collectively the “Fund Complex”). This table should be read in conjunction with the Prospectus and the Statement of Additional Information1. The mailing address of each Trustee and Officer is 525 Market Street, 12th Floor, San Francisco, CA 94105. Each Trustee and Officer serves an indefinite term, however, each Trustee serves such term until reaching the mandatory retirement age established by the Trustees.
Independent Trustees
Name and
year of birth | Position held and
length of service* | Principal occupations during past five years or longer | Current other
public company or
investment
company
directorships |
William R. Ebsworth
(Born 1957) | Trustee,
since 2015 | Retired. From 1984 to 2013, equities analyst, portfolio manager, research director and chief investment officer at Fidelity Management and Research Company in Boston, Tokyo, and Hong Kong, and retired in 2013 as Chief Investment Officer of Fidelity Strategic Advisers, Inc. where he led a team of investment professionals managing client assets. Prior thereto, Board member of Hong Kong Securities Clearing Co., Hong Kong Options Clearing Corp., the Thailand International Fund, Ltd., Fidelity Investments Life Insurance Company, and Empire Fidelity Investments Life Insurance Company. Audit Committee Chair and Investment Committee Chair of the Vincent Memorial Hospital Endowment (non-profit organization). Mr. Ebsworth is a CFA® charterholder. | N/A |
Jane A. Freeman
(Born 1953) | Trustee,
since 2015;
Chair Liaison,
since 2018 | Retired. From 2012 to 2014 and 1999 to 2008, Chief Financial Officer of Scientific Learning Corporation. From 2008 to 2012, Ms. Freeman provided consulting services related to strategic business projects. Prior to 1999, Portfolio Manager at Rockefeller & Co. and Scudder, Stevens & Clark. Board member of the Harding Loevner Funds from 1996 to 2014, serving as both Lead Independent Director and chair of the Audit Committee. Board member of the Russell Exchange Traded Funds Trust from 2011 to 2012 and the chair of the Audit Committee. Ms. Freeman is also an inactive Chartered Financial Analyst. | N/A |
Isaiah Harris, Jr.
(Born 1952) | Trustee,
since 2009; Audit
Committee
Chair,
since 2019 | Retired. Chairman of the Board of CIGNA Corporation from 2009 to 2021, and Director from 2005 to 2008. From 2003 to 2011, Director of Deluxe Corporation. Prior thereto, President and CEO of BellSouth Advertising and Publishing Corp. from 2005 to 2007, President and CEO of BellSouth Enterprises from 2004 to 2005 and President of BellSouth Consumer Services from 2000 to 2003. Emeritus member of the Iowa State University Foundation Board of Governors. Emeritus Member of the Advisory Board of Iowa State University School of Business. Advisory Board Member, Palm Harbor Academy (private school). Advisory Board Member, Fellowship of Christian Athletes. Mr. Harris is a certified public accountant (inactive status). | N/A |
David F. Larcker
(Born 1950) | Trustee,
since 2009 | James Irvin Miller Professor of Accounting at the Graduate School of Business (Emeritus), Stanford University, Director of the Corporate Governance Research Initiative and Senior Faculty of The Rock Center for Corporate Governance since 2006. From 2005 to 2008, Professor of Accounting at the Graduate School of Business, Stanford University. Prior thereto, Ernst & Young Professor of Accounting at The Wharton School, University of Pennsylvania from 1985 to 2005. | N/A |
Allspring Disciplined Small Cap Fund | 33
Other information (unaudited)
Name and
year of birth | Position held and
length of service* | Principal occupations during past five years or longer | Current other
public company or
investment
company
directorships |
Olivia S. Mitchell
(Born 1953) | Trustee,
since 2006;
Nominating and
Governance
Committee Chair,
since 2018 | International Foundation of Employee Benefit Plans Professor since 1993, Wharton School of the University of Pennsylvania. Director of Wharton’s Pension Research Council and Boettner Center on Pensions & Retirement Research, and Research Associate at the National Bureau of Economic Research. Previously taught at Cornell University from 1978 to 1993. | N/A |
Timothy J. Penny
(Born 1951) | Trustee,
since 1996;
Chair,
since 2018 | President and Chief Executive Officer of Southern Minnesota Initiative Foundation, a non-profit organization, since 2007. Vice Chair of the Economic Club of Minnesota, since 2007. Co-Chair of the Committee for a Responsible Federal Budget, since 1995. Member of the Board of Trustees of NorthStar Education Finance, Inc., a non-profit organization, since 2007. Senior Fellow of the University of Minnesota Humphrey Institute from 1995 to 2017. | N/A |
James G. Polisson
(Born 1959) | Trustee,
since 2018 | Retired. Chief Marketing Officer, Source (ETF) UK Services, Ltd, from 2015 to 2017. From 2012 to 2015, Principal of The Polisson Group, LLC, a management consulting, corporate advisory and principal investing company. Chief Executive Officer and Managing Director at Russell Investments, Global Exchange Traded Funds from 2010 to 2012. Managing Director of Barclays Global Investors from 1998 to 2010 and Global Chief Marketing Officer for iShares and Barclays Global Investors from 2000 to 2010. Trustee of the San Francisco Mechanics’ Institute, a non-profit organization, from 2013 to 2015. Board member of the Russell Exchange Traded Fund Trust from 2011 to 2012. Director of Barclays Global Investors Holdings Deutschland GmbH from 2006 to 2009. Mr. Polisson is an attorney and has a retired status with the Massachusetts and District of Columbia Bar Associations. | N/A |
Pamela Wheelock
(Born 1959) | Trustee,
since January
2020; previously
Trustee from
January 2018 to
July 2019 | Retired. Executive and Senior Financial leadership positions in the public, private and nonprofit sectors. Interim President and CEO, McKnight Foundation, 2020. Interim Commissioner, Minnesota Department of Human Services, 2019. Chief Operating Officer, Twin Cities Habitat for Humanity, 2017-2019. Vice President for University Services, University of Minnesota, 2012-2016. Interim President and CEO, Blue Cross and Blue Shield of Minnesota, 2011-2012. Executive Vice-President and Chief Financial Officer, Minnesota Wild, 2002-2008. Commissioner, Minnesota Department of Finance, 1999-2002. Chair of the Board of Directors of Destination Medical Center Corporation. Board member of the Minnesota Wild Foundation. | N/A |
* Length of service dates reflect the Trustee’s commencement of service with the Trust’s predecessor entities, where applicable.
34 | Allspring Disciplined Small Cap Fund
Other information (unaudited)
Officers2
Name and
year of birth | Position held and
length of service | Principal occupations during past five years or longer |
Andrew Owen
(Born 1960) | President,
since 2017 | President and Chief Executive Officer of Allspring Funds Management, LLC since 2017 and Head of Global Fund Governance of Allspring Global Investments since 2022. Prior thereto, co-president of Galliard Capital Management, LLC, an affiliate of Allspring Funds Management, LLC, from 2019 to 2022 and Head of Affiliated Managers, Allspring Global Investments, from 2014 to 2019 and Executive Vice President responsible for marketing, investments and product development for Allspring Funds Management, LLC, from 2009 to 2014. |
Jeremy DePalma
(Born 1974) | Treasurer,
since 2012
(for certain funds in
the Fund Complex);
since 2021 (for
the remaining funds in the
Fund Complex) | Senior Vice President of Allspring Funds Management, LLC since 2009. Senior Vice President of Evergreen Investment Management Company, LLC from 2008 to 2010 and head of the Fund Reporting and Control Team within Fund Administration from 2005 to 2010. |
Christopher Baker
(Born 1976) | Chief Compliance Officer, since 2022 | Global Chief Compliance Officer for Allspring Global Investments since 2022. Prior thereto, Chief Compliance Officer for State Street Global Advisors from 2018 to 2021. Senior Compliance Officer for the State Street divisions of Alternative Investment Solutions, Sector Solutions, and Global Marketing from 2015 to 2018. From 2010 to 2015 Vice President, Global Head of Investment and Marketing Compliance for State Street Global Advisors. |
Matthew Prasse
(Born 1983) | Chief Legal Officer, since 2022; Secretary, since 2021 | Senior Counsel of the Allspring Legal Department since 2021. Senior Counsel of the Wells Fargo Legal Department from 2018 to 2021. Previously, Counsel for Barings LLC from 2015 to 2018. Prior to joining Barings, Associate at Morgan, Lewis & Bockius LLP from 2008 to 2015. |
1 The Statement of Additional Information includes additional information about the Trustees and is available, without charge, upon request, by calling 1-800-222-8222 or by visiting the website at allspringglobal.com.
2 For those Officers with tenures at Allspring Global Investments and/or Allspring Funds Management, LLC that began prior to 2021, such tenures include years of service during which these businesses/entities were known as Wells Fargo Asset Management and Wells Fargo Funds Management, LLC, respectively.
Allspring Disciplined Small Cap Fund | 35
Other information (unaudited)
LIQUIDITY RISK MANAGEMENT PROGRAM
In accordance with Rule 22e-4 under the Investment Company Act of 1940, as amended (the “Liquidity Rule”), Allspring Funds Trust (the “Trust”) has adopted and implemented a liquidity risk management program (the “Program”) on behalf of each of its series (other than the series that operate as money market funds), including the Fund, which is reasonably designed to assess and manage the Fund's liquidity risk. “Liquidity risk” is defined under the Liquidity Rule as the risk that the Fund is unable to meet redemption requests without significantly diluting remaining investors’ interests in the Fund. The Trust’s Board of Trustees (the “Board”) previously approved the designation of Allspring Funds Management, LLC (“Allspring Funds Management”), the Fund's investment manager, to administer the Program, and Allspring Funds Management has established a Liquidity Risk Management Council (the "Council") composed of personnel from multiple departments within Allspring Funds Management and its affiliates to assist Allspring Funds Management in the administration of the Program.
The Program is comprised of various components designed to support the assessment and/or management of liquidity risk, including: (1) the periodic assessment (no less frequently than annually) of certain factors that influence the Fund's liquidity risk; (2) the periodic classification (no less frequently than monthly) of the Fund's investments into one of four liquidity categories that reflect an estimate of their liquidity under current market conditions; (3) a 15% limit on the acquisition of “illiquid investments” (as defined under the Liquidity Rule); (4) to the extent the Fund does not invest primarily in “highly liquid investments” (as defined under the Liquidity Rule), the determination of a minimum percentage of the Fund's assets that generally will be invested in highly liquid investments (an “HLIM”); (5) if the Fund has established an HLIM, the periodic review (no less frequently than annually) of the HLIM and the adoption of policies and procedures for responding to a shortfall of the Fund's “highly liquid investments” below its HLIM; and (6) periodic reporting to the Board.
At a meeting of the Board held on May 24-25, 2022, the Board received and reviewed a written report (the “Report”) from Allspring Funds Management that, among other things, addressed the operation of the Program and assessed its adequacy and effectiveness for the period from January 1, 2021 through December 31, 2021 (the “Reporting Period”). Other than extended foreign market holidays, no significant liquidity events impacting the Funds were noted in the Report. In addition, other than corporate-related changes to the Program, there were no material changes to the Program during the Reporting Period.
Allspring Funds Management determined in the Report that the Program has been implemented and operates effectively to manage the Fund’s liquidity risk, and Allspring Funds Management continues to believe that the Program has been and continues to be adequately and effectively implemented to monitor and, as applicable, respond to the Fund’s liquidity developments.
There can be no assurance that the Program will achieve its objectives under all circumstances in the future. Please refer to the Fund’s prospectus for more information regarding the Fund’s exposure to liquidity risk and other risks to which an investment in the Fund may be subject.
36 | Allspring Disciplined Small Cap Fund
For more information
More information about Allspring Funds is available free upon request. To obtain literature, please write, visit the Fund's website, or call:
Allspring Funds
P.O. Box 219967
Kansas City, MO 64121-9967
Website: allspringglobal.com
Individual investors: 1-800-222-8222
Retail investment professionals: 1-888-877-9275
Institutional investment professionals: 1-800-260-5969
This report and the financial statements contained herein are submitted for the general information of the shareholders of the Fund. If this report is used for promotional purposes, distribution of the report must be accompanied or preceded by a current prospectus. Before investing, please consider the investment objectives, risks, charges, and expenses of the investment. For a current prospectus and, if available, a summary prospectus, containing this information, call
1-800-222-8222 or visit the Fund's website at allspringglobal.com. Read the prospectus carefully before you invest or send money.
Allspring Global InvestmentsTM is the trade name for the asset management firms of Allspring Global Investments Holdings, LLC, a holding company indirectly owned by certain private funds of GTCR LLC and Reverence Capital Partners, L.P. These firms include but are not limited to Allspring Global Investments, LLC, and Allspring Funds Management, LLC. Certain products managed by Allspring entities are distributed by Allspring Funds Distributor, LLC (a broker-dealer and Member FINRA/SIPC).
This material is for general informational and educational purposes only and is NOT intended to provide investment advice or a recommendation of any kind - including a recommendation for any specific investment, strategy, or plan.
© 2022 Allspring Global Investments Holdings, LLC. All rights reserved.
PAR-1022-00366 11-22
SA243/SAR243 09-22
Semi-Annual Report
September 30, 2022
Allspring
Discovery Small Cap Growth Fund
(formerly, Allspring Fundamental Small Cap Growth Fund)
The views expressed and any forward-looking statements are as of September 30, 2022, unless otherwise noted, and are those of the Fund's portfolio managers and/or Allspring Global Investments. Discussions of individual securities or the markets generally are not intended as individual recommendations. Future events or results may vary significantly from those expressed in any forward-looking statements. The views expressed are subject to change at any time in response to changing circumstances in the market. Allspring Global Investments disclaims any obligation to publicly update or revise any views expressed or forward-looking statements.
Allspring Discovery Small Cap Growth Fund | 1
Letter to shareholders (unaudited)
Andrew Owen
President
Allspring Funds
Dear Shareholder:
We are pleased to offer you this semi-annual report for Allspring Discovery Small Cap Growth Fund for the six-month period that ended September 30, 2022. Effective May 2, 2022, the Fund changed its name from Allspring Fundamental Small Cap Growth Fund to Allspring Discovery Small Cap Growth Fund. Globally, stocks and bonds experienced heightened volatility through the extremely difficult period. Non-U.S. securities fared the worst as the global economy faced multiple challenges and the strength of the U.S. dollar eroded already-poor returns of non-U.S.-dollar-denominated assets. Bonds had historically poor performance, with major fixed income indexes falling substantially for the six-month period.
Earlier tailwinds provided by global stimulus programs, vaccination rollouts, and recovering consumer and corporate sentiment were wiped away by the highest rate of inflation in four decades, the impact of ongoing aggressive central bank rate hikes and the prospect of more, plus the global reverberations of the Russia-Ukraine war. The already-significant global supply chain disruptions were compounded by China’s COVID-19 lockdowns.
For the six-month period, both stocks and bonds registered major losses, with even U.S. bonds suffering deep losses and other assets faring worse. For the period, U.S. stocks, based on the S&P 500 Index,1 lost 20.20%. International stocks, as measured by the MSCI ACWI ex USA Index (Net),2 returned -22.27%, while the MSCI EM Index (Net) (USD)3 declined 21.70%. Among bond indexes, the Bloomberg U.S. Aggregate Bond Index,4 returned -9.22%, the Bloomberg Global Aggregate ex-USD Index (unhedged),5 returned -18.89%, the Bloomberg Municipal Bond Index6 declined 6.30%, and the ICE BofA U.S. High Yield Index7 fell 10.56%.
| 1 | The S&P 500 Index consists of 500 stocks chosen for market size, liquidity, and industry group representation. It is a market-value-weighted index with each stock's weight in the index proportionate to its market value. You cannot invest directly in an index. |
| 2 | The Morgan Stanley Capital International (MSCI) All Country World Index (ACWI) ex USA Index (Net) is a free-float-adjusted market-capitalization-weighted index that is designed to measure the equity market performance of developed and emerging markets, excluding the U.S. Source: MSCI. MSCI makes no express or implied warranties or representations and shall have no liability whatsoever with respect to any MSCI data contained herein. The MSCI data may not be further redistributed or used as a basis for other indexes or any securities or financial products. This report is not approved, reviewed, or produced by MSCI. You cannot invest directly in an index. |
| 3 | The MSCI Emerging Markets (EM) Index (Net) (USD) is a free-float-adjusted market-capitalization-weighted index that is designed to measure equity market performance of emerging markets. You cannot invest directly in an index. |
| 4 | The Bloomberg U.S. Aggregate Bond Index is a broad-based benchmark that measures the investment-grade, U.S.-dollar-denominated, fixed-rate taxable bond market, including Treasuries, government-related and corporate securities, mortgage-backed securities (agency fixed-rate and hybrid adjustable-rate mortgage pass-throughs), asset-backed securities, and commercial mortgage-backed securities. You cannot invest directly in an index. |
| 5 | The Bloomberg Global Aggregate ex-USD Index (unhedged) is an unmanaged index that provides a broad-based measure of the global investment-grade fixed-income markets excluding the U.S.-dollar-denominated debt market. You cannot invest directly in an index. |
| 6 | The Bloomberg Municipal Bond Index is an unmanaged index composed of long-term tax-exempt bonds with a minimum credit rating of Baa. You cannot invest directly in an index. |
| 7 | The ICE BofA U.S. High Yield Index is a market-capitalization-weighted index of domestic and Yankee high-yield bonds. The index tracks the performance of high-yield securities traded in the U.S. bond market. You cannot invest directly in an index. Copyright 2022. ICE Data Indices, LLC. All rights reserved. |
2 | Allspring Discovery Small Cap Growth Fund
Letter to shareholders (unaudited)
Rising inflation, COVID, and the Russian invasion of Ukraine drove market performance.
Just before the six-month reporting period began, global financial markets had been rocked by the Russian invasion of Ukraine and resulting spike in volatility. In April, the market misery continued, with broad and deep losses, as both the S&P 500 Index and MSCI ACWI (Net)1 fell 8% or more for the month. The Chinese economy struggled through a strict lockdown as the government tried to contain a major COVID-19 outbreak. The ensuing global ripple effect compounded existing supply shortages. This was exacerbated by the impact of the Russia-Ukraine war on global commodities. Meanwhile, U.S. annual inflation raged at 8.5%, its highest level since 1981, and investors braced themselves for aggressive Federal Reserve (Fed) monetary tightening moves.
Market volatility continued in May, although markets recovered ground late in the month. Value stocks outperformed growth stocks. The concerns that had dominated markets for months continued, including high inflation and geopolitical tensions that added to high crude oil, gasoline, and food prices. In response, the Fed raised the federal funds rate by 0.50%, with widescale expectations of multiple rate hikes to come. Meanwhile, highly contagious COVID-19 variants persisted. However, labor markets in the U.S., the U.K., and Europe remained strong. U.S. retail sales for April, released in May, indicated a fourth consecutive monthly increase, reflecting continued consumer resilience.
A dreadful year in financial markets continued in June with stocks posting further losses en route to their worst first half of a year in 50 years. Bonds didn’t fare much better. Driving the losses were the same factors that have been at play: rising global inflation and fears of recession as central banks increase rates to try to curb inflation, which climbed above 9% in June in the U.S. The Fed raised its short-term rate by another 0.75% in June. Meanwhile, U.S. economic data showed resilience as the U.S. unemployment rate held steady at 3.6% and the housing market was only marginally affected, so far, by sharply higher mortgage rates.
Markets rebounded in July, led by U.S. stocks. While evidence began to point to an economic slowdown after two consecutive quarters of declining gross domestic product (economic contraction), the U.S. labor market remained surprisingly strong: July nonfarm payrolls grew by more than 500,000 and U.S. unemployment dipped to 3.5%. Meanwhile, crude oil and retail gasoline prices, major contributors to recent overall inflation, fell substantially from earlier highs. And while U.S. home prices rose, sales fell as houses became less affordable with mortgage rates at a 13-year high. The Fed raised the federal funds rate another 0.75% in July—to a range of 2.25% to 2.50%—and forecasts pointed to continued rate increases.
August was yet another broadly challenging month for financial markets, with more red ink flowing. High inflation persisted, cresting 9% in the eurozone and remaining above 8% in the U.S. despite the Fed’s aggressive monetary policy and a major drop in global crude oil and gasoline prices from their June peak. One positive note in the U.S. was the resilience of the country’s jobs market. However, the Fed’s job was clearly not complete. One longer-term bright spot was the U.S. Congress’s passage of the Inflation Reduction Act. Its primary stated goals include include to reduce inflation (though not immediately) by curbing the deficit, capping health care spending by seniors, and investing in domestic sources of clean energy.
“ Just before the six-month reporting period began, global financial markets had been rocked by the Russian invasion of Ukraine and resulting spike in volatility. In April, the market misery continued, with broad and deep losses, as both the S&P 500 Index and MSCI ACWI (Net) fell 8% or more for the month.”
| 1 | The MSCI ACWI (Net) is a free-float-adjusted market-capitalization-weighted index that is designed to measure the equity market performance of developed and emerging markets. You cannot invest directly in an index. |
Allspring Discovery Small Cap Growth Fund | 3
Letter to shareholders (unaudited)
The market misery continued in September. There was nowhere to hide as all asset classes suffered major losses at the hands of persistent inflation. Central banks kept up their battle against rapidly rising prices with more rate hikes. The strength of the U.S. dollar made things even more difficult for investors holding assets in other currencies. U.S. mortgage rates jumped to near 7% on 30-year fixed-rate mortgages; the decreased housing affordability began to cool demand somewhat. The U.K. experienced a sharp sell-off of government bonds and the British pound in September as investors panicked in response to a new government budget that was seen as financially unsound. The market meltdown forced the Bank of England to step in and buy long-dated government bonds. The drama continued into the next fiscal year.
Don’t let short-term uncertainty derail long-term investment goals.
Periods of investment uncertainty can present challenges, but experience has taught us that maintaining long-term investment goals can be an effective way to plan for the future. To help you create a sound strategy based on your personal goals and risk tolerance, Allspring Funds offers more than 100 mutual funds spanning a wide range of asset classes and investment styles. Although diversification cannot guarantee an investment profit or prevent losses, we believe it can be an effective way to manage investment risk and potentially smooth out overall portfolio performance. We encourage investors to know their investments and to understand that appropriate levels of risk-taking may unlock opportunities.
Thank you for choosing to invest with Allspring Funds. We appreciate your confidence in us and remain committed to helping you meet your financial needs.
Sincerely,
Andrew Owen
President
Allspring Funds
For further information about your fund, contact your investment professional, visit our website at allspringglobal.com, or call us directly at 1-800-222-8222.
4 | Allspring Discovery Small Cap Growth Fund
This page is intentionally left blank.
Performance highlights (unaudited)
| Investment objective | The Fund seeks long-term capital appreciation. |
| Manager | Allspring Funds Management, LLC |
| Subadviser | Allspring Global Investments, LLC |
| Portfolio managers | Michael T. Smith, CFA®‡, Christopher J. Warner, CFA®‡ |
| Average annual total returns (%) as of September 30, 2022 |
| | | Including sales charge | | Excluding sales charge | | Expense ratios1 (%) |
| | Inception date | 1 year | 5 year | 10 year | | 1 year | 5 year | 10 year | | Gross | Net 2 |
| Class A (EGWAX) | 6-5-1995 | -43.82 | 5.03 | 8.06 | | -40.38 | 6.28 | 8.70 | | 1.44 | 1.23 |
| Class C (EGWCX) | 7-30-2010 | -41.86 | 5.51 | 8.06 | | -40.86 | 5.51 | 8.06 | | 2.19 | 1.98 |
| Class R6 (EGWRX)3 | 5-29-2020 | – | – | – | | -40.17 | 6.68 | 9.09 | | 1.01 | 0.80 |
| Administrator Class (EGWDX) | 7-30-2010 | – | – | – | | -40.24 | 6.67 | 9.00 | | 1.36 | 1.15 |
| Institutional Class (EGRYX) | 11-19-1997 | – | – | – | | -40.24 | 6.63 | 9.06 | | 1.11 | 0.90 |
| Russell 2000® Growth Index4 | – | – | – | – | | -29.27 | 3.60 | 8.81 | | – | – |
Figures quoted represent past performance, which is no guarantee of future results, and do not reflect taxes that a shareholder may pay on an investment in a fund. Investment return and principal value of an investment will fluctuate so that an investor’s shares, when redeemed, may be worth more or less than their original cost. Performance shown without sales charges would be lower if sales charges were reflected. Current performance may be lower or higher than the performance data quoted, which assumes the reinvestment of dividends and capital gains. Current month-end performance is available on the Fund’s website, allspringglobal.com.
Index returns do not include transaction costs associated with buying and selling securities, any mutual fund fees or expenses, or any taxes. It is not possible to invest directly in an index.
For Class A shares, the maximum front-end sales charge is 5.75%. For Class C shares, the maximum contingent deferred sales charge is 1.00%. Performance including a contingent deferred sales charge assumes the sales charge for the corresponding time period. Class R6, Administrator Class and Institutional Class shares are sold without a front-end sales charge or contingent deferred sales charge.
| 1 | Reflects the expense ratios as stated in the most recent prospectuses. The expense ratios shown are subject to change and may differ from the annualized expense ratios shown in the financial highlights of this report. |
| 2 | The manager has contractually committed through July 31, 2023, to waive fees and/or reimburse expenses to the extent necessary to cap total annual fund operating expenses after fee waivers at 1.23% for Class A, 1.98% for Class C, 0.80% for Class R6, 1.15% for Administrator Class, and 0.90% for Institutional Class. Brokerage commissions, stamp duty fees, interest, taxes, acquired fund fees and expenses (if any), and extraordinary expenses are excluded from the expense caps. Prior to or after the commitment expiration date, the caps may be increased or the commitment to maintain the caps may be terminated only with the approval of the Board of Trustees. Without these caps, the Fund’s returns would have been lower. The expense ratio paid by an investor is the net expense ratio (the total annual fund operating expenses after fee waivers) as stated in the prospectuses. |
| 3 | Historical performance shown for the Class R6 shares prior to their inception reflects the performance of the Institutional Class shares, and includes the higher expenses applicable to the Institutional Class shares. If these expenses had not been included, returns for the Class R6 shares would be higher. |
| 4 | The Russell 2000® Growth Index measures the performance of those Russell 2000 companies with higher price/book ratios and higher forecasted growth values. You cannot invest directly in an index. |
Stock values fluctuate in response to the activities of individual companies and general market and economic conditions. Smaller-company stocks tend to be more volatile and less liquid than those of larger companies. Consult the Fund’s prospectus for additional information on these and other risks.
| ‡ | CFA® and Chartered Financial Analyst® are trademarks owned by CFA Institute. |
6 | Allspring Discovery Small Cap Growth Fund
Performance highlights (unaudited)
| Ten largest holdings (%) as of September 30, 20221 |
| HealthEquity Incorporated | 3.32 |
| Wingstop Incorporated | 2.88 |
| WNS Holdings Limited ADR | 2.67 |
| Casella Waste Systems Incorporated Class A | 2.50 |
| MGP Ingredients Incorporated | 2.35 |
| Saia Incorporated | 2.35 |
| Shockwave Medical Incorporated | 2.28 |
| Tetra Tech Incorporated | 2.27 |
| Rexford Industrial Realty Incorporated | 2.26 |
| Option Care Health Incorporated | 1.96 |
| 1 | Figures represent the percentage of the Fund's net assets. Holdings are subject to change and may have changed since the date specified. |
| Sector allocation as of September 30, 20221 |
| 1 | Figures represent the percentage of the Fund's long-term investments. Allocations are subject to change and may have changed since the date specified. |
Allspring Discovery Small Cap Growth Fund | 7
Fund expenses (unaudited)
As a shareholder of the Fund, you incur two types of costs: (1) transaction costs, including sales charges (loads) on purchase payments and contingent deferred sales charges (if any) on redemptions and (2) ongoing costs, including management fees, distribution (12b-1) and/or shareholder servicing fees, and other Fund expenses. This example is intended to help you understand your ongoing costs (in dollars) of investing in the Fund and to compare these costs with the ongoing costs of investing in other mutual funds.
The example is based on an investment of $1,000 invested at the beginning of the six-month period and held for the entire period from April 1, 2022 to September 30, 2022.
Actual expenses
The “Actual” line of the table below provides information about actual account values and actual expenses. You may use the information in this line, together with the amount you invested, to estimate the expenses that you paid over the period. Simply divide your account value by $1,000 (for example, an $8,600 account value divided by $1,000 = 8.6), then multiply the result by the number in the “Actual” line under the heading entitled “Expenses paid during period” for your applicable class of shares to estimate the expenses you paid on your account during this period.
Hypothetical example for comparison purposes
The “Hypothetical” line of the table below provides information about hypothetical account values and hypothetical expenses based on the Fund’s actual expense ratio and an assumed rate of return of 5% per year before expenses, which is not the Fund’s actual return. The hypothetical account values and expenses may not be used to estimate the actual ending account balance or expenses you paid for the period. You may use this information to compare the ongoing costs of investing in the Fund and other funds. To do so, compare this 5% hypothetical example with the 5% hypothetical examples that appear in the shareholder reports of the other funds.
Please note that the expenses shown in the table are meant to highlight your ongoing costs only and do not reflect any transactional costs, such as sales charges (loads) and contingent deferred sales charges. Therefore, the “Hypothetical” line of the table is useful in comparing ongoing costs only, and will not help you determine the relative total costs of owning different funds. In addition, if these transactional costs were included, your costs would have been higher.
| | Beginning
account value
4-1-2022 | Ending
account value
9-30-2022 | Expenses
paid during
the period1 | Annualized net
expense ratio |
| Class A | | | | |
| Actual | $1,000.00 | $ 762.48 | $5.43 | 1.23% |
| Hypothetical (5% return before expenses) | $1,000.00 | $1,018.90 | $6.23 | 1.23% |
| Class C | | | | |
| Actual | $1,000.00 | $ 758.97 | $8.64 | 1.96% |
| Hypothetical (5% return before expenses) | $1,000.00 | $1,015.24 | $9.90 | 1.96% |
| Class R6 | | | | |
| Actual | $1,000.00 | $ 763.59 | $3.54 | 0.80% |
| Hypothetical (5% return before expenses) | $1,000.00 | $1,021.06 | $4.05 | 0.80% |
| Administrator Class | | | | |
| Actual | $1,000.00 | $ 763.96 | $5.09 | 1.15% |
| Hypothetical (5% return before expenses) | $1,000.00 | $1,019.30 | $5.82 | 1.15% |
| Institutional Class | | | | |
| Actual | $1,000.00 | $ 763.09 | $3.98 | 0.90% |
| Hypothetical (5% return before expenses) | $1,000.00 | $1,020.56 | $4.56 | 0.90% |
1 Expenses paid is equal to the annualized net expense ratio of each class multiplied by the average account value over the period, multiplied by 183 divided by 365 (to reflect the one-half-year period).
8 | Allspring Discovery Small Cap Growth Fund
Portfolio of investments—September 30, 2022 (unaudited)
| | | | | Shares | Value |
| Common stocks: 96.51% | | | | | |
| Communication services: 1.98% | | | | | |
| Interactive media & services: 1.98% | | | | | |
| Bumble Incorporated Class A † | | | | 62,150 | $ 1,335,604 |
| IAC/InterActiveCorp † | | | | 13,688 | 758,041 |
| | | | | | 2,093,645 |
| Consumer discretionary: 11.09% | | | | | |
| Diversified consumer services: 1.06% | | | | | |
| Mister Car Wash Incorporated † | | | | 130,014 | 1,115,520 |
| Hotels, restaurants & leisure: 4.68% | | | | | |
| Papa John's International Incorporated | | | | 27,184 | 1,903,152 |
| Wingstop Incorporated | | | | 24,293 | 3,046,828 |
| | | | | | 4,949,980 |
| Internet & direct marketing retail: 2.89% | | | | | |
| Global-E Online Limited † | | | | 51,473 | 1,377,417 |
| Xometry Incorporated Class A †« | | | | 29,566 | 1,679,053 |
| | | | | | 3,056,470 |
| Leisure products: 2.46% | | | | | |
| Callaway Golf Company † | | | | 84,264 | 1,622,925 |
| Games Workshop Group plc | | | | 15,358 | 982,046 |
| | | | | | 2,604,971 |
| Consumer staples: 2.35% | | | | | |
| Beverages: 2.35% | | | | | |
| MGP Ingredients Incorporated | | | | 23,436 | 2,487,966 |
| Financials: 2.41% | | | | | |
| Banks: 1.09% | | | | | |
| Silvergate Capital Corporation Class A † | | | | 15,365 | 1,157,753 |
| Capital markets: 0.59% | | | | | |
| Open Lending Corporation Class A † | | | | 77,973 | 626,903 |
| Insurance: 0.73% | | | | | |
| Goosehead Insurance Incorporated Class A † | | | | 21,512 | 766,688 |
| Health care: 29.79% | | | | | |
| Biotechnology: 5.02% | | | | | |
| Apellis Pharmaceuticals Incorporated † | | | | 10,851 | 741,123 |
| Ascendis Pharma AS ADR †« | | | | 8,193 | 846,009 |
| Chimerix Incorporated † | | | | 156,443 | 301,935 |
| CRISPR Therapeutics AG † | | | | 7,563 | 494,242 |
| CTI BioPharma Corporation † | | | | 83,094 | 483,607 |
| Fate Therapeutics Incorporated † | | | | 17,460 | 391,279 |
| Halozyme Therapeutics Incorporated † | | | | 33,133 | 1,310,079 |
| Mirati Therapeutics Incorporated † | | | | 5,892 | 411,497 |
| Zentalis Pharmaceuticals Incorporated † | | | | 15,363 | 332,763 |
| | | | | | 5,312,534 |
The accompanying notes are an integral part of these financial statements.
Allspring Discovery Small Cap Growth Fund | 9
Portfolio of investments—September 30, 2022 (unaudited)
| | | | | Shares | Value |
| Health care equipment & supplies: 14.08% | | | | | |
| Axonics Incorporated † | | | | 12,845 | $ 904,802 |
| Cryoport Incorporated † | | | | 34,934 | 850,992 |
| Establishment Labs Holdings Incorporated † | | | | 14,934 | 815,546 |
| ICU Medical Incorporated † | | | | 4,884 | 735,530 |
| Inari Medical Incorporated † | | | | 23,637 | 1,716,992 |
| Inspire Medical Systems Incorporated † | | | | 10,988 | 1,948,942 |
| iRhythm Technologies Incorporated † | | | | 15,571 | 1,950,735 |
| Lantheus Holdings Incorporated † | | | | 20,081 | 1,412,297 |
| Shockwave Medical Incorporated † | | | | 8,669 | 2,410,589 |
| Treace Medical Concepts Incorporated † | | | | 57,594 | 1,271,100 |
| UFP Technologies Incorporated † | | | | 10,174 | 873,336 |
| | | | | | 14,890,861 |
| Health care providers & services: 5.95% | | | | | |
| Amedisys Incorporated † | | | | 7,353 | 711,697 |
| HealthEquity Incorporated † | | | | 52,189 | 3,505,530 |
| Option Care Health Incorporated † | | | | 65,953 | 2,075,541 |
| | | | | | 6,292,768 |
| Life sciences tools & services: 4.09% | | | | | |
| Azenta Incorporated | | | | 16,844 | 721,934 |
| Inotiv Incorporated † | | | | 57,365 | 966,600 |
| MaxCyte Incorporated †« | | | | 152,247 | 989,606 |
| Stevanato Group SpA | | | | 96,867 | 1,640,927 |
| | | | | | 4,319,067 |
| Pharmaceuticals: 0.65% | | | | | |
| Arvinas Incorporated † | | | | 15,363 | 683,500 |
| Industrials: 16.05% | | | | | |
| Aerospace & defense: 1.50% | | | | | |
| Axon Enterprise Incorporated † | | | | 13,730 | 1,589,248 |
| Building products: 2.20% | | | | | |
| Advanced Drainage Systems Incorporated | | | | 12,518 | 1,556,864 |
| Trex Company Incorporated † | | | | 17,435 | 766,094 |
| | | | | | 2,322,958 |
| Commercial services & supplies: 5.28% | | | | | |
| Casella Waste Systems Incorporated Class A † | | | | 34,631 | 2,645,462 |
| Ritchie Bros. Auctioneers Incorporated | | | | 8,627 | 539,015 |
| Tetra Tech Incorporated | | | | 18,643 | 2,396,185 |
| | | | | | 5,580,662 |
| Electrical equipment: 1.68% | | | | | |
| Allied Motion Technologies | | | | 62,073 | 1,776,529 |
| Professional services: 1.28% | | | | | |
| ICF International Incorporated | | | | 12,430 | 1,355,119 |
| Road & rail: 2.35% | | | | | |
| Saia Incorporated † | | | | 13,082 | 2,485,580 |
| Trading companies & distributors: 1.76% | | | | | |
| SiteOne Landscape Supply Incorporated † | | | | 17,883 | 1,862,336 |
The accompanying notes are an integral part of these financial statements.
10 | Allspring Discovery Small Cap Growth Fund
Portfolio of investments—September 30, 2022 (unaudited)
| | | | | Shares | Value |
| Information technology: 28.96% | | | | | |
| Electronic equipment, instruments & components: 5.00% | | | | | |
| Littelfuse Incorporated | | | | 7,994 | $ 1,588,328 |
| Nayax Limited † | | | | 41,723 | 990,007 |
| Nlight Incorporated † | | | | 80,845 | 763,985 |
| Novanta Incorporated † | | | | 16,813 | 1,944,423 |
| | | | | | 5,286,743 |
| IT services: 9.23% | | | | | |
| Globant SA † | | | | 10,238 | 1,915,325 |
| Keywords Studios plc | | | | 67,233 | 1,715,096 |
| Marqeta Incorporated Class A † | | | | 122,583 | 872,791 |
| Shift4 Payments Incorporated Class A † | | | | 34,193 | 1,525,350 |
| StoneCo Limited Class A † | | | | 96,075 | 915,595 |
| WNS Holdings Limited ADR † | | | | 34,451 | 2,819,470 |
| | | | | | 9,763,627 |
| Semiconductors & semiconductor equipment: 2.20% | | | | | |
| Impinj Incorporated † | | | | 22,588 | 1,807,718 |
| Sitime Corporation † | | | | 6,569 | 517,177 |
| | | | | | 2,324,895 |
| Software: 12.53% | | | | | |
| Bill.com Holdings Incorporated † | | | | 10,600 | 1,403,122 |
| CCC Intelligent Solutions † | | | | 88,579 | 806,069 |
| Clearwater Analytics Holdings Incorporated Class A † | | | | 63,110 | 1,059,617 |
| CS Disco Incorporated † | | | | 45,033 | 450,330 |
| Five9 Incorporated † | | | | 20,454 | 1,533,641 |
| Gitlab Incorporated Class A † | | | | 17,819 | 912,689 |
| Jamf Holding Corporation † | | | | 63,626 | 1,409,952 |
| Lightspeed Commerce Incorporated † | | | | 31,326 | 550,711 |
| Olo Incorporated Class A † | | | | 134,351 | 1,061,373 |
| SentinelOne, Incorporated Class A † | | | | 31,549 | 806,392 |
| Sprout Social Incorporated Class A † | | | | 32,297 | 1,959,782 |
| Workiva Incorporated † | | | | 16,681 | 1,297,782 |
| | | | | | 13,251,460 |
| Materials: 0.59% | | | | | |
| Chemicals: 0.27% | | | | | |
| Aspen Aerogels Incorporated † | | | | 30,257 | 278,970 |
| Containers & packaging: 0.32% | | | | | |
| Ranpak Holdings Corporation † | | | | 99,060 | 338,785 |
| Real estate: 3.29% | | | | | |
| Equity REITs: 2.26% | | | | | |
| Rexford Industrial Realty Incorporated | | | | 46,009 | 2,392,468 |
| Real estate management & development: 1.03% | | | | | |
| DigitalBridge Group Incorporated | | | | 86,816 | 1,086,068 |
| Total Common stocks (Cost $113,647,116) | | | | | 102,054,074 |
The accompanying notes are an integral part of these financial statements.
Allspring Discovery Small Cap Growth Fund | 11
Portfolio of investments—September 30, 2022 (unaudited)
| | | Yield | | Shares | Value |
| Short-term investments: 6.58% | | | | | |
| Investment companies: 6.58% | | | | | |
| Allspring Government Money Market Fund Select Class ♠∞ | | 2.75% | | 3,764,268 | $ 3,764,268 |
| Securities Lending Cash Investments LLC ♠∩∞ | | 3.08 | | 3,194,700 | 3,194,700 |
| Total Short-term investments (Cost $6,958,968) | | | | | 6,958,968 |
| Total investments in securities (Cost $120,606,084) | 103.09% | | | | 109,013,042 |
| Other assets and liabilities, net | (3.09) | | | | (3,268,624) |
| Total net assets | 100.00% | | | | $105,744,418 |
| † | Non-income-earning security |
| « | All or a portion of this security is on loan. |
| ♠ | The issuer of the security is an affiliated person of the Fund as defined in the Investment Company Act of 1940. |
| ∩ | The investment is a non-registered investment company purchased with cash collateral received from securities on loan. |
| ∞ | The rate represents the 7-day annualized yield at period end. |
| Abbreviations: |
| ADR | American depositary receipt |
| REIT | Real estate investment trust |
Investments in affiliates
An affiliated investment is an investment in which the Fund owns at least 5% of the outstanding voting shares of the issuer or as a result of other relationships, such as the Fund and the issuer having the same investment manager. Transactions with issuers that were affiliates of the Fund at the end of the period were as follows:
| | Value,
beginning of
period | Purchases | Sales
proceeds | Net
realized
gains
(losses) | | Net
change in
unrealized
gains
(losses) | | Value,
end of
period | Shares,
end
of period | Income
from
affiliated
securities |
| Short-term investments | | | | | | | | | |
| Allspring Government Money Market Fund Select Class | $1,852,545 | $16,378,435 | $(14,466,712) | $0 | | $0 | | $ 3,764,268 | 3,764,268 | $ 27,450 |
| Securities Lending Cash Investments LLC | 5,055,425 | 24,651,377 | (26,512,102) | 0 | | 0 | | 3,194,700 | 3,194,700 | 29,684 # |
| | | | | $0 | | $0 | | $6,958,968 | | $57,134 |
| # | Amount shown represents income before fees and rebates. |
The accompanying notes are an integral part of these financial statements.
12 | Allspring Discovery Small Cap Growth Fund
Statement of assets and liabilities—September 30, 2022 (unaudited)
| | |
| Assets | |
Investments in unaffiliated securities (including $3,114,664 of securities loaned), at value (cost $113,647,116)
| $ 102,054,074 |
Investments in affiliated securities, at value (cost $6,958,968)
| 6,958,968 |
Foreign currency, at value (cost $348)
| 291 |
Receivable for investments sold
| 1,405,291 |
Receivable for Fund shares sold
| 137,046 |
Receivable for dividends
| 26,986 |
Receivable for securities lending income, net
| 1,487 |
Prepaid expenses and other assets
| 90,459 |
Total assets
| 110,674,602 |
| Liabilities | |
Payable upon receipt of securities loaned
| 3,194,700 |
Payable for investments purchased
| 1,558,359 |
Management fee payable
| 55,053 |
Payable for Fund shares redeemed
| 49,045 |
Administration fees payable
| 18,112 |
Trustees’ fees and expenses payable
| 3,758 |
Overdraft due to custodian bank
| 600 |
Distribution fee payable
| 325 |
Accrued expenses and other liabilities
| 50,232 |
Total liabilities
| 4,930,184 |
Total net assets
| $105,744,418 |
| Net assets consist of | |
Paid-in capital
| $ 122,791,214 |
Total distributable loss
| (17,046,796) |
Total net assets
| $105,744,418 |
| Computation of net asset value and offering price per share | |
Net assets – Class A
| $ 72,874,247 |
Shares outstanding – Class A1
| 6,451,842 |
Net asset value per share – Class A
| $11.30 |
Maximum offering price per share – Class A2
| $11.99 |
Net assets – Class C
| $ 474,664 |
Shares outstanding – Class C1
| 52,161 |
Net asset value per share – Class C
| $9.10 |
Net assets – Class R6
| $ 2,320,637 |
Shares outstanding – Class R61
| 160,370 |
Net asset value per share – Class R6
| $14.47 |
Net assets – Administrator Class
| $ 315,857 |
Shares outstanding – Administrator Class1
| 22,642 |
Net asset value per share – Administrator Class
| $13.95 |
Net assets – Institutional Class
| $ 29,759,013 |
Shares outstanding – Institutional Class1
| 2,061,900 |
Net asset value per share – Institutional Class
| $14.43 |
| 1 | The Fund has an unlimited number of authorized shares. |
| 2 | Maximum offering price is computed as 100/94.25 of net asset value. On investments of $50,000 or more, the offering price is reduced. |
The accompanying notes are an integral part of these financial statements.
Allspring Discovery Small Cap Growth Fund | 13
Statement of operations—six months ended September 30, 2022 (unaudited)
| | |
| Investment income | |
Dividends (net of foreign withholdings taxes of $793)
| $ 115,085 |
Income from affiliated securities
| 27,450 |
Securities lending income (including from affiliate), net
| 10,954 |
Total investment income
| 153,489 |
| Expenses | |
Management fee
| 498,907 |
| Administration fees | |
Class A
| 86,723 |
Class C
| 576 |
Class R6
| 342 |
Administrator Class
| 247 |
Institutional Class
| 20,533 |
| Shareholder servicing fees | |
Class A
| 103,241 |
Class C
| 619 |
Administrator Class
| 475 |
| Distribution fee | |
Class C
| 1,762 |
Custody and accounting fees
| 12,733 |
Professional fees
| 29,370 |
Registration fees
| 35,283 |
Shareholder report expenses
| 25,697 |
Trustees’ fees and expenses
| 11,176 |
Other fees and expenses
| 5,497 |
Total expenses
| 833,181 |
| Less: Fee waivers and/or expense reimbursements | |
Fund-level
| (97,784) |
Class A
| (50,297) |
Class R6
| (342) |
Administrator Class
| (226) |
Institutional Class
| (18,641) |
Net expenses
| 665,891 |
Net investment loss
| (512,402) |
| Realized and unrealized gains (losses) on investments | |
Net realized losses on investments
| (11,628,034) |
Net change in unrealized gains (losses) on investments
| (21,054,108) |
Net realized and unrealized gains (losses) on investments
| (32,682,142) |
Net decrease in net assets resulting from operations
| $(33,194,544) |
The accompanying notes are an integral part of these financial statements.
14 | Allspring Discovery Small Cap Growth Fund
Statement of changes in net assets
| | | | | |
| | Six months ended
September 30, 2022
(unaudited) | Year ended
March 31, 2022 |
| Operations | | | | |
Net investment loss
| | $ (512,402) | | $ (1,646,546) |
Net realized gains (losses) on investments
| | (11,628,034) | | 19,377,472 |
Net change in unrealized gains (losses) on investments
| | (21,054,108) | | (48,630,162) |
Net decrease in net assets resulting from operations
| | (33,194,544) | | (30,899,236) |
| Distributions to shareholders from | | | | |
| Net investment income and net realized gains | | | | |
Class A
| | 0 | | (20,423,584) |
Class C
| | 0 | | (219,886) |
Class R6
| | 0 | | (261,203) |
Administrator Class
| | 0 | | (73,953) |
Institutional Class
| | 0 | | (5,596,005) |
Total distributions to shareholders
| | 0 | | (26,574,631) |
| Capital share transactions | Shares | | Shares | |
| Proceeds from shares sold | | | | |
Class A
| 66,892 | 815,010 | 332,425 | 6,683,479 |
Class C
| 1,674 | 17,272 | 9,338 | 159,600 |
Class R6
| 69,223 | 1,049,984 | 101,634 | 2,520,991 |
Administrator Class
| 3,257 | 48,141 | 19,749 | 478,478 |
Institutional Class
| 415,978 | 6,297,370 | 1,426,944 | 36,296,515 |
| | | 8,227,777 | | 46,139,063 |
| Reinvestment of distributions | | | | |
Class A
| 0 | 0 | 1,111,624 | 20,009,223 |
Class C
| 0 | 0 | 15,071 | 219,886 |
Class R6
| 0 | 0 | 11,367 | 261,203 |
Administrator Class
| 0 | 0 | 3,223 | 71,474 |
Institutional Class
| 0 | 0 | 243,402 | 5,583,641 |
| | | 0 | | 26,145,427 |
| Payment for shares redeemed | | | | |
Class A
| (440,138) | (5,423,824) | (833,733) | (16,092,697) |
Class C
| (15,682) | (159,212) | (45,052) | (778,561) |
Class R6
| (23,303) | (365,728) | (15,802) | (375,226) |
Administrator Class
| (8,211) | (130,620) | (10,679) | (239,024) |
Institutional Class
| (307,504) | (4,774,166) | (452,264) | (10,422,365) |
| | | (10,853,550) | | (27,907,873) |
Net increase (decrease) in net assets resulting from capital share transactions
| | (2,625,773) | | 44,376,617 |
Total decrease in net assets
| | (35,820,317) | | (13,097,250) |
| Net assets | | | | |
Beginning of period
| | 141,564,735 | | 154,661,985 |
End of period
| | $105,744,418 | | $141,564,735 |
The accompanying notes are an integral part of these financial statements.
Allspring Discovery Small Cap Growth Fund | 15
Financial highlights
(For a share outstanding throughout each period)
| | | Year ended March 31 |
| Class A | Six months ended
September 30, 2022
(unaudited) | 2022 | 2021 | 2020 | 2019 | 2018 |
Net asset value, beginning of period
| $14.82 | $21.39 | $11.00 | $13.28 | $15.32 | $14.08 |
Net investment loss
| (0.06) 1 | (0.21) 1 | (0.18) 1 | (0.10) 1 | (0.11) 1 | (0.12) 1 |
Net realized and unrealized gains (losses) on investments
| (3.46) | (2.94) | 11.09 | (1.27) | 2.17 | 2.35 |
Total from investment operations
| (3.52) | (3.15) | 10.91 | (1.37) | 2.06 | 2.23 |
| Distributions to shareholders from | | | | | | |
Net realized gains
| 0.00 | (3.42) | (0.52) | (0.91) | (4.10) | (0.99) |
Net asset value, end of period
| $11.30 | $14.82 | $21.39 | $11.00 | $13.28 | $15.32 |
Total return2
| (23.75)% | (17.57)% | 99.31% | (11.52)% | 17.46% | 16.08% |
| Ratios to average net assets (annualized) | | | | | | |
Gross expenses
| 1.51% | 1.44% | 1.47% | 1.52% | 1.51% | 1.52% |
Net expenses
| 1.23% | 1.23% | 1.23% | 1.23% | 1.23% | 1.33% |
Net investment loss
| (0.97)% | (1.03)% | (0.99)% | (0.74)% | (0.74)% | (0.79)% |
| Supplemental data | | | | | | |
Portfolio turnover rate
| 19% | 55% | 55% | 63% | 155% | 44% |
Net assets, end of period (000s omitted)
| $72,874 | $101,163 | $132,937 | $66,472 | $86,006 | $84,738 |
| 1 | Calculated based upon average shares outstanding |
| 2 | Total return calculations do not include any sales charges. Returns for periods of less than one year are not annualized. |
The accompanying notes are an integral part of these financial statements.
16 | Allspring Discovery Small Cap Growth Fund
Financial highlights
(For a share outstanding throughout each period)
| | | Year ended March 31 |
| Class C | Six months ended
September 30, 2022
(unaudited) | 2022 | 2021 | 2020 | 2019 | 2018 |
Net asset value, beginning of period
| $11.99 | $18.08 | $9.39 | $11.55 | $13.94 | $12.99 |
Net investment loss
| (0.09) 1 | (0.31) 1 | (0.28) 1 | (0.18) 1 | (0.20) 1 | (0.21) 1 |
Payment from affiliate
| 0.00 | 0.00 | 0.01 | 0.00 | 0.00 | 0.00 |
Net realized and unrealized gains (losses) on investments
| (2.80) | (2.36) | 9.48 | (1.07) | 1.91 | 2.15 |
Total from investment operations
| (2.89) | (2.67) | 9.21 | (1.25) | 1.71 | 1.94 |
| Distributions to shareholders from | | | | | | |
Net realized gains
| 0.00 | (3.42) | (0.52) | (0.91) | (4.10) | (0.99) |
Net asset value, end of period
| $9.10 | $11.99 | $18.08 | $9.39 | $11.55 | $13.94 |
Total return2
| (24.10)% | (18.16)% | 98.22% 3 | (12.30)% | 16.69% | 15.17% |
| Ratios to average net assets (annualized) | | | | | | |
Gross expenses
| 2.13% | 2.18% | 2.20% | 2.26% | 2.26% | 2.27% |
Net expenses
| 1.96% | 1.98% | 1.98% | 1.98% | 1.98% | 2.08% |
Net investment loss
| (1.71)% | (1.79)% | (1.74)% | (1.49)% | (1.48)% | (1.54)% |
| Supplemental data | | | | | | |
Portfolio turnover rate
| 19% | 55% | 55% | 63% | 155% | 44% |
Net assets, end of period (000s omitted)
| $475 | $793 | $1,569 | $395 | $349 | $274 |
| 1 | Calculated based upon average shares outstanding |
| 2 | Total return calculations do not include any sales charges. Returns for periods of less than one year are not annualized. |
| 3 | During the year ended March 31, 2021, the Fund received a payment from an affiliate which had a 0.09% impact on the total return. |
The accompanying notes are an integral part of these financial statements.
Allspring Discovery Small Cap Growth Fund | 17
Financial highlights
(For a share outstanding throughout each period)
| | | Year ended March 31 |
| Class R6 | Six months ended
September 30, 2022
(unaudited) | 2022 | 2021 1 |
Net asset value, beginning of period
| $18.95 | $26.29 | $17.87 |
Net investment loss
| (0.04) 2 | (0.14) 2 | (0.11) 2 |
Net realized and unrealized gains (losses) on investments
| (4.44) | (3.78) | 9.05 |
Total from investment operations
| (4.48) | (3.92) | 8.94 |
| Distributions to shareholders from | | | |
Net realized gains
| 0.00 | (3.42) | (0.52) |
Net asset value, end of period
| $14.47 | $18.95 | $26.29 |
Total return3
| (23.64)% | (17.21)% | 50.11% |
| Ratios to average net assets (annualized) | | | |
Gross expenses
| 1.09% | 1.02% | 1.03% |
Net expenses
| 0.80% | 0.80% | 0.80% |
Net investment loss
| (0.53)% | (0.58)% | (0.54)% |
| Supplemental data | | | |
Portfolio turnover rate
| 19% | 55% | 55% |
Net assets, end of period (000s omitted)
| $2,321 | $2,169 | $454 |
| 1 | For the period from May 29, 2020 (commencement of class operations) to March 31, 2021 |
| 2 | Calculated based upon average shares outstanding |
| 3 | Returns for periods of less than one year are not annualized. |
The accompanying notes are an integral part of these financial statements.
18 | Allspring Discovery Small Cap Growth Fund
Financial highlights
(For a share outstanding throughout each period)
| | | Year ended March 31 |
| Administrator Class | Six months ended
September 30, 2022
(unaudited) | 2022 | 2021 | 2020 | 2019 | 2018 |
Net asset value, beginning of period
| $18.26 | $25.54 | $12.91 | $15.43 | $17.14 | $15.63 |
Net investment loss
| (0.07) 1 | (0.22) 1 | (0.20) 1 | (0.11) 1 | (0.11) 1 | (0.11) 1 |
Payment from affiliate
| 0.00 | 0.00 | 0.11 | 0.00 | 0.00 | 0.00 |
Net realized and unrealized gains (losses) on investments
| (4.24) | (3.64) | 13.24 | (1.50) | 2.50 | 2.61 |
Total from investment operations
| (4.31) | (3.86) | 13.15 | (1.61) | 2.39 | 2.50 |
| Distributions to shareholders from | | | | | | |
Net realized gains
| 0.00 | (3.42) | (0.52) | (0.91) | (4.10) | (0.99) |
Net asset value, end of period
| $13.95 | $18.26 | $25.54 | $12.91 | $15.43 | $17.14 |
Total return2
| (23.60)% | (17.49)% | 101.97% 3 | (11.52)% | 17.59% | 16.21% |
| Ratios to average net assets (annualized) | | | | | | |
Gross expenses
| 1.43% | 1.37% | 1.39% | 1.44% | 1.43% | 1.44% |
Net expenses
| 1.15% | 1.15% | 1.15% | 1.15% | 1.15% | 1.20% |
Net investment loss
| (0.89)% | (0.95)% | (0.90)% | (0.66)% | (0.62)% | (0.66)% |
| Supplemental data | | | | | | |
Portfolio turnover rate
| 19% | 55% | 55% | 63% | 155% | 44% |
Net assets, end of period (000s omitted)
| $316 | $504 | $391 | $93 | $104 | $133 |
| 1 | Calculated based upon average shares outstanding |
| 2 | Returns for periods of less than one year are not annualized. |
| 3 | During the year ended March 31, 2021, the Fund received a payment from an affiliate which had a 0.89% impact on the total return. |
The accompanying notes are an integral part of these financial statements.
Allspring Discovery Small Cap Growth Fund | 19
Financial highlights
(For a share outstanding throughout each period)
| | | Year ended March 31 |
| Institutional Class | Six months ended
September 30, 2022
(unaudited) | 2022 | 2021 | 2020 | 2019 | 2018 |
Net asset value, beginning of period
| $18.91 | $26.26 | $13.39 | $15.94 | $17.53 | $15.94 |
Net investment loss
| (0.05) 1 | (0.17) 1 | (0.15) 1 | (0.07) 1 | (0.07) 1 | (0.08) 1 |
Net realized and unrealized gains (losses) on investments
| (4.43) | (3.76) | 13.54 | (1.57) | 2.58 | 2.66 |
Total from investment operations
| (4.48) | (3.93) | 13.39 | (1.64) | 2.51 | 2.58 |
| Distributions to shareholders from | | | | | | |
Net realized gains
| 0.00 | (3.42) | (0.52) | (0.91) | (4.10) | (0.99) |
Net asset value, end of period
| $14.43 | $18.91 | $26.26 | $13.39 | $15.94 | $17.53 |
Total return2
| (23.69)% | (17.27)% | 100.11% | (11.29)% | 17.85% | 16.40% |
| Ratios to average net assets (annualized) | | | | | | |
Gross expenses
| 1.18% | 1.12% | 1.14% | 1.19% | 1.18% | 1.19% |
Net expenses
| 0.90% | 0.90% | 0.90% | 0.90% | 0.90% | 0.98% |
Net investment loss
| (0.64)% | (0.69)% | (0.66)% | (0.41)% | (0.41)% | (0.44)% |
| Supplemental data | | | | | | |
Portfolio turnover rate
| 19% | 55% | 55% | 63% | 155% | 44% |
Net assets, end of period (000s omitted)
| $29,759 | $36,936 | $19,311 | $7,980 | $9,695 | $8,878 |
| 1 | Calculated based upon average shares outstanding |
| 2 | Returns for periods of less than one year are not annualized. |
The accompanying notes are an integral part of these financial statements.
20 | Allspring Discovery Small Cap Growth Fund
Notes to financial statements (unaudited)
1. ORGANIZATION
Allspring Funds Trust (the "Trust"), a Delaware statutory trust organized on March 10, 1999, is an open-end management investment company registered under the Investment Company Act of 1940, as amended (the "1940 Act"). As an investment company, the Trust follows the accounting and reporting guidance in Financial Accounting Standards Board ("FASB") Accounting Standards Codification Topic 946, Financial Services – Investment Companies. These financial statements report on the Allspring Discovery Small Cap Growth Fund (formerly, Allspring Fundamental Small Cap Growth Fund) (the "Fund") which is a diversified series of the Trust.
2. SIGNIFICANT ACCOUNTING POLICIES
The following significant accounting policies, which are consistently followed in the preparation of the financial statements of the Fund, are in conformity with U.S. generally accepted accounting principles which require management to make estimates and assumptions that affect the reported amounts of assets and liabilities, disclosure of contingent assets and liabilities at the date of the financial statements, and the reported amounts of income and expenses during the reporting period. Actual results could differ from those estimates.
Securities valuation
All investments are valued each business day as of the close of regular trading on the New York Stock Exchange (generally 4 p.m. Eastern Time), although the Fund may deviate from this calculation time under unusual or unexpected circumstances.
Equity securities that are listed on a foreign or domestic exchange or market are valued at the official closing price or, if none, the last sales price.
The values of securities denominated in foreign currencies are translated into U.S. dollars at rates provided by an independent foreign currency pricing source at a time each business day specified by the Allspring Global Investments Pricing Committee at Allspring Funds Management, LLC ("Allspring Funds Management").
Many securities markets and exchanges outside the U.S. close prior to the close of the New York Stock Exchange and therefore may not fully reflect trading or events that occur after the close of the principal exchange in which the foreign securities are traded, but before the close of the New York Stock Exchange. If such trading or events are expected to materially affect the value of such securities, then fair value pricing procedures approved by the Board of Trustees of the Fund are applied. These procedures take into account multiple factors including movements in U.S. securities markets after foreign exchanges close. Foreign securities that are fair valued under these procedures are categorized as Level 2 and the application of these procedures may result in transfers between Level 1 and Level 2. Depending on market activity, such fair valuations may be frequent. Such fair value pricing may result in net asset values that are higher or lower than net asset values based on the last reported sales price or latest quoted bid price. On September 30, 2022, such fair value pricing was used in pricing certain foreign securities.
Investments in registered open-end investment companies are valued at net asset value. Interests in non-registered investment companies that are redeemable at net asset value are fair valued normally at net asset value.
Investments which are not valued using the methods discussed above are valued at their fair value, as determined in good faith by Allspring Funds Management, which was named the valuation designee by the Board of Trustees. As the valuation designee, Allspring Funds Management is responsible for day-to-day valuation activities for the Allspring Funds. In connection with these responsibilities, Allspring Funds Management has established a Valuation Committee and has delegated to it the authority to take any actions regarding the valuation of portfolio securities that the Valuation Committee deems necessary or appropriate, including determining the fair value of portfolio securities. On a quarterly basis, the Board of Trustees receives reports of valuation actions taken by the Valuation Committee. On at least an annual basis, the Board of Trustees receives an assessment of the adequacy and effectiveness of Allspring Funds Management's process for determining the fair value of the portfolio of investments.
Foreign currency translation
The accounting records of the Fund are maintained in U.S. dollars. The values of other assets and liabilities denominated in foreign currencies are translated into U.S. dollars at rates provided by an independent foreign currency pricing source at a time each business day specified by the Allspring Global Investments Pricing Committee. Purchases and sales of securities, and income and expenses are converted at the rate of exchange on the respective dates of such transactions. Net realized foreign exchange gains or losses arise from sales of foreign currencies, currency gains or losses realized between the trade and settlement dates on securities transactions, and the difference between the amounts of dividends, interest and foreign withholding taxes recorded and the U.S. dollar equivalent of the amounts actually paid or received. Net unrealized foreign exchange gains and losses arise from changes in the fair value of assets and liabilities other than investments in securities
Allspring Discovery Small Cap Growth Fund | 21
Notes to financial statements (unaudited)
resulting from changes in exchange rates. The changes in net assets arising from changes in exchange rates of securities and the changes in net assets resulting from changes in market prices of securities are not separately presented. Such changes are included in net realized and unrealized gains or losses from investments.
Securities lending
The Fund may lend its securities from time to time in order to earn additional income in the form of fees or interest on securities received as collateral or the investment of any cash received as collateral. When securities are on loan, the Fund receives interest or dividends on those securities. Cash collateral received in connection with its securities lending transactions is invested in Securities Lending Cash Investments, LLC (the "Securities Lending Fund"), an affiliated non-registered investment company. Investments in Securities Lending Fund are valued at the evaluated bid price provided by an independent pricing service. Income earned from investment in the Securities Lending Fund, if any, is included in securities lending income (including from affiliate) (net of fees and rebates) on the Statement of Operations.
In a securities lending transaction, the net asset value of the Fund is affected by an increase or decrease in the value of the securities loaned and by an increase or decrease in the value of the instrument in which collateral is invested. The amount of securities lending activity undertaken by the Fund fluctuates from time to time. The Fund has the right under the lending agreement to recover the securities from the borrower on demand. In the event of default or bankruptcy by the borrower, the Fund may be prevented from recovering the loaned securities or gaining access to the collateral or may experience delays or costs in doing so. In such an event, the terms of the agreement allow the unaffiliated securities lending agent to use the collateral to purchase replacement securities on behalf of the Fund or pay the Fund the market value of the loaned securities. The Fund bears the risk of loss with respect to depreciation of its investment of the cash collateral.
Security transactions and income recognition
Securities transactions are recorded on a trade date basis. Realized gains or losses are recorded on the basis of identified cost.
Dividend income is recognized on the ex-dividend date, except for certain dividends from foreign securities, which are recorded as soon as the custodian verifies the ex-dividend date. Dividend income is recorded net of foreign taxes withheld where recovery of such taxes is not assured.
Distributions to shareholders
Distributions to shareholders from net investment income and any net realized gains are recorded on the ex-dividend date and paid at least annually. Such distributions are determined in accordance with income tax regulations and may differ from U.S. generally accepted accounting principles. Dividend sources are estimated at the time of declaration. The tax character of distributions is determined as of the Fund's fiscal year end. Therefore, a portion of the Fund's distributions made prior to the Fund’s fiscal year end may be categorized as a tax return of capital at year end.
Federal and other taxes
The Fund intends to continue to qualify as a regulated investment company by distributing substantially all of its investment company taxable income and any net realized capital gains (after reduction for capital loss carryforwards) sufficient to relieve it from all, or substantially all, federal income taxes. Accordingly, no provision for federal income taxes was required.
The Fund’s income and federal excise tax returns and all financial records supporting those returns for the prior three fiscal years are subject to examination by the federal and Delaware revenue authorities. Management has analyzed the Fund's tax positions taken on federal, state, and foreign tax returns, as applicable, for all open tax years and does not believe that there are any uncertain tax positions that require recognition of a tax liability.
As of September 30, 2022, the aggregate cost of all investments for federal income tax purposes was $120,607,438 and the unrealized gains (losses) consisted of:
| Gross unrealized gains | $ 21,275,948 |
| Gross unrealized losses | (32,870,344) |
| Net unrealized losses | $(11,594,396) |
As of March 31, 2022, the Fund had a qualified late-year ordinary loss of $287,091 which was recognized on the first day of the current fiscal year.
Class allocations
The separate classes of shares offered by the Fund differ principally in applicable sales charges, distribution, shareholder servicing, and administration fees. Class specific expenses are charged directly to that share class. Investment income, common
22 | Allspring Discovery Small Cap Growth Fund
Notes to financial statements (unaudited)
fund-level expenses, and realized and unrealized gains (losses) on investments are allocated daily to each class of shares based on the relative proportion of net assets of each class.
3. FAIR VALUATION MEASUREMENTS
Fair value measurements of investments are determined within a framework that has established a fair value hierarchy based upon the various data inputs utilized in determining the value of the Fund’s investments. The three-level hierarchy gives the highest priority to unadjusted quoted prices in active markets for identical assets or liabilities (Level 1) and the lowest priority to unobservable inputs (Level 3). The Fund’s investments are classified within the fair value hierarchy based on the lowest level of input that is significant to the fair value measurement. The inputs are summarized into three broad levels as follows:
| ■ | Level 1 – quoted prices in active markets for identical securities |
| ■ | Level 2 – other significant observable inputs (including quoted prices for similar securities, interest rates, prepayment speeds, credit risk, etc.) |
| ■ | Level 3 – significant unobservable inputs (including the Fund’s own assumptions in determining the fair value of investments) |
The inputs or methodologies used for valuing investments in securities are not necessarily an indication of the risk associated with investing in those securities.
The following is a summary of the inputs used in valuing the Fund’s assets and liabilities as of September 30, 2022:
| | Quoted prices
(Level 1) | Other significant
observable inputs
(Level 2) | Significant
unobservable inputs
(Level 3) | Total |
| Assets | | | | |
| Investments in: | | | | |
| Common stocks | | | | |
| Communication services | $ 2,093,645 | $ 0 | $0 | $ 2,093,645 |
| Consumer discretionary | 10,744,895 | 982,046 | 0 | 11,726,941 |
| Consumer staples | 2,487,966 | 0 | 0 | 2,487,966 |
| Financials | 2,551,344 | 0 | 0 | 2,551,344 |
| Health care | 31,498,730 | 0 | 0 | 31,498,730 |
| Industrials | 16,972,432 | 0 | 0 | 16,972,432 |
| Information technology | 27,921,622 | 2,705,103 | 0 | 30,626,725 |
| Materials | 617,755 | 0 | 0 | 617,755 |
| Real estate | 3,478,536 | 0 | 0 | 3,478,536 |
| Short-term investments | | | | |
| Investment companies | 6,958,968 | 0 | 0 | 6,958,968 |
| Total assets | $105,325,893 | $3,687,149 | $0 | $109,013,042 |
Additional sector, industry or geographic detail, if any, is included in the Portfolio of Investments.
For the six months ended September 30, 2022, the Fund did not have any transfers into/out of Level 3.
4. TRANSACTIONS WITH AFFILIATES
Management fee
Allspring Funds Management, a wholly owned subsidiary of Allspring Global Investments Holdings, LLC, a holding company indirectly owned by certain private funds of GTCR LLC and Reverence Capital Partners, L.P., is the manager of the Fund and provides advisory and fund-level administrative services under an investment management agreement. Under the investment management agreement, Allspring Funds Management is responsible for, among other services, implementing the investment objectives and strategies of the Fund, supervising the subadviser and providing fund-level administrative services in connection with the Fund’s operations. As compensation for its services under the investment management agreement, Allspring Funds Management is entitled to receive a management fee at the following annual rate based on the Fund’s average daily net assets:
Allspring Discovery Small Cap Growth Fund | 23
Notes to financial statements (unaudited)
| Average daily net assets | Management fee |
| First $500 million | 0.850% |
| Next $500 million | 0.825 |
| Next $1 billion | 0.800 |
| Next $1 billion | 0.775 |
| Next $1 billion | 0.750 |
| Next $1 billion | 0.730 |
| Next $5 billion | 0.720 |
| Over $10 billion | 0.710 |
For the six months ended September 30, 2022, the management fee was equivalent to an annual rate of 0.85% of the Fund’s average daily net assets.
Allspring Funds Management has retained the services of a subadviser to provide daily portfolio management to the Fund. The fee for subadvisory services is borne by Allspring Funds Management. Allspring Global Investments, LLC ("Allspring Investments"), an affiliate of Allspring Funds Management and a wholly owned subsidiary of Allspring Global Investments Holdings, LLC, is the subadviser to the Fund and is entitled to receive a fee from Allspring Funds Management at an annual rate starting at 0.55% and declining to 0.40% as the average daily net assets of the Fund increase.
Administration fees
Under a class-level administration agreement, Allspring Funds Management provides class-level administrative services to the Fund, which includes paying fees and expenses for services provided by the transfer agent, sub-transfer agents, omnibus account servicers and record-keepers. As compensation for its services under the class-level administration agreement, Allspring Funds Management receives an annual fee which is calculated based on the average daily net assets of each class as follows:
| | Class-level
administration fee |
| Class A | 0.21% |
| Class C | 0.21 |
| Class R6 | 0.03 |
| Administrator Class | 0.13 |
| Institutional Class | 0.13 |
Waivers and/or expense reimbursements
Allspring Funds Management has contractually committed to waive and/or reimburse management and administration fees to the extent necessary to maintain certain net operating expense ratios for the Fund. When each class of the Fund has exceeded its expense cap, Allspring Funds Management will waive fees and/or reimburse expenses from fund-level expenses on a proportionate basis and then from class specific expenses. When only certain classes exceed their expense caps, waivers and/or reimbursements are applied against class specific expenses before fund-level expenses. Allspring Funds Management has contractually committed through July 31, 2023 to waive fees and/or reimburse expenses to the extent necessary to cap expenses. Prior to or after the commitment expiration date, the caps may be increased or the commitment to maintain the caps may be terminated only with the approval of the Board of Trustees. As of September 30, 2022, the contractual expense caps are as follows:
24 | Allspring Discovery Small Cap Growth Fund
Notes to financial statements (unaudited)
| | Expense ratio caps |
| Class A | 1.23% |
| Class C | 1.98 |
| Class R6 | 0.80 |
| Administrator Class | 1.15 |
| Institutional Class | 0.90 |
Distribution fee
The Trust has adopted a distribution plan for Class C shares pursuant to Rule 12b-1 under the 1940 Act. A distribution fee is charged to Class C shares and paid to Allspring Funds Distributor, LLC ("Allspring Funds Distributor"), the principal underwriter, an affiliate of Allspring Funds Management, at an annual rate of 0.75% of the average daily net assets of Class C shares.
In addition, Allspring Funds Distributor is entitled to receive the front-end sales charge from the purchase of Class A shares and a contingent deferred sales charge on the redemption of certain Class A shares. Allspring Funds Distributor is also entitled to receive the contingent deferred sales charges from redemptions of Class C shares. For the six months ended September 30, 2022, Allspring Funds Distributor received $125 from the sale of Class A shares. No contingent deferred sales charges were incurred by Class A and Class C shares for the six months ended September 30, 2022.
Shareholder servicing fees
The Trust has entered into contracts with one or more shareholder servicing agents, whereby Class A, Class C and Administrator Class are charged a fee at an annual rate of 0.25% of the average daily net assets of each respective class. A portion of these total shareholder servicing fees were paid to affiliates.
Interfund transactions
The Fund may purchase or sell portfolio investment securities to certain affiliates pursuant to Rule 17a-7 under the 1940 Act and under procedures adopted by the Board of Trustees. The procedures have been designed to ensure that these interfund transactions, which do not incur broker commissions, are effected at current market prices.
5. INVESTMENT PORTFOLIO TRANSACTIONS
Purchases and sales of investments, excluding U.S. government obligations (if any) and short-term securities, for the six months ended September 30, 2022 were $21,653,545 and $26,329,830, respectively.
6. SECURITIES LENDING TRANSACTIONS
The Fund lends its securities through an unaffiliated securities lending agent and receives collateral in the form of cash or securities with a value at least equal to the value of the securities on loan. The value of the loaned securities is determined at the close of each business day and any increases or decreases in the required collateral are exchanged between the Fund and the counterparty on the next business day. Cash collateral received is invested in the Securities Lending Fund which seeks to provide a positive return compared to the daily Federal Funds Open Rate by investing in high-quality, U.S. dollar-denominated short-term money market instruments and is exempt from registration under Section 3(c)(7) of the 1940 Act. Securities Lending Fund is managed by Allspring Funds Management and is subadvised by Allspring Investments. Allspring Funds Management receives an advisory fee starting at 0.05% and declining to 0.01% as the average daily net assets of the Securities Lending Fund increase. All of the fees received by Allspring Funds Management are paid to Allspring Investments for its services as subadviser.
In the event of counterparty default or the failure of a borrower to return a loaned security, the Fund has the right to use the collateral to offset any losses incurred. As of September 30, 2022, the Fund had securities lending transactions with the following counterparties which are subject to offset:
Allspring Discovery Small Cap Growth Fund | 25
Notes to financial statements (unaudited)
| Counterparty | Value of
securities on
loan | Collateral
received1 | Net amount |
| BNP Paribas Securities Corporation | $1,334,322 | $(1,334,322) | $0 |
| Morgan Stanley & Co. LLC | 615,720 | (615,720) | 0 |
| National Financial Services LLC | 369,264 | (369,264) | 0 |
| Scotia Capital (USA) Incorporated | 795,358 | (795,358) | 0 |
1 Collateral received within this table is limited to the collateral for the net transaction with the counterparty.
7. BANK BORROWINGS
The Trust (excluding the money market funds), Allspring Master Trust and Allspring Variable Trust are parties to a $350,000,000 revolving credit agreement whereby the Fund is permitted to use bank borrowings for temporary or emergency purposes, such as to fund shareholder redemption requests. Interest under the credit agreement is charged to the Fund based on a borrowing rate equal to the higher of the Federal Funds rate or the overnight bank funding rate in effect on that day plus a spread. In addition, an annual commitment fee equal based on the unused balance is allocated to each participating fund.
For the six months ended September 30, 2022, there were no borrowings by the Fund under the agreement.
8. CONCENTRATION RISKS
As of the end of the period, the Fund concentrated its portfolio of investments in the health care and information technology sectors. A fund that invests a substantial portion of its assets in any sector may be more affected by changes in that sector than would be a fund whose investments are not heavily weighted in any sector.
9. INDEMNIFICATION
Under the Fund's organizational documents, the officers and Trustees have been granted certain indemnification rights against certain liabilities that may arise out of performance of their duties to the Fund. The Fund has entered into a separate agreement with each Trustee that converts indemnification rights currently existing under the Fund’s organizational documents into contractual rights that cannot be changed in the future without the consent of the Trustee. Additionally, in the normal course of business, the Fund may enter into contracts with service providers that contain a variety of indemnification clauses. The Fund’s maximum exposure under these arrangements is dependent on future claims that may be made against the Fund and, therefore, cannot be estimated.
10. CORONAVIRUS (COVID-19) PANDEMIC
On March 11, 2020, the World Health Organization announced that it had made the assessment that coronavirus disease 2019 (“COVID-19”) is a pandemic. The impacts of COVID-19 are affecting the entire global economy, individual companies and investment products, the funds, and the market in general. There is significant uncertainty around the extent and duration of business disruptions related to COVID-19 and the impacts may last for an extended period of time. COVID-19 has led to significant uncertainty and volatility in the financial markets.
26 | Allspring Discovery Small Cap Growth Fund
Other information (unaudited)
PROXY VOTING INFORMATION
A description of the policies and procedures used to determine how to vote proxies relating to portfolio securities is available without charge, upon request, by calling 1-800-222-8222, visiting our website at allspringglobal.com, or visiting the SEC website at sec.gov. Information regarding how the proxies related to portfolio securities were voted during the most recent 12-month period ended June 30 is available on the website at allspringglobal.com or by visiting the SEC website at sec.gov.
QUARTERLY PORTFOLIO HOLDINGS INFORMATION
The Fund files its complete schedule of portfolio holdings with the SEC for the first and third quarters of each fiscal year as an exhibit to its reports on Form N-PORT. Shareholders may view the filed Form N-PORT by visiting the SEC website at sec.gov.
Allspring Discovery Small Cap Growth Fund | 27
Other information (unaudited)
BOARD OF TRUSTEES AND OFFICERS
Each of the Trustees and Officers listed in the table below acts in identical capacities for each fund in the Allspring family of funds, which consists of 124 mutual funds comprising the Allspring Funds Trust, Allspring Variable Trust, Allspring Master Trust and four closed-end funds (collectively the “Fund Complex”). This table should be read in conjunction with the Prospectus and the Statement of Additional Information1. The mailing address of each Trustee and Officer is 525 Market Street, 12th Floor, San Francisco, CA 94105. Each Trustee and Officer serves an indefinite term, however, each Trustee serves such term until reaching the mandatory retirement age established by the Trustees.
Independent Trustees
Name and
year of birth | Position held and
length of service* | Principal occupations during past five years or longer | Current other
public company or
investment
company
directorships |
William R. Ebsworth
(Born 1957) | Trustee,
since 2015 | Retired. From 1984 to 2013, equities analyst, portfolio manager, research director and chief investment officer at Fidelity Management and Research Company in Boston, Tokyo, and Hong Kong, and retired in 2013 as Chief Investment Officer of Fidelity Strategic Advisers, Inc. where he led a team of investment professionals managing client assets. Prior thereto, Board member of Hong Kong Securities Clearing Co., Hong Kong Options Clearing Corp., the Thailand International Fund, Ltd., Fidelity Investments Life Insurance Company, and Empire Fidelity Investments Life Insurance Company. Audit Committee Chair and Investment Committee Chair of the Vincent Memorial Hospital Endowment (non-profit organization). Mr. Ebsworth is a CFA® charterholder. | N/A |
Jane A. Freeman
(Born 1953) | Trustee,
since 2015;
Chair Liaison,
since 2018 | Retired. From 2012 to 2014 and 1999 to 2008, Chief Financial Officer of Scientific Learning Corporation. From 2008 to 2012, Ms. Freeman provided consulting services related to strategic business projects. Prior to 1999, Portfolio Manager at Rockefeller & Co. and Scudder, Stevens & Clark. Board member of the Harding Loevner Funds from 1996 to 2014, serving as both Lead Independent Director and chair of the Audit Committee. Board member of the Russell Exchange Traded Funds Trust from 2011 to 2012 and the chair of the Audit Committee. Ms. Freeman is also an inactive Chartered Financial Analyst. | N/A |
Isaiah Harris, Jr.
(Born 1952) | Trustee,
since 2009; Audit
Committee
Chair,
since 2019 | Retired. Chairman of the Board of CIGNA Corporation from 2009 to 2021, and Director from 2005 to 2008. From 2003 to 2011, Director of Deluxe Corporation. Prior thereto, President and CEO of BellSouth Advertising and Publishing Corp. from 2005 to 2007, President and CEO of BellSouth Enterprises from 2004 to 2005 and President of BellSouth Consumer Services from 2000 to 2003. Emeritus member of the Iowa State University Foundation Board of Governors. Emeritus Member of the Advisory Board of Iowa State University School of Business. Advisory Board Member, Palm Harbor Academy (private school). Advisory Board Member, Fellowship of Christian Athletes. Mr. Harris is a certified public accountant (inactive status). | N/A |
David F. Larcker
(Born 1950) | Trustee,
since 2009 | James Irvin Miller Professor of Accounting at the Graduate School of Business (Emeritus), Stanford University, Director of the Corporate Governance Research Initiative and Senior Faculty of The Rock Center for Corporate Governance since 2006. From 2005 to 2008, Professor of Accounting at the Graduate School of Business, Stanford University. Prior thereto, Ernst & Young Professor of Accounting at The Wharton School, University of Pennsylvania from 1985 to 2005. | N/A |
28 | Allspring Discovery Small Cap Growth Fund
Other information (unaudited)
Name and
year of birth | Position held and
length of service* | Principal occupations during past five years or longer | Current other
public company or
investment
company
directorships |
Olivia S. Mitchell
(Born 1953) | Trustee,
since 2006;
Nominating and
Governance
Committee Chair,
since 2018 | International Foundation of Employee Benefit Plans Professor since 1993, Wharton School of the University of Pennsylvania. Director of Wharton’s Pension Research Council and Boettner Center on Pensions & Retirement Research, and Research Associate at the National Bureau of Economic Research. Previously taught at Cornell University from 1978 to 1993. | N/A |
Timothy J. Penny
(Born 1951) | Trustee,
since 1996;
Chair,
since 2018 | President and Chief Executive Officer of Southern Minnesota Initiative Foundation, a non-profit organization, since 2007. Vice Chair of the Economic Club of Minnesota, since 2007. Co-Chair of the Committee for a Responsible Federal Budget, since 1995. Member of the Board of Trustees of NorthStar Education Finance, Inc., a non-profit organization, since 2007. Senior Fellow of the University of Minnesota Humphrey Institute from 1995 to 2017. | N/A |
James G. Polisson
(Born 1959) | Trustee,
since 2018 | Retired. Chief Marketing Officer, Source (ETF) UK Services, Ltd, from 2015 to 2017. From 2012 to 2015, Principal of The Polisson Group, LLC, a management consulting, corporate advisory and principal investing company. Chief Executive Officer and Managing Director at Russell Investments, Global Exchange Traded Funds from 2010 to 2012. Managing Director of Barclays Global Investors from 1998 to 2010 and Global Chief Marketing Officer for iShares and Barclays Global Investors from 2000 to 2010. Trustee of the San Francisco Mechanics’ Institute, a non-profit organization, from 2013 to 2015. Board member of the Russell Exchange Traded Fund Trust from 2011 to 2012. Director of Barclays Global Investors Holdings Deutschland GmbH from 2006 to 2009. Mr. Polisson is an attorney and has a retired status with the Massachusetts and District of Columbia Bar Associations. | N/A |
Pamela Wheelock
(Born 1959) | Trustee,
since January
2020; previously
Trustee from
January 2018 to
July 2019 | Retired. Executive and Senior Financial leadership positions in the public, private and nonprofit sectors. Interim President and CEO, McKnight Foundation, 2020. Interim Commissioner, Minnesota Department of Human Services, 2019. Chief Operating Officer, Twin Cities Habitat for Humanity, 2017-2019. Vice President for University Services, University of Minnesota, 2012-2016. Interim President and CEO, Blue Cross and Blue Shield of Minnesota, 2011-2012. Executive Vice-President and Chief Financial Officer, Minnesota Wild, 2002-2008. Commissioner, Minnesota Department of Finance, 1999-2002. Chair of the Board of Directors of Destination Medical Center Corporation. Board member of the Minnesota Wild Foundation. | N/A |
* Length of service dates reflect the Trustee’s commencement of service with the Trust’s predecessor entities, where applicable.
Allspring Discovery Small Cap Growth Fund | 29
Other information (unaudited)
Officers2
Name and
year of birth | Position held and
length of service | Principal occupations during past five years or longer |
Andrew Owen
(Born 1960) | President,
since 2017 | President and Chief Executive Officer of Allspring Funds Management, LLC since 2017 and Head of Global Fund Governance of Allspring Global Investments since 2022. Prior thereto, co-president of Galliard Capital Management, LLC, an affiliate of Allspring Funds Management, LLC, from 2019 to 2022 and Head of Affiliated Managers, Allspring Global Investments, from 2014 to 2019 and Executive Vice President responsible for marketing, investments and product development for Allspring Funds Management, LLC, from 2009 to 2014. |
Jeremy DePalma
(Born 1974) | Treasurer,
since 2012
(for certain funds in
the Fund Complex);
since 2021 (for
the remaining funds in the
Fund Complex) | Senior Vice President of Allspring Funds Management, LLC since 2009. Senior Vice President of Evergreen Investment Management Company, LLC from 2008 to 2010 and head of the Fund Reporting and Control Team within Fund Administration from 2005 to 2010. |
Christopher Baker
(Born 1976) | Chief Compliance Officer, since 2022 | Global Chief Compliance Officer for Allspring Global Investments since 2022. Prior thereto, Chief Compliance Officer for State Street Global Advisors from 2018 to 2021. Senior Compliance Officer for the State Street divisions of Alternative Investment Solutions, Sector Solutions, and Global Marketing from 2015 to 2018. From 2010 to 2015 Vice President, Global Head of Investment and Marketing Compliance for State Street Global Advisors. |
Matthew Prasse
(Born 1983) | Chief Legal Officer, since 2022; Secretary, since 2021 | Senior Counsel of the Allspring Legal Department since 2021. Senior Counsel of the Wells Fargo Legal Department from 2018 to 2021. Previously, Counsel for Barings LLC from 2015 to 2018. Prior to joining Barings, Associate at Morgan, Lewis & Bockius LLP from 2008 to 2015. |
1 The Statement of Additional Information includes additional information about the Trustees and is available, without charge, upon request, by calling 1-800-222-8222 or by visiting the website at allspringglobal.com.
2 For those Officers with tenures at Allspring Global Investments and/or Allspring Funds Management, LLC that began prior to 2021, such tenures include years of service during which these businesses/entities were known as Wells Fargo Asset Management and Wells Fargo Funds Management, LLC, respectively.
30 | Allspring Discovery Small Cap Growth Fund
Other information (unaudited)
LIQUIDITY RISK MANAGEMENT PROGRAM
In accordance with Rule 22e-4 under the Investment Company Act of 1940, as amended (the “Liquidity Rule”), Allspring Funds Trust (the “Trust”) has adopted and implemented a liquidity risk management program (the “Program”) on behalf of each of its series (other than the series that operate as money market funds), including the Fund, which is reasonably designed to assess and manage the Fund's liquidity risk. “Liquidity risk” is defined under the Liquidity Rule as the risk that the Fund is unable to meet redemption requests without significantly diluting remaining investors’ interests in the Fund. The Trust’s Board of Trustees (the “Board”) previously approved the designation of Allspring Funds Management, LLC (“Allspring Funds Management”), the Fund's investment manager, to administer the Program, and Allspring Funds Management has established a Liquidity Risk Management Council (the "Council") composed of personnel from multiple departments within Allspring Funds Management and its affiliates to assist Allspring Funds Management in the administration of the Program.
The Program is comprised of various components designed to support the assessment and/or management of liquidity risk, including: (1) the periodic assessment (no less frequently than annually) of certain factors that influence the Fund's liquidity risk; (2) the periodic classification (no less frequently than monthly) of the Fund's investments into one of four liquidity categories that reflect an estimate of their liquidity under current market conditions; (3) a 15% limit on the acquisition of “illiquid investments” (as defined under the Liquidity Rule); (4) to the extent the Fund does not invest primarily in “highly liquid investments” (as defined under the Liquidity Rule), the determination of a minimum percentage of the Fund's assets that generally will be invested in highly liquid investments (an “HLIM”); (5) if the Fund has established an HLIM, the periodic review (no less frequently than annually) of the HLIM and the adoption of policies and procedures for responding to a shortfall of the Fund's “highly liquid investments” below its HLIM; and (6) periodic reporting to the Board.
At a meeting of the Board held on May 24-25, 2022, the Board received and reviewed a written report (the “Report”) from Allspring Funds Management that, among other things, addressed the operation of the Program and assessed its adequacy and effectiveness for the period from January 1, 2021 through December 31, 2021 (the “Reporting Period”). Other than extended foreign market holidays, no significant liquidity events impacting the Funds were noted in the Report. In addition, other than corporate-related changes to the Program, there were no material changes to the Program during the Reporting Period.
Allspring Funds Management determined in the Report that the Program has been implemented and operates effectively to manage the Fund’s liquidity risk, and Allspring Funds Management continues to believe that the Program has been and continues to be adequately and effectively implemented to monitor and, as applicable, respond to the Fund’s liquidity developments.
There can be no assurance that the Program will achieve its objectives under all circumstances in the future. Please refer to the Fund’s prospectus for more information regarding the Fund’s exposure to liquidity risk and other risks to which an investment in the Fund may be subject.
Allspring Discovery Small Cap Growth Fund | 31
For more information
More information about Allspring Funds is available free upon request. To obtain literature, please write, visit the Fund's website, or call:
Allspring Funds
P.O. Box 219967
Kansas City, MO 64121-9967
Website: allspringglobal.com
Individual investors: 1-800-222-8222
Retail investment professionals: 1-888-877-9275
Institutional investment professionals: 1-800-260-5969
This report and the financial statements contained herein are submitted for the general information of the shareholders of the Fund. If this report is used for promotional purposes, distribution of the report must be accompanied or preceded by a current prospectus. Before investing, please consider the investment objectives, risks, charges, and expenses of the investment. For a current prospectus and, if available, a summary prospectus, containing this information, call
1-800-222-8222 or visit the Fund's website at allspringglobal.com. Read the prospectus carefully before you invest or send money.
Allspring Global InvestmentsTM is the trade name for the asset management firms of Allspring Global Investments Holdings, LLC, a holding company indirectly owned by certain private funds of GTCR LLC and Reverence Capital Partners, L.P. These firms include but are not limited to Allspring Global Investments, LLC, and Allspring Funds Management, LLC. Certain products managed by Allspring entities are distributed by Allspring Funds Distributor, LLC (a broker-dealer and Member FINRA/SIPC).
This material is for general informational and educational purposes only and is NOT intended to provide investment advice or a recommendation of any kind - including a recommendation for any specific investment, strategy, or plan.
© 2022 Allspring Global Investments Holdings, LLC. All rights reserved.
PAR-1022-00382 11-22
SA247/SAR247 09-22
Semi-Annual Report
September 30, 2022
The views expressed and any forward-looking statements are as of September 30, 2022, unless otherwise noted, and are those of the Fund's portfolio managers and/or Allspring Global Investments. Discussions of individual securities or the markets generally are not intended as individual recommendations. Future events or results may vary significantly from those expressed in any forward-looking statements. The views expressed are subject to change at any time in response to changing circumstances in the market. Allspring Global Investments disclaims any obligation to publicly update or revise any views expressed or forward-looking statements.
Allspring Small Cap Fund | 1
Letter to shareholders (unaudited)
Andrew Owen
President
Allspring Funds
Dear Shareholder:
We are pleased to offer you this semi-annual report for Allspring Small Cap Fund for the six-month period that ended September 30, 2022. Globally, stocks and bonds experienced heightened volatility through the extremely difficult period. Non-U.S. securities fared the worst as the global economy faced multiple challenges and the strength of the U.S. dollar eroded already-poor returns of non-U.S.-dollar-denominated assets. Bonds had historically poor performance, with major fixed income indexes falling substantially for the six-month period.
Earlier tailwinds provided by global stimulus programs, vaccination rollouts, and recovering consumer and corporate sentiment were wiped away by the highest rate of inflation in four decades, the impact of ongoing aggressive central bank rate hikes and the prospect of more, plus the global reverberations of the Russia-Ukraine war. The already-significant global supply chain disruptions were compounded by China’s COVID-19 lockdowns.
For the six-month period, both stocks and bonds registered major losses, with even U.S. bonds suffering deep losses and other assets faring worse. For the period, U.S. stocks, based on the S&P 500 Index,1 lost 20.20%. International stocks, as measured by the MSCI ACWI ex USA Index (Net),2 returned -22.27%, while the MSCI EM Index (Net) (USD)3 declined 21.70%. Among bond indexes, the Bloomberg U.S. Aggregate Bond Index,4 returned -9.22%, the Bloomberg Global Aggregate ex-USD Index (unhedged),5 returned -18.89%, the Bloomberg Municipal Bond Index6 declined 6.30%, and the ICE BofA U.S. High Yield Index7 fell 10.56%.
| 1 | The S&P 500 Index consists of 500 stocks chosen for market size, liquidity, and industry group representation. It is a market-value-weighted index with each stock's weight in the index proportionate to its market value. You cannot invest directly in an index. |
| 2 | The Morgan Stanley Capital International (MSCI) All Country World Index (ACWI) ex USA Index (Net) is a free-float-adjusted market-capitalization-weighted index that is designed to measure the equity market performance of developed and emerging markets, excluding the U.S. Source: MSCI. MSCI makes no express or implied warranties or representations and shall have no liability whatsoever with respect to any MSCI data contained herein. The MSCI data may not be further redistributed or used as a basis for other indexes or any securities or financial products. This report is not approved, reviewed, or produced by MSCI. You cannot invest directly in an index. |
| 3 | The MSCI Emerging Markets (EM) Index (Net) (USD) is a free-float-adjusted market-capitalization-weighted index that is designed to measure equity market performance of emerging markets. You cannot invest directly in an index. |
| 4 | The Bloomberg U.S. Aggregate Bond Index is a broad-based benchmark that measures the investment-grade, U.S.-dollar-denominated, fixed-rate taxable bond market, including Treasuries, government-related and corporate securities, mortgage-backed securities (agency fixed-rate and hybrid adjustable-rate mortgage pass-throughs), asset-backed securities, and commercial mortgage-backed securities. You cannot invest directly in an index. |
| 5 | The Bloomberg Global Aggregate ex-USD Index (unhedged) is an unmanaged index that provides a broad-based measure of the global investment-grade fixed-income markets excluding the U.S.-dollar-denominated debt market. You cannot invest directly in an index. |
| 6 | The Bloomberg Municipal Bond Index is an unmanaged index composed of long-term tax-exempt bonds with a minimum credit rating of Baa. You cannot invest directly in an index. |
| 7 | The ICE BofA U.S. High Yield Index is a market-capitalization-weighted index of domestic and Yankee high-yield bonds. The index tracks the performance of high-yield securities traded in the U.S. bond market. You cannot invest directly in an index. Copyright 2022. ICE Data Indices, LLC. All rights reserved. |
2 | Allspring Small Cap Fund
Letter to shareholders (unaudited)
Rising inflation, COVID, and the Russian invasion of Ukraine drove market performance.
Just before the six-month reporting period began, global financial markets had been rocked by the Russian invasion of Ukraine and resulting spike in volatility. In April, the market misery continued, with broad and deep losses, as both the S&P 500 Index and MSCI ACWI (Net)1 fell 8% or more for the month. The Chinese economy struggled through a strict lockdown as the government tried to contain a major COVID-19 outbreak. The ensuing global ripple effect compounded existing supply shortages. This was exacerbated by the impact of the Russia-Ukraine war on global commodities. Meanwhile, U.S. annual inflation raged at 8.5%, its highest level since 1981, and investors braced themselves for aggressive Federal Reserve (Fed) monetary tightening moves.
Market volatility continued in May, although markets recovered ground late in the month. Value stocks outperformed growth stocks. The concerns that had dominated markets for months continued, including high inflation and geopolitical tensions that added to high crude oil, gasoline, and food prices. In response, the Fed raised the federal funds rate by 0.50%, with widescale expectations of multiple rate hikes to come. Meanwhile, highly contagious COVID-19 variants persisted. However, labor markets in the U.S., the U.K., and Europe remained strong. U.S. retail sales for April, released in May, indicated a fourth consecutive monthly increase, reflecting continued consumer resilience.
A dreadful year in financial markets continued in June with stocks posting further losses en route to their worst first half of a year in 50 years. Bonds didn’t fare much better. Driving the losses were the same factors that have been at play: rising global inflation and fears of recession as central banks increase rates to try to curb inflation, which climbed above 9% in June in the U.S. The Fed raised its short-term rate by another 0.75% in June. Meanwhile, U.S. economic data showed resilience as the U.S. unemployment rate held steady at 3.6% and the housing market was only marginally affected, so far, by sharply higher mortgage rates.
Markets rebounded in July, led by U.S. stocks. While evidence began to point to an economic slowdown after two consecutive quarters of declining gross domestic product (economic contraction), the U.S. labor market remained surprisingly strong: July nonfarm payrolls grew by more than 500,000 and U.S. unemployment dipped to 3.5%. Meanwhile, crude oil and retail gasoline prices, major contributors to recent overall inflation, fell substantially from earlier highs. And while U.S. home prices rose, sales fell as houses became less affordable with mortgage rates at a 13-year high. The Fed raised the federal funds rate another 0.75% in July—to a range of 2.25% to 2.50%—and forecasts pointed to continued rate increases.
August was yet another broadly challenging month for financial markets, with more red ink flowing. High inflation persisted, cresting 9% in the eurozone and remaining above 8% in the U.S. despite the Fed’s aggressive monetary policy and a major drop in global crude oil and gasoline prices from their June peak. One positive note in the U.S. was the resilience of the country’s jobs market. However, the Fed’s job was clearly not complete. One longer-term bright spot was the U.S. Congress’s passage of the Inflation Reduction Act. Its primary stated goals include include to reduce inflation (though not immediately) by curbing the deficit, capping health care spending by seniors, and investing in domestic sources of clean energy.
“ Just before the six-month reporting period began, global financial markets had been rocked by the Russian invasion of Ukraine and resulting spike in volatility. In April, the market misery continued, with broad and deep losses, as both the S&P 500 Index and MSCI ACWI (Net) fell 8% or more for the month.”
| 1 | The MSCI ACWI (Net) is a free-float-adjusted market-capitalization-weighted index that is designed to measure the equity market performance of developed and emerging markets. You cannot invest directly in an index. |
Allspring Small Cap Fund | 3
Letter to shareholders (unaudited)
The market misery continued in September. There was nowhere to hide as all asset classes suffered major losses at the hands of persistent inflation. Central banks kept up their battle against rapidly rising prices with more rate hikes. The strength of the U.S. dollar made things even more difficult for investors holding assets in other currencies. U.S. mortgage rates jumped to near 7% on 30-year fixed-rate mortgages; the decreased housing affordability began to cool demand somewhat. The U.K. experienced a sharp sell-off of government bonds and the British pound in September as investors panicked in response to a new government budget that was seen as financially unsound. The market meltdown forced the Bank of England to step in and buy long-dated government bonds. The drama continued into the next fiscal year.
Don’t let short-term uncertainty derail long-term investment goals.
Periods of investment uncertainty can present challenges, but experience has taught us that maintaining long-term investment goals can be an effective way to plan for the future. To help you create a sound strategy based on your personal goals and risk tolerance, Allspring Funds offers more than 100 mutual funds spanning a wide range of asset classes and investment styles. Although diversification cannot guarantee an investment profit or prevent losses, we believe it can be an effective way to manage investment risk and potentially smooth out overall portfolio performance. We encourage investors to know their investments and to understand that appropriate levels of risk-taking may unlock opportunities.
Thank you for choosing to invest with Allspring Funds. We appreciate your confidence in us and remain committed to helping you meet your financial needs.
Sincerely,
Andrew Owen
President
Allspring Funds
For further information about your fund, contact your investment professional, visit our website at allspringglobal.com, or call us directly at 1-800-222-8222.
4 | Allspring Small Cap Fund
This page is intentionally left blank.
Performance highlights (unaudited)
| Investment objective | The Fund seeks long-term capital appreciation. |
| Manager | Allspring Funds Management, LLC |
| Subadviser | Allspring Global Investments, LLC |
| Portfolio managers | Christopher G. Miller, CFA®‡, Theran Motl, CFA®‡ |
| Average annual total returns (%) as of September 30, 2022 |
| | | Including sales charge | | Excluding sales charge | | Expense ratios1 (%) |
| | Inception date | 1 year | 5 year | 10 year | | 1 year | 5 year | 10 year | | Gross | Net 2 |
| Class A (WFSMX) | 3-31-2008 | -27.94 | 0.13 | 6.68 | | -23.53 | 1.32 | 7.31 | | 1.67 | 1.23 |
| Class C (WSCDX) | 3-31-2008 | -25.11 | 0.55 | 6.68 | | -24.11 | 0.55 | 6.68 | | 2.42 | 1.98 |
| Class R6 (WFSJX)3 | 5-29-2020 | – | – | – | | -23.21 | 1.74 | 7.75 | | 1.24 | 0.80 |
| Administrator Class (WFSDX) | 4-8-2005 | – | – | – | | -23.47 | 1.44 | 7.49 | | 1.59 | 1.15 |
| Institutional Class (WFSSX) | 4-8-2005 | – | – | – | | -23.28 | 1.67 | 7.71 | | 1.34 | 0.90 |
| Russell 2000® Index4 | – | – | – | – | | -23.50 | 3.55 | 8.55 | | – | – |
Figures quoted represent past performance, which is no guarantee of future results, and do not reflect taxes that a shareholder may pay on an investment in a fund. Investment return and principal value of an investment will fluctuate so that an investor’s shares, when redeemed, may be worth more or less than their original cost. Performance shown without sales charges would be lower if sales charges were reflected. Current performance may be lower or higher than the performance data quoted, which assumes the reinvestment of dividends and capital gains. Current month-end performance is available on the Fund’s website, allspringglobal.com.
Index returns do not include transaction costs associated with buying and selling securities, any mutual fund fees or expenses, or any taxes. It is not possible to invest directly in an index.
For Class A shares, the maximum front-end sales charge is 5.75%. For Class C shares, the maximum contingent deferred sales charge is 1.00%. Performance including a contingent deferred sales charge assumes the sales charge for the corresponding time period. Class R6, Administrator Class and Institutional Class shares are sold without a front-end sales charge or contingent deferred sales charge.
| 1 | Reflects the expense ratios as stated in the most recent prospectuses. The expense ratios shown are subject to change and may differ from the annualized expense ratios shown in the financial highlights of this report. |
| 2 | The manager has contractually committed through July 31, 2023, to waive fees and/or reimburse expenses to the extent necessary to cap total annual fund operating expenses after fee waivers at 1.23% for Class A, 1.98% for Class C, 0.80% for Class R6, 1.15% for Administrator Class, and 0.90% for Institutional Class. Brokerage commissions, stamp duty fees, interest, taxes, acquired fund fees and expenses (if any), and extraordinary expenses are excluded from the expense caps. Prior to or after the commitment expiration date, the caps may be increased or the commitment to maintain the caps may be terminated only with the approval of the Board of Trustees. Without these caps, the Fund’s returns would have been lower. The expense ratio paid by an investor is the net expense ratio (the total annual fund operating expenses after fee waivers) as stated in the prospectuses. |
| 3 | Historical performance shown for the Class R6 shares prior to their inception reflects the performance of the Institutional Class shares, and includes the higher expenses applicable to the Institutional Class shares. If these expenses had not been included, returns for the Class R6 shares would be higher. |
| 4 | The Russell 2000® Index measures the performance of the 2,000 smallest companies in the Russell 3000® Index, which represents approximately 8% of the total market capitalization of the Russell 3000® Index. You cannot invest directly in an index. |
Stock values fluctuate in response to the activities of individual companies and general market and economic conditions. Smaller company stocks tend to be more volatile and less liquid than those of larger companies. Certain investment strategies tend to increase the total risk of an investment (relative to the broader market). Consult the Fund’s prospectus for additional information on these and other risks.
| ‡ | CFA® and Chartered Financial Analyst® are trademarks owned by CFA Institute. |
6 | Allspring Small Cap Fund
Performance highlights (unaudited)
| Ten largest holdings (%) as of September 30, 20221 |
| LivaNova plc | 2.31 |
| Ashland Global Holdings Incorporated | 2.25 |
| Atkore Incorporated | 2.24 |
| Masonite International Corporation | 2.22 |
| Stericycle Incorporated | 1.96 |
| Reinsurance Group of America Incorporated | 1.96 |
| Armstrong World Industries Incorporated | 1.86 |
| Integer Holdings Corporation | 1.83 |
| SPX Technologies Incorporated | 1.77 |
| HealthEquity Incorporated | 1.66 |
| 1 | Figures represent the percentage of the Fund's net assets. Holdings are subject to change and may have changed since the date specified. |
| Sector allocation as of September 30, 20221 |
| 1 | Figures represent the percentage of the Fund's long-term investments. Allocations are subject to change and may have changed since the date specified. |
Allspring Small Cap Fund | 7
Fund expenses (unaudited)
As a shareholder of the Fund, you incur two types of costs: (1) transaction costs, including sales charges (loads) on purchase payments and contingent deferred sales charges (if any) on redemptions and (2) ongoing costs, including management fees, distribution (12b-1) and/or shareholder servicing fees, and other Fund expenses. This example is intended to help you understand your ongoing costs (in dollars) of investing in the Fund and to compare these costs with the ongoing costs of investing in other mutual funds.
The example is based on an investment of $1,000 invested at the beginning of the six-month period and held for the entire period from April 1, 2022 to September 30, 2022.
Actual expenses
The “Actual” line of the table below provides information about actual account values and actual expenses. You may use the information in this line, together with the amount you invested, to estimate the expenses that you paid over the period. Simply divide your account value by $1,000 (for example, an $8,600 account value divided by $1,000 = 8.6), then multiply the result by the number in the “Actual” line under the heading entitled “Expenses paid during period” for your applicable class of shares to estimate the expenses you paid on your account during this period.
Hypothetical example for comparison purposes
The “Hypothetical” line of the table below provides information about hypothetical account values and hypothetical expenses based on the Fund’s actual expense ratio and an assumed rate of return of 5% per year before expenses, which is not the Fund’s actual return. The hypothetical account values and expenses may not be used to estimate the actual ending account balance or expenses you paid for the period. You may use this information to compare the ongoing costs of investing in the Fund and other funds. To do so, compare this 5% hypothetical example with the 5% hypothetical examples that appear in the shareholder reports of the other funds.
Please note that the expenses shown in the table are meant to highlight your ongoing costs only and do not reflect any transactional costs, such as sales charges (loads) and contingent deferred sales charges. Therefore, the “Hypothetical” line of the table is useful in comparing ongoing costs only, and will not help you determine the relative total costs of owning different funds. In addition, if these transactional costs were included, your costs would have been higher.
| | Beginning
account value
4-1-2022 | Ending
account value
9-30-2022 | Expenses
paid during
the period1 | Annualized net
expense ratio |
| Class A | | | | |
| Actual | $1,000.00 | $ 800.19 | $ 5.46 | 1.21% |
| Hypothetical (5% return before expenses) | $1,000.00 | $1,019.00 | $ 6.12 | 1.21% |
| Class C | | | | |
| Actual | $1,000.00 | $ 796.92 | $ 8.92 | 1.98% |
| Hypothetical (5% return before expenses) | $1,000.00 | $1,015.14 | $10.00 | 1.98% |
| Class R6 | | | | |
| Actual | $1,000.00 | $ 801.70 | $ 3.61 | 0.80% |
| Hypothetical (5% return before expenses) | $1,000.00 | $1,021.06 | $ 4.05 | 0.80% |
| Administrator Class | | | | |
| Actual | $1,000.00 | $ 800.63 | $ 5.19 | 1.15% |
| Hypothetical (5% return before expenses) | $1,000.00 | $1,019.30 | $ 5.82 | 1.15% |
| Institutional Class | | | | |
| Actual | $1,000.00 | $ 801.59 | $ 4.06 | 0.90% |
| Hypothetical (5% return before expenses) | $1,000.00 | $1,020.56 | $ 4.56 | 0.90% |
1 Expenses paid is equal to the annualized net expense ratio of each class multiplied by the average account value over the period, multiplied by 183 divided by 365 (to reflect the one-half-year period).
8 | Allspring Small Cap Fund
Portfolio of investments—September 30, 2022 (unaudited)
| | | | | Shares | Value |
| Common stocks: 95.71% | | | | | |
| Communication services: 1.68% | | | | | |
| Interactive media & services: 1.68% | | | | | |
| Bumble Incorporated Class A † | | | | 15,537 | $ 333,890 |
| Eventbrite Incorporated Class A † | | | | 49,064 | 298,309 |
| | | | | | 632,199 |
| Consumer discretionary: 8.51% | | | | | |
| Auto components: 1.71% | | | | | |
| Dana Incorporated | | | | 29,034 | 331,859 |
| Gentherm Incorporated † | | | | 6,187 | 307,680 |
| | | | | | 639,539 |
| Diversified consumer services: 1.03% | | | | | |
| Service Corporation International | | | | 6,708 | 387,320 |
| Hotels, restaurants & leisure: 1.61% | | | | | |
| Jack In The Box Incorporated | | | | 2,931 | 217,099 |
| Planet Fitness Incorporated Class A † | | | | 6,730 | 388,052 |
| | | | | | 605,151 |
| Internet & direct marketing retail: 1.28% | | | | | |
| Revolve Group Incorporated † | | | | 19,075 | 413,737 |
| The RealReal Incorporated † | | | | 45,361 | 68,042 |
| | | | | | 481,779 |
| Specialty retail: 2.88% | | | | | |
| Leslie's Incorporated † | | | | 31,221 | 459,261 |
| National Vision Holdings Incorporated † | | | | 19,049 | 621,950 |
| | | | | | 1,081,211 |
| Consumer staples: 5.19% | | | | | |
| Food products: 3.38% | | | | | |
| Nomad Foods Limited † | | | | 36,023 | 511,527 |
| The Simply Good Foods Company † | | | | 15,701 | 502,275 |
| TreeHouse Foods Incorporated † | | | | 6,028 | 255,708 |
| | | | | | 1,269,510 |
| Personal products: 1.81% | | | | | |
| e.l.f. Beauty Incorporated † | | | | 10,833 | 407,537 |
| The Honest Company Incorporated † | | | | 77,510 | 271,285 |
| | | | | | 678,822 |
| Financials: 12.93% | | | | | |
| Banks: 6.93% | | | | | |
| Ameris Bancorp | | | | 10,222 | 457,026 |
| Pinnacle Financial Partners Incorporated | | | | 6,376 | 517,094 |
| United Community Bank | | | | 10,977 | 363,339 |
| Veritex Holdings Incorporated | | | | 14,991 | 398,611 |
The accompanying notes are an integral part of these financial statements.
Allspring Small Cap Fund | 9
Portfolio of investments—September 30, 2022 (unaudited)
| | | | | Shares | Value |
| Banks (continued) | | | | | |
| Webster Financial Corporation | | | | 13,678 | $ 618,246 |
| Wintrust Financial Corporation | | | | 3,057 | 249,298 |
| | | | | | 2,603,614 |
| Capital markets: 0.90% | | | | | |
| Raymond James Financial Incorporated | | | | 3,425 | 338,459 |
| Insurance: 3.46% | | | | | |
| Axis Capital Holdings Limited | | | | 11,480 | 564,242 |
| Reinsurance Group of America Incorporated | | | | 5,846 | 735,485 |
| | | | | | 1,299,727 |
| Thrifts & mortgage finance: 1.64% | | | | | |
| Essent Group Limited | | | | 17,668 | 616,083 |
| Health care: 20.04% | | | | | |
| Biotechnology: 2.83% | | | | | |
| Agios Pharmaceuticals Incorporated † | | | | 8,219 | 232,433 |
| Atara Biotherapeutics Incorporated † | | | | 9,820 | 37,120 |
| Coherus Biosciences Incorporated † | | | | 8,994 | 86,432 |
| Insmed Incorporated † | | | | 11,453 | 246,698 |
| Mirati Therapeutics Incorporated † | | | | 790 | 55,174 |
| Neurocrine Biosciences Incorporated † | | | | 1,686 | 179,070 |
| Sage Therapeutics Incorporated † | | | | 3,717 | 145,558 |
| Zymeworks Incorporated † | | | | 12,980 | 79,827 |
| | | | | | 1,062,312 |
| Health care equipment & supplies: 11.49% | | | | | |
| AngioDynamics Incorporated † | | | | 26,958 | 551,561 |
| Cardiovascular Systems Incorporated † | | | | 26,357 | 365,308 |
| Haemonetics Corporation † | | | | 7,633 | 565,071 |
| Integer Holdings Corporation † | | | | 11,036 | 686,770 |
| LivaNova plc † | | | | 17,123 | 869,333 |
| Neuronetics Incorporated † | | | | 76,793 | 244,202 |
| Teleflex Incorporated | | | | 2,391 | 481,691 |
| ViewRay Incorporated † | | | | 151,414 | 551,147 |
| | | | | | 4,315,083 |
| Health care providers & services: 1.66% | | | | | |
| HealthEquity Incorporated † | | | | 9,306 | 625,084 |
| Health care technology: 0.60% | | | | | |
| Schrodinger Incorporated † | | | | 8,957 | 223,746 |
| Life sciences tools & services: 3.46% | | | | | |
| Azenta Incorporated | | | | 11,133 | 477,160 |
| Bruker Corporation | | | | 10,687 | 567,052 |
| Codexis Incorporated † | | | | 24,647 | 149,361 |
| Sotera Health Company † | | | | 15,400 | 105,028 |
| | | | | | 1,298,601 |
| Industrials: 18.65% | | | | | |
| Building products: 5.84% | | | | | |
| Armstrong World Industries Incorporated | | | | 8,805 | 697,620 |
| Masonite International Corporation † | | | | 11,708 | 834,663 |
The accompanying notes are an integral part of these financial statements.
10 | Allspring Small Cap Fund
Portfolio of investments—September 30, 2022 (unaudited)
| | | | | Shares | Value |
| Building products (continued) | | | | | |
| Tecnoglass Incorporated « | | | | 13,611 | $ 285,695 |
| The AZEK Company Incorporated † | | | | 22,558 | 374,914 |
| | | | | | 2,192,892 |
| Commercial services & supplies: 2.81% | | | | | |
| Steelcase Incorporated Class A | | | | 48,614 | 316,963 |
| Stericycle Incorporated † | | | | 17,513 | 737,472 |
| | | | | | 1,054,435 |
| Construction & engineering: 1.36% | | | | | |
| APi Group Corporation † | | | | 38,584 | 512,009 |
| Electrical equipment: 3.33% | | | | | |
| Atkore Incorporated † | | | | 10,801 | 840,426 |
| Regal Rexnord Corporation | | | | 2,933 | 411,676 |
| | | | | | 1,252,102 |
| Machinery: 1.77% | | | | | |
| SPX Technologies Incorporated † | | | | 12,042 | 664,959 |
| Road & rail: 1.05% | | | | | |
| Ryder System Incorporated | | | | 5,224 | 394,360 |
| Trading companies & distributors: 2.49% | | | | | |
| Air Lease Corporation | | | | 18,537 | 574,832 |
| Herc Holdings Incorporated | | | | 3,454 | 358,802 |
| | | | | | 933,634 |
| Information technology: 13.71% | | | | | |
| Communications equipment: 0.41% | | | | | |
| Infinera Corporation † | | | | 31,630 | 153,089 |
| Electronic equipment, instruments & components: 1.49% | | | | | |
| Littelfuse Incorporated | | | | 2,821 | 560,504 |
| IT services: 1.57% | | | | | |
| WNS Holdings Limited ADR † | | | | 7,206 | 589,739 |
| Semiconductors & semiconductor equipment: 1.17% | | | | | |
| Macom Technology Solutions Holdings Incorporated † | | | | 8,473 | 438,817 |
| Software: 9.07% | | | | | |
| 8x8 Incorporated † | | | | 24,642 | 85,015 |
| Benefitfocus Incorporated † | | | | 24,120 | 153,162 |
| CommVault Systems Incorporated † | | | | 8,565 | 454,288 |
| Instructure Holdings Incorporated †« | | | | 26,498 | 590,375 |
| New Relic Incorporated † | | | | 5,268 | 302,278 |
| Pagerduty Incorporated † | | | | 23,250 | 536,378 |
| Q2 Holdings Incorporated † | | | | 11,793 | 379,735 |
| Riskified Limited Class A †« | | | | 14,558 | 57,359 |
| SPS Commerce Incorporated † | | | | 3,709 | 460,769 |
| WalkMe Limited †« | | | | 45,824 | 389,504 |
| | | | | | 3,408,863 |
The accompanying notes are an integral part of these financial statements.
Allspring Small Cap Fund | 11
Portfolio of investments—September 30, 2022 (unaudited)
| | | | | Shares | Value |
| Materials: 9.84% | | | | | |
| Chemicals: 6.65% | | | | | |
| Ashland Global Holdings Incorporated | | | | 8,917 | $ 846,847 |
| Olin Corporation | | | | 13,621 | 584,068 |
| Quaker Chemical Corporation | | | | 3,990 | 576,076 |
| Westlake Chemical Corporation | | | | 5,621 | 488,352 |
| | | | | | 2,495,343 |
| Containers & packaging: 1.55% | | | | | |
| Silgan Holdings Incorporated | | | | 13,879 | 583,473 |
| Metals & mining: 1.64% | | | | | |
| Reliance Steel & Aluminum Company | | | | 3,535 | 616,539 |
| Real estate: 5.16% | | | | | |
| Equity REITs: 5.16% | | | | | |
| American Homes 4 Rent Class A | | | | 18,583 | 609,708 |
| Apartment Income REIT Corporation | | | | 11,954 | 461,663 |
| Four Corners Property Trust Incorporated | | | | 17,609 | 425,962 |
| Terreno Realty Corporation | | | | 8,287 | 439,128 |
| | | | | | 1,936,461 |
| Total Common stocks (Cost $39,117,401) | | | | | 35,945,459 |
| | | | | | |
| Investment companies: 1.34% | | | | | |
| Exchange-traded funds: 1.34% | | | | | |
| SPDR S&P Biotech ETF « | | | | 6,334 | 502,413 |
| Total Investment companies (Cost $834,809) | | | | | 502,413 |
| | | Yield | | | |
| Short-term investments: 7.78% | | | | | |
| Investment companies: 7.78% | | | | | |
| Allspring Government Money Market Fund Select Class ♠∞ | | 2.75% | | 1,389,201 | 1,389,201 |
| Securities Lending Cash Investments LLC ♠∩∞ | | 3.08 | | 1,533,775 | 1,533,775 |
| Total Short-term investments (Cost $2,922,976) | | | | | 2,922,976 |
| Total investments in securities (Cost $42,875,186) | 104.83% | | | | 39,370,848 |
| Other assets and liabilities, net | (4.83) | | | | (1,812,392) |
| Total net assets | 100.00% | | | | $37,558,456 |
| † | Non-income-earning security |
| « | All or a portion of this security is on loan. |
| ♠ | The issuer of the security is an affiliated person of the Fund as defined in the Investment Company Act of 1940. |
| ∩ | The investment is a non-registered investment company purchased with cash collateral received from securities on loan. |
| ∞ | The rate represents the 7-day annualized yield at period end. |
| Abbreviations: |
| ADR | American depositary receipt |
| REIT | Real estate investment trust |
The accompanying notes are an integral part of these financial statements.
12 | Allspring Small Cap Fund
Portfolio of investments—September 30, 2022 (unaudited)
Investments in affiliates
An affiliated investment is an investment in which the Fund owns at least 5% of the outstanding voting shares of the issuer or as a result of other relationships, such as the Fund and the issuer having the same investment manager. Transactions with issuers that were affiliates of the Fund at the end of the period were as follows:
| | Value,
beginning of
period | Purchases | Sales
proceeds | Net
realized
gains
(losses) | | Net
change in
unrealized
gains
(losses) | | Value,
end of
period | Shares,
end
of period | Income
from
affiliated
securities |
| Short-term investments | | | | | | | | | |
| Allspring Government Money Market Fund Select Class | $ 594,684 | $4,846,113 | $(4,051,596) | $0 | | $0 | | $ 1,389,201 | 1,389,201 | $ 5,954 |
| Securities Lending Cash Investments LLC | 1,552,990 | 6,160,465 | (6,179,680) | 0 | | 0 | | 1,533,775 | 1,533,775 | 14,123 # |
| | | | | $0 | | $0 | | $2,922,976 | | $20,077 |
| # | Amount shown represents income before fees and rebates. |
The accompanying notes are an integral part of these financial statements.
Allspring Small Cap Fund | 13
Statement of assets and liabilities—September 30, 2022 (unaudited)
| | |
| Assets | |
Investments in unaffiliated securities (including $1,494,049 of securities loaned), at value (cost $39,952,210)
| $ 36,447,872 |
Investments in affiliated securities, at value (cost $2,922,976)
| 2,922,976 |
Receivable for investments sold
| 453,310 |
Receivable for dividends
| 27,702 |
Receivable for Fund shares sold
| 22,357 |
Receivable for securities lending income, net
| 746 |
Prepaid expenses and other assets
| 80,099 |
Total assets
| 39,955,062 |
| Liabilities | |
Payable upon receipt of securities loaned
| 1,533,775 |
Payable for investments purchased
| 771,482 |
Payable for Fund shares redeemed
| 27,393 |
Management fee payable
| 11,152 |
Administration fees payable
| 6,855 |
Trustees’ fees and expenses payable
| 3,342 |
Distribution fee payable
| 22 |
Accrued expenses and other liabilities
| 42,585 |
Total liabilities
| 2,396,606 |
Total net assets
| $37,558,456 |
| Net assets consist of | |
Paid-in capital
| $ 34,937,446 |
Total distributable earnings
| 2,621,010 |
Total net assets
| $37,558,456 |
| Computation of net asset value and offering price per share | |
Net assets – Class A
| $ 31,984,026 |
Shares outstanding – Class A1
| 1,288,149 |
Net asset value per share – Class A
| $24.83 |
Maximum offering price per share – Class A2
| $26.34 |
Net assets – Class C
| $ 29,983 |
Shares outstanding – Class C1
| 1,382 |
Net asset value per share – Class C
| $21.70 |
Net assets – Class R6
| $ 813,293 |
Shares outstanding – Class R61
| 30,855 |
Net asset value per share – Class R6
| $26.36 |
Net assets – Administrator Class
| $ 325,293 |
Shares outstanding – Administrator Class1
| 12,721 |
Net asset value per share – Administrator Class
| $25.57 |
Net assets – Institutional Class
| $ 4,405,861 |
Shares outstanding – Institutional Class1
| 168,334 |
Net asset value per share – Institutional Class
| $26.17 |
| 1 | The Fund has an unlimited number of authorized shares. |
| 2 | Maximum offering price is computed as 100/94.25 of net asset value. On investments of $50,000 or more, the offering price is reduced. |
The accompanying notes are an integral part of these financial statements.
14 | Allspring Small Cap Fund
Statement of operations—six months ended September 30, 2022 (unaudited)
| | |
| Investment income | |
Dividends
| $ 183,045 |
Income from affiliated securities
| 10,752 |
Total investment income
| 193,797 |
| Expenses | |
Management fee
| 183,814 |
| Administration fees | |
Class A
| 38,867 |
Class C
| 45 |
Class R6
| 142 |
Administrator Class
| 195 |
Institutional Class
| 3,215 |
| Shareholder servicing fees | |
Class A
| 46,270 |
Class C
| 53 |
Administrator Class
| 373 |
| Distribution fee | |
Class C
| 159 |
Custody and accounting fees
| 7,976 |
Professional fees
| 24,210 |
Registration fees
| 27,814 |
Shareholder report expenses
| 19,507 |
Trustees’ fees and expenses
| 11,176 |
Other fees and expenses
| 2,030 |
Total expenses
| 365,846 |
| Less: Fee waivers and/or expense reimbursements | |
Fund-level
| (104,067) |
Class A
| (10,180) |
Class C
| (1) |
Class R6
| (32) |
Administrator Class
| (11) |
Institutional Class
| (196) |
Net expenses
| 251,359 |
Net investment loss
| (57,562) |
| Realized and unrealized gains (losses) on investments | |
Net realized gains on investments
| 9,807 |
Net change in unrealized gains (losses) on investments
| (9,536,160) |
Net realized and unrealized gains (losses) on investments
| (9,526,353) |
Net decrease in net assets resulting from operations
| $(9,583,915) |
The accompanying notes are an integral part of these financial statements.
Allspring Small Cap Fund | 15
Statement of changes in net assets
| | | | | |
| | Six months ended
September 30, 2022
(unaudited) | Year ended
March 31, 2022 |
| Operations | | | | |
Net investment loss
| | $ (57,562) | | $ (273,654) |
Net realized gains on investments
| | 9,807 | | 8,162,825 |
Net change in unrealized gains (losses) on investments
| | (9,536,160) | | (7,318,854) |
Net increase (decrease) in net assets resulting from operations
| | (9,583,915) | | 570,317 |
| Distributions to shareholders from | | | | |
| Net investment income and net realized gains | | | | |
Class A
| | 0 | | (8,202,400) |
Class C
| | 0 | | (13,229) |
Class R6
| | 0 | | (166,835) |
Administrator Class
| | 0 | | (76,156) |
Institutional Class
| | 0 | | (1,065,163) |
Total distributions to shareholders
| | 0 | | (9,523,783) |
| Capital share transactions | Shares | | Shares | |
| Proceeds from shares sold | | | | |
Class A
| 15,669 | 425,047 | 63,622 | 2,219,863 |
Class C
| 0 | 0 | 2,679 | 92,317 |
Class R6
| 5,650 | 159,678 | 7,280 | 281,475 |
Administrator Class
| 2,720 | 71,140 | 2,330 | 86,569 |
Institutional Class
| 6,744 | 204,414 | 8,764 | 343,421 |
| | | 860,279 | | 3,023,645 |
| Reinvestment of distributions | | | | |
Class A
| 0 | 0 | 241,326 | 7,944,449 |
Class C
| 0 | 0 | 457 | 13,229 |
Class R6
| 0 | 0 | 4,790 | 166,835 |
Administrator Class
| 0 | 0 | 1,824 | 61,820 |
Institutional Class
| 0 | 0 | 28,785 | 996,275 |
| | | 0 | | 9,182,608 |
| Payment for shares redeemed | | | | |
Class A
| (104,416) | (2,963,321) | (161,278) | (5,903,305) |
Class C
| (826) | (20,264) | (4,193) | (145,645) |
Class R6
| (4,271) | (124,500) | (6,311) | (255,377) |
Administrator Class
| (280) | (7,807) | (5,921) | (211,605) |
Institutional Class
| (6,666) | (187,425) | (210,359) | (8,645,948) |
| | | (3,303,317) | | (15,161,880) |
Net decrease in net assets resulting from capital share transactions
| | (2,443,038) | | (2,955,627) |
Total decrease in net assets
| | (12,026,953) | | (11,909,093) |
| Net assets | | | | |
Beginning of period
| | 49,585,409 | | 61,494,502 |
End of period
| | $ 37,558,456 | | $ 49,585,409 |
The accompanying notes are an integral part of these financial statements.
16 | Allspring Small Cap Fund
Financial highlights
(For a share outstanding throughout each period)
| | | Year ended March 31 |
| Class A | Six months ended
September 30, 2022
(unaudited) | 2022 | 2021 | 2020 | 2019 | 2018 |
Net asset value, beginning of period
| $31.03 | $37.77 | $19.77 | $30.27 | $31.46 | $28.92 |
Net investment income (loss)
| (0.04) 1 | (0.20) 1 | (0.07) 1 | 0.02 1 | (0.04) 1 | (0.08) 1 |
Net realized and unrealized gains (losses) on investments
| (6.16) | 0.52 | 18.10 | (8.43) | (1.15) | 2.62 |
Total from investment operations
| (6.20) | 0.32 | 18.03 | (8.41) | (1.19) | 2.54 |
| Distributions to shareholders from | | | | | | |
Net investment income
| 0.00 | 0.00 | (0.03) | 0.00 | 0.00 | 0.00 |
Net realized gains
| 0.00 | (7.06) | 0.00 | (2.09) | 0.00 | 0.00 |
Total distributions to shareholders
| 0.00 | (7.06) | (0.03) | (2.09) | 0.00 | 0.00 |
Net asset value, end of period
| $24.83 | $31.03 | $37.77 | $19.77 | $30.27 | $31.46 |
Total return2
| (19.98)% | (0.22)% | 91.20% | (30.24)% | (3.78)% | 8.78% |
| Ratios to average net assets (annualized) | | | | | | |
Gross expenses
| 1.74% | 1.67% | 1.68% | 1.60% | 1.54% | 1.54% |
Net expenses
| 1.21% | 1.21% | 1.32% | 1.33% | 1.35% | 1.35% |
Net investment income (loss)
| (0.31)% | (0.54)% | (0.24)% | 0.05% | (0.11)% | (0.26)% |
| Supplemental data | | | | | | |
Portfolio turnover rate
| 12% | 37% | 55% | 41% | 34% | 27% |
Net assets, end of period (000s omitted)
| $31,984 | $42,732 | $46,580 | $27,115 | $44,028 | $50,993 |
| 1 | Calculated based upon average shares outstanding |
| 2 | Total return calculations do not include any sales charges. Returns for periods of less than one year are not annualized. |
The accompanying notes are an integral part of these financial statements.
Allspring Small Cap Fund | 17
Financial highlights
(For a share outstanding throughout each period)
| | | Year ended March 31 |
| Class C | Six months ended
September 30, 2022
(unaudited) | 2022 | 2021 | 2020 | 2019 | 2018 |
Net asset value, beginning of period
| $27.22 | $34.21 | $18.03 | $27.98 | $29.30 | $27.14 |
Net investment loss
| (0.13) 1 | (0.43) 1 | (0.23) 1 | (0.20) 1 | (0.25) 1 | (0.28) 1 |
Net realized and unrealized gains (losses) on investments
| (5.39) | 0.50 | 16.41 | (7.66) | (1.07) | 2.44 |
Total from investment operations
| (5.52) | 0.07 | 16.18 | (7.86) | (1.32) | 2.16 |
| Distributions to shareholders from | | | | | | |
Net realized gains
| 0.00 | (7.06) | 0.00 | (2.09) | 0.00 | 0.00 |
Net asset value, end of period
| $21.70 | $27.22 | $34.21 | $18.03 | $27.98 | $29.30 |
Total return2
| (20.31)% | (1.02)% | 89.74% | (30.76)% | (4.51)% | 7.96% |
| Ratios to average net assets (annualized) | | | | | | |
Gross expenses
| 2.49% | 2.40% | 2.44% | 2.34% | 2.29% | 2.29% |
Net expenses
| 1.98% | 1.98% | 2.09% | 2.10% | 2.10% | 2.10% |
Net investment loss
| (1.09)% | (1.27)% | (0.94)% | (0.73)% | (0.85)% | (1.02)% |
| Supplemental data | | | | | | |
Portfolio turnover rate
| 12% | 37% | 55% | 41% | 34% | 27% |
Net assets, end of period (000s omitted)
| $30 | $60 | $112 | $190 | $526 | $840 |
| 1 | Calculated based upon average shares outstanding |
| 2 | Total return calculations do not include any sales charges. Returns for periods of less than one year are not annualized. |
The accompanying notes are an integral part of these financial statements.
18 | Allspring Small Cap Fund
Financial highlights
(For a share outstanding throughout each period)
| | | Year ended March 31 |
| Class R6 | Six months ended
September 30, 2022
(unaudited) | 2022 | 2021 1 |
Net asset value, beginning of period
| $32.88 | $39.46 | $25.43 |
Net investment income (loss)
| 0.02 2 | (0.05) 2 | 0.03 2 |
Net realized and unrealized gains (losses) on investments
| (6.54) | 0.53 | 14.09 |
Total from investment operations
| (6.52) | 0.48 | 14.12 |
| Distributions to shareholders from | | | |
Net investment income
| 0.00 | 0.00 | (0.09) |
Net realized gains
| 0.00 | (7.06) | 0.00 |
Total distributions to shareholders
| 0.00 | (7.06) | (0.09) |
Net asset value, end of period
| $26.36 | $32.88 | $39.46 |
Total return3
| (19.83)% | 0.23% | 55.58% |
| Ratios to average net assets (annualized) | | | |
Gross expenses
| 1.31% | 1.24% | 1.23% |
Net expenses
| 0.80% | 0.80% | 0.88% |
Net investment income (loss)
| 0.10% | (0.13)% | 0.09% |
| Supplemental data | | | |
Portfolio turnover rate
| 12% | 37% | 55% |
Net assets, end of period (000s omitted)
| $813 | $969 | $936 |
| 1 | For the period from May 29, 2020 (commencement of class operations) to March 31, 2021 |
| 2 | Calculated based upon average shares outstanding |
| 3 | Returns for periods of less than one year are not annualized. |
The accompanying notes are an integral part of these financial statements.
Allspring Small Cap Fund | 19
Financial highlights
(For a share outstanding throughout each period)
| | | Year ended March 31 |
| Administrator Class | Six months ended
September 30, 2022
(unaudited) | 2022 | 2021 | 2020 | 2019 | 2018 |
Net asset value, beginning of period
| $31.95 | $38.67 | $20.23 | $30.89 | $32.06 | $29.43 |
Net investment income (loss)
| (0.03) 1 | (0.17) 1 | (0.01) 1 | 0.05 1 | 0.01 1 | (0.03) 1 |
Net realized and unrealized gains (losses) on investments
| (6.35) | 0.51 | 18.51 | (8.62) | (1.18) | 2.66 |
Total from investment operations
| (6.38) | 0.34 | 18.50 | (8.57) | (1.17) | 2.63 |
| Distributions to shareholders from | | | | | | |
Net investment income
| 0.00 | 0.00 | (0.06) | 0.00 | 0.00 | 0.00 |
Net realized gains
| 0.00 | (7.06) | 0.00 | (2.09) | 0.00 | 0.00 |
Total distributions to shareholders
| 0.00 | (7.06) | (0.06) | (2.09) | 0.00 | 0.00 |
Net asset value, end of period
| $25.57 | $31.95 | $38.67 | $20.23 | $30.89 | $32.06 |
Total return2
| (19.94)% | (0.16)% | 91.48% | (30.15)% | (3.65)% | 8.94% |
| Ratios to average net assets (annualized) | | | | | | |
Gross expenses
| 1.66% | 1.59% | 1.61% | 1.51% | 1.46% | 1.46% |
Net expenses
| 1.15% | 1.15% | 1.20% | 1.20% | 1.20% | 1.20% |
Net investment income (loss)
| (0.23)% | (0.46)% | (0.02)% | 0.17% | 0.05% | (0.10)% |
| Supplemental data | | | | | | |
Portfolio turnover rate
| 12% | 37% | 55% | 41% | 34% | 27% |
Net assets, end of period (000s omitted)
| $325 | $329 | $466 | $450 | $1,165 | $1,347 |
| 1 | Calculated based upon average shares outstanding |
| 2 | Returns for periods of less than one year are not annualized. |
The accompanying notes are an integral part of these financial statements.
20 | Allspring Small Cap Fund
Financial highlights
(For a share outstanding throughout each period)
| | | Year ended March 31 |
| Institutional Class | Six months ended
September 30, 2022
(unaudited) | 2022 | 2021 | 2020 | 2019 | 2018 |
Net asset value, beginning of period
| $32.66 | $39.29 | $20.58 | $31.33 | $32.45 | $29.73 |
Net investment income (loss)
| (0.00) 1,2 | (0.11) 1 | 0.02 1 | 0.12 1 | 0.08 1 | 0.03 1 |
Net realized and unrealized gains (losses) on investments
| (6.49) | 0.54 | 18.87 | (8.78) | (1.20) | 2.69 |
Total from investment operations
| (6.49) | 0.43 | 18.89 | (8.66) | (1.12) | 2.72 |
| Distributions to shareholders from | | | | | | |
Net investment income
| 0.00 | 0.00 | (0.18) | (0.00) 3 | 0.00 | 0.00 |
Net realized gains
| 0.00 | (7.06) | 0.00 | (2.09) | 0.00 | 0.00 |
Total distributions to shareholders
| 0.00 | (7.06) | (0.18) | (2.09) | 0.00 | 0.00 |
Net asset value, end of period
| $26.17 | $32.66 | $39.29 | $20.58 | $31.33 | $32.45 |
Total return4
| (19.84)% | 0.09% | 91.87% | (30.00)% | (3.45)% | 9.15% |
| Ratios to average net assets (annualized) | | | | | | |
Gross expenses
| 1.41% | 1.33% | 1.35% | 1.27% | 1.21% | 1.21% |
Net expenses
| 0.90% | 0.90% | 0.98% | 1.00% | 1.00% | 1.00% |
Net investment income (loss)
| (0.00) % | (0.28)% | 0.08% | 0.38% | 0.24% | 0.08% |
| Supplemental data | | | | | | |
Portfolio turnover rate
| 12% | 37% | 55% | 41% | 34% | 27% |
Net assets, end of period (000s omitted)
| $4,406 | $5,496 | $13,401 | $11,305 | $21,398 | $28,032 |
| 1 | Calculated based upon average shares outstanding |
| 2 | Amount is more than $(0.005) |
| 3 | Amount is less than $0.005. |
| 4 | Returns for periods of less than one year are not annualized. |
The accompanying notes are an integral part of these financial statements.
Allspring Small Cap Fund | 21
Notes to financial statements (unaudited)
1. ORGANIZATION
Allspring Funds Trust (the "Trust"), a Delaware statutory trust organized on March 10, 1999, is an open-end management investment company registered under the Investment Company Act of 1940, as amended (the "1940 Act"). As an investment company, the Trust follows the accounting and reporting guidance in Financial Accounting Standards Board ("FASB") Accounting Standards Codification Topic 946, Financial Services – Investment Companies. These financial statements report on the Allspring Small Cap Fund (the "Fund") which is a diversified series of the Trust.
2. SIGNIFICANT ACCOUNTING POLICIES
The following significant accounting policies, which are consistently followed in the preparation of the financial statements of the Fund, are in conformity with U.S. generally accepted accounting principles which require management to make estimates and assumptions that affect the reported amounts of assets and liabilities, disclosure of contingent assets and liabilities at the date of the financial statements, and the reported amounts of income and expenses during the reporting period. Actual results could differ from those estimates.
Securities valuation
All investments are valued each business day as of the close of regular trading on the New York Stock Exchange (generally 4 p.m. Eastern Time), although the Fund may deviate from this calculation time under unusual or unexpected circumstances.
Equity securities that are listed on a foreign or domestic exchange or market are valued at the official closing price or, if none, the last sales price.
Investments in registered open-end investment companies are valued at net asset value. Interests in non-registered investment companies that are redeemable at net asset value are fair valued normally at net asset value.
Investments which are not valued using the methods discussed above are valued at their fair value, as determined in good faith by Allspring Funds Management, LLC ("Allspring Funds Management"), which was named the valuation designee by the Board of Trustees. As the valuation designee, Allspring Funds Management is responsible for day-to-day valuation activities for the Allspring Funds. In connection with these responsibilities, Allspring Funds Management has established a Valuation Committee and has delegated to it the authority to take any actions regarding the valuation of portfolio securities that the Valuation Committee deems necessary or appropriate, including determining the fair value of portfolio securities. On a quarterly basis, the Board of Trustees receives reports of valuation actions taken by the Valuation Committee. On at least an annual basis, the Board of Trustees receives an assessment of the adequacy and effectiveness of Allspring Funds Management's process for determining the fair value of the portfolio of investments.
Securities lending
The Fund may lend its securities from time to time in order to earn additional income in the form of fees or interest on securities received as collateral or the investment of any cash received as collateral. When securities are on loan, the Fund receives interest or dividends on those securities. Cash collateral received in connection with its securities lending transactions is invested in Securities Lending Cash Investments, LLC (the "Securities Lending Fund"), an affiliated non-registered investment company. Investments in Securities Lending Fund are valued at the evaluated bid price provided by an independent pricing service. Income earned from investment in the Securities Lending Fund (net of fees and rebates), if any, is included in income from affiliated securities on the Statement of Operations.
In a securities lending transaction, the net asset value of the Fund is affected by an increase or decrease in the value of the securities loaned and by an increase or decrease in the value of the instrument in which collateral is invested. The amount of securities lending activity undertaken by the Fund fluctuates from time to time. The Fund has the right under the lending agreement to recover the securities from the borrower on demand. In the event of default or bankruptcy by the borrower, the Fund may be prevented from recovering the loaned securities or gaining access to the collateral or may experience delays or costs in doing so. In such an event, the terms of the agreement allow the unaffiliated securities lending agent to use the collateral to purchase replacement securities on behalf of the Fund or pay the Fund the market value of the loaned securities. The Fund bears the risk of loss with respect to depreciation of its investment of the cash collateral.
Security transactions and income recognition
Securities transactions are recorded on a trade date basis. Realized gains or losses are recorded on the basis of identified cost.
Dividend income is recognized on the ex-dividend date.
Income dividends and capital gain distributions from investment companies are recorded on the ex-dividend date. Capital gain distributions from investment companies are treated as realized gains.
22 | Allspring Small Cap Fund
Notes to financial statements (unaudited)
Distributions to shareholders
Distributions to shareholders from net investment income and any net realized gains are recorded on the ex-dividend date and paid at least annually. Such distributions are determined in accordance with income tax regulations and may differ from U.S. generally accepted accounting principles. Dividend sources are estimated at the time of declaration. The tax character of distributions is determined as of the Fund's fiscal year end. Therefore, a portion of the Fund's distributions made prior to the Fund’s fiscal year end may be categorized as a tax return of capital at year end.
Federal and other taxes
The Fund intends to continue to qualify as a regulated investment company by distributing substantially all of its investment company taxable income and any net realized capital gains (after reduction for capital loss carryforwards) sufficient to relieve it from all, or substantially all, federal income taxes. Accordingly, no provision for federal income taxes was required.
The Fund’s income and federal excise tax returns and all financial records supporting those returns for the prior three fiscal years are subject to examination by the federal and Delaware revenue authorities. Management has analyzed the Fund's tax positions taken on federal, state, and foreign tax returns, as applicable, for all open tax years and does not believe that there are any uncertain tax positions that require recognition of a tax liability.
As of September 30, 2022, the aggregate cost of all investments for federal income tax purposes was $42,861,556 and the unrealized gains (losses) consisted of:
| Gross unrealized gains | $ 5,438,820 |
| Gross unrealized losses | (8,929,528) |
| Net unrealized losses | $(3,490,708) |
Class allocations
The separate classes of shares offered by the Fund differ principally in applicable sales charges, distribution, shareholder servicing, and administration fees. Class specific expenses are charged directly to that share class. Investment income, common fund-level expenses, and realized and unrealized gains (losses) on investments are allocated daily to each class of shares based on the relative proportion of net assets of each class.
3. FAIR VALUATION MEASUREMENTS
Fair value measurements of investments are determined within a framework that has established a fair value hierarchy based upon the various data inputs utilized in determining the value of the Fund’s investments. The three-level hierarchy gives the highest priority to unadjusted quoted prices in active markets for identical assets or liabilities (Level 1) and the lowest priority to unobservable inputs (Level 3). The Fund’s investments are classified within the fair value hierarchy based on the lowest level of input that is significant to the fair value measurement. The inputs are summarized into three broad levels as follows:
| ■ | Level 1 – quoted prices in active markets for identical securities |
| ■ | Level 2 – other significant observable inputs (including quoted prices for similar securities, interest rates, prepayment speeds, credit risk, etc.) |
| ■ | Level 3 – significant unobservable inputs (including the Fund’s own assumptions in determining the fair value of investments) |
The inputs or methodologies used for valuing investments in securities are not necessarily an indication of the risk associated with investing in those securities.
Allspring Small Cap Fund | 23
Notes to financial statements (unaudited)
The following is a summary of the inputs used in valuing the Fund’s assets and liabilities as of September 30, 2022:
| | Quoted prices
(Level 1) | Other significant
observable inputs
(Level 2) | Significant
unobservable inputs
(Level 3) | Total |
| Assets | | | | |
| Investments in: | | | | |
| Common stocks | | | | |
| Communication services | $ 632,199 | $0 | $0 | $ 632,199 |
| Consumer discretionary | 3,195,000 | 0 | 0 | 3,195,000 |
| Consumer staples | 1,948,332 | 0 | 0 | 1,948,332 |
| Financials | 4,857,883 | 0 | 0 | 4,857,883 |
| Health care | 7,524,826 | 0 | 0 | 7,524,826 |
| Industrials | 7,004,391 | 0 | 0 | 7,004,391 |
| Information technology | 5,151,012 | 0 | 0 | 5,151,012 |
| Materials | 3,695,355 | 0 | 0 | 3,695,355 |
| Real estate | 1,936,461 | 0 | 0 | 1,936,461 |
| Investment companies | 502,413 | 0 | 0 | 502,413 |
| Short-term investments | | | | |
| Investment companies | 2,922,976 | 0 | 0 | 2,922,976 |
| Total assets | $39,370,848 | $0 | $0 | $39,370,848 |
Additional sector, industry or geographic detail, if any, is included in the Portfolio of Investments.
For the six months ended September 30, 2022, the Fund did not have any transfers into/out of Level 3.
4. TRANSACTIONS WITH AFFILIATES
Management fee
Allspring Funds Management, a wholly owned subsidiary of Allspring Global Investments Holdings, LLC, a holding company indirectly owned by certain private funds of GTCR LLC and Reverence Capital Partners, L.P., is the manager of the Fund and provides advisory and fund-level administrative services under an investment management agreement. Under the investment management agreement, Allspring Funds Management is responsible for, among other services, implementing the investment objectives and strategies of the Fund, supervising the subadviser and providing fund-level administrative services in connection with the Fund’s operations. As compensation for its services under the investment management agreement, Allspring Funds Management is entitled to receive a management fee at the following annual rate based on the Fund’s average daily net assets:
| Average daily net assets | Management fee |
| First $500 million | 0.850% |
| Next $500 million | 0.825 |
| Next $1 billion | 0.800 |
| Next $1 billion | 0.775 |
| Next $1 billion | 0.750 |
| Next $1 billion | 0.730 |
| Next $5 billion | 0.720 |
| Over $10 billion | 0.710 |
For the six months ended September 30, 2022, the management fee was equivalent to an annual rate of 0.85% of the Fund’s average daily net assets.
Allspring Funds Management has retained the services of a subadviser to provide daily portfolio management to the Fund. The fee for subadvisory services is borne by Allspring Funds Management. Allspring Global Investments, LLC ("Allspring Investments"), an affiliate of Allspring Funds Management and a wholly owned subsidiary of Allspring Global Investments
24 | Allspring Small Cap Fund
Notes to financial statements (unaudited)
Holdings, LLC, is the subadviser to the Fund and is entitled to receive a fee from Allspring Funds Management at an annual rate starting at 0.55% and declining to 0.40% as the average daily net assets of the Fund increase.
Administration fees
Under a class-level administration agreement, Allspring Funds Management provides class-level administrative services to the Fund, which includes paying fees and expenses for services provided by the transfer agent, sub-transfer agents, omnibus account servicers and record-keepers. As compensation for its services under the class-level administration agreement, Allspring Funds Management receives an annual fee which is calculated based on the average daily net assets of each class as follows:
| | Class-level
administration fee |
| Class A | 0.21% |
| Class C | 0.21 |
| Class R6 | 0.03 |
| Administrator Class | 0.13 |
| Institutional Class | 0.13 |
Waivers and/or expense reimbursements
Allspring Funds Management has contractually committed to waive and/or reimburse management and administration fees to the extent necessary to maintain certain net operating expense ratios for the Fund. When each class of the Fund has exceeded its expense cap, Allspring Funds Management will waive fees and/or reimburse expenses from fund-level expenses on a proportionate basis and then from class specific expenses. When only certain classes exceed their expense caps, waivers and/or reimbursements are applied against class specific expenses before fund-level expenses. Allspring Funds Management has contractually committed through July 31, 2023 to waive fees and/or reimburse expenses to the extent necessary to cap expenses. Prior to or after the commitment expiration date, the caps may be increased or the commitment to maintain the caps may be terminated only with the approval of the Board of Trustees. As of September 30, 2022, the contractual expense caps are as follows:
| | Expense ratio caps |
| Class A | 1.23% |
| Class C | 1.98 |
| Class R6 | 0.80 |
| Administrator Class | 1.15 |
| Institutional Class | 0.90 |
Distribution fee
The Trust has adopted a distribution plan for Class C shares pursuant to Rule 12b-1 under the 1940 Act. A distribution fee is charged to Class C shares and paid to Allspring Funds Distributor, LLC ("Allspring Funds Distributor"), the principal underwriter, an affiliate of Allspring Funds Management, at an annual rate of 0.75% of the average daily net assets of Class C shares.
In addition, Allspring Funds Distributor is entitled to receive the front-end sales charge from the purchase of Class A shares and a contingent deferred sales charge on the redemption of certain Class A shares. Allspring Funds Distributor is also entitled to receive the contingent deferred sales charges from redemptions of Class C shares. For the six months ended September 30, 2022, Allspring Funds Distributor received $21 from the sale of Class A shares. No contingent deferred sales charges were incurred by Class A and Class C shares for the six months ended September 30, 2022.
Shareholder servicing fees
The Trust has entered into contracts with one or more shareholder servicing agents, whereby Class A, Class C and Administrator Class are charged a fee at an annual rate of 0.25% of the average daily net assets of each respective class. A portion of these total shareholder servicing fees were paid to affiliates.
Allspring Small Cap Fund | 25
Notes to financial statements (unaudited)
Interfund transactions
The Fund may purchase or sell portfolio investment securities to certain affiliates pursuant to Rule 17a-7 under the 1940 Act and under procedures adopted by the Board of Trustees. The procedures have been designed to ensure that these interfund transactions, which do not incur broker commissions, are effected at current market prices.
5. INVESTMENT PORTFOLIO TRANSACTIONS
Purchases and sales of investments, excluding U.S. government obligations (if any) and short-term securities, for the six months ended September 30, 2022 were $5,019,532 and $8,017,269, respectively.
6. SECURITIES LENDING TRANSACTIONS
The Fund lends its securities through an unaffiliated securities lending agent and receives collateral in the form of cash or securities with a value at least equal to the value of the securities on loan. The value of the loaned securities is determined at the close of each business day and any increases or decreases in the required collateral are exchanged between the Fund and the counterparty on the next business day. Cash collateral received is invested in the Securities Lending Fund which seeks to provide a positive return compared to the daily Federal Funds Open Rate by investing in high-quality, U.S. dollar-denominated short-term money market instruments and is exempt from registration under Section 3(c)(7) of the 1940 Act. Securities Lending Fund is managed by Allspring Funds Management and is subadvised by Allspring Investments. Allspring Funds Management receives an advisory fee starting at 0.05% and declining to 0.01% as the average daily net assets of the Securities Lending Fund increase. All of the fees received by Allspring Funds Management are paid to Allspring Investments for its services as subadviser.
In the event of counterparty default or the failure of a borrower to return a loaned security, the Fund has the right to use the collateral to offset any losses incurred. As of September 30, 2022, the Fund had securities lending transactions with the following counterparties which are subject to offset:
| Counterparty | Value of
securities on
loan | Collateral
received1 | Net amount |
| Bank of America Securities Incorporated | $551,346 | $(551,346) | $0 |
| JPMorgan Securities LLC | 167,505 | (167,505) | 0 |
| National Financial Services LLC | 270,255 | (270,255) | 0 |
| SG Americas Securities LLC | 473,160 | (473,160) | 0 |
| UBS Securities LLC | 31,783 | (31,783) | 0 |
1 Collateral received within this table is limited to the collateral for the net transaction with the counterparty.
7. BANK BORROWINGS
The Trust (excluding the money market funds), Allspring Master Trust and Allspring Variable Trust are parties to a $350,000,000 revolving credit agreement whereby the Fund is permitted to use bank borrowings for temporary or emergency purposes, such as to fund shareholder redemption requests. Interest under the credit agreement is charged to the Fund based on a borrowing rate equal to the higher of the Federal Funds rate or the overnight bank funding rate in effect on that day plus a spread. In addition, an annual commitment fee equal based on the unused balance is allocated to each participating fund.
For the six months ended September 30, 2022, there were no borrowings by the Fund under the agreement.
8. INDEMNIFICATION
Under the Fund's organizational documents, the officers and Trustees have been granted certain indemnification rights against certain liabilities that may arise out of performance of their duties to the Fund. The Fund has entered into a separate agreement with each Trustee that converts indemnification rights currently existing under the Fund’s organizational documents into contractual rights that cannot be changed in the future without the consent of the Trustee. Additionally, in the normal course of business, the Fund may enter into contracts with service providers that contain a variety of indemnification clauses. The Fund’s maximum exposure under these arrangements is dependent on future claims that may be made against the Fund and, therefore, cannot be estimated.
26 | Allspring Small Cap Fund
Notes to financial statements (unaudited)
9. CORONAVIRUS (COVID-19) PANDEMIC
On March 11, 2020, the World Health Organization announced that it had made the assessment that coronavirus disease 2019 (“COVID-19”) is a pandemic. The impacts of COVID-19 are affecting the entire global economy, individual companies and investment products, the funds, and the market in general. There is significant uncertainty around the extent and duration of business disruptions related to COVID-19 and the impacts may last for an extended period of time. COVID-19 has led to significant uncertainty and volatility in the financial markets.
Allspring Small Cap Fund | 27
Other information (unaudited)
PROXY VOTING INFORMATION
A description of the policies and procedures used to determine how to vote proxies relating to portfolio securities is available without charge, upon request, by calling 1-800-222-8222, visiting our website at allspringglobal.com, or visiting the SEC website at sec.gov. Information regarding how the proxies related to portfolio securities were voted during the most recent 12-month period ended June 30 is available on the website at allspringglobal.com or by visiting the SEC website at sec.gov.
QUARTERLY PORTFOLIO HOLDINGS INFORMATION
The Fund files its complete schedule of portfolio holdings with the SEC for the first and third quarters of each fiscal year as an exhibit to its reports on Form N-PORT. Shareholders may view the filed Form N-PORT by visiting the SEC website at sec.gov.
28 | Allspring Small Cap Fund
Other information (unaudited)
BOARD OF TRUSTEES AND OFFICERS
Each of the Trustees and Officers listed in the table below acts in identical capacities for each fund in the Allspring family of funds, which consists of 124 mutual funds comprising the Allspring Funds Trust, Allspring Variable Trust, Allspring Master Trust and four closed-end funds (collectively the “Fund Complex”). This table should be read in conjunction with the Prospectus and the Statement of Additional Information1. The mailing address of each Trustee and Officer is 525 Market Street, 12th Floor, San Francisco, CA 94105. Each Trustee and Officer serves an indefinite term, however, each Trustee serves such term until reaching the mandatory retirement age established by the Trustees.
Independent Trustees
Name and
year of birth | Position held and
length of service* | Principal occupations during past five years or longer | Current other
public company or
investment
company
directorships |
William R. Ebsworth
(Born 1957) | Trustee,
since 2015 | Retired. From 1984 to 2013, equities analyst, portfolio manager, research director and chief investment officer at Fidelity Management and Research Company in Boston, Tokyo, and Hong Kong, and retired in 2013 as Chief Investment Officer of Fidelity Strategic Advisers, Inc. where he led a team of investment professionals managing client assets. Prior thereto, Board member of Hong Kong Securities Clearing Co., Hong Kong Options Clearing Corp., the Thailand International Fund, Ltd., Fidelity Investments Life Insurance Company, and Empire Fidelity Investments Life Insurance Company. Audit Committee Chair and Investment Committee Chair of the Vincent Memorial Hospital Endowment (non-profit organization). Mr. Ebsworth is a CFA® charterholder. | N/A |
Jane A. Freeman
(Born 1953) | Trustee,
since 2015;
Chair Liaison,
since 2018 | Retired. From 2012 to 2014 and 1999 to 2008, Chief Financial Officer of Scientific Learning Corporation. From 2008 to 2012, Ms. Freeman provided consulting services related to strategic business projects. Prior to 1999, Portfolio Manager at Rockefeller & Co. and Scudder, Stevens & Clark. Board member of the Harding Loevner Funds from 1996 to 2014, serving as both Lead Independent Director and chair of the Audit Committee. Board member of the Russell Exchange Traded Funds Trust from 2011 to 2012 and the chair of the Audit Committee. Ms. Freeman is also an inactive Chartered Financial Analyst. | N/A |
Isaiah Harris, Jr.
(Born 1952) | Trustee,
since 2009; Audit
Committee
Chair,
since 2019 | Retired. Chairman of the Board of CIGNA Corporation from 2009 to 2021, and Director from 2005 to 2008. From 2003 to 2011, Director of Deluxe Corporation. Prior thereto, President and CEO of BellSouth Advertising and Publishing Corp. from 2005 to 2007, President and CEO of BellSouth Enterprises from 2004 to 2005 and President of BellSouth Consumer Services from 2000 to 2003. Emeritus member of the Iowa State University Foundation Board of Governors. Emeritus Member of the Advisory Board of Iowa State University School of Business. Advisory Board Member, Palm Harbor Academy (private school). Advisory Board Member, Fellowship of Christian Athletes. Mr. Harris is a certified public accountant (inactive status). | N/A |
David F. Larcker
(Born 1950) | Trustee,
since 2009 | James Irvin Miller Professor of Accounting at the Graduate School of Business (Emeritus), Stanford University, Director of the Corporate Governance Research Initiative and Senior Faculty of The Rock Center for Corporate Governance since 2006. From 2005 to 2008, Professor of Accounting at the Graduate School of Business, Stanford University. Prior thereto, Ernst & Young Professor of Accounting at The Wharton School, University of Pennsylvania from 1985 to 2005. | N/A |
Allspring Small Cap Fund | 29
Other information (unaudited)
Name and
year of birth | Position held and
length of service* | Principal occupations during past five years or longer | Current other
public company or
investment
company
directorships |
Olivia S. Mitchell
(Born 1953) | Trustee,
since 2006;
Nominating and
Governance
Committee Chair,
since 2018 | International Foundation of Employee Benefit Plans Professor since 1993, Wharton School of the University of Pennsylvania. Director of Wharton’s Pension Research Council and Boettner Center on Pensions & Retirement Research, and Research Associate at the National Bureau of Economic Research. Previously taught at Cornell University from 1978 to 1993. | N/A |
Timothy J. Penny
(Born 1951) | Trustee,
since 1996;
Chair,
since 2018 | President and Chief Executive Officer of Southern Minnesota Initiative Foundation, a non-profit organization, since 2007. Vice Chair of the Economic Club of Minnesota, since 2007. Co-Chair of the Committee for a Responsible Federal Budget, since 1995. Member of the Board of Trustees of NorthStar Education Finance, Inc., a non-profit organization, since 2007. Senior Fellow of the University of Minnesota Humphrey Institute from 1995 to 2017. | N/A |
James G. Polisson
(Born 1959) | Trustee,
since 2018 | Retired. Chief Marketing Officer, Source (ETF) UK Services, Ltd, from 2015 to 2017. From 2012 to 2015, Principal of The Polisson Group, LLC, a management consulting, corporate advisory and principal investing company. Chief Executive Officer and Managing Director at Russell Investments, Global Exchange Traded Funds from 2010 to 2012. Managing Director of Barclays Global Investors from 1998 to 2010 and Global Chief Marketing Officer for iShares and Barclays Global Investors from 2000 to 2010. Trustee of the San Francisco Mechanics’ Institute, a non-profit organization, from 2013 to 2015. Board member of the Russell Exchange Traded Fund Trust from 2011 to 2012. Director of Barclays Global Investors Holdings Deutschland GmbH from 2006 to 2009. Mr. Polisson is an attorney and has a retired status with the Massachusetts and District of Columbia Bar Associations. | N/A |
Pamela Wheelock
(Born 1959) | Trustee,
since January
2020; previously
Trustee from
January 2018 to
July 2019 | Retired. Executive and Senior Financial leadership positions in the public, private and nonprofit sectors. Interim President and CEO, McKnight Foundation, 2020. Interim Commissioner, Minnesota Department of Human Services, 2019. Chief Operating Officer, Twin Cities Habitat for Humanity, 2017-2019. Vice President for University Services, University of Minnesota, 2012-2016. Interim President and CEO, Blue Cross and Blue Shield of Minnesota, 2011-2012. Executive Vice-President and Chief Financial Officer, Minnesota Wild, 2002-2008. Commissioner, Minnesota Department of Finance, 1999-2002. Chair of the Board of Directors of Destination Medical Center Corporation. Board member of the Minnesota Wild Foundation. | N/A |
* Length of service dates reflect the Trustee’s commencement of service with the Trust’s predecessor entities, where applicable.
30 | Allspring Small Cap Fund
Other information (unaudited)
Officers2
Name and
year of birth | Position held and
length of service | Principal occupations during past five years or longer |
Andrew Owen
(Born 1960) | President,
since 2017 | President and Chief Executive Officer of Allspring Funds Management, LLC since 2017 and Head of Global Fund Governance of Allspring Global Investments since 2022. Prior thereto, co-president of Galliard Capital Management, LLC, an affiliate of Allspring Funds Management, LLC, from 2019 to 2022 and Head of Affiliated Managers, Allspring Global Investments, from 2014 to 2019 and Executive Vice President responsible for marketing, investments and product development for Allspring Funds Management, LLC, from 2009 to 2014. |
Jeremy DePalma
(Born 1974) | Treasurer,
since 2012
(for certain funds in
the Fund Complex);
since 2021 (for
the remaining funds in the
Fund Complex) | Senior Vice President of Allspring Funds Management, LLC since 2009. Senior Vice President of Evergreen Investment Management Company, LLC from 2008 to 2010 and head of the Fund Reporting and Control Team within Fund Administration from 2005 to 2010. |
Christopher Baker
(Born 1976) | Chief Compliance Officer, since 2022 | Global Chief Compliance Officer for Allspring Global Investments since 2022. Prior thereto, Chief Compliance Officer for State Street Global Advisors from 2018 to 2021. Senior Compliance Officer for the State Street divisions of Alternative Investment Solutions, Sector Solutions, and Global Marketing from 2015 to 2018. From 2010 to 2015 Vice President, Global Head of Investment and Marketing Compliance for State Street Global Advisors. |
Matthew Prasse
(Born 1983) | Chief Legal Officer, since 2022; Secretary, since 2021 | Senior Counsel of the Allspring Legal Department since 2021. Senior Counsel of the Wells Fargo Legal Department from 2018 to 2021. Previously, Counsel for Barings LLC from 2015 to 2018. Prior to joining Barings, Associate at Morgan, Lewis & Bockius LLP from 2008 to 2015. |
1 The Statement of Additional Information includes additional information about the Trustees and is available, without charge, upon request, by calling 1-800-222-8222 or by visiting the website at allspringglobal.com.
2 For those Officers with tenures at Allspring Global Investments and/or Allspring Funds Management, LLC that began prior to 2021, such tenures include years of service during which these businesses/entities were known as Wells Fargo Asset Management and Wells Fargo Funds Management, LLC, respectively.
Allspring Small Cap Fund | 31
Other information (unaudited)
LIQUIDITY RISK MANAGEMENT PROGRAM
In accordance with Rule 22e-4 under the Investment Company Act of 1940, as amended (the “Liquidity Rule”), Allspring Funds Trust (the “Trust”) has adopted and implemented a liquidity risk management program (the “Program”) on behalf of each of its series (other than the series that operate as money market funds), including the Fund, which is reasonably designed to assess and manage the Fund's liquidity risk. “Liquidity risk” is defined under the Liquidity Rule as the risk that the Fund is unable to meet redemption requests without significantly diluting remaining investors’ interests in the Fund. The Trust’s Board of Trustees (the “Board”) previously approved the designation of Allspring Funds Management, LLC (“Allspring Funds Management”), the Fund's investment manager, to administer the Program, and Allspring Funds Management has established a Liquidity Risk Management Council (the "Council") composed of personnel from multiple departments within Allspring Funds Management and its affiliates to assist Allspring Funds Management in the administration of the Program.
The Program is comprised of various components designed to support the assessment and/or management of liquidity risk, including: (1) the periodic assessment (no less frequently than annually) of certain factors that influence the Fund's liquidity risk; (2) the periodic classification (no less frequently than monthly) of the Fund's investments into one of four liquidity categories that reflect an estimate of their liquidity under current market conditions; (3) a 15% limit on the acquisition of “illiquid investments” (as defined under the Liquidity Rule); (4) to the extent the Fund does not invest primarily in “highly liquid investments” (as defined under the Liquidity Rule), the determination of a minimum percentage of the Fund's assets that generally will be invested in highly liquid investments (an “HLIM”); (5) if the Fund has established an HLIM, the periodic review (no less frequently than annually) of the HLIM and the adoption of policies and procedures for responding to a shortfall of the Fund's “highly liquid investments” below its HLIM; and (6) periodic reporting to the Board.
At a meeting of the Board held on May 24-25, 2022, the Board received and reviewed a written report (the “Report”) from Allspring Funds Management that, among other things, addressed the operation of the Program and assessed its adequacy and effectiveness for the period from January 1, 2021 through December 31, 2021 (the “Reporting Period”). Other than extended foreign market holidays, no significant liquidity events impacting the Funds were noted in the Report. In addition, other than corporate-related changes to the Program, there were no material changes to the Program during the Reporting Period.
Allspring Funds Management determined in the Report that the Program has been implemented and operates effectively to manage the Fund’s liquidity risk, and Allspring Funds Management continues to believe that the Program has been and continues to be adequately and effectively implemented to monitor and, as applicable, respond to the Fund’s liquidity developments.
There can be no assurance that the Program will achieve its objectives under all circumstances in the future. Please refer to the Fund’s prospectus for more information regarding the Fund’s exposure to liquidity risk and other risks to which an investment in the Fund may be subject.
32 | Allspring Small Cap Fund
For more information
More information about Allspring Funds is available free upon request. To obtain literature, please write, visit the Fund's website, or call:
Allspring Funds
P.O. Box 219967
Kansas City, MO 64121-9967
Website: allspringglobal.com
Individual investors: 1-800-222-8222
Retail investment professionals: 1-888-877-9275
Institutional investment professionals: 1-800-260-5969
This report and the financial statements contained herein are submitted for the general information of the shareholders of the Fund. If this report is used for promotional purposes, distribution of the report must be accompanied or preceded by a current prospectus. Before investing, please consider the investment objectives, risks, charges, and expenses of the investment. For a current prospectus and, if available, a summary prospectus, containing this information, call
1-800-222-8222 or visit the Fund's website at allspringglobal.com. Read the prospectus carefully before you invest or send money.
Allspring Global InvestmentsTM is the trade name for the asset management firms of Allspring Global Investments Holdings, LLC, a holding company indirectly owned by certain private funds of GTCR LLC and Reverence Capital Partners, L.P. These firms include but are not limited to Allspring Global Investments, LLC, and Allspring Funds Management, LLC. Certain products managed by Allspring entities are distributed by Allspring Funds Distributor, LLC (a broker-dealer and Member FINRA/SIPC).
This material is for general informational and educational purposes only and is NOT intended to provide investment advice or a recommendation of any kind - including a recommendation for any specific investment, strategy, or plan.
© 2022 Allspring Global Investments Holdings, LLC. All rights reserved.
PAR-1022-00367 11-22
SA242/SAR242 09-22
Semi-Annual Report
September 30, 2022
Allspring
Special Small Cap Value Fund
The views expressed and any forward-looking statements are as of September 30, 2022, unless otherwise noted, and are those of the Fund's portfolio managers and/or Allspring Global Investments. Discussions of individual securities or the markets generally are not intended as individual recommendations. Future events or results may vary significantly from those expressed in any forward-looking statements. The views expressed are subject to change at any time in response to changing circumstances in the market. Allspring Global Investments disclaims any obligation to publicly update or revise any views expressed or forward-looking statements.
Allspring Special Small Cap Value Fund | 1
Letter to shareholders (unaudited)
Andrew Owen
President
Allspring Funds
Dear Shareholder:
We are pleased to offer you this semi-annual report for Allspring Special Small Cap Value Fund for the six-month period that ended September 30, 2022. Globally, stocks and bonds experienced heightened volatility through the extremely difficult period. Non-U.S. securities fared the worst as the global economy faced multiple challenges and the strength of the U.S. dollar eroded already-poor returns of non-U.S.-dollar-denominated assets. Bonds had historically poor performance, with major fixed income indexes falling substantially for the six-month period.
Earlier tailwinds provided by global stimulus programs, vaccination rollouts, and recovering consumer and corporate sentiment were wiped away by the highest rate of inflation in four decades, the impact of ongoing aggressive central bank rate hikes and the prospect of more, plus the global reverberations of the Russia-Ukraine war. The already-significant global supply chain disruptions were compounded by China’s COVID-19 lockdowns.
For the six-month period, both stocks and bonds registered major losses, with even U.S. bonds suffering deep losses and other assets faring worse. For the period, U.S. stocks, based on the S&P 500 Index,1 lost 20.20%. International stocks, as measured by the MSCI ACWI ex USA Index (Net),2 returned -22.27%, while the MSCI EM Index (Net) (USD)3 declined 21.70%. Among bond indexes, the Bloomberg U.S. Aggregate Bond Index,4 returned -9.22%, the Bloomberg Global Aggregate ex-USD Index (unhedged),5 returned -18.89%, the Bloomberg Municipal Bond Index6 declined 6.30%, and the ICE BofA U.S. High Yield Index7 fell 10.56%.
| 1 | The S&P 500 Index consists of 500 stocks chosen for market size, liquidity, and industry group representation. It is a market-value-weighted index with each stock's weight in the index proportionate to its market value. You cannot invest directly in an index. |
| 2 | The Morgan Stanley Capital International (MSCI) All Country World Index (ACWI) ex USA Index (Net) is a free-float-adjusted market-capitalization-weighted index that is designed to measure the equity market performance of developed and emerging markets, excluding the U.S. Source: MSCI. MSCI makes no express or implied warranties or representations and shall have no liability whatsoever with respect to any MSCI data contained herein. The MSCI data may not be further redistributed or used as a basis for other indexes or any securities or financial products. This report is not approved, reviewed, or produced by MSCI. You cannot invest directly in an index. |
| 3 | The MSCI Emerging Markets (EM) Index (Net) (USD) is a free-float-adjusted market-capitalization-weighted index that is designed to measure equity market performance of emerging markets. You cannot invest directly in an index. |
| 4 | The Bloomberg U.S. Aggregate Bond Index is a broad-based benchmark that measures the investment-grade, U.S.-dollar-denominated, fixed-rate taxable bond market, including Treasuries, government-related and corporate securities, mortgage-backed securities (agency fixed-rate and hybrid adjustable-rate mortgage pass-throughs), asset-backed securities, and commercial mortgage-backed securities. You cannot invest directly in an index. |
| 5 | The Bloomberg Global Aggregate ex-USD Index (unhedged) is an unmanaged index that provides a broad-based measure of the global investment-grade fixed-income markets excluding the U.S.-dollar-denominated debt market. You cannot invest directly in an index. |
| 6 | The Bloomberg Municipal Bond Index is an unmanaged index composed of long-term tax-exempt bonds with a minimum credit rating of Baa. You cannot invest directly in an index. |
| 7 | The ICE BofA U.S. High Yield Index is a market-capitalization-weighted index of domestic and Yankee high-yield bonds. The index tracks the performance of high-yield securities traded in the U.S. bond market. You cannot invest directly in an index. Copyright 2022. ICE Data Indices, LLC. All rights reserved. |
2 | Allspring Special Small Cap Value Fund
Letter to shareholders (unaudited)
Rising inflation, COVID, and the Russian invasion of Ukraine drove market performance.
Just before the six-month reporting period began, global financial markets had been rocked by the Russian invasion of Ukraine and resulting spike in volatility. In April, the market misery continued, with broad and deep losses, as both the S&P 500 Index and MSCI ACWI (Net)1 fell 8% or more for the month. The Chinese economy struggled through a strict lockdown as the government tried to contain a major COVID-19 outbreak. The ensuing global ripple effect compounded existing supply shortages. This was exacerbated by the impact of the Russia-Ukraine war on global commodities. Meanwhile, U.S. annual inflation raged at 8.5%, its highest level since 1981, and investors braced themselves for aggressive Federal Reserve (Fed) monetary tightening moves.
Market volatility continued in May, although markets recovered ground late in the month. Value stocks outperformed growth stocks. The concerns that had dominated markets for months continued, including high inflation and geopolitical tensions that added to high crude oil, gasoline, and food prices. In response, the Fed raised the federal funds rate by 0.50%, with widescale expectations of multiple rate hikes to come. Meanwhile, highly contagious COVID-19 variants persisted. However, labor markets in the U.S., the U.K., and Europe remained strong. U.S. retail sales for April, released in May, indicated a fourth consecutive monthly increase, reflecting continued consumer resilience.
A dreadful year in financial markets continued in June with stocks posting further losses en route to their worst first half of a year in 50 years. Bonds didn’t fare much better. Driving the losses were the same factors that have been at play: rising global inflation and fears of recession as central banks increase rates to try to curb inflation, which climbed above 9% in June in the U.S. The Fed raised its short-term rate by another 0.75% in June. Meanwhile, U.S. economic data showed resilience as the U.S. unemployment rate held steady at 3.6% and the housing market was only marginally affected, so far, by sharply higher mortgage rates.
Markets rebounded in July, led by U.S. stocks. While evidence began to point to an economic slowdown after two consecutive quarters of declining gross domestic product (economic contraction), the U.S. labor market remained surprisingly strong: July nonfarm payrolls grew by more than 500,000 and U.S. unemployment dipped to 3.5%. Meanwhile, crude oil and retail gasoline prices, major contributors to recent overall inflation, fell substantially from earlier highs. And while U.S. home prices rose, sales fell as houses became less affordable with mortgage rates at a 13-year high. The Fed raised the federal funds rate another 0.75% in July—to a range of 2.25% to 2.50%—and forecasts pointed to continued rate increases.
August was yet another broadly challenging month for financial markets, with more red ink flowing. High inflation persisted, cresting 9% in the eurozone and remaining above 8% in the U.S. despite the Fed’s aggressive monetary policy and a major drop in global crude oil and gasoline prices from their June peak. One positive note in the U.S. was the resilience of the country’s jobs market. However, the Fed’s job was clearly not complete. One longer-term bright spot was the U.S. Congress’s passage of the Inflation Reduction Act. Its primary stated goals include include to reduce inflation (though not immediately) by curbing the deficit, capping health care spending by seniors, and investing in domestic sources of clean energy.
“ Just before the six-month reporting period began, global financial markets had been rocked by the Russian invasion of Ukraine and resulting spike in volatility. In April, the market misery continued, with broad and deep losses, as both the S&P 500 Index and MSCI ACWI (Net) fell 8% or more for the month.”
| 1 | The MSCI ACWI (Net) is a free-float-adjusted market-capitalization-weighted index that is designed to measure the equity market performance of developed and emerging markets. You cannot invest directly in an index. |
Allspring Special Small Cap Value Fund | 3
Letter to shareholders (unaudited)
The market misery continued in September. There was nowhere to hide as all asset classes suffered major losses at the hands of persistent inflation. Central banks kept up their battle against rapidly rising prices with more rate hikes. The strength of the U.S. dollar made things even more difficult for investors holding assets in other currencies. U.S. mortgage rates jumped to near 7% on 30-year fixed-rate mortgages; the decreased housing affordability began to cool demand somewhat. The U.K. experienced a sharp sell-off of government bonds and the British pound in September as investors panicked in response to a new government budget that was seen as financially unsound. The market meltdown forced the Bank of England to step in and buy long-dated government bonds. The drama continued into the next fiscal year.
Don’t let short-term uncertainty derail long-term investment goals.
Periods of investment uncertainty can present challenges, but experience has taught us that maintaining long-term investment goals can be an effective way to plan for the future. To help you create a sound strategy based on your personal goals and risk tolerance, Allspring Funds offers more than 100 mutual funds spanning a wide range of asset classes and investment styles. Although diversification cannot guarantee an investment profit or prevent losses, we believe it can be an effective way to manage investment risk and potentially smooth out overall portfolio performance. We encourage investors to know their investments and to understand that appropriate levels of risk-taking may unlock opportunities.
Thank you for choosing to invest with Allspring Funds. We appreciate your confidence in us and remain committed to helping you meet your financial needs.
Sincerely,
Andrew Owen
President
Allspring Funds
For further information about your fund, contact your investment professional, visit our website at allspringglobal.com, or call us directly at 1-800-222-8222.
4 | Allspring Special Small Cap Value Fund
This page is intentionally left blank.
Performance highlights (unaudited)
This Fund is currently closed to most new investors.*
| Investment objective | The Fund seeks long-term capital appreciation. |
| Manager | Allspring Funds Management, LLC |
| Subadviser | Allspring Global Investments, LLC |
| Portfolio managers | Brian Martin, CFA®‡, James M. Tringas, CFA®‡, Bryant VanCronkhite, CFA®‡ |
| Average annual total returns (%) as of September 30, 2022 |
| | | Including sales charge | | Excluding sales charge | | Expense ratios1 (%) |
| | Inception date | 1 year | 5 year | 10 year | | 1 year | 5 year | 10 year | | Gross | Net 2 |
| Class A (ESPAX) | 5-7-1993 | -22.38 | 1.76 | 8.18 | | -17.64 | 2.97 | 8.82 | | 1.24 | 1.24 |
| Class C (ESPCX) | 12-12-2000 | -19.27 | 2.22 | 8.18 | | -18.27 | 2.22 | 8.18 | | 1.99 | 1.99 |
| Class R (ESPHX)3 | 9-30-2015 | – | – | – | | -17.86 | 2.71 | 8.56 | | 1.49 | 1.49 |
| Class R6 (ESPRX)4 | 10-31-2014 | – | – | – | | -17.29 | 3.42 | 9.28 | | 0.81 | 0.81 |
| Administrator Class (ESPIX) | 7-23-1996 | – | – | – | | -17.58 | 3.06 | 8.98 | | 1.16 | 1.16 |
| Institutional Class (ESPNX) | 7-30-2010 | – | – | – | | -17.37 | 3.33 | 9.22 | | 0.91 | 0.91 |
| Russell 2000® Value Index5 | – | – | – | – | | -17.69 | 2.87 | 7.94 | | – | – |
Figures quoted represent past performance, which is no guarantee of future results, and do not reflect taxes that a shareholder may pay on an investment in a fund. Investment return and principal value of an investment will fluctuate so that an investor’s shares, when redeemed, may be worth more or less than their original cost. Performance shown without sales charges would be lower if sales charges were reflected. Current performance may be lower or higher than the performance data quoted, which assumes the reinvestment of dividends and capital gains. Current month-end performance is available on the Fund’s website, allspringglobal.com.
Index returns do not include transaction costs associated with buying and selling securities, any mutual fund fees or expenses, or any taxes. It is not possible to invest directly in an index.
For Class A shares, the maximum front-end sales charge is 5.75%. For Class C shares, the maximum contingent deferred sales charge is 1.00%. Performance including a contingent deferred sales charge assumes the sales charge for the corresponding time period. Class R, Class R6, Administrator Class and Institutional Class shares are sold without a front-end sales charge or contingent deferred sales charge.
| 1 | Reflects the expense ratios as stated in the most recent prospectuses. The expense ratios shown are subject to change and may differ from the annualized expense ratios shown in the financial highlights of this report. |
| 2 | The manager has contractually committed through July 31, 2023, to waive fees and/or reimburse expenses to the extent necessary to cap total annual fund operating expenses after fee waivers at 1.31% for Class A, 2.06% for Class C, 1.56% for Class R, 0.89% for Class R6, 1.20% for Administrator Class, and 0.94% for Institutional Class. Brokerage commissions, stamp duty fees, interest, taxes, acquired fund fees and expenses (if any), and extraordinary expenses are excluded from the expense caps. Prior to or after the commitment expiration date, the caps may be increased or the commitment to maintain the caps may be terminated only with the approval of the Board of Trustees. Without these caps, the Fund’s returns would have been lower. The expense ratio paid by an investor is the net expense ratio (the total annual fund operating expenses after fee waivers) as stated in the prospectuses. |
| 3 | Historical performance shown for the Class R shares prior to their inception reflects the performance of the Institutional Class shares, adjusted to reflect the higher expenses applicable to the Class R shares. |
| 4 | Historical performance shown for the Class R6 shares prior to their inception reflects the performance of the Institutional Class shares, and includes the higher expenses applicable to the Institutional Class shares. If these expenses had not been included, returns for the Class R6 shares would be higher. |
| 5 | The Russell 2000® Value Index measures the performance of those Russell 2000 companies with lower price/book ratios and lower forecasted growth values. You cannot invest directly in an index. |
Stock values fluctuate in response to the activities of individual companies and general market and economic conditions. Smaller-company stocks tend to be more volatile and less liquid than those of larger companies. Consult the Fund’s prospectus for additional information on these and other risks.
| ‡ | CFA® and Chartered Financial Analyst® are trademarks owned by CFA Institute. |
* Please see the Fund’s current Statement of Additional Information for further details.
6 | Allspring Special Small Cap Value Fund
Performance highlights (unaudited)
| Ten largest holdings (%) as of September 30, 20221 |
| Mueller Industries Incorporated | 4.07 |
| Innospec Incorporated | 3.25 |
| Franklin Electric Company Incorporated | 3.05 |
| J & J Snack Foods Corporation | 2.86 |
| Eagle Materials Incorporated | 2.64 |
| UMB Financial Corporation | 2.50 |
| CSW Industrials Incorporated | 2.25 |
| Avient Corporation | 2.10 |
| Mativ Holdings Inc | 1.77 |
| Silgan Holdings Incorporated | 1.59 |
| 1 | Figures represent the percentage of the Fund's net assets. Holdings are subject to change and may have changed since the date specified. |
| Sector allocation as of September 30, 20221 |
| 1 | Figures represent the percentage of the Fund's long-term investments. Allocations are subject to change and may have changed since the date specified. |
Allspring Special Small Cap Value Fund | 7
Fund expenses (unaudited)
As a shareholder of the Fund, you incur two types of costs: (1) transaction costs, including sales charges (loads) on purchase payments and contingent deferred sales charges (if any) on redemptions and (2) ongoing costs, including management fees, distribution (12b-1) and/or shareholder servicing fees, and other Fund expenses. This example is intended to help you understand your ongoing costs (in dollars) of investing in the Fund and to compare these costs with the ongoing costs of investing in other mutual funds.
The example is based on an investment of $1,000 invested at the beginning of the six-month period and held for the entire period from April 1, 2022 to September 30, 2022.
Actual expenses
The “Actual” line of the table below provides information about actual account values and actual expenses. You may use the information in this line, together with the amount you invested, to estimate the expenses that you paid over the period. Simply divide your account value by $1,000 (for example, an $8,600 account value divided by $1,000 = 8.6), then multiply the result by the number in the “Actual” line under the heading entitled “Expenses paid during period” for your applicable class of shares to estimate the expenses you paid on your account during this period.
Hypothetical example for comparison purposes
The “Hypothetical” line of the table below provides information about hypothetical account values and hypothetical expenses based on the Fund’s actual expense ratio and an assumed rate of return of 5% per year before expenses, which is not the Fund’s actual return. The hypothetical account values and expenses may not be used to estimate the actual ending account balance or expenses you paid for the period. You may use this information to compare the ongoing costs of investing in the Fund and other funds. To do so, compare this 5% hypothetical example with the 5% hypothetical examples that appear in the shareholder reports of the other funds.
Please note that the expenses shown in the table are meant to highlight your ongoing costs only and do not reflect any transactional costs, such as sales charges (loads) and contingent deferred sales charges. Therefore, the “Hypothetical” line of the table is useful in comparing ongoing costs only, and will not help you determine the relative total costs of owning different funds. In addition, if these transactional costs were included, your costs would have been higher.
| | Beginning
account value
4-1-2022 | Ending
account value
9-30-2022 | Expenses
paid during
the period1 | Annualized net
expense ratio |
| Class A | | | | |
| Actual | $1,000.00 | $ 804.21 | $ 5.70 | 1.26% |
| Hypothetical (5% return before expenses) | $1,000.00 | $1,018.75 | $ 6.38 | 1.26% |
| Class C | | | | |
| Actual | $1,000.00 | $ 801.05 | $ 9.03 | 2.00% |
| Hypothetical (5% return before expenses) | $1,000.00 | $1,015.04 | $10.10 | 2.00% |
| Class R | | | | |
| Actual | $1,000.00 | $ 803.09 | $ 6.83 | 1.51% |
| Hypothetical (5% return before expenses) | $1,000.00 | $1,017.50 | $ 7.64 | 1.51% |
| Class R6 | | | | |
| Actual | $1,000.00 | $ 805.86 | $ 3.76 | 0.83% |
| Hypothetical (5% return before expenses) | $1,000.00 | $1,020.91 | $ 4.20 | 0.83% |
| Administrator Class | | | | |
| Actual | $1,000.00 | $ 804.58 | $ 5.25 | 1.16% |
| Hypothetical (5% return before expenses) | $1,000.00 | $1,019.25 | $ 5.87 | 1.16% |
| Institutional Class | | | | |
| Actual | $1,000.00 | $ 805.62 | $ 4.21 | 0.93% |
| Hypothetical (5% return before expenses) | $1,000.00 | $1,020.41 | $ 4.71 | 0.93% |
1 Expenses paid is equal to the annualized net expense ratio of each class multiplied by the average account value over the period, multiplied by 183 divided by 365 (to reflect the one-half-year period).
8 | Allspring Special Small Cap Value Fund
Portfolio of investments—September 30, 2022 (unaudited)
| | | | | Shares | Value |
| Common stocks: 95.08% | | | | | |
| Communication services: 0.47% | | | | | |
| Media: 0.47% | | | | | |
| DallasNews Corporation Class A ♠ | | | | 436,597 | $ 2,025,810 |
| Thryv Holdings Incorporated † | | | | 860,400 | 19,642,932 |
| | | | | | 21,668,742 |
| Consumer discretionary: 6.64% | | | | | |
| Auto components: 0.54% | | | | | |
| Holley Incorporated †« | | | | 6,099,043 | 24,701,124 |
| Hotels, restaurants & leisure: 3.63% | | | | | |
| Denny’s Corporation ♠† | | | | 4,560,412 | 42,913,477 |
| Dine Brands Global Incorporated ♠ | | | | 993,743 | 63,162,305 |
| Jack In The Box Incorporated | | | | 815,800 | 60,426,306 |
| | | | | | 166,502,088 |
| Household durables: 1.43% | | | | | |
| Helen of Troy Limited † | | | | 563,533 | 54,347,123 |
| Tupperware Brands Corporation ♠† | | | | 1,751,837 | 11,474,532 |
| | | | | | 65,821,655 |
| Multiline retail: 0.39% | | | | | |
| Franchise Group Incorporated | | | | 733,421 | 17,822,130 |
| Textiles, apparel & luxury goods: 0.65% | | | | | |
| Delta Apparel Incorporated ♠† | | | | 602,202 | 8,424,806 |
| Steven Madden Limited | | | | 798,100 | 21,285,327 |
| | | | | | 29,710,133 |
| Consumer staples: 8.34% | | | | | |
| Beverages: 0.84% | | | | | |
| Primo Water Corporation | | | | 3,078,389 | 38,633,782 |
| Food products: 4.38% | | | | | |
| J & J Snack Foods Corporation ♠ | | | | 1,015,608 | 131,490,768 |
| Nomad Foods Limited † | | | | 3,325,728 | 47,225,338 |
| Tootsie Roll Industries Incorporated | | | | 672,640 | 22,385,459 |
| | | | | | 201,101,565 |
| Household products: 3.12% | | | | | |
| Central Garden & Pet Company ♠† | | | | 813,322 | 29,312,125 |
| Central Garden & Pet Company Class A † | | | | 1,267,151 | 43,285,878 |
| Spectrum Brands Holdings Incorporated ##« | | | | 1,803,094 | 70,374,759 |
| | | | | | 142,972,762 |
| Energy: 7.30% | | | | | |
| Energy equipment & services: 1.74% | | | | | |
| Forum Energy Technologies Incorporated † | | | | 172,344 | 3,660,587 |
| Liberty Oilfield Services Class A † | | | | 1,584,371 | 20,089,824 |
| Patterson-UTI Energy Incorporated | | | | 4,803,848 | 56,108,945 |
| | | | | | 79,859,356 |
The accompanying notes are an integral part of these financial statements.
Allspring Special Small Cap Value Fund | 9
Portfolio of investments—September 30, 2022 (unaudited)
| | | | | Shares | Value |
| Oil, gas & consumable fuels: 5.56% | | | | | |
| Alto Ingredients Incorporated † | | | | 2,132,188 | $ 7,761,164 |
| Berry Corporation | | | | 2,139,686 | 16,047,645 |
| Callon Petroleum Company †## | | | | 534,930 | 18,727,899 |
| Chord Energy Corporation | | | | 449,912 | 61,534,464 |
| Magnolia Oil & Gas Corporation Class A | | | | 2,941,984 | 58,280,703 |
| Nordic American Tankers Limited « | | | | 3,711,011 | 9,908,399 |
| Northern Oil and Gas Incorporated | | | | 908,210 | 24,894,036 |
| Southwestern Energy Company †## | | | | 9,482,980 | 58,035,838 |
| | | | | | 255,190,148 |
| Financials: 16.75% | | | | | |
| Banks: 7.27% | | | | | |
| Associated Banc Corporation | | | | 1,955,756 | 39,271,580 |
| CVB Financial Corporation | | | | 832,774 | 21,085,838 |
| First Hawaiian Incorporated | | | | 1,022,658 | 25,188,067 |
| Hancock Whitney Corporation | | | | 1,038,240 | 47,561,774 |
| Renasant Corporation | | | | 1,132,774 | 35,433,171 |
| South State Corporation | | | | 637,618 | 50,448,336 |
| UMB Financial Corporation | | | | 1,360,980 | 114,717,004 |
| | | | | | 333,705,770 |
| Capital markets: 1.16% | | | | | |
| Apollo Investment Corporation | | | | 1,873,186 | 19,143,961 |
| Capitol Investment Corporation V | | | | 1,250,000 | 549,250 |
| Glassbridge Enterprises Incorporated ♠†« | | | | 1,527 | 38,175 |
| New Mountain Finance Corporation | | | | 2,515,550 | 29,004,292 |
| Pershing Square Escrow Shares ♦† | | | | 1,415,995 | 0 |
| Westwood Holdings Group Incorporated ♠ | | | | 446,683 | 4,301,557 |
| | | | | | 53,037,235 |
| Diversified financial services: 0.75% | | | | | |
| Jackson Financial Incorporation Class A | | | | 1,247,661 | 34,622,593 |
| Insurance: 4.95% | | | | | |
| CNO Financial Group Incorporated | | | | 747,092 | 13,425,243 |
| Enstar Group Limited † | | | | 308,502 | 52,318,854 |
| National Western Life Group Class A | | | | 68,833 | 11,756,676 |
| ProAssurance Corporation | | | | 1,230,100 | 23,999,251 |
| Stewart Information Services Corporation | | | | 1,316,802 | 57,465,239 |
| The Hanover Insurance Group Incorporated | | | | 530,177 | 67,936,881 |
| | | | | | 226,902,144 |
| Mortgage REITs: 2.62% | | | | | |
| AGNC Investment Corporation | | | | 3,643,200 | 30,675,744 |
| Apollo Commercial Real Estate Finance Incorporated | | | | 2,404,190 | 19,954,777 |
| New York Mortgage Trust Incorporated | | | | 11,637,106 | 27,230,828 |
| Two Harbors Investment Corporation | | | | 12,763,196 | 42,373,811 |
| | | | | | 120,235,160 |
The accompanying notes are an integral part of these financial statements.
10 | Allspring Special Small Cap Value Fund
Portfolio of investments—September 30, 2022 (unaudited)
| | | | | Shares | Value |
| Health care: 4.87% | | | | | |
| Health care equipment & supplies: 0.88% | | | | | |
| Enovis Corporation | | | | 113,800 | $ 5,242,766 |
| Varex Imaging Corporation † | | | | 1,675,689 | 35,424,065 |
| | | | | | 40,666,831 |
| Health care providers & services: 1.88% | | | | | |
| Owens & Minor Incorporated | | | | 1,732,034 | 41,742,019 |
| Patterson Companies Incorporated | | | | 1,127,665 | 27,086,513 |
| Premier Incorporated Class A | | | | 515,737 | 17,504,114 |
| | | | | | 86,332,646 |
| Life sciences tools & services: 0.74% | | | | | |
| Azenta Incorporated | | | | 790,241 | 33,869,729 |
| Pharmaceuticals: 1.37% | | | | | |
| Perrigo Company plc | | | | 752,251 | 26,825,271 |
| Prestige Consumer Healthcare Incorporated † | | | | 720,526 | 35,903,811 |
| | | | | | 62,729,082 |
| Industrials: 29.16% | | | | | |
| Aerospace & defense: 0.69% | | | | | |
| Parsons Corporation † | | | | 808,516 | 31,693,827 |
| Air freight & logistics: 0.19% | | | | | |
| GXO Logistics Incorporated † | | | | 249,757 | 8,756,480 |
| Building products: 6.75% | | | | | |
| CSW Industrials Incorporated ♠ | | | | 862,581 | 103,337,204 |
| Griffon Corporation | | | | 1,609,799 | 47,521,266 |
| Janus International Group Incorporated † | | | | 2,443,102 | 21,792,470 |
| JELD-WEN Holding Incorporated † | | | | 681,621 | 5,964,184 |
| Quanex Building Products Corporation ♠ | | | | 2,782,780 | 50,535,285 |
| Simpson Manufacturing Company Incorporated | | | | 546,267 | 42,827,333 |
| UFP Industries Incorporated | | | | 522,259 | 37,686,209 |
| | | | | | 309,663,951 |
| Commercial services & supplies: 2.34% | | | | | |
| ACCO Brands Corporation | | | | 3,845,700 | 18,843,932 |
| Custom Truck One Source Incorporated | | | | 3,475,000 | 20,259,250 |
| Ennis Incorporated ♠ | | | | 1,256,422 | 25,291,775 |
| Harsco Corporation † | | | | 1,319,631 | 4,935,420 |
| Matthews International Corporation Class A | | | | 221,500 | 4,963,815 |
| Viad Corporation ♠† | | | | 1,050,007 | 33,159,221 |
| | | | | | 107,453,413 |
| Construction & engineering: 0.99% | | | | | |
| APi Group Corporation † | | | | 3,407,467 | 45,217,087 |
| Electrical equipment: 1.55% | | | | | |
| Atkore Incorporated †## | | | | 742,609 | 57,782,406 |
| Babcock & Wilcox Enterprises Incorporated † | | | | 2,119,231 | 13,520,694 |
| | | | | | 71,303,100 |
The accompanying notes are an integral part of these financial statements.
Allspring Special Small Cap Value Fund | 11
Portfolio of investments—September 30, 2022 (unaudited)
| | | | | Shares | Value |
| Machinery: 12.36% | | | | | |
| Alamo Group Incorporated | | | | 291,849 | $ 35,684,377 |
| Columbus McKinnon Corporation | | | | 961,117 | 25,142,821 |
| Douglas Dynamics Incorporated ♠ | | | | 1,848,821 | 51,803,964 |
| Franklin Electric Company Incorporated | | | | 1,710,869 | 139,795,106 |
| Hillenbrand Incorporated | | | | 578,157 | 21,229,925 |
| Hillman Group Incorporated | | | | 3,622,900 | 27,316,666 |
| Hillman Solutions Corporation † | | | | 2,182,381 | 16,455,153 |
| Kadant Incorporated | | | | 305,289 | 50,925,258 |
| Mayville Engineering Company Incorporated † | | | | 1,628,924 | 10,604,295 |
| Mueller Industries Incorporated ♠## | | | | 3,139,496 | 186,611,642 |
| NN Incorporated †« | | | | 946,098 | 1,617,828 |
| | | | | | 567,187,035 |
| Professional services: 2.63% | | | | | |
| CBIZ Incorporated † | | | | 1,637,002 | 70,030,946 |
| Korn Ferry International | | | | 1,073,437 | 50,397,867 |
| | | | | | 120,428,813 |
| Road & rail: 0.84% | | | | | |
| Werner Enterprises Incorporated | | | | 1,028,689 | 38,678,706 |
| Trading companies & distributors: 0.82% | | | | | |
| Air Lease Corporation | | | | 956,100 | 29,648,661 |
| Custom Truck One Source Incorporated †« | | | | 1,350,793 | 7,875,123 |
| | | | | | 37,523,784 |
| Information technology: 4.23% | | | | | |
| Electronic equipment, instruments & components: 1.53% | | | | | |
| Belden Incorporated | | | | 1,169,293 | 70,180,966 |
| IT services: 2.19% | | | | | |
| Concentrix Corporation | | | | 114,200 | 12,748,146 |
| Euronet Worldwide Incorporated † | | | | 75,000 | 5,682,000 |
| Global Blue Group Holding AG | | | | 4,536,904 | 21,005,866 |
| Kyndryl Holdings Incorporated † | | | | 3,264,489 | 26,997,324 |
| Maximus Incorporated | | | | 588,400 | 34,050,708 |
| | | | | | 100,484,044 |
| Software: 0.51% | | | | | |
| E2open Parent Holding Incorporated † | | | | 3,077,572 | 18,680,862 |
| Synchronoss Technologies Incorporated † | | | | 4,327,500 | 4,933,350 |
| | | | | | 23,614,212 |
| Materials: 16.09% | | | | | |
| Chemicals: 8.35% | | | | | |
| Avient Corporation | | | | 3,176,901 | 96,260,100 |
| Diversey Holdings Limited † | | | | 2,050,560 | 9,965,722 |
| Ecovyst Incorporated † | | | | 3,945,238 | 33,297,809 |
| Element Solutions Incorporated | | | | 668,592 | 10,877,992 |
| Innospec Incorporated ♠ | | | | 1,740,494 | 149,108,121 |
| Minerals Technologies Incorporated | | | | 229,756 | 11,352,244 |
| NewMarket Corporation | | | | 240,293 | 72,287,343 |
| | | | | | 383,149,331 |
The accompanying notes are an integral part of these financial statements.
12 | Allspring Special Small Cap Value Fund
Portfolio of investments—September 30, 2022 (unaudited)
| | | | | Shares | Value |
| Construction materials: 2.64% | | | | | |
| Eagle Materials Incorporated | | | | 1,131,401 | $ 121,263,559 |
| Containers & packaging: 3.33% | | | | | |
| Myers Industries Incorporated | | | | 1,671,660 | 27,532,240 |
| Silgan Holdings Incorporated | | | | 1,730,665 | 72,757,157 |
| Trimas Corporation | | | | 2,094,063 | 52,498,159 |
| | | | | | 152,787,556 |
| Paper & forest products: 1.77% | | | | | |
| Mativ Holdings Inc ♠ | | | | 3,679,722 | 81,248,262 |
| Real estate: 0.56% | | | | | |
| Equity REITs: 0.56% | | | | | |
| Washington REIT | | | | 1,450,410 | 25,469,200 |
| Utilities: 0.67% | | | | | |
| Electric utilities: 0.67% | | | | | |
| Hawaiian Electric Industries Incorporated | | | | 889,664 | 30,835,754 |
| Total Common stocks (Cost $4,481,047,607) | | | | | 4,363,023,755 |
| | | | | | |
| Investment companies: 1.13% | | | | | |
| Mutual funds: 1.13% | | | | | |
| iShares Russell 2000 Index ETF | | | | 314,275 | 51,830,233 |
| Total Investment companies (Cost $56,092,263) | | | | | 51,830,233 |
| | | Yield | | | |
| Short-term investments: 2.76% | | | | | |
| Investment companies: 2.76% | | | | | |
| Allspring Government Money Market Fund Select Class ♠∞ | | 2.75% | | 124,897,784 | 124,897,784 |
| Securities Lending Cash Investments LLC ♠∩∞ | | 3.08 | | 1,780,491 | 1,780,491 |
| Total Short-term investments (Cost $126,678,275) | | | | | 126,678,275 |
| Total investments in securities (Cost $4,663,818,145) | 98.97% | | | | 4,541,532,263 |
| Other assets and liabilities, net | 1.03 | | | | 47,327,948 |
| Total net assets | 100.00% | | | | $4,588,860,211 |
| † | Non-income-earning security |
| ♦ | The security is fair valued in accordance with procedures approved by the Board of Trustees. |
| « | All or a portion of this security is on loan. |
| ♠ | The issuer of the security is an affiliated person of the Fund as defined in the Investment Company Act of 1940. |
| ∩ | The investment is a non-registered investment company purchased with cash collateral received from securities on loan. |
| ∞ | The rate represents the 7-day annualized yield at period end. |
| ## | All or a portion of this security is segregated as collateral for investments in derivative instruments. |
| Abbreviations: |
| REIT | Real estate investment trust |
The accompanying notes are an integral part of these financial statements.
Allspring Special Small Cap Value Fund | 13
Portfolio of investments—September 30, 2022 (unaudited)
Investments in affiliates
An affiliated investment is an investment in which the Fund owns at least 5% of the outstanding voting shares of the issuer or as a result of other relationships, such as the Fund and the issuer having the same investment manager. Transactions with issuers that were affiliates of the Fund at the end of the period were as follows:
| | Value,
beginning of
period | Purchases | Sales
proceeds | Net
realized
gains
(losses) | | Net
change in
unrealized
gains
(losses) | | Value,
end of
period | Shares,
end
of period | Income
from
affiliated
securities |
| Common Stocks | | | | | | | | | |
| Central Garden & Pet Company† | $ 35,722,863 | $ 29,713 | $ 0 | $ 0 | | $ (6,440,451) | | $ 29,312,125 | 813,322 | $ 0 |
| CSW Industrials Incorporated | 100,337,313 | 1,056,901 | 0 | 0 | | 1,942,990 | | 103,337,204 | 862,581 | 293,159 |
| DallasNews Corporation Class A | 3,757,683 | 0 | (850,593) | (2,637,121) | | 1,755,841 | | 2,025,810 | 436,597 | 827,663 |
| Delta Apparel Incorporated† | 17,924,703 | 13,759 | 0 | 0 | | (9,513,656) | | 8,424,806 | 602,202 | 0 |
| Denny’s Corporation† | 64,584,064 | 639,745 | 0 | 0 | | (22,310,332) | | 42,913,477 | 4,560,412 | 0 |
| Dine Brands Global Incorporated | 81,172,687 | 375,259 | (3,634,052) | (546,554) | | (14,205,035) | | 63,162,305 | 993,743 | 1,525,939 |
| Douglas Dynamics Incorporated | 63,549,474 | 367,932 | 0 | 0 | | (12,113,442) | | 51,803,964 | 1,848,821 | 1,071,852 |
| Ennis Incorporated | 24,606,270 | 0 | (1,490,593) | (72,749) | | 2,248,847 | | 25,291,775 | 1,256,422 | 649,163 |
| Glassbridge Enterprises Incorporated† | 9,926 | 0 | 0 | 0 | | 28,249 | | 38,175 | 1,527 | 0 |
| Innospec Incorporated | 165,737,985 | 597,281 | (5,706,497) | (172,528) | | (11,348,120) | | 149,108,121 | 1,740,494 | 1,923,345 |
| J & J Snack Foods Corporation | 158,418,985 | 2,481,150 | (3,201,873) | (713,077) | | (25,494,417) | | 131,490,768 | 1,015,608 | 1,288,927 |
| Mativ Holdings Inc | 0 | 154,683,625 | 0 | (291,456) | | (73,143,907) | | 81,248,262 | 3,679,722 | 2,819,690 |
| Mueller Industries Incorporated | 171,377,466 | 5,668,024 | (8,289,414) | 1,887,638 | | 15,967,928 | | 186,611,642 | 3,139,496 | 2,066,467 |
| Quanex Building Products Corporation | 56,833,951 | 1,570,736 | 0 | 0 | | (7,869,402) | | 50,535,285 | 2,782,780 | 442,860 |
| Tupperware Brands Corporation† | 51,130,899 | 1,062,750 | (7,268,001) | (12,246,733) | | (21,204,383) | | 11,474,532 | 1,751,837 | 0 |
| Viad Corporation† | 42,137,421 | 178,001 | (5,425,336) | (2,436,258) | | (1,294,606) | | 33,159,221 | 1,050,007 | 0 |
| Westwood Holdings Group Incorporated | 6,843,184 | 0 | 0 | 0 | | (2,541,627) | | 4,301,557 | 446,683 | 134,005 |
| Short-term investments | | | | | | | | | |
| Allspring Government Money Market Fund Select Class | 110,061,302 | 581,217,415 | (566,380,933) | 0 | | 0 | | 124,897,784 | 124,897,784 | 787,652 |
| Securities Lending Cash Investments LLC | 3,452,615 | 47,086,421 | (48,758,545) | 0 | | 0 | | 1,780,491 | 1,780,491 | 74,466 # |
Investments in affiliates no longer
held at end of period | | | | | | | | | | |
| Neenah Incorporated | 61,082,785 | 76,658 | (98,150,707) | 0 | | 36,991,264 | | 0 | 0 | 0 |
| | | | | $(17,228,838) | | $(148,544,259) | | $1,100,917,304 | | $13,905,188 |
| † | Non-income-earning security |
| # | Amount shown represents income before fees and rebates. |
Written options
| Description | Counterparty | Number of
contracts | Notional
amount | Exercise
price | Expiration
date | Value |
| Call | | | | | | |
| Atkore International Incorporated | Bank of America Securities Incorporated | (250) | $(2,000,000) | $ 80.00 | 10-21-2022 | $ (70,000) |
| Atkore International Incorporated | Bank of America Securities Incorporated | (250) | (2,125,000) | 85.00 | 11-18-2022 | (95,625) |
| J&J Snack Foods Corporation | Bank of America Securities Incorporated | (250) | (3,250,000) | 130.00 | 11-18-2022 | (157,500) |
| Mueller Industries Incorporated | Bank of America Securities Incorporated | (250) | (1,750,000) | 70.00 | 10-21-2022 | (8,125) |
| Mueller Industries Incorporated | Bank of America Securities Incorporated | (250) | (1,875,000) | 75.00 | 12-16-2022 | (12,392) |
The accompanying notes are an integral part of these financial statements.
14 | Allspring Special Small Cap Value Fund
Portfolio of investments—September 30, 2022 (unaudited)
Written options (continued)
| Description | Counterparty | Number of
contracts | Notional
amount | Exercise
price | Expiration
date | Value |
| Call (continued) | | | | | | |
| Petroleum Company | Bank of America Securities Incorporated | (500) | $(2,000,000) | $ 40.00 | 10-21-2022 | $ (48,750) |
| Southwestern Energy Company | Bank of America Securities Incorporated | (1,000) | (800,000) | 8.00 | 10-21-2022 | (3,000) |
| Spectrum Brands Holdings Incorporated | Bank of America Securities Incorporated | (250) | (1,250,000) | 50.00 | 10-21-2022 | (4,375) |
| Put | | | | | | |
| Atkore International Incorporated | Bank of America Securities Incorporated | (250) | (2,000,000) | 80.00 | 10-21-2022 | (118,750) |
| Atkore International Incorporated | Bank of America Securities Incorporated | (250) | (2,125,000) | 85.00 | 10-21-2022 | (206,250) |
| Atkore International Incorporated | Bank of America Securities Incorporated | (250) | (1,875,000) | 75.00 | 11-18-2022 | (123,750) |
| Atkore International Incorporated | Bank of America Securities Incorporated | (250) | (1,750,000) | 70.00 | 11-18-2022 | (74,375) |
| Avient Corporation | Bank of America Securities Incorporated | (500) | (1,750,000) | 35.00 | 11-18-2022 | (277,500) |
| Azenta Incorporated | Bank of America Securities Incorporated | (500) | (2,750,000) | 55.00 | 10-21-2022 | (597,500) |
| Chord Energy Corporation | Bank of America Securities Incorporated | (250) | (3,125,000) | 125.00 | 10-21-2022 | (80,000) |
| Concenrix Corporation | Bank of America Securities Incorporated | (500) | (6,000,000) | 120.00 | 10-21-2022 | (472,500) |
| Concentrix Corporation | Bank of America Securities Incorporated | (250) | (2,750,000) | 110.00 | 11-18-2022 | (151,250) |
| Enovis Corporation | Bank of America Securities Incorporated | (1,250) | (6,250,000) | 50.00 | 10-21-2022 | (490,625) |
| Euronet Worldwide Incorporated | Bank of America Securities Incorporated | (250) | (2,125,000) | 85.00 | 10-21-2022 | (248,750) |
| Petroleum Company | Bank of America Securities Incorporated | (250) | (875,000) | 35.00 | 11-18-2022 | (107,500) |
| Simpson Manufacturing Company Incorporated | Bank of America Securities Incorporated | (500) | (4,750,000) | 95.00 | 10-21-2022 | (835,000) |
| SM Energy Company | Bank of America Securities Incorporated | (1,000) | (4,000,000) | 40.00 | 11-18-2022 | (560,000) |
| Southwestern Energy Company | Bank of America Securities Incorporated | (1,000) | (700,000) | 7.00 | 10-21-2022 | (100,500) |
| | | | | | | $(4,844,017) |
The accompanying notes are an integral part of these financial statements.
Allspring Special Small Cap Value Fund | 15
Statement of assets and liabilities—September 30, 2022 (unaudited)
| | |
| Assets | |
Investments in unaffiliated securities (including $1,672,448 of securities loaned), at value (cost $3,575,390,707)
| $ 3,440,614,959 |
Investments in affiliated securities, at value (cost $1,088,427,438)
| 1,100,917,304 |
Cash
| 37,999 |
Cash at broker segregated for written options
| 42,824,952 |
Receivable for investments sold
| 12,143,170 |
Receivable for dividends
| 10,121,254 |
Receivable for Fund shares sold
| 10,005,400 |
Receivable for securities lending income, net
| 3,013 |
Prepaid expenses and other assets
| 318,985 |
Total assets
| 4,616,987,036 |
| Liabilities | |
Payable for Fund shares redeemed
| 11,414,680 |
Payable for investments purchased
| 5,424,249 |
Written options at value (premiums received $2,821,480)
| 4,844,017 |
Management fee payable
| 3,404,992 |
Payable upon receipt of securities loaned
| 1,780,491 |
Administration fees payable
| 485,048 |
Distribution fees payable
| 8,158 |
Trustees’ fees and expenses payable
| 3,331 |
Accrued expenses and other liabilities
| 761,859 |
Total liabilities
| 28,126,825 |
Total net assets
| $4,588,860,211 |
| Net assets consist of | |
Paid-in capital
| $ 4,449,432,869 |
Total distributable earnings
| 139,427,342 |
Total net assets
| $4,588,860,211 |
| Computation of net asset value and offering price per share | |
Net assets – Class A
| $ 646,036,343 |
Shares outstanding – Class A1
| 19,685,731 |
Net asset value per share – Class A
| $32.82 |
Maximum offering price per share – Class A2
| $34.82 |
Net assets – Class C
| $ 7,402,259 |
Shares outstanding – Class C1
| 256,377 |
Net asset value per share – Class C
| $28.87 |
Net assets – Class R
| $ 11,799,184 |
Shares outstanding – Class R1
| 354,501 |
Net asset value per share – Class R
| $33.28 |
Net assets – Class R6
| $ 1,419,796,846 |
Shares outstanding – Class R61
| 41,967,766 |
Net asset value per share – Class R6
| $33.83 |
Net assets – Administrator Class
| $ 102,049,147 |
Shares outstanding – Administrator Class1
| 3,022,905 |
Net asset value per share – Administrator Class
| $33.76 |
Net assets – Institutional Class
| $ 2,401,776,432 |
Shares outstanding – Institutional Class1
| 71,023,252 |
Net asset value per share – Institutional Class
| $33.82 |
| 1 | The Fund has an unlimited number of authorized shares. |
| 2 | Maximum offering price is computed as 100/94.25 of net asset value. On investments of $50,000 or more, the offering price is reduced. |
The accompanying notes are an integral part of these financial statements.
16 | Allspring Special Small Cap Value Fund
Statement of operations—six months ended September 30, 2022 (unaudited)
| | |
| Investment income | |
Dividends (net of foreign withholdings taxes of $64,619)
| $ 45,615,086 |
Income from affiliated securities
| 13,861,089 |
Total investment income
| 59,476,175 |
| Expenses | |
Management fee
| 20,929,501 |
| Administration fees | |
Class A
| 782,402 |
Class C
| 9,952 |
Class R
| 14,532 |
Class R6
| 245,430 |
Administrator Class
| 80,086 |
Institutional Class
| 1,868,353 |
| Shareholder servicing fees | |
Class A
| 931,431 |
Class C
| 11,831 |
Class R
| 17,300 |
Administrator Class
| 147,622 |
| Distribution fees | |
Class C
| 35,446 |
Class R
| 17,221 |
Custody and accounting fees
| 197,838 |
Professional fees
| 26,995 |
Registration fees
| 77,424 |
Shareholder report expenses
| 215,209 |
Trustees’ fees and expenses
| 11,191 |
Other fees and expenses
| 71,758 |
Total expenses
| 25,691,522 |
| Less: Fee waivers and/or expense reimbursements | |
Class A
| (1,214) |
Class C
| (1) |
Administrator Class
| (811) |
Institutional Class
| (16) |
Net expenses
| 25,689,480 |
Net investment income
| 33,786,695 |
| Realized and unrealized gains (losses) on investments | |
| Net realized gains (losses) on | |
Unaffiliated securities
| 26,530,528 |
Affiliated securities
| (17,228,838) |
Written options
| 11,920,070 |
Net realized gains on investments
| 21,221,760 |
| Net change in unrealized gains (losses) on | |
Unaffiliated securities
| (1,028,759,435) |
Affiliated securities
| (148,544,259) |
Written options
| (1,736,658) |
Net change in unrealized gains (losses) on investments
| (1,179,040,352) |
Net realized and unrealized gains (losses) on investments
| (1,157,818,592) |
Net decrease in net assets resulting from operations
| $(1,124,031,897) |
The accompanying notes are an integral part of these financial statements.
Allspring Special Small Cap Value Fund | 17
Statement of changes in net assets
| | | | | |
| | Six months ended
September 30, 2022
(unaudited) | Year ended
March 31, 2022 |
| Operations | | | | |
Net investment income
| | $ 33,786,695 | | $ 27,875,748 |
Net realized gains on investments
| | 21,221,760 | | 476,640,248 |
Net change in unrealized gains (losses) on investments
| | (1,179,040,352) | | (343,672,729) |
Net increase (decrease) in net assets resulting from operations
| | (1,124,031,897) | | 160,843,267 |
| Distributions to shareholders from | | | | |
| Net investment income and net realized gains | | | | |
Class A
| | 0 | | (50,783,331) |
Class C
| | 0 | | (807,798) |
Class R
| | 0 | | (917,911) |
Class R6
| | 0 | | (114,036,990) |
Administrator Class
| | 0 | | (11,844,857) |
Institutional Class
| | 0 | | (204,793,322) |
Total distributions to shareholders
| | 0 | | (383,184,209) |
| Capital share transactions | Shares | | Shares | |
| Proceeds from shares sold | | | | |
Class A
| 1,724,048 | 64,593,958 | 4,280,098 | 184,277,105 |
Class C
| 2,403 | 80,977 | 8,749 | 336,570 |
Class R
| 36,441 | 1,392,178 | 103,689 | 4,505,291 |
Class R6
| 4,392,528 | 168,917,725 | 15,549,670 | 685,689,346 |
Administrator Class
| 183,666 | 7,098,960 | 885,087 | 39,305,726 |
Institutional Class
| 9,383,869 | 362,214,803 | 24,127,132 | 1,060,759,280 |
| | | 604,298,601 | | 1,974,873,318 |
| Reinvestment of distributions | | | | |
Class A
| 0 | 0 | 1,121,289 | 46,807,127 |
Class C
| 0 | 0 | 21,112 | 778,823 |
Class R
| 0 | 0 | 21,670 | 917,911 |
Class R6
| 0 | 0 | 2,465,581 | 106,043,414 |
Administrator Class
| 0 | 0 | 273,495 | 11,744,267 |
Institutional Class
| 0 | 0 | 3,574,870 | 153,704,110 |
| | | 0 | | 319,995,652 |
| Payment for shares redeemed | | | | |
Class A
| (1,570,413) | (59,134,399) | (4,682,744) | (200,722,890) |
Class C
| (45,485) | (1,498,067) | (101,436) | (3,882,504) |
Class R
| (42,181) | (1,590,002) | (107,696) | (4,664,636) |
Class R6
| (4,461,099) | (174,370,197) | (12,714,796) | (559,504,556) |
Administrator Class
| (398,930) | (15,414,367) | (2,444,640) | (105,093,900) |
Institutional Class
| (14,437,157) | (556,307,981) | (22,927,729) | (1,005,623,154) |
| | | (808,315,013) | | (1,879,491,640) |
Net increase (decrease) in net assets resulting from capital share transactions
| | (204,016,412) | | 415,377,330 |
Total increase (decrease) in net assets
| | (1,328,048,309) | | 193,036,388 |
| Net assets | | | | |
Beginning of period
| | 5,916,908,520 | | 5,723,872,132 |
End of period
| | $ 4,588,860,211 | | $ 5,916,908,520 |
The accompanying notes are an integral part of these financial statements.
18 | Allspring Special Small Cap Value Fund
Financial highlights
(For a share outstanding throughout each period)
| | | Year ended March 31 |
| Class A | Six months ended
September 30, 2022
(unaudited) | 2022 | 2021 | 2020 | 2019 | 2018 |
Net asset value, beginning of period
| $40.81 | $42.37 | $23.39 | $31.74 | $34.42 | $33.15 |
Net investment income
| 0.18 1 | 0.07 | 0.14 1 | 0.24 | 0.22 | 0.24 |
Net realized and unrealized gains (losses) on investments
| (8.17) | 1.07 | 18.98 | (8.00) | (0.69) | 2.89 |
Total from investment operations
| (7.99) | 1.14 | 19.12 | (7.76) | (0.47) | 3.13 |
| Distributions to shareholders from | | | | | | |
Net investment income
| 0.00 | (0.10) | (0.13) | (0.28) | (0.15) | (0.32) |
Net realized gains
| 0.00 | (2.60) | (0.01) | (0.31) | (2.06) | (1.54) |
Total distributions to shareholders
| 0.00 | (2.70) | (0.14) | (0.59) | (2.21) | (1.86) |
Net asset value, end of period
| $32.82 | $40.81 | $42.37 | $23.39 | $31.74 | $34.42 |
Total return2
| (19.58)% | 2.56% | 81.92% | (25.08)% | (0.87)% | 9.42% |
| Ratios to average net assets (annualized) | | | | | | |
Gross expenses
| 1.26% | 1.24% | 1.27% | 1.27% | 1.29% | 1.31% |
Net expenses
| 1.26% | 1.24% | 1.27% | 1.27% | 1.29% | 1.31% |
Net investment income
| 0.96% | 0.17% | 0.43% | 0.75% | 0.67% | 0.66% |
| Supplemental data | | | | | | |
Portfolio turnover rate
| 13% | 28% | 40% | 39% | 32% | 41% |
Net assets, end of period (000s omitted)
| $646,036 | $797,067 | $797,193 | $381,058 | $526,656 | $539,499 |
| 1 | Calculated based upon average shares outstanding |
| 2 | Total return calculations do not include any sales charges. Returns for periods of less than one year are not annualized. |
The accompanying notes are an integral part of these financial statements.
Allspring Special Small Cap Value Fund | 19
Financial highlights
(For a share outstanding throughout each period)
| | | Year ended March 31 |
| Class C | Six months ended
September 30, 2022
(unaudited) | 2022 | 2021 | 2020 | 2019 | 2018 |
Net asset value, beginning of period
| $36.04 | $37.90 | $20.99 | $28.49 | $31.21 | $30.19 |
Net investment income (loss)
| 0.03 1 | (0.22) 1 | (0.08) 1 | (0.01) 1 | (0.05) 1 | (0.03) 1 |
Net realized and unrealized gains (losses) on investments
| (7.20) | 0.96 | 17.00 | (7.18) | (0.61) | 2.64 |
Total from investment operations
| (7.17) | 0.74 | 16.92 | (7.19) | (0.66) | 2.61 |
| Distributions to shareholders from | | | | | | |
Net investment income
| 0.00 | 0.00 | 0.00 | 0.00 | 0.00 | (0.05) |
Net realized gains
| 0.00 | (2.60) | (0.01) | (0.31) | (2.06) | (1.54) |
Total distributions to shareholders
| 0.00 | (2.60) | (0.01) | (0.31) | (2.06) | (1.59) |
Net asset value, end of period
| $28.87 | $36.04 | $37.90 | $20.99 | $28.49 | $31.21 |
Total return2
| (19.89)% | 1.79% | 80.71% | (25.65)% | (1.63)% | 8.60% |
| Ratios to average net assets (annualized) | | | | | | |
Gross expenses
| 2.00% | 1.99% | 2.01% | 2.02% | 2.04% | 2.06% |
Net expenses
| 2.00% | 1.99% | 2.01% | 2.02% | 2.04% | 2.06% |
Net investment income (loss)
| 0.17% | (0.58)% | (0.29)% | (0.04)% | (0.13)% | (0.10)% |
| Supplemental data | | | | | | |
Portfolio turnover rate
| 13% | 28% | 40% | 39% | 32% | 41% |
Net assets, end of period (000s omitted)
| $7,402 | $10,792 | $14,063 | $11,419 | $24,334 | $53,145 |
| 1 | Calculated based upon average shares outstanding |
| 2 | Total return calculations do not include any sales charges. Returns for periods of less than one year are not annualized. |
The accompanying notes are an integral part of these financial statements.
20 | Allspring Special Small Cap Value Fund
Financial highlights
(For a share outstanding throughout each period)
| | | Year ended March 31 |
| Class R | Six months ended
September 30, 2022
(unaudited) | 2022 | 2021 | 2020 | 2019 | 2018 |
Net asset value, beginning of period
| $41.44 | $43.01 | $23.73 | $32.20 | $34.94 | $33.73 |
Net investment income (loss)
| 0.14 1 | (0.03) | 0.07 | 0.16 | 0.18 | 0.17 |
Net realized and unrealized gains (losses) on investments
| (8.30) | 1.07 | 19.25 | (8.12) | (0.74) | 2.92 |
Total from investment operations
| (8.16) | 1.04 | 19.32 | (7.96) | (0.56) | 3.09 |
| Distributions to shareholders from | | | | | | |
Net investment income
| 0.00 | (0.01) | (0.03) | (0.20) | (0.12) | (0.34) |
Net realized gains
| 0.00 | (2.60) | (0.01) | (0.31) | (2.06) | (1.54) |
Total distributions to shareholders
| 0.00 | (2.61) | (0.04) | (0.51) | (2.18) | (1.88) |
Net asset value, end of period
| $33.28 | $41.44 | $43.01 | $23.73 | $32.20 | $34.94 |
Total return2
| (19.69)% | 2.27% | 81.50% | (25.29)% | (1.11)% | 9.13% |
| Ratios to average net assets (annualized) | | | | | | |
Gross expenses
| 1.51% | 1.49% | 1.51% | 1.52% | 1.55% | 1.57% |
Net expenses
| 1.51% | 1.49% | 1.51% | 1.52% | 1.55% | 1.56% |
Net investment income (loss)
| 0.70% | (0.08)% | 0.13% | 0.46% | 0.47% | 0.43% |
| Supplemental data | | | | | | |
Portfolio turnover rate
| 13% | 28% | 40% | 39% | 32% | 41% |
Net assets, end of period (000s omitted)
| $11,799 | $14,929 | $14,733 | $5,209 | $6,656 | $4,631 |
| 1 | Calculated based upon average shares outstanding |
| 2 | Returns for periods of less than one year are not annualized. |
The accompanying notes are an integral part of these financial statements.
Allspring Special Small Cap Value Fund | 21
Financial highlights
(For a share outstanding throughout each period)
| | | Year ended March 31 |
| Class R6 | Six months ended
September 30, 2022
(unaudited) | 2022 | 2021 | 2020 | 2019 | 2018 |
Net asset value, beginning of period
| $41.98 | $43.51 | $24.00 | $32.55 | $35.25 | $33.93 |
Net investment income
| 0.27 1 | 0.26 1 | 0.28 | 0.37 | 0.38 | 0.38 1 |
Net realized and unrealized gains (losses) on investments
| (8.42) | 1.10 | 19.49 | (8.17) | (0.72) | 2.97 |
Total from investment operations
| (8.15) | 1.36 | 19.77 | (7.80) | (0.34) | 3.35 |
| Distributions to shareholders from | | | | | | |
Net investment income
| 0.00 | (0.29) | (0.25) | (0.44) | (0.30) | (0.49) |
Net realized gains
| 0.00 | (2.60) | (0.01) | (0.31) | (2.06) | (1.54) |
Total distributions to shareholders
| 0.00 | (2.89) | (0.26) | (0.75) | (2.36) | (2.03) |
Net asset value, end of period
| $33.83 | $41.98 | $43.51 | $24.00 | $32.55 | $35.25 |
Total return2
| (19.41)% | 2.99% | 82.77% | (24.78)% | (0.42)% | 9.85% |
| Ratios to average net assets (annualized) | | | | | | |
Gross expenses
| 0.83% | 0.81% | 0.84% | 0.84% | 0.86% | 0.88% |
Net expenses
| 0.83% | 0.81% | 0.84% | 0.84% | 0.86% | 0.88% |
Net investment income
| 1.38% | 0.59% | 0.84% | 1.12% | 1.16% | 0.10% |
| Supplemental data | | | | | | |
Portfolio turnover rate
| 13% | 28% | 40% | 39% | 32% | 41% |
Net assets, end of period (000s omitted)
| $1,419,797 | $1,764,529 | $1,598,341 | $580,535 | $518,377 | $254,801 |
| 1 | Calculated based upon average shares outstanding |
| 2 | Returns for periods of less than one year are not annualized. |
The accompanying notes are an integral part of these financial statements.
22 | Allspring Special Small Cap Value Fund
Financial highlights
(For a share outstanding throughout each period)
| | | Year ended March 31 |
| Administrator Class | Six months ended
September 30, 2022
(unaudited) | 2022 | 2021 | 2020 | 2019 | 2018 |
Net asset value, beginning of period
| $41.96 | $43.50 | $24.00 | $32.55 | $35.22 | $33.90 |
Net investment income
| 0.20 1 | 0.11 1 | 0.16 1 | 0.26 1 | 0.27 1 | 0.27 1 |
Net realized and unrealized gains (losses) on investments
| (8.40) | 1.09 | 19.48 | (8.18) | (0.71) | 2.97 |
Total from investment operations
| (8.20) | 1.20 | 19.64 | (7.92) | (0.44) | 3.24 |
| Distributions to shareholders from | | | | | | |
Net investment income
| 0.00 | (0.14) | (0.13) | (0.32) | (0.17) | (0.38) |
Net realized gains
| 0.00 | (2.60) | (0.01) | (0.31) | (2.06) | (1.54) |
Total distributions to shareholders
| 0.00 | (2.74) | (0.14) | (0.63) | (2.23) | (1.92) |
Net asset value, end of period
| $33.76 | $41.96 | $43.50 | $24.00 | $32.55 | $35.22 |
Total return2
| (19.54)% | 2.62% | 82.13% | (25.03)% | (0.77)% | 9.52% |
| Ratios to average net assets (annualized) | | | | | | |
Gross expenses
| 1.17% | 1.16% | 1.19% | 1.19% | 1.21% | 1.23% |
Net expenses
| 1.16% | 1.16% | 1.18% | 1.19% | 1.20% | 1.20% |
Net investment income
| 1.03% | 0.26% | 0.51% | 0.79% | 0.74% | 0.76% |
| Supplemental data | | | | | | |
Portfolio turnover rate
| 13% | 28% | 40% | 39% | 32% | 41% |
Net assets, end of period (000s omitted)
| $102,049 | $135,870 | $196,801 | $105,286 | $160,369 | $229,992 |
| 1 | Calculated based upon average shares outstanding |
| 2 | Returns for periods of less than one year are not annualized. |
The accompanying notes are an integral part of these financial statements.
Allspring Special Small Cap Value Fund | 23
Financial highlights
(For a share outstanding throughout each period)
| | | Year ended March 31 |
| Institutional Class | Six months ended
September 30, 2022
(unaudited) | 2022 | 2021 | 2020 | 2019 | 2018 |
Net asset value, beginning of period
| $41.98 | $43.52 | $24.01 | $32.56 | $35.27 | $33.94 |
Net investment income
| 0.25 1 | 0.22 1 | 0.25 1 | 0.31 | 0.33 | 0.33 |
Net realized and unrealized gains (losses) on investments
| (8.41) | 1.08 | 19.50 | (8.14) | (0.70) | 3.01 |
Total from investment operations
| (8.16) | 1.30 | 19.75 | (7.83) | (0.37) | 3.34 |
| Distributions to shareholders from | | | | | | |
Net investment income
| 0.00 | (0.24) | (0.23) | (0.41) | (0.28) | (0.47) |
Net realized gains
| 0.00 | (2.60) | (0.01) | (0.31) | (2.06) | (1.54) |
Total distributions to shareholders
| 0.00 | (2.84) | (0.24) | (0.72) | (2.34) | (2.01) |
Net asset value, end of period
| $33.82 | $41.98 | $43.52 | $24.01 | $32.56 | $35.27 |
Total return2
| (19.44)% | 2.87% | 82.59% | (24.85)% | (0.53)% | 9.82% |
| Ratios to average net assets (annualized) | | | | | | |
Gross expenses
| 0.93% | 0.91% | 0.94% | 0.94% | 0.96% | 0.98% |
Net expenses
| 0.93% | 0.91% | 0.93% | 0.94% | 0.94% | 0.94% |
Net investment income
| 1.27% | 0.49% | 0.77% | 1.07% | 1.04% | 1.02% |
| Supplemental data | | | | | | |
Portfolio turnover rate
| 13% | 28% | 40% | 39% | 32% | 41% |
Net assets, end of period (000s omitted)
| $2,401,776 | $3,193,721 | $3,102,741 | $1,465,398 | $1,359,038 | $1,196,501 |
| 1 | Calculated based upon average shares outstanding |
| 2 | Returns for periods of less than one year are not annualized. |
The accompanying notes are an integral part of these financial statements.
24 | Allspring Special Small Cap Value Fund
Notes to financial statements (unaudited)
1. ORGANIZATION
Allspring Funds Trust (the "Trust"), a Delaware statutory trust organized on March 10, 1999, is an open-end management investment company registered under the Investment Company Act of 1940, as amended (the "1940 Act"). As an investment company, the Trust follows the accounting and reporting guidance in Financial Accounting Standards Board ("FASB") Accounting Standards Codification Topic 946, Financial Services – Investment Companies. These financial statements report on the Allspring Special Small Cap Value Fund (the "Fund") which is a diversified series of the Trust.
2. SIGNIFICANT ACCOUNTING POLICIES
The following significant accounting policies, which are consistently followed in the preparation of the financial statements of the Fund, are in conformity with U.S. generally accepted accounting principles which require management to make estimates and assumptions that affect the reported amounts of assets and liabilities, disclosure of contingent assets and liabilities at the date of the financial statements, and the reported amounts of income and expenses during the reporting period. Actual results could differ from those estimates.
Securities valuation
All investments are valued each business day as of the close of regular trading on the New York Stock Exchange (generally 4 p.m. Eastern Time), although the Fund may deviate from this calculation time under unusual or unexpected circumstances.
Equity securities that are listed on a foreign or domestic exchange or market are valued at the official closing price or, if none, the last sales price.
Options that are listed on a foreign or domestic exchange or market are valued at the closing mid-price. Non-listed options are valued at the evaluated price provided by an independent pricing service or, if a reliable price is not available, the quoted bid price from an independent broker-dealer.
Investments in registered open-end investment companies are valued at net asset value. Interests in non-registered investment companies that are redeemable at net asset value are fair valued normally at net asset value.
Investments which are not valued using the methods discussed above are valued at their fair value, as determined in good faith by Allspring Funds Management, LLC ("Allspring Funds Management"), which was named the valuation designee by the Board of Trustees. As the valuation designee, Allspring Funds Management is responsible for day-to-day valuation activities for the Allspring Funds. In connection with these responsibilities, Allspring Funds Management has established a Valuation Committee and has delegated to it the authority to take any actions regarding the valuation of portfolio securities that the Valuation Committee deems necessary or appropriate, including determining the fair value of portfolio securities. On a quarterly basis, the Board of Trustees receives reports of valuation actions taken by the Valuation Committee. On at least an annual basis, the Board of Trustees receives an assessment of the adequacy and effectiveness of Allspring Funds Management's process for determining the fair value of the portfolio of investments.
Securities lending
The Fund may lend its securities from time to time in order to earn additional income in the form of fees or interest on securities received as collateral or the investment of any cash received as collateral. When securities are on loan, the Fund receives interest or dividends on those securities. Cash collateral received in connection with its securities lending transactions is invested in Securities Lending Cash Investments, LLC (the "Securities Lending Fund"), an affiliated non-registered investment company. Investments in Securities Lending Fund are valued at the evaluated bid price provided by an independent pricing service. Income earned from investment in the Securities Lending Fund (net of fees and rebates), if any, is included in income from affiliated securities on the Statement of Operations.
In a securities lending transaction, the net asset value of the Fund is affected by an increase or decrease in the value of the securities loaned and by an increase or decrease in the value of the instrument in which collateral is invested. The amount of securities lending activity undertaken by the Fund fluctuates from time to time. The Fund has the right under the lending agreement to recover the securities from the borrower on demand. In the event of default or bankruptcy by the borrower, the Fund may be prevented from recovering the loaned securities or gaining access to the collateral or may experience delays or costs in doing so. In such an event, the terms of the agreement allow the unaffiliated securities lending agent to use the collateral to purchase replacement securities on behalf of the Fund or pay the Fund the market value of the loaned securities. The Fund bears the risk of loss with respect to depreciation of its investment of the cash collateral.
Options
The Fund may write covered call options or secured put options on individual securities and/or indexes. When the Fund writes an option, an amount equal to the premium received is recorded as a liability and is subsequently adjusted to the current market
Allspring Special Small Cap Value Fund | 25
Notes to financial statements (unaudited)
value of the written option. Premiums received from written options that expire unexercised are recognized as realized gains on the expiration date. For exercised options, the difference between the premium received and the amount paid on effecting a closing purchase transaction, including brokerage commissions, is treated as a realized gain or loss. If a call option is exercised, the premium is added to the proceeds from the sale of the underlying security in calculating the realized gain or loss on the sale. If a put option is exercised, the premium reduces the cost of the security purchased. The Fund, as a writer of an option, bears the market risk of an unfavorable change in the price of the security and/or index underlying the written option.
The Fund may also purchase call or put options. Premiums paid are included in the Statement of Assets and Liabilities as investments, the values of which are subsequently adjusted based on the current market values of the options. Premiums paid for purchased options that expire are recognized as realized losses on the expiration date. Premiums paid for purchased options that are exercised or closed are added to the amount paid or offset against the proceeds received for the underlying security to determine the realized gain or loss. The risk of loss associated with purchased options is limited to the premium paid.
Options traded on an exchange are regulated and terms of the options are standardized. The Fund is subject to equity price risk. Purchased options traded over-the-counter expose the Fund to counterparty risk in the event the counterparty does not perform. This risk can be mitigated by having a master netting arrangement between the Fund and the counterparty and by having the counterparty post collateral to cover the Fund’s exposure to the counterparty.
Security transactions and income recognition
Securities transactions are recorded on a trade date basis. Realized gains or losses are recorded on the basis of identified cost.
Dividend income is recognized on the ex-dividend date. Dividend income is recorded net of foreign taxes withheld where recovery of such taxes is not assured.
Distributions to shareholders
Distributions to shareholders from net investment income and any net realized gains are recorded on the ex-dividend date and paid at least annually. Such distributions are determined in accordance with income tax regulations and may differ from U.S. generally accepted accounting principles. Dividend sources are estimated at the time of declaration. The tax character of distributions is determined as of the Fund's fiscal year end. Therefore, a portion of the Fund's distributions made prior to the Fund’s fiscal year end may be categorized as a tax return of capital at year end.
Federal and other taxes
The Fund intends to continue to qualify as a regulated investment company by distributing substantially all of its investment company taxable income and any net realized capital gains (after reduction for capital loss carryforwards) sufficient to relieve it from all, or substantially all, federal income taxes. Accordingly, no provision for federal income taxes was required.
The Fund’s income and federal excise tax returns and all financial records supporting those returns for the prior three fiscal years are subject to examination by the federal and Delaware revenue authorities. Management has analyzed the Fund's tax positions taken on federal, state, and foreign tax returns, as applicable, for all open tax years and does not believe that there are any uncertain tax positions that require recognition of a tax liability.
As of September 30, 2022, the aggregate cost of all investments for federal income tax purposes was $4,668,662,357 and the unrealized gains (losses) consisted of:
| Gross unrealized gains | $ 664,900,986 |
| Gross unrealized losses | (794,053,617) |
| Net unrealized losses | $(129,152,631) |
Class allocations
The separate classes of shares offered by the Fund differ principally in applicable sales charges, distribution, shareholder servicing, and administration fees. Class specific expenses are charged directly to that share class. Investment income, common fund-level expenses, and realized and unrealized gains (losses) on investments are allocated daily to each class of shares based on the relative proportion of net assets of each class.
26 | Allspring Special Small Cap Value Fund
Notes to financial statements (unaudited)
3. FAIR VALUATION MEASUREMENTS
Fair value measurements of investments are determined within a framework that has established a fair value hierarchy based upon the various data inputs utilized in determining the value of the Fund’s investments. The three-level hierarchy gives the highest priority to unadjusted quoted prices in active markets for identical assets or liabilities (Level 1) and the lowest priority to unobservable inputs (Level 3). The Fund’s investments are classified within the fair value hierarchy based on the lowest level of input that is significant to the fair value measurement. The inputs are summarized into three broad levels as follows:
| ■ | Level 1 – quoted prices in active markets for identical securities |
| ■ | Level 2 – other significant observable inputs (including quoted prices for similar securities, interest rates, prepayment speeds, credit risk, etc.) |
| ■ | Level 3 – significant unobservable inputs (including the Fund’s own assumptions in determining the fair value of investments) |
The inputs or methodologies used for valuing investments in securities are not necessarily an indication of the risk associated with investing in those securities.
The following is a summary of the inputs used in valuing the Fund’s assets and liabilities as of September 30, 2022:
| | Quoted prices
(Level 1) | Other significant
observable inputs
(Level 2) | Significant
unobservable inputs
(Level 3) | Total |
| Assets | | | | |
| Investments in: | | | | |
| Common stocks | | | | |
| Communication services | $ 21,668,742 | $ 0 | $0 | $ 21,668,742 |
| Consumer discretionary | 304,557,130 | 0 | 0 | 304,557,130 |
| Consumer staples | 382,708,109 | 0 | 0 | 382,708,109 |
| Energy | 335,049,504 | 0 | 0 | 335,049,504 |
| Financials | 768,464,727 | 38,175 | 0 | 768,502,902 |
| Health care | 223,598,288 | 0 | 0 | 223,598,288 |
| Industrials | 1,337,906,196 | 0 | 0 | 1,337,906,196 |
| Information technology | 194,279,222 | 0 | 0 | 194,279,222 |
| Materials | 738,448,708 | 0 | 0 | 738,448,708 |
| Real estate | 25,469,200 | 0 | 0 | 25,469,200 |
| Utilities | 30,835,754 | 0 | 0 | 30,835,754 |
| Investment companies | 51,830,233 | 0 | 0 | 51,830,233 |
| Short-term investments | | | | |
| Investment companies | 126,678,275 | 0 | 0 | 126,678,275 |
| Total assets | $4,541,494,088 | $38,175 | $0 | $4,541,532,263 |
| Liabilities | | | | |
| Written options | $ 4,831,625 | $ 12,392 | $0 | $ 4,844,017 |
| Total liabilities | $ 4,831,625 | $12,392 | $0 | $ 4,844,017 |
Additional sector, industry or geographic detail, if any, is included in the Portfolio of Investments.
For the six months ended September 30, 2022, the Fund did not have any transfers into/out of Level 3.
4. TRANSACTIONS WITH AFFILIATES
Management fee
Allspring Funds Management, a wholly owned subsidiary of Allspring Global Investments Holdings, LLC, a holding company indirectly owned by certain private funds of GTCR LLC and Reverence Capital Partners, L.P., is the manager of the Fund and provides advisory and fund-level administrative services under an investment management agreement. Under the investment management agreement, Allspring Funds Management is responsible for, among other services, implementing the investment objectives and strategies of the Fund, supervising the subadviser and providing fund-level administrative services in connection
Allspring Special Small Cap Value Fund | 27
Notes to financial statements (unaudited)
with the Fund’s operations. As compensation for its services under the investment management agreement, Allspring Funds Management is entitled to receive a management fee at the following annual rate based on the Fund’s average daily net assets:
| Average daily net assets | Management fee |
| First $500 million | 0.850% |
| Next $500 million | 0.825 |
| Next $1 billion | 0.800 |
| Next $1 billion | 0.775 |
| Next $1 billion | 0.750 |
| Next $1 billion | 0.730 |
| Next $5 billion | 0.720 |
| Over $10 billion | 0.710 |
For the six months ended September 30, 2022, the management fee was equivalent to an annual rate of 0.77% of the Fund’s average daily net assets.
Allspring Funds Management has retained the services of a subadviser to provide daily portfolio management to the Fund. The fee for subadvisory services is borne by Allspring Funds Management. Allspring Global Investments, LLC ("Allspring Investments"), an affiliate of Allspring Funds Management and a wholly owned subsidiary of Allspring Global Investments Holdings, LLC, is the subadviser to the Fund and is entitled to receive a fee from Allspring Funds Management at an annual rate starting at 0.55% and declining to 0.40% as the average daily net assets of the Fund increase.
Administration fees
Under a class-level administration agreement, Allspring Funds Management provides class-level administrative services to the Fund, which includes paying fees and expenses for services provided by the transfer agent, sub-transfer agents, omnibus account servicers and record-keepers. As compensation for its services under the class-level administration agreement, Allspring Funds Management receives an annual fee which is calculated based on the average daily net assets of each class as follows:
| | Class-level
administration fee |
| Class A | 0.21% |
| Class C | 0.21 |
| Class R | 0.21 |
| Class R6 | 0.03 |
| Administrator Class | 0.13 |
| Institutional Class | 0.13 |
Waivers and/or expense reimbursements
Allspring Funds Management has contractually committed to waive and/or reimburse management and administration fees to the extent necessary to maintain certain net operating expense ratios for the Fund. When each class of the Fund has exceeded its expense cap, Allspring Funds Management will waive fees and/or reimburse expenses from fund-level expenses on a proportionate basis and then from class specific expenses. When only certain classes exceed their expense caps, waivers and/or reimbursements are applied against class specific expenses before fund-level expenses. Allspring Funds Management has contractually committed through July 31, 2023 to waive fees and/or reimburse expenses to the extent necessary to cap expenses. Prior to or after the commitment expiration date, the caps may be increased or the commitment to maintain the caps may be terminated only with the approval of the Board of Trustees. As of September 30, 2022, the contractual expense caps are as follows:
28 | Allspring Special Small Cap Value Fund
Notes to financial statements (unaudited)
| | Expense ratio caps |
| Class A | 1.31% |
| Class C | 2.06 |
| Class R | 1.56 |
| Class R6 | 0.89 |
| Administrator Class | 1.20 |
| Institutional Class | 0.94 |
Distribution fees
The Trust has adopted a distribution plan for Class C and Class R shares pursuant to Rule 12b-1 under the 1940 Act. Distribution fees are charged to Class C and Class R shares and paid to Allspring Funds Distributor, LLC ("Allspring Funds Distributor"), the principal underwriter, an affiliate of Allspring Funds Management, at an annual rate of 0.75% of the average daily net assets of Class C shares and 0.25% of the average daily net assets of Class R shares.
In addition, Allspring Funds Distributor is entitled to receive the front-end sales charge from the purchase of Class A shares and a contingent deferred sales charge on the redemption of certain Class A shares. Allspring Funds Distributor is also entitled to receive the contingent deferred sales charges from redemptions of Class C shares. For the six months ended September 30, 2022, Allspring Funds Distributor received $665 from the sale of Class A shares. No contingent deferred sales charges were incurred by Class A and Class C shares for the six months ended September 30, 2022.
Shareholder servicing fees
The Trust has entered into contracts with one or more shareholder servicing agents, whereby Class A, Class C, Class R, and Administrator Class are charged a fee at an annual rate of 0.25% of the average daily net assets of each respective class. A portion of these total shareholder servicing fees were paid to affiliates.
Interfund transactions
The Fund may purchase or sell portfolio investment securities to certain affiliates pursuant to Rule 17a-7 under the 1940 Act and under procedures adopted by the Board of Trustees. The procedures have been designed to ensure that these interfund transactions, which do not incur broker commissions, are effected at current market prices.
5. INVESTMENT PORTFOLIO TRANSACTIONS
Purchases and sales of investments, excluding U.S. government obligations (if any) and short-term securities, for the six months ended September 30, 2022 were $646,983,060 and $761,743,125, respectively.
6. SECURITIES LENDING TRANSACTIONS
The Fund lends its securities through an unaffiliated securities lending agent and receives collateral in the form of cash or securities with a value at least equal to the value of the securities on loan. The value of the loaned securities is determined at the close of each business day and any increases or decreases in the required collateral are exchanged between the Fund and the counterparty on the next business day. Cash collateral received is invested in the Securities Lending Fund which seeks to provide a positive return compared to the daily Federal Funds Open Rate by investing in high-quality, U.S. dollar-denominated short-term money market instruments and is exempt from registration under Section 3(c)(7) of the 1940 Act. Securities Lending Fund is managed by Allspring Funds Management and is subadvised by Allspring Investments. Allspring Funds Management receives an advisory fee starting at 0.05% and declining to 0.01% as the average daily net assets of the Securities Lending Fund increase. All of the fees received by Allspring Funds Management are paid to Allspring Investments for its services as subadviser.
In the event of counterparty default or the failure of a borrower to return a loaned security, the Fund has the right to use the collateral to offset any losses incurred. As of September 30, 2022, the Fund had securities lending transactions with the following counterparties which are subject to offset:
Allspring Special Small Cap Value Fund | 29
Notes to financial statements (unaudited)
| Counterparty | Value of
securities on
loan | Collateral
received1 | Net amount |
| Bank of America Securities Incorporated | $ 12,810 | $ (12,810) | $0 |
| JPMorgan Securities LLC | 105,000 | (105,000) | 0 |
| National Financial Services LLC | 766,238 | (766,238) | 0 |
| UBS Securities LLC | 788,400 | (788,400) | 0 |
1 Collateral received within this table is limited to the collateral for the net transaction with the counterparty.
7. DERIVATIVE TRANSACTIONS
During the six months ended September 30, 2022, the Fund entered into written options for hedging purposes and had an average of 16,245 written option contracts.
The fair value, realized gains or losses and change in unrealized gains or losses, if any, on derivative instruments are reflected in the corresponding financial statement captions.
The Fund's written option contracts are subject to a master netting arrangement. As of September 30, 2022, the Fund had written options contracts with the following counterparty which are subject to offset:
| Counterparty | Value of
written
options | Collateral
received1 | Net amount |
| Bank of America Securities Incorporated | $4,844,017 | $(4,844,017) | $0 |
1 Collateral pledged within this table is limited to the collateral for the net transaction with the counterparty.
8. BANK BORROWINGS
The Trust (excluding the money market funds), Allspring Master Trust and Allspring Variable Trust are parties to a $350,000,000 revolving credit agreement whereby the Fund is permitted to use bank borrowings for temporary or emergency purposes, such as to fund shareholder redemption requests. Interest under the credit agreement is charged to the Fund based on a borrowing rate equal to the higher of the Federal Funds rate or the overnight bank funding rate in effect on that day plus a spread. In addition, an annual commitment fee equal based on the unused balance is allocated to each participating fund.
For the six months ended September 30, 2022, there were no borrowings by the Fund under the agreement.
9. CONCENTRATION RISKS
As of the end of the period, the Fund concentrated its portfolio of investments in industrials sector. A fund that invests a substantial portion of its assets in any sector may be more affected by changes in that sector than would be a fund whose investments are not heavily weighted in any sector.
10. INDEMNIFICATION
Under the Fund's organizational documents, the officers and Trustees have been granted certain indemnification rights against certain liabilities that may arise out of performance of their duties to the Fund. The Fund has entered into a separate agreement with each Trustee that converts indemnification rights currently existing under the Fund’s organizational documents into contractual rights that cannot be changed in the future without the consent of the Trustee. Additionally, in the normal course of business, the Fund may enter into contracts with service providers that contain a variety of indemnification clauses. The Fund’s maximum exposure under these arrangements is dependent on future claims that may be made against the Fund and, therefore, cannot be estimated.
11. REDEMPTIONS IN-KIND
During the year ended March 31, 2022, the Fund redeemed assets through in-kind redemptions for shareholders in Class R6. These redemption transactions are reflected on the Statement of Changes in Net Assets. The date of the redemption transaction, value of securities issued from the redemption, cash paid, realized gains (losses) and the percentage of the Fund redeemed by the shareholders was as follows:
30 | Allspring Special Small Cap Value Fund
Notes to financial statements (unaudited)
| Date | Value of
securities issued | Cash | Realized
gains (losses) | % of the
Fund |
| 11-8-2021 | $ 31,199,229 | $645,412 | $ 17,188,502 | 0.50 % |
12. CORONAVIRUS (COVID-19) PANDEMIC
On March 11, 2020, the World Health Organization announced that it had made the assessment that coronavirus disease 2019 (“COVID-19”) is a pandemic. The impacts of COVID-19 are affecting the entire global economy, individual companies and investment products, the funds, and the market in general. There is significant uncertainty around the extent and duration of business disruptions related to COVID-19 and the impacts may last for an extended period of time. COVID-19 has led to significant uncertainty and volatility in the financial markets.
Allspring Special Small Cap Value Fund | 31
Other information (unaudited)
PROXY VOTING INFORMATION
A description of the policies and procedures used to determine how to vote proxies relating to portfolio securities is available without charge, upon request, by calling 1-800-222-8222, visiting our website at allspringglobal.com, or visiting the SEC website at sec.gov. Information regarding how the proxies related to portfolio securities were voted during the most recent 12-month period ended June 30 is available on the website at allspringglobal.com or by visiting the SEC website at sec.gov.
QUARTERLY PORTFOLIO HOLDINGS INFORMATION
The Fund files its complete schedule of portfolio holdings with the SEC for the first and third quarters of each fiscal year as an exhibit to its reports on Form N-PORT. Shareholders may view the filed Form N-PORT by visiting the SEC website at sec.gov.
32 | Allspring Special Small Cap Value Fund
Other information (unaudited)
BOARD OF TRUSTEES AND OFFICERS
Each of the Trustees and Officers listed in the table below acts in identical capacities for each fund in the Allspring family of funds, which consists of 124 mutual funds comprising the Allspring Funds Trust, Allspring Variable Trust, Allspring Master Trust and four closed-end funds (collectively the “Fund Complex”). This table should be read in conjunction with the Prospectus and the Statement of Additional Information1. The mailing address of each Trustee and Officer is 525 Market Street, 12th Floor, San Francisco, CA 94105. Each Trustee and Officer serves an indefinite term, however, each Trustee serves such term until reaching the mandatory retirement age established by the Trustees.
Independent Trustees
Name and
year of birth | Position held and
length of service* | Principal occupations during past five years or longer | Current other
public company or
investment
company
directorships |
William R. Ebsworth
(Born 1957) | Trustee,
since 2015 | Retired. From 1984 to 2013, equities analyst, portfolio manager, research director and chief investment officer at Fidelity Management and Research Company in Boston, Tokyo, and Hong Kong, and retired in 2013 as Chief Investment Officer of Fidelity Strategic Advisers, Inc. where he led a team of investment professionals managing client assets. Prior thereto, Board member of Hong Kong Securities Clearing Co., Hong Kong Options Clearing Corp., the Thailand International Fund, Ltd., Fidelity Investments Life Insurance Company, and Empire Fidelity Investments Life Insurance Company. Audit Committee Chair and Investment Committee Chair of the Vincent Memorial Hospital Endowment (non-profit organization). Mr. Ebsworth is a CFA® charterholder. | N/A |
Jane A. Freeman
(Born 1953) | Trustee,
since 2015;
Chair Liaison,
since 2018 | Retired. From 2012 to 2014 and 1999 to 2008, Chief Financial Officer of Scientific Learning Corporation. From 2008 to 2012, Ms. Freeman provided consulting services related to strategic business projects. Prior to 1999, Portfolio Manager at Rockefeller & Co. and Scudder, Stevens & Clark. Board member of the Harding Loevner Funds from 1996 to 2014, serving as both Lead Independent Director and chair of the Audit Committee. Board member of the Russell Exchange Traded Funds Trust from 2011 to 2012 and the chair of the Audit Committee. Ms. Freeman is also an inactive Chartered Financial Analyst. | N/A |
Isaiah Harris, Jr.
(Born 1952) | Trustee,
since 2009; Audit
Committee
Chair,
since 2019 | Retired. Chairman of the Board of CIGNA Corporation from 2009 to 2021, and Director from 2005 to 2008. From 2003 to 2011, Director of Deluxe Corporation. Prior thereto, President and CEO of BellSouth Advertising and Publishing Corp. from 2005 to 2007, President and CEO of BellSouth Enterprises from 2004 to 2005 and President of BellSouth Consumer Services from 2000 to 2003. Emeritus member of the Iowa State University Foundation Board of Governors. Emeritus Member of the Advisory Board of Iowa State University School of Business. Advisory Board Member, Palm Harbor Academy (private school). Advisory Board Member, Fellowship of Christian Athletes. Mr. Harris is a certified public accountant (inactive status). | N/A |
David F. Larcker
(Born 1950) | Trustee,
since 2009 | James Irvin Miller Professor of Accounting at the Graduate School of Business (Emeritus), Stanford University, Director of the Corporate Governance Research Initiative and Senior Faculty of The Rock Center for Corporate Governance since 2006. From 2005 to 2008, Professor of Accounting at the Graduate School of Business, Stanford University. Prior thereto, Ernst & Young Professor of Accounting at The Wharton School, University of Pennsylvania from 1985 to 2005. | N/A |
Allspring Special Small Cap Value Fund | 33
Other information (unaudited)
Name and
year of birth | Position held and
length of service* | Principal occupations during past five years or longer | Current other
public company or
investment
company
directorships |
Olivia S. Mitchell
(Born 1953) | Trustee,
since 2006;
Nominating and
Governance
Committee Chair,
since 2018 | International Foundation of Employee Benefit Plans Professor since 1993, Wharton School of the University of Pennsylvania. Director of Wharton’s Pension Research Council and Boettner Center on Pensions & Retirement Research, and Research Associate at the National Bureau of Economic Research. Previously taught at Cornell University from 1978 to 1993. | N/A |
Timothy J. Penny
(Born 1951) | Trustee,
since 1996;
Chair,
since 2018 | President and Chief Executive Officer of Southern Minnesota Initiative Foundation, a non-profit organization, since 2007. Vice Chair of the Economic Club of Minnesota, since 2007. Co-Chair of the Committee for a Responsible Federal Budget, since 1995. Member of the Board of Trustees of NorthStar Education Finance, Inc., a non-profit organization, since 2007. Senior Fellow of the University of Minnesota Humphrey Institute from 1995 to 2017. | N/A |
James G. Polisson
(Born 1959) | Trustee,
since 2018 | Retired. Chief Marketing Officer, Source (ETF) UK Services, Ltd, from 2015 to 2017. From 2012 to 2015, Principal of The Polisson Group, LLC, a management consulting, corporate advisory and principal investing company. Chief Executive Officer and Managing Director at Russell Investments, Global Exchange Traded Funds from 2010 to 2012. Managing Director of Barclays Global Investors from 1998 to 2010 and Global Chief Marketing Officer for iShares and Barclays Global Investors from 2000 to 2010. Trustee of the San Francisco Mechanics’ Institute, a non-profit organization, from 2013 to 2015. Board member of the Russell Exchange Traded Fund Trust from 2011 to 2012. Director of Barclays Global Investors Holdings Deutschland GmbH from 2006 to 2009. Mr. Polisson is an attorney and has a retired status with the Massachusetts and District of Columbia Bar Associations. | N/A |
Pamela Wheelock
(Born 1959) | Trustee,
since January
2020; previously
Trustee from
January 2018 to
July 2019 | Retired. Executive and Senior Financial leadership positions in the public, private and nonprofit sectors. Interim President and CEO, McKnight Foundation, 2020. Interim Commissioner, Minnesota Department of Human Services, 2019. Chief Operating Officer, Twin Cities Habitat for Humanity, 2017-2019. Vice President for University Services, University of Minnesota, 2012-2016. Interim President and CEO, Blue Cross and Blue Shield of Minnesota, 2011-2012. Executive Vice-President and Chief Financial Officer, Minnesota Wild, 2002-2008. Commissioner, Minnesota Department of Finance, 1999-2002. Chair of the Board of Directors of Destination Medical Center Corporation. Board member of the Minnesota Wild Foundation. | N/A |
* Length of service dates reflect the Trustee’s commencement of service with the Trust’s predecessor entities, where applicable.
34 | Allspring Special Small Cap Value Fund
Other information (unaudited)
Officers2
Name and
year of birth | Position held and
length of service | Principal occupations during past five years or longer |
Andrew Owen
(Born 1960) | President,
since 2017 | President and Chief Executive Officer of Allspring Funds Management, LLC since 2017 and Head of Global Fund Governance of Allspring Global Investments since 2022. Prior thereto, co-president of Galliard Capital Management, LLC, an affiliate of Allspring Funds Management, LLC, from 2019 to 2022 and Head of Affiliated Managers, Allspring Global Investments, from 2014 to 2019 and Executive Vice President responsible for marketing, investments and product development for Allspring Funds Management, LLC, from 2009 to 2014. |
Jeremy DePalma
(Born 1974) | Treasurer,
since 2012
(for certain funds in
the Fund Complex);
since 2021 (for
the remaining funds in the
Fund Complex) | Senior Vice President of Allspring Funds Management, LLC since 2009. Senior Vice President of Evergreen Investment Management Company, LLC from 2008 to 2010 and head of the Fund Reporting and Control Team within Fund Administration from 2005 to 2010. |
Christopher Baker
(Born 1976) | Chief Compliance Officer, since 2022 | Global Chief Compliance Officer for Allspring Global Investments since 2022. Prior thereto, Chief Compliance Officer for State Street Global Advisors from 2018 to 2021. Senior Compliance Officer for the State Street divisions of Alternative Investment Solutions, Sector Solutions, and Global Marketing from 2015 to 2018. From 2010 to 2015 Vice President, Global Head of Investment and Marketing Compliance for State Street Global Advisors. |
Matthew Prasse
(Born 1983) | Chief Legal Officer, since 2022; Secretary, since 2021 | Senior Counsel of the Allspring Legal Department since 2021. Senior Counsel of the Wells Fargo Legal Department from 2018 to 2021. Previously, Counsel for Barings LLC from 2015 to 2018. Prior to joining Barings, Associate at Morgan, Lewis & Bockius LLP from 2008 to 2015. |
1 The Statement of Additional Information includes additional information about the Trustees and is available, without charge, upon request, by calling 1-800-222-8222 or by visiting the website at allspringglobal.com.
2 For those Officers with tenures at Allspring Global Investments and/or Allspring Funds Management, LLC that began prior to 2021, such tenures include years of service during which these businesses/entities were known as Wells Fargo Asset Management and Wells Fargo Funds Management, LLC, respectively.
Allspring Special Small Cap Value Fund | 35
Other information (unaudited)
LIQUIDITY RISK MANAGEMENT PROGRAM
In accordance with Rule 22e-4 under the Investment Company Act of 1940, as amended (the “Liquidity Rule”), Allspring Funds Trust (the “Trust”) has adopted and implemented a liquidity risk management program (the “Program”) on behalf of each of its series (other than the series that operate as money market funds), including the Fund, which is reasonably designed to assess and manage the Fund's liquidity risk. “Liquidity risk” is defined under the Liquidity Rule as the risk that the Fund is unable to meet redemption requests without significantly diluting remaining investors’ interests in the Fund. The Trust’s Board of Trustees (the “Board”) previously approved the designation of Allspring Funds Management, LLC (“Allspring Funds Management”), the Fund's investment manager, to administer the Program, and Allspring Funds Management has established a Liquidity Risk Management Council (the "Council") composed of personnel from multiple departments within Allspring Funds Management and its affiliates to assist Allspring Funds Management in the administration of the Program.
The Program is comprised of various components designed to support the assessment and/or management of liquidity risk, including: (1) the periodic assessment (no less frequently than annually) of certain factors that influence the Fund's liquidity risk; (2) the periodic classification (no less frequently than monthly) of the Fund's investments into one of four liquidity categories that reflect an estimate of their liquidity under current market conditions; (3) a 15% limit on the acquisition of “illiquid investments” (as defined under the Liquidity Rule); (4) to the extent the Fund does not invest primarily in “highly liquid investments” (as defined under the Liquidity Rule), the determination of a minimum percentage of the Fund's assets that generally will be invested in highly liquid investments (an “HLIM”); (5) if the Fund has established an HLIM, the periodic review (no less frequently than annually) of the HLIM and the adoption of policies and procedures for responding to a shortfall of the Fund's “highly liquid investments” below its HLIM; and (6) periodic reporting to the Board.
At a meeting of the Board held on May 24-25, 2022, the Board received and reviewed a written report (the “Report”) from Allspring Funds Management that, among other things, addressed the operation of the Program and assessed its adequacy and effectiveness for the period from January 1, 2021 through December 31, 2021 (the “Reporting Period”). Other than extended foreign market holidays, no significant liquidity events impacting the Funds were noted in the Report. In addition, other than corporate-related changes to the Program, there were no material changes to the Program during the Reporting Period.
Allspring Funds Management determined in the Report that the Program has been implemented and operates effectively to manage the Fund’s liquidity risk, and Allspring Funds Management continues to believe that the Program has been and continues to be adequately and effectively implemented to monitor and, as applicable, respond to the Fund’s liquidity developments.
There can be no assurance that the Program will achieve its objectives under all circumstances in the future. Please refer to the Fund’s prospectus for more information regarding the Fund’s exposure to liquidity risk and other risks to which an investment in the Fund may be subject.
36 | Allspring Special Small Cap Value Fund
For more information
More information about Allspring Funds is available free upon request. To obtain literature, please write, visit the Fund's website, or call:
Allspring Funds
P.O. Box 219967
Kansas City, MO 64121-9967
Website: allspringglobal.com
Individual investors: 1-800-222-8222
Retail investment professionals: 1-888-877-9275
Institutional investment professionals: 1-800-260-5969
This report and the financial statements contained herein are submitted for the general information of the shareholders of the Fund. If this report is used for promotional purposes, distribution of the report must be accompanied or preceded by a current prospectus. Before investing, please consider the investment objectives, risks, charges, and expenses of the investment. For a current prospectus and, if available, a summary prospectus, containing this information, call
1-800-222-8222 or visit the Fund's website at allspringglobal.com. Read the prospectus carefully before you invest or send money.
Allspring Global InvestmentsTM is the trade name for the asset management firms of Allspring Global Investments Holdings, LLC, a holding company indirectly owned by certain private funds of GTCR LLC and Reverence Capital Partners, L.P. These firms include but are not limited to Allspring Global Investments, LLC, and Allspring Funds Management, LLC. Certain products managed by Allspring entities are distributed by Allspring Funds Distributor, LLC (a broker-dealer and Member FINRA/SIPC).
This material is for general informational and educational purposes only and is NOT intended to provide investment advice or a recommendation of any kind - including a recommendation for any specific investment, strategy, or plan.
© 2022 Allspring Global Investments Holdings, LLC. All rights reserved.
PAR-1022-00365 11-22
SA246/SAR246 09-22
Semi-Annual Report
September 30, 2022
Allspring Precious Metals Fund
The views expressed and any forward-looking statements are as of September 30, 2022, unless otherwise noted, and are those of the Fund's portfolio managers and/or Allspring Global Investments. Discussions of individual securities or the markets generally are not intended as individual recommendations. Future events or results may vary significantly from those expressed in any forward-looking statements. The views expressed are subject to change at any time in response to changing circumstances in the market. Allspring Global Investments disclaims any obligation to publicly update or revise any views expressed or forward-looking statements.
Allspring Precious Metals Fund | 1
Letter to shareholders (unaudited)
Andrew Owen
President
Allspring Funds
Dear Shareholder:
We are pleased to offer you this semi-annual report for Allspring Precious Metals Fund for the six-month period that ended September 30, 2022. Globally, stocks and bonds experienced heightened volatility through the extremely difficult period. Non-U.S. securities fared the worst as the global economy faced multiple challenges and the strength of the U.S. dollar eroded already-poor returns of non-U.S.-dollar-denominated assets. Bonds had historically poor performance, with major fixed income indexes falling substantially for the six-month period.
Earlier tailwinds provided by global stimulus programs, vaccination rollouts, and recovering consumer and corporate sentiment were wiped away by the highest rate of inflation in four decades, the impact of ongoing aggressive central bank rate hikes and the prospect of more, plus the global reverberations of the Russia-Ukraine war. The already-significant global supply chain disruptions were compounded by China’s COVID-19 lockdowns.
For the six-month period, both stocks and bonds registered major losses, with even U.S. bonds suffering deep losses and other assets faring worse. For the period, U.S. stocks, based on the S&P 500 Index,1 lost 20.20%. International stocks, as measured by the MSCI ACWI ex USA Index (Net),2 returned -22.27%, while the MSCI EM Index (Net) (USD)3 declined 21.70%. Among bond indexes, the Bloomberg U.S. Aggregate Bond Index,4 returned -9.22%, the Bloomberg Global Aggregate ex-USD Index (unhedged),5 returned -18.89%, the Bloomberg Municipal Bond Index6 declined 6.30%, and the ICE BofA U.S. High Yield Index7 fell 10.56%.
| 1 | The S&P 500 Index consists of 500 stocks chosen for market size, liquidity, and industry group representation. It is a market-value-weighted index with each stock's weight in the index proportionate to its market value. You cannot invest directly in an index. |
| 2 | The Morgan Stanley Capital International (MSCI) All Country World Index (ACWI) ex USA Index (Net) is a free-float-adjusted market-capitalization-weighted index that is designed to measure the equity market performance of developed and emerging markets, excluding the U.S. Source: MSCI. MSCI makes no express or implied warranties or representations and shall have no liability whatsoever with respect to any MSCI data contained herein. The MSCI data may not be further redistributed or used as a basis for other indexes or any securities or financial products. This report is not approved, reviewed, or produced by MSCI. You cannot invest directly in an index. |
| 3 | The MSCI Emerging Markets (EM) Index (Net) (USD) is a free-float-adjusted market-capitalization-weighted index that is designed to measure equity market performance of emerging markets. You cannot invest directly in an index. |
| 4 | The Bloomberg U.S. Aggregate Bond Index is a broad-based benchmark that measures the investment-grade, U.S.-dollar-denominated, fixed-rate taxable bond market, including Treasuries, government-related and corporate securities, mortgage-backed securities (agency fixed-rate and hybrid adjustable-rate mortgage pass-throughs), asset-backed securities, and commercial mortgage-backed securities. You cannot invest directly in an index. |
| 5 | The Bloomberg Global Aggregate ex-USD Index (unhedged) is an unmanaged index that provides a broad-based measure of the global investment-grade fixed-income markets excluding the U.S.-dollar-denominated debt market. You cannot invest directly in an index. |
| 6 | The Bloomberg Municipal Bond Index is an unmanaged index composed of long-term tax-exempt bonds with a minimum credit rating of Baa. You cannot invest directly in an index. |
| 7 | The ICE BofA U.S. High Yield Index is a market-capitalization-weighted index of domestic and Yankee high-yield bonds. The index tracks the performance of high-yield securities traded in the U.S. bond market. You cannot invest directly in an index. Copyright 2022. ICE Data Indices, LLC. All rights reserved. |
2 | Allspring Precious Metals Fund
Letter to shareholders (unaudited)
Rising inflation, COVID, and the Russian invasion of Ukraine drove market performance.
Just before the six-month reporting period began, global financial markets had been rocked by the Russian invasion of Ukraine and resulting spike in volatility. In April, the market misery continued, with broad and deep losses, as both the S&P 500 Index and MSCI ACWI (Net)1 fell 8% or more for the month. The Chinese economy struggled through a strict lockdown as the government tried to contain a major COVID-19 outbreak. The ensuing global ripple effect compounded existing supply shortages. This was exacerbated by the impact of the Russia-Ukraine war on global commodities. Meanwhile, U.S. annual inflation raged at 8.5%, its highest level since 1981, and investors braced themselves for aggressive Federal Reserve (Fed) monetary tightening moves.
Market volatility continued in May, although markets recovered ground late in the month. Value stocks outperformed growth stocks. The concerns that had dominated markets for months continued, including high inflation and geopolitical tensions that added to high crude oil, gasoline, and food prices. In response, the Fed raised the federal funds rate by 0.50%, with widescale expectations of multiple rate hikes to come. Meanwhile, highly contagious COVID-19 variants persisted. However, labor markets in the U.S., the U.K., and Europe remained strong. U.S. retail sales for April, released in May, indicated a fourth consecutive monthly increase, reflecting continued consumer resilience.
A dreadful year in financial markets continued in June with stocks posting further losses en route to their worst first half of a year in 50 years. Bonds didn’t fare much better. Driving the losses were the same factors that have been at play: rising global inflation and fears of recession as central banks increase rates to try to curb inflation, which climbed above 9% in June in the U.S. The Fed raised its short-term rate by another 0.75% in June. Meanwhile, U.S. economic data showed resilience as the U.S. unemployment rate held steady at 3.6% and the housing market was only marginally affected, so far, by sharply higher mortgage rates.
Markets rebounded in July, led by U.S. stocks. While evidence began to point to an economic slowdown after two consecutive quarters of declining gross domestic product (economic contraction), the U.S. labor market remained surprisingly strong: July nonfarm payrolls grew by more than 500,000 and U.S. unemployment dipped to 3.5%. Meanwhile, crude oil and retail gasoline prices, major contributors to recent overall inflation, fell substantially from earlier highs. And while U.S. home prices rose, sales fell as houses became less affordable with mortgage rates at a 13-year high. The Fed raised the federal funds rate another 0.75% in July—to a range of 2.25% to 2.50%—and forecasts pointed to continued rate increases.
August was yet another broadly challenging month for financial markets, with more red ink flowing. High inflation persisted, cresting 9% in the eurozone and remaining above 8% in the U.S. despite the Fed’s aggressive monetary policy and a major drop in global crude oil and gasoline prices from their June peak. One positive note in the U.S. was the resilience of the country’s jobs market. However, the Fed’s job was clearly not complete. One longer-term bright spot was the U.S. Congress’s passage of the Inflation Reduction Act. Its primary stated goals include include to reduce inflation (though not immediately) by curbing the deficit, capping health care spending by seniors, and investing in domestic sources of clean energy.
“ Just before the six-month reporting period began, global financial markets had been rocked by the Russian invasion of Ukraine and resulting spike in volatility. In April, the market misery continued, with broad and deep losses, as both the S&P 500 Index and MSCI ACWI (Net) fell 8% or more for the month.”
| 1 | The MSCI ACWI (Net) is a free-float-adjusted market-capitalization-weighted index that is designed to measure the equity market performance of developed and emerging markets. You cannot invest directly in an index. |
Allspring Precious Metals Fund | 3
Letter to shareholders (unaudited)
The market misery continued in September. There was nowhere to hide as all asset classes suffered major losses at the hands of persistent inflation. Central banks kept up their battle against rapidly rising prices with more rate hikes. The strength of the U.S. dollar made things even more difficult for investors holding assets in other currencies. U.S. mortgage rates jumped to near 7% on 30-year fixed-rate mortgages; the decreased housing affordability began to cool demand somewhat. The U.K. experienced a sharp sell-off of government bonds and the British pound in September as investors panicked in response to a new government budget that was seen as financially unsound. The market meltdown forced the Bank of England to step in and buy long-dated government bonds. The drama continued into the next fiscal year.
Don’t let short-term uncertainty derail long-term investment goals.
Periods of investment uncertainty can present challenges, but experience has taught us that maintaining long-term investment goals can be an effective way to plan for the future. To help you create a sound strategy based on your personal goals and risk tolerance, Allspring Funds offers more than 100 mutual funds spanning a wide range of asset classes and investment styles. Although diversification cannot guarantee an investment profit or prevent losses, we believe it can be an effective way to manage investment risk and potentially smooth out overall portfolio performance. We encourage investors to know their investments and to understand that appropriate levels of risk-taking may unlock opportunities.
Thank you for choosing to invest with Allspring Funds. We appreciate your confidence in us and remain committed to helping you meet your financial needs.
Sincerely,
Andrew Owen
President
Allspring Funds
For further information about your fund, contact your investment professional, visit our website at allspringglobal.com, or call us directly at 1-800-222-8222.
4 | Allspring Precious Metals Fund
This page is intentionally left blank.
Performance highlights (unaudited)
| Investment objective | The Fund seeks long-term capital appreciation. |
| Manager | Allspring Funds Management, LLC |
| Subadviser | Allspring Global Investments, LLC |
| Portfolio managers | Michael Bradshaw, CFA®‡, Oleg Makhorine |
| Average annual total returns (%) as of September 30, 2022 |
| | | Including sales charge | | Excluding sales charge | | Expense ratios1 (%) |
| | Inception date | 1 year | 5 year | 10 year | | 1 year | 5 year | 10 year | | Gross | Net 2 |
| Class A (EKWAX) | 1-20-1998 | -20.01 | -0.19 | -6.88 | | -15.12 | 1.00 | -6.32 | | 1.18 | 1.09 |
| Class C (EKWCX) | 1-29-1998 | -16.74 | 0.24 | -6.88 | | -15.74 | 0.24 | -6.88 | | 1.93 | 1.84 |
| Administrator Class (EKWDX) | 7-30-2010 | – | – | – | | -14.99 | 1.14 | -6.19 | | 1.10 | 0.95 |
| Institutional Class (EKWYX) | 2-29-2000 | – | – | – | | -14.86 | 1.30 | -6.04 | | 0.85 | 0.79 |
| FTSE Gold Mines Index3 | – | – | – | – | | -19.59 | 1.01 | -6.49 | | – | – |
| S&P 500 Index4 | – | – | – | – | | -15.47 | 9.24 | 11.70 | | – | – |
Figures quoted represent past performance, which is no guarantee of future results, and do not reflect taxes that a shareholder may pay on an investment in a fund. Investment return and principal value of an investment will fluctuate so that an investor’s shares, when redeemed, may be worth more or less than their original cost. Performance shown without sales charges would be lower if sales charges were reflected. Current performance may be lower or higher than the performance data quoted, which assumes the reinvestment of dividends and capital gains. Current month-end performance is available on the Fund’s website, allspringglobal.com.
While the S&P 500 Index is comprised of U.S. equity securities of companies diversified across ten sectors, the Fund’s holdings are concentrated primarily in precious metals related stocks. Therefore, the performance of the S&P 500 Index is displayed only to show how the concentrated Fund performed compared with a diversified selection of U.S. equity securities.
Index returns do not include transaction costs associated with buying and selling securities, any mutual fund fees or expenses, or any taxes. It is not possible to invest directly in an index.
For Class A shares, the maximum front-end sales charge is 5.75%. For Class C shares, the maximum contingent deferred sales charge is 1.00%. Performance including a contingent deferred sales charge assumes the sales charge for the corresponding time period. Administrator Class and Institutional Class shares are sold without a front-end sales charge or contingent deferred sales charge.
| 1 | Reflects the expense ratios as stated in the most recent prospectuses. The expense ratios shown are subject to change and may differ from the annualized expense ratios shown in the financial highlights of this report. |
| 2 | The manager has contractually committed through July 31, 2023, to waive fees and/or reimburse expenses to the extent necessary to cap total annual fund operating expenses after fee waivers at 1.09% for Class A, 1.84% for Class C, 0.95% for Administrator Class, and 0.79% for Institutional Class. Brokerage commissions, stamp duty fees, interest, taxes, acquired fund fees and expenses (if any), and extraordinary expenses are excluded from the expense caps. Prior to or after the commitment expiration date, the caps may be increased or the commitment to maintain the caps may be terminated only with the approval of the Board of Trustees. Without these caps, the Fund’s returns would have been lower. The expense ratio paid by an investor is the net expense ratio (the total annual fund operating expenses after fee waivers) as stated in the prospectuses. |
| 3 | FTSE Gold Mines Index is an unmanaged, open-ended index designed to reflect the performance of the worldwide market in the shares of companies whose principal activity is the mining of gold. You cannot invest directly in an index. |
| 4 | The S&P 500 Index consists of 500 stocks chosen for market size, liquidity, and industry group representation. It is a market-value weighted index with each stock’s weight in the index proportionate to its market value. You cannot invest directly in an index. |
| ‡ | CFA® and Chartered Financial Analyst® are trademarks owned by CFA Institute. |
6 | Allspring Precious Metals Fund
Performance highlights (unaudited)
Stock values fluctuate in response to the activities of individual companies and general market and economic conditions. Bond values fluctuate in response to the financial condition of individual issuers, general market and economic conditions, and changes in interest rates. Changes in market conditions and government policies may lead to periods of heightened volatility in the bond market and reduced liquidity for certain bonds held by the Fund. In general, when interest rates rise, bond values fall and investors may lose principal value. Interest rate changes and their impact on the Fund and its share price can be sudden and unpredictable. Funds that concentrate their investments in limited sectors, such as gold-related investments, are more vulnerable to adverse market, economic, regulatory, political, or other developments affecting those sectors. Certain investment strategies tend to increase the total risk of an investment (relative to the broader market). This fund is exposed to foreign investment risk, geographic, non-diversification risk, smaller-company securities risk, and subsidiary risk. Consult the Fund’s prospectus for additional information on these and other risks.
| Ten largest holdings (%) as of September 30, 20221 |
| Franco-Nevada Corporation-Legend Shares | 6.52 |
| Barrick Gold Corporation | 6.11 |
| Agnico-Eagle Mines Limited | 5.89 |
| Gold Bullion | 5.33 |
| Endeavour Mining plc | 5.31 |
| Wheaton Precious Metals Corporation-U.S. Exchange Traded Shares | 5.13 |
| Royal Gold Incorporated | 5.02 |
| Kinross Gold Corporation | 4.76 |
| Gold Fields Limited ADR | 4.55 |
| B2Gold Corporation | 4.15 |
| 1 | Figures represent the percentage of the Fund's net assets. Holdings are subject to change and may have changed since the date specified. |
| Country allocation as of September 30, 20221 |
| 1 | Figures represent the percentage of the Fund's long-term investments. Allocations are subject to change and may have changed since the date specified. |
Allspring Precious Metals Fund | 7
Consolidated fund expenses (unaudited)
As a shareholder of the Fund, you incur two types of costs: (1) transaction costs, including sales charges (loads) on purchase payments and contingent deferred sales charges (if any) on redemptions and (2) ongoing costs, including management fees, distribution (12b-1) and/or shareholder servicing fees, and other Fund expenses. This example is intended to help you understand your ongoing costs (in dollars) of investing in the Fund and to compare these costs with the ongoing costs of investing in other mutual funds.
The example is based on an investment of $1,000 invested at the beginning of the six-month period and held for the entire period from April 1, 2022 to September 30, 2022.
Actual expenses
The “Actual” line of the table below provides information about actual account values and actual expenses. You may use the information in this line, together with the amount you invested, to estimate the expenses that you paid over the period. Simply divide your account value by $1,000 (for example, an $8,600 account value divided by $1,000 = 8.6), then multiply the result by the number in the “Actual” line under the heading entitled “Expenses paid during period” for your applicable class of shares to estimate the expenses you paid on your account during this period.
Hypothetical example for comparison purposes
The “Hypothetical” line of the table below provides information about hypothetical account values and hypothetical expenses based on the Fund’s actual expense ratio and an assumed rate of return of 5% per year before expenses, which is not the Fund’s actual return. The hypothetical account values and expenses may not be used to estimate the actual ending account balance or expenses you paid for the period. You may use this information to compare the ongoing costs of investing in the Fund and other funds. To do so, compare this 5% hypothetical example with the 5% hypothetical examples that appear in the shareholder reports of the other funds.
Please note that the expenses shown in the table are meant to highlight your ongoing costs only and do not reflect any transactional costs, such as sales charges (loads) and contingent deferred sales charges. Therefore, the “Hypothetical” line of the table is useful in comparing ongoing costs only, and will not help you determine the relative total costs of owning different funds. In addition, if these transactional costs were included, your costs would have been higher.
| | Beginning
account value
4-1-2022 | Ending
account value
9-30-2022 | Consolidated
expenses
paid during
the period1 | Annualized net
expense ratio |
| Class A | | | | |
| Actual | $1,000.00 | $ 664.71 | $4.51 | 1.08% |
| Hypothetical (5% return before expenses) | $1,000.00 | $1,019.65 | $5.47 | 1.08% |
| Class C | | | | |
| Actual | $1,000.00 | $ 662.32 | $7.67 | 1.84% |
| Hypothetical (5% return before expenses) | $1,000.00 | $1,015.84 | $9.30 | 1.84% |
| Administrator Class | | | | |
| Actual | $1,000.00 | $ 665.27 | $3.97 | 0.95% |
| Hypothetical (5% return before expenses) | $1,000.00 | $1,020.31 | $4.81 | 0.95% |
| Institutional Class | | | | |
| Actual | $1,000.00 | $ 665.77 | $3.30 | 0.79% |
| Hypothetical (5% return before expenses) | $1,000.00 | $1,021.11 | $4.00 | 0.79% |
1 Consolidated expenses paid is equal to the annualized net expense ratio of each class multiplied by the average account value over the period, multiplied by 183 divided by 365 (to reflect the one-half-year period).
8 | Allspring Precious Metals Fund
Consolidated portfolio of investments—September 30, 2022 (unaudited)
| | | | | | Shares | Value |
| Common stocks: 93.94% | | | | | | |
| Australia: 7.42% | | | | | | |
| Capricorn Metals Limited (Materials, Metals & mining) † | | | | | 300,000 | $ 574,353 |
| Evolution Mining Limited (Materials, Metals & mining) | | | | | 1,400,000 | 1,826,407 |
| Newcrest Mining Limited (Materials, Metals & mining) | | | | | 702,294 | 7,710,613 |
| Northern Star Resources Limited (Materials, Metals & mining) | | | | | 1,536,412 | 7,693,264 |
| | | | | | | 17,804,637 |
| Canada: 64.79% | | | | | | |
| Agnico-Eagle Mines Limited (Materials, Metals & mining) | | | | | 334,527 | 14,133,272 |
| Agnico-Eagle Mines Limited-Legend Shares (Materials, Metals & mining) | | | | | 35,000 | 1,478,050 |
| Agnico-Eagle Mines Limited-U.S. Exchange Traded Shares (Materials, Metals & mining) | | | | | 124,164 | 5,243,446 |
| Alamos Gold Incorporated Class A (Materials, Metals & mining) | | | | | 1,153,980 | 8,554,498 |
| Artemis Gold Incorporated (Materials, Metals & mining) † | | | | | 900,000 | 2,782,061 |
| Ascot Resources Limited (Materials, Metals & mining) † | | | | | 2,650,000 | 748,181 |
| B2Gold Corporation (Materials, Metals & mining) | | | | | 3,100,000 | 9,964,165 |
| Barrick Gold Corporation (Materials, Metals & mining) | | | | | 945,723 | 14,658,707 |
| Centerra Gold Incorporated (Materials, Metals & mining) | | | | | 200,000 | 880,298 |
| Centerra Gold Incorporated-Legend Shares (Materials, Metals & mining) 144A | | | | | 250,000 | 1,100,373 |
| Dundee Precious Metals Incorporated (Materials, Metals & mining) | | | | | 1,075,000 | 4,778,297 |
| Franco-Nevada Corporation-Legend Shares (Materials, Metals & mining) 144A | | | | | 130,948 | 15,641,525 |
| Kinross Gold Corporation (Materials, Metals & mining) | | | | | 3,032,483 | 11,415,580 |
| Lundin Gold Incorporated (Materials, Metals & mining) | | | | | 1,150,000 | 7,992,182 |
| MAG Silver Corporation (Materials, Metals & mining) † | | | | | 510,000 | 6,383,538 |
| MAG Silver Corporation-Legend Shares (Materials, Metals & mining) | | | | | 100,000 | 1,251,674 |
| Marathon Gold Corporation (Materials, Metals & mining) † | | | | | 1,300,000 | 997,575 |
| Orla Mining Limited (Materials, Metals & mining) † | | | | | 300,000 | 979,477 |
| Osisko Mining Incorporated (Materials, Metals & mining) † | | | | | 450,000 | 1,006,620 |
| Pan American Silver Corporation (Materials, Metals & mining) | | | | | 265,000 | 4,208,200 |
| SilverCrest Metals Incorporated (Materials, Metals & mining) † | | | | | 1,135,000 | 6,302,132 |
| Skeena Resources Limited (Materials, Metals & mining) † | | | | | 300,000 | 1,402,975 |
| SSR Mining Incorporated (Materials, Metals & mining) | | | | | 275,000 | 4,045,250 |
| SSR Mining Incorporated-U.S. Exchange Traded Shares (Materials, Metals & mining) | | | | | 383,552 | 5,639,368 |
| Torex Gold Resources Incorporated (Materials, Metals & mining) † | | | | | 310,000 | 2,237,449 |
| Torex Gold Resources Incorporated-Legend Shares (Materials, Metals & mining) 144A | | | | | 185,000 | 1,335,252 |
| Torex Gold Resources Incorporated-Legend Shares (Materials, Metals & mining) | | | | | 266,250 | 1,921,680 |
| Triple Flag Precious Metals Corporation (Materials, Metals & mining) | | | | | 210,000 | 2,660,441 |
| Wheaton Precious Metals Corporation (Materials, Metals & mining) | | | | | 12,950 | 419,339 |
The accompanying notes are an integral part of these consolidated financial statements.
Allspring Precious Metals Fund | 9
Consolidated portfolio of investments—September 30, 2022 (unaudited)
| | | | | | Shares | Value |
| Canada: (continued) | | | | | | |
| Wheaton Precious Metals Corporation-U.S. Exchange Traded Shares (Materials, Metals & mining) | | | | | 380,000 | $ 12,296,800 |
| Yamana Gold Incorporated (Materials, Metals & mining) | | | | | 650,000 | 2,940,964 |
| | | | | | | 155,399,369 |
| South Africa: 6.46% | | | | | | |
| AngloGold Ashanti Limited ADR (Materials, Metals & mining) | | | | | 330,591 | 4,568,768 |
| Gold Fields Limited ADR (Materials, Metals & mining) | | | | | 1,350,000 | 10,921,500 |
| | | | | | | 15,490,268 |
| United Kingdom: 5.31% | | | | | | |
| Endeavour Mining plc (Materials, Metals & mining) | | | | | 690,000 | 12,727,549 |
| United States: 9.96% | | | | | | |
| Newmont Corporation (Materials, Metals & mining) | | | | | 150,802 | 6,338,208 |
| Newmont Corporation-Toronto Exchange Traded Shares (Materials, Metals & mining) | | | | | 131,348 | 5,514,077 |
| Royal Gold Incorporated (Materials, Metals & mining) | | | | | 128,436 | 12,049,866 |
| | | | | | | 23,902,151 |
| Total Common stocks (Cost $180,077,819) | | | | | | 225,323,974 |
| | | | Expiration
date | | | |
| Rights: 0.00% | | | | | | |
| Canada: 0.00% | | | | | | |
| Kinross Gold Corporation Contingent Value Rights (Materials, Metals & mining) ♦† | | | 3-1-2032 | | 75,000 | 0 |
| Total Rights (Cost $0) | | | | | | 0 |
| | | | | | | |
| Warrants: 0.00% | | | | | | |
| Canada: 0.00% | | | | | | |
| Marathon Gold Corporation (Materials, Metals & mining) ♦† | | | 9-20-2024 | | 250,000 | 0 |
| Total Warrants (Cost $0) | | | | | | 0 |
| | | | | | Troy ounces | |
| Commodities: 5.33% | | | | | | |
| Gold Bullion * | | | | | 7,690 | 12,779,600 |
| Total Commodities (Cost $4,532,552) | | | | | | 12,779,600 |
The accompanying notes are an integral part of these consolidated financial statements.
10 | Allspring Precious Metals Fund
Consolidated portfolio of investments—September 30, 2022 (unaudited)
| | | Yield | | | Shares | Value |
| Short-term investments: 0.73% | | | | | | |
| Investment companies: 0.73% | | | | | | |
| Allspring Government Money Market Fund Select Class ♠∞ | | 2.75% | | | 1,747,897 | $ 1,747,897 |
| Total Short-term investments (Cost $1,747,897) | | | | | | 1,747,897 |
| Total investments in securities (Cost $186,358,268) | 100.00% | | | | | 239,851,471 |
| Other assets and liabilities, net | 0.00 | | | | | 10,810 |
| Total net assets | 100.00% | | | | | $239,862,281 |
| † | Non-income-earning security |
| 144A | The security may be resold in transactions exempt from registration, normally to qualified institutional buyers, pursuant to Rule 144A under the Securities Act of 1933. |
| ♦ | The security is fair valued in accordance with procedures approved by the Board of Trustees. |
| * | Represents an investment held in Special Investments (Cayman) SPC, the consolidated subsidiary. |
| ♠ | The issuer of the security is an affiliated person of the Fund as defined in the Investment Company Act of 1940. |
| ∞ | The rate represents the 7-day annualized yield at period end. |
| Abbreviations: |
| ADR | American depositary receipt |
Investments in affiliates
An affiliated investment is an investment in which the Fund owns at least 5% of the outstanding voting shares of the issuer or as a result of other relationships, such as the Fund and the issuer having the same investment manager. Transactions with issuers that were affiliates of the Fund at the end of the period were as follows:
| | Value,
beginning of
period | Purchases | Sales
proceeds | Net
realized
gains
(losses) | Net
change in
unrealized
gains
(losses) | Value,
end of
period | Shares,
end
of period | Income
from
affiliated
securities |
| Short-term investments | | | | | | | |
| Allspring Government Money Market Fund Select Class | $8,444,788 | $37,252,536 | $(43,949,427) | $0 | $0 | $1,747,897 | 1,747,897 | $25,712 |
The accompanying notes are an integral part of these consolidated financial statements.
Allspring Precious Metals Fund | 11
Consolidated statement of assets and liabilities—September 30, 2022 (unaudited)
| | |
| Assets | |
Investments in unaffiliated securities, at value (cost $180,077,819)
| $ 225,323,974 |
Investments in affiliated securities, at value (cost $1,747,897)
| 1,747,897 |
Investments in commodities, at value (cost $4,532,552)
| 12,779,600 |
Cash
| 227,279 |
Foreign currency, at value (cost $2,195,755)
| 2,107,012 |
Receivable for Fund shares sold
| 498,907 |
Receivable for dividends
| 136,050 |
Prepaid expenses and other assets
| 63,689 |
Total assets
| 242,884,408 |
| Liabilities | |
Payable for Fund shares redeemed
| 2,727,120 |
Management fee payable
| 117,633 |
Administration fees payable
| 37,343 |
Distribution fee payable
| 4,842 |
Trustees’ fees and expenses payable
| 3,726 |
Accrued expenses and other liabilities
| 131,463 |
Total liabilities
| 3,022,127 |
Total net assets
| $239,862,281 |
| Net assets consist of | |
Paid-in capital
| $ 331,258,061 |
Total distributable loss
| (91,395,780) |
Total net assets
| $239,862,281 |
| Computation of net asset value and offering price per share | |
Net assets – Class A
| $ 130,696,800 |
Shares outstanding – Class A1
| 3,600,210 |
Net asset value per share – Class A
| $36.30 |
Maximum offering price per share – Class A2
| $38.51 |
Net assets – Class C
| $ 7,411,165 |
Shares outstanding – Class C1
| 231,693 |
Net asset value per share – Class C
| $31.99 |
Net assets – Administrator Class
| $ 16,181,922 |
Shares outstanding – Administrator Class1
| 441,772 |
Net asset value per share – Administrator Class
| $36.63 |
Net assets – Institutional Class
| $ 85,572,394 |
Shares outstanding – Institutional Class1
| 2,315,686 |
Net asset value per share – Institutional Class
| $36.95 |
| 1 | The Fund has an unlimited number of authorized shares. |
| 2 | Maximum offering price is computed as 100/94.25 of net asset value. On investments of $50,000 or more, the offering price is reduced. |
The accompanying notes are an integral part of these consolidated financial statements.
12 | Allspring Precious Metals Fund
Consolidated statement of operations— six months ended September 30, 2022 (unaudited)
| | |
| Investment income | |
Dividends (net of foreign withholdings taxes of $357,068)
| $ 2,970,042 |
Income from affiliated securities
| 25,712 |
Total investment income
| 2,995,754 |
| Expenses | |
Management fee
| 1,002,138 |
| Administration fees | |
Class A
| 175,935 |
Class C
| 9,836 |
Administrator Class
| 13,317 |
Institutional Class
| 72,110 |
| Shareholder servicing fees | |
Class A
| 209,446 |
Class C
| 11,709 |
Administrator Class
| 25,609 |
| Distribution fee | |
Class C
| 35,127 |
Custody and accounting fees
| 20,668 |
Professional fees
| 31,182 |
Registration fees
| 27,458 |
Shareholder report expenses
| 7,028 |
Trustees’ fees and expenses
| 11,191 |
Transfer agent fees
| 2,211 |
Other fees and expenses
| 3,387 |
Total expenses
| 1,658,352 |
| Less: Fee waivers and/or expense reimbursements | |
Fund-level
| (84,504) |
Class A
| (34,182) |
Class C
| (1,427) |
Administrator Class
| (7,550) |
Net expenses
| 1,530,689 |
Net investment income
| 1,465,065 |
| Realized and unrealized gains (losses) on investments | |
Net realized losses on investments
| (1,878,377) |
| Net change in unrealized gains (losses) on | |
Unaffiliated securities
| (127,920,556) |
Commodities
| (2,114,339) |
Net change in unrealized gains (losses) on investments
| (130,034,895) |
Net realized and unrealized gains (losses) on investments
| (131,913,272) |
Net decrease in net assets resulting from operations
| $(130,448,207) |
The accompanying notes are an integral part of these consolidated financial statements.
Allspring Precious Metals Fund | 13
Consolidated statement of changes in net assets
| | | | | |
| | Six months ended
September 30, 2022
(unaudited) | Year ended
March 31, 2022 |
| Operations | | | | |
Net investment income
| | $ 1,465,065 | | $ 2,289,676 |
Net realized gains (losses) on investments
| | (1,878,377) | | 11,771,865 |
Net change in unrealized gains (losses) on investments
| | (130,034,895) | | 43,339,500 |
Net increase (decrease) in net assets resulting from operations
| | (130,448,207) | | 57,401,041 |
| Distributions to shareholders from | | | | |
| Net investment income and net realized gains | | | | |
Class A
| | 0 | | (2,465,823) |
Class C
| | 0 | | (23,828) |
Administrator Class
| | 0 | | (285,008) |
Institutional Class
| | 0 | | (1,978,706) |
Total distributions to shareholders
| | 0 | | (4,753,365) |
| Capital share transactions | Shares | | Shares | |
| Proceeds from shares sold | | | | |
Class A
| 361,822 | 16,887,094 | 635,264 | 31,820,827 |
Class C
| 13,060 | 528,950 | 34,189 | 1,491,358 |
Administrator Class
| 157,744 | 7,216,001 | 546,383 | 27,219,384 |
Institutional Class
| 536,312 | 24,338,599 | 908,294 | 46,314,183 |
| | | 48,970,644 | | 106,845,752 |
| Reinvestment of distributions | | | | |
Class A
| 0 | 0 | 50,693 | 2,290,305 |
Class C
| 0 | 0 | 590 | 23,631 |
Administrator Class
| 0 | 0 | 6,179 | 281,352 |
Institutional Class
| 0 | 0 | 32,848 | 1,507,057 |
| | | 0 | | 4,102,345 |
| Payment for shares redeemed | | | | |
Class A
| (579,619) | (23,951,857) | (999,369) | (48,762,130) |
Class C
| (34,788) | (1,382,223) | (72,521) | (3,120,098) |
Administrator Class
| (170,288) | (7,387,766) | (393,345) | (19,388,309) |
Institutional Class
| (749,463) | (32,054,557) | (1,081,288) | (53,579,450) |
| | | (64,776,403) | | (124,849,987) |
Net decrease in net assets resulting from capital share transactions
| | (15,805,759) | | (13,901,890) |
Total increase (decrease) in net assets
| | (146,253,966) | | 38,745,786 |
| Net assets | | | | |
Beginning of period
| | 386,116,247 | | 347,370,461 |
End of period
| | $ 239,862,281 | | $ 386,116,247 |
The accompanying notes are an integral part of these consolidated financial statements.
14 | Allspring Precious Metals Fund
Consolidated financial highlights
(For a share outstanding throughout each period)
| | | Year ended March 31 |
| Class A | Six months ended
September 30, 2022
(unaudited) | 2022 | 2021 | 2020 | 2019 | 2018 |
Net asset value, beginning of period
| $54.61 | $46.95 | $35.30 | $33.94 | $32.80 | $35.99 |
Net investment income (loss)
| 0.19 1 | 0.27 1 | 0.08 | (0.03) 1 | (0.03) 1 | (0.11) 1 |
Net realized and unrealized gains (losses) on investments
| (18.50) | 8.03 | 12.35 | 1.44 | 1.17 | (2.60) |
Total from investment operations
| (18.31) | 8.30 | 12.43 | 1.41 | 1.14 | (2.71) |
| Distributions to shareholders from | | | | | | |
Net investment income
| 0.00 | (0.64) | (0.78) | (0.05) | 0.00 | (0.48) |
Net asset value, end of period
| $36.30 | $54.61 | $46.95 | $35.30 | $33.94 | $32.80 |
Total return2
| (33.53)% | 17.96% | 34.95% | 4.13% | 3.48% | (7.56)% |
| Ratios to average net assets (annualized) | | | | | | |
Gross expenses
| 1.18% | 1.18% | 1.17% | 1.20% | 1.22% | 1.21% |
Net expenses
| 1.08% | 1.09% | 1.09% | 1.09% | 1.09% | 1.04% |
Net investment income (loss)
| 0.86% | 0.55% | 0.12% | (0.08)% | (0.11)% | (0.32)% |
| Supplemental data | | | | | | |
Portfolio turnover rate3
| 7% | 15% | 22% | 25% | 19% | 27% |
Net assets, end of period (000s omitted)
| $130,697 | $208,497 | $193,949 | $147,020 | $162,860 | $177,859 |
| 1 | Calculated based upon average shares outstanding |
| 2 | Total return calculations do not include any sales charges. Returns for periods of less than one year are not annualized. |
| 3 | Portfolio turnover rate includes the purchases and sales transactions of its wholly-owned subsidiary. |
The accompanying notes are an integral part of these consolidated financial statements.
Allspring Precious Metals Fund | 15
Consolidated financial highlights
(For a share outstanding throughout each period)
| | | Year ended March 31 |
| Class C | Six months ended
September 30, 2022
(unaudited) | 2022 | 2021 | 2020 | 2019 | 2018 |
Net asset value, beginning of period
| $48.30 | $41.35 | $30.87 | $29.88 | $29.09 | $32.07 |
Net investment income (loss)
| 0.02 1 | (0.09) 1 | (0.32) 1 | (0.29) 1 | (0.24) 1 | (0.33) 1 |
Net realized and unrealized gains (losses) on investments
| (16.33) | 7.13 | 10.80 | 1.28 | 1.03 | (2.30) |
Total from investment operations
| (16.31) | 7.04 | 10.48 | 0.99 | 0.79 | (2.63) |
| Distributions to shareholders from | | | | | | |
Net investment income
| 0.00 | (0.09) | 0.00 | 0.00 | 0.00 | (0.35) |
Net asset value, end of period
| $31.99 | $48.30 | $41.35 | $30.87 | $29.88 | $29.09 |
Total return2
| (33.77)% | 17.07% | 33.95% | 3.31% | 2.72% | (8.24)% |
| Ratios to average net assets (annualized) | | | | | | |
Gross expenses
| 1.93% | 1.93% | 1.92% | 1.95% | 1.97% | 1.96% |
Net expenses
| 1.84% | 1.84% | 1.84% | 1.84% | 1.84% | 1.79% |
Net investment income (loss)
| 0.10% | (0.21)% | (0.68)% | (0.83)% | (0.88)% | (1.07)% |
| Supplemental data | | | | | | |
Portfolio turnover rate3
| 7% | 15% | 22% | 25% | 19% | 27% |
Net assets, end of period (000s omitted)
| $7,411 | $12,241 | $12,039 | $11,834 | $14,908 | $33,022 |
| 1 | Calculated based upon average shares outstanding |
| 2 | Total return calculations do not include any sales charges. Returns for periods of less than one year are not annualized. |
| 3 | Portfolio turnover rate includes the purchases and sales transactions of its wholly-owned subsidiary. |
The accompanying notes are an integral part of these consolidated financial statements.
16 | Allspring Precious Metals Fund
Consolidated financial highlights
(For a share outstanding throughout each period)
| | | Year ended March 31 |
| Administrator Class | Six months ended
September 30, 2022
(unaudited) | 2022 | 2021 | 2020 | 2019 | 2018 |
Net asset value, beginning of period
| $55.06 | $47.36 | $35.66 | $34.29 | $33.09 | $36.27 |
Net investment income (loss)
| 0.22 1 | 0.38 1 | 0.17 1 | 0.02 1 | 0.01 1 | (0.09) 1 |
Net realized and unrealized gains (losses) on investments
| (18.65) | 8.05 | 12.47 | 1.45 | 1.19 | (2.59) |
Total from investment operations
| (18.43) | 8.43 | 12.64 | 1.47 | 1.20 | (2.68) |
| Distributions to shareholders from | | | | | | |
Net investment income
| 0.00 | (0.73) | (0.94) | (0.10) | 0.00 | (0.50) |
Net asset value, end of period
| $36.63 | $55.06 | $47.36 | $35.66 | $34.29 | $33.09 |
Total return2
| (33.47)% | 18.13% | 35.13% | 4.24% | 3.63% | (7.40)% |
| Ratios to average net assets (annualized) | | | | | | |
Gross expenses
| 1.10% | 1.10% | 1.09% | 1.12% | 1.14% | 1.15% |
Net expenses
| 0.95% | 0.95% | 0.95% | 0.95% | 0.95% | 0.91% |
Net investment income (loss)
| 1.00% | 0.78% | 0.31% | 0.06% | 0.04% | (0.25)% |
| Supplemental data | | | | | | |
Portfolio turnover rate3
| 7% | 15% | 22% | 25% | 19% | 27% |
Net assets, end of period (000s omitted)
| $16,182 | $25,016 | $13,976 | $7,994 | $8,086 | $9,148 |
| 1 | Calculated based upon average shares outstanding |
| 2 | Returns for periods of less than one year are not annualized. |
| 3 | Portfolio turnover rate includes the purchases and sales transactions of its wholly-owned subsidiary. |
The accompanying notes are an integral part of these consolidated financial statements.
Allspring Precious Metals Fund | 17
Consolidated financial highlights
(For a share outstanding throughout each period)
| | | Year ended March 31 |
| Institutional Class | Six months ended
September 30, 2022
(unaudited) | 2022 | 2021 | 2020 | 2019 | 2018 |
Net asset value, beginning of period
| $55.50 | $47.74 | $35.96 | $34.57 | $33.30 | $36.47 |
Net investment income
| 0.38 | 0.50 | 0.24 | 0.09 1 | 0.04 | 0.02 |
Net realized and unrealized gains (losses) on investments
| (18.93) | 8.07 | 12.59 | 1.46 | 1.23 | (2.67) |
Total from investment operations
| (18.55) | 8.57 | 12.83 | 1.55 | 1.27 | (2.65) |
| Distributions to shareholders from | | | | | | |
Net investment income
| 0.00 | (0.81) | (1.05) | (0.16) | 0.00 | (0.52) |
Net asset value, end of period
| $36.95 | $55.50 | $47.74 | $35.96 | $34.57 | $33.30 |
Total return2
| (33.42)% | 18.30% | 35.34% | 4.43% | 3.81% | (7.27)% |
| Ratios to average net assets (annualized) | | | | | | |
Gross expenses
| 0.85% | 0.85% | 0.84% | 0.87% | 0.89% | 0.88% |
Net expenses
| 0.79% | 0.79% | 0.79% | 0.79% | 0.79% | 0.73% |
Net investment income
| 1.14% | 0.85% | 0.37% | 0.22% | 0.21% | 0.01% |
| Supplemental data | | | | | | |
Portfolio turnover rate3
| 7% | 15% | 22% | 25% | 19% | 27% |
Net assets, end of period (000s omitted)
| $85,572 | $140,363 | $127,406 | $107,907 | $95,431 | $82,650 |
| 1 | Calculated based upon average shares outstanding |
| 2 | Returns for periods of less than one year are not annualized. |
| 3 | Portfolio turnover rate includes the purchases and sales transactions of its wholly-owned subsidiary. |
The accompanying notes are an integral part of these consolidated financial statements.
18 | Allspring Precious Metals Fund
Notes to consolidated financial statements (unaudited)
1. ORGANIZATION
Allspring Funds Trust (the "Trust"), a Delaware statutory trust organized on March 10, 1999, is an open-end management investment company registered under the Investment Company Act of 1940, as amended (the "1940 Act"). As an investment company, the Trust follows the accounting and reporting guidance in Financial Accounting Standards Board ("FASB") Accounting Standards Codification Topic 946, Financial Services – Investment Companies. These consolidated financial statements report on the Allspring Precious Metals Fund (the "Fund") which is a non-diversified series of the Trust.
2. INVESTMENT IN SUBSIDIARY
The Fund invests in precious metals and minerals through Special Investments (Cayman) SPC (the “Subsidiary”), a wholly owned subsidiary incorporated on May 3, 2005 under the laws of the Cayman Islands as an exempted segregated portfolio company with limited liability. As of September 30, 2022, the Subsidiary held $12,779,600 in gold bullion representing 99.55% of its net assets. The Fund is the sole shareholder of the Subsidiary. As of September 30, 2022, the Fund held $12,837,652, in the Subsidiary, representing 5.35% of the Fund’s net assets prior to consolidation.
The consolidated financial statements of the Fund include the financial results of the Subsidiary. The Consolidated Portfolio of Investments includes positions of the Fund and the Subsidiary and the consolidated financial statements include the accounts of the Fund and the Subsidiary. Accordingly, all interfund balances and transactions between the Fund and the Subsidiary have been eliminated in consolidation.
3. SIGNIFICANT ACCOUNTING POLICIES
The following significant accounting policies, which are consistently followed in the preparation of the consolidated financial statements of the Fund, are in conformity with U.S. generally accepted accounting principles which require management to make estimates and assumptions that affect the reported amounts of assets and liabilities, disclosure of contingent assets and liabilities at the date of the consolidated financial statements, and the reported amounts of income and expenses during the reporting period. Actual results could differ from those estimates.
Securities valuation
All investments are valued each business day as of the close of regular trading on the New York Stock Exchange (generally 4 p.m. Eastern Time), although the Fund may deviate from this calculation time under unusual or unexpected circumstances.
Equity securities that are listed on a foreign or domestic exchange or market are valued at the official closing price or, if none, the last sales price.
The values of securities denominated in foreign currencies are translated into U.S. dollars at rates provided by an independent foreign currency pricing source at a time each business day specified by the Allspring Global Investments Pricing Committee at Allspring Funds Management, LLC ("Allspring Funds Management").
Many securities markets and exchanges outside the U.S. close prior to the close of the New York Stock Exchange and therefore may not fully reflect trading or events that occur after the close of the principal exchange in which the foreign securities are traded, but before the close of the New York Stock Exchange. If such trading or events are expected to materially affect the value of such securities, then fair value pricing procedures approved by the Board of Trustees of the Fund are applied. These procedures take into account multiple factors including movements in U.S. securities markets after foreign exchanges close. Foreign securities that are fair valued under these procedures are categorized as Level 2 and the application of these procedures may result in transfers between Level 1 and Level 2. Depending on market activity, such fair valuations may be frequent. Such fair value pricing may result in net asset values that are higher or lower than net asset values based on the last reported sales price or latest quoted bid price. On September 30, 2022, such fair value pricing was used in pricing certain foreign securities.
Investments in commodities are valued at their last traded price.
Investments in registered open-end investment companies are valued at net asset value.
Investments which are not valued using the methods discussed above are valued at their fair value, as determined in good faith by Allspring Funds Management, which was named the valuation designee by the Board of Trustees. As the valuation designee, Allspring Funds Management is responsible for day-to-day valuation activities for the Allspring Funds. In connection with these responsibilities, Allspring Funds Management has established a Valuation Committee and has delegated to it the authority to take any actions regarding the valuation of portfolio securities that the Valuation Committee deems necessary or appropriate, including determining the fair value of portfolio securities. On a quarterly basis, the Board of Trustees receives reports of
Allspring Precious Metals Fund | 19
Notes to consolidated financial statements (unaudited)
valuation actions taken by the Valuation Committee. On at least an annual basis, the Board of Trustees receives an assessment of the adequacy and effectiveness of Allspring Funds Management's process for determining the fair value of the portfolio of investments.
Foreign currency translation
The accounting records of the Fund are maintained in U.S. dollars. The values of other assets and liabilities denominated in foreign currencies are translated into U.S. dollars at rates provided by an independent foreign currency pricing source at a time each business day specified by the Allspring Global Investments Pricing Committee. Purchases and sales of securities, and income and expenses are converted at the rate of exchange on the respective dates of such transactions. Net realized foreign exchange gains or losses arise from sales of foreign currencies, currency gains or losses realized between the trade and settlement dates on securities transactions, and the difference between the amounts of dividends, interest and foreign withholding taxes recorded and the U.S. dollar equivalent of the amounts actually paid or received. Net unrealized foreign exchange gains and losses arise from changes in the fair value of assets and liabilities other than investments in securities resulting from changes in exchange rates. The changes in net assets arising from changes in exchange rates of securities and the changes in net assets resulting from changes in market prices of securities are not separately presented. Such changes are included in net realized and unrealized gains or losses from investments.
Security transactions and income recognition
Securities transactions are recorded on a trade date basis. Realized gains or losses are recorded on the basis of identified cost.
Dividend income is recognized on the ex-dividend date, except for certain dividends from foreign securities, which are recorded as soon as the custodian verifies the ex-dividend date. Dividend income is recorded net of foreign taxes withheld where recovery of such taxes is not assured.
Distributions to shareholders
Distributions to shareholders from net investment income and any net realized gains are recorded on the ex-dividend date and paid at least annually. Such distributions are determined in accordance with income tax regulations and may differ from U.S. generally accepted accounting principles. Dividend sources are estimated at the time of declaration. The tax character of distributions is determined as of the Fund's fiscal year end. Therefore, a portion of the Fund's distributions made prior to the Fund’s fiscal year end may be categorized as a tax return of capital at year end.
Federal and other taxes
The Fund intends to continue to qualify as a regulated investment company by distributing substantially all of its investment company taxable income and any net realized capital gains (after reduction for capital loss carryforwards) sufficient to relieve it from all, or substantially all, federal income taxes. Accordingly, no provision for federal income taxes was required.
The Subsidiary is classified as a controlled foreign corporation under Subchapter N of the Internal Revenue Code. Therefore, the Fund is required to increase its taxable income by its share of the Subsidiary’s income. Net investment losses of the Subsidiary cannot be deducted by the Fund in the current period nor carried forward to offset taxable income in future periods.
The Fund’s income and federal excise tax returns and all financial records supporting those returns for the prior three fiscal years are subject to examination by the federal and Delaware revenue authorities. Management has analyzed the Fund's tax positions taken on federal, state, and foreign tax returns, as applicable, for all open tax years and does not believe that there are any uncertain tax positions that require recognition of a tax liability.
As of September 30, 2022, the aggregate cost of all investments for federal income tax purposes was $17,492,550 and the unrealized gains (losses) consisted of:
| Gross unrealized gains | $248,250,108 |
| Gross unrealized losses | (25,891,187) |
| Net unrealized gains | $222,358,921 |
As of March 31, 2022, the Fund had capital loss carryforwards which consisted of $33,908,700 in short-term capital losses and $101,545,949 in long-term capital losses.
Class allocations
The separate classes of shares offered by the Fund differ principally in applicable sales charges, distribution, shareholder servicing, and administration fees. Class specific expenses are charged directly to that share class. Investment income, common
20 | Allspring Precious Metals Fund
Notes to consolidated financial statements (unaudited)
fund-level expenses, and realized and unrealized gains (losses) on investments are allocated daily to each class of shares based on the relative proportion of net assets of each class.
4. FAIR VALUATION MEASUREMENTS
Fair value measurements of investments are determined within a framework that has established a fair value hierarchy based upon the various data inputs utilized in determining the value of the Fund’s investments. The three-level hierarchy gives the highest priority to unadjusted quoted prices in active markets for identical assets or liabilities (Level 1) and the lowest priority to unobservable inputs (Level 3). The Fund’s investments are classified within the fair value hierarchy based on the lowest level of input that is significant to the fair value measurement. The inputs are summarized into three broad levels as follows:
| ■ | Level 1 – quoted prices in active markets for identical securities |
| ■ | Level 2 – other significant observable inputs (including quoted prices for similar securities, interest rates, prepayment speeds, credit risk, etc.) |
| ■ | Level 3 – significant unobservable inputs (including the Fund’s own assumptions in determining the fair value of investments) |
The inputs or methodologies used for valuing investments in securities are not necessarily an indication of the risk associated with investing in those securities.
The following is a summary of the inputs used in valuing the Fund’s assets and liabilities as of September 30, 2022:
| | Quoted prices
(Level 1) | Other significant
observable inputs
(Level 2) | Significant
unobservable inputs
(Level 3) | Total |
| Assets | | | | |
| Investments in: | | | | |
| Common stocks | | | | |
| Australia | $ 0 | $ 17,804,637 | $0 | $ 17,804,637 |
| Canada | 132,670,815 | 22,728,554 | 0 | 155,399,369 |
| South Africa | 15,490,268 | 0 | 0 | 15,490,268 |
| United Kingdom | 12,727,549 | 0 | 0 | 12,727,549 |
| United States | 23,902,151 | 0 | 0 | 23,902,151 |
| Rights | | | | |
| Canada | 0 | 0 | 0 | 0 |
| Warrants | | | | |
| Canada | 0 | 0 | 0 | 0 |
| Commodities | 12,779,600 | 0 | 0 | 12,779,600 |
| Short-term investments | | | | |
| Investment companies | 1,747,897 | 0 | 0 | 1,747,897 |
| Total assets | $199,318,280 | $40,533,191 | $0 | $239,851,471 |
Additional sector, industry or geographic detail, if any, is included in the Consolidated Portfolio of Investments.
For the six months ended September 30, 2022, the Fund did not have any transfers into/out of Level 3.
5. TRANSACTIONS WITH AFFILIATES
Management fee
Allspring Funds Management, a wholly owned subsidiary of Allspring Global Investments Holdings, LLC, a holding company indirectly owned by certain private funds of GTCR LLC and Reverence Capital Partners, L.P., is the manager of the Fund and provides advisory and fund-level administrative services under an investment management agreement. Under the investment management agreement, Allspring Funds Management is responsible for, among other services, implementing the investment objectives and strategies of the Fund, supervising the subadviser and providing fund-level administrative services in connection with the Fund’s operations. As compensation for its services under the investment management agreement, Allspring Funds Management is entitled to receive a management fee at the following annual rate based on the Fund’s average daily net assets:
Allspring Precious Metals Fund | 21
Notes to consolidated financial statements (unaudited)
| Average daily net assets | Management fee |
| First $500 million | 0.650% |
| Next $500 million | 0.600 |
| Next $1 billion | 0.550 |
| Next $2 billion | 0.525 |
| Next $1 billion | 0.500 |
| Next $5 billion | 0.490 |
| Over $10 billion | 0.480 |
For the six months ended September 30, 2022, the management fee was equivalent to an annual rate of 0.65% of the Fund’s average daily net assets.
The Subsidiary has entered into a separate advisory contract with Allspring Funds Management to manage the investment and reinvestment of its assets in conformity with its investment objectives and restrictions. Under this agreement, the Subsidiary does not pay Allspring Funds Management a fee for its services.
Allspring Funds Management has retained the services of a subadviser to provide daily portfolio management to the Fund. The fee for subadvisory services is borne by Allspring Funds Management. Allspring Global Investments, LLC, an affiliate of Allspring Funds Management and a wholly owned subsidiary of Allspring Global Investments Holdings, LLC, is the subadviser to the Fund and is entitled to receive a fee from Allspring Funds Management at an annual rate starting at 0.40% and declining to 0.30% as the average daily net assets of the Fund increase.
Administration fees
Under a class-level administration agreement, Allspring Funds Management provides class-level administrative services to the Fund, which includes paying fees and expenses for services provided by the transfer agent, sub-transfer agents, omnibus account servicers and record-keepers. As compensation for its services under the class-level administration agreement, Allspring Funds Management receives an annual fee which is calculated based on the average daily net assets of each class as follows:
| | Class-level
administration fee |
| Class A | 0.21% |
| Class C | 0.21 |
| Administrator Class | 0.13 |
| Institutional Class | 0.13 |
Waivers and/or expense reimbursements
Allspring Funds Management has contractually committed to waive and/or reimburse management and administration fees to the extent necessary to maintain certain net operating expense ratios for the Fund. When each class of the Fund has exceeded its expense cap, Allspring Funds Management will waive fees and/or reimburse expenses from fund-level expenses on a proportionate basis and then from class specific expenses. When only certain classes exceed their expense caps, waivers and/or reimbursements are applied against class specific expenses before fund-level expenses. Allspring Funds Management has contractually committed through July 31, 2022 to waive fees and/or reimburse expenses to the extent necessary to cap expenses. Prior to or after the commitment expiration date, the caps may be increased or the commitment to maintain the caps may be terminated only with the approval of the Board of Trustees. As of September 30, 2022, the contractual expense caps are as follows:
22 | Allspring Precious Metals Fund
Notes to consolidated financial statements (unaudited)
| | Expense ratio caps |
| Class A | 1.09% |
| Class C | 1.84 |
| Administrator Class | 0.95 |
| Institutional Class | 0.79 |
Distribution fee
The Trust has adopted a distribution plan for Class C shares pursuant to Rule 12b-1 under the 1940 Act. A distribution fee is charged to Class C shares and paid to Allspring Funds Distributor, LLC ("Allspring Funds Distributor"), the principal underwriter, an affiliate of Allspring Funds Management, at an annual rate of 0.75% of the average daily net assets of Class C shares.
In addition, Allspring Funds Distributor is entitled to receive the front-end sales charge from the purchase of Class A shares and a contingent deferred sales charge on the redemption of certain Class A shares. Allspring Funds Distributor is also entitled to receive the contingent deferred sales charges from redemptions of Class C shares. For the six months ended September 30, 2022, Allspring Funds Distributor received $2,127 from the sale of Class A shares. No contingent deferred sales charges were incurred by Class A and Class C shares for the six months ended September 30, 2022.
Shareholder servicing fees
The Trust has entered into contracts with one or more shareholder servicing agents, whereby Class A, Class C, and Administrator Class are charged a fee at an annual rate of 0.25% of the average daily net assets of each respective class. A portion of these total shareholder servicing fees were paid to affiliates.
Interfund transactions
The Fund may purchase or sell portfolio investment securities to certain affiliates pursuant to Rule 17a-7 under the 1940 Act and under procedures adopted by the Board of Trustees. The procedures have been designed to ensure that these interfund transactions, which do not incur broker commissions, are effected at current market prices.
6. INVESTMENT PORTFOLIO TRANSACTIONS
Purchases and sales of investments, excluding U.S. government obligations (if any) and short-term securities, for the six months ended September 30, 2022 were $21,185,993 and $26,164,283, respectively. These amounts include purchase and sales transactions of the Subsidiary.
7. BANK BORROWINGS
The Trust (excluding the money market funds), Allspring Master Trust and Allspring Variable Trust are parties to a $350,000,000 revolving credit agreement whereby the Fund is permitted to use bank borrowings for temporary or emergency purposes, such as to fund shareholder redemption requests. Interest under the credit agreement is charged to the Fund based on a borrowing rate equal to the higher of the Federal Funds rate or the overnight bank funding rate in effect on that day plus a spread. In addition, an annual commitment fee equal based on the unused balance is allocated to each participating fund.
For the six months ended September 30, 2022, there were no borrowings by the Fund under the agreement.
8. CONCENTRATION RISKS
The Fund concentrated its portfolio of investments in precious metals and minerals with a geographic emphasis in Canada. A fund that invests a substantial portion of its assets in any sector or geographic region may be more affected by changes in that sector or geographic region than would be a fund whose investments are not heavily weighted in any sector or geographic region.
9. INDEMNIFICATION
Under the Fund's organizational documents, the officers and Trustees have been granted certain indemnification rights against certain liabilities that may arise out of performance of their duties to the Fund. The Fund has entered into a separate agreement with each Trustee that converts indemnification rights currently existing under the Fund’s organizational documents into contractual rights that cannot be changed in the future without the consent of the Trustee. Additionally, in the normal course of business, the Fund may enter into contracts with service providers that contain a variety of indemnification clauses. The Fund’s maximum exposure under these arrangements is dependent on future claims that may be made against the Fund and, therefore, cannot be estimated.
Allspring Precious Metals Fund | 23
Notes to consolidated financial statements (unaudited)
10. CORONAVIRUS (COVID-19) PANDEMIC
On March 11, 2020, the World Health Organization announced that it had made the assessment that coronavirus disease 2019 (“COVID-19”) is a pandemic. The impacts of COVID-19 are affecting the entire global economy, individual companies and investment products, the funds, and the market in general. There is significant uncertainty around the extent and duration of business disruptions related to COVID-19 and the impacts may last for an extended period of time. COVID-19 has led to significant uncertainty and volatility in the financial markets.
24 | Allspring Precious Metals Fund
Other information (unaudited)
TAX INFORMATION
Pursuant to Section 853 of the Internal Revenue Code, the following amounts have been designated as foreign taxes paid for the fiscal year ended March 31, 2022. These amounts may be less than the actual foreign taxes paid for financial statement purposes. Foreign taxes paid or withheld should be included in taxable income with an offsetting deduction from gross income or as a credit for taxes paid to foreign governments. None of the income was derived from ineligible foreign sources as defined under Section 901(j) of the Internal Revenue Code.
Creditable
foreign taxes
paid | Per share
amount | Foreign
income as % of
ordinary income
distributions |
| $553,621 | $0.0785 | 49.85% |
PROXY VOTING INFORMATION
A description of the policies and procedures used to determine how to vote proxies relating to portfolio securities is available without charge, upon request, by calling 1-800-222-8222, visiting our website at allspringglobal.com, or visiting the SEC website at sec.gov. Information regarding how the proxies related to portfolio securities were voted during the most recent 12-month period ended June 30 is available on the website at allspringglobal.com or by visiting the SEC website at sec.gov.
QUARTERLY PORTFOLIO HOLDINGS INFORMATION
The Fund files its complete schedule of portfolio holdings with the SEC for the first and third quarters of each fiscal year as an exhibit to its reports on Form N-PORT. Shareholders may view the filed Form N-PORT by visiting the SEC website at sec.gov.
Allspring Precious Metals Fund | 25
Other information (unaudited)
BOARD OF TRUSTEES AND OFFICERS
Each of the Trustees and Officers listed in the table below acts in identical capacities for each fund in the Allspring family of funds, which consists of 124 mutual funds comprising the Allspring Funds Trust, Allspring Variable Trust, Allspring Master Trust and four closed-end funds (collectively the “Fund Complex”). This table should be read in conjunction with the Prospectus and the Statement of Additional Information1. The mailing address of each Trustee and Officer is 525 Market Street, 12th Floor, San Francisco, CA 94105. Each Trustee and Officer serves an indefinite term, however, each Trustee serves such term until reaching the mandatory retirement age established by the Trustees.
Independent Trustees
Name and
year of birth | Position held and
length of service* | Principal occupations during past five years or longer | Current other
public company or
investment
company
directorships |
William R. Ebsworth
(Born 1957) | Trustee,
since 2015 | Retired. From 1984 to 2013, equities analyst, portfolio manager, research director and chief investment officer at Fidelity Management and Research Company in Boston, Tokyo, and Hong Kong, and retired in 2013 as Chief Investment Officer of Fidelity Strategic Advisers, Inc. where he led a team of investment professionals managing client assets. Prior thereto, Board member of Hong Kong Securities Clearing Co., Hong Kong Options Clearing Corp., the Thailand International Fund, Ltd., Fidelity Investments Life Insurance Company, and Empire Fidelity Investments Life Insurance Company. Audit Committee Chair and Investment Committee Chair of the Vincent Memorial Hospital Endowment (non-profit organization). Mr. Ebsworth is a CFA® charterholder. | N/A |
Jane A. Freeman
(Born 1953) | Trustee,
since 2015;
Chair Liaison,
since 2018 | Retired. From 2012 to 2014 and 1999 to 2008, Chief Financial Officer of Scientific Learning Corporation. From 2008 to 2012, Ms. Freeman provided consulting services related to strategic business projects. Prior to 1999, Portfolio Manager at Rockefeller & Co. and Scudder, Stevens & Clark. Board member of the Harding Loevner Funds from 1996 to 2014, serving as both Lead Independent Director and chair of the Audit Committee. Board member of the Russell Exchange Traded Funds Trust from 2011 to 2012 and the chair of the Audit Committee. Ms. Freeman is also an inactive Chartered Financial Analyst. | N/A |
Isaiah Harris, Jr.
(Born 1952) | Trustee,
since 2009; Audit
Committee
Chair,
since 2019 | Retired. Chairman of the Board of CIGNA Corporation from 2009 to 2021, and Director from 2005 to 2008. From 2003 to 2011, Director of Deluxe Corporation. Prior thereto, President and CEO of BellSouth Advertising and Publishing Corp. from 2005 to 2007, President and CEO of BellSouth Enterprises from 2004 to 2005 and President of BellSouth Consumer Services from 2000 to 2003. Emeritus member of the Iowa State University Foundation Board of Governors. Emeritus Member of the Advisory Board of Iowa State University School of Business. Advisory Board Member, Palm Harbor Academy (private school). Advisory Board Member, Fellowship of Christian Athletes. Mr. Harris is a certified public accountant (inactive status). | N/A |
David F. Larcker
(Born 1950) | Trustee,
since 2009 | James Irvin Miller Professor of Accounting at the Graduate School of Business (Emeritus), Stanford University, Director of the Corporate Governance Research Initiative and Senior Faculty of The Rock Center for Corporate Governance since 2006. From 2005 to 2008, Professor of Accounting at the Graduate School of Business, Stanford University. Prior thereto, Ernst & Young Professor of Accounting at The Wharton School, University of Pennsylvania from 1985 to 2005. | N/A |
26 | Allspring Precious Metals Fund
Other information (unaudited)
Name and
year of birth | Position held and
length of service* | Principal occupations during past five years or longer | Current other
public company or
investment
company
directorships |
Olivia S. Mitchell
(Born 1953) | Trustee,
since 2006;
Nominating and
Governance
Committee Chair,
since 2018 | International Foundation of Employee Benefit Plans Professor since 1993, Wharton School of the University of Pennsylvania. Director of Wharton’s Pension Research Council and Boettner Center on Pensions & Retirement Research, and Research Associate at the National Bureau of Economic Research. Previously taught at Cornell University from 1978 to 1993. | N/A |
Timothy J. Penny
(Born 1951) | Trustee,
since 1996;
Chair,
since 2018 | President and Chief Executive Officer of Southern Minnesota Initiative Foundation, a non-profit organization, since 2007. Vice Chair of the Economic Club of Minnesota, since 2007. Co-Chair of the Committee for a Responsible Federal Budget, since 1995. Member of the Board of Trustees of NorthStar Education Finance, Inc., a non-profit organization, since 2007. Senior Fellow of the University of Minnesota Humphrey Institute from 1995 to 2017. | N/A |
James G. Polisson
(Born 1959) | Trustee,
since 2018 | Retired. Chief Marketing Officer, Source (ETF) UK Services, Ltd, from 2015 to 2017. From 2012 to 2015, Principal of The Polisson Group, LLC, a management consulting, corporate advisory and principal investing company. Chief Executive Officer and Managing Director at Russell Investments, Global Exchange Traded Funds from 2010 to 2012. Managing Director of Barclays Global Investors from 1998 to 2010 and Global Chief Marketing Officer for iShares and Barclays Global Investors from 2000 to 2010. Trustee of the San Francisco Mechanics’ Institute, a non-profit organization, from 2013 to 2015. Board member of the Russell Exchange Traded Fund Trust from 2011 to 2012. Director of Barclays Global Investors Holdings Deutschland GmbH from 2006 to 2009. Mr. Polisson is an attorney and has a retired status with the Massachusetts and District of Columbia Bar Associations. | N/A |
Pamela Wheelock
(Born 1959) | Trustee,
since January
2020; previously
Trustee from
January 2018 to
July 2019 | Retired. Executive and Senior Financial leadership positions in the public, private and nonprofit sectors. Interim President and CEO, McKnight Foundation, 2020. Interim Commissioner, Minnesota Department of Human Services, 2019. Chief Operating Officer, Twin Cities Habitat for Humanity, 2017-2019. Vice President for University Services, University of Minnesota, 2012-2016. Interim President and CEO, Blue Cross and Blue Shield of Minnesota, 2011-2012. Executive Vice-President and Chief Financial Officer, Minnesota Wild, 2002-2008. Commissioner, Minnesota Department of Finance, 1999-2002. Chair of the Board of Directors of Destination Medical Center Corporation. Board member of the Minnesota Wild Foundation. | N/A |
* Length of service dates reflect the Trustee’s commencement of service with the Trust’s predecessor entities, where applicable.
Allspring Precious Metals Fund | 27
Other information (unaudited)
Officers2
Name and
year of birth | Position held and
length of service | Principal occupations during past five years or longer |
Andrew Owen
(Born 1960) | President,
since 2017 | President and Chief Executive Officer of Allspring Funds Management, LLC since 2017 and Head of Global Fund Governance of Allspring Global Investments since 2022. Prior thereto, co-president of Galliard Capital Management, LLC, an affiliate of Allspring Funds Management, LLC, from 2019 to 2022 and Head of Affiliated Managers, Allspring Global Investments, from 2014 to 2019 and Executive Vice President responsible for marketing, investments and product development for Allspring Funds Management, LLC, from 2009 to 2014. |
Jeremy DePalma
(Born 1974) | Treasurer,
since 2012
(for certain funds in
the Fund Complex);
since 2021 (for
the remaining funds in the
Fund Complex) | Senior Vice President of Allspring Funds Management, LLC since 2009. Senior Vice President of Evergreen Investment Management Company, LLC from 2008 to 2010 and head of the Fund Reporting and Control Team within Fund Administration from 2005 to 2010. |
Christopher Baker
(Born 1976) | Chief Compliance Officer, since 2022 | Global Chief Compliance Officer for Allspring Global Investments since 2022. Prior thereto, Chief Compliance Officer for State Street Global Advisors from 2018 to 2021. Senior Compliance Officer for the State Street divisions of Alternative Investment Solutions, Sector Solutions, and Global Marketing from 2015 to 2018. From 2010 to 2015 Vice President, Global Head of Investment and Marketing Compliance for State Street Global Advisors. |
Matthew Prasse
(Born 1983) | Chief Legal Officer, since 2022; Secretary, since 2021 | Senior Counsel of the Allspring Legal Department since 2021. Senior Counsel of the Wells Fargo Legal Department from 2018 to 2021. Previously, Counsel for Barings LLC from 2015 to 2018. Prior to joining Barings, Associate at Morgan, Lewis & Bockius LLP from 2008 to 2015. |
1 The Statement of Additional Information includes additional information about the Trustees and is available, without charge, upon request, by calling 1-800-222-8222 or by visiting the website at allspringglobal.com.
2 For those Officers with tenures at Allspring Global Investments and/or Allspring Funds Management, LLC that began prior to 2021, such tenures include years of service during which these businesses/entities were known as Wells Fargo Asset Management and Wells Fargo Funds Management, LLC, respectively.
28 | Allspring Precious Metals Fund
Other information (unaudited)
LIQUIDITY RISK MANAGEMENT PROGRAM
In accordance with Rule 22e-4 under the Investment Company Act of 1940, as amended (the “Liquidity Rule”), Allspring Funds Trust (the “Trust”) has adopted and implemented a liquidity risk management program (the “Program”) on behalf of each of its series (other than the series that operate as money market funds), including the Fund, which is reasonably designed to assess and manage the Fund's liquidity risk. “Liquidity risk” is defined under the Liquidity Rule as the risk that the Fund is unable to meet redemption requests without significantly diluting remaining investors’ interests in the Fund. The Trust’s Board of Trustees (the “Board”) previously approved the designation of Allspring Funds Management, LLC (“Allspring Funds Management”), the Fund's investment manager, to administer the Program, and Allspring Funds Management has established a Liquidity Risk Management Council (the "Council") composed of personnel from multiple departments within Allspring Funds Management and its affiliates to assist Allspring Funds Management in the administration of the Program.
The Program is comprised of various components designed to support the assessment and/or management of liquidity risk, including: (1) the periodic assessment (no less frequently than annually) of certain factors that influence the Fund's liquidity risk; (2) the periodic classification (no less frequently than monthly) of the Fund's investments into one of four liquidity categories that reflect an estimate of their liquidity under current market conditions; (3) a 15% limit on the acquisition of “illiquid investments” (as defined under the Liquidity Rule); (4) to the extent the Fund does not invest primarily in “highly liquid investments” (as defined under the Liquidity Rule), the determination of a minimum percentage of the Fund's assets that generally will be invested in highly liquid investments (an “HLIM”); (5) if the Fund has established an HLIM, the periodic review (no less frequently than annually) of the HLIM and the adoption of policies and procedures for responding to a shortfall of the Fund's “highly liquid investments” below its HLIM; and (6) periodic reporting to the Board.
At a meeting of the Board held on May 24-25, 2022, the Board received and reviewed a written report (the “Report”) from Allspring Funds Management that, among other things, addressed the operation of the Program and assessed its adequacy and effectiveness for the period from January 1, 2021 through December 31, 2021 (the “Reporting Period”). Other than extended foreign market holidays, no significant liquidity events impacting the Funds were noted in the Report. In addition, other than corporate-related changes to the Program, there were no material changes to the Program during the Reporting Period.
Allspring Funds Management determined in the Report that the Program has been implemented and operates effectively to manage the Fund’s liquidity risk, and Allspring Funds Management continues to believe that the Program has been and continues to be adequately and effectively implemented to monitor and, as applicable, respond to the Fund’s liquidity developments.
There can be no assurance that the Program will achieve its objectives under all circumstances in the future. Please refer to the Fund’s prospectus for more information regarding the Fund’s exposure to liquidity risk and other risks to which an investment in the Fund may be subject.
Allspring Precious Metals Fund | 29
For more information
More information about Allspring Funds is available free upon request. To obtain literature, please write, visit the Fund's website, or call:
Allspring Funds
P.O. Box 219967
Kansas City, MO 64121-9967
Website: allspringglobal.com
Individual investors: 1-800-222-8222
Retail investment professionals: 1-888-877-9275
Institutional investment professionals: 1-800-260-5969
This report and the financial statements contained herein are submitted for the general information of the shareholders of the Fund. If this report is used for promotional purposes, distribution of the report must be accompanied or preceded by a current prospectus. Before investing, please consider the investment objectives, risks, charges, and expenses of the investment. For a current prospectus and, if available, a summary prospectus, containing this information, call
1-800-222-8222 or visit the Fund's website at allspringglobal.com. Read the prospectus carefully before you invest or send money.
Allspring Global InvestmentsTM is the trade name for the asset management firms of Allspring Global Investments Holdings, LLC, a holding company indirectly owned by certain private funds of GTCR LLC and Reverence Capital Partners, L.P. These firms include but are not limited to Allspring Global Investments, LLC, and Allspring Funds Management, LLC. Certain products managed by Allspring entities are distributed by Allspring Funds Distributor, LLC (a broker-dealer and Member FINRA/SIPC).
This material is for general informational and educational purposes only and is NOT intended to provide investment advice or a recommendation of any kind - including a recommendation for any specific investment, strategy, or plan.
© 2022 Allspring Global Investments Holdings, LLC. All rights reserved.
PAR-1022-00383 11-22
SA316/SAR316 09-22
Semi-Annual Report
September 30, 2022
Allspring
Discovery Innovation Fund
(formerly, Allspring Specialized Technology Fund)
The views expressed and any forward-looking statements are as of September 30, 2022, unless otherwise noted, and are those of the Fund's portfolio managers and/or Allspring Global Investments. Discussions of individual securities or the markets generally are not intended as individual recommendations. Future events or results may vary significantly from those expressed in any forward-looking statements. The views expressed are subject to change at any time in response to changing circumstances in the market. Allspring Global Investments disclaims any obligation to publicly update or revise any views expressed or forward-looking statements.
Allspring Discovery Innovation Fund | 1
Letter to shareholders (unaudited)
Andrew Owen
President
Allspring Funds
Dear Shareholder:
We are pleased to offer you this semi-annual report for Allspring Discovery Innovation Fund for the six-month period that ended September 30, 2022. Effective September 6, 2022, the Fund changed its name from Allspring Specialized Technology Fund to Allspring Discovery Innovation Fund. Globally, stocks and bonds experienced heightened volatility through the extremely difficult period. Non-U.S. securities fared the worst as the global economy faced multiple challenges and the strength of the U.S. dollar eroded already-poor returns of non-U.S.-dollar-denominated assets. Bonds had historically poor performance, with major fixed income indexes falling substantially for the six-month period.
Earlier tailwinds provided by global stimulus programs, vaccination rollouts, and recovering consumer and corporate sentiment were wiped away by the highest rate of inflation in four decades, the impact of ongoing aggressive central bank rate hikes and the prospect of more, plus the global reverberations of the Russia-Ukraine war. The already-significant global supply chain disruptions were compounded by China’s COVID-19 lockdowns.
For the six-month period, both stocks and bonds registered major losses, with even U.S. bonds suffering deep losses and other assets faring worse. For the period, U.S. stocks, based on the S&P 500 Index,1 lost 20.20%. International stocks, as measured by the MSCI ACWI ex USA Index (Net),2 returned -22.27%, while the MSCI EM Index (Net) (USD)3 declined 21.70%. Among bond indexes, the Bloomberg U.S. Aggregate Bond Index,4 returned -9.22%, the Bloomberg Global Aggregate ex-USD Index (unhedged),5 returned -18.89%, the Bloomberg Municipal Bond Index6 declined 6.30%, and the ICE BofA U.S. High Yield Index7 fell 10.56%.
| 1 | The S&P 500 Index consists of 500 stocks chosen for market size, liquidity, and industry group representation. It is a market-value-weighted index with each stock's weight in the index proportionate to its market value. You cannot invest directly in an index. |
| 2 | The Morgan Stanley Capital International (MSCI) All Country World Index (ACWI) ex USA Index (Net) is a free-float-adjusted market-capitalization-weighted index that is designed to measure the equity market performance of developed and emerging markets, excluding the U.S. Source: MSCI. MSCI makes no express or implied warranties or representations and shall have no liability whatsoever with respect to any MSCI data contained herein. The MSCI data may not be further redistributed or used as a basis for other indexes or any securities or financial products. This report is not approved, reviewed, or produced by MSCI. You cannot invest directly in an index. |
| 3 | The MSCI Emerging Markets (EM) Index (Net) (USD) is a free-float-adjusted market-capitalization-weighted index that is designed to measure equity market performance of emerging markets. You cannot invest directly in an index. |
| 4 | The Bloomberg U.S. Aggregate Bond Index is a broad-based benchmark that measures the investment-grade, U.S.-dollar-denominated, fixed-rate taxable bond market, including Treasuries, government-related and corporate securities, mortgage-backed securities (agency fixed-rate and hybrid adjustable-rate mortgage pass-throughs), asset-backed securities, and commercial mortgage-backed securities. You cannot invest directly in an index. |
| 5 | The Bloomberg Global Aggregate ex-USD Index (unhedged) is an unmanaged index that provides a broad-based measure of the global investment-grade fixed-income markets excluding the U.S.-dollar-denominated debt market. You cannot invest directly in an index. |
| 6 | The Bloomberg Municipal Bond Index is an unmanaged index composed of long-term tax-exempt bonds with a minimum credit rating of Baa. You cannot invest directly in an index. |
| 7 | The ICE BofA U.S. High Yield Index is a market-capitalization-weighted index of domestic and Yankee high-yield bonds. The index tracks the performance of high-yield securities traded in the U.S. bond market. You cannot invest directly in an index. Copyright 2022. ICE Data Indices, LLC. All rights reserved. |
2 | Allspring Discovery Innovation Fund
Letter to shareholders (unaudited)
Rising inflation, COVID, and the Russian invasion of Ukraine drove market performance.
Just before the six-month reporting period began, global financial markets had been rocked by the Russian invasion of Ukraine and resulting spike in volatility. In April, the market misery continued, with broad and deep losses, as both the S&P 500 Index and MSCI ACWI (Net)1 fell 8% or more for the month. The Chinese economy struggled through a strict lockdown as the government tried to contain a major COVID-19 outbreak. The ensuing global ripple effect compounded existing supply shortages. This was exacerbated by the impact of the Russia-Ukraine war on global commodities. Meanwhile, U.S. annual inflation raged at 8.5%, its highest level since 1981, and investors braced themselves for aggressive Federal Reserve (Fed) monetary tightening moves.
Market volatility continued in May, although markets recovered ground late in the month. Value stocks outperformed growth stocks. The concerns that had dominated markets for months continued, including high inflation and geopolitical tensions that added to high crude oil, gasoline, and food prices. In response, the Fed raised the federal funds rate by 0.50%, with widescale expectations of multiple rate hikes to come. Meanwhile, highly contagious COVID-19 variants persisted. However, labor markets in the U.S., the U.K., and Europe remained strong. U.S. retail sales for April, released in May, indicated a fourth consecutive monthly increase, reflecting continued consumer resilience.
A dreadful year in financial markets continued in June with stocks posting further losses en route to their worst first half of a year in 50 years. Bonds didn’t fare much better. Driving the losses were the same factors that have been at play: rising global inflation and fears of recession as central banks increase rates to try to curb inflation, which climbed above 9% in June in the U.S. The Fed raised its short-term rate by another 0.75% in June. Meanwhile, U.S. economic data showed resilience as the U.S. unemployment rate held steady at 3.6% and the housing market was only marginally affected, so far, by sharply higher mortgage rates.
Markets rebounded in July, led by U.S. stocks. While evidence began to point to an economic slowdown after two consecutive quarters of declining gross domestic product (economic contraction), the U.S. labor market remained surprisingly strong: July nonfarm payrolls grew by more than 500,000 and U.S. unemployment dipped to 3.5%. Meanwhile, crude oil and retail gasoline prices, major contributors to recent overall inflation, fell substantially from earlier highs. And while U.S. home prices rose, sales fell as houses became less affordable with mortgage rates at a 13-year high. The Fed raised the federal funds rate another 0.75% in July—to a range of 2.25% to 2.50%—and forecasts pointed to continued rate increases.
August was yet another broadly challenging month for financial markets, with more red ink flowing. High inflation persisted, cresting 9% in the eurozone and remaining above 8% in the U.S. despite the Fed’s aggressive monetary policy and a major drop in global crude oil and gasoline prices from their June peak. One positive note in the U.S. was the resilience of the country’s jobs market. However, the Fed’s job was clearly not complete. One longer-term bright spot was the U.S. Congress’s passage of the Inflation Reduction Act. Its primary stated goals include include to reduce inflation (though not immediately) by curbing the deficit, capping health care spending by seniors, and investing in domestic sources of clean energy.
“ Just before the six-month reporting period began, global financial markets had been rocked by the Russian invasion of Ukraine and resulting spike in volatility. In April, the market misery continued, with broad and deep losses, as both the S&P 500 Index and MSCI ACWI (Net) fell 8% or more for the month.”
| 1 | The MSCI ACWI (Net) is a free-float-adjusted market-capitalization-weighted index that is designed to measure the equity market performance of developed and emerging markets. You cannot invest directly in an index. |
Allspring Discovery Innovation Fund | 3
Letter to shareholders (unaudited)
The market misery continued in September. There was nowhere to hide as all asset classes suffered major losses at the hands of persistent inflation. Central banks kept up their battle against rapidly rising prices with more rate hikes. The strength of the U.S. dollar made things even more difficult for investors holding assets in other currencies. U.S. mortgage rates jumped to near 7% on 30-year fixed-rate mortgages; the decreased housing affordability began to cool demand somewhat. The U.K. experienced a sharp sell-off of government bonds and the British pound in September as investors panicked in response to a new government budget that was seen as financially unsound. The market meltdown forced the Bank of England to step in and buy long-dated government bonds. The drama continued into the next fiscal year.
Don’t let short-term uncertainty derail long-term investment goals.
Periods of investment uncertainty can present challenges, but experience has taught us that maintaining long-term investment goals can be an effective way to plan for the future. To help you create a sound strategy based on your personal goals and risk tolerance, Allspring Funds offers more than 100 mutual funds spanning a wide range of asset classes and investment styles. Although diversification cannot guarantee an investment profit or prevent losses, we believe it can be an effective way to manage investment risk and potentially smooth out overall portfolio performance. We encourage investors to know their investments and to understand that appropriate levels of risk-taking may unlock opportunities.
Thank you for choosing to invest with Allspring Funds. We appreciate your confidence in us and remain committed to helping you meet your financial needs.
Sincerely,
Andrew Owen
President
Allspring Funds
For further information about your fund, contact your investment professional, visit our website at allspringglobal.com, or call us directly at 1-800-222-8222.
4 | Allspring Discovery Innovation Fund
This page is intentionally left blank.
Performance highlights (unaudited)
| Investment objective | The Fund seeks long-term capital appreciation. |
| Manager | Allspring Funds Management, LLC |
| Subadviser | Allspring Global Investments, LLC |
| Portfolio managers | Michael T. Smith#, Christopher J. Warner, CFA‡# |
| Average annual total returns (%) as of September 30, 2022* |
| | | Including sales charge | | Excluding sales charge | | Expense ratios1 (%) |
| | Inception date | 1 year | 5 year | 10 year | | 1 year | 5 year | 10 year | | Gross | Net 2 |
| Class A (WFSTX) | 9-18-2000 | -37.74 | 10.50 | 14.19 | | -33.94 | 11.81 | 14.86 | | 1.28 | 1.23 |
| Class C (WFTCX) | 9-18-2000 | -35.46 | 11.00 | 14.20 | | -34.46 | 11.00 | 14.20 | | 2.03 | 1.98 |
| Administrator Class (WFTDX) | 7-30-2010 | – | – | – | | -33.88 | 11.90 | 15.00 | | 1.20 | 1.15 |
| Institutional Class (WFTIX)3 | 10-31-2016 | – | – | – | | -33.69 | 12.18 | 15.16 | | 0.95 | 0.90 |
| Russell 3000® Growth Index4 | – | – | – | – | | -23.01 | 11.57 | 13.36 | | – | – |
| S&P North American Technology Sector Index5 | – | – | – | – | | -30.58 | 13.29 | 16.17 | | – | – |
Figures quoted represent past performance, which is no guarantee of future results, and do not reflect taxes that a shareholder may pay on an investment in a fund. Investment return and principal value of an investment will fluctuate so that an investor’s shares, when redeemed, may be worth more or less than their original cost. Performance shown without sales charges would be lower if sales charges were reflected. Current performance may be lower or higher than the performance data quoted, which assumes the reinvestment of dividends and capital gains. Current month-end performance is available on the Fund’s website, allspringglobal.com.
Index returns do not include transaction costs associated with buying and selling securities, any mutual fund fees or expenses, or any taxes. It is not possible to invest directly in an index.
For Class A shares, the maximum front-end sales charge is 5.75%. For Class C shares, the maximum contingent deferred sales charge is 1.00%. Performance including a contingent deferred sales charge assumes the sales charge for the corresponding time period. Administrator Class and Institutional Class shares are sold without a front-end sales charge or contingent deferred sales charge.
| * | The Fund changed its principal investment strategy on September 6, 2022. Performance shown prior to this date reflects the Fund’s previous investment strategy |
| 1 | Reflects the expense ratios as stated in the most recent prospectuses. The expense ratios shown are subject to change and may differ from the annualized expense ratios shown in the financial highlights of this report. |
| 2 | The manager has contractually committed through July 31, 2024, to waive fees and/or reimburse expenses to the extent necessary to cap total annual fund operating expenses after fee waivers at 1.23% for Class A, 1.98% for Class C, 1.15% for Administrator Class, and 0.90% for Institutional Class. Brokerage commissions, stamp duty fees, interest, taxes, acquired fund fees and expenses (if any), and extraordinary expenses are excluded from the expense caps. Prior to or after the commitment expiration date, the caps may be increased or the commitment to maintain the caps may be terminated only with the approval of the Board of Trustees. Without these caps, the Fund’s returns would have been lower. The expense ratio paid by an investor is the net expense ratio (the total annual fund operating expenses after fee waivers) as stated in the prospectuses. |
| 3 | Historical performance shown for the Institutional Class shares prior to their inception reflects the performance of the Administrator Class shares, and includes the higher expenses applicable to the Administrator Class shares. If these expenses had not been included, returns for the Institutional Class shares would be higher. |
| 4 | The Russell 3000® Growth Index measures the performance of those Russell 3000® Index companies with higher price/book ratios and higher forecasted growth values. You cannot invest directly in an index. The Fund has changed its primary benchmark from the S&P North American Technology Sector Index to the Russell 3000® Growth Index to more accurately reflect the revised strategy of the Fund. The S&P North American Technology Sector Index will remain as a secondary benchmark for the Fund. |
| 5 | The S&P North American Technology Sector Index is a modified market-capitalization-weighted index of select technology stocks. You cannot invest directly in an index |
Stock values fluctuate in response to the activities of individual companies and general market and economic conditions. Funds that concentrate their investments in limited sectors, such as information technology, are more vulnerable to adverse market, economic, regulatory, political, or other developments affecting those sectors. Certain investment strategies tend to increase the total risk of an investment (relative to the broader market). This fund is exposed to convertible securities risk, foreign investment risk, non-diversification risk, and smaller-company securities risk. Consult the Fund’s prospectus for additional information on these and other risks.
| ‡ | CFA® and Chartered Financial Analyst® are trademarks owned by CFA Institute. |
| # | Mr. Smith and Mr. Warner became portfolio managers of the Fund on July 15, 2022. |
6 | Allspring Discovery Innovation Fund
Performance highlights (unaudited)
| Ten largest holdings (%) as of September 30, 20221 |
| Microsoft Corporation | 8.01 |
| Alphabet Incorporated Class C | 7.66 |
| UnitedHealth Group Incorporated | 6.87 |
| Visa Incorporated Class A | 5.69 |
| Amazon.com Incorporated | 5.09 |
| Teledyne Technologies Incorporated | 4.82 |
| Crowdstrike Holdings Incorporated Class A | 4.51 |
| Chipotle Mexican Grill Incorporated | 3.99 |
| Enphase Energy Incorporated | 3.75 |
| Globant SA | 2.91 |
| 1 | Figures represent the percentage of the Fund's net assets. Holdings are subject to change and may have changed since the date specified. |
| Sector allocation as of September 30, 20221 |
| 1 | Figures represent the percentage of the Fund's long-term investments. Allocations are subject to change and may have changed since the date specified. |
Allspring Discovery Innovation Fund | 7
Fund expenses (unaudited)
As a shareholder of the Fund, you incur two types of costs: (1) transaction costs, including sales charges (loads) on purchase payments and contingent deferred sales charges (if any) on redemptions and (2) ongoing costs, including management fees, distribution (12b-1) and/or shareholder servicing fees, and other Fund expenses. This example is intended to help you understand your ongoing costs (in dollars) of investing in the Fund and to compare these costs with the ongoing costs of investing in other mutual funds.
The example is based on an investment of $1,000 invested at the beginning of the six-month period and held for the entire period from April 1, 2022 to September 30, 2022.
Actual expenses
The “Actual” line of the table below provides information about actual account values and actual expenses. You may use the information in this line, together with the amount you invested, to estimate the expenses that you paid over the period. Simply divide your account value by $1,000 (for example, an $8,600 account value divided by $1,000 = 8.6), then multiply the result by the number in the “Actual” line under the heading entitled “Expenses paid during period” for your applicable class of shares to estimate the expenses you paid on your account during this period.
Hypothetical example for comparison purposes
The “Hypothetical” line of the table below provides information about hypothetical account values and hypothetical expenses based on the Fund’s actual expense ratio and an assumed rate of return of 5% per year before expenses, which is not the Fund’s actual return. The hypothetical account values and expenses may not be used to estimate the actual ending account balance or expenses you paid for the period. You may use this information to compare the ongoing costs of investing in the Fund and other funds. To do so, compare this 5% hypothetical example with the 5% hypothetical examples that appear in the shareholder reports of the other funds.
Please note that the expenses shown in the table are meant to highlight your ongoing costs only and do not reflect any transactional costs, such as sales charges (loads) and contingent deferred sales charges. Therefore, the “Hypothetical” line of the table is useful in comparing ongoing costs only, and will not help you determine the relative total costs of owning different funds. In addition, if these transactional costs were included, your costs would have been higher.
| | Beginning
account value
4-1-2022 | Ending
account value
9-30-2022 | Expenses
paid during
the period1 | Annualized net
expense ratio |
| Class A | | | | |
| Actual | $1,000.00 | $ 713.99 | $ 5.50 | 1.28% |
| Hypothetical (5% return before expenses) | $1,000.00 | $1,018.65 | $ 6.48 | 1.28% |
| Class C | | | | |
| Actual | $1,000.00 | $ 710.93 | $ 8.79 | 2.05% |
| Hypothetical (5% return before expenses) | $1,000.00 | $1,014.79 | $10.35 | 2.05% |
| Administrator Class | | | | |
| Actual | $1,000.00 | $ 714.57 | $ 5.24 | 1.22% |
| Hypothetical (5% return before expenses) | $1,000.00 | $1,018.95 | $ 6.17 | 1.22% |
| Institutional Class | | | | |
| Actual | $1,000.00 | $ 715.76 | $ 4.22 | 0.98% |
| Hypothetical (5% return before expenses) | $1,000.00 | $1,020.16 | $ 4.96 | 0.98% |
1 Expenses paid is equal to the annualized net expense ratio of each class multiplied by the average account value over the period, multiplied by 183 divided by 365 (to reflect the one-half-year period).
8 | Allspring Discovery Innovation Fund
Portfolio of investments—September 30, 2022 (unaudited)
| | | | | Shares | Value |
| Common stocks: 97.69% | | | | | |
| Communication services: 12.62% | | | | | |
| Entertainment: 1.17% | | | | | |
| Spotify Technology SA † | | | | 55,884 | $ 4,822,789 |
| Interactive media & services: 10.89% | | | | | |
| Alphabet Incorporated Class C † | | | | 328,440 | 31,579,510 |
| Bumble Incorporated Class A † | | | | 116,283 | 2,498,922 |
| IAC/InterActiveCorp † | | | | 75,343 | 4,172,495 |
| ZoomInfo Technologies Incorporated † | | | | 159,591 | 6,648,561 |
| | | | | | 44,899,488 |
| Media: 0.56% | | | | | |
| Comcast Corporation Class A | | | | 79,201 | 2,322,965 |
| Consumer discretionary: 11.09% | | | | | |
| Hotels, restaurants & leisure: 3.99% | | | | | |
| Chipotle Mexican Grill Incorporated † | | | | 10,946 | 16,449,211 |
| Internet & direct marketing retail: 7.10% | | | | | |
| Amazon.com Incorporated † | | | | 185,689 | 20,982,857 |
| Global-E Online Limited † | | | | 97,853 | 2,618,546 |
| MercadoLibre Incorporated † | | | | 6,823 | 5,647,943 |
| | | | | | 29,249,346 |
| Financials: 3.89% | | | | | |
| Capital markets: 1.90% | | | | | |
| MSCI Incorporated | | | | 4,218 | 1,779,110 |
| S&P Global Incorporated | | | | 19,854 | 6,062,419 |
| | | | | | 7,841,529 |
| Insurance: 1.99% | | | | | |
| Progressive Corporation | | | | 70,645 | 8,209,655 |
| Health care: 12.47% | | | | | |
| Health care equipment & supplies: 0.99% | | | | | |
| Intuitive Surgical Incorporated † | | | | 21,714 | 4,070,072 |
| Health care providers & services: 6.87% | | | | | |
| UnitedHealth Group Incorporated | | | | 56,083 | 28,324,158 |
| Life sciences tools & services: 4.61% | | | | | |
| Bio-Rad Laboratories Incorporated Class A † | | | | 22,555 | 9,408,593 |
| Bio-Techne Corporation | | | | 33,835 | 9,609,140 |
| | | | | | 19,017,733 |
| Information technology: 57.62% | | | | | |
| Communications equipment: 2.11% | | | | | |
| F5 Networks Incorporated † | | | | 20,177 | 2,920,217 |
| Motorola Solutions Incorporated | | | | 25,822 | 5,783,353 |
| | | | | | 8,703,570 |
The accompanying notes are an integral part of these financial statements.
Allspring Discovery Innovation Fund | 9
Portfolio of investments—September 30, 2022 (unaudited)
| | | | | Shares | Value |
| Electronic equipment, instruments & components: 8.44% | | | | | |
| Cognex Corporation | | | | 76,261 | $ 3,161,018 |
| Novanta Incorporated † | | | | 101,791 | 11,772,129 |
| Teledyne Technologies Incorporated † | | | | 58,876 | 19,868,884 |
| | | | | | 34,802,031 |
| IT services: 16.87% | | | | | |
| Automatic Data Processing Incorporated | | | | 9,107 | 2,059,912 |
| Fiserv Incorporated † | | | | 104,439 | 9,772,357 |
| Globant SA † | | | | 64,102 | 11,992,202 |
| MasterCard Incorporated Class A | | | | 6,751 | 1,919,579 |
| Maximus Incorporated | | | | 35,954 | 2,080,658 |
| MongoDB Incorporated † | | | | 37,158 | 7,378,092 |
| Visa Incorporated Class A | | | | 131,998 | 23,449,445 |
| WNS Holdings Limited ADR † | | | | 132,941 | 10,879,891 |
| | | | | | 69,532,136 |
| Semiconductors & semiconductor equipment: 6.61% | | | | | |
| Enphase Energy Incorporated † | | | | 55,687 | 15,451,472 |
| Impinj Incorporated † | | | | 33,280 | 2,663,398 |
| Micron Technology Incorporated | | | | 80,663 | 4,041,216 |
| Wolfspeed Incorporated † | | | | 49,330 | 5,098,749 |
| | | | | | 27,254,835 |
| Software: 20.75% | | | | | |
| Atlassian Corporation plc Class A † | | | | 25,651 | 5,401,844 |
| Bill.com Holdings Incorporated † | | | | 48,165 | 6,375,601 |
| Crowdstrike Holdings Incorporated Class A † | | | | 112,796 | 18,589,909 |
| Five9 Incorporated † | | | | 118,351 | 8,873,958 |
| HubSpot Incorporated † | | | | 29,167 | 7,878,590 |
| Microsoft Corporation | | | | 141,789 | 33,022,658 |
| NortonLifeLock Incorporated | | | | 80,993 | 1,631,199 |
| Olo Incorporated Class A † | | | | 221,593 | 1,750,585 |
| Oracle Corporation | | | | 32,905 | 2,009,508 |
| | | | | | 85,533,852 |
| Technology hardware, storage & peripherals: 2.84% | | | | | |
| Apple Incorporated | | | | 84,869 | 11,728,896 |
| Total Common stocks (Cost $376,319,001) | | | | | 402,762,266 |
| | | Yield | | | |
| Short-term investments: 2.40% | | | | | |
| Investment companies: 2.40% | | | | | |
| Allspring Government Money Market Fund Select Class ♠∞ | | 2.75% | | 9,890,294 | 9,890,294 |
| Total Short-term investments (Cost $9,890,294) | | | | | 9,890,294 |
| Total investments in securities (Cost $386,209,295) | 100.09% | | | | 412,652,560 |
| Other assets and liabilities, net | (0.09) | | | | (373,661) |
| Total net assets | 100.00% | | | | $412,278,899 |
| † | Non-income-earning security |
| ♠ | The issuer of the security is an affiliated person of the Fund as defined in the Investment Company Act of 1940. |
| ∞ | The rate represents the 7-day annualized yield at period end. |
The accompanying notes are an integral part of these financial statements.
10 | Allspring Discovery Innovation Fund
Portfolio of investments—September 30, 2022 (unaudited)
| Abbreviations: |
| ADR | American depositary receipt |
Investments in affiliates
An affiliated investment is an investment in which the Fund owns at least 5% of the outstanding voting shares of the issuer or as a result of other relationships, such as the Fund and the issuer having the same investment manager. Transactions with issuers that were affiliates of the Fund at the end of the period were as follows:
| | Value,
beginning of
period | Purchases | Sales
proceeds | Net
realized
gains
(losses) | | Net
change in
unrealized
gains
(losses) | | Value,
end of
period | Shares,
end
of period | Income
from
affiliated
securities |
| Short-term investments | | | | | | | | | |
| Allspring Government Money Market Fund Select Class | $31,826,516 | $76,007,534 | $(97,943,756) | $0 | | $0 | | $ 9,890,294 | 9,890,294 | $ 159,714 |
Investments in affiliates no longer
held at end of period | | | | | | | | | | |
| Securities Lending Cash Investments LLC | 786,600 | 78,600 | (865,200) | 0 | | 0 | | 0 | 0 | 43 # |
| | | | | $0 | | $0 | | $9,890,294 | | $159,757 |
| # | Amount shown represents income before fees and rebates. |
The accompanying notes are an integral part of these financial statements.
Allspring Discovery Innovation Fund | 11
Statement of assets and liabilities—September 30, 2022 (unaudited)
| | |
| Assets | |
Investments in unaffiliated securities, at value (cost $376,319,001)
| $ 402,762,266 |
Investments in affiliated securities, at value (cost $9,890,294)
| 9,890,294 |
Foreign currency, at value (cost $7,257)
| 6,606 |
Receivable for Fund shares sold
| 156,696 |
Receivable for dividends
| 74,359 |
Prepaid expenses and other assets
| 118,563 |
Total assets
| 413,008,784 |
| Liabilities | |
Management fee payable
| 282,302 |
Payable for Fund shares redeemed
| 192,954 |
Administration fees payable
| 79,291 |
Distribution fee payable
| 4,269 |
Trustees’ fees and expenses payable
| 3,405 |
Accrued expenses and other liabilities
| 167,664 |
Total liabilities
| 729,885 |
Total net assets
| $412,278,899 |
| Net assets consist of | |
Paid-in capital
| $ 338,110,108 |
Total distributable earnings
| 74,168,791 |
Total net assets
| $412,278,899 |
| Computation of net asset value and offering price per share | |
Net assets – Class A
| $ 361,289,893 |
Shares outstanding – Class A1
| 34,699,787 |
Net asset value per share – Class A
| $10.41 |
Maximum offering price per share – Class A2
| $11.05 |
Net assets – Class C
| $ 5,948,443 |
Shares outstanding – Class C1
| 982,956 |
Net asset value per share – Class C
| $6.05 |
Net assets – Administrator Class
| $ 6,729,126 |
Shares outstanding – Administrator Class1
| 620,887 |
Net asset value per share – Administrator Class
| $10.84 |
Net assets – Institutional Class
| $ 38,311,437 |
Shares outstanding – Institutional Class1
| 3,458,992 |
Net asset value per share – Institutional Class
| $11.08 |
| 1 | The Fund has an unlimited number of authorized shares. |
| 2 | Maximum offering price is computed as 100/94.25 of net asset value. On investments of $50,000 or more, the offering price is reduced. |
The accompanying notes are an integral part of these financial statements.
12 | Allspring Discovery Innovation Fund
Statement of operations—six months ended September 30, 2022 (unaudited)
| | |
| Investment income | |
Dividends (net of foreign withholdings taxes of $21,937)
| $ 963,074 |
Income from affiliated securities
| 159,760 |
Total investment income
| 1,122,834 |
| Expenses | |
Management fee
| 2,050,583 |
| Administration fees | |
Class A
| 450,314 |
Class C
| 7,876 |
Administrator Class
| 5,295 |
Institutional Class
| 32,776 |
| Shareholder servicing fees | |
Class A
| 534,133 |
Class C
| 9,283 |
Administrator Class
| 10,182 |
| Distribution fee | |
Class C
| 27,849 |
Custody and accounting fees
| 32,854 |
Professional fees
| 23,996 |
Registration fees
| 35,574 |
Shareholder report expenses
| 17,343 |
Trustees’ fees and expenses
| 11,191 |
Other fees and expenses
| 6,029 |
Total expenses
| 3,255,278 |
| Less: Fee waivers and/or expense reimbursements | |
Fund-level
| (17,780) |
Class A
| (119,067) |
Class C
| (1,178) |
Administrator Class
| (763) |
Institutional Class
| (8,458) |
Net expenses
| 3,108,032 |
Net investment loss
| (1,985,198) |
| Realized and unrealized gains (losses) on investments | |
Net realized losses on investments
| (27,182,492) |
Net change in unrealized gains (losses) on investments
| (142,522,320) |
Net realized and unrealized gains (losses) on investments
| (169,704,812) |
Net decrease in net assets resulting from operations
| $(171,690,010) |
The accompanying notes are an integral part of these financial statements.
Allspring Discovery Innovation Fund | 13
Statement of changes in net assets
| | | | | |
| | Six months ended
September 30, 2022
(unaudited) | Year ended
March 31, 2022 |
| Operations | | | | |
Net investment loss
| | $ (1,985,198) | | $ (7,037,826) |
Net realized gains (losses) on investments
| | (27,182,492) | | 87,045,702 |
Net change in unrealized gains (losses) on investments
| | (142,522,320) | | (66,380,714) |
Net increase (decrease) in net assets resulting from operations
| | (171,690,010) | | 13,627,162 |
| Distributions to shareholders from | | | | |
| Net investment income and net realized gains | | | | |
Class A
| | 0 | | (143,063,634) |
Class C
| | 0 | | (4,200,146) |
Administrator Class
| | 0 | | (2,584,254) |
Institutional Class
| | 0 | | (19,099,092) |
Total distributions to shareholders
| | 0 | | (168,947,126) |
| Capital share transactions | Shares | | Shares | |
| Proceeds from shares sold | | | | |
Class A
| 342,453 | 4,139,941 | 1,025,768 | 18,709,362 |
Class C
| 16,112 | 109,639 | 69,766 | 881,654 |
Administrator Class
| 44,434 | 548,162 | 109,867 | 2,157,542 |
Institutional Class
| 162,985 | 2,062,501 | 807,805 | 15,521,449 |
| | | 6,860,243 | | 37,270,007 |
| Reinvestment of distributions | | | | |
Class A
| 0 | 0 | 8,259,821 | 138,104,208 |
Class C
| 0 | 0 | 429,463 | 4,200,146 |
Administrator Class
| 0 | 0 | 146,691 | 2,550,952 |
Institutional Class
| 0 | 0 | 1,064,445 | 18,883,248 |
| | | 0 | | 163,738,554 |
| Payment for shares redeemed | | | | |
Class A
| (1,766,597) | (21,055,935) | (4,175,414) | (73,339,383) |
Class C
| (187,930) | (1,306,315) | (295,041) | (3,224,878) |
Administrator Class
| (95,425) | (1,167,895) | (88,403) | (1,634,898) |
Institutional Class
| (992,746) | (12,329,418) | (2,000,907) | (37,260,346) |
| | | (35,859,563) | | (115,459,505) |
Net increase (decrease) in net assets resulting from capital share transactions
| | (28,999,320) | | 85,549,056 |
Total decrease in net assets
| | (200,689,330) | | (69,770,908) |
| Net assets | | | | |
Beginning of period
| | 612,968,229 | | 682,739,137 |
End of period
| | $ 412,278,899 | | $ 612,968,229 |
The accompanying notes are an integral part of these financial statements.
14 | Allspring Discovery Innovation Fund
Financial highlights
(For a share outstanding throughout each period)
| | | Year ended March 31 |
| Class A | Six months ended
September 30, 2022
(unaudited) | 2022 | 2021 | 2020 | 2019 | 2018 |
Net asset value, beginning of period
| $14.58 | $18.55 | $12.08 | $13.33 | $14.08 | $10.95 |
Net investment loss
| (0.05) | (0.19) 1 | (0.16) | (0.11) | (0.11) | (0.10) 1 |
Net realized and unrealized gains (losses) on investments
| (4.12) | 1.04 | 9.44 | (0.01) | 2.06 | 4.20 |
Total from investment operations
| (4.17) | 0.85 | 9.28 | (0.12) | 1.95 | 4.10 |
| Distributions to shareholders from | | | | | | |
Net realized gains
| 0.00 | (4.82) | (2.81) | (1.13) | (2.70) | (0.97) |
Net asset value, end of period
| $10.41 | $14.58 | $18.55 | $12.08 | $13.33 | $14.08 |
Total return2
| (28.60)% | 1.26% | 77.67% | (1.31)% | 16.80% | 38.41% |
| Ratios to average net assets (annualized) | | | | | | |
Gross expenses
| 1.34% | 1.34% | 1.35% | 1.39% | 1.40% | 1.41% |
Net expenses
| 1.28% | 1.33% | 1.34% | 1.37% | 1.39% | 1.41% |
Net investment loss
| (0.82)% | (1.02)% | (0.98)% | (0.80)% | (0.77)% | (0.75)% |
| Supplemental data | | | | | | |
Portfolio turnover rate
| 101% | 93% | 146% | 149% | 107% | 109% |
Net assets, end of period (000s omitted)
| $361,290 | $526,555 | $575,422 | $344,949 | $401,990 | $353,552 |
| 1 | Calculated based upon average shares outstanding |
| 2 | Total return calculations do not include any sales charges. Returns for periods of less than one year are not annualized. |
The accompanying notes are an integral part of these financial statements.
Allspring Discovery Innovation Fund | 15
Financial highlights
(For a share outstanding throughout each period)
| | | Year ended March 31 |
| Class C | Six months ended
September 30, 2022
(unaudited) | 2022 | 2021 | 2020 | 2019 | 2018 |
Net asset value, beginning of period
| $8.51 | $12.64 | $8.80 | $10.09 | $11.38 | $9.06 |
Net investment loss
| (0.25) | (0.21) 1 | (0.17) | (0.16) 1 | (0.17) 1 | (0.16) |
Net realized and unrealized gains (losses) on investments
| (2.21) | 0.90 | 6.82 | (0.00) 2 | 1.58 | 3.45 |
Total from investment operations
| (2.46) | 0.69 | 6.65 | (0.16) | 1.41 | 3.29 |
| Distributions to shareholders from | | | | | | |
Net realized gains
| 0.00 | (4.82) | (2.81) | (1.13) | (2.70) | (0.97) |
Net asset value, end of period
| $6.05 | $8.51 | $12.64 | $8.80 | $10.09 | $11.38 |
Total return3
| (28.91)% | 0.51% | 76.67% | (2.15)% | 16.01% | 37.45% |
| Ratios to average net assets (annualized) | | | | | | |
Gross expenses
| 2.08% | 2.09% | 2.10% | 2.14% | 2.15% | 2.16% |
Net expenses
| 2.05% | 2.09% | 2.10% | 2.13% | 2.14% | 2.16% |
Net investment loss
| (1.60)% | (1.79)% | (1.75)% | (1.57)% | (1.52)% | (1.49)% |
| Supplemental data | | | | | | |
Portfolio turnover rate
| 101% | 93% | 146% | 149% | 107% | 109% |
Net assets, end of period (000s omitted)
| $5,948 | $9,822 | $12,017 | $8,035 | $11,615 | $15,932 |
| 1 | Calculated based upon average shares outstanding |
| 2 | Amount is more than $(0.005) |
| 3 | Total return calculations do not include any sales charges. Returns for periods of less than one year are not annualized. |
The accompanying notes are an integral part of these financial statements.
16 | Allspring Discovery Innovation Fund
Financial highlights
(For a share outstanding throughout each period)
| | | Year ended March 31 |
| Administrator Class | Six months ended
September 30, 2022
(unaudited) | 2022 | 2021 | 2020 | 2019 | 2018 |
Net asset value, beginning of period
| $15.17 | $19.13 | $12.40 | $13.65 | $14.34 | $11.12 |
Net investment loss
| (0.05) 1 | (0.18) 1 | (0.16) | (0.10) 1 | (0.09) 1 | (0.09) 1 |
Net realized and unrealized gains (losses) on investments
| (4.28) | 1.04 | 9.70 | (0.02) | 2.10 | 4.28 |
Total from investment operations
| (4.33) | 0.86 | 9.54 | (0.12) | 2.01 | 4.19 |
| Distributions to shareholders from | | | | | | |
Net realized gains
| 0.00 | (4.82) | (2.81) | (1.13) | (2.70) | (0.97) |
Net asset value, end of period
| $10.84 | $15.17 | $19.13 | $12.40 | $13.65 | $14.34 |
Total return2
| (28.54)% | 1.28% | 77.92% | (1.28)% | 17.02% | 38.55% |
| Ratios to average net assets (annualized) | | | | | | |
Gross expenses
| 1.26% | 1.27% | 1.27% | 1.31% | 1.32% | 1.33% |
Net expenses
| 1.22% | 1.26% | 1.27% | 1.28% | 1.29% | 1.32% |
Net investment loss
| (0.77)% | (0.95)% | (0.91)% | (0.71)% | (0.65)% | (0.66)% |
| Supplemental data | | | | | | |
Portfolio turnover rate
| 101% | 93% | 146% | 149% | 107% | 109% |
Net assets, end of period (000s omitted)
| $6,729 | $10,192 | $9,636 | $11,873 | $22,480 | $19,140 |
| 1 | Calculated based upon average shares outstanding |
| 2 | Returns for periods of less than one year are not annualized. |
The accompanying notes are an integral part of these financial statements.
Allspring Discovery Innovation Fund | 17
Financial highlights
(For a share outstanding throughout each period)
| | | Year ended March 31 |
| Institutional Class | Six months ended
September 30, 2022
(unaudited) | 2022 | 2021 | 2020 | 2019 | 2018 |
Net asset value, beginning of period
| $15.48 | $19.39 | $12.51 | $13.73 | $14.37 | $11.12 |
Net investment loss
| (0.04) 1 | (0.13) | (0.12) | (0.07) | (0.07) | (0.05) |
Net realized and unrealized gains (losses) on investments
| (4.36) | 1.04 | 9.81 | (0.02) | 2.13 | 4.27 |
Total from investment operations
| (4.40) | 0.91 | 9.69 | (0.09) | 2.06 | 4.22 |
| Distributions to shareholders from | | | | | | |
Net realized gains
| 0.00 | (4.82) | (2.81) | (1.13) | (2.70) | (0.97) |
Net asset value, end of period
| $11.08 | $15.48 | $19.39 | $12.51 | $13.73 | $14.37 |
Total return2
| (28.42)% | 1.53% | 78.30% | (1.05)% | 17.25% | 38.91% |
| Ratios to average net assets (annualized) | | | | | | |
Gross expenses
| 1.01% | 1.01% | 1.02% | 1.06% | 1.07% | 1.08% |
Net expenses
| 0.98% | 1.01% | 1.02% | 1.03% | 1.04% | 1.07% |
Net investment loss
| (0.52)% | (0.71)% | (0.66)% | (0.47)% | (0.42)% | (0.40)% |
| Supplemental data | | | | | | |
Portfolio turnover rate
| 101% | 93% | 146% | 149% | 107% | 109% |
Net assets, end of period (000s omitted)
| $38,311 | $66,399 | $85,664 | $48,504 | $51,223 | $27,509 |
| 1 | Calculated based upon average shares outstanding |
| 2 | Returns for periods of less than one year are not annualized. |
The accompanying notes are an integral part of these financial statements.
18 | Allspring Discovery Innovation Fund
Notes to financial statements (unaudited)
1. ORGANIZATION
Allspring Funds Trust (the "Trust"), a Delaware statutory trust organized on March 10, 1999, is an open-end management investment company registered under the Investment Company Act of 1940, as amended (the "1940 Act"). As an investment company, the Trust follows the accounting and reporting guidance in Financial Accounting Standards Board ("FASB") Accounting Standards Codification Topic 946, Financial Services – Investment Companies. These financial statements report on the Allspring Discovery Innovation Fund (formerly, Allspring Specialized Technology Fund) (the "Fund") which is a non-diversified series of the Trust.
2. SIGNIFICANT ACCOUNTING POLICIES
The following significant accounting policies, which are consistently followed in the preparation of the financial statements of the Fund, are in conformity with U.S. generally accepted accounting principles which require management to make estimates and assumptions that affect the reported amounts of assets and liabilities, disclosure of contingent assets and liabilities at the date of the financial statements, and the reported amounts of income and expenses during the reporting period. Actual results could differ from those estimates.
Securities valuation
All investments are valued each business day as of the close of regular trading on the New York Stock Exchange (generally 4 p.m. Eastern Time), although the Fund may deviate from this calculation time under unusual or unexpected circumstances.
Equity securities that are listed on a foreign or domestic exchange or market are valued at the official closing price or, if none, the last sales price.
Investments in registered open-end investment companies are valued at net asset value. Interests in non-registered investment companies that are redeemable at net asset value are fair valued normally at net asset value.
Investments which are not valued using the methods discussed above are valued at their fair value, as determined in good faith by Allspring Funds Management, LLC ("Allspring Funds Management"), which was named the valuation designee by the Board of Trustees. As the valuation designee, Allspring Funds Management is responsible for day-to-day valuation activities for the Allspring Funds. In connection with these responsibilities, Allspring Funds Management has established a Valuation Committee and has delegated to it the authority to take any actions regarding the valuation of portfolio securities that the Valuation Committee deems necessary or appropriate, including determining the fair value of portfolio securities. On a quarterly basis, the Board of Trustees receives reports of valuation actions taken by the Valuation Committee. On at least an annual basis, the Board of Trustees receives an assessment of the adequacy and effectiveness of Allspring Funds Management's process for determining the fair value of the portfolio of investments.
Foreign currency translation
The accounting records of the Fund are maintained in U.S. dollars. The values of other assets and liabilities denominated in foreign currencies are translated into U.S. dollars at rates provided by an independent foreign currency pricing source at a time each business day specified by the Allspring Global Investments Pricing Committee. Purchases and sales of securities, and income and expenses are converted at the rate of exchange on the respective dates of such transactions. Net realized foreign exchange gains or losses arise from sales of foreign currencies, currency gains or losses realized between the trade and settlement dates on securities transactions, and the difference between the amounts of dividends, interest and foreign withholding taxes recorded and the U.S. dollar equivalent of the amounts actually paid or received. Net unrealized foreign exchange gains and losses arise from changes in the fair value of assets and liabilities other than investments in securities resulting from changes in exchange rates. The changes in net assets arising from changes in exchange rates of securities and the changes in net assets resulting from changes in market prices of securities are not separately presented. Such changes are included in net realized and unrealized gains or losses from investments.
Securities lending
The Fund may lend its securities from time to time in order to earn additional income in the form of fees or interest on securities received as collateral or the investment of any cash received as collateral. When securities are on loan, the Fund receives interest or dividends on those securities. Cash collateral received in connection with its securities lending transactions is invested in Securities Lending Cash Investments, LLC (the "Securities Lending Fund"), an affiliated non-registered investment company. Investments in Securities Lending Fund are valued at the evaluated bid price provided by an independent pricing service. Income earned from investment in the Securities Lending Fund (net of fees and rebates), if any, is included in income from affiliated securities on the Statement of Operations.
Allspring Discovery Innovation Fund | 19
Notes to financial statements (unaudited)
In a securities lending transaction, the net asset value of the Fund is affected by an increase or decrease in the value of the securities loaned and by an increase or decrease in the value of the instrument in which collateral is invested. The amount of securities lending activity undertaken by the Fund fluctuates from time to time. The Fund has the right under the lending agreement to recover the securities from the borrower on demand. In the event of default or bankruptcy by the borrower, the Fund may be prevented from recovering the loaned securities or gaining access to the collateral or may experience delays or costs in doing so. In such an event, the terms of the agreement allow the unaffiliated securities lending agent to use the collateral to purchase replacement securities on behalf of the Fund or pay the Fund the market value of the loaned securities. The Fund bears the risk of loss with respect to depreciation of its investment of the cash collateral.
Security transactions and income recognition
Securities transactions are recorded on a trade date basis. Realized gains or losses are recorded on the basis of identified cost.
Dividend income is recognized on the ex-dividend date. Dividend income is recorded net of foreign taxes withheld where recovery of such taxes is not assured.
Distributions to shareholders
Distributions to shareholders from net investment income and any net realized gains are recorded on the ex-dividend date and paid at least annually. Such distributions are determined in accordance with income tax regulations and may differ from U.S. generally accepted accounting principles. Dividend sources are estimated at the time of declaration. The tax character of distributions is determined as of the Fund's fiscal year end. Therefore, a portion of the Fund's distributions made prior to the Fund’s fiscal year end may be categorized as a tax return of capital at year end.
Federal and other taxes
The Fund intends to continue to qualify as a regulated investment company by distributing substantially all of its investment company taxable income and any net realized capital gains (after reduction for capital loss carryforwards) sufficient to relieve it from all, or substantially all, federal income taxes. Accordingly, no provision for federal income taxes was required.
The Fund’s income and federal excise tax returns and all financial records supporting those returns for the prior three fiscal years are subject to examination by the federal and Delaware revenue authorities. Management has analyzed the Fund's tax positions taken on federal, state, and foreign tax returns, as applicable, for all open tax years and does not believe that there are any uncertain tax positions that require recognition of a tax liability.
As of September 30, 2022, the aggregate cost of all investments for federal income tax purposes was $388,541,323 and the unrealized gains (losses) consisted of:
| Gross unrealized gains | $ 42,846,832 |
| Gross unrealized losses | (18,735,595) |
| Net unrealized gains | $ 24,111,237 |
As of March 31, 2022, the Fund had current year deferred post-October capital losses consisting of $1,232,958 in short-term capital losses which was recognized in the first day of the current fiscal year.
Class allocations
The separate classes of shares offered by the Fund differ principally in applicable sales charges, distribution, shareholder servicing, and administration fees. Class specific expenses are charged directly to that share class. Investment income, common fund-level expenses, and realized and unrealized gains (losses) on investments are allocated daily to each class of shares based on the relative proportion of net assets of each class.
20 | Allspring Discovery Innovation Fund
Notes to financial statements (unaudited)
3. FAIR VALUATION MEASUREMENTS
Fair value measurements of investments are determined within a framework that has established a fair value hierarchy based upon the various data inputs utilized in determining the value of the Fund’s investments. The three-level hierarchy gives the highest priority to unadjusted quoted prices in active markets for identical assets or liabilities (Level 1) and the lowest priority to unobservable inputs (Level 3). The Fund’s investments are classified within the fair value hierarchy based on the lowest level of input that is significant to the fair value measurement. The inputs are summarized into three broad levels as follows:
| ■ | Level 1 – quoted prices in active markets for identical securities |
| ■ | Level 2 – other significant observable inputs (including quoted prices for similar securities, interest rates, prepayment speeds, credit risk, etc.) |
| ■ | Level 3 – significant unobservable inputs (including the Fund’s own assumptions in determining the fair value of investments) |
The inputs or methodologies used for valuing investments in securities are not necessarily an indication of the risk associated with investing in those securities.
The following is a summary of the inputs used in valuing the Fund’s assets and liabilities as of September 30, 2022:
| | Quoted prices
(Level 1) | Other significant
observable inputs
(Level 2) | Significant
unobservable inputs
(Level 3) | Total |
| Assets | | | | |
| Investments in: | | | | |
| Common stocks | | | | |
| Communication services | $ 52,045,242 | $0 | $0 | $ 52,045,242 |
| Consumer discretionary | 45,698,557 | 0 | 0 | 45,698,557 |
| Financials | 16,051,184 | 0 | 0 | 16,051,184 |
| Health care | 51,411,963 | 0 | 0 | 51,411,963 |
| Information technology | 237,555,320 | 0 | 0 | 237,555,320 |
| Short-term investments | | | | |
| Investment companies | 9,890,294 | 0 | 0 | 9,890,294 |
| Total assets | $412,652,560 | $0 | $0 | $412,652,560 |
Additional sector, industry or geographic detail, if any, is included in the Portfolio of Investments.
For the six months ended September 30, 2022, the Fund did not have any transfers into/out of Level 3.
4. TRANSACTIONS WITH AFFILIATES AND OTHER EXPENSES
Management fee
Allspring Funds Management, a wholly owned subsidiary of Allspring Global Investments Holdings, LLC, a holding company indirectly owned by certain private funds of GTCR LLC and Reverence Capital Partners, L.P., is the manager of the Fund and provides advisory and fund-level administrative services under an investment management agreement. Under the investment management agreement, Allspring Funds Management is responsible for, among other services, implementing the investment objectives and strategies of the Fund, supervising the subadviser and providing fund-level administrative services in connection with the Fund’s operations. As compensation for its services under the investment management agreement, Allspring Funds Management is entitled to receive a management fee at the following annual rate based on the Fund’s average daily net assets:
Allspring Discovery Innovation Fund | 21
Notes to financial statements (unaudited)
| Average daily net assets | Management fee |
| First $500 million | 0.800% |
| Next $500 million | 0.750 |
| Next $1 billion | 0.700 |
| Next $2 billion | 0.675 |
| Next $1 billion | 0.650 |
| Next $3 billion | 0.640 |
| Next $2 billion | 0.615 |
| Next $2 billion | 0.605 |
| Next $4 billion | 0.580 |
| Over $16 billion | 0.555 |
Prior to July 15, 2022, the management fee rate was as follows:
| Average daily net assets | Management fee |
| First $500 million | 0.850% |
| Next $500 million | 0.840 |
| Next $1 billion | 0.815 |
| Next $2 billion | 0.790 |
| Next $1 billion | 0.765 |
| Next $5 billion | 0.755 |
| Over $10 billion | 0.745 |
For the six months ended September 30, 2022, the management fee was equivalent to an annual rate of 0.83% of the Fund’s average daily net assets.
Allspring Funds Management has retained the services of a subadviser to provide daily portfolio management to the Fund. The fee for subadvisory services is borne by Allspring Funds Management. Allspring Global Investments, LLC ("Allspring Investments"), an affiliate of Allspring Funds Management and a wholly owned subsidiary of Allspring Global Investments Holdings, LLC, is the subadviser to the Fund and is entitled to receive a fee from Allspring Funds Management at an annual rate starting at 0.45% and declining to 0.30% as the average daily net assets of the Fund increase. Prior to July 15, 2022, Allianz Global Investors U.S., LLC, which is not an affiliate of Allspring Funds Management, was the subadviser to the Fund and was entitled to receive a fee from Allspring Funds Management at an annual rate which started at 0.57% and declined to 0.50% as the average daily net assets of the Fund increased.
Administration fees
Under a class-level administration agreement, Allspring Funds Management provides class-level administrative services to the Fund, which includes paying fees and expenses for services provided by the transfer agent, sub-transfer agents, omnibus account servicers and record-keepers. As compensation for its services under the class-level administration agreement, Allspring Funds Management receives an annual fee which is calculated based on the average daily net assets of each class as follows:
| | Class-level
administration fee |
| Class A | 0.21% |
| Class C | 0.21 |
| Administrator Class | 0.13 |
| Institutional Class | 0.13 |
22 | Allspring Discovery Innovation Fund
Notes to financial statements (unaudited)
Waivers and/or expense reimbursements
Allspring Funds Management has contractually committed to waive and/or reimburse management and administration fees to the extent necessary to maintain certain net operating expense ratios for the Fund. When each class of the Fund has exceeded its expense cap, Allspring Funds Management will waive fees and/or reimburse expenses from fund-level expenses on a proportionate basis and then from class specific expenses. When only certain classes exceed their expense caps, waivers and/or reimbursements are applied against class specific expenses before fund-level expenses. Allspring Funds Management has contractually committed through July 31, 2024 to waive fees and/or reimburse expenses to the extent necessary to cap expenses. Prior to or after the commitment expiration date, the caps may be increased or the commitment to maintain the caps may be terminated only with the approval of the Board of Trustees. As of September 30, 2022, the contractual expense caps are as follows:
| | Expense ratio caps |
| Class A | 1.23% |
| Class C | 1.98 |
| Administrator Class | 1.15 |
| Institutional Class | 0.90 |
Prior to July 15, 2022, the Fund's expenses were contractually capped at 1.35% for Class A shares, 2.10% for Class C shares, 1.28% for Administrator Class shares, and 1.03% for Institutional Class shares.
Distribution fee
The Trust has adopted a distribution plan for Class C shares pursuant to Rule 12b-1 under the 1940 Act. A distribution fee is charged to Class C shares and paid to Allspring Funds Distributor, LLC ("Allspring Funds Distributor"), the principal underwriter, an affiliate of Allspring Funds Management, at an annual rate of 0.75% of the average daily net assets of Class C shares.
In addition, Allspring Funds Distributor is entitled to receive the front-end sales charge from the purchase of Class A shares and a contingent deferred sales charge on the redemption of certain Class A shares. Allspring Funds Distributor is also entitled to receive the contingent deferred sales charges from redemptions of Class C shares. For the six months ended September 30, 2022, Allspring Funds Distributor received $1,269 from the sale of Class A shares. No contingent deferred sales charges were incurred by Class A and Class C shares for the six months ended September 30, 2022.
Shareholder servicing fees
The Trust has entered into contracts with one or more shareholder servicing agents, whereby Class A, Class C and Administrator Class are charged a fee at an annual rate of 0.25% of the average daily net assets of each respective class. A portion of these total shareholder servicing fees were paid to affiliates.
Interfund transactions
The Fund may purchase or sell portfolio investment securities to certain affiliates pursuant to Rule 17a-7 under the 1940 Act and under procedures adopted by the Board of Trustees. The procedures have been designed to ensure that these interfund transactions, which do not incur broker commissions, are effected at current market prices.
5. INVESTMENT PORTFOLIO TRANSACTIONS
Purchases and sales of investments, excluding U.S. government obligations (if any) and short-term securities, for the six months ended September 30, 2022 were $468,664,266 and $476,396,687, respectively.
6. SECURITIES LENDING TRANSACTIONS
The Fund lends its securities through an unaffiliated securities lending agent and receives collateral in the form of cash or securities with a value at least equal to the value of the securities on loan. The value of the loaned securities is determined at the close of each business day and any increases or decreases in the required collateral are exchanged between the Fund and the counterparty on the next business day. Cash collateral received is invested in the Securities Lending Fund which seeks to provide a positive return compared to the daily Federal Funds Open Rate by investing in high-quality, U.S. dollar-denominated short-term money market instruments and is exempt from registration under Section 3(c)(7) of the 1940 Act. Securities Lending Fund is managed by Allspring Funds Management and is subadvised by Allspring Investments. Allspring Funds
Allspring Discovery Innovation Fund | 23
Notes to financial statements (unaudited)
Management receives an advisory fee starting at 0.05% and declining to 0.01% as the average daily net assets of the Securities Lending Fund increase. All of the fees received by Allspring Funds Management are paid to Allspring Investments for its services as subadviser.
In the event of counterparty default or the failure of a borrower to return a loaned security, the Fund has the right to use the collateral to offset any losses incurred. As of September 30, 2022, the Fund did not have any securities on loan.
7. BANK BORROWINGS
The Trust (excluding the money market funds), Allspring Master Trust and Allspring Variable Trust are parties to a $350,000,000 revolving credit agreement whereby the Fund is permitted to use bank borrowings for temporary or emergency purposes, such as to fund shareholder redemption requests. Interest under the credit agreement is charged to the Fund based on a borrowing rate equal to the higher of the Federal Funds rate or the overnight bank funding rate in effect on that day plus a spread. In addition, an annual commitment fee equal based on the unused balance is allocated to each participating fund.
For the six months ended September 30, 2022, there were no borrowings by the Fund under the agreement.
8. CONCENTRATION RISKS
The Fund concentrated its portfolio of investments in the information technology sector. A fund that invests a substantial portion of its assets in any sector may be more affected by changes in that sector than would be a fund whose investments are not heavily weighted in any sector.
9. INDEMNIFICATION
Under the Fund's organizational documents, the officers and Trustees have been granted certain indemnification rights against certain liabilities that may arise out of performance of their duties to the Fund. The Fund has entered into a separate agreement with each Trustee that converts indemnification rights currently existing under the Fund’s organizational documents into contractual rights that cannot be changed in the future without the consent of the Trustee. Additionally, in the normal course of business, the Fund may enter into contracts with service providers that contain a variety of indemnification clauses. The Fund’s maximum exposure under these arrangements is dependent on future claims that may be made against the Fund and, therefore, cannot be estimated.
10. CORONAVIRUS (COVID-19) PANDEMIC
On March 11, 2020, the World Health Organization announced that it had made the assessment that coronavirus disease 2019 (“COVID-19”) is a pandemic. The impacts of COVID-19 are affecting the entire global economy, individual companies and investment products, the funds, and the market in general. There is significant uncertainty around the extent and duration of business disruptions related to COVID-19 and the impacts may last for an extended period of time. COVID-19 has led to significant uncertainty and volatility in the financial markets.
24 | Allspring Discovery Innovation Fund
Other information (unaudited)
PROXY VOTING INFORMATION
A description of the policies and procedures used to determine how to vote proxies relating to portfolio securities is available without charge, upon request, by calling 1-800-222-8222, visiting our website at allspringglobal.com, or visiting the SEC website at sec.gov. Information regarding how the proxies related to portfolio securities were voted during the most recent 12-month period ended June 30 is available on the website at allspringglobal.com or by visiting the SEC website at sec.gov.
QUARTERLY PORTFOLIO HOLDINGS INFORMATION
The Fund files its complete schedule of portfolio holdings with the SEC for the first and third quarters of each fiscal year as an exhibit to its reports on Form N-PORT. Shareholders may view the filed Form N-PORT by visiting the SEC website at sec.gov.
Allspring Discovery Innovation Fund | 25
Other information (unaudited)
BOARD OF TRUSTEES AND OFFICERS
Each of the Trustees and Officers listed in the table below acts in identical capacities for each fund in the Allspring family of funds, which consists of 124 mutual funds comprising the Allspring Funds Trust, Allspring Variable Trust, Allspring Master Trust and four closed-end funds (collectively the “Fund Complex”). This table should be read in conjunction with the Prospectus and the Statement of Additional Information1. The mailing address of each Trustee and Officer is 525 Market Street, 12th Floor, San Francisco, CA 94105. Each Trustee and Officer serves an indefinite term, however, each Trustee serves such term until reaching the mandatory retirement age established by the Trustees.
Independent Trustees
Name and
year of birth | Position held and
length of service* | Principal occupations during past five years or longer | Current other
public company or
investment
company
directorships |
William R. Ebsworth
(Born 1957) | Trustee,
since 2015 | Retired. From 1984 to 2013, equities analyst, portfolio manager, research director and chief investment officer at Fidelity Management and Research Company in Boston, Tokyo, and Hong Kong, and retired in 2013 as Chief Investment Officer of Fidelity Strategic Advisers, Inc. where he led a team of investment professionals managing client assets. Prior thereto, Board member of Hong Kong Securities Clearing Co., Hong Kong Options Clearing Corp., the Thailand International Fund, Ltd., Fidelity Investments Life Insurance Company, and Empire Fidelity Investments Life Insurance Company. Audit Committee Chair and Investment Committee Chair of the Vincent Memorial Hospital Endowment (non-profit organization). Mr. Ebsworth is a CFA® charterholder. | N/A |
Jane A. Freeman
(Born 1953) | Trustee,
since 2015;
Chair Liaison,
since 2018 | Retired. From 2012 to 2014 and 1999 to 2008, Chief Financial Officer of Scientific Learning Corporation. From 2008 to 2012, Ms. Freeman provided consulting services related to strategic business projects. Prior to 1999, Portfolio Manager at Rockefeller & Co. and Scudder, Stevens & Clark. Board member of the Harding Loevner Funds from 1996 to 2014, serving as both Lead Independent Director and chair of the Audit Committee. Board member of the Russell Exchange Traded Funds Trust from 2011 to 2012 and the chair of the Audit Committee. Ms. Freeman is also an inactive Chartered Financial Analyst. | N/A |
Isaiah Harris, Jr.
(Born 1952) | Trustee,
since 2009; Audit
Committee
Chair,
since 2019 | Retired. Chairman of the Board of CIGNA Corporation from 2009 to 2021, and Director from 2005 to 2008. From 2003 to 2011, Director of Deluxe Corporation. Prior thereto, President and CEO of BellSouth Advertising and Publishing Corp. from 2005 to 2007, President and CEO of BellSouth Enterprises from 2004 to 2005 and President of BellSouth Consumer Services from 2000 to 2003. Emeritus member of the Iowa State University Foundation Board of Governors. Emeritus Member of the Advisory Board of Iowa State University School of Business. Advisory Board Member, Palm Harbor Academy (private school). Advisory Board Member, Fellowship of Christian Athletes. Mr. Harris is a certified public accountant (inactive status). | N/A |
David F. Larcker
(Born 1950) | Trustee,
since 2009 | James Irvin Miller Professor of Accounting at the Graduate School of Business (Emeritus), Stanford University, Director of the Corporate Governance Research Initiative and Senior Faculty of The Rock Center for Corporate Governance since 2006. From 2005 to 2008, Professor of Accounting at the Graduate School of Business, Stanford University. Prior thereto, Ernst & Young Professor of Accounting at The Wharton School, University of Pennsylvania from 1985 to 2005. | N/A |
26 | Allspring Discovery Innovation Fund
Other information (unaudited)
Name and
year of birth | Position held and
length of service* | Principal occupations during past five years or longer | Current other
public company or
investment
company
directorships |
Olivia S. Mitchell
(Born 1953) | Trustee,
since 2006;
Nominating and
Governance
Committee Chair,
since 2018 | International Foundation of Employee Benefit Plans Professor since 1993, Wharton School of the University of Pennsylvania. Director of Wharton’s Pension Research Council and Boettner Center on Pensions & Retirement Research, and Research Associate at the National Bureau of Economic Research. Previously taught at Cornell University from 1978 to 1993. | N/A |
Timothy J. Penny
(Born 1951) | Trustee,
since 1996;
Chair,
since 2018 | President and Chief Executive Officer of Southern Minnesota Initiative Foundation, a non-profit organization, since 2007. Vice Chair of the Economic Club of Minnesota, since 2007. Co-Chair of the Committee for a Responsible Federal Budget, since 1995. Member of the Board of Trustees of NorthStar Education Finance, Inc., a non-profit organization, since 2007. Senior Fellow of the University of Minnesota Humphrey Institute from 1995 to 2017. | N/A |
James G. Polisson
(Born 1959) | Trustee,
since 2018 | Retired. Chief Marketing Officer, Source (ETF) UK Services, Ltd, from 2015 to 2017. From 2012 to 2015, Principal of The Polisson Group, LLC, a management consulting, corporate advisory and principal investing company. Chief Executive Officer and Managing Director at Russell Investments, Global Exchange Traded Funds from 2010 to 2012. Managing Director of Barclays Global Investors from 1998 to 2010 and Global Chief Marketing Officer for iShares and Barclays Global Investors from 2000 to 2010. Trustee of the San Francisco Mechanics’ Institute, a non-profit organization, from 2013 to 2015. Board member of the Russell Exchange Traded Fund Trust from 2011 to 2012. Director of Barclays Global Investors Holdings Deutschland GmbH from 2006 to 2009. Mr. Polisson is an attorney and has a retired status with the Massachusetts and District of Columbia Bar Associations. | N/A |
Pamela Wheelock
(Born 1959) | Trustee,
since January
2020; previously
Trustee from
January 2018 to
July 2019 | Retired. Executive and Senior Financial leadership positions in the public, private and nonprofit sectors. Interim President and CEO, McKnight Foundation, 2020. Interim Commissioner, Minnesota Department of Human Services, 2019. Chief Operating Officer, Twin Cities Habitat for Humanity, 2017-2019. Vice President for University Services, University of Minnesota, 2012-2016. Interim President and CEO, Blue Cross and Blue Shield of Minnesota, 2011-2012. Executive Vice-President and Chief Financial Officer, Minnesota Wild, 2002-2008. Commissioner, Minnesota Department of Finance, 1999-2002. Chair of the Board of Directors of Destination Medical Center Corporation. Board member of the Minnesota Wild Foundation. | N/A |
* Length of service dates reflect the Trustee’s commencement of service with the Trust’s predecessor entities, where applicable.
Allspring Discovery Innovation Fund | 27
Other information (unaudited)
Officers2
Name and
year of birth | Position held and
length of service | Principal occupations during past five years or longer |
Andrew Owen
(Born 1960) | President,
since 2017 | President and Chief Executive Officer of Allspring Funds Management, LLC since 2017 and Head of Global Fund Governance of Allspring Global Investments since 2022. Prior thereto, co-president of Galliard Capital Management, LLC, an affiliate of Allspring Funds Management, LLC, from 2019 to 2022 and Head of Affiliated Managers, Allspring Global Investments, from 2014 to 2019 and Executive Vice President responsible for marketing, investments and product development for Allspring Funds Management, LLC, from 2009 to 2014. |
Jeremy DePalma
(Born 1974) | Treasurer,
since 2012
(for certain funds in
the Fund Complex);
since 2021 (for
the remaining funds in the
Fund Complex) | Senior Vice President of Allspring Funds Management, LLC since 2009. Senior Vice President of Evergreen Investment Management Company, LLC from 2008 to 2010 and head of the Fund Reporting and Control Team within Fund Administration from 2005 to 2010. |
Christopher Baker
(Born 1976) | Chief Compliance Officer, since 2022 | Global Chief Compliance Officer for Allspring Global Investments since 2022. Prior thereto, Chief Compliance Officer for State Street Global Advisors from 2018 to 2021. Senior Compliance Officer for the State Street divisions of Alternative Investment Solutions, Sector Solutions, and Global Marketing from 2015 to 2018. From 2010 to 2015 Vice President, Global Head of Investment and Marketing Compliance for State Street Global Advisors. |
Matthew Prasse
(Born 1983) | Chief Legal Officer, since 2022; Secretary, since 2021 | Senior Counsel of the Allspring Legal Department since 2021. Senior Counsel of the Wells Fargo Legal Department from 2018 to 2021. Previously, Counsel for Barings LLC from 2015 to 2018. Prior to joining Barings, Associate at Morgan, Lewis & Bockius LLP from 2008 to 2015. |
1 The Statement of Additional Information includes additional information about the Trustees and is available, without charge, upon request, by calling 1-800-222-8222 or by visiting the website at allspringglobal.com.
2 For those Officers with tenures at Allspring Global Investments and/or Allspring Funds Management, LLC that began prior to 2021, such tenures include years of service during which these businesses/entities were known as Wells Fargo Asset Management and Wells Fargo Funds Management, LLC, respectively.
28 | Allspring Discovery Innovation Fund
Other information (unaudited)
LIQUIDITY RISK MANAGEMENT PROGRAM
In accordance with Rule 22e-4 under the Investment Company Act of 1940, as amended (the “Liquidity Rule”), Allspring Funds Trust (the “Trust”) has adopted and implemented a liquidity risk management program (the “Program”) on behalf of each of its series (other than the series that operate as money market funds), including the Fund, which is reasonably designed to assess and manage the Fund's liquidity risk. “Liquidity risk” is defined under the Liquidity Rule as the risk that the Fund is unable to meet redemption requests without significantly diluting remaining investors’ interests in the Fund. The Trust’s Board of Trustees (the “Board”) previously approved the designation of Allspring Funds Management, LLC (“Allspring Funds Management”), the Fund's investment manager, to administer the Program, and Allspring Funds Management has established a Liquidity Risk Management Council (the "Council") composed of personnel from multiple departments within Allspring Funds Management and its affiliates to assist Allspring Funds Management in the administration of the Program.
The Program is comprised of various components designed to support the assessment and/or management of liquidity risk, including: (1) the periodic assessment (no less frequently than annually) of certain factors that influence the Fund's liquidity risk; (2) the periodic classification (no less frequently than monthly) of the Fund's investments into one of four liquidity categories that reflect an estimate of their liquidity under current market conditions; (3) a 15% limit on the acquisition of “illiquid investments” (as defined under the Liquidity Rule); (4) to the extent the Fund does not invest primarily in “highly liquid investments” (as defined under the Liquidity Rule), the determination of a minimum percentage of the Fund's assets that generally will be invested in highly liquid investments (an “HLIM”); (5) if the Fund has established an HLIM, the periodic review (no less frequently than annually) of the HLIM and the adoption of policies and procedures for responding to a shortfall of the Fund's “highly liquid investments” below its HLIM; and (6) periodic reporting to the Board.
At a meeting of the Board held on May 24-25, 2022, the Board received and reviewed a written report (the “Report”) from Allspring Funds Management that, among other things, addressed the operation of the Program and assessed its adequacy and effectiveness for the period from January 1, 2021 through December 31, 2021 (the “Reporting Period”). Other than extended foreign market holidays, no significant liquidity events impacting the Funds were noted in the Report. In addition, other than corporate-related changes to the Program, there were no material changes to the Program during the Reporting Period.
Allspring Funds Management determined in the Report that the Program has been implemented and operates effectively to manage the Fund’s liquidity risk, and Allspring Funds Management continues to believe that the Program has been and continues to be adequately and effectively implemented to monitor and, as applicable, respond to the Fund’s liquidity developments.
There can be no assurance that the Program will achieve its objectives under all circumstances in the future. Please refer to the Fund’s prospectus for more information regarding the Fund’s exposure to liquidity risk and other risks to which an investment in the Fund may be subject.
Allspring Discovery Innovation Fund | 29
For more information
More information about Allspring Funds is available free upon request. To obtain literature, please write, visit the Fund's website, or call:
Allspring Funds
P.O. Box 219967
Kansas City, MO 64121-9967
Website: allspringglobal.com
Individual investors: 1-800-222-8222
Retail investment professionals: 1-888-877-9275
Institutional investment professionals: 1-800-260-5969
This report and the financial statements contained herein are submitted for the general information of the shareholders of the Fund. If this report is used for promotional purposes, distribution of the report must be accompanied or preceded by a current prospectus. Before investing, please consider the investment objectives, risks, charges, and expenses of the investment. For a current prospectus and, if available, a summary prospectus, containing this information, call
1-800-222-8222 or visit the Fund's website at allspringglobal.com. Read the prospectus carefully before you invest or send money.
Allspring Global InvestmentsTM is the trade name for the asset management firms of Allspring Global Investments Holdings, LLC, a holding company indirectly owned by certain private funds of GTCR LLC and Reverence Capital Partners, L.P. These firms include but are not limited to Allspring Global Investments, LLC, and Allspring Funds Management, LLC. Certain products managed by Allspring entities are distributed by Allspring Funds Distributor, LLC (a broker-dealer and Member FINRA/SIPC).
This material is for general informational and educational purposes only and is NOT intended to provide investment advice or a recommendation of any kind - including a recommendation for any specific investment, strategy, or plan.
© 2022 Allspring Global Investments Holdings, LLC. All rights reserved.
PAR-1022-00386 11-22
SA317/SAR317 09-22
Semi-Annual Report
September 30, 2022
Allspring Utility and
Telecommunications Fund
The views expressed and any forward-looking statements are as of September 30, 2022, unless otherwise noted, and are those of the Fund's portfolio managers and/or Allspring Global Investments. Discussions of individual securities or the markets generally are not intended as individual recommendations. Future events or results may vary significantly from those expressed in any forward-looking statements. The views expressed are subject to change at any time in response to changing circumstances in the market. Allspring Global Investments disclaims any obligation to publicly update or revise any views expressed or forward-looking statements.
Allspring Utility and Telecommunications Fund | 1
Letter to shareholders (unaudited)
Andrew Owen
President
Allspring Funds
Dear Shareholder:
We are pleased to offer you this semi-annual report for Allspring Utility and Telecommunications Fund for the six-month period that ended September 30, 2022. Globally, stocks and bonds experienced heightened volatility through the extremely difficult period. Non-U.S. securities fared the worst as the global economy faced multiple challenges and the strength of the U.S. dollar eroded already-poor returns of non-U.S.-dollar-denominated assets. Bonds had historically poor performance, with major fixed income indexes falling substantially for the six-month period.
Earlier tailwinds provided by global stimulus programs, vaccination rollouts, and recovering consumer and corporate sentiment were wiped away by the highest rate of inflation in four decades, the impact of ongoing aggressive central bank rate hikes and the prospect of more, plus the global reverberations of the Russia-Ukraine war. The already-significant global supply chain disruptions were compounded by China’s COVID-19 lockdowns.
For the six-month period, both stocks and bonds registered major losses, with even U.S. bonds suffering deep losses and other assets faring worse. For the period, U.S. stocks, based on the S&P 500 Index,1 lost 20.20%. International stocks, as measured by the MSCI ACWI ex USA Index (Net),2 returned -22.27%, while the MSCI EM Index (Net) (USD)3 declined 21.70%. Among bond indexes, the Bloomberg U.S. Aggregate Bond Index,4 returned -9.22%, the Bloomberg Global Aggregate ex-USD Index (unhedged),5 returned -18.89%, the Bloomberg Municipal Bond Index6 declined 6.30%, and the ICE BofA U.S. High Yield Index7 fell 10.56%.
| 1 | The S&P 500 Index consists of 500 stocks chosen for market size, liquidity, and industry group representation. It is a market-value-weighted index with each stock's weight in the index proportionate to its market value. You cannot invest directly in an index. |
| 2 | The Morgan Stanley Capital International (MSCI) All Country World Index (ACWI) ex USA Index (Net) is a free-float-adjusted market-capitalization-weighted index that is designed to measure the equity market performance of developed and emerging markets, excluding the U.S. Source: MSCI. MSCI makes no express or implied warranties or representations and shall have no liability whatsoever with respect to any MSCI data contained herein. The MSCI data may not be further redistributed or used as a basis for other indexes or any securities or financial products. This report is not approved, reviewed, or produced by MSCI. You cannot invest directly in an index. |
| 3 | The MSCI Emerging Markets (EM) Index (Net) (USD) is a free-float-adjusted market-capitalization-weighted index that is designed to measure equity market performance of emerging markets. You cannot invest directly in an index. |
| 4 | The Bloomberg U.S. Aggregate Bond Index is a broad-based benchmark that measures the investment-grade, U.S.-dollar-denominated, fixed-rate taxable bond market, including Treasuries, government-related and corporate securities, mortgage-backed securities (agency fixed-rate and hybrid adjustable-rate mortgage pass-throughs), asset-backed securities, and commercial mortgage-backed securities. You cannot invest directly in an index. |
| 5 | The Bloomberg Global Aggregate ex-USD Index (unhedged) is an unmanaged index that provides a broad-based measure of the global investment-grade fixed-income markets excluding the U.S.-dollar-denominated debt market. You cannot invest directly in an index. |
| 6 | The Bloomberg Municipal Bond Index is an unmanaged index composed of long-term tax-exempt bonds with a minimum credit rating of Baa. You cannot invest directly in an index. |
| 7 | The ICE BofA U.S. High Yield Index is a market-capitalization-weighted index of domestic and Yankee high-yield bonds. The index tracks the performance of high-yield securities traded in the U.S. bond market. You cannot invest directly in an index. Copyright 2022. ICE Data Indices, LLC. All rights reserved. |
2 | Allspring Utility and Telecommunications Fund
Letter to shareholders (unaudited)
Rising inflation, COVID, and the Russian invasion of Ukraine drove market performance.
Just before the six-month reporting period began, global financial markets had been rocked by the Russian invasion of Ukraine and resulting spike in volatility. In April, the market misery continued, with broad and deep losses, as both the S&P 500 Index and MSCI ACWI (Net)1 fell 8% or more for the month. The Chinese economy struggled through a strict lockdown as the government tried to contain a major COVID-19 outbreak. The ensuing global ripple effect compounded existing supply shortages. This was exacerbated by the impact of the Russia-Ukraine war on global commodities. Meanwhile, U.S. annual inflation raged at 8.5%, its highest level since 1981, and investors braced themselves for aggressive Federal Reserve (Fed) monetary tightening moves.
Market volatility continued in May, although markets recovered ground late in the month. Value stocks outperformed growth stocks. The concerns that had dominated markets for months continued, including high inflation and geopolitical tensions that added to high crude oil, gasoline, and food prices. In response, the Fed raised the federal funds rate by 0.50%, with widescale expectations of multiple rate hikes to come. Meanwhile, highly contagious COVID-19 variants persisted. However, labor markets in the U.S., the U.K., and Europe remained strong. U.S. retail sales for April, released in May, indicated a fourth consecutive monthly increase, reflecting continued consumer resilience.
A dreadful year in financial markets continued in June with stocks posting further losses en route to their worst first half of a year in 50 years. Bonds didn’t fare much better. Driving the losses were the same factors that have been at play: rising global inflation and fears of recession as central banks increase rates to try to curb inflation, which climbed above 9% in June in the U.S. The Fed raised its short-term rate by another 0.75% in June. Meanwhile, U.S. economic data showed resilience as the U.S. unemployment rate held steady at 3.6% and the housing market was only marginally affected, so far, by sharply higher mortgage rates.
Markets rebounded in July, led by U.S. stocks. While evidence began to point to an economic slowdown after two consecutive quarters of declining gross domestic product (economic contraction), the U.S. labor market remained surprisingly strong: July nonfarm payrolls grew by more than 500,000 and U.S. unemployment dipped to 3.5%. Meanwhile, crude oil and retail gasoline prices, major contributors to recent overall inflation, fell substantially from earlier highs. And while U.S. home prices rose, sales fell as houses became less affordable with mortgage rates at a 13-year high. The Fed raised the federal funds rate another 0.75% in July—to a range of 2.25% to 2.50%—and forecasts pointed to continued rate increases.
August was yet another broadly challenging month for financial markets, with more red ink flowing. High inflation persisted, cresting 9% in the eurozone and remaining above 8% in the U.S. despite the Fed’s aggressive monetary policy and a major drop in global crude oil and gasoline prices from their June peak. One positive note in the U.S. was the resilience of the country’s jobs market. However, the Fed’s job was clearly not complete. One longer-term bright spot was the U.S. Congress’s passage of the Inflation Reduction Act. Its primary stated goals include include to reduce inflation (though not immediately) by curbing the deficit, capping health care spending by seniors, and investing in domestic sources of clean energy.
“ Just before the six-month reporting period began, global financial markets had been rocked by the Russian invasion of Ukraine and resulting spike in volatility. In April, the market misery continued, with broad and deep losses, as both the S&P 500 Index and MSCI ACWI (Net) fell 8% or more for the month.”
| 1 | The MSCI ACWI (Net) is a free-float-adjusted market-capitalization-weighted index that is designed to measure the equity market performance of developed and emerging markets. You cannot invest directly in an index. |
Allspring Utility and Telecommunications Fund | 3
Letter to shareholders (unaudited)
The market misery continued in September. There was nowhere to hide as all asset classes suffered major losses at the hands of persistent inflation. Central banks kept up their battle against rapidly rising prices with more rate hikes. The strength of the U.S. dollar made things even more difficult for investors holding assets in other currencies. U.S. mortgage rates jumped to near 7% on 30-year fixed-rate mortgages; the decreased housing affordability began to cool demand somewhat. The U.K. experienced a sharp sell-off of government bonds and the British pound in September as investors panicked in response to a new government budget that was seen as financially unsound. The market meltdown forced the Bank of England to step in and buy long-dated government bonds. The drama continued into the next fiscal year.
Don’t let short-term uncertainty derail long-term investment goals.
Periods of investment uncertainty can present challenges, but experience has taught us that maintaining long-term investment goals can be an effective way to plan for the future. To help you create a sound strategy based on your personal goals and risk tolerance, Allspring Funds offers more than 100 mutual funds spanning a wide range of asset classes and investment styles. Although diversification cannot guarantee an investment profit or prevent losses, we believe it can be an effective way to manage investment risk and potentially smooth out overall portfolio performance. We encourage investors to know their investments and to understand that appropriate levels of risk-taking may unlock opportunities.
Thank you for choosing to invest with Allspring Funds. We appreciate your confidence in us and remain committed to helping you meet your financial needs.
Sincerely,
Andrew Owen
President
Allspring Funds
For further information about your fund, contact your investment professional, visit our website at allspringglobal.com, or call us directly at 1-800-222-8222.
4 | Allspring Utility and Telecommunications Fund
This page is intentionally left blank.
Performance highlights (unaudited)
| Investment objective | The Fund seeks total return, consisting of current income and capital appreciation. |
| Manager | Allspring Funds Management, LLC |
| Subadviser | Allspring Global Investments, LLC |
| Portfolio managers | Kent Newcomb, CFA®‡, Jack Spudich, CFA®‡ |
| Average annual total returns (%) as of September 30, 2022 |
| | | Including sales charge | | Excluding sales charge | | Expense ratios1 (%) |
| | Inception date | 1 year | 5 year | 10 year | | 1 year | 5 year | 10 year | | Gross | Net 2 |
| Class A (EVUAX) | 1-4-1994 | -7.95 | 5.72 | 7.73 | | -2.34 | 6.98 | 8.37 | | 1.16 | 1.05 |
| Class C (EVUCX) | 9-2-1994 | -4.03 | 6.18 | 7.72 | | -3.03 | 6.18 | 7.72 | | 1.91 | 1.80 |
| Administrator Class (EVUDX) | 7-30-2010 | – | – | – | | -2.20 | 7.14 | 8.56 | | 1.08 | 0.92 |
| Institutional Class (EVUYX) | 2-28-1994 | – | – | – | | -2.03 | 7.34 | 8.73 | | 0.83 | 0.72 |
| S&P 500 Utilities Index3 | – | – | – | – | | 5.58 | 7.82 | 9.85 | | – | – |
| S&P 500 Index4 | – | – | – | – | | -15.47 | 9.24 | 11.70 | | – | – |
Figures quoted represent past performance, which is no guarantee of future results, and do not reflect taxes that a shareholder may pay on an investment in a fund. Investment return and principal value of an investment will fluctuate so that an investor’s shares, when redeemed, may be worth more or less than their original cost. Performance shown without sales charges would be lower if sales charges were reflected. Current performance may be lower or higher than the performance data quoted, which assumes the reinvestment of dividends and capital gains. Current month-end performance is available on the Fund’s website, allspringglobal.com.
While the S&P 500 Index is comprised of U.S. equity securities of companies diversified across ten sectors, the Fund’s holdings are concentrated primarily in utilities and telecommunication services stocks. Therefore, the performance of the S&P 500 Index is displayed only to show how the concentrated Fund performed compared with a diversified selection of U.S. equity securities.
Index returns do not include transaction costs associated with buying and selling securities, any mutual fund fees or expenses, or any taxes. It is not possible to invest directly in an index.
For Class A shares, the maximum front-end sales charge is 5.75%. For Class C shares, the maximum contingent deferred sales charge is 1.00%. Performance including a contingent deferred sales charge assumes the sales charge for the corresponding time period. Administrator Class and Institutional Class shares are sold without a front-end sales charge or contingent deferred sales charge.
| 1 | Reflects the expense ratios as stated in the most recent prospectuses. The expense ratios shown are subject to change and may differ from the annualized expense ratios shown in the financial highlights of this report. |
| 2 | The manager has contractually committed through July 31, 2023, to waive fees and/or reimburse expenses to the extent necessary to cap total annual fund operating expenses after fee waivers at 1.05% for Class A, 1.80% for Class C, 0.92% for Administrator Class, and 0.72% for Institutional Class. Brokerage commissions, stamp duty fees, interest, taxes, acquired fund fees and expenses (if any), and extraordinary expenses are excluded from the expense caps. Prior to or after the commitment expiration date, the caps may be increased or the commitment to maintain the caps may be terminated only with the approval of the Board of Trustees. Without these caps, the Fund’s returns would have been lower. The expense ratio paid by an investor is the net expense ratio (the total annual fund operating expenses after fee waivers) as stated in the prospectuses. |
| 3 | The S&P 500 Utilities Index is a market-value-weighted index that measures the performance of all stocks within the utilities sector of the S&P 500 Index. You cannot invest directly in an index. |
| 4 | The S&P 500 Index consists of 500 stocks chosen for market size, liquidity, and industry group representation. It is a market-value weighted index with each stock’s weight in the index proportionate to its market value. You cannot invest directly in an index. |
| ‡ | CFA® and Chartered Financial Analyst® are trademarks owned by CFA Institute. |
6 | Allspring Utility and Telecommunications Fund
Performance highlights (unaudited)
Stock values fluctuate in response to the activities of individual companies and general market and economic conditions. Bond values fluctuate in response to the financial condition of individual issuers, general market and economic conditions, and changes in interest rates. Changes in market conditions and government policies may lead to periods of heightened volatility in the bond market and reduced liquidity for certain bonds held by the Fund. In general, when interest rates rise, bond values fall and investors may lose principal value. Interest rate changes and their impact on the Fund and its share price can be sudden and unpredictable. The use of derivatives may reduce returns and/or increase volatility. Funds that concentrate their investments in limited sectors, such as utilities and telecommunication services, are more vulnerable to adverse market, economic, regulatory, political, or other developments affecting those sectors. Certain investment strategies tend to increase the total risk of an investment (relative to the broader market). This fund is exposed to convertible securities risk, foreign investment risk, high-yield securities risk, smaller-company securities risk, and non-diversification risk. Consult the Fund’s prospectus for additional information on these and other risks.
Allspring Utility and Telecommunications Fund | 7
Performance highlights (unaudited)
| Ten largest holdings (%) as of September 30, 20221 |
| NextEra Energy Incorporated | 14.05 |
| Sempra Energy | 4.81 |
| Duke Energy Corporation | 4.69 |
| Dominion Energy Incorporated | 4.69 |
| American Electric Power Company Incorporated | 4.43 |
| The Southern Company | 4.08 |
| Xcel Energy Incorporated | 3.72 |
| Exelon Corporation | 3.47 |
| American Tower Corporation | 3.43 |
| WEC Energy Group Incorporated | 3.24 |
| 1 | Figures represent the percentage of the Fund's net assets. Holdings are subject to change and may have changed since the date specified. |
| Sector allocation as of September 30, 20221 |
| 1 | Figures represent the percentage of the Fund's long-term investments. Allocations are subject to change and may have changed since the date specified. |
8 | Allspring Utility and Telecommunications Fund
Fund expenses (unaudited)
As a shareholder of the Fund, you incur two types of costs: (1) transaction costs, including sales charges (loads) on purchase payments and contingent deferred sales charges (if any) on redemptions and (2) ongoing costs, including management fees, distribution (12b-1) and/or shareholder servicing fees, and other Fund expenses. This example is intended to help you understand your ongoing costs (in dollars) of investing in the Fund and to compare these costs with the ongoing costs of investing in other mutual funds.
The example is based on an investment of $1,000 invested at the beginning of the six-month period and held for the entire period from April 1, 2022 to September 30, 2022.
Actual expenses
The “Actual” line of the table below provides information about actual account values and actual expenses. You may use the information in this line, together with the amount you invested, to estimate the expenses that you paid over the period. Simply divide your account value by $1,000 (for example, an $8,600 account value divided by $1,000 = 8.6), then multiply the result by the number in the “Actual” line under the heading entitled “Expenses paid during period” for your applicable class of shares to estimate the expenses you paid on your account during this period.
Hypothetical example for comparison purposes
The “Hypothetical” line of the table below provides information about hypothetical account values and hypothetical expenses based on the Fund’s actual expense ratio and an assumed rate of return of 5% per year before expenses, which is not the Fund’s actual return. The hypothetical account values and expenses may not be used to estimate the actual ending account balance or expenses you paid for the period. You may use this information to compare the ongoing costs of investing in the Fund and other funds. To do so, compare this 5% hypothetical example with the 5% hypothetical examples that appear in the shareholder reports of the other funds.
Please note that the expenses shown in the table are meant to highlight your ongoing costs only and do not reflect any transactional costs, such as sales charges (loads) and contingent deferred sales charges. Therefore, the “Hypothetical” line of the table is useful in comparing ongoing costs only, and will not help you determine the relative total costs of owning different funds. In addition, if these transactional costs were included, your costs would have been higher.
| | Beginning
account value
4-1-2022 | Ending
account value
9-30-2022 | Expenses
paid during
the period1 | Annualized net
expense ratio |
| Class A | | | | |
| Actual | $1,000.00 | $ 869.43 | $4.83 | 1.03% |
| Hypothetical (5% return before expenses) | $1,000.00 | $1,019.90 | $5.22 | 1.03% |
| Class C | | | | |
| Actual | $1,000.00 | $ 866.65 | $8.42 | 1.80% |
| Hypothetical (5% return before expenses) | $1,000.00 | $1,016.04 | $9.10 | 1.80% |
| Administrator Class | | | | |
| Actual | $1,000.00 | $ 870.30 | $4.31 | 0.92% |
| Hypothetical (5% return before expenses) | $1,000.00 | $1,020.46 | $4.66 | 0.92% |
| Institutional Class | | | | |
| Actual | $1,000.00 | $ 871.24 | $3.38 | 0.72% |
| Hypothetical (5% return before expenses) | $1,000.00 | $1,021.46 | $3.65 | 0.72% |
1 Expenses paid is equal to the annualized net expense ratio of each class multiplied by the average account value over the period, multiplied by 183 divided by 365 (to reflect the one-half-year period).
Allspring Utility and Telecommunications Fund | 9
Portfolio of investments—September 30, 2022 (unaudited)
| | | | | Shares | Value |
| Common stocks: 97.55% | | | | | |
| Communication services: 5.09% | | | | | |
| Diversified telecommunication services: 2.54% | | | | | |
| Verizon Communications Incorporated | | | | 274,564 | $ 10,425,195 |
| Media: 2.55% | | | | | |
| Comcast Corporation Class A | | | | 357,700 | 10,491,341 |
| Consumer discretionary: 2.03% | | | | | |
| Multiline retail: 0.80% | | | | | |
| Target Corporation | | | | 22,069 | 3,274,819 |
| Specialty retail: 1.23% | | | | | |
| The Home Depot Incorporated | | | | 18,381 | 5,072,053 |
| Financials: 1.01% | | | | | |
| Banks: 1.01% | | | | | |
| JPMorgan Chase & Company | | | | 39,772 | 4,156,174 |
| Health care: 3.53% | | | | | |
| Biotechnology: 1.71% | | | | | |
| Amgen Incorporated | | | | 31,093 | 7,008,362 |
| Health care providers & services: 1.82% | | | | | |
| UnitedHealth Group Incorporated | | | | 14,830 | 7,489,743 |
| Information technology: 5.75% | | | | | |
| Communications equipment: 2.90% | | | | | |
| Cisco Systems Incorporated | | | | 297,717 | 11,908,680 |
| IT services: 2.85% | | | | | |
| MasterCard Incorporated Class A | | | | 20,588 | 5,853,992 |
| Visa Incorporated Class A | | | | 32,898 | 5,844,330 |
| | | | | | 11,698,322 |
| Real estate: 3.43% | | | | | |
| Equity REITs: 3.43% | | | | | |
| American Tower Corporation | | | | 65,522 | 14,067,573 |
| Utilities: 76.71% | | | | | |
| Electric utilities: 45.30% | | | | | |
| Alliant Energy Corporation | | | | 100,158 | 5,307,374 |
| American Electric Power Company Incorporated | | | | 210,292 | 18,179,743 |
| Constellation Energy Corporation | | | | 111,094 | 9,241,910 |
| Duke Energy Corporation | | | | 207,113 | 19,265,651 |
| Entergy Corporation | | | | 77,022 | 7,750,724 |
| Evergy Incorporated | | | | 113,357 | 6,733,406 |
| Eversource Energy | | | | 101,960 | 7,948,802 |
| Exelon Corporation | | | | 380,990 | 14,271,885 |
| FirstEnergy Corporation | | | | 205,868 | 7,617,116 |
| NextEra Energy Incorporated | | | | 735,750 | 57,690,158 |
The accompanying notes are an integral part of these financial statements.
10 | Allspring Utility and Telecommunications Fund
Portfolio of investments—September 30, 2022 (unaudited)
| | | | | Shares | Value |
| Electric utilities (continued) | | | | | |
| The Southern Company | | | | 246,693 | $ 16,775,124 |
| Xcel Energy Incorporated | | | | 238,866 | 15,287,424 |
| | | | | | 186,069,317 |
| Gas utilities: 3.41% | | | | | |
| Atmos Energy Corporation | | | | 97,312 | 9,911,227 |
| ONE Gas Incorporated | | | | 58,135 | 4,092,123 |
| | | | | | 14,003,350 |
| Multi-utilities: 25.87% | | | | | |
| Ameren Corporation | | | | 133,679 | 10,767,843 |
| CenterPoint Energy Incorporated | | | | 361,174 | 10,177,883 |
| CMS Energy Corporation | | | | 208,002 | 12,114,036 |
| Dominion Energy Incorporated | | | | 278,504 | 19,247,411 |
| DTE Energy Company | | | | 103,797 | 11,941,845 |
| Public Service Enterprise Group Incorporated | | | | 158,388 | 8,906,157 |
| Sempra Energy | | | | 131,761 | 19,756,244 |
| WEC Energy Group Incorporated | | | | 149,041 | 13,328,737 |
| | | | | | 106,240,156 |
| Water utilities: 2.13% | | | | | |
| American Water Works Company Incorporated | | | | 67,273 | 8,756,254 |
| Total Common stocks (Cost $291,422,656) | | | | | 400,661,339 |
| | | Yield | | | |
| Short-term investments: 2.52% | | | | | |
| Investment companies: 2.52% | | | | | |
| Allspring Government Money Market Fund Select Class ♠∞ | | 2.75% | | 10,368,624 | 10,368,624 |
| Total Short-term investments (Cost $10,368,624) | | | | | 10,368,624 |
| Total investments in securities (Cost $301,791,280) | 100.07% | | | | 411,029,963 |
| Other assets and liabilities, net | (0.07) | | | | (294,373) |
| Total net assets | 100.00% | | | | $410,735,590 |
| ♠ | The issuer of the security is an affiliated person of the Fund as defined in the Investment Company Act of 1940. |
| ∞ | The rate represents the 7-day annualized yield at period end. |
| Abbreviations: |
| REIT | Real estate investment trust |
The accompanying notes are an integral part of these financial statements.
Allspring Utility and Telecommunications Fund | 11
Portfolio of investments—September 30, 2022 (unaudited)
Investments in affiliates
An affiliated investment is an investment in which the Fund owns at least 5% of the outstanding voting shares of the issuer or as a result of other relationships, such as the Fund and the issuer having the same investment manager. Transactions with issuers that were affiliates of the Fund at the end of the period were as follows:
| | Value,
beginning of
period | Purchases | Sales
proceeds | Net
realized
gains
(losses) | Net
change in
unrealized
gains
(losses) | Value,
end of
period | Shares,
end
of period | Income
from
affiliated
securities |
| Short-term investments | | | | | | | |
| Allspring Government Money Market Fund Select Class | $2,507,848 | $20,977,679 | $(13,116,903) | $0 | $0 | $10,368,624 | 10,368,624 | $43,363 |
The accompanying notes are an integral part of these financial statements.
12 | Allspring Utility and Telecommunications Fund
Statement of assets and liabilities—September 30, 2022 (unaudited)
| | |
| Assets | |
Investments in unaffiliated securities, at value (cost $291,422,656)
| $ 400,661,339 |
Investments in affiliated securities, at value (cost $10,368,624)
| 10,368,624 |
Receivable for dividends
| 379,992 |
Receivable for Fund shares sold
| 96,267 |
Prepaid expenses and other assets
| 50,134 |
Total assets
| 411,556,356 |
| Liabilities | |
Payable for Fund shares redeemed
| 351,942 |
Management fee payable
| 221,765 |
Shareholder servicing fees payable
| 81,898 |
Administration fees payable
| 77,757 |
Trustees’ fees and expenses payable
| 3,970 |
Distribution fee payable
| 3,634 |
Accrued expenses and other liabilities
| 79,800 |
Total liabilities
| 820,766 |
Total net assets
| $410,735,590 |
| Net assets consist of | |
Paid-in capital
| $ 265,160,575 |
Total distributable earnings
| 145,575,015 |
Total net assets
| $410,735,590 |
| Computation of net asset value and offering price per share | |
Net assets – Class A
| $ 322,687,226 |
Shares outstanding – Class A1
| 17,428,477 |
Net asset value per share – Class A
| $18.51 |
Maximum offering price per share – Class A2
| $19.64 |
Net assets – Class C
| $ 4,977,525 |
Shares outstanding – Class C1
| 267,392 |
Net asset value per share – Class C
| $18.62 |
Net assets – Administrator Class
| $ 7,673,394 |
Shares outstanding – Administrator Class1
| 413,715 |
Net asset value per share – Administrator Class
| $18.55 |
Net assets – Institutional Class
| $ 75,397,445 |
Shares outstanding – Institutional Class1
| 4,074,790 |
Net asset value per share – Institutional Class
| $18.50 |
| 1 | The Fund has an unlimited number of authorized shares. |
| 2 | Maximum offering price is computed as 100/94.25 of net asset value. On investments of $50,000 or more, the offering price is reduced. |
The accompanying notes are an integral part of these financial statements.
Allspring Utility and Telecommunications Fund | 13
Statement of operations—six months ended September 30, 2022 (unaudited)
| | |
| Investment income | |
Dividends
| $ 6,242,890 |
Income from affiliated securities
| 43,363 |
Total investment income
| 6,286,253 |
| Expenses | |
Management fee
| 1,508,263 |
| Administration fees | |
Class A
| 388,522 |
Class C
| 5,448 |
Administrator Class
| 5,160 |
Institutional Class
| 52,606 |
| Shareholder servicing fees | |
Class A
| 462,526 |
Class C
| 6,477 |
Administrator Class
| 9,922 |
| Distribution fee | |
Class C
| 19,195 |
Custody and accounting fees
| 10,009 |
Professional fees
| 18,243 |
Registration fees
| 33,948 |
Shareholder report expenses
| 8,042 |
Trustees’ fees and expenses
| 11,191 |
Other fees and expenses
| 5,705 |
Total expenses
| 2,545,257 |
| Less: Fee waivers and/or expense reimbursements | |
Fund-level
| (174,194) |
Class A
| (75,679) |
Class C
| (9) |
Administrator Class
| (2,426) |
Institutional Class
| (4,265) |
Net expenses
| 2,288,684 |
Net investment income
| 3,997,569 |
| Realized and unrealized gains (losses) on investments | |
Net realized gains on investments
| 1,491,942 |
Net change in unrealized gains (losses) on investments
| (67,115,868) |
Net realized and unrealized gains (losses) on investments
| (65,623,926) |
Net decrease in net assets resulting from operations
| $(61,626,357) |
The accompanying notes are an integral part of these financial statements.
14 | Allspring Utility and Telecommunications Fund
Statement of changes in net assets
| | | | | |
| | Six months ended
September 30, 2022
(unaudited) | Year ended
March 31, 2022 |
| Operations | | | | |
Net investment income
| | $ 3,997,569 | | $ 7,075,173 |
Net realized gains on investments
| | 1,491,942 | | 34,747,201 |
Net change in unrealized gains (losses) on investments
| | (67,115,868) | | 16,262,033 |
Net increase (decrease) in net assets resulting from operations
| | (61,626,357) | | 58,084,407 |
| Distributions to shareholders from | | | | |
| Net investment income and net realized gains | | | | |
Class A
| | (3,074,828) | | (44,877,027) |
Class C
| | (27,743) | | (572,530) |
Administrator Class
| | (75,324) | | (791,404) |
Institutional Class
| | (819,739) | | (9,166,657) |
Total distributions to shareholders
| | (3,997,634) | | (55,407,618) |
| Capital share transactions | Shares | | Shares | |
| Proceeds from shares sold | | | | |
Class A
| 368,217 | 7,738,402 | 1,015,898 | 22,075,851 |
Class C
| 87,548 | 1,810,253 | 37,936 | 829,370 |
Administrator Class
| 93,103 | 1,960,026 | 247,879 | 5,407,252 |
Institutional Class
| 766,571 | 16,116,842 | 1,249,622 | 26,754,319 |
| | | 27,625,523 | | 55,066,792 |
| Reinvestment of distributions | | | | |
Class A
| 146,892 | 2,903,376 | 2,096,156 | 42,565,818 |
Class C
| 1,387 | 27,575 | 27,825 | 565,194 |
Administrator Class
| 3,798 | 75,177 | 38,712 | 787,414 |
Institutional Class
| 41,378 | 817,149 | 448,365 | 9,114,183 |
| | | 3,823,277 | | 53,032,609 |
| Payment for shares redeemed | | | | |
Class A
| (742,072) | (15,377,581) | (2,391,654) | (51,265,683) |
Class C
| (32,098) | (675,166) | (150,982) | (3,277,302) |
Administrator Class
| (29,310) | (608,676) | (82,475) | (1,755,120) |
Institutional Class
| (422,835) | (8,782,805) | (1,067,904) | (22,740,013) |
| | | (25,444,228) | | (79,038,118) |
Net increase in net assets resulting from capital share transactions
| | 6,004,572 | | 29,061,283 |
Total increase (decrease) in net assets
| | (59,619,419) | | 31,738,072 |
| Net assets | | | | |
Beginning of period
| | 470,355,009 | | 438,616,937 |
End of period
| | $410,735,590 | | $470,355,009 |
The accompanying notes are an integral part of these financial statements.
Allspring Utility and Telecommunications Fund | 15
Financial highlights
(For a share outstanding throughout each period)
| | | Year ended March 31 |
| Class A | Six months ended
September 30, 2022
(unaudited) | 2022 | 2021 | 2020 | 2019 | 2018 |
Net asset value, beginning of period
| $21.48 | $21.47 | $20.19 | $24.03 | $20.46 | $20.01 |
Net investment income
| 0.18 | 0.33 | 0.34 | 0.34 | 0.32 | 0.34 |
Net realized and unrealized gains (losses) on investments
| (2.97) | 2.40 | 3.82 | 0.02 | 3.65 | 0.47 |
Total from investment operations
| (2.79) | 2.73 | 4.16 | 0.36 | 3.97 | 0.81 |
| Distributions to shareholders from | | | | | | |
Net investment income
| (0.18) | (0.32) | (0.35) | (0.34) | (0.34) | (0.36) |
Net realized gains
| 0.00 | (2.40) | (2.53) | (3.86) | (0.06) | 0.00 |
Total distributions to shareholders
| (0.18) | (2.72) | (2.88) | (4.20) | (0.40) | (0.36) |
Net asset value, end of period
| $18.51 | $21.48 | $21.47 | $20.19 | $24.03 | $20.46 |
Total return1
| (13.06)% | 13.62% | 21.23% | 0.04% | 19.59% | 4.00% |
| Ratios to average net assets (annualized) | | | | | | |
Gross expenses
| 1.15% | 1.16% | 1.17% | 1.17% | 1.19% | 1.17% |
Net expenses
| 1.03% | 1.04% | 1.04% | 1.09% | 1.14% | 1.14% |
Net investment income
| 1.67% | 1.52% | 1.58% | 1.42% | 1.47% | 1.60% |
| Supplemental data | | | | | | |
Portfolio turnover rate
| 2% | 11% | 20% | 49% | 10% | 7% |
Net assets, end of period (000s omitted)
| $322,687 | $379,164 | $363,540 | $319,200 | $337,848 | $287,047 |
| 1 | Total return calculations do not include any sales charges. Returns for periods of less than one year are not annualized. |
The accompanying notes are an integral part of these financial statements.
16 | Allspring Utility and Telecommunications Fund
Financial highlights
(For a share outstanding throughout each period)
| | | Year ended March 31 |
| Class C | Six months ended
September 30, 2022
(unaudited) | 2022 | 2021 | 2020 | 2019 | 2018 |
Net asset value, beginning of period
| $21.60 | $21.57 | $20.25 | $24.06 | $20.47 | $20.01 |
Net investment income
| 0.10 1 | 0.17 1 | 0.17 1 | 0.16 1 | 0.16 1 | 0.13 |
Net realized and unrealized gains (losses) on investments
| (2.97) | 2.40 | 3.85 | 0.01 | 3.63 | 0.52 |
Total from investment operations
| (2.87) | 2.57 | 4.02 | 0.17 | 3.79 | 0.65 |
| Distributions to shareholders from | | | | | | |
Net investment income
| (0.11) | (0.14) | (0.17) | (0.12) | (0.14) | (0.19) |
Net realized gains
| 0.00 | (2.40) | (2.53) | (3.86) | (0.06) | 0.00 |
Total distributions to shareholders
| (0.11) | (2.54) | (2.70) | (3.98) | (0.20) | (0.19) |
Net asset value, end of period
| $18.62 | $21.60 | $21.57 | $20.25 | $24.06 | $20.47 |
Total return2
| (13.34)% | 12.75% | 20.34% | (0.73)% | 18.65% | 3.24% |
| Ratios to average net assets (annualized) | | | | | | |
Gross expenses
| 1.89% | 1.90% | 1.91% | 1.92% | 1.94% | 1.92% |
Net expenses
| 1.80% | 1.80% | 1.80% | 1.86% | 1.89% | 1.89% |
Net investment income
| 0.91% | 0.77% | 0.80% | 0.63% | 0.74% | 0.85% |
| Supplemental data | | | | | | |
Portfolio turnover rate
| 2% | 11% | 20% | 49% | 10% | 7% |
Net assets, end of period (000s omitted)
| $4,978 | $4,548 | $6,379 | $10,274 | $19,618 | $41,729 |
| 1 | Calculated based upon average shares outstanding |
| 2 | Total return calculations do not include any sales charges. Returns for periods of less than one year are not annualized. |
The accompanying notes are an integral part of these financial statements.
Allspring Utility and Telecommunications Fund | 17
Financial highlights
(For a share outstanding throughout each period)
| | | Year ended March 31 |
| Administrator Class | Six months ended
September 30, 2022
(unaudited) | 2022 | 2021 | 2020 | 2019 | 2018 |
Net asset value, beginning of period
| $21.52 | $21.51 | $20.22 | $24.05 | $20.48 | $20.03 |
Net investment income
| 0.19 | 0.37 | 0.37 | 0.36 | 0.36 | 0.37 |
Net realized and unrealized gains (losses) on investments
| (2.97) | 2.39 | 3.83 | 0.04 | 3.65 | 0.48 |
Total from investment operations
| (2.78) | 2.76 | 4.20 | 0.40 | 4.01 | 0.85 |
| Distributions to shareholders from | | | | | | |
Net investment income
| (0.19) | (0.35) | (0.38) | (0.37) | (0.38) | (0.40) |
Net realized gains
| 0.00 | (2.40) | (2.53) | (3.86) | (0.06) | 0.00 |
Total distributions to shareholders
| (0.19) | (2.75) | (2.91) | (4.23) | (0.44) | (0.40) |
Net asset value, end of period
| $18.55 | $21.52 | $21.51 | $20.22 | $24.05 | $20.48 |
Total return1
| (12.97)% | 13.76% | 21.39% | 0.20% | 19.80% | 4.21% |
| Ratios to average net assets (annualized) | | | | | | |
Gross expenses
| 1.07% | 1.08% | 1.09% | 1.09% | 1.11% | 1.09% |
Net expenses
| 0.92% | 0.92% | 0.92% | 0.94% | 0.95% | 0.95% |
Net investment income
| 1.79% | 1.63% | 1.70% | 1.49% | 1.66% | 1.80% |
| Supplemental data | | | | | | |
Portfolio turnover rate
| 2% | 11% | 20% | 49% | 10% | 7% |
Net assets, end of period (000s omitted)
| $7,673 | $7,447 | $3,054 | $2,449 | $5,296 | $4,702 |
| 1 | Returns for periods of less than one year are not annualized. |
The accompanying notes are an integral part of these financial statements.
18 | Allspring Utility and Telecommunications Fund
Financial highlights
(For a share outstanding throughout each period)
| | | Year ended March 31 |
| Institutional Class | Six months ended
September 30, 2022
(unaudited) | 2022 | 2021 | 2020 | 2019 | 2018 |
Net asset value, beginning of period
| $21.46 | $21.46 | $20.18 | $24.01 | $20.45 | $20.00 |
Net investment income
| 0.21 | 0.40 | 0.43 | 0.44 | 0.41 | 0.41 |
Net realized and unrealized gains (losses) on investments
| (2.96) | 2.39 | 3.80 | 0.01 | 3.62 | 0.47 |
Total from investment operations
| (2.75) | 2.79 | 4.23 | 0.45 | 4.03 | 0.88 |
| Distributions to shareholders from | | | | | | |
Net investment income
| (0.21) | (0.39) | (0.42) | (0.42) | (0.41) | (0.43) |
Net realized gains
| 0.00 | (2.40) | (2.53) | (3.86) | (0.06) | 0.00 |
Total distributions to shareholders
| (0.21) | (2.79) | (2.95) | (4.28) | (0.47) | (0.43) |
Net asset value, end of period
| $18.50 | $21.46 | $21.46 | $20.18 | $24.01 | $20.45 |
Total return1
| (12.88)% | 13.94% | 21.62% | 0.42% | 20.03% | 4.38% |
| Ratios to average net assets (annualized) | | | | | | |
Gross expenses
| 0.82% | 0.83% | 0.84% | 0.84% | 0.86% | 0.84% |
Net expenses
| 0.72% | 0.72% | 0.72% | 0.75% | 0.78% | 0.78% |
Net investment income
| 2.00% | 1.84% | 1.92% | 1.76% | 1.83% | 1.95% |
| Supplemental data | | | | | | |
Portfolio turnover rate
| 2% | 11% | 20% | 49% | 10% | 7% |
Net assets, end of period (000s omitted)
| $75,397 | $79,196 | $65,644 | $45,888 | $42,427 | $31,548 |
| 1 | Returns for periods of less than one year are not annualized. |
The accompanying notes are an integral part of these financial statements.
Allspring Utility and Telecommunications Fund | 19
Notes to financial statements (unaudited)
1. ORGANIZATION
Allspring Funds Trust (the "Trust"), a Delaware statutory trust organized on March 10, 1999, is an open-end management investment company registered under the Investment Company Act of 1940, as amended (the "1940 Act"). As an investment company, the Trust follows the accounting and reporting guidance in Financial Accounting Standards Board ("FASB") Accounting Standards Codification Topic 946, Financial Services – Investment Companies. These financial statements report on the Allspring Utility and Telecommunications Fund (the "Fund") which is a non-diversified series of the Trust.
2. SIGNIFICANT ACCOUNTING POLICIES
The following significant accounting policies, which are consistently followed in the preparation of the financial statements of the Fund, are in conformity with U.S. generally accepted accounting principles which require management to make estimates and assumptions that affect the reported amounts of assets and liabilities, disclosure of contingent assets and liabilities at the date of the financial statements, and the reported amounts of income and expenses during the reporting period. Actual results could differ from those estimates.
Securities valuation
All investments are valued each business day as of the close of regular trading on the New York Stock Exchange (generally 4 p.m. Eastern Time), although the Fund may deviate from this calculation time under unusual or unexpected circumstances.
Equity securities that are listed on a foreign or domestic exchange or market are valued at the official closing price or, if none, the last sales price.
Investments in registered open-end investment companies are valued at net asset value.
Investments which are not valued using the methods discussed above are valued at their fair value, as determined in good faith by Allspring Funds Management, LLC ("Allspring Funds Management"), which was named the valuation designee by the Board of Trustees. As the valuation designee, Allspring Funds Management is responsible for day-to-day valuation activities for the Allspring Funds. In connection with these responsibilities, Allspring Funds Management has established a Valuation Committee and has delegated to it the authority to take any actions regarding the valuation of portfolio securities that the Valuation Committee deems necessary or appropriate, including determining the fair value of portfolio securities. On a quarterly basis, the Board of Trustees receives reports of valuation actions taken by the Valuation Committee. On at least an annual basis, the Board of Trustees receives an assessment of the adequacy and effectiveness of Allspring Funds Management's process for determining the fair value of the portfolio of investments.
Security transactions and income recognition
Securities transactions are recorded on a trade date basis. Realized gains or losses are recorded on the basis of identified cost.
Dividend income is recognized on the ex-dividend date.
Distributions to shareholders
Distributions to shareholders are recorded on the ex-dividend date and paid from net investment income quarterly and any net realized gains are paid at least annually. Such distributions are determined in accordance with income tax regulations and may differ from U.S. generally accepted accounting principles. Dividend sources are estimated at the time of declaration. The tax character of distributions is determined as of the Fund's fiscal year end. Therefore, a portion of the Fund's distributions made prior to the Fund’s fiscal year end may be categorized as a tax return of capital at year end.
Federal and other taxes
The Fund intends to continue to qualify as a regulated investment company by distributing substantially all of its investment company taxable income and any net realized capital gains (after reduction for capital loss carryforwards) sufficient to relieve it from all, or substantially all, federal income taxes. Accordingly, no provision for federal income taxes was required.
The Fund’s income and federal excise tax returns and all financial records supporting those returns for the prior three fiscal years are subject to examination by the federal and Delaware revenue authorities. Management has analyzed the Fund's tax positions taken on federal, state, and foreign tax returns, as applicable, for all open tax years and does not believe that there are any uncertain tax positions that require recognition of a tax liability.
20 | Allspring Utility and Telecommunications Fund
Notes to financial statements (unaudited)
As of September 30, 2022, the aggregate cost of all investments for federal income tax purposes was $301,791,280 and the unrealized gains (losses) consisted of:
| Gross unrealized gains | $121,166,197 |
| Gross unrealized losses | (11,927,514) |
| Net unrealized gains | $109,238,683 |
Class allocations
The separate classes of shares offered by the Fund differ principally in applicable sales charges, distribution, shareholder servicing, and administration fees. Class specific expenses are charged directly to that share class. Investment income, common fund-level expenses, and realized and unrealized gains (losses) on investments are allocated daily to each class of shares based on the relative proportion of net assets of each class.
3. FAIR VALUATION MEASUREMENTS
Fair value measurements of investments are determined within a framework that has established a fair value hierarchy based upon the various data inputs utilized in determining the value of the Fund’s investments. The three-level hierarchy gives the highest priority to unadjusted quoted prices in active markets for identical assets or liabilities (Level 1) and the lowest priority to unobservable inputs (Level 3). The Fund’s investments are classified within the fair value hierarchy based on the lowest level of input that is significant to the fair value measurement. The inputs are summarized into three broad levels as follows:
| ■ | Level 1 – quoted prices in active markets for identical securities |
| ■ | Level 2 – other significant observable inputs (including quoted prices for similar securities, interest rates, prepayment speeds, credit risk, etc.) |
| ■ | Level 3 – significant unobservable inputs (including the Fund’s own assumptions in determining the fair value of investments) |
The inputs or methodologies used for valuing investments in securities are not necessarily an indication of the risk associated with investing in those securities.
The following is a summary of the inputs used in valuing the Fund’s assets and liabilities as of September 30, 2022:
| | Quoted prices
(Level 1) | Other significant
observable inputs
(Level 2) | Significant
unobservable inputs
(Level 3) | Total |
| Assets | | | | |
| Investments in: | | | | |
| Common stocks | | | | |
| Communication services | $ 20,916,536 | $0 | $0 | $ 20,916,536 |
| Consumer discretionary | 8,346,872 | 0 | 0 | 8,346,872 |
| Financials | 4,156,174 | 0 | 0 | 4,156,174 |
| Health care | 14,498,105 | 0 | 0 | 14,498,105 |
| Information technology | 23,607,002 | 0 | 0 | 23,607,002 |
| Real estate | 14,067,573 | 0 | 0 | 14,067,573 |
| Utilities | 315,069,077 | 0 | 0 | 315,069,077 |
| Short-term investments | | | | |
| Investment companies | 10,368,624 | 0 | 0 | 10,368,624 |
| Total assets | $411,029,963 | $0 | $0 | $411,029,963 |
Additional sector, industry or geographic detail, if any, is included in the Portfolio of Investments.
For the six months ended September 30, 2022, the Fund did not have any transfers into/out of Level 3.
Allspring Utility and Telecommunications Fund | 21
Notes to financial statements (unaudited)
4. TRANSACTIONS WITH AFFILIATES
Management fee
Allspring Funds Management, a wholly owned subsidiary of Allspring Global Investments Holdings, LLC, a holding company indirectly owned by certain private funds of GTCR LLC and Reverence Capital Partners, L.P., is the manager of the Fund and provides advisory and fund-level administrative services under an investment management agreement. Under the investment management agreement, Allspring Funds Management is responsible for, among other services, implementing the investment objectives and strategies of the Fund, supervising the subadviser and providing fund-level administrative services in connection with the Fund’s operations. As compensation for its services under the investment management agreement, Allspring Funds Management is entitled to receive a management fee at the following annual rate based on the Fund’s average daily net assets:
| Average daily net assets | Management fee |
| First $500 million | 0.650% |
| Next $500 million | 0.600 |
| Next $1 billion | 0.550 |
| Next $2 billion | 0.525 |
| Next $1 billion | 0.500 |
| Next $5 billion | 0.490 |
| Over $10 billion | 0.480 |
For the six months ended September 30, 2022, the management fee was equivalent to an annual rate of 0.65% of the Fund’s average daily net assets.
Allspring Funds Management has retained the services of a subadviser to provide daily portfolio management to the Fund. The fee for subadvisory services is borne by Allspring Funds Management. Allspring Global Investments, LLC, an affiliate of Allspring Funds Management and a wholly owned subsidiary of Allspring Global Investments Holdings, LLC, is the subadviser to the Fund and is entitled to receive a fee from Allspring Funds Management at an annual rate starting at 0.30% and declining to 0.20% as the average daily net assets of the Fund increase.
Administration fees
Under a class-level administration agreement, Allspring Funds Management provides class-level administrative services to the Fund, which includes paying fees and expenses for services provided by the transfer agent, sub-transfer agents, omnibus account servicers and record-keepers. As compensation for its services under the class-level administration agreement, Allspring Funds Management receives an annual fee which is calculated based on the average daily net assets of each class as follows:
| | Class-level
administration fee |
| Class A | 0.21% |
| Class C | 0.21 |
| Administrator Class | 0.13 |
| Institutional Class | 0.13 |
Waivers and/or expense reimbursements
Allspring Funds Management has contractually committed to waive and/or reimburse management and administration fees to the extent necessary to maintain certain net operating expense ratios for the Fund. When each class of the Fund has exceeded its expense cap, Allspring Funds Management will waive fees and/or reimburse expenses from fund-level expenses on a proportionate basis and then from class specific expenses. When only certain classes exceed their expense caps, waivers and/or reimbursements are applied against class specific expenses before fund-level expenses. Allspring Funds Management has contractually committed through July 31, 2023 to waive fees and/or reimburse expenses to the extent necessary to cap expenses. Prior to or after the commitment expiration date, the caps may be increased or the commitment to maintain the
22 | Allspring Utility and Telecommunications Fund
Notes to financial statements (unaudited)
caps may be terminated only with the approval of the Board of Trustees. As of September 30, 2022, the contractual expense caps are as follows:
| | Expense ratio caps |
| Class A | 1.05% |
| Class C | 1.80 |
| Administrator Class | 0.92 |
| Institutional Class | 0.72 |
Distribution fee
The Trust has adopted a distribution plan for Class C shares pursuant to Rule 12b-1 under the 1940 Act. A distribution fee is charged to Class C shares and paid to Allspring Funds Distributor, LLC ("Allspring Funds Distributor"), the principal underwriter, an affiliate of Allspring Funds Management, at an annual rate of 0.75% of the average daily net assets of Class C shares.
In addition, Allspring Funds Distributor is entitled to receive the front-end sales charge from the purchase of Class A shares and a contingent deferred sales charge on the redemption of certain Class A shares. Allspring Funds Distributor is also entitled to receive the contingent deferred sales charges from redemptions of Class C shares. For the six months ended September 30, 2022, Allspring Funds Distributor received $5,130 from the sale of Class A shares. No contingent deferred sales charges were incurred by Class A and Class C shares for the six months ended September 30, 2022.
Shareholder servicing fees
The Trust has entered into contracts with one or more shareholder servicing agents, whereby Class A, Class C and Administrator Class are charged a fee at an annual rate of 0.25% of the average daily net assets of each respective class. A portion of these total shareholder servicing fees were paid to affiliates.
Interfund transactions
The Fund may purchase or sell portfolio investment securities to certain affiliates pursuant to Rule 17a-7 under the 1940 Act and under procedures adopted by the Board of Trustees. The procedures have been designed to ensure that these interfund transactions, which do not incur broker commissions, are effected at current market prices.
5. INVESTMENT PORTFOLIO TRANSACTIONS
Purchases and sales of investments, excluding U.S. government obligations (if any) and short-term securities, for the six months ended September 30, 2022 were $8,962,540 and $7,136,215, respectively.
6. BANK BORROWINGS
The Trust (excluding the money market funds), Allspring Master Trust and Allspring Variable Trust are parties to a $350,000,000 revolving credit agreement whereby the Fund is permitted to use bank borrowings for temporary or emergency purposes, such as to fund shareholder redemption requests. Interest under the credit agreement is charged to the Fund based on a borrowing rate equal to the higher of the Federal Funds rate or the overnight bank funding rate in effect on that day plus a spread. In addition, an annual commitment fee equal based on the unused balance is allocated to each participating fund.
For the six months ended September 30, 2022, there were no borrowings by the Fund under the agreement.
7. CONCENTRATION RISKS
The Fund concentrated its portfolio of investments in the utility sector. A fund that invests a substantial portion of its assets in any sector may be more affected by changes in that sector than would be a fund whose investments are not heavily weighted in any sector.
8. INDEMNIFICATION
Under the Fund's organizational documents, the officers and Trustees have been granted certain indemnification rights against certain liabilities that may arise out of performance of their duties to the Fund. The Fund has entered into a separate agreement with each Trustee that converts indemnification rights currently existing under the Fund’s organizational documents into contractual rights that cannot be changed in the future without the consent of the Trustee. Additionally, in the normal course of business, the Fund may enter into contracts with service providers that contain a variety of indemnification
Allspring Utility and Telecommunications Fund | 23
Notes to financial statements (unaudited)
clauses. The Fund’s maximum exposure under these arrangements is dependent on future claims that may be made against the Fund and, therefore, cannot be estimated.
9. CORONAVIRUS (COVID-19) PANDEMIC
On March 11, 2020, the World Health Organization announced that it had made the assessment that coronavirus disease 2019 (“COVID-19”) is a pandemic. The impacts of COVID-19 are affecting the entire global economy, individual companies and investment products, the funds, and the market in general. There is significant uncertainty around the extent and duration of business disruptions related to COVID-19 and the impacts may last for an extended period of time. COVID-19 has led to significant uncertainty and volatility in the financial markets.
24 | Allspring Utility and Telecommunications Fund
Other information (unaudited)
PROXY VOTING INFORMATION
A description of the policies and procedures used to determine how to vote proxies relating to portfolio securities is available without charge, upon request, by calling 1-800-222-8222, visiting our website at allspringglobal.com, or visiting the SEC website at sec.gov. Information regarding how the proxies related to portfolio securities were voted during the most recent 12-month period ended June 30 is available on the website at allspringglobal.com or by visiting the SEC website at sec.gov.
QUARTERLY PORTFOLIO HOLDINGS INFORMATION
The Fund files its complete schedule of portfolio holdings with the SEC for the first and third quarters of each fiscal year as an exhibit to its reports on Form N-PORT. Shareholders may view the filed Form N-PORT by visiting the SEC website at sec.gov.
Allspring Utility and Telecommunications Fund | 25
Other information (unaudited)
BOARD OF TRUSTEES AND OFFICERS
Each of the Trustees and Officers listed in the table below acts in identical capacities for each fund in the Allspring family of funds, which consists of 124 mutual funds comprising the Allspring Funds Trust, Allspring Variable Trust, Allspring Master Trust and four closed-end funds (collectively the “Fund Complex”). This table should be read in conjunction with the Prospectus and the Statement of Additional Information1. The mailing address of each Trustee and Officer is 525 Market Street, 12th Floor, San Francisco, CA 94105. Each Trustee and Officer serves an indefinite term, however, each Trustee serves such term until reaching the mandatory retirement age established by the Trustees.
Independent Trustees
Name and
year of birth | Position held and
length of service* | Principal occupations during past five years or longer | Current other
public company or
investment
company
directorships |
William R. Ebsworth
(Born 1957) | Trustee,
since 2015 | Retired. From 1984 to 2013, equities analyst, portfolio manager, research director and chief investment officer at Fidelity Management and Research Company in Boston, Tokyo, and Hong Kong, and retired in 2013 as Chief Investment Officer of Fidelity Strategic Advisers, Inc. where he led a team of investment professionals managing client assets. Prior thereto, Board member of Hong Kong Securities Clearing Co., Hong Kong Options Clearing Corp., the Thailand International Fund, Ltd., Fidelity Investments Life Insurance Company, and Empire Fidelity Investments Life Insurance Company. Audit Committee Chair and Investment Committee Chair of the Vincent Memorial Hospital Endowment (non-profit organization). Mr. Ebsworth is a CFA® charterholder. | N/A |
Jane A. Freeman
(Born 1953) | Trustee,
since 2015;
Chair Liaison,
since 2018 | Retired. From 2012 to 2014 and 1999 to 2008, Chief Financial Officer of Scientific Learning Corporation. From 2008 to 2012, Ms. Freeman provided consulting services related to strategic business projects. Prior to 1999, Portfolio Manager at Rockefeller & Co. and Scudder, Stevens & Clark. Board member of the Harding Loevner Funds from 1996 to 2014, serving as both Lead Independent Director and chair of the Audit Committee. Board member of the Russell Exchange Traded Funds Trust from 2011 to 2012 and the chair of the Audit Committee. Ms. Freeman is also an inactive Chartered Financial Analyst. | N/A |
Isaiah Harris, Jr.
(Born 1952) | Trustee,
since 2009; Audit
Committee
Chair,
since 2019 | Retired. Chairman of the Board of CIGNA Corporation from 2009 to 2021, and Director from 2005 to 2008. From 2003 to 2011, Director of Deluxe Corporation. Prior thereto, President and CEO of BellSouth Advertising and Publishing Corp. from 2005 to 2007, President and CEO of BellSouth Enterprises from 2004 to 2005 and President of BellSouth Consumer Services from 2000 to 2003. Emeritus member of the Iowa State University Foundation Board of Governors. Emeritus Member of the Advisory Board of Iowa State University School of Business. Advisory Board Member, Palm Harbor Academy (private school). Advisory Board Member, Fellowship of Christian Athletes. Mr. Harris is a certified public accountant (inactive status). | N/A |
David F. Larcker
(Born 1950) | Trustee,
since 2009 | James Irvin Miller Professor of Accounting at the Graduate School of Business (Emeritus), Stanford University, Director of the Corporate Governance Research Initiative and Senior Faculty of The Rock Center for Corporate Governance since 2006. From 2005 to 2008, Professor of Accounting at the Graduate School of Business, Stanford University. Prior thereto, Ernst & Young Professor of Accounting at The Wharton School, University of Pennsylvania from 1985 to 2005. | N/A |
26 | Allspring Utility and Telecommunications Fund
Other information (unaudited)
Name and
year of birth | Position held and
length of service* | Principal occupations during past five years or longer | Current other
public company or
investment
company
directorships |
Olivia S. Mitchell
(Born 1953) | Trustee,
since 2006;
Nominating and
Governance
Committee Chair,
since 2018 | International Foundation of Employee Benefit Plans Professor since 1993, Wharton School of the University of Pennsylvania. Director of Wharton’s Pension Research Council and Boettner Center on Pensions & Retirement Research, and Research Associate at the National Bureau of Economic Research. Previously taught at Cornell University from 1978 to 1993. | N/A |
Timothy J. Penny
(Born 1951) | Trustee,
since 1996;
Chair,
since 2018 | President and Chief Executive Officer of Southern Minnesota Initiative Foundation, a non-profit organization, since 2007. Vice Chair of the Economic Club of Minnesota, since 2007. Co-Chair of the Committee for a Responsible Federal Budget, since 1995. Member of the Board of Trustees of NorthStar Education Finance, Inc., a non-profit organization, since 2007. Senior Fellow of the University of Minnesota Humphrey Institute from 1995 to 2017. | N/A |
James G. Polisson
(Born 1959) | Trustee,
since 2018 | Retired. Chief Marketing Officer, Source (ETF) UK Services, Ltd, from 2015 to 2017. From 2012 to 2015, Principal of The Polisson Group, LLC, a management consulting, corporate advisory and principal investing company. Chief Executive Officer and Managing Director at Russell Investments, Global Exchange Traded Funds from 2010 to 2012. Managing Director of Barclays Global Investors from 1998 to 2010 and Global Chief Marketing Officer for iShares and Barclays Global Investors from 2000 to 2010. Trustee of the San Francisco Mechanics’ Institute, a non-profit organization, from 2013 to 2015. Board member of the Russell Exchange Traded Fund Trust from 2011 to 2012. Director of Barclays Global Investors Holdings Deutschland GmbH from 2006 to 2009. Mr. Polisson is an attorney and has a retired status with the Massachusetts and District of Columbia Bar Associations. | N/A |
Pamela Wheelock
(Born 1959) | Trustee,
since January
2020; previously
Trustee from
January 2018 to
July 2019 | Retired. Executive and Senior Financial leadership positions in the public, private and nonprofit sectors. Interim President and CEO, McKnight Foundation, 2020. Interim Commissioner, Minnesota Department of Human Services, 2019. Chief Operating Officer, Twin Cities Habitat for Humanity, 2017-2019. Vice President for University Services, University of Minnesota, 2012-2016. Interim President and CEO, Blue Cross and Blue Shield of Minnesota, 2011-2012. Executive Vice-President and Chief Financial Officer, Minnesota Wild, 2002-2008. Commissioner, Minnesota Department of Finance, 1999-2002. Chair of the Board of Directors of Destination Medical Center Corporation. Board member of the Minnesota Wild Foundation. | N/A |
* Length of service dates reflect the Trustee’s commencement of service with the Trust’s predecessor entities, where applicable.
Allspring Utility and Telecommunications Fund | 27
Other information (unaudited)
Officers2
Name and
year of birth | Position held and
length of service | Principal occupations during past five years or longer |
Andrew Owen
(Born 1960) | President,
since 2017 | President and Chief Executive Officer of Allspring Funds Management, LLC since 2017 and Head of Global Fund Governance of Allspring Global Investments since 2022. Prior thereto, co-president of Galliard Capital Management, LLC, an affiliate of Allspring Funds Management, LLC, from 2019 to 2022 and Head of Affiliated Managers, Allspring Global Investments, from 2014 to 2019 and Executive Vice President responsible for marketing, investments and product development for Allspring Funds Management, LLC, from 2009 to 2014. |
Jeremy DePalma
(Born 1974) | Treasurer,
since 2012
(for certain funds in
the Fund Complex);
since 2021 (for
the remaining funds in the
Fund Complex) | Senior Vice President of Allspring Funds Management, LLC since 2009. Senior Vice President of Evergreen Investment Management Company, LLC from 2008 to 2010 and head of the Fund Reporting and Control Team within Fund Administration from 2005 to 2010. |
Christopher Baker
(Born 1976) | Chief Compliance Officer, since 2022 | Global Chief Compliance Officer for Allspring Global Investments since 2022. Prior thereto, Chief Compliance Officer for State Street Global Advisors from 2018 to 2021. Senior Compliance Officer for the State Street divisions of Alternative Investment Solutions, Sector Solutions, and Global Marketing from 2015 to 2018. From 2010 to 2015 Vice President, Global Head of Investment and Marketing Compliance for State Street Global Advisors. |
Matthew Prasse
(Born 1983) | Chief Legal Officer, since 2022; Secretary, since 2021 | Senior Counsel of the Allspring Legal Department since 2021. Senior Counsel of the Wells Fargo Legal Department from 2018 to 2021. Previously, Counsel for Barings LLC from 2015 to 2018. Prior to joining Barings, Associate at Morgan, Lewis & Bockius LLP from 2008 to 2015. |
1 The Statement of Additional Information includes additional information about the Trustees and is available, without charge, upon request, by calling 1-800-222-8222 or by visiting the website at allspringglobal.com.
2 For those Officers with tenures at Allspring Global Investments and/or Allspring Funds Management, LLC that began prior to 2021, such tenures include years of service during which these businesses/entities were known as Wells Fargo Asset Management and Wells Fargo Funds Management, LLC, respectively.
28 | Allspring Utility and Telecommunications Fund
Other information (unaudited)
LIQUIDITY RISK MANAGEMENT PROGRAM
In accordance with Rule 22e-4 under the Investment Company Act of 1940, as amended (the “Liquidity Rule”), Allspring Funds Trust (the “Trust”) has adopted and implemented a liquidity risk management program (the “Program”) on behalf of each of its series (other than the series that operate as money market funds), including the Fund, which is reasonably designed to assess and manage the Fund's liquidity risk. “Liquidity risk” is defined under the Liquidity Rule as the risk that the Fund is unable to meet redemption requests without significantly diluting remaining investors’ interests in the Fund. The Trust’s Board of Trustees (the “Board”) previously approved the designation of Allspring Funds Management, LLC (“Allspring Funds Management”), the Fund's investment manager, to administer the Program, and Allspring Funds Management has established a Liquidity Risk Management Council (the "Council") composed of personnel from multiple departments within Allspring Funds Management and its affiliates to assist Allspring Funds Management in the administration of the Program.
The Program is comprised of various components designed to support the assessment and/or management of liquidity risk, including: (1) the periodic assessment (no less frequently than annually) of certain factors that influence the Fund's liquidity risk; (2) the periodic classification (no less frequently than monthly) of the Fund's investments into one of four liquidity categories that reflect an estimate of their liquidity under current market conditions; (3) a 15% limit on the acquisition of “illiquid investments” (as defined under the Liquidity Rule); (4) to the extent the Fund does not invest primarily in “highly liquid investments” (as defined under the Liquidity Rule), the determination of a minimum percentage of the Fund's assets that generally will be invested in highly liquid investments (an “HLIM”); (5) if the Fund has established an HLIM, the periodic review (no less frequently than annually) of the HLIM and the adoption of policies and procedures for responding to a shortfall of the Fund's “highly liquid investments” below its HLIM; and (6) periodic reporting to the Board.
At a meeting of the Board held on May 24-25, 2022, the Board received and reviewed a written report (the “Report”) from Allspring Funds Management that, among other things, addressed the operation of the Program and assessed its adequacy and effectiveness for the period from January 1, 2021 through December 31, 2021 (the “Reporting Period”). Other than extended foreign market holidays, no significant liquidity events impacting the Funds were noted in the Report. In addition, other than corporate-related changes to the Program, there were no material changes to the Program during the Reporting Period.
Allspring Funds Management determined in the Report that the Program has been implemented and operates effectively to manage the Fund’s liquidity risk, and Allspring Funds Management continues to believe that the Program has been and continues to be adequately and effectively implemented to monitor and, as applicable, respond to the Fund’s liquidity developments.
There can be no assurance that the Program will achieve its objectives under all circumstances in the future. Please refer to the Fund’s prospectus for more information regarding the Fund’s exposure to liquidity risk and other risks to which an investment in the Fund may be subject.
Allspring Utility and Telecommunications Fund | 29
For more information
More information about Allspring Funds is available free upon request. To obtain literature, please write, visit the Fund's website, or call:
Allspring Funds
P.O. Box 219967
Kansas City, MO 64121-9967
Website: allspringglobal.com
Individual investors: 1-800-222-8222
Retail investment professionals: 1-888-877-9275
Institutional investment professionals: 1-800-260-5969
This report and the financial statements contained herein are submitted for the general information of the shareholders of the Fund. If this report is used for promotional purposes, distribution of the report must be accompanied or preceded by a current prospectus. Before investing, please consider the investment objectives, risks, charges, and expenses of the investment. For a current prospectus and, if available, a summary prospectus, containing this information, call
1-800-222-8222 or visit the Fund's website at allspringglobal.com. Read the prospectus carefully before you invest or send money.
Allspring Global InvestmentsTM is the trade name for the asset management firms of Allspring Global Investments Holdings, LLC, a holding company indirectly owned by certain private funds of GTCR LLC and Reverence Capital Partners, L.P. These firms include but are not limited to Allspring Global Investments, LLC, and Allspring Funds Management, LLC. Certain products managed by Allspring entities are distributed by Allspring Funds Distributor, LLC (a broker-dealer and Member FINRA/SIPC).
This material is for general informational and educational purposes only and is NOT intended to provide investment advice or a recommendation of any kind - including a recommendation for any specific investment, strategy, or plan.
© 2022 Allspring Global Investments Holdings, LLC. All rights reserved.
PAR-1022-00385 11-22
SA318/SAR318 09-22
ITEM 2. CODE OF ETHICS
Not applicable.
ITEM 3. AUDIT COMMITTEE FINANCIAL EXPERT
Not applicable.
ITEM 4. PRINCIPAL ACCOUNTANT FEES AND SERVICES
Not applicable.
ITEM 5. AUDIT COMMITTEE OF LISTED REGISTRANTS
Not applicable.
ITEM 6. INVESTMENTS
A Portfolio of Investments for each series of Allspring Funds Trust is included as part of the report to shareholders filed under Item 1 of this Form.
ITEM 7. DISCLOSURE OF PROXY VOTING POLICIES AND PROCEDURES FOR CLOSED-END MANAGEMENT INVESTMENT COMPANIES
Not applicable.
ITEM 8. PORTFOLIO MANAGERS OF CLOSED-END MANAGEMENT INVESTMENT COMPANIES
Not applicable.
ITEM 9. PURCHASES OF EQUITY SECURITIES BY CLOSED-END MANAGEMEENT INVESTMENT COMPANY AND AFFILIATED PURCHASERS
Not applicable.
ITEM 10. SUBMISSION OF MATTERS TO A VOTE OF SECURITY HOLDERS
There have been no material changes to the procedures by which shareholders may recommend nominees to the registrant’s Board of Trustees that have been implemented since the registrant’s last provided disclosure in response to the requirements of this Item.
ITEM 11. CONTROLS AND PROCEDURES
(a) The President and Treasurer have concluded that the Allspring Funds Trust disclosure controls and procedures (as defined in Rule 30a-3(c) under the Investment Company Act of 1940) provide reasonable assurances that material information relating to the registrant is made known to them by the appropriate persons, based on their evaluation of these controls and procedures as of a date within 90 days of the filing of this report.
(b) There were no significant changes in the registrant’s internal controls over financial reporting (as defined in Rule 30a-3(d) under the Investment Company Act of 1940) that occurred during the most recent fiscal half-year of the period covered by this report that materially affected, or is reasonably likely to materially affect, the registrant’s internal control over financial reporting.
ITEM 12. DISCLOSURES OF SECURITIES LENDING ACTIVITES FOR CLOSED-END MANAGEMENT INVESTMENT COMPANIES
Not applicable.
ITEM 13. EXHIBITS
(a)(1) Not applicable.
(a)(2) Certifications pursuant to Section 302 of the Sarbanes-Oxley Act of 2002.
(b) Certifications pursuant to Section 906 of the Sarbanes-Oxley Act of 2002.
SIGNATURES
Pursuant to the requirements of the Securities Exchange Act of 1934 and the Investment Company Act of 1940, the registrant has duly caused this report to be signed on its behalf by the undersigned, thereunto duly authorized.
| | |
| Allspring Funds Trust |
| |
| By: | | /s/Andrew Owen |
| | Andrew Owen |
| | President |
|
| Date: November 22, 2022 |
Pursuant to the requirements of the Securities Exchange Act of 1934 and the Investment Company Act of 1940, this report has been signed below by the following persons on behalf of the registrant and in the capacities and on the date indicated.
| | |
| Allspring Funds Trust |
| |
| By: | | /s/Andrew Owen |
| | Andrew Owen |
| | President |
| Date: November 22, 2022 |
| | |
| By: | | /s/Jeremy DePalma |
| | Jeremy DePalma |
| | Treasurer |
| Date: November 22, 2022 |