UNITED STATES
SECURITIES AND EXCHANGE COMMISSION
Washington, D.C. 20549
FORM N-CSRS
CERTIFIED SHAREHOLDER REPORT OF REGISTERED
MANAGEMENT INVESTMENT COMPANIES
Investment Company Act file number: 811-09253
Allspring Funds Trust
(Exact name of registrant as specified in charter)
525 Market St., San Francisco, CA 94105
(Address of principal executive offices) (Zip code)
Matthew Prasse
Allspring Funds Management, LLC
525 Market St., San Francisco, CA 94105
(Name and address of agent for service)
Registrant’s telephone number, including area code: 800-222-8222
Date of fiscal year end: April 30
Registrant is making a filing for 1 of its series: Allspring Absolute Return Fund.
Date of reporting period: October 31, 2022
ITEM 1. REPORT TO STOCKHOLDERS
Semi-Annual Report
October 31, 2022
Allspring Absolute Return Fund
The views expressed and any forward-looking statements are as of October 31, 2022, unless otherwise noted, and are those of the Fund's portfolio managers and/or Allspring Global Investments. Discussions of individual securities or the markets generally are not intended as individual recommendations. Future events or results may vary significantly from those expressed in any forward-looking statements. The views expressed are subject to change at any time in response to changing circumstances in the market. Allspring Global Investments disclaims any obligation to publicly update or revise any views expressed or forward-looking statements.
Allspring Absolute Return Fund | 1
Letter to shareholders (unaudited)
Andrew Owen
President
Allspring Funds
Dear Shareholder:
We are pleased to offer you this semi-annual report for Allspring Absolute Return Fund for the six-month period that ended October 31, 2022. Globally, stocks and bonds experienced heightened volatility through the extremely difficult period. Non-U.S. securities fared the worst as the global economy faced multiple challenges and the strength of the U.S. dollar eroded already-poor returns of non-U.S.-dollar-denominated assets. Bonds had historically poor performance, with major fixed income indexes falling substantially for the six-month period.
Earlier tailwinds provided by global stimulus programs, vaccination rollouts, and recovering consumer and corporate sentiment were wiped away by the highest rate of inflation in four decades, the impact of ongoing aggressive central bank rate hikes and the prospect of more, plus the global reverberations of the Russia-Ukraine war. The already-significant global supply-chain disruptions were compounded by China’s COVID-19 lockdowns.
For the six-month period, both stocks and bonds registered major losses, with even U.S. bonds suffering deep losses and other assets faring worse. For the period, U.S. stocks, based on the S&P 500 Index,1 lost 5.50%. International stocks, as measured by the MSCI ACWI ex USA Index (Net),2 returned -14.59%, while the MSCI EM Index (Net) (USD)3 lost 19.66%. Among bond indexes, the Bloomberg U.S. Aggregate Bond Index4 returned -6.86%, the Bloomberg Global Aggregate ex-USD Index (unhedged)5 returned -13.07%, the Bloomberg Municipal Bond Index6 declined 4.43%, and the ICE BofA U.S. High Yield Index7 fell 4.53%.
Rising inflation, COVID, and the Russian invasion of Ukraine drove market performance.
Months-long market volatility that had been sparked by the Russian invasion of Ukraine continued in May, although stocks recovered ground late in the month. Value stocks continued to outperform growth stocks. The concerns that had dominated markets for months continued, including high inflation and geopolitical tensions that added to high crude oil, gasoline, and food prices. In response, the Federal Reserve (Fed) raised the federal funds rate by 0.50%, with widescale expectations of more rate hikes. Meanwhile, highly contagious COVID-19 variants persisted. However, labor markets in the U.S., the U.K., and Europe remained strong. U.S. retail sales for April, released in May, indicated a fourth consecutive monthly increase, reflecting continued consumer resilience.
In June, stocks posted further losses en route to their worst first half of a year in 50 years. Bonds didn’t fare much better. Driving the losses were the familiar factors: rising global inflation and fears of recession as central banks increased rates to try to curb soaring inflation. The Fed raised its short-term rate by another 0.75% in June. Meanwhile, the U.S. unemployment rate held firm at 3.6% and the housing market remained only marginally affected by sharply higher mortgage rates.
“In June, stocks posted further losses en route to their worst first half of a year in 50 years. Bonds didn’t fare much better. Driving the losses were the familiar factors: rising global inflation and fears of recession as central banks increased rates to try to curb soaring inflation.”
| 1 | The S&P 500 Index consists of 500 stocks chosen for market size, liquidity, and industry group representation. It is a market-value-weighted index with each stock's weight in the index proportionate to its market value. You cannot invest directly in an index. |
| 2 | The Morgan Stanley Capital International (MSCI) All Country World Index (ACWI) ex USA Index (Net) is a free-float-adjusted market-capitalization-weighted index that is designed to measure the equity market performance of developed and emerging markets, excluding the U.S. Source: MSCI. MSCI makes no express or implied warranties or representations and shall have no liability whatsoever with respect to any MSCI data contained herein. The MSCI data may not be further redistributed or used as a basis for other indexes or any securities or financial products. This report is not approved, reviewed, or produced by MSCI. You cannot invest directly in an index. |
| 3 | The MSCI Emerging Markets (EM) Index (Net) (USD) is a free-float-adjusted market-capitalization-weighted index that is designed to measure equity market performance of emerging markets. You cannot invest directly in an index. |
| 4 | The Bloomberg U.S. Aggregate Bond Index is a broad-based benchmark that measures the investment-grade, U.S.-dollar-denominated, fixed-rate taxable bond market, including Treasuries, government-related and corporate securities, mortgage-backed securities (agency fixed-rate and hybrid adjustable-rate mortgage pass-throughs), asset-backed securities, and commercial mortgage-backed securities. You cannot invest directly in an index. |
| 5 | The Bloomberg Global Aggregate ex-USD Index (unhedged) is an unmanaged index that provides a broad-based measure of the global investment-grade fixed-income markets excluding the U.S.-dollar-denominated debt market. You cannot invest directly in an index. |
| 6 | The Bloomberg Municipal Bond Index is an unmanaged index composed of long-term tax-exempt bonds with a minimum credit rating of Baa. You cannot invest directly in an index. |
| 7 | The ICE BofA U.S. High Yield Index is a market-capitalization-weighted index of domestic and Yankee high-yield bonds. The index tracks the performance of high-yield securities traded in the U.S. bond market. You cannot invest directly in an index. Copyright 2022. ICE Data Indices, LLC. All rights reserved. |
2 | Allspring Absolute Return Fund
Letter to shareholders (unaudited)
Markets rebounded in July, led by U.S. stocks. While evidence began to point to an economic slowdown after two consecutive quarters of declining gross domestic product (economic contraction), the U.S. labor market remained surprisingly strong: July nonfarm payrolls grew by more than 500,000 and U.S. unemployment dipped to 3.5%. Meanwhile, crude oil and retail gasoline prices, major contributors to recent overall inflation, fell substantially from earlier highs. And while U.S. home prices rose, home sales fell as houses became less affordable with mortgage rates at a 13-year high. The Fed raised the federal funds rate another 0.75% in July—to a range of 2.25% to 2.50%—and forecasts pointed to further rate hikes.
August was yet another broadly challenging month for financial markets, with more red ink flowing. High inflation persisted, cresting 9% in the eurozone on an annual basis and remaining above 8% in the United States despite the Fed’s aggressive monetary policy and a major drop in global crude oil and gasoline prices from their June peak. One positive note was the resilience of the U.S. job market. However, the Fed’s job was clearly not complete. One longer-term bright spot was the U.S. Congress’s passage of the Inflation Reduction Act. Its primary stated goals include : to reduce inflation (though not immediately) by curbing the deficit, capping health care spending by seniors, and investing in domestic sources of clean energy.
The market misery continued in September. There was nowhere to hide as all asset classes suffered major losses at the hands of persistent inflation. Central banks kept up their battle against rapidly rising prices with more rate hikes. The strength of the U.S. dollar made things even more difficult for investors holding assets in other currencies. U.S. mortgage rates jumped to near 7% on 30-year fixed-rate mortgages; the decreased housing affordability began to cool demand somewhat. The U.K. experienced a sharp sell-off of government bonds and the British pound in September as investors panicked in response to a new government budget that was seen as financially unsound. The market meltdown forced the Bank of England to step in and buy long-dated government bonds.
Equities had a reprieve in October after two months of sharp declines. Value stocks and small caps fared best. Globally, developed markets outpaced emerging market equities, which were hurt by weakness among Chinese stocks. Central banks continued to try to curtail high inflation with aggressive interest rate hikes. Geopolitical risks persisted, including the ongoing Russia-Ukraine war and economic, financial market, and political turmoil in the U.K., which led to a second prime ministerial change in six weeks, as Rishi Sunak replaced Liz Truss in late October. Concerns over Europe’s energy crisis eased, for now, thanks to unseasonably warm weather and plentiful gas on hand. The U.S. labor market continued its resilience against rising prices, as unemployment stood at 3.7%, near a record low.
Don’t let short-term uncertainty derail long-term investment goals.
Periods of investment uncertainty can present challenges, but experience has taught us that maintaining long-term investment goals can be an effective way to plan for the future. To help you create a sound strategy based on your personal goals and risk tolerance, Allspring Funds offers more than 100 mutual funds spanning a wide range of asset classes and investment styles. Although diversification cannot guarantee an investment profit or prevent losses, we believe it can be an effective way to manage investment risk and potentially smooth out overall portfolio performance. We encourage investors to know their investments and to understand that appropriate levels of risk-taking may unlock opportunities.
Thank you for choosing to invest with Allspring Funds. We appreciate your confidence in us and remain committed to helping you meet your financial needs.
Sincerely,
Andrew Owen
President
Allspring Funds
For further information about your fund, contact your investment professional, visit our website at allspringglobal.com, or call us directly at 1-800-222-8222.
Allspring Absolute Return Fund | 3
Performance highlights (unaudited)
| Investment objective | The Fund seeks a positive total return. |
| Manager | Allspring Funds Management, LLC |
| Portfolio managers | Ben Inker, CFA®‡*, John Thorndike* |
| Average annual total returns (%) as of October 31, 2022 |
| | | Including sales charge | | Excluding sales charge | | Expense ratios1 (%) |
| | Inception date | 1 year | 5 year | 10 year | | 1 year | 5 year | 10 year | | Gross | Net 2 |
| Class A (WARAX) | 3-1-2012 | -12.41 | -1.97 | 1.01 | | -7.09 | -0.81 | 1.61 | | 1.75 | 1.75 |
| Class C (WARCX) | 3-1-2012 | -8.65 | -1.48 | 1.03 | | -7.65 | -1.48 | 1.03 | | 2.50 | 2.50 |
| Class R (WARHX)3 | 9-30-2015 | – | – | – | | -7.20 | -0.75 | 1.52 | | 2.00 | 2.00 |
| Class R6 (WARRX)4 | 10-31-2014 | – | – | – | | -6.59 | -0.36 | 2.07 | | 1.32 | 1.32 |
| Administrator Class (WARDX) | 3-1-2012 | – | – | – | | -6.89 | -0.60 | 1.79 | | 1.67 | 1.62 |
| Institutional Class (WABIX)5 | 11-30-2012 | – | – | – | | -6.69 | -0.44 | 2.00 | | 1.42 | 1.38 |
| MSCI ACWI (Net)6 | – | – | – | – | | -19.96 | 5.24 | 7.98 | | – | – |
| Bloomberg U.S. TIPS 1-10 Year Index7 | – | – | – | – | | -7.18 | 2.46 | 1.24 | | – | – |
| CPI 8 | – | – | – | – | | 7.75 | 3.85 | 2.57 | | – | – |
Figures quoted represent past performance, which is no guarantee of future results, and do not reflect taxes that a shareholder may pay on an investment in a fund. Investment return and principal value of an investment will fluctuate so that an investor’s shares, when redeemed, may be worth more or less than their original cost. Performance shown without sales charges would be lower if sales charges were reflected. Current performance may be lower or higher than the performance data quoted, which assumes the reinvestment of dividends and capital gains. Current month-end performance is available on the Fund’s website, allspringglobal.com.
Index returns do not include transaction costs associated with buying and selling securities, any mutual fund fees or expenses, or any taxes. It is not possible to invest directly in an index.
For Class A shares, the maximum front-end sales charge is 5.75%. For Class C shares, the maximum contingent deferred sales charge is 1.00%. Performance including a contingent deferred sales charge assumes the sales charge for the corresponding time period. Class R, Class R6, Administrator Class and Institutional Class shares are sold without a front-end sales charge or contingent deferred sales charge.
| 1 | Reflects the expense ratios as stated in the most recent prospectuses, which include the impact of 0.35% in acquired fund fees and expenses and underlying GMO fees. The expense ratios shown are subject to change and may differ from the annualized expense ratios shown in the financial highlights of this report, which do not include the expenses of GMO Benchmark-Free Allocation Fund and other acquired fund fees and expenses. |
| 2 | The manager has contractually committed through August 31, 2023, to waive fees and/or reimburse expenses to the extent necessary to cap total annual fund operating expenses after fee waivers at 0.71% for Class A, 1.46% for Class C, 0.96% for Class R, 0.28% for Class R6, 0.57% for Administrator Class, and 0.33% for Institutional Class. Brokerage commissions, stamp duty fees, interest, taxes, acquired fund fees and expenses (if any, including the expenses of GMO Benchmark-Free Allocation Fund), and extraordinary expenses are excluded from the expense caps. Prior to or after the commitment expiration date, the caps may be increased or the commitment to maintain the caps may be terminated only with the approval of the Board of Trustees. Without these caps, the Fund’s returns would have been lower. The expense ratio paid by an investor is the net expense ratio (the total annual fund operating expenses after fee waivers) as stated in the prospectuses. |
| 3 | Historical performance shown for the Class R shares prior to their inception reflects the performance of the Administrator Class shares, adjusted to reflect the higher expenses applicable to the Class R shares. |
| 4 | Historical performance shown for the Class R6 shares prior to their inception reflects the performance of the Institutional Class shares, and includes the higher expenses applicable to the Institutional Class shares. If these expenses had not been included, returns for the Class R6 shares would be higher. |
| 5 | Historical performance shown for the Institutional Class shares prior to their inception reflects the performance of the Administrator Class shares, and includes the higher expenses applicable to the Administrator Class shares. If these expenses had not been included, returns for the Institutional Class shares would be higher. |
| 6 | The Morgan Stanley Capital International (MSCI) All Country World Index (ACWI) (Net) is a free-float-adjusted market-capitalization-weighted index that is designed to measure the equity market performance of developed and emerging markets. Source: MSCI. MSCI makes no express or implied warranties or representations and shall have no liability whatsoever with respect to any MSCI data contained herein. The MSCI data may not be further redistributed or used as a basis for other indices or any securities or financial products. This report is not approved, reviewed, or produced by MSCI. You cannot invest directly in an index. |
| ‡ | CFA® and Chartered Financial Analyst® are trademarks owned by CFA Institute. |
| * | The Fund invests substantially all of its investable assets directly in GMO Benchmark-Free Allocation Fund, an investment company advised by Grantham, Mayo, Van Otterloo & Co. LLC (GMO). Mr. Inker and Mr. Thorndike have been responsible for coordinating the portfolio management of GMO Benchmark-Free Allocation Fund since 2003 and 2019, respectively. |
4 | Allspring Absolute Return Fund
Performance highlights (unaudited)
Footnotes continued from previous page
| 7 | The Bloomberg U.S. Treasury Inflation-Protected Securities (TIPS) 1-10 Year Index is an unmanaged index of U.S. Treasury securities with maturities of less than 10 years and more than 1 year. You cannot invest directly in an index. |
| 8 | The Consumer Price Index (CPI) is a measure of the average change over time in the prices paid by urban consumers for a market basket of consumer goods and services. You cannot invest directly in an index. |
Absolute return funds are not intended to outperform stocks and bonds in strong markets, and there is no guarantee of positive returns or that the Fund’s objectives will be achieved. Stock values fluctuate in response to the activities of individual companies and general market and economic conditions. Bond values fluctuate in response to the financial condition of individual issuers, general market and economic conditions, and changes in interest rates. Changes in market conditions and government policies may lead to periods of heightened volatility in the bond market and reduced liquidity for certain bonds held by the Fund. In general, when interest rates rise, bond values fall and investors may lose principal value. Interest rate changes and their impact on the Fund and its share price can be sudden and unpredictable. Borrowing money to purchase securities or cover short positions magnifies losses and incurs expenses. Short selling is generally considered speculative, has the potential for unlimited loss, and may involve leverage. Alternative investments, such as commodities and merger arbitrage strategies, are speculative and entail a high degree of risk. Foreign investments are especially volatile and can rise or fall dramatically due to differences in the political and economic conditions of the host country. The Fund will indirectly be exposed to all of the risks of an investment in the underlying funds and will indirectly bear expenses of the underlying funds. The use of derivatives may reduce returns and/or increase volatility. Certain investment strategies tend to increase the total risk of an investment (relative to the broader market). This fund is exposed to asset-backed securities risk, nondiversified funds risk, geographic risk, and smaller-company securities risk. Consult the Fund’s prospectus for additional information on these and other risks.
Allspring Absolute Return Fund | 5
Performance highlights (unaudited)
| Holdings (%) as of October 31, 20221 |
| GMO Implementation Fund | 83.58 |
| GMO Opportunistic Income Fund, Class VI | 3.86 |
| GMO High Yield Fund, Class VI | 3.06 |
| GMO Emerging Country Debt Fund, Class IV | 3.02 |
| GMO SGM Major Markets Fund, Class VI | 2.63 |
| 1 | Figures represent the Fund's allocable portion of the investments of the GMO Benchmark-Free Allocation Fund. Figures represent each holding as a percentage of the Fund's net assets. Holdings are subject to change and may have changed since the date specified. |
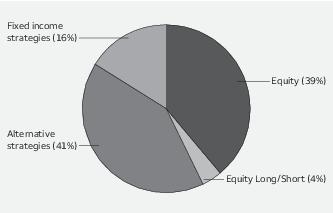
| Portfolio composition as of October 31, 20221 |
| 1 | Figures represent the portfolio allocation of the GMO Benchmark-Free Allocation Fund. Allocations are subject to change and may have changed since the date specified. Equities in the Equity Long/Short segment are hedged with a basket of short index futures positions. |
6 | Allspring Absolute Return Fund
Fund expenses (unaudited)
As a shareholder of the Fund, you incur two types of costs: (1) transaction costs, including sales charges (loads) on purchase payments and contingent deferred sales charges (if any) on redemptions and (2) ongoing costs, including management fees, distribution (12b-1) and/or shareholder servicing fees, and other Fund expenses. This example is intended to help you understand your ongoing costs (in dollars) of investing in the Fund and to compare these costs with the ongoing costs of investing in other mutual funds.
The example is based on an investment of $1,000 invested at the beginning of the six-month period and held for the entire period from May 1, 2022 to October 31, 2022.
Actual expenses
The “Actual” line of the table below provides information about actual account values and actual expenses. You may use the information in this line, together with the amount you invested, to estimate the expenses that you paid over the period. Simply divide your account value by $1,000 (for example, an $8,600 account value divided by $1,000 = 8.6), then multiply the result by the number in the “Actual” line under the heading entitled “Expenses paid during period” for your applicable class of shares to estimate the expenses you paid on your account during this period.
Hypothetical example for comparison purposes
The “Hypothetical” line of the table below provides information about hypothetical account values and hypothetical expenses based on the Fund’s actual expense ratio and an assumed rate of return of 5% per year before expenses, which is not the Fund’s actual return. The hypothetical account values and expenses may not be used to estimate the actual ending account balance or expenses you paid for the period. You may use this information to compare the ongoing costs of investing in the Fund and other funds. To do so, compare this 5% hypothetical example with the 5% hypothetical examples that appear in the shareholder reports of the other funds.
Please note that the expenses shown in the table are meant to highlight your ongoing costs only and do not reflect any transactional costs, such as sales charges (loads) and contingent deferred sales charges. Therefore, the “Hypothetical” line of the table is useful in comparing ongoing costs only, and will not help you determine the relative total costs of owning different funds. In addition, if these transactional costs were included, your costs would have been higher.
Allspring Absolute Return Fund (excluding GMO
Benchmark-Free Allocation Fund and its underlying fund
expenses) | Beginning
account value
5-1-2022 | Ending
account value
10-31-2022 | Expenses
paid during
the period1 | Annualized net
expense ratio |
| Class A | | | | |
| Actual | $1,000.00 | $ 945.10 | $3.43 | 0.70% |
| Hypothetical (5% return before expenses) | $1,000.00 | $1,021.68 | $3.57 | 0.70% |
| Class C | | | | |
| Actual | $1,000.00 | $ 942.27 | $7.05 | 1.44% |
| Hypothetical (5% return before expenses) | $1,000.00 | $1,017.95 | $7.32 | 1.44% |
| Class R | | | | |
| Actual | $1,000.00 | $ 944.76 | $4.36 | 0.89% |
| Hypothetical (5% return before expenses) | $1,000.00 | $1,020.72 | $4.53 | 0.89% |
| Class R6 | | | | |
| Actual | $1,000.00 | $ 948.19 | $1.33 | 0.27% |
| Hypothetical (5% return before expenses) | $1,000.00 | $1,023.84 | $1.38 | 0.27% |
| Administrator Class | | | | |
| Actual | $1,000.00 | $ 946.71 | $2.80 | 0.57% |
| Hypothetical (5% return before expenses) | $1,000.00 | $1,022.33 | $2.91 | 0.57% |
| Institutional Class | | | | |
| Actual | $1,000.00 | $ 947.21 | $1.62 | 0.33% |
| Hypothetical (5% return before expenses) | $1,000.00 | $1,023.54 | $1.68 | 0.33% |
1 Expenses paid is equal to the annualized net expense ratio of each class multiplied by the average account value over the period, multiplied by 184 divided by 365 (to reflect the one-half-year period).
Allspring Absolute Return Fund | 7
Fund expenses (unaudited)
Allspring Absolute Return Fund (including GMO
Benchmark-Free Allocation Fund and its underlying fund
expenses) | Beginning
account value
5-1-2022 | Ending
account value
10-31-2022 | Expenses
paid during
the period1 | Annualized net
expense ratio |
| Class A | | | | |
| (Actual) | $1,000.00 | $ 945.10 | $ 8.99 | 1.83% |
| (Hypothetical) (5% return before expenses) | $1,000.00 | $1,015.96 | $ 9.32 | 1.83% |
| Class C | | | | |
| (Actual) | $1,000.00 | $ 942.27 | $12.60 | 2.57% |
| (Hypothetical) (5% return before expenses) | $1,000.00 | $1,012.23 | $13.06 | 2.57% |
| Class R | | | | |
| (Actual) | $1,000.00 | $ 944.76 | $ 9.92 | 2.02% |
| (Hypothetical) (5% return before expenses) | $1,000.00 | $1,015.00 | $10.28 | 2.02% |
| Class R6 | | | | |
| (Actual) | $1,000.00 | $ 948.19 | $ 6.89 | 1.40% |
| (Hypothetical) (5% return before expenses) | $1,000.00 | $1,018.13 | $ 7.14 | 1.40% |
| Administrator Class | | | | |
| (Actual) | $1,000.00 | $ 946.71 | $ 8.36 | 1.70% |
| (Hypothetical) (5% return before expenses) | $1,000.00 | $1,016.62 | $ 8.66 | 1.70% |
| Institutional Class | | | | |
| (Actual) | $1,000.00 | $ 947.21 | $ 7.19 | 1.46% |
| (Hypothetical) (5% return before expenses) | $1,000.00 | $1,017.83 | $ 7.45 | 1.46% |
1 Expenses paid is equal to the annualized net expense ratio of each class multiplied by the average account value over the period, multiplied by 184 divided by 365 (to reflect the one-half-year period).
8 | Allspring Absolute Return Fund
Portfolio of investments—October 31, 2022 (unaudited)
| | | | | Shares | Value |
| Investment companies: 96.15% | | | | | |
| Multi-asset funds: 96.15% | | | | | |
| GMO Benchmark-Free Allocation Fund Class MF ♠ | | | | 45,422,974 | $1,071,527,957 |
| Total Investment companies (Cost $1,076,616,197) | | | | | 1,071,527,957 |
| Total investments in securities (Cost $1,076,616,197) | 96.15% | | | | 1,071,527,957 |
| Other assets and liabilities, net | 3.85 | | | | 42,909,576 |
| Total net assets | 100.00% | | | | $1,114,437,533 |
| ♠ | The issuer of the security is an affiliated person of the Fund as defined in the Investment Company Act of 1940. |
Investments in affiliates
An affiliated investment is an investment in which the Fund owns at least 5% of the outstanding voting shares of the issuer or as a result of other relationships, such as the Fund and the issuer having the same investment manager. Transactions with issuers that were affiliates of the Fund at the end of the period were as follows:
| | Value,
beginning of
period | Purchases | Sales
proceeds | Net
realized
gains
(losses) on
affiliated
investment
companies | Net
change in
unrealized
gains
(losses) on
affiliated
investment
companies | Value,
end of
period |
| Investment companies | | | | | | |
| GMO Benchmark-Free Allocation Fund Class MF | $1,301,677,274 | $11,422,241 | $(174,821,887) | $(818,785) | $(65,930,886) | $1,071,527,957 |
| | Shares,
end of
period | Dividends from
affiliated
investment companies |
| Investment companies | | |
| GMO Benchmark-Free Allocation Fund Class MF | 45,422,974 | $0 |
The accompanying notes are an integral part of these financial statements.
Allspring Absolute Return Fund | 9
Statement of assets and liabilities—October 31, 2022 (unaudited)
| | |
| Assets | |
Investments in affiliated investment companies, at value (cost $1,076,616,197)
| $ 1,071,527,957 |
Cash
| 49,367,572 |
Receivable for Fund shares sold
| 1,091,117 |
Receivable for investments sold
| 632,428 |
Prepaid expenses and other assets
| 60,927 |
Total assets
| 1,122,680,001 |
| Liabilities | |
Payable for Fund shares redeemed
| 7,211,385 |
Shareholder report expenses payable
| 595,971 |
Management fee payable
| 185,473 |
Administration fees payable
| 148,644 |
Distribution fees payable
| 23,721 |
Trustees’ fees and expenses payable
| 1,911 |
Accrued expenses and other liabilities
| 75,363 |
Total liabilities
| 8,242,468 |
Total net assets
| $1,114,437,533 |
| Net assets consist of | |
Paid-in capital
| $ 1,587,295,246 |
Total distributable loss
| (472,857,713) |
Total net assets
| $1,114,437,533 |
| Computation of net asset value and offering price per share | |
Net assets – Class A
| $ 290,298,139 |
Shares outstanding – Class A1
| 30,108,560 |
Net asset value per share – Class A
| $9.64 |
Maximum offering price per share – Class A2
| $10.23 |
Net assets – Class C
| $ 36,908,568 |
Shares outstanding – Class C1
| 3,833,424 |
Net asset value per share – Class C
| $9.63 |
Net assets – Class R
| $ 122,706 |
Shares outstanding – Class R1
| 12,374 |
Net asset value per share – Class R
| $9.92 |
Net assets – Class R6
| $ 4,184,986 |
Shares outstanding – Class R61
| 431,553 |
Net asset value per share – Class R6
| $9.70 |
Net assets – Administrator Class
| $ 17,543,048 |
Shares outstanding – Administrator Class1
| 1,795,623 |
Net asset value per share – Administrator Class
| $9.77 |
Net assets – Institutional Class
| $ 765,380,086 |
Shares outstanding – Institutional Class1
| 78,962,103 |
Net asset value per share – Institutional Class
| $9.69 |
| 1 | The Fund has an unlimited number of authorized shares. |
| 2 | Maximum offering price is computed as 100/94.25 of net asset value. On investments of $50,000 or more, the offering price is reduced. |
The accompanying notes are an integral part of these financial statements.
10 | Allspring Absolute Return Fund
Statement of operations—six months ended October 31, 2022 (unaudited)
| | |
| Investment income | |
Dividends from affiliated investment companies
| $ 0 |
| Expenses | |
Management fee
| 1,383,081 |
| Administration fees | |
Class A
| 323,830 |
Class C
| 48,886 |
Class R
| 133 |
Class R6
| 1,090 |
Administrator Class
| 13,663 |
Institutional Class
| 568,333 |
| Shareholder servicing fees | |
Class A
| 385,512 |
Class C
| 57,743 |
Class R
| 158 |
Administrator Class
| 25,498 |
| Distribution fees | |
Class C
| 173,037 |
Class R
| 122 |
Custody and accounting fees
| 7,344 |
Professional fees
| 16,249 |
Registration fees
| 35,401 |
Shareholder report expenses
| 56,348 |
Trustees’ fees and expenses
| 10,779 |
Other fees and expenses
| 2,535 |
Total expenses
| 3,109,742 |
| Less: Fee waivers and/or expense reimbursements | |
Class A
| (164) |
Class C
| (5) |
Administrator Class
| (4,498) |
Institutional Class
| (176,566) |
Net expenses
| 2,928,509 |
Net investment loss
| (2,928,509) |
| Realized and unrealized gains (losses) on investments | |
Net realized losses from affiliated investment companies
| (818,785) |
Net change in unrealized gains (losses) from affiliated investment companies
| (65,930,886) |
Net realized and unrealized gains (losses) on investments
| (66,749,671) |
Net decrease in net assets resulting from operations
| $(69,678,180) |
The accompanying notes are an integral part of these financial statements.
Allspring Absolute Return Fund | 11
Statement of changes in net assets
| | | | | |
| | Six months ended
October 31, 2022
(unaudited) | Year ended
April 30, 2022 |
| Operations | | | | |
Net investment income (loss)
| | $ (2,928,509) | | $ 27,239,495 |
Net realized gains (losses) on investments
| | (818,785) | | 21,350,266 |
Net change in unrealized gains (losses) on investments
| | (65,930,886) | | (121,217,791) |
Net decrease in net assets resulting from operations
| | (69,678,180) | | (72,628,030) |
| Distributions to shareholders from | | | | |
| Net investment income and net realized gains | | | | |
Class A
| | 0 | | (10,481,984) |
Class C
| | 0 | | (532,511) |
Class R
| | 0 | | (4,113) |
Class R6
| | 0 | | (465,159) |
Administrator Class
| | 0 | | (1,001,636) |
Institutional Class
| | 0 | | (33,821,801) |
Total distributions to shareholders
| | 0 | | (46,307,204) |
| Capital share transactions | Shares | | Shares | |
| Proceeds from shares sold | | | | |
Class A
| 2,183,524 | 21,804,859 | 7,290,999 | 78,841,319 |
Class C
| 110,237 | 1,101,510 | 589,758 | 6,324,386 |
Class R
| 2 | 24 | 312 | 3,363 |
Class R6
| 27,329 | 273,514 | 51,639 | 555,443 |
Administrator Class
| 73,369 | 739,528 | 349,123 | 3,791,366 |
Institutional Class
| 7,237,554 | 72,219,985 | 18,008,528 | 194,524,182 |
| | | 96,139,420 | | 284,040,059 |
| Reinvestment of distributions | | | | |
Class A
| 0 | 0 | 889,292 | 9,310,884 |
Class C
| 0 | 0 | 49,212 | 517,714 |
Class R
| 0 | 0 | 81 | 869 |
Class R6
| 0 | 0 | 33,116 | 347,390 |
Administrator Class
| 0 | 0 | 91,916 | 974,308 |
Institutional Class
| 0 | 0 | 2,590,846 | 27,177,971 |
| | | 0 | | 38,329,136 |
| Payment for shares redeemed | | | | |
Class A
| (3,984,666) | (39,461,470) | (8,176,385) | (87,937,649) |
Class C
| (2,045,167) | (20,355,727) | (6,952,463) | (74,485,079) |
Class R
| 0 | 0 | (1,005) | (11,161) |
Class R6
| (621,303) | (6,221,005) | (620,382) | (6,656,095) |
Administrator Class
| (1,439,875) | (14,674,239) | (918,724) | (10,060,721) |
Institutional Class
| (18,473,816) | (181,764,489) | (37,495,597) | (405,316,293) |
| | | (262,476,930) | | (584,466,998) |
Net decrease in net assets resulting from capital share transactions
| | (166,337,510) | | (262,097,803) |
Total decrease in net assets
| | (236,015,690) | | (381,033,037) |
| Net assets | | | | |
Beginning of period
| | 1,350,453,223 | | 1,731,486,260 |
End of period
| | $1,114,437,533 | | $1,350,453,223 |
The accompanying notes are an integral part of these financial statements.
12 | Allspring Absolute Return Fund
Financial highlights
(For a share outstanding throughout each period)
| | | Year ended April 30 |
| Class A | Six months ended
October 31, 2022
(unaudited) | 2022 | 2021 | 2020 | 2019 | 2018 |
Net asset value, beginning of period
| $10.20 | $11.07 | $10.11 | $11.15 | $11.40 | $10.90 |
Net investment income (loss)
| (0.03) | 0.17 1 | 0.22 | 0.29 1 | 0.27 1 | 0.19 1 |
Net realized and unrealized gains (losses) on investments
| (0.53) | (0.70) | 1.09 | (1.04) | (0.24) | 0.51 |
Total from investment operations
| (0.56) | (0.53) | 1.31 | (0.75) | 0.03 | 0.70 |
| Distributions to shareholders from | | | | | | |
Net investment income
| 0.00 | (0.34) | (0.35) | (0.29) | (0.28) | (0.20) |
Net asset value, end of period
| $9.64 | $10.20 | $11.07 | $10.11 | $11.15 | $11.40 |
Total return2
| (5.49)% | (4.89)% | 13.16% | (6.99)% | 0.42% | 6.45% |
| Ratios to average net assets (annualized) | | | | | | |
Gross expenses3
| 0.70% | 0.70% | 0.69% | 0.69% | 0.69% | 0.68% |
Net expenses3
| 0.70% | 0.70% | 0.69% | 0.69% | 0.69% | 0.68% |
Net investment income (loss)
| (0.70)% | 1.62% | 2.33% | 2.68% | 2.43% | 1.67% |
| Supplemental data | | | | | | |
Portfolio turnover rate
| 1% | 6% | 5% | 4% | 5% | 5% |
Net assets, end of period (000s omitted)
| $290,298 | $325,369 | $353,134 | $297,590 | $415,011 | $516,085 |
| 1 | Calculated based upon average shares outstanding |
| 2 | Total return calculations do not include any sales charges. Returns for periods of less than one year are not annualized. |
| 3 | Ratios do not include net expenses of GMO Benchmark-Free Allocation Fund, Class MF. Including net expenses allocated from GMO Benchmark-Free Allocation Fund, Class MF, the ratios would be increased by the following amounts: |
| Six months ended October 31, 2022 (unaudited) | 0.69% |
| Year ended April 30, 2022 | 0.70% |
| Year ended April 30, 2021 | 0.67% |
| Year ended April 30, 2020 | 0.61% |
| Year ended April 30, 2019 | 0.60% |
| Year ended April 30, 2018 | 0.60% |
The accompanying notes are an integral part of these financial statements.
Allspring Absolute Return Fund | 13
Financial highlights
(For a share outstanding throughout each period)
| | | Year ended April 30 |
| Class C | Six months ended
October 31, 2022
(unaudited) | 2022 | 2021 | 2020 | 2019 | 2018 |
Net asset value, beginning of period
| $10.22 | $10.90 | $9.95 | $10.96 | $11.19 | $10.70 |
Net investment income (loss)
| (0.07) 1 | 0.06 1 | 0.12 1 | 0.12 | 0.19 1 | 0.10 1 |
Payment from affiliate
| 0.00 | 0.00 | 0.05 | 0.00 | 0.00 | 0.00 |
Net realized and unrealized gains (losses) on investments
| (0.52) | (0.67) | 1.08 | (0.95) | (0.24) | 0.50 |
Total from investment operations
| (0.59) | (0.61) | 1.25 | (0.83) | (0.05) | 0.60 |
| Distributions to shareholders from | | | | | | |
Net investment income
| 0.00 | (0.07) | (0.30) | (0.18) | (0.18) | (0.11) |
Net asset value, end of period
| $9.63 | $10.22 | $10.90 | $9.95 | $10.96 | $11.19 |
Total return2
| (5.77)% | (5.59)% | 12.66% 3 | (7.73)% | (0.31)% | 5.60% |
| Ratios to average net assets (annualized) | | | | | | |
Gross expenses4
| 1.44% | 1.43% | 1.44% | 1.44% | 1.44% | 1.43% |
Net expenses4
| 1.44% | 1.43% | 1.44% | 1.44% | 1.44% | 1.43% |
Net investment income (loss)
| (1.44)% | 0.61% | 1.18% | 1.71% | 1.78% | 0.88% |
| Supplemental data | | | | | | |
Portfolio turnover rate
| 1% | 6% | 5% | 4% | 5% | 5% |
Net assets, end of period (000s omitted)
| $36,909 | $58,948 | $131,690 | $254,485 | $419,656 | $629,813 |
| 1 | Calculated based upon average shares outstanding |
| 2 | Total return calculations do not include any sales charges. Returns for periods of less than one year are not annualized. |
| 3 | During the year ended April 30, 2021, the Fund received a payment from an affiliate that had an impact of 0.53% on total return. |
| 4 | Ratios do not include net expenses of GMO Benchmark-Free Allocation Fund, Class MF. Including net expenses allocated from GMO Benchmark-Free Allocation Fund, Class MF, the ratios would be increased by the following amounts: |
| Six months ended October 31, 2022 (unaudited) | 0.69% |
| Year ended April 30, 2022 | 0.70% |
| Year ended April 30, 2021 | 0.67% |
| Year ended April 30, 2020 | 0.61% |
| Year ended April 30, 2019 | 0.60% |
| Year ended April 30, 2018 | 0.60% |
The accompanying notes are an integral part of these financial statements.
14 | Allspring Absolute Return Fund
Financial highlights
(For a share outstanding throughout each period)
| | | Year ended April 30 |
| Class R | Six months ended
October 31, 2022
(unaudited) | 2022 | 2021 | 2020 | 2019 | 2018 |
Net asset value, beginning of period
| $10.50 | $11.41 | $10.33 | $11.12 | $11.37 | $10.82 |
Net investment income (loss)
| (0.05) | 0.16 1 | 0.18 | 0.12 | 0.27 | 0.12 |
Payment from affiliate
| 0.00 | 0.00 | 0.02 | 0.00 | 0.00 | 0.00 |
Net realized and unrealized gains (losses) on investments
| (0.53) | (0.73) | 1.25 | (0.91) | (0.26) | 0.55 |
Total from investment operations
| (0.58) | (0.57) | 1.45 | (0.79) | 0.01 | 0.67 |
| Distributions to shareholders from | | | | | | |
Net investment income
| 0.00 | (0.34) | (0.37) | 0.00 | (0.26) | (0.12) |
Net asset value, end of period
| $9.92 | $10.50 | $11.41 | $10.33 | $11.12 | $11.37 |
Total return2
| (5.52)% | (5.05)% | 14.17% 3 | (7.10)% | 0.21% | 6.21% |
| Ratios to average net assets (annualized) | | | | | | |
Gross expenses4
| 0.89% | 0.88% | 0.88% | 0.91% | 0.85% | 0.93% |
Net expenses4
| 0.89% | 0.88% | 0.88% | 0.91% | 0.85% | 0.93% |
Net investment income (loss)
| (0.89)% | 1.40% | 4.51% | 0.21% | 2.42% | 0.85% |
| Supplemental data | | | | | | |
Portfolio turnover rate
| 1% | 6% | 5% | 4% | 5% | 5% |
Net assets, end of period (000s omitted)
| $123 | $130 | $148 | $27 | $262 | $368 |
| 1 | Calculated based upon average shares outstanding |
| 2 | Returns for periods of less than one year are not annualized. |
| 3 | During the year ended April 30, 2021, the Fund received a payment from an affiliate that had an impact of 0.22% on total return. |
| 4 | Ratios do not include net expenses of GMO Benchmark-Free Allocation Fund, Class MF. Including net expenses allocated from GMO Benchmark-Free Allocation Fund, Class MF, the ratios would be increased by the following amounts: |
| Six months ended October 31, 2022 (unaudited) | 0.69% |
| Year ended April 30, 2022 | 0.70% |
| Year ended April 30, 2021 | 0.67% |
| Year ended April 30, 2020 | 0.61% |
| Year ended April 30, 2019 | 0.60% |
| Year ended April 30, 2018 | 0.60% |
The accompanying notes are an integral part of these financial statements.
Allspring Absolute Return Fund | 15
Financial highlights
(For a share outstanding throughout each period)
| | | Year ended April 30 |
| Class R6 | Six months ended
October 31, 2022
(unaudited) | 2022 | 2021 | 2020 | 2019 | 2018 |
Net asset value, beginning of period
| $10.23 | $11.10 | $10.11 | $11.15 | $11.41 | $10.91 |
Net investment income (loss)
| (0.01) 1 | 0.21 1 | 0.28 | 0.35 | 0.34 | 0.31 1 |
Net realized and unrealized gains (losses) on investments
| (0.52) | (0.70) | 1.08 | (1.05) | (0.27) | 0.45 |
Total from investment operations
| (0.53) | (0.49) | 1.36 | (0.70) | 0.07 | 0.76 |
| Distributions to shareholders from | | | | | | |
Net investment income
| 0.00 | (0.38) | (0.37) | (0.34) | (0.33) | (0.26) |
Net asset value, end of period
| $9.70 | $10.23 | $11.10 | $10.11 | $11.15 | $11.41 |
Total return2
| (5.18)% | (4.50)% | 13.62% | (6.57)% | 0.86% | 6.97% |
| Ratios to average net assets (annualized) | | | | | | |
Gross expenses3
| 0.27% | 0.27% | 0.26% | 0.26% | 0.26% | 0.25% |
Net expenses3
| 0.27% | 0.27% | 0.26% | 0.26% | 0.26% | 0.25% |
Net investment income (loss)
| (0.27)% | 1.91% | 2.63% | 3.05% | 2.64% | 2.69% |
| Supplemental data | | | | | | |
Portfolio turnover rate
| 1% | 6% | 5% | 4% | 5% | 5% |
Net assets, end of period (000s omitted)
| $4,185 | $10,494 | $17,332 | $25,363 | $31,838 | $46,753 |
| 1 | Calculated based upon average shares outstanding |
| 2 | Returns for periods of less than one year are not annualized. |
| 3 | Ratios do not include net expenses of GMO Benchmark-Free Allocation Fund, Class MF. Including net expenses allocated from GMO Benchmark-Free Allocation Fund, Class MF, the ratios would be increased by the following amounts: |
| Six months ended October 31, 2022 (unaudited) | 0.69% |
| Year ended April 30, 2022 | 0.70% |
| Year ended April 30, 2021 | 0.67% |
| Year ended April 30, 2020 | 0.61% |
| Year ended April 30, 2019 | 0.60% |
| Year ended April 30, 2018 | 0.60% |
The accompanying notes are an integral part of these financial statements.
16 | Allspring Absolute Return Fund
Financial highlights
(For a share outstanding throughout each period)
| | | Year ended April 30 |
| Administrator Class | Six months ended
October 31, 2022
(unaudited) | 2022 | 2021 | 2020 | 2019 | 2018 |
Net asset value, beginning of period
| $10.32 | $11.18 | $10.15 | $11.18 | $11.43 | $10.92 |
Net investment income (loss)
| (0.03) 1 | 0.17 1 | 0.24 1 | 0.27 1 | 0.27 1 | 0.19 1 |
Payment from affiliate
| 0.00 | 0.00 | 0.06 | 0.00 | 0.00 | 0.00 |
Net realized and unrealized gains (losses) on investments
| (0.52) | (0.70) | 1.08 | (1.01) | (0.24) | 0.53 |
Total from investment operations
| (0.55) | (0.53) | 1.38 | (0.74) | 0.03 | 0.72 |
| Distributions to shareholders from | | | | | | |
Net investment income
| 0.00 | (0.33) | (0.35) | (0.29) | (0.28) | (0.21) |
Net asset value, end of period
| $9.77 | $10.32 | $11.18 | $10.15 | $11.18 | $11.43 |
Total return2
| (5.33)% | (4.81)% | 13.76% 3 | (6.85)% | 0.48% | 6.62% |
| Ratios to average net assets (annualized) | | | | | | |
Gross expenses4
| 0.61% | 0.61% | 0.61% | 0.61% | 0.60% | 0.60% |
Net expenses4
| 0.57% | 0.57% | 0.57% | 0.57% | 0.57% | 0.57% |
Net investment income (loss)
| (0.57)% | 1.60% | 2.20% | 2.42% | 2.44% | 1.70% |
| Supplemental data | | | | | | |
Portfolio turnover rate
| 1% | 6% | 5% | 4% | 5% | 5% |
Net assets, end of period (000s omitted)
| $17,543 | $32,644 | $40,694 | $60,846 | $116,871 | $212,965 |
| 1 | Calculated based upon average shares outstanding |
| 2 | Returns for periods of less than one year are not annualized. |
| 3 | During the year ended April 30, 2021, the Fund received a payment from an affiliate that had an impact of 0.62% on total return. |
| 4 | Ratios do not include net expenses of GMO Benchmark-Free Allocation Fund, Class MF. Including net expenses allocated from GMO Benchmark-Free Allocation Fund, Class MF, the ratios would be increased by the following amounts: |
| Six months ended October 31, 2022 (unaudited) | 0.69% |
| Year ended April 30, 2022 | 0.70% |
| Year ended April 30, 2021 | 0.67% |
| Year ended April 30, 2020 | 0.61% |
| Year ended April 30, 2019 | 0.60% |
| Year ended April 30, 2018 | 0.60% |
The accompanying notes are an integral part of these financial statements.
Allspring Absolute Return Fund | 17
Financial highlights
(For a share outstanding throughout each period)
| | | Year ended April 30 |
| Institutional Class | Six months ended
October 31, 2022
(unaudited) | 2022 | 2021 | 2020 | 2019 | 2018 |
Net asset value, beginning of period
| $10.23 | $11.10 | $10.11 | $11.15 | $11.41 | $10.92 |
Net investment income (loss)
| (0.02) 1 | 0.21 1 | 0.26 1 | 0.33 1 | 0.31 1 | 0.24 |
Net realized and unrealized gains (losses) on investments
| (0.52) | (0.71) | 1.09 | (1.04) | (0.25) | 0.50 |
Total from investment operations
| (0.54) | (0.50) | 1.35 | (0.71) | 0.06 | 0.74 |
| Distributions to shareholders from | | | | | | |
Net investment income
| 0.00 | (0.37) | (0.36) | (0.33) | (0.32) | (0.25) |
Net asset value, end of period
| $9.69 | $10.23 | $11.10 | $10.11 | $11.15 | $11.41 |
Total return2
| (5.28)% | (4.59)% | 13.57% | (6.65)% | 0.76% | 6.78% |
| Ratios to average net assets (annualized) | | | | | | |
Gross expenses3
| 0.37% | 0.37% | 0.36% | 0.36% | 0.36% | 0.35% |
Net expenses3
| 0.33% | 0.33% | 0.33% | 0.33% | 0.33% | 0.33% |
Net investment income (loss)
| (0.33)% | 1.90% | 2.43% | 3.00% | 2.82% | 2.07% |
| Supplemental data | | | | | | |
Portfolio turnover rate
| 1% | 6% | 5% | 4% | 5% | 5% |
Net assets, end of period (000s omitted)
| $765,380 | $922,867 | $1,188,488 | $1,664,020 | $2,890,106 | $4,189,647 |
| 1 | Calculated based upon average shares outstanding |
| 2 | Returns for periods of less than one year are not annualized. |
| 3 | Ratios do not include net expenses of GMO Benchmark-Free Allocation Fund, Class MF. Including net expenses allocated from GMO Benchmark-Free Allocation Fund, Class MF, the ratios would be increased by the following amounts: |
| Six months ended October 31, 2022 (unaudited) | 0.69% |
| Year ended April 30, 2022 | 0.70% |
| Year ended April 30, 2021 | 0.67% |
| Year ended April 30, 2020 | 0.61% |
| Year ended April 30, 2019 | 0.60% |
| Year ended April 30, 2018 | 0.60% |
The accompanying notes are an integral part of these financial statements.
18 | Allspring Absolute Return Fund
Notes to financial statements (unaudited)
1. ORGANIZATION
Allspring Funds Trust (the "Trust"), a Delaware statutory trust organized on March 10, 1999, is an open-end management investment company registered under the Investment Company Act of 1940, as amended (the "1940 Act"). As an investment company, the Trust follows the accounting and reporting guidance in Financial Accounting Standards Board ("FASB") Accounting Standards Codification Topic 946, Financial Services – Investment Companies. These financial statements report on the Allspring Absolute Return Fund (the "Fund") which is a diversified series of the Trust.
The Fund invests all of its investable assets in the GMO Benchmark-Free Allocation Fund (the “Benchmark-Free Allocation Fund”), an investment company managed by Grantham, Mayo, Van Otterloo & Co. LLC (“GMO”). Benchmark-Free Allocation Fund is a fund-of-funds and gains its investment exposures primarily by investing in GMO Implementation Fund. In addition, Benchmark-Free Allocation Fund may invest in other GMO Funds (together with GMO Implementation Fund, the “underlying GMO funds”), whether currently existing or created in the future. These underlying GMO funds may include, among others, GMO High Yield Fund, GMO Emerging Country Debt Fund, GMO Opportunistic Income Fund, and the GMO Alternative Funds. GMO Implementation Fund is permitted to invest in any asset class and may engage in merger arbitrage. Benchmark-Free Allocation Fund also may invest directly in securities (including other underlying funds) and derivatives. As of October 31, 2022, the Fund owned 25% of Benchmark-Free Allocation Fund. Because the Fund invests all of its assets in Benchmark-Free Allocation Fund, the shareholders of the Fund bear the fees and expenses of Benchmark-Free Allocation Fund, which are not included in the Statement of Operations, but are incurred indirectly because they are considered in the calculation of the net asset value of Benchmark-Free Allocation Fund. As a result, the Fund’s actual expenses may be higher than those of other mutual funds that invest directly in securities. The Fund will indirectly be exposed to all of the risks of an investment in the underlying funds and will indirectly bear expenses of the underlying funds.
2. SIGNIFICANT ACCOUNTING POLICIES
The following significant accounting policies, which are consistently followed in the preparation of the financial statements of the Fund, are in conformity with U.S. generally accepted accounting principles which require management to make estimates and assumptions that affect the reported amounts of assets and liabilities, disclosure of contingent assets and liabilities at the date of the financial statements, and the reported amounts of income and expenses during the reporting period. Actual results could differ from those estimates.
Securities valuation
All investments are valued each business day as of the close of regular trading on the New York Stock Exchange (generally 4 p.m. Eastern Time), although the Fund may deviate from this calculation time under unusual or unexpected circumstances.
The Fund values its investment in Benchmark-Free Allocation Fund at net asset value. The valuation of investments in securities and the underlying funds held by Benchmark-Free Allocation Fund is discussed in the semi-annual report of Benchmark-Free Allocation Fund, which is included in the distribution of this shareholder report. For your reference, an unaudited Statement of Assets and Liabilities and an unaudited Schedule of Investments for Benchmark-Free Allocation Fund as of October 31, 2022 have been included in the Appendix within this report.
Investment transactions and income recognition
Investment transactions in Benchmark-Free Allocation Fund are recorded on a trade date basis. Realized gains and losses resulting from investment transactions in Benchmark-Free Allocation Fund are determined on the identified cost basis.
Income dividends and capital gain distributions from Benchmark-Free Allocation Fund are recorded on the ex-dividend date. Capital gain distributions from Benchmark-Free Allocation Fund are treated as realized gains.
Distributions to shareholders
Distributions to shareholders from net investment income and any net realized gains are recorded on the ex-dividend date and paid at least annually. Such distributions are determined in accordance with income tax regulations and may differ from U.S. generally accepted accounting principles. Dividend sources are estimated at the time of declaration. The tax character of distributions is determined as of the Fund's fiscal year end. Therefore, a portion of the Fund's distributions made prior to the Fund’s fiscal year end may be categorized as a tax return of capital at year end.
Federal and other taxes
The Fund intends to continue to qualify as a regulated investment company by distributing substantially all of its investment company taxable income and any net realized capital gains (after reduction for capital loss carryforwards) sufficient to relieve it from all, or substantially all, federal income taxes. Accordingly, no provision for federal income taxes was required.
Allspring Absolute Return Fund | 19
Notes to financial statements (unaudited)
The Fund’s income and federal excise tax returns and all financial records supporting those returns for the prior three fiscal years are subject to examination by the federal and Delaware revenue authorities. Management has analyzed the Fund's tax positions taken on federal, state, and foreign tax returns, as applicable, for all open tax years and does not believe that there are any uncertain tax positions that require recognition of a tax liability.
As of October 31, 2022, the aggregate cost of all investments for federal income tax purposes was $1,209,953,266 and the unrealized gains (losses) consisted of:
| Gross unrealized gains | $ 0 |
| Gross unrealized losses | (138,425,309) |
| Net unrealized losses | $(138,425,309) |
As of April 30, 2022, the Fund had capital loss carryforwards which consisted of $2,952,508 in short-term capital losses and $429,247,782 in long-term capital losses.
Class allocations
The separate classes of shares offered by the Fund differ principally in applicable sales charges, distribution, shareholder servicing, and administration fees. Class specific expenses are charged directly to that share class. Investment income, common fund-level expenses, and realized and unrealized gains (losses) on investments are allocated daily to each class of shares based on the relative proportion of net assets of each class.
3. FAIR VALUATION MEASUREMENTS
Fair value measurements of investments are determined within a framework that has established a fair value hierarchy based upon the various data inputs utilized in determining the value of the Fund’s investments. The three-level hierarchy gives the highest priority to unadjusted quoted prices in active markets for identical assets or liabilities (Level 1) and the lowest priority to unobservable inputs (Level 3). The Fund’s investments are classified within the fair value hierarchy based on the lowest level of input that is significant to the fair value measurement. The inputs are summarized into three broad levels as follows:
| ■ | Level 1 – quoted prices in active markets for identical securities |
| ■ | Level 2 – other significant observable inputs (including quoted prices for similar securities, interest rates, prepayment speeds, credit risk, etc.) |
| ■ | Level 3 – significant unobservable inputs (including the Fund’s own assumptions in determining the fair value of investments) |
The inputs or methodologies used for valuing investments in securities are not necessarily an indication of the risk associated with investing in those securities.
At October 31, 2022, the Fund’s investment in Benchmark-Free Allocation Fund was measured at fair value using Level 1 inputs.
For the six months ended October 31, 2022, the Fund did not have any transfers into/out of Level 3.
4. TRANSACTIONS WITH AFFILIATES
Management fee
Allspring Funds Management, LLC (“Allspring Funds Management”), a wholly owned subsidiary of Allspring Global Investments Holdings, LLC, a holding company indirectly owned by certain private funds of GTCR LLC and Reverence Capital Partners, L.P., is the manager of the Fund and provides advisory and fund-level administrative services under an investment management agreement. Under the investment management agreement, Allspring Funds Management is responsible for, among other services, implementing the investment objectives and strategies of the Fund, and providing fund-level administrative services in connection with the Fund’s operations. As compensation for its services under the investment management agreement, Allspring Funds Management is entitled to receive a management fee at the following annual rate based on the Fund’s average daily net assets:
20 | Allspring Absolute Return Fund
Notes to financial statements (unaudited)
| Average daily net assets | Management fee |
| First $1 billion | 0.225% |
| Next $4 billion | 0.200 |
| Next $5 billion | 0.175 |
| Next $10 billion | 0.165 |
| Over $20 billion | 0.160 |
For the six months ended October 31, 2022, the management fee was equivalent to an annual rate of 0.220% of the Fund’s average daily net assets.
Administration fees
Under a class-level administration agreement, Allspring Funds Management provides class-level administrative services to the Fund, which includes paying fees and expenses for services provided by the transfer agent, sub-transfer agents, omnibus account servicers and record-keepers. As compensation for its services under the class-level administration agreement, Allspring Funds Management receives an annual fee which is calculated based on the average daily net assets of each class as follows:
| | Class-level
administration fee |
| Class A | 0.21% |
| Class C | 0.21 |
| Class R | 0.21 |
| Class R6 | 0.03 |
| Administrator Class | 0.13 |
| Institutional Class | 0.13 |
Waivers and/or expense reimbursements
Allspring Funds Management has contractually committed to waive and/or reimburse management and administration fees to the extent necessary to maintain certain net operating expense ratios for the Fund. When each class of the Fund has exceeded its expense cap, Allspring Funds Management will waive fees and/or reimburse expenses from fund-level expenses on a proportionate basis and then from class specific expenses. When only certain classes exceed their expense caps, waivers and/or reimbursements are applied against class specific expenses before fund-level expenses. Allspring Funds Management has contractually committed through August 31, 2023 to waive fees and/or reimburse expenses to the extent necessary to cap expenses (excluding expenses of Benchmark-Free Allocation Fund and acquired fund fees and expenses). Prior to or after the commitment expiration date, the caps may be increased or the commitment to maintain the caps may be terminated only with the approval of the Board of Trustees. As of October 31, 2022, the contractual expense caps are as follows:
| | Expense ratio caps |
| Class A | 0.71% |
| Class C | 1.46 |
| Class R | 0.96 |
| Class R6 | 0.28 |
| Administrator Class | 0.57 |
| Institutional Class | 0.33 |
Distribution fees
The Trust has adopted a distribution plan for Class C and Class R shares pursuant to Rule 12b-1 under the 1940 Act. Distribution fees are charged to Class C and Class R shares and paid to Allspring Funds Distributor, LLC ("Allspring Funds Distributor"), the principal underwriter, an affiliate of Allspring Funds Management, at an annual rate of 0.75% of the average daily net assets of Class C shares and 0.25% of the average daily net assets of Class R shares.
Allspring Absolute Return Fund | 21
Notes to financial statements (unaudited)
In addition, Allspring Funds Distributor is entitled to receive the front-end sales charge from the purchase of Class A shares and a contingent deferred sales charge on the redemption of certain Class A shares. Allspring Funds Distributor is also entitled to receive the contingent deferred sales charges from redemptions of Class C shares. For the six months ended October 31, 2022, Allspring Funds Distributor received $10,140 from the sale of Class A shares. No contingent deferred sales charges were incurred by Class A and Class C shares for the six months ended October 31, 2022.
Shareholder servicing fees
The Trust has entered into contracts with one or more shareholder servicing agents, whereby Class A, Class C, Class R, and Administrator Class are charged a fee at an annual rate of 0.25% of the average daily net assets of each respective class. A portion of these total shareholder servicing fees were paid to affiliates of the Fund.
5. INVESTMENT TRANSACTIONS
For the six months ended October 31, 2022, the Fund made aggregate purchases and sales of $11,422,241 and $174,821,885, respectively, in its investment in Benchmark-Free Allocation Fund.
6. BANK BORROWINGS
The Trust (excluding the money market funds), Allspring Master Trust and Allspring Variable Trust are parties to a $350,000,000 revolving credit agreement whereby the Fund is permitted to use bank borrowings for temporary or emergency purposes, such as to fund shareholder redemption requests. Interest under the credit agreement is charged to the Fund based on a borrowing rate equal to the higher of the Federal Funds rate or the overnight bank funding rate in effect on that day plus a spread. In addition, an annual commitment fee equal based on the unused balance is allocated to each participating fund.
For the six months ended October 31, 2022, there were no borrowings by the Fund under the agreement.
7. MARKET RISKS
On March 11, 2020, the World Health Organization announced that it had made the assessment that coronavirus disease 2019 (“COVID-19”) is a pandemic. The impacts of COVID-19 are affecting the entire global economy, individual companies and investment products, the funds, and the market in general. There is significant uncertainty around the extent and duration of business disruptions related to COVID-19 and the impacts may last for an extended period of time. COVID-19 has led to significant uncertainty and volatility in the financial markets.
8. INDEMNIFICATION
Under the Fund's organizational documents, the officers and Trustees have been granted certain indemnification rights against certain liabilities that may arise out of performance of their duties to the Fund. The Fund has entered into a separate agreement with each Trustee that converts indemnification rights currently existing under the Fund’s organizational documents into contractual rights that cannot be changed in the future without the consent of the Trustee. Additionally, in the normal course of business, the Fund may enter into contracts with service providers that contain a variety of indemnification clauses. The Fund’s maximum exposure under these arrangements is dependent on future claims that may be made against the Fund and, therefore, cannot be estimated.
22 | Allspring Absolute Return Fund
Other information (unaudited)
PROXY VOTING INFORMATION
A description of the policies and procedures used to determine how to vote proxies relating to portfolio securities is available without charge, upon request, by calling 1-800-222-8222, visiting our website at allspringglobal.com, or visiting the SEC website at sec.gov. Information regarding how the proxies related to portfolio securities were voted during the most recent 12-month period ended June 30 is available on the website at allspringglobal.com or by visiting the SEC website at sec.gov.
QUARTERLY PORTFOLIO HOLDINGS INFORMATION
The Fund files its complete schedule of portfolio holdings with the SEC for the first and third quarters of each fiscal year as an exhibit to its reports on Form N-PORT. Shareholders may view the filed Form N-PORT by visiting the SEC website at sec.gov.
Allspring Absolute Return Fund | 23
Other information (unaudited)
BOARD OF TRUSTEES AND OFFICERS
Each of the Trustees and Officers listed in the table below acts in identical capacities for each fund in the Allspring family of funds, which consists of 124 mutual funds comprising the Allspring Funds Trust, Allspring Variable Trust, Allspring Master Trust and four closed-end funds (collectively the “Fund Complex”). This table should be read in conjunction with the Prospectus and the Statement of Additional Information1. The mailing address of each Trustee and Officer is 525 Market Street, 12th Floor, San Francisco, CA 94105. Each Trustee and Officer serves an indefinite term, however, each Trustee serves such term until reaching the mandatory retirement age established by the Trustees.
Independent Trustees
Name and
year of birth | Position held and
length of service* | Principal occupations during past five years or longer | Current other
public company or
investment
company
directorships |
William R. Ebsworth
(Born 1957) | Trustee,
since 2015 | Retired. From 1984 to 2013, equities analyst, portfolio manager, research director and chief investment officer at Fidelity Management and Research Company in Boston, Tokyo, and Hong Kong, and retired in 2013 as Chief Investment Officer of Fidelity Strategic Advisers, Inc. where he led a team of investment professionals managing client assets. Prior thereto, Board member of Hong Kong Securities Clearing Co., Hong Kong Options Clearing Corp., the Thailand International Fund, Ltd., Fidelity Investments Life Insurance Company, and Empire Fidelity Investments Life Insurance Company. Audit Committee Chair and Investment Committee Chair of the Vincent Memorial Hospital Endowment (non-profit organization). Mr. Ebsworth is a CFA® charterholder. | N/A |
Jane A. Freeman
(Born 1953) | Trustee,
since 2015;
Chair Liaison,
since 2018 | Retired. From 2012 to 2014 and 1999 to 2008, Chief Financial Officer of Scientific Learning Corporation. From 2008 to 2012, Ms. Freeman provided consulting services related to strategic business projects. Prior to 1999, Portfolio Manager at Rockefeller & Co. and Scudder, Stevens & Clark. Board member of the Harding Loevner Funds from 1996 to 2014, serving as both Lead Independent Director and chair of the Audit Committee. Board member of the Russell Exchange Traded Funds Trust from 2011 to 2012 and the chair of the Audit Committee. Ms. Freeman is also an inactive Chartered Financial Analyst. | N/A |
Isaiah Harris, Jr.
(Born 1952) | Trustee,
since 2009; Audit
Committee
Chair,
since 2019 | Retired. Chairman of the Board of CIGNA Corporation from 2009 to 2021, and Director from 2005 to 2008. From 2003 to 2011, Director of Deluxe Corporation. Prior thereto, President and CEO of BellSouth Advertising and Publishing Corp. from 2005 to 2007, President and CEO of BellSouth Enterprises from 2004 to 2005 and President of BellSouth Consumer Services from 2000 to 2003. Emeritus member of the Iowa State University Foundation Board of Governors. Emeritus Member of the Advisory Board of Iowa State University School of Business. Advisory Board Member, Palm Harbor Academy (private school). Advisory Board Member, Fellowship of Christian Athletes. Mr. Harris is a certified public accountant (inactive status). | N/A |
David F. Larcker
(Born 1950) | Trustee,
since 2009 | James Irvin Miller Professor of Accounting at the Graduate School of Business (Emeritus), Stanford University, Director of the Corporate Governance Research Initiative and Senior Faculty of The Rock Center for Corporate Governance since 2006. From 2005 to 2008, Professor of Accounting at the Graduate School of Business, Stanford University. Prior thereto, Ernst & Young Professor of Accounting at The Wharton School, University of Pennsylvania from 1985 to 2005. | N/A |
24 | Allspring Absolute Return Fund
Other information (unaudited)
Name and
year of birth | Position held and
length of service* | Principal occupations during past five years or longer | Current other
public company or
investment
company
directorships |
Olivia S. Mitchell
(Born 1953) | Trustee,
since 2006;
Nominating and
Governance
Committee Chair,
since 2018 | International Foundation of Employee Benefit Plans Professor since 1993, Wharton School of the University of Pennsylvania. Director of Wharton’s Pension Research Council and Boettner Center on Pensions & Retirement Research, and Research Associate at the National Bureau of Economic Research. Previously taught at Cornell University from 1978 to 1993. | N/A |
Timothy J. Penny
(Born 1951) | Trustee,
since 1996;
Chair,
since 2018 | President and Chief Executive Officer of Southern Minnesota Initiative Foundation, a non-profit organization, since 2007. Vice Chair of the Economic Club of Minnesota, since 2007. Co-Chair of the Committee for a Responsible Federal Budget, since 1995. Member of the Board of Trustees of NorthStar Education Finance, Inc., a non-profit organization, since 2007. Senior Fellow of the University of Minnesota Humphrey Institute from 1995 to 2017. | N/A |
James G. Polisson
(Born 1959) | Trustee,
since 2018 | Retired. Chief Marketing Officer, Source (ETF) UK Services, Ltd, from 2015 to 2017. From 2012 to 2015, Principal of The Polisson Group, LLC, a management consulting, corporate advisory and principal investing company. Chief Executive Officer and Managing Director at Russell Investments, Global Exchange Traded Funds from 2010 to 2012. Managing Director of Barclays Global Investors from 1998 to 2010 and Global Chief Marketing Officer for iShares and Barclays Global Investors from 2000 to 2010. Trustee of the San Francisco Mechanics’ Institute, a non-profit organization, from 2013 to 2015. Board member of the Russell Exchange Traded Fund Trust from 2011 to 2012. Director of Barclays Global Investors Holdings Deutschland GmbH from 2006 to 2009. Mr. Polisson is an attorney and has a retired status with the Massachusetts and District of Columbia Bar Associations. | N/A |
Pamela Wheelock
(Born 1959) | Trustee,
since January
2020; previously
Trustee from
January 2018 to
July 2019 | Retired. Executive and Senior Financial leadership positions in the public, private and nonprofit sectors. Interim President and CEO, McKnight Foundation, 2020. Interim Commissioner, Minnesota Department of Human Services, 2019. Chief Operating Officer, Twin Cities Habitat for Humanity, 2017-2019. Vice President for University Services, University of Minnesota, 2012-2016. Interim President and CEO, Blue Cross and Blue Shield of Minnesota, 2011-2012. Executive Vice-President and Chief Financial Officer, Minnesota Wild, 2002-2008. Commissioner, Minnesota Department of Finance, 1999-2002. Chair of the Board of Directors of Destination Medical Center Corporation. Board member of the Minnesota Wild Foundation. | N/A |
* Length of service dates reflect the Trustee’s commencement of service with the Trust’s predecessor entities, where applicable.
Allspring Absolute Return Fund | 25
Other information (unaudited)
Officers2
Name and
year of birth | Position held and
length of service | Principal occupations during past five years or longer |
Andrew Owen
(Born 1960) | President,
since 2017 | President and Chief Executive Officer of Allspring Funds Management, LLC since 2017 and Head of Global Fund Governance of Allspring Global Investments since 2022. Prior thereto, co-president of Galliard Capital Management, LLC, an affiliate of Allspring Funds Management, LLC, from 2019 to 2022 and Head of Affiliated Managers, Allspring Global Investments, from 2014 to 2019 and Executive Vice President responsible for marketing, investments and product development for Allspring Funds Management, LLC, from 2009 to 2014. |
Jeremy DePalma
(Born 1974) | Treasurer,
since 2012
(for certain funds in
the Fund Complex);
since 2021 (for
the remaining funds in the
Fund Complex) | Senior Vice President of Allspring Funds Management, LLC since 2009. Senior Vice President of Evergreen Investment Management Company, LLC from 2008 to 2010 and head of the Fund Reporting and Control Team within Fund Administration from 2005 to 2010. |
Christopher Baker
(Born 1976) | Chief Compliance Officer, since 2022 | Global Chief Compliance Officer for Allspring Global Investments since 2022. Prior thereto, Chief Compliance Officer for State Street Global Advisors from 2018 to 2021. Senior Compliance Officer for the State Street divisions of Alternative Investment Solutions, Sector Solutions, and Global Marketing from 2015 to 2018. From 2010 to 2015 Vice President, Global Head of Investment and Marketing Compliance for State Street Global Advisors. |
Matthew Prasse
(Born 1983) | Chief Legal Officer, since 2022; Secretary, since 2021 | Senior Counsel of the Allspring Legal Department since 2021. Senior Counsel of the Wells Fargo Legal Department from 2018 to 2021. Previously, Counsel for Barings LLC from 2015 to 2018. Prior to joining Barings, Associate at Morgan, Lewis & Bockius LLP from 2008 to 2015. |
1 The Statement of Additional Information includes additional information about the Trustees and is available, without charge, upon request, by calling 1-800-222-8222 or by visiting the website at allspringglobal.com.
2 For those Officers with tenures at Allspring Global Investments and/or Allspring Funds Management, LLC that began prior to 2021, such tenures include years of service during which these businesses/entities were known as Wells Fargo Asset Management and Wells Fargo Funds Management, LLC, respectively.
26 | Allspring Absolute Return Fund
Other information (unaudited)
LIQUIDITY RISK MANAGEMENT PROGRAM
In accordance with Rule 22e-4 under the Investment Company Act of 1940, as amended (the “Liquidity Rule”), Allspring Funds Trust (the “Trust”) has adopted and implemented a liquidity risk management program (the “Program”) on behalf of each of its series (other than the series that operate as money market funds), including the Fund, which is reasonably designed to assess and manage the Fund's liquidity risk. “Liquidity risk” is defined under the Liquidity Rule as the risk that the Fund is unable to meet redemption requests without significantly diluting remaining investors’ interests in the Fund. The Trust’s Board of Trustees (the “Board”) previously approved the designation of Allspring Funds Management, LLC (“Allspring Funds Management”), the Fund's investment manager, to administer the Program, and Allspring Funds Management has established a Liquidity Risk Management Council (the "Council") composed of personnel from multiple departments within Allspring Funds Management and its affiliates to assist Allspring Funds Management in the administration of the Program.
The Program is comprised of various components designed to support the assessment and/or management of liquidity risk, including: (1) the periodic assessment (no less frequently than annually) of certain factors that influence the Fund's liquidity risk; (2) the periodic classification (no less frequently than monthly) of the Fund's investments into one of four liquidity categories that reflect an estimate of their liquidity under current market conditions; (3) a 15% limit on the acquisition of “illiquid investments” (as defined under the Liquidity Rule); (4) to the extent the Fund does not invest primarily in “highly liquid investments” (as defined under the Liquidity Rule), the determination of a minimum percentage of the Fund's assets that generally will be invested in highly liquid investments (an “HLIM”); (5) if the Fund has established an HLIM, the periodic review (no less frequently than annually) of the HLIM and the adoption of policies and procedures for responding to a shortfall of the Fund's “highly liquid investments” below its HLIM; and (6) periodic reporting to the Board.
At a meeting of the Board held on May 24-25, 2022, the Board received and reviewed a written report (the “Report”) from Allspring Funds Management that, among other things, addressed the operation of the Program and assessed its adequacy and effectiveness for the period from January 1, 2021 through December 31, 2021 (the “Reporting Period”). Other than extended foreign market holidays, no significant liquidity events impacting the Funds were noted in the Report. In addition, other than corporate-related changes to the Program, there were no material changes to the Program during the Reporting Period.
Allspring Funds Management determined in the Report that the Program has been implemented and operates effectively to manage the Fund’s liquidity risk, and Allspring Funds Management continues to believe that the Program has been and continues to be adequately and effectively implemented to monitor and, as applicable, respond to the Fund’s liquidity developments.
There can be no assurance that the Program will achieve its objectives under all circumstances in the future. Please refer to the Fund’s prospectus for more information regarding the Fund’s exposure to liquidity risk and other risks to which an investment in the Fund may be subject.
Allspring Absolute Return Fund | 27
Appendix (unaudited)
GMO Benchmark-Free Allocation Fund
(A Series of GMO Trust)
Schedule of Investments
(showing percentage of total net assets)
October 31, 2022 (Unaudited)
| | | | | | | | | | |
| Shares | | | Description | | Value ($) | |
| | |
| | | | | | MUTUAL FUNDS — 100.1% | |
| | |
| | | | | | Affiliated Issuers — 100.1% | |
| | | |
| | | 7,645,231 | | | GMO Emerging Country Debt Fund, Class VI | | | 134,173,810 | |
| | | |
| | | 7,825,181 | | | GMO High Yield Fund, Class VI | | | 136,001,638 | |
| | | |
| | | 322,239,128 | | | GMO Implementation Fund | | | 3,712,194,754 | |
| | | |
| | | 7,112,093 | | | GMO Opportunistic Income Fund, Class VI | | | 171,330,316 | |
| | | |
| | | 4,500,059 | | | GMO SGM Major Markets Fund, Class VI | | | 116,821,537 | |
| | | | | | | | | | |
| | | |
| | | | | | TOTAL MUTUAL FUNDS
(COST $4,862,057,124) | | | 4,270,522,055 | |
| | | | | | | | | | |
| | |
| | | | | | SHORT-TERM INVESTMENTS — 0.1% | |
| | |
| | | | | | Money Market Funds — 0.1% | |
| | | |
| | | 3,251,138 | | | State Street Institutional Treasury Money Market Fund – Premier Class, 2.92%(a) | | | 3,251,138 | |
| | | | | | | | | | |
| | | |
| | | | | | TOTAL SHORT-TERM INVESTMENTS
(COST $3,251,138) | | | 3,251,138 | |
| | | | | | | | | | |
| | | |
| | | | | | TOTAL INVESTMENTS — 100.2%
(Cost $4,865,308,262) | | | 4,273,773,193 | |
| | | |
| | | | | | Other Assets and Liabilities (net) — (0.2%) | | | (7,365,510 | ) |
| | | | | | | | | | |
| | | |
| | | | | | TOTAL NET ASSETS — 100.0% | | $ | 4,266,407,683 | |
| | | | | | | | | | |
Notes to Schedule of Investments:
| (a) | The rate disclosed is the 7 day net yield as of October 31, 2022. |
28 | Allspring Absolute Return Fund
Appendix (unaudited)
GMO Benchmark-Free Allocation Fund
(A Series of GMO Trust)
Statement of Assets and Liabilities — October 31, 2022 (Unaudited)
| | | | |
Assets: | |
| |
Investments in affiliated issuers, at value(a) | | $ | 4,270,522,055 | |
| |
Investments in unaffiliated issuers, at value(b) | | | 3,251,138 | |
| |
Receivable for investments sold | | | 33,700,000 | |
| |
Receivable for Fund shares sold | | | 183,846 | |
| |
Dividends and interest receivable | | | 7,390 | |
| |
Receivable for expenses reimbursed and/or waived by GMO | | | 293,572 | |
| | | | |
| |
Total assets | | | 4,307,958,001 | |
| | | | |
Liabilities: | |
| |
Payable for Fund shares repurchased | | | 38,473,966 | |
| |
Payable to affiliate for: | | | | |
Management fee | | | 2,412,310 | |
Supplemental support fee – Class MF | | | 93,704 | |
Shareholder service fee | | | 366,011 | |
| |
Payable to Trustees and related expenses | | | 3,720 | |
| |
Accrued expenses | | | 200,607 | |
| | | | |
| |
Total liabilities | | | 41,550,318 | |
| | | | |
Net assets | | $ | 4,266,407,683 | |
| | | | |
| |
Net assets consist of: | | | | |
| |
Paid-in capital | | $ | 5,092,346,396 | |
| |
Distributable earnings (accumulated loss) | | | (825,938,713 | ) |
| | | | |
| | $ | 4,266,407,683 | |
| | | | |
Net assets attributable to: | | | | |
| |
Class III | | $ | 1,455,034,586 | |
| | | | |
| |
Class IV | | $ | 1,193,191,625 | |
| | | | |
| |
Class MF | | $ | 1,071,365,317 | |
| | | | |
| |
Class R6 | | $ | 251,299,359 | |
| | | | |
| |
Class I | | $ | 295,516,796 | |
| | | | |
Shares outstanding: | | | | |
| |
Class III | | | 61,764,803 | |
| | | | |
| |
Class IV | | | 50,629,479 | |
| | | | |
| |
Class MF | | | 45,422,974 | |
| | | | |
| |
Class R6 | | | 10,674,932 | |
| | | | |
| |
Class I | | | 12,567,174 | |
| | | | |
Net asset value per share: | | | | |
| |
Class III | | $ | 23.56 | |
| | | | |
| |
Class IV | | $ | 23.57 | |
| | | | |
| |
Class MF | | $ | 23.59 | |
| | | | |
| |
Class R6 | | $ | 23.54 | |
| | | | |
| |
Class I | | $ | 23.51 | |
| | | | |
| |
(a) Cost of investments – affiliated issuers: | | $ | 4,862,057,124 | |
| |
(b) Cost of investments – unaffiliated issuers: | | $ | 3,251,138 | |
Allspring Absolute Return Fund | 29
For more information
More information about Allspring Funds is available free upon request. To obtain literature, please write, visit the Fund's website, or call:
Allspring Funds
P.O. Box 219967
Kansas City, MO 64121-9967
Website: allspringglobal.com
Individual investors: 1-800-222-8222
Retail investment professionals: 1-888-877-9275
Institutional investment professionals: 1-800-260-5969
This report and the financial statements contained herein are submitted for the general information of the shareholders of the Fund. If this report is used for promotional purposes, distribution of the report must be accompanied or preceded by a current prospectus. Before investing, please consider the investment objectives, risks, charges, and expenses of the investment. For a current prospectus and, if available, a summary prospectus, containing this information, call
1-800-222-8222 or visit the Fund's website at allspringglobal.com. Read the prospectus carefully before you invest or send money.
Allspring Global InvestmentsTM is the trade name for the asset management firms of Allspring Global Investments Holdings, LLC, a holding company indirectly owned by certain private funds of GTCR LLC and Reverence Capital Partners, L.P. These firms include but are not limited to Allspring Global Investments, LLC, and Allspring Funds Management, LLC. Certain products managed by Allspring entities are distributed by Allspring Funds Distributor, LLC (a broker-dealer and Member FINRA/SIPC).
This material is for general informational and educational purposes only and is NOT intended to provide investment advice or a recommendation of any kind - including a recommendation for any specific investment, strategy, or plan.
© 2022 Allspring Global Investments Holdings, LLC. All rights reserved.
ALL-12132022-pk7ulj3k 12-22
SA260/SAR260 10-22
ITEM 2. CODE OF ETHICS
Not applicable.
ITEM 3. AUDIT COMMITTEE FINANCIAL EXPERT
Not applicable.
ITEM 4. PRINCIPAL ACCOUNTANT FEES AND SERVICES
Not applicable.
ITEM 5. AUDIT COMMITTEE OF LISTED REGISTRANTS
Not applicable.
ITEM 6. INVESTMENTS
A Portfolio of Investments for Allspring Absolute Return Fund is included as part of the report to shareholders filed under Item 1 of this Form.
ITEM 7. DISCLOSURE OF PROXY VOTING POLICIES AND PROCEDURES FOR CLOSED-END MANAGEMENT INVESTMENT COMPANIES
Not applicable.
ITEM 8. PORTFOLIO MANAGERS OF CLOSED-END MANAGEMENT INVESTMENT COMPANIES
Not applicable.
ITEM 9. PURCHASES OF EQUITY SECURITIES BY CLOSED-END MANAGEMEENT INVESTMENT COMPANY AND AFFILIATED PURCHASERS
Not applicable.
ITEM 10. SUBMISSION OF MATTERS TO A VOTE OF SECURITY HOLDERS
There have been no material changes to the procedures by which shareholders may recommend nominees to the registrant’s Board of Trustees that have been implemented since the registrant’s last provided disclosure in response to the requirements of this Item.
ITEM 11. CONTROLS AND PROCEDURES
(a) The President and Treasurer have concluded that the Allspring Funds Trust disclosure controls and procedures (as defined in Rule 30a-3(c) under the Investment Company Act of 1940) provide reasonable assurances that material information relating to the registrant is made known to them by the appropriate persons, based on their evaluation of these controls and procedures as of a date within 90 days of the filing of this report.
(b) There were no significant changes in the registrant’s internal controls over financial reporting (as defined in Rule 30a-3(d) under the Investment Company Act of 1940) that occurred during the most recent fiscal half-year of the period covered by this report that materially affected, or is reasonably likely to materially affect, the registrant’s internal control over financial reporting.
ITEM 12. DISCLOSURES OF SECURITIES LENDING ACTIVITES FOR CLOSED-END MANAGEMENT INVESTMENT COMPANIES
Not applicable.
ITEM 13. EXHIBITS
SIGNATURES
Pursuant to the requirements of the Securities Exchange Act of 1934 and the Investment Company Act of 1940, the registrant has duly caused this report to be signed on its behalf by the undersigned, thereunto duly authorized.
| | |
| Allspring Funds Trust |
| |
| By: | | /s/ Andrew Owen |
| | Andrew Owen |
| | President |
| |
| Date: | | December 22, 2022 |
Pursuant to the requirements of the Securities Exchange Act of 1934 and the Investment Company Act of 1940, this report has been signed below by the following persons on behalf of the registrant and in the capacities and on the date indicated.
| | |
| Allspring Funds Trust |
| |
| By: | | /s/ Andrew Owen |
| | Andrew Owen |
| | President |
| |
| Date: | | December 22, 2022 |
| |
| By: | | /s/ Jeremy DePalma |
| | Jeremy DePalma |
| | Treasurer |
| |
| Date: | | December 22, 2022 |