UNITED STATES
SECURITIES AND EXCHANGE COMMISSION
Washington, D.C. 20549
FORM N-CSRS
CERTIFIED SHAREHOLDER REPORT OF REGISTERED
MANAGEMENT INVESTMENT COMPANIES
Investment Company Act file number: 811-09253
Allspring Funds Trust
(Exact name of registrant as specified in charter)
1415 Vantage Park Drive, 3rd Floor, Charlotte, NC 28203
(Address of principal executive offices) (Zip code)
Matthew Prasse
Allspring Funds Management, LLC
1415 Vantage Park Drive, 3rd Floor, Charlotte, NC 28203
(Name and address of agent for service)
Registrant’s telephone number, including area code: 800-222-8222
Date of fiscal year end: June 30
Registrant is making a filing for 13 of its series:
Allspring Alternative Risk Premia Fund, Allspring California Limited-Term Tax-Free Fund, Allspring California Tax-Free Fund, Allspring High Yield Municipal Bond Fund, Allspring Intermediate Tax/AMT-Free Fund, Allspring Minnesota Tax-Free Fund, Allspring Municipal Bond Fund, Allspring Municipal Sustainability Fund, Allspring Pennsylvania Tax-Free Fund, Allspring Short-Term Municipal Bond Fund, Allspring Strategic Municipal Bond Fund, Allspring Ultra Short-Term Municipal Income Fund and Allspring Wisconsin Tax-Free Fund
Date of reporting period: December 31, 2022
ITEM 1. REPORT TO STOCKHOLDERS
Semi-Annual Report
December 31, 2022
Allspring California
Limited-Term Tax-Free Fund
The views expressed and any forward-looking statements are as of December 31, 2022, unless otherwise noted, and are those of the Fund's portfolio managers and/or Allspring Global Investments. Discussions of individual securities or the markets generally are not intended as individual recommendations. Future events or results may vary significantly from those expressed in any forward-looking statements. The views expressed are subject to change at any time in response to changing circumstances in the market. Allspring Global Investments disclaims any obligation to publicly update or revise any views expressed or forward-looking statements.
Allspring California Limited-Term Tax-Free Fund | 1
Letter to shareholders (unaudited)
Andrew Owen
President
Allspring Funds
Dear Shareholder:
We are pleased to offer you this semi-annual report for the Allspring California Limited-Term Tax-Free Fund for the six-month period that ended December 31, 2022. Globally, stocks and bonds experienced heightened volatility and generally negative returns through the challenging period. Earlier tailwinds provided by global stimulus programs, vaccination rollouts, and recovering consumer and corporate sentiment were wiped away by the highest rate of inflation in four decades, the impact of ongoing aggressive central bank rate hikes and the prospect of more rate hikes. Compounding these concerns were the global reverberations of the Russia-Ukraine war and the impact of China’s strict COVID-19 lockdowns.
For the six-month period, stocks and bonds had mixed results, with emerging market equities trailing those of developed markets and both U.S. and non-U.S. bonds fighting an uphill battle in the face of sustained interest rate increases. For the period, U.S. stocks, based on the S&P 500 Index,1 gained 2.31%. International stocks, as measured by the MSCI ACWI ex USA Index (Net),2 returned 2.96%, while the MSCI EM Index (Net) (USD)3 declined 2.99%. Among bond indexes, the Bloomberg U.S. Aggregate Bond Index4 returned -2.97%, the Bloomberg Global Aggregate ex-USD Index (unhedged)5 returned -2.65%, the Bloomberg Municipal Bond Index6 gained 0.50%, and the ICE BofA U.S. High Yield Index7 returned 3.33%.
Persistent inflation and economic fallout from the Russia-Ukraine war drove markets.
Markets rebounded from earlier losses in July, led by U.S. stocks. While evidence pointed to an economic slowdown after two consecutive quarters of declining gross domestic product (economic contraction), the U.S. labor market remained surprisingly strong: July nonfarm payrolls grew by more than 500,000 and U.S. unemployment dipped to 3.5%. Meanwhile, crude oil and retail gasoline prices, major contributors to recent overall inflation, fell substantially from earlier highs. And while U.S. home prices rose, sales fell as houses became less affordable with mortgage rates at a 13-year high. The Federal Reserve (Fed) raised the federal funds rate another 0.75% in July—to a range of 2.25% to 2.50%—and forecasts pointed to further rate hikes.
| 1 | The S&P 500 Index consists of 500 stocks chosen for market size, liquidity, and industry group representation. It is a market-value-weighted index with each stock's weight in the index proportionate to its market value. You cannot invest directly in an index. |
| 2 | The Morgan Stanley Capital International (MSCI) All Country World Index (ACWI) ex USA Index (Net) is a free-float-adjusted market-capitalization-weighted index that is designed to measure the equity market performance of developed and emerging markets, excluding the U.S. Source: MSCI. MSCI makes no express or implied warranties or representations and shall have no liability whatsoever with respect to any MSCI data contained herein. The MSCI data may not be further redistributed or used as a basis for other indexes or any securities or financial products. This report is not approved, reviewed, or produced by MSCI. You cannot invest directly in an index. |
| 3 | The MSCI Emerging Markets (EM) Index (Net) (USD) is a free-float-adjusted market-capitalization-weighted index that is designed to measure equity market performance of emerging markets. You cannot invest directly in an index. |
| 4 | The Bloomberg U.S. Aggregate Bond Index is a broad-based benchmark that measures the investment-grade, U.S.-dollar-denominated, fixed-rate taxable bond market, including Treasuries, government-related and corporate securities, mortgage-backed securities (agency fixed-rate and hybrid adjustable-rate mortgage pass-throughs), asset-backed securities, and commercial mortgage-backed securities. You cannot invest directly in an index. |
| 5 | The Bloomberg Global Aggregate ex-USD Index (unhedged) is an unmanaged index that provides a broad-based measure of the global investment-grade fixed-income markets excluding the U.S.-dollar-denominated debt market. You cannot invest directly in an index. |
| 6 | The Bloomberg Municipal Bond Index is an unmanaged index composed of long-term tax-exempt bonds with a minimum credit rating of Baa. You cannot invest directly in an index. |
| 7 | The ICE BofA U.S. High Yield Index is a market-capitalization-weighted index of domestic and Yankee high-yield bonds. The index tracks the performance of high-yield securities traded in the U.S. bond market. You cannot invest directly in an index. Copyright 2023. ICE Data Indices, LLC. All rights reserved. |
2 | Allspring California Limited-Term Tax-Free Fund
Letter to shareholders (unaudited)
August was yet another broadly challenging month for financial markets, with more red ink flowing. High inflation persisted, cresting 9% in the eurozone on an annual basis and remaining above 8% in the U.S. despite the Fed’s aggressive monetary policy and a major drop in global crude oil and gasoline prices from their June peak. One positive note was the resilience of the U.S. job market. However, the Fed’s job was clearly not complete. One longer-term bright spot was the U.S. Congress’s passage of the Inflation Reduction Act. Its primary stated goals include: to reduce inflation (though not immediately) by curbing the deficit, capping health care spending by seniors, and investing in domestic sources of clean energy.
The market misery continued in September. There was nowhere to hide as all asset classes suffered major losses at the hands of persistent inflation. Central banks kept up their battle against rapidly rising prices with more rate hikes. The strength of the U.S. dollar made things even more difficult for investors holding assets in other currencies. U.S. mortgage rates jumped to near 7% on 30-year fixed-rate mortgages; the decreased housing affordability began to cool demand somewhat. The U.K. experienced a sharp sell-off of government bonds and the British pound in September as investors panicked in response to a new government budget that was seen as financially unsound. The market meltdown forced the Bank of England to step in and buy long-dated government bonds.
Equities had a reprieve in October after two months of sharp declines. Value stocks and small caps fared best. Globally, developed markets outpaced emerging market equities, which were hurt by weakness among Chinese stocks. Central banks continued to try to curtail high inflation with aggressive interest rate hikes. Geopolitical risks persisted, including the ongoing Russia-Ukraine war and economic, financial market, and political turmoil in the U.K., which led to a second prime ministerial change in six weeks, as Rishi Sunak replaced Liz Truss in late October. Concerns over Europe’s energy crisis eased thanks to unseasonably warm weather and plentiful gas on hand. The U.S. labor market continued its resilience against rising prices, as unemployment stood at 3.7%, near a record low.
Stocks and bonds rallied in November, with emerging market equities gaining nearly 15% and developed market equities returning 7%. The S&P 500 Index rose 5.6% in November. Bonds also had positive monthly returns. Economic news was encouraging, driven by U.S. labor market strength. Although central banks kept raising rates, expectations grew regarding an impending easing in the pace of rate hikes and a possible end to central bank monetary tightening in 2023. Although inflation remained at record highs in the eurozone, with a 10.6% annual increase in October, Germany’s producer prices decreased 4.2% annually, signaling a possible decline in inflationary pressures. Meanwhile, U.S. inflation continued to moderate, with a 7.1% annual price rise in November and a monthly price increase of just 0.1%. China’s economic data remained weak, reflecting its zero-COVID-19 policy.
Financial markets cooled in December, with U.S. equities posting negative overall results in response to a weakening U.S. dollar. Fixed income securities ended one of their worst years ever with flat overall monthly returns as markets weighed the hopes for an end to the monetary tightening cycle with the reality that central banks had not completed their jobs yet. U.S. Consumer Price Index (CPI)1 data showed a strong consistent trend downward, which brought down the 12-month CPI to 6.5% in December from 9.1% in June. Other countries and regions reported still-high but declining inflation rates as the year winded down.
“ The market misery continued in September. There was nowhere to hide as all asset classes suffered major losses at the hands of persistent inflation.”
| 1 | The Consumer Price Index (CPI) is a measure of the average change over time in the prices paid by urban consumers for a market basket of consumer goods and services. You cannot invest directly in an index. |
Allspring California Limited-Term Tax-Free Fund | 3
Letter to shareholders (unaudited)
Don’t let short-term uncertainty derail long-term investment goals.
Periods of investment uncertainty can present challenges, but experience has taught us that maintaining long-term investment goals can be an effective way to plan for the future. To help you create a sound strategy based on your personal goals and risk tolerance, Allspring Funds offers more than 100 mutual funds spanning a wide range of asset classes and investment styles. Although diversification cannot guarantee an investment profit or prevent losses, we believe it can be an effective way to manage investment risk and potentially smooth out overall portfolio performance. We encourage investors to know their investments and to understand that appropriate levels of risk-taking may unlock opportunities.
Thank you for choosing to invest with Allspring Funds. We appreciate your confidence in us and remain committed to helping you meet your financial needs.
Sincerely,
Andrew Owen
President
Allspring Funds
For further information about your fund, contact your investment professional, visit our website at allspringglobal.com, or call us directly at 1-800-222-8222.
4 | Allspring California Limited-Term Tax-Free Fund
This page is intentionally left blank.
Performance highlights (unaudited)
| Investment objective | The Fund seeks current income exempt from federal income tax and California individual income tax, consistent with capital preservation. |
| Manager | Allspring Funds Management, LLC |
| Subadviser | Allspring Global Investments, LLC |
| Portfolio managers | Terry J. Goode, Kim Nakahara, Adrian Van Poppel |
| Average annual total returns (%) as of December 31, 2022 |
| | | Including sales charge | | Excluding sales charge | | Expense ratios1 (%) |
| | Inception date | 1 year | 5 year | 10 year | | 1 year | 5 year | 10 year | | Gross | Net 2 |
| Class A (SFCIX) | 11-18-1992 | -6.72 | -0.16 | 0.71 | | -4.79 | 0.25 | 0.92 | | 0.85 | 0.80 |
| Class C (SFCCX) | 8-30-2002 | -6.51 | -0.50 | 0.32 | | -5.51 | -0.50 | 0.32 | | 1.60 | 1.55 |
| Administrator Class (SCTIX) | 9-6-1996 | – | – | – | | -4.60 | 0.45 | 1.13 | | 0.79 | 0.60 |
| Institutional Class (SFCNX)3 | 10-31-2014 | – | – | – | | -4.51 | 0.57 | 1.21 | | 0.52 | 0.50 |
| Bloomberg Municipal Bond 1-5 Year Blend Index4 | – | – | – | – | | -3.55 | 1.11 | 1.17 | | – | – |
| Bloomberg California Municipal 1-5 Year Blend Index5 | – | – | – | – | | -3.36 | 0.95 | 1.09 | | – | – |
Figures quoted represent past performance, which is no guarantee of future results, and do not reflect taxes that a shareholder may pay on an investment in a fund. Investment return and principal value of an investment will fluctuate so that an investor’s shares, when redeemed, may be worth more or less than their original cost. Performance shown without sales charges would be lower if sales charges were reflected. Current performance may be lower or higher than the performance data quoted, which assumes the reinvestment of dividends and capital gains. Current month-end performance is available on the Fund’s website, allspringglobal.com.
Index returns do not include transaction costs associated with buying and selling securities, any mutual fund fees or expenses, or any taxes. It is not possible to invest directly in an index.
For Class A shares, the maximum front-end sales charge is 2.00%. For Class C shares, the maximum contingent deferred sales charge is 1.00%. Performance including a contingent deferred sales charge assumes the sales charge for the corresponding time period. Administrator Class and Institutional Class shares are sold without a front-end sales charge or contingent deferred sales charge.
| 1 | Reflects the expense ratios as stated in the most recent prospectuses. The expense ratios shown are subject to change and may differ from the annualized expense ratios shown in the financial highlights of this report. |
| 2 | The manager has contractually committed through October 31, 2023, to waive fees and/or reimburse expenses to the extent necessary to cap total annual fund operating expenses after fee waivers at 0.80% for Class A, 1.55% for Class C, 0.60% for Administrator Class, and 0.50% for Institutional Class. Brokerage commissions, stamp duty fees, interest, taxes, acquired fund fees and expenses (if any), and extraordinary expenses are excluded from the expense caps. Prior to or after the commitment expiration date, the caps may be increased or the commitment to maintain the caps may be terminated only with the approval of the Board of Trustees. Without these caps, the Fund’s returns would have been lower. The expense ratio paid by an investor is the net expense ratio (the total annual fund operating expenses after fee waivers) as stated in the prospectuses. |
| 3 | Historical performance shown for the Institutional Class shares prior to their inception reflects the performance of the Administrator Class shares, and includes the higher expenses applicable to the Administrator Class shares. If these expenses had not been included, returns for the Institutional Class shares would be higher. |
| 4 | The Bloomberg Municipal Bond 1–5 Year Blend Index is the 1–5 Year component of the Bloomberg Municipal Bond Index. The Bloomberg Municipal Bond Index is an unmanaged index composed of long-term tax-exempt bonds with a minimum credit rating of Baa. You cannot invest directly in an index. |
| 5 | The Bloomberg California Municipal 1-5 Year Blend Index is the 1-5 Year component of the Bloomberg California Municipal Bond Index. You cannot invest directly in an index. |
6 | Allspring California Limited-Term Tax-Free Fund
Performance highlights (unaudited)
Bond values fluctuate in response to the financial condition of individual issuers, general market and economic conditions, and changes in interest rates. Changes in market conditions and government policies may lead to periods of heightened volatility in the bond market and reduced liquidity for certain bonds held by the Fund. In general, when interest rates rise, bond values fall and investors may lose principal value. Interest rate changes and their impact on the Fund and its share price can be sudden and unpredictable. The use of derivatives may reduce returns and/or increase volatility. Certain investment strategies tend to increase the total risk of an investment (relative to the broader market). This fund is exposed to California municipal securities risk and high-yield securities risk. Consult the Fund’s prospectus for additional information on these and other risks. A portion of the Fund’s income may be subject to federal, state, and/or local income taxes or the Alternative Minimum Tax (AMT). Any capital gains distributions may be taxable.
Allspring California Limited-Term Tax-Free Fund | 7
Performance highlights (unaudited)
| Credit quality as of December 31, 20221 |
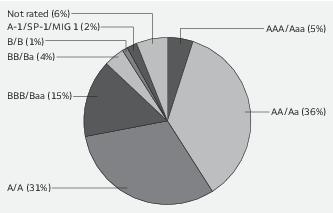
| 1 | The credit quality distribution of portfolio holdings reflected in the chart is based on ratings from Standard & Poor’s, Moody’s Investors Service, and/or Fitch Ratings Ltd. Credit quality ratings apply to the underlying holdings of the Fund and not to the Fund itself. The percentages of the portfolio with the ratings depicted in the chart are calculated based on the market value of fixed income securities held by the Fund. If a security was rated by all three rating agencies, the middle rating was utilized. If rated by two of the three rating agencies, the lower rating was utilized, and if rated by one of the rating agencies, that rating was utilized. Standard & Poor’s rates the creditworthiness of bonds, ranging from AAA (highest) to D (lowest). Ratings from A to CCC may be modified by the addition of a plus (+) or minus (-) sign to show relative standing within the rating categories. Standard & Poor’s rates the creditworthiness of short-term notes from SP-1 (highest) to SP-3 (lowest). Moody’s rates the creditworthiness of bonds, ranging from Aaa (highest) to C (lowest). Ratings Aa to B may be modified by the addition of a number 1 (highest) to 3 (lowest) to show relative standing within the ratings categories. Moody’s rates the creditworthiness of short-term U.S. tax-exempt municipal securities from MIG 1/VMIG 1 (highest) to SG (lowest). Fitch rates the creditworthiness of bonds, ranging from AAA (highest) to D (lowest). Credit quality distribution is subject to change and may have changed since the date specified. |
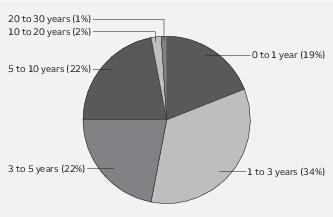
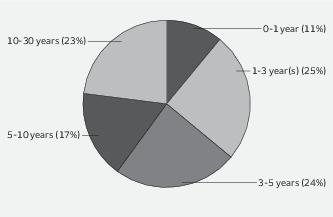
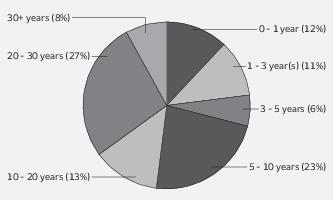
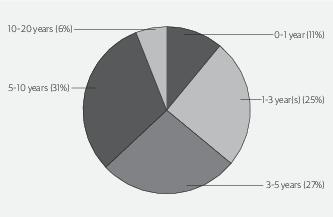
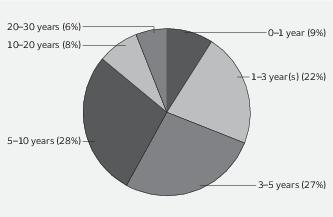
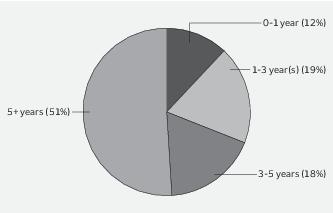
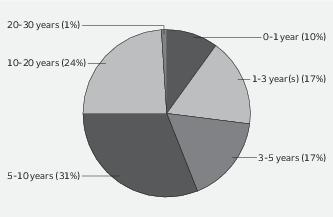
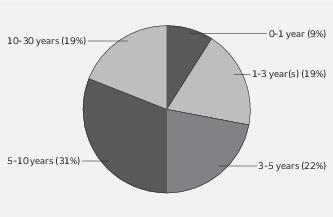
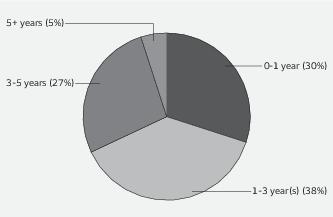
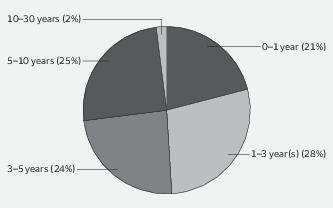
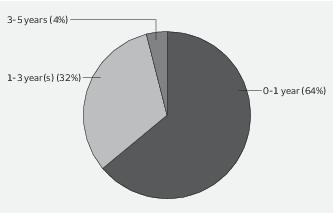
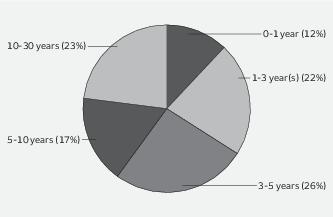
| Effective maturity distribution as of December 31, 20221 |
| 1 | Figures represent the percentage of the Fund's long-term investments. Allocations are subject to change and may have changed since the date specified. |
8 | Allspring California Limited-Term Tax-Free Fund
Fund expenses (unaudited)
As a shareholder of the Fund, you incur two types of costs: (1) transaction costs, including sales charges (loads) on purchase payments and contingent deferred sales charges (if any) on redemptions and (2) ongoing costs, including management fees, distribution (12b-1) and/or shareholder servicing fees, and other Fund expenses. This example is intended to help you understand your ongoing costs (in dollars) of investing in the Fund and to compare these costs with the ongoing costs of investing in other mutual funds.
The example is based on an investment of $1,000 invested at the beginning of the six-month period and held for the entire period from July 1, 2022 to December 31, 2022.
Actual expenses
The “Actual” line of the table below provides information about actual account values and actual expenses. You may use the information in this line, together with the amount you invested, to estimate the expenses that you paid over the period. Simply divide your account value by $1,000 (for example, an $8,600 account value divided by $1,000 = 8.6), then multiply the result by the number in the “Actual” line under the heading entitled “Expenses paid during period” for your applicable class of shares to estimate the expenses you paid on your account during this period.
Hypothetical example for comparison purposes
The “Hypothetical” line of the table below provides information about hypothetical account values and hypothetical expenses based on the Fund’s actual expense ratio and an assumed rate of return of 5% per year before expenses, which is not the Fund’s actual return. The hypothetical account values and expenses may not be used to estimate the actual ending account balance or expenses you paid for the period. You may use this information to compare the ongoing costs of investing in the Fund and other funds. To do so, compare this 5% hypothetical example with the 5% hypothetical examples that appear in the shareholder reports of the other funds.
Please note that the expenses shown in the table are meant to highlight your ongoing costs only and do not reflect any transactional costs, such as sales charges (loads) and contingent deferred sales charges. Therefore, the “Hypothetical” line of the table is useful in comparing ongoing costs only, and will not help you determine the relative total costs of owning different funds. In addition, if these transactional costs were included, your costs would have been higher.
| | Beginning
account value
7-1-2022 | Ending
account value
12-31-2022 | Expenses
paid during
the period1 | Annualized net
expense ratio |
| Class A | | | | |
| Actual | $1,000.00 | $1,004.06 | $4.04 | 0.80% |
| Hypothetical (5% return before expenses) | $1,000.00 | $1,021.17 | $4.08 | 0.80% |
| Class C | | | | |
| Actual | $1,000.00 | $1,000.25 | $7.81 | 1.55% |
| Hypothetical (5% return before expenses) | $1,000.00 | $1,017.39 | $7.88 | 1.55% |
| Administrator Class | | | | |
| Actual | $1,000.00 | $1,005.00 | $3.03 | 0.60% |
| Hypothetical (5% return before expenses) | $1,000.00 | $1,022.18 | $3.06 | 0.60% |
| Institutional Class | | | | |
| Actual | $1,000.00 | $1,006.52 | $2.53 | 0.50% |
| Hypothetical (5% return before expenses) | $1,000.00 | $1,022.68 | $2.55 | 0.50% |
1 Expenses paid is equal to the annualized net expense ratio of each class multiplied by the average account value over the period, multiplied by 184 divided by 365 (to reflect the one-half-year period).
Allspring California Limited-Term Tax-Free Fund | 9
Portfolio of investments—December 31, 2022 (unaudited)
| | | | | Principal | Value |
| Closed end municipal bond fund obligations: 1.25% | | | | | |
| California: 1.25% | | | | | |
| Nuveen California AMT-Free Quality Municipal Income Fund MuniFund Preferred Shares Series A (54 shares) 4.11% 144Aø | | | | $ 5,400,000 | $ 5,400,000 |
| Total Closed end municipal bond fund obligations (Cost $5,400,000) | | | | | 5,400,000 |
| | | Interest
rate | Maturity
date | | |
| Municipal obligations: 97.94% | | | | | |
| California: 91.92% | | | | | |
| Airport revenue: 7.41% | | | | | |
| California Municipal Finance Authority Revenue Senior Lien Linxs APM Project Series A | | 5.00% | 12-31-2023 | 1,100,000 | 1,111,237 |
| California Municipal Finance Authority Revenue Senior Lien Linxs APM Project Series A | | 5.00 | 6-30-2024 | 1,115,000 | 1,133,282 |
| California Municipal Finance Authority Revenue Senior Lien Linxs APM Project Series A | | 5.00 | 12-31-2024 | 750,000 | 767,495 |
| California Municipal Finance Authority Revenue Senior Lien Linxs APM Project Series A | | 5.00 | 6-30-2027 | 450,000 | 470,970 |
| California Municipal Finance Authority Revenue Senior Lien Linxs APM Project Series A | | 5.00 | 6-30-2028 | 390,000 | 409,749 |
| California Municipal Finance Authority Revenue Senior Lien Linxs APM Project Series A | | 5.00 | 12-31-2029 | 3,815,000 | 3,996,757 |
| Los Angeles CA Department of Airports Airport Revenue AMT Subordinated Los Angeles International Airport | | 5.00 | 5-15-2028 | 2,000,000 | 2,140,040 |
| Los Angeles CA Department of Airports Airport Revenue AMT Subordinated Los Angeles International Airport | | 5.00 | 5-15-2028 | 2,705,000 | 2,894,404 |
| Los Angeles CA Department of Airports AMT Series B | | 5.00 | 5-15-2025 | 6,000,000 | 6,231,870 |
| Los Angeles CA Department of Airports AMT Series B | | 5.00 | 5-15-2026 | 2,500,000 | 2,638,874 |
| Palm Springs CA Airport Passenger Facility Charge Revenue Palm Springs International Airport (BAM Insured) | | 5.00 | 6-1-2027 | 1,205,000 | 1,246,114 |
| Port of Oakland Revenue Refunding Bond Series 11 | | 5.00 | 11-1-2023 | 70,000 | 71,200 |
| Port of Oakland Revenue Refunding Bond Series 11 | | 5.00 | 11-1-2023 | 130,000 | 132,015 |
| Port of Oakland Revenue Refunding Intermediate Lien Series E | | 5.00 | 11-1-2026 | 1,200,000 | 1,284,498 |
| Sacramento CA Airport System Subordinate Refunding Bond AMT Series F | | 5.00 | 7-1-2023 | 2,585,000 | 2,603,432 |
| Sacramento CA Airport System Subordinate Refunding Bond AMT Series F | | 5.00 | 7-1-2024 | 1,760,000 | 1,799,175 |
| San Diego County CA Regional Airport Authority Airport Revenue Refunding Bond AMT Subordinated Series C | | 5.00 | 7-1-2027 | 750,000 | 796,085 |
| San Diego County CA Regional Airport Authority Airport Revenue Refunding Bond AMT Subordinated Series C | | 5.00 | 7-1-2028 | 1,000,000 | 1,068,978 |
| San Diego County CA Regional Airport Authority Airport Revenue Refunding Bond AMT Subordinated Series C | | 5.00 | 7-1-2029 | 1,000,000 | 1,076,211 |
| San Francisco CA City & County Refunding Bond AMT Second Series A | | 5.50 | 5-1-2028 | 250,000 | 251,511 |
| | | | | | 32,123,897 |
| Education revenue: 8.89% | | | | | |
| California CDA Revenue Bond California Baptist University Series A 144A | | 5.13 | 11-1-2023 | 175,000 | 176,133 |
The accompanying notes are an integral part of these financial statements.
10 | Allspring California Limited-Term Tax-Free Fund
Portfolio of investments—December 31, 2022 (unaudited)
| | | Interest
rate | Maturity
date | Principal | Value |
| Education revenue (continued) | | | | | |
| California Educational Facilities Authority Revenue Loma Linda University Series A | | 5.00% | 4-1-2024 | $ 550,000 | $ 563,436 |
| California Educational Facilities Authority Revenue Loma Linda University Series A | | 5.00 | 4-1-2026 | 325,000 | 343,564 |
| California Infrastructure & Economic Development Bank Colburn School Series 2022 (SIFMA Municipal Swap +0.90%) ± | | 4.56 | 8-1-2072 | 5,000,000 | 4,803,771 |
| California Municipal Finance Authority Charter School Revenue Albert Einstein Academies Project Series A | | 6.00 | 8-1-2023 | 155,000 | 157,546 |
| California Municipal Finance Authority Charter School Revenue Palmdale Aerospace Academy Project Series A 144A | | 3.88 | 7-1-2028 | 1,310,000 | 1,246,024 |
| California Municipal Finance Authority Revenue Bond Institute Arts | | 4.00 | 10-1-2033 | 250,000 | 243,648 |
| California Municipal Finance Authority Revenue Bond Institute Arts | | 4.00 | 10-1-2035 | 350,000 | 332,800 |
| California Municipal Finance Authority Revenue Refunding Bond Biola University | | 5.00 | 10-1-2027 | 790,000 | 840,930 |
| California Municipal Finance Authority Revenue Refunding Bond California Lutheran University | | 5.00 | 10-1-2023 | 225,000 | 227,298 |
| California Municipal Finance Authority Revenue Refunding Bond California Lutheran University | | 5.00 | 10-1-2024 | 275,000 | 281,876 |
| California Municipal Finance Authority Revenue Refunding Bond California Lutheran University | | 5.00 | 10-1-2025 | 275,000 | 283,079 |
| California Municipal Finance Authority Revenue Refunding Bond California Lutheran University | | 5.00 | 10-1-2026 | 300,000 | 311,532 |
| California Municipal Finance Authority Revenue Refunding Bond University of the Pacific Series A | | 5.00 | 11-1-2024 | 600,000 | 621,127 |
| California Municipal Finance Authority Revenue Refunding Bond University of the Pacific Series A | | 5.00 | 11-1-2025 | 600,000 | 637,067 |
| California Municipal Finance Authority Revenue Refunding Bond University of the Pacific Series A | | 5.00 | 11-1-2026 | 625,000 | 674,404 |
| California Municipal Finance Authority Revenue Refunding Bond University of the Pacific Series A | | 5.00 | 11-1-2027 | 650,000 | 713,742 |
| California Municipal Finance Authority Revenue Refunding Bond University of the Pacific Series A | | 5.00 | 11-1-2028 | 700,000 | 780,410 |
| California Municipal Finance Authority Revenue Refunding Bond University of the Pacific Series A | | 5.00 | 11-1-2029 | 470,000 | 530,000 |
| California Municipal Finance Authority Revenue Refunding Bond University of the Pacific Series A | | 5.00 | 11-1-2030 | 500,000 | 568,201 |
| California School Finance Authority Bright Star School Obligation Group 144A | | 5.00 | 6-1-2027 | 1,110,000 | 1,113,274 |
| California School Finance Authority Charter School Revenue Aspire Public Schools Issue #5 Series 144A | | 2.13 | 8-1-2031 | 500,000 | 422,608 |
| California School Finance Authority Charter School Revenue Classical Academies Vista Project 144A | | 3.00 | 10-1-2031 | 375,000 | 343,405 |
| California School Finance Authority Charter School Revenue Hawking Steam Charter School 144A | | 5.00 | 7-1-2023 | 285,000 | 286,192 |
| California School Finance Authority Charter School Revenue Hawking Steam Charter School 144A | | 5.00 | 7-1-2024 | 380,000 | 384,240 |
| California School Finance Authority Charter School Revenue Hawking Steam Charter School 144A | | 5.00 | 7-1-2026 | 420,000 | 428,754 |
| California School Finance Authority Charter School Revenue Hawking Steam Charter School 144A | | 5.00 | 7-1-2027 | 440,000 | 450,292 |
| California School Finance Authority Charter School Revenue Hawking Steam Charter School 144A | | 5.00 | 7-1-2028 | 465,000 | 476,200 |
The accompanying notes are an integral part of these financial statements.
Allspring California Limited-Term Tax-Free Fund | 11
Portfolio of investments—December 31, 2022 (unaudited)
| | | Interest
rate | Maturity
date | Principal | Value |
| Education revenue (continued) | | | | | |
| California School Finance Authority Charter School Revenue Hawking Steam Charter School 144A | | 5.00% | 7-1-2029 | $ 485,000 | $ 496,326 |
| California School Finance Authority Charter School Revenue Hawking Steam Charter School 144A | | 5.00 | 7-1-2030 | 510,000 | 520,474 |
| California School Finance Authority Charter School Revenue Hawking Steam Charter School 144A | | 5.00 | 7-1-2031 | 535,000 | 541,798 |
| California School Finance Authority Charter School Revenue Hawking Steam Charter School 144A | | 5.00 | 7-1-2032 | 565,000 | 568,731 |
| California School Finance Authority Charter School Revenue Santa Clarita Valley International School Project 144A | | 4.00 | 6-1-2031 | 260,000 | 244,707 |
| California School Finance Authority Rocketship Education Series A 144A | | 5.00 | 6-1-2026 | 400,000 | 401,781 |
| California School Finance Authority School Facility Revenue Granada Hills Charter 144A | | 4.00 | 7-1-2029 | 620,000 | 619,976 |
| California University Revenue Systemwide Series B2 øø | | 0.55 | 11-1-2049 | 6,500,000 | 5,691,750 |
| Fullerton CA PFA Revenue Refunding Bond Marshall B Ketchum University | | 4.00 | 2-1-2029 | 360,000 | 374,234 |
| Fullerton CA PFA Revenue Refunding Bond Marshall B Ketchum University | | 4.00 | 2-1-2031 | 415,000 | 431,256 |
| Fullerton CA PFA Revenue Refunding Bond Marshall B Ketchum University | | 4.00 | 2-1-2033 | 325,000 | 336,923 |
| University of California Series AK ## | | 5.00 | 5-15-2048 | 10,000,000 | 10,074,743 |
| | | | | | 38,544,252 |
| GO revenue: 21.93% | | | | | |
| Aromas-San Juan Unified School District BAN ¤ | | 0.00 | 8-1-2027 | 1,375,000 | 1,154,689 |
| Bassett Unified School District Refunding Bond Series B (BAM Insured) | | 5.00 | 8-1-2023 | 725,000 | 732,730 |
| Cajon Valley Union School District Refunding Bond | | 5.00 | 8-1-2026 | 340,000 | 368,604 |
| Cajon Valley Union School District Refunding Bond | | 5.00 | 8-1-2027 | 200,000 | 220,848 |
| California Refunding Bond Various Purpose | | 4.00 | 9-1-2026 | 6,000,000 | 6,288,779 |
| California Refunding Bond Various Purpose | | 5.00 | 9-1-2023 | 10,730,000 | 10,877,231 |
| California Refunding Bond Various Purpose | | 5.00 | 10-1-2023 | 8,400,000 | 8,532,183 |
| California Refunding Bond Various Purpose | | 5.00 | 8-1-2025 | 3,500,000 | 3,715,898 |
| California Refunding Bond Various Purpose Bidding Group C (BAM Insured) | | 5.00 | 9-1-2027 | 8,500,000 | 9,231,889 |
| Carlsbad CA Unified School District Election 2018 Series B | | 3.00 | 8-1-2031 | 300,000 | 296,968 |
| Carlsbad CA Unified School District Election 2018 Series B | | 3.00 | 8-1-2032 | 350,000 | 343,289 |
| Carlsbad CA Unified School District Election 2018 Series B | | 3.00 | 8-1-2034 | 300,000 | 280,619 |
| Carlsbad CA Unified School District Election 2018 Series B | | 3.00 | 8-1-2035 | 250,000 | 229,573 |
| Carlsbad CA Unified School District Election 2018 Series B | | 3.00 | 8-1-2036 | 350,000 | 313,549 |
| El Monte CA City School District CAB BAN ¤ | | 0.00 | 4-1-2023 | 2,000,000 | 1,981,822 |
| Hayward CA Unified School District Certificate of Participation (AGM Insured) | | 5.00 | 8-1-2023 | 805,000 | 814,597 |
| Inglewood CA Unified School District Election of 2012 Series B (BAM Insured) | | 5.00 | 8-1-2023 | 195,000 | 197,079 |
| Inglewood CA Unified School District Election of 2012 Series B (BAM Insured) | | 5.00 | 8-1-2024 | 150,000 | 154,714 |
| Inglewood CA Unified School District Election of 2012 Series B (BAM Insured) | | 5.00 | 8-1-2025 | 170,000 | 178,877 |
| Inglewood CA Unified School District Election of 2012 Series B (BAM Insured) | | 5.00 | 8-1-2026 | 235,000 | 252,023 |
| Local Public Schools Funding Bond Authority School Facilities Improvement District #2016-1 CA 2020 Election Series B (AGM Insured) | | 3.00 | 8-1-2033 | 225,000 | 213,462 |
The accompanying notes are an integral part of these financial statements.
12 | Allspring California Limited-Term Tax-Free Fund
Portfolio of investments—December 31, 2022 (unaudited)
| | | Interest
rate | Maturity
date | Principal | Value |
| GO revenue (continued) | | | | | |
| Local Public Schools Funding Bond Authority School Facilities Improvement District #2016-1 CA 2020 Election Series B (AGM Insured) | | 3.00% | 8-1-2034 | $ 375,000 | $ 350,773 |
| Local Public Schools Funding Bond Authority School Facilities Improvement District #2016-1 CA 2020 Election Series B (AGM Insured) | | 3.00 | 8-1-2035 | 520,000 | 477,512 |
| Long Beach CA Harbor Revenue AMT Series C | | 5.00 | 5-15-2027 | 500,000 | 526,636 |
| Los Angeles CA Unified School District Series C | | 4.00 | 7-1-2032 | 1,000,000 | 1,072,420 |
| Newman-Crows Landing Unified School District CAB Series 2022 ¤ | | 0.00 | 8-1-2025 | 2,000,000 | 1,832,748 |
| Oak Valley Hospital District Refunding Bond Los Angeles County CA RDA | | 5.00 | 7-1-2023 | 755,000 | 762,226 |
| Oakland CA Unified School District Alameda County | | 5.00 | 8-1-2029 | 10,125,000 | 10,913,142 |
| Oakland CA Unified School District Alameda County Election of 2012 Series A | | 5.00 | 8-1-2024 | 600,000 | 619,698 |
| Oakland CA Unified School District Refunding Bond | | 5.00 | 8-1-2025 | 1,540,000 | 1,627,096 |
| Oakland CA Unified School District Refunding Bond Measure B Series B | | 5.00 | 8-1-2026 | 500,000 | 539,221 |
| Oakland CA Unified School District Refunding Bond Measure J Series C | | 5.00 | 8-1-2025 | 795,000 | 839,962 |
| Palomar CA Pomerado Health CAB Electric Series A (NPFGC Insured) ¤ | | 0.00 | 8-1-2025 | 1,000,000 | 917,767 |
| Pittsburg CA Unified School District (AGM Insured) | | 4.00 | 8-1-2031 | 150,000 | 158,635 |
| Pittsburg CA Unified School District (AGM Insured) | | 4.00 | 8-1-2032 | 250,000 | 263,883 |
| Sacramento CA City Unified School District Election of 2012 Measure Q Series E | | 5.00 | 8-1-2029 | 1,500,000 | 1,640,040 |
| Sacramento CA City Unified School District Election of 2012 Measure Q Series G (AGM Insured) | | 4.00 | 8-1-2030 | 150,000 | 158,541 |
| Sacramento CA City Unified School District Election of 2012 Measure Q Series G (AGM Insured) | | 4.00 | 8-1-2031 | 200,000 | 210,774 |
| Sacramento CA City Unified School District Election of 2012 Measure Q Series G (AGM Insured) | | 4.00 | 8-1-2032 | 200,000 | 210,259 |
| Sacramento CA City Unified School District Election of 2012 Measure Q Series G (AGM Insured) | | 4.00 | 8-1-2033 | 200,000 | 209,001 |
| San Bernardino CA City Unified School District Refunding Bond Series A (AGM Insured) | | 1.25 | 8-1-2029 | 435,000 | 375,368 |
| San Bernardino CA City Unified School District Refunding Bond Series A (AGM Insured) | | 4.00 | 8-1-2031 | 875,000 | 928,796 |
| San Diego CA Unified School District Election of 2018 Series F 2 Green | | 5.00 | 7-1-2024 | 20,000,000 | 20,687,120 |
| San Gorgonio CA Memorial Healthcare District Refunding Bond | | 4.00 | 8-1-2027 | 1,090,000 | 1,042,449 |
| San Gorgonio CA Memorial Healthcare District Refunding Bond | | 4.00 | 8-1-2030 | 580,000 | 540,408 |
| San Gorgonio CA Memorial Healthcare District Refunding Bond | | 5.00 | 8-1-2023 | 1,000,000 | 999,230 |
| Sierra Kings CA Health Care District Refunding Bond | | 4.00 | 8-1-2023 | 405,000 | 406,638 |
| Sierra Kings CA Health Care District Refunding Bond | | 4.00 | 8-1-2024 | 420,000 | 425,358 |
| | | | | | 95,115,124 |
| Health revenue: 11.94% | | | | | |
| California CDA Adventist Health Systems West Series A | | 5.00 | 3-1-2024 | 800,000 | 817,027 |
| California CDA Emanate Health Series A | | 5.00 | 4-1-2028 | 755,000 | 812,760 |
| California CDA Emanate Health Series A | | 5.00 | 4-1-2029 | 795,000 | 861,400 |
| California CDA Health Facilities Catholic Series F (AGM Insured) € | | 3.25 | 7-1-2040 | 1,000,000 | 1,000,000 |
The accompanying notes are an integral part of these financial statements.
Allspring California Limited-Term Tax-Free Fund | 13
Portfolio of investments—December 31, 2022 (unaudited)
| | | Interest
rate | Maturity
date | Principal | Value |
| Health revenue (continued) | | | | | |
| California CDA Henry Mayo Newhall Memorial Hospital Series A (AGM Insured) | | 5.00% | 10-1-2023 | $ 500,000 | $ 506,024 |
| California CDA Huntington Memorial Hospital | | 5.00 | 7-1-2025 | 500,000 | 524,615 |
| California CDA Huntington Memorial Hospital | | 5.00 | 7-1-2026 | 500,000 | 533,718 |
| California CDA Loma Linda University Medical Center Series A 144A | | 5.00 | 12-1-2026 | 250,000 | 258,446 |
| California CDA Loma Linda University Medical Center Series A 144A | | 5.00 | 12-1-2027 | 300,000 | 309,298 |
| California CDA Loma Linda University Medical Center Series A 144A | | 5.00 | 12-1-2028 | 250,000 | 259,019 |
| California HFFA Adventist Health Series A | | 3.00 | 3-1-2041 | 6,275,000 | 6,249,281 |
| California HFFA Adventist Health Series A | | 5.00 | 3-1-2040 | 4,000,000 | 4,348,997 |
| California HFFA Common Spirit Health Series A | | 5.00 | 4-1-2032 | 1,500,000 | 1,631,906 |
| California HFFA El Camino Hospital | | 5.00 | 2-1-2025 | 1,000,000 | 1,042,036 |
| California HFFA On Lok Senior Health Services Series 2020 | | 3.00 | 8-1-2025 | 475,000 | 468,383 |
| California HFFA On Lok Senior Health Services Series 2020 | | 3.00 | 8-1-2028 | 400,000 | 388,668 |
| California HFFA On Lok Senior Health Services Series 2020 | | 3.00 | 8-1-2030 | 210,000 | 202,288 |
| California HFFA Providence St Joseph Health Series B | | 2.00 | 10-1-2036 | 5,000,000 | 4,879,780 |
| California HFFA Stanford Heath Care Series A | | 3.00 | 8-15-2054 | 4,700,000 | 4,693,060 |
| California Municipal Finance Authority Community Medical Centers Series A | | 5.00 | 2-1-2023 | 735,000 | 736,127 |
| California Municipal Finance Authority Community Medical Centers Series A | | 5.00 | 2-1-2024 | 500,000 | 511,905 |
| California Municipal Finance Authority Open Door Community Health | | 4.00 | 9-15-2030 | 790,000 | 847,414 |
| California Municipal Finance Authority Open Door Community Health | | 4.00 | 9-15-2033 | 890,000 | 938,685 |
| California Municipal Finance Authority Revenue Bond Community Medical Centers Series A | | 5.00 | 2-1-2025 | 1,000,000 | 1,030,616 |
| California Municipal Finance Authority Revenue Carmel Valley Manor Project | | 5.00 | 5-15-2024 | 185,000 | 189,985 |
| California Municipal Finance Authority Revenue Carmel Valley Manor Project | | 5.00 | 5-15-2025 | 200,000 | 209,729 |
| California Municipal Finance Authority Revenue Carmel Valley Manor Project | | 5.00 | 5-15-2026 | 185,000 | 197,774 |
| California Municipal Finance Authority Revenue Refunding Bond Channing House Project Series A | | 5.00 | 5-15-2023 | 925,000 | 931,341 |
| California Municipal Finance Authority Revenue Refunding Bond Eisenhower Medical Center Series A | | 5.00 | 7-1-2029 | 400,000 | 423,546 |
| California Municipal Finance Authority Revenue Refunding Bond Paradise Valley Estates Project Series B1 | | 2.25 | 7-1-2025 | 1,860,000 | 1,828,034 |
| California Municipal Finance Authority Revenue Refunding Bond Series A 144A | | 5.00 | 11-1-2029 | 1,170,000 | 1,207,185 |
| California Municipal Finance Authority Revenue Refunding Bonds Eisenhower Medical Center Series A | | 5.00 | 7-1-2027 | 1,650,000 | 1,743,658 |
| California Municipal Finance Authority Senior Living Revenue Bonds Series 2022-B1 | | 2.75 | 11-15-2027 | 520,000 | 466,055 |
| California Municipal Finance Authority Senior Living Revenue Bonds Series 2022-B2 | | 2.13 | 11-15-2026 | 565,000 | 516,185 |
| California PFA Revenue Bond Henry Mayo Newhall Hospital Series A | | 4.00 | 10-15-2028 | 360,000 | 363,965 |
| California PFA Revenue Bond Henry Mayo Newhall Hospital Series B | | 4.00 | 10-15-2051 | 690,000 | 669,674 |
| California PFA Senior Living Revenue Refunding Bond Enso Village Project Series B-2 144A | | 2.38 | 11-15-2028 | 1,000,000 | 916,770 |
The accompanying notes are an integral part of these financial statements.
14 | Allspring California Limited-Term Tax-Free Fund
Portfolio of investments—December 31, 2022 (unaudited)
| | | Interest
rate | Maturity
date | Principal | Value |
| Health revenue (continued) | | | | | |
| California Statewide Communities American Baptist Homes West | | 5.00% | 10-1-2026 | $ 720,000 | $ 746,920 |
| California Statewide Communities American Baptist Homes West | | 5.00 | 10-1-2027 | 1,000,000 | 1,036,160 |
| California Statewide Communities American Baptist Homes West | | 5.00 | 10-1-2028 | 1,125,000 | 1,165,855 |
| Palomar Health Certificate of Participation | | 5.00 | 11-1-2023 | 300,000 | 303,204 |
| Palomar Health Certificate of Participation | | 5.00 | 11-1-2024 | 300,000 | 307,497 |
| Palomar Health Certificate of Participation | | 5.00 | 11-1-2025 | 330,000 | 343,350 |
| Sierra View Local Health Care District Revenue Refunding Bond | | 4.00 | 7-1-2023 | 500,000 | 501,222 |
| Sierra View Local Health Care District Revenue Refunding Bond | | 4.00 | 7-1-2025 | 580,000 | 587,878 |
| Sierra View Local Health Care District Revenue Refunding Bond | | 5.00 | 7-1-2027 | 630,000 | 671,408 |
| Sierra View Local Health Care District Revenue Refunding Bond | | 5.00 | 7-1-2029 | 630,000 | 684,456 |
| Washington Township Health Care District Refunding Bond Series A | | 4.00 | 7-1-2033 | 275,000 | 274,675 |
| Washington Township Health Care District Refunding Bond Series A | | 5.00 | 7-1-2023 | 600,000 | 603,840 |
| Washington Township Health Care District Refunding Bond Series A | | 5.00 | 7-1-2029 | 350,000 | 375,420 |
| Washington Township Health Care District Refunding Bond Series A | | 5.00 | 7-1-2030 | 300,000 | 324,568 |
| Washington Township Health Care District Refunding Bond Series A | | 5.00 | 7-1-2031 | 325,000 | 348,924 |
| | | | | | 51,790,731 |
| Housing revenue: 8.41% | | | | | |
| California CDA Lancer Educational Student Housing Project Series A 144A | | 3.00 | 6-1-2029 | 710,000 | 635,463 |
| California CDA MFHR Refunding Bonds 2021 Series A (Landesbank Hessen-Thüringen LOC) ø | | 3.74 | 3-1-2057 | 10,000,000 | 10,000,000 |
| California CDA Student Housing Revenue Series 2021 (BAM Insured) | | 5.00 | 5-15-2026 | 1,605,000 | 1,708,390 |
| California Enterprise Development Authority Student Housing Revenue Provident Group | | 5.00 | 8-1-2029 | 200,000 | 211,102 |
| California Enterprise Development Authority Student Housing Revenue Provident Group | | 5.00 | 8-1-2030 | 325,000 | 344,088 |
| California HFA Municipal Certificate of Participation Series 2 Class A | | 4.00 | 3-20-2033 | 4,980,978 | 4,808,888 |
| California HFA Municipal Certificate of Participation Series 2021-1 Class A | | 3.50 | 11-20-2035 | 2,923,208 | 2,643,975 |
| California Independent Cities Finance Authority Mobile Home Park Revenue Refunding Bond Union City Tropics | | 4.25 | 5-15-2024 | 745,000 | 755,664 |
| California Municipal Finance Authority Davis I LLC West Village Student Housing Project | | 5.00 | 5-15-2024 | 1,200,000 | 1,219,549 |
| California Municipal Finance Authority Davis I LLC West Village Student Housing Project | | 5.00 | 5-15-2025 | 3,435,000 | 3,527,979 |
| California Municipal Finance Authority Peppertree Senior Apartments Series A (FHLMC Insured, FHLMC LIQ) | | 2.80 | 6-1-2023 | 2,500,000 | 2,497,532 |
| California Municipal Finance Authority Revenue Green Bond Orchard Park Student Housing Project (BAM Insured) | | 4.00 | 5-15-2032 | 700,000 | 710,270 |
| California Municipal Finance Authority Revenue Green Bond Orchard Park Student Housing Project (BAM Insured) | | 5.00 | 5-15-2029 | 400,000 | 434,688 |
The accompanying notes are an integral part of these financial statements.
Allspring California Limited-Term Tax-Free Fund | 15
Portfolio of investments—December 31, 2022 (unaudited)
| | | Interest
rate | Maturity
date | Principal | Value |
| Housing revenue (continued) | | | | | |
| California Municipal Finance Authority Revenue Green Bond Orchard Park Student Housing Project (BAM Insured) | | 5.00% | 5-15-2030 | $ 450,000 | $ 492,063 |
| California Municipal Finance Authority Revenue Green Bond Orchard Park Student Housing Project (BAM Insured) | | 5.00 | 5-15-2031 | 400,000 | 439,992 |
| FHLMC Multifamily Certificate of Participation Series M 057 Class A | | 2.40 | 10-15-2029 | 5,975,000 | 5,654,753 |
| Sacramento CA Housing Authority MFHR (FNMA Insured, FNMA LIQ) ø | | 3.14 | 7-15-2029 | 405,000 | 405,000 |
| | | | | | 36,489,396 |
| Industrial development revenue: 0.71% | | | | | |
| San Francisco CA City & County Airports Commission International Airport Revenue AMT Special Facilities Lease SFO Fuel Company Series 2019A | | 5.00 | 1-1-2025 | 3,000,000 | 3,088,579 |
| Miscellaneous revenue: 10.55% | | | | | |
| California CDA Community Infrastructure Program Revenue Series A | | 4.00 | 9-2-2027 | 390,000 | 386,379 |
| California CDA Community Infrastructure Program Revenue Series A | | 4.00 | 9-2-2028 | 260,000 | 256,944 |
| California CDA Monterey County Savers Bond Program (BAM Insured) | | 5.00 | 8-1-2027 | 2,185,000 | 2,358,234 |
| California HFA Revenue Bonds (San Francisco Supportive Housing -833 Bryant Apartments) 2020 Issue N- Social Bonds | | 5.00 | 4-1-2029 | 630,000 | 704,330 |
| California HFA Revenue Bonds (San Francisco Supportive Housing -833 Bryant Apartments) 2020 Issue N- Social Bonds | | 5.00 | 4-1-2031 | 730,000 | 830,773 |
| California Infrastructure & Economic Development Bank J Paul Getty Trust Series 2021-B2 | | 3.00 | 10-1-2047 | 11,390,000 | 11,411,906 |
| California Infrastructure & Economic Development Bank Lease Revenue California Teachers Retirement | | 5.00 | 8-1-2027 | 400,000 | 438,978 |
| California Municipal Finance Authority Revenue Refunding Bond Southwestern Law School | | 4.00 | 11-1-2031 | 175,000 | 172,025 |
| California Municipal Finance Authority Revenue Refunding Bond Southwestern Law School | | 5.00 | 11-1-2026 | 275,000 | 286,979 |
| California Municipal Finance Authority Revenue Refunding Bond Southwestern Law School | | 5.00 | 11-1-2027 | 290,000 | 304,784 |
| California Municipal Finance Authority Revenue Refunding Bond Southwestern Law School | | 5.00 | 11-1-2028 | 200,000 | 211,511 |
| California Municipal Finance Authority Revenue Refunding Bond Southwestern Law School | | 5.00 | 11-1-2029 | 210,000 | 223,164 |
| California Municipal Finance Authority Revenue Refunding Bond Southwestern Law School | | 5.00 | 11-1-2030 | 220,000 | 234,669 |
| California Public Works Board Department of Corrections & Rehabilitation Series D | | 5.00 | 9-1-2025 | 1,160,000 | 1,204,320 |
| Compton CA PFA Refunding Bond 144A | | 4.00 | 9-1-2027 | 2,000,000 | 1,953,372 |
| Desert Sands Unified School District Certificate of Participation (BAM Insured) | | 5.00 | 3-1-2024 | 1,500,000 | 1,534,856 |
| El Centro CA Financing Authority Lease Revenue Refunding Bond Transportation Improvements Series B | | 4.00 | 10-1-2026 | 140,000 | 144,653 |
| El Centro CA Financing Authority Lease Revenue Refunding Bond Transportation Improvements Series B | | 4.00 | 10-1-2027 | 365,000 | 378,831 |
| El Centro CA Financing Authority Lease Revenue Refunding Bond Transportation Improvements Series B | | 4.00 | 10-1-2028 | 255,000 | 266,501 |
The accompanying notes are an integral part of these financial statements.
16 | Allspring California Limited-Term Tax-Free Fund
Portfolio of investments—December 31, 2022 (unaudited)
| | | Interest
rate | Maturity
date | Principal | Value |
| Miscellaneous revenue (continued) | | | | | |
| El Centro CA Financing Authority Lease Revenue Refunding Bond Transportation Improvements Series B | | 4.00% | 10-1-2029 | $ 265,000 | $ 279,959 |
| El Centro CA Financing Authority Lease Revenue Refunding Bond Transportation Improvements Series B | | 4.00 | 10-1-2030 | 275,000 | 291,287 |
| El Centro CA Financing Authority Lease Revenue Refunding Bond Transportation Improvements Series B | | 4.00 | 10-1-2031 | 285,000 | 302,437 |
| Independent Cities Finance Authority California Sales Tax Revenue (AGM Insured) 144A | | 4.00 | 6-1-2028 | 500,000 | 516,819 |
| Independent Cities Finance Authority California Sales Tax Revenue (AGM Insured) 144A | | 4.00 | 6-1-2030 | 550,000 | 570,077 |
| Irvine CA Limited Obligation Improvement Bonds Reassessment District #15-2 | | 5.00 | 9-2-2023 | 800,000 | 806,877 |
| Irvine CA Limited Obligation Improvement Bonds Reassessment District #15-2 | | 5.00 | 9-2-2024 | 850,000 | 870,124 |
| Irvine CA Limited Obligation Improvement Reassessment District | | 4.00 | 9-2-2029 | 1,220,000 | 1,271,300 |
| Irvine CA Limited Obligation Improvement Reassessment District (BAM Insured) | | 4.00 | 9-2-2033 | 270,000 | 279,123 |
| Lassen Municipal Utility District Certificate of Participation | | 4.00 | 5-1-2029 | 485,000 | 495,632 |
| Lassen Municipal Utility District Certificate of Participation | | 4.00 | 5-1-2030 | 505,000 | 513,788 |
| Lassen Municipal Utility District Certificate of Participation | | 4.00 | 5-1-2031 | 525,000 | 531,941 |
| Lassen Municipal Utility District Certificate of Participation | | 4.00 | 5-1-2032 | 550,000 | 553,014 |
| Lassen Municipal Utility District Certificate of Participation | | 4.00 | 5-1-2033 | 570,000 | 572,584 |
| Lassen Municipal Utility District Certificate of Participation | | 4.00 | 5-1-2034 | 595,000 | 598,338 |
| Lodi CA PFA Electric Revenue Refunding Bond (AGM Insured) | | 5.00 | 9-1-2024 | 1,100,000 | 1,137,491 |
| Los Angeles CA Municipal Improvement Corporation Lease Revenue Series C | | 5.00 | 11-1-2030 | 2,340,000 | 2,726,512 |
| Los Angeles CA Public Works Series D | | 5.00 | 12-1-2027 | 1,605,000 | 1,717,683 |
| Mountain House California PFA Utility System Revenue Refunding Bond | | 5.00 | 12-1-2029 | 520,000 | 564,717 |
| Mountain House California PFA Utility System Revenue Refunding Bond | | 5.00 | 12-1-2030 | 710,000 | 765,841 |
| Mountain House California PFA Utility System Revenue Refunding Bond | | 5.00 | 12-1-2031 | 745,000 | 797,188 |
| Sacramento CA City Schools Joint Powers Financing Authority Series A (BAM Insured) | | 5.00 | 3-1-2023 | 815,000 | 817,281 |
| San Joaquin CA Area Flood Control Agency Smith Canal Area Assessment District Assessment Revenue (AGM Insured) | | 5.00 | 10-1-2025 | 250,000 | 263,945 |
| San Joaquin CA Area Flood Control Agency Smith Canal Area Assessment District Assessment Revenue (AGM Insured) | | 5.00 | 10-1-2027 | 350,000 | 382,962 |
| San Joaquin CA Area Flood Control Agency Smith Canal Area Assessment District Assessment Revenue (AGM Insured) | | 5.00 | 10-1-2029 | 380,000 | 429,230 |
| Santa Barbara County CA Solid Waste System Revenue Certificate of Participation AMT Series B | | 5.00 | 12-1-2029 | 600,000 | 659,291 |
| Sutter Butte Flood Control Agency Assessment (BAM Insured) | | 5.00 | 10-1-2023 | 1,280,000 | 1,300,142 |
| Sutter Butte Flood Control Agency Assessment (BAM Insured) | | 5.00 | 10-1-2024 | 715,000 | 742,588 |
| Sutter Butte Flood Control Agency Assessment (BAM Insured) | | 5.00 | 10-1-2025 | 1,575,000 | 1,671,410 |
| | | | | | 45,732,790 |
The accompanying notes are an integral part of these financial statements.
Allspring California Limited-Term Tax-Free Fund | 17
Portfolio of investments—December 31, 2022 (unaudited)
| | | Interest
rate | Maturity
date | Principal | Value |
| Tax revenue: 11.02% | | | | | |
| California Community Facilities District #2015-01 | | 5.00% | 9-1-2027 | $ 335,000 | $ 349,248 |
| Cathedral City CA RDA Refunding Bond Merged Redevelopment Project Series A | | 5.00 | 8-1-2023 | 1,735,000 | 1,756,282 |
| Cathedral City CA RDA Refunding Bond Merged Redevelopment Project Series A (AGM Insured) | | 5.00 | 8-1-2024 | 1,770,000 | 1,821,484 |
| Cathedral City CA RDA Successor Agency Tax Allocation Revenue Refunding Bond Subordinated Merged Redevelopment Project Area (BAM Insured) | | 4.00 | 8-1-2027 | 580,000 | 601,366 |
| Cathedral City CA RDA Successor Agency Tax Allocation Revenue Refunding Bond Subordinated Merged Redevelopment Project Area (BAM Insured) | | 4.00 | 8-1-2029 | 500,000 | 524,428 |
| Cathedral City CA RDA Successor Agency Tax Allocation Revenue Refunding Bond Subordinated Merged Redevelopment Project Area (BAM Insured) | | 4.00 | 8-1-2031 | 600,000 | 631,497 |
| Chino CA PFA Local Agency Series A (AGM Insured) | | 5.00 | 9-1-2024 | 660,000 | 680,868 |
| Commerce CA Successor Agency to the Community Development Commission Refunding Bond Series A (AGM Insured) | | 5.00 | 8-1-2023 | 600,000 | 606,397 |
| Compton CA Community Redevelopment Agency Successor Agency Tax Allocation Refunding Bond Series A (AGM Insured) | | 5.00 | 8-1-2025 | 4,095,000 | 4,276,697 |
| Fairfield CA RDA Successor Agency Tax Allocation Refunding Bond | | 5.00 | 8-1-2023 | 1,025,000 | 1,036,985 |
| Fontana CA Special Tax Community Facilities District #90 Summit | | 3.00 | 9-1-2025 | 110,000 | 106,752 |
| Fontana CA Special Tax Community Facilities District #90 Summit | | 4.00 | 9-1-2026 | 110,000 | 110,800 |
| Fontana CA Special Tax Community Facilities District #90 Summit | | 4.00 | 9-1-2027 | 125,000 | 125,998 |
| Fontana CA Special Tax Community Facilities District #90 Summit | | 4.00 | 9-1-2028 | 255,000 | 256,985 |
| Fontana CA Special Tax Community Facilities District #90 Summit | | 4.00 | 9-1-2030 | 140,000 | 139,651 |
| Fontana CA Special Tax Community Facilities District #90 Summit | | 4.00 | 9-1-2032 | 300,000 | 297,275 |
| Fremont CA Community Facilities District | | 5.00 | 9-1-2024 | 1,000,000 | 1,025,084 |
| Hollister CA RDA Refunding Bond Hollister Community Development Project (BAM Insured) | | 5.00 | 10-1-2026 | 700,000 | 727,735 |
| Inglewood CA Redevelopment Refunding Bond Subordinate Lien Merged Redevelopment Project (BAM Insured) | | 5.00 | 5-1-2025 | 1,000,000 | 1,044,582 |
| Irwindale CA CDA City Industrial Development Project (AGM Insured) | | 5.00 | 7-15-2023 | 375,000 | 379,040 |
| Lancaster CA RDA Refunding Bond Combined Redevelopment Project Areas (AGM Insured) | | 5.00 | 8-1-2024 | 870,000 | 895,306 |
| Lancaster CA RDA Refunding Bond Combined Redevelopment Project Areas (AGM Insured) | | 5.00 | 8-1-2029 | 400,000 | 429,864 |
| Lincoln CA Special Tax Refunding Bond Community Facilities District #2003-1 Lincoln Crossing Project | | 4.00 | 9-1-2024 | 600,000 | 609,342 |
| Lincoln CA Special Tax Refunding Bond Community Facilities District #2003-1 Lincoln Crossing Project | | 5.00 | 9-1-2025 | 550,000 | 577,965 |
| Oakdale CA Successor Agency to Oakdale Community RDA Series A (AGM Insured) | | 5.00 | 6-1-2027 | 350,000 | 381,118 |
| Orange County CA Community Facilities #2015-1 Esencia Village Series A | | 5.00 | 8-15-2023 | 365,000 | 367,966 |
| Orange County CA Community Facilities #2015-1 Esencia Village Series A | | 5.00 | 8-15-2025 | 325,000 | 337,415 |
The accompanying notes are an integral part of these financial statements.
18 | Allspring California Limited-Term Tax-Free Fund
Portfolio of investments—December 31, 2022 (unaudited)
| | | Interest
rate | Maturity
date | Principal | Value |
| Tax revenue (continued) | | | | | |
| Pittsburg CA Successor Agency of Los Medanos Community Development (AGM Insured) | | 5.00% | 8-1-2023 | $ 780,000 | $ 788,540 |
| Poway CA Unified School District PFA Series B (BAM Insured) | | 5.00 | 9-1-2024 | 1,115,000 | 1,154,839 |
| Poway CA Unified School District PFA Series B (BAM Insured) | | 5.00 | 9-1-2025 | 775,000 | 822,978 |
| River Islands PFA California Special Tax Refunding Bond Community Facilities District #2003 1 (AGM Insured) | | 5.00 | 9-1-2026 | 130,000 | 139,621 |
| River Islands PFA California Special Tax Refunding Bond Community Facilities District #2003 1 (AGM Insured) | | 5.00 | 9-1-2027 | 225,000 | 245,130 |
| River Islands PFA California Special Tax Refunding Bond Community Facilities District #2003 1 (AGM Insured) | | 5.00 | 9-1-2028 | 200,000 | 221,272 |
| River Islands PFA California Special Tax Refunding Bond Community Facilities District #2003 1 (AGM Insured) | | 5.00 | 9-1-2029 | 200,000 | 224,085 |
| River Islands PFA California Special Tax Refunding Bond Community Facilities District #2003 1 (AGM Insured) | | 5.00 | 9-1-2030 | 325,000 | 368,039 |
| River Islands PFA Special Tax Communities Facilities District #2021-1 | | 4.00 | 9-1-2030 | 200,000 | 197,814 |
| River Islands PFA Special Tax Communities Facilities District #2021-1 | | 4.00 | 9-1-2031 | 500,000 | 491,867 |
| Riverside CA PFA Local Measure Certificate of Participation Riverside Pavement Rehabilitation Project (AGM Insured) | | 5.00 | 6-1-2023 | 845,000 | 852,161 |
| Roseville CA Finance Authority Special Refunding Bond Series A | | 5.00 | 9-1-2023 | 400,000 | 405,567 |
| Roseville CA Finance Authority Special Refunding Bond Series A | | 5.00 | 9-1-2029 | 300,000 | 330,400 |
| Roseville CA Special Tax Refunding Bond Fiddyment Ranch Community | | 5.00 | 9-1-2024 | 1,905,000 | 1,952,785 |
| Roseville CA Special Tax Refunding Bond Fiddyment Ranch Community | | 5.00 | 9-1-2029 | 1,595,000 | 1,699,685 |
| Sacramento CA Transient Occupancy Tax Revenue Convention Center Complex Senior | | 5.00 | 6-1-2027 | 575,000 | 620,938 |
| San Francisco CA City & County Community Facilities District #2016-1 Improvement Area #1 Special Tax Treasure Island | | 4.00 | 9-1-2032 | 350,000 | 346,271 |
| San Francisco CA City & County Community Facilities District #2016-1 Improvement Area #1 Special Tax Treasure Island | | 4.00 | 9-1-2033 | 865,000 | 850,018 |
| San Francisco CA City & County Community Facilities District #2016-1 Improvement Area #1 Special Tax Treasure Island | | 4.00 | 9-1-2034 | 700,000 | 683,457 |
| San Francisco CA City & County Improvement Area #2 Community Facilities District Series 2022 A 144A | | 4.00 | 9-1-2032 | 1,150,000 | 1,137,746 |
| San Francisco CA City & County Infrastructure & Revitalization Financing District #1 Facilities Increment Series A 144A | | 5.00 | 9-1-2027 | 500,000 | 519,086 |
| San Francisco CA City & County RDA Successor Agency to Community Facilities District #6 Mission Bay South Series A | | 5.00 | 8-1-2025 | 1,600,000 | 1,601,807 |
| San Pablo CA RDA Series B (AGM Insured) | | 5.00 | 6-15-2023 | 1,945,000 | 1,960,797 |
| Santaluz Community Facilities District #2 CA Special Tax Refunding Bond Improvement Area #1 | | 4.00 | 9-1-2030 | 435,000 | 456,776 |
| Stockton CA RDA Refunding Bond Series A (AGM Insured) | | 5.00 | 9-1-2025 | 1,675,000 | 1,761,044 |
| Successor Agency to the Richmond Community RDA Series A (BAM Insured) | | 4.00 | 9-1-2027 | 1,150,000 | 1,201,545 |
The accompanying notes are an integral part of these financial statements.
Allspring California Limited-Term Tax-Free Fund | 19
Portfolio of investments—December 31, 2022 (unaudited)
| | | Interest
rate | Maturity
date | Principal | Value |
| Tax revenue (continued) | | | | | |
| Successor Agency to the Richmond Community RDA Series A (BAM Insured) | | 4.50% | 9-1-2025 | $ 160,000 | $ 164,097 |
| Successor Agency to the Richmond Community RDA Series A (BAM Insured) | | 5.00 | 9-1-2023 | 265,000 | 268,202 |
| Successor Agency to the Richmond Community RDA Series A (BAM Insured) | | 5.00 | 9-1-2025 | 150,000 | 155,097 |
| Successor Agency to the Riverside County RDA Desert Communities Project Series D | | 5.00 | 10-1-2023 | 470,000 | 476,528 |
| Successor Agency to the Riverside County RDA Project Area #1 Series A | | 5.00 | 10-1-2023 | 460,000 | 466,389 |
| Tracy CA Community Facilities District Special Tax Bonds | | 4.00 | 9-1-2024 | 135,000 | 135,235 |
| Tracy CA Community Facilities District Special Tax Bonds | | 4.00 | 9-1-2025 | 155,000 | 155,715 |
| Tracy CA Community Facilities District Special Tax Bonds | | 5.00 | 9-1-2028 | 425,000 | 451,047 |
| Transbay Joint Powers Authority Green Tax Allocation Bond Senior Series A | | 5.00 | 10-1-2029 | 500,000 | 546,492 |
| Transbay Joint Powers Authority Green Tax Allocation Bond Senior Series A | | 5.00 | 10-1-2030 | 500,000 | 547,987 |
| Transbay Joint Powers Authority Green Tax Allocation Bond Senior Series A | | 5.00 | 10-1-2031 | 400,000 | 436,225 |
| Tustin CA Community Facilities District #6-1 Legacy Columbus Villages Series A | | 5.00 | 9-1-2025 | 1,000,000 | 1,048,494 |
| Upland CA Successor Agency to Merged Project Tax Allocation Bond (AGM Insured) | | 5.00 | 9-1-2023 | 1,000,000 | 1,012,737 |
| Yuba City CA RDA Refunding Bond (AGM Insured) | | 5.00 | 9-1-2025 | 750,000 | 788,527 |
| | | | | | 47,785,170 |
| Tobacco revenue: 1.72% | | | | | |
| California County Tobacco Securitization Agency (Sonoma County Securitization Corporation) Tobacco Settlement Bonds Series 2020A | | 5.00 | 6-1-2029 | 950,000 | 1,005,404 |
| California County Tobacco Securitization Agency (Sonoma County Securitization Corporation) Tobacco Settlement Bonds Series 2020A | | 5.00 | 6-1-2030 | 200,000 | 212,575 |
| California County Tobacco Securitization Agency (Sonoma County Securitization Corporation) Tobacco Settlement Bonds Series 2020A | | 5.00 | 6-1-2031 | 225,000 | 238,864 |
| California County Tobacco Securitization Agency (Sonoma County Securitization Corporation) Tobacco Settlement Bonds Series 2020A | | 5.00 | 6-1-2032 | 250,000 | 264,711 |
| California County Tobacco Securitization Agency Tobacco Settlement Senior Refunding Bond Series A | | 5.00 | 6-1-2030 | 450,000 | 478,294 |
| California County Tobacco Securitization Agency Tobacco Settlement Senior Refunding Bond Series A | | 5.00 | 6-1-2031 | 550,000 | 582,051 |
| California County Tobacco Securitization Agency Tobacco Settlement Senior Refunding Bond Series A | | 5.00 | 6-1-2032 | 300,000 | 316,697 |
| Golden State Tobacco Securitization Corporation California Tobacco Settlement Refunding Bond Series A-1 | | 5.00 | 6-1-2026 | 3,000,000 | 3,256,550 |
| Golden State Tobacco Securitization Corporation California Tobacco Settlement Refunding Bond Series A-1 | | 5.00 | 6-1-2028 | 1,000,000 | 1,106,856 |
| | | | | | 7,462,002 |
| Transportation revenue: 1.04% | | | | | |
| Bay Area Toll Authority Toll Bridge Revenue Francisco Bay Area Series E (SIFMA Municipal Swap +0.41%) ± | | 4.07 | 4-1-2056 | 1,500,000 | 1,454,684 |
| Sacramento CA Regional Transit District Revenue Refunding Bond Series A | | 5.00 | 3-1-2031 | 410,000 | 476,146 |
The accompanying notes are an integral part of these financial statements.
20 | Allspring California Limited-Term Tax-Free Fund
Portfolio of investments—December 31, 2022 (unaudited)
| | | Interest
rate | Maturity
date | Principal | Value |
| Transportation revenue (continued) | | | | | |
| Sacramento CA Regional Transit District Revenue Refunding Bond Series A | | 5.00% | 3-1-2033 | $ 1,425,000 | $ 1,641,403 |
| San Joaquin CA Transportation Corridor Agency Toll Road Revenue Refunding Bond Senior Lien Series A | | 5.00 | 1-15-2030 | 865,000 | 946,134 |
| | | | | | 4,518,367 |
| Utilities revenue: 7.07% | | | | | |
| California CDA PCR Refunding Bond Southern California Edison Company Series A | | 1.75 | 9-1-2029 | 1,500,000 | 1,237,203 |
| California Community Choice Financing Authority Clean Energy Project Revenue Series B 2 Green Buildings (SIFMA Municipal Swap +0.45%) ± | | 4.11 | 2-1-2052 | 6,300,000 | 5,686,555 |
| California Community Choice Financing Authority Clean Energy Project Revenue Series 2021-A | | 4.00 | 10-1-2052 | 11,650,000 | 11,693,886 |
| California Community Choice Financing Authority Clean Energy Project Revenue Series A 1 | | 4.00 | 2-1-2027 | 2,290,000 | 2,315,146 |
| California Community Choice Financing Authority Clean Energy Project Revenue Series A 1 | | 4.00 | 2-1-2028 | 2,810,000 | 2,827,538 |
| California Community Choice Financing Authority Clean Energy Project Revenue Series A 1 %% | | 5.00 | 12-1-2053 | 6,000,000 | 6,252,597 |
| Vernon CA Electric System Series A | | 5.00 | 8-1-2026 | 600,000 | 626,214 |
| | | | | | 30,639,139 |
| Water & sewer revenue: 1.23% | | | | | |
| Lower Tule River Irrigation District Revenue Refunding Bond Series A | | 5.00 | 8-1-2027 | 680,000 | 741,065 |
| Lower Tule River Irrigation District Revenue Refunding Bond Series A | | 5.00 | 8-1-2031 | 700,000 | 797,149 |
| Middle Fork Project Finance Authority Revenue Refunding Bond | | 5.00 | 4-1-2029 | 3,525,000 | 3,811,202 |
| | | | | | 5,349,416 |
| | | | | | 398,638,863 |
| Guam: 1.19% | | | | | |
| Airport revenue: 0.30% | | | | | |
| Guam Port Authority AMT Series B | | 5.00 | 7-1-2023 | 540,000 | 542,670 |
| Guam Port Authority AMT Series B | | 5.00 | 7-1-2024 | 750,000 | 762,647 |
| | | | | | 1,305,317 |
| Miscellaneous revenue: 0.89% | | | | | |
| Guam Education Financing Foundation Certificate of Participation Refunding Bond Series A | | 5.00 | 10-1-2023 | 3,840,000 | 3,852,336 |
| | | | | | 5,157,653 |
| Illinois: 2.87% | | | | | |
| Miscellaneous revenue: 2.35% | | | | | |
| Illinois Refunding Bond | | 5.00 | 2-1-2025 | 10,000,000 | 10,204,916 |
The accompanying notes are an integral part of these financial statements.
Allspring California Limited-Term Tax-Free Fund | 21
Portfolio of investments—December 31, 2022 (unaudited)
| | | Interest
rate | Maturity
date | Principal | Value |
| Tax revenue: 0.52% | | | | | |
| Metropolitan Pier & Exposition Authority McCormick Place Expansion Project Series B | | 5.00% | 12-15-2025 | $ 650,000 | $ 664,416 |
| Sales Tax Securitization Corporation Series 2017A | | 5.00 | 1-1-2026 | 1,500,000 | 1,582,137 |
| | | | | | 2,246,553 |
| | | | | | 12,451,469 |
| New York: 1.27% | | | | | |
| Airport revenue: 0.10% | | | | | |
| New York Transportation Development Corporation Special Facilities Revenue Terminal 4 John F Kennedy International Airport | | 5.00 | 12-1-2032 | 400,000 | 423,151 |
| Industrial development revenue: 1.17% | | | | | |
| New York Transportation Development Corporation Special Facilities Revenue Delta Air Lines Incorporated LaGuardia Airport Terminals C&D Redevelopment | | 5.00 | 1-1-2029 | 5,000,000 | 5,097,140 |
| | | | | | 5,520,291 |
| Texas: 0.69% | | | | | |
| Industrial development revenue: 0.69% | | | | | |
| Houston TX Airport System AMT Revenue Refunding Bond United Airlines Incorporated Terminal E Project | | 5.00 | 7-1-2029 | 3,000,000 | 3,006,386 |
| Total Municipal obligations (Cost $439,852,552) | | | | | 424,774,662 |
| | | Yield | | Shares | |
| Short-term investments: 1.25% | | | | | |
| Investment companies: 1.25% | | | | | |
| Allspring Municipal Cash Management Money Market Fund Institutional Class ♠∞## | | 3.56 | | 5,427,901 | 5,428,987 |
| Total Short-term investments (Cost $5,428,987) | | | | | 5,428,987 |
| Total investments in securities (Cost $450,681,539) | 100.44% | | | | 435,603,649 |
| Other assets and liabilities, net | (0.44) | | | | (1,909,292) |
| Total net assets | 100.00% | | | | $433,694,357 |
| 144A | The security may be resold in transactions exempt from registration, normally to qualified institutional buyers, pursuant to Rule 144A under the Securities Act of 1933. |
| ø | Variable rate demand notes are subject to a demand feature which reduces the effective maturity. The maturity date shown represents the final maturity date of the security. The interest rate is determined and reset by the issuer daily, weekly, or monthly depending upon the terms of the security. The rate shown is the rate in effect at period end. |
| ± | Variable rate investment. The rate shown is the rate in effect at period end. |
| øø | The interest rate is determined and reset by the issuer periodically depending upon the terms of the security. The rate shown is the rate in effect at period end. |
| ## | All or a portion of this security is segregated for when-issued securities. |
| ¤ | The security is issued in zero coupon form with no periodic interest payments. |
| € | The security is an auction-rate security which has an interest rate that resets at predetermined short-term intervals through a Dutch auction. The rate shown is the rate in effect at period end. |
| ♠ | The issuer of the security is an affiliated person of the Fund as defined in the Investment Company Act of 1940. |
| ∞ | The rate represents the 7-day annualized yield at period end. |
| %% | The security is purchased on a when-issued basis. |
The accompanying notes are an integral part of these financial statements.
22 | Allspring California Limited-Term Tax-Free Fund
Portfolio of investments—December 31, 2022 (unaudited)
| Abbreviations: |
| AGM | Assured Guaranty Municipal |
| AMT | Alternative minimum tax |
| BAM | Build America Mutual Assurance Company |
| BAN | Bond anticipation notes |
| CAB | Capital appreciation bond |
| CDA | Community Development Authority |
| FHLMC | Federal Home Loan Mortgage Corporation |
| FNMA | Federal National Mortgage Association |
| GO | General obligation |
| HFA | Housing Finance Authority |
| HFFA | Health Facilities Financing Authority |
| LIQ | Liquidity agreement |
| LOC | Letter of credit |
| MFHR | Multifamily housing revenue |
| NPFGC | National Public Finance Guarantee Corporation |
| PCR | Pollution control revenue |
| PFA | Public Finance Authority |
| RDA | Redevelopment Authority |
| SIFMA | Securities Industry and Financial Markets Association |
Investments in affiliates
An affiliated investment is an investment in which the Fund owns at least 5% of the outstanding voting shares of the issuer or as a result of other relationships, such as the Fund and the issuer having the same investment manager. Transactions with issuers that were affiliates of the Fund at the end of the period were as follows:
| | Value,
beginning of
period | Purchases | Sales
proceeds | Net
realized
gains
(losses) | Net
change in
unrealized
gains
(losses) | Value,
end of
period | Shares,
end
of period | Income
from
affiliated
securities |
| Short-term investments | | | | | | | |
| Allspring Municipal Cash Management Money Market Fund Institutional Class | $26,507,817 | $219,541,118 | $(240,607,548) | $(11,349) | $(1,051) | $5,428,987 | 5,427,901 | $224,928 |
The accompanying notes are an integral part of these financial statements.
Allspring California Limited-Term Tax-Free Fund | 23
Statement of assets and liabilities—December 31, 2022 (unaudited)
| | |
| Assets | |
Investments in unaffiliated securities, at value (cost $445,252,552)
| $ 430,174,662 |
Investments in affiliated securities, at value (cost $5,428,987)
| 5,428,987 |
Cash
| 24 |
Receivable for interest
| 5,135,333 |
Receivable for Fund shares sold
| 842,431 |
Prepaid expenses and other assets
| 45,964 |
Total assets
| 441,627,401 |
| Liabilities | |
Payable for when-issued transactions
| 6,255,540 |
Payable for Fund shares redeemed
| 1,164,025 |
Dividends payable
| 262,770 |
Management fee payable
| 137,394 |
Administration fees payable
| 41,624 |
Trustees’ fees and expenses payable
| 1,877 |
Distribution fee payable
| 1,797 |
Accrued expenses and other liabilities
| 68,017 |
Total liabilities
| 7,933,044 |
Total net assets
| $433,694,357 |
| Net assets consist of | |
Paid-in capital
| $ 463,045,979 |
Total distributable loss
| (29,351,622) |
Total net assets
| $433,694,357 |
| Computation of net asset value and offering price per share | |
Net assets – Class A
| $ 104,529,431 |
Shares outstanding – Class A1
| 10,470,652 |
Net asset value per share – Class A
| $9.98 |
Maximum offering price per share – Class A2
| $10.18 |
Net assets – Class C
| $ 2,611,360 |
Shares outstanding – Class C1
| 261,600 |
Net asset value per share – Class C
| $9.98 |
Net assets – Administrator Class
| $ 66,813,087 |
Shares outstanding – Administrator Class1
| 6,796,501 |
Net asset value per share – Administrator Class
| $9.83 |
Net assets – Institutional Class
| $ 259,740,479 |
Shares outstanding – Institutional Class1
| 26,428,372 |
Net asset value per share – Institutional Class
| $9.83 |
| 1 | The Fund has an unlimited number of authorized shares. |
| 2 | Maximum offering price is computed as 100/98 of net asset value. On investments of $100,000 or more, the offering price is reduced. |
The accompanying notes are an integral part of these financial statements.
24 | Allspring California Limited-Term Tax-Free Fund
Statement of operations—six months ended December 31, 2022 (unaudited)
| | |
| Investment income | |
Interest
| $ 6,357,054 |
Income from affiliated securities
| 224,928 |
Total investment income
| 6,581,982 |
| Expenses | |
Management fee
| 1,016,945 |
| Administration fees | |
Class A
| 85,779 |
Class C
| 2,496 |
Administrator Class
| 27,665 |
Institutional Class
| 137,568 |
| Shareholder servicing fees | |
Class A
| 133,695 |
Class C
| 3,885 |
Administrator Class
| 69,142 |
| Distribution fee | |
Class C
| 11,655 |
Custody and accounting fees
| 13,480 |
Professional fees
| 32,228 |
Registration fees
| 29,565 |
Shareholder report expenses
| 13,725 |
Trustees’ fees and expenses
| 11,158 |
Other fees and expenses
| 5,044 |
Total expenses
| 1,594,030 |
| Less: Fee waivers and/or expense reimbursements | |
Fund-level
| (52,269) |
Class A
| (16,042) |
Class C
| (306) |
Administrator Class
| (46,578) |
Net expenses
| 1,478,835 |
Net investment income
| 5,103,147 |
| Realized and unrealized gains (losses) on investments | |
| Net realized losses on | |
Unaffiliated securities
| (1,701,635) |
Affiliated securities
| (11,349) |
Net realized losses on investments
| (1,712,984) |
| Net change in unrealized gains (losses) on | |
Unaffiliated securities
| (2,852,143) |
Affiliated securities
| (1,051) |
Net change in unrealized gains (losses) on investments
| (2,853,194) |
Net realized and unrealized gains (losses) on investments
| (4,566,178) |
Net increase in net assets resulting from operations
| $ 536,969 |
The accompanying notes are an integral part of these financial statements.
Allspring California Limited-Term Tax-Free Fund | 25
Statement of changes in net assets
| | | | | |
| | Six months ended
December 31, 2022
(unaudited) | Year ended
June 30, 2022 |
| Operations | | | | |
Net investment income
| | $ 5,103,147 | | $ 8,592,270 |
Net realized losses on investments
| | (1,712,984) | | (3,552,858) |
Net change in unrealized gains (losses) on investments
| | (2,853,194) | | (31,547,062) |
Net increase (decrease) in net assets resulting from operations
| | 536,969 | | (26,507,650) |
| Distributions to shareholders from | | | | |
| Net investment income and net realized gains | | | | |
Class A
| | (967,095) | | (1,417,298) |
Class C
| | (16,001) | | (31,263) |
Administrator Class
| | (562,510) | | (523,074) |
Institutional Class
| | (3,558,599) | | (6,623,021) |
Total distributions to shareholders
| | (5,104,205) | | (8,594,656) |
| Capital share transactions | Shares | | Shares | |
| Proceeds from shares sold | | | | |
Class A
| 4,127,452 | 41,549,114 | 1,227,534 | 13,008,495 |
Class C
| 6,444 | 64,497 | 33,146 | 337,374 |
Administrator Class
| 4,339,024 | 42,698,487 | 605,760 | 6,178,113 |
Institutional Class
| 9,572,065 | 93,948,074 | 27,358,468 | 278,656,194 |
| | | 178,260,172 | | 298,180,176 |
| Reinvestment of distributions | | | | |
Class A
| 90,329 | 897,780 | 123,975 | 1,295,806 |
Class C
| 1,557 | 15,491 | 2,931 | 30,594 |
Administrator Class
| 56,665 | 554,013 | 50,858 | 522,681 |
Institutional Class
| 222,369 | 2,178,997 | 401,807 | 4,129,632 |
| | | 3,646,281 | | 5,978,713 |
| Payment for shares redeemed | | | | |
Class A
| (2,212,787) | (22,049,217) | (2,790,407) | (29,285,529) |
Class C
| (120,399) | (1,202,061) | (169,911) | (1,775,351) |
Administrator Class
| (832,913) | (8,161,944) | (469,763) | (4,841,204) |
Institutional Class
| (22,238,878) | (216,704,580) | (26,317,874) | (269,536,298) |
| | | (248,117,802) | | (305,438,382) |
Net decrease in net assets resulting from capital share transactions
| | (66,211,349) | | (1,279,493) |
Total decrease in net assets
| | (70,778,585) | | (36,381,799) |
| Net assets | | | | |
Beginning of period
| | 504,472,942 | | 540,854,741 |
End of period
| | $ 433,694,357 | | $ 504,472,942 |
The accompanying notes are an integral part of these financial statements.
26 | Allspring California Limited-Term Tax-Free Fund
Financial highlights
(For a share outstanding throughout each period)
| | | Year ended June 30 |
| Class A | Six months ended
December 31, 2022
(unaudited) | 2022 | 2021 | 2020 | 2019 | 2018 |
Net asset value, beginning of period
| $10.03 | $10.76 | $10.71 | $10.76 | $10.61 | $10.79 |
Net investment income
| 0.09 | 0.15 1 | 0.16 | 0.19 | 0.20 | 0.19 |
Net realized and unrealized gains (losses) on investments
| (0.05) | (0.73) | 0.05 | (0.05) | 0.15 | (0.18) |
Total from investment operations
| 0.04 | (0.58) | 0.21 | 0.14 | 0.35 | 0.01 |
| Distributions to shareholders from | | | | | | |
Net investment income
| (0.09) | (0.15) | (0.16) | (0.19) | (0.20) | (0.19) |
Net asset value, end of period
| $9.98 | $10.03 | $10.76 | $10.71 | $10.76 | $10.61 |
Total return2
| 0.41% | (5.42)% | 1.99% | 1.30% | 3.33% | 0.05% |
| Ratios to average net assets (annualized) | | | | | | |
Gross expenses
| 0.85% | 0.85% | 0.85% | 0.85% | 0.85% | 0.84% |
Net expenses
| 0.80% | 0.80% | 0.80% | 0.80% | 0.80% | 0.80% |
Net investment income
| 1.80% | 1.44% | 1.51% | 1.76% | 1.87% | 1.73% |
| Supplemental data | | | | | | |
Portfolio turnover rate
| 29% | 32% | 18% | 27% | 11% | 45% |
Net assets, end of period (000s omitted)
| $104,529 | $84,928 | $106,602 | $108,189 | $101,765 | $119,657 |
| 1 | Calculated based upon average shares outstanding |
| 2 | Total return calculations do not include any sales charges. Returns for periods of less than one year are not annualized. |
The accompanying notes are an integral part of these financial statements.
Allspring California Limited-Term Tax-Free Fund | 27
Financial highlights
(For a share outstanding throughout each period)
| | | Year ended June 30 |
| Class C | Six months ended
December 31, 2022
(unaudited) | 2022 | 2021 | 2020 | 2019 | 2018 |
Net asset value, beginning of period
| $10.03 | $10.76 | $10.71 | $10.76 | $10.61 | $10.79 |
Net investment income
| 0.05 1 | 0.07 1 | 0.08 1 | 0.11 1 | 0.12 | 0.11 |
Net realized and unrealized gains (losses) on investments
| (0.05) | (0.73) | 0.05 | (0.05) | 0.15 | (0.18) |
Total from investment operations
| 0.00 | (0.66) | 0.13 | 0.06 | 0.27 | (0.07) |
| Distributions to shareholders from | | | | | | |
Net investment income
| (0.05) | (0.07) | (0.08) | (0.11) | (0.12) | (0.11) |
Net asset value, end of period
| $9.98 | $10.03 | $10.76 | $10.71 | $10.76 | $10.61 |
Total return2
| 0.03% | (6.13)% | 1.23% | 0.54% | 2.56% | (0.70)% |
| Ratios to average net assets (annualized) | | | | | | |
Gross expenses
| 1.60% | 1.59% | 1.59% | 1.60% | 1.60% | 1.59% |
Net expenses
| 1.55% | 1.55% | 1.55% | 1.55% | 1.55% | 1.55% |
Net investment income
| 1.03% | 0.68% | 0.75% | 1.01% | 1.12% | 0.98% |
| Supplemental data | | | | | | |
Portfolio turnover rate
| 29% | 32% | 18% | 27% | 11% | 45% |
Net assets, end of period (000s omitted)
| $2,611 | $3,751 | $5,464 | $11,981 | $19,929 | $26,868 |
| 1 | Calculated based upon average shares outstanding |
| 2 | Total return calculations do not include any sales charges. Returns for periods of less than one year are not annualized. |
The accompanying notes are an integral part of these financial statements.
28 | Allspring California Limited-Term Tax-Free Fund
Financial highlights
(For a share outstanding throughout each period)
| | | Year ended June 30 |
| Administrator Class | Six months ended
December 31, 2022
(unaudited) | 2022 | 2021 | 2020 | 2019 | 2018 |
Net asset value, beginning of period
| $9.88 | $10.60 | $10.55 | $10.60 | $10.45 | $10.63 |
Net investment income
| 0.10 1 | 0.17 1 | 0.18 1 | 0.21 1 | 0.22 | 0.20 1 |
Net realized and unrealized gains (losses) on investments
| (0.05) | (0.72) | 0.05 | (0.05) | 0.15 | (0.18) |
Total from investment operations
| 0.05 | (0.55) | 0.23 | 0.16 | 0.37 | 0.02 |
| Distributions to shareholders from | | | | | | |
Net investment income
| (0.10) | (0.17) | (0.18) | (0.21) | (0.22) | (0.20) |
Net asset value, end of period
| $9.83 | $9.88 | $10.60 | $10.55 | $10.60 | $10.45 |
Total return2
| 0.50% | (5.24)% | 2.21% | 1.50% | 3.56% | 0.23% |
| Ratios to average net assets (annualized) | | | | | | |
Gross expenses
| 0.79% | 0.79% | 0.79% | 0.78% | 0.79% | 0.78% |
Net expenses
| 0.60% | 0.60% | 0.60% | 0.60% | 0.60% | 0.60% |
Net investment income
| 2.03% | 1.65% | 1.71% | 1.95% | 2.07% | 1.93% |
| Supplemental data | | | | | | |
Portfolio turnover rate
| 29% | 32% | 18% | 27% | 11% | 45% |
Net assets, end of period (000s omitted)
| $66,813 | $31,947 | $32,294 | $36,591 | $108,484 | $133,581 |
| 1 | Calculated based upon average shares outstanding |
| 2 | Returns for periods of less than one year are not annualized. |
The accompanying notes are an integral part of these financial statements.
Allspring California Limited-Term Tax-Free Fund | 29
Financial highlights
(For a share outstanding throughout each period)
| | | Year ended June 30 |
| Institutional Class | Six months ended
December 31, 2022
(unaudited) | 2022 | 2021 | 2020 | 2019 | 2018 |
Net asset value, beginning of period
| $9.87 | $10.59 | $10.54 | $10.59 | $10.44 | $10.62 |
Net investment income
| 0.10 1 | 0.18 | 0.19 | 0.22 | 0.23 | 0.21 |
Net realized and unrealized gains (losses) on investments
| (0.04) | (0.72) | 0.05 | (0.05) | 0.15 | (0.18) |
Total from investment operations
| 0.06 | (0.54) | 0.24 | 0.17 | 0.38 | 0.03 |
| Distributions to shareholders from | | | | | | |
Net investment income
| (0.10) | (0.18) | (0.19) | (0.22) | (0.23) | (0.21) |
Net asset value, end of period
| $9.83 | $9.87 | $10.59 | $10.54 | $10.59 | $10.44 |
Total return2
| 0.65% | (5.15)% | 2.31% | 1.60% | 3.66% | 0.33% |
| Ratios to average net assets (annualized) | | | | | | |
Gross expenses
| 0.52% | 0.52% | 0.52% | 0.52% | 0.52% | 0.51% |
Net expenses
| 0.50% | 0.50% | 0.50% | 0.50% | 0.50% | 0.50% |
Net investment income
| 2.07% | 1.74% | 1.81% | 2.06% | 2.17% | 2.03% |
| Supplemental data | | | | | | |
Portfolio turnover rate
| 29% | 32% | 18% | 27% | 11% | 45% |
Net assets, end of period (000s omitted)
| $259,740 | $383,847 | $396,495 | $380,649 | $322,273 | $325,973 |
| 1 | Calculated based upon average shares outstanding |
| 2 | Returns for periods of less than one year are not annualized. |
The accompanying notes are an integral part of these financial statements.
30 | Allspring California Limited-Term Tax-Free Fund
Notes to financial statements (unaudited)
1. ORGANIZATION
Allspring Funds Trust (the "Trust"), a Delaware statutory trust organized on March 10, 1999, is an open-end management investment company registered under the Investment Company Act of 1940, as amended (the "1940 Act"). As an investment company, the Trust follows the accounting and reporting guidance in Financial Accounting Standards Board ("FASB") Accounting Standards Codification Topic 946, Financial Services – Investment Companies. These financial statements report on the Allspring California Limited-Term Tax-Free Fund (the "Fund") which is a diversified series of the Trust.
2. SIGNIFICANT ACCOUNTING POLICIES
The following significant accounting policies, which are consistently followed in the preparation of the financial statements of the Fund, are in conformity with U.S. generally accepted accounting principles which require management to make estimates and assumptions that affect the reported amounts of assets and liabilities, disclosure of contingent assets and liabilities at the date of the financial statements, and the reported amounts of income and expenses during the reporting period. Actual results could differ from those estimates.
Securities valuation
All investments are valued each business day as of the close of regular trading on the New York Stock Exchange (generally 4 p.m. Eastern Time), although the Fund may deviate from this calculation time under unusual or unexpected circumstances.
Debt securities are valued at the evaluated bid price provided by an independent pricing service (e.g. taking into account various factors, including yields, maturities, or credit ratings) or, if a reliable price is not available, the quoted bid price from an independent broker-dealer.
Investments in registered open-end investment companies (other than those listed on a foreign or domestic exchange or market) are valued at net asset value.
Investments which are not valued using the methods discussed above are valued at their fair value, as determined in good faith by Allspring Funds Management, LLC ("Allspring Funds Management"), which was named the valuation designee by the Board of Trustees. As the valuation designee, Allspring Funds Management is responsible for day-to-day valuation activities for the Allspring Funds. In connection with these responsibilities, Allspring Funds Management has established a Valuation Committee and has delegated to it the authority to take any actions regarding the valuation of portfolio securities that the Valuation Committee deems necessary or appropriate, including determining the fair value of portfolio securities. On a quarterly basis, the Board of Trustees receives reports of valuation actions taken by the Valuation Committee. On at least an annual basis, the Board of Trustees receives an assessment of the adequacy and effectiveness of Allspring Funds Management's process for determining the fair value of the portfolio of investments.
When-issued transactions
The Fund may purchase securities on a forward commitment or when-issued basis. The Fund records a when-issued transaction on the trade date and will segregate assets in an amount at least equal in value to the Fund's commitment to purchase when-issued securities. Securities purchased on a when-issued basis are marked-to-market daily and the Fund begins earning interest on the settlement date. Losses may arise due to changes in the market value of the underlying securities or if the counterparty does not perform under the contract.
Security transactions and income recognition
Securities transactions are recorded on a trade date basis. Realized gains or losses are recorded on the basis of identified cost.
Interest income is accrued daily and bond discounts are accreted and premiums are amortized daily. To the extent debt obligations are placed on non-accrual status, any related interest income may be reduced by writing off interest receivables when the collection of all or a portion of interest has been determined to be doubtful based on consistently applied procedures and the fair value has decreased. If the issuer subsequently resumes interest payments or when the collectability of interest is reasonably assured, the debt obligation is removed from non-accrual status.
Distributions to shareholders
Distributions to shareholders from net investment income are declared daily and paid monthly. Distributions from net realized gains, if any, are recorded on the ex-dividend date and paid at least annually. Such distributions are determined in accordance with income tax regulations and may differ from U.S. generally accepted accounting principles. Dividend sources are estimated at the time of declaration. The tax character of distributions is determined as of the Fund's fiscal year end. Therefore, a portion of the Fund's distributions made prior to the Fund’s fiscal year end may be categorized as a tax return of capital at year end.
Allspring California Limited-Term Tax-Free Fund | 31
Notes to financial statements (unaudited)
Federal and other taxes
The Fund intends to continue to qualify as a regulated investment company by distributing substantially all of its investment company taxable and tax-exempt income and any net realized capital gains (after reduction for capital loss carryforwards) sufficient to relieve it from all, or substantially all, federal income taxes. Accordingly, no provision for federal income taxes was required.
The Fund’s income and federal excise tax returns and all financial records supporting those returns for the prior three fiscal years are subject to examination by the federal and Delaware revenue authorities. Management has analyzed the Fund's tax positions taken on federal, state, and foreign tax returns, as applicable, for all open tax years and does not believe that there are any uncertain tax positions that require recognition of a tax liability.
As of December 31, 2022, the aggregate cost of all investments for federal income tax purposes was $450,801,743 and the unrealized gains (losses) consisted of:
| Gross unrealized gains | $ 1,124,987 |
| Gross unrealized losses | (16,323,081) |
| Net unrealized losses | $(15,198,094) |
As of June 30, 2022, the Fund had capital loss carryforwards which consisted of $10,307,977 in short-term capital losses and $3,001,658 in long-term capital losses.
Class allocations
The separate classes of shares offered by the Fund differ principally in applicable sales charges, distribution, shareholder servicing, and administration fees. Class specific expenses are charged directly to that share class. Investment income, common fund-level expenses, and realized and unrealized gains (losses) on investments are allocated daily to each class of shares based on the relative proportion of net assets of each class.
3. FAIR VALUATION MEASUREMENTS
Fair value measurements of investments are determined within a framework that has established a fair value hierarchy based upon the various data inputs utilized in determining the value of the Fund’s investments. The three-level hierarchy gives the highest priority to unadjusted quoted prices in active markets for identical assets or liabilities (Level 1) and the lowest priority to unobservable inputs (Level 3). The Fund’s investments are classified within the fair value hierarchy based on the lowest level of input that is significant to the fair value measurement. The inputs are summarized into three broad levels as follows:
| ■ | Level 1 – quoted prices in active markets for identical securities |
| ■ | Level 2 – other significant observable inputs (including quoted prices for similar securities, interest rates, prepayment speeds, credit risk, etc.) |
| ■ | Level 3 – significant unobservable inputs (including the Fund’s own assumptions in determining the fair value of investments) |
The inputs or methodologies used for valuing investments in securities are not necessarily an indication of the risk associated with investing in those securities.
The following is a summary of the inputs used in valuing the Fund’s assets and liabilities as of December 31, 2022:
| | Quoted prices
(Level 1) | Other significant
observable inputs
(Level 2) | Significant
unobservable inputs
(Level 3) | Total |
| Assets | | | | |
| Investments in: | | | | |
| Closed end municipal bond fund obligations | $ 0 | $ 5,400,000 | $0 | $ 5,400,000 |
| Municipal obligations | 0 | 424,774,662 | 0 | 424,774,662 |
| Short-term investments | | | | |
| Investment companies | 5,428,987 | 0 | 0 | 5,428,987 |
| Total assets | $5,428,987 | $430,174,662 | $0 | $435,603,649 |
Additional sector, industry or geographic detail, if any, is included in the Portfolio of Investments.
32 | Allspring California Limited-Term Tax-Free Fund
Notes to financial statements (unaudited)
For the six months ended December 31, 2022, the Fund did not have any transfers into/out of Level 3.
4. TRANSACTIONS WITH AFFILIATES
Management fee
Allspring Funds Management, a wholly owned subsidiary of Allspring Global Investments Holdings, LLC, a holding company indirectly owned by certain private funds of GTCR LLC and Reverence Capital Partners, L.P., is the manager of the Fund and provides advisory and fund-level administrative services under an investment management agreement. Under the investment management agreement, Allspring Funds Management is responsible for, among other services, implementing the investment objectives and strategies of the Fund, supervising the subadviser and providing fund-level administrative services in connection with the Fund’s operations. As compensation for its services under the investment management agreement, Allspring Funds Management is entitled to receive a management fee at the following annual rate based on the Fund’s average daily net assets:
| Average daily net assets | Management fee |
| First $500 million | 0.400% |
| Next $500 million | 0.375 |
| Next $2 billion | 0.350 |
| Next $2 billion | 0.325 |
| Next $5 billion | 0.290 |
| Over $10 billion | 0.280 |
For the six months ended December 31, 2022, the management fee was equivalent to an annual rate of 0.40% of the Fund’s average daily net assets.
Allspring Funds Management has retained the services of a subadviser to provide daily portfolio management to the Fund. The fee for subadvisory services is borne by Allspring Funds Management. Allspring Global Investments, LLC, an affiliate of Allspring Funds Management and a wholly owned subsidiary of Allspring Global Investments Holdings, LLC, is the subadviser to the Fund and is entitled to receive a fee from Allspring Funds Management at an annual rate starting at 0.15% and declining to 0.05% as the average daily net assets of the Fund increase.
Administration fees
Under a class-level administration agreement, Allspring Funds Management provides class-level administrative services to the Fund, which includes paying fees and expenses for services provided by the transfer agent, sub-transfer agents, omnibus account servicers and record-keepers. As compensation for its services under the class-level administration agreement, Allspring Funds Management receives an annual fee which is calculated based on the average daily net assets of each class as follows:
| | Class-level
administration fee |
| Class A | 0.16% |
| Class C | 0.16 |
| Administrator Class | 0.10 |
| Institutional Class | 0.08 |
Waivers and/or expense reimbursements
Allspring Funds Management has contractually committed to waive and/or reimburse management and administration fees to the extent necessary to maintain certain net operating expense ratios for the Fund. When each class of the Fund has exceeded its expense cap, Allspring Funds Management will waive fees and/or reimburse expenses from fund-level expenses on a proportionate basis and then from class specific expenses. When only certain classes exceed their expense caps, waivers and/or reimbursements are applied against class specific expenses before fund-level expenses. Allspring Funds Management has contractually committed through October 31, 2023 to waive fees and/or reimburse expenses to the extent necessary to cap expenses. Prior to or after the commitment expiration date, the caps may be increased or the commitment to maintain the
Allspring California Limited-Term Tax-Free Fund | 33
Notes to financial statements (unaudited)
caps may be terminated only with the approval of the Board of Trustees. As of December 31, 2022, the contractual expense caps are as follows:
| | Expense ratio caps |
| Class A | 0.80% |
| Class C | 1.55 |
| Administrator Class | 0.60 |
| Institutional Class | 0.50 |
Distribution fee
The Trust has adopted a distribution plan for Class C shares pursuant to Rule 12b-1 under the 1940 Act. A distribution fee is charged to Class C shares and paid to Allspring Funds Distributor, LLC ("Allspring Funds Distributor"), the principal underwriter, an affiliate of Allspring Funds Management, at an annual rate up to 0.75% of the average daily net assets of Class C shares.
In addition, Allspring Funds Distributor is entitled to receive the front-end sales charge from the purchase of Class A shares and a contingent deferred sales charge on the redemption of certain Class A shares. Allspring Funds Distributor is also entitled to receive the contingent deferred sales charges from redemptions of Class C shares. For the six months ended December 31, 2022, Allspring Funds Distributor received $73 from the sale of Class A shares. No contingent deferred sales charges were incurred by Class A and Class C shares for the six months ended December 31, 2022.
Shareholder servicing fees
The Trust has entered into contracts with one or more shareholder servicing agents, whereby Class A, Class C and Administrator Class are charged a fee at an annual rate up to 0.25% of the average daily net assets of each respective class. A portion of these total shareholder servicing fees were paid to affiliates of the Fund.
Interfund transactions
The Fund may purchase or sell portfolio investment securities to certain affiliates pursuant to Rule 17a-7 under the 1940 Act and under procedures adopted by the Board of Trustees. The procedures have been designed to ensure that these interfund transactions, which do not incur broker commissions, are effected at current market prices. Pursuant to these procedures, the Fund had $34,796,389, $18,020,000 and $0 in interfund purchases, sales and net realized gains (losses), respectively, during the six months ended December 31, 2022.
5. INVESTMENT PORTFOLIO TRANSACTIONS
Purchases and sales of investments, excluding U.S. government obligations (if any) and short-term securities, for the six months ended December 31, 2022 were $131,066,601 and $138,998,317, respectively.
6. BANK BORROWINGS
The Trust (excluding the money market funds), Allspring Master Trust and Allspring Variable Trust are parties to a $350,000,000 revolving credit agreement whereby the Fund is permitted to use bank borrowings for temporary or emergency purposes, such as to fund shareholder redemption requests. Interest under the credit agreement is charged to the Fund based on a borrowing rate equal to the higher of the Federal Funds rate or the overnight bank funding rate in effect on that day plus a spread. In addition, an annual commitment fee equal based on the unused balance is allocated to each participating fund.
For the six months ended December 31, 2022, there were no borrowings by the Fund under the agreement.
7. CONCENTRATION RISK
The Fund invests a substantial portion of its assets in issuers of municipal debt securities located in a single state or territory of the U.S. Therefore, it may be more affected by economic and political developments in that state or region than would be a comparable general tax-exempt fund. As of the end of the period, the Fund's investments were concentrated in the state of California.
8. MARKET RISKS
On March 11, 2020, the World Health Organization announced that it had made the assessment that coronavirus disease 2019 (“COVID-19”) is a pandemic. The impacts of COVID-19 are affecting the entire global economy, individual companies and investment products, the funds, and the market in general. There is significant uncertainty around the extent and duration of
34 | Allspring California Limited-Term Tax-Free Fund
Notes to financial statements (unaudited)
business disruptions related to COVID-19 and the impacts may last for an extended period of time. COVID-19 has led to significant uncertainty and volatility in the financial markets.
9. INDEMNIFICATION
Under the Fund's organizational documents, the officers and Trustees have been granted certain indemnification rights against certain liabilities that may arise out of performance of their duties to the Fund. The Fund has entered into a separate agreement with each Trustee that converts indemnification rights currently existing under the Fund’s organizational documents into contractual rights that cannot be changed in the future without the consent of the Trustee. Additionally, in the normal course of business, the Fund may enter into contracts with service providers that contain a variety of indemnification clauses. The Fund’s maximum exposure under these arrangements is dependent on future claims that may be made against the Fund and, therefore, cannot be estimated.
Allspring California Limited-Term Tax-Free Fund | 35
Other information (unaudited)
PROXY VOTING INFORMATION
A description of the policies and procedures used to determine how to vote proxies relating to portfolio securities is available without charge, upon request, by calling 1-800-222-8222, visiting our website at allspringglobal.com, or visiting the SEC website at sec.gov. Information regarding how the proxies related to portfolio securities were voted during the most recent 12-month period ended June 30 is available on the website at allspringglobal.com or by visiting the SEC website at sec.gov.
QUARTERLY PORTFOLIO HOLDINGS INFORMATION
The Fund files its complete schedule of portfolio holdings with the SEC for the first and third quarters of each fiscal year as an exhibit to its reports on Form N-PORT. Shareholders may view the filed Form N-PORT by visiting the SEC website at sec.gov.
36 | Allspring California Limited-Term Tax-Free Fund
Other information (unaudited)
BOARD OF TRUSTEES AND OFFICERS
Each of the Trustees and Officers listed in the table below acts in identical capacities for each fund in the Allspring family of funds, which consists of 127 mutual funds comprising the Allspring Funds Trust, Allspring Variable Trust, Allspring Master Trust and four closed-end funds (collectively the “Fund Complex”). This table should be read in conjunction with the Prospectus and the Statement of Additional Information1. The mailing address of each Trustee and Officer is 1415 Vantage Park Drive, 3rd Floor, Charlotte, NC 28203. Each Trustee and Officer serves an indefinite term, however, each Trustee serves such term until reaching the mandatory retirement age established by the Trustees.
Independent Trustees
Name and
year of birth | Position held and
length of service* | Principal occupations during past five years or longer | Current other
public company or
investment
company
directorships |
William R. Ebsworth
(Born 1957) | Trustee,
since 2015 | Retired. From 1984 to 2013, equities analyst, portfolio manager, research director and chief investment officer at Fidelity Management and Research Company in Boston, Tokyo, and Hong Kong, and retired in 2013 as Chief Investment Officer of Fidelity Strategic Advisers, Inc. where he led a team of investment professionals managing client assets. Prior thereto, Board member of Hong Kong Securities Clearing Co., Hong Kong Options Clearing Corp., the Thailand International Fund, Ltd., Fidelity Investments Life Insurance Company, and Empire Fidelity Investments Life Insurance Company. Audit Committee Chair and Investment Committee Chair of the Vincent Memorial Hospital Foundation (non-profit organization). Mr. Ebsworth is a CFA® charterholder. | N/A |
Jane A. Freeman
(Born 1953) | Trustee,
since 2015;
Chair Liaison,
since 2018 | Retired. From 2012 to 2014 and 1999 to 2008, Chief Financial Officer of Scientific Learning Corporation. From 2008 to 2012, Ms. Freeman provided consulting services related to strategic business projects. Prior to 1999, Portfolio Manager at Rockefeller & Co. and Scudder, Stevens & Clark. Board member of the Harding Loevner Funds from 1996 to 2014, serving as both Lead Independent Director and chair of the Audit Committee. Board member of the Russell Exchange Traded Funds Trust from 2011 to 2012 and the chair of the Audit Committee. Ms. Freeman is also an inactive Chartered Financial Analyst. | N/A |
Isaiah Harris, Jr.
(Born 1952) | Trustee,
since 2009; Audit
Committee
Chair,
since 2019 | Retired. Member of the Advisory Board of CEF of East Central Florida. Chairman of the Board of CIGNA Corporation from 2009 to 2021, and Director from 2005 to 2008. From 2003 to 2011, Director of Deluxe Corporation. Prior thereto, President and CEO of BellSouth Advertising and Publishing Corp. from 2005 to 2007, President and CEO of BellSouth Enterprises from 2004 to 2005 and President of BellSouth Consumer Services from 2000 to 2003. Emeritus member of the Iowa State University Foundation Board of Governors. Emeritus Member of the Advisory Board of Iowa State University School of Business. Advisory Board Member, Palm Harbor Academy (private school). Advisory Board Member, Fellowship of Christian Athletes. Mr. Harris is a certified public accountant (inactive status). | N/A |
David F. Larcker
(Born 1950) | Trustee,
since 2009 | Distinguished Visiting Fellow at the Hoover Institution since 2022. James Irvin Miller Professor of Accounting at the Graduate School of Business (Emeritus), Stanford University, Director of the Corporate Governance Research Initiative and Senior Faculty of The Rock Center for Corporate Governance since 2006. From 2005 to 2008, Professor of Accounting at the Graduate School of Business, Stanford University. Prior thereto, Ernst & Young Professor of Accounting at The Wharton School, University of Pennsylvania from 1985 to 2005. | N/A |
Allspring California Limited-Term Tax-Free Fund | 37
Other information (unaudited)
Name and
year of birth | Position held and
length of service* | Principal occupations during past five years or longer | Current other
public company or
investment
company
directorships |
Olivia S. Mitchell
(Born 1953) | Trustee,
since 2006;
Nominating and
Governance
Committee Chair,
since 2018 | International Foundation of Employee Benefit Plans Professor since 1993, Wharton School of the University of Pennsylvania. Director of Wharton’s Pension Research Council and Boettner Center on Pensions & Retirement Research, and Research Associate at the National Bureau of Economic Research. Previously taught at Cornell University from 1978 to 1993. | N/A |
Timothy J. Penny
(Born 1951) | Trustee,
since 1996;
Chair,
since 2018 | President and Chief Executive Officer of Southern Minnesota Initiative Foundation, a non-profit organization, since 2007. Vice Chair of the Economic Club of Minnesota, since 2007. Co-Chair of the Committee for a Responsible Federal Budget, since 1995. Member of the Board of Trustees of NorthStar Education Finance, Inc., a non-profit organization, from 2007-2022. Senior Fellow of the University of Minnesota Humphrey Institute from 1995 to 2017. | N/A |
James G. Polisson
(Born 1959) | Trustee,
since 2018 | Retired. Chief Marketing Officer, Source (ETF) UK Services, Ltd, from 2015 to 2017. From 2012 to 2015, Principal of The Polisson Group, LLC, a management consulting, corporate advisory and principal investing company. Chief Executive Officer and Managing Director at Russell Investments, Global Exchange Traded Funds from 2010 to 2012. Managing Director of Barclays Global Investors from 1998 to 2010 and Global Chief Marketing Officer for iShares and Barclays Global Investors from 2000 to 2010. Trustee of the San Francisco Mechanics’ Institute, a non-profit organization, from 2013 to 2015. Board member of the Russell Exchange Traded Fund Trust from 2011 to 2012. Director of Barclays Global Investors Holdings Deutschland GmbH from 2006 to 2009. Mr. Polisson is an attorney and has a retired status with the Massachusetts and District of Columbia Bar Associations. | N/A |
Pamela Wheelock
(Born 1959) | Trustee,
since January
2020; previously
Trustee from
January 2018 to
July 2019 | Retired. Executive and Senior Financial leadership positions in the public, private and nonprofit sectors. Interim President and CEO, McKnight Foundation, 2020. Interim Commissioner, Minnesota Department of Human Services, 2019. Chief Operating Officer, Twin Cities Habitat for Humanity, 2017-2019. Vice President for University Services, University of Minnesota, 2012-2016. Interim President and CEO, Blue Cross and Blue Shield of Minnesota, 2011-2012. Executive Vice-President and Chief Financial Officer, Minnesota Wild, 2002-2008. Commissioner, Minnesota Department of Finance, 1999-2002. Chair of the Board of Directors of Destination Medical Center Corporation. Board member of the Minnesota Wild Foundation. | N/A |
* Length of service dates reflect the Trustee’s commencement of service with the Trust’s predecessor entities, where applicable.
38 | Allspring California Limited-Term Tax-Free Fund
Other information (unaudited)
Officers2
Name and
year of birth | Position held and
length of service | Principal occupations during past five years or longer |
Andrew Owen
(Born 1960) | President,
since 2017 | President and Chief Executive Officer of Allspring Funds Management, LLC since 2017 and Head of Global Fund Governance of Allspring Global Investments since 2022. Prior thereto, co-president of Galliard Capital Management, LLC, an affiliate of Allspring Funds Management, LLC, from 2019 to 2022 and Head of Affiliated Managers, Allspring Global Investments, from 2014 to 2019 and Executive Vice President responsible for marketing, investments and product development for Allspring Funds Management, LLC, from 2009 to 2014. |
Jeremy DePalma
(Born 1974) | Treasurer,
since 2012
(for certain funds in
the Fund Complex);
since 2021 (for
the remaining funds in the
Fund Complex) | Senior Vice President of Allspring Funds Management, LLC since 2009. Senior Vice President of Evergreen Investment Management Company, LLC from 2008 to 2010 and head of the Fund Reporting and Control Team within Fund Administration from 2005 to 2010. |
Christopher Baker
(Born 1976) | Chief Compliance Officer, since 2022 | Global Chief Compliance Officer for Allspring Global Investments since 2022. Prior thereto, Chief Compliance Officer for State Street Global Advisors from 2018 to 2021. Senior Compliance Officer for the State Street divisions of Alternative Investment Solutions, Sector Solutions, and Global Marketing from 2015 to 2018. From 2010 to 2015 Vice President, Global Head of Investment and Marketing Compliance for State Street Global Advisors. |
Matthew Prasse
(Born 1983) | Chief Legal Officer, since 2022; Secretary, since 2021 | Senior Counsel of the Allspring Legal Department since 2021. Senior Counsel of the Wells Fargo Legal Department from 2018 to 2021. Previously, Counsel for Barings LLC from 2015 to 2018. Prior to joining Barings, Associate at Morgan, Lewis & Bockius LLP from 2008 to 2015. |
1 The Statement of Additional Information includes additional information about the Trustees and is available, without charge, upon request, by calling 1-800-222-8222 or by visiting the website at allspringglobal.com.
2 For those Officers with tenures at Allspring Global Investments and/or Allspring Funds Management, LLC that began prior to 2021, such tenures include years of service during which these businesses/entities were known as Wells Fargo Asset Management and Wells Fargo Funds Management, LLC, respectively.
Allspring California Limited-Term Tax-Free Fund | 39
For more information
More information about Allspring Funds is available free upon request. To obtain literature, please write, visit the Fund's website, or call:
Allspring Funds
P.O. Box 219967
Kansas City, MO 64121-9967
Website: allspringglobal.com
Individual investors: 1-800-222-8222
Retail investment professionals: 1-888-877-9275
Institutional investment professionals: 1-800-260-5969
This report and the financial statements contained herein are submitted for the general information of the shareholders of the Fund. If this report is used for promotional purposes, distribution of the report must be accompanied or preceded by a current prospectus. Before investing, please consider the investment objectives, risks, charges, and expenses of the investment. For a current prospectus and, if available, a summary prospectus, containing this information, call
1-800-222-8222 or visit the Fund's website at allspringglobal.com. Read the prospectus carefully before you invest or send money.
Allspring Global InvestmentsTM is the trade name for the asset management firms of Allspring Global Investments Holdings, LLC, a holding company indirectly owned by certain private funds of GTCR LLC and Reverence Capital Partners, L.P. These firms include but are not limited to Allspring Global Investments, LLC, and Allspring Funds Management, LLC. Certain products managed by Allspring entities are distributed by Allspring Funds Distributor, LLC (a broker-dealer and Member FINRA/SIPC).
This material is for general informational and educational purposes only and is NOT intended to provide investment advice or a recommendation of any kind - including a recommendation for any specific investment, strategy, or plan.
© 2023 Allspring Global Investments Holdings, LLC. All rights reserved.
ALL-01092023-5ygybicu 02-23
SAR0033 12-22
Semi-Annual Report
December 31, 2022
Allspring
California Tax-Free Fund
The views expressed and any forward-looking statements are as of December 31, 2022, unless otherwise noted, and are those of the Fund's portfolio managers and/or Allspring Global Investments. Discussions of individual securities or the markets generally are not intended as individual recommendations. Future events or results may vary significantly from those expressed in any forward-looking statements. The views expressed are subject to change at any time in response to changing circumstances in the market. Allspring Global Investments disclaims any obligation to publicly update or revise any views expressed or forward-looking statements.
Allspring California Tax-Free Fund | 1
Letter to shareholders (unaudited)
Andrew Owen
President
Allspring Funds
Dear Shareholder:
We are pleased to offer you this semi-annual report for the Allspring California Tax-Free Fund for the six-month period that ended December 31, 2022. Globally, stocks and bonds experienced heightened volatility and generally negative returns through the challenging period. Earlier tailwinds provided by global stimulus programs, vaccination rollouts, and recovering consumer and corporate sentiment were wiped away by the highest rate of inflation in four decades, the impact of ongoing aggressive central bank rate hikes and the prospect of more rate hikes. Compounding these concerns were the global reverberations of the Russia-Ukraine war and the impact of China’s strict COVID-19 lockdowns.
For the six-month period, stocks and bonds had mixed results, with emerging market equities trailing those of developed markets and both U.S. and non-U.S. bonds fighting an uphill battle in the face of sustained interest rate increases. For the period, U.S. stocks, based on the S&P 500 Index,1 gained 2.31%. International stocks, as measured by the MSCI ACWI ex USA Index (Net),2 returned 2.96%, while the MSCI EM Index (Net) (USD)3 declined 2.99%. Among bond indexes, the Bloomberg U.S. Aggregate Bond Index4 returned -2.97%, the Bloomberg Global Aggregate ex-USD Index (unhedged)5 returned -2.65%, the Bloomberg Municipal Bond Index6 gained 0.50%, and the ICE BofA U.S. High Yield Index7 returned 3.33%.
Persistent inflation and economic fallout from the Russia-Ukraine war drove markets.
Markets rebounded from earlier losses in July, led by U.S. stocks. While evidence pointed to an economic slowdown after two consecutive quarters of declining gross domestic product (economic contraction), the U.S. labor market remained surprisingly strong: July nonfarm payrolls grew by more than 500,000 and U.S. unemployment dipped to 3.5%. Meanwhile, crude oil and retail gasoline prices, major contributors to recent overall inflation, fell substantially from earlier highs. And while U.S. home prices rose, sales fell as houses became less affordable with mortgage rates at a 13-year high. The Federal Reserve (Fed) raised the federal funds rate another 0.75% in July—to a range of 2.25% to 2.50%—and forecasts pointed to further rate hikes.
| 1 | The S&P 500 Index consists of 500 stocks chosen for market size, liquidity, and industry group representation. It is a market-value-weighted index with each stock's weight in the index proportionate to its market value. You cannot invest directly in an index. |
| 2 | The Morgan Stanley Capital International (MSCI) All Country World Index (ACWI) ex USA Index (Net) is a free-float-adjusted market-capitalization-weighted index that is designed to measure the equity market performance of developed and emerging markets, excluding the U.S. Source: MSCI. MSCI makes no express or implied warranties or representations and shall have no liability whatsoever with respect to any MSCI data contained herein. The MSCI data may not be further redistributed or used as a basis for other indexes or any securities or financial products. This report is not approved, reviewed, or produced by MSCI. You cannot invest directly in an index. |
| 3 | The MSCI Emerging Markets (EM) Index (Net) (USD) is a free-float-adjusted market-capitalization-weighted index that is designed to measure equity market performance of emerging markets. You cannot invest directly in an index. |
| 4 | The Bloomberg U.S. Aggregate Bond Index is a broad-based benchmark that measures the investment-grade, U.S.-dollar-denominated, fixed-rate taxable bond market, including Treasuries, government-related and corporate securities, mortgage-backed securities (agency fixed-rate and hybrid adjustable-rate mortgage pass-throughs), asset-backed securities, and commercial mortgage-backed securities. You cannot invest directly in an index. |
| 5 | The Bloomberg Global Aggregate ex-USD Index (unhedged) is an unmanaged index that provides a broad-based measure of the global investment-grade fixed-income markets excluding the U.S.-dollar-denominated debt market. You cannot invest directly in an index. |
| 6 | The Bloomberg Municipal Bond Index is an unmanaged index composed of long-term tax-exempt bonds with a minimum credit rating of Baa. You cannot invest directly in an index. |
| 7 | The ICE BofA U.S. High Yield Index is a market-capitalization-weighted index of domestic and Yankee high-yield bonds. The index tracks the performance of high-yield securities traded in the U.S. bond market. You cannot invest directly in an index. Copyright 2023. ICE Data Indices, LLC. All rights reserved. |
2 | Allspring California Tax-Free Fund
Letter to shareholders (unaudited)
August was yet another broadly challenging month for financial markets, with more red ink flowing. High inflation persisted, cresting 9% in the eurozone on an annual basis and remaining above 8% in the U.S. despite the Fed’s aggressive monetary policy and a major drop in global crude oil and gasoline prices from their June peak. One positive note was the resilience of the U.S. job market. However, the Fed’s job was clearly not complete. One longer-term bright spot was the U.S. Congress’s passage of the Inflation Reduction Act. Its primary stated goals include: to reduce inflation (though not immediately) by curbing the deficit, capping health care spending by seniors, and investing in domestic sources of clean energy.
The market misery continued in September. There was nowhere to hide as all asset classes suffered major losses at the hands of persistent inflation. Central banks kept up their battle against rapidly rising prices with more rate hikes. The strength of the U.S. dollar made things even more difficult for investors holding assets in other currencies. U.S. mortgage rates jumped to near 7% on 30-year fixed-rate mortgages; the decreased housing affordability began to cool demand somewhat. The U.K. experienced a sharp sell-off of government bonds and the British pound in September as investors panicked in response to a new government budget that was seen as financially unsound. The market meltdown forced the Bank of England to step in and buy long-dated government bonds.
Equities had a reprieve in October after two months of sharp declines. Value stocks and small caps fared best. Globally, developed markets outpaced emerging market equities, which were hurt by weakness among Chinese stocks. Central banks continued to try to curtail high inflation with aggressive interest rate hikes. Geopolitical risks persisted, including the ongoing Russia-Ukraine war and economic, financial market, and political turmoil in the U.K., which led to a second prime ministerial change in six weeks, as Rishi Sunak replaced Liz Truss in late October. Concerns over Europe’s energy crisis eased thanks to unseasonably warm weather and plentiful gas on hand. The U.S. labor market continued its resilience against rising prices, as unemployment stood at 3.7%, near a record low.
Stocks and bonds rallied in November, with emerging market equities gaining nearly 15% and developed market equities returning 7%. The S&P 500 Index rose 5.6% in November. Bonds also had positive monthly returns. Economic news was encouraging, driven by U.S. labor market strength. Although central banks kept raising rates, expectations grew regarding an impending easing in the pace of rate hikes and a possible end to central bank monetary tightening in 2023. Although inflation remained at record highs in the eurozone, with a 10.6% annual increase in October, Germany’s producer prices decreased 4.2% annually, signaling a possible decline in inflationary pressures. Meanwhile, U.S. inflation continued to moderate, with a 7.1% annual price rise in November and a monthly price increase of just 0.1%. China’s economic data remained weak, reflecting its zero-COVID-19 policy.
Financial markets cooled in December, with U.S. equities posting negative overall results in response to a weakening U.S. dollar. Fixed income securities ended one of their worst years ever with flat overall monthly returns as markets weighed the hopes for an end to the monetary tightening cycle with the reality that central banks had not completed their jobs yet. U.S. Consumer Price Index (CPI)1 data showed a strong consistent trend downward, which brought down the 12-month CPI to 6.5% in December from 9.1% in June. Other countries and regions reported still-high but declining inflation rates as the year winded down.
“ The market misery continued in September. There was nowhere to hide as all asset classes suffered major losses at the hands of persistent inflation.”
| 1 | The Consumer Price Index (CPI) is a measure of the average change over time in the prices paid by urban consumers for a market basket of consumer goods and services. You cannot invest directly in an index. |
Allspring California Tax-Free Fund | 3
Letter to shareholders (unaudited)
Don’t let short-term uncertainty derail long-term investment goals.
Periods of investment uncertainty can present challenges, but experience has taught us that maintaining long-term investment goals can be an effective way to plan for the future. To help you create a sound strategy based on your personal goals and risk tolerance, Allspring Funds offers more than 100 mutual funds spanning a wide range of asset classes and investment styles. Although diversification cannot guarantee an investment profit or prevent losses, we believe it can be an effective way to manage investment risk and potentially smooth out overall portfolio performance. We encourage investors to know their investments and to understand that appropriate levels of risk-taking may unlock opportunities.
Thank you for choosing to invest with Allspring Funds. We appreciate your confidence in us and remain committed to helping you meet your financial needs.
Sincerely,
Andrew Owen
President
Allspring Funds
For further information about your fund, contact your investment professional, visit our website at allspringglobal.com, or call us directly at 1-800-222-8222.
4 | Allspring California Tax-Free Fund
This page is intentionally left blank.
Performance highlights (unaudited)
| Investment objective | The Fund seeks current income exempt from federal income tax and California individual income tax. |
| Manager | Allspring Funds Management, LLC |
| Subadviser | Allspring Global Investments, LLC |
| Portfolio managers | Terry J. Goode, Kim Nakahara, Adrian Van Poppel |
| Average annual total returns (%) as of December 31, 2022 |
| | | Including sales charge | | Excluding sales charge | | Expense ratios1 (%) |
| | Inception date | 1 year | 5 year | 10 year | | 1 year | 5 year | 10 year | | Gross | Net 2 |
| Class A (SCTAX) | 10-6-1988 | -14.31 | -0.50 | 1.54 | | -10.24 | 0.43 | 2.01 | | 0.81 | 0.75 |
| Class C (SCTCX) | 7-1-1993 | -11.99 | -0.35 | 1.40 | | -10.99 | -0.35 | 1.40 | | 1.56 | 1.50 |
| Administrator Class (SGCAX) | 12-15-1997 | – | – | – | | -10.11 | 0.63 | 2.22 | | 0.75 | 0.55 |
| Institutional Class (SGTIX)3 | 10-31-2014 | – | – | – | | -10.05 | 0.70 | 2.27 | | 0.48 | 0.48 |
| Bloomberg California Municipal Bond Index4 | – | – | – | – | | -8.17 | 1.25 | 2.30 | | – | – |
| Bloomberg Municipal Bond Index5 | – | – | – | – | | -8.53 | 1.25 | 2.13 | | – | – |
Figures quoted represent past performance, which is no guarantee of future results, and do not reflect taxes that a shareholder may pay on an investment in a fund. Investment return and principal value of an investment will fluctuate so that an investor’s shares, when redeemed, may be worth more or less than their original cost. Performance shown without sales charges would be lower if sales charges were reflected. Current performance may be lower or higher than the performance data quoted, which assumes the reinvestment of dividends and capital gains. Current month-end performance is available on the Fund’s website, allspringglobal.com.
Index returns do not include transaction costs associated with buying and selling securities, any mutual fund fees or expenses, or any taxes. It is not possible to invest directly in an index.
For Class A shares, the maximum front-end sales charge is 4.50%. For Class C shares, the maximum contingent deferred sales charge is 1.00%. Performance including a contingent deferred sales charge assumes the sales charge for the corresponding time period. Administrator Class and Institutional Class shares are sold without a front-end sales charge or contingent deferred sales charge.
| 1 | Reflects the expense ratios as stated in the most recent prospectuses. The expense ratios shown are subject to change and may differ from the annualized expense ratios shown in the financial highlights of this report. |
| 2 | The manager has contractually committed through October 31, 2023, to waive fees and/or reimburse expenses to the extent necessary to cap total annual fund operating expenses after fee waivers at 0.75% for Class A, 1.50% for Class C, 0.55% for Administrator Class, and 0.48% for Institutional Class. Brokerage commissions, stamp duty fees, interest, taxes, acquired fund fees and expenses (if any), and extraordinary expenses are excluded from the expense caps. Prior to or after the commitment expiration date, the caps may be increased or the commitment to maintain the caps may be terminated only with the approval of the Board of Trustees. Without these caps, the Fund’s returns would have been lower. The expense ratio paid by an investor is the net expense ratio (the total annual fund operating expenses after fee waivers) as stated in the prospectuses. |
| 3 | Historical performance shown for the Institutional Class shares prior to their inception reflects the performance of the Administrator Class shares, and includes the higher expenses applicable to the Administrator Class shares. If these expenses had not been included, returns for the Institutional Class shares would be higher. |
| 4 | The Bloomberg California Municipal Bond Index is the California component of the Bloomberg Municipal Bond Index. You cannot invest directly in an index. |
| 5 | The Bloomberg Municipal Bond Index is an unmanaged index composed of long-term tax-exempt bonds with a minimum credit rating of Baa. You cannot invest directly in an index. |
6 | Allspring California Tax-Free Fund
Performance highlights (unaudited)
Bond values fluctuate in response to the financial condition of individual issuers, general market and economic conditions, and changes in interest rates. Changes in market conditions and government policies may lead to periods of heightened volatility in the bond market and reduced liquidity for certain bonds held by the Fund. In general, when interest rates rise, bond values fall and investors may lose principal value. Interest rate changes and their impact on the Fund and its share price can be sudden and unpredictable. The use of derivatives may reduce returns and/or increase volatility. Certain investment strategies tend to increase the total risk of an investment (relative to the broader market). This fund is exposed to California municipal securities risk, high-yield securities risk, and non-diversification risk. Consult the Fund’s prospectus for additional information on these and other risks. A portion of the Fund’s income may be subject to federal, state, and/or local income taxes or the Alternative Minimum Tax (AMT). Any capital gains distributions may be taxable.
Allspring California Tax-Free Fund | 7
Performance highlights (unaudited)
| Credit quality as of December 31, 20221 |
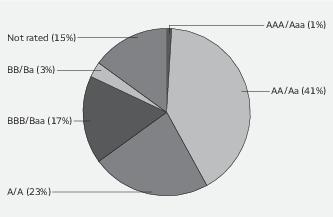
| 1 | The credit quality distribution of portfolio holdings reflected in the chart is based on ratings from Standard & Poor’s, Moody’s Investors Service, and/or Fitch Ratings Ltd. Credit quality ratings apply to the underlying holdings of the Fund and not to the Fund itself. The percentages of the portfolio with the ratings depicted in the chart are calculated based on the market value of fixed income securities held by the Fund. If a security was rated by all three rating agencies, the middle rating was utilized. If rated by two of the three rating agencies, the lower rating was utilized, and if rated by one of the rating agencies, that rating was utilized. Standard & Poor’s rates the creditworthiness of bonds, ranging from AAA (highest) to D (lowest). Ratings from A to CCC may be modified by the addition of a plus (+) or minus (-) sign to show relative standing within the rating categories. Standard & Poor’s rates the creditworthiness of short-term notes from SP-1 (highest) to SP-3 (lowest). Moody’s rates the creditworthiness of bonds, ranging from Aaa (highest) to C (lowest). Ratings Aa to B may be modified by the addition of a number 1 (highest) to 3 (lowest) to show relative standing within the ratings categories. Moody’s rates the creditworthiness of short-term U.S. tax-exempt municipal securities from MIG 1/VMIG 1 (highest) to SG (lowest). Fitch rates the creditworthiness of bonds, ranging from AAA (highest) to D (lowest). Credit quality distribution is subject to change and may have changed since the date specified. |
| Effective maturity distribution as of December 31, 20221 |
| 1 | Figures represent the percentage of the Fund's long-term investments. Allocations are subject to change and may have changed since the date specified. |
8 | Allspring California Tax-Free Fund
Fund expenses (unaudited)
As a shareholder of the Fund, you incur two types of costs: (1) transaction costs, including sales charges (loads) on purchase payments and contingent deferred sales charges (if any) on redemptions and (2) ongoing costs, including management fees, distribution (12b-1) and/or shareholder servicing fees, and other Fund expenses. This example is intended to help you understand your ongoing costs (in dollars) of investing in the Fund and to compare these costs with the ongoing costs of investing in other mutual funds.
The example is based on an investment of $1,000 invested at the beginning of the six-month period and held for the entire period from July 1, 2022 to December 31, 2022.
Actual expenses
The “Actual” line of the table below provides information about actual account values and actual expenses. You may use the information in this line, together with the amount you invested, to estimate the expenses that you paid over the period. Simply divide your account value by $1,000 (for example, an $8,600 account value divided by $1,000 = 8.6), then multiply the result by the number in the “Actual” line under the heading entitled “Expenses paid during period” for your applicable class of shares to estimate the expenses you paid on your account during this period.
Hypothetical example for comparison purposes
The “Hypothetical” line of the table below provides information about hypothetical account values and hypothetical expenses based on the Fund’s actual expense ratio and an assumed rate of return of 5% per year before expenses, which is not the Fund’s actual return. The hypothetical account values and expenses may not be used to estimate the actual ending account balance or expenses you paid for the period. You may use this information to compare the ongoing costs of investing in the Fund and other funds. To do so, compare this 5% hypothetical example with the 5% hypothetical examples that appear in the shareholder reports of the other funds.
Please note that the expenses shown in the table are meant to highlight your ongoing costs only and do not reflect any transactional costs, such as sales charges (loads) and contingent deferred sales charges. Therefore, the “Hypothetical” line of the table is useful in comparing ongoing costs only, and will not help you determine the relative total costs of owning different funds. In addition, if these transactional costs were included, your costs would have been higher.
| | Beginning
account value
7-1-2022 | Ending
account value
12-31-2022 | Expenses
paid during
the period1 | Annualized net
expense ratio |
| Class A | | | | |
| Actual | $1,000.00 | $ 999.36 | $3.78 | 0.75% |
| Hypothetical (5% return before expenses) | $1,000.00 | $1,021.42 | $3.82 | 0.75% |
| Class C | | | | |
| Actual | $1,000.00 | $ 994.95 | $7.54 | 1.50% |
| Hypothetical (5% return before expenses) | $1,000.00 | $1,017.64 | $7.63 | 1.50% |
| Administrator Class | | | | |
| Actual | $1,000.00 | $1,000.40 | $2.77 | 0.55% |
| Hypothetical (5% return before expenses) | $1,000.00 | $1,022.43 | $2.80 | 0.55% |
| Institutional Class | | | | |
| Actual | $1,000.00 | $1,000.75 | $2.42 | 0.48% |
| Hypothetical (5% return before expenses) | $1,000.00 | $1,022.79 | $2.45 | 0.48% |
1 Expenses paid is equal to the annualized net expense ratio of each class multiplied by the average account value over the period, multiplied by 184 divided by 365 (to reflect the one-half-year period).
Allspring California Tax-Free Fund | 9
Portfolio of investments—December 31, 2022 (unaudited)
| | | Interest
rate | Maturity
date | Principal | Value |
| Municipal obligations: 98.43% | | | | | |
| California: 95.39% | | | | | |
| Airport revenue: 4.97% | | | | | |
| Los Angeles CA Department of Airports AMT Subordinated Bond Series A | | 5.00% | 5-15-2047 | $ 5,000,000 | $ 5,063,364 |
| Sacramento County CA Airport System Refunding Bond AMT Senior Series C | | 5.00 | 7-1-2038 | 3,000,000 | 3,106,336 |
| San Diego County CA Regional Airport Authority Revenue Refunding Subordinated Bond Series A | | 5.00 | 7-1-2044 | 3,045,000 | 3,212,698 |
| San Diego County CA Regional Airport Authority Subordinate Airport Revenue Bonds Series 2021 Class B | | 5.00 | 7-1-2056 | 6,040,000 | 6,079,748 |
| San Francisco CA City & County Airport Commission San Francisco International Airport Revenue Bonds Series 2019A | | 5.00 | 5-1-2049 | 5,000,000 | 5,062,723 |
| San Francisco CA City & County Airport Commission San Francisco International Airport Series 2022A | | 4.00 | 5-1-2052 | 1,500,000 | 1,292,230 |
| San Francisco CA City & County Airport Commission San Francisco International Airport Series A | | 5.00 | 5-1-2047 | 7,715,000 | 7,796,866 |
| San Jose CA Airport Revenue Refunding Bond AMT Series A | | 5.00 | 3-1-2047 | 4,000,000 | 4,040,966 |
| San Jose CA Airport Revenue Refunding Bond Series B | | 5.00 | 3-1-2042 | 1,750,000 | 1,815,601 |
| | | | | | 37,470,532 |
| Education revenue: 8.65% | | | | | |
| California CDA Refunding Bond California Baptist University Series A 144A | | 5.00 | 11-1-2032 | 1,135,000 | 1,153,882 |
| California CDA Refunding Bond California Baptist University Series A 144A | | 5.00 | 11-1-2041 | 2,875,000 | 2,789,477 |
| California Educational Facilities Authority Loma Linda University Series A | | 5.00 | 4-1-2042 | 2,645,000 | 2,718,928 |
| California Educational Facilities Authority Revenue Bonds Series 2022A | | 4.00 | 12-1-2050 | 2,735,000 | 2,250,570 |
| California Financial Authority Charter School Palmdale Aerospace Academy Project 144A | | 5.00 | 7-1-2046 | 1,670,000 | 1,482,176 |
| California Municipal Finance Authority California Baptist University Series A 144A | | 5.00 | 11-1-2025 | 660,000 | 666,803 |
| California Municipal Finance Authority Charter School Albert Einstein Academies Project Series A | | 6.75 | 8-1-2033 | 1,525,000 | 1,557,926 |
| California Municipal Finance Authority Charter School Albert Einstein Academies Project Series A | | 7.13 | 8-1-2043 | 1,000,000 | 1,023,538 |
| California Municipal Finance Authority Charter School Palmdale Aerospace Academy Project 144A | | 5.00 | 7-1-2041 | 1,250,000 | 1,146,768 |
| California Municipal Finance Authority Education Revenue Bond Literacy First Charter Schools | | 5.00 | 12-1-2039 | 1,390,000 | 1,426,164 |
| California Municipal Finance Authority Education Revenue Bond Stream Charter School Project 144A | | 5.00 | 6-15-2041 | 925,000 | 845,735 |
| California Municipal Finance Authority Education Revenue Bond Stream Charter School Project Series A 144A | | 5.00 | 6-15-2051 | 1,265,000 | 1,091,812 |
| California Municipal Finance Authority Refunding Bond Biola University Incorporated | | 5.00 | 10-1-2035 | 600,000 | 629,326 |
| California Municipal Finance Authority Revenue Bonds | | 4.00 | 10-1-2046 | 1,930,000 | 1,639,584 |
| California Municipal Finance Authority Revenue Bonds | | 4.00 | 10-1-2051 | 1,150,000 | 947,086 |
| California Municipal Finance Authority Revenue Refunding Bond University Pacific Series A | | 4.00 | 11-1-2042 | 1,600,000 | 1,536,142 |
| California Municipal Finance Authority Revenue Samuel Merritt University Series 2022 | | 5.25 | 6-1-2053 | 9,500,000 | 10,178,554 |
The accompanying notes are an integral part of these financial statements.
10 | Allspring California Tax-Free Fund
Portfolio of investments—December 31, 2022 (unaudited)
| | | Interest
rate | Maturity
date | Principal | Value |
| Education revenue (continued) | | | | | |
| California School Finance Authority Bright Star Schools Obligation Group 144A | | 5.00% | 6-1-2047 | $ 1,000,000 | $ 928,157 |
| California School Finance Authority Bright Star Schools Obligation Group 144A | | 5.00 | 6-1-2054 | 1,000,000 | 910,342 |
| California School Finance Authority Charter School Revenue Aspire Public Schools Series 2021A 144A | | 4.00 | 8-1-2051 | 775,000 | 632,669 |
| California School Finance Authority Charter School Revenue Aspire Public Schools 144A | | 5.00 | 8-1-2050 | 3,540,000 | 3,492,443 |
| California School Finance Authority Charter School Revenue Girls Athletic Leadership Schools 144A | | 4.00 | 6-1-2051 | 905,000 | 632,197 |
| California School Finance Authority Charter School Revenue Lifeline Education Charter School Project 144A | | 5.00 | 7-1-2045 | 800,000 | 728,560 |
| California School Finance Authority Green Dot Public Schools Projects 144A | | 4.00 | 8-1-2025 | 475,000 | 476,262 |
| California School Finance Authority Green Dot Public Schools Projects 144A | | 5.00 | 8-1-2035 | 2,525,000 | 2,569,890 |
| California School Finance Authority KIPP Louisiana School Projects Series A 144A | | 5.00 | 7-1-2035 | 1,000,000 | 1,019,137 |
| California School Finance Authority Rocketship Education Series A 144A | | 5.00 | 6-1-2036 | 945,000 | 900,547 |
| California School Finance Authority Rocketship Education Series A 144A | | 5.00 | 6-1-2046 | 2,100,000 | 1,873,881 |
| California School Finance Authority Santa Clarita Valley International School Project 144A | | 4.00 | 6-1-2041 | 500,000 | 408,806 |
| California School Finance Authority Santa Clarita Valley International School Project 144A | | 4.00 | 6-1-2051 | 650,000 | 485,816 |
| California University Systemwide Refunding Bond Series A | | 5.00 | 11-1-2045 | 6,400,000 | 6,647,710 |
| Fullerton CA PFA Refunding Bond | | 4.00 | 2-1-2051 | 2,500,000 | 2,285,214 |
| Trustees of the California State University Systemwide Revenue Bonds Series 2017A | | 5.00 | 11-1-2047 | 1,000,000 | 1,046,006 |
| University of California Series AI | | 5.00 | 5-15-2038 | 2,000,000 | 2,009,414 |
| University of California Series K | | 4.00 | 5-15-2046 | 5,295,000 | 5,149,338 |
| | | | | | 65,280,860 |
| GO revenue: 21.04% | | | | | |
| Alvord CA Unified School District Election of 2012 Series A (AGM Insured) | | 5.25 | 8-1-2037 | 1,620,000 | 1,642,349 |
| Barstow CA Unified School District Election of 2016 Series C (AGM Insured) | | 5.00 | 8-1-2050 | 1,195,000 | 1,289,006 |
| Bassett CA Unified School District Refunding Bond Series B (BAM Insured) | | 5.00 | 8-1-2027 | 1,050,000 | 1,111,549 |
| California Various Purposes | | 5.00 | 9-1-2032 | 5,100,000 | 5,171,319 |
| California Various Purposes (BAM Insured) | | 5.00 | 9-1-2035 | 35,000,000 | 37,367,411 |
| California Various Purposes | | 5.00 | 2-1-2038 | 5,000,000 | 5,007,667 |
| California Various Purposes | | 5.00 | 8-1-2046 | 10,000,000 | 10,455,256 |
| Centinela Valley CA Union High School District Election of 2008 Series B | | 6.00 | 8-1-2036 | 2,500,000 | 2,544,093 |
| Centinela Valley CA Union High School District Election of 2008 Series C | | 5.00 | 8-1-2035 | 2,000,000 | 2,071,929 |
| Cerritos CA Community College CAB Election of 2004 ¤ | | 0.00 | 8-1-2029 | 1,750,000 | 1,422,109 |
| Cerritos CA Community College CAB Election of 2004 ¤ | | 0.00 | 8-1-2033 | 1,500,000 | 1,036,241 |
| College of the Sequoias Tulare Area Improvement District #3 California CAB Election of 2008 Series A (AGC Insured) ¤ | | 0.00 | 8-1-2024 | 1,000,000 | 950,756 |
| Compton CA Community College CAB Election of 2002 Series C ¤ | | 0.00 | 8-1-2035 | 3,445,000 | 2,080,156 |
The accompanying notes are an integral part of these financial statements.
Allspring California Tax-Free Fund | 11
Portfolio of investments—December 31, 2022 (unaudited)
| | | Interest
rate | Maturity
date | Principal | Value |
| GO revenue (continued) | | | | | |
| Contra Costa County CA Community College District Election of 2006 | | 5.00% | 8-1-2038 | $ 3,250,000 | $ 3,290,238 |
| Delano CA Union High School Election of 2010 Series B (AGM Insured) | | 5.75 | 8-1-2035 | 4,510,000 | 4,519,099 |
| Escondido CA Union High School CAB Election of 2008 Series A (AGC Insured) ¤ | | 0.00 | 8-1-2027 | 8,385,000 | 7,267,858 |
| Garden Grove CA Unified School District Election of 2010 Series C | | 5.25 | 8-1-2037 | 2,000,000 | 2,027,592 |
| Inglewood CA Unified School District Election of 2012 GO Series B (BAM Insured) | | 5.00 | 8-1-2036 | 200,000 | 212,889 |
| Inglewood CA Unified School District Election of 2012 GO Series B (BAM Insured) | | 5.00 | 8-1-2038 | 500,000 | 527,928 |
| Long Beach CA Unified School District CAB Election of 2008 Series B ¤ | | 0.00 | 8-1-2035 | 2,000,000 | 1,222,618 |
| Long Beach CA Unified School District Unrefunded Bond Election of 2008 Series A | | 5.50 | 8-1-2026 | 95,000 | 95,168 |
| Lynwood CA Unified School District Election of 2012 Series A (AGM Insured) | | 5.00 | 8-1-2033 | 5,000 | 5,058 |
| Merced CA City School District Election of 2014 | | 5.00 | 8-1-2045 | 1,000,000 | 1,034,873 |
| Merced CA Union High School District CAB Series C ¤ | | 0.00 | 8-1-2032 | 3,380,000 | 2,417,457 |
| Mount San Antonio CA Community College District CAB Election of 2008 Series A ¤ | | 0.00 | 8-1-2024 | 1,610,000 | 1,540,246 |
| Norwalk-La Mirada CA Unified School District CAB Election of 2002 Series D (AGM Insured) ¤ | | 0.00 | 8-1-2023 | 1,500,000 | 1,471,531 |
| Oakland CA Unified School District Election of 2012 | | 5.50 | 8-1-2023 | 260,000 | 263,641 |
| Oakland CA Unified School District Election of 2012 Series A | | 5.00 | 8-1-2040 | 3,600,000 | 3,819,290 |
| Pajaro Valley CA Unified School District Election of 2012 Series A | | 5.00 | 8-1-2038 | 1,700,000 | 1,721,047 |
| Paramount CA Unified School District CAB Election of 2006 ¤ | | 0.00 | 8-1-2033 | 2,500,000 | 1,679,316 |
| Pomona CA Unified School District Series A (NPFGC Insured) | | 6.55 | 8-1-2029 | 1,480,000 | 1,661,885 |
| Poway CA Unified School District CAB Election of 2008 Improvement District 07-1-A ¤ | | 0.00 | 8-1-2024 | 1,800,000 | 1,715,612 |
| Rialto CA Unified School District CAB Election of 2010 Series A (AGM Insured) ¤ | | 0.00 | 8-1-2026 | 3,320,000 | 2,960,294 |
| Sacramento CA Unified School District Election of 2012 Series A (BAM Insured) | | 5.25 | 8-1-2033 | 1,000,000 | 1,012,419 |
| Sacramento CA Unified School District Election of 2012 Series C (AGM Insured) | | 5.00 | 8-1-2033 | 2,735,000 | 2,884,239 |
| San Bernardino County CA Community Election of 2008 Series D | | 5.00 | 8-1-2045 | 2,000,000 | 2,121,828 |
| San Bernardino County CA Unified School District Election of 2012 Series C (AGM Insured) | | 5.00 | 8-1-2040 | 8,000,000 | 8,309,701 |
| San Diego CA Community College Election of 2002 | | 5.00 | 8-1-2031 | 4,000,000 | 4,051,360 |
| San Diego CA Unified School District | | 4.00 | 7-1-2047 | 2,025,000 | 1,925,730 |
| San Gorgonio CA Memorial Healthcare Refunding Bond | | 5.00 | 8-1-2032 | 1,750,000 | 1,728,829 |
| San Gorgonio CA Memorial Healthcare Refunding Bond | | 5.50 | 8-1-2028 | 2,525,000 | 2,540,577 |
| San Rafael CA City High School District CAB Election of 2002 Series B (NPFGC Insured) ¤ | | 0.00 | 8-1-2023 | 1,260,000 | 1,236,786 |
| San Rafael CA City High School District Election of 2015 Series C | | 4.00 | 8-1-2043 | 1,500,000 | 1,474,503 |
| Sanger CA Unified School District Refunding Bond (NPFGC Insured) | | 5.60 | 8-1-2023 | 55,000 | 55,187 |
| Santa Ana CA Unified School District CAB Election of 2008 Series B (AGC Insured) ¤ | | 0.00 | 8-1-2038 | 15,000,000 | 7,581,845 |
| Sierra Kings CA Health Care District | | 5.00 | 8-1-2028 | 1,000,000 | 1,047,044 |
The accompanying notes are an integral part of these financial statements.
12 | Allspring California Tax-Free Fund
Portfolio of investments—December 31, 2022 (unaudited)
| | | Interest
rate | Maturity
date | Principal | Value |
| GO revenue (continued) | | | | | |
| Sierra Kings CA Health Care District | | 5.00% | 8-1-2032 | $ 1,500,000 | $ 1,569,555 |
| Sierra Kings CA Health Care District | | 5.00 | 8-1-2037 | 1,750,000 | 1,813,995 |
| Sonoma Valley CA Unified School District CAB Election of 2010 Series A ¤ | | 0.00 | 8-1-2027 | 1,020,000 | 876,969 |
| Stockton CA Unified School District Election of 2012 Series A (AGM Insured) | | 5.00 | 8-1-2038 | 1,025,000 | 1,049,409 |
| Tulare CA Local Health Care District Refunding Bond (BAM Insured) | | 4.00 | 8-1-2039 | 1,850,000 | 1,826,253 |
| Washington Township CA Health Care District Election of 2004 Series B | | 5.50 | 8-1-2038 | 1,500,000 | 1,549,991 |
| West Contra Costa CA Unified School District Election of 2005 Series B | | 6.00 | 8-1-2027 | 1,080,000 | 1,229,407 |
| Wiseburn CA School District CAB (AGC Insured) ¤ | | 0.00 | 8-1-2027 | 1,525,000 | 1,317,663 |
| | | | | | 158,806,771 |
| Health revenue: 15.53% | | | | | |
| Association of Bay Area Governments California Finance Authority for Nonprofit Corporation Insured Revenue Bond O'Connor Woods Series 2013 | | 5.00 | 1-1-2043 | 5,000,000 | 5,050,000 |
| Association of Bay Area Governments California Finance Authority for Nonprofit Corporation Insured Senior Living Revenue Bond Odd Fellows Home of California Series 2012 A | | 5.00 | 4-1-2042 | 1,100,000 | 1,104,464 |
| California CDA Adventist Health System Series A | | 5.00 | 3-1-2045 | 2,500,000 | 2,529,716 |
| California CDA Loma Linda University Medical Center Refunding Bond Series A | | 5.25 | 12-1-2044 | 5,150,000 | 5,151,831 |
| California CDA Redwoods Projects | | 5.13 | 11-15-2035 | 1,500,000 | 1,529,801 |
| California CDA Revenue Refunding Bond Adventist Health System West Series A | | 5.00 | 3-1-2048 | 5,000,000 | 5,053,477 |
| California Communities Marin General Hospital Series A | | 5.00 | 8-1-2036 | 700,000 | 723,986 |
| California Communities Marin General Hospital Series A | | 5.00 | 8-1-2037 | 500,000 | 514,610 |
| California Communities Marin General Hospital Series A | | 5.00 | 8-1-2038 | 450,000 | 461,960 |
| California HFFA | | 4.00 | 11-15-2048 | 5,000,000 | 4,750,320 |
| California HFFA | | 4.00 | 11-1-2051 | 3,000,000 | 2,853,155 |
| California HFFA | | 5.00 | 11-15-2046 | 2,040,000 | 2,232,575 |
| California HFFA | | 5.00 | 11-15-2046 | 2,960,000 | 3,016,022 |
| California HFFA El Camino Hospital | | 5.00 | 2-1-2035 | 3,000,000 | 3,174,462 |
| California HFFA LA Biomedical Research Institute at Harbor-UCLA Medical Center | | 5.00 | 9-1-2048 | 6,095,000 | 6,141,685 |
| California HFFA Nevada Methodist Homes | | 5.00 | 7-1-2030 | 1,830,000 | 1,913,801 |
| California HFFA Nevada Methodist Homes | | 5.00 | 7-1-2035 | 1,000,000 | 1,032,280 |
| California HFFA Nevada Methodist Homes | | 5.00 | 7-1-2045 | 4,500,000 | 4,556,761 |
| California HFFA Refunding Bond Cedars-Sinai Medical Center Series B | | 4.00 | 8-15-2039 | 10,500,000 | 10,543,136 |
| California HFFA Refunding Bond Children's Hospital Series A | | 5.00 | 8-15-2047 | 10,050,000 | 10,179,841 |
| California HFFA Senior Health Services | | 5.00 | 8-1-2040 | 700,000 | 725,615 |
| California HFFA Senior Health Services | | 5.00 | 8-1-2050 | 1,000,000 | 1,023,961 |
| California HFFA Series A | | 4.00 | 11-1-2040 | 1,375,000 | 1,355,699 |
| California Municipal Finance Authority Palomar Health Certificate of Participation Series 2022A (AGM Insured) | | 5.25 | 11-1-2052 | 1,500,000 | 1,580,614 |
| California Municipal Finance Authority Refunding Bond Channing House Project Series A | | 5.00 | 5-15-2034 | 1,000,000 | 1,089,556 |
| California Municipal Finance Authority Refunding Bond Eisenhower Medical Center Series A | | 5.00 | 7-1-2047 | 1,400,000 | 1,414,332 |
| California Municipal Finance Authority Revenue Bonds Series 2021 Humangood California Obligated Group | | 4.00 | 10-1-2049 | 2,250,000 | 2,031,599 |
The accompanying notes are an integral part of these financial statements.
Allspring California Tax-Free Fund | 13
Portfolio of investments—December 31, 2022 (unaudited)
| | | Interest
rate | Maturity
date | Principal | Value |
| Health revenue (continued) | | | | | |
| California Municipal Finance Authority Revenue Bonds | | 4.00% | 12-1-2039 | $ 1,240,000 | $ 1,225,569 |
| California Municipal Finance Authority Revenue Bonds | | 4.00 | 9-15-2046 | 3,300,000 | 3,160,443 |
| California Municipal Finance Authority Revenue Bonds | | 4.00 | 12-1-2049 | 2,915,000 | 2,758,480 |
| California Municipal Finance Authority Revenue Bonds | | 4.00 | 9-15-2051 | 3,885,000 | 3,652,707 |
| California Municipal Finance Authority Revenue Bonds | | 5.00 | 7-1-2039 | 1,000,000 | 1,086,668 |
| California Municipal Finance Authority Revenue Bonds | | 5.00 | 7-1-2049 | 2,650,000 | 2,825,657 |
| California Municipal Finance Authority Revenue Bonds Community Health System Series 2021A | | 4.00 | 2-1-2051 | 1,500,000 | 1,344,180 |
| California PFA Refunding Bond Henry Mayo Newhall Hospital | | 5.00 | 10-15-2037 | 500,000 | 509,938 |
| California PFA Refunding Bond Henry Mayo Newhall Hospital | | 5.00 | 10-15-2047 | 5,365,000 | 5,286,513 |
| California PFA Senior Living Enso Village Project Series A 144A | | 5.00 | 11-15-2051 | 1,255,000 | 1,034,856 |
| California PFA Senior Living Enso Village Project Series A 144A | | 5.00 | 11-15-2056 | 1,235,000 | 996,745 |
| California Statewide CDA Revenue Bonds Enloe Medical Center Series 2022A (AGM Insured) | | 5.25 | 8-15-2052 | 2,000,000 | 2,104,079 |
| Palomar Health Refunding Bond | | 5.00 | 11-1-2042 | 4,000,000 | 4,025,119 |
| University of California Regents Medical Center Series J | | 5.00 | 5-15-2033 | 2,265,000 | 2,282,371 |
| University of California Regents Medical Center Unrefunded Bond Series J | | 5.25 | 5-15-2038 | 2,210,000 | 2,218,766 |
| Washington Township CA Health Care District Series A | | 5.00 | 7-1-2042 | 1,000,000 | 981,575 |
| | | | | | 117,228,925 |
| Housing revenue: 7.46% | | | | | |
| California CDA Poway Retirement Housing Foundation Housing Incorporated Series A | | 5.25 | 11-15-2035 | 1,500,000 | 1,534,021 |
| California CDA Uptown Newport Apartments Series 2017 AA & BB (East West Bank LOC) ø | | 3.72 | 3-1-2057 | 3,020,000 | 3,020,000 |
| California Community Housing Agency Essential Housing Revenue Creekwood Series A 144A | | 4.00 | 2-1-2056 | 3,000,000 | 2,294,724 |
| California Community Housing Agency Essential Housing Revenue Serenity at Larkspur Series C 144A | | 5.00 | 2-1-2050 | 3,000,000 | 2,696,666 |
| California Community Housing Agency Workforce Apartments Series A 144A | | 5.00 | 4-1-2049 | 3,000,000 | 2,616,399 |
| California HFA Municipal Certificate of Participation Series 2 Class A (FHLMC Insured) | | 3.75 | 3-25-2035 | 124,963 | 122,479 |
| California HFA Municipal Certificate of Participation Series 2 Class A | | 4.00 | 3-20-2033 | 8,214,328 | 7,930,527 |
| California Municipal Finance Authority AMT Senior Lien Linxs Apartment Project Series A | | 5.00 | 12-31-2043 | 5,730,000 | 5,766,020 |
| California Municipal Finance Authority Mobile Home Park Revenue Caritas Projects Series 2021B | | 4.00 | 8-15-2051 | 870,000 | 735,102 |
| California Municipal Finance Authority Mobile Senior Caritas Projects Series A | | 5.00 | 8-15-2029 | 500,000 | 529,258 |
| California Municipal Finance Authority Special Finance Agency Essential Housing Revenue Bond Series 2021A-2 Junior Bonds Latitude33 144A | | 4.00 | 12-1-2045 | 1,500,000 | 1,156,437 |
| California Municipal Finance Authority Special Finance Agency XII California Essential Housing Revenue Bond Allure Apartments Series A-2 Junior Bonds 144A | | 4.38 | 8-1-2049 | 1,800,000 | 1,388,061 |
| California Municipal Finance Authority Student Housing Revenue Bond CHF Riverside I LLC - University of California Riverside North District Phase 1 Student Housing Project | | 5.00 | 5-15-2029 | 625,000 | 655,483 |
| California Municipal Finance Authority Student Housing Revenue CHF Davis I LLC Orchard Park (BAM Insured) | | 4.00 | 5-15-2033 | 600,000 | 606,056 |
The accompanying notes are an integral part of these financial statements.
14 | Allspring California Tax-Free Fund
Portfolio of investments—December 31, 2022 (unaudited)
| | | Interest
rate | Maturity
date | Principal | Value |
| Housing revenue (continued) | | | | | |
| California Municipal Finance Authority Student Housing Revenue CHF Davis I LLC Orchard Park (BAM Insured) | | 4.00% | 5-15-2034 | $ 700,000 | $ 703,216 |
| California Municipal Finance Authority Student Housing Revenue CHF Davis I LLC Orchard Park (BAM Insured) | | 4.00 | 5-15-2035 | 700,000 | 696,654 |
| California Municipal Finance Authority Student Housing Revenue CHF Davis I LLC Orchard Park (BAM Insured) | | 4.00 | 5-15-2036 | 600,000 | 591,052 |
| California Municipal Finance Authority Student Housing Revenue CHF Davis I LLC Orchard Park (BAM Insured) | | 4.00 | 5-15-2037 | 700,000 | 681,200 |
| California Municipal Finance Authority Student Housing Revenue CHF Davis I LLC Orchard Park (BAM Insured) | | 4.00 | 5-15-2038 | 750,000 | 724,121 |
| California Municipal Finance Authority Student Housing Revenue CHF Davis I LLC West Village Projects | | 5.00 | 5-15-2051 | 6,700,000 | 6,570,154 |
| California Municipal Finance Authority Student Housing Revenue CHF Riverside I LLC Projects | | 5.00 | 5-15-2052 | 5,650,000 | 5,439,334 |
| California Municipal Finance Authority Student Housing Revenue Series 2021 CHF Davis II LLC Orchard Park Student Housing Project (BAM Insured) | | 4.00 | 5-15-2040 | 1,100,000 | 1,041,078 |
| California Statewide CDA Community Improvement Authority Essential Housing Revenue Bond Altana Glendale Series A-2 144A | | 4.00 | 10-1-2056 | 2,000,000 | 1,460,065 |
| California Statewide CDA Community Improvement Authority Essential Housing Revenue Bond Mezzanine Lien Series 2021B 144A | | 4.00 | 5-1-2057 | 1,500,000 | 1,041,072 |
| California Statewide CDA Community Improvement Authority Essential Housing Revenue Bond Mezzanine Lien Series 2022B 144A | | 5.00 | 9-1-2037 | 980,000 | 925,401 |
| California Statewide CDA Community Improvement Authority Essential Housing Revenue Bond Social Bonds Series 2021B 144A | | 4.00 | 4-1-2057 | 1,000,000 | 686,831 |
| Independent Cities California Finance Authority Mobile Home Park Revenue | | 5.00 | 5-15-2048 | 2,000,000 | 2,057,786 |
| Independent Cities California Finance Authority Refunding Bond Sanitary Juan Mobile Estates | | 5.00 | 8-15-2030 | 1,000,000 | 1,031,128 |
| Independent Cities California Finance Authority Refunding Bond Santa Rose Leisure Mobile | | 5.00 | 8-15-2046 | 1,570,000 | 1,588,540 |
| | | | | | 56,288,865 |
| Miscellaneous revenue: 12.81% | | | | | |
| Alameda CA Joint Powers Authority Multiple Capital Projects Series A | | 5.00 | 12-1-2034 | 1,005,000 | 1,023,050 |
| Anaheim CA PFA CAB Subordinate Lien Bond Public Improvements Project Series C (AGM Insured) ¤ | | 0.00 | 9-1-2025 | 10,000,000 | 9,187,256 |
| Anaheim CA PFA Convention Center Expansion Project Series A | | 5.00 | 5-1-2039 | 3,000,000 | 3,089,357 |
| California CDA Community Infrastructure Program Series 2021A | | 4.00 | 9-2-2041 | 995,000 | 866,060 |
| California Communities Series A | | 5.00 | 9-2-2047 | 1,995,000 | 2,025,892 |
| California Enterprise Development Authority Lease Revenue Riverside County Library Facilities Project | | 4.00 | 11-1-2049 | 1,900,000 | 1,752,210 |
| California Infrastructure & Economic Development Bank King City Joint Union High School | | 5.75 | 8-15-2029 | 2,150,000 | 2,151,792 |
| California Infrastructure & Economic Development Bank Lease Revenue | | 5.00 | 8-1-2044 | 4,000,000 | 4,272,666 |
| California Municipal Finance Authority Refunding Bond Southwestern Law School Series 2021 | | 4.00 | 11-1-2041 | 575,000 | 505,250 |
The accompanying notes are an integral part of these financial statements.
Allspring California Tax-Free Fund | 15
Portfolio of investments—December 31, 2022 (unaudited)
| | | Interest
rate | Maturity
date | Principal | Value |
| Miscellaneous revenue (continued) | | | | | |
| California Public Works Board Judicial Council Projects Series A | | 5.00% | 3-1-2038 | $ 7,000,000 | $ 7,018,920 |
| California Public Works Board Various Capital Projects Series I | | 5.50 | 11-1-2033 | 2,000,000 | 2,044,518 |
| Compton CA PFA Refunding Bond 144A | | 4.00 | 9-1-2027 | 5,620,000 | 5,488,976 |
| Fresno CA Joint Powers Financing Authority Lease Revenue Master Lease Projects Series A (AGM Insured) | | 4.00 | 4-1-2046 | 1,225,000 | 1,183,215 |
| Fullerton CA Joint Union High School Project Certificate of Participation (BAM Insured) | | 5.00 | 9-1-2035 | 1,385,000 | 1,458,790 |
| Hayward Unified School District Certificates of Participation Series 2022 | | 5.25 | 8-1-2052 | 8,000,000 | 8,287,370 |
| Independent Cities California Finance Authority Sales Tax Revenue (AGM Insured) 144A | | 4.00 | 6-1-2041 | 1,700,000 | 1,660,420 |
| Independent Cities California Finance Authority Sales Tax Revenue (AGM Insured) 144A | | 4.00 | 6-1-2051 | 750,000 | 680,990 |
| Irvine CA Improvement Bond Act 1915 Limited Obligation Reassessment District #15-2 | | 5.00 | 9-2-2025 | 725,000 | 753,607 |
| Irvine CA Improvement Bond Act 1915 Limited Obligation Reassessment District #15-2 | | 5.00 | 9-2-2026 | 400,000 | 415,781 |
| Irvine CA Improvement Bond Act 1915 Limited Obligation Reassessment District #15-2 | | 5.00 | 9-2-2042 | 1,495,000 | 1,513,054 |
| Jefferson CA Union High School District Certificate of Participation Teacher and Staff Housing Project (BAM Insured) | | 4.00 | 8-1-2045 | 1,400,000 | 1,361,221 |
| Los Angeles CA Public Works Financing Authority Series A | | 5.00 | 12-1-2039 | 2,860,000 | 2,932,231 |
| Modesto CA Irrigation District Financing Authority Series A | | 5.00 | 10-1-2040 | 3,500,000 | 3,625,201 |
| Montclair CA PFA Lease Refunding Bond (AGM Insured) | | 5.00 | 10-1-2035 | 2,400,000 | 2,476,031 |
| Mountain House CA Financing Authority Utility System Revenue Series A | | 5.00 | 12-1-2034 | 535,000 | 559,172 |
| North Coast County Water District San Mateo County Certificate of Participation 2021 (AGM Insured) | | 4.00 | 10-1-2051 | 1,745,000 | 1,665,140 |
| Porterville CA Water Revenue Certificate of Participation Water System Financing Project (AGM Insured) | | 4.00 | 8-15-2050 | 1,000,000 | 907,678 |
| Riverside County CA Asset Leasing Corporation Riverside County Hospital Project (NPFGC Insured) ¤ | | 0.00 | 6-1-2026 | 10,000,000 | 8,952,620 |
| Sacramento CA City Financing Authority Refunding Bond Master Lease Program Facilities (BAM Insured) | | 5.00 | 12-1-2035 | 1,300,000 | 1,374,497 |
| Sacramento CA City School Joint Refunding Bond Series A (BAM Insured) | | 5.00 | 3-1-2040 | 2,165,000 | 2,203,147 |
| San Jose CA Unified School District CAB (AGM Insured) ¤ | | 0.00 | 1-1-2026 | 3,175,000 | 2,917,251 |
| San Marino CA Unified School District Certificate of Participation Los Angeles County Schools Pooled Financing Program Series A | | 5.00 | 12-1-2041 | 500,000 | 500,476 |
| Stockton CA Unified School District Community Improvement Project | | 5.00 | 2-1-2033 | 550,000 | 599,206 |
| Sutter Butte CA Flood Control Agency (BAM Insured) | | 5.00 | 10-1-2040 | 3,545,000 | 3,690,628 |
| Torrance CA Certificate of Participation | | 5.25 | 6-1-2039 | 5,385,000 | 5,571,117 |
| Upland CA Certificate of Participation San Antonio Regional Hospital | | 5.00 | 1-1-2047 | 1,955,000 | 1,985,671 |
| | | | | | 96,700,461 |
| Tax revenue: 14.71% | | | | | |
| Beaumont CA Community Facilities District #93-1 Special Tax Improvement Area #17C | | 5.00 | 9-1-2043 | 750,000 | 762,958 |
| Beaumont CA Community Facilities District #93-1 Special Tax Improvement Area #17C | | 5.00 | 9-1-2048 | 1,100,000 | 1,110,051 |
The accompanying notes are an integral part of these financial statements.
16 | Allspring California Tax-Free Fund
Portfolio of investments—December 31, 2022 (unaudited)
| | | Interest
rate | Maturity
date | Principal | Value |
| Tax revenue (continued) | | | | | |
| Beaumont CA Community Facilities District #93-1 Special Tax Improvement Area #8D Series A | | 5.00% | 9-1-2043 | $ 750,000 | $ 762,958 |
| Beaumont CA Community Facilities District #93-1 Special Tax Improvement Area #8D Series A | | 5.00 | 9-1-2048 | 1,035,000 | 1,044,457 |
| Belmont CA Community Facilities Special Tax District #2000-1 Library Project Series A (Ambac Insured) | | 5.75 | 8-1-2030 | 3,190,000 | 3,657,883 |
| California CDA Community Facilities District #2015-01 | | 5.00 | 9-1-2047 | 1,420,000 | 1,439,081 |
| California CDA Special Tax Community Facilities District #2017-01 | | 5.00 | 9-1-2048 | 5,000,000 | 5,072,888 |
| California CDA Special Tax Community Facilities District #2020-02 | | 4.00 | 9-1-2051 | 1,150,000 | 965,419 |
| Cathedral City CA RDA Successor Agency to Merged Redevelopment Project Tax Allocation Bond Series A (BAM Insured) | | 4.00 | 8-1-2032 | 1,050,000 | 1,103,862 |
| Cathedral City CA RDA Successor Agency to Merged Redevelopment Project Tax Allocation Bond Series A (BAM Insured) | | 4.00 | 8-1-2034 | 1,250,000 | 1,296,077 |
| Cathedral City CA RDA Successor Agency to Merged Redevelopment Project Tax Allocation Bond Series A (AGM Insured) | | 5.00 | 8-1-2032 | 1,450,000 | 1,502,168 |
| Cathedral City CA RDA Successor Agency to Merged Redevelopment Project Tax Allocation Bond Series A (AGM Insured) | | 5.00 | 8-1-2033 | 880,000 | 911,562 |
| Chino CA Community Facilities District Special Tax Bond #2003-3 Improvement Area #7 | | 5.00 | 9-1-2048 | 2,500,000 | 2,533,965 |
| Chula Vista CA Community Facilities District Special Tax Bond #16-I Improvement Area #1 | | 5.00 | 9-1-2043 | 445,000 | 454,909 |
| Chula Vista CA Community Facilities District Special Tax Bond #16-I Improvement Area #1 | | 5.00 | 9-1-2048 | 895,000 | 908,491 |
| City of Roseville CA | | 5.00 | 9-1-2045 | 1,280,000 | 1,308,567 |
| Corona CA Community Facilities District Special Tax Bond #2018-1 Improvement Area #1 Series A | | 5.00 | 9-1-2048 | 1,000,000 | 1,011,428 |
| Corona Norco CA Unified School Districts Special Tax Bond Community Facilities District #16-1 | | 5.00 | 9-1-2048 | 1,500,000 | 1,522,611 |
| Dinuba CA RDA Merged City Redevelopment Project (BAM Insured) | | 5.00 | 9-1-2033 | 1,500,000 | 1,556,453 |
| Elk Grove CA Financing Authority Special Tax Refunding Bond (BAM Insured) | | 5.00 | 9-1-2038 | 1,500,000 | 1,570,992 |
| Fairfield CA Community Facilities District Special Tax Bond #2019 One Lake Improvement Area 144A | | 5.00 | 9-1-2050 | 3,000,000 | 3,037,705 |
| Folsom Ranch Financing Authority California Facilities District #20 Russell Ranch | | 5.00 | 9-1-2048 | 1,650,000 | 1,625,888 |
| Fremont CA Community Facilities District #1 Refunding Bond | | 5.00 | 9-1-2040 | 2,700,000 | 2,736,981 |
| Inglewood CA Redevelopment Successor Agency to Merged Redevelopment Project Tax Allocation Refunding Subordinate Lien Series A (BAM Insured) | | 5.00 | 5-1-2038 | 305,000 | 324,598 |
| Inglewood CA Redevelopment Successor Agency to Merged Redevelopment Project Tax Allocation Refunding Subordinate Lien Series A (BAM Insured) | | 5.00 | 5-1-2034 | 500,000 | 541,319 |
| Inland Valley CA Development Agency Series A | | 5.25 | 9-1-2037 | 4,000,000 | 4,073,504 |
| Lafayette CA RDA Refunding Bond Lafayette Redevelopment Project (AGM Insured) | | 5.00 | 8-1-2033 | 1,500,000 | 1,553,799 |
| Lafayette CA RDA Refunding Bond Lafayette Redevelopment Project (AGM Insured) | | 5.00 | 8-1-2038 | 1,635,000 | 1,687,733 |
The accompanying notes are an integral part of these financial statements.
Allspring California Tax-Free Fund | 17
Portfolio of investments—December 31, 2022 (unaudited)
| | | Interest
rate | Maturity
date | Principal | Value |
| Tax revenue (continued) | | | | | |
| Lancaster CA RDA Tax Allocation Refunding Bond Combined Redevelopment Project Areas (AGM Insured) | | 5.00% | 8-1-2033 | $ 1,200,000 | $ 1,284,195 |
| Los Angeles CA Community Facilities District #11 Ponte Vista Special Tax Series 2021 | | 4.00 | 9-1-2046 | 1,250,000 | 1,076,102 |
| Oakland CA Redevelopment Successor Agency Refunding Bond Subordinate Series TE (AGM Insured) | | 5.00 | 9-1-2035 | 2,545,000 | 2,670,598 |
| Oakland CA Redevelopment Successor Agency Refunding Bond Subordinate Series TE (AGM Insured) | | 5.00 | 9-1-2036 | 4,000,000 | 4,188,387 |
| Orange County CA Community Facilities District #2015-1 Esencia Village Series A | | 5.25 | 8-15-2045 | 1,950,000 | 1,978,416 |
| Rancho Cucamonga CA RDA Rancho Redevelopment Project Area (AGM Insured) | | 5.00 | 9-1-2032 | 1,870,000 | 1,937,858 |
| Redwood City CA RDA CAB Redevelopment Project Area Series 2-A (Ambac Insured) ¤ | | 0.00 | 7-15-2030 | 3,505,000 | 2,711,706 |
| Rio Vista CA Community Facilities District Special Tax #2018-1 | | 5.00 | 9-1-2048 | 1,185,000 | 1,189,422 |
| River Islands PFA California Community Facilities District No. 2016-1 (AGM Insured) | | 5.25 | 9-1-2052 | 2,000,000 | 2,151,345 |
| Riverside County CA Community Facilities Districts Special Tax #05-8 | | 5.00 | 9-1-2048 | 1,600,000 | 1,624,118 |
| Romoland School District Community Facilities District #2004-1 Heritage Lake Improvement Area #4 Series 2018 Special Tax Bond | | 5.00 | 9-1-2048 | 3,000,000 | 3,022,979 |
| Sacramento CA Transient Occupancy Tax Convention Center Complex Series A | | 5.00 | 6-1-2048 | 3,750,000 | 3,906,124 |
| San Bernardino CA Special Tax Community Facilities District #2006-1 Series 2018 | | 5.00 | 9-1-2048 | 1,200,000 | 1,218,089 |
| San Clemente CA Special Tax Community Facilities District #2006-1 | | 5.00 | 9-1-2040 | 965,000 | 978,217 |
| San Clemente CA Special Tax Community Facilities District #2006-1 | | 5.00 | 9-1-2046 | 1,175,000 | 1,185,106 |
| San Diego CA RDA CAB Tax Allocation Centre (AGM Insured) ¤ | | 0.00 | 9-1-2023 | 885,000 | 866,836 |
| San Francisco CA City & County Community Facilities District #2014-1 Transbay Transit Center Special Tax Bonds Series 2022A | | 5.00 | 9-1-2052 | 1,000,000 | 1,049,611 |
| San Francisco CA City & County Community Facilities District #2016-1 Improvement Area #1 Special Tax Treasure Island | | 4.00 | 9-1-2051 | 1,250,000 | 1,052,693 |
| San Francisco CA City & County Community Facilities District #2016-1 Improvement Area #1 Special Tax Treasure Island Series 2021 | | 4.00 | 9-1-2041 | 1,000,000 | 899,591 |
| San Francisco CA City & County Community Facilities District #2016-1 Improvement Area #2 Special Tax Treasure Island Series 2022A 144A | | 4.00 | 9-1-2052 | 1,750,000 | 1,465,588 |
| San Francisco CA City & County Community Facilities District #2020-1 Mission Rock Facilities and Services Special Tax Series 2021C 144A | | 4.00 | 9-1-2051 | 3,900,000 | 3,095,104 |
| San Francisco CA City & County RDA CAB Mission Bay South Redevelopment Project Subordinate Bond Series D 144A¤ | | 0.00 | 8-1-2026 | 4,000,000 | 3,398,926 |
| San Francisco CA City & County RDA Mission Bay South Redevelopment Project Series A | | 5.00 | 8-1-2043 | 2,500,000 | 2,574,822 |
| San Francisco CA City & County RDA Tax Transbay Infrastructure Project Third Lien Series B (AGM Insured) | | 5.00 | 8-1-2046 | 1,500,000 | 1,585,881 |
| San Marcos CA Unified School District Special Tax Community Facilities District #4 (BAM Insured) | | 5.00 | 9-1-2034 | 1,705,000 | 1,763,953 |
The accompanying notes are an integral part of these financial statements.
18 | Allspring California Tax-Free Fund
Portfolio of investments—December 31, 2022 (unaudited)
| | | Interest
rate | Maturity
date | Principal | Value |
| Tax revenue (continued) | | | | | |
| San Marcos CA Unified School District Special Tax Community Facilities District #5 (BAM Insured) | | 5.00% | 9-1-2028 | $ 1,290,000 | $ 1,333,542 |
| San Marcos CA Unified School District Special Tax Community Facilities District #5 (BAM Insured) | | 5.00 | 9-1-2029 | 1,325,000 | 1,369,723 |
| Sonoma CA CDA Successor Agency to Sonoma Redevelopment Project Tax Allocation Bond (NPFGC Insured) | | 5.00 | 6-1-2033 | 1,325,000 | 1,420,016 |
| Successor Agency to the Marina Redevelopment Agency Tax Allocation Bonds Series A | | 5.00 | 9-1-2033 | 340,000 | 359,500 |
| Successor Agency to the Marina Redevelopment Agency Tax Allocation Bonds Series A | | 5.00 | 9-1-2038 | 400,000 | 415,557 |
| Successor Agency to the Marina Redevelopment Agency Tax Allocation Bonds Series B | | 5.00 | 9-1-2033 | 250,000 | 264,404 |
| Successor Agency to the Marina Redevelopment Agency Tax Allocation Bonds Series B | | 5.00 | 9-1-2038 | 250,000 | 259,723 |
| Temescal Valley Water District Improvement Area #2 2021 Special Tax Bonds | | 4.00 | 9-1-2051 | 930,000 | 779,356 |
| Tracy Hills CA Improvement Area #1 Community Facilities District #2016-1 Special Tax Bonds Series 2018 | | 5.00 | 9-1-2048 | 2,750,000 | 2,787,361 |
| Transbay Joint Powers Authority Tax Allocation California Senior Series A Green Bonds | | 5.00 | 10-1-2045 | 2,000,000 | 2,049,982 |
| Transbay Joint Powers Authority Tax Allocation California Senior Series A Green Bonds | | 5.00 | 10-1-2049 | 2,200,000 | 2,225,587 |
| Tustin CA Community Facilities District Special Tax #2014-1 Legacy/Standard Pacific Series A | | 5.00 | 9-1-2040 | 750,000 | 760,085 |
| Tustin CA Community Facilities District Special Tax #2014-1 Legacy/Standard Pacific Series A | | 5.00 | 9-1-2045 | 1,000,000 | 1,008,364 |
| Union City CA Community RDA Successor Agency to Community Redevelopment Project Tax Allocation Refunding Bond Series A | | 5.00 | 10-1-2036 | 1,000,000 | 1,047,534 |
| | | | | | 111,034,708 |
| Tobacco revenue: 0.86% | | | | | |
| California County CA Tobacco Securitization Agency | | 5.00 | 6-1-2050 | 1,170,000 | 1,154,474 |
| California County CA Tobacco Securitization Agency CAB ¤ | | 0.00 | 6-1-2055 | 14,000,000 | 2,577,366 |
| Golden State Tobacco Securitization Corporation California Tobacco Settlement Refunding Bond Series A-1 | | 5.00 | 6-1-2028 | 2,000,000 | 2,213,711 |
| Northern California Tobacco Securitization Authority Tobacco Settlement CAB Asset-Backed Refunding Bonds Class 2 Series B-2 ¤ | | 0.00 | 6-1-2060 | 3,250,000 | 504,899 |
| | | | | | 6,450,450 |
| Transportation revenue: 0.25% | | | | | |
| Riverside County CA Transportation Commission Toll Revenue 2021 Series B-1 | | 4.00 | 6-1-2046 | 2,000,000 | 1,850,722 |
| Utilities revenue: 6.49% | | | | | |
| Banning CA Financing Authority Refunding Bond Electric System Project (AGM Insured) | | 5.00 | 6-1-2037 | 5,000,000 | 5,222,076 |
| Imperial Irrigation District Electric System Refunding Bond Series A | | 5.00 | 11-1-2045 | 1,060,000 | 1,103,254 |
| Imperial Irrigation District Electric System Refunding Bond Series A | | 5.00 | 11-1-2040 | 3,715,000 | 3,877,150 |
| Imperial Irrigation District Electric System Refunding Bond Series C | | 5.00 | 11-1-2038 | 2,500,000 | 2,622,309 |
The accompanying notes are an integral part of these financial statements.
Allspring California Tax-Free Fund | 19
Portfolio of investments—December 31, 2022 (unaudited)
| | | Interest
rate | Maturity
date | Principal | Value |
| Utilities revenue (continued) | | | | | |
| Lassen CA Municipal Utility District Certificate of Participation | | 4.00% | 5-1-2038 | $ 2,615,000 | $ 2,482,621 |
| Lassen CA Municipal Utility District Certificate of Participation | | 4.00 | 5-1-2041 | 2,250,000 | 2,112,728 |
| Lassen CA Municipal Utility District Certificate of Participation | | 4.00 | 5-1-2046 | 4,395,000 | 4,049,666 |
| Lassen CA Municipal Utility District Certificate of Participation | | 4.00 | 5-1-2051 | 2,340,000 | 2,109,416 |
| Los Angeles CA Department of Water and Power Series E | | 5.00 | 7-1-2044 | 12,475,000 | 12,747,203 |
| M-S-R California Energy Authority Gas Series B | | 7.00 | 11-1-2034 | 4,000,000 | 4,942,879 |
| M-S-R California Energy Authority Gas Series C | | 6.13 | 11-1-2029 | 935,000 | 1,034,853 |
| Redding CA Joint Powers Financing Authority Election System Series A | | 5.00 | 6-1-2032 | 440,000 | 466,912 |
| Roseville CA Natural Gas Financing Authority | | 5.00 | 2-15-2025 | 1,930,000 | 1,972,060 |
| Southern California Public Power Authority Natural Gas Project #1 Series A | | 5.25 | 11-1-2025 | 1,000,000 | 1,042,741 |
| Walnut Energy Center Authority Series A | | 5.00 | 1-1-2034 | 3,115,000 | 3,202,643 |
| | | | | | 48,988,511 |
| Water & sewer revenue: 2.62% | | | | | |
| Adelanto CA Public Utility Authority Refunding Bond (AGM Insured) | | 5.00 | 7-1-2039 | 2,000,000 | 2,139,470 |
| Bay Area CA Water Supply & Conservation Agency Series A | | 5.00 | 10-1-2034 | 6,000,000 | 6,028,008 |
| Compton CA Sewer Revenue | | 6.00 | 9-1-2039 | 1,775,000 | 1,775,254 |
| El Dorado CA Irrigation District Refunding Bond Series A (AGM Insured) | | 5.25 | 3-1-2039 | 2,000,000 | 2,056,050 |
| Florin CA Resource Conservation Refunding Bond Second Senior Lien Series A (NPFGC Insured) | | 5.00 | 9-1-2032 | 2,000,000 | 2,062,908 |
| Merced Irrigation District Water & Hydroelectric System Series A (AGM Insured) | | 5.00 | 10-1-2038 | 4,000,000 | 4,127,405 |
| Tulare CA Sewer Refunding Bond (AGM Insured) | | 5.00 | 11-15-2041 | 1,500,000 | 1,563,587 |
| | | | | | 19,752,682 |
| | | | | | 719,853,487 |
| Guam: 0.87% | | | | | |
| Tax revenue: 0.12% | | | | | |
| Guam Government Business Privilege Tax Revenue Refunding Bond Series 2021 F | | 4.00 | 1-1-2036 | 1,000,000 | 934,523 |
| Water & sewer revenue: 0.75% | | | | | |
| Guam Government Waterworks Authority | | 5.25 | 7-1-2033 | 1,500,000 | 1,516,688 |
| Guam Government Waterworks Authority | | 5.50 | 7-1-2043 | 3,125,000 | 3,163,551 |
| Guam Government Waterworks Authority Series A | | 5.00 | 1-1-2050 | 1,000,000 | 991,081 |
| | | | | | 5,671,320 |
| | | | | | 6,605,843 |
| Illinois: 1.35% | | | | | |
| Miscellaneous revenue: 1.35% | | | | | |
| Illinois Refunding Bond | | 5.00 | 2-1-2025 | 10,000,000 | 10,204,916 |
The accompanying notes are an integral part of these financial statements.
20 | Allspring California Tax-Free Fund
Portfolio of investments—December 31, 2022 (unaudited)
| | | Interest
rate | Maturity
date | Principal | Value |
| New York: 0.67% | | | | | |
| Industrial development revenue: 0.67% | | | | | |
| New York Transportation Development Corporation Special Facilities Revenue Delta Air Lines Incorporated LaGuardia Airport Terminals C&D Redevelopment | | 5.00% | 1-1-2029 | $ 5,000,000 | $ 5,097,140 |
| Ohio: 0.08% | | | | | |
| Tobacco revenue: 0.08% | | | | | |
| Buckeye Tobacco Settlement Financing Authority CAB ¤ | | 0.00 | 6-1-2057 | 5,000,000 | 572,241 |
| Texas: 0.07% | | | | | |
| Resource recovery revenue: 0.07% | | | | | |
| Port Arthur TX Navigation District Jefferson County Environmental Facilities Motiva Enterprises LLC Project Series C ø | | 4.21 | 4-1-2040 | 500,000 | 500,000 |
| Total Municipal obligations (Cost $762,021,637) | | | | | 742,833,627 |
| | | Yield | | Shares | |
| Short-term investments: 0.68% | | | | | |
| Investment companies: 0.68% | | | | | |
| Allspring Municipal Cash Management Money Market Fund Institutional Class ♠∞ | | 3.56 | | 5,114,208 | 5,115,231 |
| Total Short-term investments (Cost $5,114,988) | | | | | 5,115,231 |
| Total investments in securities (Cost $767,136,625) | 99.11% | | | | 747,948,858 |
| Other assets and liabilities, net | 0.89 | | | | 6,695,853 |
| Total net assets | 100.00% | | | | $754,644,711 |
| 144A | The security may be resold in transactions exempt from registration, normally to qualified institutional buyers, pursuant to Rule 144A under the Securities Act of 1933. |
| ¤ | The security is issued in zero coupon form with no periodic interest payments. |
| ø | Variable rate demand notes are subject to a demand feature which reduces the effective maturity. The maturity date shown represents the final maturity date of the security. The interest rate is determined and reset by the issuer daily, weekly, or monthly depending upon the terms of the security. The rate shown is the rate in effect at period end. |
| ♠ | The issuer of the security is an affiliated person of the Fund as defined in the Investment Company Act of 1940. |
| ∞ | The rate represents the 7-day annualized yield at period end. |
| Abbreviations: |
| AGC | Assured Guaranty Corporation |
| AGM | Assured Guaranty Municipal |
| Ambac | Ambac Financial Group Incorporated |
| AMT | Alternative minimum tax |
| BAM | Build America Mutual Assurance Company |
| CAB | Capital appreciation bond |
| CDA | Community Development Authority |
| FHLMC | Federal Home Loan Mortgage Corporation |
| GO | General obligation |
| HFA | Housing Finance Authority |
| HFFA | Health Facilities Financing Authority |
| LOC | Letter of credit |
| NPFGC | National Public Finance Guarantee Corporation |
| PFA | Public Finance Authority |
| RDA | Redevelopment Authority |
The accompanying notes are an integral part of these financial statements.
Allspring California Tax-Free Fund | 21
Portfolio of investments—December 31, 2022 (unaudited)
Investments in affiliates
An affiliated investment is an investment in which the Fund owns at least 5% of the outstanding voting shares of the issuer or as a result of other relationships, such as the Fund and the issuer having the same investment manager. Transactions with issuers that were affiliates of the Fund at the end of the period were as follows:
| | Value,
beginning of
period | Purchases | Sales
proceeds | Net
realized
gains
(losses) | Net
change in
unrealized
gains
(losses) | Value,
end of
period | Shares,
end
of period | Income
from
affiliated
securities |
| Short-term investments | | | | | | | |
| Allspring Municipal Cash Management Money Market Fund Institutional Class | $11,287,598 | $238,834,962 | $(245,005,594) | $(1,435) | $(300) | $5,115,231 | 5,114,208 | $156,507 |
The accompanying notes are an integral part of these financial statements.
22 | Allspring California Tax-Free Fund
Statement of assets and liabilities—December 31, 2022 (unaudited)
| | |
| Assets | |
Investments in unaffiliated securities, at value (cost $762,021,637)
| $ 742,833,627 |
Investments in affiliated securities, at value (cost $5,114,988)
| 5,115,231 |
Cash
| 618 |
Receivable for interest
| 9,955,421 |
Receivable for Fund shares sold
| 1,693,022 |
Prepaid expenses and other assets
| 58,000 |
Total assets
| 759,655,919 |
| Liabilities | |
Payable for Fund shares redeemed
| 3,944,046 |
Dividends payable
| 607,084 |
Management fee payable
| 209,586 |
Administration fees payable
| 85,356 |
Distribution fee payable
| 7,403 |
Trustees’ fees and expenses payable
| 790 |
Accrued expenses and other liabilities
| 156,943 |
Total liabilities
| 5,011,208 |
Total net assets
| $754,644,711 |
| Net assets consist of | |
Paid-in capital
| $ 850,818,800 |
Total distributable loss
| (96,174,089) |
Total net assets
| $754,644,711 |
| Computation of net asset value and offering price per share | |
Net assets – Class A
| $ 345,629,824 |
Shares outstanding – Class A1
| 32,993,204 |
Net asset value per share – Class A
| $10.48 |
Maximum offering price per share – Class A2
| $10.97 |
Net assets – Class C
| $ 10,757,039 |
Shares outstanding – Class C1
| 1,006,960 |
Net asset value per share – Class C
| $10.68 |
Net assets – Administrator Class
| $ 162,601,243 |
Shares outstanding – Administrator Class1
| 15,492,256 |
Net asset value per share – Administrator Class
| $10.50 |
Net assets – Institutional Class
| $ 235,656,605 |
Shares outstanding – Institutional Class1
| 22,453,357 |
Net asset value per share – Institutional Class
| $10.50 |
| 1 | The Fund has an unlimited number of authorized shares. |
| 2 | Maximum offering price is computed as 100/95.50 of net asset value. On investments of $50,000 or more, the offering price is reduced. |
The accompanying notes are an integral part of these financial statements.
Allspring California Tax-Free Fund | 23
Statement of operations—six months ended December 31, 2022 (unaudited)
| | |
| Investment income | |
Interest
| $ 17,644,494 |
Income from affiliated securities
| 156,507 |
Total investment income
| 17,801,001 |
| Expenses | |
Management fee
| 1,826,543 |
| Administration fees | |
Class A
| 299,756 |
Class C
| 8,881 |
Administrator Class
| 135,586 |
Institutional Class
| 113,967 |
| Shareholder servicing fees | |
Class A
| 467,622 |
Class C
| 13,819 |
Administrator Class
| 337,770 |
| Distribution fee | |
Class C
| 41,458 |
Custody and accounting fees
| 26,722 |
Professional fees
| 34,990 |
Registration fees
| 30,557 |
Shareholder report expenses
| 19,407 |
Trustees’ fees and expenses
| 11,160 |
Other fees and expenses
| 3,919 |
Total expenses
| 3,372,157 |
| Less: Fee waivers and/or expense reimbursements | |
Fund-level
| (58,742) |
Class A
| (128,675) |
Class C
| (3,268) |
Administrator Class
| (266,070) |
Net expenses
| 2,915,402 |
Net investment income
| 14,885,599 |
| Realized and unrealized gains (losses) on investments | |
| Net realized losses on | |
Unaffiliated securities
| (29,970,088) |
Affiliated securities
| (1,435) |
Net realized losses on investments
| (29,971,523) |
| Net change in unrealized gains (losses) on | |
Unaffiliated securities
| 11,237,346 |
Affiliated securities
| (300) |
Net change in unrealized gains (losses) on investments
| 11,237,046 |
Net realized and unrealized gains (losses) on investments
| (18,734,477) |
Net decrease in net assets resulting from operations
| $ (3,848,878) |
The accompanying notes are an integral part of these financial statements.
24 | Allspring California Tax-Free Fund
Statement of changes in net assets
| | | | | |
| | Six months ended
December 31, 2022
(unaudited) | Year ended
June 30, 2022 |
| Operations | | | | |
Net investment income
| | $ 14,885,599 | | $ 33,632,993 |
Net realized losses on investments
| | (29,971,523) | | (19,017,886) |
Net change in unrealized gains (losses) on investments
| | 11,237,046 | | (139,862,538) |
Net decrease in net assets resulting from operations
| | (3,848,878) | | (125,247,431) |
| Distributions to shareholders from | | | | |
| Net investment income and net realized gains | | | | |
Class A
| | (5,691,671) | | (12,231,031) |
Class C
| | (127,457) | | (290,228) |
Administrator Class
| | (4,363,679) | | (10,633,943) |
Institutional Class
| | (4,703,548) | | (10,482,832) |
Total distributions to shareholders
| | (14,886,355) | | (33,638,034) |
| Capital share transactions | Shares | | Shares | |
| Proceeds from shares sold | | | | |
Class A
| 1,394,177 | 14,571,152 | 8,830,381 | 104,258,640 |
Class C
| 86,006 | 913,270 | 77,931 | 931,768 |
Administrator Class
| 6,872,600 | 72,820,451 | 7,732,532 | 89,652,025 |
Institutional Class
| 7,418,692 | 78,398,109 | 13,875,016 | 158,722,682 |
| | | 166,702,982 | | 353,565,115 |
| Reinvestment of distributions | | | | |
Class A
| 511,836 | 5,362,049 | 1,008,834 | 11,677,026 |
Class C
| 11,777 | 125,713 | 24,246 | 287,042 |
Administrator Class
| 405,760 | 4,263,818 | 907,189 | 10,502,816 |
Institutional Class
| 186,801 | 1,961,656 | 392,088 | 4,547,445 |
| | | 11,713,236 | | 27,014,329 |
| Payment for shares redeemed | | | | |
Class A
| (7,649,361) | (81,091,718) | (11,212,029) | (130,013,134) |
Class C
| (154,104) | (1,656,416) | (579,735) | (6,824,136) |
Administrator Class
| (23,945,407) | (250,288,503) | (7,910,999) | (89,148,723) |
Institutional Class
| (13,705,016) | (143,920,577) | (17,310,888) | (195,721,790) |
| | | (476,957,214) | | (421,707,783) |
Net decrease in net assets resulting from capital share transactions
| | (298,540,996) | | (41,128,339) |
Total decrease in net assets
| | (317,276,229) | | (200,013,804) |
| Net assets | | | | |
Beginning of period
| | 1,071,920,940 | | 1,271,934,744 |
End of period
| | $ 754,644,711 | | $1,071,920,940 |
The accompanying notes are an integral part of these financial statements.
Allspring California Tax-Free Fund | 25
Financial highlights
(For a share outstanding throughout each period)
| | | Year ended June 30 |
| Class A | Six months ended
December 31, 2022
(unaudited) | 2022 | 2021 | 2020 | 2019 | 2018 |
Net asset value, beginning of period
| $10.65 | $12.13 | $11.91 | $11.91 | $11.64 | $11.83 |
Net investment income
| 0.16 | 0.30 | 0.32 | 0.35 | 0.37 | 0.37 |
Net realized and unrealized gains (losses) on investments
| (0.17) | (1.48) | 0.22 | (0.00) 1 | 0.28 | (0.19) |
Total from investment operations
| (0.01) | (1.18) | 0.54 | 0.35 | 0.65 | 0.18 |
| Distributions to shareholders from | | | | | | |
Net investment income
| (0.16) | (0.30) | (0.32) | (0.35) | (0.38) | (0.37) |
Net asset value, end of period
| $10.48 | $10.65 | $12.13 | $11.91 | $11.91 | $11.64 |
Total return2
| (0.06)% | (9.90)% | 4.59% | 2.93% | 5.70% | 1.55% |
| Ratios to average net assets (annualized) | | | | | | |
Gross expenses
| 0.82% | 0.81% | 0.81% | 0.81% | 0.83% | 0.83% |
Net expenses
| 0.75% | 0.75% | 0.75% | 0.75% | 0.75% | 0.75% |
Net investment income
| 3.04% | 2.57% | 2.66% | 2.92% | 3.22% | 3.15% |
| Supplemental data | | | | | | |
Portfolio turnover rate
| 4% | 17% | 9% | 23% | 9% | 33% |
Net assets, end of period (000s omitted)
| $345,630 | $412,553 | $486,668 | $494,450 | $482,395 | $443,165 |
| 1 | Amount is more than $(0.005) |
| 2 | Total return calculations do not include any sales charges. Returns for periods of less than one year are not annualized. |
The accompanying notes are an integral part of these financial statements.
26 | Allspring California Tax-Free Fund
Financial highlights
(For a share outstanding throughout each period)
| | | Year ended June 30 |
| Class C | Six months ended
December 31, 2022
(unaudited) | 2022 | 2021 | 2020 | 2019 | 2018 |
Net asset value, beginning of period
| $10.86 | $12.37 | $12.14 | $12.15 | $11.87 | $12.07 |
Net investment income
| 0.13 | 0.22 | 0.24 | 0.27 | 0.29 | 0.29 |
Net realized and unrealized gains (losses) on investments
| (0.18) | (1.51) | 0.23 | (0.02) | 0.29 | (0.20) |
Total from investment operations
| (0.05) | (1.29) | 0.47 | 0.25 | 0.58 | 0.09 |
| Distributions to shareholders from | | | | | | |
Net investment income
| (0.13) | (0.22) | (0.24) | (0.26) | (0.30) | (0.29) |
Net asset value, end of period
| $10.68 | $10.86 | $12.37 | $12.14 | $12.15 | $11.87 |
Total return1
| (0.50)% | (10.58)% | 3.86% | 2.08% | 4.95% | 0.74% |
| Ratios to average net assets (annualized) | | | | | | |
Gross expenses
| 1.57% | 1.56% | 1.56% | 1.56% | 1.58% | 1.58% |
Net expenses
| 1.50% | 1.50% | 1.50% | 1.50% | 1.50% | 1.50% |
Net investment income
| 2.30% | 1.80% | 1.91% | 2.18% | 2.47% | 2.40% |
| Supplemental data | | | | | | |
Portfolio turnover rate
| 4% | 17% | 9% | 23% | 9% | 33% |
Net assets, end of period (000s omitted)
| $10,757 | $11,548 | $19,066 | $27,413 | $32,758 | $47,831 |
| 1 | Total return calculations do not include any sales charges. Returns for periods of less than one year are not annualized. |
The accompanying notes are an integral part of these financial statements.
Allspring California Tax-Free Fund | 27
Financial highlights
(For a share outstanding throughout each period)
| | | Year ended June 30 |
| Administrator Class | Six months ended
December 31, 2022
(unaudited) | 2022 | 2021 | 2020 | 2019 | 2018 |
Net asset value, beginning of period
| $10.67 | $12.16 | $11.93 | $11.94 | $11.66 | $11.86 |
Net investment income
| 0.17 | 0.32 | 0.34 | 0.37 | 0.40 | 0.39 |
Net realized and unrealized gains (losses) on investments
| (0.17) | (1.49) | 0.24 | (0.01) | 0.28 | (0.20) |
Total from investment operations
| 0.00 | (1.17) | 0.58 | 0.36 | 0.68 | 0.19 |
| Distributions to shareholders from | | | | | | |
Net investment income
| (0.17) | (0.32) | (0.35) | (0.37) | (0.40) | (0.39) |
Net asset value, end of period
| $10.50 | $10.67 | $12.16 | $11.93 | $11.94 | $11.66 |
Total return1
| 0.04% | (9.77)% | 4.89% | 3.05% | 5.99% | 1.67% |
| Ratios to average net assets (annualized) | | | | | | |
Gross expenses
| 0.76% | 0.75% | 0.75% | 0.75% | 0.77% | 0.77% |
Net expenses
| 0.55% | 0.55% | 0.55% | 0.55% | 0.55% | 0.55% |
Net investment income
| 3.22% | 2.78% | 2.86% | 3.13% | 3.43% | 3.34% |
| Supplemental data | | | | | | |
Portfolio turnover rate
| 4% | 17% | 9% | 23% | 9% | 33% |
Net assets, end of period (000s omitted)
| $162,601 | $343,154 | $382,093 | $301,919 | $231,252 | $186,626 |
| 1 | Returns for periods of less than one year are not annualized. |
The accompanying notes are an integral part of these financial statements.
28 | Allspring California Tax-Free Fund
Financial highlights
(For a share outstanding throughout each period)
| | | Year ended June 30 |
| Institutional Class | Six months ended
December 31, 2022
(unaudited) | 2022 | 2021 | 2020 | 2019 | 2018 |
Net asset value, beginning of period
| $10.67 | $12.16 | $11.93 | $11.94 | $11.66 | $11.86 |
Net investment income
| 0.18 | 0.33 | 0.35 | 0.38 | 0.41 | 0.40 |
Net realized and unrealized gains (losses) on investments
| (0.17) | (1.49) | 0.23 | (0.01) | 0.28 | (0.20) |
Total from investment operations
| 0.01 | (1.16) | 0.58 | 0.37 | 0.69 | 0.20 |
| Distributions to shareholders from | | | | | | |
Net investment income
| (0.18) | (0.33) | (0.35) | (0.38) | (0.41) | (0.40) |
Net asset value, end of period
| $10.50 | $10.67 | $12.16 | $11.93 | $11.94 | $11.66 |
Total return1
| 0.07% | (9.71)% | 4.96% | 3.12% | 6.07% | 1.74% |
| Ratios to average net assets (annualized) | | | | | | |
Gross expenses
| 0.49% | 0.48% | 0.48% | 0.48% | 0.50% | 0.50% |
Net expenses
| 0.48% | 0.48% | 0.48% | 0.48% | 0.48% | 0.48% |
Net investment income
| 3.30% | 2.83% | 2.93% | 3.19% | 3.49% | 3.42% |
| Supplemental data | | | | | | |
Portfolio turnover rate
| 4% | 17% | 9% | 23% | 9% | 33% |
Net assets, end of period (000s omitted)
| $235,657 | $304,666 | $384,108 | $328,107 | $293,180 | $287,616 |
| 1 | Returns for periods of less than one year are not annualized. |
The accompanying notes are an integral part of these financial statements.
Allspring California Tax-Free Fund | 29
Notes to financial statements (unaudited)
1. ORGANIZATION
Allspring Funds Trust (the "Trust"), a Delaware statutory trust organized on March 10, 1999, is an open-end management investment company registered under the Investment Company Act of 1940, as amended (the "1940 Act"). As an investment company, the Trust follows the accounting and reporting guidance in Financial Accounting Standards Board ("FASB") Accounting Standards Codification Topic 946, Financial Services – Investment Companies. These financial statements report on the Allspring California Tax-Free Fund (the "Fund") which is a non-diversified series of the Trust.
2. SIGNIFICANT ACCOUNTING POLICIES
The following significant accounting policies, which are consistently followed in the preparation of the financial statements of the Fund, are in conformity with U.S. generally accepted accounting principles which require management to make estimates and assumptions that affect the reported amounts of assets and liabilities, disclosure of contingent assets and liabilities at the date of the financial statements, and the reported amounts of income and expenses during the reporting period. Actual results could differ from those estimates.
Securities valuation
All investments are valued each business day as of the close of regular trading on the New York Stock Exchange (generally 4 p.m. Eastern Time), although the Fund may deviate from this calculation time under unusual or unexpected circumstances.
Debt securities are valued at the evaluated bid price provided by an independent pricing service (e.g. taking into account various factors, including yields, maturities, or credit ratings) or, if a reliable price is not available, the quoted bid price from an independent broker-dealer.
Investments in registered open-end investment companies (other than those listed on a foreign or domestic exchange or market) are valued at net asset value.
Investments which are not valued using the methods discussed above are valued at their fair value, as determined in good faith by Allspring Funds Management, LLC ("Allspring Funds Management"), which was named the valuation designee by the Board of Trustees. As the valuation designee, Allspring Funds Management is responsible for day-to-day valuation activities for the Allspring Funds. In connection with these responsibilities, Allspring Funds Management has established a Valuation Committee and has delegated to it the authority to take any actions regarding the valuation of portfolio securities that the Valuation Committee deems necessary or appropriate, including determining the fair value of portfolio securities. On a quarterly basis, the Board of Trustees receives reports of valuation actions taken by the Valuation Committee. On at least an annual basis, the Board of Trustees receives an assessment of the adequacy and effectiveness of Allspring Funds Management's process for determining the fair value of the portfolio of investments.
Security transactions and income recognition
Securities transactions are recorded on a trade date basis. Realized gains or losses are recorded on the basis of identified cost.
Interest income is accrued daily and bond discounts are accreted and premiums are amortized daily. To the extent debt obligations are placed on non-accrual status, any related interest income may be reduced by writing off interest receivables when the collection of all or a portion of interest has been determined to be doubtful based on consistently applied procedures and the fair value has decreased. If the issuer subsequently resumes interest payments or when the collectability of interest is reasonably assured, the debt obligation is removed from non-accrual status.
Distributions to shareholders
Distributions to shareholders from net investment income are declared daily and paid monthly. Distributions from net realized gains, if any, are recorded on the ex-dividend date and paid at least annually. Such distributions are determined in accordance with income tax regulations and may differ from U.S. generally accepted accounting principles. Dividend sources are estimated at the time of declaration. The tax character of distributions is determined as of the Fund's fiscal year end. Therefore, a portion of the Fund's distributions made prior to the Fund’s fiscal year end may be categorized as a tax return of capital at year end.
Federal and other taxes
The Fund intends to continue to qualify as a regulated investment company by distributing substantially all of its investment company taxable and tax-exempt income and any net realized capital gains (after reduction for capital loss carryforwards) sufficient to relieve it from all, or substantially all, federal income taxes. Accordingly, no provision for federal income taxes was required.
The Fund’s income and federal excise tax returns and all financial records supporting those returns for the prior three fiscal years are subject to examination by the federal and Delaware revenue authorities. Management has analyzed the Fund's tax
30 | Allspring California Tax-Free Fund
Notes to financial statements (unaudited)
positions taken on federal, state, and foreign tax returns, as applicable, for all open tax years and does not believe that there are any uncertain tax positions that require recognition of a tax liability.
As of December 31, 2022, the aggregate cost of all investments for federal income tax purposes was $767,267,219 and the unrealized gains (losses) consisted of:
| Gross unrealized gains | $ 14,063,333 |
| Gross unrealized losses | (33,381,694) |
| Net unrealized losses | $(19,318,361) |
As of June 30, 2022, the Fund had capital loss carryforwards which consisted of $34,053,224 in short-term capital losses and $12,887,996 in long-term capital losses.
Class allocations
The separate classes of shares offered by the Fund differ principally in applicable sales charges, distribution, shareholder servicing, and administration fees. Class specific expenses are charged directly to that share class. Investment income, common fund-level expenses, and realized and unrealized gains (losses) on investments are allocated daily to each class of shares based on the relative proportion of net assets of each class.
3. FAIR VALUATION MEASUREMENTS
Fair value measurements of investments are determined within a framework that has established a fair value hierarchy based upon the various data inputs utilized in determining the value of the Fund’s investments. The three-level hierarchy gives the highest priority to unadjusted quoted prices in active markets for identical assets or liabilities (Level 1) and the lowest priority to unobservable inputs (Level 3). The Fund’s investments are classified within the fair value hierarchy based on the lowest level of input that is significant to the fair value measurement. The inputs are summarized into three broad levels as follows:
| ■ | Level 1 – quoted prices in active markets for identical securities |
| ■ | Level 2 – other significant observable inputs (including quoted prices for similar securities, interest rates, prepayment speeds, credit risk, etc.) |
| ■ | Level 3 – significant unobservable inputs (including the Fund’s own assumptions in determining the fair value of investments) |
The inputs or methodologies used for valuing investments in securities are not necessarily an indication of the risk associated with investing in those securities.
The following is a summary of the inputs used in valuing the Fund’s assets and liabilities as of December 31, 2022:
| | Quoted prices
(Level 1) | Other significant
observable inputs
(Level 2) | Significant
unobservable inputs
(Level 3) | Total |
| Assets | | | | |
| Investments in: | | | | |
| Municipal obligations | $ 0 | $ 742,833,627 | $0 | $ 742,833,627 |
| Short-term investments | | | | |
| Investment companies | 5,115,231 | 0 | 0 | 5,115,231 |
| Total assets | $5,115,231 | $742,833,627 | $0 | $747,948,858 |
Additional sector, industry or geographic detail, if any, is included in the Portfolio of Investments.
For the six months ended December 31, 2022, the Fund did not have any transfers into/out of Level 3.
4. TRANSACTIONS WITH AFFILIATES
Management fee
Allspring Funds Management, a wholly owned subsidiary of Allspring Global Investments Holdings, LLC, a holding company indirectly owned by certain private funds of GTCR LLC and Reverence Capital Partners, L.P., is the manager of the Fund and provides advisory and fund-level administrative services under an investment management agreement. Under the investment management agreement, Allspring Funds Management is responsible for, among other services, implementing the investment
Allspring California Tax-Free Fund | 31
Notes to financial statements (unaudited)
objectives and strategies of the Fund, supervising the subadviser and providing fund-level administrative services in connection with the Fund’s operations. As compensation for its services under the investment management agreement, Allspring Funds Management is entitled to receive a management fee at the following annual rate based on the Fund’s average daily net assets:
| Average daily net assets | Management fee |
| First $500 million | 0.400% |
| Next $500 million | 0.375 |
| Next $2 billion | 0.350 |
| Next $2 billion | 0.325 |
| Next $5 billion | 0.290 |
| Over $10 billion | 0.280 |
For the six months ended December 31, 2022, the management fee was equivalent to an annual rate of 0.39% of the Fund’s average daily net assets.
Allspring Funds Management has retained the services of a subadviser to provide daily portfolio management to the Fund. The fee for subadvisory services is borne by Allspring Funds Management. Allspring Global Investments, LLC, an affiliate of Allspring Funds Management and a wholly owned subsidiary of Allspring Global Investments Holdings, LLC, is the subadviser to the Fund and is entitled to receive a fee from Allspring Funds Management at an annual rate starting at 0.20% and declining to 0.10% as the average daily net assets of the Fund increase.
Administration fees
Under a class-level administration agreement, Allspring Funds Management provides class-level administrative services to the Fund, which includes paying fees and expenses for services provided by the transfer agent, sub-transfer agents, omnibus account servicers and record-keepers. As compensation for its services under the class-level administration agreement, Allspring Funds Management receives an annual fee which is calculated based on the average daily net assets of each class as follows:
| | Class-level
administration fee |
| Class A | 0.16% |
| Class C | 0.16 |
| Administrator Class | 0.10 |
| Institutional Class | 0.08 |
Waivers and/or expense reimbursements
Allspring Funds Management has contractually committed to waive and/or reimburse management and administration fees to the extent necessary to maintain certain net operating expense ratios for the Fund. When each class of the Fund has exceeded its expense cap, Allspring Funds Management will waive fees and/or reimburse expenses from fund-level expenses on a proportionate basis and then from class specific expenses. When only certain classes exceed their expense caps, waivers and/or reimbursements are applied against class specific expenses before fund-level expenses. Allspring Funds Management has contractually committed through October 31, 2023 to waive fees and/or reimburse expenses to the extent necessary to cap expenses. Prior to or after the commitment expiration date, the caps may be increased or the commitment to maintain the caps may be terminated only with the approval of the Board of Trustees. As of December 31, 2022, the contractual expense caps are as follows:
| | Expense ratio caps |
| Class A | 0.75% |
| Class C | 1.50 |
| Administrator Class | 0.55 |
| Institutional Class | 0.48 |
32 | Allspring California Tax-Free Fund
Notes to financial statements (unaudited)
Distribution fee
The Trust has adopted a distribution plan for Class C shares pursuant to Rule 12b-1 under the 1940 Act. A distribution fee is charged to Class C shares and paid to Allspring Funds Distributor, LLC ("Allspring Funds Distributor"), the principal underwriter, an affiliate of Allspring Funds Management, at an annual rate up to 0.75% of the average daily net assets of Class C shares.
In addition, Allspring Funds Distributor is entitled to receive the front-end sales charge from the purchase of Class A shares and a contingent deferred sales charge on the redemption of certain Class A shares. Allspring Funds Distributor is also entitled to receive the contingent deferred sales charges from redemptions of Class C shares. For the six months ended December 31, 2022, Allspring Funds Distributor received $3,675 from the sale of Class A shares. No contingent deferred sales charges were incurred by Class A and Class C shares for the six months ended December 31, 2022.
Shareholder servicing fees
The Trust has entered into contracts with one or more shareholder servicing agents, whereby Class A, Class C and Administrator Class are charged a fee at an annual rate up to 0.25% of the average daily net assets of each respective class. A portion of these total shareholder servicing fees were paid to affiliates of the Fund.
Interfund transactions
The Fund may purchase or sell portfolio investment securities to certain affiliates pursuant to Rule 17a-7 under the 1940 Act and under procedures adopted by the Board of Trustees. The procedures have been designed to ensure that these interfund transactions, which do not incur broker commissions, are effected at current market prices. Pursuant to these procedures, the Fund had $20,020,000, $49,021,389 and $(410,034) in interfund purchases, sales and net realized gains (losses), respectively, during the six months ended December 31, 2022.
5. INVESTMENT PORTFOLIO TRANSACTIONS
Purchases and sales of investments, excluding U.S. government obligations (if any) and short-term securities, for the six months ended December 31, 2022 were $36,793,535 and $305,611,335, respectively.
6. BANK BORROWINGS
The Trust (excluding the money market funds), Allspring Master Trust and Allspring Variable Trust are parties to a $350,000,000 revolving credit agreement whereby the Fund is permitted to use bank borrowings for temporary or emergency purposes, such as to fund shareholder redemption requests. Interest under the credit agreement is charged to the Fund based on a borrowing rate equal to the higher of the Federal Funds rate or the overnight bank funding rate in effect on that day plus a spread. In addition, an annual commitment fee equal based on the unused balance is allocated to each participating fund.
For the six months ended December 31, 2022, there were no borrowings by the Fund under the agreement.
7. CONCENTRATION RISK
The Fund invests a substantial portion of its assets in issuers of municipal debt securities located in a single state or territory of the U.S. Therefore, it may be more affected by economic and political developments in that state or region than would be a comparable general tax-exempt fund. As of the end of the period, the Fund's investments were concentrated in the state of California.
8. MARKET RISKS
On March 11, 2020, the World Health Organization announced that it had made the assessment that coronavirus disease 2019 (“COVID-19”) is a pandemic. The impacts of COVID-19 are affecting the entire global economy, individual companies and investment products, the funds, and the market in general. There is significant uncertainty around the extent and duration of business disruptions related to COVID-19 and the impacts may last for an extended period of time. COVID-19 has led to significant uncertainty and volatility in the financial markets.
9. INDEMNIFICATION
Under the Fund's organizational documents, the officers and Trustees have been granted certain indemnification rights against certain liabilities that may arise out of performance of their duties to the Fund. The Fund has entered into a separate agreement with each Trustee that converts indemnification rights currently existing under the Fund’s organizational documents into contractual rights that cannot be changed in the future without the consent of the Trustee. Additionally, in the normal course of business, the Fund may enter into contracts with service providers that contain a variety of indemnification clauses. The Fund’s maximum exposure under these arrangements is dependent on future claims that may be made against the Fund and, therefore, cannot be estimated.
Allspring California Tax-Free Fund | 33
Other information (unaudited)
PROXY VOTING INFORMATION
A description of the policies and procedures used to determine how to vote proxies relating to portfolio securities is available without charge, upon request, by calling 1-800-222-8222, visiting our website at allspringglobal.com, or visiting the SEC website at sec.gov. Information regarding how the proxies related to portfolio securities were voted during the most recent 12-month period ended June 30 is available on the website at allspringglobal.com or by visiting the SEC website at sec.gov.
QUARTERLY PORTFOLIO HOLDINGS INFORMATION
The Fund files its complete schedule of portfolio holdings with the SEC for the first and third quarters of each fiscal year as an exhibit to its reports on Form N-PORT. Shareholders may view the filed Form N-PORT by visiting the SEC website at sec.gov.
34 | Allspring California Tax-Free Fund
Other information (unaudited)
BOARD OF TRUSTEES AND OFFICERS
Each of the Trustees and Officers listed in the table below acts in identical capacities for each fund in the Allspring family of funds, which consists of 127 mutual funds comprising the Allspring Funds Trust, Allspring Variable Trust, Allspring Master Trust and four closed-end funds (collectively the “Fund Complex”). This table should be read in conjunction with the Prospectus and the Statement of Additional Information1. The mailing address of each Trustee and Officer is 1415 Vantage Park Drive, 3rd Floor, Charlotte, NC 28203. Each Trustee and Officer serves an indefinite term, however, each Trustee serves such term until reaching the mandatory retirement age established by the Trustees.
Independent Trustees
Name and
year of birth | Position held and
length of service* | Principal occupations during past five years or longer | Current other
public company or
investment
company
directorships |
William R. Ebsworth
(Born 1957) | Trustee,
since 2015 | Retired. From 1984 to 2013, equities analyst, portfolio manager, research director and chief investment officer at Fidelity Management and Research Company in Boston, Tokyo, and Hong Kong, and retired in 2013 as Chief Investment Officer of Fidelity Strategic Advisers, Inc. where he led a team of investment professionals managing client assets. Prior thereto, Board member of Hong Kong Securities Clearing Co., Hong Kong Options Clearing Corp., the Thailand International Fund, Ltd., Fidelity Investments Life Insurance Company, and Empire Fidelity Investments Life Insurance Company. Audit Committee Chair and Investment Committee Chair of the Vincent Memorial Hospital Foundation (non-profit organization). Mr. Ebsworth is a CFA® charterholder. | N/A |
Jane A. Freeman
(Born 1953) | Trustee,
since 2015;
Chair Liaison,
since 2018 | Retired. From 2012 to 2014 and 1999 to 2008, Chief Financial Officer of Scientific Learning Corporation. From 2008 to 2012, Ms. Freeman provided consulting services related to strategic business projects. Prior to 1999, Portfolio Manager at Rockefeller & Co. and Scudder, Stevens & Clark. Board member of the Harding Loevner Funds from 1996 to 2014, serving as both Lead Independent Director and chair of the Audit Committee. Board member of the Russell Exchange Traded Funds Trust from 2011 to 2012 and the chair of the Audit Committee. Ms. Freeman is also an inactive Chartered Financial Analyst. | N/A |
Isaiah Harris, Jr.
(Born 1952) | Trustee,
since 2009; Audit
Committee
Chair,
since 2019 | Retired. Member of the Advisory Board of CEF of East Central Florida. Chairman of the Board of CIGNA Corporation from 2009 to 2021, and Director from 2005 to 2008. From 2003 to 2011, Director of Deluxe Corporation. Prior thereto, President and CEO of BellSouth Advertising and Publishing Corp. from 2005 to 2007, President and CEO of BellSouth Enterprises from 2004 to 2005 and President of BellSouth Consumer Services from 2000 to 2003. Emeritus member of the Iowa State University Foundation Board of Governors. Emeritus Member of the Advisory Board of Iowa State University School of Business. Advisory Board Member, Palm Harbor Academy (private school). Advisory Board Member, Fellowship of Christian Athletes. Mr. Harris is a certified public accountant (inactive status). | N/A |
David F. Larcker
(Born 1950) | Trustee,
since 2009 | Distinguished Visiting Fellow at the Hoover Institution since 2022. James Irvin Miller Professor of Accounting at the Graduate School of Business (Emeritus), Stanford University, Director of the Corporate Governance Research Initiative and Senior Faculty of The Rock Center for Corporate Governance since 2006. From 2005 to 2008, Professor of Accounting at the Graduate School of Business, Stanford University. Prior thereto, Ernst & Young Professor of Accounting at The Wharton School, University of Pennsylvania from 1985 to 2005. | N/A |
Allspring California Tax-Free Fund | 35
Other information (unaudited)
Name and
year of birth | Position held and
length of service* | Principal occupations during past five years or longer | Current other
public company or
investment
company
directorships |
Olivia S. Mitchell
(Born 1953) | Trustee,
since 2006;
Nominating and
Governance
Committee Chair,
since 2018 | International Foundation of Employee Benefit Plans Professor since 1993, Wharton School of the University of Pennsylvania. Director of Wharton’s Pension Research Council and Boettner Center on Pensions & Retirement Research, and Research Associate at the National Bureau of Economic Research. Previously taught at Cornell University from 1978 to 1993. | N/A |
Timothy J. Penny
(Born 1951) | Trustee,
since 1996;
Chair,
since 2018 | President and Chief Executive Officer of Southern Minnesota Initiative Foundation, a non-profit organization, since 2007. Vice Chair of the Economic Club of Minnesota, since 2007. Co-Chair of the Committee for a Responsible Federal Budget, since 1995. Member of the Board of Trustees of NorthStar Education Finance, Inc., a non-profit organization, from 2007-2022. Senior Fellow of the University of Minnesota Humphrey Institute from 1995 to 2017. | N/A |
James G. Polisson
(Born 1959) | Trustee,
since 2018 | Retired. Chief Marketing Officer, Source (ETF) UK Services, Ltd, from 2015 to 2017. From 2012 to 2015, Principal of The Polisson Group, LLC, a management consulting, corporate advisory and principal investing company. Chief Executive Officer and Managing Director at Russell Investments, Global Exchange Traded Funds from 2010 to 2012. Managing Director of Barclays Global Investors from 1998 to 2010 and Global Chief Marketing Officer for iShares and Barclays Global Investors from 2000 to 2010. Trustee of the San Francisco Mechanics’ Institute, a non-profit organization, from 2013 to 2015. Board member of the Russell Exchange Traded Fund Trust from 2011 to 2012. Director of Barclays Global Investors Holdings Deutschland GmbH from 2006 to 2009. Mr. Polisson is an attorney and has a retired status with the Massachusetts and District of Columbia Bar Associations. | N/A |
Pamela Wheelock
(Born 1959) | Trustee,
since January
2020; previously
Trustee from
January 2018 to
July 2019 | Retired. Executive and Senior Financial leadership positions in the public, private and nonprofit sectors. Interim President and CEO, McKnight Foundation, 2020. Interim Commissioner, Minnesota Department of Human Services, 2019. Chief Operating Officer, Twin Cities Habitat for Humanity, 2017-2019. Vice President for University Services, University of Minnesota, 2012-2016. Interim President and CEO, Blue Cross and Blue Shield of Minnesota, 2011-2012. Executive Vice-President and Chief Financial Officer, Minnesota Wild, 2002-2008. Commissioner, Minnesota Department of Finance, 1999-2002. Chair of the Board of Directors of Destination Medical Center Corporation. Board member of the Minnesota Wild Foundation. | N/A |
* Length of service dates reflect the Trustee’s commencement of service with the Trust’s predecessor entities, where applicable.
36 | Allspring California Tax-Free Fund
Other information (unaudited)
Officers2
Name and
year of birth | Position held and
length of service | Principal occupations during past five years or longer |
Andrew Owen
(Born 1960) | President,
since 2017 | President and Chief Executive Officer of Allspring Funds Management, LLC since 2017 and Head of Global Fund Governance of Allspring Global Investments since 2022. Prior thereto, co-president of Galliard Capital Management, LLC, an affiliate of Allspring Funds Management, LLC, from 2019 to 2022 and Head of Affiliated Managers, Allspring Global Investments, from 2014 to 2019 and Executive Vice President responsible for marketing, investments and product development for Allspring Funds Management, LLC, from 2009 to 2014. |
Jeremy DePalma
(Born 1974) | Treasurer,
since 2012
(for certain funds in
the Fund Complex);
since 2021 (for
the remaining funds in the
Fund Complex) | Senior Vice President of Allspring Funds Management, LLC since 2009. Senior Vice President of Evergreen Investment Management Company, LLC from 2008 to 2010 and head of the Fund Reporting and Control Team within Fund Administration from 2005 to 2010. |
Christopher Baker
(Born 1976) | Chief Compliance Officer, since 2022 | Global Chief Compliance Officer for Allspring Global Investments since 2022. Prior thereto, Chief Compliance Officer for State Street Global Advisors from 2018 to 2021. Senior Compliance Officer for the State Street divisions of Alternative Investment Solutions, Sector Solutions, and Global Marketing from 2015 to 2018. From 2010 to 2015 Vice President, Global Head of Investment and Marketing Compliance for State Street Global Advisors. |
Matthew Prasse
(Born 1983) | Chief Legal Officer, since 2022; Secretary, since 2021 | Senior Counsel of the Allspring Legal Department since 2021. Senior Counsel of the Wells Fargo Legal Department from 2018 to 2021. Previously, Counsel for Barings LLC from 2015 to 2018. Prior to joining Barings, Associate at Morgan, Lewis & Bockius LLP from 2008 to 2015. |
1 The Statement of Additional Information includes additional information about the Trustees and is available, without charge, upon request, by calling 1-800-222-8222 or by visiting the website at allspringglobal.com.
2 For those Officers with tenures at Allspring Global Investments and/or Allspring Funds Management, LLC that began prior to 2021, such tenures include years of service during which these businesses/entities were known as Wells Fargo Asset Management and Wells Fargo Funds Management, LLC, respectively.
Allspring California Tax-Free Fund | 37
For more information
More information about Allspring Funds is available free upon request. To obtain literature, please write, visit the Fund's website, or call:
Allspring Funds
P.O. Box 219967
Kansas City, MO 64121-9967
Website: allspringglobal.com
Individual investors: 1-800-222-8222
Retail investment professionals: 1-888-877-9275
Institutional investment professionals: 1-800-260-5969
This report and the financial statements contained herein are submitted for the general information of the shareholders of the Fund. If this report is used for promotional purposes, distribution of the report must be accompanied or preceded by a current prospectus. Before investing, please consider the investment objectives, risks, charges, and expenses of the investment. For a current prospectus and, if available, a summary prospectus, containing this information, call
1-800-222-8222 or visit the Fund's website at allspringglobal.com. Read the prospectus carefully before you invest or send money.
Allspring Global InvestmentsTM is the trade name for the asset management firms of Allspring Global Investments Holdings, LLC, a holding company indirectly owned by certain private funds of GTCR LLC and Reverence Capital Partners, L.P. These firms include but are not limited to Allspring Global Investments, LLC, and Allspring Funds Management, LLC. Certain products managed by Allspring entities are distributed by Allspring Funds Distributor, LLC (a broker-dealer and Member FINRA/SIPC).
This material is for general informational and educational purposes only and is NOT intended to provide investment advice or a recommendation of any kind - including a recommendation for any specific investment, strategy, or plan.
© 2023 Allspring Global Investments Holdings, LLC. All rights reserved.
ALL-01092023-xiokoisn 02-23
SAR0032 12-22
Semi-Annual Report
December 31, 2022
Allspring
High Yield Municipal Bond Fund
The views expressed and any forward-looking statements are as of December 31, 2022, unless otherwise noted, and are those of the Fund's portfolio managers and/or Allspring Global Investments. Discussions of individual securities or the markets generally are not intended as individual recommendations. Future events or results may vary significantly from those expressed in any forward-looking statements. The views expressed are subject to change at any time in response to changing circumstances in the market. Allspring Global Investments disclaims any obligation to publicly update or revise any views expressed or forward-looking statements.
Allspring High Yield Municipal Bond Fund | 1
Letter to shareholders (unaudited)
Andrew Owen
President
Allspring Funds
Dear Shareholder:
We are pleased to offer you this semi-annual report for the Allspring High Yield Municipal Bond Fund for the six-month period that ended December 31, 2022. Globally, stocks and bonds experienced heightened volatility and generally negative returns through the challenging period. Earlier tailwinds provided by global stimulus programs, vaccination rollouts, and recovering consumer and corporate sentiment were wiped away by the highest rate of inflation in four decades, the impact of ongoing aggressive central bank rate hikes and the prospect of more rate hikes. Compounding these concerns were the global reverberations of the Russia-Ukraine war and the impact of China’s strict COVID-19 lockdowns.
For the six-month period, stocks and bonds had mixed results, with emerging market equities trailing those of developed markets and both U.S. and non-U.S. bonds fighting an uphill battle in the face of sustained interest rate increases. For the period, U.S. stocks, based on the S&P 500 Index,1 gained 2.31%. International stocks, as measured by the MSCI ACWI ex USA Index (Net),2 returned 2.96%, while the MSCI EM Index (Net) (USD)3 declined 2.99%. Among bond indexes, the Bloomberg U.S. Aggregate Bond Index4 returned -2.97%, the Bloomberg Global Aggregate ex-USD Index (unhedged)5 returned -2.65%, the Bloomberg Municipal Bond Index6 gained 0.50%, and the ICE BofA U.S. High Yield Index7 returned 3.33%.
Persistent inflation and economic fallout from the Russia-Ukraine war drove markets.
Markets rebounded from earlier losses in July, led by U.S. stocks. While evidence pointed to an economic slowdown after two consecutive quarters of declining gross domestic product (economic contraction), the U.S. labor market remained surprisingly strong: July nonfarm payrolls grew by more than 500,000 and U.S. unemployment dipped to 3.5%. Meanwhile, crude oil and retail gasoline prices, major contributors to recent overall inflation, fell substantially from earlier highs. And while U.S. home prices rose, sales fell as houses became less affordable with mortgage rates at a 13-year high. The Federal Reserve (Fed) raised the federal funds rate another 0.75% in July—to a range of 2.25% to 2.50%—and forecasts pointed to further rate hikes.
| 1 | The S&P 500 Index consists of 500 stocks chosen for market size, liquidity, and industry group representation. It is a market-value-weighted index with each stock's weight in the index proportionate to its market value. You cannot invest directly in an index. |
| 2 | The Morgan Stanley Capital International (MSCI) All Country World Index (ACWI) ex USA Index (Net) is a free-float-adjusted market-capitalization-weighted index that is designed to measure the equity market performance of developed and emerging markets, excluding the U.S. Source: MSCI. MSCI makes no express or implied warranties or representations and shall have no liability whatsoever with respect to any MSCI data contained herein. The MSCI data may not be further redistributed or used as a basis for other indexes or any securities or financial products. This report is not approved, reviewed, or produced by MSCI. You cannot invest directly in an index. |
| 3 | The MSCI Emerging Markets (EM) Index (Net) (USD) is a free-float-adjusted market-capitalization-weighted index that is designed to measure equity market performance of emerging markets. You cannot invest directly in an index. |
| 4 | The Bloomberg U.S. Aggregate Bond Index is a broad-based benchmark that measures the investment-grade, U.S.-dollar-denominated, fixed-rate taxable bond market, including Treasuries, government-related and corporate securities, mortgage-backed securities (agency fixed-rate and hybrid adjustable-rate mortgage pass-throughs), asset-backed securities, and commercial mortgage-backed securities. You cannot invest directly in an index. |
| 5 | The Bloomberg Global Aggregate ex-USD Index (unhedged) is an unmanaged index that provides a broad-based measure of the global investment-grade fixed-income markets excluding the U.S.-dollar-denominated debt market. You cannot invest directly in an index. |
| 6 | The Bloomberg Municipal Bond Index is an unmanaged index composed of long-term tax-exempt bonds with a minimum credit rating of Baa. You cannot invest directly in an index. |
| 7 | The ICE BofA U.S. High Yield Index is a market-capitalization-weighted index of domestic and Yankee high-yield bonds. The index tracks the performance of high-yield securities traded in the U.S. bond market. You cannot invest directly in an index. Copyright 2023. ICE Data Indices, LLC. All rights reserved. |
2 | Allspring High Yield Municipal Bond Fund
Letter to shareholders (unaudited)
August was yet another broadly challenging month for financial markets, with more red ink flowing. High inflation persisted, cresting 9% in the eurozone on an annual basis and remaining above 8% in the U.S. despite the Fed’s aggressive monetary policy and a major drop in global crude oil and gasoline prices from their June peak. One positive note was the resilience of the U.S. job market. However, the Fed’s job was clearly not complete. One longer-term bright spot was the U.S. Congress’s passage of the Inflation Reduction Act. Its primary stated goals include: to reduce inflation (though not immediately) by curbing the deficit, capping health care spending by seniors, and investing in domestic sources of clean energy.
The market misery continued in September. There was nowhere to hide as all asset classes suffered major losses at the hands of persistent inflation. Central banks kept up their battle against rapidly rising prices with more rate hikes. The strength of the U.S. dollar made things even more difficult for investors holding assets in other currencies. U.S. mortgage rates jumped to near 7% on 30-year fixed-rate mortgages; the decreased housing affordability began to cool demand somewhat. The U.K. experienced a sharp sell-off of government bonds and the British pound in September as investors panicked in response to a new government budget that was seen as financially unsound. The market meltdown forced the Bank of England to step in and buy long-dated government bonds.
Equities had a reprieve in October after two months of sharp declines. Value stocks and small caps fared best. Globally, developed markets outpaced emerging market equities, which were hurt by weakness among Chinese stocks. Central banks continued to try to curtail high inflation with aggressive interest rate hikes. Geopolitical risks persisted, including the ongoing Russia-Ukraine war and economic, financial market, and political turmoil in the U.K., which led to a second prime ministerial change in six weeks, as Rishi Sunak replaced Liz Truss in late October. Concerns over Europe’s energy crisis eased thanks to unseasonably warm weather and plentiful gas on hand. The U.S. labor market continued its resilience against rising prices, as unemployment stood at 3.7%, near a record low.
Stocks and bonds rallied in November, with emerging market equities gaining nearly 15% and developed market equities returning 7%. The S&P 500 Index rose 5.6% in November. Bonds also had positive monthly returns. Economic news was encouraging, driven by U.S. labor market strength. Although central banks kept raising rates, expectations grew regarding an impending easing in the pace of rate hikes and a possible end to central bank monetary tightening in 2023. Although inflation remained at record highs in the eurozone, with a 10.6% annual increase in October, Germany’s producer prices decreased 4.2% annually, signaling a possible decline in inflationary pressures. Meanwhile, U.S. inflation continued to moderate, with a 7.1% annual price rise in November and a monthly price increase of just 0.1%. China’s economic data remained weak, reflecting its zero-COVID-19 policy.
Financial markets cooled in December, with U.S. equities posting negative overall results in response to a weakening U.S. dollar. Fixed income securities ended one of their worst years ever with flat overall monthly returns as markets weighed the hopes for an end to the monetary tightening cycle with the reality that central banks had not completed their jobs yet. U.S. Consumer Price Index (CPI)1 data showed a strong consistent trend downward, which brought down the 12-month CPI to 6.5% in December from 9.1% in June. Other countries and regions reported still-high but declining inflation rates as the year winded down.
“ The market misery continued in September. There was nowhere to hide as all asset classes suffered major losses at the hands of persistent inflation.”
| 1 | The Consumer Price Index (CPI) is a measure of the average change over time in the prices paid by urban consumers for a market basket of consumer goods and services. You cannot invest directly in an index. |
Allspring High Yield Municipal Bond Fund | 3
Letter to shareholders (unaudited)
Don’t let short-term uncertainty derail long-term investment goals.
Periods of investment uncertainty can present challenges, but experience has taught us that maintaining long-term investment goals can be an effective way to plan for the future. To help you create a sound strategy based on your personal goals and risk tolerance, Allspring Funds offers more than 100 mutual funds spanning a wide range of asset classes and investment styles. Although diversification cannot guarantee an investment profit or prevent losses, we believe it can be an effective way to manage investment risk and potentially smooth out overall portfolio performance. We encourage investors to know their investments and to understand that appropriate levels of risk-taking may unlock opportunities.
Thank you for choosing to invest with Allspring Funds. We appreciate your confidence in us and remain committed to helping you meet your financial needs.
Sincerely,
Andrew Owen
President
Allspring Funds
For further information about your fund, contact your investment professional, visit our website at allspringglobal.com, or call us directly at 1-800-222-8222.
4 | Allspring High Yield Municipal Bond Fund
This page is intentionally left blank.
Performance highlights (unaudited)
| Investment objective | The Fund seeks high current income exempt from federal income tax, and capital appreciation. |
| Manager | Allspring Funds Management, LLC |
| Subadviser | Allspring Global Investments, LLC |
| Portfolio managers | Dennis Derby, Terry J. Goode, Kerry Laurin |
| Average annual total returns (%) as of December 31, 2022 | |
| | | Including sales charge | | Excluding sales charge | | Expense ratios1 (%) |
| | Inception date | 1 year | 5 year | Since
inception | | 1 year | 5 year | Since
inception | | Gross | Net 2 |
| Class A (WHYMX) | 1-31-2013 | -15.96 | 0.36 | 2.76 | | -11.98 | 1.29 | 3.23 | | 1.11 | 0.80 |
| Class C (WHYCX) | 1-31-2013 | -13.64 | 0.53 | 2.61 | | -12.64 | 0.53 | 2.61 | | 1.86 | 1.55 |
| Class R6 (EKHRX)3 | 7-31-2018 | – | – | – | | -11.78 | 1.59 | 3.52 | | 0.73 | 0.50 |
| Administrator Class (WHYDX) | 1-31-2013 | – | – | – | | -11.87 | 1.40 | 3.35 | | 1.05 | 0.70 |
| Institutional Class (WHYIX) | 1-31-2013 | – | – | – | | -11.76 | 1.54 | 3.49 | | 0.78 | 0.55 |
| High Yield Municipal Bond Blended Index4 | – | – | – | – | | -11.29 | 2.11 | 2.90 * | | – | – |
| Bloomberg High Yield Municipal Bond Index5 | – | – | – | – | | -13.10 | 2.63 | 3.40 * | | – | – |
| Bloomberg Municipal Bond Index6 | – | – | – | – | | -8.53 | 1.25 | 2.11 * | | – | – |
Figures quoted represent past performance, which is no guarantee of future results, and do not reflect taxes that a shareholder may pay on an investment in a fund. Investment return and principal value of an investment will fluctuate so that an investor’s shares, when redeemed, may be worth more or less than their original cost. Performance shown without sales charges would be lower if sales charges were reflected. Current performance may be lower or higher than the performance data quoted, which assumes the reinvestment of dividends and capital gains. Current month-end performance is available on the Fund’s website, allspringglobal.com.
Index returns do not include transaction costs associated with buying and selling securities, any mutual fund fees or expenses, or any taxes. It is not possible to invest directly in an index.
For Class A shares, the maximum front-end sales charge is 4.50%. For Class C shares, the maximum contingent deferred sales charge is 1.00%. Performance including a contingent deferred sales charge assumes the sales charge for the corresponding time period. Class R6, Administrator Class and Institutional Class shares are sold without a front-end sales charge or contingent deferred sales charge.
| * | Based on the inception date of the oldest Fund class. |
| 1 | Reflects the expense ratios as stated in the most recent prospectuses. The expense ratios shown are subject to change and may differ from the annualized expense ratios shown in the financial highlights of this report. |
| 2 | The manager has contractually committed through October 31, 2023, to waive fees and/or reimburse expenses to the extent necessary to cap total annual fund operating expenses after fee waivers at 0.80% for Class A, 1.55% for Class C, 0.50% for Class R6, 0.70% for Administrator Class, and 0.55% for Institutional Class. Brokerage commissions, stamp duty fees, interest, taxes, acquired fund fees and expenses (if any), and extraordinary expenses are excluded from the expense caps. Prior to or after the commitment expiration date, the caps may be increased or the commitment to maintain the caps may be terminated only with the approval of the Board of Trustees. Without these caps, the Fund’s returns would have been lower. The expense ratio paid by an investor is the net expense ratio (the total annual fund operating expenses after fee waivers) as stated in the prospectuses. |
| 3 | Historical performance shown for the Class R6 shares prior to their inception reflects the performance of the Institutional Class shares, and includes the higher expenses applicable to the Institutional Class shares. If these expenses had not been included, returns for the Class R6 shares would be higher. |
| 4 | Source: Allspring Funds Management, LLC. The High Yield Municipal Bond Blended Index is weighted 60% in the Bloomberg High Yield Municipal Bond Index and 40% in the Bloomberg Municipal Bond Index. Effective November 1, 2019, the Fund’s benchmark changed from Bloomberg Municipal Bond Index to the High Yield Municipal Bond Blended Index to better match the Fund’s investment strategy. You cannot invest directly in an index. |
| 5 | The Bloomberg High Yield Municipal Bond Index measures the non-investment-grade and nonrated U.S. dollar–denominated, fixed-rate, tax-exempt bond market within the 50 United States and four other qualifying regions (Washington, D.C.; Puerto Rico; Guam; and the Virgin Islands). The index allows state and local general obligation, revenue, insured, and prefunded bonds; however, historically the index has been composed of mostly revenue bonds. You cannot invest directly in an index. |
| 6 | The Bloomberg Municipal Bond Index is an unmanaged index composed of long-term tax-exempt bonds with a minimum credit rating of Baa. You cannot invest directly in an index. |
6 | Allspring High Yield Municipal Bond Fund
Performance highlights (unaudited)
Bond values fluctuate in response to the financial condition of individual issuers, general market and economic conditions, and changes in interest rates. Changes in market conditions and government policies may lead to periods of heightened volatility in the bond market and reduced liquidity for certain bonds held by the Fund. In general, when interest rates rise, bond values fall and investors may lose principal value. Interest rate changes and their impact on the Fund and its share price can be sudden and unpredictable. High-yield securities have a greater risk of default and tend to be more volatile than higher-rated debt securities. The use of derivatives may reduce returns and/or increase volatility. Certain investment strategies tend to increase the total risk of an investment (relative to the broader market). This fund is exposed to municipal securities risk. Consult the Fund's prospectus for additional information on these and other risks. A portion of the Fund’s income may be subject to federal, state, and/or local income taxes or the Alternative Minimum Tax (AMT). Any capital gains distributions may be taxable.
Allspring High Yield Municipal Bond Fund | 7
Performance highlights (unaudited)
| Credit quality as of December 31, 20221 |

| 1 | The credit quality distribution of portfolio holdings reflected in the chart is based on ratings from Standard & Poor’s, Moody’s Investors Service, and/or Fitch Ratings Ltd. Credit quality ratings apply to the underlying holdings of the Fund and not to the Fund itself. The percentages of the portfolio with the ratings depicted in the chart are calculated based on the market value of fixed income securities held by the Fund. If a security was rated by all three rating agencies, the middle rating was utilized. If rated by two of the three rating agencies, the lower rating was utilized, and if rated by one of the rating agencies, that rating was utilized. Standard & Poor’s rates the creditworthiness of bonds, ranging from AAA (highest) to D (lowest). Ratings from A to CCC may be modified by the addition of a plus (+) or minus (-) sign to show relative standing within the rating categories. Standard & Poor’s rates the creditworthiness of short-term notes from SP-1 (highest) to SP-3 (lowest). Moody’s rates the creditworthiness of bonds, ranging from Aaa (highest) to C (lowest). Ratings Aa to B may be modified by the addition of a number 1 (highest) to 3 (lowest) to show relative standing within the ratings categories. Moody’s rates the creditworthiness of short-term U.S. tax-exempt municipal securities from MIG 1/VMIG 1 (highest) to SG (lowest). Fitch rates the creditworthiness of bonds, ranging from AAA (highest) to D (lowest). Credit quality distribution is subject to change and may have changed since the date specified. |
| Effective maturity distribution as of December 31, 20221 |
| 1 | Figures represent the percentage of the Fund's long-term investments. Allocations are subject to change and may have changed since the date specified. |
8 | Allspring High Yield Municipal Bond Fund
Fund expenses (unaudited)
As a shareholder of the Fund, you incur two types of costs: (1) transaction costs, including sales charges (loads) on purchase payments and contingent deferred sales charges (if any) on redemptions and (2) ongoing costs, including management fees, distribution (12b-1) and/or shareholder servicing fees, and other Fund expenses. This example is intended to help you understand your ongoing costs (in dollars) of investing in the Fund and to compare these costs with the ongoing costs of investing in other mutual funds.
The example is based on an investment of $1,000 invested at the beginning of the six-month period and held for the entire period from July 1, 2022 to December 31, 2022.
Actual expenses
The “Actual” line of the table below provides information about actual account values and actual expenses. You may use the information in this line, together with the amount you invested, to estimate the expenses that you paid over the period. Simply divide your account value by $1,000 (for example, an $8,600 account value divided by $1,000 = 8.6), then multiply the result by the number in the “Actual” line under the heading entitled “Expenses paid during period” for your applicable class of shares to estimate the expenses you paid on your account during this period.
Hypothetical example for comparison purposes
The “Hypothetical” line of the table below provides information about hypothetical account values and hypothetical expenses based on the Fund’s actual expense ratio and an assumed rate of return of 5% per year before expenses, which is not the Fund’s actual return. The hypothetical account values and expenses may not be used to estimate the actual ending account balance or expenses you paid for the period. You may use this information to compare the ongoing costs of investing in the Fund and other funds. To do so, compare this 5% hypothetical example with the 5% hypothetical examples that appear in the shareholder reports of the other funds.
Please note that the expenses shown in the table are meant to highlight your ongoing costs only and do not reflect any transactional costs, such as sales charges (loads) and contingent deferred sales charges. Therefore, the “Hypothetical” line of the table is useful in comparing ongoing costs only, and will not help you determine the relative total costs of owning different funds. In addition, if these transactional costs were included, your costs would have been higher.
| | Beginning
account value
7-1-2022 | Ending
account value
12-31-2022 | Expenses
paid during
the period1 | Annualized net
expense ratio |
| Class A | | | | |
| Actual | $1,000.00 | $ 992.00 | $4.02 | 0.80% |
| Hypothetical (5% return before expenses) | $1,000.00 | $1,021.17 | $4.08 | 0.80% |
| Class C | | | | |
| Actual | $1,000.00 | $ 988.24 | $7.77 | 1.55% |
| Hypothetical (5% return before expenses) | $1,000.00 | $1,017.39 | $7.88 | 1.55% |
| Class R6 | | | | |
| Actual | $1,000.00 | $ 993.42 | $2.51 | 0.50% |
| Hypothetical (5% return before expenses) | $1,000.00 | $1,022.68 | $2.55 | 0.50% |
| Administrator Class | | | | |
| Actual | $1,000.00 | $ 992.59 | $3.47 | 0.69% |
| Hypothetical (5% return before expenses) | $1,000.00 | $1,021.73 | $3.52 | 0.69% |
| Institutional Class | | | | |
| Actual | $1,000.00 | $ 993.25 | $2.76 | 0.55% |
| Hypothetical (5% return before expenses) | $1,000.00 | $1,022.43 | $2.80 | 0.55% |
1 Expenses paid is equal to the annualized net expense ratio of each class multiplied by the average account value over the period, multiplied by 184 divided by 365 (to reflect the one-half-year period).
Allspring High Yield Municipal Bond Fund | 9
Portfolio of investments—December 31, 2022 (unaudited)
| | | Interest
rate | Maturity
date | Principal | Value |
| Municipal obligations: 89.30% | | | | | |
| Alabama: 0.47% | | | | | |
| Water & sewer revenue: 0.47% | | | | | |
| Jefferson County AL Warrants CAB Senior Lien Series B (AGM Insured) ¤ | | 0.00% | 10-1-2027 | $ 920,000 | $ 740,039 |
| Arizona: 1.86% | | | | | |
| Education revenue: 0.46% | | | | | |
| Florence AZ IDA Legacy Traditional School Project Queen Creek & Casa Grande Campuses 144A | | 5.00 | 7-1-2023 | 55,000 | 55,478 |
| Phoenix AZ IDA Legacy Traditional School Project Series A 144A | | 6.50 | 7-1-2034 | 500,000 | 512,238 |
| Pima County AZ IDA Desert Heights Charter School Facility Refunding Bond | | 6.00 | 5-1-2024 | 170,000 | 172,043 |
| | | | | | 739,759 |
| Health revenue: 1.40% | | | | | |
| Pima County AZ IDA Senior Living Revenue Bonds Series 2022A 144A | | 7.00 | 11-15-2057 | 1,000,000 | 1,019,122 |
| Tempe AZ IDA Mirabella at ASU Incorporated Project Series A 144A | | 6.13 | 10-1-2052 | 1,400,000 | 1,202,676 |
| | | | | | 2,221,798 |
| | | | | | 2,961,557 |
| California: 4.18% | | | | | |
| Education revenue: 0.28% | | | | | |
| California Infrastructure & Economic Development Bank Senior WFCS Portfolio Projects Series A1 144A | | 5.00 | 1-1-2056 | 250,000 | 185,195 |
| California Municipal Finance Authority Charter School Albert Einstein Academies Project Series A | | 7.13 | 8-1-2043 | 250,000 | 255,885 |
| | | | | | 441,080 |
| Health revenue: 1.26% | | | | | |
| California Municipal Finance Authority Palomar Health Certificate of Participation Series 2022A (AGM Insured) | | 5.25 | 11-1-2052 | 500,000 | 526,871 |
| California PFA Living Enso Village Project Refunding Bond Series A 144A | | 5.00 | 11-15-2046 | 500,000 | 420,810 |
| California Statewide CDA Revenue Bonds Enloe Medical Center Series 2022A (AGM Insured) | | 5.25 | 8-15-2052 | 1,000,000 | 1,052,039 |
| | | | | | 1,999,720 |
| Housing revenue: 1.30% | | | | | |
| California Community Housing Agency Essential Housing Revenue Creekwood Series A 144A | | 4.00 | 2-1-2056 | 500,000 | 382,454 |
| California Municipal Finance Authority AMT Senior Lien Linxs Apartment Project Series A | | 5.00 | 12-31-2043 | 1,000,000 | 1,006,286 |
The accompanying notes are an integral part of these financial statements.
10 | Allspring High Yield Municipal Bond Fund
Portfolio of investments—December 31, 2022 (unaudited)
| | | Interest
rate | Maturity
date | Principal | Value |
| Housing revenue (continued) | | | | | |
| California Statewide CDA Community Improvement Authority Essential Housing Revenue Bond Social Bonds Series 2021B 144A | | 4.00% | 4-1-2057 | $ 500,000 | $ 343,416 |
| California Statewide CDA Community Improvement Authority Essential Housing Revenue Bonds Mezzanine Lien Waterscape Apartments Series 2021B 144A | | 4.00 | 9-1-2046 | 425,000 | 331,755 |
| | | | | | 2,063,911 |
| Miscellaneous revenue: 0.61% | | | | | |
| Compton CA PFA Refunding Bond 144A | | 4.00 | 9-1-2027 | 1,000,000 | 976,686 |
| Tax revenue: 0.53% | | | | | |
| San Francisco CA City & County RDA CAB Mission Bay South Redevelopment Project Subordinate Bond Series D 144A¤ | | 0.00 | 8-1-2026 | 1,000,000 | 849,732 |
| Tobacco revenue: 0.20% | | | | | |
| Northern California Tobacco Securitization Authority Tobacco Settlement CAB Asset-Backed Refunding Bonds Class 2 Series B-2 ¤ | | 0.00 | 6-1-2060 | 2,000,000 | 310,707 |
| | | | | | 6,641,836 |
| Colorado: 9.25% | | | | | |
| Airport revenue: 0.64% | | | | | |
| Denver Department of Aviation Airport System Revenue Bonds Series 2022D | | 5.00 | 11-15-2053 | 1,000,000 | 1,019,115 |
| Education revenue: 2.12% | | | | | |
| Colorado Board of Trustees School of Mines Institutional Enterprise Revenue Bonds Series 2022B (AGM Insured) | | 5.25 | 12-1-2052 | 2,750,000 | 2,944,137 |
| Educational & Cultural Facilities Authority Charter School New Summit 144A | | 4.00 | 7-1-2061 | 600,000 | 417,860 |
| | | | | | 3,361,997 |
| GO revenue: 5.58% | | | | | |
| Aurora Cornerstar Metropolitan District Refunding Bond Series A | | 5.25 | 12-1-2047 | 1,000,000 | 922,878 |
| Berthoud-Heritage Metropolitan District #10 Senior Limited Tax GO Bonds Series 2022A | | 4.75 | 12-1-2052 | 500,000 | 383,623 |
| Chambers Highpoint Metropolitan District #2 | | 5.00 | 12-1-2051 | 830,000 | 694,496 |
| Clear Creek Transit Metropolitan District #2 Series A | | 5.00 | 12-1-2050 | 1,000,000 | 835,751 |
| Colorado Pronghorn Valley Metropolitan District #1 Limited Tax Series A | | 4.00 | 12-1-2051 | 250,000 | 180,936 |
| Cottonwood Highlands Metropolitan District #1 Limited Tax Series A | | 5.00 | 12-1-2049 | 900,000 | 791,269 |
| Denver International Business Center Metropolitan District #1 Series B | | 6.00 | 12-1-2048 | 1,145,000 | 1,111,389 |
| Great Western Metropolitan District #5 Refunding Bond | | 4.75 | 12-1-2050 | 1,000,000 | 827,533 |
| Hogback Metropolitan District Jefferson City Limited Tax Series 2021-A | | 5.00 | 12-1-2051 | 585,000 | 489,494 |
| Murphy Creek Metropolitan District #5 GO Limited Tax Bonds Series A | | 6.00 | 12-1-2052 | 1,000,000 | 936,853 |
The accompanying notes are an integral part of these financial statements.
Allspring High Yield Municipal Bond Fund | 11
Portfolio of investments—December 31, 2022 (unaudited)
| | | Interest
rate | Maturity
date | Principal | Value |
| GO revenue (continued) | | | | | |
| Westgate Metropolitan District City of Colorado Springs GO Limited Tax Bonds Series 2022 | | 5.13% | 12-1-2051 | $1,000,000 | $ 825,721 |
| Whispering Pines Metropolitan District #1 Series A | | 5.00 | 12-1-2047 | 966,000 | 870,649 |
| | | | | | 8,870,592 |
| Tax revenue: 0.60% | | | | | |
| Pueblo Urban Renewal Authority Regional Tourism Act Project | | 5.00 | 6-1-2036 | 1,000,000 | 956,616 |
| Transportation revenue: 0.31% | | | | | |
| High Performance Transportation Enterprise US 36 & I-25 Managed Lanes | | 5.75 | 1-1-2044 | 500,000 | 500,344 |
| | | | | | 14,708,664 |
| Connecticut: 0.38% | | | | | |
| GO revenue: 0.38% | | | | | |
| Hartford CT Series A | | 4.00 | 4-1-2032 | 325,000 | 325,704 |
| Hartford CT Series A | | 5.00 | 4-1-2024 | 105,000 | 105,520 |
| Hartford CT Series B | | 5.00 | 4-1-2033 | 50,000 | 50,247 |
| Hartford CT Unrefunded Bond Series A | | 5.00 | 4-1-2029 | 45,000 | 45,072 |
| Hartford CT Unrefunded Bond Series A | | 5.00 | 4-1-2030 | 70,000 | 70,112 |
| | | | | | 596,655 |
| Delaware: 0.65% | | | | | |
| Education revenue: 0.65% | | | | | |
| Delaware EDA Odyssey Charter School Incorporated Project Series A 144A | | 7.00 | 9-1-2045 | 1,000,000 | 1,030,651 |
| District of Columbia: 0.28% | | | | | |
| Tobacco revenue: 0.28% | | | | | |
| District of Columbia Tobacco Settlement Financing Corporation | | 6.75 | 5-15-2040 | 435,000 | 446,441 |
| Florida: 3.72% | | | | | |
| Education revenue: 2.18% | | | | | |
| Florida Capital Trust Agency Educational Facilities Pineapple Cove Classical Academy Incorporated Project Series A 144A | | 5.13 | 7-1-2039 | 2,000,000 | 1,882,160 |
| Florida Development Finance Corporation Educational Facilities Renaissance Charter School Project Series A | | 8.50 | 6-15-2044 | 250,000 | 255,637 |
| Florida Development Finance Corporation Global Outreach Charter Project 144A | | 4.00 | 6-30-2056 | 500,000 | 331,744 |
| Miami-Dade County FL IDA Youth Co-Op Charter Schools Project Series A 144A | | 6.00 | 9-15-2045 | 1,000,000 | 991,329 |
| | | | | | 3,460,870 |
| Health revenue: 0.69% | | | | | |
| Holmes County FL Hospital Corporation Doctors Memorial Hospital Project | | 6.00 | 11-1-2038 | 250,000 | 225,888 |
| Lee County IDA HCFR Bond Series 2022A | | 5.25 | 10-1-2052 | 1,000,000 | 865,555 |
| | | | | | 1,091,443 |
| Miscellaneous revenue: 0.62% | | | | | |
| City of Leesburg FL Special Assessment Revenue Bond Series 2022 | | 5.13 | 5-1-2037 | 1,000,000 | 994,411 |
The accompanying notes are an integral part of these financial statements.
12 | Allspring High Yield Municipal Bond Fund
Portfolio of investments—December 31, 2022 (unaudited)
| | | Interest
rate | Maturity
date | Principal | Value |
| Water & sewer revenue: 0.23% | | | | | |
| Charlotte County FL IDA Town and Country Utilities Project Series A 144A | | 4.00% | 10-1-2051 | $ 500,000 | $ 365,529 |
| | | | | | 5,912,253 |
| Georgia: 2.96% | | | | | |
| Education revenue: 0.83% | | | | | |
| Georgia Private Colleges & Universities Authority Mercer University Project Series 2022 | | 5.25 | 10-1-2051 | 1,250,000 | 1,316,390 |
| Housing revenue: 0.51% | | | | | |
| Cobb County GA Development Authority Student Housing Kennesaw State University Foundation Project Refunding Bond Series C | | 5.00 | 7-15-2028 | 800,000 | 805,605 |
| Transportation revenue: 0.63% | | | | | |
| Georgia Road & Tollway Authority CCAB I-75 South Expressway Lanes Project Series B 144A¤ | | 0.00 | 6-1-2049 | 1,000,000 | 1,007,073 |
| Utilities revenue: 0.99% | | | | | |
| Georgia Main Street Natural Gas Incorporated Gas Supply Revenue Bonds Series A | | 5.00 | 5-15-2049 | 1,610,000 | 1,573,757 |
| | | | | | 4,702,825 |
| Guam: 0.30% | | | | | |
| Airport revenue: 0.30% | | | | | |
| Guam Antonio B. Won Pat International Airport Authority Refunding Bond Series A %% | | 5.38 | 10-1-2043 | 500,000 | 478,975 |
| Idaho: 0.16% | | | | | |
| Education revenue: 0.16% | | | | | |
| Idaho Housing & Finance Association Legacy Public Charter School Incorporated Project Series A | | 6.25 | 5-1-2043 | 250,000 | 250,567 |
| Illinois: 8.75% | | | | | |
| Education revenue: 0.91% | | | | | |
| Illinois Finance Authority Acero Charter Schools Incorporated 144A | | 4.00 | 10-1-2042 | 250,000 | 192,347 |
| Illinois Finance Authority Charter School Aid Intrinsic Schools Belmont School Project Series A 144A | | 5.25 | 12-1-2025 | 505,000 | 515,072 |
| Illinois Finance Authority Charter School Art in Motion Project Social Bonds Series A 144A | | 5.00 | 7-1-2051 | 1,000,000 | 735,160 |
| | | | | | 1,442,579 |
| GO revenue: 3.80% | | | | | |
| Chicago IL Board of Education CAB School Reform Series A (NPFGC Insured) ¤ | | 0.00 | 12-1-2025 | 500,000 | 446,924 |
| Chicago IL Series 2023A %% | | 5.50 | 1-1-2041 | 500,000 | 516,414 |
| Chicago IL Series 2023A %% | | 5.50 | 1-1-2043 | 500,000 | 515,161 |
| Chicago IL Series A | | 6.00 | 1-1-2038 | 1,500,000 | 1,581,927 |
| Cook County IL School District #144 Prairie Hills CAB Refunding Bond Series C (AGM Insured) ¤ | | 0.00 | 12-1-2025 | 730,000 | 656,994 |
| Lake County IL Community Unit School District #187 North Chicago CAB Series A (AGM Insured) ¤ | | 0.00 | 1-1-2023 | 590,000 | 590,000 |
The accompanying notes are an integral part of these financial statements.
Allspring High Yield Municipal Bond Fund | 13
Portfolio of investments—December 31, 2022 (unaudited)
| | | Interest
rate | Maturity
date | Principal | Value |
| GO revenue (continued) | | | | | |
| Will County IL Community High School CAB Refunding Bond Series B (BAM Insured) ¤ | | 0.00% | 1-1-2033 | $1,000,000 | $ 678,676 |
| Will County IL Community High School Refunding Bond Series A (BAM Insured) | | 3.25 | 1-1-2030 | 450,000 | 450,000 |
| Will County IL Lincoln-Way Community High School District #210 CAB Refunding Bond Series B (BAM Insured) ¤ | | 0.00 | 1-1-2027 | 685,000 | 597,669 |
| | | | | | 6,033,765 |
| Health revenue: 1.26% | | | | | |
| Illinois Finance Authority Revenue Bonds Series 2020C (JPMorgan Chase & Company SPA) ø | | 3.65 | 8-15-2049 | 2,000,000 | 2,000,000 |
| Miscellaneous revenue: 1.95% | | | | | |
| Chicago IL Certificate of Participation River Point Plaza Redevelopment Project Series A 144A | | 4.84 | 4-15-2028 | 1,446,000 | 1,446,781 |
| Illinois Finance Authority Educational Facility Senior Rogers Park Montessori School | | 6.00 | 2-1-2034 | 680,000 | 685,159 |
| Illinois Metropolitan Pier and Exposition Authority McCormick Place Expansion Project Refunding Bond Series A | | 5.00 | 6-15-2050 | 1,000,000 | 974,104 |
| | | | | | 3,106,044 |
| Tax revenue: 0.83% | | | | | |
| Hillside IL Tax Increment Refunding Bond | | 5.00 | 1-1-2030 | 1,345,000 | 1,323,135 |
| | | | | | 13,905,523 |
| Indiana: 1.30% | | | | | |
| Education revenue: 1.30% | | | | | |
| Indiana Finance Authority Educational Facilities Multipurpose DePauw University Project Series 2022A | | 5.00 | 7-1-2047 | 2,055,000 | 2,065,149 |
| Iowa: 0.24% | | | | | |
| Tobacco revenue: 0.24% | | | | | |
| Iowa Tobacco Settlement Authority CAB Asset-Backed Bonds Class 2 Series B-2 ¤ | | 0.00 | 6-1-2065 | 3,490,000 | 376,538 |
| Kansas: 1.32% | | | | | |
| Health revenue: 0.53% | | | | | |
| Kansas State Development Finance Authority Revenue Bond Series A | | 5.25 | 11-15-2033 | 1,000,000 | 849,291 |
| Tax revenue: 0.79% | | | | | |
| Wyandotte County & Kansas City KS Special Obligation Improvement & Refunding Bonds Plaza Redevelopment Project | | 4.00 | 12-1-2028 | 320,000 | 294,283 |
| Wyandotte County & Kansas City KS Special Obligation Vacation Village Project Area 4 Major Multi-Sport Athletic Complex Project CAB 144A¤ | | 0.00 | 9-1-2034 | 2,760,000 | 962,530 |
| | | | | | 1,256,813 |
| | | | | | 2,106,104 |
The accompanying notes are an integral part of these financial statements.
14 | Allspring High Yield Municipal Bond Fund
Portfolio of investments—December 31, 2022 (unaudited)
| | | Interest
rate | Maturity
date | Principal | Value |
| Kentucky: 0.57% | | | | | |
| Health revenue: 0.57% | | | | | |
| Kentucky EDFA Rosedale Green Project Refunding Bond | | 5.50% | 11-15-2035 | $1,000,000 | $ 899,124 |
| Maryland: 1.83% | | | | | |
| Education revenue: 0.65% | | | | | |
| Prince George's County MD Chesapeake Lighthouse Charter School Project Series 2016-A 144A | | 6.90 | 8-1-2041 | 1,000,000 | 1,030,010 |
| Miscellaneous revenue: 0.25% | | | | | |
| Maryland Economic Development Corporation Special Obligation Covington Project | | 4.00 | 9-1-2050 | 500,000 | 389,870 |
| Transportation revenue: 0.93% | | | | | |
| Maryland Economic Development Corporation Private Activity Revenue Bonds Series B | | 5.25 | 6-30-2055 | 1,500,000 | 1,482,866 |
| | | | | | 2,902,746 |
| Massachusetts: 0.57% | | | | | |
| Health revenue: 0.57% | | | | | |
| Massachusetts Development Finance Agency Revenue Refunding Bond Series 2022 | | 5.13 | 1-1-2040 | 1,000,000 | 906,579 |
| Michigan: 1.98% | | | | | |
| Education revenue: 0.25% | | | | | |
| Michigan Finance Authority Limited Obligation Refunding Bond Public School Academy Bradford | | 4.80 | 9-1-2040 | 150,000 | 123,025 |
| Michigan Public Educational Facilities Authority Limited Obligation Crescent Academy Project | | 7.00 | 10-1-2036 | 277,500 | 277,579 |
| | | | | | 400,604 |
| Miscellaneous revenue: 0.77% | | | | | |
| Charyl Stockwell Academy Michigan Public School Refunding Bond | | 4.88 | 10-1-2023 | 75,000 | 74,497 |
| Michigan Finance Authority Local Government Loan Program City of Detroit Financial Recovery Refunding Bonds Series F | | 4.50 | 10-1-2029 | 1,000,000 | 1,002,399 |
| Michigan Public Educational Facilities Authority Chandler Park Academy Project | | 6.35 | 11-1-2028 | 150,000 | 150,098 |
| | | | | | 1,226,994 |
| Tax revenue: 0.96% | | | | | |
| Detroit MI Downtown Development Authority CAB ¤ | | 0.00 | 7-1-2024 | 20,000 | 18,416 |
| Detroit MI Downtown Development Authority CAB ¤ | | 0.00 | 7-1-2025 | 580,000 | 502,988 |
| Michigan Finance Authority Local Government Loan Program Public Lighting Authority Refunding Bonds Series B | | 5.00 | 7-1-2044 | 1,000,000 | 997,727 |
| | | | | | 1,519,131 |
| | | | | | 3,146,729 |
| Minnesota: 2.43% | | | | | |
| Education revenue: 1.67% | | | | | |
| Deephaven MN Charter School Eagle Ridge Academy Project Series 2015-A | | 4.40 | 7-1-2025 | 65,000 | 64,591 |
The accompanying notes are an integral part of these financial statements.
Allspring High Yield Municipal Bond Fund | 15
Portfolio of investments—December 31, 2022 (unaudited)
| | | Interest
rate | Maturity
date | Principal | Value |
| Education revenue (continued) | | | | | |
| Deephaven MN Charter School Eagle Ridge Academy Project Series 2015-A | | 5.00% | 7-1-2030 | $ 195,000 | $ 195,996 |
| Ramsey MN Charter School PACT Project Series 2022A | | 5.00 | 6-1-2032 | 1,000,000 | 974,340 |
| St. Cloud MN Charter School Lease Revenue Bonds Athlos Academy of St. Cloud Series A 144A | | 5.25 | 6-1-2032 | 1,000,000 | 940,792 |
| Woodbury MN Charter School Woodbury Leadership Academy | | 4.00 | 7-1-2051 | 660,000 | 473,796 |
| | | | | | 2,649,515 |
| Health revenue: 0.30% | | | | | |
| Shakopee MN Senior Housing Revenue Benedictine Living Community LLC Project 144A | | 5.85 | 11-1-2058 | 495,000 | 486,390 |
| Housing revenue: 0.46% | | | | | |
| Minneapolis MN Student Housing Riverton Community Housing Project Refunding Bond | | 4.70 | 8-1-2026 | 335,000 | 334,770 |
| Minneapolis MN Student Housing Riverton Community Housing Project Refunding Bond | | 4.80 | 8-1-2027 | 400,000 | 399,660 |
| | | | | | 734,430 |
| | | | | | 3,870,335 |
| Missouri: 0.37% | | | | | |
| Tax revenue: 0.37% | | | | | |
| Blue Springs MO Special Obligation Tax Improvement & Refunding Bonds Adams Farm Project Series A | | 4.00 | 6-1-2026 | 15,000 | 14,269 |
| Richmond Heights MO Francis Place Redevelopment Project | | 5.63 | 11-1-2025 | 595,000 | 579,463 |
| | | | | | 593,732 |
| New Jersey: 3.86% | | | | | |
| Education revenue: 0.74% | | | | | |
| Camden County NJ Improvement Authority Charter School Revenue Bond Series 2022 144A | | 5.00 | 7-15-2042 | 1,175,000 | 1,171,950 |
| GO revenue: 0.65% | | | | | |
| Newark NJ Qualified General Improvement Bonds Series A | | 5.00 | 7-15-2027 | 1,000,000 | 1,043,174 |
| Industrial development revenue: 0.16% | | | | | |
| New Jersey EDA Continental Airlines Incorporated Project | | 5.25 | 9-15-2029 | 250,000 | 248,375 |
| Miscellaneous revenue: 0.64% | | | | | |
| New Jersey EDA Transit Transportation Project Bonds Series A | | 5.00 | 11-1-2044 | 1,000,000 | 1,019,186 |
| Transportation revenue: 1.67% | | | | | |
| New Jersey TTFA Transportation Program Bonds Series CC | | 5.50 | 6-15-2050 | 500,000 | 534,722 |
| New Jersey TTFA Transportation System Series C | | 5.25 | 6-15-2032 | 1,000,000 | 1,029,100 |
| South Jersey Transportation Authority Transportation System Revenue Bonds 2022 Series A | | 5.25 | 11-1-2052 | 1,075,000 | 1,091,059 |
| | | | | | 2,654,881 |
| | | | | | 6,137,566 |
The accompanying notes are an integral part of these financial statements.
16 | Allspring High Yield Municipal Bond Fund
Portfolio of investments—December 31, 2022 (unaudited)
| | | Interest
rate | Maturity
date | Principal | Value |
| New York: 10.65% | | | | | |
| Airport revenue: 2.27% | | | | | |
| New York Transportation Development Corporation Special Facilities Revenue Bond Series 2016 | | 5.00% | 7-1-2046 | $1,000,000 | $ 957,395 |
| New York Transportation Development Corporation Special Facilities Revenue Bond Series 2016A | | 5.25 | 1-1-2050 | 1,000,000 | 971,767 |
| New York Transportation Development Corporation Special Facilities Revenue Bond Series 2022 | | 5.00 | 12-1-2041 | 1,660,000 | 1,675,214 |
| | | | | | 3,604,376 |
| Education revenue: 4.02% | | | | | |
| Build NYC Resource Corporation Friends of Hellenic Classical 144A | | 5.00 | 12-1-2041 | 1,200,000 | 1,043,294 |
| Build NYC Resource Corporation Revenue Bonds Series 2022 144A | | 5.75 | 6-1-2052 | 1,000,000 | 995,720 |
| Hempstead NY Local Development Corporation The Academy Charter School Project Series A | | 4.60 | 2-1-2051 | 500,000 | 368,395 |
| Hempstead NY Local Development Corporation The Academy Charter School Project Series A | | 5.73 | 2-1-2050 | 1,000,000 | 956,306 |
| Hempstead NY Local Development Corporation The Evergreen Charter School Project Series A | | 5.25 | 6-15-2052 | 2,000,000 | 1,874,911 |
| New York Dormitory Authority Supported Debt St. Joseph's College | | 4.00 | 7-1-2035 | 400,000 | 384,261 |
| New York Dormitory Authority Supported Debt St. Joseph's College | | 5.00 | 7-1-2051 | 750,000 | 763,239 |
| | | | | | 6,386,126 |
| GO revenue: 1.38% | | | | | |
| New York GO Fiscal 2023 Series B | | 5.25 | 10-1-2047 | 2,000,000 | 2,199,235 |
| Health revenue: 0.63% | | | | | |
| Westchester County NY Local Development Corporation Revenue Bond Series 2016 | | 5.00 | 11-1-2046 | 1,000,000 | 994,448 |
| Tobacco revenue: 0.16% | | | | | |
| Suffolk County NY Tobacco Securitization Corporation Settlement CAB Asset-Backed Bonds ¤ | | 0.00 | 6-1-2066 | 2,500,000 | 258,103 |
| Transportation revenue: 2.19% | | | | | |
| Metropolitan Transportation Authority Hudson Rail Yards Trust Obligations Revenue Bonds Series 2016A | | 5.00 | 11-15-2056 | 2,000,000 | 1,982,371 |
| Metropolitan Transportation Authority Revenue Green Bonds Series 2020C | | 5.25 | 11-15-2055 | 1,500,000 | 1,499,899 |
| | | | | | 3,482,270 |
| | | | | | 16,924,558 |
| Ohio: 3.88% | | | | | |
| Education revenue: 1.13% | | | | | |
| Ohio Higher Education Facility Commission The Capital University of Higher Educational 2022 Project | | 6.00 | 9-1-2052 | 1,250,000 | 1,281,133 |
| Ohio Higher Education Facility Commission The Cleveland Institute of Music 2022 Project | | 5.38 | 12-1-2052 | 500,000 | 505,747 |
| | | | | | 1,786,880 |
The accompanying notes are an integral part of these financial statements.
Allspring High Yield Municipal Bond Fund | 17
Portfolio of investments—December 31, 2022 (unaudited)
| | | Interest
rate | Maturity
date | Principal | Value |
| GO revenue: 1.21% | | | | | |
| Ohio Treasurer Private Activity Bonds Series 2015 | | 5.00% | 6-30-2053 | $2,000,000 | $ 1,923,117 |
| Resource recovery revenue: 0.43% | | | | | |
| Southern Ohio Port Authority Exempt Facility Revenue PureCycle Project 144A | | 7.00 | 12-1-2042 | 1,000,000 | 687,289 |
| Tobacco revenue: 1.11% | | | | | |
| Buckeye Tobacco Settlement Financing Authority | | 5.00 | 6-1-2055 | 985,000 | 854,980 |
| Buckeye Tobacco Settlement Financing Authority CAB ¤ | | 0.00 | 6-1-2057 | 8,000,000 | 915,586 |
| | | | | | 1,770,566 |
| | | | | | 6,167,852 |
| Oregon: 1.29% | | | | | |
| Health revenue: 1.29% | | | | | |
| Hospital Facility Authority of Polk County Revenue Bond Dallas Retirement Village Project Series 2015-A | | 5.00 | 7-1-2025 | 345,000 | 340,639 |
| Oregon Facilities Authority Revenue Refunding Bond Samaritan Health Services Project Series A | | 5.00 | 10-1-2040 | 1,685,000 | 1,715,658 |
| | | | | | 2,056,297 |
| Pennsylvania: 4.31% | | | | | |
| Education revenue: 0.40% | | | | | |
| Allegheny County PA IDA Propel Charter School Sunrise Project | | 5.25 | 7-15-2023 | 25,000 | 25,178 |
| Philadelphia PA IDA Independence Charter School Project | | 5.00 | 6-15-2039 | 250,000 | 233,496 |
| Philadelphia PA IDA Tacony Academy Charter School Project | | 6.88 | 6-15-2033 | 375,000 | 379,981 |
| | | | | | 638,655 |
| Health revenue: 2.73% | | | | | |
| Lancaster County Hospital Authority Series 2021 | | 5.00 | 11-1-2051 | 1,000,000 | 1,009,284 |
| Pennsylvania EDFA Private Activity Revenue Bonds Series 2022 | | 5.25 | 6-30-2053 | 2,500,000 | 2,447,876 |
| Quakertown PA General Authority Health LifeQuest Obligated Group Refunding Bond Series C | | 5.30 | 7-1-2042 | 1,000,000 | 877,451 |
| | | | | | 4,334,611 |
| Miscellaneous revenue: 0.54% | | | | | |
| Chester County PA IDA Woodlands at Graystone Project Series 2018 144A | | 5.13 | 3-1-2048 | 915,000 | 853,159 |
| Utilities revenue: 0.64% | | | | | |
| Philadelphia PA Gas Works Revenue Bonds Fifteenth Series | | 5.00 | 8-1-2047 | 1,000,000 | 1,023,997 |
| | | | | | 6,850,422 |
| South Carolina: 2.70% | | | | | |
| Education revenue: 0.64% | | | | | |
| South Carolina Jobs EDA Refunding Bond Columbia College Project | | 5.75 | 10-1-2045 | 500,000 | 440,131 |
The accompanying notes are an integral part of these financial statements.
18 | Allspring High Yield Municipal Bond Fund
Portfolio of investments—December 31, 2022 (unaudited)
| | | Interest
rate | Maturity
date | Principal | Value |
| Education revenue (continued) | | | | | |
| South Carolina Jobs EDA York Preparatory Academy Project Series A 144A | | 5.75% | 11-1-2023 | $ 35,000 | $ 35,760 |
| South Carolina Jobs EDA York Preparatory Academy Project Series A 144A | | 7.25 | 11-1-2045 | 500,000 | 537,524 |
| | | | | | 1,013,415 |
| Health revenue: 0.50% | | | | | |
| South Carolina Jobs EDA Residential Facilities Revenue Episcopal Home Still Hopes Refunding Bond Series A | | 5.00 | 4-1-2048 | 1,000,000 | 803,505 |
| Resource recovery revenue: 0.30% | | | | | |
| South Carolina Jobs EDA Solid Waste Disposal AMT RePower South Berkeley LLC Project Green Bond 144A† | | 6.25 | 2-1-2045 | 1,000,000 | 400,000 |
| South Carolina Jobs EDA Solid Waste Disposal RePower South Berkeley LLC Green Bond † | | 8.00 | 12-6-2029 | 100,000 | 81,559 |
| | | | | | 481,559 |
| Utilities revenue: 1.26% | | | | | |
| Tender Option Bond Trust Receipts (AGM Insured, Barclays Bank plc LIQ) 144Aø | | 3.78 | 12-1-2052 | 2,000,000 | 2,000,000 |
| | | | | | 4,298,479 |
| Tennessee: 1.96% | | | | | |
| Health revenue: 1.26% | | | | | |
| Shelby County TN Health Educational & Housing Facilities Board Methodist Le Bonheur Series B (AGM Insured, U.S. Bank NA SPA) ø | | 3.63 | 6-1-2042 | 2,000,000 | 2,000,000 |
| Tax revenue: 0.70% | | | | | |
| Bristol TN Industrial Development Board Sales Tax CAB Series B 144A¤ | | 0.00 | 12-1-2031 | 1,000,000 | 606,499 |
| Nashville TN Metropolitan Development & Housing Agency Tax Increment Fifth & Broadway Development Project 144A | | 5.13 | 6-1-2036 | 500,000 | 503,142 |
| | | | | | 1,109,641 |
| | | | | | 3,109,641 |
| Texas: 5.71% | | | | | |
| Education revenue: 2.13% | | | | | |
| Arlington TX Higher Education Finance Corporation Refunding Bond Legacy Traditional Schools Series A 144A | | 6.38 | 2-15-2052 | 1,500,000 | 1,458,336 |
| Arlington TX Higher Education Finance Corporation Refunding Bond Wayside Schools Series A | | 4.00 | 8-15-2046 | 860,000 | 652,268 |
| Arlington TX Higher Education Finance Corporation Universal Academy Series A | | 7.00 | 3-1-2034 | 320,000 | 326,075 |
| Pottsboro TX Higher Education Finance Corporation Imagine International Academy of North Texas Series A | | 3.88 | 8-15-2026 | 1,000,000 | 957,445 |
| | | | | | 3,394,124 |
| GO revenue: 0.60% | | | | | |
| Port Isabel TX Series 2019 144A | | 5.10 | 2-15-2049 | 950,000 | 959,548 |
The accompanying notes are an integral part of these financial statements.
Allspring High Yield Municipal Bond Fund | 19
Portfolio of investments—December 31, 2022 (unaudited)
| | | Interest
rate | Maturity
date | Principal | Value |
| Resource recovery revenue: 1.26% | | | | | |
| Port Corpus Christi Solid Waste Disposal Revenue Bonds Series 2002A 144Aø | | 3.90% | 7-1-2029 | $2,000,000 | $ 2,000,000 |
| Tax revenue: 0.26% | | | | | |
| Baytown TX Municipal Development District Hotel Second Lien Baytown Convention 144A | | 5.00 | 10-1-2050 | 500,000 | 410,689 |
| Transportation revenue: 1.33% | | | | | |
| Texas Private Activity Bond Surface Transportation Corporation Project NTE Mobility Partners Segments LLC | | 5.00 | 6-30-2058 | 2,000,000 | 1,907,534 |
| Texas Private Activity Bond Surface Transportation Corporation Project NTE Mobility Partners Segments LLC | | 7.00 | 12-31-2038 | 200,000 | 203,695 |
| | | | | | 2,111,229 |
| Utilities revenue: 0.13% | | | | | |
| Texas Gas Supply SA Energy Acquisition Public Facilities Corporation | | 5.50 | 8-1-2027 | 190,000 | 200,583 |
| | | | | | 9,076,173 |
| Utah: 1.55% | | | | | |
| Education revenue: 0.58% | | | | | |
| Utah Charter School Finance Authority Freedom Academy Foundation St. George 144A | | 5.00 | 6-15-2041 | 1,020,000 | 925,035 |
| Miscellaneous revenue: 0.45% | | | | | |
| Mida Mountain Village Public Infrastructure District Utah Special Assessment Revenue Bonds Mountain Village Assessment Area #2 144A | | 4.00 | 8-1-2050 | 1,000,000 | 712,421 |
| Tax revenue: 0.52% | | | | | |
| Utah Inland Port Authority Crossroads Public Infrastructure District Tax Differential Revenue 144A | | 4.38 | 6-1-2052 | 1,000,000 | 827,250 |
| | | | | | 2,464,706 |
| Virginia: 1.67% | | | | | |
| Health revenue: 0.49% | | | | | |
| Roanoke VA EDA Residential Care Richfield Living | | 5.13 | 9-1-2055 | 1,210,000 | 777,604 |
| Transportation revenue: 1.18% | | | | | |
| Virginia Small Business Financing Authority Private Activity Revenue Bonds Series 2017 | | 5.00 | 12-31-2052 | 2,000,000 | 1,884,636 |
| | | | | | 2,662,240 |
| Washington: 0.48% | | | | | |
| Health revenue: 0.48% | | | | | |
| Washington Health Care Facilities Authority Revenue Bonds Series 2020 | | 5.00 | 9-1-2050 | 750,000 | 765,207 |
| West Virginia: 0.95% | | | | | |
| Tax revenue: 0.95% | | | | | |
| Monongalia County WV Commission Improvement & Refunding Bonds University Town Center Series A 144A | | 5.75 | 6-1-2043 | 1,500,000 | 1,512,667 |
The accompanying notes are an integral part of these financial statements.
20 | Allspring High Yield Municipal Bond Fund
Portfolio of investments—December 31, 2022 (unaudited)
| | | Interest
rate | Maturity
date | Principal | Value |
| Wisconsin: 6.72% | | | | | |
| Education revenue: 4.70% | | | | | |
| Wisconsin PFA Coral Academy Science Las Vegas Series A | | 5.00% | 7-1-2024 | $ 160,000 | $ 161,442 |
| Wisconsin PFA Education Revenue Bond Uwharrie Charter Academy Project Series 2022-A 144A | | 5.00 | 6-15-2042 | 1,310,000 | 1,180,229 |
| Wisconsin PFA Education Revenue Bonds Eastern Michigan University Student Housing Project Series 2022 (BAM Insured) | | 5.50 | 7-1-2052 | 500,000 | 543,340 |
| Wisconsin PFA Education Revenue Bonds Triad Educational Services Series 2022 | | 5.00 | 6-15-2042 | 1,140,000 | 1,110,798 |
| Wisconsin PFA Education Revenue Bonds Triad Educational Services Series 2022 | | 5.25 | 6-15-2052 | 1,610,000 | 1,557,440 |
| Wisconsin PFA Educational Facility Revenue Refunding Bond Estancia Valley Classical 144A | | 4.25 | 7-1-2051 | 1,000,000 | 702,854 |
| Wisconsin PFA Research Triangle High School Project Series 2015-A 144A | | 5.63 | 7-1-2045 | 1,000,000 | 1,003,559 |
| Wisconsin PFA Wilson Preparatory Academy Series A 144A | | 5.00 | 6-15-2039 | 1,285,000 | 1,214,669 |
| | | | | | 7,474,331 |
| Health revenue: 0.76% | | | | | |
| Wisconsin HEFA Revenue Bond Senior Housing Incorporate Series A | | 5.25 | 8-1-2048 | 1,500,000 | 1,215,201 |
| Housing revenue: 1.26% | | | | | |
| Wisconsin Housing and Economic Development Authority Demand Home Ownership Revenue Bonds Series E (FHLB SPA) ø | | 3.78 | 9-1-2035 | 2,000,000 | 2,000,000 |
| | | | | | 10,689,532 |
| Total Municipal obligations (Cost $151,088,608) | | | | | 141,958,362 |
| | | Yield | | Shares | |
| Short-term investments: 3.79% | | | | | |
| Investment companies: 3.79% | | | | | |
| Allspring Municipal Cash Management Money Market Fund Institutional Class ♠∞## | | 3.56 | | 6,019,760 | 6,020,964 |
| Total Short-term investments (Cost $6,020,964) | | | | | 6,020,964 |
| Total investments in securities (Cost $157,109,572) | 93.09% | | | | 147,979,326 |
| Other assets and liabilities, net | 6.91 | | | | 10,984,632 |
| Total net assets | 100.00% | | | | $158,963,958 |
| ¤ | The security is issued in zero coupon form with no periodic interest payments. |
| 144A | The security may be resold in transactions exempt from registration, normally to qualified institutional buyers, pursuant to Rule 144A under the Securities Act of 1933. |
| ø | Variable rate demand notes are subject to a demand feature which reduces the effective maturity. The maturity date shown represents the final maturity date of the security. The interest rate is determined and reset by the issuer daily, weekly, or monthly depending upon the terms of the security. The rate shown is the rate in effect at period end. |
| † | Non-income-earning security |
| ## | All or a portion of this security is segregated for when-issued securities. |
| ♠ | The issuer of the security is an affiliated person of the Fund as defined in the Investment Company Act of 1940. |
| ∞ | The rate represents the 7-day annualized yield at period end. |
| %% | The security is purchased on a when-issued basis. |
The accompanying notes are an integral part of these financial statements.
Allspring High Yield Municipal Bond Fund | 21
Portfolio of investments—December 31, 2022 (unaudited)
| Abbreviations: |
| AGM | Assured Guaranty Municipal |
| AMT | Alternative minimum tax |
| BAM | Build America Mutual Assurance Company |
| CAB | Capital appreciation bond |
| CCAB | Convertible capital appreciation bond |
| CDA | Community Development Authority |
| EDA | Economic Development Authority |
| EDFA | Economic Development Finance Authority |
| FHLB | Federal Home Loan Bank |
| GO | General obligation |
| HCFR | Healthcare facilities revenue |
| HEFA | Health & Educational Facilities Authority |
| IDA | Industrial Development Authority |
| LIQ | Liquidity agreement |
| NPFGC | National Public Finance Guarantee Corporation |
| PFA | Public Finance Authority |
| RDA | Redevelopment Authority |
| SPA | Standby purchase agreement |
| TTFA | Transportation Trust Fund Authority |
Investments in affiliates
An affiliated investment is an investment in which the Fund owns at least 5% of the outstanding voting shares of the issuer or as a result of other relationships, such as the Fund and the issuer having the same investment manager. Transactions with issuers that were affiliates of the Fund at the end of the period were as follows:
| | Value,
beginning of
period | Purchases | Sales
proceeds | Net
realized
gains
(losses) | Net
change in
unrealized
gains
(losses) | Value,
end of
period | Shares,
end
of period | Income
from
affiliated
securities |
| Short-term investments | | | | | | | |
| Allspring Municipal Cash Management Money Market Fund Institutional Class | $5,593,920 | $64,626,698 | $(64,194,817) | $(4,837) | $0 | $6,020,964 | 6,019,760 | $71,423 |
The accompanying notes are an integral part of these financial statements.
22 | Allspring High Yield Municipal Bond Fund
Statement of assets and liabilities—December 31, 2022 (unaudited)
| | |
| Assets | |
Investments in unaffiliated securities, at value (cost $151,088,608)
| $ 141,958,362 |
Investments in affiliated securities, at value (cost $6,020,964)
| 6,020,964 |
Receivable for Fund shares sold
| 11,823,812 |
Receivable for interest
| 1,761,565 |
Prepaid expenses and other assets
| 44,793 |
Total assets
| 161,609,496 |
| Liabilities | |
Payable for when-issued transactions
| 1,531,960 |
Payable for Fund shares redeemed
| 964,533 |
Dividends payable
| 54,023 |
Management fee payable
| 38,350 |
Administration fees payable
| 13,707 |
Distribution fee payable
| 4,469 |
Trustees’ fees and expenses payable
| 1,888 |
Accrued expenses and other liabilities
| 36,608 |
Total liabilities
| 2,645,538 |
Total net assets
| $158,963,958 |
| Net assets consist of | |
Paid-in capital
| $ 171,023,093 |
Total distributable loss
| (12,059,135) |
Total net assets
| $158,963,958 |
| Computation of net asset value and offering price per share | |
Net assets – Class A
| $ 41,572,627 |
Shares outstanding – Class A1
| 4,475,723 |
Net asset value per share – Class A
| $9.29 |
Maximum offering price per share – Class A2
| $9.73 |
Net assets – Class C
| $ 6,760,918 |
Shares outstanding – Class C1
| 727,827 |
Net asset value per share – Class C
| $9.29 |
Net assets – Class R6
| $ 23,021 |
Shares outstanding – Class R61
| 2,473 |
Net asset value per share – Class R6
| $9.31 |
Net assets – Administrator Class
| $ 7,713,339 |
Shares outstanding – Administrator Class1
| 830,089 |
Net asset value per share – Administrator Class
| $9.29 |
Net assets – Institutional Class
| $ 102,894,053 |
Shares outstanding – Institutional Class1
| 11,077,321 |
Net asset value per share – Institutional Class
| $9.29 |
| 1 | The Fund has an unlimited number of authorized shares. |
| 2 | Maximum offering price is computed as 100/95.50 of net asset value. On investments of $50,000 or more, the offering price is reduced. |
The accompanying notes are an integral part of these financial statements.
Allspring High Yield Municipal Bond Fund | 23
Statement of operations—six months ended December 31, 2022 (unaudited)
| | |
| Investment income | |
Interest
| $ 2,933,368 |
Income from affiliated securities
| 71,423 |
Total investment income
| 3,004,791 |
| Expenses | |
Management fee
| 311,302 |
| Administration fees | |
Class A
| 30,752 |
Class C
| 5,134 |
Class R6
| 4 |
Administrator Class
| 3,809 |
Institutional Class
| 28,809 |
| Shareholder servicing fees | |
Class A
| 47,930 |
Class C
| 7,833 |
Administrator Class
| 9,493 |
| Distribution fee | |
Class C
| 23,498 |
Custody and accounting fees
| 4,685 |
Professional fees
| 28,687 |
Registration fees
| 39,493 |
Shareholder report expenses
| 13,145 |
Trustees’ fees and expenses
| 11,158 |
Other fees and expenses
| 3,333 |
Total expenses
| 569,065 |
| Less: Fee waivers and/or expense reimbursements | |
Fund-level
| (119,774) |
Class A
| (15,087) |
Class C
| (1,889) |
Administrator Class
| (4,858) |
Net expenses
| 427,457 |
Net investment income
| 2,577,334 |
| Realized and unrealized gains (losses) on investments | |
| Net realized losses on | |
Unaffiliated securities
| (1,153,109) |
Affiliated securities
| (4,837) |
Net realized losses on investments
| (1,157,946) |
Net change in unrealized gains (losses) on investments
| (2,462,054) |
Net realized and unrealized gains (losses) on investments
| (3,620,000) |
Net decrease in net assets resulting from operations
| $(1,042,666) |
The accompanying notes are an integral part of these financial statements.
24 | Allspring High Yield Municipal Bond Fund
Statement of changes in net assets
| | | | | |
| | Six months ended
December 31, 2022
(unaudited) | Year ended
June 30, 2022 |
| Operations | | | | |
Net investment income
| | $ 2,577,334 | | $ 3,790,032 |
Net realized losses on investments
| | (1,157,946) | | (1,705,630) |
Net change in unrealized gains (losses) on investments
| | (2,462,054) | | (13,871,298) |
Net decrease in net assets resulting from operations
| | (1,042,666) | | (11,786,896) |
| Distributions to shareholders from | | | | |
| Net investment income and net realized gains | | | | |
Class A
| | (782,669) | | (1,572,805) |
Class C
| | (106,564) | | (252,745) |
Class R6
| | (510) | | (1,044) |
Administrator Class
| | (159,322) | | (384,186) |
Institutional Class
| | (1,571,127) | | (1,958,274) |
Total distributions to shareholders
| | (2,620,192) | | (4,169,054) |
| Capital share transactions | Shares | | Shares | |
| Proceeds from shares sold | | | | |
Class A
| 964,622 | 9,053,935 | 1,829,910 | 19,247,400 |
Class C
| 174,562 | 1,632,129 | 121,872 | 1,282,715 |
Administrator Class
| 145,952 | 1,372,248 | 874,425 | 8,646,964 |
Institutional Class
| 8,547,693 | 79,769,827 | 5,497,610 | 54,759,627 |
| | | 91,828,139 | | 83,936,706 |
| Reinvestment of distributions | | | | |
Class A
| 79,245 | 742,417 | 141,735 | 1,500,548 |
Class C
| 11,004 | 103,096 | 23,517 | 249,871 |
Class R6
| 55 | 505 | 62 | 645 |
Administrator Class
| 8,362 | 78,498 | 20,739 | 219,472 |
Institutional Class
| 165,610 | 1,546,438 | 185,327 | 1,946,947 |
| | | 2,470,954 | | 3,917,483 |
| Payment for shares redeemed | | | | |
Class A
| (451,313) | (4,178,384) | (1,451,197) | (15,179,217) |
Class C
| (130,570) | (1,231,553) | (231,805) | (2,409,232) |
Administrator Class
| (221,733) | (2,118,966) | (866,104) | (8,538,467) |
Institutional Class
| (3,572,323) | (33,097,250) | (3,730,743) | (36,960,703) |
| | | (40,626,153) | | (63,087,619) |
Net increase in net assets resulting from capital share transactions
| | 53,672,940 | | 24,766,570 |
Total increase in net assets
| | 50,010,082 | | 8,810,620 |
| Net assets | | | | |
Beginning of period
| | 108,953,876 | | 100,143,256 |
End of period
| | $158,963,958 | | $108,953,876 |
The accompanying notes are an integral part of these financial statements.
Allspring High Yield Municipal Bond Fund | 25
Financial highlights
(For a share outstanding throughout each period)
| | | Year ended June 30 |
| Class A | Six months ended
December 31, 2022
(unaudited) | 2022 | 2021 | 2020 | 2019 | 2018 |
Net asset value, beginning of period
| $9.56 | $11.16 | $10.43 | $10.97 | $10.59 | $10.37 |
Net investment income
| 0.19 | 0.38 | 0.41 | 0.44 | 0.39 | 0.40 |
Net realized and unrealized gains (losses) on investments
| (0.26) | (1.56) | 0.73 | (0.54) | 0.38 | 0.22 |
Total from investment operations
| (0.07) | (1.18) | 1.14 | (0.10) | 0.77 | 0.62 |
| Distributions to shareholders from | | | | | | |
Net investment income
| (0.20) | (0.38) | (0.41) | (0.44) | (0.39) | (0.40) |
Net realized gains
| 0.00 | (0.04) | 0.00 | 0.00 | 0.00 | 0.00 |
Total distributions to shareholders
| (0.20) | (0.42) | (0.41) | (0.44) | (0.39) | (0.40) |
Net asset value, end of period
| $9.29 | $9.56 | $11.16 | $10.43 | $10.97 | $10.59 |
Total return1
| (0.80)% | (10.84)% | 10.98% | (0.98)% | 7.43% | 6.11% |
| Ratios to average net assets (annualized) | | | | | | |
Gross expenses
| 1.07% | 1.10% | 1.14% | 1.12% | 1.09% | 1.07% |
Net expenses
| 0.80% | 0.80% | 0.80% | 0.80% | 0.80% | 0.85% |
Net investment income
| 4.01% | 3.61% | 3.74% | 4.05% | 3.68% | 3.82% |
| Supplemental data | | | | | | |
Portfolio turnover rate
| 14% | 30% | 55% | 14% | 20% | 50% |
Net assets, end of period (000s omitted)
| $41,573 | $37,138 | $37,514 | $24,791 | $23,674 | $17,086 |
| 1 | Total return calculations do not include any sales charges. Returns for periods of less than one year are not annualized. |
The accompanying notes are an integral part of these financial statements.
26 | Allspring High Yield Municipal Bond Fund
Financial highlights
(For a share outstanding throughout each period)
| | | Year ended June 30 |
| Class C | Six months ended
December 31, 2022
(unaudited) | 2022 | 2021 | 2020 | 2019 | 2018 |
Net asset value, beginning of period
| $9.56 | $11.16 | $10.44 | $10.97 | $10.59 | $10.37 |
Net investment income
| 0.16 | 0.30 | 0.32 | 0.36 | 0.31 | 0.32 |
Net realized and unrealized gains (losses) on investments
| (0.27) | (1.55) | 0.72 | (0.53) | 0.38 | 0.22 |
Total from investment operations
| (0.11) | (1.25) | 1.04 | (0.17) | 0.69 | 0.54 |
| Distributions to shareholders from | | | | | | |
Net investment income
| (0.16) | (0.31) | (0.32) | (0.36) | (0.31) | (0.32) |
Net realized gains
| 0.00 | (0.04) | 0.00 | 0.00 | 0.00 | 0.00 |
Total distributions to shareholders
| (0.16) | (0.35) | (0.32) | (0.36) | (0.31) | (0.32) |
Net asset value, end of period
| $9.29 | $9.56 | $11.16 | $10.44 | $10.97 | $10.59 |
Total return1
| (1.18)% | (11.51)% | 10.14% | (1.63)% | 6.63% | 5.32% |
| Ratios to average net assets (annualized) | | | | | | |
Gross expenses
| 1.80% | 1.84% | 1.89% | 1.87% | 1.84% | 1.82% |
Net expenses
| 1.55% | 1.55% | 1.55% | 1.55% | 1.55% | 1.60% |
Net investment income
| 3.25% | 2.84% | 3.02% | 3.29% | 2.91% | 3.09% |
| Supplemental data | | | | | | |
Portfolio turnover rate
| 14% | 30% | 55% | 14% | 20% | 50% |
Net assets, end of period (000s omitted)
| $6,761 | $6,435 | $8,471 | $9,250 | $9,955 | $8,896 |
| 1 | Total return calculations do not include any sales charges. Returns for periods of less than one year are not annualized. |
The accompanying notes are an integral part of these financial statements.
Allspring High Yield Municipal Bond Fund | 27
Financial highlights
(For a share outstanding throughout each period)
| | | Year ended June 30 |
| Class R6 | Six months ended
December 31, 2022
(unaudited) | 2022 | 2021 | 2020 | 2019 1 |
Net asset value, beginning of period
| $9.59 | $11.16 | $10.44 | $10.98 | $10.61 |
Net investment income
| 0.21 | 0.42 | 0.44 | 0.47 | 0.39 |
Net realized and unrealized gains (losses) on investments
| (0.28) | (1.55) | 0.71 | (0.54) | 0.37 |
Total from investment operations
| (0.07) | (1.13) | 1.15 | (0.07) | 0.76 |
| Distributions to shareholders from | | | | | |
Net investment income
| (0.21) | (0.40) | (0.43) | (0.47) | (0.39) |
Net realized gains
| 0.00 | (0.04) | 0.00 | 0.00 | 0.00 |
Total distributions to shareholders
| (0.21) | (0.44) | (0.43) | (0.47) | (0.39) |
Net asset value, end of period
| $9.31 | $9.59 | $11.16 | $10.44 | $10.98 |
Total return2
| (0.66)% | (10.53)% | 11.28% | (0.68)% | 7.29% |
| Ratios to average net assets (annualized) | | | | | |
Gross expenses
| 0.69% | 0.72% | 0.76% | 0.73% | 0.71% |
Net expenses
| 0.50% | 0.50% | 0.50% | 0.50% | 0.50% |
Net investment income
| 4.29% | 3.91% | 4.07% | 4.34% | 3.96% |
| Supplemental data | | | | | |
Portfolio turnover rate
| 14% | 30% | 55% | 14% | 20% |
Net assets, end of period (000s omitted)
| $23 | $23 | $26 | $25 | $26 |
| 1 | For the period from July 31, 2018 (commencement of class operations) to June 30, 2019 |
| 2 | Returns for periods of less than one year are not annualized. |
The accompanying notes are an integral part of these financial statements.
28 | Allspring High Yield Municipal Bond Fund
Financial highlights
(For a share outstanding throughout each period)
| | | Year ended June 30 |
| Administrator Class | Six months ended
December 31, 2022
(unaudited) | 2022 | 2021 | 2020 | 2019 | 2018 |
Net asset value, beginning of period
| $9.57 | $11.16 | $10.44 | $10.98 | $10.59 | $10.37 |
Net investment income
| 0.20 | 0.40 | 0.42 | 0.45 | 0.40 | 0.41 |
Net realized and unrealized gains (losses) on investments
| (0.28) | (1.55) | 0.72 | (0.54) | 0.39 | 0.22 |
Total from investment operations
| (0.08) | (1.15) | 1.14 | (0.09) | 0.79 | 0.63 |
| Distributions to shareholders from | | | | | | |
Net investment income
| (0.20) | (0.40) | (0.42) | (0.45) | (0.40) | (0.41) |
Net realized gains
| 0.00 | (0.04) | 0.00 | 0.00 | 0.00 | 0.00 |
Total distributions to shareholders
| (0.20) | (0.44) | (0.42) | (0.45) | (0.40) | (0.41) |
Net asset value, end of period
| $9.29 | $9.57 | $11.16 | $10.44 | $10.98 | $10.59 |
Total return1
| (0.74)% | (10.65)% | 11.10% | (0.87)% | 7.64% | 6.21% |
| Ratios to average net assets (annualized) | | | | | | |
Gross expenses
| 1.01% | 1.05% | 1.08% | 1.05% | 1.03% | 1.01% |
Net expenses
| 0.69% | 0.68% | 0.69% | 0.70% | 0.71% | 0.75% |
Net investment income
| 4.12% | 3.73% | 3.88% | 4.12% | 3.69% | 3.93% |
| Supplemental data | | | | | | |
Portfolio turnover rate
| 14% | 30% | 55% | 14% | 20% | 50% |
Net assets, end of period (000s omitted)
| $7,713 | $8,587 | $9,692 | $11,115 | $15,704 | $24,627 |
| 1 | Returns for periods of less than one year are not annualized. |
The accompanying notes are an integral part of these financial statements.
Allspring High Yield Municipal Bond Fund | 29
Financial highlights
(For a share outstanding throughout each period)
| | | Year ended June 30 |
| Institutional Class | Six months ended
December 31, 2022
(unaudited) | 2022 | 2021 | 2020 | 2019 | 2018 |
Net asset value, beginning of period
| $9.56 | $11.15 | $10.43 | $10.97 | $10.59 | $10.37 |
Net investment income
| 0.21 | 0.41 | 0.43 | 0.46 | 0.42 | 0.43 |
Net realized and unrealized gains (losses) on investments
| (0.27) | (1.55) | 0.72 | (0.53) | 0.38 | 0.22 |
Total from investment operations
| (0.06) | (1.14) | 1.15 | (0.07) | 0.80 | 0.65 |
| Distributions to shareholders from | | | | | | |
Net investment income
| (0.21) | (0.41) | (0.43) | (0.47) | (0.42) | (0.43) |
Net realized gains
| 0.00 | (0.04) | 0.00 | 0.00 | 0.00 | 0.00 |
Total distributions to shareholders
| (0.21) | (0.45) | (0.43) | (0.47) | (0.42) | (0.43) |
Net asset value, end of period
| $9.29 | $9.56 | $11.15 | $10.43 | $10.97 | $10.59 |
Total return1
| (0.67)% | (10.54)% | 11.15% | (0.74)% | 7.70% | 6.37% |
| Ratios to average net assets (annualized) | | | | | | |
Gross expenses
| 0.74% | 0.77% | 0.81% | 0.78% | 0.76% | 0.74% |
Net expenses
| 0.55% | 0.55% | 0.55% | 0.55% | 0.55% | 0.60% |
Net investment income
| 4.29% | 3.87% | 4.00% | 4.24% | 3.92% | 4.09% |
| Supplemental data | | | | | | |
Portfolio turnover rate
| 14% | 30% | 55% | 14% | 20% | 50% |
Net assets, end of period (000s omitted)
| $102,894 | $56,771 | $44,440 | $37,049 | $85,187 | $75,560 |
| 1 | Returns for periods of less than one year are not annualized. |
The accompanying notes are an integral part of these financial statements.
30 | Allspring High Yield Municipal Bond Fund
Notes to financial statements (unaudited)
1. ORGANIZATION
Allspring Funds Trust (the "Trust"), a Delaware statutory trust organized on March 10, 1999, is an open-end management investment company registered under the Investment Company Act of 1940, as amended (the "1940 Act"). As an investment company, the Trust follows the accounting and reporting guidance in Financial Accounting Standards Board ("FASB") Accounting Standards Codification Topic 946, Financial Services – Investment Companies. These financial statements report on the Allspring High Yield Municipal Bond Fund (the "Fund") which is a diversified series of the Trust.
2. SIGNIFICANT ACCOUNTING POLICIES
The following significant accounting policies, which are consistently followed in the preparation of the financial statements of the Fund, are in conformity with U.S. generally accepted accounting principles which require management to make estimates and assumptions that affect the reported amounts of assets and liabilities, disclosure of contingent assets and liabilities at the date of the financial statements, and the reported amounts of income and expenses during the reporting period. Actual results could differ from those estimates.
Securities valuation
All investments are valued each business day as of the close of regular trading on the New York Stock Exchange (generally 4 p.m. Eastern Time), although the Fund may deviate from this calculation time under unusual or unexpected circumstances.
Debt securities are valued at the evaluated bid price provided by an independent pricing service (e.g. taking into account various factors, including yields, maturities, or credit ratings) or, if a reliable price is not available, the quoted bid price from an independent broker-dealer.
Investments in registered open-end investment companies (other than those listed on a foreign or domestic exchange or market) are valued at net asset value.
Investments which are not valued using the methods discussed above are valued at their fair value, as determined in good faith by Allspring Funds Management, LLC ("Allspring Funds Management"), which was named the valuation designee by the Board of Trustees. As the valuation designee, Allspring Funds Management is responsible for day-to-day valuation activities for the Allspring Funds. In connection with these responsibilities, Allspring Funds Management has established a Valuation Committee and has delegated to it the authority to take any actions regarding the valuation of portfolio securities that the Valuation Committee deems necessary or appropriate, including determining the fair value of portfolio securities. On a quarterly basis, the Board of Trustees receives reports of valuation actions taken by the Valuation Committee. On at least an annual basis, the Board of Trustees receives an assessment of the adequacy and effectiveness of Allspring Funds Management's process for determining the fair value of the portfolio of investments.
When-issued transactions
The Fund may purchase securities on a forward commitment or when-issued basis. The Fund records a when-issued transaction on the trade date and will segregate assets in an amount at least equal in value to the Fund's commitment to purchase when-issued securities. Securities purchased on a when-issued basis are marked-to-market daily and the Fund begins earning interest on the settlement date. Losses may arise due to changes in the market value of the underlying securities or if the counterparty does not perform under the contract.
Security transactions and income recognition
Securities transactions are recorded on a trade date basis. Realized gains or losses are recorded on the basis of identified cost.
Interest income is accrued daily and bond discounts are accreted and premiums are amortized daily. To the extent debt obligations are placed on non-accrual status, any related interest income may be reduced by writing off interest receivables when the collection of all or a portion of interest has been determined to be doubtful based on consistently applied procedures and the fair value has decreased. If the issuer subsequently resumes interest payments or when the collectability of interest is reasonably assured, the debt obligation is removed from non-accrual status.
Distributions to shareholders
Distributions to shareholders from net investment income are declared daily and paid monthly. Distributions from net realized gains, if any, are recorded on the ex-dividend date and paid at least annually. Such distributions are determined in accordance with income tax regulations and may differ from U.S. generally accepted accounting principles. Dividend sources are estimated at the time of declaration. The tax character of distributions is determined as of the Fund's fiscal year end. Therefore, a portion of the Fund's distributions made prior to the Fund’s fiscal year end may be categorized as a tax return of capital at year end.
Allspring High Yield Municipal Bond Fund | 31
Notes to financial statements (unaudited)
Federal and other taxes
The Fund intends to continue to qualify as a regulated investment company by distributing substantially all of its investment company taxable and tax-exempt income and any net realized capital gains (after reduction for capital loss carryforwards) sufficient to relieve it from all, or substantially all, federal income taxes. Accordingly, no provision for federal income taxes was required.
The Fund’s income and federal excise tax returns and all financial records supporting those returns for the prior three fiscal years are subject to examination by the federal and Delaware revenue authorities. Management has analyzed the Fund's tax positions taken on federal, state, and foreign tax returns, as applicable, for all open tax years and does not believe that there are any uncertain tax positions that require recognition of a tax liability.
As of December 31, 2022, the aggregate cost of all investments for federal income tax purposes was $157,109,572 and the unrealized gains (losses) consisted of:
| Gross unrealized gains | $ 1,564,833 |
| Gross unrealized losses | (10,695,079) |
| Net unrealized losses | $ (9,130,246) |
As of June 30, 2022, the Fund had current year deferred post-October capital losses consisting of $1,595,116 in short-term capital losses which was recognized in the first day of the current fiscal year.
Class allocations
The separate classes of shares offered by the Fund differ principally in applicable sales charges, distribution, shareholder servicing, and administration fees. Class specific expenses are charged directly to that share class. Investment income, common fund-level expenses, and realized and unrealized gains (losses) on investments are allocated daily to each class of shares based on the relative proportion of net assets of each class.
3. FAIR VALUATION MEASUREMENTS
Fair value measurements of investments are determined within a framework that has established a fair value hierarchy based upon the various data inputs utilized in determining the value of the Fund’s investments. The three-level hierarchy gives the highest priority to unadjusted quoted prices in active markets for identical assets or liabilities (Level 1) and the lowest priority to unobservable inputs (Level 3). The Fund’s investments are classified within the fair value hierarchy based on the lowest level of input that is significant to the fair value measurement. The inputs are summarized into three broad levels as follows:
| ■ | Level 1 – quoted prices in active markets for identical securities |
| ■ | Level 2 – other significant observable inputs (including quoted prices for similar securities, interest rates, prepayment speeds, credit risk, etc.) |
| ■ | Level 3 – significant unobservable inputs (including the Fund’s own assumptions in determining the fair value of investments) |
The inputs or methodologies used for valuing investments in securities are not necessarily an indication of the risk associated with investing in those securities.
The following is a summary of the inputs used in valuing the Fund’s assets and liabilities as of December 31, 2022:
| | Quoted prices
(Level 1) | Other significant
observable inputs
(Level 2) | Significant
unobservable inputs
(Level 3) | Total |
| Assets | | | | |
| Investments in: | | | | |
| Municipal obligations | $ 0 | $ 141,958,362 | $0 | $ 141,958,362 |
| Short-term investments | | | | |
| Investment companies | 6,020,964 | 0 | 0 | 6,020,964 |
| Total assets | $6,020,964 | $141,958,362 | $0 | $147,979,326 |
Additional sector, industry or geographic detail, if any, is included in the Portfolio of Investments.
For the six months ended December 31, 2022, the Fund did not have any transfers into/out of Level 3.
32 | Allspring High Yield Municipal Bond Fund
Notes to financial statements (unaudited)
4. TRANSACTIONS WITH AFFILIATES
Management fee
Allspring Funds Management, a wholly owned subsidiary of Allspring Global Investments Holdings, LLC, a holding company indirectly owned by certain private funds of GTCR LLC and Reverence Capital Partners, L.P., is the manager of the Fund and provides advisory and fund-level administrative services under an investment management agreement. Under the investment management agreement, Allspring Funds Management is responsible for, among other services, implementing the investment objectives and strategies of the Fund, supervising the subadviser and providing fund-level administrative services in connection with the Fund’s operations. As compensation for its services under the investment management agreement, Allspring Funds Management is entitled to receive a management fee at the following annual rate based on the Fund’s average daily net assets:
| Average daily net assets | Management fee |
| First $500 million | 0.500% |
| Next $500 million | 0.475 |
| Next $2 billion | 0.450 |
| Next $2 billion | 0.425 |
| Next $5 billion | 0.390 |
| Over $10 billion | 0.380 |
For the six months ended December 31, 2022, the management fee was equivalent to an annual rate of 0.50% of the Fund’s average daily net assets.
Allspring Funds Management has retained the services of a subadviser to provide daily portfolio management to the Fund. The fee for subadvisory services is borne by Allspring Funds Management. Allspring Global Investments, LLC, an affiliate of Allspring Funds Management and a wholly owned subsidiary of Allspring Global Investments Holdings, LLC, is the subadviser to the Fund and is entitled to receive a fee from Allspring Funds Management at an annual rate starting at 0.35% and declining to 0.20% as the average daily net assets of the Fund increase.
Administration fees
Under a class-level administration agreement, Allspring Funds Management provides class-level administrative services to the Fund, which includes paying fees and expenses for services provided by the transfer agent, sub-transfer agents, omnibus account servicers and record-keepers. As compensation for its services under the class-level administration agreement, Allspring Funds Management receives an annual fee which is calculated based on the average daily net assets of each class as follows:
| | Class-level
administration fee |
| Class A | 0.16% |
| Class C | 0.16 |
| Class R6 | 0.03 |
| Administrator Class | 0.10 |
| Institutional Class | 0.08 |
Waivers and/or expense reimbursements
Allspring Funds Management has contractually committed to waive and/or reimburse management and administration fees to the extent necessary to maintain certain net operating expense ratios for the Fund. When each class of the Fund has exceeded its expense cap, Allspring Funds Management will waive fees and/or reimburse expenses from fund-level expenses on a proportionate basis and then from class specific expenses. When only certain classes exceed their expense caps, waivers and/or reimbursements are applied against class specific expenses before fund-level expenses. Allspring Funds Management has contractually committed through October 31, 2023 to waive fees and/or reimburse expenses to the extent necessary to cap expenses. Prior to or after the commitment expiration date, the caps may be increased or the commitment to maintain the
Allspring High Yield Municipal Bond Fund | 33
Notes to financial statements (unaudited)
caps may be terminated only with the approval of the Board of Trustees. As of December 31, 2022, the contractual expense caps are as follows:
| | Expense ratio caps |
| Class A | 0.80% |
| Class C | 1.55 |
| Class R6 | 0.50 |
| Administrator Class | 0.70 |
| Institutional Class | 0.55 |
Distribution fee
The Trust has adopted a distribution plan for Class C shares pursuant to Rule 12b-1 under the 1940 Act. A distribution fee is charged to Class C shares and paid to Allspring Funds Distributor, LLC ("Allspring Funds Distributor"), the principal underwriter, an affiliate of Allspring Funds Management, at an annual rate up to 0.75% of the average daily net assets of Class C shares.
In addition, Allspring Funds Distributor is entitled to receive the front-end sales charge from the purchase of Class A shares and a contingent deferred sales charge on the redemption of certain Class A shares. Allspring Funds Distributor is also entitled to receive the contingent deferred sales charges from redemptions of Class C shares. For the six months ended December 31, 2022, Allspring Funds Distributor received $2,235 from the sale of Class A shares. No contingent deferred sales charges were incurred by Class A and Class C shares for the six months ended December 31, 2022.
Shareholder servicing fees
The Trust has entered into contracts with one or more shareholder servicing agents, whereby Class A, Class C and Administrator Class are charged a fee at an annual rate up to 0.25% of the average daily net assets of each respective class. A portion of these total shareholder servicing fees were paid to affiliates of the Fund.
Interfund transactions
The Fund may purchase or sell portfolio investment securities to certain affiliates pursuant to Rule 17a-7 under the 1940 Act and under procedures adopted by the Board of Trustees. The procedures have been designed to ensure that these interfund transactions, which do not incur broker commissions, are effected at current market prices. Pursuant to these procedures, the Fund had $0, $6,000,000 and $0 in interfund purchases, sales and net realized gains (losses), respectively, during the six months ended December 31, 2022.
5. INVESTMENT PORTFOLIO TRANSACTIONS
Purchases and sales of investments, excluding U.S. government obligations (if any) and short-term securities, for the six months ended December 31, 2022 were $47,612,454 and $14,787,945, respectively.
6. BANK BORROWINGS
The Trust (excluding the money market funds), Allspring Master Trust and Allspring Variable Trust are parties to a $350,000,000 revolving credit agreement whereby the Fund is permitted to use bank borrowings for temporary or emergency purposes, such as to fund shareholder redemption requests. Interest under the credit agreement is charged to the Fund based on a borrowing rate equal to the higher of the Federal Funds rate or the overnight bank funding rate in effect on that day plus a spread. In addition, an annual commitment fee equal based on the unused balance is allocated to each participating fund.
For the six months ended December 31, 2022, there were no borrowings by the Fund under the agreement.
7. MARKET RISKS
On March 11, 2020, the World Health Organization announced that it had made the assessment that coronavirus disease 2019 (“COVID-19”) is a pandemic. The impacts of COVID-19 are affecting the entire global economy, individual companies and investment products, the funds, and the market in general. There is significant uncertainty around the extent and duration of business disruptions related to COVID-19 and the impacts may last for an extended period of time. COVID-19 has led to significant uncertainty and volatility in the financial markets.
34 | Allspring High Yield Municipal Bond Fund
Notes to financial statements (unaudited)
8. INDEMNIFICATION
Under the Fund's organizational documents, the officers and Trustees have been granted certain indemnification rights against certain liabilities that may arise out of performance of their duties to the Fund. The Fund has entered into a separate agreement with each Trustee that converts indemnification rights currently existing under the Fund’s organizational documents into contractual rights that cannot be changed in the future without the consent of the Trustee. Additionally, in the normal course of business, the Fund may enter into contracts with service providers that contain a variety of indemnification clauses. The Fund’s maximum exposure under these arrangements is dependent on future claims that may be made against the Fund and, therefore, cannot be estimated.
Allspring High Yield Municipal Bond Fund | 35
Other information (unaudited)
PROXY VOTING INFORMATION
A description of the policies and procedures used to determine how to vote proxies relating to portfolio securities is available without charge, upon request, by calling 1-800-222-8222, visiting our website at allspringglobal.com, or visiting the SEC website at sec.gov. Information regarding how the proxies related to portfolio securities were voted during the most recent 12-month period ended June 30 is available on the website at allspringglobal.com or by visiting the SEC website at sec.gov.
QUARTERLY PORTFOLIO HOLDINGS INFORMATION
The Fund files its complete schedule of portfolio holdings with the SEC for the first and third quarters of each fiscal year as an exhibit to its reports on Form N-PORT. Shareholders may view the filed Form N-PORT by visiting the SEC website at sec.gov.
36 | Allspring High Yield Municipal Bond Fund
Other information (unaudited)
BOARD OF TRUSTEES AND OFFICERS
Each of the Trustees and Officers listed in the table below acts in identical capacities for each fund in the Allspring family of funds, which consists of 127 mutual funds comprising the Allspring Funds Trust, Allspring Variable Trust, Allspring Master Trust and four closed-end funds (collectively the “Fund Complex”). This table should be read in conjunction with the Prospectus and the Statement of Additional Information1. The mailing address of each Trustee and Officer is 1415 Vantage Park Drive, 3rd Floor, Charlotte, NC 28203. Each Trustee and Officer serves an indefinite term, however, each Trustee serves such term until reaching the mandatory retirement age established by the Trustees.
Independent Trustees
Name and
year of birth | Position held and
length of service* | Principal occupations during past five years or longer | Current other
public company or
investment
company
directorships |
William R. Ebsworth
(Born 1957) | Trustee,
since 2015 | Retired. From 1984 to 2013, equities analyst, portfolio manager, research director and chief investment officer at Fidelity Management and Research Company in Boston, Tokyo, and Hong Kong, and retired in 2013 as Chief Investment Officer of Fidelity Strategic Advisers, Inc. where he led a team of investment professionals managing client assets. Prior thereto, Board member of Hong Kong Securities Clearing Co., Hong Kong Options Clearing Corp., the Thailand International Fund, Ltd., Fidelity Investments Life Insurance Company, and Empire Fidelity Investments Life Insurance Company. Audit Committee Chair and Investment Committee Chair of the Vincent Memorial Hospital Foundation (non-profit organization). Mr. Ebsworth is a CFA® charterholder. | N/A |
Jane A. Freeman
(Born 1953) | Trustee,
since 2015;
Chair Liaison,
since 2018 | Retired. From 2012 to 2014 and 1999 to 2008, Chief Financial Officer of Scientific Learning Corporation. From 2008 to 2012, Ms. Freeman provided consulting services related to strategic business projects. Prior to 1999, Portfolio Manager at Rockefeller & Co. and Scudder, Stevens & Clark. Board member of the Harding Loevner Funds from 1996 to 2014, serving as both Lead Independent Director and chair of the Audit Committee. Board member of the Russell Exchange Traded Funds Trust from 2011 to 2012 and the chair of the Audit Committee. Ms. Freeman is also an inactive Chartered Financial Analyst. | N/A |
Isaiah Harris, Jr.
(Born 1952) | Trustee,
since 2009; Audit
Committee
Chair,
since 2019 | Retired. Member of the Advisory Board of CEF of East Central Florida. Chairman of the Board of CIGNA Corporation from 2009 to 2021, and Director from 2005 to 2008. From 2003 to 2011, Director of Deluxe Corporation. Prior thereto, President and CEO of BellSouth Advertising and Publishing Corp. from 2005 to 2007, President and CEO of BellSouth Enterprises from 2004 to 2005 and President of BellSouth Consumer Services from 2000 to 2003. Emeritus member of the Iowa State University Foundation Board of Governors. Emeritus Member of the Advisory Board of Iowa State University School of Business. Advisory Board Member, Palm Harbor Academy (private school). Advisory Board Member, Fellowship of Christian Athletes. Mr. Harris is a certified public accountant (inactive status). | N/A |
David F. Larcker
(Born 1950) | Trustee,
since 2009 | Distinguished Visiting Fellow at the Hoover Institution since 2022. James Irvin Miller Professor of Accounting at the Graduate School of Business (Emeritus), Stanford University, Director of the Corporate Governance Research Initiative and Senior Faculty of The Rock Center for Corporate Governance since 2006. From 2005 to 2008, Professor of Accounting at the Graduate School of Business, Stanford University. Prior thereto, Ernst & Young Professor of Accounting at The Wharton School, University of Pennsylvania from 1985 to 2005. | N/A |
Allspring High Yield Municipal Bond Fund | 37
Other information (unaudited)
Name and
year of birth | Position held and
length of service* | Principal occupations during past five years or longer | Current other
public company or
investment
company
directorships |
Olivia S. Mitchell
(Born 1953) | Trustee,
since 2006;
Nominating and
Governance
Committee Chair,
since 2018 | International Foundation of Employee Benefit Plans Professor since 1993, Wharton School of the University of Pennsylvania. Director of Wharton’s Pension Research Council and Boettner Center on Pensions & Retirement Research, and Research Associate at the National Bureau of Economic Research. Previously taught at Cornell University from 1978 to 1993. | N/A |
Timothy J. Penny
(Born 1951) | Trustee,
since 1996;
Chair,
since 2018 | President and Chief Executive Officer of Southern Minnesota Initiative Foundation, a non-profit organization, since 2007. Vice Chair of the Economic Club of Minnesota, since 2007. Co-Chair of the Committee for a Responsible Federal Budget, since 1995. Member of the Board of Trustees of NorthStar Education Finance, Inc., a non-profit organization, from 2007-2022. Senior Fellow of the University of Minnesota Humphrey Institute from 1995 to 2017. | N/A |
James G. Polisson
(Born 1959) | Trustee,
since 2018 | Retired. Chief Marketing Officer, Source (ETF) UK Services, Ltd, from 2015 to 2017. From 2012 to 2015, Principal of The Polisson Group, LLC, a management consulting, corporate advisory and principal investing company. Chief Executive Officer and Managing Director at Russell Investments, Global Exchange Traded Funds from 2010 to 2012. Managing Director of Barclays Global Investors from 1998 to 2010 and Global Chief Marketing Officer for iShares and Barclays Global Investors from 2000 to 2010. Trustee of the San Francisco Mechanics’ Institute, a non-profit organization, from 2013 to 2015. Board member of the Russell Exchange Traded Fund Trust from 2011 to 2012. Director of Barclays Global Investors Holdings Deutschland GmbH from 2006 to 2009. Mr. Polisson is an attorney and has a retired status with the Massachusetts and District of Columbia Bar Associations. | N/A |
Pamela Wheelock
(Born 1959) | Trustee,
since January
2020; previously
Trustee from
January 2018 to
July 2019 | Retired. Executive and Senior Financial leadership positions in the public, private and nonprofit sectors. Interim President and CEO, McKnight Foundation, 2020. Interim Commissioner, Minnesota Department of Human Services, 2019. Chief Operating Officer, Twin Cities Habitat for Humanity, 2017-2019. Vice President for University Services, University of Minnesota, 2012-2016. Interim President and CEO, Blue Cross and Blue Shield of Minnesota, 2011-2012. Executive Vice-President and Chief Financial Officer, Minnesota Wild, 2002-2008. Commissioner, Minnesota Department of Finance, 1999-2002. Chair of the Board of Directors of Destination Medical Center Corporation. Board member of the Minnesota Wild Foundation. | N/A |
* Length of service dates reflect the Trustee’s commencement of service with the Trust’s predecessor entities, where applicable.
38 | Allspring High Yield Municipal Bond Fund
Other information (unaudited)
Officers2
Name and
year of birth | Position held and
length of service | Principal occupations during past five years or longer |
Andrew Owen
(Born 1960) | President,
since 2017 | President and Chief Executive Officer of Allspring Funds Management, LLC since 2017 and Head of Global Fund Governance of Allspring Global Investments since 2022. Prior thereto, co-president of Galliard Capital Management, LLC, an affiliate of Allspring Funds Management, LLC, from 2019 to 2022 and Head of Affiliated Managers, Allspring Global Investments, from 2014 to 2019 and Executive Vice President responsible for marketing, investments and product development for Allspring Funds Management, LLC, from 2009 to 2014. |
Jeremy DePalma
(Born 1974) | Treasurer,
since 2012
(for certain funds in
the Fund Complex);
since 2021 (for
the remaining funds in the
Fund Complex) | Senior Vice President of Allspring Funds Management, LLC since 2009. Senior Vice President of Evergreen Investment Management Company, LLC from 2008 to 2010 and head of the Fund Reporting and Control Team within Fund Administration from 2005 to 2010. |
Christopher Baker
(Born 1976) | Chief Compliance Officer, since 2022 | Global Chief Compliance Officer for Allspring Global Investments since 2022. Prior thereto, Chief Compliance Officer for State Street Global Advisors from 2018 to 2021. Senior Compliance Officer for the State Street divisions of Alternative Investment Solutions, Sector Solutions, and Global Marketing from 2015 to 2018. From 2010 to 2015 Vice President, Global Head of Investment and Marketing Compliance for State Street Global Advisors. |
Matthew Prasse
(Born 1983) | Chief Legal Officer, since 2022; Secretary, since 2021 | Senior Counsel of the Allspring Legal Department since 2021. Senior Counsel of the Wells Fargo Legal Department from 2018 to 2021. Previously, Counsel for Barings LLC from 2015 to 2018. Prior to joining Barings, Associate at Morgan, Lewis & Bockius LLP from 2008 to 2015. |
1 The Statement of Additional Information includes additional information about the Trustees and is available, without charge, upon request, by calling 1-800-222-8222 or by visiting the website at allspringglobal.com.
2 For those Officers with tenures at Allspring Global Investments and/or Allspring Funds Management, LLC that began prior to 2021, such tenures include years of service during which these businesses/entities were known as Wells Fargo Asset Management and Wells Fargo Funds Management, LLC, respectively.
Allspring High Yield Municipal Bond Fund | 39
For more information
More information about Allspring Funds is available free upon request. To obtain literature, please write, visit the Fund's website, or call:
Allspring Funds
P.O. Box 219967
Kansas City, MO 64121-9967
Website: allspringglobal.com
Individual investors: 1-800-222-8222
Retail investment professionals: 1-888-877-9275
Institutional investment professionals: 1-800-260-5969
This report and the financial statements contained herein are submitted for the general information of the shareholders of the Fund. If this report is used for promotional purposes, distribution of the report must be accompanied or preceded by a current prospectus. Before investing, please consider the investment objectives, risks, charges, and expenses of the investment. For a current prospectus and, if available, a summary prospectus, containing this information, call
1-800-222-8222 or visit the Fund's website at allspringglobal.com. Read the prospectus carefully before you invest or send money.
Allspring Global InvestmentsTM is the trade name for the asset management firms of Allspring Global Investments Holdings, LLC, a holding company indirectly owned by certain private funds of GTCR LLC and Reverence Capital Partners, L.P. These firms include but are not limited to Allspring Global Investments, LLC, and Allspring Funds Management, LLC. Certain products managed by Allspring entities are distributed by Allspring Funds Distributor, LLC (a broker-dealer and Member FINRA/SIPC).
This material is for general informational and educational purposes only and is NOT intended to provide investment advice or a recommendation of any kind - including a recommendation for any specific investment, strategy, or plan.
© 2023 Allspring Global Investments Holdings, LLC. All rights reserved.
ALL-01092023-ddda3cjq 02-23
SAR3364 12-22
Semi-Annual Report
December 31, 2022
Allspring
Intermediate Tax/AMT-Free Fund
The views expressed and any forward-looking statements are as of December 31, 2022, unless otherwise noted, and are those of the Fund's portfolio managers and/or Allspring Global Investments. Discussions of individual securities or the markets generally are not intended as individual recommendations. Future events or results may vary significantly from those expressed in any forward-looking statements. The views expressed are subject to change at any time in response to changing circumstances in the market. Allspring Global Investments disclaims any obligation to publicly update or revise any views expressed or forward-looking statements.
Allspring Intermediate Tax/AMT-Free Fund | 1
Letter to shareholders (unaudited)
Andrew Owen
President
Allspring Funds
Dear Shareholder:
We are pleased to offer you this semi-annual report for the Allspring Intermediate Tax/AMT-Free Fund for the six-month period that ended December 31, 2022. Globally, stocks and bonds experienced heightened volatility and generally negative returns through the challenging period. Earlier tailwinds provided by global stimulus programs, vaccination rollouts, and recovering consumer and corporate sentiment were wiped away by the highest rate of inflation in four decades, the impact of ongoing aggressive central bank rate hikes and the prospect of more rate hikes. Compounding these concerns were the global reverberations of the Russia-Ukraine war and the impact of China’s strict COVID-19 lockdowns.
For the six-month period, stocks and bonds had mixed results, with emerging market equities trailing those of developed markets and both U.S. and non-U.S. bonds fighting an uphill battle in the face of sustained interest rate increases. For the period, U.S. stocks, based on the S&P 500 Index,1 gained 2.31%. International stocks, as measured by the MSCI ACWI ex USA Index (Net),2 returned 2.96%, while the MSCI EM Index (Net) (USD)3 declined 2.99%. Among bond indexes, the Bloomberg U.S. Aggregate Bond Index4 returned -2.97%, the Bloomberg Global Aggregate ex-USD Index (unhedged)5 returned -2.65%, the Bloomberg Municipal Bond Index6 gained 0.50%, and the ICE BofA U.S. High Yield Index7 returned 3.33%.
Persistent inflation and economic fallout from the Russia-Ukraine war drove markets.
Markets rebounded from earlier losses in July, led by U.S. stocks. While evidence pointed to an economic slowdown after two consecutive quarters of declining gross domestic product (economic contraction), the U.S. labor market remained surprisingly strong: July nonfarm payrolls grew by more than 500,000 and U.S. unemployment dipped to 3.5%. Meanwhile, crude oil and retail gasoline prices, major contributors to recent overall inflation, fell substantially from earlier highs. And while U.S. home prices rose, sales fell as houses became less affordable with mortgage rates at a 13-year high. The Federal Reserve (Fed) raised the federal funds rate another 0.75% in July—to a range of 2.25% to 2.50%—and forecasts pointed to further rate hikes.
| 1 | The S&P 500 Index consists of 500 stocks chosen for market size, liquidity, and industry group representation. It is a market-value-weighted index with each stock's weight in the index proportionate to its market value. You cannot invest directly in an index. |
| 2 | The Morgan Stanley Capital International (MSCI) All Country World Index (ACWI) ex USA Index (Net) is a free-float-adjusted market-capitalization-weighted index that is designed to measure the equity market performance of developed and emerging markets, excluding the U.S. Source: MSCI. MSCI makes no express or implied warranties or representations and shall have no liability whatsoever with respect to any MSCI data contained herein. The MSCI data may not be further redistributed or used as a basis for other indexes or any securities or financial products. This report is not approved, reviewed, or produced by MSCI. You cannot invest directly in an index. |
| 3 | The MSCI Emerging Markets (EM) Index (Net) (USD) is a free-float-adjusted market-capitalization-weighted index that is designed to measure equity market performance of emerging markets. You cannot invest directly in an index. |
| 4 | The Bloomberg U.S. Aggregate Bond Index is a broad-based benchmark that measures the investment-grade, U.S.-dollar-denominated, fixed-rate taxable bond market, including Treasuries, government-related and corporate securities, mortgage-backed securities (agency fixed-rate and hybrid adjustable-rate mortgage pass-throughs), asset-backed securities, and commercial mortgage-backed securities. You cannot invest directly in an index. |
| 5 | The Bloomberg Global Aggregate ex-USD Index (unhedged) is an unmanaged index that provides a broad-based measure of the global investment-grade fixed-income markets excluding the U.S.-dollar-denominated debt market. You cannot invest directly in an index. |
| 6 | The Bloomberg Municipal Bond Index is an unmanaged index composed of long-term tax-exempt bonds with a minimum credit rating of Baa. You cannot invest directly in an index. |
| 7 | The ICE BofA U.S. High Yield Index is a market-capitalization-weighted index of domestic and Yankee high-yield bonds. The index tracks the performance of high-yield securities traded in the U.S. bond market. You cannot invest directly in an index. Copyright 2023. ICE Data Indices, LLC. All rights reserved. |
2 | Allspring Intermediate Tax/AMT-Free Fund
Letter to shareholders (unaudited)
August was yet another broadly challenging month for financial markets, with more red ink flowing. High inflation persisted, cresting 9% in the eurozone on an annual basis and remaining above 8% in the U.S. despite the Fed’s aggressive monetary policy and a major drop in global crude oil and gasoline prices from their June peak. One positive note was the resilience of the U.S. job market. However, the Fed’s job was clearly not complete. One longer-term bright spot was the U.S. Congress’s passage of the Inflation Reduction Act. Its primary stated goals include: to reduce inflation (though not immediately) by curbing the deficit, capping health care spending by seniors, and investing in domestic sources of clean energy.
The market misery continued in September. There was nowhere to hide as all asset classes suffered major losses at the hands of persistent inflation. Central banks kept up their battle against rapidly rising prices with more rate hikes. The strength of the U.S. dollar made things even more difficult for investors holding assets in other currencies. U.S. mortgage rates jumped to near 7% on 30-year fixed-rate mortgages; the decreased housing affordability began to cool demand somewhat. The U.K. experienced a sharp sell-off of government bonds and the British pound in September as investors panicked in response to a new government budget that was seen as financially unsound. The market meltdown forced the Bank of England to step in and buy long-dated government bonds.
Equities had a reprieve in October after two months of sharp declines. Value stocks and small caps fared best. Globally, developed markets outpaced emerging market equities, which were hurt by weakness among Chinese stocks. Central banks continued to try to curtail high inflation with aggressive interest rate hikes. Geopolitical risks persisted, including the ongoing Russia-Ukraine war and economic, financial market, and political turmoil in the U.K., which led to a second prime ministerial change in six weeks, as Rishi Sunak replaced Liz Truss in late October. Concerns over Europe’s energy crisis eased thanks to unseasonably warm weather and plentiful gas on hand. The U.S. labor market continued its resilience against rising prices, as unemployment stood at 3.7%, near a record low.
Stocks and bonds rallied in November, with emerging market equities gaining nearly 15% and developed market equities returning 7%. The S&P 500 Index rose 5.6% in November. Bonds also had positive monthly returns. Economic news was encouraging, driven by U.S. labor market strength. Although central banks kept raising rates, expectations grew regarding an impending easing in the pace of rate hikes and a possible end to central bank monetary tightening in 2023. Although inflation remained at record highs in the eurozone, with a 10.6% annual increase in October, Germany’s producer prices decreased 4.2% annually, signaling a possible decline in inflationary pressures. Meanwhile, U.S. inflation continued to moderate, with a 7.1% annual price rise in November and a monthly price increase of just 0.1%. China’s economic data remained weak, reflecting its zero-COVID-19 policy.
Financial markets cooled in December, with U.S. equities posting negative overall results in response to a weakening U.S. dollar. Fixed income securities ended one of their worst years ever with flat overall monthly returns as markets weighed the hopes for an end to the monetary tightening cycle with the reality that central banks had not completed their jobs yet. U.S. Consumer Price Index (CPI)1 data showed a strong consistent trend downward, which brought down the 12-month CPI to 6.5% in December from 9.1% in June. Other countries and regions reported still-high but declining inflation rates as the year winded down.
“ The market misery continued in September. There was nowhere to hide as all asset classes suffered major losses at the hands of persistent inflation.”
| 1 | The Consumer Price Index (CPI) is a measure of the average change over time in the prices paid by urban consumers for a market basket of consumer goods and services. You cannot invest directly in an index. |
Allspring Intermediate Tax/AMT-Free Fund | 3
Letter to shareholders (unaudited)
Don’t let short-term uncertainty derail long-term investment goals.
Periods of investment uncertainty can present challenges, but experience has taught us that maintaining long-term investment goals can be an effective way to plan for the future. To help you create a sound strategy based on your personal goals and risk tolerance, Allspring Funds offers more than 100 mutual funds spanning a wide range of asset classes and investment styles. Although diversification cannot guarantee an investment profit or prevent losses, we believe it can be an effective way to manage investment risk and potentially smooth out overall portfolio performance. We encourage investors to know their investments and to understand that appropriate levels of risk-taking may unlock opportunities.
Thank you for choosing to invest with Allspring Funds. We appreciate your confidence in us and remain committed to helping you meet your financial needs.
Sincerely,
Andrew Owen
President
Allspring Funds
For further information about your fund, contact your investment professional, visit our website at allspringglobal.com, or call us directly at 1-800-222-8222.
4 | Allspring Intermediate Tax/AMT-Free Fund
This page is intentionally left blank.
Performance highlights (unaudited)
| Investment objective | The Fund seeks current income exempt from federal income tax. |
| Manager | Allspring Funds Management, LLC |
| Subadviser | Allspring Global Investments, LLC |
| Portfolio managers | Bruce R. Johns, Robert J. Miller, Adrian Van Poppel, Nicholos Venditti |
| Average annual total returns (%) as of December 31, 2022 |
| | | Including sales charge | | Excluding sales charge | | Expense ratios1 (%) |
| | Inception date | 1 year | 5 year | 10 year | | 1 year | 5 year | 10 year | | Gross | Net 2 |
| Class A (WFTAX) | 7-31-2007 | -9.23 | 0.41 | 1.29 | | -6.43 | 1.02 | 1.60 | | 0.81 | 0.70 |
| Class C (WFTFX) | 7-31-2007 | -8.13 | 0.26 | 0.99 | | -7.13 | 0.26 | 0.99 | | 1.56 | 1.45 |
| Class R6 (WFRTX)3 | 7-31-2018 | – | – | – | | -6.14 | 1.32 | 1.87 | | 0.43 | 0.40 |
| Administrator Class (WFITX) | 3-31-2008 | – | – | – | | -6.33 | 1.14 | 1.70 | | 0.75 | 0.60 |
| Institutional Class (WITIX) | 3-31-2008 | – | – | – | | -6.18 | 1.29 | 1.86 | | 0.48 | 0.45 |
| Bloomberg Municipal Bond 1-15 Year Blend Index4 | – | – | – | – | | -5.95 | 1.44 | 1.95 | | – | – |
Figures quoted represent past performance, which is no guarantee of future results, and do not reflect taxes that a shareholder may pay on an investment in a fund. Investment return and principal value of an investment will fluctuate so that an investor’s shares, when redeemed, may be worth more or less than their original cost. Performance shown without sales charges would be lower if sales charges were reflected. Current performance may be lower or higher than the performance data quoted, which assumes the reinvestment of dividends and capital gains. Current month-end performance is available on the Fund’s website, allspringglobal.com.
Index returns do not include transaction costs associated with buying and selling securities, any mutual fund fees or expenses, or any taxes. It is not possible to invest directly in an index.
For Class A shares, the maximum front-end sales charge is 3.00%. For Class C shares, the maximum contingent deferred sales charge is 1.00%. Performance including a contingent deferred sales charge assumes the sales charge for the corresponding time period. Class R6, Administrator Class and Institutional Class shares are sold without a front-end sales charge or contingent deferred sales charge.
| 1 | Reflects the expense ratios as stated in the most recent prospectuses. The expense ratios shown are subject to change and may differ from the annualized expense ratios shown in the financial highlights of this report. |
| 2 | The manager has contractually committed through October 31, 2023, to waive fees and/or reimburse expenses to the extent necessary to cap total annual fund operating expenses after fee waivers at 0.70% for Class A, 1.45% for Class C, 0.40% for Class R6, 0.60% for Administrator Class, and 0.45% for Institutional Class. Brokerage commissions, stamp duty fees, interest, taxes, acquired fund fees and expenses (if any), and extraordinary expenses are excluded from the expense caps. Prior to or after the commitment expiration date, the caps may be increased or the commitment to maintain the caps may be terminated only with the approval of the Board of Trustees. Without these caps, the Fund’s returns would have been lower. The expense ratio paid by an investor is the net expense ratio (the total annual fund operating expenses after fee waivers) as stated in the prospectuses. |
| 3 | Historical performance shown for the Class R6 shares prior to their inception reflects the performance of the Institutional Class shares, and includes the higher expenses applicable to the Institutional Class shares. If these expenses had not been included, returns for the Class R6 shares would be higher. |
| 4 | The Bloomberg Municipal Bond 1–15 Year Blend Index is the 1–15 year component of the Bloomberg Municipal Bond Index. The Bloomberg Municipal Bond Index is an unmanaged index composed of long-term tax-exempt bonds with a minimum credit rating of Baa. You cannot invest directly in an index. |
Bond values fluctuate in response to the financial condition of individual issuers, general market and economic conditions, and changes in interest rates. Changes in market conditions and government policies may lead to periods of heightened volatility in the bond market and reduced liquidity for certain bonds held by the Fund. In general, when interest rates rise, bond values fall and investors may lose principal value. Interest rate changes and their impact on the Fund and its share price can be sudden and unpredictable. The use of derivatives may reduce returns and/or increase volatility. Certain investment strategies tend to increase the total risk of an investment (relative to the broader market). This fund is exposed to high-yield securities risk and municipal securities risk. Consult the Fund’s prospectus for additional information on these and other risks. A portion of the Fund’s income may be subject to federal, state, and/or local income taxes or the Alternative Minimum Tax (AMT). Any capital gains distributions may be taxable.
6 | Allspring Intermediate Tax/AMT-Free Fund
Performance highlights (unaudited)
| Credit quality as of December 31, 20221 |
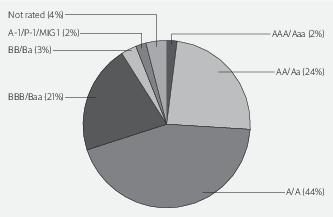
| 1 | The credit quality distribution of portfolio holdings reflected in the chart is based on ratings from Standard & Poor’s, Moody’s Investors Service, and/or Fitch Ratings Ltd. Credit quality ratings apply to the underlying holdings of the Fund and not to the Fund itself. The percentages of the portfolio with the ratings depicted in the chart are calculated based on the market value of fixed income securities held by the Fund. If a security was rated by all three rating agencies, the middle rating was utilized. If rated by two of the three rating agencies, the lower rating was utilized, and if rated by one of the rating agencies, that rating was utilized. Standard & Poor’s rates the creditworthiness of bonds, ranging from AAA (highest) to D (lowest). Ratings from A to CCC may be modified by the addition of a plus (+) or minus (-) sign to show relative standing within the rating categories. Standard & Poor’s rates the creditworthiness of short-term notes from SP-1 (highest) to SP-3 (lowest). Moody’s rates the creditworthiness of bonds, ranging from Aaa (highest) to C (lowest). Ratings Aa to B may be modified by the addition of a number 1 (highest) to 3 (lowest) to show relative standing within the ratings categories. Moody’s rates the creditworthiness of short-term U.S. tax-exempt municipal securities from MIG 1/VMIG 1 (highest) to SG (lowest). Fitch rates the creditworthiness of bonds, ranging from AAA (highest) to D (lowest). Credit quality distribution is subject to change and may have changed since the date specified. |
| Effective maturity distribution as of December 31, 20221 |
| 1 | Figures represent the percentage of the Fund's long-term investments. Allocations are subject to change and may have changed since the date specified. |
Allspring Intermediate Tax/AMT-Free Fund | 7
Fund expenses (unaudited)
As a shareholder of the Fund, you incur two types of costs: (1) transaction costs, including sales charges (loads) on purchase payments and contingent deferred sales charges (if any) on redemptions and (2) ongoing costs, including management fees, distribution (12b-1) and/or shareholder servicing fees, and other Fund expenses. This example is intended to help you understand your ongoing costs (in dollars) of investing in the Fund and to compare these costs with the ongoing costs of investing in other mutual funds.
The example is based on an investment of $1,000 invested at the beginning of the six-month period and held for the entire period from July 1, 2022 to December 31, 2022.
Actual expenses
The “Actual” line of the table below provides information about actual account values and actual expenses. You may use the information in this line, together with the amount you invested, to estimate the expenses that you paid over the period. Simply divide your account value by $1,000 (for example, an $8,600 account value divided by $1,000 = 8.6), then multiply the result by the number in the “Actual” line under the heading entitled “Expenses paid during period” for your applicable class of shares to estimate the expenses you paid on your account during this period.
Hypothetical example for comparison purposes
The “Hypothetical” line of the table below provides information about hypothetical account values and hypothetical expenses based on the Fund’s actual expense ratio and an assumed rate of return of 5% per year before expenses, which is not the Fund’s actual return. The hypothetical account values and expenses may not be used to estimate the actual ending account balance or expenses you paid for the period. You may use this information to compare the ongoing costs of investing in the Fund and other funds. To do so, compare this 5% hypothetical example with the 5% hypothetical examples that appear in the shareholder reports of the other funds.
Please note that the expenses shown in the table are meant to highlight your ongoing costs only and do not reflect any transactional costs, such as sales charges (loads) and contingent deferred sales charges. Therefore, the “Hypothetical” line of the table is useful in comparing ongoing costs only, and will not help you determine the relative total costs of owning different funds. In addition, if these transactional costs were included, your costs would have been higher.
| | Beginning
account value
7-1-2022 | Ending
account value
12-31-2022 | Expenses
paid during
the period1 | Annualized net
expense ratio |
| Class A | | | | |
| Actual | $1,000.00 | $1,007.40 | $3.54 | 0.70% |
| Hypothetical (5% return before expenses) | $1,000.00 | $1,021.68 | $3.57 | 0.70% |
| Class C | | | | |
| Actual | $1,000.00 | $1,003.58 | $7.32 | 1.45% |
| Hypothetical (5% return before expenses) | $1,000.00 | $1,017.90 | $7.38 | 1.45% |
| Class R6 | | | | |
| Actual | $1,000.00 | $1,008.91 | $2.03 | 0.40% |
| Hypothetical (5% return before expenses) | $1,000.00 | $1,023.19 | $2.04 | 0.40% |
| Administrator Class | | | | |
| Actual | $1,000.00 | $1,008.83 | $3.04 | 0.60% |
| Hypothetical (5% return before expenses) | $1,000.00 | $1,022.18 | $3.06 | 0.60% |
| Institutional Class | | | | |
| Actual | $1,000.00 | $1,009.59 | $2.28 | 0.45% |
| Hypothetical (5% return before expenses) | $1,000.00 | $1,022.94 | $2.29 | 0.45% |
1 Expenses paid is equal to the annualized net expense ratio of each class multiplied by the average account value over the period, multiplied by 184 divided by 365 (to reflect the one-half-year period).
8 | Allspring Intermediate Tax/AMT-Free Fund
Portfolio of investments—December 31, 2022 (unaudited)
| | | | | Principal | Value |
| Closed end municipal bond fund obligations: 0.19% | | | | | |
| Other: 0.19% | | | | | |
| Nuveen AMT-Free Municipal Credit Income Fund Preferred Shares Series C (200 shares) 1.41% 144Aø | | | | $ 2,000,000 | $ 2,000,000 |
| Total Closed end municipal bond fund obligations (Cost $2,000,000) | | | | | 2,000,000 |
| | | Interest
rate | Maturity
date | | |
| Municipal obligations: 98.43% | | | | | |
| Alabama: 1.62% | | | | | |
| Education revenue: 0.32% | | | | | |
| Auburn AL Refunding Bond Series A | | 4.00% | 6-1-2033 | 1,000,000 | 1,026,292 |
| University of West Alabama General Fee Bond (AGM Insured) | | 4.00 | 1-1-2033 | 595,000 | 608,958 |
| University of West Alabama General Fee Bond (AGM Insured) | | 4.00 | 1-1-2035 | 865,000 | 876,179 |
| University of West Alabama General Fee Bond (AGM Insured) | | 4.00 | 1-1-2037 | 920,000 | 915,960 |
| | | | | | 3,427,389 |
| Utilities revenue: 1.30% | | | | | |
| Black Belt Energy Gas District Alabama Gas Project Series C-1 | | 5.25 | 2-1-2053 | 3,000,000 | 3,127,262 |
| Southeast Alabama Energy Authority Commodity Supply Project #2 Series B | | 4.00 | 12-1-2051 | 1,000,000 | 964,493 |
| Southeast Alabama Gas Supply District Project #2 Series B (1 Month LIBOR +0.85%) ± | | 3.61 | 6-1-2049 | 10,000,000 | 9,838,511 |
| | | | | | 13,930,266 |
| | | | | | 17,357,655 |
| Alaska: 0.37% | | | | | |
| Miscellaneous revenue: 0.37% | | | | | |
| Matanuska-Susitna Borough AK Goode Creek Correctional Project | | 4.00 | 9-1-2030 | 3,870,000 | 3,935,743 |
| Arizona: 0.98% | | | | | |
| Education revenue: 0.32% | | | | | |
| Arizona IDA Education Facility Revenue Bonds Series 2021A | | 4.00 | 7-1-2034 | 335,000 | 318,672 |
| Arizona IDA Education Facility Revenue Bonds Series 2021A | | 4.00 | 7-1-2035 | 240,000 | 224,843 |
| Arizona IDA Education Facility Revenue Bonds Series 2021A | | 4.00 | 7-1-2035 | 345,000 | 323,212 |
| Arizona IDA Education Facility Revenue Bonds Series 2021A | | 4.00 | 7-1-2036 | 220,000 | 203,380 |
| Arizona IDA Education Facility Revenue Bonds Series 2021A | | 4.00 | 7-1-2036 | 315,000 | 291,203 |
| Arizona IDA Education Facility Revenue Bonds Series 2021A | | 5.00 | 7-1-2033 | 315,000 | 331,145 |
| Pima County AZ Community College District | | 5.00 | 7-1-2034 | 500,000 | 547,387 |
The accompanying notes are an integral part of these financial statements.
Allspring Intermediate Tax/AMT-Free Fund | 9
Portfolio of investments—December 31, 2022 (unaudited)
| | | Interest
rate | Maturity
date | Principal | Value |
| Education revenue (continued) | | | | | |
| Pima County AZ Community College District | | 5.00% | 7-1-2035 | $ 600,000 | $ 652,952 |
| Pima County AZ Community College District | | 5.00 | 7-1-2036 | 500,000 | 540,405 |
| | | | | | 3,433,199 |
| GO revenue: 0.06% | | | | | |
| Estrella Mountain Ranch AZ Community Facilities District Refunding Bond (AGM Insured) | | 5.00 | 7-15-2025 | 585,000 | 615,002 |
| Health revenue: 0.06% | | | | | |
| Tempe AZ IDA Refunding Bonds Friendship Village of Tempe Project Series 2021A | | 4.00 | 12-1-2028 | 370,000 | 342,839 |
| Tempe AZ IDA Refunding Bonds Friendship Village of Tempe Project Series 2021A | | 4.00 | 12-1-2029 | 385,000 | 350,092 |
| | | | | | 692,931 |
| Miscellaneous revenue: 0.08% | | | | | |
| Arizona State Certificate of Participation | | 5.00 | 9-1-2027 | 600,000 | 633,499 |
| Phoenix AZ Civic Improvement Corporation Series D | | 5.00 | 7-1-2024 | 190,000 | 195,907 |
| | | | | | 829,406 |
| Tax revenue: 0.46% | | | | | |
| San Luis AZ Pledged Excise Tax Series A (BAM Insured) | | 5.00 | 7-1-2027 | 450,000 | 462,993 |
| San Luis AZ Pledged Excise Tax Series A (BAM Insured) | | 5.00 | 7-1-2028 | 700,000 | 719,902 |
| San Luis AZ Pledged Excise Tax Series A (BAM Insured) | | 5.00 | 7-1-2034 | 3,680,000 | 3,772,165 |
| | | | | | 4,955,060 |
| | | | | | 10,525,598 |
| Arkansas: 0.22% | | | | | |
| Miscellaneous revenue: 0.22% | | | | | |
| Arkansas Development Finance Authority Arkansas Division of Emergency Management Project | | 4.00 | 6-1-2033 | 500,000 | 514,147 |
| Arkansas Development Finance Authority Arkansas Division of Emergency Management Project | | 4.00 | 6-1-2035 | 1,000,000 | 1,023,509 |
| Arkansas Development Finance Authority Arkansas Division of Emergency Management Project | | 4.00 | 6-1-2036 | 850,000 | 865,787 |
| | | | | | 2,403,443 |
| California: 5.21% | | | | | |
| Airport revenue: 0.32% | | | | | |
| Sacramento CA Airport System Senior Bond Series B | | 5.00 | 7-1-2032 | 600,000 | 667,147 |
| Sacramento CA Airport System Senior Bond Series B | | 5.00 | 7-1-2033 | 500,000 | 552,046 |
| Sacramento CA Airport System Senior Bond Series B | | 5.00 | 7-1-2034 | 1,000,000 | 1,094,246 |
| Sacramento CA Airport System Senior Bond Series E | | 5.00 | 7-1-2028 | 1,000,000 | 1,118,596 |
| | | | | | 3,432,035 |
| GO revenue: 1.50% | | | | | |
| Compton CA Community College District Election of 2002 CAB Series C ¤ | | 0.00 | 8-1-2029 | 1,565,000 | 1,245,723 |
| Compton CA Community College District Election of 2002 CAB Series C ¤ | | 0.00 | 8-1-2031 | 2,400,000 | 1,764,080 |
| Monterey County CA Alisal Union School District Series A (BAM Insured) | | 5.25 | 8-1-2042 | 1,500,000 | 1,614,586 |
The accompanying notes are an integral part of these financial statements.
10 | Allspring Intermediate Tax/AMT-Free Fund
Portfolio of investments—December 31, 2022 (unaudited)
| | | Interest
rate | Maturity
date | Principal | Value |
| GO revenue (continued) | | | | | |
| New Haven CA Unified School District CAB Project (AGC Insured) ¤ | | 0.00% | 8-1-2033 | $ 5,590,000 | $ 3,829,760 |
| Patterson CA Unified School District CAB Election of 2008 Project Series B (AGM Insured) ¤ | | 0.00 | 8-1-2033 | 3,000,000 | 2,008,915 |
| Rio Hondo CA Community College District ¤ | | 0.00 | 8-1-2030 | 2,315,000 | 1,793,634 |
| Sylvan CA Unified School District CAB Election of 2006 (AGM Insured) ¤ | | 0.00 | 8-1-2031 | 2,590,000 | 1,906,946 |
| Sylvan CA Unified School District CAB Election of 2006 (AGM Insured) ¤ | | 0.00 | 8-1-2032 | 2,800,000 | 1,976,430 |
| | | | | | 16,140,074 |
| Health revenue: 0.22% | | | | | |
| California Municipal Finance Authority Institute of Aging Project | | 5.00 | 8-15-2032 | 975,000 | 1,069,302 |
| California Municipal Finance Authority Institute of Aging Project | | 5.00 | 8-15-2033 | 1,150,000 | 1,259,257 |
| | | | | | 2,328,559 |
| Housing revenue: 0.92% | | | | | |
| California CDA MFHR Refunding Bonds 2021 Series A (Landesbank Hessen-Thüringen LOC) ø | | 3.74 | 3-1-2057 | 8,000,000 | 8,000,000 |
| California HFA Municipal Certificate of Participation Series 2 Class A | | 4.00 | 3-20-2033 | 952,386 | 919,481 |
| Tender Option Bond Trust Receipts/Certificates Series 2020-MIZ9012 (Mizuho Capital Markets LLC LIQ) 144Aø | | 3.91 | 10-1-2036 | 992,000 | 992,000 |
| | | | | | 9,911,481 |
| Miscellaneous revenue: 0.34% | | | | | |
| Anaheim CA PFA Convention Center Expansion Project Series A | | 5.00 | 5-1-2039 | 2,500,000 | 2,574,465 |
| Foothill de Anza CA Community College District Certificate of Participation | | 5.00 | 4-1-2033 | 500,000 | 520,074 |
| Gold Coast Transit District California Transit Finance Corporation Certificate of Participation | | 5.00 | 7-1-2027 | 520,000 | 561,824 |
| | | | | | 3,656,363 |
| Transportation revenue: 0.92% | | | | | |
| Bay Area CA Toll Authority Toll Bridge Series A (SIFMA Municipal Swap +1.25%) ± | | 4.91 | 4-1-2036 | 9,810,000 | 9,891,087 |
| Utilities revenue: 0.99% | | | | | |
| California Community Choice Financing Authority Clean Energy Project Green Bond Series B-1 | | 4.00 | 2-1-2052 | 1,500,000 | 1,475,972 |
| M-S-R California Energy Authority Gas Series B | | 7.00 | 11-1-2034 | 2,035,000 | 2,514,690 |
| M-S-R California Energy Authority Gas Series C | | 7.00 | 11-1-2034 | 3,000,000 | 3,707,159 |
| Vernon CA Electric System Series A | | 5.00 | 8-1-2026 | 600,000 | 626,214 |
| Vernon CA Electric System Series A | | 5.00 | 8-1-2031 | 1,160,000 | 1,255,517 |
| Victorville CA Electric Revenue Series A | | 5.00 | 5-1-2033 | 500,000 | 545,690 |
| Victorville CA Electric Revenue Series A | | 5.00 | 5-1-2034 | 500,000 | 542,229 |
| | | | | | 10,667,471 |
| | | | | | 56,027,070 |
The accompanying notes are an integral part of these financial statements.
Allspring Intermediate Tax/AMT-Free Fund | 11
Portfolio of investments—December 31, 2022 (unaudited)
| | | Interest
rate | Maturity
date | Principal | Value |
| Colorado: 0.88% | | | | | |
| Airport revenue: 0.32% | | | | | |
| Denver CO City and County Airport Revenue System Series C | | 5.25% | 11-15-2039 | $ 1,295,000 | $ 1,460,014 |
| Denver CO City and County Airport Revenue System Series C | | 5.25 | 11-15-2040 | 670,000 | 751,279 |
| Denver CO City and County Airport Revenue System Series C | | 5.25 | 11-15-2041 | 570,000 | 635,862 |
| Denver CO City and County Airport Revenue System Series C | | 5.25 | 11-15-2042 | 500,000 | 556,504 |
| | | | | | 3,403,659 |
| GO revenue: 0.22% | | | | | |
| Mesa County CO Valley School District #51 Grand Junction | | 5.50 | 12-1-2035 | 2,175,000 | 2,407,571 |
| Health revenue: 0.05% | | | | | |
| University of Colorado Hospital Authority Refunding Revenue Bonds Series 2018 C (TD Bank NA SPA) ø | | 3.65 | 11-15-2039 | 500,000 | 500,000 |
| Tax revenue: 0.24% | | | | | |
| Colorado Regional Transportation District Denver Transit Partners Eagle P3 Project Series A & B | | 5.00 | 7-15-2028 | 885,000 | 927,420 |
| Colorado Regional Transportation District Denver Transit Partners Eagle P3 Project Series A & B | | 5.00 | 1-15-2029 | 600,000 | 630,345 |
| Colorado Regional Transportation District Denver Transit Partners Eagle P3 Project Series A & B | | 5.00 | 1-15-2030 | 1,000,000 | 1,056,724 |
| | | | | | 2,614,489 |
| Water & sewer revenue: 0.05% | | | | | |
| Central Weld County CO Water District Revenue Bond (AGM Insured) | | 4.00 | 12-1-2033 | 500,000 | 532,541 |
| | | | | | 9,458,260 |
| Connecticut: 1.55% | | | | | |
| Education revenue: 0.31% | | | | | |
| Connecticut HEFAR University of Hartford Issue Series N | | 5.00 | 7-1-2029 | 480,000 | 490,401 |
| Connecticut HEFAR University of Hartford Issue Series N | | 5.00 | 7-1-2030 | 1,745,000 | 1,777,254 |
| Connecticut Higher Education Supplemental Loan Authority Loan Program Series D | | 3.00 | 11-15-2035 | 1,000,000 | 1,013,673 |
| | | | | | 3,281,328 |
| GO revenue: 0.79% | | | | | |
| Bridgeport CT Series A | | 5.00 | 6-1-2031 | 1,855,000 | 2,088,500 |
| Connecticut Series B | | 4.00 | 6-1-2034 | 750,000 | 783,377 |
| Connecticut Series F | | 5.00 | 11-15-2032 | 300,000 | 317,503 |
| Hamden CT Refunding Bond Series A (BAM Insured) | | 5.00 | 8-15-2029 | 500,000 | 545,872 |
| Hamden CT Refunding Bond Series A (BAM Insured) | | 5.00 | 8-15-2030 | 1,200,000 | 1,303,255 |
| Hamden CT Series A (BAM Insured) | | 5.00 | 8-15-2026 | 2,000,000 | 2,133,575 |
| Hamden CT Series A (BAM Insured) | | 5.00 | 8-15-2027 | 1,200,000 | 1,299,420 |
| | | | | | 8,471,502 |
The accompanying notes are an integral part of these financial statements.
12 | Allspring Intermediate Tax/AMT-Free Fund
Portfolio of investments—December 31, 2022 (unaudited)
| | | Interest
rate | Maturity
date | Principal | Value |
| Health revenue: 0.26% | | | | | |
| Connecticut HEFAR Stamford Hospital Issue Series M | | 4.00% | 7-1-2035 | $ 1,000,000 | $ 965,315 |
| Connecticut HEFAR Stamford Hospital Issue Series M | | 4.00 | 7-1-2038 | 2,000,000 | 1,864,076 |
| | | | | | 2,829,391 |
| Tax revenue: 0.19% | | | | | |
| Connecticut Special Tax Obligation Bonds Transportation Infrastructure Purposes Series A | | 4.00 | 9-1-2036 | 1,000,000 | 1,008,436 |
| Connecticut Special Tax Obligation Bonds Transportation Infrastructure Purposes Series A | | 5.00 | 8-1-2030 | 1,000,000 | 1,054,598 |
| | | | | | 2,063,034 |
| | | | | | 16,645,255 |
| Delaware: 0.19% | | | | | |
| Education revenue: 0.19% | | | | | |
| Delaware EDA Odyssey Charter School Project Series B 144A | | 6.75 | 9-1-2035 | 2,000,000 | 2,062,750 |
| District of Columbia: 1.11% | | | | | |
| GO revenue: 0.69% | | | | | |
| District of Columbia Series 2014C | | 5.00 | 6-1-2034 | 3,000,000 | 3,078,300 |
| District of Columbia Series 2014C | | 5.00 | 6-1-2035 | 1,620,000 | 1,659,126 |
| District of Columbia Series 2017A | | 5.00 | 6-1-2033 | 2,400,000 | 2,633,205 |
| | | | | | 7,370,631 |
| Tax revenue: 0.30% | | | | | |
| Washington Convention and Sports Authority Dedicated Tax Refunding Bond Senior Lien Series A | | 4.00 | 10-1-2034 | 750,000 | 772,209 |
| Washington Convention and Sports Authority Dedicated Tax Refunding Bond Senior Lien Series B | | 4.00 | 10-1-2033 | 720,000 | 747,433 |
| Washington Convention and Sports Authority Dedicated Tax Refunding Bond Senior Lien Series B | | 4.00 | 10-1-2034 | 650,000 | 669,248 |
| Washington Convention and Sports Authority Dedicated Tax Refunding Bond Senior Lien Series B | | 4.00 | 10-1-2035 | 1,000,000 | 1,016,199 |
| | | | | | 3,205,089 |
| Transportation revenue: 0.12% | | | | | |
| Washington Metropolitan Airport Authority Dulles Toll Road Series B | | 5.00 | 10-1-2034 | 1,250,000 | 1,319,480 |
| | | | | | 11,895,200 |
| Florida: 7.13% | | | | | |
| Airport revenue: 0.55% | | | | | |
| Jacksonville FL Port Authority Series B | | 5.00 | 11-1-2035 | 2,045,000 | 2,219,880 |
| Miami-Dade County FL Aviation Refunding Bond Series A | | 4.00 | 10-1-2035 | 1,600,000 | 1,598,225 |
| Miami-Dade County FL Aviation Refunding Bond Series A | | 5.00 | 10-1-2041 | 2,000,000 | 2,046,277 |
| | | | | | 5,864,382 |
| Health revenue: 0.82% | | | | | |
| Florida Health System Lee Memorial Hospital Series A | | 5.00 | 4-1-2036 | 4,500,000 | 4,754,554 |
| Jacksonville FL HCFR Baptist Health Series D ø | | 3.65 | 8-1-2036 | 1,800,000 | 1,800,000 |
The accompanying notes are an integral part of these financial statements.
Allspring Intermediate Tax/AMT-Free Fund | 13
Portfolio of investments—December 31, 2022 (unaudited)
| | | Interest
rate | Maturity
date | Principal | Value |
| Health revenue (continued) | | | | | |
| Miami-Dade County FL Health Facilities Authority Nicklaus Children's Hospital Project | | 5.00% | 8-1-2031 | $ 500,000 | $ 528,571 |
| Miami-Dade County FL Health Facilities Authority Nicklaus Children's Hospital Project | | 5.00 | 8-1-2033 | 1,645,000 | 1,732,197 |
| | | | | | 8,815,322 |
| Housing revenue: 0.19% | | | | | |
| Tender Option Bond Trust Receipts/Floater Certificates Series 2022-XF3058 (Mizuho Capital Markets LLC LOC) 144Aø | | 3.88 | 8-1-2039 | 2,000,000 | 2,000,000 |
| Miscellaneous revenue: 2.68% | | | | | |
| Boynton Beach FL PFA Capital Municipal Improvement Project | | 4.00 | 7-1-2030 | 2,090,000 | 2,219,246 |
| Boynton Beach FL PFA Capital Municipal Improvement Project | | 5.00 | 7-1-2035 | 3,590,000 | 3,847,082 |
| Duval County FL School Board Certificate of Participation Series 2022A (AGM Insured) | | 5.00 | 7-1-2034 | 2,000,000 | 2,249,563 |
| Duval County FL School Board Certificate of Participation Series 2022A (AGM Insured) | | 5.00 | 7-1-2035 | 2,000,000 | 2,229,227 |
| Duval County FL School Board Certificate of Participation Series B | | 5.00 | 7-1-2028 | 2,500,000 | 2,624,918 |
| Duval County FL School Board Certificate of Participation Series B | | 5.00 | 7-1-2029 | 5,000,000 | 5,246,148 |
| Monroe County FL School Board Certificate of Participation Series A | | 5.00 | 6-1-2034 | 1,500,000 | 1,637,258 |
| Monroe County FL School Board Certificate of Participation Series A | | 5.00 | 6-1-2035 | 1,000,000 | 1,086,555 |
| Orlando FL Senior Tourist Development 6th Cent Contract Payment Bond Series A (AGM Insured) | | 5.00 | 11-1-2032 | 2,000,000 | 2,162,402 |
| Orlando FL Senior Tourist Development 6th Cent Contract Payment Bond Series A (AGM Insured) | | 5.00 | 11-1-2033 | 4,500,000 | 4,865,225 |
| Orlando FL Senior Tourist Development 6th Cent Contract Payment Bond Series A (AGM Insured) | | 5.00 | 11-1-2034 | 600,000 | 648,510 |
| | | | | | 28,816,134 |
| Tax revenue: 0.30% | | | | | |
| Polk County FL School District | | 5.00 | 10-1-2033 | 2,915,000 | 3,263,187 |
| Transportation revenue: 0.39% | | | | | |
| Florida Mid-Bay Bridge Authority Series A | | 5.00 | 10-1-2025 | 1,250,000 | 1,279,199 |
| Miami-Dade County FL Expressway Authority Toll System (AGM Insured, Citibank NA LIQ) 144Aø | | 3.74 | 7-1-2035 | 1,050,000 | 1,050,000 |
| Osceola County FL Transportation Improvement & Refunding Bond Series A-1 | | 5.00 | 10-1-2034 | 375,000 | 380,556 |
| Osceola County FL Transportation Improvement & Refunding Bond Series A-1 | | 5.00 | 10-1-2035 | 400,000 | 405,068 |
| Osceola County FL Transportation Improvement & Refunding Bond Series A-1 | | 5.00 | 10-1-2036 | 600,000 | 606,502 |
| Osceola County FL Transportation Improvement & Refunding Bond Series A-1 | | 5.00 | 10-1-2037 | 525,000 | 529,201 |
| | | | | | 4,250,526 |
The accompanying notes are an integral part of these financial statements.
14 | Allspring Intermediate Tax/AMT-Free Fund
Portfolio of investments—December 31, 2022 (unaudited)
| | | Interest
rate | Maturity
date | Principal | Value |
| Utilities revenue: 0.16% | | | | | |
| Fort Pierce FL Utilities Authority Refunding Bond Series A (AGM Insured) | | 5.00% | 10-1-2035 | $ 500,000 | $ 563,161 |
| Fort Pierce FL Utilities Authority Refunding Bond Series A (AGM Insured) | | 5.00 | 10-1-2037 | 1,040,000 | 1,154,953 |
| | | | | | 1,718,114 |
| Water & sewer revenue: 2.04% | | | | | |
| North Sumter County FL Utility Dependent District Bond (BAM Insured) | | 5.00 | 10-1-2031 | 500,000 | 562,587 |
| North Sumter County FL Utility Dependent District Bond (BAM Insured) | | 5.00 | 10-1-2032 | 950,000 | 1,067,147 |
| North Sumter County FL Utility Dependent District Bond (BAM Insured) | | 5.00 | 10-1-2035 | 1,290,000 | 1,434,646 |
| North Sumter County FL Utility Dependent District Bond (BAM Insured) | | 5.00 | 10-1-2036 | 880,000 | 971,169 |
| Tohopekaliga Water Authority Florida Utility System 144A | | 5.00 | 10-1-2025 | 12,000,000 | 12,750,919 |
| Wildwood Utility Dependent District South Sumter Utility Project (BAM Insured) | | 5.00 | 10-1-2029 | 400,000 | 449,733 |
| Wildwood Utility Dependent District South Sumter Utility Project (BAM Insured) | | 5.00 | 10-1-2031 | 200,000 | 230,400 |
| Wildwood Utility Dependent District South Sumter Utility Project (BAM Insured) | | 5.00 | 10-1-2033 | 800,000 | 915,760 |
| Wildwood Utility Dependent District South Sumter Utility Project (BAM Insured) | | 5.00 | 10-1-2034 | 900,000 | 1,026,430 |
| Wildwood Utility Dependent District South Sumter Utility Project (BAM Insured) | | 5.00 | 10-1-2035 | 750,000 | 848,491 |
| Wildwood Utility Dependent District South Sumter Utility Project (BAM Insured) | | 5.00 | 10-1-2037 | 1,500,000 | 1,663,179 |
| | | | | | 21,920,461 |
| | | | | | 76,648,126 |
| Georgia: 1.76% | | | | | |
| Industrial development revenue: 0.04% | | | | | |
| George L. Smith II Georgia World Congress Center Authority Convention Center Series 2021A | | 4.00 | 1-1-2036 | 500,000 | 449,174 |
| Utilities revenue: 1.72% | | | | | |
| Burke County GA Development Authority Oglethorpe Power Corporation Vogtle Project Series A | | 1.50 | 1-1-2040 | 3,000,000 | 2,834,698 |
| Burke County GA Development Authority Oglethorpe Power Corporation Vogtle Project Series E | | 3.25 | 11-1-2045 | 6,000,000 | 5,950,285 |
| Dalton GA Combined Utilities Revenue Bonds | | 4.00 | 3-1-2033 | 1,100,000 | 1,113,899 |
| Dalton GA Combined Utilities Revenue Bonds | | 4.00 | 3-1-2034 | 1,200,000 | 1,214,102 |
| Georgia Municipal Electric Authority General Resolution Project Series A | | 4.00 | 1-1-2036 | 1,500,000 | 1,470,451 |
| Georgia Municipal Electric Authority Project One Series A | | 5.00 | 1-1-2035 | 925,000 | 974,965 |
| Georgia Municipal Electric Authority Units 3 & 4 Project Series A | | 5.00 | 1-1-2032 | 525,000 | 563,525 |
| Georgia Municipal Electric Authority Units 3 & 4 Project Series A | | 5.00 | 1-1-2034 | 930,000 | 986,704 |
The accompanying notes are an integral part of these financial statements.
Allspring Intermediate Tax/AMT-Free Fund | 15
Portfolio of investments—December 31, 2022 (unaudited)
| | | Interest
rate | Maturity
date | Principal | Value |
| Utilities revenue (continued) | | | | | |
| Georgia Municipal Electric Authority Units 3 & 4 Project Series A | | 5.00% | 1-1-2035 | $ 600,000 | $ 629,988 |
| Main Street Natural Gas Incorporated Georgia Gas Project Series A | | 5.00 | 5-15-2029 | 2,600,000 | 2,697,490 |
| | | | | | 18,436,107 |
| | | | | | 18,885,281 |
| Guam: 0.39% | | | | | |
| Airport revenue: 0.04% | | | | | |
| Guam International Airport Authority | | 5.00 | 10-1-2023 | 400,000 | 405,320 |
| Tax revenue: 0.12% | | | | | |
| Guam Government Business Privilege Tax Revenue Refunding Bonds Series F | | 4.00 | 1-1-2042 | 1,500,000 | 1,307,265 |
| Water & sewer revenue: 0.23% | | | | | |
| Guam Government Waterworks Authority | | 5.25 | 7-1-2033 | 2,500,000 | 2,527,813 |
| | | | | | 4,240,398 |
| Hawaii: 0.10% | | | | | |
| Airport revenue: 0.10% | | | | | |
| Hawaii Harbor System Series C | | 4.00 | 7-1-2036 | 500,000 | 509,062 |
| Hawaii Harbor System Series C | | 4.00 | 7-1-2037 | 600,000 | 605,268 |
| | | | | | 1,114,330 |
| Illinois: 16.28% | | | | | |
| Airport revenue: 1.48% | | | | | |
| Chicago IL Midway Airport Second Lien Revenue Refunding Bond Series B | | 4.00 | 1-1-2035 | 2,860,000 | 2,841,728 |
| Chicago IL Midway Airport Second Lien Revenue Refunding Bond Series B | | 5.00 | 1-1-2046 | 2,000,000 | 2,013,241 |
| Chicago IL O'Hare International Airport Senior Lien (AGM Insured) | | 5.13 | 1-1-2030 | 2,610,000 | 2,614,020 |
| Chicago IL O'Hare International Airport Senior Lien (AGM Insured) | | 5.13 | 1-1-2031 | 3,335,000 | 3,339,434 |
| Chicago IL O'Hare International Airport Senior Lien Series A | | 4.00 | 1-1-2038 | 1,000,000 | 973,675 |
| Chicago IL O'Hare International Airport Senior Lien Series B | | 5.00 | 1-1-2036 | 1,530,000 | 1,641,258 |
| Peoria IL Metropolitan Airport Authority Series D | | 5.00 | 12-1-2027 | 2,250,000 | 2,438,758 |
| | | | | | 15,862,114 |
| Education revenue: 1.24% | | | | | |
| Illinois Finance Authority Academic Facilities University of Illinois at Urbana-Champaign Project Series A | | 5.00 | 10-1-2026 | 450,000 | 479,071 |
| Illinois Finance Authority Academic Facilities University of Illinois at Urbana-Champaign Project Series A | | 5.00 | 10-1-2031 | 400,000 | 439,287 |
| Illinois Finance Authority Academic Facilities University of Illinois at Urbana-Champaign Project Series A | | 5.00 | 10-1-2039 | 700,000 | 730,614 |
| Illinois Finance Authority Bradley University Project Series C | | 5.00 | 8-1-2032 | 2,500,000 | 2,581,207 |
The accompanying notes are an integral part of these financial statements.
16 | Allspring Intermediate Tax/AMT-Free Fund
Portfolio of investments—December 31, 2022 (unaudited)
| | | Interest
rate | Maturity
date | Principal | Value |
| Education revenue (continued) | | | | | |
| Illinois Finance Authority Refunding Bond Bradley University Project Series A | | 4.00% | 8-1-2035 | $ 805,000 | $ 751,764 |
| Illinois Finance Authority Revenue Acero Charter Schools Incorporated 144A | | 4.00 | 10-1-2034 | 440,000 | 383,431 |
| Illinois Finance Authority Revenue Acero Charter Schools Incorporated 144A | | 4.00 | 10-1-2035 | 1,025,000 | 877,801 |
| Illinois Finance Authority University of Chicago Series 2021A | | 5.00 | 10-1-2033 | 2,000,000 | 2,335,435 |
| Illinois Finance Authority Wesleyan University | | 5.00 | 9-1-2026 | 680,000 | 717,242 |
| Northern Illinois University Board of Trustees Certificate of Participation (AGM Insured) | | 5.00 | 9-1-2024 | 1,000,000 | 1,028,344 |
| Southern Illinois University Refunding Bond Housing and Auxiliary Facilities System (BAM Insured) | | 4.00 | 4-1-2029 | 400,000 | 411,457 |
| Southern Illinois University Refunding Bond Housing and Auxiliary Facilities System (BAM Insured) | | 4.00 | 4-1-2030 | 525,000 | 529,063 |
| University of Illinois Board of Trustees Auxiliary Facilities System Revenue Refunding Bonds Series 2013A | | 4.00 | 4-1-2030 | 2,000,000 | 2,002,681 |
| | | | | | 13,267,397 |
| GO revenue: 2.63% | | | | | |
| Bolingbrook, Will & DuPage Counties IL Refunding Bond Series A (AGM Insured) | | 5.00 | 1-1-2023 | 85,000 | 85,000 |
| Chicago IL Board of Education CAB School Reform Series B-1 (NPFGC Insured) ¤ | | 0.00 | 12-1-2025 | 3,380,000 | 3,021,203 |
| Chicago IL Park District Series B (BAM Insured) | | 5.00 | 1-1-2029 | 2,000,000 | 2,037,235 |
| Chicago IL Series 2023A %% | | 5.50 | 1-1-2040 | 1,000,000 | 1,046,539 |
| Cook County IL Community College District #508 | | 5.25 | 12-1-2025 | 1,665,000 | 1,677,438 |
| Cook County IL Community College District #508 | | 5.25 | 12-1-2027 | 1,295,000 | 1,302,895 |
| Cook County IL Community College District #508 | | 5.25 | 12-1-2028 | 1,250,000 | 1,257,535 |
| Cook County IL Community College District #508 | | 5.25 | 12-1-2030 | 3,000,000 | 3,010,706 |
| Cook County IL Community College District #508 | | 5.25 | 12-1-2031 | 3,200,000 | 3,210,314 |
| Cook County IL Series A | | 5.00 | 11-15-2029 | 1,000,000 | 1,067,699 |
| Cook County IL Series A | | 5.00 | 11-15-2034 | 1,300,000 | 1,348,632 |
| Illinois Series A | | 5.00 | 3-1-2033 | 1,000,000 | 1,018,701 |
| Madison IL Bond and Montgomery Counties Obligation School Bonds Series 2022 B (AGM Insured) | | 5.50 | 2-1-2033 | 600,000 | 686,262 |
| Madison IL Bond and Montgomery Counties Obligation School Bonds Series 2022 B (AGM Insured) | | 5.50 | 2-1-2038 | 1,635,000 | 1,818,931 |
| Sangamon County IL Limited Tax (BAM Insured) | | 4.00 | 12-15-2036 | 450,000 | 456,479 |
| Sangamon County IL Limited Tax (BAM Insured) | | 4.00 | 12-15-2040 | 300,000 | 300,613 |
| Sangamon, Logan & Menard Counties IL Williamsville Community Unit School District Series B (BAM Insured) | | 4.00 | 12-1-2037 | 700,000 | 701,180 |
| Sangamon, Logan & Menard Counties IL Williamsville Community Unit School District Series B (BAM Insured) | | 5.00 | 12-1-2034 | 400,000 | 438,631 |
| Sangamon, Logan & Menard Counties IL Williamsville Community Unit School District Series B (BAM Insured) | | 5.00 | 12-1-2035 | 450,000 | 490,251 |
| Sangamon, Logan & Menard Counties IL Williamsville Community Unit School District Series B (BAM Insured) | | 5.00 | 12-1-2036 | 500,000 | 542,254 |
| Stephenson County IL School District #145 Prerefunded Series 2018A (AGM Insured) | | 5.00 | 2-1-2033 | 285,000 | 315,704 |
| Stephenson County IL School District #145 Unrefunded Series 2018A (AGM Insured) | | 5.00 | 2-1-2033 | 1,265,000 | 1,404,529 |
| Waukegan IL Series B (AGM Insured) | | 4.00 | 12-30-2024 | 1,030,000 | 1,050,533 |
| | | | | | 28,289,264 |
The accompanying notes are an integral part of these financial statements.
Allspring Intermediate Tax/AMT-Free Fund | 17
Portfolio of investments—December 31, 2022 (unaudited)
| | | Interest
rate | Maturity
date | Principal | Value |
| Health revenue: 0.51% | | | | | |
| Illinois Finance Authority Ann & Robert H. Laurie Children's Hospital Project of Chicago | | 5.00% | 8-15-2034 | $ 1,000,000 | $ 1,051,874 |
| Illinois Finance Authority Edward Elmhurst Healthcare Series A | | 5.00 | 1-1-2026 | 1,000,000 | 1,060,050 |
| Illinois Finance Authority Health Services Facility Lease Bond | | 5.00 | 10-1-2032 | 520,000 | 550,476 |
| Illinois Finance Authority Lutheran Life Communities Obligated Group Series A | | 5.00 | 11-1-2035 | 900,000 | 814,214 |
| Illinois Finance Authority Revenue Various Refunding Bond Northwestern Memorial (Barclays Bank plc SPA) ø | | 3.37 | 7-15-2055 | 2,000,000 | 2,000,000 |
| | | | | | 5,476,614 |
| Housing revenue: 0.33% | | | | | |
| Northern Illinois University Auxiliary Facilities System (BAM Insured) | | 4.00 | 10-1-2033 | 1,000,000 | 1,003,636 |
| Northern Illinois University Auxiliary Facilities System (BAM Insured) | | 4.00 | 10-1-2036 | 1,650,000 | 1,608,301 |
| Northern Illinois University Auxiliary Facilities System (BAM Insured) | | 5.00 | 10-1-2031 | 900,000 | 977,153 |
| | | | | | 3,589,090 |
| Miscellaneous revenue: 0.45% | | | | | |
| Illinois Finance Authority Refunding Bonds Field Museum of Natural History (U.S. SOFR +1.20%) ± | | 4.21 | 11-1-2034 | 1,480,000 | 1,476,747 |
| Illinois GO Series July 2013 | | 5.50 | 7-1-2026 | 2,300,000 | 2,318,264 |
| Peoria IL Public Building Commission Illinois School District Facilities Refunding Bond (BAM Insured) | | 5.00 | 12-1-2024 | 1,000,000 | 1,042,161 |
| | | | | | 4,837,172 |
| Tax revenue: 6.85% | | | | | |
| Chicago IL Sales Tax Securitization Bond Series A | | 5.00 | 1-1-2029 | 1,000,000 | 1,082,359 |
| Chicago IL Sales Tax Securitization Bond Series C | | 5.25 | 1-1-2035 | 4,700,000 | 5,018,551 |
| Chicago IL Transit Authority Sales Tax Receipts Revenue Bonds Series 2014 | | 5.25 | 12-1-2049 | 3,000,000 | 3,030,918 |
| Cook County IL Sales Tax Bond | | 5.00 | 11-15-2033 | 4,000,000 | 4,276,409 |
| Cook County IL Sales Tax Bond | | 5.25 | 11-15-2035 | 2,000,000 | 2,134,495 |
| Cook County IL Sales Tax Bond Series 2021A | | 5.00 | 11-15-2036 | 1,160,000 | 1,253,527 |
| Cook County IL Sales Tax Bond Series 2021A | | 5.00 | 11-15-2037 | 1,625,000 | 1,748,245 |
| Illinois Sports Facilities Authority State Tax Supported Refunding Bond | | 5.00 | 6-15-2028 | 1,000,000 | 1,014,417 |
| Illinois Sports Facilities Authority State Tax Supported Refunding Bond (AGM Insured) | | 5.00 | 6-15-2028 | 2,500,000 | 2,549,130 |
| Illinois Sports Facilities Authority State Tax Supported Refunding Bond (AGM Insured) | | 5.25 | 6-15-2030 | 4,000,000 | 4,090,312 |
| Illinois Sports Facilities Authority State Tax Supported Refunding Bond (AGM Insured) | | 5.25 | 6-15-2032 | 3,000,000 | 3,063,479 |
| Metropolitan Pier & Exposition Authority CAB McCormick Place Expansion Project Series A (NPFGC Insured) ¤ | | 0.00 | 12-15-2029 | 33,200,000 | 25,190,895 |
| Metropolitan Pier & Exposition Authority CAB McCormick Place Expansion Project Series A (NPFGC Insured) ¤ | | 0.00 | 12-15-2030 | 12,800,000 | 9,286,190 |
| Metropolitan Pier & Exposition Authority CAB McCormick Place Expansion Project Series B (NPFGC Insured) ¤## | | 0.00 | 6-15-2029 | 10,000,000 | 7,751,624 |
| Southwestern Illinois Development Authority Local Government Program Collinsville Limited | | 5.00 | 3-1-2025 | 2,650,000 | 2,157,642 |
| | | | | | 73,648,193 |
The accompanying notes are an integral part of these financial statements.
18 | Allspring Intermediate Tax/AMT-Free Fund
Portfolio of investments—December 31, 2022 (unaudited)
| | | Interest
rate | Maturity
date | Principal | Value |
| Transportation revenue: 0.26% | | | | | |
| Illinois Toll Highway Authority Senior Bond Class A | | 5.00% | 1-1-2037 | $ 1,250,000 | $ 1,354,217 |
| Illinois Toll Highway Authority Senior Bond Class A | | 5.00 | 1-1-2038 | 1,355,000 | 1,459,481 |
| | | | | | 2,813,698 |
| Water & sewer revenue: 2.53% | | | | | |
| Chicago IL Refunding Bond Second Lien Project | | 5.00 | 11-1-2026 | 2,000,000 | 2,012,172 |
| Chicago IL Refunding Bond Second Lien Project | | 5.00 | 11-1-2028 | 3,000,000 | 3,018,302 |
| Chicago IL Refunding Bond Second Lien Project | | 5.00 | 11-1-2029 | 1,490,000 | 1,499,104 |
| Chicago IL Refunding Bond Second Lien Project | | 5.00 | 11-1-2033 | 1,000,000 | 1,017,347 |
| Chicago IL Refunding Bond Second Lien Project (AGM Insured) | | 5.25 | 11-1-2033 | 2,000,000 | 2,148,383 |
| Chicago IL Waste Water Transmission Second Lien | | 5.00 | 1-1-2027 | 2,865,000 | 2,910,554 |
| Chicago IL Waste Water Transmission Second Lien | | 5.00 | 1-1-2029 | 4,700,000 | 4,703,317 |
| Chicago IL Waste Water Transmission Second Lien | | 5.00 | 1-1-2032 | 1,000,000 | 1,011,482 |
| Chicago IL Waste Water Transmission Second Lien | | 5.00 | 1-1-2033 | 1,000,000 | 1,008,198 |
| Chicago IL Waste Water Transmission Second Lien | | 5.00 | 1-1-2034 | 1,000,000 | 1,007,681 |
| Illinois Finance Authority Clean Water Initiative Revolving Fund Bond | | 5.25 | 7-1-2035 | 3,000,000 | 3,362,945 |
| Sangamon IL Water Commission Refunding Bond (AGM Insured) | | 4.00 | 1-1-2029 | 525,000 | 544,371 |
| Sangamon IL Water Commission Refunding Bond (AGM Insured) | | 4.00 | 1-1-2030 | 600,000 | 625,123 |
| Sangamon IL Water Commission Refunding Bond (AGM Insured) | | 4.00 | 1-1-2031 | 625,000 | 654,195 |
| Sangamon IL Water Commission Refunding Bond (AGM Insured) | | 4.00 | 1-1-2033 | 500,000 | 520,582 |
| Sangamon IL Water Commission Refunding Bond (AGM Insured) | | 4.00 | 1-1-2036 | 570,000 | 584,187 |
| Sangamon IL Water Commission Refunding Bond (AGM Insured) | | 4.00 | 1-1-2037 | 525,000 | 533,214 |
| | | | | | 27,161,157 |
| | | | | | 174,944,699 |
| Indiana: 1.87% | | | | | |
| Airport revenue: 0.12% | | | | | |
| Indianapolis IN Local Public Improvement Bond Bank Series I | | 5.00 | 1-1-2033 | 1,120,000 | 1,256,039 |
| Industrial development revenue: 0.23% | | | | | |
| Indiana Finance Authority PCR Bonds Series 2010B | | 2.50 | 11-1-2030 | 2,925,000 | 2,492,317 |
| Miscellaneous revenue: 1.11% | | | | | |
| Dubois IN Greater Jasper School Building Corporation First Mortgage Bond | | 5.00 | 7-15-2029 | 1,625,000 | 1,800,812 |
| Indiana Finance Authority Stadium Project Series A | | 5.25 | 2-1-2028 | 2,000,000 | 2,116,762 |
| Indianapolis IN Local Public Improvement Bond Bank Indy Roads Series E | | 5.00 | 1-1-2028 | 1,000,000 | 1,068,940 |
| Indianapolis IN Local Public Improvement Bond Bank Indy Roads Series E | | 5.00 | 1-1-2029 | 735,000 | 785,671 |
| Indianapolis IN Local Public Improvement Bond Bank Indy Roads Series E | | 5.00 | 1-1-2030 | 1,375,000 | 1,469,793 |
| Indianapolis IN Local Public Improvement Bond Bank Indy Roads Series E | | 5.00 | 1-1-2033 | 1,545,000 | 1,651,513 |
The accompanying notes are an integral part of these financial statements.
Allspring Intermediate Tax/AMT-Free Fund | 19
Portfolio of investments—December 31, 2022 (unaudited)
| | | Interest
rate | Maturity
date | Principal | Value |
| Miscellaneous revenue (continued) | | | | | |
| Indianapolis IN Local Public Improvement Bond Bank Indy Roads Series E | | 5.00% | 1-1-2034 | $ 2,000,000 | $ 2,137,880 |
| North West Hendricks IN Multi-School Building Corporation Ad Valorem Property Tax Mortgage Bond | | 4.00 | 7-15-2031 | 900,000 | 940,838 |
| | | | | | 11,972,209 |
| Utilities revenue: 0.09% | | | | | |
| Indiana Finance Authority Midwestern Disaster Relief Revenue Various Ohio Valley Electric Corporation Project Series 2012A | | 4.25 | 11-1-2030 | 1,000,000 | 965,147 |
| Water & sewer revenue: 0.32% | | | | | |
| Indiana Finance Authority First Lien Wastewater Utility Clean Water Project Series A | | 5.00 | 10-1-2030 | 2,315,000 | 2,386,349 |
| Indiana Finance Authority First Lien Wastewater Utility Clean Water Project Series A | | 5.00 | 10-1-2031 | 1,035,000 | 1,066,366 |
| | | | | | 3,452,715 |
| | | | | | 20,138,427 |
| Iowa: 0.52% | | | | | |
| GO revenue: 0.23% | | | | | |
| Altoona IA Annual Appropriation Urban Renewal Refunding Bond | | 5.00 | 6-1-2027 | 2,310,000 | 2,473,848 |
| Utilities revenue: 0.29% | | | | | |
| Iowa Gas Project Public Expenditure and Financial Accountability Incorporated | | 5.00 | 9-1-2049 | 3,000,000 | 3,071,576 |
| | | | | | 5,545,424 |
| Kansas: 0.35% | | | | | |
| Miscellaneous revenue: 0.25% | | | | | |
| Kansas Development Finance Authority Agro-Defense Facility Series G | | 5.00 | 4-1-2030 | 2,650,000 | 2,661,853 |
| Tax revenue: 0.10% | | | | | |
| Wyandotte County & Kansas City KS Special Obligation Vacation Village Project Area 4 Major Multi-Sport Athletic Complex Project CAB 144A¤ | | 0.00 | 9-1-2034 | 3,195,000 | 1,114,233 |
| | | | | | 3,776,086 |
| Kentucky: 0.24% | | | | | |
| Education revenue: 0.14% | | | | | |
| Kentucky Bond Development Corporation Educational Facilities Danville Centre College | | 4.00 | 6-1-2030 | 170,000 | 177,009 |
| Kentucky Bond Development Corporation Educational Facilities Danville Centre College | | 4.00 | 6-1-2031 | 260,000 | 269,664 |
| Kentucky Bond Development Corporation Educational Facilities Danville Centre College | | 4.00 | 6-1-2032 | 230,000 | 236,201 |
| Kentucky Bond Development Corporation Educational Facilities Danville Centre College | | 4.00 | 6-1-2033 | 180,000 | 182,962 |
The accompanying notes are an integral part of these financial statements.
20 | Allspring Intermediate Tax/AMT-Free Fund
Portfolio of investments—December 31, 2022 (unaudited)
| | | Interest
rate | Maturity
date | Principal | Value |
| Education revenue (continued) | | | | | |
| Kentucky Bond Development Corporation Educational Facilities Danville Centre College | | 4.00% | 6-1-2035 | $ 460,000 | $ 452,739 |
| Kentucky Bond Development Corporation Educational Facilities Danville Centre College | | 4.00 | 6-1-2036 | 235,000 | 224,465 |
| | | | | | 1,543,040 |
| Transportation revenue: 0.10% | | | | | |
| Kentucky Public Transportation Infrastructure Authority Downtown Crossing Project CAB Series B ¤ | | 0.00 | 7-1-2029 | 1,400,000 | 1,039,427 |
| | | | | | 2,582,467 |
| Louisiana: 3.27% | | | | | |
| Airport revenue: 0.27% | | | | | |
| New Orleans LA Aviation Board Consolidated Rental Car Project (AGM Insured) | | 5.00 | 1-1-2035 | 2,000,000 | 2,124,269 |
| New Orleans LA Aviation Board North Terminal Project Series A | | 5.00 | 1-1-2033 | 750,000 | 800,001 |
| | | | | | 2,924,270 |
| Education revenue: 0.54% | | | | | |
| Louisiana PFA Loyola University Project CCAB ¤ | | 0.00 | 10-1-2027 | 3,380,000 | 3,317,887 |
| Louisiana PFA Loyola University Project CCAB ¤ | | 0.00 | 10-1-2028 | 2,500,000 | 2,461,713 |
| | | | | | 5,779,600 |
| Miscellaneous revenue: 1.36% | | | | | |
| Lafayette LA Communications System (AGM Insured) | | 5.00 | 11-1-2025 | 1,500,000 | 1,587,211 |
| Louisiana PFA Archdiocese of New Orleans Project | | 5.00 | 7-1-2024 | 1,000,000 | 900,000 |
| Louisiana PFA Archdiocese of New Orleans Project | | 5.00 | 7-1-2025 | 600,000 | 540,000 |
| Louisiana PFA Archdiocese of New Orleans Project | | 5.00 | 7-1-2026 | 500,000 | 450,000 |
| Louisiana Unclaimed Property Special Bond 1-49 South Project | | 5.00 | 9-1-2027 | 2,700,000 | 2,864,288 |
| Louisiana Unclaimed Property Special Bond 1-49 South Project | | 5.00 | 9-1-2028 | 2,405,000 | 2,551,338 |
| Louisiana Unclaimed Property Special Bond 1-49 South Project | | 5.00 | 9-1-2029 | 2,695,000 | 2,858,984 |
| Louisiana Unclaimed Property Special Bond 1-49 South Project | | 5.00 | 9-1-2030 | 2,700,000 | 2,864,288 |
| | | | | | 14,616,109 |
| Tax revenue: 0.20% | | | | | |
| Jefferson LA Sales Tax District Series B (AGM Insured) | | 5.00 | 12-1-2031 | 1,000,000 | 1,087,981 |
| Jefferson LA Sales Tax District Series B (AGM Insured) | | 5.00 | 12-1-2032 | 1,000,000 | 1,081,418 |
| | | | | | 2,169,399 |
| Transportation revenue: 0.30% | | | | | |
| Greater New Orleans LA Expressway Commission Toll Subordinate Lien Bond (AGM Insured) | | 5.00 | 11-1-2031 | 1,000,000 | 1,055,910 |
| Greater New Orleans LA Expressway Commission Toll Subordinate Lien Bond (AGM Insured) | | 5.00 | 11-1-2032 | 1,000,000 | 1,055,353 |
| Greater New Orleans LA Expressway Commission Toll Subordinate Lien Bond (AGM Insured) | | 5.00 | 11-1-2033 | 1,000,000 | 1,054,241 |
| | | | | | 3,165,504 |
The accompanying notes are an integral part of these financial statements.
Allspring Intermediate Tax/AMT-Free Fund | 21
Portfolio of investments—December 31, 2022 (unaudited)
| | | Interest
rate | Maturity
date | Principal | Value |
| Water & sewer revenue: 0.60% | | | | | |
| Greater Ouachita LA Waterworks and Sewer System Refunding Bond (BAM Insured) | | 4.00% | 9-1-2030 | $ 500,000 | $ 528,576 |
| Greater Ouachita LA Waterworks and Sewer System Refunding Bond (BAM Insured) | | 4.00 | 9-1-2031 | 600,000 | 630,965 |
| Greater Ouachita LA Waterworks and Sewer System Refunding Bond (BAM Insured) | | 4.00 | 9-1-2032 | 655,000 | 687,990 |
| Louisiana Local Government Environmental Facilities & CDA East Baton Rouge Series A | | 5.00 | 2-1-2030 | 1,000,000 | 1,022,954 |
| New Orleans LA Sewerage Service Series B (AGM Insured) | | 4.00 | 6-1-2035 | 400,000 | 413,620 |
| New Orleans LA Sewerage Service Series B (AGM Insured) | | 4.00 | 6-1-2036 | 325,000 | 331,699 |
| New Orleans LA Sewerage Service Series B (AGM Insured) | | 4.00 | 6-1-2037 | 335,000 | 337,458 |
| New Orleans LA Sewerage Service Series B | | 5.00 | 6-1-2032 | 1,000,000 | 1,108,482 |
| New Orleans LA Sewerage Service Series B | | 5.00 | 6-1-2033 | 695,000 | 768,250 |
| New Orleans LA Sewerage Service Series B | | 5.00 | 6-1-2034 | 600,000 | 659,931 |
| | | | | | 6,489,925 |
| | | | | | 35,144,807 |
| Maine: 0.79% | | | | | |
| Education revenue: 0.51% | | | | | |
| Maine Health and HEFAR University of New England Series A | | 5.00 | 7-1-2029 | 1,015,000 | 1,085,615 |
| Maine Health and HEFAR University of New England Series A | | 5.00 | 7-1-2030 | 1,200,000 | 1,283,138 |
| Maine Health and HEFAR University of New England Series A | | 5.00 | 7-1-2032 | 1,415,000 | 1,504,447 |
| Maine Health and HEFAR University of New England Series A | | 5.00 | 7-1-2033 | 1,485,000 | 1,575,959 |
| | | | | | 5,449,159 |
| Health revenue: 0.28% | | | | | |
| Maine Health and HEFAR Series A | | 4.00 | 7-1-2036 | 800,000 | 797,891 |
| Maine Health and HEFAR Series A | | 4.00 | 7-1-2037 | 1,150,000 | 1,128,725 |
| Maine Health and HEFAR Series A | | 5.00 | 7-1-2035 | 1,000,000 | 1,080,096 |
| | | | | | 3,006,712 |
| | | | | | 8,455,871 |
| Maryland: 0.59% | | | | | |
| Education revenue: 0.41% | | | | | |
| Maryland Economic Development Corporation Student Housing Salisbury University Project | | 5.00 | 6-1-2027 | 500,000 | 500,127 |
| Maryland HEFAR Stevenson University Series 2021A | | 4.00 | 6-1-2035 | 470,000 | 451,987 |
| Maryland HEFAR Stevenson University Series 2021A | | 4.00 | 6-1-2037 | 450,000 | 424,885 |
| Maryland HEFAR Stevenson University Series 2021A | | 4.00 | 6-1-2039 | 500,000 | 462,094 |
| Westminster MD Educational Facilities McDaniel College | | 5.00 | 11-1-2026 | 2,450,000 | 2,579,031 |
| | | | | | 4,418,124 |
The accompanying notes are an integral part of these financial statements.
22 | Allspring Intermediate Tax/AMT-Free Fund
Portfolio of investments—December 31, 2022 (unaudited)
| | | Interest
rate | Maturity
date | Principal | Value |
| Tax revenue: 0.13% | | | | | |
| Howard County MD Downtown Columbia Project Series A 144A | | 4.00% | 2-15-2028 | $ 480,000 | $ 462,556 |
| Howard County MD Downtown Columbia Project Series A 144A | | 4.13 | 2-15-2034 | 1,000,000 | 919,610 |
| | | | | | 1,382,166 |
| Water & sewer revenue: 0.05% | | | | | |
| Baltimore MD Mayor and City Council Project Series A | | 5.00 | 7-1-2035 | 500,000 | 558,715 |
| | | | | | 6,359,005 |
| Massachusetts: 0.10% | | | | | |
| Health revenue: 0.10% | | | | | |
| Massachusetts Development Finance Agency Wellforce Issue Series C (AGM Insured) | | 5.00 | 10-1-2033 | 525,000 | 570,654 |
| Massachusetts Development Finance Agency Wellforce Issue Series C (AGM Insured) | | 5.00 | 10-1-2034 | 500,000 | 539,937 |
| | | | | | 1,110,591 |
| Michigan: 3.61% | | | | | |
| Airport revenue: 0.14% | | | | | |
| Wayne County MI Airport Authority Detroit Metropolitan Bond Series A | | 5.00 | 12-1-2032 | 800,000 | 866,647 |
| Wayne County MI Airport Authority Detroit Metropolitan Bond Series A | | 5.00 | 12-1-2034 | 600,000 | 645,909 |
| | | | | | 1,512,556 |
| Education revenue: 0.54% | | | | | |
| Flint MI International Academy Public School | | 5.50 | 10-1-2027 | 1,985,000 | 1,964,707 |
| Michigan State University Board of Trustees | | 5.00 | 2-15-2036 | 1,325,000 | 1,450,461 |
| Western Michigan University Board of Trustees | | 5.25 | 11-15-2027 | 600,000 | 612,142 |
| Western Michigan University Board of Trustees | | 5.25 | 11-15-2029 | 1,000,000 | 1,020,236 |
| Western Michigan University Board of Trustees (AGM Insured) | | 5.25 | 11-15-2033 | 750,000 | 765,177 |
| | | | | | 5,812,723 |
| GO revenue: 0.34% | | | | | |
| Kent County MI Limited Tax Capital Improvement Bond | | 5.00 | 6-1-2030 | 1,040,000 | 1,117,624 |
| Pinckney MI Community School District (Qualified School Board Loan Fund Insured) | | 5.00 | 5-1-2026 | 2,505,000 | 2,566,422 |
| | | | | | 3,684,046 |
| Health revenue: 0.28% | | | | | |
| Michigan Finance Authority Trinity Health Credit Group Series MI-2 | | 4.00 | 12-1-2035 | 3,000,000 | 3,021,706 |
| Miscellaneous revenue: 0.28% | | | | | |
| Michigan Finance Authority Local Government Loan Program Series F | | 4.00 | 10-1-2024 | 3,000,000 | 2,995,637 |
| Water & sewer revenue: 2.03% | | | | | |
| Great Lakes MI Water Authority Sewage Disposal System Series C | | 5.00 | 7-1-2030 | 3,350,000 | 3,577,802 |
The accompanying notes are an integral part of these financial statements.
Allspring Intermediate Tax/AMT-Free Fund | 23
Portfolio of investments—December 31, 2022 (unaudited)
| | | Interest
rate | Maturity
date | Principal | Value |
| Water & sewer revenue (continued) | | | | | |
| Michigan Finance Authority Local Government Loan Program Series D (NPFGC Insured) | | 5.00% | 7-1-2025 | $ 1,000,000 | $ 1,031,536 |
| Michigan Finance Authority Local Government Loan Program Series D | | 5.00 | 7-1-2030 | 12,000,000 | 12,298,774 |
| Michigan Finance Authority Local Government Loan Program Series D (AGM Insured) | | 5.00 | 7-1-2035 | 2,750,000 | 2,813,628 |
| Michigan Finance Authority Local Government Loan Program Series D (AGM Insured) | | 5.00 | 7-1-2037 | 2,000,000 | 2,040,717 |
| | | | | | 21,762,457 |
| | | | | | 38,789,125 |
| Minnesota: 0.19% | | | | | |
| GO revenue: 0.10% | | | | | |
| Hennepin County MN Series 2018B (TD Bank NA SPA) ø | | 3.58 | 12-1-2038 | 1,000,000 | 1,000,000 |
| Health revenue: 0.09% | | | | | |
| Rochester MN HCFR Mayo Clinic Series B (Northern Trust Company SPA) ø | | 3.60 | 11-15-2038 | 1,000,000 | 1,000,000 |
| | | | | | 2,000,000 |
| Mississippi: 0.66% | | | | | |
| Health revenue: 0.29% | | | | | |
| Mississippi Hospital Equipment & Facilities Authority North Mississippi Health Services Series IV | | 5.00 | 10-1-2037 | 1,000,000 | 1,038,665 |
| Mississippi Hospital Equipment & Facilities Authority North Mississippi Health Services Series IV | | 5.00 | 10-1-2038 | 1,000,000 | 1,032,898 |
| Mississippi Hospital Equipment & Facilities Authority North Mississippi Health Services Series IV | | 5.00 | 10-1-2039 | 1,000,000 | 1,031,895 |
| | | | | | 3,103,458 |
| Water & sewer revenue: 0.37% | | | | | |
| Mississippi Development Bank Special Obligation Bonds Series 2013 Jackson Water & Sewer System Project (AGM Insured) | | 6.00 | 12-1-2023 | 1,145,000 | 1,172,282 |
| West Rankin MS Utility Authority (AGM Insured) | | 5.00 | 1-1-2027 | 435,000 | 454,592 |
| West Rankin MS Utility Authority (AGM Insured) | | 5.00 | 1-1-2026 | 525,000 | 548,645 |
| West Rankin MS Utility Authority (AGM Insured) | | 5.00 | 1-1-2034 | 750,000 | 783,779 |
| West Rankin MS Utility Authority (AGM Insured) | | 5.00 | 1-1-2035 | 1,000,000 | 1,045,038 |
| | | | | | 4,004,336 |
| | | | | | 7,107,794 |
| Missouri: 0.67% | | | | | |
| Education revenue: 0.23% | | | | | |
| Missouri HEFA Webster University Project | | 5.00 | 4-1-2027 | 2,450,000 | 2,489,090 |
| Health revenue: 0.20% | | | | | |
| Missouri HEFAR Barnes-Jewish Christian Health System Series C | | 5.00 | 5-1-2052 | 2,000,000 | 2,185,776 |
The accompanying notes are an integral part of these financial statements.
24 | Allspring Intermediate Tax/AMT-Free Fund
Portfolio of investments—December 31, 2022 (unaudited)
| | | Interest
rate | Maturity
date | Principal | Value |
| Miscellaneous revenue: 0.24% | | | | | |
| Poplar Bluff MO School District (AGM Insured) | | 5.00% | 3-1-2032 | $ 1,500,000 | $ 1,530,892 |
| Poplar Bluff MO School District (AGM Insured) | | 5.00 | 3-1-2034 | 1,000,000 | 1,020,710 |
| | | | | | 2,551,602 |
| | | | | | 7,226,468 |
| Nebraska: 0.30% | | | | | |
| Health revenue: 0.11% | | | | | |
| Douglas County NE Hospital Authority Children's Hospital Obligated Group Series A | | 4.00 | 11-15-2038 | 1,200,000 | 1,177,949 |
| Utilities revenue: 0.19% | | | | | |
| Nebraska Central Plains Energy Gas Project #4 | | 5.00 | 3-1-2050 | 2,000,000 | 2,018,843 |
| | | | | | 3,196,792 |
| Nevada: 0.21% | | | | | |
| GO revenue: 0.19% | | | | | |
| Las Vegas NV Series A | | 5.00 | 5-1-2031 | 1,985,000 | 2,035,495 |
| Miscellaneous revenue: 0.02% | | | | | |
| Las Vegas NV Special Improvement District #607 | | 4.25 | 6-1-2024 | 200,000 | 200,595 |
| | | | | | 2,236,090 |
| New Hampshire: 0.32% | | | | | |
| Health revenue: 0.08% | | | | | |
| New Hampshire HEFA Kendal at Hanover Project Series B (TD Bank NA LOC) ø | | 3.66 | 10-1-2030 | 900,000 | 900,000 |
| Housing revenue: 0.24% | | | | | |
| New Hampshire HFA | | 4.80 | 7-1-2028 | 245,000 | 248,594 |
| New Hampshire National Finance Authority Municipal Certificates Series A | | 4.13 | 1-20-2034 | 2,394,719 | 2,321,968 |
| | | | | | 2,570,562 |
| | | | | | 3,470,562 |
| New Jersey: 3.16% | | | | | |
| Airport revenue: 0.21% | | | | | |
| South Jersey NJ Port Corporation Marine Terminal Refunding Bond Series S | | 5.00 | 1-1-2028 | 2,130,000 | 2,225,384 |
| GO revenue: 0.45% | | | | | |
| Trenton City NJ (BAM Insured) | | 5.00 | 12-1-2024 | 1,775,000 | 1,843,783 |
| Trenton City NJ (BAM Insured) | | 5.00 | 12-1-2025 | 1,860,000 | 1,972,624 |
| Trenton City NJ (BAM Insured) | | 5.00 | 12-1-2026 | 1,000,000 | 1,059,704 |
| | | | | | 4,876,111 |
| Miscellaneous revenue: 0.39% | | | | | |
| New Jersey EDA Motor Vehicle Surcharge Revenue Refunding Bonds Series A | | 3.13 | 7-1-2029 | 445,000 | 436,401 |
The accompanying notes are an integral part of these financial statements.
Allspring Intermediate Tax/AMT-Free Fund | 25
Portfolio of investments—December 31, 2022 (unaudited)
| | | Interest
rate | Maturity
date | Principal | Value |
| Miscellaneous revenue (continued) | | | | | |
| New Jersey EDA Motor Vehicle Surcharge Revenue Refunding Bonds Series A | | 5.00% | 7-1-2033 | $ 2,500,000 | $ 2,605,617 |
| North Hudson NJ Sewerage Authority Gross Revenue Senior Lien Lease Certificates Series 2021 (AGM Insured) | | 5.00 | 6-1-2038 | 1,000,000 | 1,146,644 |
| | | | | | 4,188,662 |
| Tax revenue: 1.26% | | | | | |
| New Jersey EDA Motor Vehicle Surcharge Unrefunded Bonds Series A (NPFGC Insured) | | 5.25 | 7-1-2026 | 2,320,000 | 2,459,938 |
| New Jersey Garden State Preservation Trust Open & Farmland Series A (AGM Insured) | | 5.75 | 11-1-2028 | 5,000,000 | 5,496,670 |
| New Jersey TTFA Transportation System Series AA | | 5.00 | 6-15-2036 | 2,000,000 | 2,127,632 |
| New Jersey TTFA Transportation System Series AA | | 5.00 | 6-15-2038 | 3,250,000 | 3,399,689 |
| | | | | | 13,483,929 |
| Transportation revenue: 0.85% | | | | | |
| New Jersey TTFA CAB Transportation System Series A ¤ | | 0.00 | 12-15-2030 | 2,000,000 | 1,456,629 |
| New Jersey TTFA CAB Transportation System Series C (Ambac Insured) ¤ | | 0.00 | 12-15-2026 | 3,500,000 | 3,045,430 |
| New Jersey TTFA Transportation System Series A | | 5.00 | 12-15-2036 | 2,000,000 | 2,095,229 |
| New Jersey TTFA Transportation System Series C | | 5.25 | 6-15-2032 | 2,500,000 | 2,572,749 |
| | | | | | 9,170,037 |
| | | | | | 33,944,123 |
| New Mexico: 1.30% | | | | | |
| GO revenue: 0.12% | | | | | |
| Albuquerque NM Municipal School District #12 Bernalillo & Sandoval Counties | | 5.00 | 8-1-2034 | 1,150,000 | 1,268,545 |
| Industrial development revenue: 0.19% | | | | | |
| Farmington NM PCR | | 1.80 | 4-1-2029 | 2,540,000 | 2,126,026 |
| Miscellaneous revenue: 0.99% | | | | | |
| Clayton NM Jail Project Improvement & Refunding Bond (NPFGC Insured) | | 5.00 | 11-1-2028 | 9,265,000 | 9,593,526 |
| Clayton NM Jail Project Improvement & Refunding Bond (NPFGC Insured) | | 5.00 | 11-1-2029 | 1,000,000 | 1,034,176 |
| | | | | | 10,627,702 |
| | | | | | 14,022,273 |
| New York: 8.82% | | | | | |
| Airport revenue: 0.50% | | | | | |
| New York Transportation Development Corporation Special Facilities Revenue Terminal 4 John F Kennedy International Airport Project Series 2020C | | 5.00 | 12-1-2035 | 1,000,000 | 1,054,071 |
The accompanying notes are an integral part of these financial statements.
26 | Allspring Intermediate Tax/AMT-Free Fund
Portfolio of investments—December 31, 2022 (unaudited)
| | | Interest
rate | Maturity
date | Principal | Value |
| Airport revenue (continued) | | | | | |
| New York Transportation Development Corporation Special Facilities Revenue Terminal 4 John F. Kennedy International Airport Project Series 2020C | | 5.00% | 12-1-2029 | $ 1,160,000 | $ 1,247,987 |
| New York Transportation Development Corporation Special Facilities Revenue Terminal 4 John F. Kennedy International Airport Project Series 2020C | | 5.00 | 12-1-2038 | 3,000,000 | 3,117,176 |
| | | | | | 5,419,234 |
| Education revenue: 1.80% | | | | | |
| Dutchess County NY Local Development Corporation The Culinary Institute of America Project Series A-1 | | 5.00 | 7-1-2027 | 335,000 | 347,925 |
| Hempstead NY Local Development Corporation The Academy Charter School Project Series A | | 4.45 | 2-1-2041 | 5,500,000 | 4,310,990 |
| Hempstead NY Local Development Corporation The Academy Charter School Project Series A | | 5.53 | 2-1-2040 | 2,725,000 | 2,622,957 |
| Hempstead NY Local Development Corporation The Academy Charter School Project Series A | | 5.89 | 2-1-2032 | 2,745,000 | 2,797,492 |
| Hempstead NY Local Development Corporation The Academy Charter School Project Series A | | 6.24 | 2-1-2047 | 1,750,000 | 1,787,021 |
| Hempstead NY Local Development Corporation The Academy Charter School Project Series B | | 5.57 | 2-1-2041 | 4,140,000 | 3,984,729 |
| Monroe County NY Industrial Development Monroe Community College Project Series A (AGM Insured) | | 5.00 | 1-15-2023 | 645,000 | 645,374 |
| Monroe County NY Industrial Development Monroe Community College Project Series A (AGM Insured) | | 5.00 | 1-15-2024 | 905,000 | 924,314 |
| Westchester County NY Local Development Pace University Series B ø | | 4.32 | 5-1-2044 | 1,910,000 | 1,910,000 |
| | | | | | 19,330,802 |
| GO revenue: 0.44% | | | | | |
| New York Fiscal Subordinate Bond Series 2017A-6 (JPMorgan Chase & Company SPA) ø | | 3.60 | 8-1-2044 | 480,000 | 480,000 |
| New York NY Subordinated Series D1 | | 5.25 | 5-1-2040 | 1,500,000 | 1,674,898 |
| Yonkers NY Series C (AGM Insured) | | 5.00 | 3-15-2035 | 1,000,000 | 1,121,158 |
| Yonkers NY Series F (BAM Insured) | | 5.00 | 11-15-2035 | 425,000 | 475,720 |
| Yonkers NY Series F (BAM Insured) | | 5.00 | 11-15-2036 | 450,000 | 499,790 |
| Yonkers NY Series F (BAM Insured) | | 5.00 | 11-15-2037 | 425,000 | 468,766 |
| | | | | | 4,720,332 |
| Industrial development revenue: 0.08% | | | | | |
| New York Liberty Development Corporation Refunding Bonds 4 World Trade Center Project | | 2.80 | 9-15-2069 | 1,000,000 | 894,848 |
| Miscellaneous revenue: 0.47% | | | | | |
| New York Dormitory Authority Series D | | 5.00 | 10-1-2031 | 2,005,000 | 2,232,591 |
| New York NY Transitional Finance Authority Building Aid Bond Series S-1 | | 5.00 | 7-15-2032 | 2,530,000 | 2,760,816 |
| | | | | | 4,993,407 |
| Tax revenue: 2.12% | | | | | |
| New York Convention Center Development Corporation | | 5.00 | 11-15-2028 | 8,000,000 | 8,387,316 |
| New York Dormitory Authority Series A | | 5.00 | 2-15-2031 | 3,000,000 | 3,218,440 |
| New York Dormitory Authority Series D | | 4.00 | 2-15-2039 | 5,000,000 | 4,874,393 |
| New York Metropolitan Transportation Authority Dedicated Tax Fund Refunding Bond Series 2016A | | 5.25 | 11-15-2034 | 2,000,000 | 2,158,635 |
The accompanying notes are an integral part of these financial statements.
Allspring Intermediate Tax/AMT-Free Fund | 27
Portfolio of investments—December 31, 2022 (unaudited)
| | | Interest
rate | Maturity
date | Principal | Value |
| Tax revenue (continued) | | | | | |
| New York NY Transitional Finance Authority Series B | | 5.00% | 8-1-2027 | $ 1,145,000 | $ 1,181,339 |
| New York Urban Development Corporation Personal Income Tax Series C | | 4.00 | 3-15-2037 | 3,000,000 | 2,973,748 |
| | | | | | 22,793,871 |
| Transportation revenue: 3.34% | | | | | |
| Metropolitan Transportation Authority New York Transportation Series B | | 5.25 | 11-15-2037 | 1,000,000 | 1,009,398 |
| New York Metropolitan Transportation Authority Refunding Bond Series B | | 5.00 | 11-15-2033 | 2,175,000 | 2,228,146 |
| New York Metropolitan Transportation Authority Refunding Bond Series D | | 5.00 | 11-15-2031 | 3,415,000 | 3,513,141 |
| New York Metropolitan Transportation Authority Refunding Bond Subordinated Series C1 | | 5.25 | 11-15-2031 | 11,540,000 | 11,848,768 |
| New York Metropolitan Transportation Authority Refunding Bond Subordinated Series D1 | | 5.00 | 11-15-2030 | 2,010,000 | 2,049,282 |
| New York Metropolitan Transportation Authority Refunding Green Bonds and Climate Bond | | 5.00 | 11-15-2027 | 12,640,000 | 13,199,925 |
| New York Metropolitan Transportation Authority Refunding Green Bonds Series D1 | | 5.00 | 11-15-2034 | 2,000,000 | 2,049,644 |
| | | | | | 35,898,304 |
| Water & sewer revenue: 0.07% | | | | | |
| Western Nassau NY Water Authority Series A | | 5.00 | 4-1-2027 | 385,000 | 403,051 |
| Western Nassau NY Water Authority Series A | | 5.00 | 4-1-2028 | 300,000 | 313,600 |
| | | | | | 716,651 |
| | | | | | 94,767,449 |
| Ohio: 1.74% | | | | | |
| Education revenue: 0.57% | | | | | |
| Northeast Ohio Medical University General Receipts Bonds (BAM Insured) | | 5.00 | 12-1-2032 | 315,000 | 354,715 |
| Northeast Ohio Medical University General Receipts Bonds (BAM Insured) | | 5.00 | 12-1-2033 | 890,000 | 989,426 |
| Northeast Ohio Medical University General Receipts Bonds (BAM Insured) | | 5.00 | 12-1-2036 | 1,025,000 | 1,098,035 |
| Northeast Ohio Medical University General Receipts Bonds (BAM Insured) | | 5.00 | 12-1-2038 | 1,070,000 | 1,130,843 |
| Northeast Ohio Medical University General Receipts Bonds (BAM Insured) | | 5.00 | 12-1-2040 | 1,260,000 | 1,318,526 |
| Ohio HEFAR Xavier University Project | | 5.00 | 5-1-2029 | 1,080,000 | 1,193,168 |
| | | | | | 6,084,713 |
| Health revenue: 0.11% | | | | | |
| Hamilton OH Hospital Facilities UC Health | | 5.00 | 9-15-2035 | 1,100,000 | 1,167,710 |
| Miscellaneous revenue: 0.28% | | | | | |
| Clermont County OH Port Authority West Clermont Local School District Project (BAM Insured) | | 5.00 | 12-1-2025 | 500,000 | 531,139 |
| Clermont County OH Port Authority West Clermont Local School District Project (BAM Insured) | | 5.00 | 12-1-2026 | 600,000 | 636,330 |
The accompanying notes are an integral part of these financial statements.
28 | Allspring Intermediate Tax/AMT-Free Fund
Portfolio of investments—December 31, 2022 (unaudited)
| | | Interest
rate | Maturity
date | Principal | Value |
| Miscellaneous revenue (continued) | | | | | |
| Clermont County OH Port Authority West Clermont Local School District Project (BAM Insured) | | 5.00% | 12-1-2028 | $ 1,250,000 | $ 1,323,534 |
| RiverSouth OH Lazarus Building Redevelopment Series A | | 5.75 | 12-1-2027 | 550,000 | 548,806 |
| | | | | | 3,039,809 |
| Tobacco revenue: 0.18% | | | | | |
| Buckeye Tobacco Settlement Financing Authority Refunding Bond | | 4.00 | 6-1-2038 | 2,100,000 | 1,976,130 |
| Utilities revenue: 0.60% | | | | | |
| Cleveland OH Public Power System Refunding Bond (AGM Insured) | | 5.00 | 11-15-2033 | 625,000 | 681,507 |
| Hamilton OH Electric System Improvement & Refunding Bond (BAM Insured) | | 4.00 | 10-1-2034 | 710,000 | 740,341 |
| Hamilton OH Electric System Improvement & Refunding Bond (BAM Insured) | | 4.00 | 10-1-2035 | 1,000,000 | 1,036,129 |
| Lancaster OH Port Authority Gas Supply Series A (Royal Bank of Canada LIQ) | | 5.00 | 8-1-2049 | 3,000,000 | 3,050,897 |
| Ohio Air Quality Development Authority Ohio Valley Electric Corporation Project Series 2019A | | 3.25 | 9-1-2029 | 1,000,000 | 916,737 |
| | | | | | 6,425,611 |
| | | | | | 18,693,973 |
| Oklahoma: 3.54% | | | | | |
| Education revenue: 0.07% | | | | | |
| Oklahoma Agricultural and Mechanical Colleges Refunding Bond Series A | | 4.00 | 9-1-2036 | 750,000 | 756,715 |
| Miscellaneous revenue: 3.21% | | | | | |
| Cache OK Educational Facilities Authority Cache Public Schools Project Series A | | 5.00 | 9-1-2025 | 3,055,000 | 3,213,533 |
| Canadian County OK Education Facilities Authority Mustang Public Schools Project | | 5.00 | 9-1-2027 | 2,000,000 | 2,146,575 |
| Canadian County OK Education Facilities Authority Mustang Public Schools Project | | 5.00 | 9-1-2028 | 2,180,000 | 2,335,848 |
| Carter County OK Public Facilities Authority Educational Facilities Plainview Public School Project | | 5.00 | 12-1-2026 | 1,000,000 | 1,073,767 |
| Carter County OK Public Facilities Authority Educational Facilities Plainview Public School Project | | 5.00 | 12-1-2027 | 1,000,000 | 1,078,364 |
| Carter County OK Public Facilities Authority Educational Facilities Plainview Public School Project | | 5.00 | 12-1-2028 | 1,285,000 | 1,382,740 |
| Cleveland County OK Educational Facilities Authority Noble Public Schools Project | | 5.00 | 9-1-2027 | 700,000 | 763,265 |
| Cleveland County OK Educational Facilities Authority Noble Public Schools Project | | 5.00 | 9-1-2028 | 400,000 | 436,072 |
| Cleveland County OK Educational Facilities Authority Noble Public Schools Project | | 5.00 | 9-1-2029 | 250,000 | 272,472 |
| Cleveland County OK Educational Facilities Authority Noble Public Schools Project | | 5.00 | 9-1-2031 | 675,000 | 736,151 |
| Comanche County OK Educational Facilities Authority Elgin Public Schools Project Series A | | 5.00 | 12-1-2032 | 1,600,000 | 1,755,416 |
| Dewey County OK Educational Facilities Authority Seiling Public Schools Project | | 5.00 | 9-1-2026 | 1,230,000 | 1,321,472 |
The accompanying notes are an integral part of these financial statements.
Allspring Intermediate Tax/AMT-Free Fund | 29
Portfolio of investments—December 31, 2022 (unaudited)
| | | Interest
rate | Maturity
date | Principal | Value |
| Miscellaneous revenue (continued) | | | | | |
| Dewey County OK Educational Facilities Authority Seiling Public Schools Project | | 5.00% | 9-1-2027 | $ 1,240,000 | $ 1,332,216 |
| Garvin County OK Educational Facilities Authority Lindsay Public Schools Project | | 5.00 | 9-1-2026 | 1,000,000 | 1,053,467 |
| Garvin County OK Educational Facilities Authority Lindsay Public Schools Project | | 5.00 | 9-1-2027 | 1,245,000 | 1,310,586 |
| Grady County OK Educational Facilities Tuttle Public Schools Project | | 5.00 | 9-1-2025 | 500,000 | 526,733 |
| Grady County OK Educational Facilities Tuttle Public Schools Project | | 5.00 | 9-1-2028 | 1,160,000 | 1,219,588 |
| Muskogee OK Industrial Trust Educational Facilities Lease Muskogee Public Schools Project | | 4.00 | 9-1-2029 | 3,000,000 | 3,097,922 |
| Muskogee OK Industrial Trust Educational Facilities Lease Muskogee Public Schools Project | | 4.00 | 9-1-2032 | 3,000,000 | 3,072,460 |
| Oklahoma Development Finance Authority State System of Higher Education Series B | | 5.00 | 6-1-2030 | 500,000 | 558,321 |
| Oklahoma Development Finance Authority State System of Higher Education Series B | | 5.00 | 6-1-2031 | 520,000 | 579,380 |
| Oklahoma Development Finance Authority State System of Higher Education Series B | | 5.00 | 6-1-2032 | 550,000 | 610,474 |
| Pontotoc County OK Educational Facilities Authority Ada Public Schools Project | | 4.00 | 9-1-2032 | 450,000 | 466,382 |
| Pontotoc County OK Educational Facilities Authority Ada Public Schools Project | | 4.00 | 9-1-2033 | 800,000 | 822,253 |
| Pontotoc County OK Educational Facilities Authority Ada Public Schools Project | | 4.00 | 9-1-2034 | 625,000 | 635,696 |
| Pontotoc County OK Educational Facilities Authority Ada Public Schools Project | | 4.00 | 9-1-2035 | 810,000 | 813,808 |
| Pontotoc County OK Educational Facilities Authority Ada Public Schools Project | | 4.00 | 9-1-2036 | 1,000,000 | 993,027 |
| Tulsa County OK Industrial Authority Educational Facilities Glenpool Public Schools Project Series A | | 5.00 | 9-1-2025 | 880,000 | 928,669 |
| | | | | | 34,536,657 |
| Tax revenue: 0.24% | | | | | |
| Oklahoma City OK Public Property Authority | | 5.00 | 10-1-2027 | 1,140,000 | 1,204,515 |
| Oklahoma City OK Public Property Authority | | 5.00 | 10-1-2028 | 1,265,000 | 1,336,246 |
| | | | | | 2,540,761 |
| Water & sewer revenue: 0.02% | | | | | |
| McGee Creek Oklahoma Authority (NPFGC Insured) | | 6.00 | 1-1-2023 | 250,000 | 250,000 |
| | | | | | 38,084,133 |
| Oregon: 0.51% | | | | | |
| Airport revenue: 0.22% | | | | | |
| Portland International Airport Refunding Bond Series 26A | | 4.00 | 7-1-2037 | 565,000 | 561,841 |
| Portland International Airport Refunding Bond Series 26A | | 5.00 | 7-1-2033 | 400,000 | 446,668 |
| Portland International Airport Refunding Bond Series 26B | | 5.00 | 7-1-2033 | 530,000 | 591,835 |
| Portland International Airport Refunding Bond Series 26B | | 5.00 | 7-1-2037 | 705,000 | 756,315 |
| | | | | | 2,356,659 |
The accompanying notes are an integral part of these financial statements.
30 | Allspring Intermediate Tax/AMT-Free Fund
Portfolio of investments—December 31, 2022 (unaudited)
| | | Interest
rate | Maturity
date | Principal | Value |
| Health revenue: 0.29% | | | | | |
| Oregon Facilities Authority Asante Project Series A | | 5.00% | 8-15-2037 | $ 1,400,000 | $ 1,498,514 |
| Oregon Facilities Authority Samaritan Health Services Project Series A | | 5.00 | 10-1-2026 | 1,500,000 | 1,584,413 |
| | | | | | 3,082,927 |
| | | | | | 5,439,586 |
| Pennsylvania: 11.42% | | | | | |
| Airport revenue: 0.08% | | | | | |
| Philadelphia PA Airport Refunding Bond Series A | | 5.00 | 7-1-2028 | 315,000 | 341,231 |
| Philadelphia PA Airport Refunding Bond Series A | | 5.00 | 7-1-2031 | 450,000 | 485,610 |
| | | | | | 826,841 |
| Education revenue: 0.66% | | | | | |
| Chester County PA IDA Collegium Charter School Project Series A | | 5.00 | 10-15-2027 | 1,500,000 | 1,501,110 |
| Northampton County PA General Purpose Authority College Refunding Bond | | 5.00 | 11-1-2027 | 1,000,000 | �� 1,098,064 |
| Northeastern Pennsylvania Hospital & Education Authority Series A | | 5.00 | 3-1-2026 | 885,000 | 916,518 |
| Northeastern Pennsylvania Hospital & Education Authority Series A | | 5.00 | 3-1-2028 | 660,000 | 680,886 |
| Philadelphia PA IDA | | 6.13 | 6-15-2023 | 200,000 | 202,230 |
| Philadelphia PA IDA | | 7.00 | 5-1-2026 | 610,000 | 610,867 |
| Philadelphia PA Public School Building Authority (BAM Insured) | | 5.00 | 6-15-2026 | 2,000,000 | 2,092,730 |
| | | | | | 7,102,405 |
| GO revenue: 4.20% | | | | | |
| Allegheny County PA Moon Area School District Series A | | 5.00 | 11-15-2024 | 3,425,000 | 3,554,876 |
| Central Dauphin PA School District | | 5.00 | 2-1-2030 | 1,110,000 | 1,193,536 |
| Norristown PA Area School District Montgomery County Series 2018 (BAM Insured) | | 5.00 | 9-1-2035 | 2,035,000 | 2,179,751 |
| Philadelphia PA Refunding Bond Series A | | 5.25 | 7-15-2028 | 2,590,000 | 2,653,218 |
| Philadelphia PA Refunding Bond Series A | | 5.25 | 7-15-2029 | 4,410,000 | 4,517,641 |
| Philadelphia PA School District Refunding Bond Series F | | 5.00 | 9-1-2028 | 5,000,000 | 5,325,244 |
| Philadelphia PA School District Refunding Bond Series F | | 5.00 | 9-1-2029 | 5,000,000 | 5,318,118 |
| Philadelphia PA School District Refunding Bond Series F | | 5.00 | 9-1-2031 | 1,240,000 | 1,310,100 |
| Philadelphia PA School District Refunding Bond Series F | | 5.00 | 9-1-2032 | 1,000,000 | 1,052,656 |
| Philadelphia PA School District Series A | | 5.00 | 9-1-2032 | 2,300,000 | 2,534,173 |
| Philadelphia PA School District Series C | | 5.00 | 9-1-2033 | 6,180,000 | 6,790,452 |
| Philadelphia PA Series A | | 5.00 | 8-1-2033 | 2,020,000 | 2,159,502 |
| Pittsburgh PA Moon Area School District Series A | | 5.00 | 11-15-2029 | 1,000,000 | 1,038,290 |
| Reading PA School District (AGM Insured) | | 5.00 | 3-1-2037 | 2,000,000 | 2,088,175 |
| Reading PA School District (AGM Insured) | | 5.00 | 3-1-2038 | 1,735,000 | 1,807,586 |
| Reading PA Series A (BAM Insured) | | 5.00 | 11-1-2026 | 1,000,000 | 1,075,284 |
| Scranton Lackawanna County PA School District Bond Series A (BAM Insured) | | 5.00 | 6-1-2037 | 500,000 | 544,062 |
| | | | | | 45,142,664 |
| Health revenue: 1.33% | | | | | |
| Allegheny County PA Hospital Development Authority University of Pittsburgh Medical Center Series A | | 4.00 | 7-15-2037 | 2,000,000 | 1,948,011 |
The accompanying notes are an integral part of these financial statements.
Allspring Intermediate Tax/AMT-Free Fund | 31
Portfolio of investments—December 31, 2022 (unaudited)
| | | Interest
rate | Maturity
date | Principal | Value |
| Health revenue (continued) | | | | | |
| Allegheny County PA Hospital Development Authority University of Pittsburgh Medical Center Series A | | 5.00% | 7-15-2025 | $ 155,000 | $ 162,369 |
| Cumberland County PA Municipal Authority Diakon Lutheran Social Ministries Project | | 5.00 | 1-1-2025 | 170,000 | 177,320 |
| Cumberland County PA Municipal Authority Diakon Lutheran Social Ministries Project | | 5.00 | 1-1-2025 | 445,000 | 464,161 |
| Cumberland County PA Municipal Authority Diakon Lutheran Social Ministries Project | | 5.00 | 1-1-2025 | 725,000 | 739,999 |
| Cumberland County PA Municipal Authority Diakon Lutheran Social Ministries Project | | 5.00 | 1-1-2026 | 155,000 | 161,674 |
| Cumberland County PA Municipal Authority Diakon Lutheran Social Ministries Project | | 5.00 | 1-1-2026 | 390,000 | 406,793 |
| Cumberland County PA Municipal Authority Diakon Lutheran Social Ministries Project | | 5.00 | 1-1-2026 | 825,000 | 841,274 |
| Cumberland County PA Municipal Authority Diakon Lutheran Social Ministries Project | | 5.00 | 1-1-2027 | 150,000 | 156,459 |
| Cumberland County PA Municipal Authority Diakon Lutheran Social Ministries Project | | 5.00 | 1-1-2027 | 365,000 | 380,716 |
| Cumberland County PA Municipal Authority Diakon Lutheran Social Ministries Project | | 5.00 | 1-1-2027 | 710,000 | 722,643 |
| Montgomery County PA HEFA Thomas Jefferson University | | 4.00 | 9-1-2037 | 1,000,000 | 965,325 |
| Pennsylvania EDFA University of Pittsburgh Medical Center Series A | | 5.00 | 4-15-2031 | 1,000,000 | 1,110,483 |
| Pennsylvania EDFA University of Pittsburgh Medical Center Series A | | 5.00 | 4-15-2034 | 1,650,000 | 1,799,478 |
| Pennsylvania EDFA University of Pittsburgh Medical Center Series A | | 5.00 | 4-15-2035 | 1,450,000 | 1,567,339 |
| Philadelphia PA Hospitals and HEFAR Temple University Health System Obligated Group (AGM Insured) | | 5.00 | 7-1-2036 | 2,505,000 | 2,706,259 |
| | | | | | 14,310,303 |
| Miscellaneous revenue: 2.44% | | | | | |
| Delaware County PA Vocational & Technical School Authority (BAM Insured) | | 5.25 | 11-1-2033 | 2,000,000 | 2,037,833 |
| Delaware Valley Regional Finance Authority Local Government Series D (TD Bank NA LOC) ø | | 3.65 | 11-1-2055 | 1,000,000 | 1,000,000 |
| Pennsylvania Certificate of Participation Municipal Real Estate Payment Series A | | 5.00 | 7-1-2028 | 435,000 | 478,346 |
| Pennsylvania Certificate of Participation Municipal Real Estate Payment Series A | | 5.00 | 7-1-2029 | 480,000 | 526,746 |
| Pennsylvania Certificate of Participation Municipal Real Estate Payment Series A | | 5.00 | 7-1-2030 | 375,000 | 412,324 |
| Pennsylvania Public School Building Authority Chester Upland School District Project Series B | | 5.25 | 9-15-2030 | 1,990,000 | 2,145,099 |
| Pennsylvania Public School Building Authority Harrisburg School District Project Series A (AGM Insured) | | 5.00 | 12-1-2028 | 3,020,000 | 3,219,790 |
| Pennsylvania Public School Building Authority Harrisburg School District Project Series A (AGM Insured) | | 5.00 | 12-1-2033 | 3,505,000 | 3,667,259 |
| Pennsylvania Public School Building Authority Harrisburg School District Project Series B-2 (BAM Insured) | | 5.00 | 12-1-2025 | 340,000 | 353,497 |
| Pennsylvania Public School Building Authority Harrisburg School District Project Series B-2 (BAM Insured) | | 5.00 | 12-1-2026 | 645,000 | 670,482 |
| Pennsylvania Public School Building Authority Harrisburg School District Project Series B-2 (BAM Insured) | | 5.00 | 12-1-2027 | 360,000 | 373,746 |
The accompanying notes are an integral part of these financial statements.
32 | Allspring Intermediate Tax/AMT-Free Fund
Portfolio of investments—December 31, 2022 (unaudited)
| | | Interest
rate | Maturity
date | Principal | Value |
| Miscellaneous revenue (continued) | | | | | |
| Pennsylvania Public School Building Authority School District of Philadelphia Project Series B (AGM Insured) | | 5.00% | 6-1-2029 | $ 2,000,000 | $ 2,225,505 |
| Philadelphia PA Municipal Authority Juvenile Justice Services Center | | 5.00 | 4-1-2031 | 3,630,000 | 3,935,160 |
| Philadelphia PA Municipal Authority Juvenile Justice Services Center | | 5.00 | 4-1-2034 | 1,800,000 | 1,948,272 |
| State Public School Building Authority Pennsylvania Philadelphia School District Project Series A | | 5.00 | 6-1-2034 | 1,750,000 | 1,821,317 |
| York County PA School of Technology Authority Series B (BAM Insured) | | 5.00 | 2-15-2027 | 800,000 | 824,547 |
| York County PA School of Technology Authority Series B (BAM Insured) | | 5.00 | 2-15-2029 | 500,000 | 514,943 |
| | | | | | 26,154,866 |
| Tax revenue: 0.21% | | | | | |
| Allentown PA Neighborhood Improvement Zone Development Authority Tax Revenue Refunding Bonds | | 5.00 | 5-1-2033 | 700,000 | 728,267 |
| Allentown PA Neighborhood Improvement Zone Development Authority Tax Revenue Refunding Bonds | | 5.00 | 5-1-2034 | 750,000 | 775,383 |
| Allentown PA Neighborhood Improvement Zone Development Authority Tax Revenue Refunding Bonds | | 5.00 | 5-1-2035 | 750,000 | 768,794 |
| | | | | | 2,272,444 |
| Tobacco revenue: 0.51% | | | | | |
| Commonwealth Financing Authority Tobacco Master Settlement Payment | | 5.00 | 6-1-2027 | 2,500,000 | 2,690,105 |
| Commonwealth Financing Authority Tobacco Master Settlement Payment | | 5.00 | 6-1-2028 | 2,500,000 | 2,727,757 |
| | | | | | 5,417,862 |
| Transportation revenue: 1.40% | | | | | |
| Pennsylvania Turnpike Commission Refunding Bond | | 5.00 | 6-1-2027 | 1,000,000 | 1,094,581 |
| Pennsylvania Turnpike Commission Refunding Bond (AGM Insured) | | 6.00 | 12-1-2030 | 4,220,000 | 4,854,185 |
| Pennsylvania Turnpike Commission Subordinate Bond Series B | | 5.00 | 6-1-2031 | 5,000,000 | 5,363,794 |
| Pennsylvania Turnpike Commission Subordinate Bond Series C (AGM Insured) | | 6.25 | 6-1-2033 | 1,350,000 | 1,505,042 |
| Pennsylvania Turnpike Commission Subordinate Bond Series E | | 6.38 | 12-1-2038 | 2,000,000 | 2,259,196 |
| | | | | | 15,076,798 |
| Water & sewer revenue: 0.59% | | | | | |
| Pennsylvania Capital Region Water System Series of 2017 | | 5.00 | 7-15-2030 | 1,180,000 | 1,285,699 |
| Pennsylvania Capital Region Water System Series of 2018 | | 5.00 | 7-15-2030 | 1,500,000 | 1,653,686 |
| Philadelphia PA Water and Wastewater Bond Series B | | 5.00 | 11-1-2033 | 1,760,000 | 1,918,471 |
| Pittsburgh PA Water and Sewer Authority First Lien Series B (AGM Insured) | | 5.00 | 9-1-2031 | 670,000 | 760,775 |
| Pittsburgh PA Water and Sewer Authority First Lien Series B (AGM Insured) | | 5.00 | 9-1-2033 | 675,000 | 759,224 |
| | | | | | 6,377,855 |
| | | | | | 122,682,038 |
The accompanying notes are an integral part of these financial statements.
Allspring Intermediate Tax/AMT-Free Fund | 33
Portfolio of investments—December 31, 2022 (unaudited)
| | | Interest
rate | Maturity
date | Principal | Value |
| South Carolina: 1.71% | | | | | |
| Education revenue: 0.57% | | | | | |
| South Carolina Jobs EDA Furman University Project | | 5.00% | 10-1-2028 | $ 700,000 | $ 732,446 |
| South Carolina Jobs EDA Furman University Project | | 5.00 | 10-1-2030 | 1,885,000 | 1,967,834 |
| South Carolina Jobs EDA Furman University Project | | 5.00 | 10-1-2031 | 2,155,000 | 2,247,397 |
| South Carolina Jobs EDA York Preparatory Academy Project Series A 144A | | 7.00 | 11-1-2033 | 1,090,000 | 1,166,999 |
| | | | | | 6,114,676 |
| Health revenue: 0.03% | | | | | |
| South Carolina Jobs EDA Prisma Health Obligated Group Series C ø | | 4.20 | 5-1-2048 | 275,000 | 275,000 |
| Miscellaneous revenue: 0.10% | | | | | |
| Laurens County SC Education Assistance for District #55 | | 5.00 | 12-1-2025 | 1,000,000 | 1,055,105 |
| Utilities revenue: 1.01% | | | | | |
| South Carolina St Public Service Authority Revenue Improvement Series E (AGM Insured) | | 5.25 | 12-1-2036 | 6,385,000 | 7,089,498 |
| South Carolina St Public Service Authority Revenue Improvement Series E (AGM Insured) | | 5.25 | 12-1-2037 | 3,445,000 | 3,787,974 |
| | | | | | 10,877,472 |
| | | | | | 18,322,253 |
| Tennessee: 0.95% | | | | | |
| Airport revenue: 0.25% | | | | | |
| Metropolitan Nashville Airport Authority Tennessee Airport Revenue Improvement Series A | | 5.25 | 7-1-2047 | 2,500,000 | 2,668,595 |
| Housing revenue: 0.16% | | | | | |
| Chattanooga TN Health Educational & Housing Facilities University of Tennessee at Chattanooga Project | | 5.00 | 10-1-2023 | 750,000 | 754,452 |
| Chattanooga TN Health Educational & Housing Facilities University of Tennessee at Chattanooga Project | | 5.00 | 10-1-2028 | 1,000,000 | 1,007,050 |
| | | | | | 1,761,502 |
| Utilities revenue: 0.54% | | | | | |
| Tennergy Corporation Tennessee Gas Supply Series A | | 5.50 | 10-1-2053 | 3,000,000 | 3,173,669 |
| Tennessee Energy Acquisition Corporation Series A | | 5.00 | 5-1-2052 | 2,500,000 | 2,587,436 |
| | | | | | 5,761,105 |
| | | | | | 10,191,202 |
| Texas: 6.11% | | | | | |
| Airport revenue: 0.75% | | | | | |
| Dallas & Fort Worth TX International Airport Refunding Bond Series A | | 4.00 | 11-1-2034 | 2,500,000 | 2,562,707 |
| Houston TX Airport System Subordinate Lien Refunding Bond Series D | | 5.00 | 7-1-2033 | 3,010,000 | 3,299,316 |
| Houston TX Airport System Subordinate Lien Refunding Bond Series D | | 5.00 | 7-1-2035 | 2,000,000 | 2,160,830 |
| | | | | | 8,022,853 |
The accompanying notes are an integral part of these financial statements.
34 | Allspring Intermediate Tax/AMT-Free Fund
Portfolio of investments—December 31, 2022 (unaudited)
| | | Interest
rate | Maturity
date | Principal | Value |
| GO revenue: 2.30% | | | | | |
| Austin TX Public Improvement Bond | | 5.00% | 9-1-2030 | $ 960,000 | $ 1,057,887 |
| Bexar County TX Hospital District Refunding Bond | | 5.00 | 2-15-2037 | 1,250,000 | 1,342,420 |
| Crane County TX Water District Unlimited Tax Bond | | 5.00 | 2-15-2026 | 1,000,000 | 1,046,271 |
| Crane County TX Water District Unlimited Tax Bond | | 5.00 | 2-15-2030 | 1,130,000 | 1,182,857 |
| Crane County TX Water District Unlimited Tax Bond | | 5.00 | 2-15-2031 | 1,000,000 | 1,046,776 |
| Denton County TX Permanent Improvement & Refunding Bond | | 5.00 | 7-15-2030 | 1,000,000 | 1,033,551 |
| Eagle Pass TX Certificate of Participation (AGM Insured) | | 4.00 | 3-1-2037 | 695,000 | 709,199 |
| El Paso County TX Hospital District | | 5.00 | 8-15-2028 | 2,045,000 | 2,063,584 |
| El Paso County TX Refunding Bond Series A | | 5.00 | 2-15-2031 | 2,000,000 | 2,131,233 |
| El Paso County TX Refunding Bond Series A | | 5.00 | 2-15-2032 | 2,120,000 | 2,256,551 |
| Fort Bend County TX Municipal District Utility # 182 Unlimited Tax Road Bonds Series 2022 (BAM Insured) | | 5.25 | 9-1-2030 | 1,185,000 | 1,321,474 |
| Plano TX GO | | 5.00 | 9-1-2030 | 2,155,000 | 2,348,869 |
| San Antonio TX Certificate of Obligation | | 5.00 | 8-1-2036 | 3,990,000 | 4,381,374 |
| San Antonio TX Independent School District Unlimited Tax | | 5.00 | 8-15-2037 | 2,000,000 | 2,097,337 |
| Viridian TX Municipal Management District Unlimited Road Improvement Bond (BAM Insured) | | 4.00 | 12-1-2030 | 710,000 | 719,293 |
| | | | | | 24,738,676 |
| Miscellaneous revenue: 0.54% | | | | | |
| Austin TX Community College District Public Facility Corporation Series 2018C | | 5.00 | 8-1-2029 | 400,000 | 436,625 |
| Austin TX Community College District Public Facility Corporation Series 2018C | | 5.00 | 8-1-2030 | 500,000 | 544,963 |
| Lower Colorado River TX Authority Refunding Bond | | 5.50 | 5-15-2031 | 2,500,000 | 2,518,512 |
| Nueces River TX Water Supply Facility Corpus Christi Lake Texana Project | | 5.00 | 7-15-2026 | 1,000,000 | 1,053,292 |
| Nueces River TX Water Supply Facility Corpus Christi Lake Texana Project | | 5.00 | 7-15-2027 | 1,250,000 | 1,316,107 |
| | | | | | 5,869,499 |
| Tax revenue: 0.78% | | | | | |
| Houston TX Old Spanish Trail Almeda Corridors RDA (BAM Insured) | | 4.00 | 9-1-2031 | 1,540,000 | 1,618,352 |
| Texas Midtown RDA Refunding Bond (BAM Insured) | | 5.25 | 1-1-2027 | 1,880,000 | 1,880,000 |
| Texas Midtown RDA Refunding Bond (BAM Insured) | | 5.25 | 1-1-2029 | 2,390,000 | 2,390,000 |
| Texas Midtown RDA Refunding Bond (BAM Insured) | | 5.25 | 1-1-2030 | 1,500,000 | 1,500,000 |
| Texas Midtown RDA Refunding Bond (BAM Insured) | | 5.25 | 1-1-2031 | 1,000,000 | 1,000,000 |
| | | | | | 8,388,352 |
| Transportation revenue: 0.73% | | | | | |
| Texas Grand Parkway Transportation Corporation System Series A | | 5.00 | 10-1-2034 | 1,500,000 | 1,633,914 |
| Texas Private Activity Bond Surface Transportation Corporation Senior Lien Series 2019A | | 5.00 | 12-31-2035 | 3,000,000 | 3,105,812 |
| Texas Private Activity Bond Surface Transportation Corporation Senior Lien Series 2019A | | 5.00 | 12-31-2036 | 3,015,000 | 3,107,718 |
| | | | | | 7,847,444 |
| Utilities revenue: 0.73% | | | | | |
| Austin TX Refunding Bond (NPFGC Insured) | | 5.25 | 5-15-2025 | 895,000 | 923,695 |
| Brownsville TX Utilities System Refunding Bond | | 5.00 | 9-1-2026 | 2,190,000 | 2,309,406 |
| Brownsville TX Utilities System Refunding Bond | | 5.00 | 9-1-2029 | 1,500,000 | 1,577,176 |
The accompanying notes are an integral part of these financial statements.
Allspring Intermediate Tax/AMT-Free Fund | 35
Portfolio of investments—December 31, 2022 (unaudited)
| | | Interest
rate | Maturity
date | Principal | Value |
| Utilities revenue (continued) | | | | | |
| Brownsville TX Utilities System Refunding Bond | | 5.00% | 9-1-2030 | $ 2,500,000 | $ 2,627,560 |
| Weatherford TX Utility System Refunding & Improvement Bond (AGM Insured) | | 5.00 | 9-1-2026 | 375,000 | 394,462 |
| | | | | | 7,832,299 |
| Water & sewer revenue: 0.28% | | | | | |
| Amarillo TX Waterworks and Sewer System Bond Series B | | 5.00 | 4-1-2028 | 645,000 | 716,583 |
| North Harris County TX Regional Water Authority Senior Lien (BAM Insured) | | 5.00 | 12-15-2029 | 1,215,000 | 1,215,890 |
| Tarrant TX Water Project Refunding Bond | | 4.00 | 2-1-2027 | 1,000,000 | 1,038,800 |
| | | | | | 2,971,273 |
| | | | | | 65,670,396 |
| Utah: 0.40% | | | | | |
| Education revenue: 0.08% | | | | | |
| Utah Charter School Finance Authority Refunding Bond 144A | | 4.50 | 6-15-2027 | 885,000 | 862,027 |
| Miscellaneous revenue: 0.32% | | | | | |
| West Valley UT Municipal Building Authority (AGM Insured) | | 5.00 | 2-1-2028 | 1,000,000 | 1,073,115 |
| West Valley UT Municipal Building Authority (AGM Insured) | | 5.00 | 2-1-2032 | 1,555,000 | 1,657,639 |
| West Valley UT Municipal Building Authority (AGM Insured) | | 5.00 | 2-1-2033 | 645,000 | 685,800 |
| | | | | | 3,416,554 |
| | | | | | 4,278,581 |
| Virginia: 0.57% | | | | | |
| Health revenue: 0.40% | | | | | |
| Mizuho Floater/Residual Trust Tender Option Bond Series 2020- MIZ9025 (Mizuho Capital Markets LLC LOC, Mizuho Capital Markets LLC LIQ) 144Aø | | 3.72 | 11-1-2035 | 4,300,000 | 4,300,000 |
| Tax revenue: 0.17% | | | | | |
| Greater Richmond Virginia Convention Center | | 5.00 | 6-15-2025 | 1,000,000 | 1,051,925 |
| Marquis VA CDA CAB Series C ¤ | | 0.00 | 9-1-2041 | 1,772,000 | 84,656 |
| Marquis VA CDA CCAB Series 2015 144Aøø | | 0.00 | 9-1-2045 | 386,000 | 172,143 |
| Marquis VA CDA Series B | | 5.63 | 9-1-2041 | 1,274,000 | 563,938 |
| | | | | | 1,872,662 |
| | | | | | 6,172,662 |
| Washington: 4.43% | | | | | |
| Education revenue: 0.10% | | | | | |
| Washington EDFA | | 5.00 | 6-1-2028 | 1,000,000 | 1,026,518 |
| GO revenue: 1.86% | | | | | |
| King County WA Public Hospital District #1 Valley Medical Center Refunding Bond | | 5.00 | 12-1-2026 | 775,000 | 834,543 |
| King County WA Public Hospital District #1 Valley Medical Center Refunding Bond | | 5.00 | 12-1-2029 | 1,600,000 | 1,707,669 |
| King County WA Public Hospital District #1 Valley Medical Center Refunding Bond | | 5.00 | 12-1-2031 | 6,665,000 | 7,055,624 |
The accompanying notes are an integral part of these financial statements.
36 | Allspring Intermediate Tax/AMT-Free Fund
Portfolio of investments—December 31, 2022 (unaudited)
| | | Interest
rate | Maturity
date | Principal | Value |
| GO revenue (continued) | | | | | |
| King County WA Public Hospital District #1 Valley Medical Center Refunding Bond | | 5.00% | 12-1-2032 | $ 2,905,000 | $ 3,056,766 |
| King County WA Public Hospital District #1 Valley Medical Center Refunding Bond | | 5.00 | 12-1-2033 | 7,045,000 | 7,392,059 |
| | | | | | 20,046,661 |
| Health revenue: 0.24% | | | | | |
| Washington HCFR Fred Hutchinson Cancer Research Center | | 5.00 | 1-1-2027 | 1,050,000 | 1,109,727 |
| Washington HCFR Fred Hutchinson Cancer Research Center | | 5.00 | 1-1-2028 | 1,350,000 | 1,426,792 |
| | | | | | 2,536,519 |
| Housing revenue: 1.34% | | | | | |
| King County WA Housing Authority Refunding Bond | | 4.00 | 6-1-2026 | 560,000 | 574,297 |
| King County WA Housing Authority Refunding Bond | | 4.00 | 12-1-2026 | 430,000 | 441,649 |
| King County WA Housing Authority Refunding Bond | | 4.00 | 6-1-2027 | 590,000 | 606,587 |
| King County WA Housing Authority Refunding Bond | | 4.00 | 12-1-2027 | 400,000 | 412,362 |
| King County WA Housing Authority Refunding Bond | | 4.00 | 6-1-2028 | 360,000 | 371,228 |
| King County WA Housing Authority Refunding Bond | | 4.00 | 12-1-2028 | 375,000 | 387,641 |
| King County WA Housing Authority Refunding Bond | | 4.00 | 12-1-2029 | 960,000 | 993,787 |
| King County WA Housing Authority Refunding Bond | | 4.00 | 12-1-2030 | 575,000 | 591,465 |
| King County WA Housing Authority Refunding Bond | | 4.00 | 12-1-2031 | 450,000 | 461,868 |
| Snohomish County WA Housing Authority Carvel Apartments Project | | 5.00 | 4-1-2032 | 1,955,000 | 2,126,230 |
| Snohomish County WA Housing Authority Carvel Apartments Project | | 5.00 | 4-1-2033 | 1,550,000 | 1,677,412 |
| Snohomish County WA Housing Authority Carvel Apartments Project | | 5.00 | 4-1-2034 | 655,000 | 706,198 |
| Washington Housing Finance Commission Downtowner Apartments Project (FHLMC LIQ) | | 3.70 | 7-1-2030 | 5,000,000 | 5,016,869 |
| | | | | | 14,367,593 |
| Miscellaneous revenue: 0.42% | | | | | |
| Washington Certificate of Participation Series B | | 5.00 | 7-1-2037 | 1,585,000 | 1,719,944 |
| Washington Office Building Refunding Bond | | 5.00 | 7-1-2026 | 2,750,000 | 2,828,997 |
| | | | | | 4,548,941 |
| Resource recovery revenue: 0.47% | | | | | |
| Seattle WA Solid Waste System Improvement & Refunding Bond | | 4.00 | 6-1-2033 | 1,175,000 | 1,213,576 |
| Tacoma WA Solid Waste Refunding Bond Series B | | 5.00 | 12-1-2027 | 620,000 | 662,518 |
| Tacoma WA Solid Waste Refunding Bond Series B | | 5.00 | 12-1-2028 | 1,455,000 | 1,551,366 |
| Tacoma WA Solid Waste Refunding Bond Series B | | 5.00 | 12-1-2029 | 1,525,000 | 1,622,434 |
| | | | | | 5,049,894 |
| | | | | | 47,576,126 |
The accompanying notes are an integral part of these financial statements.
Allspring Intermediate Tax/AMT-Free Fund | 37
Portfolio of investments—December 31, 2022 (unaudited)
| | | Interest
rate | Maturity
date | Principal | Value |
| West Virginia: 0.60% | | | | | |
| Health revenue: 0.13% | | | | | |
| West Virginia Hospital Finance Authority West Virginia University Health System Series A | | 5.00% | 6-1-2031 | $ 375,000 | $ 394,403 |
| West Virginia Hospital Finance Authority West Virginia University Health System Series A | | 5.00 | 6-1-2032 | 980,000 | 1,027,093 |
| | | | | | 1,421,496 |
| Miscellaneous revenue: 0.47% | | | | | |
| West Virginia EDA Excess Lottery Series A | | 5.00 | 7-1-2038 | 2,980,000 | 3,220,264 |
| West Virginia School Building Authority Capital Improvement Bond Series A | | 5.00 | 7-1-2029 | 1,755,000 | 1,842,692 |
| | | | | | 5,062,956 |
| | | | | | 6,484,452 |
| Wisconsin: 1.69% | | | | | |
| Health revenue: 0.88% | | | | | |
| Wisconsin HEFA Ascension Senior Credit Group Series A | | 5.00 | 11-15-2035 | 5,000,000 | 5,183,644 |
| Wisconsin HEFA Revenue Bonds Bellin Memorial Hospital Incorporate Series A | | 5.00 | 12-1-2039 | 1,000,000 | 1,057,107 |
| Wisconsin HEFA Revenue Bonds Series 2022A ø | | 4.23 | 2-15-2053 | 1,000,000 | 1,000,000 |
| Wisconsin HEFA Series A | | 4.00 | 11-15-2039 | 2,250,000 | 2,191,653 |
| | | | | | 9,432,404 |
| Housing revenue: 0.41% | | | | | |
| Wisconsin PFA CFP3 - Eastern Michigan University Student Housing Project Series A-1 (BAM Insured) | | 5.25 | 7-1-2034 | 1,000,000 | 1,125,732 |
| Wisconsin PFA CFP3 - Eastern Michigan University Student Housing Project Series A-1 (BAM Insured) | | 5.25 | 7-1-2035 | 1,000,000 | 1,116,065 |
| Wisconsin PFA CFP3 - Eastern Michigan University Student Housing Project Series A-1 (BAM Insured) | | 5.25 | 7-1-2036 | 1,000,000 | 1,108,290 |
| Wisconsin PFA CFP3 - Eastern Michigan University Student Housing Project Series A-1 (BAM Insured) | | 5.25 | 7-1-2037 | 1,000,000 | 1,100,291 |
| | | | | | 4,450,378 |
| Miscellaneous revenue: 0.25% | | | | | |
| Appleton WI RDA Fox Cities Performing Arts Center Project Series B (Associated Bank NA LOC) ø | | 4.10 | 6-1-2036 | 1,500,000 | 1,500,000 |
| Milwaukee WI RDA Public Schools | | 5.00 | 11-15-2029 | 420,000 | 451,444 |
| Milwaukee WI RDA Public Schools | | 5.00 | 11-15-2030 | 635,000 | 681,339 |
| | | | | | 2,632,783 |
The accompanying notes are an integral part of these financial statements.
38 | Allspring Intermediate Tax/AMT-Free Fund
Portfolio of investments—December 31, 2022 (unaudited)
| | | Interest
rate | Maturity
date | Principal | Value |
| Tax revenue: 0.15% | | | | | |
| Wisconsin Center District Senior Dedicated Tax Bond Series C (AGM Insured) ¤ | | 0.00% | 12-15-2034 | $ 1,250,000 | $ 755,187 |
| Wisconsin Center District Senior Dedicated Tax Bond Series C (AGM Insured) ¤ | | 0.00 | 12-15-2035 | 1,600,000 | 910,332 |
| | | | | | 1,665,519 |
| | | | | | 18,181,084 |
| Total Municipal obligations (Cost $1,078,571,811) | | | | | 1,057,793,648 |
| Total investments in securities (Cost $1,080,571,811) | 98.62% | | | | 1,059,793,648 |
| Other assets and liabilities, net | 1.38 | | | | 14,848,000 |
| Total net assets | 100.00% | | | | $1,074,641,648 |
| 144A | The security may be resold in transactions exempt from registration, normally to qualified institutional buyers, pursuant to Rule 144A under the Securities Act of 1933. |
| ø | Variable rate demand notes are subject to a demand feature which reduces the effective maturity. The maturity date shown represents the final maturity date of the security. The interest rate is determined and reset by the issuer daily, weekly, or monthly depending upon the terms of the security. The rate shown is the rate in effect at period end. |
| ± | Variable rate investment. The rate shown is the rate in effect at period end. |
| ¤ | The security is issued in zero coupon form with no periodic interest payments. |
| ## | All or a portion of this security is segregated for when-issued securities. |
| øø | The interest rate is determined and reset by the issuer periodically depending upon the terms of the security. The rate shown is the rate in effect at period end. |
| %% | The security is purchased on a when-issued basis. |
| Abbreviations: |
| AGC | Assured Guaranty Corporation |
| AGM | Assured Guaranty Municipal |
| Ambac | Ambac Financial Group Incorporated |
| BAM | Build America Mutual Assurance Company |
| CAB | Capital appreciation bond |
| CCAB | Convertible capital appreciation bond |
| CDA | Community Development Authority |
| EDA | Economic Development Authority |
| EDFA | Economic Development Finance Authority |
| FHLMC | Federal Home Loan Mortgage Corporation |
| GO | General obligation |
| HCFR | Healthcare facilities revenue |
| HEFA | Health & Educational Facilities Authority |
| HEFAR | Higher Education Facilities Authority Revenue |
| HFA | Housing Finance Authority |
| IDA | Industrial Development Authority |
| LIBOR | London Interbank Offered Rate |
| LIQ | Liquidity agreement |
| LOC | Letter of credit |
| MFHR | Multifamily housing revenue |
| NPFGC | National Public Finance Guarantee Corporation |
| PCR | Pollution control revenue |
| PFA | Public Finance Authority |
| RDA | Redevelopment Authority |
| SIFMA | Securities Industry and Financial Markets Association |
| SOFR | Secured Overnight Financing Rate |
| SPA | Standby purchase agreement |
| TTFA | Transportation Trust Fund Authority |
The accompanying notes are an integral part of these financial statements.
Allspring Intermediate Tax/AMT-Free Fund | 39
Statement of assets and liabilities—December 31, 2022 (unaudited)
| | |
| Assets | |
Investments in unaffiliated securities, at value (cost $1,080,571,811)
| $ 1,059,793,648 |
Cash
| 9,562,823 |
Receivable for interest
| 12,425,735 |
Receivable for Fund shares sold
| 4,601,983 |
Receivable for investments sold
| 31,000 |
Prepaid expenses and other assets
| 41,821 |
Total assets
| 1,086,457,010 |
| Liabilities | |
Payable for Fund shares redeemed
| 9,248,635 |
Payable for when-issued transactions
| 1,056,530 |
Dividends payable
| 968,339 |
Management fee payable
| 318,624 |
Administration fees payable
| 81,423 |
Distribution fee payable
| 5,398 |
Trustees’ fees and expenses payable
| 1,252 |
Accrued expenses and other liabilities
| 135,161 |
Total liabilities
| 11,815,362 |
Total net assets
| $1,074,641,648 |
| Net assets consist of | |
Paid-in capital
| $ 1,109,221,435 |
Total distributable loss
| (34,579,787) |
Total net assets
| $1,074,641,648 |
| Computation of net asset value and offering price per share | |
Net assets – Class A
| $ 213,105,811 |
Shares outstanding – Class A1
| 19,766,177 |
Net asset value per share – Class A
| $10.78 |
Maximum offering price per share – Class A2
| $11.11 |
Net assets – Class C
| $ 8,042,577 |
Shares outstanding – Class C1
| 745,933 |
Net asset value per share – Class C
| $10.78 |
Net assets – Class R6
| $ 287,030,199 |
Shares outstanding – Class R61
| 26,591,945 |
Net asset value per share – Class R6
| $10.79 |
Net assets – Administrator Class
| $ 27,054,342 |
Shares outstanding – Administrator Class1
| 2,507,726 |
Net asset value per share – Administrator Class
| $10.79 |
Net assets – Institutional Class
| $ 539,408,719 |
Shares outstanding – Institutional Class1
| 49,952,288 |
Net asset value per share – Institutional Class
| $10.80 |
| 1 | The Fund has an unlimited number of authorized shares. |
| 2 | Maximum offering price is computed as 100/97.00 of net asset value. On investments of $50,000 or more, the offering price is reduced. |
The accompanying notes are an integral part of these financial statements.
40 | Allspring Intermediate Tax/AMT-Free Fund
Statement of operations—six months ended December 31, 2022 (unaudited)
| | |
| Investment income | |
Interest
| $ 21,981,581 |
| Expenses | |
Management fee
| 2,564,162 |
| Administration fees | |
Class A
| 158,964 |
Class C
| 6,471 |
Class R6
| 61,897 |
Administrator Class
| 14,241 |
Institutional Class
| 283,246 |
| Shareholder servicing fees | |
Class A
| 247,537 |
Class C
| 10,096 |
Administrator Class
| 35,041 |
| Distribution fee | |
Class C
| 30,289 |
Custody and accounting fees
| 41,193 |
Professional fees
| 43,467 |
Registration fees
| 49,409 |
Shareholder report expenses
| 24,474 |
Trustees’ fees and expenses
| 11,157 |
Other fees and expenses
| 21,747 |
Total expenses
| 3,603,391 |
| Less: Fee waivers and/or expense reimbursements | |
Fund-level
| (250,375) |
Class A
| (77,986) |
Class C
| (3,175) |
Administrator Class
| (15,370) |
Net expenses
| 3,256,485 |
Net investment income
| 18,725,096 |
| Realized and unrealized gains (losses) on investments | |
Net realized losses on investments
| (5,501,284) |
Net change in unrealized gains (losses) on investments
| (8,140,532) |
Net realized and unrealized gains (losses) on investments
| (13,641,816) |
Net increase in net assets resulting from operations
| $ 5,083,280 |
The accompanying notes are an integral part of these financial statements.
Allspring Intermediate Tax/AMT-Free Fund | 41
Statement of changes in net assets
| | | | | |
| | Six months ended
December 31, 2022
(unaudited) | Year ended
June 30, 2022 |
| Operations | | | | |
Net investment income
| | $ 18,725,096 | | $ 43,701,331 |
Net realized gains (losses) on investments
| | (5,501,284) | | 6,953,488 |
Net change in unrealized gains (losses) on investments
| | (8,140,532) | | (169,556,314) |
Net increase (decrease) in net assets resulting from operations
| | 5,083,280 | | (118,901,495) |
| Distributions to shareholders from | | | | |
| Net investment income and net realized gains | | | | |
Class A
| | (2,545,669) | | (5,093,391) |
Class C
| | (72,960) | | (142,620) |
Class R6
| | (5,841,642) | | (15,955,578) |
Administrator Class
| | (377,758) | | (885,212) |
Institutional Class
| | (9,886,778) | | (21,622,788) |
Total distributions to shareholders
| | (18,724,807) | | (43,699,589) |
| Capital share transactions | Shares | | Shares | |
| Proceeds from shares sold | | | | |
Class A
| 3,544,233 | 37,995,480 | 1,251,183 | 14,251,621 |
Class C
| 96,390 | 1,035,037 | 86,124 | 960,368 |
Class R6
| 3,217,805 | 34,765,010 | 12,915,001 | 149,434,203 |
Administrator Class
| 254,249 | 2,721,061 | 283,136 | 3,208,139 |
Institutional Class
| 27,519,337 | 295,749,720 | 28,939,320 | 328,622,467 |
| | | 372,266,308 | | 496,476,798 |
| Reinvestment of distributions | | | | |
Class A
| 221,899 | 2,379,858 | 421,216 | 4,831,998 |
Class C
| 6,579 | 70,531 | 12,279 | 140,958 |
Class R6
| 40,220 | 432,006 | 81,145 | 931,361 |
Administrator Class
| 32,832 | 352,420 | 73,451 | 845,963 |
Institutional Class
| 872,663 | 9,370,024 | 1,785,945 | 20,535,850 |
| | | 12,604,839 | | 27,286,130 |
| Payment for shares redeemed | | | | |
Class A
| (2,510,001) | (26,961,472) | (3,811,202) | (43,275,042) |
Class C
| (120,020) | (1,285,878) | (341,331) | (3,962,953) |
Class R6
| (20,575,856) | (220,225,147) | (30,140,846) | (347,586,987) |
Administrator Class
| (472,645) | (5,094,416) | (1,650,035) | (19,002,588) |
Institutional Class
| (48,655,297) | (519,329,134) | (38,031,014) | (430,638,034) |
| | | (772,896,047) | | (844,465,604) |
Net decrease in net assets resulting from capital share transactions
| | (388,024,900) | | (320,702,676) |
Total decrease in net assets
| | (401,666,427) | | (483,303,760) |
| Net assets | | | | |
Beginning of period
| | 1,476,308,075 | | 1,959,611,835 |
End of period
| | $1,074,641,648 | | $1,476,308,075 |
The accompanying notes are an integral part of these financial statements.
42 | Allspring Intermediate Tax/AMT-Free Fund
Financial highlights
(For a share outstanding throughout each period)
| | | Year ended June 30 |
| Class A | Six months ended
December 31, 2022
(unaudited) | 2022 | 2021 | 2020 | 2019 | 2018 |
Net asset value, beginning of period
| $10.84 | $11.92 | $11.72 | $11.66 | $11.31 | $11.46 |
Net investment income
| 0.14 | 0.26 | 0.26 | 0.26 | 0.28 | 0.27 |
Net realized and unrealized gains (losses) on investments
| (0.06) | (1.08) | 0.20 | 0.05 | 0.35 | (0.15) |
Total from investment operations
| 0.08 | (0.82) | 0.46 | 0.31 | 0.63 | 0.12 |
| Distributions to shareholders from | | | | | | |
Net investment income
| (0.14) | (0.26) | (0.26) | (0.25) | (0.28) | (0.27) |
Net asset value, end of period
| $10.78 | $10.84 | $11.92 | $11.72 | $11.66 | $11.31 |
Total return1
| 0.74% | (7.00)% | 3.92% | 2.72% | 5.67% | 1.08% |
| Ratios to average net assets (annualized) | | | | | | |
Gross expenses
| 0.82% | 0.81% | 0.80% | 0.79% | 0.80% | 0.80% |
Net expenses
| 0.70% | 0.70% | 0.70% | 0.70% | 0.70% | 0.70% |
Net investment income
| 2.56% | 2.22% | 2.16% | 2.18% | 2.47% | 2.38% |
| Supplemental data | | | | | | |
Portfolio turnover rate
| 6% | 7% | 12% | 24% | 14% | 14% |
Net assets, end of period (000s omitted)
| $213,106 | $200,566 | $246,130 | $249,724 | $263,113 | $287,408 |
| 1 | Total return calculations do not include any sales charges. Returns for periods of less than one year are not annualized. |
The accompanying notes are an integral part of these financial statements.
Allspring Intermediate Tax/AMT-Free Fund | 43
Financial highlights
(For a share outstanding throughout each period)
| | | Year ended June 30 |
| Class C | Six months ended
December 31, 2022
(unaudited) | 2022 | 2021 | 2020 | 2019 | 2018 |
Net asset value, beginning of period
| $10.84 | $11.92 | $11.72 | $11.66 | $11.31 | $11.46 |
Net investment income
| 0.10 | 0.17 | 0.17 | 0.17 | 0.20 | 0.19 |
Net realized and unrealized gains (losses) on investments
| (0.06) | (1.08) | 0.20 | 0.06 | 0.35 | (0.15) |
Total from investment operations
| 0.04 | (0.91) | 0.37 | 0.23 | 0.55 | 0.04 |
| Distributions to shareholders from | | | | | | |
Net investment income
| (0.10) | (0.17) | (0.17) | (0.17) | (0.20) | (0.19) |
Net asset value, end of period
| $10.78 | $10.84 | $11.92 | $11.72 | $11.66 | $11.31 |
Total return1
| 0.36% | (7.70)% | 3.14% | 1.95% | 4.88% | 0.32% |
| Ratios to average net assets (annualized) | | | | | | |
Gross expenses
| 1.57% | 1.55% | 1.55% | 1.54% | 1.55% | 1.55% |
Net expenses
| 1.45% | 1.45% | 1.45% | 1.45% | 1.45% | 1.45% |
Net investment income
| 1.80% | 1.46% | 1.40% | 1.43% | 1.73% | 1.63% |
| Supplemental data | | | | | | |
Portfolio turnover rate
| 6% | 7% | 12% | 24% | 14% | 14% |
Net assets, end of period (000s omitted)
| $8,043 | $8,268 | $11,990 | $19,082 | $26,737 | $35,421 |
| 1 | Total return calculations do not include any sales charges. Returns for periods of less than one year are not annualized. |
The accompanying notes are an integral part of these financial statements.
44 | Allspring Intermediate Tax/AMT-Free Fund
Financial highlights
(For a share outstanding throughout each period)
| | | Year ended June 30 |
| Class R6 | Six months ended
December 31, 2022
(unaudited) | 2022 | 2021 | 2020 | 2019 1 |
Net asset value, beginning of period
| $10.85 | $11.93 | $11.74 | $11.67 | $11.33 |
Net investment income
| 0.16 | 0.29 | 0.29 | 0.29 | 0.29 |
Net realized and unrealized gains (losses) on investments
| (0.06) | (1.08) | 0.19 | 0.07 | 0.34 |
Total from investment operations
| 0.10 | (0.79) | 0.48 | 0.36 | 0.63 |
| Distributions to shareholders from | | | | | |
Net investment income
| (0.16) | (0.29) | (0.29) | (0.29) | (0.29) |
Net asset value, end of period
| $10.79 | $10.85 | $11.93 | $11.74 | $11.67 |
Total return2
| 0.89% | (6.71)% | 4.14% | 3.110% | 5.65% |
| Ratios to average net assets (annualized) | | | | | |
Gross expenses
| 0.44% | 0.43% | 0.42% | 0.41% | 0.41% |
Net expenses
| 0.40% | 0.40% | 0.40% | 0.40% | 0.40% |
Net investment income
| 2.83% | 2.50% | 2.44% | 2.48% | 2.75% |
| Supplemental data | | | | | |
Portfolio turnover rate
| 6% | 7% | 12% | 24% | 14% |
Net assets, end of period (000s omitted)
| $287,030 | $476,328 | $728,547 | $1,159,305 | $996,477 |
| 1 | For the period from July 31, 2018 (commencement of class operations) to June 30, 2019 |
| 2 | Returns for periods of less than one year are not annualized. |
The accompanying notes are an integral part of these financial statements.
Allspring Intermediate Tax/AMT-Free Fund | 45
Financial highlights
(For a share outstanding throughout each period)
| | | Year ended June 30 |
| Administrator Class | Six months ended
December 31, 2022
(unaudited) | 2022 | 2021 | 2020 | 2019 | 2018 |
Net asset value, beginning of period
| $10.84 | $11.93 | $11.73 | $11.67 | $11.32 | $11.47 |
Net investment income
| 0.15 | 0.27 | 0.27 | 0.27 | 0.29 | 0.28 |
Net realized and unrealized gains (losses) on investments
| (0.05) | (1.09) | 0.20 | 0.06 | 0.35 | (0.15) |
Total from investment operations
| 0.10 | (0.82) | 0.47 | 0.33 | 0.64 | 0.13 |
| Distributions to shareholders from | | | | | | |
Net investment income
| (0.15) | (0.27) | (0.27) | (0.27) | (0.29) | (0.28) |
Net asset value, end of period
| $10.79 | $10.84 | $11.93 | $11.73 | $11.67 | $11.32 |
Total return1
| 0.88% | (6.99)% | 4.02% | 2.82% | 5.77% | 1.18% |
| Ratios to average net assets (annualized) | | | | | | |
Gross expenses
| 0.75% | 0.74% | 0.73% | 0.73% | 0.74% | 0.73% |
Net expenses
| 0.60% | 0.60% | 0.60% | 0.60% | 0.60% | 0.60% |
Net investment income
| 2.65% | 2.31% | 2.25% | 2.28% | 2.57% | 2.48% |
| Supplemental data | | | | | | |
Portfolio turnover rate
| 6% | 7% | 12% | 24% | 14% | 14% |
Net assets, end of period (000s omitted)
| $27,054 | $29,202 | $47,552 | $60,435 | $177,742 | $183,624 |
| 1 | Returns for periods of less than one year are not annualized. |
The accompanying notes are an integral part of these financial statements.
46 | Allspring Intermediate Tax/AMT-Free Fund
Financial highlights
(For a share outstanding throughout each period)
| | | Year ended June 30 |
| Institutional Class | Six months ended
December 31, 2022
(unaudited) | 2022 | 2021 | 2020 | 2019 | 2018 |
Net asset value, beginning of period
| $10.85 | $11.94 | $11.74 | $11.68 | $11.33 | $11.47 |
Net investment income
| 0.15 | 0.29 | 0.29 | 0.28 | 0.31 | 0.30 |
Net realized and unrealized gains (losses) on investments
| (0.05) | (1.09) | 0.20 | 0.06 | 0.35 | (0.14) |
Total from investment operations
| 0.10 | (0.80) | 0.49 | 0.34 | 0.66 | 0.16 |
| Distributions to shareholders from | | | | | | |
Net investment income
| (0.15) | (0.29) | (0.29) | (0.28) | (0.31) | (0.30) |
Net asset value, end of period
| $10.80 | $10.85 | $11.94 | $11.74 | $11.68 | $11.33 |
Total return1
| 0.96% | (6.84)% | 4.17% | 2.97% | 5.93% | 1.42% |
| Ratios to average net assets (annualized) | | | | | | |
Gross expenses
| 0.49% | 0.48% | 0.47% | 0.46% | 0.47% | 0.47% |
Net expenses
| 0.45% | 0.45% | 0.45% | 0.45% | 0.45% | 0.45% |
Net investment income
| 2.79% | 2.47% | 2.40% | 2.43% | 2.72% | 2.64% |
| Supplemental data | | | | | | |
Portfolio turnover rate
| 6% | 7% | 12% | 24% | 14% | 14% |
Net assets, end of period (000s omitted)
| $539,409 | $761,944 | $925,392 | $1,125,657 | $1,199,588 | $1,932,382 |
| 1 | Returns for periods of less than one year are not annualized. |
The accompanying notes are an integral part of these financial statements.
Allspring Intermediate Tax/AMT-Free Fund | 47
Notes to financial statements (unaudited)
1. ORGANIZATION
Allspring Funds Trust (the "Trust"), a Delaware statutory trust organized on March 10, 1999, is an open-end management investment company registered under the Investment Company Act of 1940, as amended (the "1940 Act"). As an investment company, the Trust follows the accounting and reporting guidance in Financial Accounting Standards Board ("FASB") Accounting Standards Codification Topic 946, Financial Services – Investment Companies. These financial statements report on the Allspring Intermediate Tax/AMT-Free Fund (the "Fund") which is a diversified series of the Trust.
2. SIGNIFICANT ACCOUNTING POLICIES
The following significant accounting policies, which are consistently followed in the preparation of the financial statements of the Fund, are in conformity with U.S. generally accepted accounting principles which require management to make estimates and assumptions that affect the reported amounts of assets and liabilities, disclosure of contingent assets and liabilities at the date of the financial statements, and the reported amounts of income and expenses during the reporting period. Actual results could differ from those estimates.
Securities valuation
All investments are valued each business day as of the close of regular trading on the New York Stock Exchange (generally 4 p.m. Eastern Time), although the Fund may deviate from this calculation time under unusual or unexpected circumstances.
Debt securities are valued at the evaluated bid price provided by an independent pricing service (e.g. taking into account various factors, including yields, maturities, or credit ratings) or, if a reliable price is not available, the quoted bid price from an independent broker-dealer.
Investments which are not valued using the methods discussed above are valued at their fair value, as determined in good faith by Allspring Funds Management, LLC ("Allspring Funds Management"), which was named the valuation designee by the Board of Trustees. As the valuation designee, Allspring Funds Management is responsible for day-to-day valuation activities for the Allspring Funds. In connection with these responsibilities, Allspring Funds Management has established a Valuation Committee and has delegated to it the authority to take any actions regarding the valuation of portfolio securities that the Valuation Committee deems necessary or appropriate, including determining the fair value of portfolio securities. On a quarterly basis, the Board of Trustees receives reports of valuation actions taken by the Valuation Committee. On at least an annual basis, the Board of Trustees receives an assessment of the adequacy and effectiveness of Allspring Funds Management's process for determining the fair value of the portfolio of investments.
When-issued transactions
The Fund may purchase securities on a forward commitment or when-issued basis. The Fund records a when-issued transaction on the trade date and will segregate assets in an amount at least equal in value to the Fund's commitment to purchase when-issued securities. Securities purchased on a when-issued basis are marked-to-market daily and the Fund begins earning interest on the settlement date. Losses may arise due to changes in the market value of the underlying securities or if the counterparty does not perform under the contract.
Security transactions and income recognition
Securities transactions are recorded on a trade date basis. Realized gains or losses are recorded on the basis of identified cost.
Interest income is accrued daily and bond discounts are accreted and premiums are amortized daily. To the extent debt obligations are placed on non-accrual status, any related interest income may be reduced by writing off interest receivables when the collection of all or a portion of interest has been determined to be doubtful based on consistently applied procedures and the fair value has decreased. If the issuer subsequently resumes interest payments or when the collectability of interest is reasonably assured, the debt obligation is removed from non-accrual status.
Distributions to shareholders
Distributions to shareholders from net investment income are declared daily and paid monthly. Distributions from net realized gains, if any, are recorded on the ex-dividend date and paid at least annually. Such distributions are determined in accordance with income tax regulations and may differ from U.S. generally accepted accounting principles. Dividend sources are estimated at the time of declaration. The tax character of distributions is determined as of the Fund's fiscal year end. Therefore, a portion of the Fund's distributions made prior to the Fund’s fiscal year end may be categorized as a tax return of capital at year end.
48 | Allspring Intermediate Tax/AMT-Free Fund
Notes to financial statements (unaudited)
Federal and other taxes
The Fund intends to continue to qualify as a regulated investment company by distributing substantially all of its investment company taxable and tax-exempt income and any net realized capital gains (after reduction for capital loss carryforwards) sufficient to relieve it from all, or substantially all, federal income taxes. Accordingly, no provision for federal income taxes was required.
The Fund’s income and federal excise tax returns and all financial records supporting those returns for the prior three fiscal years are subject to examination by the federal and Delaware revenue authorities. Management has analyzed the Fund's tax positions taken on federal, state, and foreign tax returns, as applicable, for all open tax years and does not believe that there are any uncertain tax positions that require recognition of a tax liability.
As of December 31, 2022, the aggregate cost of all investments for federal income tax purposes was $1,080,571,133 and the unrealized gains (losses) consisted of:
| Gross unrealized gains | $ 10,761,455 |
| Gross unrealized losses | (31,538,940) |
| Net unrealized losses | $(20,777,485) |
As of June 30, 2022, the Fund had capital loss carryforwards which consisted of $7,431,668 in short-term capital losses.
Class allocations
The separate classes of shares offered by the Fund differ principally in applicable sales charges, distribution, shareholder servicing, and administration fees. Class specific expenses are charged directly to that share class. Investment income, common fund-level expenses, and realized and unrealized gains (losses) on investments are allocated daily to each class of shares based on the relative proportion of net assets of each class.
3. FAIR VALUATION MEASUREMENTS
Fair value measurements of investments are determined within a framework that has established a fair value hierarchy based upon the various data inputs utilized in determining the value of the Fund’s investments. The three-level hierarchy gives the highest priority to unadjusted quoted prices in active markets for identical assets or liabilities (Level 1) and the lowest priority to unobservable inputs (Level 3). The Fund’s investments are classified within the fair value hierarchy based on the lowest level of input that is significant to the fair value measurement. The inputs are summarized into three broad levels as follows:
| ■ | Level 1 – quoted prices in active markets for identical securities |
| ■ | Level 2 – other significant observable inputs (including quoted prices for similar securities, interest rates, prepayment speeds, credit risk, etc.) |
| ■ | Level 3 – significant unobservable inputs (including the Fund’s own assumptions in determining the fair value of investments) |
The inputs or methodologies used for valuing investments in securities are not necessarily an indication of the risk associated with investing in those securities.
The following is a summary of the inputs used in valuing the Fund’s assets and liabilities as of December 31, 2022:
| | Quoted prices
(Level 1) | Other significant
observable inputs
(Level 2) | Significant
unobservable inputs
(Level 3) | Total |
| Assets | | | | |
| Investments in: | | | | |
| Closed end municipal bond fund obligations | $0 | $ 2,000,000 | $0 | $ 2,000,000 |
| Municipal obligations | 0 | 1,057,793,648 | 0 | 1,057,793,648 |
| Total assets | $0 | $1,059,793,648 | $0 | $1,059,793,648 |
Additional sector, industry or geographic detail, if any, is included in the Portfolio of Investments.
For the six months ended December 31, 2022, the Fund did not have any transfers into/out of Level 3.
Allspring Intermediate Tax/AMT-Free Fund | 49
Notes to financial statements (unaudited)
4. TRANSACTIONS WITH AFFILIATES
Management fee
Allspring Funds Management, a wholly owned subsidiary of Allspring Global Investments Holdings, LLC, a holding company indirectly owned by certain private funds of GTCR LLC and Reverence Capital Partners, L.P., is the manager of the Fund and provides advisory and fund-level administrative services under an investment management agreement. Under the investment management agreement, Allspring Funds Management is responsible for, among other services, implementing the investment objectives and strategies of the Fund, supervising the subadviser and providing fund-level administrative services in connection with the Fund’s operations. As compensation for its services under the investment management agreement, Allspring Funds Management is entitled to receive a management fee at the following annual rate based on the Fund’s average daily net assets:
| Average daily net assets | Management fee |
| First $500 million | 0.400% |
| Next $500 million | 0.375 |
| Next $2 billion | 0.350 |
| Next $2 billion | 0.325 |
| Next $5 billion | 0.290 |
| Over $10 billion | 0.280 |
For the six months ended December 31, 2022, the management fee was equivalent to an annual rate of 0.38% of the Fund’s average daily net assets.
Allspring Funds Management has retained the services of a subadviser to provide daily portfolio management to the Fund. The fee for subadvisory services is borne by Allspring Funds Management. Allspring Global Investments, LLC, an affiliate of Allspring Funds Management and a wholly owned subsidiary of Allspring Global Investments Holdings, LLC, is the subadviser to the Fund and is entitled to receive a fee from Allspring Funds Management at an annual rate starting at 0.20% and declining to 0.10% as the average daily net assets of the Fund increase.
Administration fees
Under a class-level administration agreement, Allspring Funds Management provides class-level administrative services to the Fund, which includes paying fees and expenses for services provided by the transfer agent, sub-transfer agents, omnibus account servicers and record-keepers. As compensation for its services under the class-level administration agreement, Allspring Funds Management receives an annual fee which is calculated based on the average daily net assets of each class as follows:
| | Class-level
administration fee |
| Class A | 0.16% |
| Class C | 0.16 |
| Class R6 | 0.03 |
| Administrator Class | 0.10 |
| Institutional Class | 0.08 |
Waivers and/or expense reimbursements
Allspring Funds Management has contractually committed to waive and/or reimburse management and administration fees to the extent necessary to maintain certain net operating expense ratios for the Fund. When each class of the Fund has exceeded its expense cap, Allspring Funds Management will waive fees and/or reimburse expenses from fund-level expenses on a proportionate basis and then from class specific expenses. When only certain classes exceed their expense caps, waivers and/or reimbursements are applied against class specific expenses before fund-level expenses. Allspring Funds Management has contractually committed through October 31, 2023 to waive fees and/or reimburse expenses to the extent necessary to cap expenses. Prior to or after the commitment expiration date, the caps may be increased or the commitment to maintain the
50 | Allspring Intermediate Tax/AMT-Free Fund
Notes to financial statements (unaudited)
caps may be terminated only with the approval of the Board of Trustees. As of December 31, 2022, the contractual expense caps are as follows:
| | Expense ratio caps |
| Class A | 0.70% |
| Class C | 1.45 |
| Class R6 | 0.40 |
| Administrator Class | 0.60 |
| Institutional Class | 0.45 |
Distribution fee
The Trust has adopted a distribution plan for Class C shares pursuant to Rule 12b-1 under the 1940 Act. A distribution fee is charged to Class C shares and paid to Allspring Funds Distributor, LLC ("Allspring Funds Distributor"), the principal underwriter, an affiliate of Allspring Funds Management, at an annual rate up to 0.75% of the average daily net assets of Class C shares.
In addition, Allspring Funds Distributor is entitled to receive the front-end sales charge from the purchase of Class A shares and a contingent deferred sales charge on the redemption of certain Class A shares. Allspring Funds Distributor is also entitled to receive the contingent deferred sales charges from redemptions of Class C shares. For the six months ended December 31, 2022, Allspring Funds Distributor received $761 from the sale of Class A shares. No contingent deferred sales charges were incurred by Class A and Class C shares for the six months ended December 31, 2022.
Shareholder servicing fees
The Trust has entered into contracts with one or more shareholder servicing agents, whereby Class A, Class C and Administrator Class are charged a fee at an annual rate up to 0.25% of the average daily net assets of each respective class. A portion of these total shareholder servicing fees were paid to affiliates of the Fund.
Interfund transactions
The Fund may purchase or sell portfolio investment securities to certain affiliates pursuant to Rule 17a-7 under the 1940 Act and under procedures adopted by the Board of Trustees. The procedures have been designed to ensure that these interfund transactions, which do not incur broker commissions, are effected at current market prices. Pursuant to these procedures, the Fund had $139,605,000, $185,440,000 and $0 in interfund purchases, sales and net realized gains (losses), respectively, during the six months ended December 31, 2022.
5. INVESTMENT PORTFOLIO TRANSACTIONS
Purchases and sales of investments, excluding U.S. government obligations (if any) and short-term securities, for the six months ended December 31, 2022 were $75,590,608 and $419,308,447, respectively.
6. BANK BORROWINGS
The Trust (excluding the money market funds), Allspring Master Trust and Allspring Variable Trust are parties to a $350,000,000 revolving credit agreement whereby the Fund is permitted to use bank borrowings for temporary or emergency purposes, such as to fund shareholder redemption requests. Interest under the credit agreement is charged to the Fund based on a borrowing rate equal to the higher of the Federal Funds rate or the overnight bank funding rate in effect on that day plus a spread. In addition, an annual commitment fee equal based on the unused balance is allocated to each participating fund.
For the six months ended December 31, 2022, there were no borrowings by the Fund under the agreement.
7. MARKET RISKS
On March 11, 2020, the World Health Organization announced that it had made the assessment that coronavirus disease 2019 (“COVID-19”) is a pandemic. The impacts of COVID-19 are affecting the entire global economy, individual companies and investment products, the funds, and the market in general. There is significant uncertainty around the extent and duration of business disruptions related to COVID-19 and the impacts may last for an extended period of time. COVID-19 has led to significant uncertainty and volatility in the financial markets.
Allspring Intermediate Tax/AMT-Free Fund | 51
Notes to financial statements (unaudited)
8. INDEMNIFICATION
Under the Fund's organizational documents, the officers and Trustees have been granted certain indemnification rights against certain liabilities that may arise out of performance of their duties to the Fund. The Fund has entered into a separate agreement with each Trustee that converts indemnification rights currently existing under the Fund’s organizational documents into contractual rights that cannot be changed in the future without the consent of the Trustee. Additionally, in the normal course of business, the Fund may enter into contracts with service providers that contain a variety of indemnification clauses. The Fund’s maximum exposure under these arrangements is dependent on future claims that may be made against the Fund and, therefore, cannot be estimated.
52 | Allspring Intermediate Tax/AMT-Free Fund
Other information (unaudited)
PROXY VOTING INFORMATION
A description of the policies and procedures used to determine how to vote proxies relating to portfolio securities is available without charge, upon request, by calling 1-800-222-8222, visiting our website at allspringglobal.com, or visiting the SEC website at sec.gov. Information regarding how the proxies related to portfolio securities were voted during the most recent 12-month period ended June 30 is available on the website at allspringglobal.com or by visiting the SEC website at sec.gov.
QUARTERLY PORTFOLIO HOLDINGS INFORMATION
The Fund files its complete schedule of portfolio holdings with the SEC for the first and third quarters of each fiscal year as an exhibit to its reports on Form N-PORT. Shareholders may view the filed Form N-PORT by visiting the SEC website at sec.gov.
Allspring Intermediate Tax/AMT-Free Fund | 53
Other information (unaudited)
BOARD OF TRUSTEES AND OFFICERS
Each of the Trustees and Officers listed in the table below acts in identical capacities for each fund in the Allspring family of funds, which consists of 127 mutual funds comprising the Allspring Funds Trust, Allspring Variable Trust, Allspring Master Trust and four closed-end funds (collectively the “Fund Complex”). This table should be read in conjunction with the Prospectus and the Statement of Additional Information1. The mailing address of each Trustee and Officer is 1415 Vantage Park Drive, 3rd Floor, Charlotte, NC 28203. Each Trustee and Officer serves an indefinite term, however, each Trustee serves such term until reaching the mandatory retirement age established by the Trustees.
Independent Trustees
Name and
year of birth | Position held and
length of service* | Principal occupations during past five years or longer | Current other
public company or
investment
company
directorships |
William R. Ebsworth
(Born 1957) | Trustee,
since 2015 | Retired. From 1984 to 2013, equities analyst, portfolio manager, research director and chief investment officer at Fidelity Management and Research Company in Boston, Tokyo, and Hong Kong, and retired in 2013 as Chief Investment Officer of Fidelity Strategic Advisers, Inc. where he led a team of investment professionals managing client assets. Prior thereto, Board member of Hong Kong Securities Clearing Co., Hong Kong Options Clearing Corp., the Thailand International Fund, Ltd., Fidelity Investments Life Insurance Company, and Empire Fidelity Investments Life Insurance Company. Audit Committee Chair and Investment Committee Chair of the Vincent Memorial Hospital Foundation (non-profit organization). Mr. Ebsworth is a CFA® charterholder. | N/A |
Jane A. Freeman
(Born 1953) | Trustee,
since 2015;
Chair Liaison,
since 2018 | Retired. From 2012 to 2014 and 1999 to 2008, Chief Financial Officer of Scientific Learning Corporation. From 2008 to 2012, Ms. Freeman provided consulting services related to strategic business projects. Prior to 1999, Portfolio Manager at Rockefeller & Co. and Scudder, Stevens & Clark. Board member of the Harding Loevner Funds from 1996 to 2014, serving as both Lead Independent Director and chair of the Audit Committee. Board member of the Russell Exchange Traded Funds Trust from 2011 to 2012 and the chair of the Audit Committee. Ms. Freeman is also an inactive Chartered Financial Analyst. | N/A |
Isaiah Harris, Jr.
(Born 1952) | Trustee,
since 2009; Audit
Committee
Chair,
since 2019 | Retired. Member of the Advisory Board of CEF of East Central Florida. Chairman of the Board of CIGNA Corporation from 2009 to 2021, and Director from 2005 to 2008. From 2003 to 2011, Director of Deluxe Corporation. Prior thereto, President and CEO of BellSouth Advertising and Publishing Corp. from 2005 to 2007, President and CEO of BellSouth Enterprises from 2004 to 2005 and President of BellSouth Consumer Services from 2000 to 2003. Emeritus member of the Iowa State University Foundation Board of Governors. Emeritus Member of the Advisory Board of Iowa State University School of Business. Advisory Board Member, Palm Harbor Academy (private school). Advisory Board Member, Fellowship of Christian Athletes. Mr. Harris is a certified public accountant (inactive status). | N/A |
David F. Larcker
(Born 1950) | Trustee,
since 2009 | Distinguished Visiting Fellow at the Hoover Institution since 2022. James Irvin Miller Professor of Accounting at the Graduate School of Business (Emeritus), Stanford University, Director of the Corporate Governance Research Initiative and Senior Faculty of The Rock Center for Corporate Governance since 2006. From 2005 to 2008, Professor of Accounting at the Graduate School of Business, Stanford University. Prior thereto, Ernst & Young Professor of Accounting at The Wharton School, University of Pennsylvania from 1985 to 2005. | N/A |
54 | Allspring Intermediate Tax/AMT-Free Fund
Other information (unaudited)
Name and
year of birth | Position held and
length of service* | Principal occupations during past five years or longer | Current other
public company or
investment
company
directorships |
Olivia S. Mitchell
(Born 1953) | Trustee,
since 2006;
Nominating and
Governance
Committee Chair,
since 2018 | International Foundation of Employee Benefit Plans Professor since 1993, Wharton School of the University of Pennsylvania. Director of Wharton’s Pension Research Council and Boettner Center on Pensions & Retirement Research, and Research Associate at the National Bureau of Economic Research. Previously taught at Cornell University from 1978 to 1993. | N/A |
Timothy J. Penny
(Born 1951) | Trustee,
since 1996;
Chair,
since 2018 | President and Chief Executive Officer of Southern Minnesota Initiative Foundation, a non-profit organization, since 2007. Vice Chair of the Economic Club of Minnesota, since 2007. Co-Chair of the Committee for a Responsible Federal Budget, since 1995. Member of the Board of Trustees of NorthStar Education Finance, Inc., a non-profit organization, from 2007-2022. Senior Fellow of the University of Minnesota Humphrey Institute from 1995 to 2017. | N/A |
James G. Polisson
(Born 1959) | Trustee,
since 2018 | Retired. Chief Marketing Officer, Source (ETF) UK Services, Ltd, from 2015 to 2017. From 2012 to 2015, Principal of The Polisson Group, LLC, a management consulting, corporate advisory and principal investing company. Chief Executive Officer and Managing Director at Russell Investments, Global Exchange Traded Funds from 2010 to 2012. Managing Director of Barclays Global Investors from 1998 to 2010 and Global Chief Marketing Officer for iShares and Barclays Global Investors from 2000 to 2010. Trustee of the San Francisco Mechanics’ Institute, a non-profit organization, from 2013 to 2015. Board member of the Russell Exchange Traded Fund Trust from 2011 to 2012. Director of Barclays Global Investors Holdings Deutschland GmbH from 2006 to 2009. Mr. Polisson is an attorney and has a retired status with the Massachusetts and District of Columbia Bar Associations. | N/A |
Pamela Wheelock
(Born 1959) | Trustee,
since January
2020; previously
Trustee from
January 2018 to
July 2019 | Retired. Executive and Senior Financial leadership positions in the public, private and nonprofit sectors. Interim President and CEO, McKnight Foundation, 2020. Interim Commissioner, Minnesota Department of Human Services, 2019. Chief Operating Officer, Twin Cities Habitat for Humanity, 2017-2019. Vice President for University Services, University of Minnesota, 2012-2016. Interim President and CEO, Blue Cross and Blue Shield of Minnesota, 2011-2012. Executive Vice-President and Chief Financial Officer, Minnesota Wild, 2002-2008. Commissioner, Minnesota Department of Finance, 1999-2002. Chair of the Board of Directors of Destination Medical Center Corporation. Board member of the Minnesota Wild Foundation. | N/A |
* Length of service dates reflect the Trustee’s commencement of service with the Trust’s predecessor entities, where applicable.
Allspring Intermediate Tax/AMT-Free Fund | 55
Other information (unaudited)
Officers2
Name and
year of birth | Position held and
length of service | Principal occupations during past five years or longer |
Andrew Owen
(Born 1960) | President,
since 2017 | President and Chief Executive Officer of Allspring Funds Management, LLC since 2017 and Head of Global Fund Governance of Allspring Global Investments since 2022. Prior thereto, co-president of Galliard Capital Management, LLC, an affiliate of Allspring Funds Management, LLC, from 2019 to 2022 and Head of Affiliated Managers, Allspring Global Investments, from 2014 to 2019 and Executive Vice President responsible for marketing, investments and product development for Allspring Funds Management, LLC, from 2009 to 2014. |
Jeremy DePalma
(Born 1974) | Treasurer,
since 2012
(for certain funds in
the Fund Complex);
since 2021 (for
the remaining funds in the
Fund Complex) | Senior Vice President of Allspring Funds Management, LLC since 2009. Senior Vice President of Evergreen Investment Management Company, LLC from 2008 to 2010 and head of the Fund Reporting and Control Team within Fund Administration from 2005 to 2010. |
Christopher Baker
(Born 1976) | Chief Compliance Officer, since 2022 | Global Chief Compliance Officer for Allspring Global Investments since 2022. Prior thereto, Chief Compliance Officer for State Street Global Advisors from 2018 to 2021. Senior Compliance Officer for the State Street divisions of Alternative Investment Solutions, Sector Solutions, and Global Marketing from 2015 to 2018. From 2010 to 2015 Vice President, Global Head of Investment and Marketing Compliance for State Street Global Advisors. |
Matthew Prasse
(Born 1983) | Chief Legal Officer, since 2022; Secretary, since 2021 | Senior Counsel of the Allspring Legal Department since 2021. Senior Counsel of the Wells Fargo Legal Department from 2018 to 2021. Previously, Counsel for Barings LLC from 2015 to 2018. Prior to joining Barings, Associate at Morgan, Lewis & Bockius LLP from 2008 to 2015. |
1 The Statement of Additional Information includes additional information about the Trustees and is available, without charge, upon request, by calling 1-800-222-8222 or by visiting the website at allspringglobal.com.
2 For those Officers with tenures at Allspring Global Investments and/or Allspring Funds Management, LLC that began prior to 2021, such tenures include years of service during which these businesses/entities were known as Wells Fargo Asset Management and Wells Fargo Funds Management, LLC, respectively.
56 | Allspring Intermediate Tax/AMT-Free Fund
For more information
More information about Allspring Funds is available free upon request. To obtain literature, please write, visit the Fund's website, or call:
Allspring Funds
P.O. Box 219967
Kansas City, MO 64121-9967
Website: allspringglobal.com
Individual investors: 1-800-222-8222
Retail investment professionals: 1-888-877-9275
Institutional investment professionals: 1-800-260-5969
This report and the financial statements contained herein are submitted for the general information of the shareholders of the Fund. If this report is used for promotional purposes, distribution of the report must be accompanied or preceded by a current prospectus. Before investing, please consider the investment objectives, risks, charges, and expenses of the investment. For a current prospectus and, if available, a summary prospectus, containing this information, call
1-800-222-8222 or visit the Fund's website at allspringglobal.com. Read the prospectus carefully before you invest or send money.
Allspring Global InvestmentsTM is the trade name for the asset management firms of Allspring Global Investments Holdings, LLC, a holding company indirectly owned by certain private funds of GTCR LLC and Reverence Capital Partners, L.P. These firms include but are not limited to Allspring Global Investments, LLC, and Allspring Funds Management, LLC. Certain products managed by Allspring entities are distributed by Allspring Funds Distributor, LLC (a broker-dealer and Member FINRA/SIPC).
This material is for general informational and educational purposes only and is NOT intended to provide investment advice or a recommendation of any kind - including a recommendation for any specific investment, strategy, or plan.
© 2023 Allspring Global Investments Holdings, LLC. All rights reserved.
ALL-01092023-rae3zrnl 02-23
SAR3322 12-22
Semi-Annual Report
December 31, 2022
Allspring
Minnesota Tax-Free Fund
The views expressed and any forward-looking statements are as of December 31, 2022, unless otherwise noted, and are those of the Fund's portfolio managers and/or Allspring Global Investments. Discussions of individual securities or the markets generally are not intended as individual recommendations. Future events or results may vary significantly from those expressed in any forward-looking statements. The views expressed are subject to change at any time in response to changing circumstances in the market. Allspring Global Investments disclaims any obligation to publicly update or revise any views expressed or forward-looking statements.
Allspring Minnesota Tax-Free Fund | 1
Letter to shareholders (unaudited)
Andrew Owen
President
Allspring Funds
Dear Shareholder:
We are pleased to offer you this semi-annual report for the Allspring Minnesota Tax-Free Fund for the six-month period that ended December 31, 2022. Globally, stocks and bonds experienced heightened volatility and generally negative returns through the challenging period. Earlier tailwinds provided by global stimulus programs, vaccination rollouts, and recovering consumer and corporate sentiment were wiped away by the highest rate of inflation in four decades, the impact of ongoing aggressive central bank rate hikes and the prospect of more rate hikes. Compounding these concerns were the global reverberations of the Russia-Ukraine war and the impact of China’s strict COVID-19 lockdowns.
For the six-month period, stocks and bonds had mixed results, with emerging market equities trailing those of developed markets and both U.S. and non-U.S. bonds fighting an uphill battle in the face of sustained interest rate increases. For the period, U.S. stocks, based on the S&P 500 Index,1 gained 2.31%. International stocks, as measured by the MSCI ACWI ex USA Index (Net),2 returned 2.96%, while the MSCI EM Index (Net) (USD)3 declined 2.99%. Among bond indexes, the Bloomberg U.S. Aggregate Bond Index4 returned -2.97%, the Bloomberg Global Aggregate ex-USD Index (unhedged)5 returned -2.65%, the Bloomberg Municipal Bond Index6 gained 0.50%, and the ICE BofA U.S. High Yield Index7 returned 3.33%.
Persistent inflation and economic fallout from the Russia-Ukraine war drove markets.
Markets rebounded from earlier losses in July, led by U.S. stocks. While evidence pointed to an economic slowdown after two consecutive quarters of declining gross domestic product (economic contraction), the U.S. labor market remained surprisingly strong: July nonfarm payrolls grew by more than 500,000 and U.S. unemployment dipped to 3.5%. Meanwhile, crude oil and retail gasoline prices, major contributors to recent overall inflation, fell substantially from earlier highs. And while U.S. home prices rose, sales fell as houses became less affordable with mortgage rates at a 13-year high. The Federal Reserve (Fed) raised the federal funds rate another 0.75% in July—to a range of 2.25% to 2.50%—and forecasts pointed to further rate hikes.
| 1 | The S&P 500 Index consists of 500 stocks chosen for market size, liquidity, and industry group representation. It is a market-value-weighted index with each stock's weight in the index proportionate to its market value. You cannot invest directly in an index. |
| 2 | The Morgan Stanley Capital International (MSCI) All Country World Index (ACWI) ex USA Index (Net) is a free-float-adjusted market-capitalization-weighted index that is designed to measure the equity market performance of developed and emerging markets, excluding the U.S. Source: MSCI. MSCI makes no express or implied warranties or representations and shall have no liability whatsoever with respect to any MSCI data contained herein. The MSCI data may not be further redistributed or used as a basis for other indexes or any securities or financial products. This report is not approved, reviewed, or produced by MSCI. You cannot invest directly in an index. |
| 3 | The MSCI Emerging Markets (EM) Index (Net) (USD) is a free-float-adjusted market-capitalization-weighted index that is designed to measure equity market performance of emerging markets. You cannot invest directly in an index. |
| 4 | The Bloomberg U.S. Aggregate Bond Index is a broad-based benchmark that measures the investment-grade, U.S.-dollar-denominated, fixed-rate taxable bond market, including Treasuries, government-related and corporate securities, mortgage-backed securities (agency fixed-rate and hybrid adjustable-rate mortgage pass-throughs), asset-backed securities, and commercial mortgage-backed securities. You cannot invest directly in an index. |
| 5 | The Bloomberg Global Aggregate ex-USD Index (unhedged) is an unmanaged index that provides a broad-based measure of the global investment-grade fixed-income markets excluding the U.S.-dollar-denominated debt market. You cannot invest directly in an index. |
| 6 | The Bloomberg Municipal Bond Index is an unmanaged index composed of long-term tax-exempt bonds with a minimum credit rating of Baa. You cannot invest directly in an index. |
| 7 | The ICE BofA U.S. High Yield Index is a market-capitalization-weighted index of domestic and Yankee high-yield bonds. The index tracks the performance of high-yield securities traded in the U.S. bond market. You cannot invest directly in an index. Copyright 2023. ICE Data Indices, LLC. All rights reserved. |
2 | Allspring Minnesota Tax-Free Fund
Letter to shareholders (unaudited)
August was yet another broadly challenging month for financial markets, with more red ink flowing. High inflation persisted, cresting 9% in the eurozone on an annual basis and remaining above 8% in the U.S. despite the Fed’s aggressive monetary policy and a major drop in global crude oil and gasoline prices from their June peak. One positive note was the resilience of the U.S. job market. However, the Fed’s job was clearly not complete. One longer-term bright spot was the U.S. Congress’s passage of the Inflation Reduction Act. Its primary stated goals include: to reduce inflation (though not immediately) by curbing the deficit, capping health care spending by seniors, and investing in domestic sources of clean energy.
The market misery continued in September. There was nowhere to hide as all asset classes suffered major losses at the hands of persistent inflation. Central banks kept up their battle against rapidly rising prices with more rate hikes. The strength of the U.S. dollar made things even more difficult for investors holding assets in other currencies. U.S. mortgage rates jumped to near 7% on 30-year fixed-rate mortgages; the decreased housing affordability began to cool demand somewhat. The U.K. experienced a sharp sell-off of government bonds and the British pound in September as investors panicked in response to a new government budget that was seen as financially unsound. The market meltdown forced the Bank of England to step in and buy long-dated government bonds.
Equities had a reprieve in October after two months of sharp declines. Value stocks and small caps fared best. Globally, developed markets outpaced emerging market equities, which were hurt by weakness among Chinese stocks. Central banks continued to try to curtail high inflation with aggressive interest rate hikes. Geopolitical risks persisted, including the ongoing Russia-Ukraine war and economic, financial market, and political turmoil in the U.K., which led to a second prime ministerial change in six weeks, as Rishi Sunak replaced Liz Truss in late October. Concerns over Europe’s energy crisis eased thanks to unseasonably warm weather and plentiful gas on hand. The U.S. labor market continued its resilience against rising prices, as unemployment stood at 3.7%, near a record low.
Stocks and bonds rallied in November, with emerging market equities gaining nearly 15% and developed market equities returning 7%. The S&P 500 Index rose 5.6% in November. Bonds also had positive monthly returns. Economic news was encouraging, driven by U.S. labor market strength. Although central banks kept raising rates, expectations grew regarding an impending easing in the pace of rate hikes and a possible end to central bank monetary tightening in 2023. Although inflation remained at record highs in the eurozone, with a 10.6% annual increase in October, Germany’s producer prices decreased 4.2% annually, signaling a possible decline in inflationary pressures. Meanwhile, U.S. inflation continued to moderate, with a 7.1% annual price rise in November and a monthly price increase of just 0.1%. China’s economic data remained weak, reflecting its zero-COVID-19 policy.
Financial markets cooled in December, with U.S. equities posting negative overall results in response to a weakening U.S. dollar. Fixed income securities ended one of their worst years ever with flat overall monthly returns as markets weighed the hopes for an end to the monetary tightening cycle with the reality that central banks had not completed their jobs yet. U.S. Consumer Price Index (CPI)1 data showed a strong consistent trend downward, which brought down the 12-month CPI to 6.5% in December from 9.1% in June. Other countries and regions reported still-high but declining inflation rates as the year winded down.
“ The market misery continued in September. There was nowhere to hide as all asset classes suffered major losses at the hands of persistent inflation.”
| 1 | The Consumer Price Index (CPI) is a measure of the average change over time in the prices paid by urban consumers for a market basket of consumer goods and services. You cannot invest directly in an index. |
Allspring Minnesota Tax-Free Fund | 3
Letter to shareholders (unaudited)
Don’t let short-term uncertainty derail long-term investment goals.
Periods of investment uncertainty can present challenges, but experience has taught us that maintaining long-term investment goals can be an effective way to plan for the future. To help you create a sound strategy based on your personal goals and risk tolerance, Allspring Funds offers more than 100 mutual funds spanning a wide range of asset classes and investment styles. Although diversification cannot guarantee an investment profit or prevent losses, we believe it can be an effective way to manage investment risk and potentially smooth out overall portfolio performance. We encourage investors to know their investments and to understand that appropriate levels of risk-taking may unlock opportunities.
Thank you for choosing to invest with Allspring Funds. We appreciate your confidence in us and remain committed to helping you meet your financial needs.
Sincerely,
Andrew Owen
President
Allspring Funds
For further information about your fund, contact your investment professional, visit our website at allspringglobal.com, or call us directly at 1-800-222-8222.
4 | Allspring Minnesota Tax-Free Fund
This page is intentionally left blank.
Performance highlights (unaudited)
| Investment objective | The Fund seeks current income exempt from federal income tax and Minnesota individual income tax. |
| Manager | Allspring Funds Management, LLC |
| Subadviser | Allspring Global Investments, LLC |
| Portfolio managers | Bruce R. Johns, Kerry Laurin |
| Average annual total returns (%) as of December 31, 2022 |
| | | Including sales charge | | Excluding sales charge | | Expense ratios1 (%) |
| | Inception date | 1 year | 5 year | 10 year | | 1 year | 5 year | 10 year | | Gross | Net 2 |
| Class A (NMTFX) | 1-12-1988 | -10.70 | -0.05 | 1.17 | | -6.50 | 0.87 | 1.64 | | 0.91 | 0.85 |
| Class C (WMTCX) | 4-8-2005 | -8.11 | 0.14 | 1.03 | | -7.11 | 0.14 | 1.03 | | 1.66 | 1.60 |
| Administrator Class (NWMIX) | 8-2-1993 | – | – | – | | -6.18 | 1.12 | 1.90 | | 0.85 | 0.60 |
| Institutional Class (WMTIX)3 | 10-31-2016 | – | – | – | | -6.09 | 1.21 | 1.96 | | 0.58 | 0.52 |
| Bloomberg Municipal Bond Index4 | – | – | – | – | | -8.53 | 1.25 | 2.13 | | – | – |
| Bloomberg Minnesota Municipal Bond Index5 | – | – | – | – | | -7.36 | 1.21 | 1.84 | | – | – |
Figures quoted represent past performance, which is no guarantee of future results, and do not reflect taxes that a shareholder may pay on an investment in a fund. Investment return and principal value of an investment will fluctuate so that an investor’s shares, when redeemed, may be worth more or less than their original cost. Performance shown without sales charges would be lower if sales charges were reflected. Current performance may be lower or higher than the performance data quoted, which assumes the reinvestment of dividends and capital gains. Current month-end performance is available on the Fund’s website, allspringglobal.com.
Index returns do not include transaction costs associated with buying and selling securities, any mutual fund fees or expenses, or any taxes. It is not possible to invest directly in an index.
For Class A shares, the maximum front-end sales charge is 4.50%. For Class C shares, the maximum contingent deferred sales charge is 1.00%. Performance including a contingent deferred sales charge assumes the sales charge for the corresponding time period. Administrator Class and Institutional Class shares are sold without a front-end sales charge or contingent deferred sales charge.
| 1 | Reflects the expense ratios as stated in the most recent prospectuses. The expense ratios shown are subject to change and may differ from the annualized expense ratios shown in the financial highlights of this report. |
| 2 | The manager has contractually committed through October 31, 2023, to waive fees and/or reimburse expenses to the extent necessary to cap total annual fund operating expenses after fee waivers at 0.85% for Class A, 1.60% for Class C, 0.60% for Administrator Class, and 0.52% for Institutional Class. Brokerage commissions, stamp duty fees, interest, taxes, acquired fund fees and expenses (if any), and extraordinary expenses are excluded from the expense caps. Prior to or after the commitment expiration date, the caps may be increased or the commitment to maintain the caps may be terminated only with the approval of the Board of Trustees. Without these caps, the Fund’s returns would have been lower. The expense ratio paid by an investor is the net expense ratio (the total annual fund operating expenses after fee waivers) as stated in the prospectuses. |
| 3 | Historical performance shown for the Institutional Class shares prior to their inception reflects the performance of the Administrator Class shares, and includes the higher expenses applicable to the Administrator Class shares. If these expenses had not been included, returns for the Institutional Class shares would be higher. |
| 4 | The Bloomberg Municipal Bond Index is an unmanaged index composed of long-term tax-exempt bonds with a minimum credit rating of Baa. You cannot invest directly in an index. |
| 5 | The Bloomberg Minnesota Municipal Bond Index is the Minnesota component of the Bloomberg Municipal Bond Index. You cannot invest directly in an index |
6 | Allspring Minnesota Tax-Free Fund
Performance highlights (unaudited)
Bond values fluctuate in response to the financial condition of individual issuers, general market and economic conditions, and changes in interest rates. Changes in market conditions and government policies may lead to periods of heightened volatility in the bond market and reduced liquidity for certain bonds held by the Fund. In general, when interest rates rise, bond values fall and investors may lose principal value. Interest rate changes and their impact on the Fund and its share price can be sudden and unpredictable. The use of derivatives may reduce returns and/or increase volatility. Certain investment strategies tend to increase the total risk of an investment (relative to the broader market). This fund is exposed to Minnesota municipal securities risk and high-yield securities risk. Consult the Fund’s prospectus for additional information on these and other risks. A portion of the Fund’s income may be subject to federal, state, and/or local income taxes or the Alternative Minimum Tax (AMT). Any capital gains distributions may be taxable.
Allspring Minnesota Tax-Free Fund | 7
Performance highlights (unaudited)
| Credit quality as of December 31, 20221 |
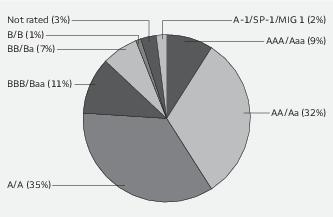
| 1 | The credit quality distribution of portfolio holdings reflected in the chart is based on ratings from Standard & Poor’s, Moody’s Investors Service, and/or Fitch Ratings Ltd. Credit quality ratings apply to the underlying holdings of the Fund and not to the Fund itself. The percentages of the portfolio with the ratings depicted in the chart are calculated based on the market value of fixed income securities held by the Fund. If a security was rated by all three rating agencies, the middle rating was utilized. If rated by two of the three rating agencies, the lower rating was utilized, and if rated by one of the rating agencies, that rating was utilized. Standard & Poor’s rates the creditworthiness of bonds, ranging from AAA (highest) to D (lowest). Ratings from A to CCC may be modified by the addition of a plus (+) or minus (-) sign to show relative standing within the rating categories. Standard & Poor’s rates the creditworthiness of short-term notes from SP-1 (highest) to SP-3 (lowest). Moody’s rates the creditworthiness of bonds, ranging from Aaa (highest) to C (lowest). Ratings Aa to B may be modified by the addition of a number 1 (highest) to 3 (lowest) to show relative standing within the ratings categories. Moody’s rates the creditworthiness of short-term U.S. tax-exempt municipal securities from MIG 1/VMIG 1 (highest) to SG (lowest). Fitch rates the creditworthiness of bonds, ranging from AAA (highest) to D (lowest). Credit quality distribution is subject to change and may have changed since the date specified. |
| Effective maturity distribution as of December 31, 20221 |
| 1 | Figures represent the percentage of the Fund's long-term investments. Allocations are subject to change and may have changed since the date specified. |
8 | Allspring Minnesota Tax-Free Fund
Fund expenses (unaudited)
As a shareholder of the Fund, you incur two types of costs: (1) transaction costs, including sales charges (loads) on purchase payments and contingent deferred sales charges (if any) on redemptions and (2) ongoing costs, including management fees, distribution (12b-1) and/or shareholder servicing fees, and other Fund expenses. This example is intended to help you understand your ongoing costs (in dollars) of investing in the Fund and to compare these costs with the ongoing costs of investing in other mutual funds.
The example is based on an investment of $1,000 invested at the beginning of the six-month period and held for the entire period from July 1, 2022 to December 31, 2022.
Actual expenses
The “Actual” line of the table below provides information about actual account values and actual expenses. You may use the information in this line, together with the amount you invested, to estimate the expenses that you paid over the period. Simply divide your account value by $1,000 (for example, an $8,600 account value divided by $1,000 = 8.6), then multiply the result by the number in the “Actual” line under the heading entitled “Expenses paid during period” for your applicable class of shares to estimate the expenses you paid on your account during this period.
Hypothetical example for comparison purposes
The “Hypothetical” line of the table below provides information about hypothetical account values and hypothetical expenses based on the Fund’s actual expense ratio and an assumed rate of return of 5% per year before expenses, which is not the Fund’s actual return. The hypothetical account values and expenses may not be used to estimate the actual ending account balance or expenses you paid for the period. You may use this information to compare the ongoing costs of investing in the Fund and other funds. To do so, compare this 5% hypothetical example with the 5% hypothetical examples that appear in the shareholder reports of the other funds.
Please note that the expenses shown in the table are meant to highlight your ongoing costs only and do not reflect any transactional costs, such as sales charges (loads) and contingent deferred sales charges. Therefore, the “Hypothetical” line of the table is useful in comparing ongoing costs only, and will not help you determine the relative total costs of owning different funds. In addition, if these transactional costs were included, your costs would have been higher.
| | Beginning
account value
7-1-2022 | Ending
account value
12-31-2022 | Expenses
paid during
the period1 | Annualized net
expense ratio |
| Class A | | | | |
| Actual | $1,000.00 | $1,002.07 | $4.29 | 0.85% |
| Hypothetical (5% return before expenses) | $1,000.00 | $1,020.92 | $4.33 | 0.85% |
| Class C | | | | |
| Actual | $1,000.00 | $ 999.27 | $8.06 | 1.60% |
| Hypothetical (5% return before expenses) | $1,000.00 | $1,017.14 | $8.13 | 1.60% |
| Administrator Class | | | | |
| Actual | $1,000.00 | $1,003.33 | $3.03 | 0.60% |
| Hypothetical (5% return before expenses) | $1,000.00 | $1,022.18 | $3.06 | 0.60% |
| Institutional Class | | | | |
| Actual | $1,000.00 | $1,004.74 | $2.63 | 0.52% |
| Hypothetical (5% return before expenses) | $1,000.00 | $1,022.58 | $2.65 | 0.52% |
1 Expenses paid is equal to the annualized net expense ratio of each class multiplied by the average account value over the period, multiplied by 184 divided by 365 (to reflect the one-half-year period).
Allspring Minnesota Tax-Free Fund | 9
Portfolio of investments—December 31, 2022 (unaudited)
| | | Interest
rate | Maturity
date | Principal | Value |
| Municipal obligations: 96.47% | | | | | |
| Colorado: 0.56% | | | | | |
| Health revenue: 0.56% | | | | | |
| Colorado Health Facilities Authority Hospital CommonSpirit Health Series B-2 | | 5.00% | 8-1-2049 | $1,000,000 | $ 1,044,214 |
| Georgia: 0.25% | | | | | |
| Utilities revenue: 0.25% | | | | | |
| Main Street Natural Gas Incorporated Gas Supply Revenue Bonds Series 2022C 144Aøø | | 4.00 | 8-1-2052 | 500,000 | 470,091 |
| Guam: 1.06% | | | | | |
| Airport revenue: 0.52% | | | | | |
| Guam International Airport Authority Revenue Bonds Series A %% | | 5.25 | 10-1-2031 | 325,000 | 328,890 |
| Guam Port Authority Series 2018B | | 5.00 | 7-1-2035 | 605,000 | 635,382 |
| | | | | | 964,272 |
| Utilities revenue: 0.28% | | | | | |
| Guam Power Authority Series A | | 5.00 | 10-1-2026 | 500,000 | 524,549 |
| Water & sewer revenue: 0.26% | | | | | |
| Guam Government Waterworks Authority Water and Wastewater Revenue Bonds Series 2016 | | 5.00 | 1-1-2046 | 500,000 | 491,959 |
| | | | | | 1,980,780 |
| Illinois: 0.99% | | | | | |
| GO revenue: 0.55% | | | | | |
| Illinois GO Series March 2022A | | 5.00 | 3-1-2024 | 500,000 | 506,938 |
| Illinois GO Series March 2022A | | 5.25 | 3-1-2037 | 500,000 | 510,904 |
| | | | | | 1,017,842 |
| Miscellaneous revenue: 0.44% | | | | | |
| Chicago IL Special Assessment Improvement Refunding Bonds Series 2022 144A | | 2.53 | 12-1-2025 | 335,000 | 313,894 |
| Illinois GO Series June 2013 | | 5.25 | 7-1-2028 | 500,000 | 502,494 |
| | | | | | 816,388 |
| | | | | | 1,834,230 |
| Minnesota: 92.71% | | | | | |
| Airport revenue: 3.53% | | | | | |
| Minneapolis & St. Paul MN Metropolitan Airports Commission Subordinate Bond Series 2014A | | 5.00 | 1-1-2032 | 800,000 | 814,582 |
| Minneapolis & St. Paul MN Metropolitan Airports Commission Subordinate Bond Series 2014B | | 5.00 | 1-1-2026 | 1,100,000 | 1,115,617 |
| Minneapolis & St. Paul MN Metropolitan Airports Commission Subordinate Bond Series 2016A | | 5.00 | 1-1-2031 | 485,000 | 521,245 |
| Minneapolis & St. Paul MN Metropolitan Airports Commission Subordinate Bond Series 2016C | | 5.00 | 1-1-2046 | 1,000,000 | 1,031,349 |
| Minneapolis & St. Paul MN Metropolitan Airports Commission Subordinate Bond Series 2016D | | 5.00 | 1-1-2041 | 250,000 | 254,231 |
The accompanying notes are an integral part of these financial statements.
10 | Allspring Minnesota Tax-Free Fund
Portfolio of investments—December 31, 2022 (unaudited)
| | | Interest
rate | Maturity
date | Principal | Value |
| Airport revenue (continued) | | | | | |
| Minneapolis & St. Paul MN Metropolitan Airports Commission Subordinate Bond Series 2019A | | 5.00% | 1-1-2031 | $ 500,000 | $ 557,669 |
| Minneapolis & St. Paul MN Metropolitan Airports Commission Subordinate Bond Series 2019A | | 5.00 | 1-1-2033 | 200,000 | 203,570 |
| Minneapolis & St. Paul MN Metropolitan Airports Commission Subordinate Bond Series 2019B | | 5.00 | 1-1-2025 | 1,000,000 | 1,029,138 |
| Minneapolis & St. Paul MN Metropolitan Airports Commission Subordinate Bond Series 2022A | | 5.00 | 1-1-2052 | 1,000,000 | 1,025,164 |
| | | | | | 6,552,565 |
| Education revenue: 21.37% | | | | | |
| Brooklyn Park MN Charter School Athlos Leadership Academy Project Series 2015A | | 5.50 | 7-1-2040 | 750,000 | 650,438 |
| Cologne MN Charter School Cologne Academy Project Series 2014A | | 5.00 | 7-1-2029 | 590,000 | 587,093 |
| Cologne MN Charter School Cologne Academy Project Series 2014A | | 5.00 | 7-1-2034 | 500,000 | 481,795 |
| Columbus MN Charter School New Millennium Academy Project Series 2015A | | 5.50 | 7-1-2030 | 1,000,000 | 965,504 |
| Deephaven MN Charter School Eagle Ridge Academy Project Series 2015A | | 5.25 | 7-1-2040 | 500,000 | 491,277 |
| Deephaven MN Charter School Eagle Ridge Academy Project Series 2016A | | 4.00 | 7-1-2025 | 125,000 | 122,907 |
| Deephaven MN Charter School Eagle Ridge Academy Project Series 2016A | | 4.00 | 7-1-2026 | 100,000 | 97,456 |
| Deephaven MN Charter School Eagle Ridge Academy Project Series 2016A | | 4.00 | 7-1-2027 | 100,000 | 96,606 |
| Deephaven MN Charter School Eagle Ridge Academy Project Series 2016A | | 5.25 | 7-1-2037 | 400,000 | 398,392 |
| Forest Lakes MN Charter School Lakes International Language Academy Project Series 2014A | | 5.50 | 8-1-2036 | 500,000 | 501,394 |
| Ham Lake MN Charter School DaVinci Academy Project Series 2012A | | 4.00 | 7-1-2028 | 370,000 | 350,887 |
| Ham Lake MN Charter School DaVinci Academy Project Series 2016A | | 5.00 | 7-1-2031 | 625,000 | 619,460 |
| Hugo MN Charter School Lease Revenue Bonds Noble Academy Project Series 2014A | | 5.00 | 7-1-2029 | 600,000 | 599,010 |
| Minneapolis MN Charter School Northeast College Preparatory Project | | 5.00 | 7-1-2055 | 700,000 | 567,452 |
| Minneapolis MN Charter School Yinghua Academy Project Series 2013A | | 5.00 | 7-1-2023 | 70,000 | 70,131 |
| Minnesota HEFAR Bethel University Series 2017 | | 5.00 | 5-1-2037 | 1,250,000 | 1,173,169 |
| Minnesota HEFAR College of St. Scholastica Series 2019 | | 4.00 | 12-1-2040 | 1,000,000 | 907,306 |
| Minnesota HEFAR College of St. Scholastica Series 7R | | 4.25 | 12-1-2027 | 400,000 | 400,057 |
| Minnesota HEFAR Hamline University Series 2017B | | 5.00 | 10-1-2035 | 1,000,000 | 1,018,328 |
| Minnesota HEFAR Macalester College | | 5.00 | 3-1-2028 | 400,000 | 432,780 |
| Minnesota HEFAR Macalester College | | 5.00 | 3-1-2030 | 500,000 | 544,421 |
| Minnesota HEFAR St. Benedict College Series 2017 | | 4.00 | 3-1-2036 | 410,000 | 391,728 |
| Minnesota HEFAR St. Catherine University Refunding Bond Series A | | 5.00 | 10-1-2025 | 570,000 | 593,831 |
| Minnesota HEFAR St. Catherine University Series A | | 5.00 | 10-1-2045 | 2,000,000 | 2,038,884 |
| Minnesota HEFAR St. John's University | | 4.00 | 10-1-2034 | 200,000 | 201,335 |
| Minnesota HEFAR St. John's University | | 4.00 | 10-1-2035 | 170,000 | 169,811 |
| Minnesota HEFAR St. John's University | | 4.00 | 10-1-2039 | 200,000 | 192,509 |
| Minnesota HEFAR St. John's University | | 4.00 | 10-1-2040 | 200,000 | 189,325 |
| Minnesota HEFAR St. Olaf College | | 4.00 | 10-1-2046 | 2,750,000 | 2,590,993 |
The accompanying notes are an integral part of these financial statements.
Allspring Minnesota Tax-Free Fund | 11
Portfolio of investments—December 31, 2022 (unaudited)
| | | Interest
rate | Maturity
date | Principal | Value |
| Education revenue (continued) | | | | | |
| Minnesota HEFAR St. Thomas University Green Bond Series A | | 5.00% | 10-1-2026 | $ 295,000 | $ 315,133 |
| Minnesota HEFAR St. Thomas University Green Bond Series A | | 5.00 | 10-1-2052 | 1,000,000 | 1,037,328 |
| Minnesota HEFAR St. Thomas University Series 2019 | | 4.00 | 10-1-2041 | 515,000 | 491,928 |
| Minnesota HEFAR St. Thomas University Series 2019 | | 5.00 | 10-1-2040 | 750,000 | 787,306 |
| Minnesota HEFAR St. Thomas University Series 8L | | 5.00 | 4-1-2028 | 920,000 | 973,957 |
| Minnesota HEFAR St. Thomas University Series 8L | | 5.00 | 4-1-2029 | 750,000 | 795,070 |
| Minnesota HEFAR St. Thomas University Series 8L | | 5.00 | 4-1-2035 | 750,000 | 786,608 |
| Minnesota HEFAR St. Thomas University Series 8L | | 5.00 | 10-1-2036 | 775,000 | 833,374 |
| Minnesota Office of Higher Education Supplemental Student Loan Program Revenue Bonds | | 4.00 | 11-1-2037 | 850,000 | 842,973 |
| Minnesota Office of Higher Education Supplemental Student Loan Program Revenue Bonds | | 5.00 | 11-1-2027 | 500,000 | 529,556 |
| Minnesota Office of Higher Education Supplemental Student Loan Program Revenue Bonds Series 2018 | | 5.00 | 11-1-2026 | 700,000 | 733,288 |
| Minnesota State Colleges & Universities Refunding Bonds Series 2017A | | 5.00 | 10-1-2027 | 500,000 | 545,548 |
| Moorhead MN Educational Facilities Revenue Bonds The Concordia College Corporation Project Series 2016 | | 5.00 | 12-1-2025 | 1,540,000 | 1,575,900 |
| Otsego MN Kaleidoscope Project Series 2014A | | 5.00 | 9-1-2034 | 1,100,000 | 1,043,964 |
| Otsego MN Kaleidoscope Project Series 2014A | | 4.15 | 9-1-2024 | 190,000 | 186,858 |
| Ramsey MN Charter School PACT Project Series 2022A | | 5.00 | 6-1-2032 | 1,000,000 | 974,340 |
| St. Cloud MN Charter School Lease Revenue Bonds Athlos Academy of St. Cloud Series A 144A | | 5.25 | 6-1-2032 | 355,000 | 333,981 |
| St. Cloud MN Charter School Lease Revenue Bonds Stride Academy Project Series 2016A | | 5.00 | 4-1-2036 | 750,000 | 612,238 |
| St. Paul MN Housing & RDA Charter School Hmong College Preparatory Academy Project Series 2016A | | 5.25 | 9-1-2031 | 1,000,000 | 1,003,224 |
| St. Paul MN Housing & RDA Charter School Hmong College Preparatory Academy Project Series 2020A | | 5.00 | 9-1-2055 | 400,000 | 345,116 |
| St. Paul MN Housing & RDA Charter School Lease Revenue Twin Cities Academy Project Series 2015A | | 5.00 | 7-1-2035 | 925,000 | 877,194 |
| St. Paul MN Housing & RDA Charter School Lease Revenue Twin Cities German Immersion School Project Series 2013A | | 4.00 | 7-1-2023 | 45,000 | 44,840 |
| St. Paul MN Housing & RDA Charter School Lease Revenue Twin Cities German Immersion School Project Series 2019A | | 5.00 | 7-1-2055 | 750,000 | 637,664 |
| St. Paul MN Housing & RDA Conservatory for Performing Artists Series A | | 4.00 | 3-1-2028 | 150,000 | 141,744 |
| St. Paul MN Housing & RDA Hope Community Academy Project Series 2015A | | 5.00 | 12-1-2034 | 1,645,000 | 1,542,286 |
| University of Minnesota Series 2017A | | 5.00 | 9-1-2042 | 770,000 | 820,891 |
| University of Minnesota Series 2019A | | 5.00 | 4-1-2034 | 270,000 | 303,131 |
| University of Minnesota Series 2019A | | 5.00 | 4-1-2044 | 2,000,000 | 2,157,794 |
| University of Minnesota State Supported Biomedical Science Series 2011B | | 5.00 | 8-1-2035 | 500,000 | 601,637 |
| Woodbury MN Charter School Refunding Bond MSA Building Company Series A | | 4.00 | 12-1-2050 | 500,000 | 413,355 |
| | | | | | 39,732,505 |
| GO revenue: 20.13% | | | | | |
| Becker MN Independent School District #726 Series 2022B (State School District Credit Program Insured) | | 4.00 | 2-1-2024 | 190,000 | 192,142 |
| Becker MN Independent School District #726 Series 2022B (State School District Credit Program Insured) | | 4.00 | 2-1-2026 | 100,000 | 103,180 |
The accompanying notes are an integral part of these financial statements.
12 | Allspring Minnesota Tax-Free Fund
Portfolio of investments—December 31, 2022 (unaudited)
| | | Interest
rate | Maturity
date | Principal | Value |
| GO revenue (continued) | | | | | |
| Brainerd MN Independent School District #181 School Building Series A (State School District Credit Program Insured) | | 4.00% | 2-1-2043 | $ 225,000 | $ 227,374 |
| Chaska MN Series C | | 5.00 | 2-1-2028 | 235,000 | 258,795 |
| Chaska MN Series C | | 5.00 | 2-1-2029 | 250,000 | 279,538 |
| Chaska MN Series C | | 5.00 | 2-1-2030 | 230,000 | 260,779 |
| Duluth MN Independent School District #709 Certificate of Participation Series 2019B (State School District Credit Program Insured) ¤ | | 0.00 | 2-1-2033 | 1,075,000 | 721,181 |
| Elk River MN Series A | | 3.00 | 12-1-2044 | 2,000,000 | 1,670,042 |
| Hastings MN Independent School District #200 CAB Series A (State School District Credit Program Insured) ¤ | | 0.00 | 2-1-2032 | 1,305,000 | 947,473 |
| Hastings MN Independent School District #200 CAB Series A (State School District Credit Program Insured) ¤ | | 0.00 | 2-1-2033 | 1,145,000 | 795,184 |
| Hennepin County MN Series 2016A | | 5.00 | 12-1-2041 | 1,000,000 | 1,063,885 |
| Hennepin County MN Series 2016B | | 5.00 | 12-1-2029 | 450,000 | 490,833 |
| Hennepin County MN Series 2017C | | 5.00 | 12-1-2031 | 2,000,000 | 2,171,384 |
| Hennepin County MN Series 2018A | | 5.00 | 12-1-2033 | 160,000 | 176,838 |
| Hennepin County MN Series 2018B (TD Bank NA SPA) ø | | 3.58 | 12-1-2038 | 2,375,000 | 2,375,000 |
| Long Prairie MN Sewer Revenue Bond Series 2018A (Minnesota Credit Program Insured) | | 5.00 | 2-1-2025 | 160,000 | 166,332 |
| Long Prairie MN Sewer Revenue Bond Series 2018A (Minnesota Credit Program Insured) | | 5.00 | 2-1-2026 | 185,000 | 196,063 |
| Minneapolis MN Special School District #1 Series A (State School District Credit Program Insured) | | 4.00 | 2-1-2040 | 1,150,000 | 1,155,208 |
| Minnesota Series A | | 5.00 | 8-1-2039 | 1,750,000 | 1,944,688 |
| Minnesota Trunk Highway Series B | | 4.00 | 8-1-2031 | 250,000 | 266,147 |
| Minnesota Various Purpose Bonds Series 2015A | | 5.00 | 8-1-2028 | 3,400,000 | 3,599,245 |
| Moorhead MN Improvement Bond Series C | | 4.00 | 2-1-2027 | 435,000 | 450,919 |
| Nashwauk-Keewatin MN Independent School District #319 Series 2022A (State School District Credit Program Insured) | | 5.00 | 2-1-2030 | 250,000 | 282,772 |
| Nashwauk-Keewatin MN Independent School District #319 Series 2022A (State School District Credit Program Insured) | | 5.00 | 2-1-2031 | 325,000 | 372,738 |
| Newfolden Minnesota Independent School District #441 School Building Series 2022A (State School District Credit Program Insured) | | 5.00 | 2-1-2037 | 250,000 | 276,857 |
| Newfolden Minnesota Independent School District #441 School Building Series 2022A (State School District Credit Program Insured) | | 5.00 | 2-1-2038 | 250,000 | 275,277 |
| North St. Paul-Maplewood Independent School District #622 Facilities Maintenance Series B (State School District Credit Program Insured) | | 4.00 | 2-1-2029 | 2,735,000 | 2,877,757 |
| Red Lake County MN Central Independent School District #2906 Series 2022A (State School District Credit Program Insured) | | 5.00 | 2-1-2030 | 275,000 | 314,068 |
| Red Lake County MN Central Independent School District #2906 Series 2022A (State School District Credit Program Insured) | | 5.00 | 2-1-2031 | 165,000 | 191,034 |
| Red Lake County MN Central Independent School District #2906 Series 2022A (State School District Credit Program Insured) | | 5.00 | 2-1-2032 | 250,000 | 291,578 |
| Red Lake County MN Central Independent School District #2906 Series 2022A (State School District Credit Program Insured) | | 5.00 | 2-1-2033 | 310,000 | 361,748 |
The accompanying notes are an integral part of these financial statements.
Allspring Minnesota Tax-Free Fund | 13
Portfolio of investments—December 31, 2022 (unaudited)
| | | Interest
rate | Maturity
date | Principal | Value |
| GO revenue (continued) | | | | | |
| Rosemount MN Independent School District #196 School Building Series 2016A (State School District Credit Program Insured) | | 5.00% | 2-1-2027 | $1,500,000 | $ 1,606,589 |
| Roseville MN Independent School District #623 School Building Series A (State School District Credit Program Insured) | | 5.00 | 2-1-2031 | 2,090,000 | 2,274,047 |
| Russell, Tyler, & Ruthton MN Independent School District #2902 School Building Series A (State School District Credit Program Insured) | | 5.00 | 2-1-2030 | 1,620,000 | 1,825,093 |
| Sartell MN Independent School District #748 St. Stephen Public Schools GO Series 2016A (State School District Credit Program Insured) | | 5.00 | 2-1-2027 | 1,450,000 | 1,516,024 |
| Shakopee MN Independent School District #720 Series A (State School District Credit Program Insured) ## | | 5.00 | 2-1-2023 | 1,000,000 | 1,001,457 |
| Shakopee MN Independent School District #720 Series B (State School District Credit Program Insured) | | 5.00 | 2-1-2025 | 405,000 | 423,107 |
| St. Cloud MN Independent School District #742 Series B (State School District Credit Program Insured) | | 5.00 | 2-1-2031 | 200,000 | 226,513 |
| St. Cloud MN Series A | | 4.00 | 2-1-2028 | 460,000 | 483,233 |
| St. Cloud MN Series A | | 4.00 | 2-1-2029 | 475,000 | 498,921 |
| St. Cloud MN Series A | | 4.00 | 2-1-2030 | 495,000 | 519,777 |
| St. Francis MN Independent School District #15 Series A (State School District Credit Program Insured) | | 5.00 | 2-1-2027 | 485,000 | 485,677 |
| St. Francis MN Independent School District #15 Series A (State School District Credit Program Insured) | | 5.00 | 2-1-2028 | 220,000 | 220,307 |
| Worthington MN Independent School District #518 School Building Series A (State School District Credit Program Insured) | | 4.00 | 2-1-2030 | 440,000 | 459,354 |
| Worthington MN Independent School District #518 School Building Series A (State School District Credit Program Insured) | | 4.00 | 2-1-2032 | 530,000 | 552,550 |
| Worthington MN Independent School District #518 School Building Series A (State School District Credit Program Insured) | | 4.00 | 2-1-2033 | 555,000 | 577,450 |
| | | | | | 37,426,158 |
| Health revenue: 18.20% | | | | | |
| Center City MN HCFR Hazelden Betty Ford Foundation Project Series 2014 | | 5.00 | 11-1-2026 | 750,000 | 765,684 |
| Center City MN HCFR Hazelden Betty Ford Foundation Project Series 2014 | | 5.00 | 11-1-2027 | 500,000 | 509,571 |
| Center City MN HCFR Hazelden Betty Ford Foundation Project Series 2014 | | 5.00 | 11-1-2029 | 300,000 | 304,104 |
| Duluth MN EDA HCFR Essentia Health Series A | | 5.00 | 2-15-2048 | 650,000 | 631,646 |
| Duluth MN EDA HCFR Essentia Health Series A | | 5.00 | 2-15-2058 | 1,450,000 | 1,416,093 |
| Duluth MN EDA HCFR Essentia Health Series A | | 5.25 | 2-15-2053 | 2,500,000 | 2,518,311 |
| Maple Grove MN HCFR Maple Grove Hospital Corporation | | 5.00 | 5-1-2030 | 850,000 | 891,816 |
| Maple Grove MN HCFR North Memorial Health Care Series 2015 | | 5.00 | 9-1-2023 | 655,000 | 661,971 |
| Maple Grove MN HCFR Series 2017 | | 5.00 | 5-1-2031 | 500,000 | 523,238 |
| Maple Grove MN HCFR Series 2017 | | 5.00 | 5-1-2032 | 500,000 | 520,425 |
| Minneapolis & St. Paul MN Housing & RDA Allina Health System | | 5.00 | 11-15-2025 | 225,000 | 237,957 |
| Minneapolis & St. Paul MN Housing & RDA Allina Health System | | 5.00 | 11-15-2026 | 645,000 | 693,289 |
The accompanying notes are an integral part of these financial statements.
14 | Allspring Minnesota Tax-Free Fund
Portfolio of investments—December 31, 2022 (unaudited)
| | | Interest
rate | Maturity
date | Principal | Value |
| Health revenue (continued) | | | | | |
| Minneapolis & St. Paul MN Housing & RDA Allina Health System | | 5.00% | 11-15-2029 | $1,000,000 | $ 1,123,670 |
| Minneapolis & St. Paul MN Housing & RDA Allina Health System Series 2017A | | 5.00 | 11-15-2029 | 1,000,000 | 1,080,653 |
| Minneapolis MN Health Care System Fairview Health Services Series 2015A | | 5.00 | 11-15-2033 | 2,000,000 | 2,071,389 |
| Minneapolis MN Health Care System Fairview Health Services Series 2018A | | 5.00 | 11-15-2035 | 270,000 | 285,501 |
| Minneapolis MN Health Care System Fairview Health Services Series 2018A | | 5.00 | 11-15-2036 | 1,100,000 | 1,158,501 |
| Minneapolis MN Health Care System Revenue Allina Health System | | 4.00 | 11-15-2038 | 975,000 | 943,861 |
| Minneapolis MN Health Care System Revenue Refunded Bond Fairview Health Services Series A | | 5.00 | 11-15-2033 | 1,000,000 | 1,069,344 |
| Minneapolis MN Health Care System Revenue Refunded Bond Fairview Health Services Series A | | 5.00 | 11-15-2049 | 1,000,000 | 1,019,954 |
| Plato MN Health Care Facilities Bond Glencoe Regional Health Services Project Series 2017 | | 5.00 | 4-1-2041 | 550,000 | 559,164 |
| Shakopee MN Senior Housing Revenue Benedictine Living Community LLC Project 144A | | 5.85 | 11-1-2058 | 745,000 | 732,042 |
| Shakopee MN St. Francis Regional Medical Center Series 2014 | | 5.00 | 9-1-2024 | 420,000 | 431,082 |
| Shakopee MN St. Francis Regional Medical Center Series 2014 | | 5.00 | 9-1-2027 | 700,000 | 715,715 |
| Shakopee MN St. Francis Regional Medical Center Series 2014 | | 5.00 | 9-1-2029 | 725,000 | 739,390 |
| St. Cloud MN Health Care CentraCare Health System Obligated Group Series A | | 5.00 | 5-1-2027 | 1,785,000 | 1,885,607 |
| St. Cloud MN Health Care CentraCare Health System Series A | | 5.00 | 5-1-2028 | 1,550,000 | 1,634,582 |
| St. Cloud MN Health Care Revenue Bonds Series 2016A | | 5.00 | 5-1-2030 | 2,000,000 | 2,101,918 |
| St. Cloud MN Health Care Revenue Bonds Series 2016A | | 5.00 | 5-1-2031 | 2,000,000 | 2,097,621 |
| St. Paul MN Housing & RDA Fairview Health Services Series 2017A | | 5.00 | 11-15-2034 | 565,000 | 595,257 |
| St. Paul MN Housing & RDA Healthfirst Care Systems Project Series 2015A | | 5.00 | 11-15-2027 | 1,000,000 | 1,058,632 |
| St. Paul MN Housing & RDA Healthpartners Obligation Group Series 2015A | | 5.00 | 7-1-2025 | 520,000 | 542,416 |
| St. Paul MN Housing & RDA Healthpartners Obligation Group Series 2015A | | 5.00 | 7-1-2028 | 225,000 | 234,109 |
| St. Paul MN Housing & RDA Healthpartners Obligation Group Series 2015A | | 5.00 | 7-1-2031 | 2,010,000 | 2,082,354 |
| | | | | | 33,836,867 |
| Housing revenue: 5.80% | | | | | |
| Minneapolis MN Student Housing Riverton Community Housing Project Series 2014 | | 5.00 | 8-1-2032 | 860,000 | 860,481 |
| Minnesota HFA Rental Housing Series C (Department of Housing and Urban Development Insured) | | 0.30 | 2-1-2024 | 1,500,000 | 1,450,932 |
| Minnesota HFA Residential Housing Series D (SIFMA Municipal Swap +0.43%)(GNMA / FNMA / FHLMC Insured) ± | | 4.09 | 1-1-2045 | 595,000 | 594,257 |
| Minnesota HFA Residential Housing Series E (GNMA / FNMA / FHLMC Insured) | | 1.75 | 1-1-2028 | 630,000 | 576,840 |
| Minnesota HFA Residential Housing Series E (GNMA / FNMA / FHLMC Insured) | | 1.75 | 7-1-2028 | 490,000 | 444,867 |
The accompanying notes are an integral part of these financial statements.
Allspring Minnesota Tax-Free Fund | 15
Portfolio of investments—December 31, 2022 (unaudited)
| | | Interest
rate | Maturity
date | Principal | Value |
| Housing revenue (continued) | | | | | |
| Minnesota HFA Residential Housing Series M (GNMA / FNMA / FHLMC Insured) | | 4.85% | 7-1-2037 | $3,055,000 | $ 3,185,829 |
| Minnesota HFA State Appropriation Bonds Series 2015A | | 4.00 | 8-1-2031 | 300,000 | 313,175 |
| Minnesota HFA State Appropriation Bonds Series 2015A | | 5.00 | 8-1-2027 | 1,665,000 | 1,718,102 |
| Minnesota HFA State Appropriation Bonds Series 2015A | | 5.00 | 8-1-2032 | 500,000 | 513,611 |
| Minnesota HFA State Appropriation Housing Infrastructure Series B | | 5.00 | 8-1-2029 | 320,000 | 361,787 |
| Minnesota HFA State Appropriation Housing Infrastructure Series B | | 5.00 | 8-1-2030 | 465,000 | 531,751 |
| Minnesota HFA State Appropriation Housing Infrastructure Series D | | 5.00 | 8-1-2028 | 200,000 | 222,512 |
| | | | | | 10,774,144 |
| Miscellaneous revenue: 11.64% | | | | | |
| Anoka Hennepin MN Independent School District #11 Certificate of Participation Series 2014A | | 5.00 | 2-1-2034 | 1,000,000 | 1,019,005 |
| Center City MN HCFR Hazelden Betty Ford Foundation Project Series 2019 | | 4.00 | 11-1-2030 | 250,000 | 243,751 |
| Center City MN HCFR Hazelden Betty Ford Foundation Project Series 2019 | | 4.00 | 11-1-2031 | 250,000 | 241,319 |
| Center City MN HCFR Hazelden Betty Ford Foundation Project Series 2019 | | 4.00 | 11-1-2034 | 300,000 | 283,446 |
| Duluth MN Independent School District #709 Certificate of Participation Series 2019A | | 4.00 | 3-1-2026 | 700,000 | 689,162 |
| Duluth MN Independent School District #709 Certificate of Participation Series 2019B (State School District Credit Program Insured) | | 5.00 | 2-1-2026 | 395,000 | 418,382 |
| Duluth MN Independent School District #709 Certificate of Participation Series 2019B (State School District Credit Program Insured) | | 5.00 | 2-1-2028 | 700,000 | 762,241 |
| Goodhue County MN Education District #6051 Red Wing Certificate of Participation Series 2014A | | 5.00 | 2-1-2029 | 750,000 | 766,814 |
| Lake Agassiz Education Cooperative #0397-52 Certificate of Participation Series A | | 3.00 | 2-1-2028 | 290,000 | 277,065 |
| Lake Agassiz Education Cooperative #0397-52 Certificate of Participation Series A | | 3.00 | 2-1-2029 | 300,000 | 284,965 |
| Lake Agassiz Education Cooperative #0397-52 Certificate of Participation Series A | | 3.00 | 2-1-2030 | 310,000 | 292,975 |
| Minneapolis MN Special School District #1 Certificate of Participation Series A | | 5.00 | 4-1-2024 | 300,000 | 307,699 |
| Minnesota Legislative Office Facility Project Certificate of Participation Series 2014 | | 5.00 | 6-1-2023 | 435,000 | 438,508 |
| Minnesota Rural Water Financial Authority Public Projects Construction Notes | | 2.63 | 12-1-2023 | 1,500,000 | 1,479,622 |
| Minnetonka MN Independent School District #276 Certificate of Participation Series 2016F | | 5.00 | 2-1-2025 | 205,000 | 205,302 |
| Minnetonka MN Independent School District #276 Certificate of Participation Series 2018C | | 5.75 | 2-1-2042 | 2,145,000 | 2,278,033 |
| Northeastern Minnesota Metropolitan Intermediate School District #916 Certificate of Participation Series 2013A | | 4.00 | 2-1-2024 | 1,100,000 | 1,100,794 |
| Northeastern Minnesota Metropolitan Intermediate School District #916 Certificate of Participation Series 2015B | | 5.00 | 2-1-2034 | 1,500,000 | 1,559,362 |
| Plymouth MN Intermediate School District #287 Certificate of Participation Series 2016A | | 4.00 | 5-1-2026 | 500,000 | 510,654 |
| Plymouth MN Intermediate School District #287 Certificate of Participation Series 2016A | | 4.00 | 5-1-2027 | 1,000,000 | 1,020,877 |
The accompanying notes are an integral part of these financial statements.
16 | Allspring Minnesota Tax-Free Fund
Portfolio of investments—December 31, 2022 (unaudited)
| | | Interest
rate | Maturity
date | Principal | Value |
| Miscellaneous revenue (continued) | | | | | |
| Plymouth MN Intermediate School District #287 Certificate of Participation Series A | | 4.00% | 2-1-2023 | $ 230,000 | $ 230,104 |
| Plymouth MN Intermediate School District #287 Certificate of Participation Series A | | 4.00 | 2-1-2024 | 130,000 | 131,122 |
| Plymouth MN Intermediate School District #287 Certificate of Participation Series A | | 4.00 | 2-1-2025 | 215,000 | 218,912 |
| St. Cloud MN Independent School District #742 Certificate of Participation Series 2017A | | 5.00 | 2-1-2032 | 500,000 | 519,890 |
| St. Cloud MN Independent School District #742 Certificate of Participation Series 2017A | | 5.00 | 2-1-2034 | 350,000 | 363,851 |
| St. Cloud MN Infrastructure Management Series B | | 4.00 | 2-1-2028 | 245,000 | 257,374 |
| St. Cloud MN Infrastructure Management Series B | | 4.00 | 2-1-2029 | 255,000 | 267,842 |
| St. Cloud MN Infrastructure Management Series B | | 4.00 | 2-1-2030 | 260,000 | 273,014 |
| St. Paul MN Independent School District #625 Certificate of Participation Series C (State School District Credit Program Insured) | | 5.00 | 2-1-2030 | 2,965,000 | 3,229,495 |
| White Bear Lake MN Independent School District #624 Certificate of Participation Series B | | 5.00 | 4-1-2026 | 830,000 | 884,007 |
| White Bear Lake MN Refunding Bonds YMCA of Greater Twin Cities Project Series 2018 | | 5.00 | 6-1-2032 | 1,000,000 | 1,074,072 |
| | | | | | 21,629,659 |
| Resource recovery revenue: 0.64% | | | | | |
| Douglas County MN Refunding Bond Solid Waste Series A | | 5.00 | 8-1-2030 | 1,055,000 | 1,196,388 |
| Tax revenue: 0.77% | | | | | |
| Hennepin County MN Series 2019B | | 5.00 | 12-15-2031 | 1,260,000 | 1,422,869 |
| Transportation revenue: 0.86% | | | | | |
| St. Paul MN Housing & RDA Parking Enterprise Refunding Bonds Series 2017A | | 4.00 | 8-1-2026 | 525,000 | 535,654 |
| St. Paul MN Housing & RDA Parking Enterprise Refunding Bonds Series 2017A | | 4.00 | 8-1-2027 | 545,000 | 554,795 |
| St. Paul MN Housing & RDA Parking Enterprise Refunding Bonds Series 2017A | | 5.00 | 8-1-2025 | 500,000 | 512,961 |
| | | | | | 1,603,410 |
| Utilities revenue: 9.77% | | | | | |
| Central Minnesota Municipal Power Agency Brookings Southeast Twin Cities Transmission Project Revenue Refunding Bonds Series 2021 (AGM Insured) | | 4.00 | 1-1-2042 | 350,000 | 344,476 |
| Central Minnesota Municipal Power Agency Brookings Southeast Twin Cities Transmission Project Revenue Refunding Bonds Series 2021 (AGM Insured) | | 5.00 | 1-1-2029 | 315,000 | 350,485 |
| Central Minnesota Municipal Power Agency Brookings Southeast Twin Cities Transmission Project Revenue Refunding Bonds Series 2021 (AGM Insured) | | 5.00 | 1-1-2030 | 210,000 | 236,822 |
| Central Minnesota Municipal Power Agency Brookings Southeast Twin Cities Transmission Project Revenue Refunding Bonds Series 2021 (AGM Insured) | | 5.00 | 1-1-2031 | 350,000 | 396,699 |
| Elk River MN Series B | | 5.00 | 8-1-2028 | 300,000 | 333,441 |
| Hutchinson MN Public Utility Revenue Refunding Bonds Series 2012A | | 5.00 | 12-1-2026 | 700,000 | 700,987 |
| Minnesota Municipal Gas Agency Series 2022 (Royal Bank of Canada LIQ) | | 4.00 | 12-1-2052 | 3,000,000 | 3,008,640 |
The accompanying notes are an integral part of these financial statements.
Allspring Minnesota Tax-Free Fund | 17
Portfolio of investments—December 31, 2022 (unaudited)
| | | Interest
rate | Maturity
date | Principal | Value |
| Utilities revenue (continued) | | | | | |
| Northern Minnesota Municipal Power Agency Electric System Series 2013A | | 4.00% | 1-1-2028 | $ 450,000 | $ 450,192 |
| Northern Minnesota Municipal Power Agency Electric System Series 2013A | | 5.00 | 1-1-2024 | 500,000 | 500,694 |
| Northern Minnesota Municipal Power Agency Electric System Series 2013A | | 5.00 | 1-1-2031 | 745,000 | 745,913 |
| Northern Minnesota Municipal Power Agency Electric System Series 2016 | | 5.00 | 1-1-2025 | 205,000 | 213,462 |
| Northern Minnesota Municipal Power Agency Electric System Series 2016 | | 5.00 | 1-1-2030 | 520,000 | 552,147 |
| Northern Minnesota Municipal Power Agency Electric System Series 2016 | | 5.00 | 1-1-2031 | 350,000 | 371,534 |
| Northern Minnesota Municipal Power Agency Electric System Series 2017 | | 5.00 | 1-1-2036 | 100,000 | 105,017 |
| Northern Minnesota Municipal Power Agency Electric System Series 2017 | | 5.00 | 1-1-2041 | 400,000 | 413,404 |
| Rochester MN Electric Utility Revenue Series 2013B | | 5.00 | 12-1-2025 | 315,000 | 321,047 |
| Rochester MN Electric Utility Revenue Series 2013B | | 5.00 | 12-1-2026 | 250,000 | 254,799 |
| Rochester MN Electric Utility Revenue Series 2017A | | 5.00 | 12-1-2037 | 500,000 | 530,810 |
| Southern Minnesota Municipal Power Agency Badger Coulee Project Series 2019A | | 5.00 | 1-1-2032 | 700,000 | 792,954 |
| Southern Minnesota Municipal Power Agency Badger Coulee Project Series 2019A | | 5.00 | 1-1-2033 | 560,000 | 631,023 |
| Southern Minnesota Municipal Power Agency Badger Coulee Project Series 2019A | | 5.00 | 1-1-2034 | 615,000 | 691,616 |
| Southern Minnesota Municipal Power Agency Series A | | 5.00 | 1-1-2041 | 480,000 | 502,085 |
| St. Paul MN Port Authority District Energy Revenue Series 1 | | 3.00 | 10-1-2023 | 200,000 | 199,723 |
| St. Paul MN Port Authority District Energy Revenue Series 1 | | 3.00 | 10-1-2027 | 100,000 | 98,239 |
| St. Paul MN Port Authority District Energy Revenue Series 1 | | 3.00 | 10-1-2034 | 225,000 | 202,018 |
| St. Paul MN Port Authority District Energy Revenue Series 1 | | 4.00 | 10-1-2028 | 400,000 | 415,303 |
| St. Paul MN Port Authority District Energy Revenue Series 1 | | 4.00 | 10-1-2041 | 500,000 | 467,633 |
| Western Minnesota Municipal Power Agency Revenue Refunding Series A | | 5.00 | 1-1-2030 | 625,000 | 708,203 |
| Western Minnesota Municipal Power Agency Series A | | 5.00 | 1-1-2027 | 1,565,000 | 1,565,000 |
| Western Minnesota Municipal Power Agency Series A | | 5.00 | 1-1-2030 | 1,000,000 | 1,000,000 |
| Western Minnesota Municipal Power Agency Series A | | 5.00 | 1-1-2031 | 1,000,000 | 1,062,707 |
| | | | | | 18,167,073 |
| | | | | | 172,341,638 |
| New York: 0.15% | | | | | |
| Health revenue: 0.15% | | | | | |
| Westchester County NY Local Development Corporation Kendal on Hudson Obligated Group Series B | | 5.00 | 1-1-2027 | 275,000 | 281,178 |
| Puerto Rico: 0.75% | | | | | |
| Health revenue: 0.75% | | | | | |
| Puerto Rico Industrial Tourist Educational Medical & Environmental Control Facilities Financing Authority Hospital Auxilio Mutuo Obligated Group Project | | 4.00 | 7-1-2037 | 275,000 | 247,680 |
The accompanying notes are an integral part of these financial statements.
18 | Allspring Minnesota Tax-Free Fund
Portfolio of investments—December 31, 2022 (unaudited)
| | | Interest
rate | Maturity
date | Principal | Value |
| Health revenue (continued) | | | | | |
| Puerto Rico Industrial Tourist Educational Medical & Environmental Control Facilities Financing Authority Hospital Auxilio Mutuo Obligated Group Project | | 5.00% | 7-1-2028 | $ 760,000 | $ 816,733 |
| Puerto Rico Industrial Tourist Educational Medical & Environmental Control Facilities Financing Authority Hospital Auxilio Mutuo Obligated Group Project 2021 | | 5.00 | 7-1-2031 | 300,000 | 330,746 |
| | | | | | 1,395,159 |
| Total Municipal obligations (Cost $185,831,114) | | | | | 179,347,290 |
| Total investments in securities (Cost $185,831,114) | 96.47% | | | | 179,347,290 |
| Other assets and liabilities, net | 3.53 | | | | 6,553,845 |
| Total net assets | 100.00% | | | | $185,901,135 |
| 144A | The security may be resold in transactions exempt from registration, normally to qualified institutional buyers, pursuant to Rule 144A under the Securities Act of 1933. |
| øø | The interest rate is determined and reset by the issuer periodically depending upon the terms of the security. The rate shown is the rate in effect at period end. |
| ¤ | The security is issued in zero coupon form with no periodic interest payments. |
| ø | Variable rate demand notes are subject to a demand feature which reduces the effective maturity. The maturity date shown represents the final maturity date of the security. The interest rate is determined and reset by the issuer daily, weekly, or monthly depending upon the terms of the security. The rate shown is the rate in effect at period end. |
| ## | All or a portion of this security is segregated for when-issued securities. |
| ± | Variable rate investment. The rate shown is the rate in effect at period end. |
| %% | The security is purchased on a when-issued basis. |
| Abbreviations: |
| AGM | Assured Guaranty Municipal |
| CAB | Capital appreciation bond |
| EDA | Economic Development Authority |
| FHLMC | Federal Home Loan Mortgage Corporation |
| FNMA | Federal National Mortgage Association |
| GNMA | Government National Mortgage Association |
| GO | General obligation |
| HCFR | Healthcare facilities revenue |
| HEFAR | Higher Education Facilities Authority Revenue |
| HFA | Housing Finance Authority |
| LIQ | Liquidity agreement |
| RDA | Redevelopment Authority |
| SIFMA | Securities Industry and Financial Markets Association |
| SPA | Standby purchase agreement |
The accompanying notes are an integral part of these financial statements.
Allspring Minnesota Tax-Free Fund | 19
Statement of assets and liabilities—December 31, 2022 (unaudited)
| | |
| Assets | |
Investments in unaffiliated securities, at value (cost $185,831,114)
| $ 179,347,290 |
Cash
| 4,287,904 |
Receivable for interest
| 2,567,304 |
Receivable for Fund shares sold
| 1,624,138 |
Receivable for investments sold
| 165,000 |
Prepaid expenses and other assets
| 59,536 |
Total assets
| 188,051,172 |
| Liabilities | |
Payable for Fund shares redeemed
| 1,648,796 |
Payable for when-issued transactions
| 330,834 |
Dividends payable
| 67,820 |
Management fee payable
| 51,334 |
Administration fees payable
| 16,500 |
Distribution fee payable
| 787 |
Accrued expenses and other liabilities
| 33,966 |
Total liabilities
| 2,150,037 |
Total net assets
| $185,901,135 |
| Net assets consist of | |
Paid-in capital
| $ 192,388,709 |
Total distributable loss
| (6,487,574) |
Total net assets
| $185,901,135 |
| Computation of net asset value and offering price per share | |
Net assets – Class A
| $ 24,109,720 |
Shares outstanding – Class A1
| 2,402,689 |
Net asset value per share – Class A
| $10.03 |
Maximum offering price per share – Class A2
| $10.50 |
Net assets – Class C
| $ 1,207,399 |
Shares outstanding – Class C1
| 120,312 |
Net asset value per share – Class C
| $10.04 |
Net assets – Administrator Class
| $ 44,220,196 |
Shares outstanding – Administrator Class1
| 4,407,211 |
Net asset value per share – Administrator Class
| $10.03 |
Net assets – Institutional Class
| $ 116,363,820 |
Shares outstanding – Institutional Class1
| 11,589,958 |
Net asset value per share – Institutional Class
| $10.04 |
| 1 | The Fund has an unlimited number of authorized shares. |
| 2 | Maximum offering price is computed as 100/95.50 of net asset value. On investments of $50,000 or more, the offering price is reduced. |
The accompanying notes are an integral part of these financial statements.
20 | Allspring Minnesota Tax-Free Fund
Statement of operations—six months ended December 31, 2022 (unaudited)
| | |
| Investment income | |
Interest
| $ 2,706,013 |
| Expenses | |
Management fee
| 382,299 |
| Administration fees | |
Class A
| 21,157 |
Class C
| 932 |
Administrator Class
| 26,359 |
Institutional Class
| 44,328 |
| Shareholder servicing fees | |
Class A
| 33,047 |
Class C
| 1,441 |
Administrator Class
| 65,369 |
| Distribution fee | |
Class C
| 4,323 |
Custody and accounting fees
| 4,768 |
Professional fees
| 32,011 |
Registration fees
| 26,033 |
Shareholder report expenses
| 16,349 |
Trustees’ fees and expenses
| 11,158 |
Other fees and expenses
| 3,208 |
Total expenses
| 672,782 |
| Less: Fee waivers and/or expense reimbursements | |
Fund-level
| (46,486) |
Class A
| (1,297) |
Administrator Class
| (51,726) |
Institutional Class
| (5,441) |
Net expenses
| 567,832 |
Net investment income
| 2,138,181 |
| Realized and unrealized gains (losses) on investments | |
Net realized losses on investments
| (547,360) |
Net change in unrealized gains (losses) on investments
| (826,253) |
Net realized and unrealized gains (losses) on investments
| (1,373,613) |
Net increase in net assets resulting from operations
| $ 764,568 |
The accompanying notes are an integral part of these financial statements.
Allspring Minnesota Tax-Free Fund | 21
Statement of changes in net assets
| | | | | |
| | Six months ended
December 31, 2022
(unaudited) | Year ended
June 30, 2022 |
| Operations | | | | |
Net investment income
| | $ 2,138,181 | | $ 3,555,926 |
Net realized losses on investments
| | (547,360) | | (285,208) |
Net change in unrealized gains (losses) on investments
| | (826,253) | | (14,731,962) |
Net increase (decrease) in net assets resulting from operations
| | 764,568 | | (11,461,244) |
| Distributions to shareholders from | | | | |
| Net investment income and net realized gains | | | | |
Class A
| | (261,470) | | (530,893) |
Class C
| | (7,185) | | (18,937) |
Administrator Class
| | (586,566) | | (1,225,069) |
Institutional Class
| | (1,282,960) | | (2,025,072) |
Total distributions to shareholders
| | (2,138,181) | | (3,799,971) |
| Capital share transactions | Shares | | Shares | |
| Proceeds from shares sold | | | | |
Class A
| 144,528 | 1,447,760 | 175,543 | 1,829,918 |
Class C
| 39,093 | 389,185 | 11,415 | 122,003 |
Administrator Class
| 1,318,646 | 13,221,582 | 1,338,902 | 14,180,966 |
Institutional Class
| 6,224,923 | 62,274,797 | 7,339,926 | 75,455,903 |
| | | 77,333,324 | | 91,588,790 |
| Reinvestment of distributions | | | | |
Class A
| 25,756 | 257,572 | 49,574 | 529,205 |
Class C
| 710 | 7,094 | 1,768 | 18,934 |
Administrator Class
| 57,908 | 578,883 | 114,150 | 1,218,535 |
Institutional Class
| 96,783 | 967,927 | 135,521 | 1,445,764 |
| | | 1,811,476 | | 3,212,438 |
| Payment for shares redeemed | | | | |
Class A
| (480,633) | (4,778,779) | (378,627) | (4,030,884) |
Class C
| (32,913) | (325,214) | (86,673) | (903,922) |
Administrator Class
| (2,269,142) | (22,738,862) | (1,665,542) | (17,447,828) |
Institutional Class
| (5,029,395) | (50,357,471) | (5,504,066) | (56,987,358) |
| | | (78,200,326) | | (79,369,992) |
Net increase in net assets resulting from capital share transactions
| | 944,474 | | 15,431,236 |
Total increase (decrease) in net assets
| | (429,139) | | 170,021 |
| Net assets | | | | |
Beginning of period
| | 186,330,274 | | 186,160,253 |
End of period
| | $185,901,135 | | $186,330,274 |
The accompanying notes are an integral part of these financial statements.
22 | Allspring Minnesota Tax-Free Fund
Financial highlights
(For a share outstanding throughout each period)
| | | Year ended June 30 |
| Class A | Six months ended
December 31, 2022
(unaudited) | 2022 | 2021 | 2020 | 2019 | 2018 |
Net asset value, beginning of period
| $10.11 | $11.02 | $10.86 | $10.77 | $10.51 | $10.68 |
Net investment income
| 0.10 1 | 0.18 | 0.20 1 | 0.23 | 0.27 1 | 0.28 1 |
Net realized and unrealized gains (losses) on investments
| (0.08) | (0.90) | 0.16 | 0.09 | 0.26 | (0.16) |
Total from investment operations
| 0.02 | (0.72) | 0.36 | 0.32 | 0.53 | 0.12 |
| Distributions to shareholders from | | | | | | |
Net investment income
| (0.10) | (0.18) | (0.20) | (0.23) | (0.27) | (0.28) |
Net realized gains
| 0.00 | (0.01) | 0.00 | 0.00 | 0.00 | (0.01) |
Total distributions to shareholders
| (0.10) | (0.19) | (0.20) | (0.23) | (0.27) | (0.29) |
Net asset value, end of period
| $10.03 | $10.11 | $11.02 | $10.86 | $10.77 | $10.51 |
Total return2
| 0.21% | (6.59)% | 3.32% | 2.99% | 5.13% | 1.10% |
| Ratios to average net assets (annualized) | | | | | | |
Gross expenses
| 0.91% | 0.91% | 0.92% | 0.93% | 0.94% | 0.85% |
Net expenses
| 0.85% | 0.85% | 0.85% | 0.85% | 0.85% | 0.84% |
Net investment income
| 1.98% | 1.67% | 1.80% | 2.12% | 2.57% | 2.64% |
| Supplemental data | | | | | | |
Portfolio turnover rate
| 9% | 11% | 9% | 16% | 18% | 15% |
Net assets, end of period (000s omitted)
| $24,110 | $27,431 | $31,586 | $29,317 | $27,399 | $29,554 |
| 1 | Calculated based upon average shares outstanding |
| 2 | Total return calculations do not include any sales charges. Returns for periods of less than one year are not annualized. |
The accompanying notes are an integral part of these financial statements.
Allspring Minnesota Tax-Free Fund | 23
Financial highlights
(For a share outstanding throughout each period)
| | | Year ended June 30 |
| Class C | Six months ended
December 31, 2022
(unaudited) | 2022 | 2021 | 2020 | 2019 | 2018 |
Net asset value, beginning of period
| $10.11 | $11.02 | $10.86 | $10.77 | $10.51 | $10.68 |
Net investment income
| 0.06 1 | 0.10 1 | 0.12 1 | 0.15 1 | 0.19 | 0.20 |
Net realized and unrealized gains (losses) on investments
| (0.07) | (0.90) | 0.16 | 0.09 | 0.26 | (0.16) |
Total from investment operations
| (0.01) | (0.80) | 0.28 | 0.24 | 0.45 | 0.04 |
| Distributions to shareholders from | | | | | | |
Net investment income
| (0.06) | (0.10) | (0.12) | (0.15) | (0.19) | (0.20) |
Net realized gains
| 0.00 | (0.01) | 0.00 | 0.00 | 0.00 | (0.01) |
Total distributions to shareholders
| (0.06) | (0.11) | (0.12) | (0.15) | (0.19) | (0.21) |
Net asset value, end of period
| $10.04 | $10.11 | $11.02 | $10.86 | $10.77 | $10.51 |
Total return2
| (0.07)% | (7.29)% | 2.54% | 2.22% | 4.35% | 0.34% |
| Ratios to average net assets (annualized) | | | | | | |
Gross expenses
| 1.65% | 1.66% | 1.66% | 1.68% | 1.69% | 1.59% |
Net expenses
| 1.60% | 1.60% | 1.60% | 1.60% | 1.60% | 1.59% |
Net investment income
| 1.23% | 0.91% | 1.06% | 1.37% | 1.83% | 1.89% |
| Supplemental data | | | | | | |
Portfolio turnover rate
| 9% | 11% | 9% | 16% | 18% | 15% |
Net assets, end of period (000s omitted)
| $1,207 | $1,147 | $2,060 | $4,020 | $5,254 | $7,387 |
| 1 | Calculated based upon average shares outstanding |
| 2 | Total return calculations do not include any sales charges. Returns for periods of less than one year are not annualized. |
The accompanying notes are an integral part of these financial statements.
24 | Allspring Minnesota Tax-Free Fund
Financial highlights
(For a share outstanding throughout each period)
| | | Year ended June 30 |
| Administrator Class | Six months ended
December 31, 2022
(unaudited) | 2022 | 2021 | 2020 | 2019 | 2018 |
Net asset value, beginning of period
| $10.11 | $11.02 | $10.86 | $10.76 | $10.51 | $10.68 |
Net investment income
| 0.11 1 | 0.21 | 0.23 1 | 0.26 1 | 0.30 1 | 0.31 1 |
Net realized and unrealized gains (losses) on investments
| (0.08) | (0.90) | 0.16 | 0.10 | 0.25 | (0.16) |
Total from investment operations
| 0.03 | (0.69) | 0.39 | 0.36 | 0.55 | 0.15 |
| Distributions to shareholders from | | | | | | |
Net investment income
| (0.11) | (0.21) | (0.23) | (0.26) | (0.30) | (0.31) |
Net realized gains
| 0.00 | (0.01) | 0.00 | 0.00 | 0.00 | (0.01) |
Total distributions to shareholders
| (0.11) | (0.22) | (0.23) | (0.26) | (0.30) | (0.32) |
Net asset value, end of period
| $10.03 | $10.11 | $11.02 | $10.86 | $10.76 | $10.51 |
Total return2
| 0.33% | (6.35)% | 3.58% | 3.34% | 5.29% | 1.34% |
| Ratios to average net assets (annualized) | | | | | | |
Gross expenses
| 0.85% | 0.85% | 0.86% | 0.87% | 0.88% | 0.78% |
Net expenses
| 0.60% | 0.60% | 0.60% | 0.60% | 0.60% | 0.60% |
Net investment income
| 2.23% | 1.92% | 2.06% | 2.38% | 2.81% | 2.89% |
| Supplemental data | | | | | | |
Portfolio turnover rate
| 9% | 11% | 9% | 16% | 18% | 15% |
Net assets, end of period (000s omitted)
| $44,220 | $53,578 | $60,727 | $69,954 | $95,072 | $85,259 |
| 1 | Calculated based upon average shares outstanding |
| 2 | Returns for periods of less than one year are not annualized. |
The accompanying notes are an integral part of these financial statements.
Allspring Minnesota Tax-Free Fund | 25
Financial highlights
(For a share outstanding throughout each period)
| | | Year ended June 30 |
| Institutional Class | Six months ended
December 31, 2022
(unaudited) | 2022 | 2021 | 2020 | 2019 | 2018 |
Net asset value, beginning of period
| $10.12 | $11.02 | $10.87 | $10.77 | $10.52 | $10.69 |
Net investment income
| 0.12 | 0.21 | 0.23 | 0.26 | 0.30 | 0.32 |
Net realized and unrealized gains (losses) on investments
| (0.08) | (0.89) | 0.15 | 0.10 | 0.25 | (0.16) |
Total from investment operations
| 0.04 | (0.68) | 0.38 | 0.36 | 0.55 | 0.16 |
| Distributions to shareholders from | | | | | | |
Net investment income
| (0.12) | (0.21) | (0.23) | (0.26) | (0.30) | (0.32) |
Net realized gains
| 0.00 | (0.01) | 0.00 | 0.00 | 0.00 | (0.01) |
Total distributions to shareholders
| (0.12) | (0.22) | (0.23) | (0.26) | (0.30) | (0.33) |
Net asset value, end of period
| $10.04 | $10.12 | $11.02 | $10.87 | $10.77 | $10.52 |
Total return1
| 0.47% | (6.19)% | 3.56% | 3.42% | 5.37% | 1.43% |
| Ratios to average net assets (annualized) | | | | | | |
Gross expenses
| 0.58% | 0.58% | 0.59% | 0.60% | 0.61% | 0.52% |
Net expenses
| 0.52% | 0.52% | 0.52% | 0.52% | 0.52% | 0.52% |
Net investment income
| 2.31% | 2.01% | 2.13% | 2.43% | 2.89% | 2.98% |
| Supplemental data | | | | | | |
Portfolio turnover rate
| 9% | 11% | 9% | 16% | 18% | 15% |
Net assets, end of period (000s omitted)
| $116,364 | $104,175 | $91,787 | $70,383 | $35,630 | $29,639 |
| 1 | Returns for periods of less than one year are not annualized. |
The accompanying notes are an integral part of these financial statements.
26 | Allspring Minnesota Tax-Free Fund
Notes to financial statements (unaudited)
1. ORGANIZATION
Allspring Funds Trust (the "Trust"), a Delaware statutory trust organized on March 10, 1999, is an open-end management investment company registered under the Investment Company Act of 1940, as amended (the "1940 Act"). As an investment company, the Trust follows the accounting and reporting guidance in Financial Accounting Standards Board ("FASB") Accounting Standards Codification Topic 946, Financial Services – Investment Companies. These financial statements report on the Allspring Minnesota Tax-Free Fund (the "Fund") which is a diversified series of the Trust.
2. SIGNIFICANT ACCOUNTING POLICIES
The following significant accounting policies, which are consistently followed in the preparation of the financial statements of the Fund, are in conformity with U.S. generally accepted accounting principles which require management to make estimates and assumptions that affect the reported amounts of assets and liabilities, disclosure of contingent assets and liabilities at the date of the financial statements, and the reported amounts of income and expenses during the reporting period. Actual results could differ from those estimates.
Securities valuation
All investments are valued each business day as of the close of regular trading on the New York Stock Exchange (generally 4 p.m. Eastern Time), although the Fund may deviate from this calculation time under unusual or unexpected circumstances.
Debt securities are valued at the evaluated bid price provided by an independent pricing service (e.g. taking into account various factors, including yields, maturities, or credit ratings) or, if a reliable price is not available, the quoted bid price from an independent broker-dealer.
Futures contracts that are listed on a foreign or domestic exchange or market are valued at the official closing price or, if none, the last sales price.
Investments which are not valued using the methods discussed above are valued at their fair value, as determined in good faith by Allspring Funds Management, LLC ("Allspring Funds Management"), which was named the valuation designee by the Board of Trustees. As the valuation designee, Allspring Funds Management is responsible for day-to-day valuation activities for the Allspring Funds. In connection with these responsibilities, Allspring Funds Management has established a Valuation Committee and has delegated to it the authority to take any actions regarding the valuation of portfolio securities that the Valuation Committee deems necessary or appropriate, including determining the fair value of portfolio securities. On a quarterly basis, the Board of Trustees receives reports of valuation actions taken by the Valuation Committee. On at least an annual basis, the Board of Trustees receives an assessment of the adequacy and effectiveness of Allspring Funds Management's process for determining the fair value of the portfolio of investments.
When-issued transactions
The Fund may purchase securities on a forward commitment or when-issued basis. The Fund records a when-issued transaction on the trade date and will segregate assets in an amount at least equal in value to the Fund's commitment to purchase when-issued securities. Securities purchased on a when-issued basis are marked-to-market daily and the Fund begins earning interest on the settlement date. Losses may arise due to changes in the market value of the underlying securities or if the counterparty does not perform under the contract.
Futures contracts
Futures contracts are agreements between the Fund and a counterparty to buy or sell a specific amount of a commodity, financial instrument or currency at a specified price on a specified date. The Fund may buy and sell futures contracts in order to gain exposure to, or protect against, changes in interest rates and is subject to interest rate risk. The primary risks associated with the use of futures contracts are the imperfect correlation between changes in market values of securities held by the Fund and the prices of futures contracts, and the possibility of an illiquid market. Futures contracts are generally entered into on a regulated futures exchange and cleared through a clearinghouse associated with the exchange. With futures contracts, there is minimal counterparty risk to the Fund since futures contracts are exchange traded and the exchange’s clearinghouse, as the counterparty to all exchange-traded futures, guarantees the futures contracts against default.
Upon entering into a futures contract, the Fund is required to deposit either cash or securities (initial margin) with the broker in an amount equal to a certain percentage of the contract value. Subsequent payments (variation margin) are paid to or from the broker each day equal to the daily changes in the contract value. Such payments are recorded as unrealized gains or losses and, if any, shown as variation margin receivable (payable) in the Statement of Assets and Liabilities. Should the Fund fail to make requested variation margin payments, the broker can gain access to the initial margin to satisfy the Fund’s payment obligations. When the contracts are closed, a realized gain or loss is recorded in the Statement of Operations.
Allspring Minnesota Tax-Free Fund | 27
Notes to financial statements (unaudited)
Security transactions and income recognition
Securities transactions are recorded on a trade date basis. Realized gains or losses are recorded on the basis of identified cost.
Interest income is accrued daily and bond discounts are accreted and premiums are amortized daily. To the extent debt obligations are placed on non-accrual status, any related interest income may be reduced by writing off interest receivables when the collection of all or a portion of interest has been determined to be doubtful based on consistently applied procedures and the fair value has decreased. If the issuer subsequently resumes interest payments or when the collectability of interest is reasonably assured, the debt obligation is removed from non-accrual status.
Distributions to shareholders
Distributions to shareholders from net investment income are declared daily and paid monthly. Distributions from net realized gains, if any, are recorded on the ex-dividend date and paid at least annually. Such distributions are determined in accordance with income tax regulations and may differ from U.S. generally accepted accounting principles. Dividend sources are estimated at the time of declaration. The tax character of distributions is determined as of the Fund's fiscal year end. Therefore, a portion of the Fund's distributions made prior to the Fund’s fiscal year end may be categorized as a tax return of capital at year end.
Federal and other taxes
The Fund intends to continue to qualify as a regulated investment company by distributing substantially all of its investment company taxable and tax-exempt income and any net realized capital gains (after reduction for capital loss carryforwards) sufficient to relieve it from all, or substantially all, federal income taxes. Accordingly, no provision for federal income taxes was required.
The Fund’s income and federal excise tax returns and all financial records supporting those returns for the prior three fiscal years are subject to examination by the federal and Delaware revenue authorities. Management has analyzed the Fund's tax positions taken on federal, state, and foreign tax returns, as applicable, for all open tax years and does not believe that there are any uncertain tax positions that require recognition of a tax liability.
As of December 31, 2022, the aggregate cost of all investments for federal income tax purposes was $185,831,112 and the unrealized gains (losses) consisted of:
| Gross unrealized gains | $ 412,611 |
| Gross unrealized losses | (6,896,433) |
| Net unrealized losses | $(6,483,822) |
As of June 30, 2022, the Fund had capital loss carryforwards which consisted of $134,095 in short-term capital losses and $151,113 in long-term capital losses.
Class allocations
The separate classes of shares offered by the Fund differ principally in applicable sales charges, distribution, shareholder servicing, and administration fees. Class specific expenses are charged directly to that share class. Investment income, common fund-level expenses, and realized and unrealized gains (losses) on investments are allocated daily to each class of shares based on the relative proportion of net assets of each class.
3. FAIR VALUATION MEASUREMENTS
Fair value measurements of investments are determined within a framework that has established a fair value hierarchy based upon the various data inputs utilized in determining the value of the Fund’s investments. The three-level hierarchy gives the highest priority to unadjusted quoted prices in active markets for identical assets or liabilities (Level 1) and the lowest priority to unobservable inputs (Level 3). The Fund’s investments are classified within the fair value hierarchy based on the lowest level of input that is significant to the fair value measurement. The inputs are summarized into three broad levels as follows:
| ■ | Level 1 – quoted prices in active markets for identical securities |
| ■ | Level 2 – other significant observable inputs (including quoted prices for similar securities, interest rates, prepayment speeds, credit risk, etc.) |
| ■ | Level 3 – significant unobservable inputs (including the Fund’s own assumptions in determining the fair value of investments) |
The inputs or methodologies used for valuing investments in securities are not necessarily an indication of the risk associated with investing in those securities.
28 | Allspring Minnesota Tax-Free Fund
Notes to financial statements (unaudited)
The following is a summary of the inputs used in valuing the Fund’s assets and liabilities as of December 31, 2022:
| | Quoted prices
(Level 1) | Other significant
observable inputs
(Level 2) | Significant
unobservable inputs
(Level 3) | Total |
| Assets | | | | |
| Investments in: | | | | |
| Municipal obligations | $0 | $179,347,290 | $0 | $179,347,290 |
Additional sector, industry or geographic detail, if any, is included in the Portfolio of Investments.
For the six months ended December 31, 2022, the Fund did not have any transfers into/out of Level 3.
4. TRANSACTIONS WITH AFFILIATES
Management fee
Allspring Funds Management, a wholly owned subsidiary of Allspring Global Investments Holdings, LLC, a holding company indirectly owned by certain private funds of GTCR LLC and Reverence Capital Partners, L.P., is the manager of the Fund and provides advisory and fund-level administrative services under an investment management agreement. Under the investment management agreement, Allspring Funds Management is responsible for, among other services, implementing the investment objectives and strategies of the Fund, supervising the subadviser and providing fund-level administrative services in connection with the Fund’s operations. As compensation for its services under the investment management agreement, Allspring Funds Management is entitled to receive a management fee at the following annual rate based on the Fund’s average daily net assets:
| Average daily net assets | Management fee |
| First $500 million | 0.400% |
| Next $500 million | 0.375 |
| Next $2 billion | 0.350 |
| Next $2 billion | 0.325 |
| Next $5 billion | 0.290 |
| Over $10 billion | 0.280 |
For the six months ended December 31, 2022, the management fee was equivalent to an annual rate of 0.40% of the Fund’s average daily net assets.
Allspring Funds Management has retained the services of a subadviser to provide daily portfolio management to the Fund. The fee for subadvisory services is borne by Allspring Funds Management. Allspring Global Investments, LLC, an affiliate of Allspring Funds Management and a wholly owned subsidiary of Allspring Global Investments Holdings, LLC, is the subadviser to the Fund and is entitled to receive a fee from Allspring Funds Management at an annual rate starting at 0.20% and declining to 0.10% as the average daily net assets of the Fund increase.
Administration fees
Under a class-level administration agreement, Allspring Funds Management provides class-level administrative services to the Fund, which includes paying fees and expenses for services provided by the transfer agent, sub-transfer agents, omnibus account servicers and record-keepers. As compensation for its services under the class-level administration agreement, Allspring Funds Management receives an annual fee which is calculated based on the average daily net assets of each class as follows:
| | Class-level
administration fee |
| Class A | 0.16% |
| Class C | 0.16 |
| Administrator Class | 0.10 |
| Institutional Class | 0.08 |
Allspring Minnesota Tax-Free Fund | 29
Notes to financial statements (unaudited)
Waivers and/or expense reimbursements
Allspring Funds Management has contractually committed to waive and/or reimburse management and administration fees to the extent necessary to maintain certain net operating expense ratios for the Fund. When each class of the Fund has exceeded its expense cap, Allspring Funds Management will waive fees and/or reimburse expenses from fund-level expenses on a proportionate basis and then from class specific expenses. When only certain classes exceed their expense caps, waivers and/or reimbursements are applied against class specific expenses before fund-level expenses. Allspring Funds Management has contractually committed through October 31, 2023 to waive fees and/or reimburse expenses to the extent necessary to cap expenses. Prior to or after the commitment expiration date, the caps may be increased or the commitment to maintain the caps may be terminated only with the approval of the Board of Trustees. As of December 31, 2022, the contractual expense caps are as follows:
| | Expense ratio caps |
| Class A | 0.85% |
| Class C | 1.60 |
| Administrator Class | 0.60 |
| Institutional Class | 0.52 |
Distribution fee
The Trust has adopted a distribution plan for Class C shares pursuant to Rule 12b-1 under the 1940 Act. A distribution fee is charged to Class C shares and paid to Allspring Funds Distributor, LLC ("Allspring Funds Distributor"), the principal underwriter, an affiliate of Allspring Funds Management, at an annual rate up to 0.75% of the average daily net assets of Class C shares.
In addition, Allspring Funds Distributor is entitled to receive the front-end sales charge from the purchase of Class A shares and a contingent deferred sales charge on the redemption of certain Class A shares. Allspring Funds Distributor is also entitled to receive the contingent deferred sales charges from redemptions of Class C shares. For the six months ended December 31, 2022, Allspring Funds Distributor received $19 from the sale of Class A shares. No contingent deferred sales charges were incurred by Class A and Class C shares for the six months ended December 31, 2022.
Shareholder servicing fees
The Trust has entered into contracts with one or more shareholder servicing agents, whereby Class A, Class C and Administrator Class are charged a fee at an annual rate up to 0.25% of the average daily net assets of each respective class. A portion of these total shareholder servicing fees were paid to affiliates of the Fund.
Interfund transactions
The Fund may purchase or sell portfolio investment securities to certain affiliates pursuant to Rule 17a-7 under the 1940 Act and under procedures adopted by the Board of Trustees. The procedures have been designed to ensure that these interfund transactions, which do not incur broker commissions, are effected at current market prices.
5. INVESTMENT PORTFOLIO TRANSACTIONS
Purchases and sales of investments, excluding U.S. government obligations (if any) and short-term securities, for the six months ended December 31, 2022 were $16,680,853 and $21,870,681, respectively.
6. BANK BORROWINGS
The Trust (excluding the money market funds), Allspring Master Trust and Allspring Variable Trust are parties to a $350,000,000 revolving credit agreement whereby the Fund is permitted to use bank borrowings for temporary or emergency purposes, such as to fund shareholder redemption requests. Interest under the credit agreement is charged to the Fund based on a borrowing rate equal to the higher of the Federal Funds rate or the overnight bank funding rate in effect on that day plus a spread. In addition, an annual commitment fee equal based on the unused balance is allocated to each participating fund.
For the six months ended December 31, 2022, there were no borrowings by the Fund under the agreement.
30 | Allspring Minnesota Tax-Free Fund
Notes to financial statements (unaudited)
7. CONCENTRATION RISK
The Fund invests a substantial portion of its assets in issuers of municipal debt securities located in a single state or territory of the U.S. Therefore, it may be more affected by economic and political developments in that state or region than would be a comparable general tax-exempt fund. As of the end of the period, the Fund's investments were concentrated in the state of Minnesota.
8. MARKET RISKS
On March 11, 2020, the World Health Organization announced that it had made the assessment that coronavirus disease 2019 (“COVID-19”) is a pandemic. The impacts of COVID-19 are affecting the entire global economy, individual companies and investment products, the funds, and the market in general. There is significant uncertainty around the extent and duration of business disruptions related to COVID-19 and the impacts may last for an extended period of time. COVID-19 has led to significant uncertainty and volatility in the financial markets.
9. INDEMNIFICATION
Under the Fund's organizational documents, the officers and Trustees have been granted certain indemnification rights against certain liabilities that may arise out of performance of their duties to the Fund. The Fund has entered into a separate agreement with each Trustee that converts indemnification rights currently existing under the Fund’s organizational documents into contractual rights that cannot be changed in the future without the consent of the Trustee. Additionally, in the normal course of business, the Fund may enter into contracts with service providers that contain a variety of indemnification clauses. The Fund’s maximum exposure under these arrangements is dependent on future claims that may be made against the Fund and, therefore, cannot be estimated.
Allspring Minnesota Tax-Free Fund | 31
Other information (unaudited)
PROXY VOTING INFORMATION
A description of the policies and procedures used to determine how to vote proxies relating to portfolio securities is available without charge, upon request, by calling 1-800-222-8222, visiting our website at allspringglobal.com, or visiting the SEC website at sec.gov. Information regarding how the proxies related to portfolio securities were voted during the most recent 12-month period ended June 30 is available on the website at allspringglobal.com or by visiting the SEC website at sec.gov.
QUARTERLY PORTFOLIO HOLDINGS INFORMATION
The Fund files its complete schedule of portfolio holdings with the SEC for the first and third quarters of each fiscal year as an exhibit to its reports on Form N-PORT. Shareholders may view the filed Form N-PORT by visiting the SEC website at sec.gov.
32 | Allspring Minnesota Tax-Free Fund
Other information (unaudited)
BOARD OF TRUSTEES AND OFFICERS
Each of the Trustees and Officers listed in the table below acts in identical capacities for each fund in the Allspring family of funds, which consists of 127 mutual funds comprising the Allspring Funds Trust, Allspring Variable Trust, Allspring Master Trust and four closed-end funds (collectively the “Fund Complex”). This table should be read in conjunction with the Prospectus and the Statement of Additional Information1. The mailing address of each Trustee and Officer is 1415 Vantage Park Drive, 3rd Floor, Charlotte, NC 28203. Each Trustee and Officer serves an indefinite term, however, each Trustee serves such term until reaching the mandatory retirement age established by the Trustees.
Independent Trustees
Name and
year of birth | Position held and
length of service* | Principal occupations during past five years or longer | Current other
public company or
investment
company
directorships |
William R. Ebsworth
(Born 1957) | Trustee,
since 2015 | Retired. From 1984 to 2013, equities analyst, portfolio manager, research director and chief investment officer at Fidelity Management and Research Company in Boston, Tokyo, and Hong Kong, and retired in 2013 as Chief Investment Officer of Fidelity Strategic Advisers, Inc. where he led a team of investment professionals managing client assets. Prior thereto, Board member of Hong Kong Securities Clearing Co., Hong Kong Options Clearing Corp., the Thailand International Fund, Ltd., Fidelity Investments Life Insurance Company, and Empire Fidelity Investments Life Insurance Company. Audit Committee Chair and Investment Committee Chair of the Vincent Memorial Hospital Foundation (non-profit organization). Mr. Ebsworth is a CFA® charterholder. | N/A |
Jane A. Freeman
(Born 1953) | Trustee,
since 2015;
Chair Liaison,
since 2018 | Retired. From 2012 to 2014 and 1999 to 2008, Chief Financial Officer of Scientific Learning Corporation. From 2008 to 2012, Ms. Freeman provided consulting services related to strategic business projects. Prior to 1999, Portfolio Manager at Rockefeller & Co. and Scudder, Stevens & Clark. Board member of the Harding Loevner Funds from 1996 to 2014, serving as both Lead Independent Director and chair of the Audit Committee. Board member of the Russell Exchange Traded Funds Trust from 2011 to 2012 and the chair of the Audit Committee. Ms. Freeman is also an inactive Chartered Financial Analyst. | N/A |
Isaiah Harris, Jr.
(Born 1952) | Trustee,
since 2009; Audit
Committee
Chair,
since 2019 | Retired. Member of the Advisory Board of CEF of East Central Florida. Chairman of the Board of CIGNA Corporation from 2009 to 2021, and Director from 2005 to 2008. From 2003 to 2011, Director of Deluxe Corporation. Prior thereto, President and CEO of BellSouth Advertising and Publishing Corp. from 2005 to 2007, President and CEO of BellSouth Enterprises from 2004 to 2005 and President of BellSouth Consumer Services from 2000 to 2003. Emeritus member of the Iowa State University Foundation Board of Governors. Emeritus Member of the Advisory Board of Iowa State University School of Business. Advisory Board Member, Palm Harbor Academy (private school). Advisory Board Member, Fellowship of Christian Athletes. Mr. Harris is a certified public accountant (inactive status). | N/A |
David F. Larcker
(Born 1950) | Trustee,
since 2009 | Distinguished Visiting Fellow at the Hoover Institution since 2022. James Irvin Miller Professor of Accounting at the Graduate School of Business (Emeritus), Stanford University, Director of the Corporate Governance Research Initiative and Senior Faculty of The Rock Center for Corporate Governance since 2006. From 2005 to 2008, Professor of Accounting at the Graduate School of Business, Stanford University. Prior thereto, Ernst & Young Professor of Accounting at The Wharton School, University of Pennsylvania from 1985 to 2005. | N/A |
Allspring Minnesota Tax-Free Fund | 33
Other information (unaudited)
Name and
year of birth | Position held and
length of service* | Principal occupations during past five years or longer | Current other
public company or
investment
company
directorships |
Olivia S. Mitchell
(Born 1953) | Trustee,
since 2006;
Nominating and
Governance
Committee Chair,
since 2018 | International Foundation of Employee Benefit Plans Professor since 1993, Wharton School of the University of Pennsylvania. Director of Wharton’s Pension Research Council and Boettner Center on Pensions & Retirement Research, and Research Associate at the National Bureau of Economic Research. Previously taught at Cornell University from 1978 to 1993. | N/A |
Timothy J. Penny
(Born 1951) | Trustee,
since 1996;
Chair,
since 2018 | President and Chief Executive Officer of Southern Minnesota Initiative Foundation, a non-profit organization, since 2007. Vice Chair of the Economic Club of Minnesota, since 2007. Co-Chair of the Committee for a Responsible Federal Budget, since 1995. Member of the Board of Trustees of NorthStar Education Finance, Inc., a non-profit organization, from 2007-2022. Senior Fellow of the University of Minnesota Humphrey Institute from 1995 to 2017. | N/A |
James G. Polisson
(Born 1959) | Trustee,
since 2018 | Retired. Chief Marketing Officer, Source (ETF) UK Services, Ltd, from 2015 to 2017. From 2012 to 2015, Principal of The Polisson Group, LLC, a management consulting, corporate advisory and principal investing company. Chief Executive Officer and Managing Director at Russell Investments, Global Exchange Traded Funds from 2010 to 2012. Managing Director of Barclays Global Investors from 1998 to 2010 and Global Chief Marketing Officer for iShares and Barclays Global Investors from 2000 to 2010. Trustee of the San Francisco Mechanics’ Institute, a non-profit organization, from 2013 to 2015. Board member of the Russell Exchange Traded Fund Trust from 2011 to 2012. Director of Barclays Global Investors Holdings Deutschland GmbH from 2006 to 2009. Mr. Polisson is an attorney and has a retired status with the Massachusetts and District of Columbia Bar Associations. | N/A |
Pamela Wheelock
(Born 1959) | Trustee,
since January
2020; previously
Trustee from
January 2018 to
July 2019 | Retired. Executive and Senior Financial leadership positions in the public, private and nonprofit sectors. Interim President and CEO, McKnight Foundation, 2020. Interim Commissioner, Minnesota Department of Human Services, 2019. Chief Operating Officer, Twin Cities Habitat for Humanity, 2017-2019. Vice President for University Services, University of Minnesota, 2012-2016. Interim President and CEO, Blue Cross and Blue Shield of Minnesota, 2011-2012. Executive Vice-President and Chief Financial Officer, Minnesota Wild, 2002-2008. Commissioner, Minnesota Department of Finance, 1999-2002. Chair of the Board of Directors of Destination Medical Center Corporation. Board member of the Minnesota Wild Foundation. | N/A |
* Length of service dates reflect the Trustee’s commencement of service with the Trust’s predecessor entities, where applicable.
34 | Allspring Minnesota Tax-Free Fund
Other information (unaudited)
Officers2
Name and
year of birth | Position held and
length of service | Principal occupations during past five years or longer |
Andrew Owen
(Born 1960) | President,
since 2017 | President and Chief Executive Officer of Allspring Funds Management, LLC since 2017 and Head of Global Fund Governance of Allspring Global Investments since 2022. Prior thereto, co-president of Galliard Capital Management, LLC, an affiliate of Allspring Funds Management, LLC, from 2019 to 2022 and Head of Affiliated Managers, Allspring Global Investments, from 2014 to 2019 and Executive Vice President responsible for marketing, investments and product development for Allspring Funds Management, LLC, from 2009 to 2014. |
Jeremy DePalma
(Born 1974) | Treasurer,
since 2012
(for certain funds in
the Fund Complex);
since 2021 (for
the remaining funds in the
Fund Complex) | Senior Vice President of Allspring Funds Management, LLC since 2009. Senior Vice President of Evergreen Investment Management Company, LLC from 2008 to 2010 and head of the Fund Reporting and Control Team within Fund Administration from 2005 to 2010. |
Christopher Baker
(Born 1976) | Chief Compliance Officer, since 2022 | Global Chief Compliance Officer for Allspring Global Investments since 2022. Prior thereto, Chief Compliance Officer for State Street Global Advisors from 2018 to 2021. Senior Compliance Officer for the State Street divisions of Alternative Investment Solutions, Sector Solutions, and Global Marketing from 2015 to 2018. From 2010 to 2015 Vice President, Global Head of Investment and Marketing Compliance for State Street Global Advisors. |
Matthew Prasse
(Born 1983) | Chief Legal Officer, since 2022; Secretary, since 2021 | Senior Counsel of the Allspring Legal Department since 2021. Senior Counsel of the Wells Fargo Legal Department from 2018 to 2021. Previously, Counsel for Barings LLC from 2015 to 2018. Prior to joining Barings, Associate at Morgan, Lewis & Bockius LLP from 2008 to 2015. |
1 The Statement of Additional Information includes additional information about the Trustees and is available, without charge, upon request, by calling 1-800-222-8222 or by visiting the website at allspringglobal.com.
2 For those Officers with tenures at Allspring Global Investments and/or Allspring Funds Management, LLC that began prior to 2021, such tenures include years of service during which these businesses/entities were known as Wells Fargo Asset Management and Wells Fargo Funds Management, LLC, respectively.
Allspring Minnesota Tax-Free Fund | 35
For more information
More information about Allspring Funds is available free upon request. To obtain literature, please write, visit the Fund's website, or call:
Allspring Funds
P.O. Box 219967
Kansas City, MO 64121-9967
Website: allspringglobal.com
Individual investors: 1-800-222-8222
Retail investment professionals: 1-888-877-9275
Institutional investment professionals: 1-800-260-5969
This report and the financial statements contained herein are submitted for the general information of the shareholders of the Fund. If this report is used for promotional purposes, distribution of the report must be accompanied or preceded by a current prospectus. Before investing, please consider the investment objectives, risks, charges, and expenses of the investment. For a current prospectus and, if available, a summary prospectus, containing this information, call
1-800-222-8222 or visit the Fund's website at allspringglobal.com. Read the prospectus carefully before you invest or send money.
Allspring Global InvestmentsTM is the trade name for the asset management firms of Allspring Global Investments Holdings, LLC, a holding company indirectly owned by certain private funds of GTCR LLC and Reverence Capital Partners, L.P. These firms include but are not limited to Allspring Global Investments, LLC, and Allspring Funds Management, LLC. Certain products managed by Allspring entities are distributed by Allspring Funds Distributor, LLC (a broker-dealer and Member FINRA/SIPC).
This material is for general informational and educational purposes only and is NOT intended to provide investment advice or a recommendation of any kind - including a recommendation for any specific investment, strategy, or plan.
© 2023 Allspring Global Investments Holdings, LLC. All rights reserved.
ALL-01092023-hmokywdt 02-23
SAR0003 12-22
Semi-Annual Report
December 31, 2022
Allspring Municipal Bond Fund
The views expressed and any forward-looking statements are as of December 31, 2022, unless otherwise noted, and are those of the Fund's portfolio managers and/or Allspring Global Investments. Discussions of individual securities or the markets generally are not intended as individual recommendations. Future events or results may vary significantly from those expressed in any forward-looking statements. The views expressed are subject to change at any time in response to changing circumstances in the market. Allspring Global Investments disclaims any obligation to publicly update or revise any views expressed or forward-looking statements.
Allspring Municipal Bond Fund | 1
Letter to shareholders (unaudited)
Andrew Owen
President
Allspring Funds
Dear Shareholder:
We are pleased to offer you this semi-annual report for the Allspring Municipal Bond Fund for the six-month period that ended December 31, 2022. Globally, stocks and bonds experienced heightened volatility and generally negative returns through the challenging period. Earlier tailwinds provided by global stimulus programs, vaccination rollouts, and recovering consumer and corporate sentiment were wiped away by the highest rate of inflation in four decades, the impact of ongoing aggressive central bank rate hikes and the prospect of more rate hikes. Compounding these concerns were the global reverberations of the Russia-Ukraine war and the impact of China’s strict COVID-19 lockdowns.
For the six-month period, stocks and bonds had mixed results, with emerging market equities trailing those of developed markets and both U.S. and non-U.S. bonds fighting an uphill battle in the face of sustained interest rate increases. For the period, U.S. stocks, based on the S&P 500 Index,1 gained 2.31%. International stocks, as measured by the MSCI ACWI ex USA Index (Net),2 returned 2.96%, while the MSCI EM Index (Net) (USD)3 declined 2.99%. Among bond indexes, the Bloomberg U.S. Aggregate Bond Index4 returned -2.97%, the Bloomberg Global Aggregate ex-USD Index (unhedged)5 returned -2.65%, the Bloomberg Municipal Bond Index6 gained 0.50%, and the ICE BofA U.S. High Yield Index7 returned 3.33%.
Persistent inflation and economic fallout from the Russia-Ukraine war drove markets.
Markets rebounded from earlier losses in July, led by U.S. stocks. While evidence pointed to an economic slowdown after two consecutive quarters of declining gross domestic product (economic contraction), the U.S. labor market remained surprisingly strong: July nonfarm payrolls grew by more than 500,000 and U.S. unemployment dipped to 3.5%. Meanwhile, crude oil and retail gasoline prices, major contributors to recent overall inflation, fell substantially from earlier highs. And while U.S. home prices rose, sales fell as houses became less affordable with mortgage rates at a 13-year high. The Federal Reserve (Fed) raised the federal funds rate another 0.75% in July—to a range of 2.25% to 2.50%—and forecasts pointed to further rate hikes.
| 1 | The S&P 500 Index consists of 500 stocks chosen for market size, liquidity, and industry group representation. It is a market-value-weighted index with each stock's weight in the index proportionate to its market value. You cannot invest directly in an index. |
| 2 | The Morgan Stanley Capital International (MSCI) All Country World Index (ACWI) ex USA Index (Net) is a free-float-adjusted market-capitalization-weighted index that is designed to measure the equity market performance of developed and emerging markets, excluding the U.S. Source: MSCI. MSCI makes no express or implied warranties or representations and shall have no liability whatsoever with respect to any MSCI data contained herein. The MSCI data may not be further redistributed or used as a basis for other indexes or any securities or financial products. This report is not approved, reviewed, or produced by MSCI. You cannot invest directly in an index. |
| 3 | The MSCI Emerging Markets (EM) Index (Net) (USD) is a free-float-adjusted market-capitalization-weighted index that is designed to measure equity market performance of emerging markets. You cannot invest directly in an index. |
| 4 | The Bloomberg U.S. Aggregate Bond Index is a broad-based benchmark that measures the investment-grade, U.S.-dollar-denominated, fixed-rate taxable bond market, including Treasuries, government-related and corporate securities, mortgage-backed securities (agency fixed-rate and hybrid adjustable-rate mortgage pass-throughs), asset-backed securities, and commercial mortgage-backed securities. You cannot invest directly in an index. |
| 5 | The Bloomberg Global Aggregate ex-USD Index (unhedged) is an unmanaged index that provides a broad-based measure of the global investment-grade fixed-income markets excluding the U.S.-dollar-denominated debt market. You cannot invest directly in an index. |
| 6 | The Bloomberg Municipal Bond Index is an unmanaged index composed of long-term tax-exempt bonds with a minimum credit rating of Baa. You cannot invest directly in an index. |
| 7 | The ICE BofA U.S. High Yield Index is a market-capitalization-weighted index of domestic and Yankee high-yield bonds. The index tracks the performance of high-yield securities traded in the U.S. bond market. You cannot invest directly in an index. Copyright 2023. ICE Data Indices, LLC. All rights reserved. |
2 | Allspring Municipal Bond Fund
Letter to shareholders (unaudited)
August was yet another broadly challenging month for financial markets, with more red ink flowing. High inflation persisted, cresting 9% in the eurozone on an annual basis and remaining above 8% in the U.S. despite the Fed’s aggressive monetary policy and a major drop in global crude oil and gasoline prices from their June peak. One positive note was the resilience of the U.S. job market. However, the Fed’s job was clearly not complete. One longer-term bright spot was the U.S. Congress’s passage of the Inflation Reduction Act. Its primary stated goals include: to reduce inflation (though not immediately) by curbing the deficit, capping health care spending by seniors, and investing in domestic sources of clean energy.
The market misery continued in September. There was nowhere to hide as all asset classes suffered major losses at the hands of persistent inflation. Central banks kept up their battle against rapidly rising prices with more rate hikes. The strength of the U.S. dollar made things even more difficult for investors holding assets in other currencies. U.S. mortgage rates jumped to near 7% on 30-year fixed-rate mortgages; the decreased housing affordability began to cool demand somewhat. The U.K. experienced a sharp sell-off of government bonds and the British pound in September as investors panicked in response to a new government budget that was seen as financially unsound. The market meltdown forced the Bank of England to step in and buy long-dated government bonds.
Equities had a reprieve in October after two months of sharp declines. Value stocks and small caps fared best. Globally, developed markets outpaced emerging market equities, which were hurt by weakness among Chinese stocks. Central banks continued to try to curtail high inflation with aggressive interest rate hikes. Geopolitical risks persisted, including the ongoing Russia-Ukraine war and economic, financial market, and political turmoil in the U.K., which led to a second prime ministerial change in six weeks, as Rishi Sunak replaced Liz Truss in late October. Concerns over Europe’s energy crisis eased thanks to unseasonably warm weather and plentiful gas on hand. The U.S. labor market continued its resilience against rising prices, as unemployment stood at 3.7%, near a record low.
Stocks and bonds rallied in November, with emerging market equities gaining nearly 15% and developed market equities returning 7%. The S&P 500 Index rose 5.6% in November. Bonds also had positive monthly returns. Economic news was encouraging, driven by U.S. labor market strength. Although central banks kept raising rates, expectations grew regarding an impending easing in the pace of rate hikes and a possible end to central bank monetary tightening in 2023. Although inflation remained at record highs in the eurozone, with a 10.6% annual increase in October, Germany’s producer prices decreased 4.2% annually, signaling a possible decline in inflationary pressures. Meanwhile, U.S. inflation continued to moderate, with a 7.1% annual price rise in November and a monthly price increase of just 0.1%. China’s economic data remained weak, reflecting its zero-COVID-19 policy.
Financial markets cooled in December, with U.S. equities posting negative overall results in response to a weakening U.S. dollar. Fixed income securities ended one of their worst years ever with flat overall monthly returns as markets weighed the hopes for an end to the monetary tightening cycle with the reality that central banks had not completed their jobs yet. U.S. Consumer Price Index (CPI)1 data showed a strong consistent trend downward, which brought down the 12-month CPI to 6.5% in December from 9.1% in June. Other countries and regions reported still-high but declining inflation rates as the year winded down.
“ The market misery continued in September. There was nowhere to hide as all asset classes suffered major losses at the hands of persistent inflation.”
| 1 | The Consumer Price Index (CPI) is a measure of the average change over time in the prices paid by urban consumers for a market basket of consumer goods and services. You cannot invest directly in an index. |
Allspring Municipal Bond Fund | 3
Letter to shareholders (unaudited)
Don’t let short-term uncertainty derail long-term investment goals.
Periods of investment uncertainty can present challenges, but experience has taught us that maintaining long-term investment goals can be an effective way to plan for the future. To help you create a sound strategy based on your personal goals and risk tolerance, Allspring Funds offers more than 100 mutual funds spanning a wide range of asset classes and investment styles. Although diversification cannot guarantee an investment profit or prevent losses, we believe it can be an effective way to manage investment risk and potentially smooth out overall portfolio performance. We encourage investors to know their investments and to understand that appropriate levels of risk-taking may unlock opportunities.
Thank you for choosing to invest with Allspring Funds. We appreciate your confidence in us and remain committed to helping you meet your financial needs.
Sincerely,
Andrew Owen
President
Allspring Funds
For further information about your fund, contact your investment professional, visit our website at allspringglobal.com, or call us directly at 1-800-222-8222.
4 | Allspring Municipal Bond Fund
This page is intentionally left blank.
Performance highlights (unaudited)
| Investment objective | The Fund seeks current income exempt from federal income tax. |
| Manager | Allspring Funds Management, LLC |
| Subadviser | Allspring Global Investments, LLC |
| Portfolio managers | Terry J. Goode, Robert J. Miller, Nicholos Venditti |
| Average annual total returns (%) as of December 31, 2022 |
| | | Including sales charge | | Excluding sales charge | | Expense ratios1 (%) |
| | Inception date | 1 year | 5 year | 10 year | | 1 year | 5 year | 10 year | | Gross | Net 2 |
| Class A (WMFAX) | 4-8-2005 | -12.82 | 0.14 | 1.86 | | -8.69 | 1.07 | 2.33 | | 0.77 | 0.75 |
| Class C (WMFCX) | 4-8-2005 | -10.38 | 0.31 | 1.72 | | -9.38 | 0.31 | 1.72 | | 1.52 | 1.50 |
| Class R6 (WMBRX)3 | 7-31-2018 | – | – | – | | -8.36 | 1.42 | 2.66 | | 0.39 | 0.39 |
| Administrator Class (WMFDX) | 4-8-2005 | – | – | – | | -8.46 | 1.22 | 2.49 | | 0.71 | 0.60 |
| Institutional Class (WMBIX) | 3-31-2008 | – | – | – | | -8.40 | 1.38 | 2.63 | | 0.44 | 0.44 |
| Bloomberg Municipal Bond Index4 | – | – | – | – | | -8.53 | 1.25 | 2.13 | | – | – |
Figures quoted represent past performance, which is no guarantee of future results, and do not reflect taxes that a shareholder may pay on an investment in a fund. Investment return and principal value of an investment will fluctuate so that an investor’s shares, when redeemed, may be worth more or less than their original cost. Performance shown without sales charges would be lower if sales charges were reflected. Current performance may be lower or higher than the performance data quoted, which assumes the reinvestment of dividends and capital gains. Current month-end performance is available on the Fund’s website, allspringglobal.com.
Index returns do not include transaction costs associated with buying and selling securities, any mutual fund fees or expenses, or any taxes. It is not possible to invest directly in an index.
For Class A shares, the maximum front-end sales charge is 4.50%. For Class C shares, the maximum contingent deferred sales charge is 1.00%. Performance including a contingent deferred sales charge assumes the sales charge for the corresponding time period. Class R6, Administrator Class and Institutional Class shares are sold without a front-end sales charge or contingent deferred sales charge.
| 1 | Reflects the expense ratios as stated in the most recent prospectuses. The expense ratios shown are subject to change and may differ from the annualized expense ratios shown in the financial highlights of this report. |
| 2 | The manager has contractually committed through October 31, 2023, to waive fees and/or reimburse expenses to the extent necessary to cap total annual fund operating expenses after fee waivers at 0.75% for Class A, 1.50% for Class C, 0.40% for Class R6, 0.60% for Administrator Class, and 0.45% for Institutional Class. Brokerage commissions, stamp duty fees, interest, taxes, acquired fund fees and expenses (if any), and extraordinary expenses are excluded from the expense caps. Prior to or after the commitment expiration date, the caps may be increased or the commitment to maintain the caps may be terminated only with the approval of the Board of Trustees. Without these caps, the Fund’s returns would have been lower. The expense ratio paid by an investor is the net expense ratio (the total annual fund operating expenses after fee waivers) as stated in the prospectuses. |
| 3 | Historical performance shown for the Class R6 shares prior to their inception reflects the performance of the Institutional Class shares, and includes the higher expenses applicable to the Institutional Class shares. If these expenses had not been included, returns for the Class R6 shares would be higher. |
| 4 | The Bloomberg Municipal Bond Index is an unmanaged index composed of long-term tax-exempt bonds with a minimum credit rating of Baa. You cannot invest directly in an index. |
Bond values fluctuate in response to the financial condition of individual issuers, general market and economic conditions, and changes in interest rates. Changes in market conditions and government policies may lead to periods of heightened volatility in the bond market and reduced liquidity for certain bonds held by the Fund. In general, when interest rates rise, bond values fall and investors may lose principal value. Interest rate changes and their impact on the Fund and its share price can be sudden and unpredictable. The use of derivatives may reduce returns and/or increase volatility. Certain investment strategies tend to increase the total risk of an investment (relative to the broader market). This fund is exposed to high-yield securities risk and municipal securities risk. Consult the Fund’s prospectus for additional information on these and other risks. A portion of the Fund’s income may be subject to federal, state, and/or local income taxes or the Alternative Minimum Tax (AMT). Any capital gains distributions may be taxable.
6 | Allspring Municipal Bond Fund
Performance highlights (unaudited)
| Credit quality as of December 31, 20221 |
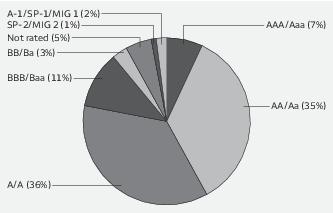
| 1 | The credit quality distribution of portfolio holdings reflected in the chart is based on ratings from Standard & Poor’s, Moody’s Investors Service, and/or Fitch Ratings Ltd. Credit quality ratings apply to the underlying holdings of the Fund and not to the Fund itself. The percentages of the portfolio with the ratings depicted in the chart are calculated based on the market value of fixed income securities held by the Fund. If a security was rated by all three rating agencies, the middle rating was utilized. If rated by two of the three rating agencies, the lower rating was utilized, and if rated by one of the rating agencies, that rating was utilized. Standard & Poor’s rates the creditworthiness of bonds, ranging from AAA (highest) to D (lowest). Ratings from A to CCC may be modified by the addition of a plus (+) or minus (-) sign to show relative standing within the rating categories. Standard & Poor’s rates the creditworthiness of short-term notes from SP-1 (highest) to SP-3 (lowest). Moody’s rates the creditworthiness of bonds, ranging from Aaa (highest) to C (lowest). Ratings Aa to B may be modified by the addition of a number 1 (highest) to 3 (lowest) to show relative standing within the ratings categories. Moody’s rates the creditworthiness of short-term U.S. tax-exempt municipal securities from MIG 1/VMIG 1 (highest) to SG (lowest). Fitch rates the creditworthiness of bonds, ranging from AAA (highest) to D (lowest). Credit quality distribution is subject to change and may have changed since the date specified. |
| Effective maturity distribution as of December 31, 20221 |
| 1 | Figures represent the percentage of the Fund's long-term investments. Allocations are subject to change and may have changed since the date specified. |
Allspring Municipal Bond Fund | 7
Fund expenses (unaudited)
As a shareholder of the Fund, you incur two types of costs: (1) transaction costs, including sales charges (loads) on purchase payments and contingent deferred sales charges (if any) on redemptions and (2) ongoing costs, including management fees, distribution (12b-1) and/or shareholder servicing fees, and other Fund expenses. This example is intended to help you understand your ongoing costs (in dollars) of investing in the Fund and to compare these costs with the ongoing costs of investing in other mutual funds.
The example is based on an investment of $1,000 invested at the beginning of the six-month period and held for the entire period from July 1, 2022 to December 31, 2022.
Actual expenses
The “Actual” line of the table below provides information about actual account values and actual expenses. You may use the information in this line, together with the amount you invested, to estimate the expenses that you paid over the period. Simply divide your account value by $1,000 (for example, an $8,600 account value divided by $1,000 = 8.6), then multiply the result by the number in the “Actual” line under the heading entitled “Expenses paid during period” for your applicable class of shares to estimate the expenses you paid on your account during this period.
Hypothetical example for comparison purposes
The “Hypothetical” line of the table below provides information about hypothetical account values and hypothetical expenses based on the Fund’s actual expense ratio and an assumed rate of return of 5% per year before expenses, which is not the Fund’s actual return. The hypothetical account values and expenses may not be used to estimate the actual ending account balance or expenses you paid for the period. You may use this information to compare the ongoing costs of investing in the Fund and other funds. To do so, compare this 5% hypothetical example with the 5% hypothetical examples that appear in the shareholder reports of the other funds.
Please note that the expenses shown in the table are meant to highlight your ongoing costs only and do not reflect any transactional costs, such as sales charges (loads) and contingent deferred sales charges. Therefore, the “Hypothetical” line of the table is useful in comparing ongoing costs only, and will not help you determine the relative total costs of owning different funds. In addition, if these transactional costs were included, your costs would have been higher.
| | Beginning
account value
7-1-2022 | Ending
account value
12-31-2022 | Expenses
paid during
the period1 | Annualized net
expense ratio |
| Class A | | | | |
| Actual | $1,000.00 | $1,001.72 | $3.78 | 0.75% |
| Hypothetical (5% return before expenses) | $1,000.00 | $1,021.42 | $3.82 | 0.75% |
| Class C | | | | |
| Actual | $1,000.00 | $ 997.91 | $7.55 | 1.50% |
| Hypothetical (5% return before expenses) | $1,000.00 | $1,017.64 | $7.63 | 1.50% |
| Class R6 | | | | |
| Actual | $1,000.00 | $1,003.54 | $1.97 | 0.39% |
| Hypothetical (5% return before expenses) | $1,000.00 | $1,023.24 | $1.99 | 0.39% |
| Administrator Class | | | | |
| Actual | $1,000.00 | $1,003.51 | $3.03 | 0.60% |
| Hypothetical (5% return before expenses) | $1,000.00 | $1,022.18 | $3.06 | 0.60% |
| Institutional Class | | | | |
| Actual | $1,000.00 | $1,003.28 | $2.22 | 0.44% |
| Hypothetical (5% return before expenses) | $1,000.00 | $1,022.99 | $2.24 | 0.44% |
1 Expenses paid is equal to the annualized net expense ratio of each class multiplied by the average account value over the period, multiplied by 184 divided by 365 (to reflect the one-half-year period).
8 | Allspring Municipal Bond Fund
Portfolio of investments—December 31, 2022 (unaudited)
| | | | | Principal | Value |
| Closed end municipal bond fund obligations: 0.75% | | | | | |
| California: 0.57% | | | | | |
| Nuveen California AMT-Free Quality Municipal Income Fund MuniFund Preferred Shares Series A (320 shares) 4.11% 144Aø | | | | $32,000,000 | $ 32,000,000 |
| Other: 0.18% | | | | | |
| Nuveen AMT-Free Municipal Credit Income Fund MuniFund Preferred Shares Series B (100 shares) 1.00% 144Aø | | | | 10,000,000 | 10,000,000 |
| Total Closed end municipal bond fund obligations (Cost $42,000,000) | | | | | 42,000,000 |
| | | Interest
rate | Maturity
date | | |
| Municipal obligations: 98.42% | | | | | |
| Alabama: 2.50% | | | | | |
| Airport revenue: 0.09% | | | | | |
| Birmingham AL Airport Authority Revenue (BAM Insured) | | 4.00% | 7-1-2036 | 500,000 | 498,167 |
| Birmingham AL Airport Authority Revenue (BAM Insured) | | 4.00 | 7-1-2037 | 500,000 | 497,204 |
| Birmingham AL Airport Authority Revenue (BAM Insured) | | 4.00 | 7-1-2038 | 400,000 | 393,685 |
| Birmingham AL Airport Authority Revenue (BAM Insured) | | 5.00 | 7-1-2028 | 700,000 | 764,312 |
| Birmingham AL Airport Authority Revenue (BAM Insured) | | 5.00 | 7-1-2029 | 750,000 | 828,573 |
| Birmingham AL Airport Authority Revenue (BAM Insured) | | 5.00 | 7-1-2030 | 500,000 | 559,297 |
| Birmingham AL Airport Authority Revenue (BAM Insured) | | 5.00 | 7-1-2032 | 600,000 | 668,562 |
| Birmingham AL Airport Authority Revenue (BAM Insured) | | 5.00 | 7-1-2033 | 650,000 | 719,455 |
| | | | | | 4,929,255 |
| GO revenue: 0.06% | | | | | |
| Birmingham AL CAB Series A1 | | 5.00 | 3-1-2045 | 3,160,000 | 3,352,278 |
| Health revenue: 0.29% | | | | | |
| Alabama Health Care Authority for Baptist Health Series B ø | | 4.33 | 11-1-2042 | 14,500,000 | 14,500,000 |
| UAB Medicine Finance Authority Series B | | 5.00 | 9-1-2034 | 1,000,000 | 1,090,295 |
| UAB Medicine Finance Authority Series B | | 5.00 | 9-1-2035 | 1,000,000 | 1,080,249 |
| | | | | | 16,670,544 |
| Tax revenue: 0.46% | | | | | |
| Alabama Federal Aid Highway Finance Authority Series A | | 5.00 | 9-1-2035 | 24,000,000 | 26,002,078 |
| Utilities revenue: 1.49% | | | | | |
| Black Belt Energy Gas District Alabama Gas Project Series C-1 | | 5.25 | 2-1-2053 | 23,000,000 | 23,975,676 |
| Black Belt Energy Gas District Gas Supply Revenue Bonds Series 2021A (Royal Bank of Canada LIQ) | | 4.00 | 6-1-2051 | 5,500,000 | 5,359,908 |
| Lower Alabama Gas Supply District Project #2 | | 4.00 | 12-1-2050 | 20,590,000 | 20,427,197 |
| Southeast Alabama Energy Authority Commodity Supply Project #2 Series B | | 4.00 | 12-1-2051 | 3,000,000 | 2,893,480 |
| Southeast Alabama Gas Supply District Project #2 Series 2018A | | 4.00 | 6-1-2049 | 28,850,000 | 28,748,892 |
| Southeast Energy Authority Alabama Project #1 Series A | | 4.00 | 11-1-2051 | 2,465,000 | 2,413,176 |
| | | | | | 83,818,329 |
The accompanying notes are an integral part of these financial statements.
Allspring Municipal Bond Fund | 9
Portfolio of investments—December 31, 2022 (unaudited)
| | | Interest
rate | Maturity
date | Principal | Value |
| Water & sewer revenue: 0.11% | | | | | |
| Jefferson County AL CAB Series B (AGM Insured) ¤ | | 0.00% | 10-1-2025 | $ 710,000 | $ 639,892 |
| Jefferson County AL CAB Series B (AGM Insured) ¤ | | 0.00 | 10-1-2026 | 3,000,000 | 2,569,659 |
| Jefferson County AL CAB Series B (AGM Insured) ¤ | | 0.00 | 10-1-2029 | 4,115,000 | 2,898,035 |
| | | | | | 6,107,586 |
| | | | | | 140,880,070 |
| Alaska: 0.04% | | | | | |
| Health revenue: 0.04% | | | | | |
| Alaska IDA Tanana Chiefs Conference Project | | 5.00 | 10-1-2033 | 1,930,000 | 2,072,763 |
| Arizona: 1.25% | | | | | |
| Education revenue: 0.33% | | | | | |
| Arizona Board of Regents University of Arizona Series C | | 5.00 | 8-1-2029 | 1,005,000 | 1,137,525 |
| Arizona IDA Kipp NYC Public Charter School Project | | 4.00 | 7-1-2061 | 1,500,000 | 1,148,506 |
| Arizona IDA Kipp NYC Public Charter School Project | | 4.00 | 7-1-2061 | 3,000,000 | 2,297,012 |
| La Paz County AZ IDA Educational Facility Imagine Schools West Middle Project Series A 144A | | 5.75 | 6-15-2038 | 1,085,000 | 1,026,567 |
| La Paz County AZ IDA Educational Facility Imagine Schools West Middle Project Series A 144A | | 5.88 | 6-15-2048 | 2,435,000 | 2,213,104 |
| Phoenix AZ IDA Legacy Traditional School Project Series A 144A | | 6.50 | 7-1-2034 | 2,000,000 | 2,048,952 |
| Pima County AZ IDA American Leadership Project 144A | | 4.00 | 6-15-2029 | 2,905,000 | 2,758,801 |
| Pima County AZ IDA American Leadership Project 144A | | 4.00 | 6-15-2041 | 3,195,000 | 2,567,370 |
| Pima County AZ IDA Noah Webster Schools-Pima Project | | 7.00 | 12-15-2043 | 3,225,000 | 3,288,916 |
| Tender Option Bond Trust Receipts/Floater Certificates Series 2020-XF2862 (Mizuho Capital Markets LLC LOC, Mizuho Capital Markets LLC LIQ) 144Aø | | 3.86 | 12-15-2047 | 150,000 | 150,000 |
| | | | | | 18,636,753 |
| GO revenue: 0.06% | | | | | |
| Maricopa County AZ Special Health Care District Series D | | 4.00 | 7-1-2035 | 3,500,000 | 3,618,981 |
| Health revenue: 0.09% | | | | | |
| Arizona Health Facilities Authority Revenue Bond Banner Health Series A | | 5.00 | 1-1-2044 | 5,000,000 | 5,105,399 |
| Industrial development revenue: 0.07% | | | | | |
| Maricopa County AZ IDA Revenue Bonds Commercial Metals Company Project Series 2022 144A | | 4.00 | 10-15-2047 | 4,000,000 | 3,234,932 |
| Maricopa County AZ PCR Refunding Bonds Series A | | 2.40 | 6-1-2035 | 1,000,000 | 759,094 |
| | | | | | 3,994,026 |
| Miscellaneous revenue: 0.66% | | | | | |
| Navajo Nation Refunding Bond Series A 144A | | 5.50 | 12-1-2030 | 7,275,000 | 7,581,817 |
| Phoenix AZ Civic Improvement Corporation Junior Lien Refunding Bond | | 5.00 | 7-1-2034 | 8,805,000 | 9,404,801 |
| Phoenix AZ Civic Improvement Corporation Junior Lien Refunding Bond Series 2019B | | 5.00 | 7-1-2044 | 5,570,000 | 5,691,484 |
| Phoenix AZ Civic Improvement Corporation Series A | | 5.00 | 7-1-2034 | 13,875,000 | 14,571,708 |
| | | | | | 37,249,810 |
The accompanying notes are an integral part of these financial statements.
10 | Allspring Municipal Bond Fund
Portfolio of investments—December 31, 2022 (unaudited)
| | | Interest
rate | Maturity
date | Principal | Value |
| Water & sewer revenue: 0.04% | | | | | |
| Mesa AZ Utility System Revenue | | 4.00% | 7-1-2042 | $ 1,000,000 | $ 985,588 |
| Mesa AZ Utility System Revenue | | 4.00 | 7-1-2043 | 1,000,000 | 979,533 |
| | | | | | 1,965,121 |
| | | | | | 70,570,090 |
| Arkansas: 0.05% | | | | | |
| Miscellaneous revenue: 0.05% | | | | | |
| Arkansas Development Finance Authority Arkansas Division of Emergency Management | | 4.00 | 6-1-2038 | 1,170,000 | 1,158,843 |
| Arkansas Development Finance Authority Arkansas Division of Emergency Management | | 4.00 | 6-1-2039 | 1,000,000 | 983,600 |
| Arkansas Development Finance Authority Arkansas Division of Emergency Management | | 4.00 | 6-1-2040 | 500,000 | 488,117 |
| | | | | | 2,630,560 |
| California: 5.00% | | | | | |
| Airport revenue: 1.31% | | | | | |
| Los Angeles CA Department of Airports AMT Subordinate Revenue Bond | | 5.00 | 5-15-2034 | 1,750,000 | 1,810,365 |
| Los Angeles CA Department of Airports Subordinate Revenue Bonds | | 5.00 | 5-15-2034 | 1,465,000 | 1,542,652 |
| Los Angeles CA Department of Airports Subordinate Revenue Bonds Series A | | 5.00 | 5-15-2046 | 7,000,000 | 7,167,885 |
| Los Angeles CA Department of Airports Subordinate Revenue Bonds Series A | | 5.25 | 5-15-2048 | 15,000,000 | 15,427,569 |
| Los Angeles CA Department of Airports Subordinate Revenue Bonds Series H | | 5.50 | 5-15-2047 | 5,000,000 | 5,333,943 |
| Los Angeles CA International Airports Revenue Bonds 2022 Series G | | 5.25 | 5-15-2047 | 3,000,000 | 3,146,222 |
| Port of Oakland CA Refunding Bonds Series H | | 5.00 | 5-1-2026 | 2,500,000 | 2,616,452 |
| Port of Oakland CA Refunding Bonds Series H | | 5.00 | 5-1-2029 | 1,875,000 | 2,031,198 |
| San Francisco CA City & County Airport Commission San Francisco International Airport Series 2022A | | 4.00 | 5-1-2052 | 1,500,000 | 1,292,230 |
| San Francisco CA City & County Airport Commission San Francisco International Airport Series B | | 5.00 | 5-1-2046 | 30,000,000 | 30,318,294 |
| San Francisco CA City & County Airport Commission San Francisco International Airport Series B | | 5.00 | 5-1-2052 | 3,000,000 | 3,041,270 |
| | | | | | 73,728,080 |
| Education revenue: 0.15% | | | | | |
| California Municipal Finance Authority Charter School Albert Einstein Academies Project Series A | | 7.13 | 8-1-2043 | 2,230,000 | 2,282,490 |
| California School Finance Authority Charter School Revenue Bonds Series A 144A | | 5.00 | 8-1-2042 | 1,000,000 | 1,005,716 |
| University of California Series K | | 4.00 | 5-15-2046 | 5,075,000 | 4,935,390 |
| | | | | | 8,223,596 |
| GO revenue: 0.92% | | | | | |
| Alhambra CA Unified School District CAB Election of 2008 Series B (AGM Insured) ¤ | | 0.00 | 8-1-2031 | 2,175,000 | 1,638,255 |
| Alhambra CA Unified School District CAB Election of 2008 Series B (AGC Insured) ¤ | | 0.00 | 8-1-2031 | 7,500,000 | 5,649,155 |
The accompanying notes are an integral part of these financial statements.
Allspring Municipal Bond Fund | 11
Portfolio of investments—December 31, 2022 (unaudited)
| | | Interest
rate | Maturity
date | Principal | Value |
| GO revenue (continued) | | | | | |
| Alhambra CA Unified School District CAB Election of 2008 Series B (AGM Insured) ¤ | | 0.00% | 8-1-2032 | $ 3,795,000 | $ 2,747,689 |
| Alhambra CA Unified School District CAB Election of 2008 Series B (AGM Insured) ¤ | | 0.00 | 8-1-2034 | 5,000,000 | 3,308,697 |
| Alhambra CA Unified School District CAB Election of 2008 Series B (AGM Insured) ¤ | | 0.00 | 8-1-2035 | 6,700,000 | 4,203,274 |
| Colton CA Unified School District CAB Series B (AGM Insured) ¤ | | 0.00 | 8-1-2031 | 1,000,000 | 740,004 |
| Colton CA Unified School District CAB Series B (AGM Insured) ¤ | | 0.00 | 8-1-2032 | 1,000,000 | 708,528 |
| Colton CA Unified School District CAB Series B (AGM Insured) ¤ | | 0.00 | 8-1-2033 | 1,000,000 | 678,031 |
| Compton CA Community College District CAB Election of 2002 Series C ¤ | | 0.00 | 8-1-2032 | 2,515,000 | 1,768,594 |
| Compton CA Community College District CAB Election of 2002 Series C ¤ | | 0.00 | 8-1-2033 | 2,000,000 | 1,344,848 |
| El Monte CA Union High School District CAB Election of 2008 (AGM Insured) ¤ | | 0.00 | 6-1-2030 | 2,000,000 | 1,556,135 |
| El Monte CA Union High School District CAB Election of 2008 (AGM Insured) ¤ | | 0.00 | 6-1-2031 | 2,000,000 | 1,495,667 |
| El Monte CA Union High School District CAB Election of 2008 (AGM Insured) ¤ | | 0.00 | 6-1-2032 | 1,660,000 | 1,189,415 |
| El Monte CA Union High School District CAB Election of 2008 (AGM Insured) ¤ | | 0.00 | 6-1-2033 | 1,230,000 | 842,442 |
| Los Angeles CA Unified School District Series R | | 4.00 | 7-1-2044 | 11,000,000 | 10,611,249 |
| Ontario Montclair CA School District CAB (AGC Insured) ¤ | | 0.00 | 8-1-2028 | 1,500,000 | 1,245,397 |
| Ontario Montclair CA School District CAB (AGC Insured) ¤ | | 0.00 | 8-1-2030 | 2,000,000 | 1,540,372 |
| San Diego CA Unified School District CAB Series C ¤ | | 0.00 | 7-1-2031 | 2,000,000 | 1,513,536 |
| San Diego CA Unified School District CAB Series C ¤ | | 0.00 | 7-1-2033 | 1,000,000 | 694,592 |
| San Diego CA Unified School District CAB Series C ¤ | | 0.00 | 7-1-2034 | 2,000,000 | 1,328,882 |
| Whittier CA School District Series C | | 5.25 | 8-1-2046 | 4,850,000 | 5,184,693 |
| Wiseburn CA School District CAB Election of 2010 Series B (AGM Insured) ¤ | | 0.00 | 8-1-2034 | 2,530,000 | 1,639,408 |
| | | | | | 51,628,863 |
| Health revenue: 0.84% | | | | | |
| California HFFA Revenue Bond Sutter Health Series A | | 5.00 | 11-15-2048 | 3,000,000 | 3,064,409 |
| California HFFA Stanford Health Care Series A | | 4.00 | 8-15-2050 | 13,450,000 | 12,757,360 |
| California PFA Enso Village Project Series B-3 144A | | 2.13 | 11-15-2027 | 4,000,000 | 3,703,242 |
| California Statewide CDA Health Facilities Dignity Health Series E (AGM Insured) € | | 3.90 | 7-1-2040 | 16,050,000 | 16,050,000 |
| University of California Regents University Medical Center Pooled Revenue Bonds 2016 Series L | | 4.00 | 5-15-2037 | 7,525,000 | 7,554,971 |
| University of California Regents University Medical Center Pooled Revenue Bonds 2016 Series L | | 5.00 | 5-15-2047 | 3,885,000 | 4,002,979 |
| | | | | | 47,132,961 |
| Housing revenue: 0.12% | | | | | |
| California Community Housing Agency Essential Housing Revenue Serenity at Larkspur Series C 144A | | 5.00 | 2-1-2050 | 1,000,000 | 898,889 |
| California HFA Municipal Certificate of Participation Series 2 Class A | | 4.00 | 3-20-2033 | 3,095,254 | 2,988,315 |
The accompanying notes are an integral part of these financial statements.
12 | Allspring Municipal Bond Fund
Portfolio of investments—December 31, 2022 (unaudited)
| | | Interest
rate | Maturity
date | Principal | Value |
| Housing revenue (continued) | | | | | |
| California Statewide CDA Community Improvement Authority Bond Mezzanine Pasadena Portfolio 144A | | 4.00% | 12-1-2056 | $ 1,500,000 | $ 1,062,319 |
| Tender Option Bond Trust Receipts/Certificates Series 2020-MIZ9012 (Mizuho Capital Markets LLC LIQ) 144Aø | | 3.91 | 10-1-2036 | 1,993,000 | 1,993,000 |
| | | | | | 6,942,523 |
| Miscellaneous revenue: 0.67% | | | | | |
| Anaheim CA PFA Convention Center Expansion Project Series A | | 5.00 | 5-1-2046 | 8,500,000 | 8,753,179 |
| California Public Works Board Judicial Council Project Series A | | 5.00 | 3-1-2031 | 3,260,000 | 3,271,432 |
| Hayward CA Unified School District Series 2022 | | 5.25 | 8-1-2047 | 5,000,000 | 5,196,433 |
| Mesa CA Water District Certificate of Participation | | 4.00 | 3-15-2039 | 500,000 | 503,211 |
| Mesa CA Water District Certificate of Participation | | 4.00 | 3-15-2040 | 500,000 | 500,112 |
| Mesa CA Water District Certificate of Participation | | 4.00 | 3-15-2045 | 1,200,000 | 1,180,960 |
| Ontario Public Financing Authority Series A (AGM Insured) | | 5.00 | 11-1-2047 | 2,750,000 | 3,003,205 |
| Pasadena CA PFA CAB Rose Bowl Series A ¤ | | 0.00 | 3-1-2027 | 2,095,000 | 1,825,639 |
| Pasadena CA PFA CAB Rose Bowl Series A ¤ | | 0.00 | 3-1-2028 | 4,450,000 | 3,735,276 |
| Pasadena CA PFA CAB Rose Bowl Series A ¤ | | 0.00 | 3-1-2029 | 4,520,000 | 3,653,219 |
| Pasadena CA PFA CAB Rose Bowl Series A ¤ | | 0.00 | 3-1-2031 | 2,185,000 | 1,633,704 |
| Pasadena CA PFA CAB Rose Bowl Series A ¤ | | 0.00 | 3-1-2032 | 2,000,000 | 1,430,207 |
| Pasadena CA PFA CAB Rose Bowl Series A ¤ | | 0.00 | 3-1-2033 | 4,295,000 | 2,937,149 |
| | | | | | 37,623,726 |
| Tax revenue: 0.02% | | | | | |
| San Diego County CA Regional Transportation Commission Limited Tax Series A | | 5.00 | 4-1-2048 | 915,000 | 956,030 |
| Tobacco revenue: 0.03% | | | | | |
| California County CA Tobacco Securitization Agency | | 4.00 | 6-1-2039 | 500,000 | 462,423 |
| California County CA Tobacco Securitization Agency | | 4.00 | 6-1-2040 | 300,000 | 274,208 |
| California County CA Tobacco Securitization Agency | | 4.00 | 6-1-2049 | 1,200,000 | 1,025,090 |
| | | | | | 1,761,721 |
| Transportation revenue: 0.56% | | | | | |
| Bay Area CA Toll Authority Toll Bridge Series A (SIFMA Municipal Swap +1.25%) ± | | 4.91 | 4-1-2036 | 23,545,000 | 23,739,616 |
| Foothill-Eastern Transportation Corridor Agency Junior Lien Road Revenue Series 2021C | | 4.00 | 1-15-2043 | 8,500,000 | 7,987,728 |
| | | | | | 31,727,344 |
| Utilities revenue: 0.38% | | | | | |
| California Community Choice Financing Authority Clean Energy Project Green Bond Series B-1 | | 4.00 | 2-1-2052 | 2,360,000 | 2,322,197 |
| M-S-R California Energy Authority Gas Series B | | 6.13 | 11-1-2029 | 14,180,000 | 15,694,345 |
| Vernon CA Electric System Revenue Series A | | 5.00 | 8-1-2039 | 450,000 | 467,116 |
| Vernon CA Electric System Revenue Series A | | 5.00 | 8-1-2040 | 375,000 | 387,802 |
| Vernon CA Electric System Revenue Series A | | 5.00 | 8-1-2041 | 420,000 | 433,152 |
The accompanying notes are an integral part of these financial statements.
Allspring Municipal Bond Fund | 13
Portfolio of investments—December 31, 2022 (unaudited)
| | | Interest
rate | Maturity
date | Principal | Value |
| Utilities revenue (continued) | | | | | |
| Victorville CA Electric Revenue Bonds Series 2022A | | 5.00% | 5-1-2036 | $ 1,210,000 | $ 1,291,389 |
| Victorville CA Electric Revenue Bonds Series 2022A | | 5.00 | 5-1-2037 | 1,005,000 | 1,062,366 |
| | | | | | 21,658,367 |
| | | | | | 281,383,211 |
| Colorado: 4.45% | | | | | |
| Airport revenue: 0.71% | | | | | |
| Denver CO City & County Airport Revenue Bonds Series 2022B | | 5.25 | 11-15-2053 | 2,000,000 | 2,175,776 |
| Denver CO City & County Airport System Revenue Series 2012A | | 5.00 | 12-1-2034 | 12,855,000 | 14,116,594 |
| Denver CO City & County Airport System Revenue Series 2012A | | 5.00 | 12-1-2037 | 3,130,000 | 3,257,810 |
| Denver CO City & County Airport System Revenue Series 2012B | | 5.00 | 12-1-2027 | 10,000,000 | 10,665,192 |
| Denver CO City & County Airport System Revenue Series 2018A | | 5.00 | 12-1-2034 | 9,000,000 | 9,489,411 |
| | | | | | 39,704,783 |
| Education revenue: 0.64% | | | | | |
| Colorado Board of Governors State University Enterprise System Revenue Prerefunded Bond Series 2018 E-1 | | 5.00 | 3-1-2040 | 390,000 | 407,410 |
| Colorado Board of Governors State University Enterprise System Revenue Prerefunded Bond Series 2018 E-1 | | 5.00 | 3-1-2040 | 555,000 | 579,776 |
| Colorado Board of Governors State University Enterprise System Revenue Unrefunded Bond Series 2018 E-1 | | 5.00 | 3-1-2040 | 1,055,000 | 1,102,097 |
| Colorado ECFA Alexander Dawson School LLC Project | | 5.00 | 2-15-2040 | 1,000,000 | 1,000,821 |
| Colorado ECFA Charter School Aspen Ridge School Project Series 2015A 144A | | 4.13 | 7-1-2026 | 250,000 | 244,241 |
| Colorado ECFA Charter School Banning Lewis Ranch Academy Project Series A | | 6.00 | 12-15-2037 | 2,965,000 | 3,129,777 |
| Colorado ECFA Charter School Banning Lewis Ranch Academy Project Series B-2 | | 7.00 | 12-15-2046 | 3,940,000 | 4,316,008 |
| Colorado ECFA Charter School Ben Franklin Academy Project | | 5.00 | 7-1-2036 | 750,000 | 766,625 |
| Colorado ECFA Charter School Community Leadership Academy Second Campus Project | | 7.00 | 8-1-2033 | 1,015,000 | 1,029,543 |
| Colorado ECFA Charter School District Montessori Charter School Project | | 5.00 | 7-15-2037 | 1,150,000 | 1,151,188 |
| Colorado ECFA Charter School New Summit Charter School 144A | | 4.00 | 7-1-2051 | 715,000 | 525,536 |
| Colorado ECFA Charter School Refunding & Improvement Bonds Skyview Academy Project 2014 144A | | 4.13 | 7-1-2024 | 110,000 | 109,208 |
| Colorado ECFA Charter School Refunding & Improvement Bonds University Laboratory School Project 2015 144A | | 5.00 | 12-15-2028 | 600,000 | 618,942 |
| Colorado ECFA Charter School Rocky Mountain Classical Academy Project Series A | | 7.50 | 9-1-2033 | 5,015,000 | 5,156,555 |
| Colorado ECFA Charter School Rocky Mountain Classical Academy Project Series A | | 8.00 | 9-1-2043 | 5,930,000 | 6,114,554 |
| Colorado ECFA Charter School Rocky Mountain Classical Academy Project Series A | | 8.13 | 9-1-2048 | 3,795,000 | 3,916,171 |
| Colorado ECFA Charter School Twin Peaks Charter Academy | | 6.50 | 3-15-2043 | 1,290,000 | 1,291,454 |
| Colorado ECFA School Refunding & Improvement Bonds | | 5.00 | 3-15-2035 | 2,000,000 | 2,132,821 |
The accompanying notes are an integral part of these financial statements.
14 | Allspring Municipal Bond Fund
Portfolio of investments—December 31, 2022 (unaudited)
| | | Interest
rate | Maturity
date | Principal | Value |
| Education revenue (continued) | | | | | |
| Colorado ECFA Union Colony School Project Revenue Bond Series 2018 | | 5.00% | 4-1-2048 | $ 715,000 | $ 723,080 |
| Colorado School of Mines Institutional Enterprise Revenue Bonds Series 2022A (AGM Insured) | | 5.25 | 12-1-2047 | 1,730,000 | 1,869,496 |
| | | | | | 36,185,303 |
| GO revenue: 0.18% | | | | | |
| Aurora CO Park 70 Metropolitan District | | 5.00 | 12-1-2046 | 1,000,000 | 1,004,186 |
| Aurora Cornerstar Metropolitan District Refunding Bond Series A | | 5.25 | 12-1-2047 | 1,000,000 | 922,878 |
| Broadway Station Metropolitan District #3 Series A | | 5.00 | 12-1-2049 | 1,250,000 | 999,696 |
| Colorado International Center Metropolitan District #3 Refunding Bonds | | 4.63 | 12-1-2031 | 500,000 | 464,782 |
| Grand River County Hospital District Series 2018 (AGM Insured) | | 5.25 | 12-1-2035 | 1,750,000 | 1,851,844 |
| Thompson Crossing Metropolitan District #4 Refunding & Improvement Bonds | | 5.00 | 12-1-2049 | 2,125,000 | 1,839,364 |
| Wheatlands CO Metropolitan District #2 Refunding Bond (BAM Insured) | | 5.00 | 12-1-2030 | 650,000 | 688,051 |
| Wiggins CO School District #50 (BAM Insured) | | 4.00 | 12-1-2046 | 2,335,000 | 2,250,584 |
| | | | | | 10,021,385 |
| Health revenue: 0.22% | | | | | |
| Aspen Valley Hospital District Refunding Bonds Series 2012 | | 5.00 | 10-15-2033 | 600,000 | 600,144 |
| Colorado Health Facilities Authority CommonSpirit Health Series A2 | | 5.00 | 8-1-2044 | 4,000,000 | 4,007,089 |
| Colorado Health Facilities Authority Evangelical Lutheran Good Samaritan Society Series 2015A | | 5.00 | 6-1-2040 | 1,000,000 | 1,053,674 |
| Colorado Health Facilities Authority Refunding & Improvement Bonds Christian Living Project | | 4.00 | 1-1-2042 | 1,000,000 | 737,458 |
| Colorado Health Facilities Authority Revenue Bonds Hospital Advent Health Obligated Group Series A | | 4.00 | 11-15-2043 | 3,500,000 | 3,261,046 |
| Colorado Health Facilities Authority Revenue Parkview Medical Center Incorporated | | 4.00 | 9-1-2045 | 500,000 | 435,746 |
| Colorado Health Facilities Authority Sisters of Charity Leavenworth Health System Series 2013A | | 5.50 | 1-1-2035 | 1,000,000 | 1,024,946 |
| Colorado Health Facilities Authority Sunny Vista Living Center Series 2015A 144A | | 5.00 | 12-1-2025 | 460,000 | 415,801 |
| Denver CO Health & Hospital Authority Refunding Bonds Series 2017A 144A | | 5.00 | 12-1-2034 | 500,000 | 519,849 |
| | | | | | 12,055,753 |
| Miscellaneous revenue: 1.22% | | | | | |
| Colorado Bridge Enterprise Revenue | | 4.00 | 12-31-2029 | 2,705,000 | 2,750,914 |
| Colorado Bridge Enterprise Revenue | | 4.00 | 6-30-2030 | 3,115,000 | 3,166,754 |
| Colorado Bridge Enterprise Revenue | | 4.00 | 6-30-2031 | 665,000 | 675,688 |
| Colorado Certificate of Participation Rural Colorado Series 2022 | | 6.00 | 12-15-2039 | 4,225,000 | 5,009,637 |
| Colorado Certificate of Participation Rural Colorado Series 2022 | | 6.00 | 12-15-2041 | 27,500,000 | 32,268,536 |
| Colorado Certificate of Participation Rural Colorado Series A | | 4.00 | 12-15-2038 | 8,150,000 | 8,069,476 |
| Colorado Certificate of Participation Rural Colorado Series A | | 4.00 | 12-15-2039 | 3,250,000 | 3,190,844 |
The accompanying notes are an integral part of these financial statements.
Allspring Municipal Bond Fund | 15
Portfolio of investments—December 31, 2022 (unaudited)
| | | Interest
rate | Maturity
date | Principal | Value |
| Miscellaneous revenue (continued) | | | | | |
| Colorado E-470 Public Highway Authority CAB Series A (NPFGC Insured) ¤ | | 0.00% | 9-1-2034 | $ 4,000,000 | $ 2,576,491 |
| Colorado Regional Transportation District Certificate of Participation Series 2014A | | 5.00 | 6-1-2044 | 2,000,000 | 2,015,478 |
| Denver CO School District #1 Certificate of Participation Series B | | 5.00 | 12-15-2035 | 1,000,000 | 1,052,436 |
| Denver CO School District #1 Certificate of Participation Series B | | 5.00 | 12-15-2045 | 1,200,000 | 1,248,492 |
| Longmont CO Certificate of Participation Series 2014 | | 5.00 | 12-1-2034 | 1,000,000 | 1,018,743 |
| Westminster CO Certificate of Participation Series 2015A | | 5.00 | 12-1-2035 | 2,000,000 | 2,103,365 |
| Westminster CO Public Schools Certificate of Participation Series 2019 (AGM Insured) | | 5.00 | 12-1-2048 | 3,500,000 | 3,712,238 |
| | | | | | 68,859,092 |
| Tax revenue: 1.10% | | | | | |
| Colorado Park Creek Metropolitan District Refunding Bonds Series A | | 5.00 | 12-1-2045 | 500,000 | 510,330 |
| Colorado Regional Transportation District Certificate of Participation Series P-3 | | 4.00 | 7-15-2039 | 800,000 | 724,458 |
| Colorado Regional Transportation District Certificate of Participation Series P-3 | | 5.00 | 1-15-2031 | 500,000 | 531,188 |
| Colorado Regional Transportation District Certificate of Participation Series P-3 | | 5.00 | 7-15-2031 | 500,000 | 531,199 |
| Colorado Regional Transportation District Fastracks Project Series A | | 5.00 | 11-1-2041 | 50,945,000 | 53,460,496 |
| Commerce City CO Sales and Use Tax Revenue Bond Series 2014 (AGM Insured) | | 5.00 | 8-1-2044 | 1,250,000 | 1,291,429 |
| Denver CO City & County Refunding & Improvement Bonds Series A | | 5.00 | 8-1-2044 | 3,000,000 | 3,129,026 |
| Thornton CO Development Authority East 144th Avenue and I-25 Project Series B | | 5.00 | 12-1-2034 | 1,375,000 | 1,414,850 |
| | | | | | 61,592,976 |
| Transportation revenue: 0.17% | | | | | |
| Colorado E-470 Public Highway Authority Senior Revenue Bond Series 2020-A | | 5.00 | 9-1-2040 | 2,000,000 | 2,008,764 |
| Colorado E-470 Public Highway Authority Senior Revenue Bonds Series 2020-A | | 5.00 | 9-1-2034 | 1,300,000 | 1,463,523 |
| Colorado E-470 Public Highway Authority Senior Revenue Bonds Series 2020-A | | 5.00 | 9-1-2035 | 1,250,000 | 1,388,116 |
| Colorado E-470 Public Highway Authority Senior Revenue Bonds Series 2020-A | | 5.00 | 9-1-2036 | 1,400,000 | 1,541,139 |
| High Performance Transportation Enterprise US 36 & I-25 Managed Lanes | | 5.75 | 1-1-2044 | 3,360,000 | 3,362,309 |
| | | | | | 9,763,851 |
| Utilities revenue: 0.05% | | | | | |
| Colorado Springs CO Utilities System Improvement Bonds Series 2013 B-2 | | 5.00 | 11-15-2038 | 3,000,000 | 3,039,132 |
| Water & sewer revenue: 0.16% | | | | | |
| Aurora CO Water Revenue Refunding Bond First Lien | | 5.00 | 8-1-2046 | 5,000,000 | 5,408,183 |
| Central Weld County CO Water District (AGM Insured) | | 4.00 | 12-1-2035 | 800,000 | 840,549 |
| Central Weld County CO Water District (AGM Insured) | | 4.00 | 12-1-2037 | 400,000 | 407,602 |
| Central Weld County CO Water District (AGM Insured) | | 4.00 | 12-1-2038 | 400,000 | 403,233 |
The accompanying notes are an integral part of these financial statements.
16 | Allspring Municipal Bond Fund
Portfolio of investments—December 31, 2022 (unaudited)
| | | Interest
rate | Maturity
date | Principal | Value |
| Water & sewer revenue (continued) | | | | | |
| Central Weld County CO Water District (AGM Insured) | | 4.00% | 12-1-2039 | $ 450,000 | $ 451,629 |
| Central Weld County CO Water District (AGM Insured) | | 4.00 | 12-1-2040 | 500,000 | 496,123 |
| East Cherry Creek Valley Water and Sanitation District | | 5.00 | 11-15-2032 | 750,000 | 789,598 |
| | | | | | 8,796,917 |
| | | | | | 250,019,192 |
| Connecticut: 1.39% | | | | | |
| Education revenue: 0.29% | | | | | |
| Connecticut HEFA Trinity College Series R | | 4.00 | 6-1-2045 | 2,500,000 | 2,254,743 |
| Connecticut HEFA Trinity College Series R | | 5.00 | 6-1-2037 | 950,000 | 1,027,989 |
| Connecticut HEFA Trinity College Series R | | 5.00 | 6-1-2038 | 1,000,000 | 1,078,222 |
| Connecticut HEFA Trinity College Series R | | 5.00 | 6-1-2039 | 1,600,000 | 1,717,984 |
| Connecticut HEFA Trinity College Series R | | 5.00 | 6-1-2040 | 1,100,000 | 1,172,384 |
| Connecticut HEFA University of Hartford Series N | | 5.00 | 7-1-2031 | 75,000 | 76,166 |
| Connecticut HEFA University of Hartford Series N | | 5.00 | 7-1-2032 | 550,000 | 556,745 |
| Connecticut HEFA University of Hartford Series N | | 5.00 | 7-1-2033 | 605,000 | 609,870 |
| Connecticut HEFA University of Hartford Series N | | 5.00 | 7-1-2034 | 450,000 | 451,252 |
| Connecticut Higher Education Supplemental Loan Authority AMT | | 3.25 | 11-15-2036 | 1,350,000 | 1,173,053 |
| Connecticut Higher Education Supplemental Loan Authority AMT | | 5.00 | 11-15-2027 | 610,000 | 649,960 |
| Connecticut Higher Education Supplemental Loan Authority AMT | | 5.00 | 11-15-2028 | 530,000 | 569,889 |
| Connecticut Higher Education Supplemental Loan Authority AMT | | 5.00 | 11-15-2029 | 515,000 | 557,737 |
| University of Connecticut Series A | | 5.00 | 2-15-2039 | 1,510,000 | 1,649,894 |
| University of Connecticut Series A | | 5.00 | 2-15-2040 | 2,500,000 | 2,718,563 |
| | | | | | 16,264,451 |
| GO revenue: 0.27% | | | | | |
| Bridgeport CT Series A | | 4.00 | 6-1-2039 | 1,750,000 | 1,708,714 |
| Connecticut Series B | | 5.00 | 6-1-2041 | 1,250,000 | 1,351,293 |
| Hartford CT Series A | | 5.00 | 4-1-2028 | 3,165,000 | 3,181,955 |
| Hartford CT Series B | | 5.00 | 4-1-2025 | 1,220,000 | 1,226,412 |
| Hartford CT Series B | | 5.00 | 4-1-2026 | 1,470,000 | 1,477,917 |
| Hartford CT Series B | | 5.00 | 4-1-2027 | 1,000,000 | 1,005,371 |
| New Britain CT Series A (BAM Insured) | | 5.00 | 3-1-2047 | 1,855,000 | 1,953,181 |
| New Haven CT Series A (AGM Insured) | | 5.00 | 8-1-2039 | 3,000,000 | 3,179,668 |
| | | | | | 15,084,511 |
| Health revenue: 0.13% | | | | | |
| Connecticut HEFA McLean Series A 144A | | 5.00 | 1-1-2045 | 1,000,000 | 930,627 |
| Connecticut HEFA Stamford Hospital Series M | | 5.00 | 7-1-2032 | 2,705,000 | 2,987,045 |
| Connecticut HEFA Stamford Hospital Series M | | 5.00 | 7-1-2033 | 3,000,000 | 3,251,303 |
| | | | | | 7,168,975 |
| Tax revenue: 0.70% | | | | | |
| Connecticut Special Tax Obligation Revenue Transportation Infrastructure Purpose Series 2014A | | 5.00 | 9-1-2028 | 10,105,000 | 10,484,969 |
| Connecticut Special Tax Obligation Revenue Transportation Infrastructure Purpose Series 2018B | | 5.00 | 10-1-2036 | 5,000,000 | 5,442,648 |
| Connecticut Special Tax Obligation Revenue Transportation Infrastructure Purpose Series 2018B | | 5.00 | 10-1-2037 | 7,500,000 | 8,112,069 |
The accompanying notes are an integral part of these financial statements.
Allspring Municipal Bond Fund | 17
Portfolio of investments—December 31, 2022 (unaudited)
| | | Interest
rate | Maturity
date | Principal | Value |
| Tax revenue (continued) | | | | | |
| Connecticut Special Tax Obligation Revenue Transportation Infrastructure Purpose Series 2020A | | 5.00% | 5-1-2040 | $ 1,700,000 | $ 1,845,624 |
| Connecticut Special Tax Obligation Revenue Transportation Infrastructure Purpose Series 2021A (AGM Insured) | | 4.00 | 5-1-2038 | 5,000,000 | 4,949,198 |
| Connecticut Special Tax Obligation Revenue Transportation Infrastructure Purpose Series 2021D | | 4.00 | 11-1-2039 | 2,000,000 | 1,964,742 |
| Connecticut Special Tax Obligation Revenue Transportation Infrastructure Purpose Series 2021D | | 4.00 | 11-1-2040 | 3,500,000 | 3,390,598 |
| Connecticut Special Tax Obligation Revenue Transportation Infrastructure Purpose Series 2022A | | 5.25 | 7-1-2043 | 3,000,000 | 3,356,729 |
| | | | | | 39,546,577 |
| | | | | | 78,064,514 |
| Delaware: 0.48% | | | | | |
| Education revenue: 0.18% | | | | | |
| Delaware EDA Odyssey Charter School Incorporated Project Series A 144A | | 7.00 | 9-1-2045 | 7,500,000 | 7,729,882 |
| Kent County DE Charter School Incorporated Project | | 4.00 | 5-1-2024 | 125,000 | 124,037 |
| Kent County DE Charter School Incorporated Project Series A | | 4.00 | 5-1-2041 | 2,750,000 | 2,362,460 |
| | | | | | 10,216,379 |
| Miscellaneous revenue: 0.05% | | | | | |
| Tender Option Bond Trust Receipts/Floater Certificates Series 2021-XF2945 (Mizuho Capital Markets LLC LOC, Mizuho Capital Markets LLC LIQ) 144Aø | | 3.86 | 6-15-2043 | 2,840,000 | 2,840,000 |
| Tax revenue: 0.01% | | | | | |
| Delaware Series 2002A | | 5.50 | 7-1-2029 | 663,220 | 675,705 |
| Transportation revenue: 0.24% | | | | | |
| Delaware River & Bay Authority Project | | 4.00 | 1-1-2039 | 650,000 | 638,981 |
| Delaware River & Bay Authority Project | | 4.00 | 1-1-2040 | 485,000 | 476,890 |
| Delaware River & Bay Authority Project | | 4.00 | 1-1-2041 | 320,000 | 313,556 |
| Delaware River & Bay Authority Project | | 4.00 | 1-1-2042 | 550,000 | 538,361 |
| Delaware River & Bay Authority Project | | 4.00 | 1-1-2046 | 1,000,000 | 954,832 |
| Delaware River & Bay Authority Project | | 5.00 | 1-1-2031 | 1,000,000 | 1,162,820 |
| Delaware River & Bay Authority Project | | 5.00 | 1-1-2032 | 1,100,000 | 1,294,176 |
| Delaware River & Bay Authority Project | | 5.00 | 1-1-2033 | 1,100,000 | 1,282,893 |
| Delaware River & Bay Authority Project | | 5.00 | 1-1-2038 | 410,000 | 453,127 |
| Delaware River & Bay Authority Project | | 5.00 | 1-1-2039 | 450,000 | 494,180 |
| Delaware River & Bay Authority Project | | 5.00 | 1-1-2040 | 465,000 | 508,066 |
| Delaware River & Bay Authority Project | | 5.00 | 1-1-2041 | 500,000 | 543,683 |
| Delaware River & Bay Authority Project | | 5.00 | 1-1-2042 | 520,000 | 564,227 |
| Delaware Transportation Authority U.S. 301 Project | | 5.00 | 6-1-2055 | 3,950,000 | 4,006,815 |
| | | | | | 13,232,607 |
| | | | | | 26,964,691 |
The accompanying notes are an integral part of these financial statements.
18 | Allspring Municipal Bond Fund
Portfolio of investments—December 31, 2022 (unaudited)
| | | Interest
rate | Maturity
date | Principal | Value |
| District of Columbia: 1.01% | | | | | |
| Airport revenue: 0.33% | | | | | |
| Metropolitan Washington Airports Authority Subordinated Lien Bond Series 2021A | | 5.00% | 10-1-2032 | $ 5,000,000 | $ 5,462,843 |
| Metropolitan Washington Airports Authority Subordinated Lien Bond Series B | | 4.00 | 10-1-2038 | 2,500,000 | 2,373,764 |
| Metropolitan Washington Airports Authority Subordinated Lien Bond Series B | | 4.00 | 10-1-2039 | 3,405,000 | 3,203,760 |
| Metropolitan Washington Airports Authority Subordinated Lien Bond Series B (AGM Insured) | | 4.00 | 10-1-2049 | 8,000,000 | 7,298,918 |
| | | | | | 18,339,285 |
| GO revenue: 0.10% | | | | | |
| District of Columbia Series A | | 5.00 | 6-1-2037 | 5,000,000 | 5,371,127 |
| Miscellaneous revenue: 0.37% | | | | | |
| District of Columbia Revenue Refunding Bonds National Public Radio Incorporated | | 4.00 | 4-1-2033 | 3,400,000 | 3,542,472 |
| District of Columbia Series A | | 5.00 | 10-15-2044 | 10,000,000 | 10,694,667 |
| District of Columbia Series A | | 5.00 | 2-1-2046 | 6,150,000 | 6,650,088 |
| | | | | | 20,887,227 |
| Tax revenue: 0.09% | | | | | |
| Washington Convention and Sports Authority Refunding Bond Senior Lien Series A | | 4.00 | 10-1-2036 | 670,000 | 670,209 |
| Washington Convention and Sports Authority Refunding Bond Senior Lien Series A | | 4.00 | 10-1-2037 | 1,000,000 | 987,711 |
| Washington Convention and Sports Authority Refunding Bond Senior Lien Series A | | 4.00 | 10-1-2037 | 1,115,000 | 1,092,837 |
| Washington Convention and Sports Authority Refunding Bond Senior Lien Series A | | 4.00 | 10-1-2038 | 1,000,000 | 986,176 |
| Washington Convention and Sports Authority Refunding Bond Senior Lien Series A | | 4.00 | 10-1-2039 | 640,000 | 627,967 |
| Washington Convention and Sports Authority Refunding Bond Senior Lien Series A | | 4.00 | 10-1-2039 | 1,000,000 | 969,450 |
| | | | | | 5,334,350 |
| Transportation revenue: 0.12% | | | | | |
| Washington Metropolitan Area Transit Authority Series A | | 4.00 | 7-15-2040 | 6,000,000 | 5,810,267 |
| Washington Metropolitan Area Transit Authority Series A | | 4.00 | 7-15-2045 | 1,000,000 | 943,260 |
| | | | | | 6,753,527 |
| | | | | | 56,685,516 |
| Florida: 6.32% | | | | | |
| Airport revenue: 2.64% | | | | | |
| Broward County FL Airport System Revenue Bond AMT Series 2015A | | 5.00 | 10-1-2034 | 1,750,000 | 1,858,941 |
| Broward County FL Airport System Revenue Bond AMT Series 2015A | | 5.00 | 10-1-2036 | 12,440,000 | 12,715,719 |
| Broward County FL Airport System Revenue Bond AMT Series 2015A | | 5.00 | 10-1-2038 | 2,000,000 | 2,084,734 |
| Broward County FL Port Facilities Revenue AMT Series B | | 4.00 | 9-1-2044 | 7,300,000 | 6,557,994 |
| Greater Orlando Aviation Authority Revenue AMT Series A | | 5.00 | 10-1-2046 | 3,000,000 | 3,035,489 |
The accompanying notes are an integral part of these financial statements.
Allspring Municipal Bond Fund | 19
Portfolio of investments—December 31, 2022 (unaudited)
| | | Interest
rate | Maturity
date | Principal | Value |
| Airport revenue (continued) | | | | | |
| Hillsborough County FL Aviation Authority Revenue Tampa International Airport Series A | | 5.00% | 10-1-2048 | $ 7,000,000 | $ 7,089,237 |
| Hillsborough County FL Aviation Authority Revenue Tampa International Airport Series E | | 5.00 | 10-1-2048 | 10,000,000 | 10,152,589 |
| Hillsborough County FL Aviation Authority Revenue Tampa International Airport Series F | | 5.00 | 10-1-2048 | 17,000,000 | 17,693,161 |
| Jacksonville FL Port Authority Series B | | 5.00 | 11-1-2044 | 4,080,000 | 4,320,923 |
| Jacksonville FL Port Authority Series B | | 5.00 | 11-1-2048 | 9,870,000 | 10,408,078 |
| Miami-Dade County FL Aviation Refunding Bond AMT Series 2014 | | 5.00 | 10-1-2032 | 14,000,000 | 14,232,996 |
| Miami-Dade County FL Aviation Refunding Bond AMT Series A | | 4.00 | 10-1-2038 | 3,250,000 | 3,164,904 |
| Miami-Dade County FL Aviation Refunding Bond AMT Series A | | 4.00 | 10-1-2041 | 1,500,000 | 1,410,773 |
| Miami-Dade County FL Aviation Refunding Bond AMT Series A | | 5.00 | 10-1-2033 | 5,000,000 | 5,070,620 |
| Miami-Dade County FL Aviation Refunding Bond AMT Series A | | 5.00 | 10-1-2049 | 18,750,000 | 18,847,976 |
| Miami-Dade County FL Aviation Refunding Bond AMT Series B | | 5.00 | 10-1-2040 | 18,000,000 | 18,290,372 |
| Miami-Dade County FL Aviation Refunding Bonds AMT Series 2014 | | 5.00 | 10-1-2030 | 11,000,000 | 11,233,221 |
| Miami-Dade County FL Seaport AMT Series B | | 6.00 | 10-1-2033 | 500,000 | 510,393 |
| | | | | | 148,678,120 |
| Education revenue: 0.55% | | | | | |
| Capital Trust Agency Florida Educational Facilities Revenue Renaissance Charter School Incorporated 144A | | 5.00 | 6-15-2039 | 3,610,000 | 3,306,382 |
| Florida Development Finance Corporation Educational Facilities Renaissance Charter School Project Series A | | 8.50 | 6-15-2044 | 13,290,000 | 13,589,675 |
| Florida Development Finance Corporation Educational Facilities Revenue Bonds Series 2022 144A | | 5.00 | 10-1-2042 | 1,605,000 | 1,469,186 |
| Florida Higher Educational Facilities Authority Jacksonville University Project Series A-1 144A | | 5.00 | 6-1-2048 | 2,000,000 | 1,676,956 |
| Volusia County FL Educational Facility Authority Embry-Riddle Aeronautical University | | 5.00 | 10-15-2044 | 6,500,000 | 6,769,640 |
| Volusia County FL Educational Facility Authority Embry-Riddle Aeronautical University | | 5.00 | 10-15-2049 | 4,000,000 | 4,137,536 |
| | | | | | 30,949,375 |
| GO revenue: 0.52% | | | | | |
| Miami-Dade County FL School District | | 5.00 | 3-15-2046 | 15,000,000 | 15,586,061 |
| Miami-Dade County FL Series 2014-A | | 5.00 | 7-1-2043 | 12,935,000 | 13,484,002 |
| | | | | | 29,070,063 |
| Health revenue: 0.65% | | | | | |
| Atlantic Beach FL HCFR Fleet Landing Project Series B | | 5.63 | 11-15-2043 | 5,000,000 | 5,021,563 |
| Holmes County FL Hospital Corporation Doctors Memorial Hospital Project | | 6.00 | 11-1-2038 | 2,500,000 | 2,258,878 |
| Jacksonville FL HCFR Brooks Rehabilitation | | 4.00 | 11-1-2045 | 3,500,000 | 3,128,221 |
| Lee County FL IDA Shell Point Alliance | | 5.00 | 11-15-2044 | 5,350,000 | 5,279,646 |
| Lee County FL IDA Shell Point Alliance | | 5.00 | 11-15-2049 | 1,000,000 | 971,160 |
| Lee Memorial Health System Series B ø | | 4.21 | 4-1-2049 | 6,500,000 | 6,500,000 |
The accompanying notes are an integral part of these financial statements.
20 | Allspring Municipal Bond Fund
Portfolio of investments—December 31, 2022 (unaudited)
| | | Interest
rate | Maturity
date | Principal | Value |
| Health revenue (continued) | | | | | |
| Sarasota County FL Public Hospital District Revenue Bonds Series 2022 | | 5.00% | 7-1-2052 | $ 8,000,000 | $ 8,303,547 |
| St. John's County FL IDA Vicars Landing Project Series A | | 4.00 | 12-15-2046 | 1,500,000 | 1,106,041 |
| Tampa FL Hospital Revenue H. Lee Moffitt Cancer Center Project | | 4.00 | 7-1-2038 | 1,025,000 | 1,006,518 |
| Tampa FL Hospital Revenue H. Lee Moffitt Cancer Center Project | | 4.00 | 7-1-2045 | 2,500,000 | 2,261,791 |
| Tampa FL Hospital Revenue H. Lee Moffitt Cancer Center Project | | 5.00 | 7-1-2040 | 700,000 | 723,594 |
| | | | | | 36,560,959 |
| Housing revenue: 0.20% | | | | | |
| Florida Housing Finance Corporation Journet Place Apartments Series 1 144A | | 7.60 | 12-15-2047 | 760,000 | 798,115 |
| Florida Housing Finance Corporation Villa Capri Phase III | | 7.60 | 12-15-2042 | 2,460,000 | 2,462,668 |
| Tender Option Bond Trust Receipts/Floater Certificates Series 2022-XF3058 (Mizuho Capital Markets LLC LOC) 144Aø | | 3.88 | 8-1-2039 | 8,000,000 | 8,000,000 |
| | | | | | 11,260,783 |
| Industrial development revenue: 0.05% | | | | | |
| Florida Development Finance Corporation Solid Waste AMT Pro USA Incorporated | | 3.00 | 6-1-2032 | 3,500,000 | 2,641,498 |
| Miscellaneous revenue: 0.64% | | | | | |
| Duval County FL School Board Certificate of Participation Series 2022A (AGM Insured) | | 5.00 | 7-1-2033 | 4,750,000 | 5,375,038 |
| Duval County FL School Board Certificate of Participation Series 2022A (AGM Insured) | | 5.00 | 7-1-2034 | 2,000,000 | 2,249,563 |
| Duval County FL School Board Certificate of Participation Series 2022A (AGM Insured) | | 5.00 | 7-1-2035 | 3,000,000 | 3,343,841 |
| Hillsborough County FL Communications Services | | 5.00 | 10-1-2038 | 8,000,000 | 8,334,474 |
| Indigo FL Community Development District Series C | | 7.00 | 5-1-2030 | 2,536,248 | 1,750,011 |
| Lakeside Plantation FL Community Development District Series A | | 6.95 | 5-1-2031 | 846,000 | 846,833 |
| Marshall Creek FL Community Development District | | 5.00 | 5-1-2032 | 1,525,000 | 1,467,503 |
| Marshall Creek FL Community Development District | | 6.32 | 5-1-2045 | 115,000 | 108,581 |
| Orlando FL Capital Improvement Special Revenue Series B | | 5.00 | 10-1-2033 | 1,525,000 | 1,575,673 |
| Orlando FL Capital Improvement Special Revenue Series B | | 5.00 | 10-1-2035 | 1,680,000 | 1,732,355 |
| Orlando FL Capital Improvement Special Revenue Series B | | 5.00 | 10-1-2036 | 1,765,000 | 1,819,398 |
| Pinellas County FL IDA Drs. Kiran & Pallavi Patel Project | | 5.00 | 7-1-2039 | 2,000,000 | 1,914,610 |
| Saint John's County FL School Board Certificate of Participation Series 2022A (AGM Insured) | | 5.25 | 7-1-2047 | 5,000,000 | 5,521,108 |
| | | | | | 36,038,988 |
| Resource recovery revenue: 0.12% | | | | | |
| Florida Development Finance Corporation Solid Waste AMT Pro USA Incorporated 144A | | 5.25 | 8-1-2029 | 7,500,000 | 6,974,058 |
The accompanying notes are an integral part of these financial statements.
Allspring Municipal Bond Fund | 21
Portfolio of investments—December 31, 2022 (unaudited)
| | | Interest
rate | Maturity
date | Principal | Value |
| Tax revenue: 0.26% | | | | | |
| Broward County FL Tourist Development Revenue Convention Center Expansion Revenue Project | | 4.00% | 9-1-2047 | $10,000,000 | $ 9,007,692 |
| Lee County FL Local Option Gas Tax Revenue Bonds Series 2022 | | 5.25 | 8-1-2049 | 5,000,000 | 5,382,982 |
| | | | | | 14,390,674 |
| Transportation revenue: 0.26% | | | | | |
| Central Florida Expressway Authority Series 2021 (AGM Insured) | | 4.00 | 7-1-2039 | 6,070,000 | 6,110,142 |
| Florida Department of Transportation Series A (AGM Insured) | | 4.00 | 7-1-2038 | 4,185,000 | 4,202,910 |
| Osceola County FL Transportation Revenue Refunding Bonds and Improvement Osceola Parkway Series 2019A-1 | | 5.00 | 10-1-2044 | 4,250,000 | 4,261,731 |
| | | | | | 14,574,783 |
| Utilities revenue: 0.06% | | | | | |
| Fort Pierce Utilities Authority Refunding Bonds Series 2022A (AGM Insured) | | 5.00 | 10-1-2038 | 1,000,000 | 1,103,826 |
| Fort Pierce Utilities Authority Refunding Bonds Series 2022A (AGM Insured) | | 5.00 | 10-1-2042 | 1,000,000 | 1,095,106 |
| Lakeland FL Energy System Revenue Bond Series 2021 | | 5.00 | 10-1-2048 | 1,250,000 | 1,451,387 |
| | | | | | 3,650,319 |
| Water & sewer revenue: 0.37% | | | | | |
| Daytona Beach FL Refunding & Improvement Bonds Project (AGM Insured) | | 5.00 | 11-1-2031 | 1,155,000 | 1,158,496 |
| Daytona Beach FL Refunding & Improvement Bonds Project (AGM Insured) | | 5.00 | 11-1-2032 | 1,465,000 | 1,469,434 |
| Florida Keys Aqueduct Authority Series A | | 5.00 | 9-1-2041 | 2,750,000 | 2,831,964 |
| North Sumter County FL Utility Dependent District (BAM Insured) | | 5.00 | 10-1-2044 | 3,000,000 | 3,196,115 |
| North Sumter County FL Utility Dependent District | | 5.00 | 10-1-2049 | 3,250,000 | 3,361,193 |
| Wildwood Utility Dependent District South Sumter Utility Project (BAM Insured) | | 5.00 | 10-1-2046 | 8,250,000 | 8,660,573 |
| | | | | | 20,677,775 |
| | | | | | 355,467,395 |
| Georgia: 2.79% | | | | | |
| Education revenue: 0.19% | | | | | |
| Cobb County GA Development Authority Charter Learning Center Foundation Central Project Series A ♣ | | 6.38 | 7-1-2025 | 1,705,000 | 1,435,518 |
| Georgia Private Colleges & Universities Authority Emory University Revenue Bond Series 2019B | | 5.00 | 9-1-2048 | 4,000,000 | 4,247,848 |
| Georgia Private Colleges & Universities Authority Mercer University Project | | 5.00 | 10-1-2040 | 5,000,000 | 5,071,757 |
| | | | | | 10,755,123 |
| Energy revenue: 0.06% | | | | | |
| Municipal Electric Authority of Georgia Project One Subordinated Bond Series A | | 5.00 | 1-1-2044 | 3,580,000 | 3,600,709 |
The accompanying notes are an integral part of these financial statements.
22 | Allspring Municipal Bond Fund
Portfolio of investments—December 31, 2022 (unaudited)
| | | Interest
rate | Maturity
date | Principal | Value |
| Health revenue: 0.22% | | | | | |
| Brookhaven GA Development Authority Childrens Healthcare of Atlanta | | 4.00% | 7-1-2044 | $ 6,000,000 | $ 5,759,425 |
| Brookhaven GA Development Authority Childrens Healthcare of Atlanta Series 2019A | | 5.00 | 7-1-2038 | 1,500,000 | 1,621,590 |
| Fulton County GA Development Authority Hospital Revenue Bond Series A | | 5.00 | 4-1-2047 | 2,250,000 | 2,277,754 |
| The Glynn-Brunswick Memorial Hospital Authority Revenue Anticipation Certificates Series 2015 | | 5.00 | 8-1-2034 | 2,580,000 | 2,620,410 |
| | | | | | 12,279,179 |
| Industrial development revenue: 0.04% | | | | | |
| George L Smith II Georgia World Congress Center Authority Convention Center Hotel Series B 144A | | 5.00 | 1-1-2054 | 3,000,000 | 2,384,978 |
| Tax revenue: 0.14% | | | | | |
| Metropolitan Atlanta Rapid Third Indenture Series B | | 5.00 | 7-1-2044 | 7,500,000 | 7,794,824 |
| Transportation revenue: 0.14% | | | | | |
| Georgia Road & Tollway Authority CAB I-75 South Expressway Lanes Project Series A 144A¤ | | 0.00 | 6-1-2034 | 3,750,000 | 1,944,282 |
| Georgia Road & Tollway Authority CCAB I-75 South Expressway Lanes Project Series B 144A¤ | | 0.00 | 6-1-2049 | 5,600,000 | 5,639,606 |
| | | | | | 7,583,888 |
| Utilities revenue: 2.00% | | | | | |
| Bartow County Development Authority Pollution Control Georgia Power Company Plant Bowen Project | | 2.75 | 12-1-2032 | 20,000,000 | 19,960,708 |
| Burke County GA Development Authority Georgia Power Company Plant Vogtle Project | | 2.93 | 11-1-2053 | 14,750,000 | 14,583,001 |
| Burke County GA Development Authority Georgia Power Company Plant Vogtle Project Series 2 | | 2.93 | 11-1-2048 | 10,000,000 | 9,886,780 |
| Burke County GA Development Authority Georgia Power Company Vogtle Project Series 5 | | 2.20 | 10-1-2032 | 1,500,000 | 1,233,661 |
| Burke County GA Development Authority Oglethorpe Power Corporation Vogtle Project Series F | | 3.00 | 11-1-2045 | 5,000,000 | 4,998,229 |
| Dalton GA Utilities Revenue | | 4.00 | 3-1-2040 | 1,000,000 | 959,627 |
| Dalton GA Utilities Revenue | | 4.00 | 3-1-2041 | 1,000,000 | 958,551 |
| Georgia Municipal Electric Authority Power Series EE (Ambac Insured) | | 7.25 | 1-1-2024 | 400,000 | 416,611 |
| Main Street Natural Gas Incorporated Gas Supply Revenue Bonds Series 2021A | | 4.00 | 7-1-2052 | 8,500,000 | 8,430,407 |
| Main Street Natural Gas Incorporated Gas Supply Revenue Bonds Series 2022B | | 5.00 | 6-1-2027 | 1,700,000 | 1,754,925 |
| Main Street Natural Gas Incorporated Gas Supply Revenue Bonds Series 2022C 144Aøø | | 4.00 | 8-1-2052 | 27,000,000 | 25,384,917 |
| Main Street Natural Gas Incorporated Georgia Gas Project Series A | | 5.00 | 5-15-2032 | 3,745,000 | 3,895,090 |
| Main Street Natural Gas Incorporated Georgia Gas Project Series B | | 5.00 | 6-1-2029 | 3,300,000 | 3,425,443 |
| Main Street Natural Gas Incorporated Georgia Gas Project Series C | | 5.00 | 6-1-2028 | 2,900,000 | 3,004,854 |
| Main Street Natural Gas Incorporated Georgia Gas Project Subordinate Bond Series B (1 Month LIBOR +0.75%) ± | | 3.51 | 4-1-2048 | 5,100,000 | 5,077,353 |
| Municipal Electric Authority of Georgia Plant Vogtle Units 3&4 Project M | | 5.00 | 1-1-2037 | 1,100,000 | 1,136,144 |
The accompanying notes are an integral part of these financial statements.
Allspring Municipal Bond Fund | 23
Portfolio of investments—December 31, 2022 (unaudited)
| | | Interest
rate | Maturity
date | Principal | Value |
| Utilities revenue (continued) | | | | | |
| Municipal Electric Authority of Georgia Plant Vogtle Units 3&4 Project M | | 5.00% | 1-1-2038 | $ 1,100,000 | $ 1,130,317 |
| Municipal Electric Authority of Georgia Plant Vogtle Units 3&4 Project M (BAM Insured) | | 5.00 | 1-1-2049 | 5,000,000 | 5,111,474 |
| Municipal Electric Authority of Georgia Project One Subordinated Bond Series A | | 4.00 | 1-1-2040 | 1,075,000 | 1,010,159 |
| | | | | | 112,358,251 |
| | | | | | 156,756,952 |
| Guam: 0.14% | | | | | |
| Airport revenue: 0.05% | | | | | |
| Guam Antonio B. Won Pat International Airport Authority Refunding Bond Series A %% | | 5.38 | 10-1-2043 | 750,000 | 718,463 |
| Guam International Airport Authority General Revenue Bonds 2023 Series A %% | | 5.25 | 10-1-2035 | 530,000 | 519,627 |
| Guam International Airport Authority General Revenue Bonds 2023 Series A %% | | 5.25 | 10-1-2036 | 1,000,000 | 972,605 |
| Guam Port Authority Private Activity AMT Series 2018B | | 5.00 | 7-1-2030 | 500,000 | 531,100 |
| | | | | | 2,741,795 |
| Housing revenue: 0.00% | | | | | |
| Guam Housing Corporation Guaranteed Mortgage-Backed Securities Series A (FHLMC Insured) | | 5.75 | 9-1-2031 | 60,000 | 60,172 |
| Tax revenue: 0.04% | | | | | |
| Guam Government Business Privilege Tax Revenue Refunding Bonds Series F | | 4.00 | 1-1-2042 | 2,750,000 | 2,396,653 |
| Water & sewer revenue: 0.05% | | | | | |
| Guam Government Waterworks Authority Series 2013 | | 5.25 | 7-1-2023 | 1,000,000 | 1,003,873 |
| Guam Government Waterworks Authority Series A | | 5.00 | 1-1-2050 | 1,600,000 | 1,585,730 |
| | | | | | 2,589,603 |
| | | | | | 7,788,223 |
| Hawaii: 0.49% | | | | | |
| Airport revenue: 0.49% | | | | | |
| Hawaii Airports System Revenue Series 2020A | | 5.00 | 7-1-2034 | 6,800,000 | 7,277,651 |
| Hawaii Airports System Revenue Series A | | 5.00 | 7-1-2048 | 7,000,000 | 7,086,290 |
| Hawaii AMT Series A | | 4.00 | 7-1-2033 | 1,250,000 | 1,279,538 |
| Hawaii AMT Series A | | 4.00 | 7-1-2034 | 875,000 | 890,897 |
| Hawaii AMT Series A | | 4.00 | 7-1-2035 | 625,000 | 631,869 |
| Hawaii AMT Series A | | 4.00 | 7-1-2036 | 300,000 | 300,374 |
| Hawaii AMT Series A | | 5.00 | 7-1-2041 | 9,500,000 | 9,617,072 |
| Hawaii AMT Series C | | 4.00 | 7-1-2040 | 425,000 | 416,448 |
| | | | | | 27,500,139 |
| Idaho: 0.11% | | | | | |
| Education revenue: 0.11% | | | | | |
| Idaho Housing & Finance Association Legacy Public Charter School Incorporated Project Series A | | 5.85 | 5-1-2033 | 565,000 | 566,224 |
The accompanying notes are an integral part of these financial statements.
24 | Allspring Municipal Bond Fund
Portfolio of investments—December 31, 2022 (unaudited)
| | | Interest
rate | Maturity
date | Principal | Value |
| Education revenue (continued) | | | | | |
| Idaho Housing & Finance Association Legacy Public Charter School Incorporated Project Series A | | 6.25% | 5-1-2043 | $ 1,365,000 | $ 1,368,095 |
| Idaho Housing & Finance Association Nonprofit CAB North Star Charter School Series B 144A¤ | | 0.00 | 7-1-2049 | 1,276,564 | 204,700 |
| Idaho Housing & Finance Association Nonprofit North Star Charter School Series A | | 6.75 | 7-1-2048 | 1,322,876 | 1,384,204 |
| Idaho Housing & Finance Association Nonprofit Refunding Bonds Liberty Charter School Incorporated 144A | | 4.00 | 6-1-2030 | 1,255,000 | 1,247,319 |
| Idaho Housing & Finance Association Nonprofit Refunding Bonds Liberty Charter School Incorporated 144A | | 4.00 | 6-1-2038 | 1,715,000 | 1,565,153 |
| | | | | | 6,335,695 |
| Illinois: 13.34% | | | | | |
| Airport revenue: 0.99% | | | | | |
| Chicago IL O'Hare International Airport AMT Passenger Facility Charge Refunding Bonds Series B | | 5.00 | 1-1-2032 | 8,000,000 | 8,006,630 |
| Chicago IL O'Hare International Airport AMT Passenger Facility Charge Series B | | 5.00 | 1-1-2026 | 5,000,000 | 5,028,589 |
| Chicago IL O'Hare International Airport AMT Senior Lien Series 2015A | | 5.00 | 1-1-2030 | 5,000,000 | 5,107,878 |
| Chicago IL O'Hare International Airport AMT Senior Lien Series 2020A | | 4.00 | 1-1-2035 | 7,500,000 | 7,541,918 |
| Chicago IL O'Hare International Airport AMT Senior Lien Series 2020A | | 5.00 | 1-1-2034 | 5,000,000 | 5,523,331 |
| Chicago IL O'Hare International Airport AMT Senior Lien Series C | | 5.50 | 1-1-2044 | 4,000,000 | 4,000,000 |
| Chicago IL O'Hare International Airport Customer Facility Charge Senior Lien (AGM Insured) | | 5.50 | 1-1-2043 | 4,530,000 | 4,533,390 |
| Chicago IL O'Hare International Airport Customer Facility Charge Senior Lien Series D | | 5.75 | 1-1-2043 | 4,500,000 | 4,520,199 |
| Chicago IL O'Hare International Airport Senior Lien Series B | | 5.00 | 1-1-2039 | 10,250,000 | 10,607,052 |
| Chicago IL O'Hare International Airport Transportation Infrastructure Properties Obligated Group | | 5.00 | 7-1-2038 | 1,000,000 | 1,004,806 |
| | | | | | 55,873,793 |
| Education revenue: 0.37% | | | | | |
| Illinois Finance Authority Acero Charter Schools Incorporated 144A | | 4.00 | 10-1-2042 | 1,250,000 | 961,735 |
| Illinois Finance Authority Bradley University Project Series A | | 4.00 | 8-1-2043 | 750,000 | 647,503 |
| Illinois Finance Authority Charter Schools Project Series A | | 6.25 | 9-1-2039 | 7,955,000 | 8,049,093 |
| Illinois Finance Authority University of Chicago Series A | | 5.00 | 10-1-2036 | 1,500,000 | 1,735,868 |
| Illinois Finance Authority University of Chicago Series A | | 5.00 | 10-1-2037 | 1,350,000 | 1,556,056 |
| Illinois Finance Authority University of Chicago Series A | | 5.00 | 10-1-2038 | 1,500,000 | 1,729,254 |
| Southern Illinois State University Series 04 (BAM Insured) | | 4.00 | 4-1-2035 | 500,000 | 487,049 |
| Southern Illinois State University Series 04 (BAM Insured) | | 4.00 | 4-1-2037 | 1,000,000 | 951,398 |
| Southern Illinois State University Series 04 (BAM Insured) | | 5.00 | 4-1-2032 | 500,000 | 542,146 |
| University of Illinois Auxiliary Facilities Systems CAB Series A (NPFGC Insured) ¤ | | 0.00 | 4-1-2026 | 2,355,000 | 2,116,468 |
| University of Illinois Auxiliary Facilities Systems CAB Series A (NPFGC Insured) ¤ | | 0.00 | 4-1-2027 | 2,435,000 | 2,112,504 |
| | | | | | 20,889,074 |
The accompanying notes are an integral part of these financial statements.
Allspring Municipal Bond Fund | 25
Portfolio of investments—December 31, 2022 (unaudited)
| | | Interest
rate | Maturity
date | Principal | Value |
| GO revenue: 2.76% | | | | | |
| Chicago IL Board of Education CAB City Colleges (NPFGC Insured) ¤ | | 0.00% | 1-1-2025 | $ 9,935,000 | $ 9,213,234 |
| Chicago IL Board of Education CAB School Reform Series B-1 (NPFGC Insured) ¤ | | 0.00 | 12-1-2023 | 2,930,000 | 2,826,683 |
| Chicago IL Board of Education CAB School Reform Series B-1 (NPFGC Insured) ¤ | | 0.00 | 12-1-2026 | 4,245,000 | 3,639,655 |
| Chicago IL Board of Education Series 2021A | | 5.00 | 12-1-2035 | 6,630,000 | 6,675,426 |
| Chicago IL Board of Education Series 2021A | | 5.00 | 12-1-2036 | 2,000,000 | 2,003,793 |
| Chicago IL Board of Education Series 2021A | | 5.00 | 12-1-2040 | 2,000,000 | 1,954,479 |
| Chicago IL CAB City Colleges (NPFGC Insured) ¤ | | 0.00 | 1-1-2030 | 5,995,000 | 4,494,218 |
| Chicago IL CAB Project & Refunding Bond Series C (AGM Insured) ¤ | | 0.00 | 1-1-2026 | 7,360,000 | 6,628,443 |
| Chicago IL Series 2021A | | 5.00 | 1-1-2034 | 11,790,000 | 12,415,925 |
| Chicago IL Series 2021B | | 4.00 | 1-1-2038 | 6,615,000 | 5,947,681 |
| Chicago IL Series 2023A %% | | 5.25 | 1-1-2037 | 1,950,000 | 2,020,567 |
| Chicago IL Series 2023A %% | | 5.50 | 1-1-2040 | 1,000,000 | 1,046,539 |
| Chicago IL Series 2023A %% | | 5.50 | 1-1-2041 | 1,500,000 | 1,549,243 |
| Chicago IL Series 2023A %% | | 5.50 | 1-1-2043 | 1,500,000 | 1,545,483 |
| Chicago IL Series A | | 5.00 | 1-1-2027 | 1,410,000 | 1,459,119 |
| Chicago IL Series A | | 6.00 | 1-1-2038 | 3,000,000 | 3,163,855 |
| Cook County IL Series 2013 | | 5.13 | 12-1-2038 | 2,250,000 | 2,251,334 |
| Illinois Series 1 (NPFGC Insured) | | 6.00 | 11-1-2026 | 3,200,000 | 3,345,361 |
| Illinois Series 2006 | | 5.50 | 1-1-2030 | 2,900,000 | 3,081,233 |
| Illinois Series 2014 (AGM Insured) | | 5.00 | 4-1-2026 | 3,000,000 | 3,054,053 |
| Illinois Series 2016 | | 5.00 | 11-1-2027 | 1,175,000 | 1,206,993 |
| Illinois Series 2022A | | 5.50 | 3-1-2042 | 3,500,000 | 3,608,606 |
| Illinois Series A (AGM Insured) | | 5.00 | 4-1-2024 | 3,000,000 | 3,012,781 |
| Illinois Series B | | 5.00 | 10-1-2028 | 2,750,000 | 2,842,600 |
| Illinois Series B | | 5.50 | 5-1-2024 | 2,500,000 | 2,554,594 |
| Illinois Series C | | 4.00 | 10-1-2038 | 4,820,000 | 4,274,597 |
| Kane, Cook & DuPage Counties IL Refunding Bond Series D | | 5.00 | 1-1-2028 | 1,165,000 | 1,182,577 |
| Kane, Cook & DuPage Counties IL Refunding Bond Series D | | 5.00 | 1-1-2033 | 2,000,000 | 2,023,347 |
| Kane, Cook & DuPage Counties IL School District #46 CAB Series B (Ambac Insured) ¤ | | 0.00 | 1-1-2023 | 10,000,000 | 10,000,000 |
| Kane, Cook & DuPage Counties IL School District #46 Elgin Refunding Bond Series D | | 5.00 | 1-1-2035 | 1,850,000 | 1,886,262 |
| Kendall, Kane & Will Counties IL CAB School District #308 (AGM Insured) ¤ | | 0.00 | 2-1-2025 | 855,000 | 799,073 |
| Kendall, Kane & Will Counties IL CAB School District #308 (AGM Insured) ¤ | | 0.00 | 2-1-2026 | 5,050,000 | 4,566,381 |
| Kendall, Kane & Will Counties IL CAB School District #308 (AGM Insured) ¤ | | 0.00 | 2-1-2027 | 12,050,000 | 10,508,847 |
| Lake County IL School District #24 Millburn CAB (NPFGC Insured) ¤ | | 0.00 | 1-1-2024 | 2,000,000 | 1,931,431 |
| Lake County IL School District #38 Big Hollow CAB (Ambac Insured) ¤ | | 0.00 | 2-1-2024 | 5,385,000 | 5,169,517 |
| Madison, Bond & Montgomery Counties, IL GO Series 2022B (AGM Insured) | | 5.50 | 2-1-2040 | 1,265,000 | 1,395,989 |
| McHenry & Kane Counties IL Community Consolidated School District #158 CAB (AGM / FGIC Insured) ¤ | | 0.00 | 1-1-2023 | 705,000 | 705,000 |
| Metropolitan Water Reclamation District of Greater Chicago Refunding Bond Series C | | 5.25 | 12-1-2032 | 1,565,000 | 1,874,648 |
| Peoria IL Refunding Bonds Series A (BAM Insured) | | 5.00 | 1-1-2029 | 2,000,000 | 2,202,209 |
The accompanying notes are an integral part of these financial statements.
26 | Allspring Municipal Bond Fund
Portfolio of investments—December 31, 2022 (unaudited)
| | | Interest
rate | Maturity
date | Principal | Value |
| GO revenue (continued) | | | | | |
| Sangamon Logan & Menard Counties IL Community Unit School District #15 Williamsville Series B (BAM Insured) | | 4.00% | 12-1-2044 | $ 1,500,000 | $ 1,428,851 |
| Tazewell County IL School District #51 (NPFGC Insured) | | 9.00 | 12-1-2023 | 350,000 | 367,653 |
| Will County IL Community High School CAB Refunding Bond Series B (BAM Insured) ¤ | | 0.00 | 1-1-2032 | 400,000 | 283,917 |
| Will County IL Community High School CAB Refunding Bond Series B (BAM Insured) ¤ | | 0.00 | 1-1-2033 | 2,830,000 | 1,920,653 |
| Will County IL Community High School Refunding Bond Series 2022A (AGM Insured) | | 5.50 | 2-1-2041 | 3,660,000 | 4,044,710 |
| Will County IL Community High School Refunding Bond Series B (BAM Insured) | | 5.00 | 1-1-2028 | 500,000 | 500,000 |
| Will County IL Community Unit School District #201 Crete-Monee Prerefunded Bond CAB (NPFGC Insured) ¤ | | 0.00 | 11-1-2023 | 70,000 | 68,264 |
| Will County IL Community Unit School District #201 Crete-Monee Prerefunded Bond CAB (NPFGC Insured) ¤ | | 0.00 | 11-1-2023 | 430,000 | 418,995 |
| Will County IL Lincoln-Way Community High School District #210 Unrefunded Bond CAB (AGM Insured) ¤ | | 0.00 | 1-1-2026 | 7,000,000 | 6,335,823 |
| | | | | | 155,430,642 |
| Health revenue: 1.07% | | | | | |
| Illinois Finance Authority Carle Foundation Series A | | 4.00 | 8-15-2040 | 8,600,000 | 8,106,842 |
| Illinois Finance Authority Carle Foundation Series A | | 4.00 | 8-15-2048 | 2,450,000 | 2,229,326 |
| Illinois Finance Authority Friendship Village of Schaumberg ♣ | | 5.00 | 2-15-2022 | 1,680,000 | 756,000 |
| Illinois Finance Authority Health Services Facility Lease Revenue Provident Group UIC Surgery Center | | 4.00 | 10-1-2050 | 2,000,000 | 1,683,752 |
| Illinois Finance Authority Lutheran Life Communities | | 5.00 | 11-1-2040 | 4,900,000 | 4,237,288 |
| Illinois Finance Authority Northwestern Memorial Project | | 4.00 | 7-15-2039 | 2,250,000 | 2,245,638 |
| Illinois Finance Authority Revenue Bonds Series 2015A | | 5.00 | 11-15-2045 | 10,000,000 | 10,015,419 |
| Illinois Finance Authority University of Chicago Series 2022A | | 5.00 | 8-15-2047 | 30,000,000 | 31,172,697 |
| | | | | | 60,446,962 |
| Housing revenue: 0.03% | | | | | |
| Northern Illinois University Auxiliary Facilities System (BAM Insured) | | 4.00 | 10-1-2037 | 1,650,000 | 1,590,796 |
| Miscellaneous revenue: 0.64% | | | | | |
| Chicago IL Certificate of Participation River Point Plaza Redevelopment Project Series A 144A | | 4.84 | 4-15-2028 | 3,799,000 | 3,801,051 |
| Illinois Finance Authority Shedd Aquarium Society Series 2022 | | 5.00 | 6-1-2044 | 4,000,000 | 4,241,266 |
| Illinois Finance Authority Shedd Aquarium Society Series 2022 | | 5.00 | 6-1-2047 | 5,000,000 | 5,261,566 |
| Illinois GO Series July 2013 | | 5.50 | 7-1-2026 | 4,450,000 | 4,485,337 |
| Illinois GO Series November 2017C | | 5.00 | 11-1-2029 | 2,965,000 | 3,037,515 |
| Illinois Series 2013 | | 5.25 | 7-1-2030 | 2,500,000 | 2,509,999 |
| Illinois Series 2013 | | 5.50 | 7-1-2025 | 6,000,000 | 6,051,947 |
| Illinois Series 2013 | | 5.50 | 7-1-2033 | 4,000,000 | 4,014,179 |
| Illinois Series 2021A | | 5.00 | 3-1-2046 | 2,500,000 | 2,429,680 |
| | | | | | 35,832,540 |
The accompanying notes are an integral part of these financial statements.
Allspring Municipal Bond Fund | 27
Portfolio of investments—December 31, 2022 (unaudited)
| | | Interest
rate | Maturity
date | Principal | Value |
| Tax revenue: 5.59% | | | | | |
| Chicago IL Motor Fuel Tax Refunding Bonds Series 2013 | | 5.00% | 1-1-2024 | $ 680,000 | $ 693,664 |
| Chicago IL Refunding Bonds Series 2002 | | 5.00 | 1-1-2028 | 4,430,000 | 4,625,132 |
| Chicago IL Refunding Bonds Series 2002 | | 5.00 | 1-1-2029 | 1,500,000 | 1,566,072 |
| Chicago IL Sales Tax Refunding Bond | | 5.00 | 1-1-2027 | 3,000,000 | 3,132,143 |
| Chicago IL Sales Tax Refunding Bond | | 5.00 | 1-1-2030 | 4,325,000 | 4,515,507 |
| Chicago IL Transit Authority Sales Tax Receipts Bonds (AGM Insured) | | 5.00 | 12-1-2044 | 4,000,000 | 4,112,883 |
| Chicago IL Transit Authority Sales Tax Receipts Bonds | | 5.00 | 12-1-2046 | 21,500,000 | 21,819,071 |
| Chicago IL Transit Authority Sales Tax Receipts Bonds Series 2022A (BAM Insured) | | 5.00 | 12-1-2046 | 10,000,000 | 10,208,746 |
| Chicago IL Transit Authority Sales Tax Receipts Bonds Series A | | 5.00 | 12-1-2045 | 1,750,000 | 1,772,419 |
| Chicago IL Transit Authority Sales Tax Receipts Revenue Bonds Series 2014 | | 5.25 | 12-1-2049 | 13,500,000 | 13,639,131 |
| Cook County IL Sales Tax Revenue Bonds Series 2022A | | 5.25 | 11-15-2045 | 5,000,000 | 5,361,970 |
| Cook County IL Series A | | 4.00 | 11-15-2041 | 2,000,000 | 1,843,709 |
| Illinois Regional Transportation Authority (AGM Insured) | | 5.75 | 6-1-2023 | 145,000 | 146,536 |
| Illinois Regional Transportation Authority Series A | | 5.00 | 6-1-2044 | 22,840,000 | 23,541,455 |
| Illinois Regional Transportation Authority Series A (AGM Insured) | | 5.75 | 6-1-2034 | 19,000,000 | 22,317,102 |
| Illinois Regional Transportation Authority Series A (NPFGC Insured) | | 6.00 | 7-1-2027 | 10,620,000 | 11,721,154 |
| Illinois Regional Transportation Authority Series A (NPFGC Insured) | | 6.00 | 7-1-2033 | 5,000,000 | 6,130,982 |
| Illinois Regional Transportation Authority Series B (NPFGC Insured) | | 5.50 | 6-1-2027 | 16,845,000 | 18,035,507 |
| Illinois Sales Tax Build Illinois Junior Obligation | | 5.00 | 6-15-2023 | 10,000,000 | 10,067,353 |
| Illinois Sales Tax Revenue Bond Junior Obligation Tax-Exempt Series A (BAM Insured) | | 4.00 | 6-15-2034 | 2,000,000 | 2,022,979 |
| Illinois Sales Tax Revenue Bond Junior Obligation Tax-Exempt Series A (BAM Insured) | | 4.13 | 6-15-2037 | 1,945,000 | 1,950,013 |
| Illinois Sales Tax Revenue Bond Junior Obligation Tax-Exempt Series C | | 5.00 | 6-15-2028 | 3,500,000 | 3,706,301 |
| Illinois Sales Tax Revenue Bond Junior Obligation Tax-Exempt Series D | | 4.00 | 6-15-2030 | 12,000,000 | 12,059,033 |
| Illinois Sales Tax Securitization Series A | | 4.00 | 1-1-2048 | 5,430,000 | 4,772,946 |
| Illinois Sales Tax Securitization Series A | | 5.00 | 1-1-2038 | 3,000,000 | 3,096,281 |
| Illinois Sales Tax Securitization Series C | | 5.00 | 1-1-2024 | 2,500,000 | 2,549,003 |
| Illinois Sports Facilities Authority Refunding Bonds State Tax Supported CAB (Ambac Insured) ¤ | | 0.00 | 6-15-2026 | 2,030,000 | 1,788,822 |
| Illinois Sports Facilities Authority State Tax Supported CAB (Ambac Insured) ¤ | | 0.00 | 6-15-2024 | 17,570,000 | 16,647,204 |
| Illinois Sports Facilities Authority State Tax Supported CAB (Ambac Insured) ¤ | | 0.00 | 6-15-2025 | 2,575,000 | 2,351,798 |
| Illinois Sports Facilities Authority State Tax Supported Refunding Bond (AGM Insured) | | 5.00 | 6-15-2025 | 3,745,000 | 3,821,252 |
| Illinois Sports Facilities Authority State Tax Supported Refunding Bond (AGM Insured) | | 5.00 | 6-15-2026 | 4,775,000 | 4,871,546 |
| Illinois Sports Facilities Authority State Tax Supported Refunding Bond (AGM Insured) | | 5.00 | 6-15-2027 | 8,845,000 | 9,021,329 |
| Illinois Sports Facilities Authority State Tax Supported Refunding Bond (AGM Insured) | | 5.00 | 6-15-2028 | 4,030,000 | 4,109,197 |
| Illinois Sports Facilities Authority State Tax Supported Refunding Bond (AGM Insured) | | 5.25 | 6-15-2032 | 3,500,000 | 3,574,059 |
| Metropolitan Pier & Exposition Authority CAB McCormick Place Expansion Project Series A (NPFGC Insured) ¤ | | 0.00 | 12-15-2026 | 12,245,000 | 10,588,769 |
The accompanying notes are an integral part of these financial statements.
28 | Allspring Municipal Bond Fund
Portfolio of investments—December 31, 2022 (unaudited)
| | | Interest
rate | Maturity
date | Principal | Value |
| Tax revenue (continued) | | | | | |
| Metropolitan Pier & Exposition Authority CAB McCormick Place Expansion Project Series A (NPFGC Insured) ¤ | | 0.00% | 12-15-2030 | $25,700,000 | $ 18,644,929 |
| Metropolitan Pier & Exposition Authority CAB McCormick Place Expansion Project Series A (NPFGC Insured) ¤ | | 0.00 | 6-15-2031 | 10,060,000 | 7,106,270 |
| Metropolitan Pier & Exposition Authority CAB McCormick Place Expansion Project Series A (NPFGC Insured) ¤ | | 0.00 | 12-15-2031 | 9,800,000 | 6,769,985 |
| Metropolitan Pier & Exposition Authority CAB McCormick Place Expansion Project Series B (NPFGC Insured) ¤ | | 0.00 | 6-15-2029 | 12,085,000 | 9,367,838 |
| Metropolitan Pier & Exposition Authority Revenue Refunding Bonds McCormick Place Expansion Project Series A | | 4.00 | 12-15-2042 | 2,500,000 | 2,175,337 |
| Sales Tax Securitization Corporation Second Lien Sales Tax | | 4.00 | 1-1-2038 | 8,950,000 | 8,627,672 |
| Southwestern Illinois Development Authority Local Government Program Collinsville Limited | | 5.00 | 3-1-2025 | 3,015,000 | 2,454,827 |
| Tender Option Bond Trust Receipts/Floater Certificates Series 2017-XF2406 (Barclays Bank plc LOC, Barclays Bank plc LIQ) 144Aø | | 3.69 | 6-15-2031 | 7,055,000 | 7,055,000 |
| | | | | | 314,382,926 |
| Tobacco revenue: 0.06% | | | | | |
| Railsplitter Tobacco Settlement Authority | | 5.00 | 6-1-2024 | 3,000,000 | 3,078,300 |
| Transportation revenue: 0.60% | | | | | |
| Chicago IL Public Building Commission Transit Authority (Ambac Insured) | | 5.25 | 3-1-2025 | 2,960,000 | 3,084,765 |
| Chicago IL Public Building Commission Transit Authority (Ambac Insured) | | 5.25 | 3-1-2027 | 3,400,000 | 3,672,366 |
| Illinois Toll Highway Authority Senior Series A | | 5.00 | 1-1-2043 | 9,000,000 | 9,529,036 |
| Illinois Toll Highway Authority Senior Series A | | 5.00 | 1-1-2046 | 15,245,000 | 16,115,630 |
| Illinois Toll Highway Authority Senior Series B | | 5.00 | 1-1-2039 | 1,500,000 | 1,515,513 |
| | | | | | 33,917,310 |
| Utilities revenue: 0.28% | | | | | |
| Illinois Municipal Electric Agency Power Supply System Series A | | 5.00 | 2-1-2030 | 7,000,000 | 7,301,778 |
| Illinois Municipal Electric Agency Power Supply System Series A | | 5.00 | 2-1-2031 | 8,000,000 | 8,324,784 |
| | | | | | 15,626,562 |
| Water & sewer revenue: 0.95% | | | | | |
| Chicago IL Refunding Bond Second Lien Project | | 5.00 | 11-1-2029 | 4,600,000 | 4,628,106 |
| Chicago IL Wastewater Refunding Bond Second Lien Bond Series C | | 5.00 | 1-1-2039 | 5,000,000 | 5,021,952 |
| Chicago IL Wastewater Transmission Second Lien Series 2012 | | 5.00 | 1-1-2027 | 5,000,000 | 5,005,664 |
| Chicago IL Wastewater Transmission Second Lien Series 2014 | | 5.00 | 1-1-2039 | 11,525,000 | 11,550,760 |
| Chicago IL Wastewater Transmission Second Lien Series 2014 | | 5.00 | 1-1-2044 | 4,425,000 | 4,427,628 |
| Chicago IL Waterworks Second Lien (AGM Insured) | | 5.25 | 11-1-2032 | 3,250,000 | 3,507,700 |
| Chicago IL Waterworks Second Lien Series 2012 | | 5.00 | 11-1-2030 | 5,000,000 | 5,030,566 |
The accompanying notes are an integral part of these financial statements.
Allspring Municipal Bond Fund | 29
Portfolio of investments—December 31, 2022 (unaudited)
| | | Interest
rate | Maturity
date | Principal | Value |
| Water & sewer revenue (continued) | | | | | |
| Chicago IL Waterworks Second Lien Series 2014 | | 5.00% | 11-1-2044 | $ 9,000,000 | $ 9,040,265 |
| Illinois Finance Authority Clean Water Initiative | | 4.00 | 7-1-2038 | 5,000,000 | 5,060,190 |
| | | | | | 53,272,831 |
| | | | | | 750,341,736 |
| Indiana: 1.73% | | | | | |
| Education revenue: 0.31% | | | | | |
| Indiana Finance Authority Educational Facilities Multipurpose DePauw University Project Series 2022A | | 5.00 | 7-1-2047 | 17,000,000 | 17,083,956 |
| Indiana Finance Authority Educational Facilities Multipurpose KIPP Indianapolis Incorporated Project | | 5.00 | 7-1-2040 | 350,000 | 330,873 |
| | | | | | 17,414,829 |
| Health revenue: 0.41% | | | | | |
| Indiana Finance Authority Health System Revenue Bonds Franciscan Alliance Incorporated Obligated Group Series C | | 4.00 | 11-1-2033 | 12,885,000 | 13,064,304 |
| Indiana Finance Authority Health System Revenue Bonds Franciscan Alliance Incorporated Obligated Group Series C | | 4.00 | 11-1-2036 | 5,000,000 | 5,014,958 |
| Indiana Finance Authority Marion General Hospital Series A | | 4.00 | 7-1-2045 | 2,560,000 | 2,393,493 |
| Indiana HFFA Ascension Health Credit Group | | 5.00 | 11-15-2034 | 2,750,000 | 2,860,360 |
| | | | | | 23,333,115 |
| Industrial development revenue: 0.28% | | | | | |
| Indiana Finance Authority Ohio River Bridges East End Crossing Project Series A | | 5.00 | 7-1-2040 | 2,720,000 | 2,740,322 |
| Indiana Finance Authority Tax-Exempt Private Activity Bonds Ohio River Bridges East End Crossing Partners LLC Project Series A-P3 | | 5.00 | 7-1-2048 | 10,000,000 | 10,074,715 |
| Valparaiso IN Pratt Paper LLC Project | | 5.88 | 1-1-2024 | 200,000 | 202,267 |
| Whiting IN Industry Environmental Facilities | | 5.00 | 3-1-2046 | 2,500,000 | 2,503,264 |
| | | | | | 15,520,568 |
| Miscellaneous revenue: 0.32% | | | | | |
| Carmel IN Local Public Improvement Multipurpose Bonds | | 5.00 | 7-15-2031 | 6,000,000 | 6,437,963 |
| Clarke County IN Building Corporation Series 2022 | | 6.00 | 7-15-2038 | 5,000,000 | 5,996,986 |
| Hobart Industry Building Corporation First Mortgage | | 4.00 | 7-15-2035 | 2,295,000 | 2,360,657 |
| Indianapolis IN Industry Local Public Improvement Bond Bank Series A (AGM Insured) | | 4.00 | 6-1-2041 | 3,000,000 | 2,926,388 |
| | | | | | 17,721,994 |
| Tax revenue: 0.07% | | | | | |
| Indianapolis IN Industry Local Public Improvement Bond Bank Community Justice Campus Courthouse & Jail Project | | 5.00 | 2-1-2049 | 4,000,000 | 4,168,428 |
| Utilities revenue: 0.19% | | | | | |
| Indiana Finance Authority Midwestern Disaster Relief Ohio Valley Electric Corporation Project | | 3.00 | 11-1-2030 | 4,000,000 | 3,537,522 |
The accompanying notes are an integral part of these financial statements.
30 | Allspring Municipal Bond Fund
Portfolio of investments—December 31, 2022 (unaudited)
| | | Interest
rate | Maturity
date | Principal | Value |
| Utilities revenue (continued) | | | | | |
| Indiana Finance Authority Midwestern Disaster Relief Revenue Various Ohio Valley Electric Corporation Project Series 2012A | | 4.25% | 11-1-2030 | $ 3,000,000 | $ 2,895,440 |
| Indiana Finance Authority Ohio Valley Electric Corporation Project Series A | | 3.00 | 11-1-2030 | 4,650,000 | 4,112,370 |
| | | | | | 10,545,332 |
| Water & sewer revenue: 0.15% | | | | | |
| Evansville IN Waterworks Series 2022A (BAM Insured) | | 5.00 | 7-1-2047 | 2,250,000 | 2,410,770 |
| Fishers Industry Sewage Works Revenue (BAM Insured) | | 4.00 | 7-1-2043 | 3,450,000 | 3,287,673 |
| Fishers Industry Sewage Works Revenue (BAM Insured) | | 4.00 | 7-1-2045 | 3,160,000 | 2,930,279 |
| | | | | | 8,628,722 |
| | | | | | 97,332,988 |
| Iowa: 0.03% | | | | | |
| GO revenue: 0.03% | | | | | |
| Altoona IA Annual Appropriation Urban Renewal Series C | | 5.00 | 6-1-2031 | 1,805,000 | 1,922,736 |
| Kansas: 0.26% | | | | | |
| GO revenue: 0.05% | | | | | |
| Wyandotte County KS Unified School District No. 203 (AGM Insured) | | 5.25 | 9-1-2052 | 2,500,000 | 2,755,720 |
| Tax revenue: 0.21% | | | | | |
| Wyandotte County & Kansas City KS Special Obligation Vacation Village Project Area 4 Major Multi-Sport Athletic Complex Project CAB 144A¤ | | 0.00 | 9-1-2034 | 33,280,000 | 11,606,154 |
| | | | | | 14,361,874 |
| Kentucky: 1.58% | | | | | |
| Education revenue: 0.03% | | | | | |
| Kentucky Bond Development Corporation Danville Centre College Project | | 4.00 | 6-1-2046 | 800,000 | 702,484 |
| Kentucky Bond Development Corporation Danville Centre College Project | | 4.00 | 6-1-2051 | 1,250,000 | 1,069,738 |
| | | | | | 1,772,222 |
| Health revenue: 0.27% | | | | | |
| Kentucky EDFA Baptist Healthcare System Series 2017-B | | 5.00 | 8-15-2046 | 2,070,000 | 2,088,569 |
| Kentucky EDFA Norton Healthcare Incorporated Series B (NPFGC Insured) ¤ | | 0.00 | 10-1-2024 | 9,260,000 | 8,698,456 |
| Kentucky EDFA Norton Healthcare Incorporated Series B (NPFGC Insured) ¤ | | 0.00 | 10-1-2028 | 5,140,000 | 4,156,100 |
| | | | | | 14,943,125 |
| Miscellaneous revenue: 0.16% | | | | | |
| Kentucky State Property and Buildings Commission Revenue Bonds Series A (AGM Insured) | | 5.00 | 11-1-2039 | 6,000,000 | 6,539,887 |
| Kentucky State University Certificate of Participation University Project (BAM Insured) | | 4.00 | 11-1-2046 | 640,000 | 603,374 |
The accompanying notes are an integral part of these financial statements.
Allspring Municipal Bond Fund | 31
Portfolio of investments—December 31, 2022 (unaudited)
| | | Interest
rate | Maturity
date | Principal | Value |
| Miscellaneous revenue (continued) | | | | | |
| Kentucky State University Certificate of Participation University Project (BAM Insured) | | 4.00% | 11-1-2051 | $ 1,000,000 | $ 909,641 |
| Kentucky State University Certificate of Participation University Project (BAM Insured) | | 4.00 | 11-1-2056 | 1,000,000 | 892,947 |
| | | | | | 8,945,849 |
| Transportation revenue: 0.15% | | | | | |
| Kentucky Public Transportation Infrastructure Authority Downtown Crossing Project CAB Series B ¤ | | 0.00 | 7-1-2030 | 2,000,000 | 1,384,280 |
| Kentucky Public Transportation Infrastructure Authority Downtown Crossing Project CAB Series B ¤ | | 0.00 | 7-1-2031 | 2,780,000 | 1,790,120 |
| Kentucky Public Transportation Infrastructure Authority Downtown Crossing Project CAB Series B ¤ | | 0.00 | 7-1-2032 | 2,500,000 | 1,495,845 |
| Kentucky Public Transportation Infrastructure Authority Downtown Crossing Project CAB Series C øø | | 0.00 | 7-1-2033 | 1,000,000 | 1,115,936 |
| Kentucky Public Transportation Infrastructure Authority Downtown Crossing Project CAB Series C øø | | 0.00 | 7-1-2034 | 2,505,000 | 2,790,535 |
| | | | | | 8,576,716 |
| Utilities revenue: 0.97% | | | | | |
| Kentucky Public Energy Authority Gas Supply Series A-1 | | 4.00 | 12-1-2049 | 18,455,000 | 18,284,668 |
| Kentucky Public Energy Authority Gas Supply Series A2 | | 4.00 | 4-1-2048 | 8,190,000 | 8,175,617 |
| Kentucky Public Energy Authority Gas Supply Series B | | 4.00 | 1-1-2049 | 23,250,000 | 23,080,229 |
| Kentucky Public Energy Authority Gas Supply Series C | | 4.00 | 12-1-2049 | 5,385,000 | 5,335,299 |
| | | | | | 54,875,813 |
| | | | | | 89,113,725 |
| Louisiana: 0.59% | | | | | |
| Airport revenue: 0.34% | | | | | |
| New Orleans LA Aviation Board AMT Series B (AGM Insured) | | 5.00 | 1-1-2033 | 3,000,000 | 3,068,580 |
| New Orleans LA Aviation Board AMT Series B | | 5.00 | 1-1-2034 | 4,500,000 | 4,588,709 |
| New Orleans LA Aviation Board General Airport North Terminal Project Series 2017B | | 5.00 | 1-1-2048 | 1,145,000 | 1,130,147 |
| New Orleans LA Aviation Board General Airport Revenue Bonds Series 2015A | | 5.00 | 1-1-2040 | 3,000,000 | 3,033,634 |
| New Orleans LA Aviation Board Gulf Opportunity Zone Consolidated Rental Car Project (AGM Insured) | | 5.00 | 1-1-2036 | 1,750,000 | 1,845,620 |
| New Orleans LA Aviation Board Gulf Opportunity Zone Consolidated Rental Car Project (AGM Insured) | | 5.00 | 1-1-2037 | 1,750,000 | 1,830,780 |
| New Orleans LA Aviation Board Gulf Opportunity Zone Consolidated Rental Car Project (AGM Insured) | | 5.00 | 1-1-2038 | 1,500,000 | 1,561,818 |
| Port of New Orleans LA AMT Series E | | 5.00 | 4-1-2040 | 2,000,000 | 2,046,727 |
| | | | | | 19,106,015 |
| GO revenue: 0.04% | | | | | |
| New Orleans LA Series 2021A | | 5.00 | 12-1-2046 | 2,000,000 | 2,071,260 |
| Miscellaneous revenue: 0.02% | | | | | |
| Louisiana Local Government Environmental Facilities and CDA Jefferson Parish Gomesa Project 144Aøø | | 4.00 | 11-1-2044 | 1,830,000 | 1,404,354 |
The accompanying notes are an integral part of these financial statements.
32 | Allspring Municipal Bond Fund
Portfolio of investments—December 31, 2022 (unaudited)
| | | Interest
rate | Maturity
date | Principal | Value |
| Water & sewer revenue: 0.19% | | | | | |
| East Baton Rouge LA Refunding Bonds Multi Modal Series A | | 1.30% | 2-1-2041 | $ 6,075,000 | $ 5,217,581 |
| New Orleans LA Series B (AGM Insured) | | 4.00 | 6-1-2038 | 350,000 | 346,433 |
| New Orleans LA Series B (AGM Insured) | | 4.00 | 6-1-2039 | 400,000 | 393,457 |
| New Orleans LA Series B (AGM Insured) | | 4.00 | 6-1-2040 | 350,000 | 341,682 |
| New Orleans LA Series B | | 4.00 | 6-1-2050 | 1,200,000 | 1,082,878 |
| New Orleans LA Series B | | 5.00 | 6-1-2045 | 1,500,000 | 1,554,461 |
| Shreveport LA Series B (AGM Insured) | | 4.00 | 12-1-2036 | 730,000 | 706,754 |
| Shreveport LA Series B (AGM Insured) | | 4.00 | 12-1-2044 | 1,000,000 | 900,016 |
| | | | | | 10,543,262 |
| | | | | | 33,124,891 |
| Maine: 0.18% | | | | | |
| Health revenue: 0.18% | | | | | |
| Maine HEFA Mainehealth Series A | | 4.00 | 7-1-2040 | 1,700,000 | 1,575,049 |
| Maine HEFA Mainehealth Series A | | 4.00 | 7-1-2045 | 4,500,000 | 4,064,599 |
| Maine HEFA Series A | | 4.00 | 7-1-2046 | 500,000 | 480,834 |
| Maine HEFA Series A | | 4.00 | 7-1-2050 | 1,000,000 | 934,911 |
| Maine HEFA Series A | | 5.00 | 7-1-2028 | 1,445,000 | 1,553,058 |
| Maine HEFA Series A | | 5.00 | 7-1-2029 | 455,000 | 516,356 |
| Maine HEFA Series A | | 5.00 | 7-1-2029 | 1,080,000 | 1,180,565 |
| | | | | | 10,305,372 |
| Maryland: 0.42% | | | | | |
| Education revenue: 0.30% | | | | | |
| Maryland Economic Development Corporation Salisbury University Project | | 5.00 | 6-1-2030 | 200,000 | 200,026 |
| Maryland Economic Development Corporation Student Housing Salisbury University Project | | 5.00 | 6-1-2027 | 235,000 | 235,060 |
| Prince George's County MD Chesapeake Lighthouse Charter School Project Series 2016-A | | 5.75 | 8-1-2033 | 1,585,000 | 1,589,295 |
| Prince George's County MD Chesapeake Lighthouse Charter School Project Series 2016-A 144A | | 6.90 | 8-1-2041 | 8,480,000 | 8,734,482 |
| Prince George's County MD Chesapeake Lighthouse Charter School Project Series 2016-A | | 7.00 | 8-1-2046 | 6,085,000 | 6,318,202 |
| | | | | | 17,077,065 |
| Health revenue: 0.03% | | | | | |
| Maryland HEFA Frederick Health System | | 4.00 | 7-1-2045 | 745,000 | 675,057 |
| Maryland HEFA Frederick Health System | | 4.00 | 7-1-2050 | 850,000 | 742,342 |
| | | | | | 1,417,399 |
| Miscellaneous revenue: 0.04% | | | | | |
| Maryland Economic Development Corporation Special Obligation Covington Project | | 4.00 | 9-1-2050 | 2,500,000 | 1,949,349 |
| Water & sewer revenue: 0.05% | | | | | |
| Baltimore MD Water Projects Series A | | 4.00 | 7-1-2039 | 500,000 | 494,280 |
The accompanying notes are an integral part of these financial statements.
Allspring Municipal Bond Fund | 33
Portfolio of investments—December 31, 2022 (unaudited)
| | | Interest
rate | Maturity
date | Principal | Value |
| Water & sewer revenue (continued) | | | | | |
| Baltimore MD Water Projects Series A | | 4.00% | 7-1-2040 | $ 500,000 | $ 487,962 |
| Baltimore MD Water Projects Series A | | 4.00 | 7-1-2045 | 2,000,000 | 1,911,461 |
| | | | | | 2,893,703 |
| | | | | | 23,337,516 |
| Massachusetts: 2.16% | | | | | |
| Airport revenue: 0.20% | | | | | |
| Massachusetts AMT Series B | | 4.00 | 7-1-2046 | 2,965,000 | 2,722,040 |
| Massachusetts Port Authority AMT Series 2022-A | | 5.00 | 7-1-2039 | 4,005,000 | 4,235,650 |
| Massachusetts Port Authority AMT Series 2022-A | | 5.00 | 7-1-2042 | 2,000,000 | 2,088,990 |
| Massachusetts Port Authority AMT Series E | | 5.00 | 7-1-2046 | 1,975,000 | 2,035,643 |
| | | | | | 11,082,323 |
| Education revenue: 0.26% | | | | | |
| Lowell MA Collegiate Charter School Revenue | | 5.00 | 6-15-2039 | 1,000,000 | 972,656 |
| Lowell MA Collegiate Charter School Revenue | | 5.00 | 6-15-2049 | 1,750,000 | 1,612,742 |
| Massachusetts Development Finance Agency Lasell University Project | | 4.00 | 7-1-2045 | 2,400,000 | 1,818,934 |
| Massachusetts Development Finance Agency Lasell University Project | | 4.00 | 7-1-2050 | 2,750,000 | 1,990,493 |
| Massachusetts Development Finance Agency Northeastern University Project Series 2022 | | 5.00 | 10-1-2044 | 7,000,000 | 7,727,782 |
| Massachusetts Development Finance Agency Suffolk University Project Series 2021 | | 4.00 | 7-1-2051 | 1,000,000 | 809,032 |
| | | | | | 14,931,639 |
| GO revenue: 0.17% | | | | | |
| Massachusetts GO Series A | | 5.00 | 3-1-2041 | 7,500,000 | 7,601,381 |
| Massachusetts Series E | | 5.25 | 9-1-2048 | 1,765,000 | 1,882,787 |
| | | | | | 9,484,168 |
| Health revenue: 0.34% | | | | | |
| Massachusetts Development Finance Agency Dana Farber Cancer Institute Project Series 2016-N | | 5.00 | 12-1-2046 | 3,000,000 | 3,034,890 |
| Massachusetts Development Finance Agency Revenue Bonds Boston Medical Center Issue Series D | | 5.00 | 7-1-2044 | 6,000,000 | 6,029,604 |
| Massachusetts Development Finance Agency Revenue Massachusetts General/Brigham & Women's Hospital Series A-2 | | 4.00 | 7-1-2040 | 1,000,000 | 968,688 |
| Massachusetts Development Finance Agency Revenue Massachusetts General/Brigham & Women's Hospital Series A-2 | | 4.00 | 7-1-2041 | 1,200,000 | 1,151,191 |
| Massachusetts Development Finance Agency Revenue Wellforce Incorporated Series C (AGM Insured) | | 4.00 | 10-1-2045 | 2,500,000 | 2,279,132 |
| Massachusetts HEFA Partners Healthcare Systems Series F3 (TD Bank NA LOC) ø | | 3.65 | 7-1-2040 | 835,000 | 835,000 |
| Massachusetts State Development Finance Authority Revenue Bonds Series F | | 5.00 | 8-15-2045 | 4,950,000 | 5,000,508 |
| | | | | | 19,299,013 |
| Tax revenue: 0.84% | | | | | |
| Massachusetts Series F | | 5.00 | 11-1-2041 | 5,000,000 | 5,281,927 |
The accompanying notes are an integral part of these financial statements.
34 | Allspring Municipal Bond Fund
Portfolio of investments—December 31, 2022 (unaudited)
| | | Interest
rate | Maturity
date | Principal | Value |
| Tax revenue (continued) | | | | | |
| Massachusetts Transportation Fund Revenue Rail Enhancement & Accelerated Bridge Programs Series A | | 5.00% | 6-1-2047 | $ 6,485,000 | $ 6,786,076 |
| Massachusetts Transportation Fund Revenue Rail Enhancement & Accelerated Bridge Programs Series A | | 5.00 | 6-1-2048 | 11,510,000 | 12,131,756 |
| Massachusetts Transportation Fund Revenue Rail Enhancement & Accelerated Bridge Programs Series A | | 5.00 | 6-1-2049 | 21,500,000 | 22,833,009 |
| | | | | | 47,032,768 |
| Water & sewer revenue: 0.35% | | | | | |
| Massachusetts Water Resources Authority General Revenue Refunding Bonds Series B (AGM Insured) | | 5.25 | 8-1-2038 | 16,000,000 | 19,711,414 |
| | | | | | 121,541,325 |
| Michigan: 3.49% | | | | | |
| Airport revenue: 0.16% | | | | | |
| Wayne County MI Airport Authority AMT | | 5.00 | 12-1-2029 | 6,000,000 | 6,209,117 |
| Wayne County MI Airport Authority AMT (BAM Insured) | | 5.00 | 12-1-2046 | 1,400,000 | 1,435,371 |
| Wayne County MI Airport Authority AMT Series 2021B | | 5.00 | 12-1-2041 | 1,145,000 | 1,188,152 |
| | | | | | 8,832,640 |
| Education revenue: 0.19% | | | | | |
| Michigan Finance Authority Limited Obligation Refunding Bond Public School Academy Bradford | | 4.30 | 9-1-2030 | 1,065,000 | 956,874 |
| Michigan Finance Authority Limited Obligation Refunding Bond Public School Academy Bradford | | 4.80 | 9-1-2040 | 1,205,000 | 988,303 |
| Michigan Finance Authority Limited Obligation Refunding Bond Public School Academy Bradford | | 5.00 | 9-1-2050 | 4,530,000 | 3,551,774 |
| Michigan Finance Authority Refunding Bond Higher Education Facilities | | 4.00 | 12-1-2041 | 4,750,000 | 4,161,772 |
| Michigan Public Educational Facilities Authority Limited Obligation Crescent Academy Project | | 7.00 | 10-1-2036 | 1,032,500 | 1,032,796 |
| | | | | | 10,691,519 |
| GO revenue: 0.13% | | | | | |
| Livonia MI Public School District Building & Site Series I | | 5.00 | 5-1-2026 | 1,075,000 | 1,081,720 |
| Livonia MI Public School District Building & Site Series I | | 5.00 | 5-1-2028 | 1,450,000 | 1,459,064 |
| Livonia MI Public School District Building & Site Series I | | 5.00 | 5-1-2029 | 1,350,000 | 1,358,439 |
| Livonia MI Public School District Building & Site Series I | | 5.00 | 5-1-2030 | 1,775,000 | 1,786,096 |
| Livonia MI Public School District Building & Site Series I | | 5.00 | 5-1-2031 | 1,425,000 | 1,433,908 |
| | | | | | 7,119,227 |
| Health revenue: 0.39% | | | | | |
| Kentwood MI EDA Limited Obligation Holland Home Project | | 4.00 | 11-15-2031 | 1,000,000 | 923,636 |
| Kentwood MI EDA Limited Obligation Holland Home Project | | 4.00 | 11-15-2045 | 750,000 | 589,770 |
| Michigan Finance Authority Hospital Revenue & Refunding Bonds Series 2015 | | 5.00 | 11-15-2045 | 8,000,000 | 8,088,439 |
| Michigan Finance Authority Hospital Revenue & Refunding Bonds Series 2016 | | 5.00 | 12-1-2034 | 8,055,000 | 8,541,341 |
| Michigan Finance Authority Hospital Revenue & Refunding Bonds Series 2016A | | 5.00 | 11-1-2044 | 4,000,000 | 4,066,327 |
| | | | | | 22,209,513 |
The accompanying notes are an integral part of these financial statements.
Allspring Municipal Bond Fund | 35
Portfolio of investments—December 31, 2022 (unaudited)
| | | Interest
rate | Maturity
date | Principal | Value |
| Miscellaneous revenue: 0.97% | | | | | |
| Michigan Building Authority Refunding Facilities Program Bond Series I | | 5.00% | 4-15-2041 | $13,000,000 | $ 13,501,255 |
| Michigan Finance Authority Charter Company Wayne Criminal Justice Center Project | | 4.00 | 11-1-2048 | 6,000,000 | 5,494,435 |
| Michigan Finance Authority Local Government Loan Program City of Detroit Financial Recovery Refunding Bonds Series F | | 4.50 | 10-1-2029 | 7,000,000 | 7,016,790 |
| Michigan Finance Authority Local Government Loan Program Series H-1 | | 5.00 | 10-1-2031 | 1,340,000 | 1,369,403 |
| Michigan Finance Authority Local Government Loan Program Series H-1 | | 5.00 | 10-1-2032 | 2,000,000 | 2,042,188 |
| Michigan Finance Authority Local Government Loan Program Series H-1 | | 5.00 | 10-1-2033 | 2,975,000 | 3,036,242 |
| Michigan Finance Authority Local Government Loan Program Series H-1 | | 5.00 | 10-1-2034 | 6,615,000 | 6,753,416 |
| Michigan Finance Authority Local Government Loan Program Series H-1 | | 5.00 | 10-1-2039 | 7,955,000 | 8,097,224 |
| Michigan Municipal Bond Authority Local Government Loan Program Series B Group A (Ambac Insured) | | 5.25 | 12-1-2023 | 920,000 | 920,335 |
| Michigan Municipal Bond Authority Local Government Loan Program Series C (Ambac Insured) | | 4.75 | 5-1-2027 | 4,610,000 | 4,660,449 |
| Tender Option Bond Trust Receipts/Certificates Series 2021 XF1115 (Deutsche Bank LIQ) 144Aø | | 3.72 | 10-15-2051 | 1,650,000 | 1,650,000 |
| | | | | | 54,541,737 |
| Tax revenue: 0.58% | | | | | |
| Detroit MI Downtown Development Authority Refunding Bonds Series 2018A (AGM Insured) | | 5.00 | 7-1-2043 | 3,000,000 | 3,005,707 |
| Detroit MI Downtown Development Authority Refunding Bonds Series 2018A (AGM Insured) | | 5.00 | 7-1-2048 | 5,000,000 | 5,009,511 |
| Michigan Finance Authority Local Government Loan Program Public Lighting Authority Refunding Bonds Series B | | 5.00 | 7-1-2039 | 7,895,000 | 7,910,000 |
| Michigan Finance Authority Local Government Loan Program Public Lighting Authority Refunding Bonds Series B | | 5.00 | 7-1-2044 | 16,845,000 | 16,806,706 |
| | | | | | 32,731,924 |
| Water & sewer revenue: 1.07% | | | | | |
| Great Lakes Michigan Water Authority Sewage Disposal System Series 2016-C | | 5.00 | 7-1-2036 | 8,500,000 | 8,891,287 |
| Great Lakes Michigan Water Authority Water Supply System Series 2016-D | | 4.00 | 7-1-2032 | 11,000,000 | 11,263,485 |
| Great Lakes Michigan Water Authority Water Supply System Series 2016-D (AGM Insured) | | 4.00 | 7-1-2033 | 11,000,000 | 11,311,683 |
| Michigan Finance Authority Local Government Loan Program Detroit Refunding Bond Series D-4 | | 5.00 | 7-1-2031 | 6,500,000 | 6,659,927 |
| Michigan Finance Authority Local Government Loan Program Detroit Refunding Bond Series D-6 (NPFGC Insured) | | 5.00 | 7-1-2027 | 1,000,000 | 1,031,980 |
| Michigan Finance Authority Local Government Loan Program Detroit Refunding Bond Series D-6 (NPFGC Insured) | | 5.00 | 7-1-2036 | 3,250,000 | 3,320,439 |
| Michigan Finance Authority Local Government Loan Program Series C (NPFGC Insured) | | 5.00 | 7-1-2025 | 2,000,000 | 2,063,072 |
The accompanying notes are an integral part of these financial statements.
36 | Allspring Municipal Bond Fund
Portfolio of investments—December 31, 2022 (unaudited)
| | | Interest
rate | Maturity
date | Principal | Value |
| Water & sewer revenue (continued) | | | | | |
| Michigan Finance Authority Local Government Loan Program Series C (NPFGC Insured) | | 5.00% | 7-1-2026 | $ 1,945,000 | $ 2,007,202 |
| Michigan Finance Authority Local Government Loan Program Series C (NPFGC Insured) | | 5.00 | 7-1-2027 | 2,260,000 | 2,332,276 |
| Michigan Finance Authority Local Government Loan Program Series C (NPFGC Insured) | | 5.00 | 7-1-2028 | 3,480,000 | 3,591,292 |
| Michigan Finance Authority Local Government Loan Program Series C (NPFGC Insured) | | 5.00 | 7-1-2032 | 5,750,000 | 5,903,308 |
| Michigan Finance Authority Local Government Loan Program Series C | | 5.00 | 7-1-2035 | 2,000,000 | 2,056,707 |
| | | | | | 60,432,658 |
| | | | | | 196,559,218 |
| Minnesota: 0.45% | | | | | |
| GO revenue: 0.03% | | | | | |
| Hennepin County MN Series 2018A | | 5.00 | 12-1-2037 | 1,000,000 | 1,087,226 |
| Shakopee MN Independent School District #720 Capital Facilities (State School District Credit Program Insured) | | 4.00 | 2-1-2030 | 225,000 | 234,256 |
| Shakopee MN Independent School District #720 Capital Facilities (State School District Credit Program Insured) | | 4.00 | 2-1-2032 | 240,000 | 250,292 |
| | | | | | 1,571,774 |
| Health revenue: 0.35% | | | | | |
| Minneapolis MN Fairview Health Services Series 2018A | | 4.00 | 11-15-2048 | 2,315,000 | 2,067,786 |
| Rochester MN HCFR Mayo Clinic Series B (Northern Trust Company SPA) ø | | 3.60 | 11-15-2038 | 4,000,000 | 4,000,000 |
| Shakopee MN Senior Housing Revenue Benedictine Living Community LLC Project 144A | | 5.85 | 11-1-2058 | 13,890,000 | 13,648,406 |
| | | | | | 19,716,192 |
| Utilities revenue: 0.07% | | | | | |
| Rochester MN Electric Utility Revenue Refunding Bond Series A | | 5.00 | 12-1-2042 | 3,895,000 | 4,086,880 |
| | | | | | 25,374,846 |
| Mississippi: 0.12% | | | | | |
| Miscellaneous revenue: 0.12% | | | | | |
| Mississippi Development Bank Special Obligation Bonds Series 2012A Jackson Water & Sewer System Project (AGM Insured) | | 5.00 | 9-1-2030 | 6,830,000 | 6,872,265 |
| Missouri: 0.77% | | | | | |
| GO revenue: 0.09% | | | | | |
| St. Louis MO Special Administrative Board of St. Louis School District | | 4.00 | 4-1-2030 | 4,840,000 | 4,984,459 |
| Miscellaneous revenue: 0.68% | | | | | |
| Kansas City MO IDA | | 5.00 | 3-1-2037 | 3,000,000 | 3,108,883 |
| Kansas City MO IDA Series B (AGM Insured) | | 5.00 | 3-1-2049 | 23,075,000 | 23,431,756 |
| Missouri Public Utilities Commission Interim Construction Notes | | 0.75 | 8-1-2023 | 12,000,000 | 11,765,701 |
| | | | | | 38,306,340 |
The accompanying notes are an integral part of these financial statements.
Allspring Municipal Bond Fund | 37
Portfolio of investments—December 31, 2022 (unaudited)
| | | Interest
rate | Maturity
date | Principal | Value |
| Tax revenue: 0.00% | | | | | |
| Blue Springs MO Special Obligation Tax Improvement & Refunding Bonds Adams Farm Project Series A | | 4.00% | 6-1-2026 | $ 170,000 | $ 161,710 |
| | | | | | 43,452,509 |
| Nebraska: 0.13% | | | | | |
| Health revenue: 0.02% | | | | | |
| Douglas County NE Hospital Authority Series 2 | | 4.00 | 11-15-2040 | 1,150,000 | 1,114,834 |
| Utilities revenue: 0.11% | | | | | |
| Central Plains Energy Project Nebraska Refunding Bond Gas Project #3 Series A 2017-A | | 5.00 | 9-1-2033 | 6,000,000 | 6,423,215 |
| | | | | | 7,538,049 |
| Nevada: 1.97% | | | | | |
| GO revenue: 1.95% | | | | | |
| Clark County NV Refunding Bond Limited Tax | | 4.00 | 7-1-2032 | 6,000,000 | 6,240,639 |
| Clark County NV School District Series A (AGM Insured) | | 4.00 | 6-15-2035 | 9,585,000 | 9,728,465 |
| Clark County NV School District Series A (AGM Insured) | | 4.00 | 6-15-2036 | 850,000 | 862,320 |
| Clark County NV School District Series A (AGM Insured) | | 4.00 | 6-15-2037 | 900,000 | 907,521 |
| Clark County NV School District Series A (AGM Insured) | | 4.00 | 6-15-2038 | 850,000 | 853,997 |
| Clark County NV School District Series A (AGM Insured) | | 4.00 | 6-15-2039 | 1,000,000 | 998,359 |
| Clark County NV School District Series A (AGM Insured) | | 5.00 | 6-15-2030 | 875,000 | 998,754 |
| Clark County NV School District Series A (AGM Insured) | | 5.00 | 6-15-2032 | 900,000 | 1,019,551 |
| Clark County NV School District Series A (AGM Insured) | | 5.00 | 6-15-2033 | 825,000 | 930,757 |
| Clark County NV School District Series A (AGM Insured) | | 5.00 | 6-15-2034 | 950,000 | 1,063,540 |
| Clark County NV School District Series A (AGM Insured) | | 5.00 | 6-15-2035 | 1,000,000 | 1,108,043 |
| Clark County NV Series A | | 5.00 | 6-1-2043 | 9,360,000 | 9,928,573 |
| Clark County NV Series A | | 5.00 | 5-1-2048 | 50,215,000 | 52,777,497 |
| Henderson NV Limited Tax Utility System Series A-1 | | 4.00 | 6-1-2045 | 9,140,000 | 8,856,011 |
| Henderson NV Series B-1 | | 4.00 | 6-1-2039 | 4,060,000 | 4,068,133 |
| Henderson NV Series B-1 | | 4.00 | 6-1-2040 | 3,340,000 | 3,293,113 |
| Las Vegas NV Series A | | 4.00 | 2-1-2038 | 1,335,000 | 1,339,962 |
| Las Vegas NV Water District Series 2022A | | 4.00 | 6-1-2034 | 4,600,000 | 4,825,099 |
| | | | | | 109,800,334 |
| Industrial development revenue: 0.02% | | | | | |
| Clark County NV Southern California Edison Company Project | | 2.10 | 6-1-2031 | 1,250,000 | 1,006,921 |
| Miscellaneous revenue: 0.00% | | | | | |
| Las Vegas NV Special Improvement District #60 Local Improvement | | 5.00 | 6-1-2023 | 205,000 | 205,858 |
| Las Vegas NV Special Improvement District #60 Local Improvement | | 5.00 | 6-1-2024 | 70,000 | 70,939 |
| | | | | | 276,797 |
| | | | | | 111,084,052 |
| New Hampshire: 0.25% | | | | | |
| Health revenue: 0.05% | | | | | |
| New Hampshire HEFA Dartmouth Hitchcook Health Group Series 2017-A | | 5.00 | 8-1-2036 | 2,660,000 | 2,809,556 |
The accompanying notes are an integral part of these financial statements.
38 | Allspring Municipal Bond Fund
Portfolio of investments—December 31, 2022 (unaudited)
| | | Interest
rate | Maturity
date | Principal | Value |
| Housing revenue: 0.11% | | | | | |
| New Hampshire National Finance Authority Municipal Certificates Series A | | 4.13% | 1-20-2034 | $ 6,226,269 | $ 6,037,117 |
| Industrial development revenue: 0.09% | | | | | |
| New Hampshire Finance Authority Lonza Biologics Incorporated (Landesbank Hessen-Thüringen LOC) ø | | 3.72 | 9-1-2030 | 5,000,000 | 5,000,000 |
| | | | | | 13,846,673 |
| New Jersey: 3.35% | | | | | |
| Airport revenue: 0.02% | | | | | |
| South Jersey Port Corporation Marine Terminal Refunding Bond Series 2016S | | 5.00 | 1-1-2039 | 1,350,000 | 1,363,197 |
| Education revenue: 0.18% | | | | | |
| Atlantic City NJ Improvement Authority Stockton University Project (AGM Insured) | | 4.00 | 7-1-2047 | 750,000 | 692,846 |
| New Jersey Educational Facilities Authority Higher Education Facilities Trust Fund | | 5.00 | 6-15-2025 | 5,830,000 | 5,976,359 |
| Rutgers University Series L | | 5.00 | 5-1-2033 | 3,560,000 | 3,583,417 |
| | | | | | 10,252,622 |
| GO revenue: 0.34% | | | | | |
| Bayonne NJ School Refunding Bonds (AGM Insured) | | 5.00 | 7-15-2023 | 2,505,000 | 2,530,925 |
| Newark NJ Qualified General Improvement Bonds Series A | | 5.00 | 7-15-2025 | 5,000,000 | 5,229,015 |
| Newark NJ Qualified General Improvement Bonds Series A | | 5.00 | 7-15-2026 | 2,205,000 | 2,304,364 |
| Newark NJ Qualified General Improvement Bonds Series A | | 5.00 | 7-15-2027 | 6,035,000 | 6,295,552 |
| Newark NJ Qualified General Improvement Bonds Series A | | 5.25 | 7-15-2024 | 1,325,000 | 1,366,663 |
| Newark NJ Qualified General Improvement Bonds Series B | | 5.00 | 7-15-2025 | 385,000 | 402,634 |
| Newark NJ Qualified General Improvement Bonds Series B | | 5.00 | 7-15-2026 | 395,000 | 412,800 |
| Newark NJ Qualified General Improvement Bonds Series B | | 5.00 | 7-15-2027 | 405,000 | 422,485 |
| Newark NJ Qualified General Improvement Bonds Series B | | 5.25 | 7-15-2024 | 375,000 | 386,791 |
| | | | | | 19,351,229 |
| Industrial development revenue: 0.18% | | | | | |
| New Jersey EDA | | 5.00 | 3-1-2025 | 4,000,000 | 4,011,057 |
| New Jersey EDA Continental Airlines Incorporated Project | | 5.25 | 9-15-2029 | 5,960,000 | 5,921,261 |
| | | | | | 9,932,318 |
| Miscellaneous revenue: 1.00% | | | | | |
| New Jersey EDA Motor Vehicle Surcharge Revenue Refunding Bonds Series A | | 3.13 | 7-1-2029 | 2,620,000 | 2,569,371 |
| New Jersey EDA School Facilities Construction Refunding Bond Series NN | | 5.00 | 3-1-2026 | 11,000,000 | 11,030,225 |
| New Jersey EDA Transportation Project Bonds Portal North Bridge Project Series 2022A | | 5.00 | 11-1-2038 | 5,000,000 | 5,274,071 |
The accompanying notes are an integral part of these financial statements.
Allspring Municipal Bond Fund | 39
Portfolio of investments—December 31, 2022 (unaudited)
| | | Interest
rate | Maturity
date | Principal | Value |
| Miscellaneous revenue (continued) | | | | | |
| New Jersey EDA Transportation Project Bonds Portal North Bridge Project Series 2022A | | 5.25% | 11-1-2041 | $ 3,000,000 | $ 3,193,651 |
| New Jersey TTFA Series A ¤ | | 0.00 | 12-15-2039 | 10,000,000 | 4,311,704 |
| New Jersey TTFA Series A (NPFGC Insured) | | 5.75 | 6-15-2025 | 10,000,000 | 10,617,390 |
| Newark NJ Housing Authority & Port Authority Port Newark Marine Terminal Rental Refunding Bond Newark Redevelopment Project (NPFGC Insured) | | 5.00 | 1-1-2032 | 7,620,000 | 8,247,154 |
| Newark NJ Housing Authority & Port Authority Port Newark Marine Terminal Rental Refunding Bond Newark Redevelopment Project (NPFGC Insured) | | 5.25 | 1-1-2024 | 1,225,000 | 1,237,491 |
| Union County NJ Utilities Authority Refunding Bond AMT Covanta Union Series A | | 5.25 | 12-1-2031 | 9,715,000 | 9,727,272 |
| | | | | | 56,208,329 |
| Tax revenue: 0.45% | | | | | |
| New Jersey Garden State Preservation Trust Open & Farmland Series A (AGM Insured) | | 5.75 | 11-1-2028 | 15,000,000 | 16,490,010 |
| New Jersey TTFA Series AA | | 4.00 | 6-15-2045 | 2,195,000 | 1,916,796 |
| New Jersey TTFA Series AA | | 5.00 | 6-15-2039 | 3,000,000 | 3,124,433 |
| New Jersey TTFA Series AA | | 5.00 | 6-15-2045 | 3,500,000 | 3,569,030 |
| | | | | | 25,100,269 |
| Transportation revenue: 1.18% | | | | | |
| New Jersey TTFA CAB Series A ¤ | | 0.00 | 12-15-2028 | 10,100,000 | 8,047,881 |
| New Jersey TTFA CAB Series A ¤ | | 0.00 | 12-15-2029 | 11,875,000 | 9,053,363 |
| New Jersey TTFA CAB Series A ¤ | | 0.00 | 12-15-2031 | 4,500,000 | 3,111,392 |
| New Jersey TTFA CAB Transportation System Series A ¤ | | 0.00 | 12-15-2026 | 1,150,000 | 995,225 |
| New Jersey TTFA CAB Transportation System Series A ¤ | | 0.00 | 12-15-2030 | 8,000,000 | 5,826,517 |
| New Jersey TTFA Program Bonds Series AA | | 5.00 | 6-15-2038 | 2,000,000 | 2,106,274 |
| New Jersey TTFA Series AA | | 5.00 | 6-15-2036 | 2,070,000 | 2,077,330 |
| New Jersey TTFA Series AA | | 5.00 | 6-15-2044 | 1,000,000 | 1,002,911 |
| New Jersey TTFA Series AA | | 5.25 | 6-15-2033 | 10,000,000 | 10,061,897 |
| New Jersey TTFA Transportation Program Bonds Series CC | | 5.25 | 6-15-2046 | 6,000,000 | 6,318,254 |
| New Jersey TTFA Transportation Program Bonds Series CC | | 5.50 | 6-15-2050 | 5,000,000 | 5,347,216 |
| New Jersey TTFA Transportation System Series A | | 5.00 | 12-15-2036 | 1,500,000 | 1,571,422 |
| New Jersey TTFA Transportation System Series C | | 5.25 | 6-15-2032 | 8,000,000 | 8,232,796 |
| South Jersey Transportation Authority Transportation System Revenue Bonds 2022 Series A | | 5.00 | 11-1-2041 | 1,000,000 | 1,011,417 |
| South Jersey Transportation Authority Transportation System Revenue Bonds 2022 Series A | | 5.25 | 11-1-2052 | 1,500,000 | 1,522,408 |
| | | | | | 66,286,303 |
| | | | | | 188,494,267 |
| New Mexico: 0.27% | | | | | |
| Industrial development revenue: 0.18% | | | | | |
| Farmington NM PCR | | 1.80 | 4-1-2029 | 5,000,000 | 4,185,092 |
| Farmington NM PCR | | 1.80 | 4-1-2029 | 7,000,000 | 5,859,128 |
| | | | | | 10,044,220 |
The accompanying notes are an integral part of these financial statements.
40 | Allspring Municipal Bond Fund
Portfolio of investments—December 31, 2022 (unaudited)
| | | Interest
rate | Maturity
date | Principal | Value |
| Utilities revenue: 0.09% | | | | | |
| New Mexico Municipal Energy Acquisition Authority Gas Supply Revenue Refunding & Acquisition Bond Subordinated Series A (Royal Bank of Canada LIQ) | | 5.00% | 11-1-2039 | $ 5,140,000 | $ 5,268,137 |
| | | | | | 15,312,357 |
| New York: 11.63% | | | | | |
| Airport revenue: 1.12% | | | | | |
| New York Transportation Development Corporation Special Facilities Revenue Terminal 4 John F Kennedy International Airport | | 4.00 | 12-1-2039 | 700,000 | 640,486 |
| New York Transportation Development Corporation Special Facilities Revenue Terminal 4 John F Kennedy International Airport | | 4.00 | 12-1-2040 | 900,000 | 813,551 |
| New York Transportation Development Corporation Special Facilities Revenue Terminal 4 John F Kennedy International Airport | | 5.00 | 12-1-2032 | 1,000,000 | 1,057,877 |
| New York Transportation Development Corporation Special Facilities Revenue Terminal 4 John F Kennedy International Airport | | 5.00 | 12-1-2036 | 1,750,000 | 1,834,130 |
| New York Transportation Development Corporation Special Facilities Revenue Terminal 4 John F Kennedy International Airport | | 5.00 | 12-1-2037 | 700,000 | 717,362 |
| New York Transportation Development Corporation Special Facilities Revenue Terminal 4 John F Kennedy International Airport | | 5.00 | 12-1-2037 | 1,750,000 | 1,825,198 |
| New York Transportation Development Corporation Special Facilities Revenue Terminal 4 John F Kennedy International Airport | | 5.00 | 12-1-2037 | 2,000,000 | 2,057,971 |
| New York Transportation Development Corporation Special Facilities Revenue Terminal 4 John F Kennedy International Airport | | 5.00 | 12-1-2038 | 3,000,000 | 3,075,526 |
| New York Transportation Development Corporation Special Facilities Revenue Terminal 4 John F Kennedy International Airport | | 5.00 | 12-1-2039 | 13,000,000 | 13,257,979 |
| New York Transportation Development Corporation Special Facilities Revenue Terminal 4 John F Kennedy International Airport | | 5.00 | 12-1-2042 | 3,385,000 | 3,408,296 |
| New York Transportation Development Corporation Special Facilities Revenue Terminal 4 John F Kennedy International Airport Project Series 2020C | | 5.00 | 12-1-2035 | 2,475,000 | 2,608,827 |
| New York Transportation Development Corporation Special Facilities Revenue Terminal B LaGuardia Airport Series 2016A | | 5.00 | 7-1-2041 | 3,250,000 | 3,161,454 |
| Port Authority of New York & New Jersey Series 193 | | 5.00 | 10-15-2028 | 1,760,000 | 1,826,661 |
| Port Authority of New York & New Jersey Series 205 | | 5.25 | 11-15-2039 | 16,580,000 | 17,808,243 |
| Port Authority of New York & New Jersey Series 211 | | 5.00 | 9-1-2048 | 2,000,000 | 2,105,211 |
| Port Authority of New York & New Jersey Series 218 | | 4.00 | 11-1-2041 | 2,275,000 | 2,122,796 |
| Port Authority of New York & New Jersey Series 221 | | 4.00 | 7-15-2045 | 5,000,000 | 4,523,174 |
| | | | | | 62,844,742 |
| Education revenue: 0.59% | | | | | |
| Hempstead NY Local Development Corporation Evergreen Charter School Project Series 2022A | | 5.25 | 6-15-2042 | 6,085,000 | 5,982,930 |
| Hempstead NY Local Development Corporation The Academy Charter School Project Series A | | 4.60 | 2-1-2051 | 5,000,000 | 3,683,953 |
The accompanying notes are an integral part of these financial statements.
Allspring Municipal Bond Fund | 41
Portfolio of investments—December 31, 2022 (unaudited)
| | | Interest
rate | Maturity
date | Principal | Value |
| Education revenue (continued) | | | | | |
| Hempstead NY Local Development Corporation The Academy Charter School Project Series A | | 5.73% | 2-1-2050 | $10,030,000 | $ 9,591,745 |
| New York Dormitory Authority Barnard College Series A | | 4.00 | 7-1-2045 | 1,270,000 | 1,136,002 |
| New York Dormitory Authority Barnard College Series A | | 4.00 | 7-1-2049 | 1,000,000 | 874,157 |
| New York Dormitory Authority Iona College | | 5.00 | 7-1-2027 | 335,000 | 355,156 |
| New York Dormitory Authority New York University Series A | | 5.00 | 7-1-2049 | 4,265,000 | 4,560,348 |
| New York Dormitory Authority St. John's University Series A | | 4.00 | 7-1-2048 | 2,000,000 | 1,823,422 |
| Westchester County NY Local Development Pace University Series B | | 4.32 | 5-1-2044 | 5,000,000 | 5,000,000 |
| | | | | | 33,007,713 |
| GO revenue: 1.57% | | | | | |
| New York NY Fiscal 2020 Subordinate Bond Series B-1 | | 4.00 | 8-1-2039 | 3,000,000 | 2,933,241 |
| New York NY Fiscal 2020 Subordinate Bond Series B-1 | | 5.00 | 10-1-2038 | 2,650,000 | 2,847,356 |
| New York NY Fiscal 2022 Subordinate Bond Series D-1 | | 5.25 | 5-1-2041 | 6,000,000 | 6,666,645 |
| New York NY Fiscal 2022 Subordinate Bond Series D-1 | | 5.25 | 5-1-2042 | 1,000,000 | 1,108,689 |
| New York NY GO Subseries A-1 | | 5.25 | 9-1-2042 | 8,750,000 | 9,729,196 |
| New York NY GO Subseries A-1 | | 5.25 | 9-1-2043 | 21,165,000 | 23,448,670 |
| New York NY GO Subseries F-1 | | 5.00 | 3-1-2043 | 4,000,000 | 4,245,006 |
| New York NY GO Subseries F-1 | | 5.00 | 3-1-2050 | 6,000,000 | 6,319,472 |
| New York NY Series E-1 | | 5.00 | 3-1-2039 | 8,800,000 | 9,321,269 |
| New York NY Series S-2 | | 5.00 | 7-15-2041 | 13,805,000 | 14,216,545 |
| Yonkers NY Series 2022-C (AGM Insured) | | 5.00 | 3-15-2036 | 2,000,000 | 2,225,152 |
| Yonkers NY Series 2022-C (AGM Insured) | | 5.00 | 3-15-2037 | 1,100,000 | 1,212,242 |
| Yonkers NY Series 2022-C (AGM Insured) | | 5.00 | 3-15-2038 | 1,140,000 | 1,249,085 |
| Yonkers NY Series 2022-F (BAM Insured) | | 5.00 | 11-15-2040 | 850,000 | 919,715 |
| Yonkers NY Series 2022-F (BAM Insured) | | 5.00 | 11-15-2041 | 750,000 | 807,325 |
| Yonkers NY Series 2022-F (BAM Insured) | | 5.00 | 11-15-2042 | 1,000,000 | 1,073,975 |
| | | | | | 88,323,583 |
| Health revenue: 0.15% | | | | | |
| New York Dormitory Authority Catholic Health Systems Obligated Group Revenue Bond Series 2019B (Manufacturers & Traders LOC) ø | | 3.73 | 7-1-2048 | 5,000,000 | 5,000,000 |
| Westchester County NY Kendal on Hudson Project Series 2013 | | 5.00 | 1-1-2028 | 1,805,000 | 1,805,000 |
| Westchester County NY Local Development Corporation Purchase Senior Learning Community Incorporated 144A | | 2.88 | 7-1-2026 | 1,500,000 | 1,442,404 |
| | | | | | 8,247,404 |
| Housing revenue: 0.18% | | | | | |
| Deutsche Bank Short Puttable Exempt Adjustable Receipts/Long Inverse Floating Exempt Receipts Trust Series DBE-8063 (Deutsche Bank LOC, Deutsche Bank LIQ) 144Aø | | 4.06 | 10-1-2045 | 10,000,000 | 10,000,000 |
| Industrial development revenue: 0.75% | | | | | |
| Monroe County NY IDA Continuing Development Services Project (Citizens Bank LOC) ø | | 3.73 | 7-1-2027 | 575,000 | 575,000 |
| New York Liberty Development Corporation Refunding Bonds 1 World Trade Center Project | | 4.00 | 2-15-2043 | 4,500,000 | 4,169,379 |
The accompanying notes are an integral part of these financial statements.
42 | Allspring Municipal Bond Fund
Portfolio of investments—December 31, 2022 (unaudited)
| | | Interest
rate | Maturity
date | Principal | Value |
| Industrial development revenue (continued) | | | | | |
| New York Liberty Development Corporation Refunding Bonds 4 World Trade Center Project | | 2.80% | 9-15-2069 | $ 1,000,000 | $ 894,848 |
| New York Transportation Development Corporation New York State Thruway Service Areas Project | | 4.00 | 10-31-2041 | 2,000,000 | 1,755,167 |
| New York Transportation Development Corporation New York State Thruway Service Areas Project | | 4.00 | 10-31-2046 | 1,500,000 | 1,262,920 |
| New York Transportation Development Corporation Special Facilities AMT Revenue | | 5.00 | 1-1-2032 | 12,000,000 | 12,168,677 |
| New York Transportation Development Corporation Special Facilities Revenue Terminal 4 John F Kennedy International Airport | | 3.00 | 8-1-2031 | 2,000,000 | 1,738,827 |
| New York Transportation Development Corporation Special Facility AMT Revenue Delta Air Lines Incorporated LaGuardia Airport Terminals C&D Redevelopment | | 5.00 | 10-1-2035 | 20,000,000 | 19,891,164 |
| | | | | | 42,455,982 |
| Miscellaneous revenue: 0.63% | | | | | |
| New York Dormitory Authority Series A (AGM Insured) | | 5.00 | 10-1-2034 | 5,000 | 5,606 |
| New York Dormitory Authority Series A (AGM Insured) | | 5.00 | 10-1-2034 | 1,745,000 | 1,909,569 |
| New York Dormitory Authority Series A (AGM Insured) | | 5.00 | 10-1-2035 | 1,000,000 | 1,088,715 |
| New York NY IDA Queens Baseball Stadium Project (AGM Insured) | | 5.00 | 1-1-2031 | 1,000,000 | 1,128,342 |
| New York Transportation Development Corporation New York State Thruway Service Areas Project | | 4.00 | 3-15-2044 | 5,000,000 | 4,727,613 |
| New York Western Regional Off Track Betting Corporation 144A | | 4.13 | 12-1-2041 | 2,400,000 | 1,732,549 |
| RBC Municipal Products Incorporated Series E-154 (Royal Bank of Canada LOC, Royal Bank of Canada LIQ) 144Aø | | 3.76 | 6-1-2028 | 18,000,000 | 18,000,000 |
| Yonkers NY IDA New Community School Project Series 2022 | | 5.00 | 5-1-2047 | 5,000,000 | 5,347,879 |
| Yonkers NY IDA New Community School Project Series 2022 | | 5.25 | 5-1-2051 | 1,600,000 | 1,731,316 |
| | | | | | 35,671,589 |
| Tax revenue: 3.70% | | | | | |
| New York Dormitory Authority Personal Income Tax Revenue Bonds Series 2019A | | 5.00 | 3-15-2043 | 6,750,000 | 7,106,278 |
| New York Dormitory Authority Series 2014E | | 5.00 | 2-15-2044 | 10,000 | 10,478 |
| New York Dormitory Authority Series 2014E | | 5.00 | 2-15-2044 | 9,580,000 | 9,831,865 |
| New York Dormitory Authority Series A | | 4.00 | 3-15-2042 | 6,000,000 | 5,750,248 |
| New York Dormitory Authority Series A | | 4.00 | 3-15-2044 | 2,700,000 | 2,556,480 |
| New York Dormitory Authority Series A | | 5.00 | 2-15-2034 | 3,790,000 | 4,028,427 |
| New York Dormitory Authority Series D | | 4.00 | 2-15-2039 | 5,000,000 | 4,874,393 |
| New York Dormitory Authority Series D | | 5.00 | 2-15-2048 | 12,500,000 | 13,138,494 |
| New York Dormitory Authority State Personal Income Tax Series B | | 4.00 | 3-15-2046 | 11,300,000 | 10,584,265 |
| New York Dormitory Authority State Personal Income Tax Series B | | 5.00 | 2-15-2045 | 7,330,000 | 7,519,706 |
| New York Dormitory Authority State Personal Income Tax Series E | | 5.00 | 2-15-2044 | 10,000 | 10,478 |
| New York NY Transitional Finance Authority Building Aid Revenue Fiscal Year 2015 Series S1 | | 5.00 | 7-15-2040 | 3,155,000 | 3,231,995 |
The accompanying notes are an integral part of these financial statements.
Allspring Municipal Bond Fund | 43
Portfolio of investments—December 31, 2022 (unaudited)
| | | Interest
rate | Maturity
date | Principal | Value |
| Tax revenue (continued) | | | | | |
New York NY Transitional Finance Authority Building Aid Revenue Fiscal Year 2019 Subordinate Bond
Series S3 A | | 4.00% | 7-15-2038 | $ 4,500,000 | $ 4,398,518 |
| New York NY Transitional Finance Authority Future Tax Secured Revenue Series A2 | | 5.00 | 8-1-2037 | 12,140,000 | 12,966,145 |
| New York NY Transitional Finance Authority Future Tax Secured Revenue Series I | | 5.00 | 5-1-2033 | 5,395,000 | 5,422,740 |
| New York NY Transitional Finance Authority Future Tax Secured Subordinate Bond | | 4.00 | 11-1-2035 | 5,000,000 | 5,060,195 |
| New York NY Transitional Finance Authority Future Tax Secured Subordinate Bond | | 5.00 | 5-1-2038 | 5,000,000 | 5,419,335 |
| New York NY Transitional Finance Authority Future Tax Secured Subordinate Bond Series A | | 5.00 | 8-1-2031 | 17,075,000 | 17,603,582 |
| New York NY Transitional Finance Authority Future Tax Secured Subordinate Bond Series E | | 4.00 | 2-1-2038 | 4,000,000 | 3,907,265 |
| New York NY Transitional Finance Authority Future Tax Secured Subordinate Bond Series F1 | | 5.00 | 5-1-2042 | 2,390,000 | 2,505,128 |
| New York Thruway Authority Series 2022A | | 5.00 | 3-15-2048 | 10,000,000 | 10,653,982 |
| New York Urban Development Corporation Series 2020A | | 5.00 | 3-15-2041 | 3,750,000 | 4,023,954 |
| New York Urban Development Corporation Series 2020A | | 5.00 | 3-15-2042 | 4,075,000 | 4,361,723 |
| New York Urban Development Corporation Series 2020C | | 4.00 | 3-15-2042 | 8,045,000 | 7,659,612 |
| New York Urban Development Corporation Series 2020C | | 5.00 | 3-15-2047 | 8,000,000 | 8,468,445 |
| New York Urban Development Corporation Series 2020E | | 4.00 | 3-15-2043 | 8,040,000 | 7,603,909 |
| Tender Option Bond Trust Receipts/Certificates Series 2021-XF1125 (Deutsche Bank LIQ) 144Aø | | 3.72 | 5-15-2051 | 440,000 | 440,000 |
| Triborough Bridge & Tunnel Authority Series 2020-A | | 4.00 | 5-15-2042 | 2,250,000 | 2,135,991 |
| Triborough Bridge & Tunnel Authority Series 2022-A | | 5.00 | 5-15-2047 | 15,000,000 | 16,035,287 |
| Triborough Bridge & Tunnel Authority Series 2022-B | | 5.00 | 5-15-2039 | 10,240,000 | 11,296,852 |
| Triborough Bridge & Tunnel Authority Series 2022-C | | 5.00 | 5-15-2047 | 8,000,000 | 8,552,153 |
| Triborough Bridge & Tunnel Authority Subordinated Bond Series A1 | | 4.00 | 5-15-2046 | 1,250,000 | 1,161,909 |
| | | | | | 208,319,832 |
| Transportation revenue: 1.06% | | | | | |
| New York Metropolitan Transportation Authority Refunding Green Bonds Series D1 | | 5.00 | 11-15-2034 | 5,000,000 | 5,124,110 |
| New York Metropolitan Transportation Authority Series 2015C | | 5.00 | 11-15-2035 | 2,000,000 | 2,026,703 |
| New York Metropolitan Transportation Authority Series 2019C (AGM Insured) | | 5.00 | 11-15-2041 | 9,700,000 | 10,083,761 |
| New York Metropolitan Transportation Authority Subordinated Bond Series A1 | | 5.00 | 11-15-2040 | 3,425,000 | 3,378,779 |
| New York Metropolitan Transportation Authority Subordinated Bond Series A-1 | | 5.00 | 11-15-2048 | 7,300,000 | 7,436,481 |
| New York Metropolitan Transportation Authority Various Refunding Bonds Transportation Subordinated Series G-3 (SIFMA Municipal Swap +0.43%) ± | | 4.09 | 11-1-2031 | 15,000,000 | 14,595,075 |
| Triborough Bridge & Tunnel Authority Series 2020-A | | 5.00 | 11-15-2049 | 7,750,000 | 8,184,205 |
| Triborough Bridge and Tunnel Authority NY General Revenue Bonds Series 2022A | | 5.00 | 11-15-2047 | 4,000,000 | 4,278,025 |
| Triborough Bridge and Tunnel Authority NY General Revenue Bonds Series 2022A | | 5.50 | 11-15-2057 | 4,000,000 | 4,514,711 |
| | | | | | 59,621,850 |
The accompanying notes are an integral part of these financial statements.
44 | Allspring Municipal Bond Fund
Portfolio of investments—December 31, 2022 (unaudited)
| | | Interest
rate | Maturity
date | Principal | Value |
| Utilities revenue: 0.56% | | | | | |
| New York Utility Debt Securitization Authority Restructuring Bonds | | 5.00% | 12-15-2032 | $22,785,000 | $ 24,204,380 |
| New York Utility Debt Securitization Authority Restructuring Bonds | | 5.00 | 12-15-2037 | 3,780,000 | 3,986,937 |
| New York Utility Debt Securitization Authority Restructuring Bonds | | 5.00 | 12-15-2040 | 2,870,000 | 3,084,784 |
| | | | | | 31,276,101 |
| Water & sewer revenue: 1.32% | | | | | |
| New York NY Environmental Facilities Corporation Municipal Water Trust | | 4.00 | 6-15-2049 | 5,000,000 | 4,835,923 |
| New York NY Environmental Facilities Corporation Municipal Water Trust | | 5.00 | 6-15-2048 | 10,035,000 | 10,666,797 |
| New York NY Municipal Water Finance Authority 2nd General Resolution Series 2018 | | 5.00 | 6-15-2048 | 3,000,000 | 3,123,500 |
| New York NY Municipal Water Finance Authority 2nd General Resolution Series 2023 Subseries AA-1 | | 5.25 | 6-15-2052 | 5,250,000 | 5,750,573 |
| New York NY Municipal Water Finance Authority 2nd General Resolution Series AA | | 5.00 | 6-15-2035 | 25,000,000 | 27,758,460 |
| New York NY Municipal Water Finance Authority 2nd General Resolution Series FF | | 4.00 | 6-15-2041 | 8,250,000 | 7,935,151 |
| New York NY Water Finance Authority Series DD | | 5.25 | 6-15-2047 | 11,490,000 | 12,088,316 |
| Western Nassau County NY Water Authority Series A | | 4.00 | 4-1-2046 | 1,100,000 | 1,036,432 |
| Western Nassau County NY Water Authority Series A | | 4.00 | 4-1-2051 | 1,000,000 | 915,581 |
| | | | | | 74,110,733 |
| | | | | | 653,879,529 |
| North Carolina: 0.56% | | | | | |
| Airport revenue: 0.06% | | | | | |
| Raleigh Durham NC Airport Authority Refunding Bond AMT Series A | | 5.00 | 5-1-2035 | 3,400,000 | 3,621,708 |
| Education revenue: 0.11% | | | | | |
| North Carolina Capital Facilities Finance Agency Forest University Series 2016 | | 5.00 | 1-1-2033 | 1,000,000 | 1,058,573 |
| North Carolina Capital Facilities Finance Agency Meredith College Series 2018 | | 5.00 | 6-1-2038 | 500,000 | 514,978 |
| University of North Carolina at Ashville Series 2017 | | 5.00 | 6-1-2042 | 625,000 | 646,265 |
| University of North Carolina at Greensboro Series 2014 | | 5.00 | 4-1-2033 | 2,000,000 | 2,041,238 |
| University of North Carolina at Greensboro Series 2014 | | 5.00 | 4-1-2039 | 1,620,000 | 1,653,402 |
| University of North Carolina Chapel Hill Series 2009- A (TD Bank NA SPA) ø | | 3.62 | 2-1-2024 | 305,000 | 305,000 |
| | | | | | 6,219,456 |
| Health revenue: 0.08% | | | | | |
| Charlotte-Mecklenburg NC Hospital Authority Health Care Refunding Bonds Series 2018 | | 5.00 | 1-15-2036 | 500,000 | 535,084 |
| North Carolina Medical Care Commission Deerfield Episcopal Retirement Community Project Series 2016 | | 5.00 | 11-1-2031 | 1,500,000 | 1,587,971 |
The accompanying notes are an integral part of these financial statements.
Allspring Municipal Bond Fund | 45
Portfolio of investments—December 31, 2022 (unaudited)
| | | Interest
rate | Maturity
date | Principal | Value |
| Health revenue (continued) | | | | | |
| North Carolina Medical Care Commission Forest Duke Project | | 4.00% | 9-1-2051 | $ 1,100,000 | $ 856,713 |
| North Carolina Medical Care Commission Presbyterian Homes Project Series 2016C | | 4.00 | 10-1-2031 | 1,500,000 | 1,432,608 |
| | | | | | 4,412,376 |
| Housing revenue: 0.04% | | | | | |
| North Carolina Facilities Finance Agency The Arc of North Carolina Project Series 2017A (Department of Housing and Urban Development Insured) | | 5.00 | 10-1-2034 | 1,000,000 | 1,016,797 |
| North Carolina Facilities Finance Agency The North Carolina A&T University Foundation LLC Project Series 2015A (AGC Insured) | | 5.00 | 6-1-2027 | 1,000,000 | 1,044,624 |
| | | | | | 2,061,421 |
| Miscellaneous revenue: 0.07% | | | | | |
| Charlotte NC Certificate of Participation Equipment Acquisition and Public Facilities Series A | | 5.00 | 12-1-2026 | 1,160,000 | 1,161,964 |
| Charlotte NC Certificate of Participation Transit Projects Series C | | 5.00 | 6-1-2030 | 1,000,000 | 1,009,337 |
| Raleigh NC Limited Obligation Series A | | 5.00 | 10-1-2033 | 1,000,000 | 1,038,015 |
| Wilmington NC Limited Obligation Series A | | 5.00 | 6-1-2030 | 400,000 | 430,891 |
| | | | | | 3,640,207 |
| Resource recovery revenue: 0.09% | | | | | |
| North Carolina Capital Finance Republic Services Incorporated Project Series 2013 | | 3.75 | 6-1-2038 | 5,000,000 | 4,997,581 |
| Transportation revenue: 0.11% | | | | | |
| North Carolina Department of Transportation I-77 HOT Lanes Project Series 2015 | | 5.00 | 6-30-2028 | 1,275,000 | 1,302,058 |
| North Carolina Turnpike Authority Monroe Expressway Toll Revenue Bond Series 2016A | | 5.00 | 7-1-2042 | 500,000 | 503,323 |
| North Carolina Turnpike Authority Triangle Expressway System (AGM Insured) | | 5.00 | 1-1-2049 | 4,500,000 | 4,629,134 |
| | | | | | 6,434,515 |
| | | | | | 31,387,264 |
| North Dakota: 0.24% | | | | | |
| Miscellaneous revenue: 0.17% | | | | | |
| University of North Dakota Infrastructure Energy Improvement Project Green Certificates Series A | | 5.00 | 4-1-2057 | 9,000,000 | 9,354,666 |
| Water & sewer revenue: 0.07% | | | | | |
| North Dakota PFA Revolving Fund Program Series A | | 5.00 | 10-1-2038 | 3,780,000 | 4,117,755 |
| | | | | | 13,472,421 |
| Ohio: 1.79% | | | | | |
| Education revenue: 0.08% | | | | | |
| Allen County OH Port Authority | | 4.00 | 12-1-2035 | 650,000 | 604,578 |
The accompanying notes are an integral part of these financial statements.
46 | Allspring Municipal Bond Fund
Portfolio of investments—December 31, 2022 (unaudited)
| | | Interest
rate | Maturity
date | Principal | Value |
| Education revenue (continued) | | | | | |
| Allen County OH Port Authority | | 4.00% | 12-1-2040 | $ 720,000 | $ 629,575 |
| Ohio HEFA Kenyon College 2023 Project %% | | 5.00 | 7-1-2037 | 3,100,000 | 3,285,552 |
| | | | | | 4,519,705 |
| GO revenue: 0.03% | | | | | |
| Highland OH Local School District Medina County School Improvement Series A | | 5.25 | 12-1-2054 | 1,500,000 | 1,514,037 |
| Health revenue: 0.56% | | | | | |
| Cleveland Cuyahoga County OH Facilities Improvement Centers for Dialysis | | 5.00 | 12-1-2047 | 5,205,000 | 5,092,911 |
| Franklin County OH Trinity Health Credit Group | | 4.00 | 12-1-2044 | 3,450,000 | 3,194,191 |
| Hamilton County OH Hospital Facilities Revenue Bonds | | 5.00 | 11-15-2041 | 2,250,000 | 2,526,237 |
| Hamilton County OH Hospital Facilities Revenue Bonds | | 5.00 | 9-15-2045 | 7,500,000 | 7,350,541 |
| Lucas County OH Hospital Revenue Promedica Healthcare Obligation | | 5.25 | 11-15-2048 | 4,250,000 | 3,702,081 |
| Middleburg Heights OH Hospital Revenue Refunding Bonds Facilities Southwest General Health | | 4.00 | 8-1-2041 | 1,100,000 | 1,018,766 |
| Middleburg Heights OH Hospital Revenue Refunding Bonds Facilities Southwest General Health | | 4.00 | 8-1-2047 | 3,000,000 | 2,634,055 |
| Middleburg Heights OH Hospital Revenue Refunding Bonds Facilities Southwest General Health Center | | 4.00 | 8-1-2041 | 3,730,000 | 3,459,742 |
| Montgomery County OH Hospital Revenue Refunding Bonds | | 4.00 | 11-15-2039 | 3,000,000 | 2,758,465 |
| | | | | | 31,736,989 |
| Miscellaneous revenue: 0.67% | | | | | |
| Ohio Private Activity Bond AMT Portsmouth Bypass Project (AGM Insured) | | 5.00 | 12-31-2026 | 2,030,000 | 2,102,141 |
| Ohio Private Activity Bond AMT Portsmouth Bypass Project (AGM Insured) | | 5.00 | 12-31-2028 | 1,610,000 | 1,657,141 |
| Ohio Private Activity Bond AMT Portsmouth Bypass Project (AGM Insured) | | 5.00 | 12-31-2030 | 2,250,000 | 2,313,724 |
| Ohio Private Activity Bond AMT Portsmouth Bypass Project (AGM Insured) | | 5.00 | 12-31-2035 | 12,000,000 | 12,231,254 |
| Ohio Private Activity Bond AMT Portsmouth Bypass Project (AGM Insured) | | 5.00 | 12-31-2039 | 2,500,000 | 2,531,076 |
| Ohio Series A | | 5.00 | 2-1-2036 | 4,265,000 | 4,502,029 |
| Ohio Water Development Authority Drinking Water Assistance Fund | | 5.00 | 12-1-2035 | 5,390,000 | 5,787,603 |
| Ohio Water Development Authority Drinking Water Assistance Fund | | 5.00 | 12-1-2036 | 2,000,000 | 2,144,479 |
| Ohio Water Development Authority Fresh Water Series B | | 5.00 | 12-1-2034 | 1,895,000 | 2,043,501 |
| RiverSouth OH Lazarus Building Redevelopment Series A | | 5.75 | 12-1-2027 | 2,260,000 | 2,255,094 |
| | | | | | 37,568,042 |
| Tax revenue: 0.09% | | | | | |
| Franklin County OH | | 5.00 | 6-1-2048 | 5,000,000 | 5,317,740 |
| Transportation revenue: 0.32% | | | | | |
| Ohio Turnpike Commission CAB Series A-4 ¤ | | 0.00 | 2-15-2034 | 8,500,000 | 9,936,087 |
| Ohio Turnpike Refunding Bond Series A | | 5.00 | 2-15-2039 | 7,000,000 | 7,890,123 |
| | | | | | 17,826,210 |
The accompanying notes are an integral part of these financial statements.
Allspring Municipal Bond Fund | 47
Portfolio of investments—December 31, 2022 (unaudited)
| | | Interest
rate | Maturity
date | Principal | Value |
| Utilities revenue: 0.04% | | | | | |
| Ohio Air Quality Refunding Bonds Series 2022B | | 4.25% | 11-1-2039 | $ 2,000,000 | $ 1,994,466 |
| | | | | | 100,477,189 |
| Oklahoma: 1.02% | | | | | |
| Airport revenue: 0.54% | | | | | |
| Oklahoma City OK Airport Trust Series 33 | | 5.00 | 7-1-2043 | 9,000,000 | 9,173,806 |
| Oklahoma City OK Airport Trust Series 33 | | 5.00 | 7-1-2047 | 11,500,000 | 11,651,830 |
| Tulsa OK Airports Improvement Trust AMT Series A (BAM Insured) | | 5.00 | 6-1-2035 | 1,055,000 | 1,081,507 |
| Tulsa OK Airports Improvement Trust Series A (AGM Insured) | | 5.00 | 6-1-2043 | 4,485,000 | 4,581,051 |
| Tulsa OK Airports Improvement Trust Series A (AGM Insured) | | 5.25 | 6-1-2048 | 3,770,000 | 3,878,303 |
| | | | | | 30,366,497 |
| Health revenue: 0.03% | | | | | |
| Oklahoma Development Finance Authority Health System Revenue ø | | 3.96 | 8-15-2031 | 1,695,000 | 1,695,000 |
| Miscellaneous revenue: 0.42% | | | | | |
| Garfield County OK Educational Facilities Authority Enid Public Schools Project Series A | | 5.00 | 9-1-2030 | 2,000,000 | 2,127,959 |
| Garfield County OK Educational Facilities Authority Enid Public Schools Project Series A | | 5.00 | 9-1-2031 | 1,145,000 | 1,214,187 |
| Muskogee OK Industrial Trust Educational Facilities Lease Muskogee Public Schools Project | | 4.00 | 9-1-2030 | 4,440,000 | 4,567,407 |
| Muskogee OK Industrial Trust Educational Facilities Lease Muskogee Public Schools Project | | 4.00 | 9-1-2031 | 5,520,000 | 5,657,311 |
| Muskogee OK Industrial Trust Educational Facilities Lease Muskogee Public Schools Project | | 4.00 | 9-1-2032 | 4,000,000 | 4,096,613 |
| Oklahoma Development Finance Authority Revenue Bonds Series 2022A | | 5.25 | 6-1-2037 | 4,535,000 | 5,050,405 |
| Pontotoc County OK Education Facilities Authority Ada Public Schools Project | | 4.00 | 9-1-2040 | 1,000,000 | 920,634 |
| | | | | | 23,634,516 |
| Transportation revenue: 0.02% | | | | | |
| Oklahoma Turnpike Authority Revenue Series A | | 5.00 | 1-1-2042 | 1,000,000 | 1,052,417 |
| Water & sewer revenue: 0.01% | | | | | |
| McGee Creek Oklahoma Authority (NPFGC Insured) | | 6.00 | 1-1-2023 | 645,000 | 645,000 |
| | | | | | 57,393,430 |
| Oregon: 0.59% | | | | | |
| Airport revenue: 0.03% | | | | | |
| Portland OR International Airport Series 24-B | | 5.00 | 7-1-2034 | 1,905,000 | 1,976,821 |
| GO revenue: 0.14% | | | | | |
| Jackson County OR School District #005 (AGM Insured) | | 5.00 | 6-15-2030 | 2,560,000 | 2,893,883 |
| Jackson County OR School District #005 (AGM Insured) | | 5.00 | 6-15-2031 | 2,125,000 | 2,399,326 |
| Jackson County OR School District #005 (AGM Insured) | | 5.00 | 6-15-2032 | 2,350,000 | 2,647,626 |
| | | | | | 7,940,835 |
The accompanying notes are an integral part of these financial statements.
48 | Allspring Municipal Bond Fund
Portfolio of investments—December 31, 2022 (unaudited)
| | | Interest
rate | Maturity
date | Principal | Value |
| Health revenue: 0.38% | | | | | |
| Clackamas County OR Hospital Facility Authority Senior Living Rose Ville Series A | | 5.13% | 11-15-2040 | $ 500,000 | $ 453,426 |
| Clackamas County OR Hospital Facility Authority Senior Living Rose Ville Series A | | 5.25 | 11-15-2050 | 500,000 | 436,729 |
| Clackamas County OR Hospital Facility Authority Senior Living Rose Ville Series A | | 5.38 | 11-15-2055 | 1,000,000 | 877,191 |
| Medford OR Hospital Facilities Refunding Bonds Asante Project Series A (AGM Insured) | | 4.00 | 8-15-2045 | 13,650,000 | 12,633,622 |
| Oregon Health Sciences University Revenue Series A | | 4.00 | 7-1-2044 | 2,000,000 | 1,929,318 |
| Salem OR Hospital Facility Authority Series 2016A | | 5.00 | 5-15-2046 | 5,000,000 | 5,047,469 |
| | | | | | 21,377,755 |
| Utilities revenue: 0.04% | | | | | |
| Eugene OR Electric Utility Revenue Series A | | 4.00 | 8-1-2045 | 1,260,000 | 1,228,695 |
| Eugene OR Electric Utility Revenue Series A | | 4.00 | 8-1-2049 | 800,000 | 767,674 |
| | | | | | 1,996,369 |
| | | | | | 33,291,780 |
| Pennsylvania: 6.10% | | | | | |
| Airport revenue: 0.65% | | | | | |
| Allegheny County PA Airport Authority Series 2021A (AGM Insured) | | 4.00 | 1-1-2046 | 2,000,000 | 1,778,725 |
| Allegheny County PA Airport Authority Series 2021A | | 5.00 | 1-1-2036 | 10,000,000 | 10,546,487 |
| Philadelphia PA Airport Revenue Bond Series B | | 5.00 | 7-1-2042 | 7,860,000 | 7,966,876 |
| Philadelphia PA Airport Series A | | 5.00 | 7-1-2047 | 9,950,000 | 9,819,705 |
| Philadelphia PA Airport Series B | | 5.00 | 7-1-2029 | 1,000,000 | 1,048,705 |
| Philadelphia PA Airport Series B | | 5.00 | 7-1-2031 | 750,000 | 784,032 |
| Philadelphia PA Airport Series C | | 4.00 | 7-1-2037 | 1,695,000 | 1,593,184 |
| Philadelphia PA Airport Series C | | 4.00 | 7-1-2038 | 1,260,000 | 1,179,678 |
| Philadelphia PA Airport Series C | | 4.00 | 7-1-2039 | 1,830,000 | 1,706,846 |
| | | | | | 36,424,238 |
| Education revenue: 0.67% | | | | | |
| Montgomery County PA Higher Education & Health Authority Arcadia University | | 5.00 | 4-1-2024 | 1,540,000 | 1,560,294 |
| Montgomery County PA Higher Education & Health Authority Arcadia University | | 5.00 | 4-1-2025 | 1,625,000 | 1,663,803 |
| Pennsylvania Higher Educational Facilities Revenue Drexel University Series A (AGM Insured) | | 5.00 | 5-1-2046 | 4,885,000 | 5,176,414 |
| Philadelphia PA IDA 1st Philadelphia Preparatory Charter School Project Series A | | 7.00 | 6-15-2033 | 2,000,000 | 2,082,920 |
| Philadelphia PA IDA Thomas Jefferson University Series B ø | | 4.17 | 9-1-2050 | 26,000,000 | 26,000,000 |
| Philadelphia PA IDA University Revenue Refunding Bond St. Joseph's University Project | | 4.00 | 11-1-2038 | 1,000,000 | 949,354 |
| | | | | | 37,432,785 |
| GO revenue: 0.35% | | | | | |
| Allegheny County PA West Mifflin Area School District (AGM Insured) | | 5.00 | 4-1-2025 | 1,180,000 | 1,231,923 |
| Allegheny County PA West Mifflin Area School District (AGM Insured) | | 5.00 | 4-1-2026 | 1,200,000 | 1,277,317 |
The accompanying notes are an integral part of these financial statements.
Allspring Municipal Bond Fund | 49
Portfolio of investments—December 31, 2022 (unaudited)
| | | Interest
rate | Maturity
date | Principal | Value |
| GO revenue (continued) | | | | | |
| Allegheny County PA West Mifflin Area School District (AGM Insured) | | 5.00% | 4-1-2027 | $ 1,000,000 | $ 1,078,533 |
| North Pocono PA School District Notes Series A (AGM Insured) | | 4.00 | 9-15-2029 | 2,170,000 | 2,294,119 |
| North Pocono PA School District Notes Series A (AGM Insured) | | 4.00 | 9-15-2032 | 1,750,000 | 1,825,394 |
| Philadelphia PA School District Series A | | 5.00 | 9-1-2024 | 2,075,000 | 2,140,607 |
| Philadelphia PA School District Series F | | 5.00 | 9-1-2035 | 3,820,000 | 3,973,135 |
| Williamsport PA Area School District (AGM Insured) | | 4.00 | 3-1-2032 | 1,440,000 | 1,433,910 |
| Williamsport PA Area School District (AGM Insured) | | 4.00 | 3-1-2033 | 1,490,000 | 1,483,033 |
| Williamsport PA Area School District (AGM Insured) | | 4.00 | 3-1-2034 | 1,555,000 | 1,547,978 |
| Williamsport PA Area School District (AGM Insured) | | 4.00 | 3-1-2035 | 1,205,000 | 1,198,494 |
| | | | | | 19,484,443 |
| Health revenue: 1.47% | | | | | |
| Allegheny County PA Hospital Development Authority Series 2017D-2 (SIFMA Municipal Swap +0.70%) ± | | 4.36 | 11-15-2047 | 10,000,000 | 9,716,278 |
| Allegheny County PA Hospital Development Authority Series A | | 4.00 | 7-15-2039 | 2,250,000 | 2,122,141 |
| Allegheny County PA Hospital Development Authority Series A | | 5.00 | 4-1-2047 | 5,000,000 | 5,056,079 |
| Chester County PA HEFA Main Line Health System Series A | | 4.00 | 9-1-2050 | 3,500,000 | 3,104,007 |
| Geisinger PA Health System Series A-1 | | 4.00 | 2-15-2047 | 10,000,000 | 9,072,047 |
| Montgomery County PA HEFA Thomas Jefferson University | | 4.00 | 9-1-2035 | 2,750,000 | 2,695,905 |
| Montgomery County PA HEFA Thomas Jefferson University | | 4.00 | 9-1-2038 | 1,000,000 | 948,336 |
| Montgomery County PA HEFA Thomas Jefferson University | | 5.00 | 9-1-2031 | 4,100,000 | 4,473,552 |
| Montgomery County PA Higher Education & Health Authority Series 2018D ø | | 4.17 | 9-1-2050 | 9,425,000 | 9,425,000 |
| Pennsylvania EDFA Series 2013A | | 5.00 | 7-1-2038 | 6,000,000 | 6,012,260 |
| Pennsylvania EDFA Series 2022A | | 5.00 | 2-15-2036 | 1,000,000 | 1,083,839 |
| Pennsylvania EDFA Series 2022A | | 5.00 | 2-15-2038 | 2,150,000 | 2,287,577 |
| Pennsylvania EDFA Series 2022A | | 5.00 | 2-15-2039 | 3,500,000 | 3,697,550 |
| Pennsylvania EDFA Series 2022A | | 6.00 | 6-30-2061 | 3,500,000 | 3,693,705 |
| Pennsylvania EDFA University of Pittsburgh Medical Center Series A-1 | | 4.00 | 4-15-2045 | 6,500,000 | 5,769,931 |
| Pennsylvania Higher Educational Facilities Revenue Thomas Jefferson University Series A | | 5.00 | 9-1-2045 | 2,640,000 | 2,657,024 |
| Pennsylvania Higher Educational Facilities Revenue University of Pennsylvania Series A | | 5.00 | 8-15-2042 | 3,000,000 | 3,117,327 |
| Quakertown PA General Authority Health LifeQuest Obligated Group Series C | | 4.50 | 7-1-2027 | 750,000 | 715,341 |
| Quakertown PA General Authority Health LifeQuest Obligated Group Series C | | 5.00 | 7-1-2032 | 1,000,000 | 925,009 |
| The Hospitals and Higher Education Facilities Authority of Philadelphia Revenue Bonds Series 2022 (AGM Insured) | | 5.00 | 7-1-2037 | 4,175,000 | 4,477,698 |
| Westmoreland County PA IDA Excela Health Project Series A | | 4.00 | 7-1-2037 | 625,000 | 568,773 |
The accompanying notes are an integral part of these financial statements.
50 | Allspring Municipal Bond Fund
Portfolio of investments—December 31, 2022 (unaudited)
| | | Interest
rate | Maturity
date | Principal | Value |
| Health revenue (continued) | | | | | |
| Westmoreland County PA IDA Excela Health Project Series A | | 5.00% | 7-1-2029 | $ 700,000 | $ 742,964 |
| Westmoreland County PA IDA Excela Health Project Series A | | 5.00 | 7-1-2030 | 550,000 | 587,995 |
| | | | | | 82,950,338 |
| Industrial development revenue: 0.30% | | | | | |
| Pennsylvania EDFA Bridges FinCo LP | | 5.00 | 12-31-2030 | 600,000 | 612,701 |
| Pennsylvania EDFA Bridges FinCo LP | | 5.00 | 12-31-2034 | 16,375,000 | 16,563,930 |
| | | | | | 17,176,631 |
| Miscellaneous revenue: 0.84% | | | | | |
| Delaware Valley Regional Finance Authority Local Government Series C (Ambac Insured) | | 7.75 | 7-1-2027 | 4,025,000 | 4,821,069 |
| Pennsylvania EDFA Tax-Exempt Private Revenue Bonds Series 2022 | | 5.75 | 6-30-2048 | 12,000,000 | 12,494,401 |
| Pennsylvania Finance Authority Pennsylvania Hills Project Series B (NPFGC Insured) ¤ | | 0.00 | 12-1-2025 | 1,060,000 | 957,815 |
| State Public School Building Authority Pennsylvania Philadelphia School District Project Series A | | 5.00 | 6-1-2024 | 2,250,000 | 2,309,352 |
| State Public School Building Authority Pennsylvania Philadelphia School District Project Series A (AGM Insured) | | 5.00 | 6-1-2030 | 3,800,000 | 4,012,730 |
| State Public School Building Authority Pennsylvania Philadelphia School District Project Series A | | 5.00 | 6-1-2034 | 1,915,000 | 1,993,041 |
| State Public School Building Authority Pennsylvania Philadelphia School District Project Series A | | 5.00 | 6-1-2035 | 16,715,000 | 17,390,020 |
| Waverly Township Municipal Authority Career Technology Center (BAM Insured) | | 4.00 | 2-15-2030 | 1,065,000 | 1,123,953 |
| Waverly Township Municipal Authority Career Technology Center (BAM Insured) | | 4.00 | 2-15-2031 | 1,110,000 | 1,169,340 |
| Waverly Township Municipal Authority Career Technology Center (BAM Insured) | | 4.00 | 2-15-2032 | 1,155,000 | 1,215,529 |
| | | | | | 47,487,250 |
| Resource recovery revenue: 0.17% | | | | | |
| Pennsylvania EDFA Solid Waste Disposal Republic Services Incorporated Project Series 2014A | | 3.60 | 6-1-2044 | 9,750,000 | 9,750,000 |
| Tax revenue: 0.22% | | | | | |
| Allentown PA Neighborhood Improvement Zone Development Authority Refunding Bond | | 5.00 | 5-1-2042 | 2,000,000 | 1,948,871 |
| Allentown PA Neighborhood Improvement Zone Development Authority Refunding Bond | | 5.00 | 5-1-2036 | 750,000 | 761,511 |
| Pennsylvania Turnpike Commission Series B | | 5.00 | 12-1-2043 | 6,000,000 | 6,271,623 |
| Southeastern Pennsylvania Transportation Authority Series 2022 | | 5.25 | 6-1-2047 | 3,000,000 | 3,290,492 |
| | | | | | 12,272,497 |
| Transportation revenue: 1.15% | | | | | |
| Delaware River Port Authority Project Series 2013 | | 5.00 | 1-1-2040 | 17,000,000 | 17,210,606 |
| Pennsylvania Turnpike Commission Motor License Series B-2 | | 5.00 | 12-1-2035 | 9,900,000 | 10,666,314 |
| Pennsylvania Turnpike Commission Series A | | 4.00 | 12-1-2046 | 3,000,000 | 2,761,562 |
| Pennsylvania Turnpike Commission Series A | | 5.00 | 12-1-2044 | 5,905,000 | 6,204,528 |
The accompanying notes are an integral part of these financial statements.
Allspring Municipal Bond Fund | 51
Portfolio of investments—December 31, 2022 (unaudited)
| | | Interest
rate | Maturity
date | Principal | Value |
| Transportation revenue (continued) | | | | | |
| Pennsylvania Turnpike Commission Series A-1 | | 5.00% | 12-1-2047 | $ 1,750,000 | $ 1,808,771 |
| Pennsylvania Turnpike Commission Series C | | 5.00 | 12-1-2046 | 4,125,000 | 4,364,910 |
| Pennsylvania Turnpike Commission Subordinate Bond Series A | | 5.00 | 12-1-2044 | 3,000,000 | 3,108,395 |
| Pennsylvania Turnpike Commission Subordinate Bond Series B | | 5.25 | 12-1-2052 | 8,250,000 | 8,866,775 |
| Pennsylvania Turnpike Commission Subordinate Bond Series B-1 | | 5.00 | 6-1-2027 | 1,150,000 | 1,246,321 |
| Pennsylvania Turnpike Commission Subordinate Bond Series B-1 | | 5.00 | 6-1-2028 | 1,450,000 | 1,561,178 |
| Pennsylvania Turnpike Commission Subordinate Bond Series B-2 | | 5.00 | 6-1-2027 | 1,260,000 | 1,365,534 |
| Pennsylvania Turnpike Commission Subordinate Bond Series B-2 | | 5.00 | 6-1-2028 | 5,005,000 | 5,388,754 |
| | | | | | 64,553,648 |
| Water & sewer revenue: 0.28% | | | | | |
| Luzerne County PA IDA Refunding Bonds AMT Pennsylvania American Water Company Project | | 2.45 | 12-1-2039 | 5,500,000 | 4,957,204 |
| Philadelphia PA Series B | | 5.00 | 7-1-2033 | 8,000,000 | 8,378,124 |
| Philadelphia PA Water & Wastewater Refunding Bond Series R | | 5.00 | 6-1-2042 | 2,200,000 | 2,369,066 |
| | | | | | 15,704,394 |
| | | | | | 343,236,224 |
| Puerto Rico: 0.02% | | | | | |
| Transportation revenue: 0.02% | | | | | |
| Puerto Rico Highways & Transportation Authority Series 2007CC | | 5.50 | 7-1-2029 | 825,000 | 846,639 |
| Rhode Island: 0.27% | | | | | |
| Airport revenue: 0.04% | | | | | |
| Rhode Island Commerce Corporation First Lien Special Facility Airport Corporation Intermodal Facility Project Series 2018 | | 5.00 | 7-1-2031 | 2,115,000 | 2,281,116 |
| Education revenue: 0.03% | | | | | |
| Rhonde Island HEFA Building Corporation Providence College Series A | | 5.00 | 11-1-2046 | 1,855,000 | 2,007,495 |
| Tax revenue: 0.20% | | | | | |
| Rhode Island Turnpike & Bridge Authority Motor Feul Tax Revenue Bonds Series 2016A | | 5.00 | 10-1-2040 | 10,640,000 | 11,061,055 |
| | | | | | 15,349,666 |
| South Carolina: 1.40% | | | | | |
| Education revenue: 0.18% | | | | | |
| South Carolina Jobs EDA York Preparatory Academy Project Series A 144A | | 7.25 | 11-1-2045 | 1,500,000 | 1,612,571 |
| University of South Carolina Athletic Facilities Series A | | 5.00 | 5-1-2043 | 8,155,000 | 8,615,461 |
| | | | | | 10,228,032 |
The accompanying notes are an integral part of these financial statements.
52 | Allspring Municipal Bond Fund
Portfolio of investments—December 31, 2022 (unaudited)
| | | Interest
rate | Maturity
date | Principal | Value |
| Health revenue: 0.21% | | | | | |
| South Carolina Jobs EDA Prisma Health Obligated Group Series C ø | | 4.20% | 5-1-2048 | $12,000,000 | $ 12,000,000 |
| Resource recovery revenue: 0.04% | | | | | |
| South Carolina Jobs EDA Solid Waste Disposal AMT RePower South Berkeley LLC Project Green Bond 144A† | | 6.00 | 2-1-2035 | 1,880,000 | 752,000 |
| South Carolina Jobs EDA Solid Waste Disposal AMT RePower South Berkeley LLC Project Green Bond 144A† | | 6.25 | 2-1-2045 | 2,750,000 | 1,100,000 |
| South Carolina Jobs EDA Solid Waste Disposal RePower South Berkeley LLC Green Bond † | | 8.00 | 12-6-2029 | 370,000 | 301,768 |
| | | | | | 2,153,768 |
| Utilities revenue: 0.97% | | | | | |
| Patriots Energy Group Financing Agency Series A (Royal Bank of Canada LIQ) | | 4.00 | 10-1-2048 | 9,040,000 | 9,032,019 |
| South Carolina Public Service Authority Refunding & Improvement Bonds Series A | | 4.00 | 12-1-2040 | 1,500,000 | 1,394,528 |
| South Carolina Public Service Authority Refunding & Improvement Bonds Series E | | 5.75 | 12-1-2047 | 31,250,000 | 33,968,116 |
| Tender Option Bond Trust Receipts (AGM Insured, Barclays Bank plc LIQ) 144Aø | | 3.78 | 12-1-2052 | 10,000,000 | 10,000,000 |
| | | | | | 54,394,663 |
| | | | | | 78,776,463 |
| South Dakota: 0.33% | | | | | |
| Health revenue: 0.18% | | | | | |
| South Dakota HEFA Avera Health Project Series 2017 | | 5.00 | 7-1-2046 | 10,000,000 | 10,055,928 |
| Housing revenue: 0.13% | | | | | |
| South Dakota Board of Regents Housing & Auxiliary Facilities System | | 5.00 | 4-1-2023 | 750,000 | 753,428 |
| South Dakota Board of Regents Housing & Auxiliary Facilities System | | 5.00 | 4-1-2024 | 1,100,000 | 1,127,280 |
| South Dakota Board of Regents Housing & Auxiliary Facilities System | | 5.00 | 4-1-2025 | 1,000,000 | 1,044,446 |
| South Dakota Board of Regents Housing & Auxiliary Facilities System | | 5.00 | 4-1-2026 | 1,540,000 | 1,640,207 |
| South Dakota Board of Regents Housing & Auxiliary Facilities System | | 5.00 | 4-1-2032 | 1,010,000 | 1,101,960 |
| South Dakota Board of Regents Housing & Auxiliary Facilities System | | 5.00 | 4-1-2033 | 1,250,000 | 1,358,491 |
| | | | | | 7,025,812 |
| Resource recovery revenue: 0.02% | | | | | |
| South Dakota EDA Riverview Project (AgCountry Farm Credit Services LOC) ø | | 3.76 | 11-1-2051 | 1,250,000 | 1,250,000 |
| | | | | | 18,331,740 |
The accompanying notes are an integral part of these financial statements.
Allspring Municipal Bond Fund | 53
Portfolio of investments—December 31, 2022 (unaudited)
| | | Interest
rate | Maturity
date | Principal | Value |
| Tennessee: 1.70% | | | | | |
| Airport revenue: 0.39% | | | | | |
| Metropolitan Government of Nashville & Davidson Counties Nashville Airport Authority Series 2022B | | 5.25% | 7-1-2047 | $15,750,000 | $ 16,451,103 |
| Metropolitan Government of Nashville & Davidson Counties Nashville Airport Authority Series 2022B | | 5.50 | 7-1-2052 | 5,000,000 | 5,282,168 |
| | | | | | 21,733,271 |
| Health revenue: 0.05% | | | | | |
| Metropolitan Government of Nashville & Davidson Counties Vanderbilt University Medical Center Series 2017A | | 5.00 | 7-1-2048 | 2,750,000 | 2,762,901 |
| Utilities revenue: 1.26% | | | | | |
| Tender Option Bond Trust Receipts/Certificates Series 2022-XM1024 144Aø | | 3.80 | 5-1-2052 | 7,500,000 | 7,500,000 |
| Tennergy Corporation Tennessee Gas Supply Series A | | 4.00 | 12-1-2051 | 25,000,000 | 24,432,353 |
| Tennergy Corporation Tennessee Gas Supply Series A | | 5.50 | 10-1-2053 | 10,000,000 | 10,578,897 |
| Tennessee Energy Acquisition Corporation Gas Project | | 4.00 | 11-1-2049 | 25,000,000 | 24,816,553 |
| Tennessee Energy Acquisition Corporation Series A | | 5.00 | 5-1-2052 | 2,640,000 | 2,732,332 |
| Tennessee Energy Acquisition Corporation Series A | | 5.25 | 9-1-2026 | 1,020,000 | 1,053,323 |
| | | | | | 71,113,458 |
| | | | | | 95,609,630 |
| Texas: 8.04% | | | | | |
| Airport revenue: 0.54% | | | | | |
| Austin TX Airport System AMT | | 5.00 | 11-15-2039 | 8,000,000 | 8,078,000 |
| Austin TX Airport System AMT | | 5.00 | 11-15-2044 | 3,500,000 | 3,499,949 |
| Austin TX Airport System AMT Series 2022 | | 5.00 | 11-15-2040 | 3,000,000 | 3,138,808 |
| Dallas & Fort Worth TX Series 2022B | | 5.00 | 11-1-2050 | 8,000,000 | 8,333,085 |
| Houston TX Airport System Subordinate Bond Lien AMT Series A | | 5.00 | 7-1-2041 | 4,750,000 | 4,868,669 |
| Port of Houston TX Series 2021 | | 4.00 | 10-1-2039 | 2,500,000 | 2,456,105 |
| | | | | | 30,374,616 |
| Education revenue: 0.57% | | | | | |
| Arlington TX Higher Education Finance Corporation BASIS Texas Charter Schools Incorporated 144A | | 4.50 | 6-15-2056 | 1,000,000 | 955,671 |
| Arlington TX Higher Education Finance Corporation Revenue Bonds Series 2022A 144A | | 6.00 | 2-15-2042 | 500,000 | 479,144 |
| Clifton TX Higher Education Finance Corporation International Leadership Series A | | 5.75 | 8-15-2038 | 2,000,000 | 2,019,142 |
| Clifton TX Higher Education Finance Corporation International Leadership Texas Series 2021T | | 4.00 | 8-15-2047 | 3,000,000 | 2,673,698 |
| Clifton TX Higher Education Finance Corporation International Leadership Texas Series 2022A | | 4.00 | 8-15-2047 | 2,500,000 | 2,323,756 |
| Clifton TX Higher Education Finance Corporation International Leadership Texas Series D | | 6.00 | 8-15-2038 | 6,000,000 | 6,108,176 |
| Clifton TX Higher Education Finance Corporation International Leadership Texas Series D | | 6.13 | 8-15-2048 | 6,750,000 | 6,849,290 |
| Hale Center Education Facilities Corporation Refunding and Improvement Bonds Wayland Baptist University Project Series 2022 | | 5.00 | 3-1-2031 | 2,140,000 | 2,253,180 |
The accompanying notes are an integral part of these financial statements.
54 | Allspring Municipal Bond Fund
Portfolio of investments—December 31, 2022 (unaudited)
| | | Interest
rate | Maturity
date | Principal | Value |
| Education revenue (continued) | | | | | |
| Southwest Texas Higher Education Authority Incorporated Southern Methodist University Project | | 5.00% | 10-1-2030 | $ 1,460,000 | $ 1,579,509 |
| Southwest Texas Higher Education Authority Incorporated Southern Methodist University Project | | 5.00 | 10-1-2032 | 650,000 | 699,061 |
| Southwest Texas Higher Education Authority Incorporated Southern Methodist University Project | | 5.00 | 10-1-2039 | 750,000 | 795,151 |
| Southwest Texas Higher Education Authority Incorporated Southern Methodist University Project | | 5.00 | 10-1-2040 | 1,000,000 | 1,057,986 |
| Southwest Texas Higher Education Authority Incorporated Southern Methodist University Project | | 5.00 | 10-1-2041 | 900,000 | 949,939 |
| University of Houston Refunding Bonds Series 2022A | | 5.00 | 2-15-2047 | 3,000,000 | 3,226,130 |
| | | | | | 31,969,833 |
| GO revenue: 2.02% | | | | | |
| Dallas County TX Series 2022 | | 5.00 | 8-15-2042 | 4,275,000 | 4,768,308 |
| El Paso TX GO Series 2016 | | 4.00 | 8-15-2031 | 6,500,000 | 6,722,922 |
| Fort Worth TX Independent School District Series 2022 | | 5.00 | 2-15-2047 | 5,935,000 | 6,287,242 |
| Houston TX Public Improvement Refunding Bonds Series A | | 4.00 | 3-1-2034 | 1,000,000 | 1,032,451 |
| Houston TX Public Improvement Refunding Bonds Series A | | 5.00 | 3-1-2029 | 2,160,000 | 2,345,479 |
| Nacogdoches TX Independent School District | | 5.00 | 2-15-2049 | 8,560,000 | 9,132,713 |
| Palestine TX Certificates of Obligation (AGM Insured) | | 4.00 | 2-15-2051 | 4,000,000 | 3,610,490 |
| Pasadena TX Independent School District Series 2022 | | 5.00 | 2-15-2047 | 6,250,000 | 6,866,309 |
| Port Isabel TX Series 2019 144A | | 5.10 | 2-15-2049 | 955,000 | 964,598 |
| Royse City TX Independent School District | | 5.00 | 8-15-2034 | 3,025,000 | 3,172,223 |
| Salado TX Independent School District | | 5.00 | 2-15-2049 | 1,605,000 | 1,712,384 |
| San Antonio TX Independent School District | | 5.00 | 8-15-2048 | 13,000,000 | 13,489,997 |
| Sugar Land TX Refunding Bonds | | 5.00 | 2-15-2030 | 1,250,000 | 1,354,879 |
| Temple TX Refunding Bonds | | 5.00 | 8-1-2032 | 1,070,000 | 1,126,944 |
| Texas Refunding Bond Series B | | 5.00 | 10-1-2036 | 24,500,000 | 25,598,962 |
| Travis County TX Certificates of Obligation Series 2019-A | | 5.00 | 3-1-2036 | 12,470,000 | 13,692,686 |
| Travis County TX Certificates of Obligation Series 2019-A | | 5.00 | 3-1-2039 | 6,250,000 | 6,752,072 |
| Viridian TX Municipal Management District Texas Road Improvement Project Series 2019 (BAM Insured) | | 4.00 | 12-1-2033 | 555,000 | 558,170 |
| Viridian TX Municipal Management District Texas Road Improvement Project Series 2019 (BAM Insured) | | 4.00 | 12-1-2034 | 630,000 | 631,207 |
| Viridian TX Municipal Management District Texas Road Improvement Project Series 2019 (BAM Insured) | | 4.00 | 12-1-2034 | 835,000 | 836,600 |
| Viridian TX Municipal Management District Texas Road Improvement Project Series 2019 (BAM Insured) | | 4.00 | 12-1-2035 | 655,000 | 649,297 |
| Viridian TX Municipal Management District Texas Road Improvement Project Series 2019 (BAM Insured) | | 4.00 | 12-1-2035 | 865,000 | 857,469 |
| Viridian TX Municipal Management District Texas Road Improvement Project Series 2019 (BAM Insured) | | 4.00 | 12-1-2036 | 680,000 | 663,214 |
| Viridian TX Municipal Management District Texas Road Improvement Project Series 2019 (BAM Insured) | | 4.00 | 12-1-2036 | 905,000 | 882,659 |
| | | | | | 113,709,275 |
| Health revenue: 0.32% | | | | | |
| Harris County TX Health Facilities Development Corporation Series A3 (AGM Insured) € | | 3.79 | 7-1-2031 | 2,675,000 | 2,675,000 |
| Harris County TX Texas Childrens Hospital Series A | | 4.00 | 10-1-2037 | 3,000,000 | 3,031,445 |
The accompanying notes are an integral part of these financial statements.
Allspring Municipal Bond Fund | 55
Portfolio of investments—December 31, 2022 (unaudited)
| | | Interest
rate | Maturity
date | Principal | Value |
| Health revenue (continued) | | | | | |
| Harris County TX Texas Childrens Hospital Series A | | 4.00% | 10-1-2038 | $ 2,300,000 | $ 2,309,474 |
| New Hope ECFA Children's Health System of Texas Project Series A | | 4.00 | 8-15-2033 | 2,050,000 | 2,074,024 |
| Tarrant County TX Cultural Education Facilities Finance Corporation Baylor Scott & White Health Project Series 2022D | | 5.50 | 11-15-2047 | 7,025,000 | 7,741,546 |
| | | | | | 17,831,489 |
| Housing revenue: 0.12% | | | | | |
| Tender Option Bond Trust Receipts/Certificates Series 2021-XF1109 (Deutsche Bank LIQ) 144Aø | | 3.96 | 7-1-2061 | 5,000,000 | 5,000,000 |
| Travis County TX Housing Finance Corporation MFHR Airway Gateway Apartments | | 4.13 | 6-1-2045 | 2,000,000 | 2,013,363 |
| | | | | | 7,013,363 |
| Industrial development revenue: 0.04% | | | | | |
| Houston TX Airport System Subordinate Bond Lien AMT | | 5.00 | 7-15-2027 | 2,500,000 | 2,536,355 |
| Miscellaneous revenue: 0.17% | | | | | |
| Texas PFA | | 4.00 | 2-1-2034 | 5,000,000 | 5,210,604 |
| Texas PFA | | 4.00 | 2-1-2035 | 2,000,000 | 2,071,212 |
| Texas PFA | | 4.00 | 2-1-2036 | 2,175,000 | 2,233,471 |
| | | | | | 9,515,287 |
| Tax revenue: 0.14% | | | | | |
| Dallas TX Area Rapid Transit Sales Tax Revenue Series A | | 5.00 | 12-1-2048 | 5,000,000 | 5,327,262 |
| Old Spanish Trail/Almeda Corridors RDA (BAM Insured) | | 4.00 | 9-1-2036 | 1,125,000 | 1,157,108 |
| Old Spanish Trail/Almeda Corridors RDA (BAM Insured) | | 4.00 | 9-1-2037 | 1,430,000 | 1,459,801 |
| | | | | | 7,944,171 |
| Transportation revenue: 1.41% | | | | | |
| Central Texas Regional Mobility Authority Senior Lien Series A | | 5.00 | 1-1-2033 | 3,740,000 | 3,740,000 |
| Central Texas Regional Mobility Authority Senior Lien Series A | | 5.00 | 1-1-2044 | 3,000,000 | 3,100,500 |
| Central Texas Regional Mobility Authority Senior Lien Series A | | 5.00 | 1-1-2049 | 2,450,000 | 2,514,397 |
| Central Texas Regional Mobility Authority Senior Lien Series B | | 4.00 | 1-1-2041 | 800,000 | 749,927 |
| Central Texas Regional Mobility Authority Senior Lien Series B | | 5.00 | 1-1-2046 | 1,600,000 | 1,652,137 |
| Grand Parkway Transportation Corporation CAB Series B øø | | 0.00 | 10-1-2029 | 1,015,000 | 1,092,705 |
| Grand Parkway Transportation Corporation CAB Series B øø | | 0.00 | 10-1-2030 | 2,000,000 | 2,159,272 |
| Grand Parkway Transportation Corporation Refunding Bonds Series 2020C | | 4.00 | 10-1-2039 | 2,500,000 | 2,443,877 |
| Grand Parkway Transportation Corporation Series C | | 4.00 | 10-1-2045 | 28,185,000 | 25,634,666 |
| North Texas Tollway Authority Series A | | 5.00 | 1-1-2033 | 3,600,000 | 3,713,009 |
| North Texas Tollway Authority Series A | | 5.00 | 1-1-2035 | 4,000,000 | 4,112,291 |
| North Texas Tollway Authority Series A | | 5.25 | 1-1-2038 | 3,500,000 | 3,889,383 |
| Tender Option Bond Trust Receipts Series 2019-XM0756 (Deutsche Bank LIQ) 144Aø | | 3.85 | 6-30-2058 | 4,769,000 | 4,769,000 |
The accompanying notes are an integral part of these financial statements.
56 | Allspring Municipal Bond Fund
Portfolio of investments—December 31, 2022 (unaudited)
| | | Interest
rate | Maturity
date | Principal | Value |
| Transportation revenue (continued) | | | | | |
| Texas Private Activity Bond Surface Transportation Corporation Project NTE Mobility Partners Segments LLC | | 4.00% | 12-31-2037 | $ 3,000,000 | $ 2,763,260 |
| Texas Private Activity Bond Surface Transportation Corporation Project NTE Mobility Partners Segments LLC | | 6.75 | 6-30-2043 | 4,000,000 | 4,063,550 |
| Texas Private Activity Bond Surface Transportation Corporation Project NTE Mobility Partners Segments LLC | | 7.00 | 12-31-2038 | 12,500,000 | 12,730,914 |
| | | | | | 79,128,888 |
| Utilities revenue: 0.36% | | | | | |
| Lower Colorado TX River Authority Series 2015 | | 5.00 | 5-15-2045 | 2,000,000 | 2,026,139 |
| Lower Colorado TX River Authority Series A (AGM Insured) | | 4.00 | 5-15-2040 | 2,500,000 | 2,451,236 |
| Lower Colorado TX River Authority Series A | | 5.00 | 5-15-2033 | 2,475,000 | 2,487,999 |
| San Antonio TX Electric and Gas Systems Refunding Bonds Series 2018 (SIFMA Municipal Swap +0.87%) ± | | 4.53 | 2-1-2048 | 8,000,000 | 8,000,043 |
| Texas Municipal Gas Acquisition & Supply Corporation Refunding Bond | | 5.00 | 12-15-2032 | 5,000,000 | 5,180,089 |
| | | | | | 20,145,506 |
| Water & sewer revenue: 2.35% | | | | | |
| Austin TX Water & Wastewater Refunding Bond | | 5.00 | 11-15-2045 | 15,065,000 | 15,769,344 |
| Brownsville TX Refunding Bonds Series 2022 (BAM Insured) | | 5.00 | 9-1-2046 | 1,000,000 | 1,060,512 |
| Brownsville TX Refunding Bonds Series 2022 (BAM Insured) | | 5.00 | 9-1-2051 | 1,000,000 | 1,050,290 |
| Dallas TX Waterworks & Sewer System Refunding Bond Series A | | 5.00 | 10-1-2030 | 3,810,000 | 4,031,818 |
| San Antonio TX Water System Refunding Bonds Series 2018A | | 5.00 | 5-15-2043 | 7,000,000 | 7,349,076 |
| Tarrant TX Regional Water District | | 5.00 | 9-1-2034 | 3,500,000 | 3,623,900 |
| Tarrant TX Regional Water District | | 5.00 | 3-1-2049 | 15,000,000 | 15,372,755 |
| Texas Series A | | 4.00 | 10-15-2036 | 5,000,000 | 5,083,137 |
| Texas Series B | | 5.00 | 4-15-2049 | 42,000,000 | 44,286,350 |
| Texas Water Development Board Series 2017-A | | 4.00 | 10-15-2037 | 11,650,000 | 11,764,989 |
| Texas Water Development Board Series 2020 | | 4.00 | 8-1-2038 | 2,500,000 | 2,527,816 |
| Texas Water Implementation Fund Series A | | 4.00 | 10-15-2037 | 4,000,000 | 4,054,085 |
| Texas Water Implementation Fund Series A | | 4.00 | 10-15-2038 | 6,500,000 | 6,565,513 |
| Texas Water Implementation Fund Series A | | 4.00 | 10-15-2044 | 9,905,000 | 9,627,205 |
| | | | | | 132,166,790 |
| | | | | | 452,335,573 |
| Utah: 0.63% | | | | | |
| Airport revenue: 0.54% | | | | | |
| Salt Lake City UT AMT Series A | | 5.00 | 7-1-2034 | 5,910,000 | 6,345,481 |
| Salt Lake City UT AMT Series A | | 5.00 | 7-1-2035 | 5,000,000 | 5,326,191 |
| Salt Lake City UT AMT Series A | | 5.00 | 7-1-2036 | 2,500,000 | 2,600,220 |
| Salt Lake City UT AMT Series A | | 5.00 | 7-1-2043 | 1,500,000 | 1,542,155 |
| Salt Lake City UT AMT Series A | | 5.00 | 7-1-2043 | 2,500,000 | 2,548,280 |
| Salt Lake City UT AMT Series A | | 5.00 | 7-1-2048 | 3,500,000 | 3,568,558 |
The accompanying notes are an integral part of these financial statements.
Allspring Municipal Bond Fund | 57
Portfolio of investments—December 31, 2022 (unaudited)
| | | Interest
rate | Maturity
date | Principal | Value |
| Airport revenue (continued) | | | | | |
| Salt Lake City UT AMT Series A | | 5.00% | 7-1-2048 | $ 5,500,000 | $ 5,562,500 |
| Salt Lake City UT AMT Series A | | 5.25 | 7-1-2048 | 3,000,000 | 3,069,960 |
| | | | | | 30,563,345 |
| Education revenue: 0.05% | | | | | |
| University of Utah (Citibank NA LIQ) 144Aø | | 3.69 | 2-1-2023 | 2,680,000 | 2,680,000 |
| Miscellaneous revenue: 0.02% | | | | | |
| Mida Mountain Village Public Infrastructure District Utah Special Assessment Revenue Bonds Mountain Village Assessment Area #2 144A | | 4.00 | 8-1-2050 | 1,500,000 | 1,068,632 |
| Tax revenue: 0.02% | | | | | |
| Utah Telecommunication Open Infrastructure Agency Series 2022 | | 5.50 | 6-1-2040 | 1,000,000 | 1,123,652 |
| | | | | | 35,435,629 |
| Virginia: 0.36% | | | | | |
| GO revenue: 0.11% | | | | | |
| Norfolk VA Series C | | 4.00 | 9-1-2032 | 5,810,000 | 6,129,155 |
| Health revenue: 0.04% | | | | | |
| Roanoke VA EDA Residential Care Facility Revenue Richfield Living Project | | 5.00 | 9-1-2040 | 3,290,000 | 2,307,577 |
| Tax revenue: 0.01% | | | | | |
| Marquis VA CDA CAB Series C ¤ | | 0.00 | 9-1-2041 | 1,824,000 | 87,140 |
| Marquis VA CDA CCAB Series 2015 144Aøø | | 0.00 | 9-1-2045 | 397,000 | 177,049 |
| Marquis VA CDA Series B | | 5.63 | 9-1-2041 | 1,310,000 | 579,874 |
| | | | | | 844,063 |
| Transportation revenue: 0.20% | | | | | |
| Virginia Small Business Financing Authority Senior Lien Elizabeth River Crossings OpCo LLC Project | | 4.00 | 7-1-2029 | 1,450,000 | 1,445,084 |
| Virginia Small Business Financing Authority Series 2022 | | 4.00 | 1-1-2040 | 1,800,000 | 1,607,793 |
| Virginia Small Business Financing Authority Series 2022 | | 4.00 | 1-1-2040 | 3,250,000 | 2,944,764 |
| Virginia Small Business Financing Authority Series 2022 | | 4.00 | 1-1-2048 | 6,000,000 | 4,997,509 |
| | | | | | 10,995,150 |
| | | | | | 20,275,945 |
| Washington: 3.41% | | | | | |
| Airport revenue: 0.56% | | | | | |
| Port of Seattle WA AMT Intermediate Lien | | 5.00 | 4-1-2044 | 16,000,000 | 16,397,338 |
| Port of Seattle WA AMT Intermediate Lien | | 5.00 | 8-1-2046 | 7,865,000 | 8,085,696 |
| Port of Seattle WA AMT Intermediate Lien Revenue and Refunding Bonds Series 2022B | | 5.00 | 8-1-2047 | 2,900,000 | 2,983,454 |
| Port of Seattle WA Intermediate Lien Revenue and Refunding Bonds Series 2022B | | 5.50 | 8-1-2047 | 3,850,000 | 4,108,352 |
| | | | | | 31,574,840 |
| Education revenue: 0.04% | | | | | |
| Washington HEFA Seattle University Project | | 4.00 | 5-1-2045 | 1,000,000 | 918,346 |
| Washington HEFA Seattle University Project | | 5.00 | 5-1-2030 | 760,000 | 842,087 |
The accompanying notes are an integral part of these financial statements.
58 | Allspring Municipal Bond Fund
Portfolio of investments—December 31, 2022 (unaudited)
| | | Interest
rate | Maturity
date | Principal | Value |
| Education revenue (continued) | | | | | |
| Washington HEFA Seattle University Project | | 5.00% | 5-1-2032 | $ 335,000 | $ 368,761 |
| Washington HEFA Seattle University Project | | 5.00 | 5-1-2033 | 300,000 | 329,349 |
| | | | | | 2,458,543 |
| GO revenue: 1.66% | | | | | |
| Clark County WA School District #114 (AGM Insured) | | 4.00 | 12-1-2031 | 9,000,000 | 9,517,126 |
| Clark County WA School District #114 (AGM Insured) | | 4.00 | 12-1-2034 | 2,500,000 | 2,605,711 |
| Grant County WA Limited Tax GO Series 2022 | | 5.25 | 12-1-2047 | 3,500,000 | 3,862,004 |
| King County WA Public Hospital District #1 Valley Medical Center Refunding Bond | | 5.00 | 12-1-2029 | 8,940,000 | 9,541,600 |
| King County WA Public Hospital District #1 Valley Medical Center Refunding Bond | | 5.00 | 12-1-2035 | 9,430,000 | 9,877,039 |
| King County WA School District #210 Federal Way (AGM Insured) | | 4.00 | 12-1-2033 | 10,000,000 | 10,404,321 |
| King County WA School District #414 Lake Washington (AGM Insured) | | 5.00 | 12-1-2033 | 570,000 | 632,634 |
| King County WA School District #414 Lake Washington (AGM Insured) | | 5.00 | 12-1-2034 | 1,000,000 | 1,101,336 |
| Seattle WA GO Series 2015 | | 4.00 | 12-1-2040 | 2,500,000 | 2,479,201 |
| Snohomish County WA School District (AGM Insured) | | 5.00 | 12-1-2031 | 1,500,000 | 1,571,920 |
| Washington Motor Vehicle Fuel Tax Series B | | 5.00 | 8-1-2032 | 8,545,000 | 8,980,363 |
| Washington Series 2017-A | | 5.00 | 8-1-2033 | 1,500,000 | 1,602,861 |
| Washington Series 2017-A | | 5.00 | 8-1-2040 | 3,500,000 | 3,670,858 |
| Washington Series 2017-A | | 5.00 | 8-1-2041 | 2,500,000 | 2,616,051 |
| Washington Series 2021-F | | 5.00 | 6-1-2038 | 6,500,000 | 7,215,176 |
| Washington Series 2022-C | | 5.00 | 2-1-2044 | 16,000,000 | 17,477,862 |
| | | | | | 93,156,063 |
| Health revenue: 0.36% | | | | | |
| Spokane WA Housing Finance Commission Riverview Retirement Community Project | | 5.00 | 1-1-2023 | 255,000 | 255,000 |
| Tender Option Bond Trust Receipts/Floater Certificates Series 2015-XF1018 (Barclays Bank plc LIQ) 144Aø | | 3.76 | 8-15-2045 | 7,875,000 | 7,875,000 |
| Washington HCFR Providence Health & Services Series 2012A | | 5.00 | 10-1-2042 | 2,160,000 | 2,143,540 |
| Washington Health Care Facilities Authority Commonspirit Health Series A-2 | | 5.00 | 8-1-2038 | 3,000,000 | 3,101,871 |
| Washington Health Care Facilities Authority Seattle Cancer Care Alliance | | 4.00 | 9-1-2045 | 3,000,000 | 2,693,782 |
| Washington Health Care Facilities Authority Seattle Cancer Care Alliance 144A | | 4.00 | 12-1-2045 | 2,450,000 | 2,230,365 |
| Washington Health Care Facilities Authority Seattle Cancer Care Alliance | | 5.00 | 9-1-2040 | 1,000,000 | 1,040,202 |
| Washington Health Care Facilities Authority Seattle Childrens Hospital Series 2017A | | 5.00 | 10-1-2047 | 1,055,000 | 1,071,187 |
| | | | | | 20,410,947 |
| Miscellaneous revenue: 0.36% | | | | | |
| FYI Properties Lease Revenue Refunding Bonds Washington State District Project Series 2019 | | 5.00 | 6-1-2037 | 7,395,000 | 7,932,739 |
| FYI Properties Lease Revenue Refunding Bonds Washington State District Project Series 2019 | | 5.00 | 6-1-2038 | 1,750,000 | 1,872,123 |
| Washington Certificate of Participation | | 5.00 | 7-1-2038 | 1,660,000 | 1,795,559 |
| Washington Certificate of Participation | | 5.00 | 7-1-2039 | 1,745,000 | 1,880,476 |
| Washington Certificate of Participation | | 5.00 | 7-1-2040 | 1,480,000 | 1,584,342 |
The accompanying notes are an integral part of these financial statements.
Allspring Municipal Bond Fund | 59
Portfolio of investments—December 31, 2022 (unaudited)
| | | Interest
rate | Maturity
date | Principal | Value |
| Miscellaneous revenue (continued) | | | | | |
| Washington Certificate of Participation | | 5.00% | 7-1-2041 | $ 1,555,000 | $ 1,658,538 |
| Washington Certificate of Participation Series A | | 5.00 | 7-1-2038 | 3,265,000 | 3,468,413 |
| | | | | | 20,192,190 |
| Tax revenue: 0.29% | | | | | |
| Washington Motor Vehicle Fuel Tax Series B | | 5.00 | 6-1-2036 | 5,000,000 | 5,565,136 |
| Washington Series 2021-A | | 5.00 | 8-1-2036 | 3,500,000 | 3,900,380 |
| Washington Series B | | 5.00 | 8-1-2037 | 6,400,000 | 6,754,262 |
| | | | | | 16,219,778 |
| Utilities revenue: 0.05% | | | | | |
| Energy Northwest Washington Electric Revenue Refunding Bonds Columbia Generating Station | | 5.00 | 7-1-2034 | 2,500,000 | 2,829,791 |
| Water & sewer revenue: 0.09% | | | | | |
| King County WA Refunding Bonds | | 5.00 | 7-1-2042 | 4,660,000 | 4,946,342 |
| | | | | | 191,788,494 |
| West Virginia: 0.13% | | | | | |
| GO revenue: 0.05% | | | | | |
| Ohio County WV Board of Education | | 3.00 | 6-1-2026 | 2,680,000 | 2,696,373 |
| Tax revenue: 0.08% | | | | | |
| Monongalia County WV Commission Improvement & Refunding Bonds University Town Center Series A 144A | | 5.50 | 6-1-2037 | 2,500,000 | 2,516,368 |
| Monongalia County WV Commission Improvement & Refunding Bonds University Town Center Series A 144A | | 5.75 | 6-1-2043 | 675,000 | 680,700 |
| Monongalia County WV Commission Special District Excise Tax University Town Center Series A 144A | | 4.13 | 6-1-2043 | 1,600,000 | 1,388,824 |
| | | | | | 4,585,892 |
| | | | | | 7,282,265 |
| Wisconsin: 3.09% | | | | | |
| Education revenue: 0.60% | | | | | |
| Milwaukee WI RDA Science Education Consortium Incorporated Project Series A | | 6.00 | 8-1-2033 | 2,120,000 | 2,143,444 |
| Milwaukee WI RDA Science Education Consortium Incorporated Project Series A | | 6.25 | 8-1-2043 | 4,650,000 | 4,692,103 |
| Wisconsin HEFA Marquette University Project Series 2022 | | 5.00 | 10-1-2031 | 6,690,000 | 7,624,095 |
| Wisconsin HEFA Marquette University Project Series 2022 | | 5.00 | 10-1-2032 | 7,040,000 | 8,094,612 |
| Wisconsin PFA Carolina International School Series A 144A | | 6.00 | 8-1-2023 | 85,000 | 85,727 |
| Wisconsin PFA Carolina International School Series A 144A | | 6.75 | 8-1-2033 | 2,430,000 | 2,457,540 |
| Wisconsin PFA Carolina International School Series A 144A | | 7.00 | 8-1-2043 | 1,575,000 | 1,589,254 |
| Wisconsin PFA Carolina International School Series A 144A | | 7.20 | 8-1-2048 | 940,000 | 948,760 |
The accompanying notes are an integral part of these financial statements.
60 | Allspring Municipal Bond Fund
Portfolio of investments—December 31, 2022 (unaudited)
| | | Interest
rate | Maturity
date | Principal | Value |
| Education revenue (continued) | | | | | |
| Wisconsin PFA Charter School Revenue American Preparatory Academy 144A | | 5.00% | 7-15-2039 | $ 1,375,000 | $ 1,289,594 |
| Wisconsin PFA Wisland Revenue Northwest Nazarene University | | 4.25 | 10-1-2049 | 5,410,000 | 4,667,031 |
| | | | | | 33,592,160 |
| GO revenue: 0.15% | | | | | |
| Verona WI Area School District Building & Improvement Bonds | | 4.00 | 4-1-2027 | 3,385,000 | 3,517,982 |
| Verona WI Area School District Building & Improvement Bonds | | 4.00 | 4-1-2028 | 1,380,000 | 1,434,492 |
| Verona WI Area School District Building & Improvement Bonds | | 5.00 | 4-1-2026 | 3,310,000 | 3,549,795 |
| | | | | | 8,502,269 |
| Health revenue: 0.91% | | | | | |
| Wisconsin HEFA Ascension Senior Credit Group Series A | | 4.50 | 11-15-2039 | 4,925,000 | 4,977,442 |
| Wisconsin HEFA Ascension Senior Credit Group Series A | | 5.00 | 11-15-2035 | 12,000,000 | 12,440,744 |
| Wisconsin HEFA Bellin Memorial Hospital Project Series 2022 | | 5.00 | 12-1-2041 | 1,315,000 | 1,373,285 |
| Wisconsin HEFA Bellin Memorial Hospital Project Series 2022 | | 5.00 | 12-1-2042 | 2,000,000 | 2,085,515 |
| Wisconsin HEFA Bellin Memorial Hospital Project Series 2022 | | 5.00 | 12-1-2043 | 3,540,000 | 3,680,682 |
| Wisconsin HEFA Bellin Memorial Hospital Project Series 2022 | | 5.50 | 12-1-2052 | 2,000,000 | 2,139,518 |
| Wisconsin HEFA Series 2053 ø | | 4.23 | 2-15-2053 | 3,000,000 | 3,000,000 |
| Wisconsin PFA Series A ## | | 4.00 | 10-1-2049 | 24,500,000 | 21,515,540 |
| | | | | | 51,212,726 |
| Housing revenue: 0.69% | | | | | |
| Wisconsin Housing & EDA Series A (FHLB SPA) ø | | 3.60 | 4-1-2046 | 2,820,000 | 2,820,000 |
| Wisconsin PFA Student Housing Revenue (AGM Insured) | | 4.00 | 7-1-2023 | 350,000 | 351,331 |
| Wisconsin PFA Student Housing Revenue (AGM Insured) | | 4.00 | 7-1-2024 | 800,000 | 805,694 |
| Wisconsin PFA Student Housing Revenue (AGM Insured) | | 4.00 | 7-1-2025 | 920,000 | 932,496 |
| Wisconsin PFA Student Housing Revenue (AGM Insured) | | 5.00 | 7-1-2026 | 1,360,000 | 1,429,098 |
| Wisconsin PFA Student Housing Revenue (AGM Insured) | | 5.00 | 7-1-2027 | 1,675,000 | 1,780,787 |
| Wisconsin PFA Student Housing Revenue (AGM Insured) | | 5.00 | 7-1-2028 | 2,025,000 | 2,175,117 |
| Wisconsin PFA Student Housing Revenue (AGM Insured) | | 5.00 | 7-1-2029 | 2,190,000 | 2,346,060 |
| Wisconsin PFA Student Housing Revenue (AGM Insured) | | 5.00 | 7-1-2030 | 2,300,000 | 2,463,102 |
| Wisconsin PFA Student Housing Revenue (AGM Insured) | | 5.00 | 7-1-2031 | 1,415,000 | 1,510,070 |
| Wisconsin PFA Student Housing Revenue (AGM Insured) | | 5.00 | 7-1-2048 | 16,775,000 | 17,046,619 |
| Wisconsin PFA Student Housing Revenue (AGM Insured) | | 5.00 | 7-1-2053 | 5,000,000 | 5,065,989 |
| | | | | | 38,726,363 |
| Industrial development revenue: 0.11% | | | | | |
| Wisconsin PFA Series 2022A | | 5.00 | 2-1-2042 | 2,500,000 | 2,407,404 |
| Wisconsin PFA Series 2022A 144A | | 5.50 | 2-1-2042 | 4,000,000 | 3,688,722 |
| | | | | | 6,096,126 |
The accompanying notes are an integral part of these financial statements.
Allspring Municipal Bond Fund | 61
Portfolio of investments—December 31, 2022 (unaudited)
| | | Interest
rate | Maturity
date | Principal | Value |
| Miscellaneous revenue: 0.09% | | | | | |
| Appleton WI RDA Fox Cities Performing Arts Center Project Series B (Associated Bank NA LOC) ø | | 4.10% | 6-1-2036 | $ 1,500,000 | $ 1,500,000 |
| Wisconsin Series A | | 5.00 | 6-1-2033 | 3,420,000 | 3,575,855 |
| | | | | | 5,075,855 |
| Tax revenue: 0.54% | | | | | |
| Mount Pleasant WI Series A ## | | 5.00 | 4-1-2043 | 20,205,000 | 21,269,818 |
| Mount Pleasant WI Series A | | 5.00 | 4-1-2048 | 650,000 | 672,888 |
| Mount Pleasant WI Series A | | 5.00 | 4-1-2048 | 6,910,000 | 7,120,558 |
| Wisconsin Center District CAB Series C (AGM Insured) ¤ | | 0.00 | 12-15-2037 | 1,600,000 | 810,600 |
| Wisconsin Center District CAB Series C (AGM Insured) ¤ | | 0.00 | 12-15-2038 | 1,600,000 | 767,621 |
| | | | | | 30,641,485 |
| | | | | | 173,846,984 |
| Total Municipal obligations (Cost $5,768,567,742) | | | | | 5,536,052,275 |
| | | Yield | | Shares | |
| Short-term investments: 0.08% | | | | | |
| Investment companies: 0.08% | | | | | |
| Allspring Municipal Cash Management Money Market Fund Institutional Class ♠∞## | | 3.56 | | 4,321,474 | 4,322,339 |
| Total Short-term investments (Cost $4,321,871) | | | | | 4,322,339 |
| Total investments in securities (Cost $5,814,889,613) | 99.25% | | | | 5,582,374,614 |
| Other assets and liabilities, net | 0.75 | | | | 42,416,758 |
| Total net assets | 100.00% | | | | $5,624,791,372 |
| 144A | The security may be resold in transactions exempt from registration, normally to qualified institutional buyers, pursuant to Rule 144A under the Securities Act of 1933. |
| ø | Variable rate demand notes are subject to a demand feature which reduces the effective maturity. The maturity date shown represents the final maturity date of the security. The interest rate is determined and reset by the issuer daily, weekly, or monthly depending upon the terms of the security. The rate shown is the rate in effect at period end. |
| ¤ | The security is issued in zero coupon form with no periodic interest payments. |
| € | The security is an auction-rate security which has an interest rate that resets at predetermined short-term intervals through a Dutch auction. The rate shown is the rate in effect at period end. |
| ± | Variable rate investment. The rate shown is the rate in effect at period end. |
| øø | The interest rate is determined and reset by the issuer periodically depending upon the terms of the security. The rate shown is the rate in effect at period end. |
| † | Non-income-earning security |
| ## | All or a portion of this security is segregated for when-issued securities. |
| ♠ | The issuer of the security is an affiliated person of the Fund as defined in the Investment Company Act of 1940. |
| ∞ | The rate represents the 7-day annualized yield at period end. |
| %% | The security is purchased on a when-issued basis. |
| ♣ | On the last interest date, partial interest was paid. |
The accompanying notes are an integral part of these financial statements.
62 | Allspring Municipal Bond Fund
Portfolio of investments—December 31, 2022 (unaudited)
| Abbreviations: |
| AGC | Assured Guaranty Corporation |
| AGM | Assured Guaranty Municipal |
| Ambac | Ambac Financial Group Incorporated |
| AMT | Alternative minimum tax |
| BAM | Build America Mutual Assurance Company |
| CAB | Capital appreciation bond |
| CCAB | Convertible capital appreciation bond |
| CDA | Community Development Authority |
| ECFA | Educational & Cultural Facilities Authority |
| EDA | Economic Development Authority |
| EDFA | Economic Development Finance Authority |
| FGIC | Financial Guaranty Insurance Corporation |
| FHLB | Federal Home Loan Bank |
| FHLMC | Federal Home Loan Mortgage Corporation |
| GO | General obligation |
| HCFR | Healthcare facilities revenue |
| HEFA | Health & Educational Facilities Authority |
| HFA | Housing Finance Authority |
| HFFA | Health Facilities Financing Authority |
| IDA | Industrial Development Authority |
| LIBOR | London Interbank Offered Rate |
| LIQ | Liquidity agreement |
| LOC | Letter of credit |
| MFHR | Multifamily housing revenue |
| NPFGC | National Public Finance Guarantee Corporation |
| PCR | Pollution control revenue |
| PFA | Public Finance Authority |
| RDA | Redevelopment Authority |
| SIFMA | Securities Industry and Financial Markets Association |
| SPA | Standby purchase agreement |
| TTFA | Transportation Trust Fund Authority |
Investments in affiliates
An affiliated investment is an investment in which the Fund owns at least 5% of the outstanding voting shares of the issuer or as a result of other relationships, such as the Fund and the issuer having the same investment manager. Transactions with issuers that were affiliates of the Fund at the end of the period were as follows:
| | Value,
beginning of
period | Purchases | Sales
proceeds | Net
realized
gains
(losses) | Net
change in
unrealized
gains
(losses) | Value,
end of
period | Shares,
end
of period | Income
from
affiliated
securities |
| Short-term investments | | | | | | | |
| Allspring Municipal Cash Management Money Market Fund Institutional Class | $15,147,751 | $820,815,009 | $(831,622,741) | $(17,436) | $(244) | $4,322,339 | 4,321,474 | $9,287 |
The accompanying notes are an integral part of these financial statements.
Allspring Municipal Bond Fund | 63
Statement of assets and liabilities—December 31, 2022 (unaudited)
| | |
| Assets | |
Investments in unaffiliated securities, at value (cost $5,810,567,742)
| $ 5,578,052,275 |
Investments in affiliated securities, at value (cost $4,321,871)
| 4,322,339 |
Cash
| 152,905 |
Receivable for interest
| 64,116,033 |
Receivable for Fund shares sold
| 44,332,573 |
Receivable for investments sold
| 366,000 |
Prepaid expenses and other assets
| 665,721 |
Total assets
| 5,692,007,846 |
| Liabilities | |
Payable for Fund shares redeemed
| 48,790,409 |
Payable for when-issued transactions
| 11,869,744 |
Dividends payable
| 4,011,175 |
Management fee payable
| 1,618,504 |
Administration fees payable
| 468,803 |
Distribution fee payable
| 19,647 |
Accrued expenses and other liabilities
| 438,192 |
Total liabilities
| 67,216,474 |
Total net assets
| $5,624,791,372 |
| Net assets consist of | |
Paid-in capital
| $ 5,935,613,437 |
Total distributable loss
| (310,822,065) |
Total net assets
| $5,624,791,372 |
| Computation of net asset value and offering price per share | |
Net assets – Class A
| $ 830,960,994 |
Shares outstanding – Class A1
| 86,626,760 |
Net asset value per share – Class A
| $9.59 |
Maximum offering price per share – Class A2
| $10.04 |
Net assets – Class C
| $ 28,988,318 |
Shares outstanding – Class C1
| 3,022,860 |
Net asset value per share – Class C
| $9.59 |
Net assets – Class R6
| $ 699,667,211 |
Shares outstanding – Class R61
| 72,931,413 |
Net asset value per share – Class R6
| $9.59 |
Net assets – Administrator Class
| $ 1,050,832,436 |
Shares outstanding – Administrator Class1
| 109,517,358 |
Net asset value per share – Administrator Class
| $9.60 |
Net assets – Institutional Class
| $ 3,014,342,413 |
Shares outstanding – Institutional Class1
| 314,269,384 |
Net asset value per share – Institutional Class
| $9.59 |
| 1 | The Fund has an unlimited number of authorized shares. |
| 2 | Maximum offering price is computed as 100/95.50 of net asset value. On investments of $50,000 or more, the offering price is reduced. |
The accompanying notes are an integral part of these financial statements.
64 | Allspring Municipal Bond Fund
Statement of operations—six months ended December 31, 2022 (unaudited)
| | |
| Investment income | |
Interest
| $ 94,116,849 |
Income from affiliated securities
| 9,287 |
Total investment income
| 94,126,136 |
| Expenses | |
Management fee
| 9,616,263 |
| Administration fees | |
Class A
| 712,471 |
Class C
| 25,400 |
Class R6
| 99,089 |
Administrator Class
| 524,183 |
Institutional Class
| 1,196,087 |
| Shareholder servicing fees | |
Class A
| 1,111,187 |
Class C
| 39,541 |
Administrator Class
| 1,310,208 |
| Distribution fee | |
Class C
| 118,622 |
Custody and accounting fees
| 130,160 |
Professional fees
| 48,370 |
Registration fees
| 100,620 |
Shareholder report expenses
| 103,210 |
Trustees’ fees and expenses
| 11,432 |
Other fees and expenses
| 67,670 |
Total expenses
| 15,214,513 |
| Less: Fee waivers and/or expense reimbursements | |
Class A
| (94,584) |
Class C
| (2,287) |
Class R6
| (365) |
Administrator Class
| (568,556) |
Institutional Class
| (484) |
Net expenses
| 14,548,237 |
Net investment income
| 79,577,899 |
| Realized and unrealized gains (losses) on investments | |
| Net realized losses on | |
Unaffiliated securities
| (10,106,913) |
Affiliated securities
| (17,436) |
Net realized losses on investments
| (10,124,349) |
| Net change in unrealized gains (losses) on | |
Unaffiliated securities
| (59,140,269) |
Affiliated securities
| (244) |
Net change in unrealized gains (losses) on investments
| (59,140,513) |
Net realized and unrealized gains (losses) on investments
| (69,264,862) |
Net increase in net assets resulting from operations
| $ 10,313,037 |
The accompanying notes are an integral part of these financial statements.
Allspring Municipal Bond Fund | 65
Statement of changes in net assets
| | | | | |
| | Six months ended
December 31, 2022
(unaudited) | Year ended
June 30, 2022 |
| Operations | | | | |
Net investment income
| | $ 79,577,899 | | $ 132,330,860 |
Net realized losses on investments
| | (10,124,349) | | (29,696,038) |
Net change in unrealized gains (losses) on investments
| | (59,140,513) | | (586,935,899) |
Net increase (decrease) in net assets resulting from operations
| | 10,313,037 | | (484,301,077) |
| Distributions to shareholders from | | | | |
| Net investment income and net realized gains | | | | |
Class A
| | (11,535,703) | | (22,307,254) |
Class C
| | (290,803) | | (618,947) |
Class R6
| | (9,775,379) | | (11,522,096) |
Administrator Class
| | (14,358,977) | | (22,759,543) |
Institutional Class
| | (43,449,907) | | (75,114,595) |
Total distributions to shareholders
| | (79,410,769) | | (132,322,435) |
| Capital share transactions | Shares | | Shares | |
| Proceeds from shares sold | | | | |
Class A
| 3,733,478 | 35,818,534 | 3,555,083 | 37,023,328 |
Class C
| 312,105 | 2,988,459 | 298,478 | 3,190,333 |
Class R6
| 76,047,189 | 722,006,147 | 100,043,556 | 1,000,180,422 |
Administrator Class
| 163,922,811 | 1,576,440,475 | 143,501,780 | 1,460,363,388 |
Institutional Class
| 160,440,327 | 1,538,258,522 | 109,281,926 | 1,122,718,011 |
| | | 3,875,512,137 | | 3,623,475,482 |
| Reinvestment of distributions | | | | |
Class A
| 1,058,927 | 10,116,797 | 1,906,296 | 19,851,582 |
Class C
| 28,727 | 274,469 | 56,879 | 592,739 |
Class R6
| 25,244 | 240,900 | 13,432 | 139,556 |
Administrator Class
| 1,477,499 | 14,126,880 | 2,179,944 | 22,612,571 |
Institutional Class
| 3,887,089 | 37,136,051 | 6,625,814 | 68,879,804 |
| | | 61,895,097 | | 112,076,252 |
| Payment for shares redeemed | | | | |
Class A
| (11,243,792) | (107,709,275) | (14,894,404) | (153,994,313) |
Class C
| (882,752) | (8,459,565) | (1,430,615) | (14,862,619) |
Class R6
| (66,286,116) | (628,978,652) | (71,421,897) | (708,522,552) |
Administrator Class
| (162,535,044) | (1,561,319,208) | (131,372,943) | (1,338,909,878) |
Institutional Class
| (132,151,566) | (1,256,961,145) | (114,743,308) | (1,161,120,631) |
| | | (3,563,427,845) | | (3,377,409,993) |
Net increase in net assets resulting from capital share transactions
| | 373,979,389 | | 358,141,741 |
Total increase (decrease) in net assets
| | 304,881,657 | | (258,481,771) |
| Net assets | | | | |
Beginning of period
| | 5,319,909,715 | | 5,578,391,486 |
End of period
| | $ 5,624,791,372 | | $ 5,319,909,715 |
The accompanying notes are an integral part of these financial statements.
66 | Allspring Municipal Bond Fund
Financial highlights
(For a share outstanding throughout each period)
| | | Year ended June 30 |
| Class A | Six months ended
December 31, 2022
(unaudited) | 2022 | 2021 | 2020 | 2019 | 2018 |
Net asset value, beginning of period
| $9.70 | $10.83 | $10.55 | $10.55 | $10.21 | $10.25 |
Net investment income
| 0.13 | 0.23 | 0.24 | 0.25 | 0.30 1 | 0.32 |
Net realized and unrealized gains (losses) on investments
| (0.11) | (1.13) | 0.28 | 0.01 | 0.34 | (0.02) |
Total from investment operations
| 0.02 | (0.90) | 0.52 | 0.26 | 0.64 | 0.30 |
| Distributions to shareholders from | | | | | | |
Net investment income
| (0.13) | (0.23) | (0.24) | (0.25) | (0.30) | (0.32) |
Net realized gains
| 0.00 | 0.00 | 0.00 | (0.01) | 0.00 | (0.02) |
Total distributions to shareholders
| (0.13) | (0.23) | (0.24) | (0.26) | (0.30) | (0.34) |
Net asset value, end of period
| $9.59 | $9.70 | $10.83 | $10.55 | $10.55 | $10.21 |
Total return2
| 0.17% | (8.47)% | 4.95% | 2.54% | 6.35% | 2.97% |
| Ratios to average net assets (annualized) | | | | | | |
Gross expenses
| 0.77% | 0.77% | 0.77% | 0.77% | 0.78% | 0.79% |
Net expenses
| 0.75% | 0.74% | 0.74% | 0.74% | 0.75% | 0.75% |
Net investment income
| 2.60% | 2.16% | 2.22% | 2.40% | 2.89% | 3.10% |
| Supplemental data | | | | | | |
Portfolio turnover rate
| 5% | 18% | 16% | 24% | 20% | 19% |
Net assets, end of period (000s omitted)
| $830,961 | $902,671 | $1,110,503 | $1,138,934 | $1,206,717 | $1,179,800 |
| 1 | Calculated based upon average shares outstanding |
| 2 | Total return calculations do not include any sales charges. Returns for periods of less than one year are not annualized. |
The accompanying notes are an integral part of these financial statements.
Allspring Municipal Bond Fund | 67
Financial highlights
(For a share outstanding throughout each period)
| | | Year ended June 30 |
| Class C | Six months ended
December 31, 2022
(unaudited) | 2022 | 2021 | 2020 | 2019 | 2018 |
Net asset value, beginning of period
| $9.70 | $10.83 | $10.55 | $10.55 | $10.21 | $10.24 |
Net investment income
| 0.09 | 0.15 1 | 0.16 1 | 0.17 | 0.22 | 0.24 |
Net realized and unrealized gains (losses) on investments
| (0.11) | (1.13) | 0.28 | 0.01 | 0.34 | (0.01) |
Total from investment operations
| (0.02) | (0.98) | 0.44 | 0.18 | 0.56 | 0.23 |
| Distributions to shareholders from | | | | | | |
Net investment income
| (0.09) | (0.15) | (0.16) | (0.17) | (0.22) | (0.24) |
Net realized gains
| 0.00 | 0.00 | 0.00 | (0.01) | 0.00 | (0.02) |
Total distributions to shareholders
| (0.09) | (0.15) | (0.16) | (0.18) | (0.22) | (0.26) |
Net asset value, end of period
| $9.59 | $9.70 | $10.83 | $10.55 | $10.55 | $10.21 |
Total return2
| (0.21)% | (9.16)% | 4.16% | 1.77% | 5.56% | 2.30% |
| Ratios to average net assets (annualized) | | | | | | |
Gross expenses
| 1.51% | 1.51% | 1.51% | 1.51% | 1.53% | 1.54% |
Net expenses
| 1.50% | 1.50% | 1.50% | 1.50% | 1.50% | 1.50% |
Net investment income
| 1.84% | 1.40% | 1.47% | 1.64% | 2.15% | 2.35% |
| Supplemental data | | | | | | |
Portfolio turnover rate
| 5% | 18% | 16% | 24% | 20% | 19% |
Net assets, end of period (000s omitted)
| $28,988 | $34,561 | $50,251 | $79,863 | $98,411 | $132,529 |
| 1 | Calculated based upon average shares outstanding |
| 2 | Total return calculations do not include any sales charges. Returns for periods of less than one year are not annualized. |
The accompanying notes are an integral part of these financial statements.
68 | Allspring Municipal Bond Fund
Financial highlights
(For a share outstanding throughout each period)
| | | Year ended June 30 |
| Class R6 | Six months ended
December 31, 2022
(unaudited) | 2022 | 2021 | 2020 | 2019 1 |
Net asset value, beginning of period
| $9.70 | $10.83 | $10.55 | $10.55 | $10.21 |
Net investment income
| 0.14 | 0.26 | 0.28 | 0.29 | 0.30 |
Net realized and unrealized gains (losses) on investments
| (0.11) | (1.13) | 0.28 | 0.01 | 0.34 |
Total from investment operations
| 0.03 | (0.87) | 0.56 | 0.30 | 0.64 |
| Distributions to shareholders from | | | | | |
Net investment income
| (0.14) | (0.26) | (0.28) | (0.29) | (0.30) |
Net realized gains
| 0.00 | 0.00 | 0.00 | (0.01) | 0.00 |
Total distributions to shareholders
| (0.14) | (0.26) | (0.28) | (0.30) | (0.30) |
Net asset value, end of period
| $9.59 | $9.70 | $10.83 | $10.55 | $10.55 |
Total return2
| 0.35% | (8.14)% | 5.33% | 2.90% | 6.43% |
| Ratios to average net assets (annualized) | | | | | |
Gross expenses
| 0.39% | 0.39% | 0.39% | 0.39% | 0.40% |
Net expenses
| 0.39% | 0.39% | 0.39% | 0.39% | 0.40% |
Net investment income
| 2.97% | 2.55% | 2.58% | 2.76% | 3.16% |
| Supplemental data | | | | | |
Portfolio turnover rate
| 5% | 18% | 16% | 24% | 20% |
Net assets, end of period (000s omitted)
| $699,667 | $612,487 | $373,876 | $276,204 | $72,655 |
| 1 | For the period from July 31, 2018 (commencement of class operations) to June 30, 2019 |
| 2 | Returns for periods of less than one year are not annualized. |
The accompanying notes are an integral part of these financial statements.
Allspring Municipal Bond Fund | 69
Financial highlights
(For a share outstanding throughout each period)
| | | Year ended June 30 |
| Administrator Class | Six months ended
December 31, 2022
(unaudited) | 2022 | 2021 | 2020 | 2019 | 2018 |
Net asset value, beginning of period
| $9.70 | $10.84 | $10.56 | $10.55 | $10.21 | $10.25 |
Net investment income
| 0.13 | 0.24 | 0.25 | 0.27 | 0.31 1 | 0.33 1 |
Net realized and unrealized gains (losses) on investments
| (0.10) | (1.14) | 0.28 | 0.02 | 0.34 | (0.02) |
Total from investment operations
| 0.03 | (0.90) | 0.53 | 0.29 | 0.65 | 0.31 |
| Distributions to shareholders from | | | | | | |
Net investment income
| (0.13) | (0.24) | (0.25) | (0.27) | (0.31) | (0.33) |
Net realized gains
| 0.00 | 0.00 | 0.00 | (0.01) | 0.00 | (0.02) |
Total distributions to shareholders
| (0.13) | (0.24) | (0.25) | (0.28) | (0.31) | (0.35) |
Net asset value, end of period
| $9.60 | $9.70 | $10.84 | $10.56 | $10.55 | $10.21 |
Total return2
| 0.35% | (8.42)% | 5.10% | 2.78% | 6.51% | 3.13% |
| Ratios to average net assets (annualized) | | | | | | |
Gross expenses
| 0.71% | 0.71% | 0.71% | 0.71% | 0.72% | 0.73% |
Net expenses
| 0.60% | 0.60% | 0.60% | 0.60% | 0.60% | 0.60% |
Net investment income
| 2.74% | 2.31% | 2.37% | 2.54% | 3.02% | 3.27% |
| Supplemental data | | | | | | |
Portfolio turnover rate
| 5% | 18% | 16% | 24% | 20% | 19% |
Net assets, end of period (000s omitted)
| $1,050,832 | $1,034,623 | $1,000,652 | $1,017,781 | $832,318 | $227,116 |
| 1 | Calculated based upon average shares outstanding |
| 2 | Returns for periods of less than one year are not annualized. |
The accompanying notes are an integral part of these financial statements.
70 | Allspring Municipal Bond Fund
Financial highlights
(For a share outstanding throughout each period)
| | | Year ended June 30 |
| Institutional Class | Six months ended
December 31, 2022
(unaudited) | 2022 | 2021 | 2020 | 2019 | 2018 |
Net asset value, beginning of period
| $9.70 | $10.83 | $10.55 | $10.55 | $10.21 | $10.24 |
Net investment income
| 0.14 | 0.26 | 0.27 | 0.29 | 0.33 | 0.35 |
Net realized and unrealized gains (losses) on investments
| (0.11) | (1.13) | 0.28 | 0.01 | 0.34 | (0.01) |
Total from investment operations
| 0.03 | (0.87) | 0.55 | 0.30 | 0.67 | 0.34 |
| Distributions to shareholders from | | | | | | |
Net investment income
| (0.14) | (0.26) | (0.27) | (0.29) | (0.33) | (0.35) |
Net realized gains
| 0.00 | 0.00 | 0.00 | (0.01) | 0.00 | (0.02) |
Total distributions to shareholders
| (0.14) | (0.26) | (0.27) | (0.30) | (0.33) | (0.37) |
Net asset value, end of period
| $9.59 | $9.70 | $10.83 | $10.55 | $10.55 | $10.21 |
Total return1
| 0.33% | (8.19)% | 5.28% | 2.85% | 6.67% | 3.37% |
| Ratios to average net assets (annualized) | | | | | | |
Gross expenses
| 0.44% | 0.44% | 0.44% | 0.44% | 0.45% | 0.46% |
Net expenses
| 0.44% | 0.44% | 0.44% | 0.44% | 0.45% | 0.46% |
Net investment income
| 2.91% | 2.47% | 2.53% | 2.71% | 3.15% | 3.40% |
| Supplemental data | | | | | | |
Portfolio turnover rate
| 5% | 18% | 16% | 24% | 20% | 19% |
Net assets, end of period (000s omitted)
| $3,014,342 | $2,735,568 | $3,043,109 | $3,006,622 | $2,862,588 | $1,425,703 |
| 1 | Returns for periods of less than one year are not annualized. |
The accompanying notes are an integral part of these financial statements.
Allspring Municipal Bond Fund | 71
Notes to financial statements (unaudited)
1. ORGANIZATION
Allspring Funds Trust (the "Trust"), a Delaware statutory trust organized on March 10, 1999, is an open-end management investment company registered under the Investment Company Act of 1940, as amended (the "1940 Act"). As an investment company, the Trust follows the accounting and reporting guidance in Financial Accounting Standards Board ("FASB") Accounting Standards Codification Topic 946, Financial Services – Investment Companies. These financial statements report on the Allspring Municipal Bond Fund (the "Fund") which is a diversified series of the Trust.
2. SIGNIFICANT ACCOUNTING POLICIES
The following significant accounting policies, which are consistently followed in the preparation of the financial statements of the Fund, are in conformity with U.S. generally accepted accounting principles which require management to make estimates and assumptions that affect the reported amounts of assets and liabilities, disclosure of contingent assets and liabilities at the date of the financial statements, and the reported amounts of income and expenses during the reporting period. Actual results could differ from those estimates.
Securities valuation
All investments are valued each business day as of the close of regular trading on the New York Stock Exchange (generally 4 p.m. Eastern Time), although the Fund may deviate from this calculation time under unusual or unexpected circumstances.
Debt securities are valued at the evaluated bid price provided by an independent pricing service (e.g. taking into account various factors, including yields, maturities, or credit ratings) or, if a reliable price is not available, the quoted bid price from an independent broker-dealer.
Futures contracts that are listed on a foreign or domestic exchange or market are valued at the official closing price or, if none, the last sales price.
Investments in registered open-end investment companies (other than those listed on a foreign or domestic exchange or market) are valued at net asset value.
Investments which are not valued using the methods discussed above are valued at their fair value, as determined in good faith by Allspring Funds Management, LLC ("Allspring Funds Management"), which was named the valuation designee by the Board of Trustees. As the valuation designee, Allspring Funds Management is responsible for day-to-day valuation activities for the Allspring Funds. In connection with these responsibilities, Allspring Funds Management has established a Valuation Committee and has delegated to it the authority to take any actions regarding the valuation of portfolio securities that the Valuation Committee deems necessary or appropriate, including determining the fair value of portfolio securities. On a quarterly basis, the Board of Trustees receives reports of valuation actions taken by the Valuation Committee. On at least an annual basis, the Board of Trustees receives an assessment of the adequacy and effectiveness of Allspring Funds Management's process for determining the fair value of the portfolio of investments.
When-issued transactions
The Fund may purchase securities on a forward commitment or when-issued basis. The Fund records a when-issued transaction on the trade date and will segregate assets in an amount at least equal in value to the Fund's commitment to purchase when-issued securities. Securities purchased on a when-issued basis are marked-to-market daily and the Fund begins earning interest on the settlement date. Losses may arise due to changes in the market value of the underlying securities or if the counterparty does not perform under the contract.
Futures contracts
Futures contracts are agreements between the Fund and a counterparty to buy or sell a specific amount of a commodity, financial instrument or currency at a specified price on a specified date. The Fund may buy and sell futures contracts in order to gain exposure to, or protect against, changes in interest rates and is subject to interest rate risk. The primary risks associated with the use of futures contracts are the imperfect correlation between changes in market values of securities held by the Fund and the prices of futures contracts, and the possibility of an illiquid market. Futures contracts are generally entered into on a regulated futures exchange and cleared through a clearinghouse associated with the exchange. With futures contracts, there is minimal counterparty risk to the Fund since futures contracts are exchange traded and the exchange’s clearinghouse, as the counterparty to all exchange-traded futures, guarantees the futures contracts against default.
Upon entering into a futures contract, the Fund is required to deposit either cash or securities (initial margin) with the broker in an amount equal to a certain percentage of the contract value. Subsequent payments (variation margin) are paid to or from the broker each day equal to the daily changes in the contract value. Such payments are recorded as unrealized gains or losses and, if any, shown as variation margin receivable (payable) in the Statement of Assets and Liabilities. Should the Fund fail to make
72 | Allspring Municipal Bond Fund
Notes to financial statements (unaudited)
requested variation margin payments, the broker can gain access to the initial margin to satisfy the Fund’s payment obligations. When the contracts are closed, a realized gain or loss is recorded in the Statement of Operations.
Security transactions and income recognition
Securities transactions are recorded on a trade date basis. Realized gains or losses are recorded on the basis of identified cost.
Interest income is accrued daily and bond discounts are accreted and premiums are amortized daily. To the extent debt obligations are placed on non-accrual status, any related interest income may be reduced by writing off interest receivables when the collection of all or a portion of interest has been determined to be doubtful based on consistently applied procedures and the fair value has decreased. If the issuer subsequently resumes interest payments or when the collectability of interest is reasonably assured, the debt obligation is removed from non-accrual status.
Distributions to shareholders
Distributions to shareholders from net investment income are declared daily and paid monthly. Distributions from net realized gains, if any, are recorded on the ex-dividend date and paid at least annually. Such distributions are determined in accordance with income tax regulations and may differ from U.S. generally accepted accounting principles. Dividend sources are estimated at the time of declaration. The tax character of distributions is determined as of the Fund's fiscal year end. Therefore, a portion of the Fund's distributions made prior to the Fund’s fiscal year end may be categorized as a tax return of capital at year end.
Federal and other taxes
The Fund intends to continue to qualify as a regulated investment company by distributing substantially all of its investment company taxable and tax-exempt income and any net realized capital gains (after reduction for capital loss carryforwards) sufficient to relieve it from all, or substantially all, federal income taxes. Accordingly, no provision for federal income taxes was required.
The Fund’s income and federal excise tax returns and all financial records supporting those returns for the prior three fiscal years are subject to examination by the federal and Delaware revenue authorities. Management has analyzed the Fund's tax positions taken on federal, state, and foreign tax returns, as applicable, for all open tax years and does not believe that there are any uncertain tax positions that require recognition of a tax liability.
As of December 31, 2022, the aggregate cost of all investments for federal income tax purposes was $5,988,734,005 and the unrealized gains (losses) consisted of:
| Gross unrealized gains | $ 101,636,527 |
| Gross unrealized losses | (507,995,918) |
| Net unrealized losses | $(406,359,391) |
As of June 30, 2022, the Fund had capital loss carryforwards which consisted of $54,955,260 in short-term capital losses and $11,485,708 in long-term capital losses.
Class allocations
The separate classes of shares offered by the Fund differ principally in applicable sales charges, distribution, shareholder servicing, and administration fees. Class specific expenses are charged directly to that share class. Investment income, common fund-level expenses, and realized and unrealized gains (losses) on investments are allocated daily to each class of shares based on the relative proportion of net assets of each class.
Allspring Municipal Bond Fund | 73
Notes to financial statements (unaudited)
3. FAIR VALUATION MEASUREMENTS
Fair value measurements of investments are determined within a framework that has established a fair value hierarchy based upon the various data inputs utilized in determining the value of the Fund’s investments. The three-level hierarchy gives the highest priority to unadjusted quoted prices in active markets for identical assets or liabilities (Level 1) and the lowest priority to unobservable inputs (Level 3). The Fund’s investments are classified within the fair value hierarchy based on the lowest level of input that is significant to the fair value measurement. The inputs are summarized into three broad levels as follows:
| ■ | Level 1 – quoted prices in active markets for identical securities |
| ■ | Level 2 – other significant observable inputs (including quoted prices for similar securities, interest rates, prepayment speeds, credit risk, etc.) |
| ■ | Level 3 – significant unobservable inputs (including the Fund’s own assumptions in determining the fair value of investments) |
The inputs or methodologies used for valuing investments in securities are not necessarily an indication of the risk associated with investing in those securities.
The following is a summary of the inputs used in valuing the Fund’s assets and liabilities as of December 31, 2022:
| | Quoted prices
(Level 1) | Other significant
observable inputs
(Level 2) | Significant
unobservable inputs
(Level 3) | Total |
| Assets | | | | |
| Investments in: | | | | |
| Closed end municipal bond fund obligations | $ 0 | $ 42,000,000 | $0 | $ 42,000,000 |
| Municipal obligations | 0 | 5,536,052,275 | 0 | 5,536,052,275 |
| Short-term investments | | | | |
| Investment companies | 4,322,339 | 0 | 0 | 4,322,339 |
| Total assets | $4,322,339 | $5,578,052,275 | $0 | $5,582,374,614 |
Additional sector, industry or geographic detail, if any, is included in the Portfolio of Investments.
For the six months ended December 31, 2022, the Fund did not have any transfers into/out of Level 3.
4. TRANSACTIONS WITH AFFILIATES
Management fee
Allspring Funds Management, a wholly owned subsidiary of Allspring Global Investments Holdings, LLC, a holding company indirectly owned by certain private funds of GTCR LLC and Reverence Capital Partners, L.P., is the manager of the Fund and provides advisory and fund-level administrative services under an investment management agreement. Under the investment management agreement, Allspring Funds Management is responsible for, among other services, implementing the investment objectives and strategies of the Fund, supervising the subadviser and providing fund-level administrative services in connection with the Fund’s operations. As compensation for its services under the investment management agreement, Allspring Funds Management is entitled to receive a management fee at the following annual rate based on the Fund’s average daily net assets:
| Average daily net assets | Management fee |
| First $500 million | 0.400% |
| Next $500 million | 0.375 |
| Next $2 billion | 0.350 |
| Next $2 billion | 0.325 |
| Next $5 billion | 0.290 |
| Over $10 billion | 0.280 |
For the six months ended December 31, 2022, the management fee was equivalent to an annual rate of 0.34% of the Fund’s average daily net assets.
74 | Allspring Municipal Bond Fund
Notes to financial statements (unaudited)
Allspring Funds Management has retained the services of a subadviser to provide daily portfolio management to the Fund. The fee for subadvisory services is borne by Allspring Funds Management. Allspring Global Investments, LLC, an affiliate of Allspring Funds Management and a wholly owned subsidiary of Allspring Global Investments Holdings, LLC, is the subadviser to the Fund and is entitled to receive a fee from Allspring Funds Management at an annual rate starting at 0.20% and declining to 0.10% as the average daily net assets of the Fund increase.
Administration fees
Under a class-level administration agreement, Allspring Funds Management provides class-level administrative services to the Fund, which includes paying fees and expenses for services provided by the transfer agent, sub-transfer agents, omnibus account servicers and record-keepers. As compensation for its services under the class-level administration agreement, Allspring Funds Management receives an annual fee which is calculated based on the average daily net assets of each class as follows:
| | Class-level
administration fee |
| Class A | 0.16% |
| Class C | 0.16 |
| Class R6 | 0.03 |
| Administrator Class | 0.10 |
| Institutional Class | 0.08 |
Waivers and/or expense reimbursements
Allspring Funds Management has contractually committed to waive and/or reimburse management and administration fees to the extent necessary to maintain certain net operating expense ratios for the Fund. When each class of the Fund has exceeded its expense cap, Allspring Funds Management will waive fees and/or reimburse expenses from fund-level expenses on a proportionate basis and then from class specific expenses. When only certain classes exceed their expense caps, waivers and/or reimbursements are applied against class specific expenses before fund-level expenses. Allspring Funds Management has contractually committed through October 31, 2023 to waive fees and/or reimburse expenses to the extent necessary to cap expenses. Prior to or after the commitment expiration date, the caps may be increased or the commitment to maintain the caps may be terminated only with the approval of the Board of Trustees. As of December 31, 2022, the contractual expense caps are as follows:
| | Expense ratio caps |
| Class A | 0.75% |
| Class C | 1.50 |
| Class R6 | 0.40 |
| Administrator Class | 0.60 |
| Institutional Class | 0.45 |
Distribution fee
The Trust has adopted a distribution plan for Class C shares pursuant to Rule 12b-1 under the 1940 Act. A distribution fee is charged to Class C shares and paid to Allspring Funds Distributor, LLC ("Allspring Funds Distributor"), the principal underwriter, an affiliate of Allspring Funds Management, at an annual rate up to 0.75% of the average daily net assets of Class C shares.
In addition, Allspring Funds Distributor is entitled to receive the front-end sales charge from the purchase of Class A shares and a contingent deferred sales charge on the redemption of certain Class A shares. Allspring Funds Distributor is also entitled to receive the contingent deferred sales charges from redemptions of Class C shares. For the six months ended December 31, 2022, Allspring Funds Distributor received $6,330 from the sale of Class A shares. No contingent deferred sales charges were incurred by Class A and Class C shares for the six months ended December 31, 2022.
Allspring Municipal Bond Fund | 75
Notes to financial statements (unaudited)
Shareholder servicing fees
The Trust has entered into contracts with one or more shareholder servicing agents, whereby Class A, Class C and Administrator Class are charged a fee at an annual rate up to 0.25% of the average daily net assets of each respective class. A portion of these total shareholder servicing fees were paid to affiliates of the Fund.
Interfund transactions
The Fund may purchase or sell portfolio investment securities to certain affiliates pursuant to Rule 17a-7 under the 1940 Act and under procedures adopted by the Board of Trustees. The procedures have been designed to ensure that these interfund transactions, which do not incur broker commissions, are effected at current market prices. Pursuant to these procedures, the Fund had $220,530,000, $165,495,000 and $0 in interfund purchases, sales and net realized gains (losses), respectively, during the six months ended December 31, 2022.
5. INVESTMENT PORTFOLIO TRANSACTIONS
Purchases and sales of investments, excluding U.S. government obligations (if any) and short-term securities, for the six months ended December 31, 2022 were $688,855,310 and $252,047,451, respectively.
6. BANK BORROWINGS
The Trust (excluding the money market funds), Allspring Master Trust and Allspring Variable Trust are parties to a $350,000,000 revolving credit agreement whereby the Fund is permitted to use bank borrowings for temporary or emergency purposes, such as to fund shareholder redemption requests. Interest under the credit agreement is charged to the Fund based on a borrowing rate equal to the higher of the Federal Funds rate or the overnight bank funding rate in effect on that day plus a spread. In addition, an annual commitment fee equal based on the unused balance is allocated to each participating fund.
For the six months ended December 31, 2022, there were no borrowings by the Fund under the agreement.
7. MARKET RISKS
On March 11, 2020, the World Health Organization announced that it had made the assessment that coronavirus disease 2019 (“COVID-19”) is a pandemic. The impacts of COVID-19 are affecting the entire global economy, individual companies and investment products, the funds, and the market in general. There is significant uncertainty around the extent and duration of business disruptions related to COVID-19 and the impacts may last for an extended period of time. COVID-19 has led to significant uncertainty and volatility in the financial markets.
8. INDEMNIFICATION
Under the Fund's organizational documents, the officers and Trustees have been granted certain indemnification rights against certain liabilities that may arise out of performance of their duties to the Fund. The Fund has entered into a separate agreement with each Trustee that converts indemnification rights currently existing under the Fund’s organizational documents into contractual rights that cannot be changed in the future without the consent of the Trustee. Additionally, in the normal course of business, the Fund may enter into contracts with service providers that contain a variety of indemnification clauses. The Fund’s maximum exposure under these arrangements is dependent on future claims that may be made against the Fund and, therefore, cannot be estimated.
76 | Allspring Municipal Bond Fund
Other information (unaudited)
PROXY VOTING INFORMATION
A description of the policies and procedures used to determine how to vote proxies relating to portfolio securities is available without charge, upon request, by calling 1-800-222-8222, visiting our website at allspringglobal.com, or visiting the SEC website at sec.gov. Information regarding how the proxies related to portfolio securities were voted during the most recent 12-month period ended June 30 is available on the website at allspringglobal.com or by visiting the SEC website at sec.gov.
QUARTERLY PORTFOLIO HOLDINGS INFORMATION
The Fund files its complete schedule of portfolio holdings with the SEC for the first and third quarters of each fiscal year as an exhibit to its reports on Form N-PORT. Shareholders may view the filed Form N-PORT by visiting the SEC website at sec.gov.
Allspring Municipal Bond Fund | 77
Other information (unaudited)
BOARD OF TRUSTEES AND OFFICERS
Each of the Trustees and Officers listed in the table below acts in identical capacities for each fund in the Allspring family of funds, which consists of 127 mutual funds comprising the Allspring Funds Trust, Allspring Variable Trust, Allspring Master Trust and four closed-end funds (collectively the “Fund Complex”). This table should be read in conjunction with the Prospectus and the Statement of Additional Information1. The mailing address of each Trustee and Officer is 1415 Vantage Park Drive, 3rd Floor, Charlotte, NC 28203. Each Trustee and Officer serves an indefinite term, however, each Trustee serves such term until reaching the mandatory retirement age established by the Trustees.
Independent Trustees
Name and
year of birth | Position held and
length of service* | Principal occupations during past five years or longer | Current other
public company or
investment
company
directorships |
William R. Ebsworth
(Born 1957) | Trustee,
since 2015 | Retired. From 1984 to 2013, equities analyst, portfolio manager, research director and chief investment officer at Fidelity Management and Research Company in Boston, Tokyo, and Hong Kong, and retired in 2013 as Chief Investment Officer of Fidelity Strategic Advisers, Inc. where he led a team of investment professionals managing client assets. Prior thereto, Board member of Hong Kong Securities Clearing Co., Hong Kong Options Clearing Corp., the Thailand International Fund, Ltd., Fidelity Investments Life Insurance Company, and Empire Fidelity Investments Life Insurance Company. Audit Committee Chair and Investment Committee Chair of the Vincent Memorial Hospital Foundation (non-profit organization). Mr. Ebsworth is a CFA® charterholder. | N/A |
Jane A. Freeman
(Born 1953) | Trustee,
since 2015;
Chair Liaison,
since 2018 | Retired. From 2012 to 2014 and 1999 to 2008, Chief Financial Officer of Scientific Learning Corporation. From 2008 to 2012, Ms. Freeman provided consulting services related to strategic business projects. Prior to 1999, Portfolio Manager at Rockefeller & Co. and Scudder, Stevens & Clark. Board member of the Harding Loevner Funds from 1996 to 2014, serving as both Lead Independent Director and chair of the Audit Committee. Board member of the Russell Exchange Traded Funds Trust from 2011 to 2012 and the chair of the Audit Committee. Ms. Freeman is also an inactive Chartered Financial Analyst. | N/A |
Isaiah Harris, Jr.
(Born 1952) | Trustee,
since 2009; Audit
Committee
Chair,
since 2019 | Retired. Member of the Advisory Board of CEF of East Central Florida. Chairman of the Board of CIGNA Corporation from 2009 to 2021, and Director from 2005 to 2008. From 2003 to 2011, Director of Deluxe Corporation. Prior thereto, President and CEO of BellSouth Advertising and Publishing Corp. from 2005 to 2007, President and CEO of BellSouth Enterprises from 2004 to 2005 and President of BellSouth Consumer Services from 2000 to 2003. Emeritus member of the Iowa State University Foundation Board of Governors. Emeritus Member of the Advisory Board of Iowa State University School of Business. Advisory Board Member, Palm Harbor Academy (private school). Advisory Board Member, Fellowship of Christian Athletes. Mr. Harris is a certified public accountant (inactive status). | N/A |
David F. Larcker
(Born 1950) | Trustee,
since 2009 | Distinguished Visiting Fellow at the Hoover Institution since 2022. James Irvin Miller Professor of Accounting at the Graduate School of Business (Emeritus), Stanford University, Director of the Corporate Governance Research Initiative and Senior Faculty of The Rock Center for Corporate Governance since 2006. From 2005 to 2008, Professor of Accounting at the Graduate School of Business, Stanford University. Prior thereto, Ernst & Young Professor of Accounting at The Wharton School, University of Pennsylvania from 1985 to 2005. | N/A |
78 | Allspring Municipal Bond Fund
Other information (unaudited)
Name and
year of birth | Position held and
length of service* | Principal occupations during past five years or longer | Current other
public company or
investment
company
directorships |
Olivia S. Mitchell
(Born 1953) | Trustee,
since 2006;
Nominating and
Governance
Committee Chair,
since 2018 | International Foundation of Employee Benefit Plans Professor since 1993, Wharton School of the University of Pennsylvania. Director of Wharton’s Pension Research Council and Boettner Center on Pensions & Retirement Research, and Research Associate at the National Bureau of Economic Research. Previously taught at Cornell University from 1978 to 1993. | N/A |
Timothy J. Penny
(Born 1951) | Trustee,
since 1996;
Chair,
since 2018 | President and Chief Executive Officer of Southern Minnesota Initiative Foundation, a non-profit organization, since 2007. Vice Chair of the Economic Club of Minnesota, since 2007. Co-Chair of the Committee for a Responsible Federal Budget, since 1995. Member of the Board of Trustees of NorthStar Education Finance, Inc., a non-profit organization, from 2007-2022. Senior Fellow of the University of Minnesota Humphrey Institute from 1995 to 2017. | N/A |
James G. Polisson
(Born 1959) | Trustee,
since 2018 | Retired. Chief Marketing Officer, Source (ETF) UK Services, Ltd, from 2015 to 2017. From 2012 to 2015, Principal of The Polisson Group, LLC, a management consulting, corporate advisory and principal investing company. Chief Executive Officer and Managing Director at Russell Investments, Global Exchange Traded Funds from 2010 to 2012. Managing Director of Barclays Global Investors from 1998 to 2010 and Global Chief Marketing Officer for iShares and Barclays Global Investors from 2000 to 2010. Trustee of the San Francisco Mechanics’ Institute, a non-profit organization, from 2013 to 2015. Board member of the Russell Exchange Traded Fund Trust from 2011 to 2012. Director of Barclays Global Investors Holdings Deutschland GmbH from 2006 to 2009. Mr. Polisson is an attorney and has a retired status with the Massachusetts and District of Columbia Bar Associations. | N/A |
Pamela Wheelock
(Born 1959) | Trustee,
since January
2020; previously
Trustee from
January 2018 to
July 2019 | Retired. Executive and Senior Financial leadership positions in the public, private and nonprofit sectors. Interim President and CEO, McKnight Foundation, 2020. Interim Commissioner, Minnesota Department of Human Services, 2019. Chief Operating Officer, Twin Cities Habitat for Humanity, 2017-2019. Vice President for University Services, University of Minnesota, 2012-2016. Interim President and CEO, Blue Cross and Blue Shield of Minnesota, 2011-2012. Executive Vice-President and Chief Financial Officer, Minnesota Wild, 2002-2008. Commissioner, Minnesota Department of Finance, 1999-2002. Chair of the Board of Directors of Destination Medical Center Corporation. Board member of the Minnesota Wild Foundation. | N/A |
* Length of service dates reflect the Trustee’s commencement of service with the Trust’s predecessor entities, where applicable.
Allspring Municipal Bond Fund | 79
Other information (unaudited)
Officers2
Name and
year of birth | Position held and
length of service | Principal occupations during past five years or longer |
Andrew Owen
(Born 1960) | President,
since 2017 | President and Chief Executive Officer of Allspring Funds Management, LLC since 2017 and Head of Global Fund Governance of Allspring Global Investments since 2022. Prior thereto, co-president of Galliard Capital Management, LLC, an affiliate of Allspring Funds Management, LLC, from 2019 to 2022 and Head of Affiliated Managers, Allspring Global Investments, from 2014 to 2019 and Executive Vice President responsible for marketing, investments and product development for Allspring Funds Management, LLC, from 2009 to 2014. |
Jeremy DePalma
(Born 1974) | Treasurer,
since 2012
(for certain funds in
the Fund Complex);
since 2021 (for
the remaining funds in the
Fund Complex) | Senior Vice President of Allspring Funds Management, LLC since 2009. Senior Vice President of Evergreen Investment Management Company, LLC from 2008 to 2010 and head of the Fund Reporting and Control Team within Fund Administration from 2005 to 2010. |
Christopher Baker
(Born 1976) | Chief Compliance Officer, since 2022 | Global Chief Compliance Officer for Allspring Global Investments since 2022. Prior thereto, Chief Compliance Officer for State Street Global Advisors from 2018 to 2021. Senior Compliance Officer for the State Street divisions of Alternative Investment Solutions, Sector Solutions, and Global Marketing from 2015 to 2018. From 2010 to 2015 Vice President, Global Head of Investment and Marketing Compliance for State Street Global Advisors. |
Matthew Prasse
(Born 1983) | Chief Legal Officer, since 2022; Secretary, since 2021 | Senior Counsel of the Allspring Legal Department since 2021. Senior Counsel of the Wells Fargo Legal Department from 2018 to 2021. Previously, Counsel for Barings LLC from 2015 to 2018. Prior to joining Barings, Associate at Morgan, Lewis & Bockius LLP from 2008 to 2015. |
1 The Statement of Additional Information includes additional information about the Trustees and is available, without charge, upon request, by calling 1-800-222-8222 or by visiting the website at allspringglobal.com.
2 For those Officers with tenures at Allspring Global Investments and/or Allspring Funds Management, LLC that began prior to 2021, such tenures include years of service during which these businesses/entities were known as Wells Fargo Asset Management and Wells Fargo Funds Management, LLC, respectively.
80 | Allspring Municipal Bond Fund
For more information
More information about Allspring Funds is available free upon request. To obtain literature, please write, visit the Fund's website, or call:
Allspring Funds
P.O. Box 219967
Kansas City, MO 64121-9967
Website: allspringglobal.com
Individual investors: 1-800-222-8222
Retail investment professionals: 1-888-877-9275
Institutional investment professionals: 1-800-260-5969
This report and the financial statements contained herein are submitted for the general information of the shareholders of the Fund. If this report is used for promotional purposes, distribution of the report must be accompanied or preceded by a current prospectus. Before investing, please consider the investment objectives, risks, charges, and expenses of the investment. For a current prospectus and, if available, a summary prospectus, containing this information, call
1-800-222-8222 or visit the Fund's website at allspringglobal.com. Read the prospectus carefully before you invest or send money.
Allspring Global InvestmentsTM is the trade name for the asset management firms of Allspring Global Investments Holdings, LLC, a holding company indirectly owned by certain private funds of GTCR LLC and Reverence Capital Partners, L.P. These firms include but are not limited to Allspring Global Investments, LLC, and Allspring Funds Management, LLC. Certain products managed by Allspring entities are distributed by Allspring Funds Distributor, LLC (a broker-dealer and Member FINRA/SIPC).
This material is for general informational and educational purposes only and is NOT intended to provide investment advice or a recommendation of any kind - including a recommendation for any specific investment, strategy, or plan.
© 2023 Allspring Global Investments Holdings, LLC. All rights reserved.
ALL-01092023-uf7uyo7p 02-23
SAR3317 12-22
Semi-Annual Report
December 31, 2022
Allspring
Municipal Sustainability Fund
The views expressed and any forward-looking statements are as of December 31, 2022, unless otherwise noted, and are those of the Fund's portfolio managers and/or Allspring Global Investments. Discussions of individual securities or the markets generally are not intended as individual recommendations. Future events or results may vary significantly from those expressed in any forward-looking statements. The views expressed are subject to change at any time in response to changing circumstances in the market. Allspring Global Investments disclaims any obligation to publicly update or revise any views expressed or forward-looking statements.
Allspring Municipal Sustainability Fund | 1
Letter to shareholders (unaudited)
Andrew Owen
President
Allspring Funds
Dear Shareholder:
We are pleased to offer you this semi-annual report for the Allspring Municipal Sustainability Fund for the six-month period that ended December 31, 2022. Globally, stocks and bonds experienced heightened volatility and generally negative returns through the challenging period. Earlier tailwinds provided by global stimulus programs, vaccination rollouts, and recovering consumer and corporate sentiment were wiped away by the highest rate of inflation in four decades, the impact of ongoing aggressive central bank rate hikes and the prospect of more rate hikes. Compounding these concerns were the global reverberations of the Russia-Ukraine war and the impact of China’s strict COVID-19 lockdowns.
For the six-month period, stocks and bonds had mixed results, with emerging market equities trailing those of developed markets and both U.S. and non-U.S. bonds fighting an uphill battle in the face of sustained interest rate increases. For the period, U.S. stocks, based on the S&P 500 Index,1 gained 2.31%. International stocks, as measured by the MSCI ACWI ex USA Index (Net),2 returned 2.96%, while the MSCI EM Index (Net) (USD)3 declined 2.99%. Among bond indexes, the Bloomberg U.S. Aggregate Bond Index4 returned -2.97%, the Bloomberg Global Aggregate ex-USD Index (unhedged)5 returned -2.65%, the Bloomberg Municipal Bond Index6 gained 0.50%, and the ICE BofA U.S. High Yield Index7 returned 3.33%.
Persistent inflation and economic fallout from the Russia-Ukraine war drove markets.
Markets rebounded from earlier losses in July, led by U.S. stocks. While evidence pointed to an economic slowdown after two consecutive quarters of declining gross domestic product (economic contraction), the U.S. labor market remained surprisingly strong: July nonfarm payrolls grew by more than 500,000 and U.S. unemployment dipped to 3.5%. Meanwhile, crude oil and retail gasoline prices, major contributors to recent overall inflation, fell substantially from earlier highs. And while U.S. home prices rose, sales fell as houses became less affordable with mortgage rates at a 13-year high. The Federal Reserve (Fed) raised the federal funds rate another 0.75% in July—to a range of 2.25% to 2.50%—and forecasts pointed to further rate hikes.
| 1 | The S&P 500 Index consists of 500 stocks chosen for market size, liquidity, and industry group representation. It is a market-value-weighted index with each stock's weight in the index proportionate to its market value. You cannot invest directly in an index. |
| 2 | The Morgan Stanley Capital International (MSCI) All Country World Index (ACWI) ex USA Index (Net) is a free-float-adjusted market-capitalization-weighted index that is designed to measure the equity market performance of developed and emerging markets, excluding the U.S. Source: MSCI. MSCI makes no express or implied warranties or representations and shall have no liability whatsoever with respect to any MSCI data contained herein. The MSCI data may not be further redistributed or used as a basis for other indexes or any securities or financial products. This report is not approved, reviewed, or produced by MSCI. You cannot invest directly in an index. |
| 3 | The MSCI Emerging Markets (EM) Index (Net) (USD) is a free-float-adjusted market-capitalization-weighted index that is designed to measure equity market performance of emerging markets. You cannot invest directly in an index. |
| 4 | The Bloomberg U.S. Aggregate Bond Index is a broad-based benchmark that measures the investment-grade, U.S.-dollar-denominated, fixed-rate taxable bond market, including Treasuries, government-related and corporate securities, mortgage-backed securities (agency fixed-rate and hybrid adjustable-rate mortgage pass-throughs), asset-backed securities, and commercial mortgage-backed securities. You cannot invest directly in an index. |
| 5 | The Bloomberg Global Aggregate ex-USD Index (unhedged) is an unmanaged index that provides a broad-based measure of the global investment-grade fixed-income markets excluding the U.S.-dollar-denominated debt market. You cannot invest directly in an index. |
| 6 | The Bloomberg Municipal Bond Index is an unmanaged index composed of long-term tax-exempt bonds with a minimum credit rating of Baa. You cannot invest directly in an index. |
| 7 | The ICE BofA U.S. High Yield Index is a market-capitalization-weighted index of domestic and Yankee high-yield bonds. The index tracks the performance of high-yield securities traded in the U.S. bond market. You cannot invest directly in an index. Copyright 2023. ICE Data Indices, LLC. All rights reserved. |
2 | Allspring Municipal Sustainability Fund
Letter to shareholders (unaudited)
August was yet another broadly challenging month for financial markets, with more red ink flowing. High inflation persisted, cresting 9% in the eurozone on an annual basis and remaining above 8% in the U.S. despite the Fed’s aggressive monetary policy and a major drop in global crude oil and gasoline prices from their June peak. One positive note was the resilience of the U.S. job market. However, the Fed’s job was clearly not complete. One longer-term bright spot was the U.S. Congress’s passage of the Inflation Reduction Act. Its primary stated goals include: to reduce inflation (though not immediately) by curbing the deficit, capping health care spending by seniors, and investing in domestic sources of clean energy.
The market misery continued in September. There was nowhere to hide as all asset classes suffered major losses at the hands of persistent inflation. Central banks kept up their battle against rapidly rising prices with more rate hikes. The strength of the U.S. dollar made things even more difficult for investors holding assets in other currencies. U.S. mortgage rates jumped to near 7% on 30-year fixed-rate mortgages; the decreased housing affordability began to cool demand somewhat. The U.K. experienced a sharp sell-off of government bonds and the British pound in September as investors panicked in response to a new government budget that was seen as financially unsound. The market meltdown forced the Bank of England to step in and buy long-dated government bonds.
Equities had a reprieve in October after two months of sharp declines. Value stocks and small caps fared best. Globally, developed markets outpaced emerging market equities, which were hurt by weakness among Chinese stocks. Central banks continued to try to curtail high inflation with aggressive interest rate hikes. Geopolitical risks persisted, including the ongoing Russia-Ukraine war and economic, financial market, and political turmoil in the U.K., which led to a second prime ministerial change in six weeks, as Rishi Sunak replaced Liz Truss in late October. Concerns over Europe’s energy crisis eased thanks to unseasonably warm weather and plentiful gas on hand. The U.S. labor market continued its resilience against rising prices, as unemployment stood at 3.7%, near a record low.
Stocks and bonds rallied in November, with emerging market equities gaining nearly 15% and developed market equities returning 7%. The S&P 500 Index rose 5.6% in November. Bonds also had positive monthly returns. Economic news was encouraging, driven by U.S. labor market strength. Although central banks kept raising rates, expectations grew regarding an impending easing in the pace of rate hikes and a possible end to central bank monetary tightening in 2023. Although inflation remained at record highs in the eurozone, with a 10.6% annual increase in October, Germany’s producer prices decreased 4.2% annually, signaling a possible decline in inflationary pressures. Meanwhile, U.S. inflation continued to moderate, with a 7.1% annual price rise in November and a monthly price increase of just 0.1%. China’s economic data remained weak, reflecting its zero-COVID-19 policy.
Financial markets cooled in December, with U.S. equities posting negative overall results in response to a weakening U.S. dollar. Fixed income securities ended one of their worst years ever with flat overall monthly returns as markets weighed the hopes for an end to the monetary tightening cycle with the reality that central banks had not completed their jobs yet. U.S. Consumer Price Index (CPI)1 data showed a strong consistent trend downward, which brought down the 12-month CPI to 6.5% in December from 9.1% in June. Other countries and regions reported still-high but declining inflation rates as the year winded down.
“ The market misery continued in September. There was nowhere to hide as all asset classes suffered major losses at the hands of persistent inflation.”
| 1 | The Consumer Price Index (CPI) is a measure of the average change over time in the prices paid by urban consumers for a market basket of consumer goods and services. You cannot invest directly in an index. |
Allspring Municipal Sustainability Fund | 3
Letter to shareholders (unaudited)
Don’t let short-term uncertainty derail long-term investment goals.
Periods of investment uncertainty can present challenges, but experience has taught us that maintaining long-term investment goals can be an effective way to plan for the future. To help you create a sound strategy based on your personal goals and risk tolerance, Allspring Funds offers more than 100 mutual funds spanning a wide range of asset classes and investment styles. Although diversification cannot guarantee an investment profit or prevent losses, we believe it can be an effective way to manage investment risk and potentially smooth out overall portfolio performance. We encourage investors to know their investments and to understand that appropriate levels of risk-taking may unlock opportunities.
Thank you for choosing to invest with Allspring Funds. We appreciate your confidence in us and remain committed to helping you meet your financial needs.
Sincerely,
Andrew Owen
President
Allspring Funds
For further information about your fund, contact your investment professional, visit our website at allspringglobal.com, or call us directly at 1-800-222-8222.
4 | Allspring Municipal Sustainability Fund
This page is intentionally left blank.
Performance highlights (unaudited)
| Investment objective | The Fund seeks current income exempt from federal income tax. |
| Manager | Allspring Funds Management, LLC |
| Subadviser | Allspring Global Investments, LLC |
| Portfolio managers | Terry J. Goode, Robert J. Miller, Nicholos Venditti |
| Average annual total returns (%) as of December 31, 2022 |
| | | Including sales charge | | Excluding sales charge | | Expense ratios1(%) |
| | Inception date | 1 year | Since
inception | | 1 year | Since
inception | | Gross | Net 2 |
| Class A (WMSAX) | 2-28-2020 | -13.71 | -2.59 | | -9.66 | -1.01 | | 1.34 | 0.75 |
| Class C (WMSCX) | 2-28-2020 | -10.54 | -1.45 | | -9.64 | -1.45 | | 2.09 | 1.50 |
| Class R6 (WMSRX) | 2-28-2020 | - | - | | -9.34 | -0.66 | | 0.96 | 0.40 |
| Administrator Class (WMSDX) | 2-28-2020 | - | - | | -9.52 | -0.86 | | 1.28 | 0.60 |
| Institutional Class (WMSIX) | 2-28-2020 | - | - | | -9.39 | -0.71 | | 1.01 | 0.45 |
| Bloomberg Municipal Bond Index3 | – | - | - | | -8.53 | -1.88* | | - | - |
Figures quoted represent past performance, which is no guarantee of future results, and do not reflect taxes that a shareholder may pay on an investment in a fund. Investment return and principal value of an investment will fluctuate so that an investor’s shares, when redeemed, may be worth more or less than their original cost. Performance shown without sales charges would be lower if sales charges were reflected. Current performance may be lower or higher than the performance data quoted, which assumes the reinvestment of dividends and capital gains. Current month-end performance is available on the Fund’s website, allspringglobal.com.
Index returns do not include transaction costs associated with buying and selling securities, any mutual fund fees or expenses, or any taxes. It is not possible to invest directly in an index.
For Class A shares, the maximum front-end sales charge is 4.50%. For Class C shares, the maximum contingent deferred sales charge is 1.00%. Performance including a contingent deferred sales charge assumes the sales charge for the corresponding time period. Class R6, Administrator Class and Institutional Class shares are sold without a front-end sales charge or contingent deferred sales charge.
| * | Based on the inception date of the oldest Fund class. |
| 1 | Reflects the expense ratios as stated in the most recent prospectuses. The expense ratios shown are subject to change and may differ from the annualized expense ratios shown in the financial highlights of this report. |
| 2 | The manager has contractually committed through October 31, 2023, to waive fees and/or reimburse expenses to the extent necessary to cap total annual fund operating expenses after fee waivers at 0.75% for Class A, 1.50% for Class C, 0.40% for Class R6, 0.60% for Administrator Class, and 0.45% for Institutional Class. Brokerage commissions, stamp duty fees, interest, taxes, acquired fund fees and expenses (if any), and extraordinary expenses are excluded from the expense caps. Prior to or after the commitment expiration date, the caps may be increased or the commitment to maintain the caps may be terminated only with the approval of the Board of Trustees. Without these caps, the Fund’s returns would have been lower. The expense ratio paid by an investor is the net expense ratio (the total annual fund operating expenses after fee waivers) as stated in the prospectuses. |
| 3 | The Bloomberg Municipal Bond Index is an unmanaged index composed of long-term tax-exempt bonds with a minimum credit rating of Baa. You cannot invest directly in an index. |
6 | Allspring Municipal Sustainability Fund
Performance highlights (unaudited)
Bond values fluctuate in response to the financial condition of individual issuers, general market and economic conditions, and changes in interest rates. Changes in market conditions and government policies may lead to periods of heightened volatility in the bond market and reduced liquidity for certain bonds held by the Fund. In general, when interest rates rise, bond values fall and investors may lose principal value. Interest rate changes and their impact on the Fund and its share price can be sudden and unpredictable. High-yield securities have a greater risk of default and tend to be more volatile than higher-rated debt securities. The use of derivatives may reduce returns and/or increase volatility. Investing in environmental, social, and governance (ESG) carries the risk that, under certain market conditions, the investments may underperform products that invest in a broader array of investments. In addition, some ESG investments may be dependent on government tax incentives and subsidies and on political support for certain environmental technologies and companies. The ESG sector also may have challenges such as a limited number of issuers and liquidity in the market, including a robust secondary market. Investing primarily in responsible investments carries the risk that, under certain market conditions, an investment may underperform funds that do not use a responsible investment strategy. This fund is exposed to municipal securities risk. Consult the Fund's prospectus for additional information on these and other risks. A portion of the Fund’s income may be subject to federal, state, and/or local income taxes or the Alternative Minimum Tax (AMT). Any capital gains distributions may be taxable.
Allspring Municipal Sustainability Fund | 7
Performance highlights (unaudited)
| Credit quality as of December 31, 20221 |
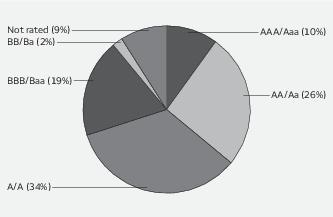
| 1 | The credit quality distribution of portfolio holdings reflected in the chart is based on ratings from Standard & Poor’s, Moody’s Investors Service, and/or Fitch Ratings Ltd. Credit quality ratings apply to the underlying holdings of the Fund and not to the Fund itself. The percentages of the portfolio with the ratings depicted in the chart are calculated based on the market value of fixed income securities held by the Fund. If a security was rated by all three rating agencies, the middle rating was utilized. If rated by two of the three rating agencies, the lower rating was utilized, and if rated by one of the rating agencies, that rating was utilized. Standard & Poor’s rates the creditworthiness of bonds, ranging from AAA (highest) to D (lowest). Ratings from A to CCC may be modified by the addition of a plus (+) or minus (-) sign to show relative standing within the rating categories. Standard & Poor’s rates the creditworthiness of short-term notes from SP-1 (highest) to SP-3 (lowest). Moody’s rates the creditworthiness of bonds, ranging from Aaa (highest) to C (lowest). Ratings Aa to B may be modified by the addition of a number 1 (highest) to 3 (lowest) to show relative standing within the ratings categories. Moody’s rates the creditworthiness of short-term U.S. tax-exempt municipal securities from MIG 1/VMIG 1 (highest) to SG (lowest). Fitch rates the creditworthiness of bonds, ranging from AAA (highest) to D (lowest). Credit quality distribution is subject to change and may have changed since the date specified. |
| Effective maturity distribution as of December 31, 20221 |
| 1 | Figures represent the percentage of the Fund's long-term investments. Allocations are subject to change and may have changed since the date specified. |
8 | Allspring Municipal Sustainability Fund
Fund expenses (unaudited)
As a shareholder of the Fund, you incur two types of costs: (1) transaction costs, including sales charges (loads) on purchase payments and contingent deferred sales charges (if any) on redemptions and (2) ongoing costs, including management fees, distribution (12b-1) and/or shareholder servicing fees, and other Fund expenses. This example is intended to help you understand your ongoing costs (in dollars) of investing in the Fund and to compare these costs with the ongoing costs of investing in other mutual funds.
The example is based on an investment of $1,000 invested at the beginning of the six-month period and held for the entire period from July 1, 2022 to December 31, 2022.
Actual expenses
The “Actual” line of the table below provides information about actual account values and actual expenses. You may use the information in this line, together with the amount you invested, to estimate the expenses that you paid over the period. Simply divide your account value by $1,000 (for example, an $8,600 account value divided by $1,000 = 8.6), then multiply the result by the number in the “Actual” line under the heading entitled “Expenses paid during period” for your applicable class of shares to estimate the expenses you paid on your account during this period.
Hypothetical example for comparison purposes
The “Hypothetical” line of the table below provides information about hypothetical account values and hypothetical expenses based on the Fund’s actual expense ratio and an assumed rate of return of 5% per year before expenses, which is not the Fund’s actual return. The hypothetical account values and expenses may not be used to estimate the actual ending account balance or expenses you paid for the period. You may use this information to compare the ongoing costs of investing in the Fund and other funds. To do so, compare this 5% hypothetical example with the 5% hypothetical examples that appear in the shareholder reports of the other funds.
Please note that the expenses shown in the table are meant to highlight your ongoing costs only and do not reflect any transactional costs, such as sales charges (loads) and contingent deferred sales charges. Therefore, the “Hypothetical” line of the table is useful in comparing ongoing costs only, and will not help you determine the relative total costs of owning different funds. In addition, if these transactional costs were included, your costs would have been higher.
| | Beginning
account value
7-1-2022 | Ending
account value
12-31-2022 | Expenses
paid during
the period1 | Annualized net
expense ratio |
| Class A | | | | |
| Actual | $1,000.00 | $ 999.16 | $3.78 | 0.75% |
| Hypothetical (5% return before expenses) | $1,000.00 | $1,021.42 | $3.82 | 0.75% |
| Class C | | | | |
| Actual | $1,000.00 | $ 997.05 | $6.49 | 1.29% |
| Hypothetical (5% return before expenses) | $1,000.00 | $1,018.70 | $6.56 | 1.29% |
| Class R6 | | | | |
| Actual | $1,000.00 | $1,000.93 | $2.02 | 0.40% |
| Hypothetical (5% return before expenses) | $1,000.00 | $1,023.19 | $2.04 | 0.40% |
| Administrator Class | | | | |
| Actual | $1,000.00 | $ 999.92 | $3.02 | 0.60% |
| Hypothetical (5% return before expenses) | $1,000.00 | $1,022.18 | $3.06 | 0.60% |
| Institutional Class | | | | |
| Actual | $1,000.00 | $1,000.68 | $2.27 | 0.45% |
| Hypothetical (5% return before expenses) | $1,000.00 | $1,022.94 | $2.29 | 0.45% |
1 Expenses paid is equal to the annualized net expense ratio of each class multiplied by the average account value over the period, multiplied by 184 divided by 365 (to reflect the one-half-year period).
Allspring Municipal Sustainability Fund | 9
Portfolio of investments—December 31, 2022 (unaudited)
| | | Interest
rate | Maturity
date | Principal | Value |
| Municipal obligations: 97.85% | | | | | |
| Arizona: 1.17% | | | | | |
| GO revenue: 1.17% | | | | | |
| Maricopa County AZ Elementary School District #25 Liberty School Improvement Project 2019 Series A (AGM Insured) | | 5.00% | 7-1-2023 | $ 300,000 | $ 302,945 |
| California: 8.38% | | | | | |
| Education revenue: 0.42% | | | | | |
| California Municipal Finance Authority Education Revenue Bond Stream Charter School Project Series A 144A | | 5.00 | 6-15-2051 | 125,000 | 107,887 |
| GO revenue: 2.13% | | | | | |
| Newman-Crows Landing Unified School District CAB Series 2022 ¤ | | 0.00 | 8-1-2025 | 600,000 | 549,824 |
| Health revenue: 0.41% | | | | | |
| California Municipal Finance Authority Revenue Refunding Bonds Eisenhower Medical Center Series A | | 5.00 | 7-1-2027 | 100,000 | 105,676 |
| Housing revenue: 2.57% | | | | | |
| California Municipal Finance Authority Special Finance Agency XII California Essential Housing Revenue Bond Allure Apartments Series A-2 Junior Bonds 144A | | 4.38 | 8-1-2049 | 200,000 | 154,229 |
| California Municipal Finance Authority Student Housing Revenue Bond CHF Riverside I LLC - University of California Riverside North District Phase 1 Student Housing Project | | 5.00 | 5-15-2029 | 375,000 | 393,290 |
| California Statewide CDA Community Improvement Authority Essential Housing Revenue Bonds Mezzanine Lien Waterscape Apartments Series 2021B 144A | | 4.00 | 9-1-2046 | 150,000 | 117,090 |
| | | | | | 664,609 |
| Miscellaneous revenue: 2.85% | | | | | |
| California Infrastructure & Economic Development Bank Lease Revenue Teachers Retirement | | 5.00 | 8-1-2030 | 310,000 | 349,558 |
| San Francisco City & County 49 South Van Ness Project Green Bond Series A | | 4.00 | 4-1-2034 | 370,000 | 385,520 |
| | | | | | 735,078 |
| | | | | | 2,163,074 |
| Colorado: 6.13% | | | | | |
| Education revenue: 3.03% | | | | | |
| Colorado Board of Trustees School of Mines Institutional Enterprise Revenue Bonds Series 2022B (AGM Insured) | | 5.25 | 12-1-2052 | 200,000 | 214,119 |
| Colorado ECFA Revenue Improvement & Refunding Bonds Charter School | | 5.00 | 3-15-2027 | 535,000 | 568,465 |
| | | | | | 782,584 |
| Health revenue: 1.80% | | | | | |
| Colorado Health Facilities Authority Revenue Bonds Hospital Advent Health Obligated Group Series A | | 4.00 | 11-15-2043 | 500,000 | 465,864 |
The accompanying notes are an integral part of these financial statements.
10 | Allspring Municipal Sustainability Fund
Portfolio of investments—December 31, 2022 (unaudited)
| | | Interest
rate | Maturity
date | Principal | Value |
| Tax revenue: 1.30% | | | | | |
| Regional Colorado Transportation District Private Activity Bond Denver Transit Partners Eagle P3 Project Series A | | 4.00% | 7-15-2040 | $ 375,000 | $ 335,368 |
| | | | | | 1,583,816 |
| District of Columbia: 1.06% | | | | | |
| Water & sewer revenue: 1.06% | | | | | |
| District of Columbia Water & Sewer Authority Public Utility Green Bond Series A | | 5.00 | 10-1-2038 | 250,000 | 272,976 |
| Florida: 0.41% | | | | | |
| Education revenue: 0.41% | | | | | |
| Florida Development Finance Corporation Educational Facilities United Cerebral Palsy Charter Schools Projects Social Bonds Series A | | 5.00 | 6-1-2050 | 125,000 | 105,050 |
| Georgia: 1.02% | | | | | |
| Education revenue: 1.02% | | | | | |
| Georgia Private Colleges & Universities Authority Mercer University Project Series 2022 | | 5.25 | 10-1-2051 | 250,000 | 263,278 |
| Guam: 0.96% | | | | | |
| Water & sewer revenue: 0.96% | | | | | |
| Guam Government Waterworks Authority Series A | | 5.00 | 1-1-2050 | 250,000 | 247,770 |
| Idaho: 1.51% | | | | | |
| Health revenue: 1.51% | | | | | |
| Idaho Health Facilities Authority Hospital Trinity Health Credit Group Series A | | 5.00 | 12-1-2047 | 385,000 | 388,916 |
| Illinois: 17.99% | | | | | |
| Education revenue: 2.40% | | | | | |
| Illinois Finance Authority LEARN Charter School Project | | 4.00 | 11-1-2051 | 750,000 | 619,447 |
| GO revenue: 3.53% | | | | | |
| Chicago IL Series A | | 6.00 | 1-1-2038 | 375,000 | 395,482 |
| Decatur IL Green Bond (BAM Insured) | | 5.00 | 3-1-2024 | 375,000 | 381,565 |
| Kendall, Kane & Will Counties IL CAB School District #308 (AGM Insured) ¤ | | 0.00 | 2-1-2027 | 155,000 | 135,176 |
| | | | | | 912,223 |
| Health revenue: 2.33% | | | | | |
| Southwestern Illinois Development Authority Health Facility Revenue Bonds Series 2017A | | 5.00 | 2-15-2025 | 580,000 | 600,991 |
| Miscellaneous revenue: 2.34% | | | | | |
| Illinois Finance Authority Clean Water Initiative Revolving Fund | | 5.00 | 7-1-2024 | 585,000 | 603,188 |
| Tax revenue: 1.97% | | | | | |
| Chicago IL Transit Authority Sales Tax Receipts (AGM Insured) | | 5.00 | 12-1-2046 | 500,000 | 510,109 |
| Transportation revenue: 2.66% | | | | | |
| Chicago IL Public Building Commission Chicago Transit Authority (Ambac Insured) | | 5.25 | 3-1-2031 | 600,000 | 686,012 |
The accompanying notes are an integral part of these financial statements.
Allspring Municipal Sustainability Fund | 11
Portfolio of investments—December 31, 2022 (unaudited)
| | | Interest
rate | Maturity
date | Principal | Value |
| Water & sewer revenue: 2.76% | | | | | |
| Chicago IL Wastewater Transmission Series C | | 5.00% | 1-1-2024 | $ 700,000 | $ 712,070 |
| | | | | | 4,644,040 |
| Indiana: 5.51% | | | | | |
| Health revenue: 1.25% | | | | | |
| Indiana Finance Authority Hospital Revenue Reid Health Series 2022 (AGM Insured) | | 5.00 | 1-1-2041 | 300,000 | 321,728 |
| Miscellaneous revenue: 2.19% | | | | | |
| Indiana Finance Authority State Revolving Fund Program Refunding Green Bonds Series E | | 5.00 | 2-1-2047 | 500,000 | 566,525 |
| Water & sewer revenue: 2.07% | | | | | |
| Indiana Finance Authority State Revolving Fund Program Refunding Green Bonds Series B | | 5.00 | 2-1-2028 | 500,000 | 534,153 |
| | | | | | 1,422,406 |
| Louisiana: 0.61% | | | | | |
| Water & sewer revenue: 0.61% | | | | | |
| New Orleans LA Water Revenue (BAM Insured) | | 5.00 | 12-1-2034 | 150,000 | 156,438 |
| Maryland: 1.87% | | | | | |
| Housing revenue: 1.87% | | | | | |
| Maryland CDA Department of Housing & Community Multifamily Development Woodside Gardens Series A 144A | | 1.33 | 1-1-2024 | 500,000 | 483,574 |
| Massachusetts: 3.71% | | | | | |
| Education revenue: 2.05% | | | | | |
| Massachusetts Development Finance Agency Boston College Issue Series U | | 5.00 | 7-1-2025 | 500,000 | 528,690 |
| Health revenue: 1.66% | | | | | |
| Massachusetts Development Finance Agency Milford Regional Medical Center Series G 144A | | 5.00 | 7-15-2025 | 125,000 | 128,180 |
| Massachusetts Development Finance Agency Revenue Bonds Boston Medical Center Issue Series D | | 5.00 | 7-1-2044 | 300,000 | 301,480 |
| | | | | | 429,660 |
| | | | | | 958,350 |
| Michigan: 4.11% | | | | | |
| Miscellaneous revenue: 2.08% | | | | | |
| Michigan Building Authority Series I | | 5.00 | 10-15-2031 | 500,000 | 537,310 |
| Tax revenue: 0.39% | | | | | |
| Michigan Finance Authority Local Government Loan Program Public Lighting Authority Refunding Bonds Series B | | 5.00 | 7-1-2044 | 100,000 | 99,773 |
| Water & sewer revenue: 1.64% | | | | | |
| Great Lakes MI Water Authority Water Supply System Series D | | 5.00 | 7-1-2031 | 400,000 | 424,570 |
| | | | | | 1,061,653 |
The accompanying notes are an integral part of these financial statements.
12 | Allspring Municipal Sustainability Fund
Portfolio of investments—December 31, 2022 (unaudited)
| | | Interest
rate | Maturity
date | Principal | Value |
| Minnesota: 0.33% | | | | | |
| Education revenue: 0.33% | | | | | |
| St. Paul MN Housing & RDA Charter School Hmong College Preparatory Academy Project Series 2020A | | 5.00% | 9-1-2055 | $ 100,000 | $ 86,279 |
| Nevada: 4.64% | | | | | |
| GO revenue: 4.64% | | | | | |
| Clark County NV Flood Control District | | 5.00 | 11-1-2029 | 500,000 | 565,736 |
| Clark County NV School District Building Series A | | 4.00 | 6-15-2035 | 625,000 | 633,274 |
| | | | | | 1,199,010 |
| New Jersey: 1.48% | | | | | |
| Miscellaneous revenue: 1.06% | | | | | |
| New Jersey EDA Series XX | | 4.00 | 6-15-2024 | 270,000 | 273,016 |
| Tax revenue: 0.42% | | | | | |
| New Jersey Garden State Preservation Trust Open & Farmland Series A (AGM Insured) | | 5.75 | 11-1-2028 | 100,000 | 109,933 |
| | | | | | 382,949 |
| New York: 8.17% | | | | | |
| Education revenue: 5.49% | | | | | |
| Allegany County NY Capital Resource Corporation Tax-Exempt Revenue Bonds Series 2022A | | 5.00 | 12-1-2026 | 390,000 | 402,606 |
| Build New York City Resource Corporation East Harlem Scholars Academy Charter School Social Impact Project Series 2022 144A | | 5.00 | 6-1-2032 | 375,000 | 373,315 |
| Build New York City Resource Corporation Richmond Preparatory Charter School Social Impact Project Series A 144A | | 5.00 | 6-1-2041 | 150,000 | 139,085 |
| New York Dormitory Authority Non-State Supported Debt Series A | | 5.00 | 7-1-2038 | 270,000 | 291,628 |
| Tompkins County Development Corporation Tax-Exempt Revenue Refunding Bonds Series 2017 | | 5.00 | 7-1-2041 | 205,000 | 209,429 |
| | | | | | 1,416,063 |
| GO revenue: 0.49% | | | | | |
| Poughkeepsie City NY Refunding Bonds Public Improvement | | 5.00 | 6-1-2024 | 125,000 | 127,396 |
| Water & sewer revenue: 2.19% | | | | | |
| New York Environmental Facilities Corporation Clean Water & Drinking Water New York City Municipal Water Finance Authority Project Series A | | 5.00 | 6-15-2032 | 500,000 | 566,473 |
| | | | | | 2,109,932 |
| North Carolina: 0.71% | | | | | |
| Housing revenue: 0.71% | | | | | |
| North Carolina Capital Facilities Finance Refunding Bonds The Arc of North Carolina Projects Series A (Department of Housing and Urban Development Insured) | | 5.00 | 10-1-2024 | 180,000 | 182,969 |
The accompanying notes are an integral part of these financial statements.
Allspring Municipal Sustainability Fund | 13
Portfolio of investments—December 31, 2022 (unaudited)
| | | Interest
rate | Maturity
date | Principal | Value |
| Oklahoma: 0.96% | | | | | |
| Miscellaneous revenue: 0.96% | | | | | |
| McIntosh County Educational Facilities Authority Educational Facilities Lease Revenue Bonds Series 2022 | | 2.00% | 9-1-2023 | $ 250,000 | $ 246,701 |
| Oregon: 3.82% | | | | | |
| GO revenue: 2.09% | | | | | |
| Bend OR Series 2020 | | 5.00 | 6-1-2050 | 500,000 | 538,628 |
| Health revenue: 1.73% | | | | | |
| Oregon State Facilities Authority Revenue Refunding Bonds Samaritan Health Services Project | | 5.00 | 10-1-2031 | 430,000 | 447,222 |
| | | | | | 985,850 |
| Pennsylvania: 8.74% | | | | | |
| Education revenue: 2.83% | | | | | |
| Allegheny County PA Higher Education Robert Morris University | | 5.00 | 10-15-2037 | 250,000 | 248,655 |
| Philadelphia PA IDA Saint Joseph's University Series C | | 4.00 | 11-1-2037 | 500,000 | 483,052 |
| | | | | | 731,707 |
| Health revenue: 3.77% | | | | | |
| Lancaster County Hospital Authority Series 2021 | | 5.00 | 11-1-2051 | 625,000 | 630,802 |
| Westmoreland County PA IDA Excela Health Project Series A | | 4.00 | 7-1-2037 | 375,000 | 341,264 |
| | | | | | 972,066 |
| Transportation revenue: 2.14% | | | | | |
| Pennsylvania Turnpike Commission Turnpike Series B-1 | | 5.25 | 6-1-2047 | 535,000 | 552,282 |
| | | | | | 2,256,055 |
| South Carolina: 1.13% | | | | | |
| Education revenue: 1.13% | | | | | |
| South Carolina Jobs EDA Revenue Wofford College Project | | 5.00 | 4-1-2033 | 270,000 | 292,667 |
| Texas: 3.35% | | | | | |
| GO revenue: 2.45% | | | | | |
| Dallas County TX Hospital District Limited Tax | | 5.00 | 8-15-2030 | 625,000 | 632,564 |
| Water & sewer revenue: 0.90% | | | | | |
| Texas Water Development Board State Water Implementation Revenue Fund For Texas Revenue Bonds Series 2018B | | 5.00 | 4-15-2024 | 225,000 | 231,345 |
| | | | | | 863,909 |
| Utah: 4.28% | | | | | |
| Housing revenue: 4.28% | | | | | |
| Utah Board of Higher Education University of Utah Bonds Series 2022B | | 5.00 | 8-1-2042 | 1,000,000 | 1,103,913 |
| Washington: 5.19% | | | | | |
| Education revenue: 0.60% | | | | | |
| Washington HEFAR Seattle University Project | | 5.00 | 5-1-2027 | 145,000 | 154,985 |
The accompanying notes are an integral part of these financial statements.
14 | Allspring Municipal Sustainability Fund
Portfolio of investments—December 31, 2022 (unaudited)
| | | Interest
rate | Maturity
date | Principal | Value |
| GO revenue: 2.61% | | | | | |
| King County WA Public Hospital District #1 Valley Medical Center Refunding Bond | | 5.00% | 12-1-2026 | $ 625,000 | $ 673,018 |
| Utilities revenue: 1.98% | | | | | |
| Chelan County WA Public Utility District #001 Consolidated Revenue Refunding Bonds Governmental Series A | | 4.00 | 7-1-2036 | 500,000 | 512,188 |
| | | | | | 1,340,191 |
| Wisconsin: 0.61% | | | | | |
| Health revenue: 0.61% | | | | | |
| PFA Hospital Revenue Bonds Carson Valley Medical Center Series A | | 4.00 | 12-1-2051 | 200,000 | 157,325 |
| Total Municipal obligations (Cost $26,917,109) | | | | | 25,262,036 |
| | | Yield | | Shares | |
| Short-term investments: 0.88% | | | | | |
| Investment companies: 0.88% | | | | | |
| Allspring Municipal Cash Management Money Market Fund Institutional Class ♠∞ | | 3.56 | | 226,526 | 226,571 |
| Total Short-term investments (Cost $226,590) | | | | | 226,571 |
| Total investments in securities (Cost $27,143,699) | 98.73% | | | | 25,488,607 |
| Other assets and liabilities, net | 1.27 | | | | 327,803 |
| Total net assets | 100.00% | | | | $25,816,410 |
| 144A | The security may be resold in transactions exempt from registration, normally to qualified institutional buyers, pursuant to Rule 144A under the Securities Act of 1933. |
| ¤ | The security is issued in zero coupon form with no periodic interest payments. |
| ♠ | The issuer of the security is an affiliated person of the Fund as defined in the Investment Company Act of 1940. |
| ∞ | The rate represents the 7-day annualized yield at period end. |
| Abbreviations: |
| AGM | Assured Guaranty Municipal |
| Ambac | Ambac Financial Group Incorporated |
| BAM | Build America Mutual Assurance Company |
| CAB | Capital appreciation bond |
| CDA | Community Development Authority |
| ECFA | Educational & Cultural Facilities Authority |
| EDA | Economic Development Authority |
| GO | General obligation |
| HEFAR | Higher Education Facilities Authority Revenue |
| IDA | Industrial Development Authority |
| PFA | Public Finance Authority |
| RDA | Redevelopment Authority |
The accompanying notes are an integral part of these financial statements.
Allspring Municipal Sustainability Fund | 15
Portfolio of investments—December 31, 2022 (unaudited)
Investments in affiliates
An affiliated investment is an investment in which the Fund owns at least 5% of the outstanding voting shares of the issuer or as a result of other relationships, such as the Fund and the issuer having the same investment manager. Transactions with issuers that were affiliates of the Fund at the end of the period were as follows:
| | Value,
beginning of
period | Purchases | Sales
proceeds | Net
realized
gains
(losses) | Net
change in
unrealized
gains
(losses) | Value,
end of
period | Shares,
end
of period | Income
from
affiliated
securities |
| Short-term investments | | | | | | | |
| Allspring Municipal Cash Management Money Market Fund Institutional Class | $1,657,378 | $1,738,680 | $(3,169,237) | $(57) | $(193) | $226,571 | 226,526 | $531 |
The accompanying notes are an integral part of these financial statements.
16 | Allspring Municipal Sustainability Fund
Statement of assets and liabilities—December 31, 2022 (unaudited)
| | |
| Assets | |
Investments in unaffiliated securities, at value (cost $26,917,109)
| $ 25,262,036 |
Investments in affiliated securities, at value (cost $226,590)
| 226,571 |
Receivable for interest
| 332,299 |
Receivable for Fund shares sold
| 22,600 |
Receivable from manager
| 5,754 |
Prepaid expenses and other assets
| 14,653 |
Total assets
| 25,863,913 |
| Liabilities | |
Professional fees payable
| 34,997 |
Custody and accounting fees payable
| 4,966 |
Dividends payable
| 3,097 |
Trustees’ fees and expenses payable
| 2,010 |
Administration fees payable
| 1,131 |
Payable for Fund shares redeemed
| 1,101 |
Distribution fee payable
| 201 |
Total liabilities
| 47,503 |
Total net assets
| $25,816,410 |
| Net assets consist of | |
Paid-in capital
| $ 27,919,700 |
Total distributable loss
| (2,103,290) |
Total net assets
| $25,816,410 |
| Computation of net asset value and offering price per share | |
Net assets – Class A
| $ 1,099,745 |
Shares outstanding – Class A1
| 59,305 |
Net asset value per share – Class A
| $18.54 |
Maximum offering price per share – Class A2
| $19.41 |
Net assets – Class C
| $ 943,810 |
Shares outstanding – Class C1
| 50,591 |
Net asset value per share – Class C
| $18.66 |
Net assets – Class R6
| $ 19,952,364 |
Shares outstanding – Class R61
| 1,075,975 |
Net asset value per share – Class R6
| $18.54 |
Net assets – Administrator Class
| $ 1,410,379 |
Shares outstanding – Administrator Class1
| 76,059 |
Net asset value per share – Administrator Class
| $18.54 |
Net assets – Institutional Class
| $ 2,410,112 |
Shares outstanding – Institutional Class1
| 129,970 |
Net asset value per share – Institutional Class
| $18.54 |
| 1 | The Fund has an unlimited number of authorized shares. |
| 2 | Maximum offering price is computed as 100/95.50 of net asset value. On investments of $50,000 or more, the offering price is reduced. |
The accompanying notes are an integral part of these financial statements.
Allspring Municipal Sustainability Fund | 17
Statement of operations—six months ended December 31, 2022 (unaudited)
| | |
| Investment income | |
Interest
| $ 338,202 |
Income from affiliated securities
| 531 |
Total investment income
| 338,733 |
| Expenses | |
Management fee
| 52,050 |
| Administration fees | |
Class A
| 925 |
Class C
| 767 |
Class R6
| 3,031 |
Administrator Class
| 588 |
Institutional Class
| 1,011 |
| Shareholder servicing fees | |
Class A
| 1,445 |
Class C
| 1,198 |
Administrator Class
| 1,471 |
| Distribution fee | |
Class C
| 13 |
Custody and accounting fees
| 3,294 |
Professional fees
| 25,105 |
Registration fees
| 30,998 |
Shareholder report expenses
| 8,080 |
Trustees’ fees and expenses
| 11,159 |
Other fees and expenses
| 2,205 |
Total expenses
| 143,340 |
| Less: Fee waivers and/or expense reimbursements | |
Fund-level
| (82,303) |
Class A
| (176) |
Administrator Class
| (718) |
Net expenses
| 60,143 |
Net investment income
| 278,590 |
| Realized and unrealized gains (losses) on investments | |
| Net realized losses on | |
Unaffiliated securities
| (3,314) |
Affiliated securities
| (57) |
Net realized losses on investments
| (3,371) |
| Net change in unrealized gains (losses) on | |
Unaffiliated securities
| (251,898) |
Affiliated securities
| (193) |
Net change in unrealized gains (losses) on investments
| (252,091) |
Net realized and unrealized gains (losses) on investments
| (255,462) |
Net increase in net assets resulting from operations
| $ 23,128 |
The accompanying notes are an integral part of these financial statements.
18 | Allspring Municipal Sustainability Fund
Statement of changes in net assets
| | | | | |
| | Six months ended
December 31, 2022
(unaudited) | Year ended
June 30, 2022 |
| Operations | | | | |
Net investment income
| | $ 278,590 | | $ 517,750 |
Net realized losses on investments
| | (3,371) | | (195,609) |
Net change in unrealized gains (losses) on investments
| | (252,091) | | (2,945,055) |
Net increase (decrease) in net assets resulting from operations
| | 23,128 | | (2,622,914) |
| Distributions to shareholders from | | | | |
| Net investment income and net realized gains | | | | |
Class A
| | (10,685) | | (20,430) |
Class C
| | (5,779) | | (9,713) |
Class R6
| | (222,204) | | (420,586) |
Administrator Class
| | (11,815) | | (20,570) |
Institutional Class
| | (27,138) | | (47,135) |
Total distributions to shareholders
| | (277,621) | | (518,434) |
| Capital share transactions | Shares | | Shares | |
| Proceeds from shares sold | | | | |
Class A
| 43 | 802 | 11,757 | 247,206 |
Administrator Class
| 17,392 | 320,051 | 1,286 | 26,349 |
Institutional Class
| 36,995 | 684,044 | 116,315 | 2,407,016 |
| | | 1,004,897 | | 2,680,571 |
| Reinvestment of distributions | | | | |
Class A
| 572 | 10,569 | 663 | 13,052 |
Class C
| 308 | 5,719 | 283 | 5,551 |
Class R6
| 11,903 | 219,732 | 14,072 | 277,876 |
Administrator Class
| 632 | 11,658 | 658 | 12,951 |
Institutional Class
| 1,454 | 26,846 | 1,957 | 38,861 |
| | | 274,524 | | 348,291 |
| Payment for shares redeemed | | | | |
Class A
| (3,313) | (60,393) | (5,387) | (109,248) |
Administrator Class
| (99) | (1,832) | (482) | (9,946) |
Institutional Class
| (40,566) | (745,874) | (41,768) | (819,382) |
| | | (808,099) | | (938,576) |
Net increase in net assets resulting from capital share transactions
| | 471,322 | | 2,090,286 |
Total increase (decrease) in net assets
| | 216,829 | | (1,051,062) |
| Net assets | | | | |
Beginning of period
| | 25,599,581 | | 26,650,643 |
End of period
| | $25,816,410 | | $25,599,581 |
The accompanying notes are an integral part of these financial statements.
Allspring Municipal Sustainability Fund | 19
Financial highlights
(For a share outstanding throughout each period)
| | | Year ended June 30 |
| Class A | Six months ended
December 31, 2022
(unaudited) | 2022 | 2021 | 2020 1 |
Net asset value, beginning of period
| $18.73 | $21.03 | $20.35 | $20.00 |
Net investment income
| 0.17 | 0.32 | 0.34 | 0.10 |
Net realized and unrealized gains (losses) on investments
| (0.19) | (2.29) | 0.68 | 0.35 |
Total from investment operations
| (0.02) | (1.97) | 1.02 | 0.45 |
| Distributions to shareholders from | | | | |
Net investment income
| (0.17) | (0.33) | (0.34) | (0.10) |
Net asset value, end of period
| $18.54 | $18.73 | $21.03 | $20.35 |
Total return2
| (0.08)% | (9.47)% | 5.04% | 2.27% |
| Ratios to average net assets (annualized) | | | | |
Gross expenses
| 1.43% | 1.34% | 1.85% | 2.26% |
Net expenses
| 0.75% | 0.75% | 0.75% | 0.75% |
Net investment income
| 1.85% | 1.60% | 1.64% | 1.52% |
| Supplemental data | | | | |
Portfolio turnover rate
| 2% | 31% | 77% | 32% |
Net assets, end of period (000s omitted)
| $1,100 | $1,161 | $1,156 | $1,020 |
| 1 | For the period from February 28, 2020 (commencement of class operations) to June 30, 2020 |
| 2 | Total return calculations do not include any sales charges. Returns for periods of less than one year are not annualized. |
The accompanying notes are an integral part of these financial statements.
20 | Allspring Municipal Sustainability Fund
Financial highlights
(For a share outstanding throughout each period)
| | | Year ended June 30 |
| Class C | Six months ended
December 31, 2022
(unaudited) | 2022 | 2021 | 2020 1 |
Net asset value, beginning of period
| $18.83 | $21.03 | $20.35 | $20.00 |
Net investment income
| 0.12 | 0.30 | 0.19 | 0.05 |
Net realized and unrealized gains (losses) on investments
| (0.18) | (2.31) | 0.68 | 0.36 |
Total from investment operations
| (0.06) | (2.01) | 0.87 | 0.41 |
| Distributions to shareholders from | | | | |
Net investment income
| (0.11) | (0.19) | (0.19) | (0.06) |
Net asset value, end of period
| $18.66 | $18.83 | $21.03 | $20.35 |
Total return2
| (0.30)% | (9.60)% | 4.30% | 2.04% |
| Ratios to average net assets (annualized) | | | | |
Gross expenses
| 1.43% * | 2.09% * | 2.35% * | 3.01% |
Net expenses
| 1.29% * | 0.88% * | 1.46% * | 1.50% |
Net investment income
| 1.31% | 1.47% | 0.93% | 0.78% |
| Supplemental data | | | | |
Portfolio turnover rate
| 2% | 31% | 77% | 32% |
Net assets, end of period (000s omitted)
| $944 | $947 | $1,051 | $1,017 |
| * | Ratio includes class-level expenses which were voluntarily waived by the investment manager. Without this voluntary waiver, the net expense ratio would be increased by the following amounts: |
| Six months ended December 31, 2022 (unaudited) | 0.14% |
| Year ended June 30, 2022 | 0.62% |
| Year ended June 30, 2021 | 0.04% |
| 1 | For the period from February 28, 2020 (commencement of class operations) to June 30, 2020 |
| 2 | Total return calculations do not include any sales charges. Returns for periods of less than one year are not annualized. |
The accompanying notes are an integral part of these financial statements.
Allspring Municipal Sustainability Fund | 21
Financial highlights
(For a share outstanding throughout each period)
| | | Year ended June 30 |
| Class R6 | Six months ended
December 31, 2022
(unaudited) | 2022 | 2021 | 2020 1 |
Net asset value, beginning of period
| $18.73 | $21.03 | $20.35 | $20.00 |
Net investment income
| 0.21 | 0.39 | 0.41 | 0.13 2 |
Net realized and unrealized gains (losses) on investments
| (0.19) | (2.29) | 0.68 | 0.35 |
Total from investment operations
| 0.02 | (1.90) | 1.09 | 0.48 |
| Distributions to shareholders from | | | | |
Net investment income
| (0.21) | (0.40) | (0.41) | (0.13) |
Net asset value, end of period
| $18.54 | $18.73 | $21.03 | $20.35 |
Total return3
| 0.09% | (9.16)% | 5.41% | 2.39% |
| Ratios to average net assets (annualized) | | | | |
Gross expenses
| 1.05% | 0.96% | 1.48% | 1.88% |
Net expenses
| 0.40% | 0.40% | 0.40% | 0.40% |
Net investment income
| 2.20% | 1.95% | 1.99% | 1.87% |
| Supplemental data | | | | |
Portfolio turnover rate
| 2% | 31% | 77% | 32% |
Net assets, end of period (000s omitted)
| $19,952 | $19,929 | $22,082 | $21,367 |
| 1 | For the period from February 28, 2020 (commencement of class operations) to June 30, 2020 |
| 2 | Calculated based upon average shares outstanding |
| 3 | Returns for periods of less than one year are not annualized. |
The accompanying notes are an integral part of these financial statements.
22 | Allspring Municipal Sustainability Fund
Financial highlights
(For a share outstanding throughout each period)
| | | Year ended June 30 |
| Administrator Class | Six months ended
December 31, 2022
(unaudited) | 2022 | 2021 | 2020 1 |
Net asset value, beginning of period
| $18.73 | $21.03 | $20.35 | $20.00 |
Net investment income
| 0.19 | 0.35 | 0.37 | 0.11 |
Net realized and unrealized gains (losses) on investments
| (0.19) | (2.29) | 0.68 | 0.35 |
Total from investment operations
| 0.00 | (1.94) | 1.05 | 0.46 |
| Distributions to shareholders from | | | | |
Net investment income
| (0.19) | (0.36) | (0.37) | (0.11) |
Net asset value, end of period
| $18.54 | $18.73 | $21.03 | $20.35 |
Total return2
| (0.01)% | (9.34)% | 5.20% | 2.32% |
| Ratios to average net assets (annualized) | | | | |
Gross expenses
| 1.37% | 1.28% | 1.77% | 2.20% |
Net expenses
| 0.60% | 0.60% | 0.60% | 0.60% |
Net investment income
| 2.01% | 1.75% | 1.80% | 1.67% |
| Supplemental data | | | | |
Portfolio turnover rate
| 2% | 31% | 77% | 32% |
Net assets, end of period (000s omitted)
| $1,410 | $1,089 | $1,192 | $1,017 |
| 1 | For the period from February 28, 2020 (commencement of class operations) to June 30, 2020 |
| 2 | Returns for periods of less than one year are not annualized. |
The accompanying notes are an integral part of these financial statements.
Allspring Municipal Sustainability Fund | 23
Financial highlights
(For a share outstanding throughout each period)
| | | Year ended June 30 |
| Institutional Class | Six months ended
December 31, 2022
(unaudited) | 2022 | 2021 | 2020 1 |
Net asset value, beginning of period
| $18.73 | $21.03 | $20.35 | $20.00 |
Net investment income
| 0.20 | 0.39 | 0.40 | 0.12 |
Net realized and unrealized gains (losses) on investments
| (0.19) | (2.30) | 0.68 | 0.35 |
Total from investment operations
| 0.01 | (1.91) | 1.08 | 0.47 |
| Distributions to shareholders from | | | | |
Net investment income
| (0.20) | (0.39) | (0.40) | (0.12) |
Net asset value, end of period
| $18.54 | $18.73 | $21.03 | $20.35 |
Total return2
| 0.07% | (9.20)% | 5.36% | 2.37% |
| Ratios to average net assets (annualized) | | | | |
Gross expenses
| 1.10% | 1.01% | 1.52% | 1.93% |
Net expenses
| 0.45% | 0.45% | 0.45% | 0.45% |
Net investment income
| 2.15% | 1.90% | 1.94% | 1.82% |
| Supplemental data | | | | |
Portfolio turnover rate
| 2% | 31% | 77% | 32% |
Net assets, end of period (000s omitted)
| $2,410 | $2,474 | $1,169 | $1,017 |
| 1 | For the period from February 28, 2020 (commencement of class operations) to June 30, 2020 |
| 2 | Returns for periods of less than one year are not annualized. |
The accompanying notes are an integral part of these financial statements.
24 | Allspring Municipal Sustainability Fund
Notes to financial statements (unaudited)
1. ORGANIZATION
Allspring Funds Trust (the "Trust"), a Delaware statutory trust organized on March 10, 1999, is an open-end management investment company registered under the Investment Company Act of 1940, as amended (the "1940 Act"). As an investment company, the Trust follows the accounting and reporting guidance in Financial Accounting Standards Board ("FASB") Accounting Standards Codification Topic 946, Financial Services – Investment Companies. These financial statements report on the Allspring Municipal Sustainability Fund (the "Fund") which is a diversified series of the Trust.
2. SIGNIFICANT ACCOUNTING POLICIES
The following significant accounting policies, which are consistently followed in the preparation of the financial statements of the Fund, are in conformity with U.S. generally accepted accounting principles which require management to make estimates and assumptions that affect the reported amounts of assets and liabilities, disclosure of contingent assets and liabilities at the date of the financial statements, and the reported amounts of income and expenses during the reporting period. Actual results could differ from those estimates.
Securities valuation
All investments are valued each business day as of the close of regular trading on the New York Stock Exchange (generally 4 p.m. Eastern Time), although the Fund may deviate from this calculation time under unusual or unexpected circumstances.
Debt securities are valued at the evaluated bid price provided by an independent pricing service (e.g. taking into account various factors, including yields, maturities, or credit ratings) or, if a reliable price is not available, the quoted bid price from an independent broker-dealer.
Investments in registered open-end investment companies (other than those listed on a foreign or domestic exchange or market) are valued at net asset value.
Investments which are not valued using the methods discussed above are valued at their fair value, as determined in good faith by Allspring Funds Management, LLC ("Allspring Funds Management"), which was named the valuation designee by the Board of Trustees. As the valuation designee, Allspring Funds Management is responsible for day-to-day valuation activities for the Allspring Funds. In connection with these responsibilities, Allspring Funds Management has established a Valuation Committee and has delegated to it the authority to take any actions regarding the valuation of portfolio securities that the Valuation Committee deems necessary or appropriate, including determining the fair value of portfolio securities. On a quarterly basis, the Board of Trustees receives reports of valuation actions taken by the Valuation Committee. On at least an annual basis, the Board of Trustees receives an assessment of the adequacy and effectiveness of Allspring Funds Management's process for determining the fair value of the portfolio of investments.
When-issued transactions
The Fund may purchase securities on a forward commitment or when-issued basis. The Fund records a when-issued transaction on the trade date and will segregate assets in an amount at least equal in value to the Fund's commitment to purchase when-issued securities. Securities purchased on a when-issued basis are marked-to-market daily and the Fund begins earning interest on the settlement date. Losses may arise due to changes in the market value of the underlying securities or if the counterparty does not perform under the contract.
Security transactions and income recognition
Securities transactions are recorded on a trade date basis. Realized gains or losses are recorded on the basis of identified cost.
Interest income is accrued daily and bond discounts are accreted and premiums are amortized daily. To the extent debt obligations are placed on non-accrual status, any related interest income may be reduced by writing off interest receivables when the collection of all or a portion of interest has been determined to be doubtful based on consistently applied procedures and the fair value has decreased. If the issuer subsequently resumes interest payments or when the collectability of interest is reasonably assured, the debt obligation is removed from non-accrual status.
Distributions to shareholders
Distributions to shareholders from net investment income are declared daily and paid monthly. Distributions from net realized gains, if any, are recorded on the ex-dividend date and paid at least annually. Such distributions are determined in accordance with income tax regulations and may differ from U.S. generally accepted accounting principles. Dividend sources are estimated at the time of declaration. The tax character of distributions is determined as of the Fund's fiscal year end. Therefore, a portion of the Fund's distributions made prior to the Fund’s fiscal year end may be categorized as a tax return of capital at year end.
Allspring Municipal Sustainability Fund | 25
Notes to financial statements (unaudited)
Federal and other taxes
The Fund intends to continue to qualify as a regulated investment company by distributing substantially all of its investment company taxable and tax-exempt income and any net realized capital gains (after reduction for capital loss carryforwards) sufficient to relieve it from all, or substantially all, federal income taxes. Accordingly, no provision for federal income taxes was required.
The Fund’s income and federal excise tax returns and all financial records supporting those returns for the fiscal years since commencement of operations are subject to examination by the federal and Delaware revenue authorities. Management has analyzed the Fund’s tax positions taken on federal, state, and foreign tax returns, as applicable, for all open tax years and does not believe that there are any uncertain tax positions that require recognition of a tax liability.
As of December 31, 2022, the aggregate cost of all investments for federal income tax purposes was $28,546,700 and the unrealized gains (losses) consisted of:
| Gross unrealized gains | $ 52,341 |
| Gross unrealized losses | (3,110,434) |
| Net unrealized losses | $(3,058,093) |
As of June 30, 2022, the Fund had capital loss carryforwards which consisted of $445,796 in short-term capital losses.
Class allocations
The separate classes of shares offered by the Fund differ principally in applicable sales charges, distribution, shareholder servicing, and administration fees. Class specific expenses are charged directly to that share class. Investment income, common fund-level expenses, and realized and unrealized gains (losses) on investments are allocated daily to each class of shares based on the relative proportion of net assets of each class.
3. FAIR VALUATION MEASUREMENTS
Fair value measurements of investments are determined within a framework that has established a fair value hierarchy based upon the various data inputs utilized in determining the value of the Fund’s investments. The three-level hierarchy gives the highest priority to unadjusted quoted prices in active markets for identical assets or liabilities (Level 1) and the lowest priority to unobservable inputs (Level 3). The Fund’s investments are classified within the fair value hierarchy based on the lowest level of input that is significant to the fair value measurement. The inputs are summarized into three broad levels as follows:
| ■ | Level 1 – quoted prices in active markets for identical securities |
| ■ | Level 2 – other significant observable inputs (including quoted prices for similar securities, interest rates, prepayment speeds, credit risk, etc.) |
| ■ | Level 3 – significant unobservable inputs (including the Fund’s own assumptions in determining the fair value of investments) |
The inputs or methodologies used for valuing investments in securities are not necessarily an indication of the risk associated with investing in those securities.
The following is a summary of the inputs used in valuing the Fund’s assets and liabilities as of December 31, 2022:
| | Quoted prices
(Level 1) | Other significant
observable inputs
(Level 2) | Significant
unobservable inputs
(Level 3) | Total |
| Assets | | | | |
| Investments in: | | | | |
| Municipal obligations | $ 0 | $ 25,262,036 | $0 | $ 25,262,036 |
| Short-term investments | | | | |
| Investment companies | 226,571 | 0 | 0 | 226,571 |
| Total assets | $226,571 | $25,262,036 | $0 | $25,488,607 |
Additional sector, industry or geographic detail, if any, is included in the Portfolio of Investments.
For the six months ended December 31, 2022, the Fund did not have any transfers into/out of Level 3.
26 | Allspring Municipal Sustainability Fund
Notes to financial statements (unaudited)
4. TRANSACTIONS WITH AFFILIATES
Management fee
Allspring Funds Management, a wholly owned subsidiary of Allspring Global Investments Holdings, LLC, a holding company indirectly owned by certain private funds of GTCR LLC and Reverence Capital Partners, L.P., is the manager of the Fund and provides advisory and fund-level administrative services under an investment management agreement. Under the investment management agreement, Allspring Funds Management is responsible for, among other services, implementing the investment objectives and strategies of the Fund, supervising the subadviser and providing fund-level administrative services in connection with the Fund’s operations. As compensation for its services under the investment management agreement, Allspring Funds Management is entitled to receive a management fee at the following annual rate based on the Fund’s average daily net assets:
| Average daily net assets | Management fee |
| First $500 million | 0.400% |
| Next $500 million | 0.375 |
| Next $2 billion | 0.350 |
| Next $2 billion | 0.325 |
| Next $5 billion | 0.290 |
| Over $10 billion | 0.280 |
For the six months ended December 31, 2022, the management fee was equivalent to an annual rate of 0.40% of the Fund’s average daily net assets.
Allspring Funds Management has retained the services of a subadviser to provide daily portfolio management to the Fund. The fee for subadvisory services is borne by Allspring Funds Management. Allspring Global Investments, LLC, an affiliate of Allspring Funds Management and a wholly owned subsidiary of Allspring Global Investments Holdings, LLC, is the subadviser to the Fund and is entitled to receive a fee from Allspring Funds Management at an annual rate starting at 0.20% and declining to 0.10% as the average daily net assets of the Fund increase.
Administration fees
Under a class-level administration agreement, Allspring Funds Management provides class-level administrative services to the Fund, which includes paying fees and expenses for services provided by the transfer agent, sub-transfer agents, omnibus account servicers and record-keepers. As compensation for its services under the class-level administration agreement, Allspring Funds Management receives an annual fee which is calculated based on the average daily net assets of each class as follows:
| | Class-level
administration fee |
| Class A | 0.16% |
| Class C | 0.16 |
| Class R6 | 0.03 |
| Administrator Class | 0.10 |
| Institutional Class | 0.08 |
Waivers and/or expense reimbursements
Allspring Funds Management has contractually committed to waive and/or reimburse management and administration fees to the extent necessary to maintain certain net operating expense ratios for the Fund. When each class of the Fund has exceeded its expense cap, Allspring Funds Management will waive fees and/or reimburse expenses from fund-level expenses on a proportionate basis and then from class specific expenses. When only certain classes exceed their expense caps, waivers and/or reimbursements are applied against class specific expenses before fund-level expenses. Allspring Funds Management has contractually committed through October 31, 2023 to waive fees and/or reimburse expenses to the extent necessary to cap expenses. Prior to or after the commitment expiration date, the caps may be increased or the commitment to maintain the caps may be terminated only with the approval of the Board of Trustees. In addition to the contractual waivers and/or reimbursements, Allspring Funds Management also voluntarily waived certain class-level expenses during the six months ended
Allspring Municipal Sustainability Fund | 27
Notes to financial statements (unaudited)
December 31, 2022. These voluntary class-level waivers may be discontinued at any time. As of December 31, 2022, the contractual expense caps are as follows:
| | Expense ratio caps |
| Class A | 0.75% |
| Class C | 1.50 |
| Class R6 | 0.40 |
| Administrator Class | 0.60 |
| Institutional Class | 0.45 |
Distribution fee
The Trust has adopted a distribution plan for Class C shares pursuant to Rule 12b-1 under the 1940 Act. A distribution fee is charged to Class C shares and paid to Allspring Funds Distributor, LLC ("Allspring Funds Distributor"), the principal underwriter, an affiliate of Allspring Funds Management, at an annual rate up to 0.75% of the average daily net assets of Class C shares.
In addition, Allspring Funds Distributor is entitled to receive the front-end sales charge from the purchase of Class A shares and a contingent deferred sales charge on the redemption of certain Class A shares. Allspring Funds Distributor is also entitled to receive the contingent deferred sales charges from redemptions of Class C shares. Allspring Funds Distributor did not receive any front-end or contingent deferred sales charges from Class A or Class C shares for the six months ended December 31, 2022.
Shareholder servicing fees
The Trust has entered into contracts with one or more shareholder servicing agents, whereby Class A, Class C and Administrator Class are charged a fee at an annual rate up to 0.25% of the average daily net assets of each respective class. A portion of these total shareholder servicing fees were paid to affiliates of the Fund.
Interfund transactions
The Fund may purchase or sell portfolio investment securities to certain affiliates pursuant to Rule 17a-7 under the 1940 Act and under procedures adopted by the Board of Trustees. The procedures have been designed to ensure that these interfund transactions, which do not incur broker commissions, are effected at current market prices.
5. INVESTMENT PORTFOLIO TRANSACTIONS
Purchases and sales of investments, excluding U.S. government obligations (if any) and short-term securities, for the six months ended December 31, 2022 were $1,107,092 and $451,468, respectively.
6. BANK BORROWINGS
The Trust (excluding the money market funds), Allspring Master Trust and Allspring Variable Trust are parties to a $350,000,000 revolving credit agreement whereby the Fund is permitted to use bank borrowings for temporary or emergency purposes, such as to fund shareholder redemption requests. Interest under the credit agreement is charged to the Fund based on a borrowing rate equal to the higher of the Federal Funds rate or the overnight bank funding rate in effect on that day plus a spread. In addition, an annual commitment fee equal based on the unused balance is allocated to each participating fund.
For the six months ended December 31, 2022, there were no borrowings by the Fund under the agreement.
7. MARKET RISKS
On March 11, 2020, the World Health Organization announced that it had made the assessment that coronavirus disease 2019 (“COVID-19”) is a pandemic. The impacts of COVID-19 are affecting the entire global economy, individual companies and investment products, the funds, and the market in general. There is significant uncertainty around the extent and duration of business disruptions related to COVID-19 and the impacts may last for an extended period of time. COVID-19 has led to significant uncertainty and volatility in the financial markets.
8. INDEMNIFICATION
Under the Fund's organizational documents, the officers and Trustees have been granted certain indemnification rights against certain liabilities that may arise out of performance of their duties to the Fund. The Fund has entered into a separate agreement with each Trustee that converts indemnification rights currently existing under the Fund’s organizational
28 | Allspring Municipal Sustainability Fund
Notes to financial statements (unaudited)
documents into contractual rights that cannot be changed in the future without the consent of the Trustee. Additionally, in the normal course of business, the Fund may enter into contracts with service providers that contain a variety of indemnification clauses. The Fund’s maximum exposure under these arrangements is dependent on future claims that may be made against the Fund and, therefore, cannot be estimated.
Allspring Municipal Sustainability Fund | 29
Other information (unaudited)
PROXY VOTING INFORMATION
A description of the policies and procedures used to determine how to vote proxies relating to portfolio securities is available without charge, upon request, by calling 1-800-222-8222, visiting our website at allspringglobal.com, or visiting the SEC website at sec.gov. Information regarding how the proxies related to portfolio securities were voted during the most recent 12-month period ended June 30 is available on the website at allspringglobal.com or by visiting the SEC website at sec.gov.
QUARTERLY PORTFOLIO HOLDINGS INFORMATION
The Fund files its complete schedule of portfolio holdings with the SEC for the first and third quarters of each fiscal year as an exhibit to its reports on Form N-PORT. Shareholders may view the filed Form N-PORT by visiting the SEC website at sec.gov.
30 | Allspring Municipal Sustainability Fund
Other information (unaudited)
BOARD OF TRUSTEES AND OFFICERS
Each of the Trustees and Officers listed in the table below acts in identical capacities for each fund in the Allspring family of funds, which consists of 127 mutual funds comprising the Allspring Funds Trust, Allspring Variable Trust, Allspring Master Trust and four closed-end funds (collectively the “Fund Complex”). This table should be read in conjunction with the Prospectus and the Statement of Additional Information1. The mailing address of each Trustee and Officer is 1415 Vantage Park Drive, 3rd Floor, Charlotte, NC 28203. Each Trustee and Officer serves an indefinite term, however, each Trustee serves such term until reaching the mandatory retirement age established by the Trustees.
Independent Trustees
Name and
year of birth | Position held and
length of service* | Principal occupations during past five years or longer | Current other
public company or
investment
company
directorships |
William R. Ebsworth
(Born 1957) | Trustee,
since 2015 | Retired. From 1984 to 2013, equities analyst, portfolio manager, research director and chief investment officer at Fidelity Management and Research Company in Boston, Tokyo, and Hong Kong, and retired in 2013 as Chief Investment Officer of Fidelity Strategic Advisers, Inc. where he led a team of investment professionals managing client assets. Prior thereto, Board member of Hong Kong Securities Clearing Co., Hong Kong Options Clearing Corp., the Thailand International Fund, Ltd., Fidelity Investments Life Insurance Company, and Empire Fidelity Investments Life Insurance Company. Audit Committee Chair and Investment Committee Chair of the Vincent Memorial Hospital Foundation (non-profit organization). Mr. Ebsworth is a CFA® charterholder. | N/A |
Jane A. Freeman
(Born 1953) | Trustee,
since 2015;
Chair Liaison,
since 2018 | Retired. From 2012 to 2014 and 1999 to 2008, Chief Financial Officer of Scientific Learning Corporation. From 2008 to 2012, Ms. Freeman provided consulting services related to strategic business projects. Prior to 1999, Portfolio Manager at Rockefeller & Co. and Scudder, Stevens & Clark. Board member of the Harding Loevner Funds from 1996 to 2014, serving as both Lead Independent Director and chair of the Audit Committee. Board member of the Russell Exchange Traded Funds Trust from 2011 to 2012 and the chair of the Audit Committee. Ms. Freeman is also an inactive Chartered Financial Analyst. | N/A |
Isaiah Harris, Jr.
(Born 1952) | Trustee,
since 2009; Audit
Committee
Chair,
since 2019 | Retired. Member of the Advisory Board of CEF of East Central Florida. Chairman of the Board of CIGNA Corporation from 2009 to 2021, and Director from 2005 to 2008. From 2003 to 2011, Director of Deluxe Corporation. Prior thereto, President and CEO of BellSouth Advertising and Publishing Corp. from 2005 to 2007, President and CEO of BellSouth Enterprises from 2004 to 2005 and President of BellSouth Consumer Services from 2000 to 2003. Emeritus member of the Iowa State University Foundation Board of Governors. Emeritus Member of the Advisory Board of Iowa State University School of Business. Advisory Board Member, Palm Harbor Academy (private school). Advisory Board Member, Fellowship of Christian Athletes. Mr. Harris is a certified public accountant (inactive status). | N/A |
David F. Larcker
(Born 1950) | Trustee,
since 2009 | Distinguished Visiting Fellow at the Hoover Institution since 2022. James Irvin Miller Professor of Accounting at the Graduate School of Business (Emeritus), Stanford University, Director of the Corporate Governance Research Initiative and Senior Faculty of The Rock Center for Corporate Governance since 2006. From 2005 to 2008, Professor of Accounting at the Graduate School of Business, Stanford University. Prior thereto, Ernst & Young Professor of Accounting at The Wharton School, University of Pennsylvania from 1985 to 2005. | N/A |
Allspring Municipal Sustainability Fund | 31
Other information (unaudited)
Name and
year of birth | Position held and
length of service* | Principal occupations during past five years or longer | Current other
public company or
investment
company
directorships |
Olivia S. Mitchell
(Born 1953) | Trustee,
since 2006;
Nominating and
Governance
Committee Chair,
since 2018 | International Foundation of Employee Benefit Plans Professor since 1993, Wharton School of the University of Pennsylvania. Director of Wharton’s Pension Research Council and Boettner Center on Pensions & Retirement Research, and Research Associate at the National Bureau of Economic Research. Previously taught at Cornell University from 1978 to 1993. | N/A |
Timothy J. Penny
(Born 1951) | Trustee,
since 1996;
Chair,
since 2018 | President and Chief Executive Officer of Southern Minnesota Initiative Foundation, a non-profit organization, since 2007. Vice Chair of the Economic Club of Minnesota, since 2007. Co-Chair of the Committee for a Responsible Federal Budget, since 1995. Member of the Board of Trustees of NorthStar Education Finance, Inc., a non-profit organization, from 2007-2022. Senior Fellow of the University of Minnesota Humphrey Institute from 1995 to 2017. | N/A |
James G. Polisson
(Born 1959) | Trustee,
since 2018 | Retired. Chief Marketing Officer, Source (ETF) UK Services, Ltd, from 2015 to 2017. From 2012 to 2015, Principal of The Polisson Group, LLC, a management consulting, corporate advisory and principal investing company. Chief Executive Officer and Managing Director at Russell Investments, Global Exchange Traded Funds from 2010 to 2012. Managing Director of Barclays Global Investors from 1998 to 2010 and Global Chief Marketing Officer for iShares and Barclays Global Investors from 2000 to 2010. Trustee of the San Francisco Mechanics’ Institute, a non-profit organization, from 2013 to 2015. Board member of the Russell Exchange Traded Fund Trust from 2011 to 2012. Director of Barclays Global Investors Holdings Deutschland GmbH from 2006 to 2009. Mr. Polisson is an attorney and has a retired status with the Massachusetts and District of Columbia Bar Associations. | N/A |
Pamela Wheelock
(Born 1959) | Trustee,
since January
2020; previously
Trustee from
January 2018 to
July 2019 | Retired. Executive and Senior Financial leadership positions in the public, private and nonprofit sectors. Interim President and CEO, McKnight Foundation, 2020. Interim Commissioner, Minnesota Department of Human Services, 2019. Chief Operating Officer, Twin Cities Habitat for Humanity, 2017-2019. Vice President for University Services, University of Minnesota, 2012-2016. Interim President and CEO, Blue Cross and Blue Shield of Minnesota, 2011-2012. Executive Vice-President and Chief Financial Officer, Minnesota Wild, 2002-2008. Commissioner, Minnesota Department of Finance, 1999-2002. Chair of the Board of Directors of Destination Medical Center Corporation. Board member of the Minnesota Wild Foundation. | N/A |
* Length of service dates reflect the Trustee’s commencement of service with the Trust’s predecessor entities, where applicable.
32 | Allspring Municipal Sustainability Fund
Other information (unaudited)
Officers2
Name and
year of birth | Position held and
length of service | Principal occupations during past five years or longer |
Andrew Owen
(Born 1960) | President,
since 2017 | President and Chief Executive Officer of Allspring Funds Management, LLC since 2017 and Head of Global Fund Governance of Allspring Global Investments since 2022. Prior thereto, co-president of Galliard Capital Management, LLC, an affiliate of Allspring Funds Management, LLC, from 2019 to 2022 and Head of Affiliated Managers, Allspring Global Investments, from 2014 to 2019 and Executive Vice President responsible for marketing, investments and product development for Allspring Funds Management, LLC, from 2009 to 2014. |
Jeremy DePalma
(Born 1974) | Treasurer,
since 2012
(for certain funds in
the Fund Complex);
since 2021 (for
the remaining funds in the
Fund Complex) | Senior Vice President of Allspring Funds Management, LLC since 2009. Senior Vice President of Evergreen Investment Management Company, LLC from 2008 to 2010 and head of the Fund Reporting and Control Team within Fund Administration from 2005 to 2010. |
Christopher Baker
(Born 1976) | Chief Compliance Officer, since 2022 | Global Chief Compliance Officer for Allspring Global Investments since 2022. Prior thereto, Chief Compliance Officer for State Street Global Advisors from 2018 to 2021. Senior Compliance Officer for the State Street divisions of Alternative Investment Solutions, Sector Solutions, and Global Marketing from 2015 to 2018. From 2010 to 2015 Vice President, Global Head of Investment and Marketing Compliance for State Street Global Advisors. |
Matthew Prasse
(Born 1983) | Chief Legal Officer, since 2022; Secretary, since 2021 | Senior Counsel of the Allspring Legal Department since 2021. Senior Counsel of the Wells Fargo Legal Department from 2018 to 2021. Previously, Counsel for Barings LLC from 2015 to 2018. Prior to joining Barings, Associate at Morgan, Lewis & Bockius LLP from 2008 to 2015. |
1 The Statement of Additional Information includes additional information about the Trustees and is available, without charge, upon request, by calling 1-800-222-8222 or by visiting the website at allspringglobal.com.
2 For those Officers with tenures at Allspring Global Investments and/or Allspring Funds Management, LLC that began prior to 2021, such tenures include years of service during which these businesses/entities were known as Wells Fargo Asset Management and Wells Fargo Funds Management, LLC, respectively.
Allspring Municipal Sustainability Fund | 33
For more information
More information about Allspring Funds is available free upon request. To obtain literature, please write, visit the Fund's website, or call:
Allspring Funds
P.O. Box 219967
Kansas City, MO 64121-9967
Website: allspringglobal.com
Individual investors: 1-800-222-8222
Retail investment professionals: 1-888-877-9275
Institutional investment professionals: 1-800-260-5969
This report and the financial statements contained herein are submitted for the general information of the shareholders of the Fund. If this report is used for promotional purposes, distribution of the report must be accompanied or preceded by a current prospectus. Before investing, please consider the investment objectives, risks, charges, and expenses of the investment. For a current prospectus and, if available, a summary prospectus, containing this information, call
1-800-222-8222 or visit the Fund's website at allspringglobal.com. Read the prospectus carefully before you invest or send money.
Allspring Global InvestmentsTM is the trade name for the asset management firms of Allspring Global Investments Holdings, LLC, a holding company indirectly owned by certain private funds of GTCR LLC and Reverence Capital Partners, L.P. These firms include but are not limited to Allspring Global Investments, LLC, and Allspring Funds Management, LLC. Certain products managed by Allspring entities are distributed by Allspring Funds Distributor, LLC (a broker-dealer and Member FINRA/SIPC).
This material is for general informational and educational purposes only and is NOT intended to provide investment advice or a recommendation of any kind - including a recommendation for any specific investment, strategy, or plan.
© 2023 Allspring Global Investments Holdings, LLC. All rights reserved.
ALL-01092023-4nnscyen 02-23
SAR4336 12-22
Semi-Annual Report
December 31, 2022
Allspring
Pennsylvania Tax-Free Fund
The views expressed and any forward-looking statements are as of December 31, 2022, unless otherwise noted, and are those of the Fund's portfolio managers and/or Allspring Global Investments. Discussions of individual securities or the markets generally are not intended as individual recommendations. Future events or results may vary significantly from those expressed in any forward-looking statements. The views expressed are subject to change at any time in response to changing circumstances in the market. Allspring Global Investments disclaims any obligation to publicly update or revise any views expressed or forward-looking statements.
Allspring Pennsylvania Tax-Free Fund | 1
Letter to shareholders (unaudited)
Andrew Owen
President
Allspring Funds
Dear Shareholder:
We are pleased to offer you this semi-annual report for the Allspring Pennsylvania Tax-Free Fund for the six-month period that ended December 31, 2022. Globally, stocks and bonds experienced heightened volatility and generally negative returns through the challenging period. Earlier tailwinds provided by global stimulus programs, vaccination rollouts, and recovering consumer and corporate sentiment were wiped away by the highest rate of inflation in four decades, the impact of ongoing aggressive central bank rate hikes and the prospect of more rate hikes. Compounding these concerns were the global reverberations of the Russia-Ukraine war and the impact of China’s strict COVID-19 lockdowns.
For the six-month period, stocks and bonds had mixed results, with emerging market equities trailing those of developed markets and both U.S. and non-U.S. bonds fighting an uphill battle in the face of sustained interest rate increases. For the period, U.S. stocks, based on the S&P 500 Index,1 gained 2.31%. International stocks, as measured by the MSCI ACWI ex USA Index (Net),2 returned 2.96%, while the MSCI EM Index (Net) (USD)3 declined 2.99%. Among bond indexes, the Bloomberg U.S. Aggregate Bond Index4 returned -2.97%, the Bloomberg Global Aggregate ex-USD Index (unhedged)5 returned -2.65%, the Bloomberg Municipal Bond Index6 gained 0.50%, and the ICE BofA U.S. High Yield Index7 returned 3.33%.
Persistent inflation and economic fallout from the Russia-Ukraine war drove markets.
Markets rebounded from earlier losses in July, led by U.S. stocks. While evidence pointed to an economic slowdown after two consecutive quarters of declining gross domestic product (economic contraction), the U.S. labor market remained surprisingly strong: July nonfarm payrolls grew by more than 500,000 and U.S. unemployment dipped to 3.5%. Meanwhile, crude oil and retail gasoline prices, major contributors to recent overall inflation, fell substantially from earlier highs. And while U.S. home prices rose, sales fell as houses became less affordable with mortgage rates at a 13-year high. The Federal Reserve (Fed) raised the federal funds rate another 0.75% in July—to a range of 2.25% to 2.50%—and forecasts pointed to further rate hikes.
| 1 | The S&P 500 Index consists of 500 stocks chosen for market size, liquidity, and industry group representation. It is a market-value-weighted index with each stock's weight in the index proportionate to its market value. You cannot invest directly in an index. |
| 2 | The Morgan Stanley Capital International (MSCI) All Country World Index (ACWI) ex USA Index (Net) is a free-float-adjusted market-capitalization-weighted index that is designed to measure the equity market performance of developed and emerging markets, excluding the U.S. Source: MSCI. MSCI makes no express or implied warranties or representations and shall have no liability whatsoever with respect to any MSCI data contained herein. The MSCI data may not be further redistributed or used as a basis for other indexes or any securities or financial products. This report is not approved, reviewed, or produced by MSCI. You cannot invest directly in an index. |
| 3 | The MSCI Emerging Markets (EM) Index (Net) (USD) is a free-float-adjusted market-capitalization-weighted index that is designed to measure equity market performance of emerging markets. You cannot invest directly in an index. |
| 4 | The Bloomberg U.S. Aggregate Bond Index is a broad-based benchmark that measures the investment-grade, U.S.-dollar-denominated, fixed-rate taxable bond market, including Treasuries, government-related and corporate securities, mortgage-backed securities (agency fixed-rate and hybrid adjustable-rate mortgage pass-throughs), asset-backed securities, and commercial mortgage-backed securities. You cannot invest directly in an index. |
| 5 | The Bloomberg Global Aggregate ex-USD Index (unhedged) is an unmanaged index that provides a broad-based measure of the global investment-grade fixed-income markets excluding the U.S.-dollar-denominated debt market. You cannot invest directly in an index. |
| 6 | The Bloomberg Municipal Bond Index is an unmanaged index composed of long-term tax-exempt bonds with a minimum credit rating of Baa. You cannot invest directly in an index. |
| 7 | The ICE BofA U.S. High Yield Index is a market-capitalization-weighted index of domestic and Yankee high-yield bonds. The index tracks the performance of high-yield securities traded in the U.S. bond market. You cannot invest directly in an index. Copyright 2023. ICE Data Indices, LLC. All rights reserved. |
2 | Allspring Pennsylvania Tax-Free Fund
Letter to shareholders (unaudited)
August was yet another broadly challenging month for financial markets, with more red ink flowing. High inflation persisted, cresting 9% in the eurozone on an annual basis and remaining above 8% in the U.S. despite the Fed’s aggressive monetary policy and a major drop in global crude oil and gasoline prices from their June peak. One positive note was the resilience of the U.S. job market. However, the Fed’s job was clearly not complete. One longer-term bright spot was the U.S. Congress’s passage of the Inflation Reduction Act. Its primary stated goals include: to reduce inflation (though not immediately) by curbing the deficit, capping health care spending by seniors, and investing in domestic sources of clean energy.
The market misery continued in September. There was nowhere to hide as all asset classes suffered major losses at the hands of persistent inflation. Central banks kept up their battle against rapidly rising prices with more rate hikes. The strength of the U.S. dollar made things even more difficult for investors holding assets in other currencies. U.S. mortgage rates jumped to near 7% on 30-year fixed-rate mortgages; the decreased housing affordability began to cool demand somewhat. The U.K. experienced a sharp sell-off of government bonds and the British pound in September as investors panicked in response to a new government budget that was seen as financially unsound. The market meltdown forced the Bank of England to step in and buy long-dated government bonds.
Equities had a reprieve in October after two months of sharp declines. Value stocks and small caps fared best. Globally, developed markets outpaced emerging market equities, which were hurt by weakness among Chinese stocks. Central banks continued to try to curtail high inflation with aggressive interest rate hikes. Geopolitical risks persisted, including the ongoing Russia-Ukraine war and economic, financial market, and political turmoil in the U.K., which led to a second prime ministerial change in six weeks, as Rishi Sunak replaced Liz Truss in late October. Concerns over Europe’s energy crisis eased thanks to unseasonably warm weather and plentiful gas on hand. The U.S. labor market continued its resilience against rising prices, as unemployment stood at 3.7%, near a record low.
Stocks and bonds rallied in November, with emerging market equities gaining nearly 15% and developed market equities returning 7%. The S&P 500 Index rose 5.6% in November. Bonds also had positive monthly returns. Economic news was encouraging, driven by U.S. labor market strength. Although central banks kept raising rates, expectations grew regarding an impending easing in the pace of rate hikes and a possible end to central bank monetary tightening in 2023. Although inflation remained at record highs in the eurozone, with a 10.6% annual increase in October, Germany’s producer prices decreased 4.2% annually, signaling a possible decline in inflationary pressures. Meanwhile, U.S. inflation continued to moderate, with a 7.1% annual price rise in November and a monthly price increase of just 0.1%. China’s economic data remained weak, reflecting its zero-COVID-19 policy.
Financial markets cooled in December, with U.S. equities posting negative overall results in response to a weakening U.S. dollar. Fixed income securities ended one of their worst years ever with flat overall monthly returns as markets weighed the hopes for an end to the monetary tightening cycle with the reality that central banks had not completed their jobs yet. U.S. Consumer Price Index (CPI)1 data showed a strong consistent trend downward, which brought down the 12-month CPI to 6.5% in December from 9.1% in June. Other countries and regions reported still-high but declining inflation rates as the year winded down.
“ The market misery continued in September. There was nowhere to hide as all asset classes suffered major losses at the hands of persistent inflation.”
| 1 | The Consumer Price Index (CPI) is a measure of the average change over time in the prices paid by urban consumers for a market basket of consumer goods and services. You cannot invest directly in an index. |
Allspring Pennsylvania Tax-Free Fund | 3
Letter to shareholders (unaudited)
Don’t let short-term uncertainty derail long-term investment goals.
Periods of investment uncertainty can present challenges, but experience has taught us that maintaining long-term investment goals can be an effective way to plan for the future. To help you create a sound strategy based on your personal goals and risk tolerance, Allspring Funds offers more than 100 mutual funds spanning a wide range of asset classes and investment styles. Although diversification cannot guarantee an investment profit or prevent losses, we believe it can be an effective way to manage investment risk and potentially smooth out overall portfolio performance. We encourage investors to know their investments and to understand that appropriate levels of risk-taking may unlock opportunities.
Thank you for choosing to invest with Allspring Funds. We appreciate your confidence in us and remain committed to helping you meet your financial needs.
Sincerely,
Andrew Owen
President
Allspring Funds
For further information about your fund, contact your investment professional, visit our website at allspringglobal.com, or call us directly at 1-800-222-8222.
4 | Allspring Pennsylvania Tax-Free Fund
This page is intentionally left blank.
Performance highlights (unaudited)
| Investment objective | The Fund seeks current income exempt from federal income tax and Pennsylvania individual income tax. |
| Manager | Allspring Funds Management, LLC |
| Subadviser | Allspring Global Investments, LLC |
| Portfolio managers | Bruce R. Johns, Kerry Laurin, Robert J. Miller |
| Average annual total returns (%) as of December 31, 2022 |
| | | Including sales charge | | Excluding sales charge | | Expense ratios1 (%) |
| | Inception date | 1 year | 5 year | 10 year | | 1 year | 5 year | 10 year | | Gross | Net 2 |
| Class A (EKVAX) | 12-27-1990 | -13.10 | -0.15 | 1.49 | | -9.01 | 0.77 | 1.96 | | 0.94 | 0.74 |
| Class C (EKVCX) | 2-1-1993 | -10.74 | 0.01 | 1.34 | | -9.74 | 0.01 | 1.34 | | 1.69 | 1.49 |
| Institutional Class (EKVYX) | 11-24-1997 | – | – | – | | -8.78 | 1.02 | 2.21 | | 0.61 | 0.49 |
| Bloomberg Municipal Bond Index3 | – | – | – | – | | -8.53 | 1.25 | 2.13 | | – | – |
| Bloomberg Pennsylvania Municipal Bond Index4 | – | – | – | – | | -9.05 | 1.41 | 2.35 | | – | – |
Figures quoted represent past performance, which is no guarantee of future results, and do not reflect taxes that a shareholder may pay on an investment in a fund. Investment return and principal value of an investment will fluctuate so that an investor’s shares, when redeemed, may be worth more or less than their original cost. Performance shown without sales charges would be lower if sales charges were reflected. Current performance may be lower or higher than the performance data quoted, which assumes the reinvestment of dividends and capital gains. Current month-end performance is available on the Fund’s website, allspringglobal.com.
Index returns do not include transaction costs associated with buying and selling securities, any mutual fund fees or expenses, or any taxes. It is not possible to invest directly in an index.
For Class A shares, the maximum front-end sales charge is 4.50%. For Class C shares, the maximum contingent deferred sales charge is 1.00%. Performance including a contingent deferred sales charge assumes the sales charge for the corresponding time period. Institutional Class shares are sold without a front-end sales charge or contingent deferred sales charge.
| 1 | Reflects the expense ratios as stated in the most recent prospectuses. The expense ratios shown are subject to change and may differ from the annualized expense ratios shown in the financial highlights of this report. |
| 2 | The manager has contractually committed through October 31, 2023, to waive fees and/or reimburse expenses to the extent necessary to cap total annual fund operating expenses after fee waivers at 0.74% for Class A, 1.49% for Class C, and 0.49% for Institutional Class. Brokerage commissions, stamp duty fees, interest, taxes, acquired fund fees and expenses (if any), and extraordinary expenses are excluded from the expense caps. Prior to or after the commitment expiration date, the caps may be increased or the commitment to maintain the caps may be terminated only with the approval of the Board of Trustees. Without these caps, the Fund’s returns would have been lower. The expense ratio paid by an investor is the net expense ratio (the total annual fund operating expenses after fee waivers) as stated in the prospectuses. |
| 3 | The Bloomberg Municipal Bond Index is an unmanaged index composed of long-term tax-exempt bonds with a minimum credit rating of Baa. You cannot invest directly in an index. |
| 4 | The Bloomberg Pennsylvania Municipal Bond Index is a Pennsylvania-specific total return index. The index is composed of Pennsylvania bonds. The bonds are all investment-grade, fixed-rate, long-term maturities (greater than two years) and are selected from issues larger than $50 million dated since January 1984. Bonds are added to the index and weighted and updated monthly, with a one-month lag. You cannot invest directly in an index. |
Bond values fluctuate in response to the financial condition of individual issuers, general market and economic conditions, and changes in interest rates. Changes in market conditions and government policies may lead to periods of heightened volatility in the bond market and reduced liquidity for certain bonds held by the Fund. In general, when interest rates rise, bond values fall and investors may lose principal value. Interest rate changes and their impact on the Fund and its share price can be sudden and unpredictable. The use of derivatives may reduce returns and/or increase volatility. Certain investment strategies tend to increase the total risk of an investment (relative to the broader market). This fund is exposed to Pennsylvania municipal securities risk and high-yield securities risk. Consult the Fund’s prospectus for additional information on these and other risks. A portion of the Fund’s income may be subject to federal, state, and/or local income taxes or the Alternative Minimum Tax (AMT). Any capital gains distributions may be taxable.
6 | Allspring Pennsylvania Tax-Free Fund
Performance highlights (unaudited)
| Credit quality as of December 31, 20221 |
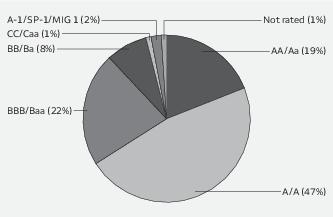
| 1 | The credit quality distribution of portfolio holdings reflected in the chart is based on ratings from Standard & Poor’s, Moody’s Investors Service, and/or Fitch Ratings Ltd. Credit quality ratings apply to the underlying holdings of the Fund and not to the Fund itself. The percentages of the portfolio with the ratings depicted in the chart are calculated based on the market value of fixed income securities held by the Fund. If a security was rated by all three rating agencies, the middle rating was utilized. If rated by two of the three rating agencies, the lower rating was utilized, and if rated by one of the rating agencies, that rating was utilized. Standard & Poor’s rates the creditworthiness of bonds, ranging from AAA (highest) to D (lowest). Ratings from A to CCC may be modified by the addition of a plus (+) or minus (-) sign to show relative standing within the rating categories. Standard & Poor’s rates the creditworthiness of short-term notes from SP-1 (highest) to SP-3 (lowest). Moody’s rates the creditworthiness of bonds, ranging from Aaa (highest) to C (lowest). Ratings Aa to B may be modified by the addition of a number 1 (highest) to 3 (lowest) to show relative standing within the ratings categories. Moody’s rates the creditworthiness of short-term U.S. tax-exempt municipal securities from MIG 1/VMIG 1 (highest) to SG (lowest). Fitch rates the creditworthiness of bonds, ranging from AAA (highest) to D (lowest). Credit quality distribution is subject to change and may have changed since the date specified. |
| Effective maturity distribution as of December 31, 20221 |
| 1 | Figures represent the percentage of the Fund's long-term investments. Allocations are subject to change and may have changed since the date specified. |
Allspring Pennsylvania Tax-Free Fund | 7
Fund expenses (unaudited)
As a shareholder of the Fund, you incur two types of costs: (1) transaction costs, including sales charges (loads) on purchase payments and contingent deferred sales charges (if any) on redemptions and (2) ongoing costs, including management fees, distribution (12b-1) and/or shareholder servicing fees, and other Fund expenses. This example is intended to help you understand your ongoing costs (in dollars) of investing in the Fund and to compare these costs with the ongoing costs of investing in other mutual funds.
The example is based on an investment of $1,000 invested at the beginning of the six-month period and held for the entire period from July 1, 2022 to December 31, 2022.
Actual expenses
The “Actual” line of the table below provides information about actual account values and actual expenses. You may use the information in this line, together with the amount you invested, to estimate the expenses that you paid over the period. Simply divide your account value by $1,000 (for example, an $8,600 account value divided by $1,000 = 8.6), then multiply the result by the number in the “Actual” line under the heading entitled “Expenses paid during period” for your applicable class of shares to estimate the expenses you paid on your account during this period.
Hypothetical example for comparison purposes
The “Hypothetical” line of the table below provides information about hypothetical account values and hypothetical expenses based on the Fund’s actual expense ratio and an assumed rate of return of 5% per year before expenses, which is not the Fund’s actual return. The hypothetical account values and expenses may not be used to estimate the actual ending account balance or expenses you paid for the period. You may use this information to compare the ongoing costs of investing in the Fund and other funds. To do so, compare this 5% hypothetical example with the 5% hypothetical examples that appear in the shareholder reports of the other funds.
Please note that the expenses shown in the table are meant to highlight your ongoing costs only and do not reflect any transactional costs, such as sales charges (loads) and contingent deferred sales charges. Therefore, the “Hypothetical” line of the table is useful in comparing ongoing costs only, and will not help you determine the relative total costs of owning different funds. In addition, if these transactional costs were included, your costs would have been higher.
| | Beginning
account value
7-1-2022 | Ending
account value
12-31-2022 | Expenses
paid during
the period1 | Annualized net
expense ratio |
| Class A | | | | |
| Actual | $1,000.00 | $ 997.23 | $3.73 | 0.74% |
| Hypothetical (5% return before expenses) | $1,000.00 | $1,021.48 | $3.77 | 0.74% |
| Class C | | | | |
| Actual | $1,000.00 | $ 993.36 | $7.49 | 1.49% |
| Hypothetical (5% return before expenses) | $1,000.00 | $1,017.69 | $7.58 | 1.49% |
| Institutional Class | | | | |
| Actual | $1,000.00 | $ 998.49 | $2.47 | 0.49% |
| Hypothetical (5% return before expenses) | $1,000.00 | $1,022.74 | $2.50 | 0.49% |
1 Expenses paid is equal to the annualized net expense ratio of each class multiplied by the average account value over the period, multiplied by 184 divided by 365 (to reflect the one-half-year period).
8 | Allspring Pennsylvania Tax-Free Fund
Portfolio of investments—December 31, 2022 (unaudited)
| | | Interest
rate | Maturity
date | Principal | Value |
| Municipal obligations: 98.89% | | | | | |
| Georgia: 0.44% | | | | | |
| Utilities revenue: 0.44% | | | | | |
| Main Street Natural Gas Incorporated Gas Supply Revenue Bonds Series 2022C 144Aøø | | 4.00% | 8-1-2052 | $ 500,000 | $ 470,091 |
| Guam: 1.16% | | | | | |
| Airport revenue: 0.75% | | | | | |
| Guam International Airport Authority Revenue Bonds Series A %% | | 5.25 | 10-1-2031 | 200,000 | 202,394 |
| Guam Port Authority AMT Series B | | 5.00 | 7-1-2032 | 550,000 | 582,771 |
| | | | | | 785,165 |
| Tax revenue: 0.41% | | | | | |
| Guam Government Business Privilege Tax Revenue Refunding Bonds Series F | | 4.00 | 1-1-2042 | 500,000 | 435,755 |
| | | | | | 1,220,920 |
| Illinois: 1.39% | | | | | |
| GO revenue: 0.58% | | | | | |
| Illinois GO Tax-Exempt Refunding Bonds 2019 Series B | | 5.00 | 9-1-2025 | 595,000 | 609,380 |
| Miscellaneous revenue: 0.81% | | | | | |
| Chicago IL Special Assessment Improvement Bonds Refunding Bond Series 2022 144A | | 2.27 | 12-1-2024 | 315,000 | 301,070 |
| Illinois Series 2014 | | 5.00 | 5-1-2025 | 550,000 | 557,070 |
| | | | | | 858,140 |
| | | | | | 1,467,520 |
| Pennsylvania: 95.90% | | | | | |
| Airport revenue: 3.46% | | | | | |
| Allegheny County PA Airport Authority Pittsburgh International Airport Series A | | 5.00 | 1-1-2051 | 1,500,000 | 1,515,002 |
| Philadelphia PA Airport Revenue Refunding Bond AMT Series A | | 5.00 | 6-15-2030 | 1,500,000 | 1,539,311 |
| Philadelphia PA Airport Revenue Refunding Bonds Series 2015A | | 5.00 | 6-15-2026 | 580,000 | 599,909 |
| | | | | | 3,654,222 |
| Education revenue: 21.61% | | | | | |
| Allegheny County PA Higher Education Robert Morris University | | 5.00 | 10-15-2037 | 750,000 | 745,964 |
| Chester County PA IDA Avon Grove Charter School Project Refunding Bond Series A | | 5.00 | 12-15-2047 | 1,160,000 | 1,151,117 |
| Chester County PA IDA Collegium Charter School Project Series A | | 5.13 | 10-15-2037 | 1,000,000 | 955,490 |
| Chester County PA IDA Renaissance Academy Charter School Project | | 3.75 | 10-1-2024 | 255,000 | 255,844 |
| Cumberland County PA Municipal Authority Revenue Bonds Series 2016 | | 5.00 | 5-1-2032 | 940,000 | 991,039 |
| Delaware County PA Neumann University Bond | | 5.00 | 10-1-2039 | 250,000 | 248,969 |
| Huntingdon County PA AICUP Financing Program | | 5.00 | 10-1-2051 | 2,000,000 | 2,000,199 |
The accompanying notes are an integral part of these financial statements.
Allspring Pennsylvania Tax-Free Fund | 9
Portfolio of investments—December 31, 2022 (unaudited)
| | | Interest
rate | Maturity
date | Principal | Value |
| Education revenue (continued) | | | | | |
| Latrobe PA IDA Seton Hall University | | 4.00% | 3-1-2051 | $ 800,000 | $ 619,879 |
| Lehigh County PA General Purpose Authority Charter School Revenue Bonds Series 2022 | | 4.00 | 6-1-2032 | 675,000 | 659,201 |
| Lehigh County PA IDA Seven Generations Charter School | | 4.00 | 5-1-2051 | 750,000 | 526,423 |
| Montgomery County PA Higher Education and Health Authority Arcadia University Refunding Bond | | 5.00 | 4-1-2030 | 1,500,000 | 1,541,976 |
| Montgomery County PA IDA Germantown Academy Project | | 4.00 | 10-1-2041 | 450,000 | 383,314 |
| Montgomery County PA IDA Germantown Academy Project | | 4.00 | 10-1-2046 | 225,000 | 182,602 |
| Montgomery County PA IDA Germantown Academy Project | | 4.00 | 10-1-2051 | 825,000 | 646,508 |
| Northeastern Pennsylvania Hospital & Education Authority Refunding Bond Wilkes University Project Series B | | 5.25 | 3-1-2037 | 1,000,000 | 1,024,253 |
| Pennsylvania Higher Educational University Pennsylvania Ursinus College Project Series A | | 5.00 | 11-1-2026 | 500,000 | 518,351 |
| Pennsylvania Higher Educational University Pennsylvania Ursinus College Project Series A | | 5.00 | 11-1-2027 | 300,000 | 312,875 |
| Pennsylvania State University Refunding Bond Series B | | 5.00 | 9-1-2034 | 2,175,000 | 2,335,966 |
| Philadelphia Authority For Industrial Development Charter School Revenue Bonds Series 2022A | | 5.00 | 6-15-2032 | 340,000 | 328,321 |
| Philadelphia PA IDA 1st Philadelphia Preparatory Charter School Project Series A | | 7.00 | 6-15-2033 | 1,000,000 | 1,041,460 |
| Philadelphia PA IDA Charter School Philadelphia Performing Arts 144A | | 5.00 | 6-15-2029 | 220,000 | 222,607 |
| Philadelphia PA IDA Charter School Philadelphia Performing Arts 144A | | 5.00 | 6-15-2030 | 145,000 | 146,302 |
| Philadelphia PA IDA Independence Charter School Project | | 5.00 | 6-15-2039 | 250,000 | 233,496 |
| Philadelphia PA IDA La Salle University | | 5.00 | 5-1-2036 | 1,355,000 | 1,226,000 |
| Philadelphia PA IDA Tacony Academy Charter School Project | | 6.88 | 6-15-2033 | 1,000,000 | 1,013,283 |
| Philadelphia PA IDA Temple University 1st Series 2016 | | 5.00 | 4-1-2029 | 1,000,000 | 1,043,339 |
| Philadelphia PA IDA West Philadelphia Achievement Charter Elementary School Project | | 7.50 | 5-1-2031 | 1,285,000 | 1,286,882 |
| South Central Pennsylvania General Authority AICUP Financing Program York College | | 4.00 | 5-1-2032 | 330,000 | 329,436 |
| South Central Pennsylvania General Authority AICUP Financing Program York College | | 4.00 | 5-1-2033 | 315,000 | 313,274 |
| South Central Pennsylvania General Authority AICUP Financing Program York College | | 4.00 | 5-1-2034 | 550,000 | 545,536 |
| | | | | | 22,829,906 |
| GO revenue: 16.89% | | | | | |
| Blue Mountain PA School District Series B (AGM Insured) | | 4.00 | 8-1-2035 | 250,000 | 258,389 |
| Blue Mountain PA School District Series B (AGM Insured) | | 4.00 | 8-1-2036 | 350,000 | 353,874 |
| Blue Mountain PA School District Series B (AGM Insured) | | 4.00 | 8-1-2037 | 350,000 | 351,622 |
| Blue Mountain PA School District Series B (AGM Insured) | | 4.00 | 8-1-2038 | 250,000 | 251,641 |
| Central Dauphin PA School District | | 5.00 | 2-1-2037 | 2,075,000 | 2,168,200 |
| Coatesville PA Area School District CAB Series C (BAM Insured) ¤ | | 0.00 | 10-1-2033 | 1,000,000 | 637,379 |
| Erie PA City School District Limited Tax Series A (AGM Insured) | | 5.00 | 4-1-2034 | 515,000 | 567,354 |
| Moon Area PA School District GO Bonds Series 2015 A | | 5.00 | 11-15-2028 | 150,000 | 155,743 |
| North Allegheny PA School District | | 5.00 | 5-1-2030 | 100,000 | 114,063 |
| Northeastern Pennsylvania School District | | 5.00 | 5-1-2031 | 290,000 | 330,477 |
| Oil City PA Series A (AGM Insured) | | 4.00 | 12-1-2039 | 315,000 | 313,618 |
| Oil City PA Series A (AGM Insured) | | 4.00 | 12-1-2040 | 250,000 | 246,808 |
| Oil City PA Series A (AGM Insured) | | 4.00 | 12-1-2041 | 250,000 | 244,715 |
| Oil City PA Series A (AGM Insured) | | 4.00 | 12-1-2042 | 200,000 | 195,927 |
| Parkland PA School District Series A | | 4.00 | 2-1-2029 | 300,000 | 320,641 |
The accompanying notes are an integral part of these financial statements.
10 | Allspring Pennsylvania Tax-Free Fund
Portfolio of investments—December 31, 2022 (unaudited)
| | | Interest
rate | Maturity
date | Principal | Value |
| GO revenue (continued) | | | | | |
| Parkland PA School District Series B | | 4.00% | 2-1-2036 | $ 650,000 | $ 661,856 |
| Penn-Delco School District | | 4.00 | 6-1-2045 | 1,000,000 | 964,708 |
| Pequea Valley School District | | 4.00 | 5-15-2049 | 750,000 | 711,041 |
| Philadelphia PA School District Refunding Bond Series A (AGM / FGIC Insured) | | 5.00 | 6-1-2024 | 1,325,000 | 1,358,108 |
| Philadelphia PA School District Series B | | 5.00 | 9-1-2043 | 1,235,000 | 1,297,049 |
| Philadelphia PA Series A | | 5.00 | 8-1-2036 | 1,250,000 | 1,323,086 |
| Pittsburgh PA (BAM Insured) | | 5.00 | 9-1-2030 | 500,000 | 518,360 |
| Pittsburgh PA Moon Area School District Series A | | 5.00 | 11-15-2029 | 1,445,000 | 1,500,328 |
| West Mifflin PA Area School District (AGM Insured) | | 5.00 | 4-1-2028 | 1,000,000 | 1,072,642 |
| West Shore PA School District | | 5.00 | 11-15-2048 | 1,500,000 | 1,558,090 |
| Wilkes-Barre School District Luzerne County PA Series 2019 (BAM Insured) | | 5.00 | 4-15-2027 | 100,000 | 108,066 |
| Wilkes-Barre School District Luzerne County PA Series 2019 (BAM Insured) | | 5.00 | 4-15-2028 | 120,000 | 131,920 |
| Wilkes-Barre School District Luzerne County PA Series 2019 (BAM Insured) | | 5.00 | 4-15-2029 | 50,000 | 55,932 |
| Wilkes-Barre School District Luzerne County PA Series 2019 (BAM Insured) | | 5.00 | 4-15-2030 | 70,000 | 78,701 |
| | | | | | 17,850,338 |
| Health revenue: 23.13% | | | | | |
| Allegheny County PA Hospital Development Authority Allegheny Health Network | | 4.00 | 4-1-2044 | 1,810,000 | 1,643,592 |
| Allegheny County PA Hospital Development Authority Health Center Series B (NPFGC Insured) | | 6.00 | 7-1-2027 | 1,800,000 | 2,022,978 |
| Allegheny County PA Hospital Development Authority Series 2017D-2 (SIFMA Municipal Swap +0.70%) ± | | 4.36 | 11-15-2047 | 1,000,000 | 971,628 |
| Berks County PA IDA Tower Health Project | | 5.00 | 11-1-2037 | 430,000 | 317,810 |
| Bucks County PA IDA St. Lukes University Health Network | | 4.00 | 8-15-2050 | 400,000 | 346,827 |
| Cumberland County PA Municipal Authority | | 5.00 | 1-1-2028 | 265,000 | 276,410 |
| Cumberland County PA Municipal Authority Revenue Bonds Lutheran Social Ministries 2015 | | 5.00 | 1-1-2028 | 640,000 | 667,557 |
| Cumberland County PA Municipal Authority Revenue Bonds Lutheran Social Ministries 2015 | | 5.00 | 1-1-2028 | 1,185,000 | 1,202,702 |
| Dauphin County PA General Authority Pinnacle Health System Project Series A | | 5.00 | 6-1-2035 | 1,000,000 | 1,034,630 |
| Doylestown PA Hospital Authority Doylestown Hospital Series A | | 5.00 | 7-1-2049 | 250,000 | 206,017 |
| East Hempfield Township PA IDA Willow Valley Communities Project Refunding Bond | | 5.00 | 12-1-2028 | 450,000 | 469,440 |
| East Hempfield Township PA IDA Willow Valley Communities Project Refunding Bond | | 5.00 | 12-1-2029 | 375,000 | 390,908 |
| Geisinger Authority PA Health System Revenue Bonds Series 2017 Series A | | 5.00 | 2-15-2045 | 1,000,000 | 1,018,941 |
| Geisinger Authority PA Health System Revenue Bonds Series 2020C | | 5.00 | 4-1-2043 | 500,000 | 548,384 |
| Geisinger PA Health System Series A-1 | | 4.00 | 4-1-2050 | 1,000,000 | 896,845 |
| Lancaster County PA Hospital Authority St. Anne's Retirement Community Incorporated | | 5.00 | 3-1-2045 | 500,000 | 422,358 |
| Montgomery County PA Higher Education and Health Authority Thomas Jefferson University Revenue Bonds Series 2022B | | 5.00 | 5-1-2052 | 1,000,000 | 969,380 |
| Montgomery County PA IDA ACTS Retirement Life Communities | | 5.00 | 11-15-2045 | 1,000,000 | 961,730 |
| Montgomery County PA IDA Waverly Heights Limited Project | | 5.00 | 12-1-2044 | 1,000,000 | 1,020,584 |
The accompanying notes are an integral part of these financial statements.
Allspring Pennsylvania Tax-Free Fund | 11
Portfolio of investments—December 31, 2022 (unaudited)
| | | Interest
rate | Maturity
date | Principal | Value |
| Health revenue (continued) | | | | | |
| Northampton County PA St. Luke's Hospital of Bethlehem Series A | | 5.00% | 8-15-2033 | $1,435,000 | $ 1,451,489 |
| Pennsylvania EDFA Series A | | 5.00 | 10-15-2035 | 645,000 | 701,530 |
| Pennsylvania EDFA Series A | | 5.00 | 10-15-2036 | 800,000 | 865,030 |
| Pennsylvania EDFA Series A-1 | | 4.00 | 4-15-2037 | 700,000 | 682,005 |
| Pennsylvania Higher Educational University of Pennsylvania Health System Series A | | 5.00 | 8-15-2040 | 1,500,000 | 1,541,857 |
| Pennsylvania Higher Educational University of Pennsylvania Health System Series A | | 5.00 | 8-15-2047 | 1,500,000 | 1,550,799 |
| The Hospitals and Higher Education Facilities Authority of Philadelphia Revenue Bonds Series 2022 (AGM Insured) | | 5.00 | 7-1-2037 | 1,000,000 | 1,072,502 |
| West Cornwall Township PA Municipal Authority Healthcare Facilities Lebanon Valley Brethren Home Project | | 4.00 | 11-15-2023 | 75,000 | 74,928 |
| West Cornwall Township PA Municipal Authority Healthcare Facilities Lebanon Valley Brethren Home Project | | 4.00 | 11-15-2041 | 370,000 | 316,618 |
| West Cornwall Township PA Municipal Authority Healthcare Facilities Lebanon Valley Brethren Home Project | | 4.00 | 11-15-2046 | 525,000 | 430,076 |
| Westmoreland County PA IDA Excela Health Project Series A | | 4.00 | 7-1-2037 | 400,000 | 364,014 |
| | | | | | 24,439,569 |
| Housing revenue: 1.44% | | | | | |
| Chester County PA IDA University Student Housing LLC Project Series A | | 5.00 | 8-1-2030 | 555,000 | 555,040 |
| Pennsylvania Housing Finance Agency MFHR Sherman Hills (Department of Housing and Urban Development Insured) øø | | 1.25 | 2-1-2025 | 1,000,000 | 972,099 |
| | | | | | 1,527,139 |
| Miscellaneous revenue: 12.09% | | | | | |
| Delaware County PA Neumann University Refunding Bond | | 5.00 | 10-1-2031 | 1,500,000 | 1,522,172 |
| Delaware Valley Regional Finance Authority Local Government Series D (TD Bank NA LOC) ø | | 3.65 | 11-1-2055 | 1,000,000 | 1,000,000 |
| Pennsylvania Certificate of Participation Series A | | 5.00 | 7-1-2038 | 1,000,000 | 1,072,063 |
| Pennsylvania Commonwealth Financing Authority Refunding Bond Series B | | 5.00 | 6-1-2031 | 250,000 | 287,393 |
| Pennsylvania EDFA Sewage Sludge Disposal Refunding Bond Philadelphia Bioslides Facility | | 4.00 | 1-1-2030 | 1,000,000 | 1,002,185 |
| Pennsylvania EDFA Tax-Exempt Private Revenue Bonds Series 2022 | | 5.75 | 6-30-2048 | 1,500,000 | 1,561,800 |
| Pennsylvania Financing Authority Pennsylvania Hills Project CAB Series B (NPFGC Insured) ¤ | | 0.00 | 12-1-2023 | 3,790,000 | 3,668,764 |
| Pennsylvania Public School Building Authority Chester Upland School District Project Series B | | 5.25 | 9-15-2030 | 540,000 | 582,087 |
| Pennsylvania Public School Building Authority Chester Upland School District Project Series C (AGM Insured) | | 5.00 | 9-15-2026 | 875,000 | 876,072 |
| Pennsylvania Public School Building Authority Harrisburg School District Project Series B-2 (BAM Insured) | | 5.00 | 12-1-2027 | 360,000 | 373,746 |
| Philadelphia PA Industrial Philadelphia Museum of Art Energy Saving Program Series A | | 5.00 | 2-15-2038 | 785,000 | 823,574 |
| | | | | | 12,769,856 |
The accompanying notes are an integral part of these financial statements.
12 | Allspring Pennsylvania Tax-Free Fund
Portfolio of investments—December 31, 2022 (unaudited)
| | | Interest
rate | Maturity
date | Principal | Value |
| Tax revenue: 2.05% | | | | | |
| Allentown PA Neighborhood Improvement Zone Development Authority Refunding Bond | | 5.00% | 5-1-2042 | $ 500,000 | $ 487,218 |
| Southeastern Pennsylvania Authority Revenue Bond, Series 2022 | | 5.25 | 6-1-2042 | 1,500,000 | 1,674,311 |
| | | | | | 2,161,529 |
| Transportation revenue: 5.50% | | | | | |
| Delaware River Joint Toll Bridge Commission | | 5.00 | 7-1-2042 | 580,000 | 604,091 |
| Pennsylvania Turnpike Commission Series A-2 | | 5.00 | 12-1-2048 | 2,000,000 | 2,077,329 |
| Pennsylvania Turnpike Commission Subordinate Bond Series A | | 5.50 | 12-1-2042 | 3,000,000 | 3,131,315 |
| | | | | | 5,812,735 |
| Utilities revenue: 0.97% | | | | | |
| Philadelphia PA Gas Works Revenue Bonds Fifteenth Series | | 5.00 | 8-1-2047 | 1,000,000 | 1,023,997 |
| Water & sewer revenue: 8.76% | | | | | |
| Allegheny County Sanitary Authority Sewer Revenue Bonds Series 2022 | | 5.75 | 6-1-2047 | 1,000,000 | 1,135,704 |
| Bucks County Water and Sewer Authority Revenue Bonds 2022 Series A (AGM Insured) | | 5.25 | 12-1-2047 | 2,175,000 | 2,372,441 |
| Capital Region Pennsylvania Water & Sewer System Refunding Bond | | 5.00 | 7-15-2037 | 1,000,000 | 1,069,188 |
| Lehigh County PA General Purpose Authority CAB Allentown Project ¤ | | 0.00 | 12-1-2030 | 2,000,000 | 1,486,335 |
| Luzerne County PA IDA Refunding Bonds AMT Pennsylvania American Water Company Project | | 2.45 | 12-1-2039 | 500,000 | 450,655 |
| Philadelphia PA Water & Wastewater Refunding Bond Series A | | 5.00 | 10-1-2038 | 2,000,000 | 2,149,438 |
| Philadelphia PA Water & Wastewater Refunding Bond Series R | | 5.00 | 6-1-2042 | 555,000 | 597,651 |
| | | | | | 9,261,412 |
| | | | | | 101,330,703 |
| Total Municipal obligations (Cost $109,581,161) | | | | | 104,489,234 |
| | | Yield | | Shares | |
| Short-term investments: 0.58% | | | | | |
| Investment companies: 0.58% | | | | | |
| Allspring Municipal Cash Management Money Market Fund Institutional Class ♠∞## | | 3.56 | | 606,377 | 606,498 |
| Total Short-term investments (Cost $606,498) | | | | | 606,498 |
| Total investments in securities (Cost $110,187,659) | 99.47% | | | | 105,095,732 |
| Other assets and liabilities, net | 0.53 | | | | 564,207 |
| Total net assets | 100.00% | | | | $105,659,939 |
The accompanying notes are an integral part of these financial statements.
Allspring Pennsylvania Tax-Free Fund | 13
Portfolio of investments—December 31, 2022 (unaudited)
| 144A | The security may be resold in transactions exempt from registration, normally to qualified institutional buyers, pursuant to Rule 144A under the Securities Act of 1933. |
| øø | The interest rate is determined and reset by the issuer periodically depending upon the terms of the security. The rate shown is the rate in effect at period end. |
| ¤ | The security is issued in zero coupon form with no periodic interest payments. |
| ± | Variable rate investment. The rate shown is the rate in effect at period end. |
| ø | Variable rate demand notes are subject to a demand feature which reduces the effective maturity. The maturity date shown represents the final maturity date of the security. The interest rate is determined and reset by the issuer daily, weekly, or monthly depending upon the terms of the security. The rate shown is the rate in effect at period end. |
| ## | All or a portion of this security is segregated for when-issued securities. |
| ♠ | The issuer of the security is an affiliated person of the Fund as defined in the Investment Company Act of 1940. |
| ∞ | The rate represents the 7-day annualized yield at period end. |
| %% | The security is purchased on a when-issued basis. |
| Abbreviations: |
| AGM | Assured Guaranty Municipal |
| AMT | Alternative minimum tax |
| BAM | Build America Mutual Assurance Company |
| CAB | Capital appreciation bond |
| EDFA | Economic Development Finance Authority |
| FGIC | Financial Guaranty Insurance Corporation |
| GO | General obligation |
| IDA | Industrial Development Authority |
| LOC | Letter of credit |
| MFHR | Multifamily housing revenue |
| NPFGC | National Public Finance Guarantee Corporation |
| SIFMA | Securities Industry and Financial Markets Association |
Investments in affiliates
An affiliated investment is an investment in which the Fund owns at least 5% of the outstanding voting shares of the issuer or as a result of other relationships, such as the Fund and the issuer having the same investment manager. Transactions with issuers that were affiliates of the Fund at the end of the period were as follows:
| | Value,
beginning of
period | Purchases | Sales
proceeds | Net
realized
gains
(losses) | Net
change in
unrealized
gains
(losses) | Value,
end of
period | Shares,
end
of period | Income
from
affiliated
securities |
| Short-term investments | | | | | | | |
| Allspring Municipal Cash Management Money Market Fund Institutional Class | $367,726 | $19,556,423 | $(19,316,920) | $(694) | $(37) | $606,498 | 606,377 | $23,774 |
The accompanying notes are an integral part of these financial statements.
14 | Allspring Pennsylvania Tax-Free Fund
Statement of assets and liabilities—December 31, 2022 (unaudited)
| | |
| Assets | |
Investments in unaffiliated securities, at value (cost $109,581,161)
| $ 104,489,234 |
Investments in affiliated securities, at value (cost $606,498)
| 606,498 |
Receivable for interest
| 1,157,567 |
Receivable for Fund shares sold
| 3,579 |
Prepaid expenses and other assets
| 34,496 |
Total assets
| 106,291,374 |
| Liabilities | |
Payable for Fund shares redeemed
| 256,706 |
Payable for when-issued transactions
| 203,590 |
Dividends payable
| 101,903 |
Management fee payable
| 23,175 |
Administration fees payable
| 10,645 |
Distribution fee payable
| 2,278 |
Trustees’ fees and expenses payable
| 960 |
Accrued expenses and other liabilities
| 32,178 |
Total liabilities
| 631,435 |
Total net assets
| $105,659,939 |
| Net assets consist of | |
Paid-in capital
| $ 111,527,331 |
Total distributable loss
| (5,867,392) |
Total net assets
| $105,659,939 |
| Computation of net asset value and offering price per share | |
Net assets – Class A
| $ 34,531,144 |
Shares outstanding – Class A1
| 3,278,761 |
Net asset value per share – Class A
| $10.53 |
Maximum offering price per share – Class A2
| $11.03 |
Net assets – Class C
| $ 3,077,778 |
Shares outstanding – Class C1
| 292,739 |
Net asset value per share – Class C
| $10.51 |
Net assets – Institutional Class
| $ 68,051,017 |
Shares outstanding – Institutional Class1
| 6,461,304 |
Net asset value per share – Institutional Class
| $10.53 |
| 1 | The Fund has an unlimited number of authorized shares. |
| 2 | Maximum offering price is computed as 100/95.50 of net asset value. On investments of $50,000 or more, the offering price is reduced. |
The accompanying notes are an integral part of these financial statements.
Allspring Pennsylvania Tax-Free Fund | 15
Statement of operations—six months ended December 31, 2022 (unaudited)
| | |
| Investment income | |
Interest
| $ 1,937,503 |
Income from affiliated securities
| 23,774 |
Total investment income
| 1,961,277 |
| Expenses | |
Management fee
| 221,605 |
| Administration fees | |
Class A
| 29,245 |
Class C
| 2,813 |
Institutional Class
| 28,292 |
| Shareholder servicing fees | |
Class A
| 45,622 |
Class C
| 4,375 |
| Distribution fee | |
Class C
| 13,126 |
Custody and accounting fees
| 5,100 |
Professional fees
| 26,766 |
Registration fees
| 22,379 |
Shareholder report expenses
| 11,015 |
Trustees’ fees and expenses
| 11,158 |
Other fees and expenses
| 3,635 |
Total expenses
| 425,131 |
| Less: Fee waivers and/or expense reimbursements | |
Fund-level
| (73,136) |
Class A
| (16,141) |
Class C
| (1,380) |
Net expenses
| 334,474 |
Net investment income
| 1,626,803 |
| Realized and unrealized gains (losses) on investments | |
| Net realized losses on | |
Unaffiliated securities
| (177,420) |
Affiliated securities
| (694) |
Net realized losses on investments
| (178,114) |
| Net change in unrealized gains (losses) on | |
Unaffiliated securities
| (1,567,319) |
Affiliated securities
| (37) |
Net change in unrealized gains (losses) on investments
| (1,567,356) |
Net realized and unrealized gains (losses) on investments
| (1,745,470) |
Net decrease in net assets resulting from operations
| $ (118,667) |
The accompanying notes are an integral part of these financial statements.
16 | Allspring Pennsylvania Tax-Free Fund
Statement of changes in net assets
| | | | | |
| | Six months ended
December 31, 2022
(unaudited) | Year ended
June 30, 2022 |
| Operations | | | | |
Net investment income
| | $ 1,626,803 | | $ 3,207,496 |
Net realized losses on investments
| | (178,114) | | (539,117) |
Net change in unrealized gains (losses) on investments
| | (1,567,356) | | (13,227,576) |
Net decrease in net assets resulting from operations
| | (118,667) | | (10,559,197) |
| Distributions to shareholders from | | | | |
| Net investment income and net realized gains | | | | |
Class A
| | (512,098) | | (988,899) |
Class C
| | (35,675) | | (83,574) |
Institutional Class
| | (1,078,842) | | (2,135,212) |
Total distributions to shareholders
| | (1,626,615) | | (3,207,685) |
| Capital share transactions | Shares | | Shares | |
| Proceeds from shares sold | | | | |
Class A
| 313,178 | 3,371,182 | 521,913 | 6,192,904 |
Class C
| 44,018 | 463,454 | 7,149 | 81,001 |
Institutional Class
| 1,470,472 | 15,358,957 | 1,209,101 | 13,809,591 |
| | | 19,193,593 | | 20,083,496 |
| Reinvestment of distributions | | | | |
Class A
| 44,939 | 472,406 | 80,133 | 921,865 |
Class C
| 3,289 | 34,523 | 7,039 | 81,111 |
Institutional Class
| 52,164 | 548,308 | 83,220 | 955,668 |
| | | 1,055,237 | | 1,958,644 |
| Payment for shares redeemed | | | | |
Class A
| (324,696) | (3,428,265) | (859,724) | (9,851,073) |
Class C
| (98,722) | (1,042,380) | (212,560) | (2,462,760) |
Institutional Class
| (1,654,505) | (17,417,481) | (1,544,113) | (17,311,128) |
| | | (21,888,126) | | (29,624,961) |
Net decrease in net assets resulting from capital share transactions
| | (1,639,296) | | (7,582,821) |
Total decrease in net assets
| | (3,384,578) | | (21,349,703) |
| Net assets | | | | |
Beginning of period
| | 109,044,517 | | 130,394,220 |
End of period
| | $105,659,939 | | $109,044,517 |
The accompanying notes are an integral part of these financial statements.
Allspring Pennsylvania Tax-Free Fund | 17
Financial highlights
(For a share outstanding throughout each period)
| | | Year ended June 30 |
| Class A | Six months ended
December 31, 2022
(unaudited) | 2022 | 2021 | 2020 | 2019 | 2018 |
Net asset value, beginning of period
| $10.71 | $11.97 | $11.75 | $11.78 | $11.48 | $11.67 |
Net investment income
| 0.15 | 0.28 | 0.31 | 0.35 | 0.35 | 0.38 |
Net realized and unrealized gains (losses) on investments
| (0.18) | (1.26) | 0.22 | (0.04) | 0.32 | (0.19) |
Total from investment operations
| (0.03) | (0.98) | 0.53 | 0.31 | 0.67 | 0.19 |
| Distributions to shareholders from | | | | | | |
Net investment income
| (0.15) | (0.28) | (0.31) | (0.34) | (0.34) | (0.38) |
Tax basis return of capital
| 0.00 | 0.00 | 0.00 | 0.00 | (0.03) | 0.00 |
Total distributions to shareholders
| (0.15) | (0.28) | (0.31) | (0.34) | (0.37) | (0.38) |
Net asset value, end of period
| $10.53 | $10.71 | $11.97 | $11.75 | $11.78 | $11.48 |
Total return1
| (0.28)% | (8.32)% | 4.52% | 2.65% | 6.00% | 1.62% |
| Ratios to average net assets (annualized) | | | | | | |
Gross expenses
| 0.95% | 0.94% | 0.94% | 0.97% | 0.96% | 0.91% |
Net expenses
| 0.74% | 0.74% | 0.74% | 0.74% | 0.74% | 0.74% |
Net investment income
| 2.80% | 2.41% | 2.64% | 2.92% | 3.07% | 3.25% |
| Supplemental data | | | | | | |
Portfolio turnover rate
| 10% | 20% | 21% | 14% | 9% | 10% |
Net assets, end of period (000s omitted)
| $34,531 | $34,755 | $41,945 | $41,550 | $41,255 | $40,664 |
| 1 | Total return calculations do not include any sales charges. Returns for periods of less than one year are not annualized. |
The accompanying notes are an integral part of these financial statements.
18 | Allspring Pennsylvania Tax-Free Fund
Financial highlights
(For a share outstanding throughout each period)
| | | Year ended June 30 |
| Class C | Six months ended
December 31, 2022
(unaudited) | 2022 | 2021 | 2020 | 2019 | 2018 |
Net asset value, beginning of period
| $10.69 | $11.95 | $11.73 | $11.76 | $11.45 | $11.65 |
Net investment income
| 0.11 1 | 0.19 1 | 0.22 | 0.27 | 0.26 1 | 0.29 1 |
Net realized and unrealized gains (losses) on investments
| (0.18) | (1.26) | 0.22 | (0.05) | 0.34 | (0.20) |
Total from investment operations
| (0.07) | (1.07) | 0.44 | 0.22 | 0.60 | 0.09 |
| Distributions to shareholders from | | | | | | |
Net investment income
| (0.11) | (0.19) | (0.22) | (0.25) | (0.26) | (0.29) |
Tax basis return of capital
| 0.00 | 0.00 | 0.00 | 0.00 | (0.03) | 0.00 |
Total distributions to shareholders
| (0.11) | (0.19) | (0.22) | (0.25) | (0.29) | (0.29) |
Net asset value, end of period
| $10.51 | $10.69 | $11.95 | $11.73 | $11.76 | $11.45 |
Total return2
| (0.66)% | (9.03)% | 3.74% | 1.89% | 5.31% | 0.77% |
| Ratios to average net assets (annualized) | | | | | | |
Gross expenses
| 1.70% | 1.68% | 1.68% | 1.72% | 1.70% | 1.66% |
Net expenses
| 1.49% | 1.49% | 1.49% | 1.49% | 1.49% | 1.49% |
Net investment income
| 2.04% | 1.64% | 1.89% | 2.23% | 2.32% | 2.50% |
| Supplemental data | | | | | | |
Portfolio turnover rate
| 10% | 20% | 21% | 14% | 9% | 10% |
Net assets, end of period (000s omitted)
| $3,078 | $3,679 | $6,485 | $8,394 | $8,768 | $13,440 |
| 1 | Calculated based upon average shares outstanding |
| 2 | Total return calculations do not include any sales charges. Returns for periods of less than one year are not annualized. |
The accompanying notes are an integral part of these financial statements.
Allspring Pennsylvania Tax-Free Fund | 19
Financial highlights
(For a share outstanding throughout each period)
| | | Year ended June 30 |
| Institutional Class | Six months ended
December 31, 2022
(unaudited) | 2022 | 2021 | 2020 | 2019 | 2018 |
Net asset value, beginning of period
| $10.71 | $11.97 | $11.75 | $11.78 | $11.48 | $11.67 |
Net investment income
| 0.16 | 0.31 | 0.34 | 0.38 | 0.38 | 0.40 |
Net realized and unrealized gains (losses) on investments
| (0.18) | (1.26) | 0.21 | (0.04) | 0.32 | (0.18) |
Total from investment operations
| (0.02) | (0.95) | 0.55 | 0.34 | 0.70 | 0.22 |
| Distributions to shareholders from | | | | | | |
Net investment income
| (0.16) | (0.31) | (0.33) | (0.37) | (0.37) | (0.41) |
Tax basis return of capital
| 0.00 | 0.00 | 0.00 | 0.00 | (0.03) | 0.00 |
Total distributions to shareholders
| (0.16) | (0.31) | (0.33) | (0.37) | (0.40) | (0.41) |
Net asset value, end of period
| $10.53 | $10.71 | $11.97 | $11.75 | $11.78 | $11.48 |
Total return1
| (0.15)% | (8.10)% | 4.78% | 2.91% | 6.27% | 1.88% |
| Ratios to average net assets (annualized) | | | | | | |
Gross expenses
| 0.62% | 0.61% | 0.61% | 0.64% | 0.62% | 0.58% |
Net expenses
| 0.49% | 0.49% | 0.49% | 0.49% | 0.49% | 0.49% |
Net investment income
| 3.05% | 2.66% | 2.88% | 3.18% | 3.31% | 3.50% |
| Supplemental data | | | | | | |
Portfolio turnover rate
| 10% | 20% | 21% | 14% | 9% | 10% |
Net assets, end of period (000s omitted)
| $68,051 | $70,610 | $81,964 | $80,592 | $79,128 | $88,663 |
| 1 | Returns for periods of less than one year are not annualized. |
The accompanying notes are an integral part of these financial statements.
20 | Allspring Pennsylvania Tax-Free Fund
Notes to financial statements (unaudited)
1. ORGANIZATION
Allspring Funds Trust (the "Trust"), a Delaware statutory trust organized on March 10, 1999, is an open-end management investment company registered under the Investment Company Act of 1940, as amended (the "1940 Act"). As an investment company, the Trust follows the accounting and reporting guidance in Financial Accounting Standards Board ("FASB") Accounting Standards Codification Topic 946, Financial Services – Investment Companies. These financial statements report on the Allspring Pennsylvania Tax-Free Fund (the "Fund") which is a diversified series of the Trust.
2. SIGNIFICANT ACCOUNTING POLICIES
The following significant accounting policies, which are consistently followed in the preparation of the financial statements of the Fund, are in conformity with U.S. generally accepted accounting principles which require management to make estimates and assumptions that affect the reported amounts of assets and liabilities, disclosure of contingent assets and liabilities at the date of the financial statements, and the reported amounts of income and expenses during the reporting period. Actual results could differ from those estimates.
Securities valuation
All investments are valued each business day as of the close of regular trading on the New York Stock Exchange (generally 4 p.m. Eastern Time), although the Fund may deviate from this calculation time under unusual or unexpected circumstances.
Debt securities are valued at the evaluated bid price provided by an independent pricing service (e.g. taking into account various factors, including yields, maturities, or credit ratings) or, if a reliable price is not available, the quoted bid price from an independent broker-dealer.
Futures contracts that are listed on a foreign or domestic exchange or market are valued at the official closing price or, if none, the last sales price.
Investments in registered open-end investment companies (other than those listed on a foreign or domestic exchange or market) are valued at net asset value.
Investments which are not valued using the methods discussed above are valued at their fair value, as determined in good faith by Allspring Funds Management, LLC ("Allspring Funds Management"), which was named the valuation designee by the Board of Trustees. As the valuation designee, Allspring Funds Management is responsible for day-to-day valuation activities for the Allspring Funds. In connection with these responsibilities, Allspring Funds Management has established a Valuation Committee and has delegated to it the authority to take any actions regarding the valuation of portfolio securities that the Valuation Committee deems necessary or appropriate, including determining the fair value of portfolio securities. On a quarterly basis, the Board of Trustees receives reports of valuation actions taken by the Valuation Committee. On at least an annual basis, the Board of Trustees receives an assessment of the adequacy and effectiveness of Allspring Funds Management's process for determining the fair value of the portfolio of investments.
When-issued transactions
The Fund may purchase securities on a forward commitment or when-issued basis. The Fund records a when-issued transaction on the trade date and will segregate assets in an amount at least equal in value to the Fund's commitment to purchase when-issued securities. Securities purchased on a when-issued basis are marked-to-market daily and the Fund begins earning interest on the settlement date. Losses may arise due to changes in the market value of the underlying securities or if the counterparty does not perform under the contract.
Futures contracts
Futures contracts are agreements between the Fund and a counterparty to buy or sell a specific amount of a commodity, financial instrument or currency at a specified price on a specified date. The Fund may buy and sell futures contracts in order to gain exposure to, or protect against, changes in interest rates and is subject to interest rate risk. The primary risks associated with the use of futures contracts are the imperfect correlation between changes in market values of securities held by the Fund and the prices of futures contracts, and the possibility of an illiquid market. Futures contracts are generally entered into on a regulated futures exchange and cleared through a clearinghouse associated with the exchange. With futures contracts, there is minimal counterparty risk to the Fund since futures contracts are exchange traded and the exchange’s clearinghouse, as the counterparty to all exchange-traded futures, guarantees the futures contracts against default.
Upon entering into a futures contract, the Fund is required to deposit either cash or securities (initial margin) with the broker in an amount equal to a certain percentage of the contract value. Subsequent payments (variation margin) are paid to or from the broker each day equal to the daily changes in the contract value. Such payments are recorded as unrealized gains or losses and, if any, shown as variation margin receivable (payable) in the Statement of Assets and Liabilities. Should the Fund fail to make
Allspring Pennsylvania Tax-Free Fund | 21
Notes to financial statements (unaudited)
requested variation margin payments, the broker can gain access to the initial margin to satisfy the Fund’s payment obligations. When the contracts are closed, a realized gain or loss is recorded in the Statement of Operations.
Security transactions and income recognition
Securities transactions are recorded on a trade date basis. Realized gains or losses are recorded on the basis of identified cost.
Interest income is accrued daily and bond discounts are accreted and premiums are amortized daily. To the extent debt obligations are placed on non-accrual status, any related interest income may be reduced by writing off interest receivables when the collection of all or a portion of interest has been determined to be doubtful based on consistently applied procedures and the fair value has decreased. If the issuer subsequently resumes interest payments or when the collectability of interest is reasonably assured, the debt obligation is removed from non-accrual status.
Distributions to shareholders
Distributions to shareholders from net investment income are declared daily and paid monthly. Distributions from net realized gains, if any, are recorded on the ex-dividend date and paid at least annually. Such distributions are determined in accordance with income tax regulations and may differ from U.S. generally accepted accounting principles. Dividend sources are estimated at the time of declaration. The tax character of distributions is determined as of the Fund's fiscal year end. Therefore, a portion of the Fund's distributions made prior to the Fund’s fiscal year end may be categorized as a tax return of capital at year end.
Federal and other taxes
The Fund intends to continue to qualify as a regulated investment company by distributing substantially all of its investment company taxable and tax-exempt income and any net realized capital gains (after reduction for capital loss carryforwards) sufficient to relieve it from all, or substantially all, federal income taxes. Accordingly, no provision for federal income taxes was required.
The Fund’s income and federal excise tax returns and all financial records supporting those returns for the prior three fiscal years are subject to examination by the federal and Delaware revenue authorities. Management has analyzed the Fund's tax positions taken on federal, state, and foreign tax returns, as applicable, for all open tax years and does not believe that there are any uncertain tax positions that require recognition of a tax liability.
As of December 31, 2022, the aggregate cost of all investments for federal income tax purposes was $110,187,659 and the unrealized gains (losses) consisted of:
| Gross unrealized gains | $ 675,853 |
| Gross unrealized losses | (5,767,780) |
| Net unrealized losses | $(5,091,927) |
As of June 30, 2022, the Fund had capital loss carryforwards which consisted of $389,612 in short-term capital losses and $210,294 in long-term capital losses.
Class allocations
The separate classes of shares offered by the Fund differ principally in applicable sales charges, distribution, shareholder servicing, and administration fees. Class specific expenses are charged directly to that share class. Investment income, common fund-level expenses, and realized and unrealized gains (losses) on investments are allocated daily to each class of shares based on the relative proportion of net assets of each class.
22 | Allspring Pennsylvania Tax-Free Fund
Notes to financial statements (unaudited)
3. FAIR VALUATION MEASUREMENTS
Fair value measurements of investments are determined within a framework that has established a fair value hierarchy based upon the various data inputs utilized in determining the value of the Fund’s investments. The three-level hierarchy gives the highest priority to unadjusted quoted prices in active markets for identical assets or liabilities (Level 1) and the lowest priority to unobservable inputs (Level 3). The Fund’s investments are classified within the fair value hierarchy based on the lowest level of input that is significant to the fair value measurement. The inputs are summarized into three broad levels as follows:
| ■ | Level 1 – quoted prices in active markets for identical securities |
| ■ | Level 2 – other significant observable inputs (including quoted prices for similar securities, interest rates, prepayment speeds, credit risk, etc.) |
| ■ | Level 3 – significant unobservable inputs (including the Fund’s own assumptions in determining the fair value of investments) |
The inputs or methodologies used for valuing investments in securities are not necessarily an indication of the risk associated with investing in those securities.
The following is a summary of the inputs used in valuing the Fund’s assets and liabilities as of December 31, 2022:
| | Quoted prices
(Level 1) | Other significant
observable inputs
(Level 2) | Significant
unobservable inputs
(Level 3) | Total |
| Assets | | | | |
| Investments in: | | | | |
| Municipal obligations | $ 0 | $ 104,489,234 | $0 | $ 104,489,234 |
| Short-term investments | | | | |
| Investment companies | 606,498 | 0 | 0 | 606,498 |
| Total assets | $606,498 | $104,489,234 | $0 | $105,095,732 |
Additional sector, industry or geographic detail, if any, is included in the Portfolio of Investments.
For the six months ended December 31, 2022, the Fund did not have any transfers into/out of Level 3.
4. TRANSACTIONS WITH AFFILIATES
Management fee
Allspring Funds Management, a wholly owned subsidiary of Allspring Global Investments Holdings, LLC, a holding company indirectly owned by certain private funds of GTCR LLC and Reverence Capital Partners, L.P., is the manager of the Fund and provides advisory and fund-level administrative services under an investment management agreement. Under the investment management agreement, Allspring Funds Management is responsible for, among other services, implementing the investment objectives and strategies of the Fund, supervising the subadviser and providing fund-level administrative services in connection with the Fund’s operations. As compensation for its services under the investment management agreement, Allspring Funds Management is entitled to receive a management fee at the following annual rate based on the Fund’s average daily net assets:
| Average daily net assets | Management fee |
| First $500 million | 0.400% |
| Next $500 million | 0.375 |
| Next $2 billion | 0.350 |
| Next $2 billion | 0.325 |
| Next $5 billion | 0.290 |
| Over $10 billion | 0.280 |
For the six months ended December 31, 2022, the management fee was equivalent to an annual rate of 0.40% of the Fund’s average daily net assets.
Allspring Funds Management has retained the services of a subadviser to provide daily portfolio management to the Fund. The fee for subadvisory services is borne by Allspring Funds Management. Allspring Global Investments, LLC, an affiliate of Allspring
Allspring Pennsylvania Tax-Free Fund | 23
Notes to financial statements (unaudited)
Funds Management and a wholly owned subsidiary of Allspring Global Investments Holdings, LLC, is the subadviser to the Fund and is entitled to receive a fee from Allspring Funds Management at an annual rate starting at 0.20% and declining to 0.10% as the average daily net assets of the Fund increase.
Administration fees
Under a class-level administration agreement, Allspring Funds Management provides class-level administrative services to the Fund, which includes paying fees and expenses for services provided by the transfer agent, sub-transfer agents, omnibus account servicers and record-keepers. As compensation for its services under the class-level administration agreement, Allspring Funds Management receives an annual fee which is calculated based on the average daily net assets of each class as follows:
| | Class-level
administration fee |
| Class A | 0.16% |
| Class C | 0.16 |
| Institutional Class | 0.08 |
Waivers and/or expense reimbursements
Allspring Funds Management has contractually committed to waive and/or reimburse management and administration fees to the extent necessary to maintain certain net operating expense ratios for the Fund. When each class of the Fund has exceeded its expense cap, Allspring Funds Management will waive fees and/or reimburse expenses from fund-level expenses on a proportionate basis and then from class specific expenses. When only certain classes exceed their expense caps, waivers and/or reimbursements are applied against class specific expenses before fund-level expenses. Allspring Funds Management has contractually committed through October 31, 2023 to waive fees and/or reimburse expenses to the extent necessary to cap expenses. Prior to or after the commitment expiration date, the caps may be increased or the commitment to maintain the caps may be terminated only with the approval of the Board of Trustees. As of December 31, 2022, the contractual expense caps are as follows:
| | Expense ratio caps |
| Class A | 0.74% |
| Class C | 1.49 |
| Institutional Class | 0.49 |
Distribution fee
The Trust has adopted a distribution plan for Class C shares pursuant to Rule 12b-1 under the 1940 Act. A distribution fee is charged to Class C shares and paid to Allspring Funds Distributor, LLC ("Allspring Funds Distributor"), the principal underwriter, an affiliate of Allspring Funds Management, at an annual rate up to 0.75% of the average daily net assets of Class C shares.
In addition, Allspring Funds Distributor is entitled to receive the front-end sales charge from the purchase of Class A shares and a contingent deferred sales charge on the redemption of certain Class A shares. Allspring Funds Distributor is also entitled to receive the contingent deferred sales charges from redemptions of Class C shares. For the six months ended December 31, 2022, Allspring Funds Distributor received $891 from the sale of Class A shares. No contingent deferred sales charges were incurred by Class A and Class C shares for the six months ended December 31, 2022.
Shareholder servicing fees
The Trust has entered into contracts with one or more shareholder servicing agents, whereby Class A and Class C are charged a fee at an annual rate up to 0.25% of the average daily net assets of each respective class. A portion of these total shareholder servicing fees were paid to affiliates of the Fund.
Interfund transactions
The Fund may purchase or sell portfolio investment securities to certain affiliates pursuant to Rule 17a-7 under the 1940 Act and under procedures adopted by the Board of Trustees. The procedures have been designed to ensure that these interfund transactions, which do not incur broker commissions, are effected at current market prices. Pursuant to these procedures, the Fund had $0, $1,000,000 and $0 in interfund purchases, sales and net realized gains (losses), respectively, during the six months ended December 31, 2022.
24 | Allspring Pennsylvania Tax-Free Fund
Notes to financial statements (unaudited)
5. INVESTMENT PORTFOLIO TRANSACTIONS
Purchases and sales of investments, excluding U.S. government obligations (if any) and short-term securities, for the six months ended December 31, 2022 were $11,216,901 and $10,327,887, respectively.
6. BANK BORROWINGS
The Trust (excluding the money market funds), Allspring Master Trust and Allspring Variable Trust are parties to a $350,000,000 revolving credit agreement whereby the Fund is permitted to use bank borrowings for temporary or emergency purposes, such as to fund shareholder redemption requests. Interest under the credit agreement is charged to the Fund based on a borrowing rate equal to the higher of the Federal Funds rate or the overnight bank funding rate in effect on that day plus a spread. In addition, an annual commitment fee equal based on the unused balance is allocated to each participating fund.
For the six months ended December 31, 2022, there were no borrowings by the Fund under the agreement.
7. CONCENTRATION RISK
The Fund invests a substantial portion of its assets in issuers of municipal debt securities located in a single state or territory of the U.S. Therefore, it may be more affected by economic and political developments in that state or region than would be a comparable general tax-exempt fund. As of the end of the period, the Fund's investments were concentrated in the state of Pennsylvania.
8. MARKET RISKS
On March 11, 2020, the World Health Organization announced that it had made the assessment that coronavirus disease 2019 (“COVID-19”) is a pandemic. The impacts of COVID-19 are affecting the entire global economy, individual companies and investment products, the funds, and the market in general. There is significant uncertainty around the extent and duration of business disruptions related to COVID-19 and the impacts may last for an extended period of time. COVID-19 has led to significant uncertainty and volatility in the financial markets.
9. INDEMNIFICATION
Under the Fund's organizational documents, the officers and Trustees have been granted certain indemnification rights against certain liabilities that may arise out of performance of their duties to the Fund. The Fund has entered into a separate agreement with each Trustee that converts indemnification rights currently existing under the Fund’s organizational documents into contractual rights that cannot be changed in the future without the consent of the Trustee. Additionally, in the normal course of business, the Fund may enter into contracts with service providers that contain a variety of indemnification clauses. The Fund’s maximum exposure under these arrangements is dependent on future claims that may be made against the Fund and, therefore, cannot be estimated.
Allspring Pennsylvania Tax-Free Fund | 25
Other information (unaudited)
PROXY VOTING INFORMATION
A description of the policies and procedures used to determine how to vote proxies relating to portfolio securities is available without charge, upon request, by calling 1-800-222-8222, visiting our website at allspringglobal.com, or visiting the SEC website at sec.gov. Information regarding how the proxies related to portfolio securities were voted during the most recent 12-month period ended June 30 is available on the website at allspringglobal.com or by visiting the SEC website at sec.gov.
QUARTERLY PORTFOLIO HOLDINGS INFORMATION
The Fund files its complete schedule of portfolio holdings with the SEC for the first and third quarters of each fiscal year as an exhibit to its reports on Form N-PORT. Shareholders may view the filed Form N-PORT by visiting the SEC website at sec.gov.
26 | Allspring Pennsylvania Tax-Free Fund
Other information (unaudited)
BOARD OF TRUSTEES AND OFFICERS
Each of the Trustees and Officers listed in the table below acts in identical capacities for each fund in the Allspring family of funds, which consists of 127 mutual funds comprising the Allspring Funds Trust, Allspring Variable Trust, Allspring Master Trust and four closed-end funds (collectively the “Fund Complex”). This table should be read in conjunction with the Prospectus and the Statement of Additional Information1. The mailing address of each Trustee and Officer is 1415 Vantage Park Drive, 3rd Floor, Charlotte, NC 28203. Each Trustee and Officer serves an indefinite term, however, each Trustee serves such term until reaching the mandatory retirement age established by the Trustees.
Independent Trustees
Name and
year of birth | Position held and
length of service* | Principal occupations during past five years or longer | Current other
public company or
investment
company
directorships |
William R. Ebsworth
(Born 1957) | Trustee,
since 2015 | Retired. From 1984 to 2013, equities analyst, portfolio manager, research director and chief investment officer at Fidelity Management and Research Company in Boston, Tokyo, and Hong Kong, and retired in 2013 as Chief Investment Officer of Fidelity Strategic Advisers, Inc. where he led a team of investment professionals managing client assets. Prior thereto, Board member of Hong Kong Securities Clearing Co., Hong Kong Options Clearing Corp., the Thailand International Fund, Ltd., Fidelity Investments Life Insurance Company, and Empire Fidelity Investments Life Insurance Company. Audit Committee Chair and Investment Committee Chair of the Vincent Memorial Hospital Foundation (non-profit organization). Mr. Ebsworth is a CFA® charterholder. | N/A |
Jane A. Freeman
(Born 1953) | Trustee,
since 2015;
Chair Liaison,
since 2018 | Retired. From 2012 to 2014 and 1999 to 2008, Chief Financial Officer of Scientific Learning Corporation. From 2008 to 2012, Ms. Freeman provided consulting services related to strategic business projects. Prior to 1999, Portfolio Manager at Rockefeller & Co. and Scudder, Stevens & Clark. Board member of the Harding Loevner Funds from 1996 to 2014, serving as both Lead Independent Director and chair of the Audit Committee. Board member of the Russell Exchange Traded Funds Trust from 2011 to 2012 and the chair of the Audit Committee. Ms. Freeman is also an inactive Chartered Financial Analyst. | N/A |
Isaiah Harris, Jr.
(Born 1952) | Trustee,
since 2009; Audit
Committee
Chair,
since 2019 | Retired. Member of the Advisory Board of CEF of East Central Florida. Chairman of the Board of CIGNA Corporation from 2009 to 2021, and Director from 2005 to 2008. From 2003 to 2011, Director of Deluxe Corporation. Prior thereto, President and CEO of BellSouth Advertising and Publishing Corp. from 2005 to 2007, President and CEO of BellSouth Enterprises from 2004 to 2005 and President of BellSouth Consumer Services from 2000 to 2003. Emeritus member of the Iowa State University Foundation Board of Governors. Emeritus Member of the Advisory Board of Iowa State University School of Business. Advisory Board Member, Palm Harbor Academy (private school). Advisory Board Member, Fellowship of Christian Athletes. Mr. Harris is a certified public accountant (inactive status). | N/A |
David F. Larcker
(Born 1950) | Trustee,
since 2009 | Distinguished Visiting Fellow at the Hoover Institution since 2022. James Irvin Miller Professor of Accounting at the Graduate School of Business (Emeritus), Stanford University, Director of the Corporate Governance Research Initiative and Senior Faculty of The Rock Center for Corporate Governance since 2006. From 2005 to 2008, Professor of Accounting at the Graduate School of Business, Stanford University. Prior thereto, Ernst & Young Professor of Accounting at The Wharton School, University of Pennsylvania from 1985 to 2005. | N/A |
Allspring Pennsylvania Tax-Free Fund | 27
Other information (unaudited)
Name and
year of birth | Position held and
length of service* | Principal occupations during past five years or longer | Current other
public company or
investment
company
directorships |
Olivia S. Mitchell
(Born 1953) | Trustee,
since 2006;
Nominating and
Governance
Committee Chair,
since 2018 | International Foundation of Employee Benefit Plans Professor since 1993, Wharton School of the University of Pennsylvania. Director of Wharton’s Pension Research Council and Boettner Center on Pensions & Retirement Research, and Research Associate at the National Bureau of Economic Research. Previously taught at Cornell University from 1978 to 1993. | N/A |
Timothy J. Penny
(Born 1951) | Trustee,
since 1996;
Chair,
since 2018 | President and Chief Executive Officer of Southern Minnesota Initiative Foundation, a non-profit organization, since 2007. Vice Chair of the Economic Club of Minnesota, since 2007. Co-Chair of the Committee for a Responsible Federal Budget, since 1995. Member of the Board of Trustees of NorthStar Education Finance, Inc., a non-profit organization, from 2007-2022. Senior Fellow of the University of Minnesota Humphrey Institute from 1995 to 2017. | N/A |
James G. Polisson
(Born 1959) | Trustee,
since 2018 | Retired. Chief Marketing Officer, Source (ETF) UK Services, Ltd, from 2015 to 2017. From 2012 to 2015, Principal of The Polisson Group, LLC, a management consulting, corporate advisory and principal investing company. Chief Executive Officer and Managing Director at Russell Investments, Global Exchange Traded Funds from 2010 to 2012. Managing Director of Barclays Global Investors from 1998 to 2010 and Global Chief Marketing Officer for iShares and Barclays Global Investors from 2000 to 2010. Trustee of the San Francisco Mechanics’ Institute, a non-profit organization, from 2013 to 2015. Board member of the Russell Exchange Traded Fund Trust from 2011 to 2012. Director of Barclays Global Investors Holdings Deutschland GmbH from 2006 to 2009. Mr. Polisson is an attorney and has a retired status with the Massachusetts and District of Columbia Bar Associations. | N/A |
Pamela Wheelock
(Born 1959) | Trustee,
since January
2020; previously
Trustee from
January 2018 to
July 2019 | Retired. Executive and Senior Financial leadership positions in the public, private and nonprofit sectors. Interim President and CEO, McKnight Foundation, 2020. Interim Commissioner, Minnesota Department of Human Services, 2019. Chief Operating Officer, Twin Cities Habitat for Humanity, 2017-2019. Vice President for University Services, University of Minnesota, 2012-2016. Interim President and CEO, Blue Cross and Blue Shield of Minnesota, 2011-2012. Executive Vice-President and Chief Financial Officer, Minnesota Wild, 2002-2008. Commissioner, Minnesota Department of Finance, 1999-2002. Chair of the Board of Directors of Destination Medical Center Corporation. Board member of the Minnesota Wild Foundation. | N/A |
* Length of service dates reflect the Trustee’s commencement of service with the Trust’s predecessor entities, where applicable.
28 | Allspring Pennsylvania Tax-Free Fund
Other information (unaudited)
Officers2
Name and
year of birth | Position held and
length of service | Principal occupations during past five years or longer |
Andrew Owen
(Born 1960) | President,
since 2017 | President and Chief Executive Officer of Allspring Funds Management, LLC since 2017 and Head of Global Fund Governance of Allspring Global Investments since 2022. Prior thereto, co-president of Galliard Capital Management, LLC, an affiliate of Allspring Funds Management, LLC, from 2019 to 2022 and Head of Affiliated Managers, Allspring Global Investments, from 2014 to 2019 and Executive Vice President responsible for marketing, investments and product development for Allspring Funds Management, LLC, from 2009 to 2014. |
Jeremy DePalma
(Born 1974) | Treasurer,
since 2012
(for certain funds in
the Fund Complex);
since 2021 (for
the remaining funds in the
Fund Complex) | Senior Vice President of Allspring Funds Management, LLC since 2009. Senior Vice President of Evergreen Investment Management Company, LLC from 2008 to 2010 and head of the Fund Reporting and Control Team within Fund Administration from 2005 to 2010. |
Christopher Baker
(Born 1976) | Chief Compliance Officer, since 2022 | Global Chief Compliance Officer for Allspring Global Investments since 2022. Prior thereto, Chief Compliance Officer for State Street Global Advisors from 2018 to 2021. Senior Compliance Officer for the State Street divisions of Alternative Investment Solutions, Sector Solutions, and Global Marketing from 2015 to 2018. From 2010 to 2015 Vice President, Global Head of Investment and Marketing Compliance for State Street Global Advisors. |
Matthew Prasse
(Born 1983) | Chief Legal Officer, since 2022; Secretary, since 2021 | Senior Counsel of the Allspring Legal Department since 2021. Senior Counsel of the Wells Fargo Legal Department from 2018 to 2021. Previously, Counsel for Barings LLC from 2015 to 2018. Prior to joining Barings, Associate at Morgan, Lewis & Bockius LLP from 2008 to 2015. |
1 The Statement of Additional Information includes additional information about the Trustees and is available, without charge, upon request, by calling 1-800-222-8222 or by visiting the website at allspringglobal.com.
2 For those Officers with tenures at Allspring Global Investments and/or Allspring Funds Management, LLC that began prior to 2021, such tenures include years of service during which these businesses/entities were known as Wells Fargo Asset Management and Wells Fargo Funds Management, LLC, respectively.
Allspring Pennsylvania Tax-Free Fund | 29
For more information
More information about Allspring Funds is available free upon request. To obtain literature, please write, visit the Fund's website, or call:
Allspring Funds
P.O. Box 219967
Kansas City, MO 64121-9967
Website: allspringglobal.com
Individual investors: 1-800-222-8222
Retail investment professionals: 1-888-877-9275
Institutional investment professionals: 1-800-260-5969
This report and the financial statements contained herein are submitted for the general information of the shareholders of the Fund. If this report is used for promotional purposes, distribution of the report must be accompanied or preceded by a current prospectus. Before investing, please consider the investment objectives, risks, charges, and expenses of the investment. For a current prospectus and, if available, a summary prospectus, containing this information, call
1-800-222-8222 or visit the Fund's website at allspringglobal.com. Read the prospectus carefully before you invest or send money.
Allspring Global InvestmentsTM is the trade name for the asset management firms of Allspring Global Investments Holdings, LLC, a holding company indirectly owned by certain private funds of GTCR LLC and Reverence Capital Partners, L.P. These firms include but are not limited to Allspring Global Investments, LLC, and Allspring Funds Management, LLC. Certain products managed by Allspring entities are distributed by Allspring Funds Distributor, LLC (a broker-dealer and Member FINRA/SIPC).
This material is for general informational and educational purposes only and is NOT intended to provide investment advice or a recommendation of any kind - including a recommendation for any specific investment, strategy, or plan.
© 2023 Allspring Global Investments Holdings, LLC. All rights reserved.
ALL-01092023-icpwlzeg 02-23
SAR4301 12-22
Semi-Annual Report
December 31, 2022
Allspring
Short-Term Municipal Bond Fund
The views expressed and any forward-looking statements are as of December 31, 2022, unless otherwise noted, and are those of the Fund's portfolio managers and/or Allspring Global Investments. Discussions of individual securities or the markets generally are not intended as individual recommendations. Future events or results may vary significantly from those expressed in any forward-looking statements. The views expressed are subject to change at any time in response to changing circumstances in the market. Allspring Global Investments disclaims any obligation to publicly update or revise any views expressed or forward-looking statements.
Allspring Short-Term Municipal Bond Fund | 1
Letter to shareholders (unaudited)
Andrew Owen
President
Allspring Funds
Dear Shareholder:
We are pleased to offer you this semi-annual report for the Allspring Short-Term Municipal Bond Fund for the six-month period that ended December 31, 2022. Globally, stocks and bonds experienced heightened volatility and generally negative returns through the challenging period. Earlier tailwinds provided by global stimulus programs, vaccination rollouts, and recovering consumer and corporate sentiment were wiped away by the highest rate of inflation in four decades, the impact of ongoing aggressive central bank rate hikes and the prospect of more rate hikes. Compounding these concerns were the global reverberations of the Russia-Ukraine war and the impact of China’s strict COVID-19 lockdowns.
For the six-month period, stocks and bonds had mixed results, with emerging market equities trailing those of developed markets and both U.S. and non-U.S. bonds fighting an uphill battle in the face of sustained interest rate increases. For the period, U.S. stocks, based on the S&P 500 Index,1 gained 2.31%. International stocks, as measured by the MSCI ACWI ex USA Index (Net),2 returned 2.96%, while the MSCI EM Index (Net) (USD)3 declined 2.99%. Among bond indexes, the Bloomberg U.S. Aggregate Bond Index4 returned -2.97%, the Bloomberg Global Aggregate ex-USD Index (unhedged)5 returned -2.65%, the Bloomberg Municipal Bond Index6 gained 0.50%, and the ICE BofA U.S. High Yield Index7 returned 3.33%.
Persistent inflation and economic fallout from the Russia-Ukraine war drove markets.
Markets rebounded from earlier losses in July, led by U.S. stocks. While evidence pointed to an economic slowdown after two consecutive quarters of declining gross domestic product (economic contraction), the U.S. labor market remained surprisingly strong: July nonfarm payrolls grew by more than 500,000 and U.S. unemployment dipped to 3.5%. Meanwhile, crude oil and retail gasoline prices, major contributors to recent overall inflation, fell substantially from earlier highs. And while U.S. home prices rose, sales fell as houses became less affordable with mortgage rates at a 13-year high. The Federal Reserve (Fed) raised the federal funds rate another 0.75% in July—to a range of 2.25% to 2.50%—and forecasts pointed to further rate hikes.
| 1 | The S&P 500 Index consists of 500 stocks chosen for market size, liquidity, and industry group representation. It is a market-value-weighted index with each stock's weight in the index proportionate to its market value. You cannot invest directly in an index. |
| 2 | The Morgan Stanley Capital International (MSCI) All Country World Index (ACWI) ex USA Index (Net) is a free-float-adjusted market-capitalization-weighted index that is designed to measure the equity market performance of developed and emerging markets, excluding the U.S. Source: MSCI. MSCI makes no express or implied warranties or representations and shall have no liability whatsoever with respect to any MSCI data contained herein. The MSCI data may not be further redistributed or used as a basis for other indexes or any securities or financial products. This report is not approved, reviewed, or produced by MSCI. You cannot invest directly in an index. |
| 3 | The MSCI Emerging Markets (EM) Index (Net) (USD) is a free-float-adjusted market-capitalization-weighted index that is designed to measure equity market performance of emerging markets. You cannot invest directly in an index. |
| 4 | The Bloomberg U.S. Aggregate Bond Index is a broad-based benchmark that measures the investment-grade, U.S.-dollar-denominated, fixed-rate taxable bond market, including Treasuries, government-related and corporate securities, mortgage-backed securities (agency fixed-rate and hybrid adjustable-rate mortgage pass-throughs), asset-backed securities, and commercial mortgage-backed securities. You cannot invest directly in an index. |
| 5 | The Bloomberg Global Aggregate ex-USD Index (unhedged) is an unmanaged index that provides a broad-based measure of the global investment-grade fixed-income markets excluding the U.S.-dollar-denominated debt market. You cannot invest directly in an index. |
| 6 | The Bloomberg Municipal Bond Index is an unmanaged index composed of long-term tax-exempt bonds with a minimum credit rating of Baa. You cannot invest directly in an index. |
| 7 | The ICE BofA U.S. High Yield Index is a market-capitalization-weighted index of domestic and Yankee high-yield bonds. The index tracks the performance of high-yield securities traded in the U.S. bond market. You cannot invest directly in an index. Copyright 2023. ICE Data Indices, LLC. All rights reserved. |
2 | Allspring Short-Term Municipal Bond Fund
Letter to shareholders (unaudited)
August was yet another broadly challenging month for financial markets, with more red ink flowing. High inflation persisted, cresting 9% in the eurozone on an annual basis and remaining above 8% in the U.S. despite the Fed’s aggressive monetary policy and a major drop in global crude oil and gasoline prices from their June peak. One positive note was the resilience of the U.S. job market. However, the Fed’s job was clearly not complete. One longer-term bright spot was the U.S. Congress’s passage of the Inflation Reduction Act. Its primary stated goals include: to reduce inflation (though not immediately) by curbing the deficit, capping health care spending by seniors, and investing in domestic sources of clean energy.
The market misery continued in September. There was nowhere to hide as all asset classes suffered major losses at the hands of persistent inflation. Central banks kept up their battle against rapidly rising prices with more rate hikes. The strength of the U.S. dollar made things even more difficult for investors holding assets in other currencies. U.S. mortgage rates jumped to near 7% on 30-year fixed-rate mortgages; the decreased housing affordability began to cool demand somewhat. The U.K. experienced a sharp sell-off of government bonds and the British pound in September as investors panicked in response to a new government budget that was seen as financially unsound. The market meltdown forced the Bank of England to step in and buy long-dated government bonds.
Equities had a reprieve in October after two months of sharp declines. Value stocks and small caps fared best. Globally, developed markets outpaced emerging market equities, which were hurt by weakness among Chinese stocks. Central banks continued to try to curtail high inflation with aggressive interest rate hikes. Geopolitical risks persisted, including the ongoing Russia-Ukraine war and economic, financial market, and political turmoil in the U.K., which led to a second prime ministerial change in six weeks, as Rishi Sunak replaced Liz Truss in late October. Concerns over Europe’s energy crisis eased thanks to unseasonably warm weather and plentiful gas on hand. The U.S. labor market continued its resilience against rising prices, as unemployment stood at 3.7%, near a record low.
Stocks and bonds rallied in November, with emerging market equities gaining nearly 15% and developed market equities returning 7%. The S&P 500 Index rose 5.6% in November. Bonds also had positive monthly returns. Economic news was encouraging, driven by U.S. labor market strength. Although central banks kept raising rates, expectations grew regarding an impending easing in the pace of rate hikes and a possible end to central bank monetary tightening in 2023. Although inflation remained at record highs in the eurozone, with a 10.6% annual increase in October, Germany’s producer prices decreased 4.2% annually, signaling a possible decline in inflationary pressures. Meanwhile, U.S. inflation continued to moderate, with a 7.1% annual price rise in November and a monthly price increase of just 0.1%. China’s economic data remained weak, reflecting its zero-COVID-19 policy.
Financial markets cooled in December, with U.S. equities posting negative overall results in response to a weakening U.S. dollar. Fixed income securities ended one of their worst years ever with flat overall monthly returns as markets weighed the hopes for an end to the monetary tightening cycle with the reality that central banks had not completed their jobs yet. U.S. Consumer Price Index (CPI)1 data showed a strong consistent trend downward, which brought down the 12-month CPI to 6.5% in December from 9.1% in June. Other countries and regions reported still-high but declining inflation rates as the year winded down.
“ The market misery continued in September. There was nowhere to hide as all asset classes suffered major losses at the hands of persistent inflation.”
| 1 | The Consumer Price Index (CPI) is a measure of the average change over time in the prices paid by urban consumers for a market basket of consumer goods and services. You cannot invest directly in an index. |
Allspring Short-Term Municipal Bond Fund | 3
Letter to shareholders (unaudited)
Don’t let short-term uncertainty derail long-term investment goals.
Periods of investment uncertainty can present challenges, but experience has taught us that maintaining long-term investment goals can be an effective way to plan for the future. To help you create a sound strategy based on your personal goals and risk tolerance, Allspring Funds offers more than 100 mutual funds spanning a wide range of asset classes and investment styles. Although diversification cannot guarantee an investment profit or prevent losses, we believe it can be an effective way to manage investment risk and potentially smooth out overall portfolio performance. We encourage investors to know their investments and to understand that appropriate levels of risk-taking may unlock opportunities.
Thank you for choosing to invest with Allspring Funds. We appreciate your confidence in us and remain committed to helping you meet your financial needs.
Sincerely,
Andrew Owen
President
Allspring Funds
For further information about your fund, contact your investment professional, visit our website at allspringglobal.com, or call us directly at 1-800-222-8222.
4 | Allspring Short-Term Municipal Bond Fund
This page is intentionally left blank.
Performance highlights (unaudited)
| Investment objective | The Fund seeks current income exempt from federal income tax consistent with capital preservation. |
| Manager | Allspring Funds Management, LLC |
| Subadviser | Allspring Global Investments, LLC |
| Portfolio managers | Bruce Johns, Nicholos Venditti |
| Average annual total returns (%) as of December 31, 2022 |
| | | Including sales charge | | Excluding sales charge | | Expense ratios1 (%) |
| | Inception date | 1 year | 5 year | 10 year | | 1 year | 5 year | 10 year | | Gross | Net 2 |
| Class A (WSMAX) | 7-18-2008 | -4.77 | 0.23 | 0.54 | | -2.83 | 0.63 | 0.74 | | 0.76 | 0.63 |
| Class C (WSSCX) | 1-31-2003 | -4.56 | -0.12 | 0.14 | | -3.56 | -0.12 | 0.14 | | 1.51 | 1.38 |
| Class R6 (WSSRX)3 | 7-31-2018 | – | – | – | | -2.55 | 0.91 | 0.99 | | 0.38 | 0.35 |
| Administrator Class (WSTMX) | 7-30-2010 | – | – | – | | -2.77 | 0.66 | 0.74 | | 0.70 | 0.60 |
| Institutional Class (WSBIX) | 3-31-2008 | – | – | – | | -2.60 | 0.86 | 0.96 | | 0.43 | 0.40 |
| Bloomberg 1-3 Year Composite Municipal Bond Index4 | – | – | – | – | | -2.26 | 1.04 | 0.95 | | – | – |
Figures quoted represent past performance, which is no guarantee of future results, and do not reflect taxes that a shareholder may pay on an investment in a fund. Investment return and principal value of an investment will fluctuate so that an investor’s shares, when redeemed, may be worth more or less than their original cost. Performance shown without sales charges would be lower if sales charges were reflected. Current performance may be lower or higher than the performance data quoted, which assumes the reinvestment of dividends and capital gains. Current month-end performance is available on the Fund’s website, allspringglobal.com.
Index returns do not include transaction costs associated with buying and selling securities, any mutual fund fees or expenses, or any taxes. It is not possible to invest directly in an index.
For Class A shares, the maximum front-end sales charge is 2.00%. For Class C shares, the maximum contingent deferred sales charge is 1.00%. Performance including a contingent deferred sales charge assumes the sales charge for the corresponding time period. Class R6, Administrator Class and Institutional Class shares are sold without a front-end sales charge or contingent deferred sales charge.
| 1 | Reflects the expense ratios as stated in the most recent prospectuses. The expense ratios shown are subject to change and may differ from the annualized expense ratios shown in the financial highlights of this report. |
| 2 | The manager has contractually committed through October 31, 2023, to waive fees and/or reimburse expenses to the extent necessary to cap total annual fund operating expenses after fee waivers at 0.63% for Class A, 1.38% for Class C, 0.35% for Class R6, 0.60% for Administrator Class, and 0.40% for Institutional Class. Brokerage commissions, stamp duty fees, interest, taxes, acquired fund fees and expenses (if any), and extraordinary expenses are excluded from the expense caps. Prior to or after the commitment expiration date, the caps may be increased or the commitment to maintain the caps may be terminated only with the approval of the Board of Trustees. Without these caps, the Fund’s returns would have been lower. The expense ratio paid by an investor is the net expense ratio (the total annual fund operating expenses after fee waivers) as stated in the prospectuses. |
| 3 | Historical performance shown for the Class R6 shares prior to their inception reflects the performance of the Institutional Class shares, and includes the higher expenses applicable to the Institutional Class shares. If these expenses had not been included, returns for the Class R6 shares would be higher. |
| 4 | The Bloomberg 1-3 Year Composite Municipal Bond Index is a blended index weighted 50% in the Bloomberg 1 Year Municipal Bond Index and 50% in the Bloomberg 3 Year Municipal Bond Index. You cannot invest directly in an index. |
Bond values fluctuate in response to the financial condition of individual issuers, general market and economic conditions, and changes in interest rates. Changes in market conditions and government policies may lead to periods of heightened volatility in the bond market and reduced liquidity for certain bonds held by the Fund. In general, when interest rates rise, bond values fall and investors may lose principal value. Interest rate changes and their impact on the Fund and its share price can be sudden and unpredictable. The use of derivatives may reduce returns and/or increase volatility. Certain investment strategies tend to increase the total risk of an investment (relative to the broader market). This fund is exposed to high-yield securities risk and municipal securities risk. Consult the Fund’s prospectus for additional information on these and other risks. A portion of the Fund’s income may be subject to federal, state, and/or local income taxes or the Alternative Minimum Tax (AMT). Any capital gains distributions may be taxable.
6 | Allspring Short-Term Municipal Bond Fund
Performance highlights (unaudited)
| Credit quality as of December 31, 20221 |
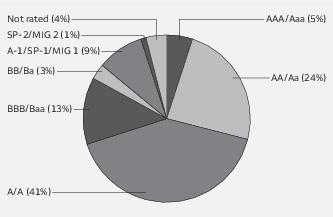
| 1 | The credit quality distribution of portfolio holdings reflected in the chart is based on ratings from Standard & Poor’s, Moody’s Investors Service, and/or Fitch Ratings Ltd. Credit quality ratings apply to the underlying holdings of the Fund and not to the Fund itself. The percentages of the portfolio with the ratings depicted in the chart are calculated based on the market value of fixed income securities held by the Fund. If a security was rated by all three rating agencies, the middle rating was utilized. If rated by two of the three rating agencies, the lower rating was utilized, and if rated by one of the rating agencies, that rating was utilized. Standard & Poor’s rates the creditworthiness of bonds, ranging from AAA (highest) to D (lowest). Ratings from A to CCC may be modified by the addition of a plus (+) or minus (-) sign to show relative standing within the rating categories. Standard & Poor’s rates the creditworthiness of short-term notes from SP-1 (highest) to SP-3 (lowest). Moody’s rates the creditworthiness of bonds, ranging from Aaa (highest) to C (lowest). Ratings Aa to B may be modified by the addition of a number 1 (highest) to 3 (lowest) to show relative standing within the ratings categories. Moody’s rates the creditworthiness of short-term U.S. tax-exempt municipal securities from MIG 1/VMIG 1 (highest) to SG (lowest). Fitch rates the creditworthiness of bonds, ranging from AAA (highest) to D (lowest). Credit quality distribution is subject to change and may have changed since the date specified. |
| Effective maturity distribution as of December 31, 20221 |
| 1 | Figures represent the percentage of the Fund's long-term investments. Allocations are subject to change and may have changed since the date specified. |
Allspring Short-Term Municipal Bond Fund | 7
Fund expenses (unaudited)
As a shareholder of the Fund, you incur two types of costs: (1) transaction costs, including sales charges (loads) on purchase payments and contingent deferred sales charges (if any) on redemptions and (2) ongoing costs, including management fees, distribution (12b-1) and/or shareholder servicing fees, and other Fund expenses. This example is intended to help you understand your ongoing costs (in dollars) of investing in the Fund and to compare these costs with the ongoing costs of investing in other mutual funds.
The example is based on an investment of $1,000 invested at the beginning of the six-month period and held for the entire period from July 1, 2022 to December 31, 2022.
Actual expenses
The “Actual” line of the table below provides information about actual account values and actual expenses. You may use the information in this line, together with the amount you invested, to estimate the expenses that you paid over the period. Simply divide your account value by $1,000 (for example, an $8,600 account value divided by $1,000 = 8.6), then multiply the result by the number in the “Actual” line under the heading entitled “Expenses paid during period” for your applicable class of shares to estimate the expenses you paid on your account during this period.
Hypothetical example for comparison purposes
The “Hypothetical” line of the table below provides information about hypothetical account values and hypothetical expenses based on the Fund’s actual expense ratio and an assumed rate of return of 5% per year before expenses, which is not the Fund’s actual return. The hypothetical account values and expenses may not be used to estimate the actual ending account balance or expenses you paid for the period. You may use this information to compare the ongoing costs of investing in the Fund and other funds. To do so, compare this 5% hypothetical example with the 5% hypothetical examples that appear in the shareholder reports of the other funds.
Please note that the expenses shown in the table are meant to highlight your ongoing costs only and do not reflect any transactional costs, such as sales charges (loads) and contingent deferred sales charges. Therefore, the “Hypothetical” line of the table is useful in comparing ongoing costs only, and will not help you determine the relative total costs of owning different funds. In addition, if these transactional costs were included, your costs would have been higher.
| | Beginning
account value
7-1-2022 | Ending
account value
12-31-2022 | Expenses
paid during
the period1 | Annualized net
expense ratio |
| Class A | | | | |
| Actual | $1,000.00 | $1,001.60 | $3.18 | 0.63% |
| Hypothetical (5% return before expenses) | $1,000.00 | $1,022.03 | $3.21 | 0.63% |
| Class C | | | | |
| Actual | $1,000.00 | $ 997.82 | $6.95 | 1.38% |
| Hypothetical (5% return before expenses) | $1,000.00 | $1,018.25 | $7.02 | 1.38% |
| Class R6 | | | | |
| Actual | $1,000.00 | $1,003.01 | $1.77 | 0.35% |
| Hypothetical (5% return before expenses) | $1,000.00 | $1,023.44 | $1.79 | 0.35% |
| Administrator Class | | | | |
| Actual | $1,000.00 | $1,001.74 | $3.03 | 0.60% |
| Hypothetical (5% return before expenses) | $1,000.00 | $1,022.18 | $3.06 | 0.60% |
| Institutional Class | | | | |
| Actual | $1,000.00 | $1,002.76 | $2.02 | 0.40% |
| Hypothetical (5% return before expenses) | $1,000.00 | $1,023.19 | $2.04 | 0.40% |
1 Expenses paid is equal to the annualized net expense ratio of each class multiplied by the average account value over the period, multiplied by 184 divided by 365 (to reflect the one-half-year period).
8 | Allspring Short-Term Municipal Bond Fund
Portfolio of investments—December 31, 2022 (unaudited)
| | | Interest
rate | Maturity
date | Principal | Value |
| Municipal obligations: 99.45% | | | | | |
| Alabama: 3.85% | | | | | |
| Airport revenue: 0.12% | | | | | |
| Birmingham AL Airport Authority Series 2020 (BAM Insured) | | 5.00% | 7-1-2023 | $ 475,000 | $ 479,314 |
| Birmingham AL Airport Authority Series 2020 (BAM Insured) | | 5.00 | 7-1-2026 | 900,000 | 958,844 |
| Birmingham AL Airport Authority Series 2020 (BAM Insured) | | 5.00 | 7-1-2027 | 500,000 | 540,433 |
| | | | | | 1,978,591 |
| Industrial development revenue: 0.54% | | | | | |
| Mobile AL Industrial Development Board Alabama Power Company Barry Plant Project Series A | | 1.00 | 6-1-2034 | 8,500,000 | 8,060,395 |
| Selma AL Industrial Development Board Refunding Bonds Gulf Opportunity Zone International Paper Company | | 2.00 | 11-1-2033 | 1,000,000 | 962,259 |
| | | | | | 9,022,654 |
| Utilities revenue: 3.19% | | | | | |
| Black Belt Energy Gas District Gas Supply Project #3 Series A | | 4.00 | 12-1-2048 | 8,000,000 | 8,007,386 |
| Black Belt Energy Gas District Gas Supply Project #7 Series C-1 | | 4.00 | 12-1-2025 | 1,500,000 | 1,495,635 |
| Black Belt Energy Gas District Gas Supply Project Series D-1 (Royal Bank of Canada LIQ) | | 4.00 | 7-1-2052 | 3,500,000 | 3,475,567 |
| Black Belt Energy Gas District Series 2021C-1 | | 4.00 | 10-1-2052 | 3,900,000 | 3,852,090 |
| Black Belt Energy Gas District Series A | | 4.00 | 6-1-2024 | 3,640,000 | 3,632,998 |
| Chatom AL Industrial Development Board Gulf Opportunity Zone PowerSouth Energy Cooperative Projects Series 2020 (AGM Insured) | | 5.00 | 8-1-2024 | 985,000 | 1,015,185 |
| Chatom AL Industrial Development Board Gulf Opportunity Zone PowerSouth Energy Cooperative Projects Series 2020 (AGM Insured) | | 5.00 | 8-1-2025 | 425,000 | 443,536 |
| Chatom AL Industrial Development Board Gulf Opportunity Zone PowerSouth Energy Cooperative Projects Series 2020 (AGM Insured) | | 5.00 | 8-1-2026 | 500,000 | 528,541 |
| Southeast Alabama Gas Supply District Project #1 Series A | | 4.00 | 4-1-2049 | 4,000,000 | 3,993,723 |
| Southeast Alabama Gas Supply District Project #2 Series 2018A | | 4.00 | 6-1-2049 | 20,060,000 | 19,989,698 |
| Southeast Energy Authority Commodity Supply Alabama SIFMA Index Project #3 Series A2 | | 5.50 | 1-1-2053 | 2,000,000 | 2,117,201 |
| Tender Option Bond Trust Receipts/Floater Certificates Series 2022-XF3073 144Aø | | 3.86 | 2-1-2053 | 5,000,000 | 5,000,000 |
| | | | | | 53,551,560 |
| | | | | | 64,552,805 |
The accompanying notes are an integral part of these financial statements.
Allspring Short-Term Municipal Bond Fund | 9
Portfolio of investments—December 31, 2022 (unaudited)
| | | Interest
rate | Maturity
date | Principal | Value |
| Alaska: 0.67% | | | | | |
| Airport revenue: 0.24% | | | | | |
| Alaska International Airports System Revenue Refunding Bonds Series 2021C | | 5.00% | 10-1-2026 | $ 3,000,000 | $ 3,166,665 |
| Alaska International Airports System Revenue Refunding Bonds Series 2021C | | 5.00 | 10-1-2028 | 775,000 | 830,576 |
| | | | | | 3,997,241 |
| Health revenue: 0.25% | | | | | |
| Alaska Industrial Development and Export Authority Tanana Chiefs Conference Project | | 5.00 | 10-1-2023 | 600,000 | 607,228 |
| Alaska Industrial Development and Export Authority Tanana Chiefs Conference Project | | 5.00 | 10-1-2024 | 750,000 | 770,289 |
| Alaska Industrial Development and Export Authority Tanana Chiefs Conference Project | | 5.00 | 10-1-2025 | 1,310,000 | 1,364,072 |
| Alaska Industrial Development and Export Authority Tanana Chiefs Conference Project | | 5.00 | 10-1-2026 | 1,385,000 | 1,461,944 |
| | | | | | 4,203,533 |
| Miscellaneous revenue: 0.18% | | | | | |
| Alaska Municipal Bond Bank Refunding Bond Series 2020-1 | | 5.00 | 12-1-2025 | 1,470,000 | 1,551,004 |
| Alaska Municipal Bond Bank Refunding Bond Series 2020-1 | | 5.00 | 12-1-2026 | 1,350,000 | 1,448,554 |
| | | | | | 2,999,558 |
| | | | | | 11,200,332 |
| Arizona: 3.05% | | | | | |
| Education revenue: 0.02% | | | | | |
| Arizona IDA Education Facility Revenue Bonds Series 2021B | | 5.00 | 7-1-2027 | 170,000 | 176,728 |
| Arizona IDA Education Facility Revenue Bonds Series 2021B | | 5.00 | 7-1-2028 | 175,000 | 181,897 |
| | | | | | 358,625 |
| GO revenue: 0.13% | | | | | |
| Vistancia AZ Community Facilities District GO Series 2020 (BAM Insured) | | 4.00 | 7-15-2024 | 1,150,000 | 1,166,565 |
| Vistancia AZ Community Facilities District GO Series 2020 (BAM Insured) | | 4.00 | 7-15-2026 | 900,000 | 933,951 |
| | | | | | 2,100,516 |
| Health revenue: 1.03% | | | | | |
| Arizona Health Facilities Authority Banner Health Series B (SIFMA Municipal Swap +0.25%) ± | | 3.91 | 1-1-2046 | 4,000,000 | 3,864,180 |
| Maricopa County AZ IDA Series 2019C (SIFMA Municipal Swap +0.57%) ± | | 4.23 | 1-1-2035 | 4,405,000 | 4,386,646 |
| Maricopa County AZ IDA Series 2019C (SIFMA Municipal Swap +0.80%) ± | | 4.46 | 9-1-2048 | 9,000,000 | 8,974,549 |
| | | | | | 17,225,375 |
| Industrial development revenue: 1.72% | | | | | |
| Chandler AZ IDA Intel Corporation Project | | 2.40 | 12-1-2035 | 22,885,000 | 22,707,314 |
The accompanying notes are an integral part of these financial statements.
10 | Allspring Short-Term Municipal Bond Fund
Portfolio of investments—December 31, 2022 (unaudited)
| | | Interest
rate | Maturity
date | Principal | Value |
| Industrial development revenue (continued) | | | | | |
| Chandler AZ IDA Intel Corporation Project | | 2.70% | 12-1-2037 | $ 1,175,000 | $ 1,167,285 |
| Chandler AZ IDA Intel Corporation Project | | 5.00 | 6-1-2049 | 4,920,000 | 4,998,440 |
| | | | | | 28,873,039 |
| Miscellaneous revenue: 0.15% | | | | | |
| Phoenix AZ Civic Improvement Corporation Senior Lien Airport Revenue Refunding Bonds Series 2013 | | 5.00 | 7-1-2028 | 2,500,000 | 2,512,468 |
| | | | | | 51,070,023 |
| Arkansas: 0.23% | | | | | |
| Health revenue: 0.08% | | | | | |
| Batesville AR Public Facilities Board Hospital Series 2020 | | 5.00 | 6-1-2025 | 1,385,000 | 1,424,383 |
| Housing revenue: 0.12% | | | | | |
| Arkansas Development Finance Authority MFHR Cottages Apartments (Department of Housing and Urban Development Insured) | | 1.25 | 12-1-2024 | 2,000,000 | 1,960,768 |
| Tax revenue: 0.03% | | | | | |
| Cabot AR Sales Tax & Improvement Bonds Series B | | 5.00 | 12-1-2028 | 435,000 | 484,874 |
| | | | | | 3,870,025 |
| California: 3.34% | | | | | |
| Airport revenue: 0.16% | | | | | |
| Los Angeles CA Department Airports AMT Subordinate Bond Series D | | 5.00 | 5-15-2027 | 2,500,000 | 2,652,676 |
| GO revenue: 0.41% | | | | | |
| Kern Community College District CAB BAN ¤ | | 0.00 | 8-1-2023 | 7,000,000 | 6,878,425 |
| Health revenue: 0.11% | | | | | |
| California CDA Series 2020A | | 5.00 | 4-1-2026 | 570,000 | 603,823 |
| California CDA Series 2020A | | 5.00 | 4-1-2027 | 845,000 | 901,809 |
| Washington Township Health Care District Revenue Refunding Bonds Series 2020A | | 5.00 | 7-1-2024 | 200,000 | 204,335 |
| Washington Township Health Care District Revenue Refunding Bonds Series 2020A | | 5.00 | 7-1-2025 | 200,000 | 207,212 |
| | | | | | 1,917,179 |
| Miscellaneous revenue: 0.25% | | | | | |
| California Infrastructure & Economic Development Bank J Paul Getty Trust Series 2021-B2 | | 3.00 | 10-1-2047 | 1,000,000 | 1,001,923 |
| California Municipal Finance Authority Certificate of Participation Palomar Health 144A | | 5.00 | 11-1-2027 | 3,000,000 | 3,105,100 |
| | | | | | 4,107,023 |
| Tax revenue: 0.08% | | | | | |
| Riverside County CA Public Financing Project Area #1 (BAM Insured) | | 5.00 | 10-1-2026 | 1,250,000 | 1,319,848 |
| Transportation revenue: 2.01% | | | | | |
| Bay Area Toll Authority Toll Bridge San Francisco Bay Area Series C (SIFMA Municipal Swap +0.45%) ± | | 4.11 | 4-1-2056 | 2,750,000 | 2,707,990 |
The accompanying notes are an integral part of these financial statements.
Allspring Short-Term Municipal Bond Fund | 11
Portfolio of investments—December 31, 2022 (unaudited)
| | | Interest
rate | Maturity
date | Principal | Value |
| Transportation revenue (continued) | | | | | |
| Bay Area Toll Authority Toll Bridge San Francisco Bay Area Series C-1 (SIFMA Municipal Swap +0.90%) ± | | 4.56% | 4-1-2045 | $15,500,000 | $ 15,503,109 |
| Bay Area Toll Authority Toll Bridge San Francisco Bay Area Series D (SIFMA Municipal Swap +0.30%) ± | | 3.96 | 4-1-2056 | 16,000,000 | 15,551,141 |
| | | | | | 33,762,240 |
| Utilities revenue: 0.32% | | | | | |
| Lassen CA Municipal Utility District Certificate of Participation Series 2021 | | 4.00 | 5-1-2024 | 400,000 | 402,791 |
| Lassen CA Municipal Utility District Certificate of Participation Series 2021 | | 4.00 | 5-1-2025 | 415,000 | 420,797 |
| Lassen CA Municipal Utility District Certificate of Participation Series 2021 | | 4.00 | 5-1-2026 | 435,000 | 443,507 |
| Lassen CA Municipal Utility District Certificate of Participation Series 2021 | | 4.00 | 5-1-2027 | 450,000 | 459,336 |
| Lassen CA Municipal Utility District Certificate of Participation Series 2021 | | 4.00 | 5-1-2028 | 470,000 | 480,077 |
| Long Beach CA Bond Finance Authority Natural Gas Series B (3 Month LIBOR +1.43%) ± | | 4.52 | 11-15-2026 | 2,000,000 | 1,970,987 |
| Vernon California Electric System Series A | | 5.00 | 8-1-2024 | 685,000 | 697,200 |
| Vernon California Electric System Series A | | 5.00 | 8-1-2025 | 500,000 | 515,682 |
| | | | | | 5,390,377 |
| | | | | | 56,027,768 |
| Colorado: 1.36% | | | | | |
| Education revenue: 0.26% | | | | | |
| University of Colorado Enterprise System Refunding Bond Series C | | 2.00 | 6-1-2054 | 2,000,000 | 1,954,760 |
| University of Colorado Enterprise System Refunding Bond Series C3 Class A | | 2.00 | 6-1-2051 | 2,500,000 | 2,426,236 |
| | | | | | 4,380,996 |
| GO revenue: 0.13% | | | | | |
| Grand River CO Hospital District (AGM Insured) | | 5.00 | 12-1-2024 | 1,140,000 | 1,175,811 |
| Sand Creek CO Metropolitan District GO Series 2020A (AGM Insured) | | 4.00 | 12-1-2024 | 550,000 | 560,430 |
| Sand Creek CO Metropolitan District GO Series 2020A (AGM Insured) | | 4.00 | 12-1-2025 | 400,000 | 412,018 |
| | | | | | 2,148,259 |
| Health revenue: 0.28% | | | | | |
| Colorado Health Facilities Authority Revenue Bonds Hospital AdventHealth Obligated Group Series C | | 5.00 | 11-15-2036 | 3,165,000 | 3,355,582 |
| Colorado Health Facilities Authority Revenue Prerefunded Bonds Hospital AdventHealth | | 5.00 | 11-15-2049 | 80,000 | 86,249 |
| Colorado Health Facilities Authority Revenue Refunding Bonds & Improvement Christian Living | | 4.00 | 1-1-2025 | 325,000 | 316,277 |
| Colorado Health Facilities Authority Revenue Unrefunded Bonds | | 5.00 | 11-15-2049 | 820,000 | 868,591 |
| | | | | | 4,626,699 |
The accompanying notes are an integral part of these financial statements.
12 | Allspring Short-Term Municipal Bond Fund
Portfolio of investments—December 31, 2022 (unaudited)
| | | Interest
rate | Maturity
date | Principal | Value |
| Miscellaneous revenue: 0.47% | | | | | |
| Colorado Bridge Enterprise Central 70 Project Series 2017 | | 4.00% | 12-31-2023 | $ 1,285,000 | $ 1,296,970 |
| Colorado Bridge Enterprise Central 70 Project Series 2017 | | 4.00 | 12-31-2025 | 2,455,000 | 2,490,117 |
| Colorado Bridge Enterprise Central 70 Project Series 2017 | | 4.00 | 6-30-2026 | 4,050,000 | 4,110,326 |
| | | | | | 7,897,413 |
| Tax revenue: 0.03% | | | | | |
| Colorado Regional Transportation District Series 2020A & Series 2020B | | 4.00 | 7-15-2033 | 500,000 | 487,562 |
| Transportation revenue: 0.16% | | | | | |
| E-470 Public Highway Authority Colorado Series A | | 5.00 | 9-1-2024 | 450,000 | 464,967 |
| E-470 Public Highway Authority Colorado Series A | | 5.00 | 9-1-2025 | 300,000 | 316,434 |
| E-470 Public Highway Authority Colorado Series A | | 5.00 | 9-1-2026 | 1,750,000 | 1,881,405 |
| | | | | | 2,662,806 |
| Water & sewer revenue: 0.03% | | | | | |
| Central Weld County CO Water District Series 2020 (AGM Insured) | | 5.00 | 12-1-2027 | 500,000 | 549,816 |
| | | | | | 22,753,551 |
| Connecticut: 2.56% | | | | | |
| Education revenue: 0.65% | | | | | |
| Connecticut HEFA University of Hartford Project Series N | | 5.00 | 7-1-2028 | 570,000 | 582,221 |
| Connecticut HEFAR University of Hartford Series N | | 5.00 | 7-1-2024 | 120,000 | 120,846 |
| Connecticut HEFAR University of Hartford Series N | | 5.00 | 7-1-2025 | 140,000 | 141,808 |
| Connecticut HEFAR Yale University Issue Series A øø | | 1.10 | 7-1-2048 | 7,000,000 | 6,981,043 |
| Connecticut Higher Education Supplemental Loan Authority Loan Program Series A | | 3.60 | 11-15-2023 | 1,265,000 | 1,270,773 |
| Connecticut Higher Education Supplemental Loan Authority Loan Program Series B | | 5.00 | 11-15-2024 | 250,000 | 257,185 |
| Connecticut Higher Education Supplemental Loan Authority Loan Program Series B | | 5.00 | 11-15-2025 | 400,000 | 416,098 |
| Connecticut Higher Education Supplemental Loan Authority Loan Program Series B | | 5.00 | 11-15-2026 | 585,000 | 616,101 |
| Connecticut Higher Education Supplemental Loan Authority Loan Program Series D | | 5.00 | 11-15-2025 | 500,000 | 532,866 |
| | | | | | 10,918,941 |
| GO revenue: 0.22% | | | | | |
| Bridgeport CT GO Refunding Bond Series 2021C | | 5.00 | 2-15-2023 | 550,000 | 551,127 |
| Bridgeport CT GO Refunding Bond Series 2021C | | 5.00 | 2-15-2026 | 1,325,000 | 1,405,168 |
| Connecticut Series C | | 4.00 | 6-1-2025 | 1,000,000 | 1,027,372 |
| Hamden CT GO Series 2020A (BAM Insured) | | 5.00 | 8-1-2026 | 710,000 | 756,948 |
| | | | | | 3,740,615 |
| Health revenue: 0.65% | | | | | |
| Connecticut HEFA Hartford Healthcare Series B1 | | 5.00 | 7-1-2053 | 7,500,000 | 7,774,187 |
| Connecticut HEFA Revenue Bond Stamford Hospital Issue Series M | | 5.00 | 7-1-2026 | 375,000 | 392,920 |
The accompanying notes are an integral part of these financial statements.
Allspring Short-Term Municipal Bond Fund | 13
Portfolio of investments—December 31, 2022 (unaudited)
| | | Interest
rate | Maturity
date | Principal | Value |
| Health revenue (continued) | | | | | |
| Connecticut HEFA Revenue Bond Stamford Hospital Issue Series M | | 5.00% | 7-1-2027 | $ 250,000 | $ 264,616 |
| Connecticut HEFA Revenue Bond Stamford Hospital Issue Series M | | 5.00 | 7-1-2028 | 300,000 | 321,002 |
| Connecticut HEFA Yale New Haven Health Series A | | 5.00 | 7-1-2028 | 1,975,000 | 2,030,908 |
| | | | | | 10,783,633 |
| Housing revenue: 0.74% | | | | | |
| Connecticut HFA Mortgage Finance Program Bonds Series A Subseries A-4 (SIFMA Municipal Swap +0.30%) ± | | 3.96 | 11-15-2050 | 12,500,000 | 12,387,481 |
| Tax revenue: 0.30% | | | | | |
| Connecticut Special Tax Obligation Transportation Infrastructure Purposes Series A | | 5.00 | 5-1-2026 | 1,200,000 | 1,291,043 |
| Connecticut Special Tax Obligation Transportation Infrastructure Purposes Series A | | 5.00 | 5-1-2027 | 3,400,000 | 3,723,152 |
| | | | | | 5,014,195 |
| | | | | | 42,844,865 |
| Delaware: 0.23% | | | | | |
| Utilities revenue: 0.23% | | | | | |
| Delaware EDA Gas Facilities Delmarva Power & Light Company Series A | | 1.05 | 1-1-2031 | 4,000,000 | 3,786,728 |
| District of Columbia: 1.20% | | | | | |
| Airport revenue: 0.59% | | | | | |
| Metropolitan Washington Airports Authority Series A | | 5.00 | 10-1-2026 | 1,180,000 | 1,245,555 |
| Metropolitan Washington Airports Authority System Revenue Refunding AMT Series A | | 5.00 | 10-1-2025 | 6,320,000 | 6,596,036 |
| Metropolitan Washington Airports Authority System Revenue Refunding Bonds Series 2021A | | 5.00 | 10-1-2027 | 1,000,000 | 1,064,468 |
| Metropolitan Washington Airports Authority System Revenue Refunding Bonds Series 2021A | | 5.00 | 10-1-2028 | 1,000,000 | 1,071,712 |
| | | | | | 9,977,771 |
| Housing revenue: 0.14% | | | | | |
| District of Columbia HFA MFHR Strand Residences Project | | 2.50 | 2-1-2039 | 2,300,000 | 2,283,628 |
| Transportation revenue: 0.13% | | | | | |
| Metropolitan Washington Transit Authority Series A | | 5.00 | 7-15-2025 | 2,000,000 | 2,112,599 |
| Water & sewer revenue: 0.34% | | | | | |
| District of Columbia Water & Sewer Authority Public Utility Subordinated Lien Bond Series C | | 1.75 | 10-1-2054 | 6,000,000 | 5,798,947 |
| | | | | | 20,172,945 |
| Florida: 4.18% | | | | | |
| Airport revenue: 0.74% | | | | | |
| Greater Orlando Aviation Authority Orlando Florida Airport Facilities Prerefunded Bond | | 5.00 | 10-1-2025 | 1,355,000 | 1,423,629 |
The accompanying notes are an integral part of these financial statements.
14 | Allspring Short-Term Municipal Bond Fund
Portfolio of investments—December 31, 2022 (unaudited)
| | | Interest
rate | Maturity
date | Principal | Value |
| Airport revenue (continued) | | | | | |
| Greater Orlando Aviation Authority Orlando Florida Airport Facilities Unrefunded Bond | | 5.00% | 10-1-2025 | $ 645,000 | $ 671,452 |
| Miami-Dade County FL Aviation Refunding Bonds Series 2014 | | 5.00 | 10-1-2028 | 10,000,000 | 10,232,894 |
| | | | | | 12,327,975 |
| Education revenue: 0.28% | | | | | |
| Capital Projects Finance Authority Student Housing Refunding Bond Series 2020A-1 | | 5.00 | 10-1-2024 | 500,000 | 507,291 |
| Capital Projects Finance Authority Student Housing Refunding Bond Series 2020A-1 | | 5.00 | 10-1-2025 | 1,000,000 | 1,018,115 |
| Capital Projects Finance Authority Student Housing Refunding Bond Series 2020A-1 | | 5.00 | 10-1-2026 | 1,000,000 | 1,018,007 |
| Florida Higher Educational Facilities Financing Authority Revenue Educational Facilities Institute Technology | | 5.00 | 10-1-2025 | 500,000 | 514,557 |
| Florida Higher Educational Facilities Financing Authority Revenue Educational Facilities Institute Technology | | 5.00 | 10-1-2026 | 750,000 | 778,299 |
| Palm Beach County FL Educational Facilities Authority Revenue Bonds Series 2021 | | 4.00 | 10-1-2026 | 250,000 | 251,157 |
| Palm Beach County FL Educational Facilities Authority Revenue Bonds Series 2021 | | 4.00 | 10-1-2027 | 255,000 | 255,962 |
| Palm Beach County FL Educational Facilities Authority Revenue Bonds Series 2021 | | 4.00 | 10-1-2028 | 270,000 | 270,880 |
| | | | | | 4,614,268 |
| Health revenue: 0.20% | | | | | |
| North Broward FL Hospital District Series B | | 5.00 | 1-1-2023 | 1,700,000 | 1,700,000 |
| Pompano Beach FL Refunding Bond John Knox Village Project | | 3.25 | 9-1-2023 | 665,000 | 659,259 |
| St. John's County FL IDA Vicars Landing Project A | | 4.00 | 12-15-2023 | 115,000 | 113,915 |
| St. John's County FL IDA Vicars Landing Project A | | 4.00 | 12-15-2024 | 145,000 | 142,128 |
| St. John's County FL IDA Vicars Landing Project A | | 4.00 | 12-15-2025 | 180,000 | 174,497 |
| St. John's County FL IDA Vicars Landing Project A | | 4.00 | 12-15-2026 | 185,000 | 176,974 |
| St. John's County FL IDA Vicars Landing Project A | | 4.00 | 12-15-2027 | 215,000 | 203,149 |
| St. John's County FL IDA Vicars Landing Project A | | 4.00 | 12-15-2028 | 200,000 | 186,976 |
| | | | | | 3,356,898 |
| Housing revenue: 0.53% | | | | | |
| Capital Trust Agency Florida College Park Towers Apartments Project (Department of Housing and Urban Development Insured) | | 1.25 | 5-1-2024 | 9,000,000 | 8,933,236 |
| Miscellaneous revenue: 0.62% | | | | | |
| Miami-Dade County FL School Board Certificate of Participation Series A | | 5.00 | 5-1-2031 | 10,115,000 | 10,378,956 |
| Resource recovery revenue: 0.27% | | | | | |
| Lee County FL Solid Waste System Refunding Bond | | 5.00 | 10-1-2023 | 4,565,000 | 4,598,590 |
| Tax revenue: 0.36% | | | | | |
| Leon County FL School District | | 4.00 | 9-1-2026 | 6,000,000 | 6,037,804 |
The accompanying notes are an integral part of these financial statements.
Allspring Short-Term Municipal Bond Fund | 15
Portfolio of investments—December 31, 2022 (unaudited)
| | | Interest
rate | Maturity
date | Principal | Value |
| Transportation revenue: 0.06% | | | | | |
| Osceola County FL Transportation Improvement Osceola Parkway Series 2019A-1 | | 5.00% | 10-1-2024 | $ 300,000 | $ 304,456 |
| Osceola County FL Transportation Improvement Osceola Parkway Series 2019A-1 | | 5.00 | 10-1-2026 | 735,000 | 753,520 |
| | | | | | 1,057,976 |
| Utilities revenue: 0.05% | | | | | |
| Orlando FL Commission Utility System Series B øø | | 1.25 | 10-1-2046 | 1,000,000 | 850,870 |
| Water & sewer revenue: 1.07% | | | | | |
| North Sumter County FL Sumter County Utility Dependent District Utility Revenue Bonds Series 2021 (AGM Insured) | | 5.00 | 10-1-2027 | 680,000 | 744,988 |
| North Sumter County FL Sumter County Utility Dependent District Utility Revenue Bonds Series 2021 (AGM Insured) | | 5.00 | 10-1-2028 | 1,360,000 | 1,514,943 |
| Tohopekaliga Water Authority Florida Utility System 144A | | 5.00 | 10-1-2025 | 14,160,000 | 15,046,085 |
| Wildwood Utility Dependent District Utility South Sumter Utility Project (BAM Insured) | | 5.00 | 10-1-2026 | 200,000 | 214,969 |
| Wildwood Utility Dependent District Utility South Sumter Utility Project (BAM Insured) | | 5.00 | 10-1-2027 | 200,000 | 218,279 |
| Wildwood Utility Dependent District Utility South Sumter Utility Project (BAM Insured) | | 5.00 | 10-1-2028 | 250,000 | 276,945 |
| | | | | | 18,016,209 |
| | | | | | 70,172,782 |
| Georgia: 2.72% | | | | | |
| Health revenue: 0.06% | | | | | |
| Cobb County GA Kennestone Hospital Authority Series 2020B | | 5.00 | 4-1-2026 | 1,000,000 | 1,055,539 |
| Industrial development revenue: 0.30% | | | | | |
| Savannah GA EDA PCR International Paper Company Project Series B | | 1.90 | 8-1-2024 | 4,250,000 | 4,102,963 |
| Savannah GA EDA Recovery Zone Facility International | | 2.00 | 11-1-2033 | 1,000,000 | 962,259 |
| | | | | | 5,065,222 |
| Utilities revenue: 2.36% | | | | | |
| Burke County GA Development Authority PCR Bonds First Series 2012 | | 2.88 | 12-1-2049 | 3,500,000 | 3,453,570 |
| Georgia Municipal Electric Authority Plant Vogtle Units 3&4 Project M | | 5.00 | 1-1-2025 | 200,000 | 206,998 |
| Georgia Municipal Electric Authority Plant Vogtle Units 3&4 Project M | | 5.00 | 1-1-2026 | 300,000 | 315,725 |
| Georgia Municipal Electric Authority Plant Vogtle Units 3&4 Project P | | 5.00 | 1-1-2023 | 250,000 | 250,000 |
| Georgia Municipal Electric Authority Plant Vogtle Units 3&4 Project P | | 5.00 | 1-1-2024 | 400,000 | 406,819 |
| Georgia Municipal Electric Authority Plant Vogtle Units 3&4 Project P | | 5.00 | 1-1-2025 | 1,000,000 | 1,031,084 |
| Main Street Natural Gas Incorporated Gas Supply Revenue Bonds Series 2018C (Royal Bank of Canada LIQ) | | 4.00 | 8-1-2048 | 6,225,000 | 6,220,289 |
The accompanying notes are an integral part of these financial statements.
16 | Allspring Short-Term Municipal Bond Fund
Portfolio of investments—December 31, 2022 (unaudited)
| | | Interest
rate | Maturity
date | Principal | Value |
| Utilities revenue (continued) | | | | | |
| Main Street Natural Gas Incorporated Gas Supply Revenue Bonds Series 2021A | | 4.00% | 7-1-2052 | $ 1,000,000 | $ 991,813 |
| Main Street Natural Gas Incorporated Gas Supply Revenue Bonds Series 2021C | | 4.00 | 12-1-2026 | 1,100,000 | 1,093,461 |
| Main Street Natural Gas Incorporated Gas Supply Revenue Bonds Series 2021C | | 4.00 | 12-1-2027 | 1,215,000 | 1,202,054 |
| Main Street Natural Gas Incorporated Gas Supply Revenue Bonds Series 2022 | | 4.00 | 12-1-2027 | 4,000,000 | 3,978,384 |
| Main Street Natural Gas Incorporated Gas Supply Revenue Bonds Series 2022A | | 4.00 | 12-1-2028 | 3,345,000 | 3,305,803 |
| Main Street Natural Gas Incorporated Gas Supply Revenue Bonds Series 2022C 144Aøø | | 4.00 | 8-1-2052 | 8,000,000 | 7,521,457 |
| Main Street Natural Gas Incorporated Gas Supply Series B | | 5.00 | 12-1-2052 | 4,000,000 | 4,129,385 |
| Monroe County GA Development Authority PCR Georgia Power Company Plant Scherer Project First Series 2009 øø | | 1.00 | 7-1-2049 | 2,500,000 | 2,233,650 |
| Monroe County GA Development Authority PCR Oglethorpe Power Corporation Scherer Project Series A øø | | 1.50 | 1-1-2039 | 1,500,000 | 1,417,349 |
| Municipal Electric Authority of Georgia Plant Vogtle Units 3&4 Project J Bonds Series 2021A (AGM Insured) | | 5.00 | 1-1-2027 | 165,000 | 176,327 |
| Municipal Electric Authority of Georgia Plant Vogtle Units 3&4 Project J Bonds Series 2021A (AGM Insured) | | 5.00 | 1-1-2028 | 200,000 | 216,846 |
| Municipal Electric Authority of Georgia Plant Vogtle Units 3&4 Project J Bonds Series 2022A (AGM Insured) | | 5.00 | 7-1-2027 | 300,000 | 322,955 |
| Municipal Electric Authority of Georgia Plant Vogtle Units 3&4 Project J Bonds Series 2022A (AGM Insured) | | 5.00 | 7-1-2028 | 300,000 | 327,562 |
| Municipal Electric Authority of Georgia Plant Vogtle Units 3&4 Project J Bonds Series 2022A (AGM Insured) | | 5.00 | 7-1-2029 | 600,000 | 663,970 |
| | | | | | 39,465,501 |
| | | | | | 45,586,262 |
| Guam: 0.33% | | | | | |
| Airport revenue: 0.03% | | | | | |
| Guam International Airport Authority Revenue Bonds 2023 Series A %% | | 5.00 | 10-1-2028 | 540,000 | 544,717 |
| Tax revenue: 0.10% | | | | | |
| Government of Guam Business Privilege Series F | | 5.00 | 1-1-2028 | 500,000 | 524,668 |
| Government of Guam Business Privilege Series F | | 5.00 | 1-1-2029 | 1,000,000 | 1,056,305 |
| | | | | | 1,580,973 |
| Utilities revenue: 0.20% | | | | | |
| Guam Power Authority Series A | | 5.00 | 10-1-2026 | 3,265,000 | 3,425,302 |
| | | | | | 5,550,992 |
| Hawaii: 0.93% | | | | | |
| GO revenue: 0.25% | | | | | |
| Honolulu HI GO Series 2022A | | 5.00 | 11-1-2024 | 1,000,000 | 1,041,553 |
| Honolulu HI GO Series 2022A | | 5.00 | 11-1-2025 | 3,000,000 | 3,195,445 |
| | | | | | 4,236,998 |
The accompanying notes are an integral part of these financial statements.
Allspring Short-Term Municipal Bond Fund | 17
Portfolio of investments—December 31, 2022 (unaudited)
| | | Interest
rate | Maturity
date | Principal | Value |
| Miscellaneous revenue: 0.50% | | | | | |
| Hawaii Department of Transportation Airports Division Series 2013 | | 5.25% | 8-1-2025 | $ 1,945,000 | $ 1,964,593 |
| Hawaii Department of Transportation Airports Division Series 2013 | | 5.25 | 8-1-2026 | 6,350,000 | 6,410,954 |
| | | | | | 8,375,547 |
| Utilities revenue: 0.18% | | | | | |
| Hawaii Department of Budget & Finance Hawaiian Electric Company Series 2017A | | 3.10 | 5-1-2026 | 3,000,000 | 2,929,193 |
| | | | | | 15,541,738 |
| Illinois: 9.28% | | | | | |
| Airport revenue: 1.20% | | | | | |
| Chicago IL Midway Airport Refunding Bond Second Lien Series A | | 5.00 | 1-1-2025 | 5,000,000 | 5,068,896 |
| Chicago IL O'Hare International Airport Refunding Bond Passenger Facility | | 5.00 | 1-1-2023 | 13,720,000 | 13,720,000 |
| Chicago IL O'Hare International Airport Refunding Bond Passenger Facility | | 5.00 | 1-1-2024 | 1,335,000 | 1,353,186 |
| | | | | | 20,142,082 |
| Education revenue: 0.46% | | | | | |
| Illinois Finance Authority Benedictine University Refunding Bond | | 5.00 | 10-1-2027 | 630,000 | 642,977 |
| Illinois State University Auxiliary Facilities System Series A | | 5.00 | 4-1-2024 | 2,325,000 | 2,334,820 |
| Illinois State University Auxiliary Facilities System Series A (AGM Insured) | | 5.00 | 4-1-2025 | 700,000 | 730,647 |
| Illinois State University Auxiliary Facilities System Series B (AGM Insured) | | 5.00 | 4-1-2024 | 415,000 | 424,015 |
| Southern Illinois University Board of Trustees Southern Illinois University Housing and Auxiliary Facilities System Series A (BAM Insured) | | 4.00 | 4-1-2026 | 825,000 | 842,259 |
| Southern Illinois University Board of Trustees Southern Illinois University Housing and Auxiliary Facilities System Series A (BAM Insured) | | 4.00 | 4-1-2027 | 780,000 | 800,264 |
| Southern Illinois University Board of Trustees Southern Illinois University Housing and Auxiliary Facilities System Series A (BAM Insured) | | 5.00 | 4-1-2027 | 400,000 | 425,425 |
| Southern Illinois University Board of Trustees Southern Illinois University Housing and Auxiliary Facilities System Series A (BAM Insured) | | 5.00 | 4-1-2028 | 500,000 | 537,258 |
| Western Illinois University Refunding Bond Auxiliary Facilities System (BAM Insured) | | 4.00 | 4-1-2024 | 1,000,000 | 1,008,316 |
| | | | | | 7,745,981 |
| GO revenue: 2.69% | | | | | |
| Boone, McHenry & DeKalb Counties IL Community Unit School District #100 GO Refunding School Bonds, Series 2021B | | 4.00 | 1-1-2027 | 4,525,000 | 4,667,170 |
| Boone, McHenry & DeKalb Counties IL Community Unit School District #100 GO Refunding School Bonds, Series 2021B | | 4.00 | 1-1-2028 | 2,100,000 | 2,180,612 |
| Chicago IL Board of Education Refunding Bond Series A (AGM Insured) | | 5.00 | 12-1-2023 | 2,000,000 | 2,029,914 |
The accompanying notes are an integral part of these financial statements.
18 | Allspring Short-Term Municipal Bond Fund
Portfolio of investments—December 31, 2022 (unaudited)
| | | Interest
rate | Maturity
date | Principal | Value |
| GO revenue (continued) | | | | | |
| Chicago IL Board of Education Refunding Bond Series B | | 5.00% | 12-1-2030 | $ 2,250,000 | $ 2,319,542 |
| Chicago IL GO Series 2021A | | 5.00 | 1-1-2027 | 3,935,000 | 4,072,080 |
| Chicago IL GO Series 2021A | | 5.00 | 1-1-2028 | 3,000,000 | 3,124,522 |
| Chicago IL Refunding Bond Series A | | 5.00 | 1-1-2026 | 5,000,000 | 5,135,291 |
| Chicago IL Refunding Bonds Project Series 2015C | | 5.00 | 1-1-2023 | 1,450,000 | 1,450,000 |
| Chicago IL Series A | | 5.00 | 1-1-2027 | 2,445,000 | 2,530,174 |
| Chicago IL Unrefunded Balance Refunding Bonds Series C | | 5.00 | 1-1-2023 | 3,300,000 | 3,300,000 |
| Cook County IL GO Refunding Bonds Series 2021A | | 5.00 | 11-15-2026 | 1,950,000 | 2,082,746 |
| Cook County IL Refunding Bond Series A | | 5.00 | 11-15-2025 | 1,200,000 | 1,264,706 |
| DeKalb County IL Community Unit School District Series B (AGM Insured) ¤ | | 0.00 | 1-1-2025 | 3,235,000 | 3,011,736 |
| Grundy, Kendall & Will Counties IL Community High School District #111 Minooka Refund Bond | | 4.00 | 5-1-2027 | 500,000 | 515,851 |
| Grundy, Kendall & Will Counties IL Community High School District #111 Minooka Refunding Bond | | 4.00 | 5-1-2026 | 635,000 | 652,859 |
| Kane, Cook, DuPage, McHenry & DeKalb Counties IL Refunding Bond Series B | | 4.00 | 12-15-2026 | 960,000 | 1,002,909 |
| Kane, Cook, DuPage, McHenry & DeKalb Counties IL Refunding Bond Series B | | 4.00 | 12-15-2027 | 795,000 | 837,563 |
| Kendall, Kane & Will Counties IL Refunding Bond Series B | | 5.00 | 10-1-2023 | 825,000 | 836,458 |
| Waukegan IL Series B (AGM Insured) | | 4.00 | 12-30-2023 | 500,000 | 504,837 |
| Whiteside & Lee Counties IL Community Unit School District Series A (BAM Insured) | | 4.00 | 12-1-2024 | 1,490,000 | 1,519,165 |
| Will County IL Community High School District #161 | | 4.00 | 1-1-2024 | 2,000,000 | 2,017,654 |
| | | | | | 45,055,789 |
| Health revenue: 1.03% | | | | | |
| Illinois Finance Authority Health Services Facility Series 2020 | | 5.00 | 10-1-2025 | 500,000 | 519,043 |
| Illinois Finance Authority Health Services Facility Series 2020 | | 5.00 | 10-1-2026 | 500,000 | 525,802 |
| Illinois Finance Authority Presbyterian Homes Obligated Group Series B (SIFMA Municipal Swap +0.70%) ± | | 4.36 | 5-1-2042 | 2,250,000 | 2,185,039 |
| Illinois Finance Authority Revenue Bonds Advocate Health Care Network | | 4.00 | 11-1-2030 | 3,600,000 | 3,638,327 |
| Illinois Finance Authority Revenue Bonds Series 2020C (JPMorgan Chase & Company SPA) ø | | 3.65 | 8-15-2049 | 4,815,000 | 4,815,000 |
| Illinois Finance Authority Revenue Refunding Bonds Series 2022 | | 4.00 | 10-15-2026 | 465,000 | 448,823 |
| Illinois Finance Authority Revenue Refunding Bonds Series 2022 | | 4.00 | 10-15-2027 | 480,000 | 457,427 |
| Illinois Finance Authority Series 2020B-2 | | 5.00 | 5-15-2050 | 4,000,000 | 4,216,973 |
| Southwestern Illinois Development Authority Health Facility Memorial Group Incorporated | | 6.38 | 11-1-2023 | 535,000 | 548,747 |
| | | | | | 17,355,181 |
| Housing revenue: 1.01% | | | | | |
| Chicago Heights IL MFHR Series 2022 | | 2.88 | 8-1-2027 | 4,500,000 | 4,394,674 |
| Illinois Housing Development Authority (SIFMA Municipal Swap +1.00%)(FNMA LOC, FNMA LIQ) ± | | 4.66 | 5-15-2050 | 7,500,000 | 7,506,746 |
| Illinois Housing Development Authority Series H (GNMA / FNMA / FHLMC Insured) | | 3.47 | 10-1-2053 | 5,000,000 | 4,997,925 |
| | | | | | 16,899,345 |
The accompanying notes are an integral part of these financial statements.
Allspring Short-Term Municipal Bond Fund | 19
Portfolio of investments—December 31, 2022 (unaudited)
| | | Interest
rate | Maturity
date | Principal | Value |
| Miscellaneous revenue: 1.26% | | | | | |
| Chicago IL Board of Education Refunding Bond Series B | | 5.00% | 12-1-2024 | $ 2,270,000 | $ 2,311,645 |
| Chicago IL Board of Education Refunding Bond Series B | | 5.00 | 12-1-2025 | 2,460,000 | 2,516,750 |
| Chicago IL Special Assessment Improvement Bonds Series 2022 144A | | 3.04 | 12-1-2028 | 270,000 | 240,512 |
| Illinois GO Series June 2013 | | 5.25 | 7-1-2028 | 4,000,000 | 4,019,953 |
| Illinois Series 2017D | | 5.00 | 11-1-2026 | 8,325,000 | 8,581,339 |
| Illinois Series 2017D | | 5.00 | 11-1-2027 | 3,335,000 | 3,447,295 |
| | | | | | 21,117,494 |
| Tax revenue: 1.22% | | | | | |
| Hillside IL Refunding Bond Series 2018 | | 5.00 | 1-1-2024 | 330,000 | 330,534 |
| Huntley IL Special Service Area #6 Special Tax Refunding Bond (BAM Insured) | | 2.20 | 3-1-2024 | 797,000 | 785,452 |
| Illinois Sales Tax Revenue Junior Obligation Series C | | 4.00 | 6-15-2025 | 4,000,000 | 4,026,466 |
| Illinois Sales Tax Revenue Refunding Bond Series C | | 4.00 | 6-15-2023 | 3,315,000 | 3,322,755 |
| Illinois Series 2013 | | 5.00 | 6-15-2024 | 585,000 | 588,295 |
| Illinois State Tax Revenue Junior Obligation Series D | | 5.00 | 6-15-2027 | 1,275,000 | 1,324,534 |
| Macon County IL Decatur School District #61 Series 2020 C (AGM Insured) | | 4.00 | 1-1-2024 | 475,000 | 479,982 |
| Macon County IL Decatur School District #61 Series 2020 C (AGM Insured) | | 4.00 | 1-1-2027 | 600,000 | 621,086 |
| Metropolitan Pier & Exposition Authority McCormick Place Project Refunding Bonds Series A | | 3.00 | 6-15-2025 | 2,000,000 | 1,967,914 |
| Sales Tax Securitization Corporation Second Lien Series 2020A | | 5.00 | 1-1-2028 | 5,000,000 | 5,366,195 |
| Village of Matteson GO Refunding Bonds Series 2021A (BAM Insured) | | 4.00 | 12-1-2025 | 500,000 | 513,730 |
| Village of Matteson GO Refunding Bonds Series 2021A (BAM Insured) | | 4.00 | 12-1-2026 | 200,000 | 206,457 |
| Village of Matteson GO Refunding Bonds Series 2021A (BAM Insured) | | 4.00 | 12-1-2027 | 300,000 | 311,616 |
| Village of Matteson GO Refunding Bonds Series 2021A (BAM Insured) | | 4.00 | 12-1-2027 | 575,000 | 598,062 |
| | | | | | 20,443,078 |
| Transportation revenue: 0.13% | | | | | |
| Illinois Toll Highway Authority Senior Refunding Bond Series C | | 5.00 | 1-1-2027 | 2,050,000 | 2,229,226 |
| Utilities revenue: 0.19% | | | | | |
| Springfield IL Senior Lien Electric Revenue Refunding Bonds Series 2015 | | 5.00 | 3-1-2029 | 3,000,000 | 3,105,224 |
| Water & sewer revenue: 0.09% | | | | | |
| Geneva IL Waterworks Sewage Alternate Revenue Source Series 2021 | | 4.00 | 2-1-2027 | 450,000 | 467,992 |
| Geneva IL Waterworks Sewage Alternate Revenue Source Series 2021 | | 4.00 | 2-1-2028 | 280,000 | 292,307 |
| Village of Matteson GO Refunding Bonds Series 2021A (BAM Insured) | | 4.00 | 12-1-2025 | 400,000 | 410,310 |
| Waukegan Lake County IL First Lien Water & Sewer System Revenue Bonds Series 2020 (AGM Insured) | | 5.00 | 12-30-2027 | 280,000 | 305,869 |
| | | | | | 1,476,478 |
| | | | | | 155,569,878 |
The accompanying notes are an integral part of these financial statements.
20 | Allspring Short-Term Municipal Bond Fund
Portfolio of investments—December 31, 2022 (unaudited)
| | | Interest
rate | Maturity
date | Principal | Value |
| Indiana: 1.44% | | | | | |
| Health revenue: 0.80% | | | | | |
| Indiana Finance Authority Deaconess Health System Series B (SIFMA Municipal Swap +0.30%) ± | | 3.96% | 3-1-2039 | $ 5,775,000 | $ 5,628,974 |
| Indiana Finance Authority Health System Franciscan Alliance Incorporated Series B | | 5.00 | 11-1-2023 | 1,270,000 | 1,290,518 |
| Indiana Finance Authority Health System Franciscan Alliance Incorporated Series B | | 5.00 | 11-1-2024 | 3,000,000 | 3,111,054 |
| Indiana Finance Authority Health System Franciscan Alliance Incorporated Series C | | 5.00 | 11-1-2023 | 800,000 | 812,925 |
| Indiana Finance Authority Health System Franciscan Alliance Incorporated Series C | | 5.00 | 11-1-2024 | 1,000,000 | 1,037,018 |
| Indiana Finance Authority Parkview Health Series A | | 5.00 | 5-1-2023 | 1,010,000 | 1,016,083 |
| Indiana Finance Authority Senior Living Series A | | 5.00 | 11-15-2023 | 500,000 | 502,869 |
| | | | | | 13,399,441 |
| Miscellaneous revenue: 0.64% | | | | | |
| Indianapolis Local Public Improvement Bond Series A | | 5.00 | 6-1-2026 | 3,000,000 | 3,186,671 |
| Indianapolis Local Public Improvement Bond Series A | | 5.00 | 6-1-2027 | 6,000,000 | 6,474,208 |
| Mishawaka RDA Lease Rental Revenue Bonds of 2021 (BAM Insured) | | 5.00 | 2-15-2027 | 1,025,000 | 1,110,905 |
| | | | | | 10,771,784 |
| | | | | | 24,171,225 |
| Iowa: 0.82% | | | | | |
| Education revenue: 0.10% | | | | | |
| Iowa Student Loan Liquidity Corporation AMT Senior Series B | | 5.00 | 12-1-2023 | 700,000 | 709,527 |
| Iowa Student Loan Liquidity Corporation AMT Senior Series B | | 5.00 | 12-1-2024 | 1,000,000 | 1,026,744 |
| | | | | | 1,736,271 |
| GO revenue: 0.11% | | | | | |
| Indianola IA GO Capital Loan Notes Series 2021 | | 3.00 | 6-1-2027 | 855,000 | 862,633 |
| Indianola IA GO Capital Loan Notes Series 2021 | | 4.00 | 6-1-2028 | 880,000 | 932,460 |
| | | | | | 1,795,093 |
| Utilities revenue: 0.61% | | | | | |
| Iowa Gas Project Public Expenditure and Financial Accountability Incorporated | | 5.00 | 9-1-2049 | 10,000,000 | 10,238,585 |
| | | | | | 13,769,949 |
| Kansas: 0.53% | | | | | |
| Health revenue: 0.18% | | | | | |
| Topeka KS Health Care Facilities Brewster Place Series B | | 5.13 | 12-1-2026 | 1,000,000 | 998,377 |
| Wichita KS Health Care Facilities Presbyterian Manors Incorporated | | 4.00 | 5-15-2024 | 1,015,000 | 1,000,156 |
| Wichita KS Health Care Facilities Presbyterian Manors Incorporated | | 5.00 | 5-15-2025 | 1,055,000 | 1,049,833 |
| | | | | | 3,048,366 |
The accompanying notes are an integral part of these financial statements.
Allspring Short-Term Municipal Bond Fund | 21
Portfolio of investments—December 31, 2022 (unaudited)
| | | Interest
rate | Maturity
date | Principal | Value |
| Housing revenue: 0.35% | | | | | |
| Wichita KS MFHR Verandas at Crestview Series I | | 3.90% | 12-1-2024 | $ 5,900,000 | $ 5,914,927 |
| | | | | | 8,963,293 |
| Kentucky: 3.50% | | | | | |
| Education revenue: 0.09% | | | | | |
| Columbia KY Educational Development Refunding Revenue Bonds Lindsey Wilson College Project Series 2021 | | 4.00 | 12-1-2027 | 525,000 | 513,716 |
| Columbia KY Educational Development Refunding Revenue Bonds Lindsey Wilson College Project Series 2021 | | 4.00 | 12-1-2028 | 545,000 | 529,725 |
| Kentucky Bond Development Corporation City of Danville Centre College Series 2021 | | 4.00 | 6-1-2026 | 210,000 | 215,430 |
| Kentucky Bond Development Corporation City of Danville Centre College Series 2021 | | 4.00 | 6-1-2028 | 250,000 | 259,805 |
| | | | | | 1,518,676 |
| Health revenue: 0.25% | | | | | |
| Louisville & Jefferson Counties KY Metro Health System Revenue Norton Healthcare Incorporated Series C | | 5.00 | 10-1-2047 | 4,000,000 | 4,199,250 |
| Industrial development revenue: 0.16% | | | | | |
| Boone County KY Poll Control Duke Energy Kentucky Incorporated Series A | | 3.70 | 8-1-2027 | 2,750,000 | 2,708,993 |
| Miscellaneous revenue: 0.20% | | | | | |
| Kentucky State University Certificate of Participation Series 2021 (BAM Insured) | | 5.00 | 11-1-2027 | 160,000 | 174,859 |
| Kentucky State University Certificate of Participation Series 2021 (BAM Insured) | | 5.00 | 11-1-2028 | 200,000 | 222,067 |
| Rural Water Financing Agency KY Public Projects Construction Series A | | 3.00 | 5-1-2024 | 3,000,000 | 2,971,709 |
| | | | | | 3,368,635 |
| Utilities revenue: 2.80% | | | | | |
| Kentucky Public Energy Authority Gas Supply Series A-1 | | 4.00 | 12-1-2049 | 9,500,000 | 9,412,319 |
| Kentucky Public Energy Authority Gas Supply Series B | | 4.00 | 1-1-2049 | 26,085,000 | 25,894,527 |
| Louisville & Jefferson Counties KY Metro Government PCR Series B | | 1.35 | 11-1-2027 | 7,500,000 | 6,582,110 |
| Trimble County KY PCR Bonds Louisville Gas and Electric Company Project Series 2016A | | 1.30 | 9-1-2044 | 6,000,000 | 5,061,944 |
| | | | | | 46,950,900 |
| | | | | | 58,746,454 |
| Louisiana: 1.35% | | | | | |
| GO revenue: 0.09% | | | | | |
| Shreveport LA GO Series 2014 | | 5.00 | 9-1-2027 | 1,420,000 | 1,465,131 |
| Industrial development revenue: 0.83% | | | | | |
| St John the Baptist Parish Marathon Oil Corporation Project | | 2.10 | 6-1-2037 | 14,450,000 | 13,997,399 |
The accompanying notes are an integral part of these financial statements.
22 | Allspring Short-Term Municipal Bond Fund
Portfolio of investments—December 31, 2022 (unaudited)
| | | Interest
rate | Maturity
date | Principal | Value |
| Miscellaneous revenue: 0.38% | | | | | |
| Louisiana Local Government Environmental Facilities and CDA Subordinated Lien Bond East Baton Rouge øø | | 0.88% | 2-1-2046 | $ 5,000,000 | $ 4,717,488 |
| Louisiana State GO Series A | | 5.00 | 2-1-2027 | 1,570,000 | 1,601,845 |
| | | | | | 6,319,333 |
| Water & sewer revenue: 0.05% | | | | | |
| East Baton Rouge LA Refunding Bonds Multi Modal Series A | | 1.30 | 2-1-2041 | 1,000,000 | 858,861 |
| | | | | | 22,640,724 |
| Maine: 0.11% | | | | | |
| Education revenue: 0.03% | | | | | |
| Maine Finance Authority Supplemental Education Loan Program Class A Series A-1 (AGM Insured) | | 5.00 | 12-1-2025 | 425,000 | 444,794 |
| Health revenue: 0.08% | | | | | |
| Maine HEFAR Bonds Series 2020A | | 5.00 | 7-1-2025 | 255,000 | 268,874 |
| Maine HEFAR Bonds Series 2020A | | 5.00 | 7-1-2025 | 545,000 | 568,493 |
| Maine HEFAR Bonds Series 2020A | | 5.00 | 7-1-2026 | 500,000 | 532,350 |
| | | | | | 1,369,717 |
| | | | | | 1,814,511 |
| Maryland: 1.89% | | | | | |
| Housing revenue: 1.52% | | | | | |
| Maryland CDA Department of Housing & Community Multifamily Development Overlook Manor Townhouses Series C | | 3.00 | 4-1-2024 | 5,000,000 | 4,932,584 |
| Maryland CDA Department of Housing & Community Multifamily Development Series 2022-D | | 3.15 | 7-1-2024 | 4,000,000 | 3,912,805 |
| Maryland CDA Department of Housing & Community Multifamily Development Windsor Valley III Apartments Series G (FHA Insured) | | 1.05 | 12-1-2023 | 11,000,000 | 10,652,165 |
| Maryland CDA Department of Housing & Community Multifamily Development Woodside Gardens Series A 144A | | 1.33 | 1-1-2024 | 6,300,000 | 6,093,038 |
| | | | | | 25,590,592 |
| Transportation revenue: 0.37% | | | | | |
| Maryland Economic Development Corporation Private Activity Green Bond Purple Line Light Rail Transit Partners LLC Series A-P3 | | 5.00 | 11-12-2028 | 6,000,000 | 6,140,697 |
| | | | | | 31,731,289 |
| Massachusetts: 1.40% | | | | | |
| Education revenue: 0.08% | | | | | |
| Massachusetts Development Finance Agency Lasell University Series 2021 | | 4.00 | 7-1-2027 | 250,000 | 241,221 |
| Massachusetts Development Finance Agency Lasell University Series 2021 | | 4.00 | 7-1-2028 | 330,000 | 315,237 |
The accompanying notes are an integral part of these financial statements.
Allspring Short-Term Municipal Bond Fund | 23
Portfolio of investments—December 31, 2022 (unaudited)
| | | Interest
rate | Maturity
date | Principal | Value |
| Education revenue (continued) | | | | | |
| Massachusetts Development Finance Agency Springfield College Issue Series 2021A | | 5.00% | 6-1-2026 | $ 420,000 | $ 436,056 |
| Massachusetts Development Finance Agency Springfield College Issue Series 2021A | | 5.00 | 6-1-2027 | 440,000 | 460,526 |
| | | | | | 1,453,040 |
| Health revenue: 0.61% | | | | | |
| Massachusetts Development Finance Agency Partners Healthcare System Series S-3 (SIFMA Municipal Swap +0.50%) ± | | 4.16 | 7-1-2038 | 5,000,000 | 4,998,523 |
| Massachusetts Development Finance Agency Revenue Bonds Boston Medical Center Issue Series C | | 5.25 | 7-1-2027 | 1,850,000 | 1,852,405 |
| Massachusetts Development Finance Agency Wellforce Issue Series C (AGM Insured) | | 5.00 | 10-1-2026 | 300,000 | 319,599 |
| Massachusetts Development Finance Agency Wellforce Issue Series C (AGM Insured) | | 5.00 | 10-1-2027 | 410,000 | 443,317 |
| Massachusetts Development Finance Authority Revenue Bonds Series 2019-T1 (SIFMA Municipal Swap +0.60%) 144A± | | 4.26 | 7-1-2049 | 2,600,000 | 2,563,159 |
| | | | | | 10,177,003 |
| Transportation revenue: 0.71% | | | | | |
| Massachusetts Department of Transportation Refunding Bond | | 5.00 | 1-1-2039 | 11,885,000 | 11,885,000 |
| | | | | | 23,515,043 |
| Michigan: 2.50% | | | | | |
| Education revenue: 0.11% | | | | | |
| Board of Trustees of Northern Michigan University General Revenue Bonds Series 2018A | | 5.00 | 12-1-2027 | 640,000 | 701,918 |
| Lake Superior State University Board of Trustees Series 2021 (AGM Insured) | | 4.00 | 11-15-2026 | 390,000 | 401,740 |
| Lake Superior State University Board of Trustees Series 2021 (AGM Insured) | | 4.00 | 11-15-2027 | 405,000 | 419,997 |
| Lake Superior State University Board of Trustees Series 2021 (AGM Insured) | | 4.00 | 11-15-2028 | 405,000 | 420,966 |
| | | | | | 1,944,621 |
| GO revenue: 0.04% | | | | | |
| Clawson MI Public School Building and Site (Qualified School Board Loan Fund Insured) | | 4.00 | 5-1-2026 | 285,000 | 296,105 |
| Clawson MI Public School Building and Site (Qualified School Board Loan Fund Insured) | | 4.00 | 5-1-2028 | 300,000 | 317,033 |
| | | | | | 613,138 |
| Health revenue: 1.11% | | | | | |
| Kalamazoo MI Economic Development Corporation Series 2020B-2 | | 2.63 | 5-15-2025 | 115,000 | 109,285 |
| Michigan Finance Authority Bronson Healthcare Group Series B & C | | 3.75 | 11-15-2049 | 7,600,000 | 7,650,990 |
The accompanying notes are an integral part of these financial statements.
24 | Allspring Short-Term Municipal Bond Fund
Portfolio of investments—December 31, 2022 (unaudited)
| | | Interest
rate | Maturity
date | Principal | Value |
| Health revenue (continued) | | | | | |
| Michigan Finance Authority Hospital Beaumont Spectrum Series 2022B (SIFMA Municipal Swap +0.75%) ± | | 4.41% | 4-15-2047 | $10,500,000 | $ 10,322,264 |
| Michigan Strategic Fund Limited Obligation Refunding Bond Holland Home Project | | 4.00 | 11-15-2024 | 580,000 | 575,049 |
| | | | | | 18,657,588 |
| Industrial development revenue: 1.24% | | | | | |
| Michigan Strategic Fund Limited Obligation Consumers Energy Company Project | | 1.80 | 10-1-2049 | 19,500,000 | 18,843,729 |
| Michigan Strategic Fund Limited Obligation Revenue Graphic Packaging International LLC | | 4.00 | 10-1-2061 | 2,000,000 | 1,929,747 |
| | | | | | 20,773,476 |
| | | | | | 41,988,823 |
| Minnesota: 1.53% | | | | | |
| Airport revenue: 0.07% | | | | | |
| Minneapolis & St. Paul MN Metropolitan Airports Commission Subordinate Bond Series 2019B | | 5.00 | 1-1-2025 | 1,100,000 | 1,132,051 |
| GO revenue: 0.10% | | | | | |
| Hastings MN Independent School District #200 Series A (State School District Credit Program Insured) ¤ | | 0.00 | 2-1-2023 | 815,000 | 813,073 |
| Hastings MN Independent School District #200 Series A (State School District Credit Program Insured) ¤ | | 0.00 | 2-1-2024 | 1,015,000 | 982,241 |
| | | | | | 1,795,314 |
| Housing revenue: 0.39% | | | | | |
| Minnesota HFA Residential Housing Series D (SIFMA Municipal Swap +0.43%)(GNMA / FNMA / FHLMC Insured) ± | | 4.09 | 1-1-2045 | 6,515,000 | 6,506,867 |
| Miscellaneous revenue: 0.05% | | | | | |
| Duluth MN Independent School District Certificate of Participation Series B (State School District Credit Program Insured) | | 5.00 | 2-1-2024 | 425,000 | 433,802 |
| Duluth MN Independent School District Certificate of Participation Series B (State School District Credit Program Insured) | | 5.00 | 2-1-2025 | 375,000 | 389,687 |
| | | | | | 823,489 |
| Utilities revenue: 0.92% | | | | | |
| Central Minnesota Municipal Power Agency Brookings Southeast Twin Cities Transmission Project (AGM Insured) | | 5.00 | 1-1-2027 | 400,000 | 432,764 |
| Central Minnesota Municipal Power Agency Brookings Southeast Twin Cities Transmission Project (AGM Insured) | | 5.00 | 1-1-2028 | 500,000 | 548,649 |
| Minnesota Municipal Gas Agency Commodity Supply Revenue Bonds (U.S. SOFR +1.00%)(Royal Bank of Canada LIQ) ± | | 3.88 | 12-1-2052 | 15,000,000 | 14,467,964 |
| | | | | | 15,449,377 |
| | | | | | 25,707,098 |
The accompanying notes are an integral part of these financial statements.
Allspring Short-Term Municipal Bond Fund | 25
Portfolio of investments—December 31, 2022 (unaudited)
| | | Interest
rate | Maturity
date | Principal | Value |
| Mississippi: 0.16% | | | | | |
| Health revenue: 0.15% | | | | | |
| Mississippi Hospital Equipment & Facilities Authority Baptist Memorial Health Care Corporation Series A-1 | | 5.00% | 9-1-2044 | $ 2,500,000 | $ 2,589,309 |
| Industrial development revenue: 0.01% | | | | | |
| Mississippi Business Finance Corporation Solid Waste Disposal Facilities Mississippi Power Company Project ø | | 3.65 | 5-1-2028 | 120,000 | 120,000 |
| | | | | | 2,709,309 |
| Missouri: 0.68% | | | | | |
| Housing revenue: 0.47% | | | | | |
| Port Authority of Kansas City MFHR Bonds Series 2022A (Department of Housing and Urban Development Insured) | | 1.50 | 5-1-2024 | 8,000,000 | 7,943,202 |
| Utilities revenue: 0.21% | | | | | |
| Missouri Environmental Improvement and Energy Resources Authority Kansas City Power and Light Company Project | | 3.50 | 5-1-2038 | 3,500,000 | 3,471,438 |
| | | | | | 11,414,640 |
| Montana: 0.21% | | | | | |
| Health revenue: 0.21% | | | | | |
| Montana Facility Finance Authority Billings Clinic Obligated Group Series 2022A | | 5.00 | 8-15-2024 | 375,000 | 386,866 |
| Montana Facility Finance Authority Billings Clinic Obligated Group Series 2022A | | 5.00 | 8-15-2025 | 325,000 | 342,073 |
| Montana Facility Finance Authority Billings Clinic Obligated Group Series 2022A | | 5.00 | 8-15-2027 | 500,000 | 544,571 |
| Montana Facility Finance Authority Billings Clinic Obligated Group Series 2022A | | 5.00 | 8-15-2028 | 2,015,000 | 2,229,998 |
| | | | | | 3,503,508 |
| Nebraska: 0.73% | | | | | |
| Airport revenue: 0.07% | | | | | |
| Airport Authority of the City of Lincoln Airport Bonds Series 2021 | | 5.00 | 7-1-2028 | 1,000,000 | 1,070,504 |
| Education revenue: 0.13% | | | | | |
| Douglas County NE Educational Facilities Creighton University (SIFMA Municipal Swap +0.53%) ± | | 4.19 | 7-1-2035 | 2,230,000 | 2,195,397 |
| Health revenue: 0.20% | | | | | |
| Douglas County NE Hospital Authority Children's Hospital Obligated Group Series B | | 5.00 | 11-15-2053 | 3,250,000 | 3,409,009 |
| Utilities revenue: 0.33% | | | | | |
| Central Plains Energy Nebraska Gas Project #1 (Royal Bank of Canada LIQ) | | 4.00 | 12-1-2049 | 5,610,000 | 5,595,369 |
| | | | | | 12,270,279 |
The accompanying notes are an integral part of these financial statements.
26 | Allspring Short-Term Municipal Bond Fund
Portfolio of investments—December 31, 2022 (unaudited)
| | | Interest
rate | Maturity
date | Principal | Value |
| Nevada: 0.33% | | | | | |
| GO revenue: 0.33% | | | | | |
| Clark County NV School District Series B (AGM Insured) | | 5.00% | 6-15-2027 | $ 5,000,000 | $ 5,454,910 |
| New Jersey: 3.80% | | | | | |
| Airport revenue: 0.21% | | | | | |
| New Jersey EDA Refunding Bond Port Newark Container Terminal LLC Project | | 5.00 | 10-1-2023 | 1,500,000 | 1,510,653 |
| New Jersey EDA Refunding Bond Port Newark Container Terminal LLC Project | | 5.00 | 10-1-2024 | 2,000,000 | 2,027,817 |
| | | | | | 3,538,470 |
| GO revenue: 1.04% | | | | | |
| New Jersey EDA Series G 144A | | 5.25 | 9-1-2023 | 15,000,000 | 15,184,811 |
| Newark Board of Education School Energy Savings Obligation Refunding Bonds Series 2021 (BAM Insured) | | 5.00 | 7-15-2028 | 350,000 | 382,545 |
| Newark Board of Education School Energy Savings Obligation Refunding Bonds Series 2021 (BAM Insured) | | 5.00 | 7-15-2027 | 350,000 | 378,525 |
| Newark NJ General Capital Improvement BAN Series 2022D | | 4.00 | 9-29-2023 | 1,500,000 | 1,503,563 |
| | | | | | 17,449,444 |
| Housing revenue: 0.91% | | | | | |
| New Jersey Housing & Mortgage Finance Agency Single Family Housing Revenue Series B | | 2.90 | 4-1-2023 | 4,900,000 | 4,890,103 |
| New Jersey Housing & Mortgage Finance Agency Single Family Housing Revenue Series B | | 2.95 | 10-1-2023 | 4,585,000 | 4,558,760 |
| New Jersey Housing & Mortgage Finance Agency Single Family Housing Revenue Series B | | 3.10 | 4-1-2024 | 2,170,000 | 2,151,732 |
| New Jersey Housing & Mortgage Finance Agency Single Family Housing Revenue Series B | | 3.25 | 4-1-2025 | 2,465,000 | 2,441,007 |
| New Jersey Housing & Mortgage Finance Agency Single Family Housing Revenue Series D | | 2.90 | 10-1-2025 | 1,200,000 | 1,175,816 |
| | | | | | 15,217,418 |
| Miscellaneous revenue: 0.34% | | | | | |
| New Jersey EDA School Facilities Construction Bond Series DDD | | 5.00 | 6-15-2023 | 3,000,000 | 3,021,426 |
| New Jersey EDA School Facilities Construction Bond Series DDD | | 5.00 | 6-15-2024 | 2,605,000 | 2,670,646 |
| | | | | | 5,692,072 |
| Transportation revenue: 1.30% | | | | | |
| New Jersey Turnpike Authority Series C-6 (1 Month LIBOR +0.75%) ± | | 3.63 | 1-1-2030 | 21,820,000 | 21,820,000 |
| | | | | | 63,717,404 |
| New York: 7.10% | | | | | |
| Airport revenue: 0.94% | | | | | |
| Albany County NY Airport Authority Airport Revenue Refunding Bonds, Series 2020B | | 5.00 | 12-15-2026 | 1,070,000 | 1,124,410 |
The accompanying notes are an integral part of these financial statements.
Allspring Short-Term Municipal Bond Fund | 27
Portfolio of investments—December 31, 2022 (unaudited)
| | | Interest
rate | Maturity
date | Principal | Value |
| Airport revenue (continued) | | | | | |
| New York Transportation Development Corporation Terminal 4 John F. Kennedy International Airport Project Series 2020A | | 5.00% | 12-1-2026 | $ 490,000 | $ 512,684 |
| New York Transportation Development Corporation Terminal 4 John F. Kennedy International Airport Project Series 2020A | | 5.00 | 12-1-2027 | 500,000 | 525,658 |
| New York Transportation Development Corporation Terminal 4 John F. Kennedy International Airport Project Series 2020A | | 5.00 | 12-1-2028 | 500,000 | 527,796 |
| New York Transportation Development Corporation Terminal 4 John F. Kennedy International Airport Project Series 2020A | | 5.00 | 12-1-2029 | 500,000 | 528,876 |
| New York Transportation Development Corporation Terminal 4 John F. Kennedy International Airport Project Series 2022 | | 5.00 | 12-1-2027 | 5,000,000 | 5,256,582 |
| Port of New York & Port of New Jersey Authority Consolidated Bonds 185th Series AMT | | 5.00 | 9-1-2026 | 7,150,000 | 7,310,774 |
| | | | | | 15,786,780 |
| Education revenue: 0.35% | | | | | |
| Hempstead Town NY Local Development Corporation Education Revenue Refunding Bonds The Academy Charter School Project Series A | | 4.05 | 2-1-2031 | 1,000,000 | 870,186 |
| Hempstead Town NY Local Development Corporation Education Revenue Refunding Bonds The Academy Charter School Project Series B | | 4.76 | 2-1-2027 | 1,640,000 | 1,589,195 |
| New York Dormitory Authority Iona College Series 2022 | | 5.00 | 7-1-2028 | 825,000 | 882,331 |
| New York Housing Finance Agency Affordable Housing Series K2 | | 5.00 | 7-1-2025 | 600,000 | 623,236 |
| St. Lawrence County NY IDA Civic Development Corporation St. Lawrence University Project | | 5.00 | 7-1-2026 | 400,000 | 426,563 |
| St. Lawrence County NY IDA Civic Development Corporation St. Lawrence University Project | | 5.00 | 7-1-2027 | 510,000 | 551,687 |
| St. Lawrence County NY IDA Clarkson University Project Series B | | 1.55 | 9-1-2042 | 1,000,000 | 949,784 |
| | | | | | 5,892,982 |
| GO revenue: 0.25% | | | | | |
| Poughkeepsie Dutchess County NY Public Improvement Refunding Bond | | 4.00 | 4-15-2027 | 480,000 | 489,867 |
| Suffolk County NY Series A (BAM Insured) | | 5.00 | 6-15-2028 | 3,215,000 | 3,593,399 |
| | | | | | 4,083,266 |
| Health revenue: 0.45% | | | | | |
| Broome County NY Local Development Corporation Series 2020 (AGM Insured) | | 5.00 | 4-1-2026 | 500,000 | 527,138 |
| Broome County NY Local Development Corporation Series 2020 (AGM Insured) | | 5.00 | 4-1-2027 | 950,000 | 1,012,318 |
| New York Dormitory Authority Montefiore Obligated Group Series 2018A | | 5.00 | 8-1-2026 | 1,000,000 | 1,028,824 |
The accompanying notes are an integral part of these financial statements.
28 | Allspring Short-Term Municipal Bond Fund
Portfolio of investments—December 31, 2022 (unaudited)
| | | Interest
rate | Maturity
date | Principal | Value |
| Health revenue (continued) | | | | | |
| New York Dormitory Authority Non State Supported Debt Northwell Health | | 5.00% | 5-1-2048 | $ 4,000,000 | $ 4,054,466 |
| Westchester County NY Local Development Corporation Purchase Senior Learning Community Incorporated 144A | | 2.88 | 7-1-2026 | 1,000,000 | 961,603 |
| | | | | | 7,584,349 |
| Housing revenue: 0.32% | | | | | |
| New York Housing Finance Agency Affordable Housing Revenue Various Sustainability Bonds Series J-2 øø | | 1.10 | 11-1-2061 | 2,500,000 | 2,227,699 |
| New York Housing Finance Agency Affordable Housing Revenue Various Sustainability Bonds Series K-2 øø | | 1.00 | 11-1-2061 | 500,000 | 452,171 |
| New York NY Housing Development Corporation MFHR AMT Sustainable Neighborhood | | 1.75 | 11-1-2023 | 400,000 | 395,540 |
| New York NY Housing Development Corporation MFHR AMT Sustainable Neighborhood | | 1.80 | 5-1-2024 | 400,000 | 393,377 |
| New York NY Housing Development Corporation MFHR AMT Sustainable Neighborhood | | 1.85 | 11-1-2024 | 400,000 | 391,880 |
| New York NY Housing Development Corporation MFHR AMT Sustainable Neighborhood | | 1.90 | 5-1-2025 | 515,000 | 502,942 |
| New York NY Housing Development Corporation MFHR AMT Sustainable Neighborhood | | 1.95 | 11-1-2025 | 520,000 | 505,829 |
| New York NY Housing Development Corporation MFHR AMT Sustainable Neighborhood | | 2.00 | 5-1-2026 | 535,000 | 515,677 |
| | | | | | 5,385,115 |
| Industrial development revenue: 1.81% | | | | | |
| New York Transportation Development Corporation Special Facilities Revenue Delta Airlines Incorporated LaGuardia Airport Terminals C&D Redevelopment Project | | 5.00 | 1-1-2024 | 7,205,000 | 7,250,907 |
| New York Transportation Development Corporation Special Facilities Revenue Delta Airlines Incorporated LaGuardia Airport Terminals C&D Redevelopment Project | | 5.00 | 1-1-2025 | 22,925,000 | 23,125,795 |
| | | | | | 30,376,702 |
| Miscellaneous revenue: 0.20% | | | | | |
| New York Liberty Development Corporation Tax-Exempt Liberty Revenue Refunding Bonds Series 2021A | | 1.20 | 11-15-2028 | 2,500,000 | 2,066,794 |
| New York NY IDA Refunding Bonds Series 2021A (AGM Insured) | | 5.00 | 1-1-2024 | 1,250,000 | 1,272,044 |
| | | | | | 3,338,838 |
| Tax revenue: 1.35% | | | | | |
| Triborough Bridge & Tunnel Authority Payroll Mobility Tax Senior Lien Series A | | 2.00 | 5-15-2045 | 6,000,000 | 5,380,573 |
| Triborough Bridge & Tunnel Authority Payroll Mobility Tax Senior Lien Series B | | 5.00 | 5-15-2026 | 15,000,000 | 16,160,780 |
| Triborough Bridge & Tunnel Authority Series 2022B | | 5.00 | 5-15-2024 | 1,000,000 | 1,030,334 |
| | | | | | 22,571,687 |
| Transportation revenue: 0.75% | | | | | |
| New York Metropolitan Transportation Authority Refunding Green Bonds Series D1 | | 5.00 | 11-15-2034 | 5,000,000 | 5,124,110 |
The accompanying notes are an integral part of these financial statements.
Allspring Short-Term Municipal Bond Fund | 29
Portfolio of investments—December 31, 2022 (unaudited)
| | | Interest
rate | Maturity
date | Principal | Value |
| Transportation revenue (continued) | | | | | |
| New York Metropolitan Transportation Authority Transportation Revenue Refunding Bonds Series 2017D | | 5.00% | 11-15-2026 | $ 4,475,000 | $ 4,676,296 |
| Triborough Bridge and Tunnel Authority Revenue Refunding Bonds 2013A | | 5.00 | 11-15-2026 | 2,770,000 | 2,789,493 |
| | | | | | 12,589,899 |
| Utilities revenue: 0.54% | | | | | |
| Long Island Power Authority Electric System General Revenue Bonds Series B øø | | 1.50 | 9-1-2051 | 3,500,000 | 3,251,929 |
| Long Island Power Authority Electric System General Revenue Bonds Series B øø | | 1.65 | 9-1-2049 | 6,000,000 | 5,799,304 |
| | | | | | 9,051,233 |
| Water & sewer revenue: 0.14% | | | | | |
| New York City Municipal Water Finance Authority Water & Sewer System Series DD | | 5.00 | 6-15-2026 | 2,225,000 | 2,403,554 |
| | | | | | 119,064,405 |
| North Carolina: 0.60% | | | | | |
| Health revenue: 0.25% | | | | | |
| Charlotte Mecklenburg Hospital Authority North Carolina Health Care System Atrium Health Series E øø | | 0.80 | 1-15-2048 | 1,500,000 | 1,412,716 |
| North Carolina Medical Care Commission Health Care Facilities First Mortgage Lutheran Services Series A | | 5.00 | 3-1-2026 | 245,000 | 245,977 |
| North Carolina Medical Care Commission Health Care Facilities First Mortgage Lutheran Services Series A | | 5.00 | 3-1-2027 | 295,000 | 294,324 |
| North Carolina Medical Care Commission Health Care Facilities First Mortgage Lutheran Services Series A | | 5.00 | 3-1-2028 | 305,000 | 302,114 |
| North Carolina Medical Care Commission Retirement Facilities Entrance Fee Series 2020B-2 | | 2.30 | 9-1-2025 | 1,250,000 | 1,169,280 |
| North Carolina Medical Care Commission Retirement Facilities First Mortgage Series 2020B-2 | | 2.50 | 10-1-2024 | 740,000 | 740,000 |
| | | | | | 4,164,411 |
| Industrial development revenue: 0.05% | | | | | |
| Columbus County Industrial Facilities & PCFA Environmental Improvement Revenue Refunding Bond International Paper Company Project Series A | | 2.00 | 11-1-2033 | 1,000,000 | 962,259 |
| Resource recovery revenue: 0.30% | | | | | |
| North Carolina Capital Finance Republic Services Incorporated Project Series 2013 | | 3.75 | 6-1-2038 | 5,000,000 | 4,997,581 |
| | | | | | 10,124,251 |
| North Dakota: 0.23% | | | | | |
| Health revenue: 0.23% | | | | | |
| Grand Forks ND Health Care System Revenue Bonds Altru Health System Series 2021 | | 5.00 | 12-1-2025 | 380,000 | 395,235 |
| Grand Forks ND Health Care System Revenue Bonds Altru Health System Series 2021 | | 5.00 | 12-1-2026 | 435,000 | 457,563 |
The accompanying notes are an integral part of these financial statements.
30 | Allspring Short-Term Municipal Bond Fund
Portfolio of investments—December 31, 2022 (unaudited)
| | | Interest
rate | Maturity
date | Principal | Value |
| Health revenue (continued) | | | | | |
| Grand Forks ND Health Care System Revenue Bonds Altru Health System Series 2021 | | 5.00% | 12-1-2027 | $ 1,125,000 | $ 1,195,141 |
| Grand Forks ND Health Care System Revenue Bonds Altru Health System Series 2021 | | 5.00 | 12-1-2028 | 1,650,000 | 1,766,865 |
| | | | | | 3,814,804 |
| Ohio: 3.14% | | | | | |
| GO revenue: 0.20% | | | | | |
| Lake County OH Building Improvement BAN Series 2022 | | 1.25 | 1-12-2023 | 3,300,000 | 3,298,297 |
| Health revenue: 0.87% | | | | | |
| Allen County OH Hospital Facilities Revenue Bonds Series 2022B-1 | | 5.00 | 10-1-2049 | 10,000,000 | 10,630,915 |
| Hamilton County OH Hospital Facilities UC Health Series 2020 | | 5.00 | 9-15-2026 | 655,000 | 691,456 |
| Ohio Hospital Revenue Bonds Series 2020 | | 5.00 | 11-15-2025 | 265,000 | 276,105 |
| Ohio University Hospital Health System Series B | | 5.00 | 1-15-2050 | 2,905,000 | 2,999,457 |
| | | | | | 14,597,933 |
| Housing revenue: 0.46% | | | | | |
| Cuyahoga Ohio Metropolitan Housing Authority Multifamily Housing Wade Park Apartments | | 4.75 | 12-1-2027 | 4,000,000 | 4,114,001 |
| Ohio HFA MFHR Series 2022A (Department of Housing and Urban Development Insured) | | 3.50 | 7-1-2025 | 3,550,000 | 3,533,013 |
| | | | | | 7,647,014 |
| Industrial development revenue: 0.21% | | | | | |
| Ohio Air Quality Development Authority Ohio Valley Electric Corporation Series A | | 2.88 | 2-1-2026 | 3,750,000 | 3,575,632 |
| Miscellaneous revenue: 0.04% | | | | | |
| Dayton OH City School District Certificate of Participation School Facilities Project | | 3.00 | 12-1-2026 | 180,000 | 179,729 |
| Dayton OH City School District Certificate of Participation School Facilities Project | | 3.00 | 12-1-2027 | 270,000 | 268,471 |
| Dayton OH City School District Certificate of Participation School Facilities Project | | 4.00 | 12-1-2028 | 230,000 | 242,898 |
| | | | | | 691,098 |
| Resource recovery revenue: 0.69% | | | | | |
| Ohio Air Quality Development Authority Refunding Bond American Electric Power Company Project | | 1.90 | 5-1-2026 | 12,000,000 | 11,501,120 |
| Tax revenue: 0.35% | | | | | |
| Akron OH Community Learning Centers Income Tax Revenue Refunding Bonds Series 2022 | | 4.00 | 12-1-2028 | 2,000,000 | 2,127,791 |
| Akron OH Community Learning Centers Income Tax Revenue Refunding Bonds Series 2022 | | 4.00 | 12-1-2027 | 3,540,000 | 3,739,956 |
| | | | | | 5,867,747 |
| Utilities revenue: 0.32% | | | | | |
| American Municipal Power Ohio Incorporated Fremont Energy Center | | 5.00 | 2-15-2027 | 400,000 | 431,426 |
| American Municipal Power Ohio Incorporated Fremont Energy Center | | 5.00 | 2-15-2029 | 350,000 | 389,510 |
The accompanying notes are an integral part of these financial statements.
Allspring Short-Term Municipal Bond Fund | 31
Portfolio of investments—December 31, 2022 (unaudited)
| | | Interest
rate | Maturity
date | Principal | Value |
| Utilities revenue (continued) | | | | | |
| American Municipal Power Ohio Incorporated Hydroelectric Projects Series A | | 5.00% | 2-15-2025 | $ 1,200,000 | $ 1,250,929 |
| American Municipal Power Ohio Incorporated Hydroelectric Projects Series A | | 5.00 | 2-15-2026 | 1,500,000 | 1,590,757 |
| American Municipal Power Ohio Incorporated Hydroelectric Projects Series A | | 5.00 | 2-15-2027 | 1,600,000 | 1,725,703 |
| | | | | | 5,388,325 |
| | | | | | 52,567,166 |
| Oklahoma: 1.31% | | | | | |
| GO revenue: 0.18% | | | | | |
| Oklahoma County OK Independent School District #52 Series A | | 3.00 | 1-1-2023 | 3,135,000 | 3,135,000 |
| Health revenue: 0.21% | | | | | |
| Comanche County OK Hospital Authority Refunding | | 5.00 | 7-1-2025 | 600,000 | 602,506 |
| Comanche County OK Hospital Authority Refunding | | 5.00 | 7-1-2027 | 1,800,000 | 1,803,081 |
| Oklahoma Development Finance Authority Oklahoma University Medicine Project Series B | | 5.00 | 8-15-2023 | 500,000 | 496,723 |
| Oklahoma Development Finance Authority Oklahoma University Medicine Project Series B | | 5.00 | 8-15-2024 | 600,000 | 592,122 |
| | | | | | 3,494,432 |
| Miscellaneous revenue: 0.87% | | | | | |
| Kay County OK Public Buildings Authority | | 2.25 | 4-1-2024 | 720,000 | 704,841 |
| Kay County OK Public Buildings Authority | | 2.25 | 4-1-2025 | 735,000 | 702,126 |
| Kay County OK Public Buildings Authority | | 2.38 | 4-1-2026 | 750,000 | 706,432 |
| Kingfisher OK Special Projects Authority Educational Facilities Kingfisher Public Schools Project | | 4.00 | 3-1-2026 | 2,005,000 | 2,065,400 |
| McIntosh County OK Educational Facilities Authority Revenue Bonds Series 2022 | | 2.00 | 9-1-2027 | 415,000 | 387,835 |
| Oklahoma County OK Finance Authority Educational Facilities Jones Public Schools Project | | 4.00 | 9-1-2025 | 550,000 | 563,061 |
| Oklahoma County OK Finance Authority Educational Facilities Jones Public Schools Project | | 4.00 | 9-1-2026 | 590,000 | 606,312 |
| Ottawa County OK Educational Facilities Authority Educational Facilities Lease Miami Public Schools Project | | 5.00 | 9-1-2023 | 830,000 | 838,184 |
| Ottawa County OK Educational Facilities Authority Educational Facilities Lease Miami Public Schools Project | | 5.00 | 9-1-2024 | 1,080,000 | 1,110,788 |
| Ottawa County OK Educational Facilities Authority Educational Facilities Lease Miami Public Schools Project | | 5.00 | 9-1-2025 | 930,000 | 973,645 |
| Tulsa County OK Industrial Authority Educational Broken Arrow Public Schools Project | | 5.00 | 9-1-2025 | 3,000,000 | 3,037,032 |
| Wagoner County OK School Development Authority Wagoner Public Schools Project | | 4.00 | 9-1-2025 | 1,255,000 | 1,285,127 |
| Weatherford OK Industrial Trust Educational Facilities Lease Weatherford Public Schools Project | | 5.00 | 3-1-2027 | 1,475,000 | 1,580,092 |
| | | | | | 14,560,875 |
The accompanying notes are an integral part of these financial statements.
32 | Allspring Short-Term Municipal Bond Fund
Portfolio of investments—December 31, 2022 (unaudited)
| | | Interest
rate | Maturity
date | Principal | Value |
| Tax revenue: 0.05% | | | | | |
| Jackson County OK Facilities Authority Sales Tax Revenue Bonds Series 2022 | | 4.00% | 10-1-2027 | $ 810,000 | $ 837,442 |
| | | | | | 22,027,749 |
| Oregon: 0.19% | | | | | |
| Airport revenue: 0.08% | | | | | |
| Port of Portland International Airport Series C | | 5.00 | 7-1-2026 | 1,240,000 | 1,304,670 |
| GO revenue: 0.05% | | | | | |
| Port of Morrow County Full Faith Refunding Bond Series A | | 4.00 | 6-1-2026 | 345,000 | 355,162 |
| Port of Morrow County Full Faith Refunding Bond Series A | | 4.00 | 6-1-2027 | 535,000 | 553,115 |
| | | | | | 908,277 |
| Health revenue: 0.06% | | | | | |
| Multnomah County OR Hospital Facilities Authority Revenue Refunding Bonds Terwilliger Plaza Parkview | | 0.95 | 6-1-2027 | 1,200,000 | 1,047,180 |
| | | | | | 3,260,127 |
| Pennsylvania: 9.13% | | | | | |
| Airport revenue: 1.26% | | | | | |
| Allegheny County PA Airport Authority Airport Revenue Bonds, Series 2021A | | 5.00 | 1-1-2026 | 1,600,000 | 1,666,671 |
| Allegheny County PA Airport Authority Airport Revenue Bonds, Series 2021A | | 5.00 | 1-1-2027 | 2,000,000 | 2,108,869 |
| Allegheny County PA Airport Authority Airport Revenue Bonds, Series 2021A | | 5.00 | 1-1-2028 | 2,000,000 | 2,126,639 |
| Philadelphia PA Airport Revenue Refunding Bonds Series 2015A | | 5.00 | 6-15-2023 | 1,410,000 | 1,418,441 |
| Philadelphia PA Airport Revenue Refunding Bonds Series 2020A | | 5.00 | 7-1-2026 | 1,160,000 | 1,239,020 |
| Philadelphia PA Airport Revenue Refunding Bonds Series 2020A | | 5.00 | 7-1-2027 | 1,400,000 | 1,517,496 |
| Philadelphia PA Airport Revenue Refunding Bonds Series 2020C | | 5.00 | 7-1-2024 | 10,745,000 | 10,984,171 |
| | | | | | 21,061,307 |
| Education revenue: 1.13% | | | | | |
| Cumberland County PA Authority Association of Independent Colleges & Universities of Pennsylvania Financing Program Series T-1 | | 3.15 | 5-1-2044 | 3,500,000 | 3,480,867 |
| Huntingdon County PA General Authority Juniata College Project Series 2021-TT3 | | 5.00 | 10-1-2027 | 385,000 | 406,718 |
| Huntingdon County PA General Authority Juniata College Project Series 2021-TT3 | | 5.00 | 10-1-2028 | 415,000 | 440,118 |
| Lehigh County PA General Purpose Authority (SIFMA Municipal Swap +0.58%) ± | | 4.24 | 11-1-2037 | 9,540,000 | 9,525,972 |
| Lehigh County PA General Purpose Authority Charter School Revenue Bonds Series 2022 | | 4.00 | 6-1-2026 | 1,005,000 | 1,003,936 |
| Lehigh County PA General Purpose Authority Charter School Revenue Bonds Series 2022 | | 4.00 | 6-1-2028 | 1,090,000 | 1,082,434 |
The accompanying notes are an integral part of these financial statements.
Allspring Short-Term Municipal Bond Fund | 33
Portfolio of investments—December 31, 2022 (unaudited)
| | | Interest
rate | Maturity
date | Principal | Value |
| Education revenue (continued) | | | | | |
| Lehigh County Pennsylvania General Purpose Authority Charter School Lehigh Valley Academy Regional Charter | | 4.00% | 6-1-2025 | $ 965,000 | $ 964,476 |
| Pennsylvania Higher Education Assistance Agency Education Loan Series A | | 5.00 | 6-1-2026 | 1,475,000 | 1,545,332 |
| Pennsylvania Higher Education Assistance Agency Education Loan Series A | | 5.00 | 6-1-2028 | 500,000 | 533,753 |
| | | | | | 18,983,606 |
| GO revenue: 1.43% | | | | | |
| Albert Gallatin School District Series A (AGM Insured) | | 4.00 | 9-1-2025 | 1,130,000 | 1,164,620 |
| Albert Gallatin School District Series B (AGM Insured) | | 4.00 | 9-1-2025 | 350,000 | 360,723 |
| Butler Area School District (AGM Insured) | | 5.00 | 10-1-2023 | 1,280,000 | 1,300,142 |
| Butler Area School District (AGM Insured) | | 5.00 | 10-1-2024 | 2,965,000 | 3,069,145 |
| Butler Area School District (AGM Insured) | | 5.00 | 10-1-2025 | 4,695,000 | 4,960,699 |
| Canon-McMillan School District GO, Series B of 2014 (AGM Insured) | | 4.50 | 12-15-2028 | 2,000,000 | 2,029,665 |
| Coatesville Area School District (AGM Insured) | | 5.00 | 8-1-2023 | 1,000,000 | 1,010,834 |
| Dunmore PA Series A (AGM Insured) | | 2.00 | 9-1-2025 | 220,000 | 210,710 |
| Dunmore PA Series A (AGM Insured) | | 2.00 | 9-1-2027 | 200,000 | 184,686 |
| Dunmore PA Series A (AGM Insured) | | 2.00 | 9-1-2028 | 220,000 | 199,171 |
| Laurel Highlands School District Series A (BAM Insured) | | 4.00 | 2-1-2027 | 1,325,000 | 1,377,687 |
| Oil City Venango County GO Series A of 2021 (AGM Insured) | | 4.00 | 12-1-2026 | 200,000 | 208,625 |
| Oil City Venango County GO Series A of 2021 (AGM Insured) | | 4.00 | 12-1-2027 | 195,000 | 204,734 |
| Oil City Venango County GO Series A of 2021 (AGM Insured) | | 4.00 | 12-1-2028 | 200,000 | 210,440 |
| Peoria PA GO Series 2016B | | 5.00 | 1-1-2023 | 715,000 | 715,000 |
| Philadelphia PA School District Refunding Bond | | 5.00 | 9-1-2023 | 4,500,000 | 4,552,307 |
| Philadelphia PA School District Series A | | 5.00 | 9-1-2024 | 800,000 | 825,294 |
| Scranton PA School District Series A | | 5.00 | 6-1-2023 | 835,000 | 840,713 |
| Scranton PA School District Series B (NPFGC Insured) | | 5.00 | 6-1-2023 | 615,000 | 619,458 |
| | | | | | 24,044,653 |
| Health revenue: 1.63% | | | | | |
| Allegheny County PA Hospital Development Authority Series 2017D-2 (SIFMA Municipal Swap +0.70%) ± | | 4.36 | 11-15-2047 | 6,000,000 | 5,829,767 |
| Berks County PA IDA Health System Tower Health Project | | 5.00 | 11-1-2023 | 1,000,000 | 978,898 |
| Berks County PA IDA Health System Tower Health Project | | 5.00 | 11-1-2024 | 1,000,000 | 957,972 |
| Berks County PA Municipal Authority Revenue Bonds Series 2020A | | 5.00 | 2-1-2023 | 1,300,000 | 1,296,647 |
| Doylestown PA Hospital Authority Hospital Series A | | 5.00 | 7-1-2027 | 2,500,000 | 2,419,015 |
| Geisinger Authority Health System Series B | | 5.00 | 4-1-2043 | 10,000,000 | 10,555,533 |
| Montgomery County PA Higher Education & Health Authority Thomas Jefferson University Series A | | 5.00 | 9-1-2023 | 1,050,000 | 1,061,175 |
| Southcentral Pennsylvania General Authority Wellspan Health Obligation Group | | 5.00 | 6-1-2027 | 2,085,000 | 2,141,744 |
| Westmoreland County PA IDA Excela Health Project Series A | | 5.00 | 7-1-2029 | 1,935,000 | 2,053,765 |
| | | | | | 27,294,516 |
The accompanying notes are an integral part of these financial statements.
34 | Allspring Short-Term Municipal Bond Fund
Portfolio of investments—December 31, 2022 (unaudited)
| | | Interest
rate | Maturity
date | Principal | Value |
| Housing revenue: 1.92% | | | | | |
| Pennsylvania Housing Finance Agency Limited Norris Homes Phase V | | 1.40% | 1-1-2043 | $10,000,000 | $ 10,000,000 |
| Pennsylvania Housing Finance Agency MFHR Sherman Hills (Department of Housing and Urban Development Insured) øø | | 1.25 | 2-1-2025 | 7,000,000 | 6,804,694 |
| Pennsylvania Housing Finance Agency Single Family Mortgage AMT Series 128A | | 4.75 | 4-1-2033 | 4,575,000 | 4,610,468 |
| Pennsylvania Housing Finance Agency Single Family Series 125A | | 2.38 | 10-1-2025 | 10,250,000 | 9,959,069 |
| Pennsylvania Housing Finance Agency Single Family Series 137 | | 5.00 | 10-1-2024 | 265,000 | 273,851 |
| Pennsylvania Housing Finance Agency Single Family Series 137 | | 5.00 | 10-1-2025 | 220,000 | 231,380 |
| Pennsylvania Housing Finance Agency Single Family Series 137 | | 5.00 | 4-1-2026 | 240,000 | 253,937 |
| | | | | | 32,133,399 |
| Miscellaneous revenue: 0.72% | | | | | |
| Pennsylvania EDFA Revenue Bonds Series 2015 | | 5.00 | 6-30-2024 | 4,500,000 | 4,568,569 |
| Pennsylvania EDFA Sewage Sludge Disposal Series 2020 | | 3.00 | 1-1-2025 | 505,000 | 498,052 |
| Pennsylvania EDFA Sewage Sludge Disposal Series 2020 | | 4.00 | 1-1-2026 | 615,000 | 620,175 |
| Pittsburgh & Allegheny Counties Sports & Exhibition Authority Series 2020 (AGM Insured) | | 4.00 | 2-1-2024 | 1,700,000 | 1,716,467 |
| Pittsburgh & Allegheny Counties Sports & Exhibition Authority Series 2020 (AGM Insured) | | 5.00 | 2-1-2026 | 2,000,000 | 2,110,549 |
| State Public School Building Authority Prerefunded Bond Series A (AGM Insured) | | 5.00 | 12-1-2023 | 375,000 | 381,859 |
| State Public School Building Authority Prerefunded Bond Series A (AGM Insured) | | 5.00 | 12-1-2023 | 2,130,000 | 2,165,501 |
| | | | | | 12,061,172 |
| Resource recovery revenue: 0.60% | | | | | |
| Pennsylvania EDFA Solid Waste Disposal Republic Services Incorporated Project Series 2014A | | 3.60 | 6-1-2044 | 10,000,000 | 10,000,000 |
| Tax revenue: 0.09% | | | | | |
| Allentown PA Neighborhood Improvement Zone Development Authority Tax Revenue Refunding Bonds Series 2022 | | 5.00 | 5-1-2026 | 500,000 | 518,357 |
| Allentown PA Neighborhood Improvement Zone Development Authority Tax Revenue Refunding Bonds Series 2022 | | 5.00 | 5-1-2027 | 500,000 | 521,300 |
| Allentown PA Neighborhood Improvement Zone Development Authority Tax Revenue Refunding Bonds Series 2022 | | 5.00 | 5-1-2028 | 500,000 | 522,674 |
| | | | | | 1,562,331 |
| Transportation revenue: 0.28% | | | | | |
| Lancaster PA Parking Authority Series A (BAM Insured) | | 4.00 | 9-1-2025 | 530,000 | 545,140 |
| Lancaster PA Parking Authority Series A (BAM Insured) | | 4.00 | 9-1-2026 | 545,000 | 566,781 |
| Pennsylvania Turnpike Commission Series B (SIFMA Municipal Swap +0.70%) ± | | 4.36 | 12-1-2023 | 2,880,000 | 2,880,185 |
| Pennsylvania Turnpike Commission Series B 2020 | | 5.00 | 12-1-2025 | 300,000 | 319,549 |
| Pennsylvania Turnpike Commission Series B 2020 | | 5.00 | 12-1-2026 | 350,000 | 379,586 |
| | | | | | 4,691,241 |
The accompanying notes are an integral part of these financial statements.
Allspring Short-Term Municipal Bond Fund | 35
Portfolio of investments—December 31, 2022 (unaudited)
| | | Interest
rate | Maturity
date | Principal | Value |
| Water & sewer revenue: 0.07% | | | | | |
| Allegheny County Sanitary Authority Sewer Revenue Series A 2020 | | 5.00% | 6-1-2026 | $ 850,000 | $ 914,305 |
| Allegheny County Sanitary Authority Sewer Revenue Series A 2020 | | 5.00 | 6-1-2027 | 300,000 | 328,767 |
| | | | | | 1,243,072 |
| | | | | | 153,075,297 |
| Rhode Island: 0.07% | | | | | |
| Education revenue: 0.07% | | | | | |
| Rhode Island Student Loan Authority AMT Series A | | 5.00 | 12-1-2023 | 1,175,000 | 1,189,939 |
| South Carolina: 0.34% | | | | | |
| Utilities revenue: 0.34% | | | | | |
| Piedmont SC Municipal Power Agency (NPFGC Insured) | | 5.38 | 1-1-2025 | 4,580,000 | 4,778,274 |
| South Carolina Public Service Authority Series C | | 5.00 | 12-1-2026 | 400,000 | 425,705 |
| South Carolina Public Service Authority Series C | | 5.00 | 12-1-2027 | 420,000 | 451,861 |
| | | | | | 5,655,840 |
| Tennessee: 3.84% | | | | | |
| Airport revenue: 0.28% | | | | | |
| Metropolitan Nashville Airport Authority Tennessee Airport AMT Improvement Series B | | 5.00 | 7-1-2027 | 675,000 | 716,477 |
| Metropolitan Nashville Airport Authority Tennessee Airport AMT Improvement Series B | | 5.00 | 7-1-2028 | 1,000,000 | 1,068,978 |
| Metropolitan Nashville Airport Authority Tennessee Airport AMT Improvement Series B | | 5.00 | 7-1-2029 | 2,675,000 | 2,872,472 |
| | | | | | 4,657,927 |
| Health revenue: 0.51% | | | | | |
| Greeneville TN Health and Educational Ballad Health Series A | | 5.00 | 7-1-2023 | 1,600,000 | 1,613,359 |
| Knox County TN Health Educational & Housing Facility University Health System Incorporate | | 5.00 | 4-1-2024 | 1,000,000 | 1,019,394 |
| Tender Option Bond Trust Receipts/Certificate Series 2015-XF1023 (Barclays Bank plc LOC, Barclays Bank plc LIQ) 144A | | 3.70 | 1-1-2045 | 5,910,000 | 5,910,000 |
| | | | | | 8,542,753 |
| Housing revenue: 0.47% | | | | | |
| Metropolitan Government Nashville & Davidson County TN Health & Educational Facilities Board Richland Hills Apartments Project (Department of Housing and Urban Development Insured) | | 1.25 | 12-1-2024 | 8,000,000 | 7,843,072 |
| Utilities revenue: 2.58% | | | | | |
| Memphis TN Light, Gas & Water Division Series 2020A | | 5.00 | 12-1-2025 | 600,000 | 639,966 |
| Memphis TN Light, Gas & Water Division Series 2020A | | 5.00 | 12-1-2026 | 600,000 | 652,811 |
| Memphis TN Light, Gas & Water Division Series 2020A | | 5.00 | 12-1-2027 | 450,000 | 498,535 |
| Tennergy Corporation Gas Revenue Series A | | 5.50 | 12-1-2028 | 1,000,000 | 1,060,078 |
| Tennergy Corporation Gas Revenue Series A | | 5.50 | 12-1-2029 | 2,000,000 | 2,128,133 |
The accompanying notes are an integral part of these financial statements.
36 | Allspring Short-Term Municipal Bond Fund
Portfolio of investments—December 31, 2022 (unaudited)
| | | Interest
rate | Maturity
date | Principal | Value |
| Utilities revenue (continued) | | | | | |
| Tennessee Energy Acquisition Corporation Gas Project | | 4.00% | 11-1-2049 | $ 7,500,000 | $ 7,444,966 |
| Tennessee Energy Acquisition Corporation Gas Project Series 2017A | | 4.00 | 5-1-2048 | 30,840,000 | 30,889,893 |
| | | | | | 43,314,382 |
| | | | | | 64,358,134 |
| Texas: 9.81% | | | | | |
| Airport revenue: 1.15% | | | | | |
| Austin TX Airport System Revenue Refunding Bonds Series 2019 | | 5.00 | 11-15-2025 | 1,500,000 | 1,565,778 |
| Dallas-Fort Worth TX International Airport Joint Revenue Refunding Bonds Series 2021B | | 5.00 | 11-1-2026 | 2,850,000 | 3,080,660 |
| Dallas-Fort Worth TX International Airport Series A | | 5.00 | 11-1-2025 | 1,000,000 | 1,061,778 |
| El Paso TX Airport Series 2018 | | 5.00 | 8-15-2025 | 3,110,000 | 3,223,282 |
| Houston TX Airport System Refunding Bond Subordinated Lien Bond Series 2020A | | 5.00 | 7-1-2026 | 1,000,000 | 1,052,153 |
| Houston TX Airport System Refunding Bond Subordinated Lien Bond Series 2020A | | 5.00 | 7-1-2027 | 1,000,000 | 1,061,447 |
| Houston TX Airport System Refunding Bond Subordinated Lien Bond Series 2020B | | 5.00 | 7-1-2026 | 1,500,000 | 1,613,023 |
| Houston TX Airport System Refunding Bond Subordinated Lien Bond Series 2020B | | 5.00 | 7-1-2027 | 3,000,000 | 3,280,813 |
| Love Field Airport Modernization Corporation Texas General Airport Revenue Refunding Bonds Series 2021 | | 5.00 | 11-1-2026 | 3,250,000 | 3,410,474 |
| | | | | | 19,349,408 |
| Education revenue: 0.42% | | | | | |
| Arlington TX Higher Education Finance Corporation Education Revenue Bonds Series 2021A | | 4.00 | 2-15-2027 | 350,000 | 360,029 |
| Arlington TX Higher Education Finance Corporation Education Revenue Bonds Series 2021A | | 4.00 | 2-15-2028 | 290,000 | 299,304 |
| Clifton TX Higher Education Finance Corporation Education International Leadership Series D | | 5.00 | 8-15-2023 | 1,510,000 | 1,514,084 |
| Clifton TX Higher Education Finance Corporation Education International Leadership Series D | | 5.00 | 8-15-2024 | 3,125,000 | 3,139,731 |
| Clifton TX Higher Education Revenue Bonds Series 2021T | | 5.00 | 8-15-2025 | 360,000 | 373,843 |
| Clifton TX Higher Education Revenue Bonds Series 2021T | | 5.00 | 8-15-2027 | 500,000 | 531,240 |
| Clifton TX Higher Education Revenue Bonds Series 2021T | | 5.00 | 8-15-2028 | 300,000 | 321,881 |
| Odessa TX College District Consolidated Fund Revenue Bonds Series 2021 (AGM Insured) | | 4.00 | 7-1-2028 | 400,000 | 422,456 |
| | | | | | 6,962,568 |
| GO revenue: 2.88% | | | | | |
| Andrews County Texas Hospital District Refunding Bond | | 5.00 | 3-15-2027 | 1,750,000 | 1,868,649 |
| Denton TX Independent School District Bonds Series 2014-B | | 2.00 | 8-1-2044 | 550,000 | 543,913 |
| Denton TX Independent School District Bonds Series 2014-B | | 2.00 | 8-1-2044 | 3,520,000 | 3,431,735 |
| Eanes TX Independent School District School Building Series B | | 1.75 | 8-1-2039 | 7,465,000 | 7,246,109 |
The accompanying notes are an integral part of these financial statements.
Allspring Short-Term Municipal Bond Fund | 37
Portfolio of investments—December 31, 2022 (unaudited)
| | | Interest
rate | Maturity
date | Principal | Value |
| GO revenue (continued) | | | | | |
| Fort Bend TX Independent School District Various Refunding Series B øø | | 0.72% | 8-1-2051 | $ 1,290,000 | $ 1,147,016 |
| Hays Consolidated Independent School District Texas School Building Bonds Series 2018B | | 2.70 | 8-15-2042 | 4,395,000 | 4,389,006 |
| Leander TX Independent School District Refunding CAB ¤ | | 0.00 | 8-15-2023 | 1,065,000 | 1,044,443 |
| McAllen TX Independent School District Series A | | 5.00 | 2-15-2024 | 2,620,000 | 2,625,867 |
| North East Independent School District Texas Series 2019 | | 2.20 | 8-1-2049 | 4,800,000 | 4,716,516 |
| Northside Texas Independent School District School Building Bond | | 2.75 | 8-1-2048 | 20,305,000 | 20,171,970 |
| Port Arthur TX Jefferson and Orange Counties Combination Tax and Revenue Certificates of Obligation Series 2021 (BAM Insured) | | 5.00 | 2-15-2028 | 365,000 | 400,030 |
| Port Arthur TX Jefferson and Orange Counties Series 2021 (BAM Insured) | | 5.00 | 2-15-2026 | 290,000 | 308,436 |
| Port Arthur TX Jefferson and Orange Counties Series 2021 (BAM Insured) | | 5.00 | 2-15-2027 | 310,000 | 334,979 |
| | | | | | 48,228,669 |
| Health revenue: 0.90% | | | | | |
| Harris County TX Cultural Education Facilities Finance Corporation Hospital Memorial Hermann Health System (SIFMA Municipal Swap +0.57%) ± | | 4.23 | 12-1-2049 | 11,000,000 | 10,927,235 |
| Tarrant County Cultural Education Facilities Finance Corporation Hospital Baylor Scott & White Health | | 5.00 | 11-15-2052 | 4,000,000 | 4,223,142 |
| | | | | | 15,150,377 |
| Housing revenue: 1.13% | | | | | |
| Dallas TX Housing Finance Corporation MFHR Estates at Shiloh | | 1.25 | 7-1-2037 | 7,000,000 | 6,921,842 |
| Housing Synergy Public Facility Corporation Tax Revenue Bonds Series 2022 (Department of Housing and Urban Development Insured) | | 3.50 | 8-1-2025 | 4,000,000 | 3,991,298 |
| Odessa TX Housing Finance Corporation MFHR Vera Odessa Apartments (FHA Insured) øø | | 0.35 | 9-1-2023 | 6,000,000 | 5,960,062 |
| Travis County TX Housing Finance Corporation MFHR Airway Gateway Apartments | | 4.13 | 6-1-2045 | 2,000,000 | 2,013,363 |
| | | | | | 18,886,565 |
| Industrial development revenue: 0.10% | | | | | |
| Port of Beaumont Navigation District Jefferson County Dock and Wharf Facility Revenue Bonds Series 2021A 144A | | 1.88 | 1-1-2026 | 800,000 | 724,695 |
| Port of Beaumont Navigation District Jefferson County Dock and Wharf Facility Revenue Bonds Series 2021A 144A | | 2.00 | 1-1-2027 | 525,000 | 460,458 |
| Port of Beaumont Navigation District Jefferson County Dock and Wharf Facility Revenue Bonds Series 2021A 144A | | 2.13 | 1-1-2028 | 575,000 | 488,574 |
| | | | | | 1,673,727 |
| Resource recovery revenue: 0.60% | | | | | |
| Port Corpus Christi Solid Waste Disposal Revenue Bonds Series 2002A 144Aø | | 3.90 | 7-1-2029 | 10,000,000 | 10,000,000 |
The accompanying notes are an integral part of these financial statements.
38 | Allspring Short-Term Municipal Bond Fund
Portfolio of investments—December 31, 2022 (unaudited)
| | | Interest
rate | Maturity
date | Principal | Value |
| Tax revenue: 0.29% | | | | | |
| Baytown TX Municipal Development District Combination Limited Sales Tax Revenue and Third-Lien Hotel Revenue Bonds Series 2021C | | 5.00% | 10-1-2025 | $ 480,000 | $ 501,606 |
| Baytown TX Municipal Development District Combination Limited Sales Tax Revenue and Third-Lien Hotel Revenue Bonds Series 2021C | | 5.00 | 10-1-2026 | 510,000 | 539,252 |
| Baytown TX Municipal Development District Combination Limited Sales Tax Revenue and Third-Lien Hotel Revenue Bonds Series 2021C | | 5.00 | 10-1-2027 | 845,000 | 901,378 |
| Old Spanish Trail Almeda Corridors RDA Texas Refunding Bond Tax Increment Contract | | 5.00 | 9-1-2025 | 2,805,000 | 2,945,421 |
| | | | | | 4,887,657 |
| Utilities revenue: 1.60% | | | | | |
| Lower Colorado River Authority Refunding Bond | | 5.00 | 5-15-2027 | 2,000,000 | 2,162,531 |
| Lower Colorado River Authority Series 2022 (AGM Insured) | | 5.00 | 5-15-2027 | 1,385,000 | 1,508,797 |
| Lower Colorado River Authority Series 2022 (AGM Insured) | | 5.00 | 5-15-2028 | 2,285,000 | 2,527,227 |
| San Antonio TX Electric & Gas Systems Various Revenue Refunding Bonds Junior Lien Series 2020 | | 1.75 | 2-1-2049 | 11,500,000 | 10,927,736 |
| Texas Municipal Gas Acquisition & Supply Corporation Series A (SIFMA Municipal Swap +0.55%) ± | | 4.21 | 9-15-2027 | 7,465,000 | 7,235,726 |
| Texas Municipal Power Agency Transmission System Series 2021 (AGM Insured) | | 3.00 | 9-1-2026 | 950,000 | 941,137 |
| Texas Municipal Power Agency Transmission System Series 2021 (AGM Insured) | | 3.00 | 9-1-2027 | 1,600,000 | 1,586,070 |
| | | | | | 26,889,224 |
| Water & sewer revenue: 0.74% | | | | | |
| San Antonio TX Water System Junior Lien Series A | | 2.63 | 5-1-2049 | 12,490,000 | 12,431,954 |
| | | | | | 164,460,149 |
| Utah: 0.55% | | | | | |
| Airport revenue: 0.53% | | | | | |
| Salt Lake City UT International Airport Airport Revenue Bonds Series 2021A | | 5.00 | 7-1-2025 | 1,300,000 | 1,349,083 |
| Salt Lake City UT International Airport Series A | | 5.00 | 7-1-2023 | 3,150,000 | 3,172,921 |
| Salt Lake City UT International Airport Series A | | 5.00 | 7-1-2024 | 2,000,000 | 2,048,328 |
| Salt Lake City UT International Airport Series A | | 5.00 | 7-1-2025 | 2,300,000 | 2,386,839 |
| | | | | | 8,957,171 |
| Miscellaneous revenue: 0.02% | | | | | |
| Utah Infrastructure Agency Telecommunications Bond | | 3.00 | 10-15-2026 | 310,000 | 295,805 |
| | | | | | 9,252,976 |
| Vermont: 0.03% | | | | | |
| Education revenue: 0.03% | | | | | |
| Vermont Educational & Health Buildings Financing Agency Saint Michael's College Project | | 5.00 | 10-1-2026 | 575,000 | 575,226 |
The accompanying notes are an integral part of these financial statements.
Allspring Short-Term Municipal Bond Fund | 39
Portfolio of investments—December 31, 2022 (unaudited)
| | | Interest
rate | Maturity
date | Principal | Value |
| Virginia: 1.58% | | | | | |
| Education revenue: 0.05% | | | | | |
| Virginia College Building Authority Educational Facilities Regent University Project Series 2021 | | 5.00% | 6-1-2026 | $ 300,000 | $ 307,895 |
| Virginia College Building Authority Educational Facilities Regent University Project Series 2021 | | 5.00 | 6-1-2027 | 275,000 | 283,438 |
| Virginia College Building Authority Educational Facilities Regent University Project Series 2021 | | 5.00 | 6-1-2028 | 300,000 | 310,261 |
| | | | | | 901,594 |
| Tax revenue: 0.09% | | | | | |
| Marquis VA CDA CAB Series A | | 5.10 | 9-1-2036 | 2,169,000 | 967,411 |
| Marquis VA CDA CAB Series C ¤ | | 0.00 | 9-1-2041 | 3,493,000 | 166,876 |
| Marquis VA CDA CCAB Series 2015 144Aøø | | 0.00 | 9-1-2045 | 680,000 | 303,258 |
| | | | | | 1,437,545 |
| Transportation revenue: 0.94% | | | | | |
| Chesapeake VA Bay Bridge & Tunnel District First Tier Generation Resolution | | 5.00 | 11-1-2023 | 14,115,000 | 14,243,953 |
| Virginia Commonwealth Transportation Board Refunding Bond Series A | | 5.00 | 5-15-2023 | 1,500,000 | 1,511,158 |
| | | | | | 15,755,111 |
| Utilities revenue: 0.50% | | | | | |
| York County EDA PCR Virginia Electric & Power Company Project Series A | | 1.90 | 5-1-2033 | 8,500,000 | 8,404,807 |
| | | | | | 26,499,057 |
| Washington: 2.71% | | | | | |
| GO revenue: 0.16% | | | | | |
| Washington Refunding Bond | | 5.00 | 6-1-2025 | 1,000,000 | 1,055,832 |
| Washington Refunding Bond | | 5.00 | 6-1-2026 | 1,570,000 | 1,691,965 |
| | | | | | 2,747,797 |
| Health revenue: 0.70% | | | | | |
| Washington HCFR Authority CommonSpirit Health Series 2019B-3 | | 5.00 | 8-1-2049 | 4,000,000 | 4,176,857 |
| Washington Health Care Facilities Authority Commonspirit Health Series 2019B-2 | | 5.00 | 8-1-2049 | 2,430,000 | 2,501,937 |
| Washington Health Care Facilities Authority Commonspirit Health Series B1 | | 5.00 | 8-1-2049 | 2,500,000 | 2,534,791 |
| Washington Health Care Facilities Authority Seattle Cancer Care Alliance 144A | | 5.00 | 12-1-2025 | 275,000 | 288,978 |
| Washington Health Care Facilities Authority Seattle Cancer Care Alliance 144A | | 5.00 | 12-1-2026 | 285,000 | 303,099 |
| Washington Housing Finance Commission Nonprofit Housing Revenue Eliseo Project Series B-2 144A | | 2.13 | 7-1-2027 | 1,250,000 | 1,120,146 |
| Washington Housing Finance Commission Nonprofit Housing Revenue Rockwood Retirement Communities 144A | | 3.00 | 7-1-2027 | 1,000,000 | 875,123 |
| | | | | | 11,800,931 |
The accompanying notes are an integral part of these financial statements.
40 | Allspring Short-Term Municipal Bond Fund
Portfolio of investments—December 31, 2022 (unaudited)
| | | Interest
rate | Maturity
date | Principal | Value |
| Housing revenue: 0.10% | | | | | |
| Housing Authority of the County of King Workforce Housing Preservation Pooled Refunding Revenue Bonds 2021 | | 4.00% | 10-1-2027 | $ 300,000 | $ 312,200 |
| Snohomish County WA Housing Authority Carvel Apartments Project | | 5.00 | 4-1-2025 | 500,000 | 520,344 |
| Snohomish County WA Housing Authority Carvel Apartments Project | | 5.00 | 4-1-2026 | 730,000 | 772,392 |
| | | | | | 1,604,936 |
| Miscellaneous revenue: 0.07% | | | | | |
| FYI Properties Refunding Bond State of Washington District Project | | 5.00 | 6-1-2027 | 1,000,000 | 1,089,803 |
| Tax revenue: 0.13% | | | | | |
| Central Puget Sound Washington Regional Transit Authority Sales & Use Tax Refunding & Improvement Green Bonds Series S-1 | | 5.00 | 11-1-2036 | 2,110,000 | 2,246,869 |
| Utilities revenue: 1.55% | | | | | |
| Seattle WA Municipal Light & Power Refunding Bond Series B (SIFMA Municipal Swap +0.25%) ± | | 3.91 | 5-1-2045 | 2,750,000 | 2,696,468 |
| Seattle WA Municipal Light & Power Refunding Bond Series C-1 (SIFMA Municipal Swap +0.49%) ± | | 4.15 | 11-1-2046 | 23,190,000 | 23,201,660 |
| | | | | | 25,898,128 |
| | | | | | 45,388,464 |
| West Virginia: 0.12% | | | | | |
| GO revenue: 0.12% | | | | | |
| Berkeley County WV Board of Education Public School Series 2020 | | 2.00 | 5-1-2023 | 1,000,000 | 995,092 |
| Berkeley County WV Board of Education Public School Series 2020 | | 2.00 | 5-1-2024 | 1,000,000 | 980,755 |
| | | | | | 1,975,847 |
| Wisconsin: 3.79% | | | | | |
| Health revenue: 2.89% | | | | | |
| Entrance Fee Principal PFA Searstone Project Series B-2 144A | | 2.25 | 6-1-2027 | 1,845,000 | 1,647,114 |
| Wisconsin HEFA Advocate Aurora Health Credit Group Series B-3 | | 5.00 | 8-15-2054 | 2,000,000 | 2,038,649 |
| Wisconsin HEFA Advocate Aurora Health Credit Group Series B-4 | | 5.00 | 8-15-2054 | 1,450,000 | 1,501,024 |
| Wisconsin HEFA Advocate Aurora Health Credit Group Series C-4 (SIFMA Municipal Swap +0.65%) ± | | 4.31 | 8-15-2054 | 4,200,000 | 4,201,235 |
| Wisconsin HEFA Ascension Health Alliance | | 5.00 | 11-15-2033 | 11,180,000 | 11,570,362 |
| Wisconsin HEFA Beloit Health System Incorporated | | 5.00 | 7-1-2025 | 1,000,000 | 1,037,271 |
| Wisconsin HEFA Beloit Health System Incorporated | | 5.00 | 7-1-2026 | 1,060,000 | 1,115,282 |
| Wisconsin HEFA Marshfield Clinic Health System Incorporated | | 5.00 | 2-15-2052 | 3,000,000 | 3,063,966 |
| Wisconsin HEFA Marshfield Clinic Health System Incorporated Series B2 | | 5.00 | 2-15-2051 | 18,300,000 | 19,119,928 |
| Wisconsin HEFA Saint John's Communities Incorporated Series 2022 | | 4.00 | 9-15-2026 | 795,000 | 779,966 |
The accompanying notes are an integral part of these financial statements.
Allspring Short-Term Municipal Bond Fund | 41
Portfolio of investments—December 31, 2022 (unaudited)
| | | Interest
rate | Maturity
date | Principal | Value |
| Health revenue (continued) | | | | | |
| Wisconsin HEFA Saint John's Communities Incorporated Series 2022 | | 4.00% | 9-15-2028 | $ 860,000 | $ 827,670 |
| Wisconsin HEFA Saint John's Communities Incorporated Series B | | 4.00 | 9-15-2027 | 140,000 | 135,847 |
| Wisconsin HEFA Saint John's Communities Incorporated Series B | | 4.00 | 9-15-2028 | 195,000 | 187,199 |
| Wisconsin HEFA St. Camillus Health System Incorporated | | 5.00 | 11-1-2024 | 155,000 | 153,396 |
| Wisconsin HEFA St. Camillus Health System Incorporated | | 5.00 | 11-1-2025 | 245,000 | 240,876 |
| Wisconsin HEFA St. Camillus Health System Incorporated | | 5.00 | 11-1-2026 | 355,000 | 346,538 |
| Wisconsin Revenue Bonds PFA Series 2021A | | 5.00 | 6-1-2027 | 200,000 | 211,407 |
| Wisconsin Revenue Bonds PFA Series 2021A | | 5.00 | 6-1-2028 | 225,000 | 239,847 |
| | | | | | 48,417,577 |
| Miscellaneous revenue: 0.63% | | | | | |
| PMA Levy and Aid Anticipation Notes Program Wisconsin Note Participation Series A | | 4.00 | 9-27-2023 | 3,000,000 | 3,015,515 |
| PMA Levy and Aid Anticipation Notes Program Wisconsin Note Participation Series B | | 4.00 | 9-27-2023 | 3,500,000 | 3,518,100 |
| Wisconsin Refunding Bond Series A | | 5.00 | 5-1-2023 | 4,015,000 | 4,041,935 |
| | | | | | 10,575,550 |
| Utilities revenue: 0.18% | | | | | |
| PFA PCR Duke Energy Progress Project Series 2022A | | 3.30 | 10-1-2046 | 3,000,000 | 3,005,717 |
| Water & sewer revenue: 0.09% | | | | | |
| Clayton WI Water System and Sewer System Series C | | 2.00 | 6-1-2026 | 1,600,000 | 1,502,532 |
| | | | | | 63,501,376 |
| Total Municipal obligations (Cost $1,721,143,754) | | | | | 1,667,609,960 |
| | | Yield | | Shares | |
| Short-term investments: 0.14% | | | | | |
| Investment companies: 0.14% | | | | | |
| Allspring Municipal Cash Management Money Market Fund Institutional Class ♠∞## | | 3.56 | | 2,320,578 | 2,321,042 |
| Total Short-term investments (Cost $2,321,042) | | | | | 2,321,042 |
| Total investments in securities (Cost $1,723,464,796) | 99.59% | | | | 1,669,931,002 |
| Other assets and liabilities, net | 0.41 | | | | 6,836,134 |
| Total net assets | 100.00% | | | | $1,676,767,136 |
| 144A | The security may be resold in transactions exempt from registration, normally to qualified institutional buyers, pursuant to Rule 144A under the Securities Act of 1933. |
| ø | Variable rate demand notes are subject to a demand feature which reduces the effective maturity. The maturity date shown represents the final maturity date of the security. The interest rate is determined and reset by the issuer daily, weekly, or monthly depending upon the terms of the security. The rate shown is the rate in effect at period end. |
| ± | Variable rate investment. The rate shown is the rate in effect at period end. |
| ¤ | The security is issued in zero coupon form with no periodic interest payments. |
| øø | The interest rate is determined and reset by the issuer periodically depending upon the terms of the security. The rate shown is the rate in effect at period end. |
| ## | All or a portion of this security is segregated for when-issued securities. |
| ♠ | The issuer of the security is an affiliated person of the Fund as defined in the Investment Company Act of 1940. |
| ∞ | The rate represents the 7-day annualized yield at period end. |
| %% | The security is purchased on a when-issued basis. |
The accompanying notes are an integral part of these financial statements.
42 | Allspring Short-Term Municipal Bond Fund
Portfolio of investments—December 31, 2022 (unaudited)
| Abbreviations: |
| AGM | Assured Guaranty Municipal |
| AMT | Alternative minimum tax |
| BAM | Build America Mutual Assurance Company |
| BAN | Bond anticipation notes |
| CAB | Capital appreciation bond |
| CCAB | Convertible capital appreciation bond |
| CDA | Community Development Authority |
| EDA | Economic Development Authority |
| EDFA | Economic Development Finance Authority |
| FHA | Federal Housing Administration |
| FHLMC | Federal Home Loan Mortgage Corporation |
| FNMA | Federal National Mortgage Association |
| GNMA | Government National Mortgage Association |
| GO | General obligation |
| HCFR | Healthcare facilities revenue |
| HEFA | Health & Educational Facilities Authority |
| HEFAR | Higher Education Facilities Authority Revenue |
| HFA | Housing Finance Authority |
| IDA | Industrial Development Authority |
| LIBOR | London Interbank Offered Rate |
| LIQ | Liquidity agreement |
| LOC | Letter of credit |
| MFHR | Multifamily housing revenue |
| NPFGC | National Public Finance Guarantee Corporation |
| PCFA | Pollution Control Financing Authority |
| PCR | Pollution control revenue |
| PFA | Public Finance Authority |
| RDA | Redevelopment Authority |
| SIFMA | Securities Industry and Financial Markets Association |
| SOFR | Secured Overnight Financing Rate |
| SPA | Standby purchase agreement |
Investments in affiliates
An affiliated investment is an investment in which the Fund owns at least 5% of the outstanding voting shares of the issuer or as a result of other relationships, such as the Fund and the issuer having the same investment manager. Transactions with issuers that were affiliates of the Fund at the end of the period were as follows:
| | Value,
beginning of
period | Purchases | Sales
proceeds | Net
realized
gains
(losses) | Net
change in
unrealized
gains
(losses) | Value,
end of
period | Shares,
end
of period | Income
from
affiliated
securities |
| Short-term investments | | | | | | | |
| Allspring Municipal Cash Management Money Market Fund Institutional Class | $4,264,311 | $373,396,380 | $(375,331,846) | $(7,704) | $(99) | $2,321,042 | 2,320,578 | $173,410 |
The accompanying notes are an integral part of these financial statements.
Allspring Short-Term Municipal Bond Fund | 43
Statement of assets and liabilities—December 31, 2022 (unaudited)
| | |
| Assets | |
Investments in unaffiliated securities, at value (cost $1,721,143,754)
| $ 1,667,609,960 |
Investments in affiliated securities, at value (cost $2,321,042)
| 2,321,042 |
Cash
| 30,961 |
Receivable for interest
| 16,722,425 |
Receivable for Fund shares sold
| 3,827,200 |
Receivable for investments sold
| 2,285,182 |
Total assets
| 1,692,796,770 |
| Liabilities | |
Payable for Fund shares redeemed
| 10,613,701 |
Payable for investments purchased
| 3,682,128 |
Dividends payable
| 550,105 |
Management fee payable
| 441,066 |
Administration fees payable
| 148,967 |
Distribution fee payable
| 3,402 |
Trustees’ fees and expenses payable
| 991 |
Accrued expenses and other liabilities
| 589,274 |
Total liabilities
| 16,029,634 |
Total net assets
| $1,676,767,136 |
| Net assets consist of | |
Paid-in capital
| $ 1,790,740,835 |
Total distributable loss
| (113,973,699) |
Total net assets
| $1,676,767,136 |
| Computation of net asset value and offering price per share | |
Net assets – Class A
| $ 438,622,030 |
Shares outstanding – Class A1
| 46,248,403 |
Net asset value per share – Class A
| $9.48 |
Maximum offering price per share – Class A2
| $9.67 |
Net assets – Class C
| $ 5,450,346 |
Shares outstanding – Class C1
| 574,690 |
Net asset value per share – Class C
| $9.48 |
Net assets – Class R6
| $ 206,232,819 |
Shares outstanding – Class R61
| 21,703,823 |
Net asset value per share – Class R6
| $9.50 |
Net assets – Administrator Class
| $ 5,678,571 |
Shares outstanding – Administrator Class1
| 598,849 |
Net asset value per share – Administrator Class
| $9.48 |
Net assets – Institutional Class
| $ 1,020,783,370 |
Shares outstanding – Institutional Class1
| 107,433,549 |
Net asset value per share – Institutional Class
| $9.50 |
| 1 | The Fund has an unlimited number of authorized shares. |
| 2 | Maximum offering price is computed as 100/98.00 of net asset value. On investments of $100,000 or more, the offering price is reduced. |
The accompanying notes are an integral part of these financial statements.
44 | Allspring Short-Term Municipal Bond Fund
Statement of operations—six months ended December 31, 2022 (unaudited)
| | |
| Investment income | |
Interest
| $ 20,941,141 |
Income from affiliated securities
| 173,410 |
Total investment income
| 21,114,551 |
| Expenses | |
Management fee
| 3,268,209 |
| Administration fees | |
Class A
| 397,166 |
Class C
| 3,848 |
Class R6
| 40,861 |
Administrator Class
| 2,799 |
Institutional Class
| 461,413 |
| Shareholder servicing fees | |
Class A
| 618,709 |
Class C
| 6,006 |
Administrator Class
| 6,895 |
| Distribution fee | |
Class C
| 18,019 |
Custody and accounting fees
| 17,849 |
Professional fees
| 37,452 |
Registration fees
| 39,974 |
Shareholder report expenses
| 206 |
Trustees’ fees and expenses
| 11,159 |
Other fees and expenses
| 11,379 |
Total expenses
| 4,941,944 |
| Less: Fee waivers and/or expense reimbursements | |
Fund-level
| (301,161) |
Class A
| (243,558) |
Class C
| (2,360) |
Administrator Class
| (1,923) |
Net expenses
| 4,392,942 |
Net investment income
| 16,721,609 |
| Realized and unrealized gains (losses) on investments | |
| Net realized losses on | |
Unaffiliated securities
| (487,058) |
Affiliated securities
| (7,704) |
Net realized losses on investments
| (494,762) |
| Net change in unrealized gains (losses) on | |
Unaffiliated securities
| (11,540,330) |
Affiliated securities
| (99) |
Net change in unrealized gains (losses) on investments
| (11,540,429) |
Net realized and unrealized gains (losses) on investments
| (12,035,191) |
Net increase in net assets resulting from operations
| $ 4,686,418 |
The accompanying notes are an integral part of these financial statements.
Allspring Short-Term Municipal Bond Fund | 45
Statement of changes in net assets
| | | | | |
| | Six months ended
December 31, 2022
(unaudited) | Year ended
June 30, 2022 |
| Operations | | | | |
Net investment income
| | $ 16,721,609 | | $ 29,640,200 |
Net realized losses on investments
| | (494,762) | | (6,806,537) |
Net change in unrealized gains (losses) on investments
| | (11,540,429) | | (94,969,202) |
Net increase (decrease) in net assets resulting from operations
| | 4,686,418 | | (72,135,539) |
| Distributions to shareholders from | | | | |
| Net investment income and net realized gains | | | | |
Class A
| | (3,874,698) | | (6,448,479) |
Class C
| | (19,564) | | (16,609) |
Class R6
| | (2,482,775) | | (5,926,588) |
Administrator Class
| | (44,453) | | (101,255) |
Institutional Class
| | (10,337,103) | | (17,109,887) |
Total distributions to shareholders
| | (16,758,593) | | (29,602,818) |
| Capital share transactions | Shares | | Shares | |
| Proceeds from shares sold | | | | |
Class A
| 2,624,572 | 24,931,107 | 5,411,821 | 53,085,084 |
Class C
| 206,655 | 1,956,489 | 93,167 | 892,311 |
Class R6
| 3,125,214 | 29,721,128 | 22,206,656 | 219,388,068 |
Administrator Class
| 99,922 | 939,471 | 16,337 | 160,666 |
Institutional Class
| 32,938,713 | 312,442,573 | 60,814,199 | 595,839,440 |
| | | 369,990,768 | | 869,365,569 |
| Reinvestment of distributions | | | | |
Class A
| 386,247 | 3,657,318 | 634,297 | 6,198,439 |
Class C
| 1,988 | 18,818 | 1,676 | 16,314 |
Class R6
| 116,868 | 1,109,911 | 248,231 | 2,427,229 |
Administrator Class
| 3,960 | 37,515 | 9,270 | 90,839 |
Institutional Class
| 968,253 | 9,188,481 | 1,635,626 | 16,004,191 |
| | | 14,012,043 | | 24,737,012 |
| Payment for shares redeemed | | | | |
Class A
| (11,530,612) | (109,258,211) | (20,151,656) | (197,188,295) |
Class C
| (164,022) | (1,549,824) | (264,125) | (2,599,228) |
Class R6
| (17,739,673) | (169,085,963) | (30,322,260) | (296,291,525) |
Administrator Class
| (173,045) | (1,653,287) | (653,324) | (6,439,085) |
Institutional Class
| (47,313,043) | (448,879,616) | (81,039,965) | (790,136,658) |
| | | (730,426,901) | | (1,292,654,791) |
Net decrease in net assets resulting from capital share transactions
| | (346,424,090) | | (398,552,210) |
Total decrease in net assets
| | (358,496,265) | | (500,290,567) |
| Net assets | | | | |
Beginning of period
| | 2,035,263,401 | | 2,535,553,968 |
End of period
| | $1,676,767,136 | | $ 2,035,263,401 |
The accompanying notes are an integral part of these financial statements.
46 | Allspring Short-Term Municipal Bond Fund
Financial highlights
(For a share outstanding throughout each period)
| | | Year ended June 30 |
| Class A | Six months ended
December 31, 2022
(unaudited) | 2022 | 2021 | 2020 | 2019 | 2018 |
Net asset value, beginning of period
| $9.54 | $9.95 | $9.92 | $9.92 | $9.83 | $9.85 |
Net investment income
| 0.08 | 0.10 | 0.12 | 0.15 | 0.15 | 0.13 |
Net realized and unrealized gains (losses) on investments
| (0.06) | (0.41) | 0.03 | (0.01) | 0.10 | (0.02) |
Total from investment operations
| 0.02 | (0.31) | 0.15 | 0.14 | 0.25 | 0.11 |
| Distributions to shareholders from | | | | | | |
Net investment income
| (0.08) | (0.10) | (0.12) | (0.14) | (0.16) | (0.13) |
Tax basis return of capital
| 0.00 | 0.00 | 0.00 | 0.00 | (0.00) 1 | 0.00 |
Total distributions to shareholders
| (0.08) | (0.10) | (0.12) | (0.14) | (0.16) | (0.13) |
Net asset value, end of period
| $9.48 | $9.54 | $9.95 | $9.92 | $9.92 | $9.83 |
Total return2
| 0.16% | (3.09)% | 1.52% | 1.47% | 2.57% | 1.15% |
| Ratios to average net assets (annualized) | | | | | | |
Gross expenses
| 0.76% | 0.76% | 0.77% | 0.76% | 0.76% | 0.77% |
Net expenses
| 0.63% | 0.63% | 0.63% | 0.63% | 0.63% | 0.63% |
Net investment income
| 1.56% | 1.05% | 1.20% | 1.52% | 1.59% | 1.34% |
| Supplemental data | | | | | | |
Portfolio turnover rate
| 9% | 28% | 20% | 35% | 33% | 31% |
Net assets, end of period (000s omitted)
| $438,622 | $522,582 | $685,618 | $743,254 | $991,514 | $1,209,079 |
| 1 | Amount is less than $0.005. |
| 2 | Total return calculations do not include any sales charges. Returns for periods of less than one year are not annualized. |
The accompanying notes are an integral part of these financial statements.
Allspring Short-Term Municipal Bond Fund | 47
Financial highlights
(For a share outstanding throughout each period)
| | | Year ended June 30 |
| Class C | Six months ended
December 31, 2022
(unaudited) | 2022 | 2021 | 2020 | 2019 | 2018 |
Net asset value, beginning of period
| $9.54 | $9.95 | $9.92 | $9.92 | $9.83 | $9.85 |
Net investment income
| 0.04 | 0.03 | 0.05 | 0.08 | 0.08 | 0.06 |
Net realized and unrealized gains (losses) on investments
| (0.06) | (0.41) | 0.03 | (0.01) | 0.10 | (0.02) |
Total from investment operations
| (0.02) | (0.38) | 0.08 | 0.07 | 0.18 | 0.04 |
| Distributions to shareholders from | | | | | | |
Net investment income
| (0.04) | (0.03) | (0.05) | (0.07) | (0.09) | (0.06) |
Tax basis return of capital
| 0.00 | 0.00 | 0.00 | 0.00 | (0.00) 1 | 0.00 |
Total distributions to shareholders
| (0.04) | (0.03) | (0.05) | (0.07) | (0.09) | (0.06) |
Net asset value, end of period
| $9.48 | $9.54 | $9.95 | $9.92 | $9.92 | $9.83 |
Total return2
| (0.22)% | (3.82)% | 0.76% | 0.71% | 1.81% | 0.40% |
| Ratios to average net assets (annualized) | | | | | | |
Gross expenses
| 1.51% | 1.51% | 1.51% | 1.50% | 1.51% | 1.52% |
Net expenses
| 1.38% | 1.38% | 1.38% | 1.38% | 1.38% | 1.38% |
Net investment income
| 0.81% | 0.30% | 0.45% | 0.77% | 0.84% | 0.59% |
| Supplemental data | | | | | | |
Portfolio turnover rate
| 9% | 28% | 20% | 35% | 33% | 31% |
Net assets, end of period (000s omitted)
| $5,450 | $5,058 | $6,962 | $16,870 | $34,381 | $48,101 |
| 1 | Amount is less than $0.005. |
| 2 | Total return calculations do not include any sales charges. Returns for periods of less than one year are not annualized. |
The accompanying notes are an integral part of these financial statements.
48 | Allspring Short-Term Municipal Bond Fund
Financial highlights
(For a share outstanding throughout each period)
| | | Year ended June 30 |
| Class R6 | Six months ended
December 31, 2022
(unaudited) | 2022 | 2021 | 2020 | 2019 1 |
Net asset value, beginning of period
| $9.56 | $9.97 | $9.94 | $9.94 | $9.86 |
Net investment income
| 0.09 | 0.13 | 0.15 | 0.18 | 0.17 |
Net realized and unrealized gains (losses) on investments
| (0.06) | (0.41) | 0.03 | (0.01) | 0.08 |
Total from investment operations
| 0.03 | (0.28) | 0.18 | 0.17 | 0.25 |
| Distributions to shareholders from | | | | | |
Net investment income
| (0.09) | (0.13) | (0.15) | (0.17) | (0.17) |
Tax basis return of capital
| 0.00 | 0.00 | 0.00 | 0.00 | (0.00) 2 |
Total distributions to shareholders
| (0.09) | (0.13) | (0.15) | (0.17) | (0.17) |
Net asset value, end of period
| $9.50 | $9.56 | $9.97 | $9.94 | $9.94 |
Total return3
| 0.30% | (2.82)% | 1.80% | 1.75% | 2.60% |
| Ratios to average net assets (annualized) | | | | | |
Gross expenses
| 0.38% | 0.38% | 0.39% | 0.38% | 0.38% |
Net expenses
| 0.35% | 0.35% | 0.35% | 0.35% | 0.35% |
Net investment income
| 1.82% | 1.33% | 1.48% | 1.80% | 1.94% |
| Supplemental data | | | | | |
Portfolio turnover rate
| 9% | 28% | 20% | 35% | 33% |
Net assets, end of period (000s omitted)
| $206,233 | $346,080 | $439,530 | $626,312 | $787,524 |
| 1 | For the period from July 31, 2018 (commencement of class operations) to June 30, 2019 |
| 2 | Amount is less than $0.005. |
| 3 | Returns for periods of less than one year are not annualized. |
The accompanying notes are an integral part of these financial statements.
Allspring Short-Term Municipal Bond Fund | 49
Financial highlights
(For a share outstanding throughout each period)
| | | Year ended June 30 |
| Administrator Class | Six months ended
December 31, 2022
(unaudited) | 2022 | 2021 | 2020 | 2019 | 2018 |
Net asset value, beginning of period
| $9.54 | $9.96 | $9.92 | $9.93 | $9.84 | $9.86 |
Net investment income
| 0.08 | 0.12 | 0.12 1 | 0.16 | 0.16 | 0.14 |
Net realized and unrealized gains (losses) on investments
| (0.06) | (0.42) | 0.04 | (0.02) | 0.09 | (0.02) |
Total from investment operations
| 0.02 | (0.30) | 0.16 | 0.14 | 0.25 | 0.12 |
| Distributions to shareholders from | | | | | | |
Net investment income
| (0.08) | (0.12) | (0.12) | (0.15) | (0.16) | (0.14) |
Tax basis return of capital
| 0.00 | 0.00 | 0.00 | 0.00 | (0.00) 2 | 0.00 |
Total distributions to shareholders
| (0.08) | (0.12) | (0.12) | (0.15) | (0.16) | (0.14) |
Net asset value, end of period
| $9.48 | $9.54 | $9.96 | $9.92 | $9.93 | $9.84 |
Total return3
| 0.17% | (3.08)% | 1.65% | 1.39% | 2.60% | 1.18% |
| Ratios to average net assets (annualized) | | | | | | |
Gross expenses
| 0.70% | 0.70% | 0.71% | 0.69% | 0.70% | 0.71% |
Net expenses
| 0.60% | 0.60% | 0.60% | 0.60% | 0.60% | 0.60% |
Net investment income
| 1.58% | 1.07% | 1.23% | 1.55% | 1.62% | 1.36% |
| Supplemental data | | | | | | |
Portfolio turnover rate
| 9% | 28% | 20% | 35% | 33% | 31% |
Net assets, end of period (000s omitted)
| $5,679 | $6,372 | $12,906 | $18,560 | $35,517 | $44,186 |
| 1 | Calculated based upon average shares outstanding |
| 2 | Amount is less than $0.005. |
| 3 | Returns for periods of less than one year are not annualized. |
The accompanying notes are an integral part of these financial statements.
50 | Allspring Short-Term Municipal Bond Fund
Financial highlights
(For a share outstanding throughout each period)
| | | Year ended June 30 |
| Institutional Class | Six months ended
December 31, 2022
(unaudited) | 2022 | 2021 | 2020 | 2019 | 2018 |
Net asset value, beginning of period
| $9.56 | $9.97 | $9.94 | $9.94 | $9.85 | $9.87 |
Net investment income
| 0.09 | 0.13 | 0.14 | 0.17 | 0.18 | 0.16 |
Net realized and unrealized gains (losses) on investments
| (0.06) | (0.41) | 0.03 | (0.00) 1 | 0.09 | (0.02) |
Total from investment operations
| 0.03 | (0.28) | 0.17 | 0.17 | 0.27 | 0.14 |
| Distributions to shareholders from | | | | | | |
Net investment income
| (0.09) | (0.13) | (0.14) | (0.17) | (0.18) | (0.16) |
Tax basis return of capital
| 0.00 | 0.00 | 0.00 | 0.00 | (0.00) 2 | 0.00 |
Total distributions to shareholders
| (0.09) | (0.13) | (0.14) | (0.17) | (0.18) | (0.16) |
Net asset value, end of period
| $9.50 | $9.56 | $9.97 | $9.94 | $9.94 | $9.85 |
Total return3
| 0.28% | (2.86)% | 1.75% | 1.70% | 2.81% | 1.39% |
| Ratios to average net assets (annualized) | | | | | | |
Gross expenses
| 0.43% | 0.43% | 0.44% | 0.43% | 0.43% | 0.44% |
Net expenses
| 0.40% | 0.40% | 0.40% | 0.40% | 0.40% | 0.40% |
Net investment income
| 1.79% | 1.29% | 1.42% | 1.74% | 1.80% | 1.58% |
| Supplemental data | | | | | | |
Portfolio turnover rate
| 9% | 28% | 20% | 35% | 33% | 31% |
Net assets, end of period (000s omitted)
| $1,020,783 | $1,155,172 | $1,390,537 | $1,919,898 | $2,159,113 | $3,421,249 |
| 1 | Amount is more than $(0.005) |
| 2 | Amount is less than $0.005. |
| 3 | Returns for periods of less than one year are not annualized. |
The accompanying notes are an integral part of these financial statements.
Allspring Short-Term Municipal Bond Fund | 51
Notes to financial statements (unaudited)
1. ORGANIZATION
Allspring Funds Trust (the "Trust"), a Delaware statutory trust organized on March 10, 1999, is an open-end management investment company registered under the Investment Company Act of 1940, as amended (the "1940 Act"). As an investment company, the Trust follows the accounting and reporting guidance in Financial Accounting Standards Board ("FASB") Accounting Standards Codification Topic 946, Financial Services – Investment Companies. These financial statements report on the Allspring Short-Term Municipal Bond Fund (the "Fund") which is a diversified series of the Trust.
2. SIGNIFICANT ACCOUNTING POLICIES
The following significant accounting policies, which are consistently followed in the preparation of the financial statements of the Fund, are in conformity with U.S. generally accepted accounting principles which require management to make estimates and assumptions that affect the reported amounts of assets and liabilities, disclosure of contingent assets and liabilities at the date of the financial statements, and the reported amounts of income and expenses during the reporting period. Actual results could differ from those estimates.
Securities valuation
All investments are valued each business day as of the close of regular trading on the New York Stock Exchange (generally 4 p.m. Eastern Time), although the Fund may deviate from this calculation time under unusual or unexpected circumstances.
Debt securities are valued at the evaluated bid price provided by an independent pricing service (e.g. taking into account various factors, including yields, maturities, or credit ratings) or, if a reliable price is not available, the quoted bid price from an independent broker-dealer.
Investments in registered open-end investment companies (other than those listed on a foreign or domestic exchange or market) are valued at net asset value.
Investments which are not valued using the methods discussed above are valued at their fair value, as determined in good faith by Allspring Funds Management, LLC ("Allspring Funds Management"), which was named the valuation designee by the Board of Trustees. As the valuation designee, Allspring Funds Management is responsible for day-to-day valuation activities for the Allspring Funds. In connection with these responsibilities, Allspring Funds Management has established a Valuation Committee and has delegated to it the authority to take any actions regarding the valuation of portfolio securities that the Valuation Committee deems necessary or appropriate, including determining the fair value of portfolio securities. On a quarterly basis, the Board of Trustees receives reports of valuation actions taken by the Valuation Committee. On at least an annual basis, the Board of Trustees receives an assessment of the adequacy and effectiveness of Allspring Funds Management's process for determining the fair value of the portfolio of investments.
When-issued transactions
The Fund may purchase securities on a forward commitment or when-issued basis. The Fund records a when-issued transaction on the trade date and will segregate assets in an amount at least equal in value to the Fund's commitment to purchase when-issued securities. Securities purchased on a when-issued basis are marked-to-market daily and the Fund begins earning interest on the settlement date. Losses may arise due to changes in the market value of the underlying securities or if the counterparty does not perform under the contract.
Security transactions and income recognition
Securities transactions are recorded on a trade date basis. Realized gains or losses are recorded on the basis of identified cost.
Interest income is accrued daily and bond discounts are accreted and premiums are amortized daily. To the extent debt obligations are placed on non-accrual status, any related interest income may be reduced by writing off interest receivables when the collection of all or a portion of interest has been determined to be doubtful based on consistently applied procedures and the fair value has decreased. If the issuer subsequently resumes interest payments or when the collectability of interest is reasonably assured, the debt obligation is removed from non-accrual status.
Distributions to shareholders
Distributions to shareholders from net investment income are declared daily and paid monthly. Distributions from net realized gains, if any, are recorded on the ex-dividend date and paid at least annually. Such distributions are determined in accordance with income tax regulations and may differ from U.S. generally accepted accounting principles. Dividend sources are estimated at the time of declaration. The tax character of distributions is determined as of the Fund's fiscal year end. Therefore, a portion of the Fund's distributions made prior to the Fund’s fiscal year end may be categorized as a tax return of capital at year end.
52 | Allspring Short-Term Municipal Bond Fund
Notes to financial statements (unaudited)
Federal and other taxes
The Fund intends to continue to qualify as a regulated investment company by distributing substantially all of its investment company taxable and tax-exempt income and any net realized capital gains (after reduction for capital loss carryforwards) sufficient to relieve it from all, or substantially all, federal income taxes. Accordingly, no provision for federal income taxes was required.
The Fund’s income and federal excise tax returns and all financial records supporting those returns for the prior three fiscal years are subject to examination by the federal and Delaware revenue authorities. Management has analyzed the Fund's tax positions taken on federal, state, and foreign tax returns, as applicable, for all open tax years and does not believe that there are any uncertain tax positions that require recognition of a tax liability.
As of December 31, 2022, the aggregate cost of all investments for federal income tax purposes was $1,723,464,798 and the unrealized gains (losses) consisted of:
| Gross unrealized gains | $ 1,276,913 |
| Gross unrealized losses | (54,810,709) |
| Net unrealized losses | $(53,533,796) |
As of June 30, 2022, the Fund had capital loss carryforwards which consisted of $9,327,297 in short-term capital losses and $51,153,537 in long-term capital losses.
Class allocations
The separate classes of shares offered by the Fund differ principally in applicable sales charges, distribution, shareholder servicing, and administration fees. Class specific expenses are charged directly to that share class. Investment income, common fund-level expenses, and realized and unrealized gains (losses) on investments are allocated daily to each class of shares based on the relative proportion of net assets of each class.
3. FAIR VALUATION MEASUREMENTS
Fair value measurements of investments are determined within a framework that has established a fair value hierarchy based upon the various data inputs utilized in determining the value of the Fund’s investments. The three-level hierarchy gives the highest priority to unadjusted quoted prices in active markets for identical assets or liabilities (Level 1) and the lowest priority to unobservable inputs (Level 3). The Fund’s investments are classified within the fair value hierarchy based on the lowest level of input that is significant to the fair value measurement. The inputs are summarized into three broad levels as follows:
| ■ | Level 1 – quoted prices in active markets for identical securities |
| ■ | Level 2 – other significant observable inputs (including quoted prices for similar securities, interest rates, prepayment speeds, credit risk, etc.) |
| ■ | Level 3 – significant unobservable inputs (including the Fund’s own assumptions in determining the fair value of investments) |
The inputs or methodologies used for valuing investments in securities are not necessarily an indication of the risk associated with investing in those securities.
The following is a summary of the inputs used in valuing the Fund’s assets and liabilities as of December 31, 2022:
| | Quoted prices
(Level 1) | Other significant
observable inputs
(Level 2) | Significant
unobservable inputs
(Level 3) | Total |
| Assets | | | | |
| Investments in: | | | | |
| Municipal obligations | $ 0 | $ 1,667,609,960 | $0 | $ 1,667,609,960 |
| Short-term investments | | | | |
| Investment companies | 2,321,042 | 0 | 0 | 2,321,042 |
| Total assets | $2,321,042 | $1,667,609,960 | $0 | $1,669,931,002 |
Additional sector, industry or geographic detail, if any, is included in the Portfolio of Investments.
For the six months ended December 31, 2022, the Fund did not have any transfers into/out of Level 3.
Allspring Short-Term Municipal Bond Fund | 53
Notes to financial statements (unaudited)
4. TRANSACTIONS WITH AFFILIATES
Management fee
Allspring Funds Management, a wholly owned subsidiary of Allspring Global Investments Holdings, LLC, a holding company indirectly owned by certain private funds of GTCR LLC and Reverence Capital Partners, L.P., is the manager of the Fund and provides advisory and fund-level administrative services under an investment management agreement. Under the investment management agreement, Allspring Funds Management is responsible for, among other services, implementing the investment objectives and strategies of the Fund, supervising the subadviser and providing fund-level administrative services in connection with the Fund’s operations. As compensation for its services under the investment management agreement, Allspring Funds Management is entitled to receive a management fee at the following annual rate based on the Fund’s average daily net assets:
| Average daily net assets | Management fee |
| First $1 billion | 0.350% |
| Next $4 billion | 0.325 |
| Next $3 billion | 0.290 |
| Next $2 billion | 0.265 |
| Over $10 billion | 0.255 |
For the six months ended December 31, 2022, the management fee was equivalent to an annual rate of 0.34% of the Fund’s average daily net assets.
Allspring Funds Management has retained the services of a subadviser to provide daily portfolio management to the Fund. The fee for subadvisory services is borne by Allspring Funds Management. Allspring Global Investments, LLC, an affiliate of Allspring Funds Management and a wholly owned subsidiary of Allspring Global Investments Holdings, LLC, is the subadviser to the Fund and is entitled to receive a fee from Allspring Funds Management at an annual rate starting at 0.15% and declining to 0.05% as the average daily net assets of the Fund increase.
Administration fees
Under a class-level administration agreement, Allspring Funds Management provides class-level administrative services to the Fund, which includes paying fees and expenses for services provided by the transfer agent, sub-transfer agents, omnibus account servicers and record-keepers. As compensation for its services under the class-level administration agreement, Allspring Funds Management receives an annual fee which is calculated based on the average daily net assets of each class as follows:
| | Class-level
administration fee |
| Class A | 0.16% |
| Class C | 0.16 |
| Class R6 | 0.03 |
| Administrator Class | 0.10 |
| Institutional Class | 0.08 |
Waivers and/or expense reimbursements
Allspring Funds Management has contractually committed to waive and/or reimburse management and administration fees to the extent necessary to maintain certain net operating expense ratios for the Fund. When each class of the Fund has exceeded its expense cap, Allspring Funds Management will waive fees and/or reimburse expenses from fund-level expenses on a proportionate basis and then from class specific expenses. When only certain classes exceed their expense caps, waivers and/or reimbursements are applied against class specific expenses before fund-level expenses. Allspring Funds Management has contractually committed through October 31, 2023 to waive fees and/or reimburse expenses to the extent necessary to cap expenses. Prior to or after the commitment expiration date, the caps may be increased or the commitment to maintain the caps may be terminated only with the approval of the Board of Trustees. As of December 31, 2022, the contractual expense caps are as follows:
54 | Allspring Short-Term Municipal Bond Fund
Notes to financial statements (unaudited)
| | Expense ratio caps |
| Class A | 0.63% |
| Class C | 1.38 |
| Class R6 | 0.35 |
| Administrator Class | 0.60 |
| Institutional Class | 0.40 |
Distribution fee
The Trust has adopted a distribution plan for Class C shares pursuant to Rule 12b-1 under the 1940 Act. A distribution fee is charged to Class C shares and paid to Allspring Funds Distributor, LLC ("Allspring Funds Distributor"), the principal underwriter, an affiliate of Allspring Funds Management, at an annual rate up to 0.75% of the average daily net assets of Class C shares.
In addition, Allspring Funds Distributor is entitled to receive the front-end sales charge from the purchase of Class A shares and a contingent deferred sales charge on the redemption of certain Class A shares. Allspring Funds Distributor is also entitled to receive the contingent deferred sales charges from redemptions of Class C shares. For the six months ended December 31, 2022, Allspring Funds Distributor received $331 from the sale of Class A shares. No contingent deferred sales charges were incurred by Class A and Class C shares for the six months ended December 31, 2022.
Shareholder servicing fees
The Trust has entered into contracts with one or more shareholder servicing agents, whereby Class A, Class C and Administrator Class are charged a fee at an annual rate up to 0.25% of the average daily net assets of each respective class. A portion of these total shareholder servicing fees were paid to affiliates of the Fund.
Interfund transactions
The Fund may purchase or sell portfolio investment securities to certain affiliates pursuant to Rule 17a-7 under the 1940 Act and under procedures adopted by the Board of Trustees. The procedures have been designed to ensure that these interfund transactions, which do not incur broker commissions, are effected at current market prices. Pursuant to these procedures, the Fund had $38,185,000, $96,583,000 and $0 in interfund purchases, sales and net realized gains (losses), respectively, during the six months ended December 31, 2022.
5. INVESTMENT PORTFOLIO TRANSACTIONS
Purchases and sales of investments, excluding U.S. government obligations (if any) and short-term securities, for the six months ended December 31, 2022 were $157,303,061 and $290,795,479, respectively.
6. BANK BORROWINGS
The Trust (excluding the money market funds), Allspring Master Trust and Allspring Variable Trust are parties to a $350,000,000 revolving credit agreement whereby the Fund is permitted to use bank borrowings for temporary or emergency purposes, such as to fund shareholder redemption requests. Interest under the credit agreement is charged to the Fund based on a borrowing rate equal to the higher of the Federal Funds rate or the overnight bank funding rate in effect on that day plus a spread. In addition, an annual commitment fee equal based on the unused balance is allocated to each participating fund.
For the six months ended December 31, 2022, there were no borrowings by the Fund under the agreement.
7. MARKET RISKS
On March 11, 2020, the World Health Organization announced that it had made the assessment that coronavirus disease 2019 (“COVID-19”) is a pandemic. The impacts of COVID-19 are affecting the entire global economy, individual companies and investment products, the funds, and the market in general. There is significant uncertainty around the extent and duration of business disruptions related to COVID-19 and the impacts may last for an extended period of time. COVID-19 has led to significant uncertainty and volatility in the financial markets.
8. INDEMNIFICATION
Under the Fund's organizational documents, the officers and Trustees have been granted certain indemnification rights against certain liabilities that may arise out of performance of their duties to the Fund. The Fund has entered into a separate agreement with each Trustee that converts indemnification rights currently existing under the Fund’s organizational documents into contractual rights that cannot be changed in the future without the consent of the Trustee. Additionally, in the
Allspring Short-Term Municipal Bond Fund | 55
Notes to financial statements (unaudited)
normal course of business, the Fund may enter into contracts with service providers that contain a variety of indemnification clauses. The Fund’s maximum exposure under these arrangements is dependent on future claims that may be made against the Fund and, therefore, cannot be estimated.
56 | Allspring Short-Term Municipal Bond Fund
Other information (unaudited)
PROXY VOTING INFORMATION
A description of the policies and procedures used to determine how to vote proxies relating to portfolio securities is available without charge, upon request, by calling 1-800-222-8222, visiting our website at allspringglobal.com, or visiting the SEC website at sec.gov. Information regarding how the proxies related to portfolio securities were voted during the most recent 12-month period ended June 30 is available on the website at allspringglobal.com or by visiting the SEC website at sec.gov.
QUARTERLY PORTFOLIO HOLDINGS INFORMATION
The Fund files its complete schedule of portfolio holdings with the SEC for the first and third quarters of each fiscal year as an exhibit to its reports on Form N-PORT. Shareholders may view the filed Form N-PORT by visiting the SEC website at sec.gov.
Allspring Short-Term Municipal Bond Fund | 57
Other information (unaudited)
BOARD OF TRUSTEES AND OFFICERS
Each of the Trustees and Officers listed in the table below acts in identical capacities for each fund in the Allspring family of funds, which consists of 127 mutual funds comprising the Allspring Funds Trust, Allspring Variable Trust, Allspring Master Trust and four closed-end funds (collectively the “Fund Complex”). This table should be read in conjunction with the Prospectus and the Statement of Additional Information1. The mailing address of each Trustee and Officer is 1415 Vantage Park Drive, 3rd Floor, Charlotte, NC 28203. Each Trustee and Officer serves an indefinite term, however, each Trustee serves such term until reaching the mandatory retirement age established by the Trustees.
Independent Trustees
Name and
year of birth | Position held and
length of service* | Principal occupations during past five years or longer | Current other
public company or
investment
company
directorships |
William R. Ebsworth
(Born 1957) | Trustee,
since 2015 | Retired. From 1984 to 2013, equities analyst, portfolio manager, research director and chief investment officer at Fidelity Management and Research Company in Boston, Tokyo, and Hong Kong, and retired in 2013 as Chief Investment Officer of Fidelity Strategic Advisers, Inc. where he led a team of investment professionals managing client assets. Prior thereto, Board member of Hong Kong Securities Clearing Co., Hong Kong Options Clearing Corp., the Thailand International Fund, Ltd., Fidelity Investments Life Insurance Company, and Empire Fidelity Investments Life Insurance Company. Audit Committee Chair and Investment Committee Chair of the Vincent Memorial Hospital Foundation (non-profit organization). Mr. Ebsworth is a CFA® charterholder. | N/A |
Jane A. Freeman
(Born 1953) | Trustee,
since 2015;
Chair Liaison,
since 2018 | Retired. From 2012 to 2014 and 1999 to 2008, Chief Financial Officer of Scientific Learning Corporation. From 2008 to 2012, Ms. Freeman provided consulting services related to strategic business projects. Prior to 1999, Portfolio Manager at Rockefeller & Co. and Scudder, Stevens & Clark. Board member of the Harding Loevner Funds from 1996 to 2014, serving as both Lead Independent Director and chair of the Audit Committee. Board member of the Russell Exchange Traded Funds Trust from 2011 to 2012 and the chair of the Audit Committee. Ms. Freeman is also an inactive Chartered Financial Analyst. | N/A |
Isaiah Harris, Jr.
(Born 1952) | Trustee,
since 2009; Audit
Committee
Chair,
since 2019 | Retired. Member of the Advisory Board of CEF of East Central Florida. Chairman of the Board of CIGNA Corporation from 2009 to 2021, and Director from 2005 to 2008. From 2003 to 2011, Director of Deluxe Corporation. Prior thereto, President and CEO of BellSouth Advertising and Publishing Corp. from 2005 to 2007, President and CEO of BellSouth Enterprises from 2004 to 2005 and President of BellSouth Consumer Services from 2000 to 2003. Emeritus member of the Iowa State University Foundation Board of Governors. Emeritus Member of the Advisory Board of Iowa State University School of Business. Advisory Board Member, Palm Harbor Academy (private school). Advisory Board Member, Fellowship of Christian Athletes. Mr. Harris is a certified public accountant (inactive status). | N/A |
David F. Larcker
(Born 1950) | Trustee,
since 2009 | Distinguished Visiting Fellow at the Hoover Institution since 2022. James Irvin Miller Professor of Accounting at the Graduate School of Business (Emeritus), Stanford University, Director of the Corporate Governance Research Initiative and Senior Faculty of The Rock Center for Corporate Governance since 2006. From 2005 to 2008, Professor of Accounting at the Graduate School of Business, Stanford University. Prior thereto, Ernst & Young Professor of Accounting at The Wharton School, University of Pennsylvania from 1985 to 2005. | N/A |
58 | Allspring Short-Term Municipal Bond Fund
Other information (unaudited)
Name and
year of birth | Position held and
length of service* | Principal occupations during past five years or longer | Current other
public company or
investment
company
directorships |
Olivia S. Mitchell
(Born 1953) | Trustee,
since 2006;
Nominating and
Governance
Committee Chair,
since 2018 | International Foundation of Employee Benefit Plans Professor since 1993, Wharton School of the University of Pennsylvania. Director of Wharton’s Pension Research Council and Boettner Center on Pensions & Retirement Research, and Research Associate at the National Bureau of Economic Research. Previously taught at Cornell University from 1978 to 1993. | N/A |
Timothy J. Penny
(Born 1951) | Trustee,
since 1996;
Chair,
since 2018 | President and Chief Executive Officer of Southern Minnesota Initiative Foundation, a non-profit organization, since 2007. Vice Chair of the Economic Club of Minnesota, since 2007. Co-Chair of the Committee for a Responsible Federal Budget, since 1995. Member of the Board of Trustees of NorthStar Education Finance, Inc., a non-profit organization, from 2007-2022. Senior Fellow of the University of Minnesota Humphrey Institute from 1995 to 2017. | N/A |
James G. Polisson
(Born 1959) | Trustee,
since 2018 | Retired. Chief Marketing Officer, Source (ETF) UK Services, Ltd, from 2015 to 2017. From 2012 to 2015, Principal of The Polisson Group, LLC, a management consulting, corporate advisory and principal investing company. Chief Executive Officer and Managing Director at Russell Investments, Global Exchange Traded Funds from 2010 to 2012. Managing Director of Barclays Global Investors from 1998 to 2010 and Global Chief Marketing Officer for iShares and Barclays Global Investors from 2000 to 2010. Trustee of the San Francisco Mechanics’ Institute, a non-profit organization, from 2013 to 2015. Board member of the Russell Exchange Traded Fund Trust from 2011 to 2012. Director of Barclays Global Investors Holdings Deutschland GmbH from 2006 to 2009. Mr. Polisson is an attorney and has a retired status with the Massachusetts and District of Columbia Bar Associations. | N/A |
Pamela Wheelock
(Born 1959) | Trustee,
since January
2020; previously
Trustee from
January 2018 to
July 2019 | Retired. Executive and Senior Financial leadership positions in the public, private and nonprofit sectors. Interim President and CEO, McKnight Foundation, 2020. Interim Commissioner, Minnesota Department of Human Services, 2019. Chief Operating Officer, Twin Cities Habitat for Humanity, 2017-2019. Vice President for University Services, University of Minnesota, 2012-2016. Interim President and CEO, Blue Cross and Blue Shield of Minnesota, 2011-2012. Executive Vice-President and Chief Financial Officer, Minnesota Wild, 2002-2008. Commissioner, Minnesota Department of Finance, 1999-2002. Chair of the Board of Directors of Destination Medical Center Corporation. Board member of the Minnesota Wild Foundation. | N/A |
* Length of service dates reflect the Trustee’s commencement of service with the Trust’s predecessor entities, where applicable.
Allspring Short-Term Municipal Bond Fund | 59
Other information (unaudited)
Officers2
Name and
year of birth | Position held and
length of service | Principal occupations during past five years or longer |
Andrew Owen
(Born 1960) | President,
since 2017 | President and Chief Executive Officer of Allspring Funds Management, LLC since 2017 and Head of Global Fund Governance of Allspring Global Investments since 2022. Prior thereto, co-president of Galliard Capital Management, LLC, an affiliate of Allspring Funds Management, LLC, from 2019 to 2022 and Head of Affiliated Managers, Allspring Global Investments, from 2014 to 2019 and Executive Vice President responsible for marketing, investments and product development for Allspring Funds Management, LLC, from 2009 to 2014. |
Jeremy DePalma
(Born 1974) | Treasurer,
since 2012
(for certain funds in
the Fund Complex);
since 2021 (for
the remaining funds in the
Fund Complex) | Senior Vice President of Allspring Funds Management, LLC since 2009. Senior Vice President of Evergreen Investment Management Company, LLC from 2008 to 2010 and head of the Fund Reporting and Control Team within Fund Administration from 2005 to 2010. |
Christopher Baker
(Born 1976) | Chief Compliance Officer, since 2022 | Global Chief Compliance Officer for Allspring Global Investments since 2022. Prior thereto, Chief Compliance Officer for State Street Global Advisors from 2018 to 2021. Senior Compliance Officer for the State Street divisions of Alternative Investment Solutions, Sector Solutions, and Global Marketing from 2015 to 2018. From 2010 to 2015 Vice President, Global Head of Investment and Marketing Compliance for State Street Global Advisors. |
Matthew Prasse
(Born 1983) | Chief Legal Officer, since 2022; Secretary, since 2021 | Senior Counsel of the Allspring Legal Department since 2021. Senior Counsel of the Wells Fargo Legal Department from 2018 to 2021. Previously, Counsel for Barings LLC from 2015 to 2018. Prior to joining Barings, Associate at Morgan, Lewis & Bockius LLP from 2008 to 2015. |
1 The Statement of Additional Information includes additional information about the Trustees and is available, without charge, upon request, by calling 1-800-222-8222 or by visiting the website at allspringglobal.com.
2 For those Officers with tenures at Allspring Global Investments and/or Allspring Funds Management, LLC that began prior to 2021, such tenures include years of service during which these businesses/entities were known as Wells Fargo Asset Management and Wells Fargo Funds Management, LLC, respectively.
60 | Allspring Short-Term Municipal Bond Fund
For more information
More information about Allspring Funds is available free upon request. To obtain literature, please write, visit the Fund's website, or call:
Allspring Funds
P.O. Box 219967
Kansas City, MO 64121-9967
Website: allspringglobal.com
Individual investors: 1-800-222-8222
Retail investment professionals: 1-888-877-9275
Institutional investment professionals: 1-800-260-5969
This report and the financial statements contained herein are submitted for the general information of the shareholders of the Fund. If this report is used for promotional purposes, distribution of the report must be accompanied or preceded by a current prospectus. Before investing, please consider the investment objectives, risks, charges, and expenses of the investment. For a current prospectus and, if available, a summary prospectus, containing this information, call
1-800-222-8222 or visit the Fund's website at allspringglobal.com. Read the prospectus carefully before you invest or send money.
Allspring Global InvestmentsTM is the trade name for the asset management firms of Allspring Global Investments Holdings, LLC, a holding company indirectly owned by certain private funds of GTCR LLC and Reverence Capital Partners, L.P. These firms include but are not limited to Allspring Global Investments, LLC, and Allspring Funds Management, LLC. Certain products managed by Allspring entities are distributed by Allspring Funds Distributor, LLC (a broker-dealer and Member FINRA/SIPC).
This material is for general informational and educational purposes only and is NOT intended to provide investment advice or a recommendation of any kind - including a recommendation for any specific investment, strategy, or plan.
© 2023 Allspring Global Investments Holdings, LLC. All rights reserved.
ALL-01092023-ub2ksp39 02-23
SAR3330 12-22
Semi-Annual Report
December 31, 2022
Allspring
Strategic Municipal Bond Fund
The views expressed and any forward-looking statements are as of December 31, 2022, unless otherwise noted, and are those of the Fund's portfolio managers and/or Allspring Global Investments. Discussions of individual securities or the markets generally are not intended as individual recommendations. Future events or results may vary significantly from those expressed in any forward-looking statements. The views expressed are subject to change at any time in response to changing circumstances in the market. Allspring Global Investments disclaims any obligation to publicly update or revise any views expressed or forward-looking statements.
Allspring Strategic Municipal Bond Fund | 1
Letter to shareholders (unaudited)
Andrew Owen
President
Allspring Funds
Dear Shareholder:
We are pleased to offer you this semi-annual report for the Allspring Strategic Municipal Bond Fund for the six-month period that ended December 31, 2022. Globally, stocks and bonds experienced heightened volatility and generally negative returns through the challenging period. Earlier tailwinds provided by global stimulus programs, vaccination rollouts, and recovering consumer and corporate sentiment were wiped away by the highest rate of inflation in four decades, the impact of ongoing aggressive central bank rate hikes and the prospect of more rate hikes. Compounding these concerns were the global reverberations of the Russia-Ukraine war and the impact of China’s strict COVID-19 lockdowns.
For the six-month period, stocks and bonds had mixed results, with emerging market equities trailing those of developed markets and both U.S. and non-U.S. bonds fighting an uphill battle in the face of sustained interest rate increases. For the period, U.S. stocks, based on the S&P 500 Index,1 gained 2.31%. International stocks, as measured by the MSCI ACWI ex USA Index (Net),2 returned 2.96%, while the MSCI EM Index (Net) (USD)3 declined 2.99%. Among bond indexes, the Bloomberg U.S. Aggregate Bond Index4 returned -2.97%, the Bloomberg Global Aggregate ex-USD Index (unhedged)5 returned -2.65%, the Bloomberg Municipal Bond Index6 gained 0.50%, and the ICE BofA U.S. High Yield Index7 returned 3.33%.
Persistent inflation and economic fallout from the Russia-Ukraine war drove markets.
Markets rebounded from earlier losses in July, led by U.S. stocks. While evidence pointed to an economic slowdown after two consecutive quarters of declining gross domestic product (economic contraction), the U.S. labor market remained surprisingly strong: July nonfarm payrolls grew by more than 500,000 and U.S. unemployment dipped to 3.5%. Meanwhile, crude oil and retail gasoline prices, major contributors to recent overall inflation, fell substantially from earlier highs. And while U.S. home prices rose, sales fell as houses became less affordable with mortgage rates at a 13-year high. The Federal Reserve (Fed) raised the federal funds rate another 0.75% in July—to a range of 2.25% to 2.50%—and forecasts pointed to further rate hikes.
| 1 | The S&P 500 Index consists of 500 stocks chosen for market size, liquidity, and industry group representation. It is a market-value-weighted index with each stock's weight in the index proportionate to its market value. You cannot invest directly in an index. |
| 2 | The Morgan Stanley Capital International (MSCI) All Country World Index (ACWI) ex USA Index (Net) is a free-float-adjusted market-capitalization-weighted index that is designed to measure the equity market performance of developed and emerging markets, excluding the U.S. Source: MSCI. MSCI makes no express or implied warranties or representations and shall have no liability whatsoever with respect to any MSCI data contained herein. The MSCI data may not be further redistributed or used as a basis for other indexes or any securities or financial products. This report is not approved, reviewed, or produced by MSCI. You cannot invest directly in an index. |
| 3 | The MSCI Emerging Markets (EM) Index (Net) (USD) is a free-float-adjusted market-capitalization-weighted index that is designed to measure equity market performance of emerging markets. You cannot invest directly in an index. |
| 4 | The Bloomberg U.S. Aggregate Bond Index is a broad-based benchmark that measures the investment-grade, U.S.-dollar-denominated, fixed-rate taxable bond market, including Treasuries, government-related and corporate securities, mortgage-backed securities (agency fixed-rate and hybrid adjustable-rate mortgage pass-throughs), asset-backed securities, and commercial mortgage-backed securities. You cannot invest directly in an index. |
| 5 | The Bloomberg Global Aggregate ex-USD Index (unhedged) is an unmanaged index that provides a broad-based measure of the global investment-grade fixed-income markets excluding the U.S.-dollar-denominated debt market. You cannot invest directly in an index. |
| 6 | The Bloomberg Municipal Bond Index is an unmanaged index composed of long-term tax-exempt bonds with a minimum credit rating of Baa. You cannot invest directly in an index. |
| 7 | The ICE BofA U.S. High Yield Index is a market-capitalization-weighted index of domestic and Yankee high-yield bonds. The index tracks the performance of high-yield securities traded in the U.S. bond market. You cannot invest directly in an index. Copyright 2023. ICE Data Indices, LLC. All rights reserved. |
2 | Allspring Strategic Municipal Bond Fund
Letter to shareholders (unaudited)
August was yet another broadly challenging month for financial markets, with more red ink flowing. High inflation persisted, cresting 9% in the eurozone on an annual basis and remaining above 8% in the U.S. despite the Fed’s aggressive monetary policy and a major drop in global crude oil and gasoline prices from their June peak. One positive note was the resilience of the U.S. job market. However, the Fed’s job was clearly not complete. One longer-term bright spot was the U.S. Congress’s passage of the Inflation Reduction Act. Its primary stated goals include: to reduce inflation (though not immediately) by curbing the deficit, capping health care spending by seniors, and investing in domestic sources of clean energy.
The market misery continued in September. There was nowhere to hide as all asset classes suffered major losses at the hands of persistent inflation. Central banks kept up their battle against rapidly rising prices with more rate hikes. The strength of the U.S. dollar made things even more difficult for investors holding assets in other currencies. U.S. mortgage rates jumped to near 7% on 30-year fixed-rate mortgages; the decreased housing affordability began to cool demand somewhat. The U.K. experienced a sharp sell-off of government bonds and the British pound in September as investors panicked in response to a new government budget that was seen as financially unsound. The market meltdown forced the Bank of England to step in and buy long-dated government bonds.
Equities had a reprieve in October after two months of sharp declines. Value stocks and small caps fared best. Globally, developed markets outpaced emerging market equities, which were hurt by weakness among Chinese stocks. Central banks continued to try to curtail high inflation with aggressive interest rate hikes. Geopolitical risks persisted, including the ongoing Russia-Ukraine war and economic, financial market, and political turmoil in the U.K., which led to a second prime ministerial change in six weeks, as Rishi Sunak replaced Liz Truss in late October. Concerns over Europe’s energy crisis eased thanks to unseasonably warm weather and plentiful gas on hand. The U.S. labor market continued its resilience against rising prices, as unemployment stood at 3.7%, near a record low.
Stocks and bonds rallied in November, with emerging market equities gaining nearly 15% and developed market equities returning 7%. The S&P 500 Index rose 5.6% in November. Bonds also had positive monthly returns. Economic news was encouraging, driven by U.S. labor market strength. Although central banks kept raising rates, expectations grew regarding an impending easing in the pace of rate hikes and a possible end to central bank monetary tightening in 2023. Although inflation remained at record highs in the eurozone, with a 10.6% annual increase in October, Germany’s producer prices decreased 4.2% annually, signaling a possible decline in inflationary pressures. Meanwhile, U.S. inflation continued to moderate, with a 7.1% annual price rise in November and a monthly price increase of just 0.1%. China’s economic data remained weak, reflecting its zero-COVID-19 policy.
Financial markets cooled in December, with U.S. equities posting negative overall results in response to a weakening U.S. dollar. Fixed income securities ended one of their worst years ever with flat overall monthly returns as markets weighed the hopes for an end to the monetary tightening cycle with the reality that central banks had not completed their jobs yet. U.S. Consumer Price Index (CPI)1 data showed a strong consistent trend downward, which brought down the 12-month CPI to 6.5% in December from 9.1% in June. Other countries and regions reported still-high but declining inflation rates as the year winded down.
“ The market misery continued in September. There was nowhere to hide as all asset classes suffered major losses at the hands of persistent inflation.”
| 1 | The Consumer Price Index (CPI) is a measure of the average change over time in the prices paid by urban consumers for a market basket of consumer goods and services. You cannot invest directly in an index. |
Allspring Strategic Municipal Bond Fund | 3
Letter to shareholders (unaudited)
Don’t let short-term uncertainty derail long-term investment goals.
Periods of investment uncertainty can present challenges, but experience has taught us that maintaining long-term investment goals can be an effective way to plan for the future. To help you create a sound strategy based on your personal goals and risk tolerance, Allspring Funds offers more than 100 mutual funds spanning a wide range of asset classes and investment styles. Although diversification cannot guarantee an investment profit or prevent losses, we believe it can be an effective way to manage investment risk and potentially smooth out overall portfolio performance. We encourage investors to know their investments and to understand that appropriate levels of risk-taking may unlock opportunities.
Thank you for choosing to invest with Allspring Funds. We appreciate your confidence in us and remain committed to helping you meet your financial needs.
Sincerely,
Andrew Owen
President
Allspring Funds
For further information about your fund, contact your investment professional, visit our website at allspringglobal.com, or call us directly at 1-800-222-8222.
4 | Allspring Strategic Municipal Bond Fund
This page is intentionally left blank.
Performance highlights (unaudited)
| Investment objective | The Fund seeks current income exempt from regular federal income tax. |
| Manager | Allspring Funds Management, LLC |
| Subadviser | Allspring Global Investments, LLC |
| Portfolio managers | Terry J. Goode, Robert J. Miller, Nicholos Venditti |
| Average annual total returns (%) as of December 31, 2022 |
| | | Including sales charge | | Excluding sales charge | | Expense ratios1 (%) |
| | Inception date | 1 year | 5 year | 10 year | | 1 year | 5 year | 10 year | | Gross | Net 2 |
| Class A (VMPAX) | 12-1-1994 | -9.33 | 0.14 | 1.08 | | -5.51 | 0.95 | 1.49 | | 0.79 | 0.79 |
| Class C (DHICX) | 8-18-1997 | -7.20 | 0.20 | 0.88 | | -6.20 | 0.20 | 0.88 | | 1.54 | 1.54 |
| Class R6 (VMPRX)3 | 7-31-2018 | – | – | – | | -5.04 | 1.33 | 1.73 | | 0.41 | 0.41 |
| Administrator Class (VMPYX) | 10-6-1997 | – | – | – | | -5.41 | 1.09 | 1.61 | | 0.73 | 0.68 |
| Institutional Class (STRIX)4 | 11-30-2012 | – | – | – | | -5.20 | 1.31 | 1.82 | | 0.46 | 0.46 |
| Bloomberg Short-Intermediate Municipal Bond Index5 | – | – | – | – | | -4.51 | 1.30 | 1.54 | | – | – |
Figures quoted represent past performance, which is no guarantee of future results, and do not reflect taxes that a shareholder may pay on an investment in a fund. Investment return and principal value of an investment will fluctuate so that an investor’s shares, when redeemed, may be worth more or less than their original cost. Performance shown without sales charges would be lower if sales charges were reflected. Current performance may be lower or higher than the performance data quoted, which assumes the reinvestment of dividends and capital gains. Current month-end performance is available on the Fund’s website, allspringglobal.com.
Index returns do not include transaction costs associated with buying and selling securities, any mutual fund fees or expenses, or any taxes. It is not possible to invest directly in an index.
For Class A shares, the maximum front-end sales charge is 4.00%. For Class C shares, the maximum contingent deferred sales charge is 1.00%. Performance including a contingent deferred sales charge assumes the sales charge for the corresponding time period. Class R6, Administrator Class and Institutional Class shares are sold without a front-end sales charge or contingent deferred sales charge.
| 1 | Reflects the expense ratios as stated in the most recent prospectuses. The expense ratios shown are subject to change and may differ from the annualized expense ratios shown in the financial highlights of this report. |
| 2 | The manager has contractually committed through October 31, 2023, to waive fees and/or reimburse expenses to the extent necessary to cap total annual fund operating expenses after fee waivers at 0.80% for Class A, 1.55% for Class C, 0.42% for Class R6, 0.68% for Administrator Class, and 0.47% for Institutional Class. Brokerage commissions, stamp duty fees, interest, taxes, acquired fund fees and expenses (if any), and extraordinary expenses are excluded from the expense caps. Prior to or after the commitment expiration date, the caps may be increased or the commitment to maintain the caps may be terminated only with the approval of the Board of Trustees. Without these caps, the Fund’s returns would have been lower. The expense ratio paid by an investor is the net expense ratio (the total annual fund operating expenses after fee waivers) as stated in the prospectuses. |
| 3 | Historical performance shown for the Class R6 shares prior to their inception reflects the performance of the Administrator Class shares, and includes the higher expenses applicable to the Administrator Class shares. If these expenses had not been included, returns for the Class R6 shares would be higher. |
| 4 | Historical performance shown for the Institutional Class shares prior to their inception reflects the performance of the Administrator Class shares, and includes the higher expenses applicable to the Administrator Class shares. If these expenses had not been included, returns for the Institutional Class shares would be higher. |
| 5 | The Bloomberg Short-Intermediate Municipal Bond Index is a rules-based, market-value-weighted index composed of publicly traded municipal bonds that cover the U.S. dollar–denominated short-term tax-exempt bond market, including state and local general obligation bonds, revenue bonds, insured bonds, and prefunded bonds. You cannot invest directly in an index. |
6 | Allspring Strategic Municipal Bond Fund
Performance highlights (unaudited)
Bond values fluctuate in response to the financial condition of individual issuers, general market and economic conditions, and changes in interest rates. Changes in market conditions and government policies may lead to periods of heightened volatility in the bond market and reduced liquidity for certain bonds held by the Fund. In general, when interest rates rise, bond values fall and investors may lose principal value. Interest rate changes and their impact on the Fund and its share price can be sudden and unpredictable. High-yield securities have a greater risk of default and tend to be more volatile than higher-rated debt securities. The use of derivatives may reduce returns and/or increase volatility. Certain investment strategies tend to increase the total risk of an investment (relative to the broader market). This fund is exposed to municipal securities risk. Consult the Fund’s prospectus for additional information on these and other risks. A portion of the Fund’s income may be subject to federal, state, and/or local income taxes or the alternative minimum tax. Any capital gains distributions may be taxable.
Allspring Strategic Municipal Bond Fund | 7
Performance highlights (unaudited)
| Credit quality as of December 31, 20221 |
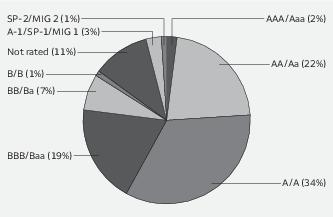
| 1 | The credit quality distribution of portfolio holdings reflected in the chart is based on ratings from Standard & Poor’s, Moody’s Investors Service, and/or Fitch Ratings Ltd. Credit quality ratings apply to the underlying holdings of the Fund and not to the Fund itself. The percentages of the portfolio with the ratings depicted in the chart are calculated based on the market value of fixed income securities held by the Fund. If a security was rated by all three rating agencies, the middle rating was utilized. If rated by two of the three rating agencies, the lower rating was utilized, and if rated by one of the rating agencies, that rating was utilized. Standard & Poor’s rates the creditworthiness of bonds, ranging from AAA (highest) to D (lowest). Ratings from A to CCC may be modified by the addition of a plus (+) or minus (-) sign to show relative standing within the rating categories. Standard & Poor’s rates the creditworthiness of short-term notes from SP-1 (highest) to SP-3 (lowest). Moody’s rates the creditworthiness of bonds, ranging from Aaa (highest) to C (lowest). Ratings Aa to B may be modified by the addition of a number 1 (highest) to 3 (lowest) to show relative standing within the ratings categories. Moody’s rates the creditworthiness of short-term U.S. tax-exempt municipal securities from MIG 1/VMIG 1 (highest) to SG (lowest). Fitch rates the creditworthiness of bonds, ranging from AAA (highest) to D (lowest). Credit quality distribution is subject to change and may have changed since the date specified. |
| Effective maturity distribution as of December 31, 20221 |
| 1 | Figures represent the percentage of the Fund's long-term investments. Allocations are subject to change and may have changed since the date specified. |
8 | Allspring Strategic Municipal Bond Fund
Fund expenses (unaudited)
As a shareholder of the Fund, you incur two types of costs: (1) transaction costs, including sales charges (loads) on purchase payments and contingent deferred sales charges (if any) on redemptions and (2) ongoing costs, including management fees, distribution (12b-1) and/or shareholder servicing fees, and other Fund expenses. This example is intended to help you understand your ongoing costs (in dollars) of investing in the Fund and to compare these costs with the ongoing costs of investing in other mutual funds.
The example is based on an investment of $1,000 invested at the beginning of the six-month period and held for the entire period from July 1, 2022 to December 31, 2022.
Actual expenses
The “Actual” line of the table below provides information about actual account values and actual expenses. You may use the information in this line, together with the amount you invested, to estimate the expenses that you paid over the period. Simply divide your account value by $1,000 (for example, an $8,600 account value divided by $1,000 = 8.6), then multiply the result by the number in the “Actual” line under the heading entitled “Expenses paid during period” for your applicable class of shares to estimate the expenses you paid on your account during this period.
Hypothetical example for comparison purposes
The “Hypothetical” line of the table below provides information about hypothetical account values and hypothetical expenses based on the Fund’s actual expense ratio and an assumed rate of return of 5% per year before expenses, which is not the Fund’s actual return. The hypothetical account values and expenses may not be used to estimate the actual ending account balance or expenses you paid for the period. You may use this information to compare the ongoing costs of investing in the Fund and other funds. To do so, compare this 5% hypothetical example with the 5% hypothetical examples that appear in the shareholder reports of the other funds.
Please note that the expenses shown in the table are meant to highlight your ongoing costs only and do not reflect any transactional costs, such as sales charges (loads) and contingent deferred sales charges. Therefore, the “Hypothetical” line of the table is useful in comparing ongoing costs only, and will not help you determine the relative total costs of owning different funds. In addition, if these transactional costs were included, your costs would have been higher.
| | Beginning
account value
7-1-2022 | Ending
account value
12-31-2022 | Expenses
paid during
the period1 | Annualized net
expense ratio |
| Class A | | | | |
| Actual | $1,000.00 | $1,001.38 | $4.04 | 0.80% |
| Hypothetical (5% return before expenses) | $1,000.00 | $1,021.17 | $4.08 | 0.80% |
| Class C | | | | |
| Actual | $1,000.00 | $ 997.63 | $7.75 | 1.54% |
| Hypothetical (5% return before expenses) | $1,000.00 | $1,017.44 | $7.83 | 1.54% |
| Class R6 | | | | |
| Actual | $1,000.00 | $1,004.46 | $2.12 | 0.42% |
| Hypothetical (5% return before expenses) | $1,000.00 | $1,023.09 | $2.14 | 0.42% |
| Administrator Class | | | | |
| Actual | $1,000.00 | $1,001.96 | $3.43 | 0.68% |
| Hypothetical (5% return before expenses) | $1,000.00 | $1,021.78 | $3.47 | 0.68% |
| Institutional Class | | | | |
| Actual | $1,000.00 | $1,003.04 | $2.37 | 0.47% |
| Hypothetical (5% return before expenses) | $1,000.00 | $1,022.84 | $2.40 | 0.47% |
1 Expenses paid is equal to the annualized net expense ratio of each class multiplied by the average account value over the period, multiplied by 184 divided by 365 (to reflect the one-half-year period).
Allspring Strategic Municipal Bond Fund | 9
Portfolio of investments—December 31, 2022 (unaudited)
| | | Interest
rate | Maturity
date | Principal | Value |
| Municipal obligations: 98.95% | | | | | |
| Alabama: 2.47% | | | | | |
| Housing revenue: 0.47% | | | | | |
| Alabama HFA MFHR South Oak Residences Series A | | 1.25% | 12-1-2025 | $10,000,000 | $ 9,537,131 |
| Industrial development revenue: 0.17% | | | | | |
| Selma AL Industrial Development Board Refunding Bonds Gulf Opportunity Zone International Paper Company | | 2.00 | 11-1-2033 | 3,675,000 | 3,536,300 |
| Utilities revenue: 1.83% | | | | | |
| Black Belt Energy Gas District Alabama Gas Project #6 Series B | | 4.00 | 10-1-2052 | 6,500,000 | 6,422,449 |
| Black Belt Energy Gas District Alabama Gas Project Series C-1 | | 5.25 | 2-1-2053 | 7,800,000 | 8,130,881 |
| Black Belt Energy Gas District Gas Supply Project #3 Series A | | 4.00 | 12-1-2048 | 2,000,000 | 2,001,847 |
| Lower Alabama Gas Supply District Project #2 | | 4.00 | 12-1-2050 | 8,660,000 | 8,591,526 |
| Southeast Alabama Gas Supply District Project #2 Series 2018A | | 4.00 | 6-1-2049 | 12,150,000 | 12,107,419 |
| | | | | | 37,254,122 |
| | | | | | 50,327,553 |
| Alaska: 0.42% | | | | | |
| Health revenue: 0.28% | | | | | |
| Alaska IDA & Export Tanana Chiefs Conference Project Series 2019A | | 5.00 | 10-1-2027 | 1,455,000 | 1,555,361 |
| Alaska IDA & Export Tanana Chiefs Conference Project Series 2019A | | 5.00 | 10-1-2028 | 1,530,000 | 1,655,386 |
| Alaska IDA & Export Tanana Chiefs Conference Project Series 2019A | | 5.00 | 10-1-2029 | 2,220,000 | 2,418,062 |
| | | | | | 5,628,809 |
| Utilities revenue: 0.14% | | | | | |
| Alaska IDA & Export Power Refunding Bonds Snettisham Hydroelectric Project | | 5.00 | 1-1-2023 | 2,835,000 | 2,835,000 |
| | | | | | 8,463,809 |
| Arizona: 2.02% | | | | | |
| Education revenue: 0.72% | | | | | |
| Arizona Board of Regents University of Arizona System Revenue Refunding Bonds Stimulus Plan for Economic and Education Development Series C | | 5.00 | 8-1-2023 | 1,000,000 | 1,011,521 |
| Arizona Board of Regents University of Arizona System Revenue Refunding Bonds Stimulus Plan for Economic and Education Development Series C | | 5.00 | 8-1-2025 | 600,000 | 635,162 |
| Arizona IDA Education Revenue Agribusiness & Equine Center Incorporated Project Series 2017B 144Aøø | | 4.00 | 3-1-2027 | 995,000 | 954,757 |
| Arizona IDA Education Revenue Jerome Facility Project Series B | | 4.00 | 7-1-2034 | 230,000 | 218,790 |
| Arizona IDA Education Revenue Jerome Facility Project Series B | | 5.00 | 7-1-2029 | 160,000 | 165,905 |
| Arizona IDA Education Revenue Jerome Facility Project Series B | | 5.00 | 7-1-2030 | 190,000 | 196,594 |
The accompanying notes are an integral part of these financial statements.
10 | Allspring Strategic Municipal Bond Fund
Portfolio of investments—December 31, 2022 (unaudited)
| | | Interest
rate | Maturity
date | Principal | Value |
| Education revenue (continued) | | | | | |
| Arizona IDA Education Revenue Jerome Facility Project Series B | | 5.00% | 7-1-2031 | $ 200,000 | $ 206,660 |
| Arizona IDA Education Revenue Jerome Facility Project Series B | | 5.00 | 7-1-2032 | 210,000 | 216,517 |
| Arizona IDA Education Revenue Jerome Facility Project Series B | | 5.00 | 7-1-2033 | 220,000 | 226,208 |
| Arizona IDA Education Revenue Leman Academy of Excellence Incorporated Parker Colorado Campus Project Series A 144A | | 4.50 | 7-1-2029 | 765,000 | 728,518 |
| Pima County AZ IDA American Leadership Academy Project 144A | | 4.60 | 6-15-2025 | 605,000 | 603,740 |
| Pima County AZ IDA Education Revenue Refunding Bonds 144A | | 4.00 | 6-15-2026 | 2,585,000 | 2,524,761 |
| Pima County AZ IDA Education Revenue Refunding Bonds 144A | | 4.00 | 6-15-2028 | 2,785,000 | 2,671,511 |
| Pima County AZ IDA Education Revenue Refunding Bonds American Leadership Project 144A | | 4.00 | 6-15-2024 | 2,140,000 | 2,120,995 |
| Pima County AZ IDA Education Revenue Refunding Bonds Facility Edkey Charter 144A | | 3.50 | 7-1-2025 | 1,985,000 | 1,919,484 |
| Pima County AZ IDA Noah Webster Schools Project Series A | | 5.50 | 12-15-2023 | 215,000 | 216,906 |
| | | | | | 14,618,029 |
| Health revenue: 0.27% | | | | | |
| Maricopa County AZ IDA Senior Living Facilities Christian Care Retirement Apartments Incorporated Project | | 5.00 | 1-1-2023 | 1,120,000 | 1,120,000 |
| Maricopa County AZ IDA Senior Living Facilities Christian Care Surprise Incorporated Project 144A | | 5.00 | 1-1-2026 | 3,420,000 | 3,144,917 |
| Tempe AZ IDA Friendship Village of Tempe Project Series A | | 4.00 | 12-1-2023 | 215,000 | 213,068 |
| Tempe AZ IDA Friendship Village of Tempe Project Series A | | 4.00 | 12-1-2024 | 220,000 | 215,761 |
| Tempe AZ IDA Friendship Village of Tempe Project Series A | | 4.00 | 12-1-2025 | 270,000 | 261,914 |
| Tempe AZ IDA Friendship Village of Tempe Project Series A | | 4.00 | 12-1-2026 | 245,000 | 234,963 |
| Tempe AZ IDA Friendship Village of Tempe Project Series A | | 4.00 | 12-1-2027 | 350,000 | 330,257 |
| | | | | | 5,520,880 |
| Industrial development revenue: 0.58% | | | | | |
| Chandler AZ IDA Intel Corporation Project | | 5.00 | 6-1-2049 | 11,645,000 | 11,830,656 |
| Miscellaneous revenue: 0.45% | | | | | |
| Arizona IDA Revenue Lincoln South Beltway Project | | 5.00 | 2-1-2027 | 1,255,000 | 1,354,604 |
| Arizona IDA Revenue Lincoln South Beltway Project | | 5.00 | 5-1-2027 | 1,125,000 | 1,219,349 |
| Arizona IDA Revenue Lincoln South Beltway Project | | 5.00 | 8-1-2027 | 1,205,000 | 1,311,431 |
| Arizona IDA Revenue Lincoln South Beltway Project | | 5.00 | 11-1-2027 | 1,000,000 | 1,092,743 |
| Navajo Nation Series A 144A | | 5.00 | 12-1-2025 | 4,110,000 | 4,205,505 |
| | | | | | 9,183,632 |
| | | | | | 41,153,197 |
| Arkansas: 0.09% | | | | | |
| Tax revenue: 0.09% | | | | | |
| Bentonville AR Sales & Use Tax Refunding and Improvement Bonds Series 2021B | | 1.05 | 11-1-2046 | 1,550,000 | 1,507,966 |
The accompanying notes are an integral part of these financial statements.
Allspring Strategic Municipal Bond Fund | 11
Portfolio of investments—December 31, 2022 (unaudited)
| | | Interest
rate | Maturity
date | Principal | Value |
| Tax revenue (continued) | | | | | |
| Cabot AR Sales & Use Tax Refunding Bonds Series B | | 4.00% | 12-1-2029 | $ 230,000 | $ 243,061 |
| Cabot AR Sales & Use Tax Refunding Bonds Series B | | 4.00 | 12-1-2030 | 125,000 | 131,607 |
| | | | | | 1,882,634 |
| California: 2.46% | | | | | |
| Airport revenue: 0.01% | | | | | |
| Port of Oakland AMT Series H | | 5.00 | 5-1-2024 | 225,000 | 231,405 |
| Education revenue: 0.53% | | | | | |
| California Municipal Finance Authority Charter School Nova Academy Project Series 2016A 144A | | 4.00 | 6-15-2026 | 525,000 | 512,603 |
| California School Finance Authority Charter School Rocketship Education Obligated Group Series 2017A 144A | | 4.50 | 6-1-2027 | 250,000 | 244,519 |
| The Regents of the University of California Series 2013AI | | 5.00 | 5-15-2033 | 10,000,000 | 10,064,172 |
| | | | | | 10,821,294 |
| Health revenue: 0.88% | | | | | |
| California PFA Revenue Henry Mayo Newhall Hospital Series A | | 4.00 | 10-15-2026 | 415,000 | 420,144 |
| California PFA Revenue Henry Mayo Newhall Hospital Series A | | 4.00 | 10-15-2027 | 400,000 | 404,825 |
| California PFA Senior Living Revenue Refunding Bond Enso Village Project Series A 144A | | 5.00 | 11-15-2036 | 1,000,000 | 904,945 |
| California PFA Senior Living Revenue Refunding Bond Enso Village Project Series B-2 144A | | 2.38 | 11-15-2028 | 1,000,000 | 916,770 |
| California Statewide CDA Health Facilities Dignity Health Series D (AGM Insured) € | | 3.25 | 7-1-2041 | 7,700,000 | 7,700,000 |
| California Statewide CDA Health Facilities Dignity Health Series E (AGM Insured) € | | 3.90 | 7-1-2040 | 7,525,000 | 7,525,000 |
| | | | | | 17,871,684 |
| Housing revenue: 0.18% | | | | | |
| California HFA Municipal Certificate of Participation Series 2 Class A | | 4.00 | 3-20-2033 | 1,428,579 | 1,379,222 |
| California Municipal Finance Authority Orchard Park Student Housing Project (BAM Insured) | | 5.00 | 5-15-2024 | 500,000 | 511,044 |
| California Municipal Finance Authority Orchard Park Student Housing Project (BAM Insured) | | 5.00 | 5-15-2025 | 400,000 | 415,643 |
| California Municipal Finance Authority Orchard Park Student Housing Project (BAM Insured) | | 5.00 | 5-15-2026 | 400,000 | 421,436 |
| California Municipal Finance Authority Orchard Park Student Housing Project (BAM Insured) | | 5.00 | 5-15-2027 | 500,000 | 532,829 |
| California Municipal Finance Authority Orchard Park Student Housing Project (BAM Insured) | | 5.00 | 5-15-2028 | 400,000 | 430,842 |
| | | | | | 3,691,016 |
| Miscellaneous revenue: 0.03% | | | | | |
| Independent Cities Finance Authority California Sales Tax Revenue (AGM Insured) 144A | | 4.00 | 6-1-2024 | 310,000 | 312,658 |
| Independent Cities Finance Authority California Sales Tax Revenue (AGM Insured) 144A | | 4.00 | 6-1-2026 | 350,000 | 358,668 |
| | | | | | 671,326 |
The accompanying notes are an integral part of these financial statements.
12 | Allspring Strategic Municipal Bond Fund
Portfolio of investments—December 31, 2022 (unaudited)
| | | Interest
rate | Maturity
date | Principal | Value |
| Tax revenue: 0.07% | | | | | |
| Riverside County CA Public Financing Project Area #1 (BAM Insured) | | 5.00% | 10-1-2026 | $ 1,250,000 | $ 1,319,848 |
| Transportation revenue: 0.76% | | | | | |
| Bay Area Toll Authority Toll Bridge San Francisco Bay Area Series C (SIFMA Municipal Swap +0.45%) ± | | 4.11 | 4-1-2056 | 2,000,000 | 1,969,447 |
| Bay Area Toll Authority Toll Bridge San Francisco Bay Area Series D (SIFMA Municipal Swap +0.30%) ± | | 3.96 | 4-1-2056 | 14,000,000 | 13,607,248 |
| | | | | | 15,576,695 |
| | | | | | 50,183,268 |
| Colorado: 0.59% | | | | | |
| Airport revenue: 0.26% | | | | | |
| Denver CO City & County Airport System Revenue Series 2012B | | 5.00 | 12-1-2030 | 5,000,000 | 5,431,669 |
| Education revenue: 0.03% | | | | | |
| Colorado ECFA Charter School New Summit Charter Academy 144A | | 4.00 | 7-1-2031 | 310,000 | 283,722 |
| Colorado ECFA Rocky Mountain Classical Academy Project | | 6.38 | 9-1-2023 | 325,000 | 331,748 |
| | | | | | 615,470 |
| GO revenue: 0.17% | | | | | |
| Aviation Station North Metropolitan District #2 Colorado Improvement & Refunding Bonds Limited Tax Series A | | 4.00 | 12-1-2029 | 499,000 | 462,406 |
| Grand River CO Hospital District (AGM Insured) | | 5.00 | 12-1-2025 | 1,000,000 | 1,049,409 |
| Mirabelle Metropolitan District #2 Colorado Senior Series A | | 5.00 | 12-1-2039 | 700,000 | 647,821 |
| Peak Metropolitan District #1 Colorado Limited Tax Series A 144A | | 4.00 | 12-1-2035 | 500,000 | 416,976 |
| Sterling Ranch Community Authority Board Colorado Supported Revenue Refunding Bonds and Improvement Limited Tax District #2 Series A | | 3.38 | 12-1-2030 | 416,000 | 359,909 |
| Thompson Crossing Metropolitan District #4 Colorado Improvement & Refunding Bonds Limited Tax | | 3.50 | 12-1-2029 | 515,000 | 459,756 |
| | | | | | 3,396,277 |
| Miscellaneous revenue: 0.08% | | | | | |
| Colorado Bridge Enterprise Senior Revenue Bonds AMT Central 70 Project Private Activity Bond | | 4.00 | 12-31-2024 | 1,610,000 | 1,625,301 |
| Tax revenue: 0.01% | | | | | |
| Pueblo CO Urban Renewal Authority Evraz Project Series B 144A¤ | | 0.00 | 12-1-2025 | 200,000 | 168,652 |
| Transportation revenue: 0.04% | | | | | |
| Colorado E-470 Public Highway Authority Senior Revenue Bond Series 2020-A | | 5.00 | 9-1-2040 | 800,000 | 803,506 |
| | | | | | 12,040,875 |
| Connecticut: 2.04% | | | | | |
| Education revenue: 0.27% | | | | | |
| Connecticut HEFA University of Hartford Project Series N | | 5.00 | 7-1-2026 | 575,000 | 585,063 |
The accompanying notes are an integral part of these financial statements.
Allspring Strategic Municipal Bond Fund | 13
Portfolio of investments—December 31, 2022 (unaudited)
| | | Interest
rate | Maturity
date | Principal | Value |
| Education revenue (continued) | | | | | |
| Connecticut HEFA University of Hartford Project Series N | | 5.00% | 7-1-2027 | $ 430,000 | $ 438,491 |
| Connecticut HEFA University of Hartford Project Series N | | 5.00 | 7-1-2028 | 530,000 | 541,363 |
| Connecticut HEFAR Yale University Issue Series A-2 | | 2.00 | 7-1-2042 | 1,500,000 | 1,421,289 |
| Connecticut Higher Education Supplemental Loan Authority AMT Chelsea Loan Program Series B | | 5.00 | 11-15-2025 | 480,000 | 511,552 |
| Connecticut Higher Education Supplemental Loan Authority AMT Chelsea Loan Program Series B | | 5.00 | 11-15-2026 | 385,000 | 418,820 |
| Connecticut Higher Education Supplemental Loan Authority AMT Chelsea Loan Program Series B | | 5.00 | 11-15-2026 | 940,000 | 989,974 |
| Connecticut Higher Education Supplemental Loan Authority AMT Chelsea Loan Program Series B | | 5.00 | 11-15-2027 | 125,000 | 135,981 |
| Connecticut Higher Education Supplemental Loan Authority AMT Chelsea Loan Program Series B | | 5.00 | 11-15-2027 | 500,000 | 535,293 |
| | | | | | 5,577,826 |
| GO revenue: 0.31% | | | | | |
| Bridgeport CT Series A | | 5.00 | 6-1-2026 | 1,220,000 | 1,300,394 |
| Bridgeport CT Series A | | 5.00 | 6-1-2027 | 1,425,000 | 1,544,354 |
| Bridgeport CT Series A | | 5.00 | 6-1-2028 | 1,605,000 | 1,763,782 |
| Hartford CT Series A | | 5.00 | 4-1-2027 | 1,650,000 | 1,658,862 |
| | | | | | 6,267,392 |
| Health revenue: 0.41% | | | | | |
| Connecticut HEFA Revenue Hartford Healthcare Series B-2 | | 5.00 | 7-1-2053 | 7,800,000 | 8,281,299 |
| Connecticut HEFA Revenue McLean Affiliates Incorporated Series B-2 144A | | 2.75 | 1-1-2026 | 115,000 | 114,985 |
| | | | | | 8,396,284 |
| Tax revenue: 1.05% | | | | | |
| Connecticut Special Tax Obligation Revenue Transportation Infrastructure Purpose Series A | | 5.00 | 8-1-2029 | 17,125,000 | 18,075,958 |
| Connecticut Special Tax Obligation Revenue Transportation Infrastructure Purpose Series B | | 5.00 | 10-1-2030 | 3,000,000 | 3,348,032 |
| | | | | | 21,423,990 |
| | | | | | 41,665,492 |
| Delaware: 0.05% | | | | | |
| Education revenue: 0.05% | | | | | |
| Delaware EDA Odyssey Charter School Project Series A 144A | | 6.25 | 9-1-2025 | 945,000 | 970,022 |
| District of Columbia: 0.59% | | | | | |
| Airport revenue: 0.31% | | | | | |
| Metropolitan Washington Airports Authority System Revenue Refunding AMT Series A | | 5.00 | 10-1-2025 | 6,000,000 | 6,262,060 |
| Education revenue: 0.09% | | | | | |
| District of Columbia Revenue Two Rivers Public Charter School Incorporated | | 3.00 | 6-1-2030 | 1,100,000 | 1,011,641 |
| District of Columbia Revenue Two Rivers Public Charter School Incorporated | | 4.00 | 6-1-2030 | 1,000,000 | 951,781 |
| | | | | | 1,963,422 |
The accompanying notes are an integral part of these financial statements.
14 | Allspring Strategic Municipal Bond Fund
Portfolio of investments—December 31, 2022 (unaudited)
| | | Interest
rate | Maturity
date | Principal | Value |
| Water & sewer revenue: 0.19% | | | | | |
| District of Columbia Water & Sewer Authority Public Utility Subordinated Lien Bond Series C | | 1.75% | 10-1-2054 | $ 4,000,000 | $ 3,865,964 |
| | | | | | 12,091,446 |
| Florida: 3.96% | | | | | |
| Airport revenue: 0.89% | | | | | |
| Broward County FL Port Facilities Revenue Refunding Bonds Series C | | 5.00 | 9-1-2027 | 2,330,000 | 2,559,764 |
| Miami-Dade County FL Aviation Refunding Bonds AMT | | 5.00 | 10-1-2029 | 11,000,000 | 11,234,358 |
| Miami-Dade County FL Aviation Refunding Bonds AMT Series 2014 | | 5.00 | 10-1-2030 | 1,325,000 | 1,353,093 |
| Miami-Dade County FL Seaport AMT Series B | | 6.00 | 10-1-2032 | 1,385,000 | 1,413,788 |
| Miami-Dade County FL Seaport AMT Series B | | 6.00 | 10-1-2033 | 1,500,000 | 1,531,178 |
| | | | | | 18,092,181 |
| Education revenue: 0.53% | | | | | |
| Capital Trust Agency Educational Facilities Renaissance Charter School Incorporated Projects Series 2017A 144A | | 4.38 | 6-15-2027 | 875,000 | 849,680 |
| Capital Trust Agency Educational Facilities Renaissance Charter School Incorporated Projects Series 2019A 144A | | 4.00 | 6-15-2029 | 2,150,000 | 1,991,206 |
| Capital Trust Agency Educational Facilities Renaissance Imagine School at Land O' Lakes 144A | | 3.00 | 12-15-2029 | 370,000 | 334,307 |
| Florida Development Finance Corporation Educational Facilities Revenue IPS Florida LLC - IDEA Florida Incorporated Jacksonville IV Project 144A | | 5.25 | 6-15-2029 | 2,200,000 | 2,128,721 |
| Florida Development Finance Corporation Educational Facilities Revenue Renaissance Charter School Incorporated Projects Series C 144A | | 4.00 | 9-15-2030 | 470,000 | 429,808 |
| Florida State HEFAR Florida Institute of Technology | | 5.00 | 10-1-2027 | 650,000 | 678,897 |
| Florida State HEFAR Florida Institute of Technology | | 5.00 | 10-1-2028 | 1,050,000 | 1,103,599 |
| Florida State HEFAR Florida Institute of Technology | | 5.00 | 10-1-2029 | 1,000,000 | 1,056,592 |
| Miami-Dade County FL IDA Youth Charter Schools Project Series 2015A 144A | | 5.00 | 9-15-2025 | 400,000 | 398,079 |
| Palm Beach County FL Educational Facilities Authority Revenue Atlantic University Incorporated | | 4.00 | 10-1-2029 | 420,000 | 420,179 |
| Palm Beach County FL Educational Facilities Authority Revenue Atlantic University Incorporated | | 4.00 | 10-1-2030 | 870,000 | 867,207 |
| Palm Beach County FL Educational Facilities Authority Revenue Atlantic University Incorporated | | 4.00 | 10-1-2031 | 660,000 | 654,253 |
| | | | | | 10,912,528 |
| Health revenue: 0.09% | | | | | |
| Florida Development Finance Corporation Senior Living Revenue Mayflower Retirement Community 144A | | 1.75 | 6-1-2026 | 510,000 | 457,303 |
| St. Johns County FL IDA Senior Living Vicar's Landing Project Series A | | 4.00 | 12-15-2029 | 225,000 | 208,179 |
| St. Johns County FL IDA Senior Living Vicar's Landing Project Series A | | 4.00 | 12-15-2030 | 200,000 | 183,187 |
| St. Johns County FL IDA Senior Living Vicar's Landing Project Series A | | 4.00 | 12-15-2031 | 205,000 | 185,656 |
| St. Johns County FL IDA Senior Living Vicar's Landing Project Series A | | 4.00 | 12-15-2036 | 1,000,000 | 840,483 |
| | | | | | 1,874,808 |
The accompanying notes are an integral part of these financial statements.
Allspring Strategic Municipal Bond Fund | 15
Portfolio of investments—December 31, 2022 (unaudited)
| | | Interest
rate | Maturity
date | Principal | Value |
| Housing revenue: 0.74% | | | | | |
| Capital Trust Agency Florida College Park Towers Apartments Project (Department of Housing and Urban Development Insured) | | 1.25% | 5-1-2024 | $ 4,000,000 | $ 3,970,327 |
| Deutsche Bank Short Puttable Exempt Adjustable Receipts/Long Inverse Floating Exempt Receipts Trust Series DBE-8055 (Deutsche Bank LOC, Deutsche Bank LIQ) 144Aø | | 4.06 | 11-1-2058 | 9,930,000 | 9,930,000 |
| University of West Florida Foundation Incorporated Dormitory Series A | | 5.00 | 6-1-2023 | 1,190,000 | 1,198,238 |
| | | | | | 15,098,565 |
| Industrial development revenue: 0.19% | | | | | |
| Escambia County FL Environmental Improvement Refunding Bonds International Paper Company Project Series B | | 2.00 | 11-1-2033 | 825,000 | 793,863 |
| Florida Development Finance Corporation Solid Waste AMT Pro USA Incorporated | | 3.00 | 6-1-2032 | 1,500,000 | 1,132,070 |
| Florida Development Finance Corporation Solid Waste AMT Pro USA Incorporated 144A | | 5.00 | 5-1-2029 | 2,000,000 | 1,858,005 |
| | | | | | 3,783,938 |
| Miscellaneous revenue: 0.16% | | | | | |
| Capital Trust Agency Florida College Park Towers Apartments Project 144A | | 4.00 | 6-15-2024 | 1,000,000 | 985,498 |
| Capital Trust Agency Florida College Park Towers Apartments Project 144A | | 4.00 | 6-15-2025 | 350,000 | 340,925 |
| Florida Village Community Development District #10 Special Assessment Bonds | | 5.13 | 5-1-2024 | 885,000 | 887,920 |
| Florida Village Community Development District #13 Special Assessment Bonds | | 2.63 | 5-1-2024 | 250,000 | 243,346 |
| Pinellas County FL IDA 2017 Foundation for Global Understanding Incorporated Project | | 5.00 | 7-1-2029 | 810,000 | 817,814 |
| | | | | | 3,275,503 |
| Resource recovery revenue: 0.23% | | | | | |
| Florida Development Finance Corporation Solid Waste AMT Pro USA Incorporated 144A | | 5.25 | 8-1-2029 | 5,000,000 | 4,649,372 |
| Transportation revenue: 0.07% | | | | | |
| Osceola County FL Transportation Revenue Improvement & Refunding Bonds Osceola Parkway Series 2019A-1 | | 5.00 | 10-1-2027 | 950,000 | 977,185 |
| Osceola County FL Transportation Revenue Improvement & Refunding Bonds Osceola Parkway Series 2019A-1 | | 5.00 | 10-1-2029 | 450,000 | 467,160 |
| | | | | | 1,444,345 |
| Water & sewer revenue: 1.06% | | | | | |
| Charlotte County FL IDA 144A | | 4.00 | 10-1-2041 | 1,250,000 | 999,528 |
| North Sumter County Utility Dependent District Florida Utility Revenue Sumter Water Conservation Authority Project (AGM Insured) | | 5.00 | 10-1-2029 | 1,055,000 | 1,193,749 |
| North Sumter County Utility Dependent District Florida Utility Revenue Sumter Water Conservation Authority Project (AGM Insured) | | 5.00 | 10-1-2030 | 1,760,000 | 2,018,776 |
| North Sumter County Utility Dependent District Florida Utility Revenue Sumter Water Conservation Authority Project (AGM Insured) | | 5.00 | 10-1-2031 | 1,980,000 | 2,294,153 |
The accompanying notes are an integral part of these financial statements.
16 | Allspring Strategic Municipal Bond Fund
Portfolio of investments—December 31, 2022 (unaudited)
| | | Interest
rate | Maturity
date | Principal | Value |
| Water & sewer revenue (continued) | | | | | |
| North Sumter County Utility Dependent District Florida Utility Revenue Sumter Water Conservation Authority Project (AGM Insured) | | 5.00% | 10-1-2032 | $ 2,080,000 | $ 2,398,121 |
| Tohopekaliga Water Authority Florida Utility System 144A | | 5.00 | 10-1-2025 | 12,000,000 | 12,750,919 |
| | | | | | 21,655,246 |
| | | | | | 80,786,486 |
| Georgia: 6.57% | | | | | |
| Health revenue: 0.15% | | | | | |
| Fulton County GA Residential Care Facilities Elderly Authority Revenue Entrance Fee Canterbury Court 144A | | 2.25 | 10-1-2028 | 3,665,000 | 2,999,277 |
| Industrial development revenue: 0.22% | | | | | |
| George L Smith II Georgia World Congress Center Authority Convention Center Hotel Series B 144A | | 3.63 | 1-1-2031 | 2,000,000 | 1,743,647 |
| George L Smith II Georgia World Congress Center Authority Convention Center Hotel Series B 144A | | 5.00 | 1-1-2036 | 1,750,000 | 1,599,804 |
| George L Smith II Georgia World Congress Center Authority Convention Center Hotel Series B 144A | | 5.00 | 1-1-2054 | 1,500,000 | 1,192,489 |
| | | | | | 4,535,940 |
| Transportation revenue: 0.06% | | | | | |
| Georgia Road & Tollway Authority I-75 S Express Lanes Project Series A 144A¤ | | 0.00 | 6-1-2024 | 1,300,000 | 1,229,589 |
| Utilities revenue: 6.14% | | | | | |
| Appling County Development Authority Oglethorpe Power Corporation Hatch Project | | 1.50 | 1-1-2038 | 2,500,000 | 2,362,249 |
| Bartow County Development Authority Pollution Control Georgia Power Company Plant Bowen Project | | 1.80 | 9-1-2029 | 1,000,000 | 892,248 |
| Bartow County Development Authority Pollution Control Georgia Power Company Plant Bowen Project | | 2.75 | 12-1-2032 | 4,950,000 | 4,940,275 |
| Burke County GA Development Authority Oglethorpe Power Corporation Vogtle Project Series E | | 3.25 | 11-1-2045 | 3,000,000 | 2,975,142 |
| Burke County GA Development Authority Oglethorpe Power Corporation Vogtle Project Series F | | 3.00 | 11-1-2045 | 14,955,000 | 14,949,703 |
| Burke County GA Development Authority PCR Bonds Georgia Power Company Plant Vogtle Project | | 1.70 | 12-1-2049 | 3,500,000 | 3,381,799 |
| Burke County GA Development Authority PCR Bonds Georgia Power Company Plant Vogtle Project | | 2.25 | 10-1-2032 | 1,500,000 | 1,491,610 |
| Dalton GA Utilities Revenue Combined Bonds | | 5.00 | 3-1-2023 | 625,000 | 626,790 |
| Dalton GA Utilities Revenue Combined Bonds | | 5.00 | 3-1-2024 | 350,000 | 357,932 |
| Dalton GA Utilities Revenue Combined Bonds | | 5.00 | 3-1-2025 | 400,000 | 415,640 |
| Dalton GA Utilities Revenue Combined Bonds | | 5.00 | 3-1-2026 | 600,000 | 634,002 |
| Dalton GA Utilities Revenue Combined Bonds | | 5.00 | 3-1-2027 | 700,000 | 749,874 |
| Dalton GA Utilities Revenue Combined Bonds | | 5.00 | 3-1-2028 | 850,000 | 921,634 |
| Dalton GA Utilities Revenue Combined Bonds | | 5.00 | 3-1-2029 | 1,000,000 | 1,098,838 |
| Dalton GA Utilities Revenue Combined Bonds | | 5.00 | 3-1-2030 | 1,100,000 | 1,223,890 |
| Dalton GA Utilities Revenue Combined Bonds | | 5.00 | 3-1-2031 | 1,000,000 | 1,111,870 |
| Dalton GA Utilities Revenue Combined Bonds | | 5.00 | 3-1-2032 | 1,000,000 | 1,105,867 |
| Main Street Natural Gas Incorporated Gas Supply Revenue Bonds Series 2022A | | 4.00 | 12-1-2028 | 3,000,000 | 2,964,846 |
| Main Street Natural Gas Incorporated Gas Supply Revenue Bonds Series 2022A | | 4.00 | 12-1-2029 | 4,500,000 | 4,405,901 |
The accompanying notes are an integral part of these financial statements.
Allspring Strategic Municipal Bond Fund | 17
Portfolio of investments—December 31, 2022 (unaudited)
| | | Interest
rate | Maturity
date | Principal | Value |
| Utilities revenue (continued) | | | | | |
| Main Street Natural Gas Incorporated Gas Supply Revenue Bonds Series 2022C 144Aøø | | 4.00% | 8-1-2052 | $28,000,000 | $ 26,325,078 |
| Main Street Natural Gas Incorporated Georgia Gas Project Series B | | 4.00 | 8-1-2049 | 10,000,000 | 10,000,306 |
| Main Street Natural Gas Incorporated Georgia Gas Project Series B | | 5.00 | 6-1-2029 | 1,630,000 | 1,691,961 |
| Main Street Natural Gas Incorporated Georgia Gas Project Series C | | 4.00 | 3-1-2050 | 10,235,000 | 10,090,456 |
| Main Street Natural Gas Incorporated Georgia Gas Project Series C | | 4.00 | 5-1-2052 | 7,265,000 | 7,094,974 |
| Main Street Natural Gas Incorporated Georgia Gas Project Series C | | 5.00 | 6-1-2028 | 2,500,000 | 2,590,392 |
| Main Street Natural Gas Incorporated Georgia Gas Project Subordinate Bond Series A (Royal Bank of Canada LIQ) | | 4.00 | 4-1-2048 | 2,640,000 | 2,639,167 |
| Main Street Natural Gas Incorporated Georgia Gas Project Subordinate Bond Series B (1 Month LIBOR +0.75%) ± | | 3.51 | 4-1-2048 | 4,700,000 | 4,679,130 |
| Municipal Electric Authority Georgia General Resolution Projects Subordinated Bonds Series A | | 5.00 | 1-1-2027 | 1,010,000 | 1,073,487 |
| Municipal Electric Authority Georgia General Resolution Projects Subordinated Bonds Series A | | 5.00 | 1-1-2028 | 1,035,000 | 1,112,278 |
| Municipal Electric Authority Georgia Plant Vogtle Units 3&4 Project J Series A (AGM Insured) | | 5.00 | 7-1-2030 | 350,000 | 392,250 |
| Municipal Electric Authority Georgia Plant Vogtle Units 3&4 Project J Series A (AGM Insured) | | 5.00 | 7-1-2032 | 1,100,000 | 1,242,902 |
| Municipal Electric Authority Georgia Plant Vogtle Units 3&4 Project M Series A | | 5.00 | 1-1-2027 | 300,000 | 318,858 |
| Municipal Electric Authority Georgia Plant Vogtle Units 3&4 Project M Series A | | 5.00 | 1-1-2028 | 400,000 | 429,866 |
| Municipal Electric Authority Georgia Plant Vogtle Units 3&4 Project M Series A | | 5.00 | 1-1-2029 | 400,000 | 432,524 |
| Municipal Electric Authority Georgia Plant Vogtle Units 3&4 Project P Series B | | 5.00 | 1-1-2028 | 1,000,000 | 1,069,920 |
| Municipal Electric Authority Georgia Plant Vogtle Units 3&4 Project P Series B | | 5.00 | 1-1-2029 | 910,000 | 974,565 |
| Municipal Electric Authority Georgia Project One Subordinated Bonds Series A | | 5.00 | 1-1-2027 | 1,150,000 | 1,222,287 |
| Municipal Electric Authority Georgia Project One Subordinated Bonds Series A | | 5.00 | 1-1-2028 | 1,270,000 | 1,364,824 |
| Municipal Electric Authority Georgia Project One Subordinated Bonds Series A | | 5.00 | 1-1-2029 | 1,140,000 | 1,240,320 |
| Municipal Electric Authority Georgia Project One Subordinated Bonds Series A | | 5.00 | 1-1-2030 | 1,025,000 | 1,114,737 |
| Municipal Electric Authority Georgia Project One Subordinated Bonds Series A | | 5.00 | 1-1-2031 | 1,385,000 | 1,505,819 |
| | | | | | 125,216,211 |
| | | | | | 133,981,017 |
| Guam: 0.21% | | | | | |
| Airport revenue: 0.03% | | | | | |
| Guam International Airport Authority Revenue Series A %% | | 5.25 | 10-1-2029 | 700,000 | 713,631 |
The accompanying notes are an integral part of these financial statements.
18 | Allspring Strategic Municipal Bond Fund
Portfolio of investments—December 31, 2022 (unaudited)
| | | Interest
rate | Maturity
date | Principal | Value |
| Miscellaneous revenue: 0.10% | | | | | |
| Guam Government Department Education Certificate of Participation Refunding Bonds John F Kennedy High School | | 3.63% | 2-1-2025 | $ 750,000 | $ 727,992 |
| Guam Government Department Education Certificate of Participation Refunding Bonds John F Kennedy High School | | 4.25 | 2-1-2030 | 1,355,000 | 1,316,233 |
| | | | | | 2,044,225 |
| Tax revenue: 0.08% | | | | | |
| Guam Government Business Privilege Tax Refunding Bonds Series F | | 5.00 | 1-1-2030 | 750,000 | 797,518 |
| Guam Government Business Privilege Tax Refunding Bonds Series F | | 5.00 | 1-1-2031 | 750,000 | 801,957 |
| | | | | | 1,599,475 |
| | | | | | 4,357,331 |
| Hawaii: 0.39% | | | | | |
| Health revenue: 0.39% | | | | | |
| Hawaii Department of Budget & Finance Queens Health System Series B (SIFMA Municipal Swap +0.45%) ± | | 4.11 | 7-1-2039 | 7,880,000 | 7,880,000 |
| Illinois: 17.04% | | | | | |
| Airport revenue: 2.66% | | | | | |
| Chicago IL Midway Airport Second Lien Refunding Bonds Series 2013A | | 5.50 | 1-1-2027 | 3,925,000 | 3,929,825 |
| Chicago IL Midway Airport Second Lien Refunding Bonds Series 2014A | | 5.00 | 1-1-2026 | 7,000,000 | 7,091,183 |
| Chicago IL Midway Airport Second Lien Refunding Bonds Series 2014A | | 5.00 | 1-1-2030 | 5,925,000 | 5,974,913 |
| Chicago IL O'Hare International Airport AMT Passenger Facility Charge Refunding Bonds Series B | | 4.00 | 1-1-2029 | 10,955,000 | 10,955,537 |
| Chicago IL O'Hare International Airport AMT Passenger Facility Charge Refunding Bonds Series B | | 5.00 | 1-1-2032 | 5,125,000 | 5,129,247 |
| Chicago IL O'Hare International Airport Customer Facility Charge | | 5.25 | 1-1-2023 | 1,350,000 | 1,350,000 |
| Chicago IL O'Hare International Airport Customer Facility Charge | | 5.25 | 1-1-2024 | 1,665,000 | 1,667,387 |
| Chicago IL O'Hare International Airport Senior Lien Refunding Bonds Series 2013A | | 5.00 | 1-1-2026 | 2,690,000 | 2,690,000 |
| Chicago IL O'Hare International Airport Senior Lien Refunding Bonds Series 2015A | | 5.00 | 1-1-2028 | 10,820,000 | 11,089,207 |
| Chicago IL O'Hare International Airport Senior Lien Refunding Bonds Series 2017D | | 5.00 | 1-1-2025 | 2,450,000 | 2,521,387 |
| Chicago IL O'Hare International Airport Senior Lien Refunding Bonds Series 2022C | | 5.00 | 1-1-2031 | 530,000 | 575,023 |
| Chicago IL O'Hare International Airport Senior Lien Refunding Bonds Series 2022C | | 5.00 | 1-1-2032 | 400,000 | 436,309 |
| Chicago IL O'Hare International Airport Senior Lien Refunding Bonds Series 2022C | | 5.00 | 1-1-2033 | 400,000 | 435,087 |
| Chicago IL O'Hare International Airport Senior Lien Refunding Bonds Series 2022C | | 5.00 | 1-1-2034 | 325,000 | 352,133 |
| | | | | | 54,197,238 |
The accompanying notes are an integral part of these financial statements.
Allspring Strategic Municipal Bond Fund | 19
Portfolio of investments—December 31, 2022 (unaudited)
| | | Interest
rate | Maturity
date | Principal | Value |
| Education revenue: 0.91% | | | | | |
| Illinois Finance Authority Charter School Revenue Series A 144A | | 4.00% | 7-1-2031 | $ 1,735,000 | $ 1,454,315 |
| Illinois Finance Authority Charter School Revenue Series A 144A | | 5.00 | 7-1-2041 | 4,475,000 | 3,562,509 |
| Illinois Finance Authority Revenue Refunding Bonds Bradley University Project Series C | | 5.00 | 8-1-2028 | 1,860,000 | 1,935,860 |
| Southern Illinois University Board of Trustees Housing & Auxiliary Facilities System Series A (BAM Insured) | | 4.00 | 4-1-2028 | 725,000 | 745,672 |
| Southern Illinois University Series A (BAM Insured) | | 5.00 | 4-1-2029 | 675,000 | 729,805 |
| Southern Illinois University Series A (BAM Insured) | | 5.00 | 4-1-2030 | 800,000 | 869,986 |
| Southern Illinois University Series A (BAM Insured) | | 5.00 | 4-1-2031 | 570,000 | 623,496 |
| Southern Illinois University Series A (BAM Insured) | | 5.00 | 4-1-2032 | 500,000 | 546,430 |
| University of Illinois Board of Trustees Auxiliary Facilities System Revenue Refunding Bonds Series 2013A | | 4.00 | 4-1-2030 | 5,000,000 | 5,006,703 |
| University of Illinois Board of Trustees Auxiliary Facilities System Revenue Refunding Bonds Series 2013A | | 5.00 | 4-1-2026 | 3,000,000 | 3,010,712 |
| | | | | | 18,485,488 |
| GO revenue: 7.37% | | | | | |
| Berwyn IL Series A | | 5.00 | 12-1-2028 | 3,000,000 | 3,056,988 |
| Berwyn IL Series A | | 5.00 | 12-1-2029 | 2,345,000 | 2,381,970 |
| Chicago IL Board of Education Dedicated Revenues Series A | | 5.00 | 12-1-2031 | 2,500,000 | 2,561,679 |
| Chicago IL Board of Education Dedicated Revenues Series A | | 5.00 | 12-1-2033 | 5,300,000 | 5,403,770 |
| Chicago IL Board of Education Dedicated Revenues Series A | | 5.00 | 12-1-2034 | 1,500,000 | 1,518,578 |
| Chicago IL Board of Education Unlimited Tax GO Refunding Bonds Series 2018A (AGM Insured) | | 5.00 | 12-1-2024 | 3,000,000 | 3,058,544 |
| Chicago IL CAB City Colleges (NPFGC Insured) ¤ | | 0.00 | 1-1-2024 | 14,800,000 | 14,242,583 |
| Chicago IL CAB City Colleges (NPFGC Insured) ¤ | | 0.00 | 1-1-2027 | 7,720,000 | 6,612,823 |
| Chicago IL Chicago Works Series A %% | | 5.25 | 1-1-2036 | 1,500,000 | 1,564,307 |
| Chicago IL Park District GO Limited Series A | | 5.00 | 1-1-2023 | 800,000 | 800,000 |
| Chicago IL Park District GO Limited Series A | | 5.00 | 1-1-2024 | 550,000 | 559,376 |
| Chicago IL Park District GO Limited Series A | | 5.00 | 1-1-2025 | 625,000 | 642,604 |
| Chicago IL Park District GO Limited Series C | | 5.00 | 1-1-2023 | 1,000,000 | 1,000,000 |
| Chicago IL Park District GO Limited Series C | | 5.00 | 1-1-2024 | 410,000 | 416,989 |
| Chicago IL Park District Harbor Facilities Series D | | 5.00 | 1-1-2023 | 1,175,000 | 1,175,000 |
| Chicago IL Park District Unlimited Tax Series E | | 5.00 | 11-15-2023 | 1,295,000 | 1,313,885 |
| Chicago IL Refunding Bonds Project Series 2003B | | 5.13 | 1-1-2027 | 1,700,000 | 1,731,658 |
| Chicago IL Refunding Bonds Project Series 2003B | | 5.50 | 1-1-2032 | 1,145,000 | 1,169,420 |
| Chicago IL Refunding Bonds Project Series 2015C | | 5.00 | 1-1-2023 | 765,000 | 765,000 |
| Chicago IL Series A | | 5.00 | 1-1-2025 | 2,000,000 | 2,038,452 |
| Chicago IL Series A | | 5.00 | 1-1-2027 | 8,000,000 | 8,278,689 |
| Chicago IL Series A | | 5.00 | 1-1-2028 | 6,125,000 | 6,379,233 |
| Chicago IL Series C | | 5.00 | 1-1-2026 | 970,000 | 996,246 |
| Chicago IL Unrefunded Balance Refunding Bonds Series C | | 5.00 | 1-1-2023 | 1,735,000 | 1,735,000 |
| Cook County IL Community Consolidated School District #15 Limited Tax | | 5.00 | 12-1-2026 | 2,540,000 | 2,705,515 |
| Cook County IL Refunding Bond Series A | | 5.00 | 11-15-2027 | 2,000,000 | 2,164,470 |
| Cook County IL School District #153 Homewood Series A (AGM Insured) ¤ | | 0.00 | 12-15-2023 | 1,225,000 | 1,186,381 |
| Cook County IL School District #227 Rich Township Refunding Bonds | | 3.00 | 12-1-2024 | 965,000 | 966,107 |
The accompanying notes are an integral part of these financial statements.
20 | Allspring Strategic Municipal Bond Fund
Portfolio of investments—December 31, 2022 (unaudited)
| | | Interest
rate | Maturity
date | Principal | Value |
| GO revenue (continued) | | | | | |
| Cook County IL School District #99 Cicero Limited Tax (BAM Insured) | | 5.00% | 12-1-2026 | $ 3,030,000 | $ 3,263,954 |
| Cook County IL School District #99 Cicero Limited Tax (BAM Insured) | | 5.00 | 12-1-2027 | 2,950,000 | 3,222,686 |
| Cook County IL School District #99 Cicero Limited Tax (BAM Insured) | | 5.00 | 12-1-2028 | 2,285,000 | 2,535,183 |
| Cook County IL School District #99 Cicero Refunding Bonds Limited Tax Series B | | 5.00 | 12-1-2024 | 1,000,000 | 1,037,618 |
| Cook County IL School District #99 Cicero Refunding Bonds Limited Tax Series B | | 5.00 | 12-1-2025 | 1,000,000 | 1,057,394 |
| Cook County IL Series A (AGM Insured) | | 5.00 | 11-15-2026 | 3,000,000 | 3,229,148 |
| Cook County IL Series A | | 5.00 | 11-15-2030 | 2,200,000 | 2,348,111 |
| Cook County IL Series A | | 5.00 | 11-15-2033 | 3,850,000 | 4,276,312 |
| Decatur IL Macon County GO Refunding Bonds | | 5.00 | 3-1-2024 | 1,405,000 | 1,410,080 |
| DeKalb & Kane Counties IL Community Unit School District #427 Sycamore Prerefunded Bond Balance CAB (AGM Insured) ¤ | | 0.00 | 1-1-2024 | 455,000 | 441,118 |
| DeKalb & Kane Counties IL Community Unit School District #427 Sycamore Prerefunded Bond Balance CAB (AGM Insured) ¤ | | 0.00 | 1-1-2024 | 2,345,000 | 2,273,455 |
| DeKalb & Kane Counties IL Community Unit School District #427 Sycamore Prerefunded Bond Balance CAB (AGM Insured) ¤ | | 0.00 | 1-1-2024 | 2,830,000 | 2,728,719 |
| Illinois Refunding Bonds Series A | | 5.00 | 10-1-2026 | 3,000,000 | 3,091,016 |
| Illinois Series 2016 | | 5.00 | 11-1-2025 | 5,000,000 | 5,125,315 |
| Illinois Series A | | 5.00 | 4-1-2023 | 3,500,000 | 3,511,349 |
| Kane, Cook & DuPage Counties IL School District #46 Elgin Series 2015A | | 5.00 | 1-1-2028 | 1,555,000 | 1,578,461 |
| Kane, Cook & DuPage Counties IL School District #46 Elgin Series 2015D | | 5.00 | 1-1-2032 | 1,025,000 | 1,037,664 |
| Madison-Macoupin Etc Counties IL Community College District #536 Series A (BAM Insured) | | 5.00 | 11-1-2025 | 1,620,000 | 1,679,676 |
| Madison-Macoupin Etc Counties IL Community College District #536 Series A (BAM Insured) | | 5.00 | 11-1-2026 | 1,410,000 | 1,461,176 |
| Peoria County IL School District #150 Peoria Series A (AGM Insured) | | 4.00 | 12-1-2027 | 1,000,000 | 1,046,685 |
| Peoria County IL School District #150 Peoria Series A (AGM Insured) | | 4.00 | 12-1-2028 | 950,000 | 995,900 |
| Peoria County IL School District #150 Peoria Series A (AGM Insured) | | 4.00 | 12-1-2029 | 4,000,000 | 4,187,554 |
| Waukegan IL Series 2015A (AGM Insured) | | 5.00 | 12-30-2031 | 1,000,000 | 1,041,614 |
| Will County IL Lincoln-Way Community High School District #210 Unrefunded Bond CAB (AGM Insured) ¤ | | 0.00 | 1-1-2025 | 14,385,000 | 13,463,186 |
| Will County IL Lincoln-Way Community High School District #210 Unrefunded Bond CAB (AGM Insured) ¤ | | 0.00 | 1-1-2026 | 8,695,000 | 7,869,998 |
| | | | | | 150,338,639 |
| Health revenue: 0.29% | | | | | |
| Illinois Finance Authority Revenue Bonds Advocate Health Care Network | | 4.00 | 11-1-2030 | 3,000,000 | 3,031,939 |
| Illinois Finance Authority Revenue Bonds Advocate Health Care Network | | 5.00 | 8-1-2038 | 1,520,000 | 1,566,817 |
| Illinois Finance Authority Revenue Bonds Lutheran Life Communities | | 4.00 | 11-1-2024 | 420,000 | 411,165 |
The accompanying notes are an integral part of these financial statements.
Allspring Strategic Municipal Bond Fund | 21
Portfolio of investments—December 31, 2022 (unaudited)
| | | Interest
rate | Maturity
date | Principal | Value |
| Health revenue (continued) | | | | | |
| Illinois Finance Authority Revenue Refunding Bonds Smith Crossing | | 4.00% | 10-15-2025 | $ 295,000 | $ 287,636 |
| Illinois Finance Authority Revenue Refunding Bonds Smith Crossing | | 4.00 | 10-15-2028 | 670,000 | 629,619 |
| | | | | | 5,927,176 |
| Housing revenue: 0.11% | | | | | |
| Illinois Housing Development Authority Homeowner Mortgage Series 2016C | | 2.90 | 8-1-2031 | 1,000,000 | 931,689 |
| Northern Illinois University Auxiliary Facilities System (BAM Insured) | | 5.00 | 10-1-2027 | 350,000 | 373,352 |
| Northern Illinois University Auxiliary Facilities System (BAM Insured) | | 5.00 | 10-1-2029 | 650,000 | 703,123 |
| Northern Illinois University Auxiliary Facilities System (BAM Insured) | | 5.00 | 10-1-2030 | 325,000 | 352,561 |
| | | | | | 2,360,725 |
| Miscellaneous revenue: 1.35% | | | | | |
| Chicago IL Board of Education Dedicated Revenue Series C | | 5.00 | 12-1-2034 | 1,945,000 | 1,964,962 |
| Chicago IL Board of Education Unlimited Tax GO Refunding Bonds Series 2019B | | 5.00 | 12-1-2026 | 2,000,000 | 2,048,029 |
| Chicago IL Board of Education Unlimited Tax GO Refunding Bonds Series 2019B | | 5.00 | 12-1-2027 | 1,625,000 | 1,660,154 |
| Chicago IL Special Assessment Improvement Refunding Bonds Lakeshore East Project 144A | | 3.29 | 12-1-2030 | 350,000 | 305,391 |
| Chicago IL Special Assessment Improvement Refunding Bonds Lakeshore East Project 144A | | 3.38 | 12-1-2031 | 375,000 | 324,025 |
| Chicago IL Special Assessment Improvement Refunding Bonds Lakeshore East Project 144A | | 3.45 | 12-1-2032 | 300,000 | 257,254 |
| Chicago IL Special Assessment Improvement Refunding Bonds Lakeshore East Project 144A | | 3.20 | 12-1-2029 | 325,000 | 286,081 |
| Illinois (AGM Insured) | | 5.00 | 7-1-2023 | 4,875,000 | 4,908,412 |
| Illinois Refunding Bonds | | 5.00 | 2-1-2026 | 2,000,000 | 2,053,189 |
| Illinois Series 2013 | | 5.50 | 7-1-2033 | 4,000,000 | 4,014,179 |
| Illinois Series A | | 5.00 | 11-1-2023 | 8,955,000 | 9,047,909 |
| Illinois Series A | | 5.00 | 12-1-2035 | 650,000 | 653,621 |
| | | | | | 27,523,206 |
| Tax revenue: 3.92% | | | | | |
| Chicago IL Motor Fuel Tax Refunding Bonds | | 5.00 | 1-1-2023 | 2,400,000 | 2,400,000 |
| Cook County IL Sales Tax Revenue | | 5.00 | 11-15-2029 | 1,000,000 | 1,081,246 |
| Cook County IL Sales Tax Revenue Series A | | 5.00 | 11-15-2029 | 675,000 | 755,810 |
| Cook County IL Sales Tax Revenue Series A | | 5.00 | 11-15-2030 | 3,575,000 | 4,043,376 |
| Cook County IL Sales Tax Revenue Series A | | 5.00 | 11-15-2031 | 2,250,000 | 2,509,010 |
| Illinois Regional Transportation Authority Series A (AGM Insured) | | 5.25 | 6-1-2024 | 9,995,000 | 10,310,999 |
| Illinois Regional Transportation Authority Series B | | 2.75 | 6-1-2025 | 5,110,000 | 5,110,000 |
| Illinois Sales Tax Build Illinois Junior Obligation | | 5.00 | 6-15-2025 | 9,025,000 | 9,078,191 |
| Illinois Sales Tax First Series (NPFGC Insured) | | 6.00 | 6-15-2024 | 515,000 | 532,167 |
| Illinois Sales Tax First Series (NPFGC Insured) | | 6.00 | 6-15-2025 | 8,365,000 | 8,808,210 |
| Illinois Sports Facilities Authority Refunding Bonds State Tax Supported | | 5.00 | 6-15-2023 | 3,220,000 | 3,234,425 |
| Illinois Sports Facilities Authority Refunding Bonds State Tax Supported | | 5.00 | 6-15-2024 | 4,135,000 | 4,188,421 |
The accompanying notes are an integral part of these financial statements.
22 | Allspring Strategic Municipal Bond Fund
Portfolio of investments—December 31, 2022 (unaudited)
| | | Interest
rate | Maturity
date | Principal | Value |
| Tax revenue (continued) | | | | | |
| Illinois Sports Facilities Authority Refunding Bonds State Tax Supported (BAM Insured) | | 5.00% | 6-15-2028 | $ 1,500,000 | $ 1,575,425 |
| Illinois Sports Facilities Authority Refunding Bonds State Tax Supported (BAM Insured) | | 5.00 | 6-15-2028 | 1,515,000 | 1,591,180 |
| Illinois Sports Facilities Authority Refunding Bonds State Tax Supported (BAM Insured) | | 5.00 | 6-15-2030 | 2,000,000 | 2,116,547 |
| Illinois Sports Facilities Authority Refunding Bonds State Tax Supported (BAM Insured) | | 5.00 | 6-15-2030 | 3,250,000 | 3,439,388 |
| Illinois Sports Facilities Authority Refunding Bonds State Tax Supported CAB (Ambac Insured) ¤ | | 0.00 | 6-15-2026 | 1,740,000 | 1,533,276 |
| Illinois Sports Facilities Authority State Tax Supported Refunding Bond | | 5.00 | 6-15-2028 | 1,000,000 | 1,014,417 |
| Metropolitan Pier & Exposition Authority CAB McCormick Place Expansion Project Series A (NPFGC Insured) ¤ | | 0.00 | 12-15-2029 | 1,750,000 | 1,327,834 |
| Metropolitan Pier & Exposition Authority CAB Prerefunded Bond (NPFGC Insured) ¤ | | 0.00 | 12-15-2023 | 20,000 | 19,398 |
| Metropolitan Pier & Exposition Authority CAB Unrefunded Bond (NPFGC Insured) ¤ | | 0.00 | 12-15-2023 | 1,105,000 | 1,067,180 |
| Sales Tax Securitization Corporation Second Lien Series 2020A | | 5.00 | 1-1-2028 | 5,000,000 | 5,366,195 |
| Sales Tax Securitization Corporation Series 2017A | | 5.00 | 1-1-2026 | 4,815,000 | 5,078,661 |
| Sales Tax Securitization Corporation Series 2017A | | 5.00 | 1-1-2027 | 1,000,000 | 1,065,942 |
| St. Charles, Kane & DuPage Counties IL | | 4.00 | 1-1-2023 | 855,000 | 855,000 |
| St. Charles, Kane & DuPage Counties IL | | 4.00 | 1-1-2024 | 885,000 | 874,310 |
| St. Charles, Kane & DuPage Counties IL | | 4.00 | 1-1-2025 | 925,000 | 901,019 |
| | | | | | 79,877,627 |
| Water & sewer revenue: 0.43% | | | | | |
| Chicago IL Wastewater Transmission Series B (AGM Insured) | | 5.00 | 1-1-2031 | 3,140,000 | 3,327,317 |
| Chicago IL Waterworks Second Lien | | 5.00 | 11-1-2028 | 2,560,000 | 2,666,854 |
| Chicago IL Waterworks Second Lien Series 2017-2 (AGM Insured) | | 5.00 | 11-1-2030 | 2,620,000 | 2,808,782 |
| | | | | | 8,802,953 |
| | | | | | 347,513,052 |
| Indiana: 2.11% | | | | | |
| Education revenue: 0.01% | | | | | |
| Indiana Finance Authority Environmental Facilities Revenue Refunding Bonds Kipp Indianapolis Incorporated Project Series A | | 4.00 | 7-1-2030 | 210,000 | 196,886 |
| Industrial development revenue: 0.53% | | | | | |
| Illinois Finance Authority Tax-Exempt Private Activity Bonds Ohio River Bridges East End Crossing Project Series 2013A | | 5.00 | 7-1-2044 | 5,550,000 | 5,591,467 |
| Indiana Finance Authority Tax-Exempt Private Activity Bonds Ohio River Bridges East End Crossing Partners LLC Project Series A-P3 | | 5.00 | 7-1-2048 | 5,215,000 | 5,253,964 |
| | | | | | 10,845,431 |
| Miscellaneous revenue: 1.07% | | | | | |
| Indiana Bond Bank Revenue CAB Hamilton Company Projects Series B ¤ | | 0.00 | 7-15-2026 | 735,000 | 656,079 |
The accompanying notes are an integral part of these financial statements.
Allspring Strategic Municipal Bond Fund | 23
Portfolio of investments—December 31, 2022 (unaudited)
| | | Interest
rate | Maturity
date | Principal | Value |
| Miscellaneous revenue (continued) | | | | | |
| Indiana Bond Bank Revenue CAB Hamilton Company Projects Series B ¤ | | 0.00% | 7-15-2027 | $ 630,000 | $ 543,185 |
| Indianapolis Industry Local Public Improvement Bond Bank Series A | | 5.00 | 6-1-2028 | 5,710,000 | 6,253,985 |
| Indianapolis Industry Local Public Improvement Bond Bank Series A | | 5.00 | 6-1-2029 | 6,600,000 | 7,307,717 |
| Indianapolis Industry Local Public Improvement Bond Bank Series A | | 5.00 | 6-1-2030 | 6,300,000 | 7,039,806 |
| | | | | | 21,800,772 |
| Utilities revenue: 0.50% | | | | | |
| Indiana Finance Authority Environmental Facilities Revenue Refunding Bonds Indianapolis Land Power and Light Company Project Series A øø | | 0.75 | 12-1-2038 | 3,000,000 | 2,602,436 |
| Indiana Finance Authority Midwestern Disaster Relief Revenue Various Ohio Valley Electric Corporation Project Series 2012A | | 4.25 | 11-1-2030 | 6,000,000 | 5,790,881 |
| Indiana Finance Authority Midwestern Disaster Relief Revenue Various Ohio Valley Electric Corporation Project Series 2012B | | 3.00 | 11-1-2030 | 2,000,000 | 1,768,761 |
| | | | | | 10,162,078 |
| | | | | | 43,005,167 |
| Iowa: 0.91% | | | | | |
| Education revenue: 0.13% | | | | | |
| Iowa Student Loan Liquidity Corporation Senior Revenue Bonds AMT Series B | | 5.00 | 12-1-2025 | 1,295,000 | 1,349,832 |
| Iowa Student Loan Liquidity Corporation Senior Revenue Bonds AMT Series B | | 5.00 | 12-1-2026 | 1,215,000 | 1,283,018 |
| | | | | | 2,632,850 |
| GO revenue: 0.45% | | | | | |
| Coralville IA Taxable-Annual Appropriation Series 2018B | | 4.40 | 5-1-2023 | 410,000 | 408,102 |
| Coralville IA Taxable-Annual Appropriation Series 2018E | | 7.00 | 6-1-2025 | 8,485,000 | 8,694,554 |
| | | | | | 9,102,656 |
| Utilities revenue: 0.25% | | | | | |
| Iowa Gas Project Public Expenditure and Financial Accountability Incorporated | | 5.00 | 9-1-2049 | 4,975,000 | 5,093,696 |
| Water & sewer revenue: 0.08% | | | | | |
| Xenia IA Rural Water District Capital Loan Notes | | 5.00 | 12-1-2031 | 1,615,000 | 1,758,404 |
| | | | | | 18,587,606 |
| Kansas: 0.47% | | | | | |
| Health revenue: 0.05% | | | | | |
| Wichita KS Health Care Facilities Presbyterian Manors Obligated Group | | 5.00 | 5-15-2026 | 1,105,000 | 1,094,502 |
The accompanying notes are an integral part of these financial statements.
24 | Allspring Strategic Municipal Bond Fund
Portfolio of investments—December 31, 2022 (unaudited)
| | | Interest
rate | Maturity
date | Principal | Value |
| Tax revenue: 0.42% | | | | | |
| Wyandotte County & Kansas City KS Special Obligation Improvement & Refunding Bonds Plaza Redevelopment Project | | 4.00% | 12-1-2028 | $ 325,000 | $ 298,881 |
| Wyandotte County & Kansas City KS Special Obligation Vacation Village Project Area 4 Major Multi-Sport Athletic Complex Project CAB 144A¤ | | 0.00 | 9-1-2034 | 23,570,000 | 8,219,863 |
| | | | | | 8,518,744 |
| | | | | | 9,613,246 |
| Kentucky: 3.27% | | | | | |
| Education revenue: 0.16% | | | | | |
| Columbia KY Educational Development Lindsey Wilson College Incorporated Project | | 3.00 | 12-1-2024 | 1,585,000 | 1,563,081 |
| Columbia KY Educational Development Lindsey Wilson College Incorporated Project | | 4.00 | 12-1-2029 | 570,000 | 548,850 |
| Columbia KY Educational Development Lindsey Wilson College Incorporated Project | | 4.00 | 12-1-2030 | 590,000 | 563,004 |
| Columbia KY Educational Development Lindsey Wilson College Incorporated Project | | 4.00 | 12-1-2031 | 615,000 | 582,412 |
| | | | | | 3,257,347 |
| Health revenue: 0.33% | | | | | |
| Kentucky EDFA Health System Revenue Norton Healthcare Incorporate Series B (NPFGC Insured) ¤ | | 0.00 | 10-1-2026 | 3,000,000 | 2,620,782 |
| Kentucky EDFA Healthcare Facilities Rosedale Green Project | | 5.00 | 11-15-2025 | 945,000 | 918,712 |
| Louisville & Jefferson Counties KY Metro Health System Revenue Norton Healthcare Incorporated Series C | | 5.00 | 10-1-2047 | 3,000,000 | 3,149,438 |
| | | | | | 6,688,932 |
| Industrial development revenue: 0.12% | | | | | |
| Boone County KY Poll Control Duke Energy Kentucky Incorporated Series A | | 3.70 | 8-1-2027 | 2,500,000 | 2,462,721 |
| Miscellaneous revenue: 0.05% | | | | | |
| Kentucky State University Certificate of Participation (BAM Insured) | | 3.00 | 11-1-2032 | 320,000 | 304,656 |
| Kentucky State University Certificate of Participation (BAM Insured) | | 4.00 | 11-1-2033 | 130,000 | 137,724 |
| Kentucky State University Certificate of Participation (BAM Insured) | | 4.00 | 11-1-2034 | 130,000 | 136,697 |
| Kentucky State University Certificate of Participation (BAM Insured) | | 5.00 | 11-1-2029 | 200,000 | 225,400 |
| Kentucky State University Certificate of Participation (BAM Insured) | | 5.00 | 11-1-2030 | 175,000 | 200,050 |
| | | | | | 1,004,527 |
| Utilities revenue: 2.61% | | | | | |
| Kentucky Public Energy Authority Gas Supply Series A-1 | | 4.00 | 12-1-2049 | 3,755,000 | 3,720,343 |
| Kentucky Public Energy Authority Gas Supply Series B | | 4.00 | 1-1-2049 | 14,725,000 | 14,617,478 |
| Kentucky Public Energy Authority Gas Supply Series C | | 4.00 | 12-1-2049 | 4,775,000 | 4,730,929 |
| Kentucky Public Energy Authority Gas Supply Series C-1 | | 4.00 | 2-1-2050 | 14,960,000 | 14,662,794 |
The accompanying notes are an integral part of these financial statements.
Allspring Strategic Municipal Bond Fund | 25
Portfolio of investments—December 31, 2022 (unaudited)
| | | Interest
rate | Maturity
date | Principal | Value |
| Utilities revenue (continued) | | | | | |
| Louisville & Jefferson Counties KY Metro Government PCR Series B | | 1.35% | 11-1-2027 | $ 2,000,000 | $ 1,755,229 |
| Trimble County KY PCR Bonds Louisville Gas and Electric Company Project Series 2001A | | 0.63 | 9-1-2026 | 3,250,000 | 2,900,721 |
| Trimble County KY PCR Bonds Louisville Gas and Electric Company Project Series 2001B | | 1.35 | 11-1-2027 | 6,200,000 | 5,527,807 |
| Trimble County KY PCR Bonds Louisville Gas and Electric Company Project Series 2016A | | 1.30 | 9-1-2044 | 6,250,000 | 5,272,859 |
| | | | | | 53,188,160 |
| | | | | | 66,601,687 |
| Louisiana: 1.41% | | | | | |
| Airport revenue: 0.22% | | | | | |
| New Orleans LA Aviation Board General North Terminal Project Series A | | 5.00 | 1-1-2032 | 1,000,000 | 1,036,053 |
| New Orleans LA Aviation Board Gulf Opportunity Zone Customer Facility Charges Revenue Refunding Bonds Consolidated Rental Car Project (AGM Insured) | | 5.00 | 1-1-2031 | 1,250,000 | 1,352,474 |
| New Orleans LA Aviation Board Gulf Opportunity Zone Customer Facility Charges Revenue Refunding Bonds Consolidated Rental Car Project (AGM Insured) | | 5.00 | 1-1-2032 | 2,000,000 | 2,160,189 |
| | | | | | 4,548,716 |
| Industrial development revenue: 0.69% | | | | | |
| St. John the Baptist Parish LA Revenue Refunding Bonds Marathon Oil Corporation Project Series 2017A-3 | | 2.20 | 6-1-2037 | 7,000,000 | 6,442,454 |
| St. John the Baptist Parish LA Revenue Refunding Bonds Marathon Oil Corporation Project Series 2017B-2 | | 2.38 | 6-1-2037 | 8,330,000 | 7,700,291 |
| | | | | | 14,142,745 |
| Miscellaneous revenue: 0.15% | | | | | |
| Louisiana Local Government Environmental Facilities and CDA Jefferson Parish Gomesa Project 144Aøø | | 4.00 | 11-1-2044 | 1,380,000 | 1,059,021 |
| Louisiana State GO Series A | | 5.00 | 2-1-2027 | 2,000,000 | 2,040,566 |
| | | | | | 3,099,587 |
| Water & sewer revenue: 0.35% | | | | | |
| East Baton Rouge LA Refunding Bonds Multi Modal Series A | | 1.30 | 2-1-2041 | 3,500,000 | 3,006,014 |
| Greater Ouachita Water Company Incorporated Louisiana Waterworks and Sewer System Refunding Bonds (BAM Insured) | | 3.00 | 9-1-2023 | 250,000 | 249,765 |
| Greater Ouachita Water Company Incorporated Louisiana Waterworks and Sewer System Refunding Bonds (BAM Insured) | | 5.00 | 9-1-2024 | 460,000 | 475,300 |
| Greater Ouachita Water Company Incorporated Louisiana Waterworks and Sewer System Refunding Bonds (BAM Insured) | | 5.00 | 9-1-2025 | 510,000 | 538,206 |
| New Orleans LA Sewage Service Revenue Series B | | 5.00 | 6-1-2026 | 350,000 | 372,479 |
| New Orleans LA Sewage Service Revenue Series B | | 5.00 | 6-1-2027 | 600,000 | 648,707 |
| New Orleans LA Sewage Service Revenue Series B | | 5.00 | 6-1-2028 | 400,000 | 438,316 |
The accompanying notes are an integral part of these financial statements.
26 | Allspring Strategic Municipal Bond Fund
Portfolio of investments—December 31, 2022 (unaudited)
| | | Interest
rate | Maturity
date | Principal | Value |
| Water & sewer revenue (continued) | | | | | |
| New Orleans LA Sewage Service Revenue Series B | | 5.00% | 6-1-2029 | $ 600,000 | $ 663,604 |
| New Orleans LA Sewage Service Revenue Series B | | 5.00 | 6-1-2030 | 600,000 | 668,783 |
| | | | | | 7,061,174 |
| | | | | | 28,852,222 |
| Maine: 0.13% | | | | | |
| Health revenue: 0.13% | | | | | |
| Maine Health & Higher Educational Facilities Authority Series C | | 5.00 | 7-1-2039 | 1,865,000 | 1,943,479 |
| Maine HEFA | | 5.00 | 7-1-2027 | 180,000 | 197,407 |
| Maine HEFA | | 5.00 | 7-1-2027 | 570,000 | 611,884 |
| | | | | | 2,752,770 |
| Maryland: 1.82% | | | | | |
| Education revenue: 0.10% | | | | | |
| Maryland Health and HEFAR Stevenson University Series A | | 5.00 | 6-1-2029 | 300,000 | 319,782 |
| Maryland Health and HEFAR Stevenson University Series A | | 5.00 | 6-1-2031 | 350,000 | 376,691 |
| Maryland Health and HEFAR Stevenson University Series A | | 5.00 | 6-1-2033 | 425,000 | 452,597 |
| Prince George's County MD Chesapeake Lighthouse Charter School Project Series A | | 5.00 | 8-1-2026 | 1,005,000 | 997,832 |
| | | | | | 2,146,902 |
| Health revenue: 0.09% | | | | | |
| Maryland Health and HEFAR Adventist Healthcare | | 5.00 | 1-1-2026 | 495,000 | 511,927 |
| Maryland Health and HEFAR Adventist Healthcare | | 5.00 | 1-1-2027 | 430,000 | 448,522 |
| Maryland Health and HEFAR Adventist Healthcare | | 5.00 | 1-1-2028 | 300,000 | 315,078 |
| Maryland Health and HEFAR Adventist Healthcare | | 5.00 | 1-1-2029 | 290,000 | 306,170 |
| Maryland Health and HEFAR Adventist Healthcare | | 5.00 | 1-1-2030 | 285,000 | 302,164 |
| | | | | | 1,883,861 |
| Housing revenue: 1.03% | | | | | |
| Maryland CDA Department of Housing & Community Multifamily Development Overlook Manor Townhouses Series C | | 3.00 | 4-1-2024 | 4,600,000 | 4,537,977 |
| Maryland CDA Department of Housing & Community Multifamily Development Windsor Valley III Apartments Series G (FHA Insured) | | 1.05 | 12-1-2023 | 11,000,000 | 10,652,165 |
| Maryland CDA Department of Housing & Community Multifamily Development Woodside Gardens Series A 144A | | 1.33 | 1-1-2024 | 6,000,000 | 5,802,893 |
| | | | | | 20,993,035 |
| Tax revenue: 0.46% | | | | | |
| Maryland Department of Transportation Consolidated 3rd Issue | | 4.00 | 12-15-2027 | 9,260,000 | 9,374,995 |
| Transportation revenue: 0.14% | | | | | |
| Maryland Economic Development Corporation Private Activity Green Bond Purple Line Light Rail Transit Partners LLC Series A-P3 | | 5.00 | 11-12-2028 | 2,750,000 | 2,814,486 |
| | | | | | 37,213,279 |
The accompanying notes are an integral part of these financial statements.
Allspring Strategic Municipal Bond Fund | 27
Portfolio of investments—December 31, 2022 (unaudited)
| | | Interest
rate | Maturity
date | Principal | Value |
| Massachusetts: 2.77% | | | | | |
| Airport revenue: 0.44% | | | | | |
| Massachusetts Port Authority Revenue AMT Series E | | 5.00% | 7-1-2031 | $ 1,000,000 | $ 1,102,485 |
| Massachusetts Port Authority Revenue AMT Series E | | 5.00 | 7-1-2032 | 1,500,000 | 1,646,949 |
| Massachusetts Port Authority Revenue AMT Series E | | 5.00 | 7-1-2033 | 3,000,000 | 3,281,087 |
| Massachusetts Port Authority Revenue AMT Series E | | 5.00 | 7-1-2034 | 2,615,000 | 2,837,120 |
| | | | | | 8,867,641 |
| Education revenue: 0.38% | | | | | |
| Lowell MA Collegiate Charter School Revenue | | 4.00 | 6-15-2024 | 215,000 | 213,209 |
| Lowell MA Collegiate Charter School Revenue | | 5.00 | 6-15-2029 | 490,000 | 494,615 |
| Massachusetts Development Finance Agency Lasell University Issue | | 4.00 | 7-1-2029 | 340,000 | 321,348 |
| Massachusetts Development Finance Agency Lasell University Issue | | 4.00 | 7-1-2030 | 355,000 | 331,776 |
| Massachusetts Development Finance Agency Lasell University Issue | | 4.00 | 7-1-2031 | 370,000 | 341,748 |
| Massachusetts Development Finance Agency Sabis International Charter School | | 5.00 | 4-15-2025 | 630,000 | 636,245 |
| Massachusetts Educational Financing Authority Education Loan Revenue AMT Issue Lien Senior Series 2020B | | 5.00 | 7-1-2026 | 1,000,000 | 1,048,793 |
| Massachusetts Educational Financing Authority Education Loan Revenue AMT Issue Lien Senior Series 2020B | | 5.00 | 7-1-2027 | 1,500,000 | 1,591,530 |
| Massachusetts Educational Financing Authority Education Loan Revenue AMT Issue Lien Senior Series 2020B | | 5.00 | 7-1-2028 | 1,250,000 | 1,332,375 |
| Massachusetts Educational Financing Authority Education Loan Revenue AMT Issue Lien Senior Series 2020B | | 5.00 | 7-1-2029 | 1,400,000 | 1,498,348 |
| | | | | | 7,809,987 |
| Health revenue: 0.97% | | | | | |
| Massachusetts Development Finance Agency Linden Ponds Incorporated Facility 144A | | 4.00 | 11-15-2023 | 310,000 | 309,286 |
| Massachusetts Development Finance Agency Partners Healthcare System Series S-3 (SIFMA Municipal Swap +0.50%) ± | | 4.16 | 7-1-2038 | 14,870,000 | 14,865,606 |
| Massachusetts Development Finance Agency Revenue Milford Regional Medical Center Series G 144A | | 5.00 | 7-15-2026 | 150,000 | 155,124 |
| Massachusetts Development Finance Agency Revenue Milford Regional Medical Center Series G 144A | | 5.00 | 7-15-2027 | 160,000 | 166,504 |
| Massachusetts Development Finance Agency Revenue Milford Regional Medical Center Series G 144A | | 5.00 | 7-15-2028 | 175,000 | 183,035 |
| Massachusetts Development Finance Agency Revenue Milford Regional Medical Center Series G 144A | | 5.00 | 7-15-2029 | 300,000 | 314,974 |
| Massachusetts Development Finance Agency Revenue Milford Regional Medical Center Series G 144A | | 5.00 | 7-15-2030 | 320,000 | 336,866 |
| Massachusetts Development Finance Agency Revenue Milford Regional Medical Center Series G 144A | | 5.00 | 7-15-2031 | 350,000 | 359,253 |
| Massachusetts Development Finance Agency Revenue Milford Regional Medical Center Series G 144A | | 5.00 | 7-15-2032 | 400,000 | 407,035 |
| Massachusetts Development Finance Authority Revenue Bonds Series 2019-T1 (SIFMA Municipal Swap +0.60%) 144A± | | 4.26 | 7-1-2049 | 2,650,000 | 2,612,450 |
| | | | | | 19,710,133 |
The accompanying notes are an integral part of these financial statements.
28 | Allspring Strategic Municipal Bond Fund
Portfolio of investments—December 31, 2022 (unaudited)
| | | Interest
rate | Maturity
date | Principal | Value |
| Miscellaneous revenue: 0.98% | | | | | |
| Massachusetts Water Pollution Abatement Trust Revolving Fund Series 17A | | 5.00% | 2-1-2031 | $10,000,000 | $ 10,013,955 |
| Massachusetts Water Pollution Abatement Trust Revolving Fund Series 17A | | 5.00 | 2-1-2032 | 10,000,000 | 10,013,955 |
| | | | | | 20,027,910 |
| | | | | | 56,415,671 |
| Michigan: 2.03% | | | | | |
| Airport revenue: 0.20% | | | | | |
| Wayne County MI Airport Authority AMT Detroit Metropolitan Airport Series 2015F | | 5.00 | 12-1-2030 | 4,000,000 | 4,138,778 |
| Education revenue: 0.25% | | | | | |
| Lake Superior State University Board of Trustees (AGM Insured) | | 4.00 | 11-15-2029 | 1,220,000 | 1,271,813 |
| Lake Superior State University Board of Trustees (AGM Insured) | | 4.00 | 11-15-2030 | 405,000 | 425,381 |
| Lake Superior State University Board of Trustees (AGM Insured) | | 4.00 | 11-15-2031 | 400,000 | 418,413 |
| Michigan Finance Authority Limited Obligation Refunding Bonds Higher Education College Creative Studies Project | | 5.00 | 12-1-2026 | 840,000 | 846,078 |
| Michigan Finance Authority Limited Obligation Refunding Bonds Higher Education College Creative Studies Project | | 5.00 | 12-1-2027 | 585,000 | 589,199 |
| Michigan Finance Authority Limited Obligation Refunding Bonds Higher Education College Creative Studies Project | | 5.00 | 12-1-2028 | 535,000 | 538,823 |
| Michigan Finance Authority Limited Obligation Refunding Bonds Higher Education College Creative Studies Project | | 5.00 | 12-1-2029 | 590,000 | 594,439 |
| Michigan Finance Authority Limited Obligation Refunding Bonds Higher Education College Creative Studies Project | | 5.00 | 12-1-2030 | 400,000 | 402,882 |
| Michigan Finance Authority Limited Obligation Refunding Bonds Public School Academy Cesar Chavez Academy Project | | 3.25 | 2-1-2024 | 90,000 | 88,562 |
| | | | | | 5,175,590 |
| GO revenue: 0.10% | | | | | |
| Ingham County MI Williamston Community Schools Series A (Qualified School Board Loan Fund Insured) | | 4.00 | 5-1-2024 | 1,025,000 | 1,038,402 |
| Ingham County MI Williamston Community Schools Series A (Qualified School Board Loan Fund Insured) | | 4.00 | 5-1-2025 | 1,000,000 | 1,026,829 |
| | | | | | 2,065,231 |
| Health revenue: 0.07% | | | | | |
| Kalamazoo MI Economic Development Corporation Revenue Limited Obligation Heritage Community | | 2.88 | 5-15-2026 | 1,520,000 | 1,424,710 |
| Industrial development revenue: 0.10% | | | | | |
| Michigan Strategic Fund Limited Obligation Revenue Graphic Packaging International LLC | | 4.00 | 10-1-2061 | 2,000,000 | 1,929,747 |
| Miscellaneous revenue: 0.62% | | | | | |
| Michigan Finance Authority Detroit Recovery Project Series 2014F | | 3.88 | 10-1-2023 | 2,500,000 | 2,493,011 |
The accompanying notes are an integral part of these financial statements.
Allspring Strategic Municipal Bond Fund | 29
Portfolio of investments—December 31, 2022 (unaudited)
| | | Interest
rate | Maturity
date | Principal | Value |
| Miscellaneous revenue (continued) | | | | | |
| Michigan Finance Authority Local Government Loan Program City of Detroit Financial Recovery Refunding Bonds Series F | | 4.50% | 10-1-2029 | $ 5,685,000 | $ 5,698,635 |
| Michigan Finance Authority Senior Lien Distributable State Aid | | 5.00 | 11-1-2028 | 865,000 | 965,347 |
| Michigan Finance Authority Senior Lien Distributable State Aid | | 5.00 | 11-1-2029 | 1,500,000 | 1,672,544 |
| Michigan Municipal Bond Authority Local Government Loan Program Series C (Ambac Insured) | | 5.00 | 5-1-2023 | 710,000 | 710,133 |
| Michigan Public Educational Facilities Authority Chandler Park Academy Project | | 6.35 | 11-1-2028 | 1,005,000 | 1,005,659 |
| | | | | | 12,545,329 |
| Tax revenue: 0.15% | | | | | |
| Michigan Finance Authority Series 2014B | | 5.00 | 7-1-2032 | 3,000,000 | 3,030,537 |
| Water & sewer revenue: 0.54% | | | | | |
| Michigan Financial Authority Great Lakes Water Authority Series C-3 (AGM Insured) | | 5.00 | 7-1-2031 | 3,000,000 | 3,081,312 |
| Michigan Financial Authority Local Government Loan Program Series D-1 (AGM Insured) | | 5.00 | 7-1-2023 | 2,000,000 | 2,017,675 |
| Michigan Financial Authority Local Government Loan Program Series D-6 (NPFGC Insured) | | 5.00 | 7-1-2023 | 3,670,000 | 3,702,434 |
| Michigan Financial Authority Local Government Loan Program Series D-6 (NPFGC Insured) | | 5.00 | 7-1-2024 | 2,130,000 | 2,191,501 |
| | | | | | 10,992,922 |
| | | | | | 41,302,844 |
| Minnesota: 1.32% | | | | | |
| Education revenue: 0.58% | | | | | |
| Cologne MN Charter School Lease Academy Project Series 2014A | | 4.00 | 7-1-2023 | 260,000 | 259,323 |
| Minneapolis MN Charter School Lease Revenue Northeast College Preparatory Project | | 5.00 | 7-1-2040 | 875,000 | 768,942 |
| Minnesota State HEFAR Refunding Bonds St. Catherine University Series A | | 5.00 | 10-1-2024 | 545,000 | 559,464 |
| Minnesota State HEFAR Refunding Bonds St. Catherine University Series A | | 5.00 | 10-1-2027 | 1,035,000 | 1,103,122 |
| Minnesota State HEFAR Refunding Bonds St. Catherine University Series A | | 5.00 | 10-1-2029 | 660,000 | 707,796 |
| Ramsey MN Charter School PACT Project Series 2022A | | 5.00 | 6-1-2032 | 6,500,000 | 6,333,208 |
| St. Paul MN Housing & RDA Charter School Hmong College Preparatory Academy Project Series A | | 5.00 | 9-1-2026 | 815,000 | 816,464 |
| Woodbury MN Charter School Woodbury Leadership Academy Project Series A | | 4.00 | 7-1-2031 | 690,000 | 630,624 |
| Woodbury MN Charter School Woodbury Leadership Academy Project Series A | | 4.00 | 7-1-2041 | 850,000 | 672,109 |
| | | | | | 11,851,052 |
| Health revenue: 0.26% | | | | | |
| Shakopee MN Senior Housing Revenue Benedictine Living Community LLC Project 144A | | 5.85 | 11-1-2058 | 5,455,000 | 5,360,119 |
The accompanying notes are an integral part of these financial statements.
30 | Allspring Strategic Municipal Bond Fund
Portfolio of investments—December 31, 2022 (unaudited)
| | | Interest
rate | Maturity
date | Principal | Value |
| Utilities revenue: 0.48% | | | | | |
| Minnesota Municipal Gas Agency Commodity Supply Revenue Bonds (U.S. SOFR +1.00%)(Royal Bank of Canada LIQ) ± | | 3.88% | 12-1-2052 | $10,000,000 | $ 9,645,309 |
| | | | | | 26,856,480 |
| Mississippi: 0.54% | | | | | |
| GO revenue: 0.18% | | | | | |
| Mississippi Development Bank Special Obligation Gulfport Mississippi Public Improvement Project | | 4.00 | 9-1-2029 | 620,000 | 640,555 |
| Mississippi Development Bank Special Obligation Gulfport Mississippi Public Improvement Project | | 4.00 | 9-1-2030 | 565,000 | 582,957 |
| Mississippi Development Bank Special Obligation Gulfport Mississippi Public Improvement Project | | 4.00 | 9-1-2031 | 400,000 | 411,089 |
| Mississippi Development Bank Special Obligation Gulfport Mississippi Public Improvement Project | | 4.00 | 9-1-2032 | 435,000 | 442,606 |
| Mississippi Development Bank Special Obligation Gulfport Mississippi Public Improvement Project | | 5.00 | 9-1-2024 | 355,000 | 365,933 |
| Mississippi Development Bank Special Obligation Gulfport Mississippi Public Improvement Project | | 5.00 | 9-1-2025 | 255,000 | 267,766 |
| Mississippi Development Bank Special Obligation Gulfport Mississippi Public Improvement Project | | 5.00 | 9-1-2026 | 225,000 | 240,440 |
| Mississippi Development Bank Special Obligation Gulfport Mississippi Public Improvement Project | | 5.00 | 9-1-2027 | 385,000 | 418,047 |
| Mississippi Development Bank Special Obligation Gulfport Mississippi Public Improvement Project | | 5.00 | 9-1-2028 | 315,000 | 347,295 |
| | | | | | 3,716,688 |
| Health revenue: 0.36% | | | | | |
| Mississippi Hospital Equipment & Facilities Authority Baptist Memorial Health Care Corporation Series A-1 | | 5.00 | 9-1-2044 | 3,000,000 | 3,107,171 |
| Mississippi Hospital Equipment & Facilities Authority North Mississippi Health Services Series II | | 5.00 | 10-1-2040 | 3,930,000 | 4,111,934 |
| | | | | | 7,219,105 |
| | | | | | 10,935,793 |
| Missouri: 3.19% | | | | | |
| Education revenue: 0.40% | | | | | |
| Missouri State HEFAR University Health Science | | 5.00 | 10-1-2026 | 925,000 | 976,388 |
| Missouri State HEFAR University Health Science | | 5.00 | 10-1-2027 | 975,000 | 1,040,052 |
| Missouri State HEFAR University Health Science | | 5.00 | 10-1-2028 | 1,025,000 | 1,102,358 |
| Missouri State HEFAR Webster University Project | | 5.00 | 4-1-2023 | 1,050,000 | 1,051,236 |
| Missouri State HEFAR Webster University Project | | 5.00 | 4-1-2024 | 2,820,000 | 2,837,664 |
| Missouri State HEFAR Webster University Project | | 5.00 | 4-1-2025 | 600,000 | 606,288 |
| Missouri State HEFAR Webster University Project | | 5.00 | 4-1-2026 | 500,000 | 506,977 |
| | | | | | 8,120,963 |
| Health revenue: 1.24% | | | | | |
| Missouri HEFAR Barnes-Jewish Christian Health System Series C | | 5.00 | 5-1-2052 | 18,000,000 | 19,671,984 |
| Missouri HEFAR St. Lukes Health System Incorporated | | 5.00 | 11-15-2030 | 5,425,000 | 5,719,928 |
| | | | | | 25,391,912 |
The accompanying notes are an integral part of these financial statements.
Allspring Strategic Municipal Bond Fund | 31
Portfolio of investments—December 31, 2022 (unaudited)
| | | Interest
rate | Maturity
date | Principal | Value |
| Housing revenue: 0.42% | | | | | |
| Missouri Southern State University Auxiliary Enterprise Revenue System | | 3.00% | 10-1-2026 | $ 720,000 | $ 677,921 |
| Missouri Southern State University Auxiliary Enterprise Revenue System | | 4.00 | 10-1-2031 | 1,000,000 | 907,302 |
| Port Authority of Kansas City MFHR Bonds Series 2022A (Department of Housing and Urban Development Insured) | | 1.50 | 5-1-2024 | 7,000,000 | 6,950,302 |
| | | | | | 8,535,525 |
| Miscellaneous revenue: 0.90% | | | | | |
| Kansas City MO IDA International Airport Terminal Modernization Project Series B | | 5.00 | 3-1-2028 | 3,000,000 | 3,172,357 |
| Kansas City MO IDA International Airport Terminal Modernization Project Series B | | 5.00 | 3-1-2030 | 2,000,000 | 2,127,781 |
| Missouri Public Utilities Commission Interim Construction Notes | | 0.75 | 8-1-2023 | 10,000,000 | 9,804,751 |
| Platte County MO Riverside-Quindaro Bend Levee District Project L-385 | | 4.00 | 3-1-2023 | 1,010,000 | 1,010,237 |
| Platte County MO Riverside-Quindaro Bend Levee District Project L-385 | | 5.00 | 3-1-2024 | 1,000,000 | 1,014,771 |
| Platte County MO Riverside-Quindaro Bend Levee District Project L-385 | | 5.00 | 3-1-2025 | 1,105,000 | 1,129,392 |
| | | | | | 18,259,289 |
| Tax revenue: 0.10% | | | | | |
| Branson MO IDA Branson Shoppes Series A | | 4.00 | 11-1-2023 | 750,000 | 744,051 |
| Hanley Road Corridor Transportation Development District Missouri Transportation Sales Tax Revenue Refunding Bonds | | 1.63 | 10-1-2033 | 345,000 | 342,806 |
| Richmond Heights MO Francis Place Redevelopment Project | | 5.63 | 11-1-2025 | 880,000 | 857,021 |
| | | | | | 1,943,878 |
| Water & sewer revenue: 0.13% | | | | | |
| Kansas City MO Sanitation Sewer System Revenue Series B | | 5.00 | 1-1-2023 | 805,000 | 805,000 |
| Kansas City MO Sanitation Sewer System Revenue Series B | | 5.00 | 1-1-2025 | 810,000 | 845,037 |
| Kansas City MO Sanitation Sewer System Revenue Series B | | 5.00 | 1-1-2027 | 700,000 | 761,476 |
| Kansas City MO Sanitation Sewer System Revenue Series B | | 5.00 | 1-1-2028 | 275,000 | 304,723 |
| | | | | | 2,716,236 |
| | | | | | 64,967,803 |
| Nebraska: 0.56% | | | | | |
| Airport revenue: 0.04% | | | | | |
| Lincoln NE Airport Authority | | 5.00 | 7-1-2029 | 835,000 | 903,145 |
| Education revenue: 0.11% | | | | | |
| Douglas County NE Educational Facilities Creighton University (SIFMA Municipal Swap +0.53%) ± | | 4.19 | 7-1-2035 | 2,230,000 | 2,195,397 |
The accompanying notes are an integral part of these financial statements.
32 | Allspring Strategic Municipal Bond Fund
Portfolio of investments—December 31, 2022 (unaudited)
| | | Interest
rate | Maturity
date | Principal | Value |
| Utilities revenue: 0.41% | | | | | |
| Central Plains Energy Nebraska Gas Project #3 | | 5.00% | 9-1-2025 | $ 3,290,000 | $ 3,381,693 |
| Central Plains Energy Nebraska Gas Project #3 | | 5.00 | 9-1-2026 | 3,750,000 | 3,891,243 |
| Central Plains Energy Nebraska Gas Project #3 | | 5.00 | 9-1-2027 | 1,000,000 | 1,045,942 |
| | | | | | 8,318,878 |
| | | | | | 11,417,420 |
| Nevada: 0.12% | | | | | |
| Miscellaneous revenue: 0.10% | | | | | |
| Las Vegas NV Special Improvement District #816 Local Improvement Summerlin Village 22 | | 2.00 | 6-1-2024 | 150,000 | 144,465 |
| Las Vegas NV Special Improvement District #816 Local Improvement Summerlin Village 22 | | 2.00 | 6-1-2025 | 180,000 | 168,558 |
| Las Vegas NV Special Improvement District #816 Local Improvement Summerlin Village 22 | | 2.00 | 6-1-2026 | 225,000 | 204,543 |
| Las Vegas NV Special Improvement District #816 Local Improvement Summerlin Village 22 | | 2.25 | 6-1-2027 | 250,000 | 222,637 |
| Las Vegas NV Special Improvement District #816 Local Improvement Summerlin Village 22 | | 2.50 | 6-1-2028 | 250,000 | 218,828 |
| Las Vegas NV Special Improvement District #816 Local Improvement Summerlin Village 22 | | 2.50 | 6-1-2029 | 200,000 | 169,901 |
| Las Vegas NV Special Improvement District #816 Local Improvement Summerlin Village 22 | | 2.63 | 6-1-2030 | 300,000 | 251,183 |
| Las Vegas NV Special Improvement District #816 Local Improvement Summerlin Village 22 | | 2.75 | 6-1-2031 | 225,000 | 185,929 |
| Las Vegas NV Special Improvement District #816 Local Improvement Summerlin Village 22 | | 2.75 | 6-1-2033 | 515,000 | 408,462 |
| | | | | | 1,974,506 |
| Tax revenue: 0.02% | | | | | |
| Sparks NV Tourism Improvement District #1 Senior Revenue Refunding Bonds Sales Tax Anticipation Notes 144A | | 2.50 | 6-15-2024 | 455,000 | 441,269 |
| | | | | | 2,415,775 |
| New Hampshire: 0.11% | | | | | |
| Housing revenue: 0.11% | | | | | |
| New Hampshire National Finance Authority Municipal Certificates Series A | | 4.13 | 1-20-2034 | 2,394,719 | 2,321,968 |
| New Jersey: 4.35% | | | | | |
| Airport revenue: 0.40% | | | | | |
| New Jersey EDA Refunding Bonds Port Newark Container Terminal LLC Project | | 5.00 | 10-1-2025 | 2,750,000 | 2,805,524 |
| New Jersey EDA Refunding Bonds Port Newark Container Terminal LLC Project | | 5.00 | 10-1-2026 | 2,130,000 | 2,183,847 |
| South Jersey NJ Port Corporation Marine Terminal Series B | | 5.00 | 1-1-2027 | 1,000,000 | 1,039,695 |
| South Jersey NJ Port Corporation Marine Terminal Series B | | 5.00 | 1-1-2028 | 500,000 | 523,975 |
| South Jersey NJ Port Corporation Marine Terminal Series S-2 | | 5.00 | 1-1-2023 | 1,665,000 | 1,665,000 |
| | | | | | 8,218,041 |
The accompanying notes are an integral part of these financial statements.
Allspring Strategic Municipal Bond Fund | 33
Portfolio of investments—December 31, 2022 (unaudited)
| | | Interest
rate | Maturity
date | Principal | Value |
| Education revenue: 0.89% | | | | | |
| Atlantic County NJ Improvement Authority Atlantic City Campus Phase II Project Series A (AGM Insured) | | 4.00% | 7-1-2036 | $ 425,000 | $ 422,130 |
| Atlantic County NJ Improvement Authority Atlantic City Campus Phase II Project Series A (AGM Insured) | | 4.00 | 7-1-2037 | 150,000 | 146,905 |
| Atlantic County NJ Improvement Authority Atlantic City Campus Phase II Project Series A (AGM Insured) | | 4.00 | 7-1-2038 | 200,000 | 193,726 |
| Atlantic County NJ Improvement Authority Atlantic City Campus Phase II Project Series A (AGM Insured) | | 5.00 | 7-1-2032 | 225,000 | 253,872 |
| Atlantic County NJ Improvement Authority Atlantic City Campus Phase II Project Series A (AGM Insured) | | 5.00 | 7-1-2034 | 225,000 | 252,430 |
| New Jersey EDA Revenue School Facilities Construction Series QQQ | | 5.00 | 6-15-2030 | 1,000,000 | 1,101,954 |
| New Jersey EDA Revenue School Facilities Construction Series QQQ | | 5.00 | 6-15-2031 | 500,000 | 550,631 |
| New Jersey EDA School Facilities Construction Refunding Bonds Series I (SIFMA Municipal Swap +1.25%) ± | | 4.91 | 9-1-2025 | 4,500,000 | 4,501,208 |
| New Jersey EDA School Facilities Construction Refunding Bonds Series I (SIFMA Municipal Swap +1.60%) ± | | 5.26 | 3-1-2028 | 10,000,000 | 9,998,172 |
| Newark NJ Higher Educational Finance Corporation Charter Schools Incorporated Series 2015A 144A | | 4.63 | 8-15-2025 | 730,000 | 737,896 |
| | | | | | 18,158,924 |
| GO revenue: 0.31% | | | | | |
| Atlantic City NJ Board of Education Refunding Bonds (AGM Insured) | | 4.00 | 4-1-2027 | 400,000 | 419,312 |
| Atlantic City NJ Board of Education Refunding Bonds (AGM Insured) | | 4.00 | 4-1-2029 | 400,000 | 424,598 |
| Atlantic City NJ Board of Education Refunding Bonds (AGM Insured) | | 4.00 | 4-1-2031 | 350,000 | 367,550 |
| Atlantic City NJ Board of Education Refunding Bonds (AGM Insured) | | 4.00 | 4-1-2033 | 300,000 | 312,367 |
| Atlantic City NJ Board of Education Refunding Bonds (AGM Insured) | | 4.00 | 4-1-2034 | 260,000 | 269,083 |
| New Jersey EDA Revenue Refunding Bonds School Facilities Construction Series GGG 144A | | 5.25 | 9-1-2026 | 2,000,000 | 2,134,407 |
| Newark NJ Board of Education Refunding School Energy Savings Obligation (BAM Insured) | | 5.00 | 7-15-2029 | 340,000 | 376,013 |
| Newark NJ Board of Education Refunding School Energy Savings Obligation (BAM Insured) | | 5.00 | 7-15-2030 | 325,000 | 363,712 |
| Newark NJ Board of Education Refunding School Energy Savings Obligation (BAM Insured) | | 5.00 | 7-15-2031 | 400,000 | 452,078 |
| Newark NJ Board of Education Refunding School Energy Savings Obligation (BAM Insured) | | 5.00 | 7-15-2032 | 430,000 | 484,317 |
| Newark NJ Board of Education Refunding School Energy Savings Obligation (BAM Insured) | | 5.00 | 7-15-2033 | 520,000 | 583,774 |
| | | | | | 6,187,211 |
| Industrial development revenue: 0.01% | | | | | |
| New Jersey EDA Elite Pharmaceuticals Project Series A | | 6.50 | 9-1-2030 | 275,000 | 238,468 |
The accompanying notes are an integral part of these financial statements.
34 | Allspring Strategic Municipal Bond Fund
Portfolio of investments—December 31, 2022 (unaudited)
| | | Interest
rate | Maturity
date | Principal | Value |
| Miscellaneous revenue: 0.73% | | | | | |
| New Jersey EDA Motor Vehicle Surcharge Revenue Refunding Bonds Series A | | 3.13% | 7-1-2029 | $ 5,620,000 | $ 5,511,399 |
| New Jersey EDA Motor Vehicle Surcharge Revenue Refunding Bonds Series A | | 3.38 | 7-1-2030 | 9,705,000 | 9,378,805 |
| | | | | | 14,890,204 |
| Tax revenue: 0.35% | | | | | |
| New Jersey Garden State Preservation Trust Open & Farmland Series A (AGM Insured) | | 5.75 | 11-1-2028 | 5,000,000 | 5,496,670 |
| New Jersey TTFA Transportation Program Series BB | | 5.00 | 6-15-2030 | 1,500,000 | 1,625,162 |
| | | | | | 7,121,832 |
| Transportation revenue: 1.34% | | | | | |
| New Jersey TTFA CAB Transportation System Series A ¤ | | 0.00 | 12-15-2026 | 12,000,000 | 10,384,954 |
| New Jersey TTFA CAB Transportation System Series C (Ambac Insured) ¤ | | 0.00 | 12-15-2026 | 3,500,000 | 3,045,430 |
| New Jersey TTFA Transportation Program Series 2013AA | | 5.00 | 6-15-2023 | 4,740,000 | 4,773,853 |
| New Jersey TTFA Transportation System Series 2010D | | 5.00 | 12-15-2023 | 6,960,000 | 7,069,934 |
| New Jersey TTFA Transportation System Series 2019A | | 5.00 | 12-15-2025 | 1,000,000 | 1,050,995 |
| South Jersey Transportation Authority Transportation System Revenue Series A (BAM Insured) | | 5.00 | 11-1-2036 | 500,000 | 532,303 |
| South Jersey Transportation Authority Transportation System Revenue Series A (BAM Insured) | | 5.00 | 11-1-2037 | 500,000 | 528,954 |
| | | | | | 27,386,423 |
| Water & sewer revenue: 0.32% | | | | | |
| New Jersey EDA Water Facilities Revenue Refunding Bonds AMT American Water Company Incorporated Project Series A | | 2.20 | 10-1-2039 | 5,500,000 | 4,727,203 |
| New Jersey EDA Water Facilities Revenue Refunding Bonds AMT American Water Company Incorporated Project Series D | | 1.10 | 11-1-2029 | 2,075,000 | 1,819,086 |
| | | | | | 6,546,289 |
| | | | | | 88,747,392 |
| New Mexico: 0.83% | | | | | |
| Industrial development revenue: 0.41% | | | | | |
| Farmington NM PCR Bonds Corners Project Series 4 | | 1.80 | 4-1-2029 | 10,000,000 | 8,370,183 |
| Tax revenue: 0.08% | | | | | |
| Winrock Town Center Tax Increment Development District 1 Senior Lien Gross Receipts 144A | | 3.75 | 5-1-2028 | 867,000 | 806,070 |
| Winrock Town Center Tax Increment Development District 1 Senior Lien Gross Receipts 144A | | 4.00 | 5-1-2033 | 1,035,000 | 894,326 |
| | | | | | 1,700,396 |
| Utilities revenue: 0.34% | | | | | |
| New Mexico Municipal Energy Acquisition Authority Gas Supply Revenue Refunding & Acquisition Bond Subordinated Series A (Royal Bank of Canada LIQ) | | 5.00 | 11-1-2039 | 6,660,000 | 6,826,029 |
| | | | | | 16,896,608 |
The accompanying notes are an integral part of these financial statements.
Allspring Strategic Municipal Bond Fund | 35
Portfolio of investments—December 31, 2022 (unaudited)
| | | Interest
rate | Maturity
date | Principal | Value |
| New York: 7.27% | | | | | |
| Airport revenue: 1.04% | | | | | |
| New York Transportation Development Corporation Special Facility AMT John F Kennedy International Airport Terminal 4 Project | | 5.00% | 12-1-2032 | $ 5,500,000 | $ 5,883,830 |
| Port Authority of New York & New Jersey Consolidated Bonds 205 Series | | 5.00 | 11-15-2025 | 475,000 | 506,400 |
| Port Authority of New York & New Jersey Consolidated Bonds 207 Series | | 5.00 | 9-15-2027 | 13,880,000 | 14,847,970 |
| | | | | | 21,238,200 |
| Education revenue: 0.94% | | | | | |
| Build New York City Resource Corporation Bronx Charter School for International Cultures & Arts Series A 144A | | 3.88 | 4-15-2023 | 200,000 | 199,727 |
| Build New York City Resource Corporation Richmond Preparatory Charter School Social Impact Project Series A 144A | | 4.00 | 6-1-2031 | 650,000 | 589,530 |
| Build New York City Resource Corporation Richmond Preparatory Charter School Social Impact Project Series A 144A | | 5.00 | 6-1-2036 | 525,000 | 503,186 |
| Build New York City Resource Corporation Richmond Preparatory Charter School Social Impact Project Series A 144A | | 5.00 | 6-1-2041 | 400,000 | 370,894 |
| Hempstead NY Local Development Corporation The Academy Charter School Project Series A | | 4.45 | 2-1-2041 | 500,000 | 391,908 |
| Hempstead Town NY Local Development Corporation Education Revenue Refunding Bonds Evergreen Charter School Project Series A | | 5.00 | 6-15-2032 | 7,115,000 | 7,363,990 |
| Hempstead Town NY Local Development Corporation Education Revenue Refunding Bonds The Academy Charter School Project Series A | | 4.05 | 2-1-2031 | 2,415,000 | 2,101,499 |
| Hempstead Town NY Local Development Corporation Education Revenue Refunding Bonds The Academy Charter School Project Series A | | 4.76 | 2-1-2027 | 970,000 | 939,951 |
| Hempstead Town NY Local Development Corporation Education Revenue Refunding Bonds The Academy Charter School Project Series A | | 5.45 | 2-1-2027 | 2,880,000 | 2,867,416 |
| Hempstead Town NY Local Development Corporation Education Revenue Refunding Bonds The Academy Charter School Project Series A | | 6.47 | 2-1-2033 | 1,435,000 | 1,503,588 |
| Hempstead Town NY Local Development Corporation Education Revenue Refunding Bonds The Academy Charter School Project Series B | | 4.76 | 2-1-2027 | 180,000 | 174,424 |
| New York Dormitory Authority Revenues Non-State Supported Debt Montefiore Obligation Group Series A | | 5.00 | 7-1-2030 | 625,000 | 678,308 |
| New York Dormitory Authority Revenues Non-State Supported Debt Montefiore Obligation Group Series A | | 5.00 | 7-1-2037 | 200,000 | 211,593 |
| New York Dormitory Authority Revenues Non-State Supported Debt Montefiore Obligation Group Series A | | 5.00 | 7-1-2042 | 275,000 | 284,862 |
| New York NY IDA Civic Facility Stars Churchill School Center Project (AGC Insured) | | 2.25 | 10-1-2029 | 1,080,000 | 995,721 |
| | | | | | 19,176,597 |
| GO revenue: 0.24% | | | | | |
| Poughkeepsie City NY Refunding Bonds Public Improvement | | 4.00 | 4-15-2029 | 245,000 | 252,007 |
The accompanying notes are an integral part of these financial statements.
36 | Allspring Strategic Municipal Bond Fund
Portfolio of investments—December 31, 2022 (unaudited)
| | | Interest
rate | Maturity
date | Principal | Value |
| GO revenue (continued) | | | | | |
| Poughkeepsie City NY Refunding Bonds Public Improvement | | 5.00% | 6-1-2024 | $ 340,000 | $ 346,517 |
| Poughkeepsie City NY Refunding Bonds Public Improvement | | 5.00 | 6-1-2025 | 235,000 | 243,272 |
| Poughkeepsie City NY Refunding Bonds Public Improvement | | 5.00 | 6-1-2031 | 600,000 | 625,605 |
| Suffolk County NY Series A (BAM Insured) | | 5.00 | 6-15-2028 | 3,000,000 | 3,353,094 |
| | | | | | 4,820,495 |
| Health revenue: 0.77% | | | | | |
| Huntington NY Local Development Corporation Revenue Gurwin Independent Housing Incorporated | | 3.00 | 7-1-2025 | 180,000 | 173,087 |
| New York Dormitory Authority Catholic Health Systems Obligated Group Revenue Bond Series 2019B (Manufacturers & Traders LOC) ø | | 3.73 | 7-1-2048 | 4,925,000 | 4,925,000 |
| New York Dormitory Authority Revenues Non-State Supported Debt Montefiore Obligation Group Series A | | 5.00 | 9-1-2028 | 1,400,000 | 1,446,210 |
| New York Dormitory Authority Revenues Non-State Supported Debt Montefiore Obligation Group Series A | | 5.00 | 9-1-2029 | 1,350,000 | 1,392,993 |
| New York Dormitory Authority Revenues Non-State Supported Debt Northwell Health Obligated Group Series B-3 | | 5.00 | 5-1-2048 | 6,000,000 | 6,285,573 |
| Westchester County NY Local Development Corporation Purchase Senior Learning Community Incorporated 144A | | 2.88 | 7-1-2026 | 1,500,000 | 1,442,404 |
| | | | | | 15,665,267 |
| Housing revenue: 0.57% | | | | | |
| New York Housing Finance Agency Affordable Housing Revenue Various Sustainability Bonds Series J-2 øø | | 1.10 | 11-1-2061 | 2,500,000 | 2,227,699 |
| New York Housing Finance Agency Affordable Housing Revenue Various Sustainability Bonds Series K-2 øø | | 1.00 | 11-1-2061 | 500,000 | 452,171 |
| New York Mortgage Agency Homeowner Mortgage Revenue AMT Social Bonds Series 235 | | 0.40 | 4-1-2023 | 480,000 | 476,412 |
| New York Mortgage Agency Homeowner Mortgage Revenue AMT Social Bonds Series 235 | | 0.55 | 10-1-2023 | 760,000 | 743,532 |
| New York Mortgage Agency Homeowner Mortgage Revenue AMT Social Bonds Series 235 | | 0.65 | 4-1-2024 | 710,000 | 685,637 |
| New York Mortgage Agency Homeowner Mortgage Revenue AMT Social Bonds Series 235 | | 0.75 | 10-1-2024 | 825,000 | 787,460 |
| New York Mortgage Agency Homeowner Mortgage Revenue AMT Social Bonds Series 235 | | 0.88 | 4-1-2025 | 1,705,000 | 1,609,829 |
| New York Mortgage Agency Homeowner Mortgage Revenue AMT Social Bonds Series 235 | | 1.00 | 10-1-2025 | 2,415,000 | 2,261,558 |
| New York Mortgage Agency Homeowner Mortgage Revenue AMT Social Bonds Series 235 | | 1.05 | 4-1-2026 | 1,275,000 | 1,181,832 |
| New York Mortgage Agency Homeowner Mortgage Revenue AMT Social Bonds Series 235 | | 1.15 | 10-1-2026 | 1,335,000 | 1,227,862 |
| | | | | | 11,653,992 |
| Industrial development revenue: 1.21% | | | | | |
| New York Liberty Development Corporation Refunding Bonds 4 World Trade Center Project | | 2.80 | 9-15-2069 | 2,000,000 | 1,789,695 |
| New York Transportation Development Corporation Exempt Facility Revenue New York Thruway Service Areas Project | | 2.50 | 10-31-2031 | 750,000 | 610,801 |
The accompanying notes are an integral part of these financial statements.
Allspring Strategic Municipal Bond Fund | 37
Portfolio of investments—December 31, 2022 (unaudited)
| | | Interest
rate | Maturity
date | Principal | Value |
| Industrial development revenue (continued) | | | | | |
| New York Transportation Development Corporation Exempt Facility Revenue New York Thruway Service Areas Project | | 4.00% | 10-31-2034 | $ 500,000 | $ 478,203 |
| New York Transportation Development Corporation Special Facility AMT American Airlines Incorporated John F Kennedy International Airport Project | | 2.25 | 8-1-2026 | 1,625,000 | 1,500,453 |
| New York Transportation Development Corporation Special Facility AMT Revenue Delta Air Lines Incorporated LaGuardia Airport Terminals C&D Redevelopment | | 5.00 | 1-1-2026 | 11,030,000 | 11,179,803 |
| New York Transportation Development Corporation Special Facility AMT Revenue Delta Air Lines Incorporated LaGuardia Airport Terminals C&D Redevelopment | | 5.00 | 10-1-2035 | 9,250,000 | 9,199,663 |
| | | | | | 24,758,618 |
| Miscellaneous revenue: 0.54% | | | | | |
| New York City IDA Pilot Refunding Bonds Queens Baseball Stadium Project Series 2021A (AGM Insured) | | 5.00 | 1-1-2025 | 1,250,000 | 1,297,662 |
| New York City IDA Pilot Refunding Bonds Queens Baseball Stadium Project Series 2021A (AGM Insured) | | 5.00 | 1-1-2030 | 1,750,000 | 1,953,618 |
| New York Liberty Development Corporation Refunding Bonds 4 World Trade Center Project | | 1.70 | 11-15-2030 | 4,000,000 | 3,220,003 |
| New York Liberty Development Corporation Refunding Bonds 4 World Trade Center Project | | 2.10 | 11-15-2032 | 5,000,000 | 4,085,434 |
| Western Regional Off-Track Betting Corporation 144A | | 3.00 | 12-1-2026 | 550,000 | 494,493 |
| | | | | | 11,051,210 |
| Resource recovery revenue: 0.09% | | | | | |
| New York Environmental Facilities Corporation Solid Waste Disposal Revenue Casella Waste System Incorporated Project | | 2.75 | 9-1-2050 | 2,000,000 | 1,883,394 |
| Tax revenue: 0.35% | | | | | |
| Triborough Bridge & Tunnel Authority Payroll Mobility Tax Senior Lien Series A | | 2.00 | 5-15-2045 | 7,900,000 | 7,084,421 |
| Transportation revenue: 1.22% | | | | | |
| New York Metropolitan Transportation Authority Subordinated Bond Series 2002G-1F (U.S. SOFR +0.43%) ± | | 3.31 | 11-1-2026 | 990,000 | 967,637 |
| New York Metropolitan Transportation Authority Subordinated Bond Series A-1 | | 5.00 | 11-15-2048 | 800,000 | 814,957 |
| New York Metropolitan Transportation Authority Subordinated Bond Series C-1 | | 5.00 | 11-15-2024 | 3,535,000 | 3,627,958 |
| New York Metropolitan Transportation Authority Various Refunding Bonds Transportation Subordinated Series G-3 (SIFMA Municipal Swap +0.43%) ± | | 4.09 | 11-1-2031 | 20,000,000 | 19,460,100 |
| | | | | | 24,870,652 |
The accompanying notes are an integral part of these financial statements.
38 | Allspring Strategic Municipal Bond Fund
Portfolio of investments—December 31, 2022 (unaudited)
| | | Interest
rate | Maturity
date | Principal | Value |
| Utilities revenue: 0.30% | | | | | |
| Long Island Power Authority Electric System General Revenue Bonds Series B øø | | 0.85% | 9-1-2050 | $ 3,000,000 | $ 2,795,906 |
| Long Island Power Authority Electric System General Revenue Bonds Series B øø | | 1.50 | 9-1-2051 | 3,500,000 | 3,251,929 |
| | | | | | 6,047,835 |
| | | | | | 148,250,681 |
| North Carolina: 0.35% | | | | | |
| Education revenue: 0.07% | | | | | |
| North Carolina Capital Facilities Finance Agency Educational Facilities Revenue Refunding Campbell University Series A | | 5.00 | 10-1-2028 | 450,000 | 479,386 |
| North Carolina Capital Facilities Finance Agency Educational Facilities Revenue Refunding Campbell University Series A | | 5.00 | 10-1-2029 | 550,000 | 589,848 |
| North Carolina Capital Facilities Finance Agency Educational Facilities Revenue Refunding Campbell University Series A | | 5.00 | 10-1-2030 | 450,000 | 485,023 |
| | | | | | 1,554,257 |
| Health revenue: 0.24% | | | | | |
| Charlotte Mecklenburg Hospital Authority North Carolina Health Care System Atrium Health Series E øø | | 0.80 | 1-15-2048 | 2,000,000 | 1,883,622 |
| North Carolina Medical Care Commission Health Care Facilities First Mortgage Lutheran Services Series A | | 4.00 | 3-1-2029 | 275,000 | 256,270 |
| North Carolina Medical Care Commission Health Care Facilities First Mortgage Lutheran Services Series A | | 4.00 | 3-1-2030 | 285,000 | 261,076 |
| North Carolina Medical Care Commission Health Care Facilities First Mortgage Lutheran Services Series A | | 4.00 | 3-1-2031 | 290,000 | 261,163 |
| North Carolina Medical Care Commission Health Care Facilities First Mortgage Lutheran Services Series A | | 4.00 | 3-1-2036 | 900,000 | 747,146 |
| North Carolina Medical Care Commission Retirement Facilities Revenue Entrance Fee Friends Homes Series B-1 | | 2.55 | 9-1-2026 | 1,575,000 | 1,446,890 |
| | | | | | 4,856,167 |
| Industrial development revenue: 0.04% | | | | | |
| Columbus County NC Industrial Facilities and PCFA Refunding Bonds Recovery Zone Facility International Paper Company Project | | 2.00 | 11-1-2033 | 850,000 | 817,920 |
| | | | | | 7,228,344 |
| North Dakota: 0.97% | | | | | |
| GO revenue: 0.53% | | | | | |
| McKenzie County ND Public School District #1 School Building Series A | | 5.00 | 8-1-2025 | 960,000 | 1,005,262 |
| McKenzie County ND Public School District #1 School Building Series A | | 5.00 | 8-1-2026 | 1,115,000 | 1,187,949 |
| McKenzie County ND Public School District #1 School Building Series A | | 5.00 | 8-1-2027 | 1,170,000 | 1,263,603 |
| McKenzie County ND Public School District #1 School Building Series A | | 5.00 | 8-1-2028 | 1,225,000 | 1,339,064 |
The accompanying notes are an integral part of these financial statements.
Allspring Strategic Municipal Bond Fund | 39
Portfolio of investments—December 31, 2022 (unaudited)
| | | Interest
rate | Maturity
date | Principal | Value |
| GO revenue (continued) | | | | | |
| McKenzie County ND Public School District #1 School Building Series A | | 5.00% | 8-1-2029 | $ 1,290,000 | $ 1,406,258 |
| McKenzie County ND Public School District #1 School Building Series A | | 5.00 | 8-1-2030 | 1,355,000 | 1,476,646 |
| McKenzie County ND Public School District #1 School Building Series A | | 5.00 | 8-1-2031 | 1,420,000 | 1,545,567 |
| McKenzie County ND Public School District #1 School Building Series A | | 5.00 | 8-1-2032 | 1,490,000 | 1,618,686 |
| | | | | | 10,843,035 |
| Health revenue: 0.32% | | | | | |
| Grand Forks ND Health Care System Revenue Altru Health System | | 5.00 | 12-1-2029 | 1,650,000 | 1,781,408 |
| Grand Forks ND Health Care System Revenue Altru Health System | | 5.00 | 12-1-2030 | 1,600,000 | 1,742,708 |
| Grand Forks ND Health Care System Revenue Altru Health System | | 5.00 | 12-1-2032 | 2,805,000 | 3,021,225 |
| | | | | | 6,545,341 |
| Miscellaneous revenue: 0.12% | | | | | |
| Cass County ND Joint Water Resources District Refunding Bond Temporary Improvement Series A | | 0.48 | 5-1-2024 | 2,500,000 | 2,376,324 |
| | | | | | 19,764,700 |
| Ohio: 2.09% | | | | | |
| Airport revenue: 0.11% | | | | | |
| Port of Greater Cincinnati Development Authority | | 4.38 | 6-15-2056 | 2,340,000 | 2,152,284 |
| Education revenue: 0.03% | | | | | |
| Allen County OH Port Authority Economic Development Revenue Refunding Bonds University of Northwestern Ohio Project Series A | | 4.00 | 12-1-2031 | 710,000 | 697,160 |
| Health revenue: 0.27% | | | | | |
| Hamilton County OH Hospital Facilities Revenue UC Health Obligated Group | | 5.00 | 9-15-2027 | 615,000 | 657,613 |
| Hamilton County OH Hospital Facilities Revenue UC Health Obligated Group | | 5.00 | 9-15-2028 | 650,000 | 700,110 |
| Montgomery County OH Hospital Refunding Bonds Facilities Premier Health Partners | | 5.00 | 11-15-2033 | 4,000,000 | 4,224,593 |
| | | | | | 5,582,316 |
| Resource recovery revenue: 0.23% | | | | | |
| Ohio Air Quality Development Authority Revenue Refunding Bonds AMT American Electric Power Company | | 2.10 | 12-1-2027 | 4,930,000 | 4,736,605 |
| Tax revenue: 0.33% | | | | | |
| Akron OH Income Tax Revenue | | 4.00 | 12-1-2029 | 4,515,000 | 4,833,578 |
| Akron OH Income Tax Revenue | | 4.00 | 12-1-2030 | 1,830,000 | 1,944,009 |
| | | | | | 6,777,587 |
| Utilities revenue: 0.82% | | | | | |
| American Municipal Power Ohio Incorporated Refunding Bonds | | 5.00 | 2-15-2031 | 1,700,000 | 1,938,671 |
The accompanying notes are an integral part of these financial statements.
40 | Allspring Strategic Municipal Bond Fund
Portfolio of investments—December 31, 2022 (unaudited)
| | | Interest
rate | Maturity
date | Principal | Value |
| Utilities revenue (continued) | | | | | |
| Lancaster OH Port Authority Gas Supply Series A (Royal Bank of Canada LIQ) | | 5.00% | 8-1-2049 | $ 6,355,000 | $ 6,462,818 |
| Ohio Air Quality Development Authority Ohio Valley Electric Corporation Project Series 2009C | | 1.50 | 2-1-2026 | 2,000,000 | 1,843,452 |
| Ohio Air Quality Development Authority Ohio Valley Electric Corporation Project Series 2019A | | 3.25 | 9-1-2029 | 7,000,000 | 6,417,156 |
| | | | | | 16,662,097 |
| Water & sewer revenue: 0.30% | | | | | |
| Columbus OH Sewerage System | | 5.00 | 6-1-2031 | 5,825,000 | 6,041,926 |
| | | | | | 42,649,975 |
| Oklahoma: 0.79% | | | | | |
| Education revenue: 0.24% | | | | | |
| Oklahoma Development Finance Authority Revenue Refunding Bonds Oklahoma City University Project | | 5.00 | 8-1-2025 | 925,000 | 939,007 |
| Oklahoma Development Finance Authority Revenue Refunding Bonds Oklahoma City University Project | | 5.00 | 8-1-2026 | 975,000 | 994,655 |
| Oklahoma Development Finance Authority Revenue Refunding Bonds Oklahoma City University Project | | 5.00 | 8-1-2027 | 1,370,000 | 1,401,980 |
| Oklahoma Development Finance Authority Revenue Refunding Bonds Oklahoma City University Project | | 5.00 | 8-1-2028 | 715,000 | 734,043 |
| Oklahoma Development Finance Authority Revenue Refunding Bonds Oklahoma City University Project | | 5.00 | 8-1-2029 | 755,000 | 777,530 |
| | | | | | 4,847,215 |
| Miscellaneous revenue: 0.34% | | | | | |
| Carter County OK Public Facilities Authority Dickson Public Schools Project | | 4.00 | 9-1-2025 | 350,000 | 359,846 |
| Carter County OK Public Facilities Authority Dickson Public Schools Project | | 5.00 | 9-1-2025 | 365,000 | 378,914 |
| Muskogee OK Industrial Trust Educational Facilities Lease Muskogee Public Schools Project | | 4.00 | 9-1-2028 | 2,500,000 | 2,578,729 |
| Muskogee OK Industrial Trust Educational Facilities Lease Muskogee Public Schools Project | | 5.00 | 9-1-2024 | 890,000 | 914,209 |
| Muskogee OK Industrial Trust Educational Facilities Lease Muskogee Public Schools Project | | 5.00 | 9-1-2025 | 855,000 | 892,901 |
| Muskogee OK Industrial Trust Educational Facilities Lease Muskogee Public Schools Project | | 5.00 | 9-1-2026 | 1,810,000 | 1,916,804 |
| | | | | | 7,041,403 |
| Tax revenue: 0.21% | | | | | |
| Tulsa OK Public Facilities Authority Capital Improvements | | 4.00 | 10-1-2027 | 4,050,000 | 4,210,023 |
| | | | | | 16,098,641 |
| Oregon: 0.89% | | | | | |
| Airport revenue: 0.05% | | | | | |
| Port of Portland OR Portland International Airport AMT Series 28 | | 5.00 | 7-1-2024 | 1,125,000 | 1,151,195 |
The accompanying notes are an integral part of these financial statements.
Allspring Strategic Municipal Bond Fund | 41
Portfolio of investments—December 31, 2022 (unaudited)
| | | Interest
rate | Maturity
date | Principal | Value |
| Health revenue: 0.84% | | | | | |
| Multnomah County OR Hospital Facilities Authority Revenue Refunding Bonds Adventist Health System/West | | 5.00% | 3-1-2040 | $ 9,500,000 | $ 9,565,734 |
| Multnomah County OR Hospital Facilities Authority Revenue Refunding Bonds Terwilliger Plaza Parkview | | 0.95 | 6-1-2027 | 1,900,000 | 1,658,036 |
| Oregon State Facilities Authority Revenue Refunding Bonds Samaritan Health Services Project | | 5.00 | 10-1-2025 | 400,000 | 416,617 |
| Oregon State Facilities Authority Revenue Refunding Bonds Samaritan Health Services Project | | 5.00 | 10-1-2026 | 125,000 | 132,034 |
| Oregon State Facilities Authority Revenue Refunding Bonds Samaritan Health Services Project | | 5.00 | 10-1-2027 | 300,000 | 318,263 |
| Oregon State Facilities Authority Revenue Refunding Bonds Samaritan Health Services Project | | 5.00 | 10-1-2031 | 1,750,000 | 1,820,089 |
| YamHill County OR Hospital Authority Friendsview Series A | | 5.00 | 11-15-2036 | 1,220,000 | 1,064,460 |
| YamHill County OR Hospital Authority Friendsview Series A | | 5.00 | 11-15-2046 | 1,540,000 | 1,222,505 |
| YamHill County OR Hospital Authority Friendsview Series B-2 | | 2.13 | 11-15-2027 | 1,000,000 | 883,158 |
| | | | | | 17,080,896 |
| | | | | | 18,232,091 |
| Pennsylvania: 4.99% | | | | | |
| Airport revenue: 0.49% | | | | | |
| Allegheny County PA Airport Authority AMT Series A | | 5.00 | 1-1-2029 | 4,000,000 | 4,273,630 |
| Allegheny County PA Airport Authority AMT Series A | | 5.00 | 1-1-2030 | 3,000,000 | 3,233,752 |
| Allegheny County PA Airport Authority AMT Series A | | 5.00 | 1-1-2031 | 2,250,000 | 2,445,991 |
| | | | | | 9,953,373 |
| Education revenue: 0.69% | | | | | |
| Chester County PA IDA Avon Grove Charter School Project 144A | | 5.00 | 10-15-2032 | 3,025,000 | 2,960,698 |
| Chester County PA IDA Avon Grove Charter School Project Series 2017A | | 4.00 | 12-15-2027 | 1,260,000 | 1,243,715 |
| Lehigh County General Purpose Authority Charter School Lehigh Valley Academy Regional Charter School | | 4.00 | 6-1-2030 | 1,175,000 | 1,157,478 |
| Montgomery County PA HEFAR Arcadia University | | 5.00 | 4-1-2023 | 1,555,000 | 1,558,283 |
| Pennsylvania Higher Education Assistance Agency Education Loan Series A | | 5.00 | 6-1-2028 | 600,000 | 640,504 |
| Pennsylvania Higher Education Assistance Agency Education Loan Series A | | 5.00 | 6-1-2030 | 800,000 | 860,056 |
| Philadelphia PA IDA Charter School Project Series 2016A | | 4.50 | 8-1-2026 | 1,830,000 | 1,843,460 |
| Philadelphia PA IDA Charter School Project Series 2016B | | 4.88 | 8-1-2026 | 1,200,000 | 1,208,013 |
| Philadelphia PA IDA Independence Charter School West Project | | 4.00 | 6-15-2029 | 350,000 | 329,062 |
| Philadelphia PA IDA Tacony Academy Christian School Project Series A-1 | | 6.25 | 6-15-2023 | 140,000 | 141,638 |
| South Central Pennsylvania General Authority Association of Independent Colleges & Universities Financing Program Series TT2 | | 5.00 | 5-1-2029 | 245,000 | 267,734 |
| South Central Pennsylvania General Authority Association of Independent Colleges & Universities Financing Program Series TT2 | | 5.00 | 5-1-2030 | 395,000 | 436,582 |
The accompanying notes are an integral part of these financial statements.
42 | Allspring Strategic Municipal Bond Fund
Portfolio of investments—December 31, 2022 (unaudited)
| | | Interest
rate | Maturity
date | Principal | Value |
| Education revenue (continued) | | | | | |
| South Central Pennsylvania General Authority Association of Independent Colleges & Universities Financing Program Series TT2 | | 5.00% | 5-1-2031 | $ 485,000 | $ 541,482 |
| Tender Option Bond Trust Receipts/Floater Certificates Series 2019-XF2836 (Mizuho Capital Markets LLC LOC, Mizuho Capital Markets LLC LIQ) 144Aø | | 3.86 | 6-15-2039 | 935,000 | 935,000 |
| | | | | | 14,123,705 |
| GO revenue: 1.18% | | | | | |
| Allegheny County PA Penn Hills Schools District (BAM Insured) | | 5.00 | 11-15-2023 | 1,025,000 | 1,041,265 |
| Armstrong PA School District Refunding Bonds Series A (BAM Insured) | | 5.00 | 3-15-2027 | 745,000 | 810,762 |
| Armstrong PA School District Refunding Bonds Series A (BAM Insured) | | 5.00 | 3-15-2029 | 920,000 | 1,036,193 |
| Armstrong PA School District Refunding Bonds Series A (BAM Insured) | | 5.00 | 3-15-2030 | 1,800,000 | 2,031,985 |
| Bristol Township PA School District | | 5.25 | 6-1-2031 | 6,990,000 | 7,052,551 |
| Laurel Highlands PA School District (BAM Insured) | | 3.00 | 2-1-2030 | 675,000 | 669,364 |
| Laurel Highlands PA School District (BAM Insured) | | 4.00 | 2-1-2027 | 980,000 | 1,017,272 |
| Laurel Highlands PA School District (BAM Insured) | | 4.00 | 2-1-2029 | 1,150,000 | 1,197,594 |
| Philadelphia PA School District Series 2019A | | 5.00 | 9-1-2030 | 2,500,000 | 2,765,066 |
| Philadelphia PA School District Series 2019A | | 5.00 | 9-1-2031 | 2,500,000 | 2,760,627 |
| Scranton PA 144A | | 5.00 | 9-1-2023 | 1,355,000 | 1,357,476 |
| Scranton PA School District Series A | | 5.00 | 6-1-2024 | 750,000 | 769,262 |
| Scranton PA School District Series B (NPFGC Insured) | | 5.00 | 6-1-2024 | 665,000 | 683,005 |
| Scranton PA School District Series B (NPFGC Insured) | | 5.00 | 6-1-2025 | 710,000 | 743,367 |
| | | | | | 23,935,789 |
| Health revenue: 0.73% | | | | | |
| Berks County PA Municipal Authority Tower Health Project Series B-1 | | 5.00 | 2-1-2040 | 6,000,000 | 5,647,663 |
| Bucks County PA IDA Hospital Revenue Grand View Hospital Project | | 5.00 | 7-1-2026 | 1,350,000 | 1,389,012 |
| Bucks County PA IDA Hospital Revenue Grand View Hospital Project | | 5.00 | 7-1-2028 | 1,500,000 | 1,549,816 |
| Bucks County PA IDA Hospital Revenue Grand View Hospital Project | | 5.00 | 7-1-2031 | 1,120,000 | 1,147,310 |
| Bucks County PA IDA Hospital Revenue Grand View Hospital Project | | 5.00 | 7-1-2032 | 955,000 | 966,994 |
| Bucks County PA IDA Hospital St. Luke's University Health Network Project | | 4.00 | 8-15-2031 | 750,000 | 765,717 |
| Bucks County PA IDA Hospital St. Luke's University Health Network Project | | 4.00 | 8-15-2032 | 1,390,000 | 1,406,506 |
| Lancaster PA IDA Health Center Revenue Refunding Landis Homes Retirement | | 4.00 | 7-1-2031 | 430,000 | 393,550 |
| Lancaster PA IDA Health Center Revenue Refunding Landis Homes Retirement | | 4.00 | 7-1-2037 | 345,000 | 295,008 |
| Westmoreland County PA IDA Health System Revenue Excela Health Project Series A | | 5.00 | 7-1-2027 | 1,200,000 | 1,258,474 |
| | | | | | 14,820,050 |
| Housing revenue: 0.42% | | | | | |
| East Hempfield Township PA Industrial Development Student Services Incorporate Student Housing | | 5.00 | 7-1-2025 | 790,000 | 814,906 |
The accompanying notes are an integral part of these financial statements.
Allspring Strategic Municipal Bond Fund | 43
Portfolio of investments—December 31, 2022 (unaudited)
| | | Interest
rate | Maturity
date | Principal | Value |
| Housing revenue (continued) | | | | | |
| Pennsylvania Housing Finance Agency MFHR Sherman Hills (Department of Housing and Urban Development Insured) øø | | 1.25% | 2-1-2025 | $ 7,000,000 | $ 6,804,694 |
| Pennsylvania Housing Finance Agency Single Family Mortgage AMT Series 128A | | 4.75 | 4-1-2033 | 1,010,000 | 1,017,830 |
| | | | | | 8,637,430 |
| Miscellaneous revenue: 0.25% | | | | | |
| Delaware Valley Regional Finance Authority Local Government Series B (Ambac Insured) | | 5.70 | 7-1-2027 | 1,780,000 | 1,974,287 |
| Delaware Valley Regional Finance Authority Local Government Series C (Ambac Insured) | | 7.75 | 7-1-2027 | 125,000 | 149,723 |
| Pennsylvania EDFA Tax-Exempt Private Activity Bond AMT The PennDot Major Bridges Package One Project Series P-3 | | 5.00 | 6-30-2032 | 2,770,000 | 2,976,191 |
| | | | | | 5,100,201 |
| Resource recovery revenue: 0.63% | | | | | |
| Pennsylvania EDFA Solid Waste Disposal Waste Management Incorporated Project Series 2019A | | 1.75 | 8-1-2038 | 13,500,000 | 12,896,078 |
| Tax revenue: 0.11% | | | | | |
| Allentown PA Neighborhood Improvement Zone Development Authority Revenue Refunding Bonds | | 5.00 | 5-1-2029 | 500,000 | 523,443 |
| Allentown PA Neighborhood Improvement Zone Development Authority Revenue Refunding Bonds | | 5.00 | 5-1-2030 | 500,000 | 522,861 |
| Allentown PA Neighborhood Improvement Zone Development Authority Revenue Refunding Bonds | | 5.00 | 5-1-2031 | 550,000 | 575,395 |
| Allentown PA Neighborhood Improvement Zone Development Authority Revenue Refunding Bonds | | 5.00 | 5-1-2032 | 600,000 | 627,183 |
| | | | | | 2,248,882 |
| Transportation revenue: 0.15% | | | | | |
| Lancaster PA Guaranteed Parking Authority Series A (BAM Insured) | | 4.00 | 9-1-2027 | 570,000 | 598,336 |
| Lancaster PA Guaranteed Parking Authority Series A (BAM Insured) | | 4.00 | 9-1-2028 | 590,000 | 618,995 |
| Lancaster PA Guaranteed Parking Authority Series A (BAM Insured) | | 4.00 | 9-1-2029 | 410,000 | 428,923 |
| Lancaster PA Guaranteed Parking Authority Series A (BAM Insured) | | 4.00 | 9-1-2030 | 425,000 | 445,511 |
| Lancaster PA Guaranteed Parking Authority Series A (BAM Insured) | | 4.00 | 9-1-2031 | 440,000 | 459,672 |
| Lancaster PA Guaranteed Parking Authority Series A (BAM Insured) | | 4.00 | 9-1-2032 | 460,000 | 479,136 |
| | | | | | 3,030,573 |
| Water & sewer revenue: 0.34% | | | | | |
| Luzerne County PA IDA Refunding Bonds AMT Pennsylvania American Water Company Project | | 2.45 | 12-1-2039 | 3,250,000 | 2,929,257 |
| Pittsburgh PA Water & Sewer Authority Series C (SIFMA Municipal Swap +0.65%)(AGM Insured) ± | | 4.31 | 9-1-2040 | 4,000,000 | 3,996,016 |
| | | | | | 6,925,273 |
| | | | | | 101,671,354 |
The accompanying notes are an integral part of these financial statements.
44 | Allspring Strategic Municipal Bond Fund
Portfolio of investments—December 31, 2022 (unaudited)
| | | Interest
rate | Maturity
date | Principal | Value |
| Puerto Rico: 0.20% | | | | | |
| Water & sewer revenue: 0.20% | | | | | |
| Puerto Rico Commonwealth Aqueduct and Sewer Authority Revenue Refunding Bonds Senior Lien Series A 144A | | 4.00% | 7-1-2023 | $ 4,000,000 | $ 3,982,121 |
| Rhode Island: 0.14% | | | | | |
| GO revenue: 0.09% | | | | | |
| Providence RI Refunding Bonds Series A | | 5.00 | 1-15-2023 | 425,000 | 425,187 |
| Providence RI Refunding Bonds Series A | | 5.00 | 1-15-2024 | 400,000 | 406,658 |
| Providence RI Refunding Bonds Series A | | 5.00 | 1-15-2025 | 450,000 | 466,966 |
| Providence RI Refunding Bonds Series A | | 5.00 | 1-15-2026 | 450,000 | 474,940 |
| | | | | | 1,773,751 |
| Housing revenue: 0.00% | | | | | |
| Rhode Island Housing & Mortgage Finance | | 6.50 | 4-1-2027 | 15,000 | 15,031 |
| Miscellaneous revenue: 0.05% | | | | | |
| Providence RI Public Buildings Authority Revenue Capital Improvement Program Projects Series A (AGM Insured) | | 4.00 | 9-15-2023 | 1,000,000 | 1,006,676 |
| | | | | | 2,795,458 |
| South Carolina: 0.26% | | | | | |
| Education revenue: 0.01% | | | | | |
| South Carolina Jobs EDA York Preparatory Academy Project Series A 144A | | 5.75 | 11-1-2023 | 145,000 | 148,150 |
| Miscellaneous revenue: 0.02% | | | | | |
| Berkeley County SC Assessment Revenue Bonds Nexton Improvement District | | 4.00 | 11-1-2030 | 425,000 | 391,756 |
| Resource recovery revenue: 0.08% | | | | | |
| South Carolina Jobs EDA Solid Waste Disposal RePower South Berkeley LLC Green Bond 144A† | | 5.25 | 2-1-2027 | 3,310,000 | 1,324,000 |
| South Carolina Jobs EDA Solid Waste Disposal RePower South Berkeley LLC Green Bond † | | 8.00 | 12-6-2029 | 260,000 | 212,053 |
| | | | | | 1,536,053 |
| Utilities revenue: 0.15% | | | | | |
| South Carolina Public Service Authority Revenue Refunding Bonds & Improvement Series A | | 5.00 | 12-1-2031 | 2,850,000 | 3,125,373 |
| | | | | | 5,201,332 |
| South Dakota: 0.38% | | | | | |
| Health revenue: 0.38% | | | | | |
| South Dakota HEFA Avera Health Series A | | 5.00 | 7-1-2033 | 7,675,000 | 7,848,327 |
| Tennessee: 1.46% | | | | | |
| Housing revenue: 0.38% | | | | | |
| Metropolitan Government Nashville & Davidson County TN Health & Educational Facilities Board Richland Hills Apartments Project (Department of Housing and Urban Development Insured) | | 1.25 | 12-1-2024 | 8,000,000 | 7,843,072 |
The accompanying notes are an integral part of these financial statements.
Allspring Strategic Municipal Bond Fund | 45
Portfolio of investments—December 31, 2022 (unaudited)
| | | Interest
rate | Maturity
date | Principal | Value |
| Utilities revenue: 1.08% | | | | | |
| Tennergy Corporation Tennessee Gas Supply Series A | | 4.00% | 12-1-2051 | $ 1,190,000 | $ 1,162,980 |
| Tennergy Corporation Tennessee Gas Supply Series A | | 5.50 | 10-1-2053 | 5,000,000 | 5,289,449 |
| Tennessee Energy Acquisition Corporation Gas Project | | 4.00 | 11-1-2049 | 2,210,000 | 2,193,783 |
| Tennessee Energy Acquisition Corporation Gas Project Series 2006B | | 5.63 | 9-1-2026 | 925,000 | 968,124 |
| Tennessee Energy Acquisition Corporation Gas Project Series 2017A | | 4.00 | 5-1-2048 | 12,390,000 | 12,410,045 |
| | | | | | 22,024,381 |
| | | | | | 29,867,453 |
| Texas: 6.32% | | | | | |
| Airport revenue: 0.56% | | | | | |
| Dallas Fort Worth TX International Airport Refunding Bonds AMT Series A | | 5.00 | 11-1-2024 | 4,000,000 | 4,151,692 |
| El Paso TX Airport Revenue Refunding Bonds El Paso International Airport | | 5.00 | 8-15-2023 | 690,000 | 698,593 |
| El Paso TX Airport Revenue Refunding Bonds El Paso International Airport | | 5.00 | 8-15-2024 | 725,000 | 750,379 |
| El Paso TX Airport Revenue Refunding Bonds El Paso International Airport | | 5.00 | 8-15-2027 | 835,000 | 909,809 |
| El Paso TX Airport Revenue Refunding Bonds El Paso International Airport | | 5.00 | 8-15-2028 | 880,000 | 971,976 |
| El Paso TX Airport Revenue Refunding Bonds El Paso International Airport | | 5.00 | 8-15-2029 | 920,000 | 1,031,319 |
| El Paso TX Airport Revenue Refunding Bonds El Paso International Airport | | 5.00 | 8-15-2030 | 970,000 | 1,102,756 |
| Houston TX Airport System Revenue Refunding Bonds AMT United Airlines Incorporated Terminal E Project Series A | | 5.00 | 7-1-2027 | 1,750,000 | 1,775,272 |
| | | | | | 11,391,796 |
| Education revenue: 1.66% | | | | | |
| Alamo TX Community College District Various Financing System | | 1.70 | 11-1-2042 | 320,000 | 308,852 |
| Arlington TX Higher Education Finance Corporation BASIS Texas Charter Schools Incorporated 144A | | 4.50 | 6-15-2056 | 1,500,000 | 1,433,507 |
| Arlington TX Higher Education Finance Corporation Education Series A | | 4.00 | 2-15-2030 | 305,000 | 316,960 |
| Arlington TX Higher Education Finance Corporation Education Series A | | 4.00 | 2-15-2031 | 315,000 | 328,077 |
| Arlington TX Higher Education Finance Corporation Harmony Public Schools Series A | | 4.00 | 2-15-2029 | 300,000 | 310,370 |
| Arlington TX Higher Education Finance Corporation Legacy Traditional Schools Texas Project Series A | | 4.00 | 2-15-2031 | 1,240,000 | 1,103,021 |
| Arlington TX Higher Education Finance Corporation Legacy Traditional Schools Texas Project Series A 144A | | 5.00 | 2-15-2032 | 500,000 | 476,039 |
| Arlington TX Higher Education Finance Corporation Series A | | 4.00 | 8-15-2029 | 80,000 | 74,596 |
| Arlington TX Higher Education Finance Corporation Series A | | 4.00 | 8-15-2030 | 85,000 | 78,348 |
| Arlington TX Higher Education Finance Corporation Series A | | 4.00 | 8-15-2031 | 80,000 | 72,775 |
| Arlington TX Higher Education Finance Corporation Series A | | 5.00 | 8-15-2023 | 155,000 | 155,671 |
The accompanying notes are an integral part of these financial statements.
46 | Allspring Strategic Municipal Bond Fund
Portfolio of investments—December 31, 2022 (unaudited)
| | | Interest
rate | Maturity
date | Principal | Value |
| Education revenue (continued) | | | | | |
| Arlington TX Higher Education Finance Corporation Series A | | 5.00% | 8-15-2024 | $ 195,000 | $ 196,613 |
| Arlington TX Higher Education Finance Corporation Series A | | 5.00 | 8-15-2025 | 205,000 | 206,837 |
| Arlington TX Higher Education Finance Corporation Series A | | 5.00 | 8-15-2026 | 200,000 | 201,566 |
| Arlington TX Higher Education Finance Corporation Series A | | 5.00 | 8-15-2027 | 205,000 | 206,247 |
| Arlington TX Higher Education Finance Corporation Series A | | 5.00 | 8-15-2028 | 75,000 | 75,105 |
| Austin TX Community College District Series A | | 4.00 | 2-1-2023 | 320,000 | 320,235 |
| Clifton TX Higher Education Finance Corporation Education Revenue IDEA Public Schools Series 2021T | | 5.00 | 8-15-2029 | 315,000 | 340,914 |
| Clifton TX Higher Education Finance Corporation Education Revenue IDEA Public Schools Series 2021T | | 5.00 | 8-15-2030 | 385,000 | 419,337 |
| Clifton TX Higher Education Finance Corporation Education Revenue IDEA Public Schools Series 2021T | | 5.00 | 8-15-2031 | 435,000 | 475,231 |
| Clifton TX Higher Education Finance Corporation Education Revenue IDEA Public Schools Series 2021T | | 5.00 | 8-15-2032 | 515,000 | 563,375 |
| Clifton TX Higher Education Finance Corporation Education Revenue International Leadership Texas Series A | | 6.00 | 3-1-2029 | 2,150,000 | 2,177,843 |
| Clifton TX Higher Education Finance Corporation International Leadership Series 2015A | | 4.63 | 8-15-2025 | 5,400,000 | 5,389,891 |
| Clifton TX Higher Education Finance Corporation Uplift Education Series 2015A | | 4.00 | 12-1-2025 | 1,500,000 | 1,485,913 |
| Clifton TX Higher Education Finance Corporation Uplift Education Series 2018D | | 5.00 | 8-15-2025 | 6,565,000 | 6,604,561 |
| Hale Center Education Facilities Corporation Improvement and Revenue Refunding Bonds Wayland Baptist University Project | | 5.00 | 3-1-2028 | 1,635,000 | 1,706,325 |
| Hale Center Education Facilities Corporation Improvement and Revenue Refunding Bonds Wayland Baptist University Project | | 5.00 | 3-1-2029 | 1,015,000 | 1,063,812 |
| Hale Center Education Facilities Corporation Improvement and Revenue Refunding Bonds Wayland Baptist University Project | | 5.00 | 3-1-2030 | 2,040,000 | 2,144,422 |
| New Hope TX Cultural Education Facilities Finance Corporation Education Cumberland Academy Incorporated Series 2020A 144A | | 4.00 | 8-15-2030 | 1,735,000 | 1,613,663 |
| Odessa TX College District Revenue Consolidated Fund (AGM Insured) | | 4.00 | 7-1-2029 | 650,000 | 692,858 |
| Odessa TX College District Revenue Consolidated Fund (AGM Insured) | | 4.00 | 7-1-2030 | 870,000 | 933,837 |
| Odessa TX College District Revenue Consolidated Fund (AGM Insured) | | 4.00 | 7-1-2031 | 220,000 | 237,660 |
| Odessa TX College District Revenue Consolidated Fund (AGM Insured) | | 4.00 | 7-1-2032 | 460,000 | 492,944 |
| Odessa TX College District Revenue Consolidated Fund (AGM Insured) | | 4.00 | 7-1-2033 | 710,000 | 756,469 |
| Odessa TX College District Revenue Consolidated Fund (AGM Insured) | | 4.00 | 7-1-2034 | 500,000 | 528,018 |
| Odessa TX College District Revenue Consolidated Fund (AGM Insured) | | 4.00 | 7-1-2035 | 290,000 | 303,398 |
| | | | | | 33,795,290 |
The accompanying notes are an integral part of these financial statements.
Allspring Strategic Municipal Bond Fund | 47
Portfolio of investments—December 31, 2022 (unaudited)
| | | Interest
rate | Maturity
date | Principal | Value |
| GO revenue: 1.26% | | | | | |
| Brazosporight TX Independent School District School Building Series A | | 4.00% | 2-15-2029 | $ 2,355,000 | $ 2,454,488 |
| Cypress-Fairbanks Independent High School Series B-1 øø | | 0.28 | 2-15-2040 | 2,870,000 | 2,746,360 |
| Fort Bend TX Independent School District Various Refunding Series B øø | | 0.72 | 8-1-2051 | 1,290,000 | 1,147,016 |
| Grapevine Colleyville TX Independent School Building | | 5.00 | 8-15-2034 | 2,890,000 | 3,038,089 |
| Grapevine Colleyville TX Independent School Building | | 5.00 | 8-15-2035 | 1,600,000 | 1,678,692 |
| Leander TX Independent School District CAB Series 2014C ¤ | | 0.00 | 8-15-2035 | 2,975,000 | 1,636,108 |
| Northside Texas Independent School District School Building Bond | | 2.75 | 8-1-2048 | 11,275,000 | 11,201,131 |
| Northwest Texas Independent School District Refunding Bonds | | 5.00 | 2-15-2032 | 1,750,000 | 1,831,857 |
| | | | | | 25,733,741 |
| Health revenue: 0.27% | | | | | |
| Harris County TX Cultural Education Facilities Finance Corporation Revenue Texas Medical Center Series A øø | | 0.90 | 5-15-2050 | 1,500,000 | 1,389,829 |
| New Hope TX Cultural Education Facilities Finance Corporation Hospital Children's Health System of Texas Obligated Group Series 2017A | | 5.00 | 8-15-2026 | 2,000,000 | 2,144,205 |
| New Hope TX Cultural Education Facilities Finance Corporation Retirement Facility Presbyterian Village North Project | | 5.00 | 10-1-2023 | 1,570,000 | 1,566,152 |
| Tarrant County TX Cultural Education Facilities Finance Corporation Retirement Facility Revenue MRC Stevenson Oaks Project | | 3.00 | 11-15-2026 | 450,000 | 429,209 |
| | | | | | 5,529,395 |
| Housing revenue: 0.16% | | | | | |
| New Hope TX Cultural Education Facilities Finance Corporation Collegiate Housing Tarleton State University Project Series 2015A | | 5.00 | 4-1-2025 | 480,000 | 502,292 |
| New Hope TX Cultural Education Facilities Finance Corporation Stephenville LLC Tarleton State University Project Series 2013A | | 5.38 | 4-1-2028 | 1,845,000 | 1,854,898 |
| Travis County TX Housing Finance Corporation MFHR Airway Gateway Apartments | | 4.13 | 6-1-2045 | 1,000,000 | 1,006,682 |
| | | | | | 3,363,872 |
| Industrial development revenue: 0.26% | | | | | |
| Brazoria County TX Industrial Development Corporation Solid Waste Disposal Facilities Aleon Renewable Metals LLC 144A | | 10.00 | 6-1-2042 | 3,000,000 | 2,939,328 |
| Port Beaumont TX Navigation District Dock and Wharf Facility Revenue Jefferson Gulf Coast Energy 144A | | 2.50 | 1-1-2030 | 800,000 | 648,001 |
| Port Beaumont TX Navigation District Dock and Wharf Facility Revenue Jefferson Gulf Coast Energy 144A | | 2.63 | 1-1-2031 | 800,000 | 634,952 |
| Port Beaumont TX Navigation District Dock and Wharf Facility Revenue Jefferson Gulf Coast Energy 144A | | 2.75 | 1-1-2036 | 1,500,000 | 1,064,433 |
| | | | | | 5,286,714 |
| Miscellaneous revenue: 0.44% | | | | | |
| Lower Colorado River Authority Texas Transmission Contract Transmission Services Corporation Project | | 5.00 | 5-15-2028 | 1,845,000 | 1,890,474 |
The accompanying notes are an integral part of these financial statements.
48 | Allspring Strategic Municipal Bond Fund
Portfolio of investments—December 31, 2022 (unaudited)
| | | Interest
rate | Maturity
date | Principal | Value |
| Miscellaneous revenue (continued) | | | | | |
| Texas Transportation Commission Highway Improvement | | 5.00% | 4-1-2027 | $ 3,010,000 | $ 3,088,734 |
| Wise County TX Parker County Junior College District Project | | 5.00 | 8-15-2025 | 505,000 | 522,213 |
| Wise County TX Parker County Junior College District Project | | 5.00 | 8-15-2028 | 1,630,000 | 1,714,515 |
| Wise County TX Parker County Junior College District Project | | 5.00 | 8-15-2031 | 680,000 | 722,993 |
| Wise County TX Parker County Junior College District Project | | 5.00 | 8-15-2034 | 980,000 | 1,025,311 |
| | | | | | 8,964,240 |
| Transportation revenue: 0.45% | | | | | |
| Central Texas Regional Mobility Authority Revenue Senior Lien Series A | | 5.00 | 1-1-2023 | 500,000 | 500,000 |
| Central Texas Regional Mobility Authority Revenue Subordinated Lien BAN Series F | | 5.00 | 1-1-2025 | 2,000,000 | 2,051,938 |
| Harris County TX Cultural Education Facilities Finance Corporation Revenue Texas Medical Center Series A | | 5.00 | 8-15-2026 | 1,280,000 | ��1,352,539 |
| Texas Private Activity Bond Surface Transportation Corporation Senior Lien Revenue Refunding Bonds North Tarrant Express Managed Lanes Project Series A | | 5.00 | 12-31-2030 | 1,000,000 | 1,058,000 |
| Texas Private Activity Bond Surface Transportation Corporation Senior Lien Revenue Refunding Bonds North Tarrant Express Managed Lanes Project Series A | | 5.00 | 12-31-2032 | 1,000,000 | 1,053,158 |
| Texas Private Activity Bond Surface Transportation Corporation Senior Lien Revenue Refunding Bonds North Tarrant Express Managed Lanes Project Series A | | 5.00 | 12-31-2033 | 3,000,000 | 3,149,530 |
| | | | | | 9,165,165 |
| Utilities revenue: 0.40% | | | | | |
| Lower Colorado River Authority Texas Transmission Contract Transmission Services Corporation Project (AGM Insured) | | 5.00 | 5-15-2029 | 1,745,000 | 1,960,932 |
| Lower Colorado River Authority Texas Transmission Contract Transmission Services Corporation Project (AGM Insured) | | 5.00 | 5-15-2030 | 990,000 | 1,129,331 |
| San Antonio TX Electric & Gas Systems Various Revenue Refunding Bonds Junior Lien Series 2020 | | 1.75 | 2-1-2049 | 4,250,000 | 4,038,511 |
| Texas Municipal Gas Acquisition & Supply Corporation | | 5.00 | 12-15-2024 | 1,100,000 | 1,118,321 |
| | | | | | 8,247,095 |
| Water & sewer revenue: 0.86% | | | | | |
| Dallas TX Waterworks Refunding Bonds Series A | | 5.00 | 10-1-2029 | 16,225,000 | 17,505,195 |
| | | | | | 128,982,503 |
| Utah: 0.51% | | | | | |
| Airport revenue: 0.19% | | | | | |
| Salt Lake City UT Airport Revenue Bonds AMT Series 2018A | | 5.00 | 7-1-2029 | 1,000,000 | 1,063,054 |
| Salt Lake City UT Airport Revenue Bonds AMT Series 2018A | | 5.00 | 7-1-2031 | 2,705,000 | 2,871,528 |
| | | | | | 3,934,582 |
The accompanying notes are an integral part of these financial statements.
Allspring Strategic Municipal Bond Fund | 49
Portfolio of investments—December 31, 2022 (unaudited)
| | | Interest
rate | Maturity
date | Principal | Value |
| Education revenue: 0.07% | | | | | |
| Utah Charter School Finance Authority Freedom Academy Foundation St. George 144A | | 3.25% | 6-15-2031 | $ 540,000 | $ 478,614 |
| Utah Charter School Finance Authority Ronald Wilson Reagan Academy Project Series A 144A | | 3.50 | 2-15-2026 | 915,000 | 879,661 |
| | | | | | 1,358,275 |
| Miscellaneous revenue: 0.25% | | | | | |
| Mida Mountain Village Public Infrastructure District Mountain Village Assessment Area #2 144A | | 4.00 | 8-1-2024 | 1,000,000 | 991,683 |
| Mida Mountain Village Public Infrastructure District Mountain Village Assessment Area #2 144A | | 4.00 | 8-1-2026 | 1,000,000 | 974,041 |
| Mida Mountain Village Public Infrastructure District Mountain Village Assessment Area #2 144A | | 4.00 | 8-1-2028 | 1,000,000 | 950,323 |
| Mida Mountain Village Public Infrastructure District Mountain Village Assessment Area #2 144A | | 4.00 | 8-1-2029 | 580,000 | 542,710 |
| Mida Mountain Village Public Infrastructure District Mountain Village Assessment Area #2 144A | | 4.00 | 8-1-2030 | 680,000 | 626,063 |
| Mida Mountain Village Public Infrastructure District Utah Special Assessment Revenue Bonds Mountain Village Assessment Area #2 144A | | 4.00 | 8-1-2050 | 1,500,000 | 1,068,632 |
| | | | | | 5,153,452 |
| | | | | | 10,446,309 |
| Vermont: 0.13% | | | | | |
| Education revenue: 0.06% | | | | | |
| Vermont Student Assistance Corporation Series A | | 5.00 | 6-15-2023 | 1,200,000 | 1,209,586 |
| Housing revenue: 0.07% | | | | | |
| Vermont Housing Finance Agency Multiple Purpose Series A (GNMA / FNMA / FHLMC Insured) | | 3.75 | 11-1-2050 | 1,505,000 | 1,498,503 |
| | | | | | 2,708,089 |
| Virginia: 1.31% | | | | | |
| Education revenue: 0.05% | | | | | |
| Virginia College Building Authority Educational Facilities Regent University Project | | 5.00 | 6-1-2029 | 330,000 | 342,073 |
| Virginia College Building Authority Educational Facilities Regent University Project | | 5.00 | 6-1-2030 | 350,000 | 363,451 |
| Virginia College Building Authority Educational Facilities Regent University Project | | 5.00 | 6-1-2031 | 300,000 | 311,759 |
| | | | | | 1,017,283 |
| Health revenue: 0.03% | | | | | |
| Roanoke VA EDA Residential Care Facility Revenue Richfield Living | | 4.30 | 9-1-2030 | 770,000 | 603,047 |
| Transportation revenue: 0.71% | | | | | |
| Toll Road Investors Partnership II LP Series 1999B (National Public Finance Guaranty Insured) 144A¤ | | 0.00 | 2-15-2029 | 10,000,000 | 6,357,901 |
| Virginia SBA Financing Senior Lien Revenue Refunding Bonds 95 Express Lane LLC Project AMT | | 5.00 | 1-1-2032 | 3,225,000 | 3,441,745 |
The accompanying notes are an integral part of these financial statements.
50 | Allspring Strategic Municipal Bond Fund
Portfolio of investments—December 31, 2022 (unaudited)
| | | Interest
rate | Maturity
date | Principal | Value |
| Transportation revenue (continued) | | | | | |
| Virginia SBA Financing Senior Lien Revenue Refunding Bonds 95 Express Lane LLC Project AMT | | 5.00% | 7-1-2032 | $ 2,800,000 | $ 2,984,018 |
| Virginia Small Business Financing Authority Senior Lien Elizabeth River Crossings OpCo LLC Project | | 4.00 | 7-1-2029 | 1,750,000 | 1,744,067 |
| | | | | | 14,527,731 |
| Utilities revenue: 0.52% | | | | | |
| Chesapeake VA EDA Pollution Control Electric & Power Company Series 2008A | | 1.90 | 2-1-2032 | 4,250,000 | 4,202,403 |
| Louisa VA IDA PCR Bonds Virginia Electric and Power Company Project Series 2008C | | 1.65 | 11-1-2035 | 2,000,000 | 1,920,403 |
| Wise County VA IDA Solid Waste & Sewage Disposal Revenue Bond Virginia Electric & Power Company Project Series A øø | | 0.75 | 10-1-2040 | 5,000,000 | 4,531,827 |
| | | | | | 10,654,633 |
| | | | | | 26,802,694 |
| Washington: 2.26% | | | | | |
| Airport revenue: 0.10% | | | | | |
| Port of Seattle WA Intermediate Lien Revenue Bonds AMT Series 2018A | | 5.00 | 5-1-2036 | 2,030,000 | 2,102,581 |
| GO revenue: 0.20% | | | | | |
| Washington State Refunding Bonds Motor Vehicle Fuel Tax | | 5.00 | 6-1-2028 | 1,500,000 | 1,679,383 |
| Washington State Refunding Bonds Motor Vehicle Fuel Tax | | 5.00 | 6-1-2029 | 1,000,000 | 1,139,590 |
| Washington State Refunding Bonds Motor Vehicle Fuel Tax | | 5.00 | 6-1-2030 | 1,150,000 | 1,332,673 |
| | | | | | 4,151,646 |
| Health revenue: 1.01% | | | | | |
| Skagit County WA Public Hospital District Refunding Bonds and Improvement Skagit Regional Health | | 5.00 | 12-1-2029 | 3,975,000 | 4,153,472 |
| Washington HCFR Authority Catholic Health Initiatives Series 2013B-2 (SIFMA Municipal Swap +1.40%) ± | | 5.06 | 1-1-2035 | 11,000,000 | 11,047,909 |
| Washington HCFR Authority CommonSpirit Health Series 2019B-3 | | 5.00 | 8-1-2049 | 3,000,000 | 3,132,643 |
| Washington Housing Finance Commission Nonprofit Housing Revenue Eliseo Project Series B-2 144A | | 2.13 | 7-1-2027 | 1,500,000 | 1,344,176 |
| Washington Housing Finance Commission Nonprofit Housing Revenue Rockwood Retirement Communities 144A | | 3.00 | 7-1-2027 | 1,000,000 | 875,123 |
| | | | | | 20,553,323 |
| Housing revenue: 0.71% | | | | | |
| King County WA Housing Authority Workforce Housing Preservation Pooled Revenue Refunding Bond | | 2.00 | 10-1-2033 | 600,000 | 510,384 |
| King County WA Housing Authority Workforce Housing Preservation Pooled Revenue Refunding Bond | | 2.13 | 10-1-2036 | 2,000,000 | 1,598,335 |
| King County WA Housing Authority Workforce Housing Preservation Pooled Revenue Refunding Bond | | 4.00 | 10-1-2029 | 225,000 | 237,480 |
| King County WA Housing Authority Workforce Housing Preservation Pooled Revenue Refunding Bond | | 4.00 | 10-1-2030 | 200,000 | 209,099 |
| King County WA Housing Authority Workforce Housing Preservation Pooled Revenue Refunding Bond | | 4.00 | 10-1-2031 | 290,000 | 303,970 |
The accompanying notes are an integral part of these financial statements.
Allspring Strategic Municipal Bond Fund | 51
Portfolio of investments—December 31, 2022 (unaudited)
| | | Interest
rate | Maturity
date | Principal | Value |
| Housing revenue (continued) | | | | | |
| Seattle WA Housing Authority Northgate Plaza Project | | 1.00% | 6-1-2026 | $ 2,000,000 | $ 1,819,381 |
| Snohomish County WA Housing Authority | | 5.00 | 4-1-2027 | 1,130,000 | 1,211,988 |
| Snohomish County WA Housing Authority | | 5.00 | 4-1-2028 | 1,610,000 | 1,747,665 |
| Snohomish County WA Housing Authority | | 5.00 | 4-1-2029 | 1,690,000 | 1,853,992 |
| Washington Housing Finance Commission Downtowner Apartments Project (FHLMC LIQ) | | 3.70 | 7-1-2030 | 5,000,000 | 5,016,869 |
| | | | | | 14,509,163 |
| Tax revenue: 0.10% | | | | | |
| Central Puget Sound Washington Regional Transit Authority Sales & Use Tax Refunding & Improvement Green Bonds Series S-1 | | 5.00 | 11-1-2036 | 1,000,000 | 1,064,867 |
| Central Puget Sound Washington Regional Transit Authority Sales & Use Tax Refunding & Improvement Green Bonds Series S-1 | | 5.00 | 11-1-2050 | 810,000 | 862,542 |
| | | | | | 1,927,409 |
| Utilities revenue: 0.14% | | | | | |
| Seattle WA Municipal Light & Power Refunding Bond Series B (SIFMA Municipal Swap +0.25%) ± | | 3.91 | 5-1-2045 | 3,000,000 | 2,941,601 |
| | | | | | 46,185,723 |
| West Virginia: 0.50% | | | | | |
| Education revenue: 0.05% | | | | | |
| West Virginia University Revenues Refunding Bonds West Virginia University Projects Series B | | 5.00 | 10-1-2041 | 1,000,000 | 1,098,615 |
| Tax revenue: 0.16% | | | | | |
| Monongalia County WV Commission Special District Excise Tax University Town Center Series A 144A | | 4.13 | 6-1-2043 | 900,000 | 781,213 |
| Monongalia County WV Commission Special District Excise Tax University Town Center Series A 144A | | 4.50 | 6-1-2027 | 2,490,000 | 2,450,837 |
| | | | | | 3,232,050 |
| Utilities revenue: 0.25% | | | | | |
| West Virginia EDA Solid Waste Disposal Facilities Revenue Refunding Bonds Wheeling Power Company Mitchell Project Series 2013A | | 3.00 | 6-1-2037 | 5,245,000 | 4,975,780 |
| Water & sewer revenue: 0.04% | | | | | |
| Parkersburg WV Waterworks & Sewerage System Series A (BAM Insured) | | 3.00 | 8-1-2024 | 400,000 | 400,287 |
| Parkersburg WV Waterworks & Sewerage System Series A (BAM Insured) | | 3.00 | 8-1-2025 | 400,000 | 399,695 |
| | | | | | 799,982 |
| | | | | | 10,106,427 |
| Wisconsin: 3.29% | | | | | |
| Education revenue: 0.37% | | | | | |
| Corvian County WI Community School Revenue 144A | | 4.25 | 6-15-2029 | 870,000 | 818,369 |
| Milwaukee WI RDA Science Education Consortium Incorporated Project Series A | | 4.75 | 8-1-2023 | 220,000 | 221,109 |
| Pine Lake WI PFA Pine Lake Preparatory School 144A | | 4.35 | 3-1-2025 | 1,130,000 | 1,126,243 |
The accompanying notes are an integral part of these financial statements.
52 | Allspring Strategic Municipal Bond Fund
Portfolio of investments—December 31, 2022 (unaudited)
| | | Interest
rate | Maturity
date | Principal | Value |
| Education revenue (continued) | | | | | |
| Wisconsin PFA Charter School Revenue American Preparatory Academy 144A | | 4.00% | 7-15-2029 | $ 650,000 | $ 611,042 |
| Wisconsin PFA Conference Center & Hotel Revenue Foundation of The University of North Carolina at Charlotte Incorporated Series A 144A | | 4.00 | 9-1-2036 | 1,000,000 | 885,627 |
| Wisconsin PFA Education Revenue Corvian Community School Series A 144A | | 4.00 | 6-15-2029 | 905,000 | 838,625 |
| Wisconsin PFA Education Revenue Triad Educational Services Incorporated | | 4.25 | 6-15-2027 | 480,000 | 477,895 |
| Wisconsin PFA Education Revenue Triad Educational Services Incorporated | | 5.00 | 6-15-2032 | 725,000 | 753,083 |
| Wisconsin PFA Educational Facility Revenue Estancia Valley Classical Academy Project Series A 144A | | 4.00 | 7-1-2031 | 1,150,000 | 1,003,582 |
| Wisconsin PFA Revenue Refunding Bonds Roseman University of Health Sciences Project 144A | | 4.00 | 4-1-2032 | 900,000 | 827,707 |
| | | | | | 7,563,282 |
| GO revenue: 1.04% | | | | | |
| Eau Claire WI Area School District Refunding Bonds | | 5.00 | 4-1-2023 | 1,860,000 | 1,868,455 |
| Eau Claire WI Area School District Refunding Bonds | | 5.00 | 4-1-2024 | 1,000,000 | 1,025,417 |
| Wisconsin Series B | | 5.00 | 5-1-2031 | 12,230,000 | 13,145,746 |
| Wisconsin Series B | | 5.00 | 5-1-2034 | 5,000,000 | 5,228,644 |
| | | | | | 21,268,262 |
| Health revenue: 0.55% | | | | | |
| Entrance Fee Principal PFA Searstone Project Series B-2 144A | | 2.25 | 6-1-2027 | 1,840,000 | 1,642,650 |
| Wisconsin HEFA Beloit Health System Incorporated | | 5.00 | 7-1-2027 | 1,145,000 | 1,220,257 |
| Wisconsin HEFA Beloit Health System Incorporated | | 5.00 | 7-1-2028 | 600,000 | 647,277 |
| Wisconsin HEFA St. Camillus Health System Incorporated | | 5.00 | 11-1-2027 | 375,000 | 363,725 |
| Wisconsin HEFA St. Camillus Health System Incorporated | | 5.00 | 11-1-2028 | 470,000 | 452,722 |
| Wisconsin HEFA St. John's Community Incorporated Project | | 4.00 | 9-15-2029 | 895,000 | 847,469 |
| Wisconsin PFA Hospital Revenue Carson Valley Medical Center Series A | | 4.00 | 12-1-2031 | 700,000 | 663,914 |
| Wisconsin PFA Revenue Providence St. Joseph Health Obligated Group Series C | | 4.00 | 10-1-2041 | 3,000,000 | 3,084,824 |
| Wisconsin PFA Revenue Texas Biomedical Research Institute Series A | | 5.00 | 6-1-2029 | 175,000 | 187,876 |
| Wisconsin PFA Revenue Texas Biomedical Research Institute Series A | | 5.00 | 6-1-2030 | 175,000 | 189,546 |
| Wisconsin PFA Revenue Texas Biomedical Research Institute Series A | | 5.00 | 6-1-2031 | 275,000 | 300,086 |
| Wisconsin PFA Revenue Texas Biomedical Research Institute Series A | | 5.00 | 6-1-2032 | 350,000 | 375,681 |
| Wisconsin PFA Revenue Texas Biomedical Research Institute Series A | | 5.00 | 6-1-2033 | 550,000 | 588,543 |
| Wisconsin PFA Revenue Texas Biomedical Research Institute Series A | | 5.00 | 6-1-2034 | 570,000 | 608,683 |
| | | | | | 11,173,253 |
The accompanying notes are an integral part of these financial statements.
Allspring Strategic Municipal Bond Fund | 53
Portfolio of investments—December 31, 2022 (unaudited)
| | | Interest
rate | Maturity
date | Principal | Value |
| Industrial development revenue: 0.31% | | | | | |
| Wisconsin PFA Grand Hyatt San Antonio Hotel Acquisition Project Series 2022A | | 3.75% | 2-1-2032 | $ 850,000 | $ 784,821 |
| Wisconsin PFA Series 2022A 144A | | 5.50 | 2-1-2042 | 5,950,000 | 5,486,974 |
| | | | | | 6,271,795 |
| Miscellaneous revenue: 0.16% | | | | | |
| Wisconsin State Series 2 | | 5.00 | 11-1-2029 | 3,000,000 | 3,232,574 |
| Tax revenue: 0.77% | | | | | |
| Wisconsin Center District Tax Revenue CAB Junior Dedicated Series D ¤ | | 0.00 | 12-15-2028 | 260,000 | 212,070 |
| Wisconsin Center District Tax Revenue CAB Junior Dedicated Series D ¤ | | 0.00 | 12-15-2029 | 390,000 | 305,554 |
| Wisconsin Center District Tax Revenue CAB Junior Dedicated Series D ¤ | | 0.00 | 12-15-2030 | 550,000 | 413,265 |
| Wisconsin Center District Tax Revenue CAB Senior Dedicated Series C (AGM Insured) ¤ | | 0.00 | 12-15-2029 | 1,050,000 | 811,496 |
| Wisconsin Center District Tax Revenue CAB Senior Dedicated Series C (AGM Insured) ¤ | | 0.00 | 12-15-2031 | 1,350,000 | 951,601 |
| Wisconsin State General Fund Annual Appropriations Series A | | 5.00 | 5-1-2028 | 11,775,000 | 12,926,754 |
| | | | | | 15,620,740 |
| Water & sewer revenue: 0.09% | | | | | |
| Wisconsin Clean Water Refunding Bonds | | 5.00 | 6-1-2023 | 310,000 | 312,526 |
| Wisconsin Clean Water Refunding Bonds | | 5.00 | 6-1-2026 | 1,525,000 | 1,570,767 |
| | | | | | 1,883,293 |
| | | | | | 67,013,199 |
| Total Municipal obligations (Cost $2,115,481,512) | | | | | 2,018,035,334 |
| | | Yield | | Shares | |
| Short-term investments: 0.12% | | | | | |
| Investment companies: 0.12% | | | | | |
| Allspring Municipal Cash Management Money Market Fund Institutional Class ♠∞## | | 3.56 | | 2,429,076 | 2,429,561 |
| Total Short-term investments (Cost $2,429,561) | | | | | 2,429,561 |
| Total investments in securities (Cost $2,117,911,073) | 99.07% | | | | 2,020,464,895 |
| Other assets and liabilities, net | 0.93 | | | | 18,894,721 |
| Total net assets | 100.00% | | | | $2,039,359,616 |
The accompanying notes are an integral part of these financial statements.
54 | Allspring Strategic Municipal Bond Fund
Portfolio of investments—December 31, 2022 (unaudited)
| 144A | The security may be resold in transactions exempt from registration, normally to qualified institutional buyers, pursuant to Rule 144A under the Securities Act of 1933. |
| øø | The interest rate is determined and reset by the issuer periodically depending upon the terms of the security. The rate shown is the rate in effect at period end. |
| € | The security is an auction-rate security which has an interest rate that resets at predetermined short-term intervals through a Dutch auction. The rate shown is the rate in effect at period end. |
| ± | Variable rate investment. The rate shown is the rate in effect at period end. |
| ¤ | The security is issued in zero coupon form with no periodic interest payments. |
| ø | Variable rate demand notes are subject to a demand feature which reduces the effective maturity. The maturity date shown represents the final maturity date of the security. The interest rate is determined and reset by the issuer daily, weekly, or monthly depending upon the terms of the security. The rate shown is the rate in effect at period end. |
| † | Non-income-earning security |
| ## | All or a portion of this security is segregated for when-issued securities. |
| ♠ | The issuer of the security is an affiliated person of the Fund as defined in the Investment Company Act of 1940. |
| ∞ | The rate represents the 7-day annualized yield at period end. |
| %% | The security is purchased on a when-issued basis. |
| Abbreviations: |
| AGC | Assured Guaranty Corporation |
| AGM | Assured Guaranty Municipal |
| Ambac | Ambac Financial Group Incorporated |
| AMT | Alternative minimum tax |
| BAM | Build America Mutual Assurance Company |
| BAN | Bond anticipation notes |
| CAB | Capital appreciation bond |
| CDA | Community Development Authority |
| ECFA | Educational & Cultural Facilities Authority |
| EDA | Economic Development Authority |
| EDFA | Economic Development Finance Authority |
| FHA | Federal Housing Administration |
| FHLMC | Federal Home Loan Mortgage Corporation |
| FNMA | Federal National Mortgage Association |
| GNMA | Government National Mortgage Association |
| GO | General obligation |
| HCFR | Healthcare facilities revenue |
| HEFA | Health & Educational Facilities Authority |
| HEFAR | Higher Education Facilities Authority Revenue |
| HFA | Housing Finance Authority |
| IDA | Industrial Development Authority |
| LIBOR | London Interbank Offered Rate |
| LIQ | Liquidity agreement |
| LOC | Letter of credit |
| MFHR | Multifamily housing revenue |
| NPFGC | National Public Finance Guarantee Corporation |
| PCFA | Pollution Control Financing Authority |
| PCR | Pollution control revenue |
| PFA | Public Finance Authority |
| RDA | Redevelopment Authority |
| SBA | Small Business Authority |
| SIFMA | Securities Industry and Financial Markets Association |
| SOFR | Secured Overnight Financing Rate |
| TTFA | Transportation Trust Fund Authority |
The accompanying notes are an integral part of these financial statements.
Allspring Strategic Municipal Bond Fund | 55
Portfolio of investments—December 31, 2022 (unaudited)
Investments in affiliates
An affiliated investment is an investment in which the Fund owns at least 5% of the outstanding voting shares of the issuer or as a result of other relationships, such as the Fund and the issuer having the same investment manager. Transactions with issuers that were affiliates of the Fund at the end of the period were as follows:
| | Value,
beginning of
period | Purchases | Sales
proceeds | Net
realized
gains
(losses) | Net
change in
unrealized
gains
(losses) | Value,
end of
period | Shares,
end
of period | Income
from
affiliated
securities |
| Short-term investments | | | | | | | |
| Allspring Municipal Cash Management Money Market Fund Institutional Class | $63,253,150 | $386,096,006 | $(446,898,952) | $(18,520) | $(2,123) | $2,429,561 | 2,429,076 | $376,780 |
The accompanying notes are an integral part of these financial statements.
56 | Allspring Strategic Municipal Bond Fund
Statement of assets and liabilities—December 31, 2022 (unaudited)
| | |
| Assets | |
Investments in unaffiliated securities, at value (cost $2,115,481,512)
| $ 2,018,035,334 |
Investments in affiliated securities, at value (cost $2,429,561)
| 2,429,561 |
Cash
| 3,005,670 |
Cash due from broker
| 367,638 |
Receivable for interest
| 21,086,730 |
Receivable for Fund shares sold
| 11,061,301 |
Receivable for investments sold
| 1,212,986 |
Prepaid expenses and other assets
| 93,751 |
Total assets
| 2,057,292,971 |
| Liabilities | |
Payable for Fund shares redeemed
| 13,760,275 |
Payable for when-issued transactions
| 2,304,711 |
Dividends payable
| 771,838 |
Management fee payable
| 686,752 |
Administration fees payable
| 185,071 |
Distribution fee payable
| 22,077 |
Trustees’ fees and expenses payable
| 7,118 |
Accrued expenses and other liabilities
| 195,513 |
Total liabilities
| 17,933,355 |
Total net assets
| $2,039,359,616 |
| Net assets consist of | |
Paid-in capital
| $ 2,166,278,440 |
Total distributable loss
| (126,918,824) |
Total net assets
| $2,039,359,616 |
| Computation of net asset value and offering price per share | |
Net assets – Class A
| $ 427,495,963 |
Shares outstanding – Class A1
| 49,629,732 |
Net asset value per share – Class A
| $8.61 |
Maximum offering price per share – Class A2
| $8.97 |
Net assets – Class C
| $ 32,084,418 |
Shares outstanding – Class C1
| 3,711,997 |
Net asset value per share – Class C
| $8.64 |
Net assets – Class R6
| $ 7,004,268 |
Shares outstanding – Class R61
| 812,945 |
Net asset value per share – Class R6
| $8.62 |
Net assets – Administrator Class
| $ 50,591,488 |
Shares outstanding – Administrator Class1
| 5,876,206 |
Net asset value per share – Administrator Class
| $8.61 |
Net assets – Institutional Class
| $ 1,522,183,479 |
Shares outstanding – Institutional Class1
| 176,763,513 |
Net asset value per share – Institutional Class
| $8.61 |
| 1 | The Fund has an unlimited number of authorized shares. |
| 2 | Maximum offering price is computed as 100/96 of net asset value. On investments of $50,000 or more, the offering price is reduced. |
The accompanying notes are an integral part of these financial statements.
Allspring Strategic Municipal Bond Fund | 57
Statement of operations—six months ended December 31, 2022 (unaudited)
| | |
| Investment income | |
Interest
| $ 30,304,558 |
Income from affiliated securities
| 376,780 |
Total investment income
| 30,681,338 |
| Expenses | |
Management fee
| 4,222,097 |
| Administration fees | |
Class A
| 388,749 |
Class C
| 29,238 |
Class R6
| 1,591 |
Administrator Class
| 31,973 |
Institutional Class
| 682,556 |
| Shareholder servicing fees | |
Class A
| 606,430 |
Class C
| 45,493 |
Administrator Class
| 79,101 |
| Distribution fee | |
Class C
| 136,478 |
Custody and accounting fees
| 58,573 |
Professional fees
| 39,869 |
Registration fees
| 65,052 |
Shareholder report expenses
| 41,942 |
Trustees’ fees and expenses
| 11,158 |
Other fees and expenses
| 26,503 |
Total expenses
| 6,466,803 |
| Less: Fee waivers and/or expense reimbursements | |
Class A
| (866) |
Class C
| (22) |
Class R6
| (24) |
Administrator Class
| (17,612) |
Institutional Class
| (1,844) |
Net expenses
| 6,446,435 |
Net investment income
| 24,234,903 |
| Realized and unrealized gains (losses) on investments | |
| Net realized gains (losses) on | |
Unaffiliated securities
| (10,591,684) |
Affiliated securities
| (18,520) |
Futures contracts
| 31,058 |
Net realized losses on investments
| (10,579,146) |
| Net change in unrealized gains (losses) on | |
Unaffiliated securities
| (9,816,832) |
Affiliated securities
| (2,123) |
Futures contracts
| 56,590 |
Net change in unrealized gains (losses) on investments
| (9,762,365) |
Net realized and unrealized gains (losses) on investments
| (20,341,511) |
Net increase in net assets resulting from operations
| $ 3,893,392 |
The accompanying notes are an integral part of these financial statements.
58 | Allspring Strategic Municipal Bond Fund
Statement of changes in net assets
| | | | | |
| | Six months ended
December 31, 2022
(unaudited) | Year ended
June 30, 2022 |
| Operations | | | | |
Net investment income
| | $ 24,234,903 | | $ 47,681,555 |
Net realized losses on investments
| | (10,579,146) | | (10,033,222) |
Net change in unrealized gains (losses) on investments
| | (9,762,365) | | (200,621,301) |
Net increase (decrease) in net assets resulting from operations
| | 3,893,392 | | (162,972,968) |
| Distributions to shareholders from | | | | |
| Net investment income and net realized gains | | | | |
Class A
| | (4,543,249) | | (8,226,378) |
Class C
| | (204,828) | | (312,087) |
Class R6
| | (119,037) | | (240,075) |
Administrator Class
| | (630,438) | | (1,512,513) |
Institutional Class
| | (18,743,101) | | (37,387,253) |
Total distributions to shareholders
| | (24,240,653) | | (47,678,306) |
| Capital share transactions | Shares | | Shares | |
| Proceeds from shares sold | | | | |
Class A
| 5,343,555 | 46,073,057 | 10,739,692 | 98,440,532 |
Class C
| 382,474 | 3,287,413 | 636,058 | 5,888,091 |
Class R6
| 143,376 | 1,234,476 | 576,086 | 5,291,077 |
Administrator Class
| 501,620 | 4,292,033 | 3,043,843 | 28,151,678 |
Institutional Class
| 55,014,224 | 474,023,317 | 105,486,944 | 953,288,175 |
| | | 528,910,296 | | 1,091,059,553 |
| Reinvestment of distributions | | | | |
Class A
| 465,411 | 4,001,068 | 813,995 | 7,373,477 |
Class C
| 22,058 | 190,223 | 31,998 | 289,895 |
Class R6
| 9,384 | 80,708 | 16,150 | 146,388 |
Administrator Class
| 69,699 | 599,660 | 162,068 | 1,469,491 |
Institutional Class
| 1,855,878 | 15,958,669 | 3,602,410 | 32,646,734 |
| | | 20,830,328 | | 41,925,985 |
| Payment for shares redeemed | | | | |
Class A
| (14,770,124) | (127,004,352) | (19,694,585) | (177,517,874) |
Class C
| (1,250,127) | (10,823,723) | (2,145,684) | (19,520,756) |
Class R6
| (607,907) | (5,215,918) | (1,210,075) | (11,157,810) |
Administrator Class
| (3,549,813) | (30,609,644) | (6,280,931) | (56,916,202) |
Institutional Class
| (88,283,205) | (758,980,234) | (143,530,875) | (1,284,623,827) |
| | | (932,633,871) | | (1,549,736,469) |
Net decrease in net assets resulting from capital share transactions
| | (382,893,247) | | (416,750,931) |
Total decrease in net assets
| | (403,240,508) | | (627,402,205) |
| Net assets | | | | |
Beginning of period
| | 2,442,600,124 | | 3,070,002,329 |
End of period
| | $2,039,359,616 | | $ 2,442,600,124 |
The accompanying notes are an integral part of these financial statements.
Allspring Strategic Municipal Bond Fund | 59
Financial highlights
(For a share outstanding throughout each period)
| | | Year ended June 30 |
| Class A | Six months ended
December 31, 2022
(unaudited) | 2022 | 2021 | 2020 | 2019 | 2018 |
Net asset value, beginning of period
| $8.68 | $9.33 | $9.17 | $9.14 | $8.93 | $8.94 |
Net investment income
| 0.08 | 0.13 | 0.14 | 0.17 | 0.18 | 0.15 |
Net realized and unrealized gains (losses) on investments
| (0.07) | (0.65) | 0.16 | 0.03 | 0.21 | 0.01 |
Total from investment operations
| 0.01 | (0.52) | 0.30 | 0.20 | 0.39 | 0.16 |
| Distributions to shareholders from | | | | | | |
Net investment income
| (0.08) | (0.13) | (0.14) | (0.16) | (0.18) | (0.15) |
Net realized gains
| 0.00 | 0.00 | 0.00 | (0.01) | 0.00 | (0.02) |
Total distributions to shareholders
| (0.08) | (0.13) | (0.14) | (0.17) | (0.18) | (0.17) |
Net asset value, end of period
| $8.61 | $8.68 | $9.33 | $9.17 | $9.14 | $8.93 |
Total return1
| 0.14% | (5.66)% | 3.26% | 2.23% | 4.41% | 1.82% |
| Ratios to average net assets (annualized) | | | | | | |
Gross expenses
| 0.80% | 0.79% | 0.79% | 0.79% | 0.80% | 0.82% |
Net expenses
| 0.80% | 0.79% | 0.79% | 0.79% | 0.80% | 0.82% |
Net investment income
| 1.87% | 1.38% | 1.47% | 1.81% | 1.99% | 1.69% |
| Supplemental data | | | | | | |
Portfolio turnover rate
| 4% | 24% | 11% | 26% | 29% | 33% |
Net assets, end of period (000s omitted)
| $427,496 | $508,573 | $622,409 | $545,670 | $528,004 | $491,128 |
| 1 | Total return calculations do not include any sales charges. Returns for periods of less than one year are not annualized. |
The accompanying notes are an integral part of these financial statements.
60 | Allspring Strategic Municipal Bond Fund
Financial highlights
(For a share outstanding throughout each period)
| | | Year ended June 30 |
| Class C | Six months ended
December 31, 2022
(unaudited) | 2022 | 2021 | 2020 | 2019 | 2018 |
Net asset value, beginning of period
| $8.71 | $9.36 | $9.20 | $9.17 | $8.96 | $8.97 |
Net investment income
| 0.05 | 0.06 | 0.07 | 0.10 | 0.11 1 | 0.08 1 |
Net realized and unrealized gains (losses) on investments
| (0.07) | (0.65) | 0.16 | 0.04 | 0.21 | 0.01 |
Total from investment operations
| (0.02) | (0.59) | 0.23 | 0.14 | 0.32 | 0.09 |
| Distributions to shareholders from | | | | | | |
Net investment income
| (0.05) | (0.06) | (0.07) | (0.10) | (0.11) | (0.08) |
Net realized gains
| 0.00 | 0.00 | 0.00 | (0.01) | 0.00 | (0.02) |
Total distributions to shareholders
| (0.05) | (0.06) | (0.07) | (0.11) | (0.11) | (0.10) |
Net asset value, end of period
| $8.64 | $8.71 | $9.36 | $9.20 | $9.17 | $8.96 |
Total return2
| (0.24)% | (6.34)% | 2.49% | 1.47% | 3.62% | 1.06% |
| Ratios to average net assets (annualized) | | | | | | |
Gross expenses
| 1.54% | 1.54% | 1.54% | 1.54% | 1.55% | 1.57% |
Net expenses
| 1.54% | 1.54% | 1.54% | 1.54% | 1.55% | 1.57% |
Net investment income
| 1.12% | 0.62% | 0.72% | 1.06% | 1.24% | 0.94% |
| Supplemental data | | | | | | |
Portfolio turnover rate
| 4% | 24% | 11% | 26% | 29% | 33% |
Net assets, end of period (000s omitted)
| $32,084 | $39,696 | $56,483 | $69,472 | $82,331 | $115,518 |
| 1 | Calculated based upon average shares outstanding |
| 2 | Total return calculations do not include any sales charges. Returns for periods of less than one year are not annualized. |
The accompanying notes are an integral part of these financial statements.
Allspring Strategic Municipal Bond Fund | 61
Financial highlights
(For a share outstanding throughout each period)
| | | Year ended June 30 |
| Class R6 | Six months ended
December 31, 2022
(unaudited) | 2022 | 2021 | 2020 | 2019 1 |
Net asset value, beginning of period
| $8.68 | $9.33 | $9.17 | $9.15 | $8.94 |
Net investment income
| 0.10 | 0.16 | 0.17 | 0.20 | 0.20 |
Net realized and unrealized gains (losses) on investments
| (0.06) | (0.65) | 0.16 | 0.03 | 0.21 |
Total from investment operations
| 0.04 | (0.49) | 0.33 | 0.23 | 0.41 |
| Distributions to shareholders from | | | | | |
Net investment income
| (0.10) | (0.16) | (0.17) | (0.20) | (0.20) |
Net realized gains
| 0.00 | 0.00 | 0.00 | (0.01) | 0.00 |
Total distributions to shareholders
| (0.10) | (0.16) | (0.17) | (0.21) | (0.20) |
Net asset value, end of period
| $8.62 | $8.68 | $9.33 | $9.17 | $9.15 |
Total return2
| 0.45% | (5.30)% | 3.65% | 2.51% | 4.61% |
| Ratios to average net assets (annualized) | | | | | |
Gross expenses
| 0.42% | 0.41% | 0.41% | 0.41% | 0.41% |
Net expenses
| 0.42% | 0.41% | 0.41% | 0.41% | 0.41% |
Net investment income
| 2.24% | 1.74% | 1.85% | 2.19% | 2.39% |
| Supplemental data | | | | | |
Portfolio turnover rate
| 4% | 24% | 11% | 26% | 29% |
Net assets, end of period (000s omitted)
| $7,004 | $11,008 | $17,590 | $20,459 | $13,291 |
| 1 | For the period from July 31, 2018 (commencement of class operations) to June 30, 2019 |
| 2 | Returns for periods of less than one year are not annualized. |
The accompanying notes are an integral part of these financial statements.
62 | Allspring Strategic Municipal Bond Fund
Financial highlights
(For a share outstanding throughout each period)
| | | Year ended June 30 |
| Administrator Class | Six months ended
December 31, 2022
(unaudited) | 2022 | 2021 | 2020 | 2019 | 2018 |
Net asset value, beginning of period
| $8.68 | $9.32 | $9.17 | $9.14 | $8.93 | $8.93 |
Net investment income
| 0.09 1 | 0.13 | 0.15 | 0.17 | 0.19 | 0.16 |
Net realized and unrealized gains (losses) on investments
| (0.07) | (0.63) | 0.15 | 0.04 | 0.21 | 0.02 |
Total from investment operations
| 0.02 | (0.50) | 0.30 | 0.21 | 0.40 | 0.18 |
| Distributions to shareholders from | | | | | | |
Net investment income
| (0.09) | (0.14) | (0.15) | (0.17) | (0.19) | (0.16) |
Net realized gains
| 0.00 | 0.00 | 0.00 | (0.01) | 0.00 | (0.02) |
Total distributions to shareholders
| (0.09) | (0.14) | (0.15) | (0.18) | (0.19) | (0.18) |
Net asset value, end of period
| $8.61 | $8.68 | $9.32 | $9.17 | $9.14 | $8.93 |
Total return2
| 0.20% | (5.46)% | 3.27% | 2.34% | 4.53% | 2.07% |
| Ratios to average net assets (annualized) | | | | | | |
Gross expenses
| 0.73% | 0.73% | 0.73% | 0.73% | 0.73% | 0.76% |
Net expenses
| 0.68% | 0.68% | 0.68% | 0.68% | 0.68% | 0.68% |
Net investment income
| 1.97% | 1.48% | 1.58% | 1.92% | 2.10% | 1.80% |
| Supplemental data | | | | | | |
Portfolio turnover rate
| 4% | 24% | 11% | 26% | 29% | 33% |
Net assets, end of period (000s omitted)
| $50,591 | $76,816 | $111,200 | $115,889 | $149,097 | $191,723 |
| 1 | Calculated based upon average shares outstanding |
| 2 | Returns for periods of less than one year are not annualized. |
The accompanying notes are an integral part of these financial statements.
Allspring Strategic Municipal Bond Fund | 63
Financial highlights
(For a share outstanding throughout each period)
| | | Year ended June 30 |
| Institutional Class | Six months ended
December 31, 2022
(unaudited) | 2022 | 2021 | 2020 | 2019 | 2018 |
Net asset value, beginning of period
| $8.68 | $9.32 | $9.17 | $9.14 | $8.93 | $8.94 |
Net investment income
| 0.10 | 0.16 | 0.17 | 0.20 | 0.21 | 0.18 |
Net realized and unrealized gains (losses) on investments
| (0.07) | (0.64) | 0.15 | 0.04 | 0.21 | 0.01 |
Total from investment operations
| 0.03 | (0.48) | 0.32 | 0.24 | 0.42 | 0.19 |
| Distributions to shareholders from | | | | | | |
Net investment income
| (0.10) | (0.16) | (0.17) | (0.20) | (0.21) | (0.18) |
Net realized gains
| 0.00 | 0.00 | 0.00 | (0.01) | 0.00 | (0.02) |
Total distributions to shareholders
| (0.10) | (0.16) | (0.17) | (0.21) | (0.21) | (0.20) |
Net asset value, end of period
| $8.61 | $8.68 | $9.32 | $9.17 | $9.14 | $8.93 |
Total return1
| 0.30% | (5.25)% | 3.49% | 2.57% | 4.75% | 2.16% |
| Ratios to average net assets (annualized) | | | | | | |
Gross expenses
| 0.47% | 0.46% | 0.46% | 0.46% | 0.47% | 0.49% |
Net expenses
| 0.47% | 0.46% | 0.46% | 0.46% | 0.47% | 0.48% |
Net investment income
| 2.20% | 1.71% | 1.80% | 2.14% | 2.32% | 2.05% |
| Supplemental data | | | | | | |
Portfolio turnover rate
| 4% | 24% | 11% | 26% | 29% | 33% |
Net assets, end of period (000s omitted)
| $1,522,183 | $1,806,507 | $2,262,320 | $1,829,368 | $1,647,093 | $1,224,170 |
| 1 | Returns for periods of less than one year are not annualized. |
The accompanying notes are an integral part of these financial statements.
64 | Allspring Strategic Municipal Bond Fund
Notes to financial statements (unaudited)
1. ORGANIZATION
Allspring Funds Trust (the "Trust"), a Delaware statutory trust organized on March 10, 1999, is an open-end management investment company registered under the Investment Company Act of 1940, as amended (the "1940 Act"). As an investment company, the Trust follows the accounting and reporting guidance in Financial Accounting Standards Board ("FASB") Accounting Standards Codification Topic 946, Financial Services – Investment Companies. These financial statements report on the Allspring Strategic Municipal Bond Fund (the "Fund") which is a diversified series of the Trust.
2. SIGNIFICANT ACCOUNTING POLICIES
The following significant accounting policies, which are consistently followed in the preparation of the financial statements of the Fund, are in conformity with U.S. generally accepted accounting principles which require management to make estimates and assumptions that affect the reported amounts of assets and liabilities, disclosure of contingent assets and liabilities at the date of the financial statements, and the reported amounts of income and expenses during the reporting period. Actual results could differ from those estimates.
Securities valuation
All investments are valued each business day as of the close of regular trading on the New York Stock Exchange (generally 4 p.m. Eastern Time), although the Fund may deviate from this calculation time under unusual or unexpected circumstances.
Debt securities are valued at the evaluated bid price provided by an independent pricing service (e.g. taking into account various factors, including yields, maturities, or credit ratings) or, if a reliable price is not available, the quoted bid price from an independent broker-dealer.
Futures contracts that are listed on a foreign or domestic exchange or market are valued at the official closing price or, if none, the last sales price.
Investments in registered open-end investment companies (other than those listed on a foreign or domestic exchange or market) are valued at net asset value.
Investments which are not valued using the methods discussed above are valued at their fair value, as determined in good faith by Allspring Funds Management, LLC ("Allspring Funds Management"), which was named the valuation designee by the Board of Trustees. As the valuation designee, Allspring Funds Management is responsible for day-to-day valuation activities for the Allspring Funds. In connection with these responsibilities, Allspring Funds Management has established a Valuation Committee and has delegated to it the authority to take any actions regarding the valuation of portfolio securities that the Valuation Committee deems necessary or appropriate, including determining the fair value of portfolio securities. On a quarterly basis, the Board of Trustees receives reports of valuation actions taken by the Valuation Committee. On at least an annual basis, the Board of Trustees receives an assessment of the adequacy and effectiveness of Allspring Funds Management's process for determining the fair value of the portfolio of investments.
When-issued transactions
The Fund may purchase securities on a forward commitment or when-issued basis. The Fund records a when-issued transaction on the trade date and will segregate assets in an amount at least equal in value to the Fund's commitment to purchase when-issued securities. Securities purchased on a when-issued basis are marked-to-market daily and the Fund begins earning interest on the settlement date. Losses may arise due to changes in the market value of the underlying securities or if the counterparty does not perform under the contract.
Futures contracts
Futures contracts are agreements between the Fund and a counterparty to buy or sell a specific amount of a commodity, financial instrument or currency at a specified price on a specified date. The Fund may buy and sell futures contracts in order to gain exposure to, or protect against, changes in interest rates and is subject to interest rate risk. The primary risks associated with the use of futures contracts are the imperfect correlation between changes in market values of securities held by the Fund and the prices of futures contracts, and the possibility of an illiquid market. Futures contracts are generally entered into on a regulated futures exchange and cleared through a clearinghouse associated with the exchange. With futures contracts, there is minimal counterparty risk to the Fund since futures contracts are exchange traded and the exchange’s clearinghouse, as the counterparty to all exchange-traded futures, guarantees the futures contracts against default.
Upon entering into a futures contract, the Fund is required to deposit either cash or securities (initial margin) with the broker in an amount equal to a certain percentage of the contract value. Subsequent payments (variation margin) are paid to or from the broker each day equal to the daily changes in the contract value. Such payments are recorded as unrealized gains or losses and, if any, shown as variation margin receivable (payable) in the Statement of Assets and Liabilities. Should the Fund fail to make
Allspring Strategic Municipal Bond Fund | 65
Notes to financial statements (unaudited)
requested variation margin payments, the broker can gain access to the initial margin to satisfy the Fund’s payment obligations. When the contracts are closed, a realized gain or loss is recorded in the Statement of Operations.
Security transactions and income recognition
Securities transactions are recorded on a trade date basis. Realized gains or losses are recorded on the basis of identified cost.
Interest income is accrued daily and bond discounts are accreted and premiums are amortized daily. To the extent debt obligations are placed on non-accrual status, any related interest income may be reduced by writing off interest receivables when the collection of all or a portion of interest has been determined to be doubtful based on consistently applied procedures and the fair value has decreased. If the issuer subsequently resumes interest payments or when the collectability of interest is reasonably assured, the debt obligation is removed from non-accrual status.
Distributions to shareholders
Distributions to shareholders from net investment income are declared daily and paid monthly. Distributions from net realized gains, if any, are recorded on the ex-dividend date and paid at least annually. Such distributions are determined in accordance with income tax regulations and may differ from U.S. generally accepted accounting principles. Dividend sources are estimated at the time of declaration. The tax character of distributions is determined as of the Fund's fiscal year end. Therefore, a portion of the Fund's distributions made prior to the Fund’s fiscal year end may be categorized as a tax return of capital at year end.
Federal and other taxes
The Fund intends to continue to qualify as a regulated investment company by distributing substantially all of its investment company taxable and tax-exempt income and any net realized capital gains (after reduction for capital loss carryforwards) sufficient to relieve it from all, or substantially all, federal income taxes. Accordingly, no provision for federal income taxes was required.
The Fund’s income and federal excise tax returns and all financial records supporting those returns for the prior three fiscal years are subject to examination by the federal and Delaware revenue authorities. Management has analyzed the Fund's tax positions taken on federal, state, and foreign tax returns, as applicable, for all open tax years and does not believe that there are any uncertain tax positions that require recognition of a tax liability.
As of December 31, 2022, the aggregate cost of all investments for federal income tax purposes was $2,118,125,866 and the unrealized gains (losses) consisted of:
| Gross unrealized gains | $ 4,780,682 |
| Gross unrealized losses | (102,441,653) |
| Net unrealized losses | $ (97,660,971) |
As of June 30, 2022, the Fund had capital loss carryforwards which consisted of $14,206,533 in short-term capital losses and $4,232,788 in long-term capital losses.
Class allocations
The separate classes of shares offered by the Fund differ principally in applicable sales charges, distribution, shareholder servicing, and administration fees. Class specific expenses are charged directly to that share class. Investment income, common fund-level expenses, and realized and unrealized gains (losses) on investments are allocated daily to each class of shares based on the relative proportion of net assets of each class.
66 | Allspring Strategic Municipal Bond Fund
Notes to financial statements (unaudited)
3. FAIR VALUATION MEASUREMENTS
Fair value measurements of investments are determined within a framework that has established a fair value hierarchy based upon the various data inputs utilized in determining the value of the Fund’s investments. The three-level hierarchy gives the highest priority to unadjusted quoted prices in active markets for identical assets or liabilities (Level 1) and the lowest priority to unobservable inputs (Level 3). The Fund’s investments are classified within the fair value hierarchy based on the lowest level of input that is significant to the fair value measurement. The inputs are summarized into three broad levels as follows:
| ■ | Level 1 – quoted prices in active markets for identical securities |
| ■ | Level 2 – other significant observable inputs (including quoted prices for similar securities, interest rates, prepayment speeds, credit risk, etc.) |
| ■ | Level 3 – significant unobservable inputs (including the Fund’s own assumptions in determining the fair value of investments) |
The inputs or methodologies used for valuing investments in securities are not necessarily an indication of the risk associated with investing in those securities.
The following is a summary of the inputs used in valuing the Fund’s assets and liabilities as of December 31, 2022:
| | Quoted prices
(Level 1) | Other significant
observable inputs
(Level 2) | Significant
unobservable inputs
(Level 3) | Total |
| Assets | | | | |
| Investments in: | | | | |
| Municipal obligations | $ 0 | $ 2,018,035,334 | $0 | $ 2,018,035,334 |
| Short-term investments | | | | |
| Investment companies | 2,429,561 | 0 | 0 | 2,429,561 |
| Total assets | $2,429,561 | $2,018,035,334 | $0 | $2,020,464,895 |
Additional sector, industry or geographic detail, if any, is included in the Portfolio of Investments.
For the six months ended December 31, 2022, the Fund did not have any transfers into/out of Level 3.
4. TRANSACTIONS WITH AFFILIATES
Management fee
Allspring Funds Management, a wholly owned subsidiary of Allspring Global Investments Holdings, LLC, a holding company indirectly owned by certain private funds of GTCR LLC and Reverence Capital Partners, L.P., is the manager of the Fund and provides advisory and fund-level administrative services under an investment management agreement. Under the investment management agreement, Allspring Funds Management is responsible for, among other services, implementing the investment objectives and strategies of the Fund, supervising the subadviser and providing fund-level administrative services in connection with the Fund’s operations. As compensation for its services under the investment management agreement, Allspring Funds Management is entitled to receive a management fee at the following annual rate based on the Fund’s average daily net assets:
| Average daily net assets | Management fee |
| First $500 million | 0.400% |
| Next $500 million | 0.375 |
| Next $2 billion | 0.350 |
| Next $2 billion | 0.325 |
| Next $5 billion | 0.290 |
| Over $10 billion | 0.280 |
For the six months ended December 31, 2022, the management fee was equivalent to an annual rate of 0.36% of the Fund’s average daily net assets.
Allspring Funds Management has retained the services of a subadviser to provide daily portfolio management to the Fund. The fee for subadvisory services is borne by Allspring Funds Management. Allspring Global Investments, LLC, an affiliate of Allspring
Allspring Strategic Municipal Bond Fund | 67
Notes to financial statements (unaudited)
Funds Management and a wholly owned subsidiary of Allspring Global Investments Holdings, LLC, is the subadviser to the Fund and is entitled to receive a fee from Allspring Funds Management at an annual rate starting at 0.20% and declining to 0.10% as the average daily net assets of the Fund increase.
Administration fees
Under a class-level administration agreement, Allspring Funds Management provides class-level administrative services to the Fund, which includes paying fees and expenses for services provided by the transfer agent, sub-transfer agents, omnibus account servicers and record-keepers. As compensation for its services under the class-level administration agreement, Allspring Funds Management receives an annual fee which is calculated based on the average daily net assets of each class as follows:
| | Class-level
administration fee |
| Class A | 0.16% |
| Class C | 0.16 |
| Class R6 | 0.03 |
| Administrator Class | 0.10 |
| Institutional Class | 0.08 |
Waivers and/or expense reimbursements
Allspring Funds Management has contractually committed to waive and/or reimburse management and administration fees to the extent necessary to maintain certain net operating expense ratios for the Fund. When each class of the Fund has exceeded its expense cap, Allspring Funds Management will waive fees and/or reimburse expenses from fund-level expenses on a proportionate basis and then from class specific expenses. When only certain classes exceed their expense caps, waivers and/or reimbursements are applied against class specific expenses before fund-level expenses. Allspring Funds Management has contractually committed through October 31, 2023 to waive fees and/or reimburse expenses to the extent necessary to cap expenses. Prior to or after the commitment expiration date, the caps may be increased or the commitment to maintain the caps may be terminated only with the approval of the Board of Trustees. As of December 31, 2022, the contractual expense caps are as follows:
| | Expense ratio caps |
| Class A | 0.80% |
| Class C | 1.55 |
| Class R6 | 0.42 |
| Administrator Class | 0.68 |
| Institutional Class | 0.47 |
Prior to November 1, 2022, the Fund's expenses were contractually capped at 0.81% for Class A shares, 1.56% for Class C shares, 0.43% for Class R6 shares, and 0.48% for Institutional Class shares.
Distribution fee
The Trust has adopted a distribution plan for Class C shares pursuant to Rule 12b-1 under the 1940 Act. A distribution fee is charged to Class C shares and paid to Allspring Funds Distributor, LLC ("Allspring Funds Distributor"), the principal underwriter, an affiliate of Allspring Funds Management, at an annual rate up to 0.75% of the average daily net assets of Class C shares.
In addition, Allspring Funds Distributor is entitled to receive the front-end sales charge from the purchase of Class A shares and a contingent deferred sales charge on the redemption of certain Class A shares. Allspring Funds Distributor is also entitled to receive the contingent deferred sales charges from redemptions of Class C shares. For the six months ended December 31, 2022, Allspring Funds Distributor received $989 from the sale of Class A shares and $115 in contingent deferred sales charges from redemptions of Class C shares. No contingent deferred sales charges were incurred by Class A shares for the six months ended December 31, 2022.
68 | Allspring Strategic Municipal Bond Fund
Notes to financial statements (unaudited)
Shareholder servicing fees
The Trust has entered into contracts with one or more shareholder servicing agents, whereby Class A, Class C and Administrator Class are charged a fee at an annual rate up to 0.25% of the average daily net assets of each respective class. A portion of these total shareholder servicing fees were paid to affiliates of the Fund.
Interfund transactions
The Fund may purchase or sell portfolio investment securities to certain affiliates pursuant to Rule 17a-7 under the 1940 Act and under procedures adopted by the Board of Trustees. The procedures have been designed to ensure that these interfund transactions, which do not incur broker commissions, are effected at current market prices. Pursuant to these procedures, the Fund had $42,925,000, $46,800,000 and $0 in interfund purchases, sales and net realized gains (losses), respectively, during the six months ended December 31, 2022.
5. INVESTMENT PORTFOLIO TRANSACTIONS
Purchases and sales of investments, excluding U.S. government obligations (if any) and short-term securities, for the six months ended December 31, 2022 were $85,538,267 and $340,665,855, respectively.
6. DERIVATIVE TRANSACTIONS
During the six months ended December 31, 2022, the Fund entered into futures contracts to take advantage of the differences between municipal and treasury yields and to help manage the duration of the portfolio. The Fund had an average notional amount of $5,780,675 in short futures contracts during the six months ended December 31, 2022.
The fair value, realized gains or losses and change in unrealized gains or losses, if any, on derivative instruments are reflected in the corresponding financial statement captions.
7. BANK BORROWINGS
The Trust (excluding the money market funds), Allspring Master Trust and Allspring Variable Trust are parties to a $350,000,000 revolving credit agreement whereby the Fund is permitted to use bank borrowings for temporary or emergency purposes, such as to fund shareholder redemption requests. Interest under the credit agreement is charged to the Fund based on a borrowing rate equal to the higher of the Federal Funds rate or the overnight bank funding rate in effect on that day plus a spread. In addition, an annual commitment fee equal based on the unused balance is allocated to each participating fund.
For the six months ended December 31, 2022, there were no borrowings by the Fund under the agreement.
8. MARKET RISKS
On March 11, 2020, the World Health Organization announced that it had made the assessment that coronavirus disease 2019 (“COVID-19”) is a pandemic. The impacts of COVID-19 are affecting the entire global economy, individual companies and investment products, the funds, and the market in general. There is significant uncertainty around the extent and duration of business disruptions related to COVID-19 and the impacts may last for an extended period of time. COVID-19 has led to significant uncertainty and volatility in the financial markets.
9. INDEMNIFICATION
Under the Fund's organizational documents, the officers and Trustees have been granted certain indemnification rights against certain liabilities that may arise out of performance of their duties to the Fund. The Fund has entered into a separate agreement with each Trustee that converts indemnification rights currently existing under the Fund’s organizational documents into contractual rights that cannot be changed in the future without the consent of the Trustee. Additionally, in the normal course of business, the Fund may enter into contracts with service providers that contain a variety of indemnification clauses. The Fund’s maximum exposure under these arrangements is dependent on future claims that may be made against the Fund and, therefore, cannot be estimated.
Allspring Strategic Municipal Bond Fund | 69
Other information (unaudited)
PROXY VOTING INFORMATION
A description of the policies and procedures used to determine how to vote proxies relating to portfolio securities is available without charge, upon request, by calling 1-800-222-8222, visiting our website at allspringglobal.com, or visiting the SEC website at sec.gov. Information regarding how the proxies related to portfolio securities were voted during the most recent 12-month period ended June 30 is available on the website at allspringglobal.com or by visiting the SEC website at sec.gov.
QUARTERLY PORTFOLIO HOLDINGS INFORMATION
The Fund files its complete schedule of portfolio holdings with the SEC for the first and third quarters of each fiscal year as an exhibit to its reports on Form N-PORT. Shareholders may view the filed Form N-PORT by visiting the SEC website at sec.gov.
70 | Allspring Strategic Municipal Bond Fund
Other information (unaudited)
BOARD OF TRUSTEES AND OFFICERS
Each of the Trustees and Officers listed in the table below acts in identical capacities for each fund in the Allspring family of funds, which consists of 127 mutual funds comprising the Allspring Funds Trust, Allspring Variable Trust, Allspring Master Trust and four closed-end funds (collectively the “Fund Complex”). This table should be read in conjunction with the Prospectus and the Statement of Additional Information1. The mailing address of each Trustee and Officer is 1415 Vantage Park Drive, 3rd Floor, Charlotte, NC 28203. Each Trustee and Officer serves an indefinite term, however, each Trustee serves such term until reaching the mandatory retirement age established by the Trustees.
Independent Trustees
Name and
year of birth | Position held and
length of service* | Principal occupations during past five years or longer | Current other
public company or
investment
company
directorships |
William R. Ebsworth
(Born 1957) | Trustee,
since 2015 | Retired. From 1984 to 2013, equities analyst, portfolio manager, research director and chief investment officer at Fidelity Management and Research Company in Boston, Tokyo, and Hong Kong, and retired in 2013 as Chief Investment Officer of Fidelity Strategic Advisers, Inc. where he led a team of investment professionals managing client assets. Prior thereto, Board member of Hong Kong Securities Clearing Co., Hong Kong Options Clearing Corp., the Thailand International Fund, Ltd., Fidelity Investments Life Insurance Company, and Empire Fidelity Investments Life Insurance Company. Audit Committee Chair and Investment Committee Chair of the Vincent Memorial Hospital Foundation (non-profit organization). Mr. Ebsworth is a CFA® charterholder. | N/A |
Jane A. Freeman
(Born 1953) | Trustee,
since 2015;
Chair Liaison,
since 2018 | Retired. From 2012 to 2014 and 1999 to 2008, Chief Financial Officer of Scientific Learning Corporation. From 2008 to 2012, Ms. Freeman provided consulting services related to strategic business projects. Prior to 1999, Portfolio Manager at Rockefeller & Co. and Scudder, Stevens & Clark. Board member of the Harding Loevner Funds from 1996 to 2014, serving as both Lead Independent Director and chair of the Audit Committee. Board member of the Russell Exchange Traded Funds Trust from 2011 to 2012 and the chair of the Audit Committee. Ms. Freeman is also an inactive Chartered Financial Analyst. | N/A |
Isaiah Harris, Jr.
(Born 1952) | Trustee,
since 2009; Audit
Committee
Chair,
since 2019 | Retired. Member of the Advisory Board of CEF of East Central Florida. Chairman of the Board of CIGNA Corporation from 2009 to 2021, and Director from 2005 to 2008. From 2003 to 2011, Director of Deluxe Corporation. Prior thereto, President and CEO of BellSouth Advertising and Publishing Corp. from 2005 to 2007, President and CEO of BellSouth Enterprises from 2004 to 2005 and President of BellSouth Consumer Services from 2000 to 2003. Emeritus member of the Iowa State University Foundation Board of Governors. Emeritus Member of the Advisory Board of Iowa State University School of Business. Advisory Board Member, Palm Harbor Academy (private school). Advisory Board Member, Fellowship of Christian Athletes. Mr. Harris is a certified public accountant (inactive status). | N/A |
David F. Larcker
(Born 1950) | Trustee,
since 2009 | Distinguished Visiting Fellow at the Hoover Institution since 2022. James Irvin Miller Professor of Accounting at the Graduate School of Business (Emeritus), Stanford University, Director of the Corporate Governance Research Initiative and Senior Faculty of The Rock Center for Corporate Governance since 2006. From 2005 to 2008, Professor of Accounting at the Graduate School of Business, Stanford University. Prior thereto, Ernst & Young Professor of Accounting at The Wharton School, University of Pennsylvania from 1985 to 2005. | N/A |
Allspring Strategic Municipal Bond Fund | 71
Other information (unaudited)
Name and
year of birth | Position held and
length of service* | Principal occupations during past five years or longer | Current other
public company or
investment
company
directorships |
Olivia S. Mitchell
(Born 1953) | Trustee,
since 2006;
Nominating and
Governance
Committee Chair,
since 2018 | International Foundation of Employee Benefit Plans Professor since 1993, Wharton School of the University of Pennsylvania. Director of Wharton’s Pension Research Council and Boettner Center on Pensions & Retirement Research, and Research Associate at the National Bureau of Economic Research. Previously taught at Cornell University from 1978 to 1993. | N/A |
Timothy J. Penny
(Born 1951) | Trustee,
since 1996;
Chair,
since 2018 | President and Chief Executive Officer of Southern Minnesota Initiative Foundation, a non-profit organization, since 2007. Vice Chair of the Economic Club of Minnesota, since 2007. Co-Chair of the Committee for a Responsible Federal Budget, since 1995. Member of the Board of Trustees of NorthStar Education Finance, Inc., a non-profit organization, from 2007-2022. Senior Fellow of the University of Minnesota Humphrey Institute from 1995 to 2017. | N/A |
James G. Polisson
(Born 1959) | Trustee,
since 2018 | Retired. Chief Marketing Officer, Source (ETF) UK Services, Ltd, from 2015 to 2017. From 2012 to 2015, Principal of The Polisson Group, LLC, a management consulting, corporate advisory and principal investing company. Chief Executive Officer and Managing Director at Russell Investments, Global Exchange Traded Funds from 2010 to 2012. Managing Director of Barclays Global Investors from 1998 to 2010 and Global Chief Marketing Officer for iShares and Barclays Global Investors from 2000 to 2010. Trustee of the San Francisco Mechanics’ Institute, a non-profit organization, from 2013 to 2015. Board member of the Russell Exchange Traded Fund Trust from 2011 to 2012. Director of Barclays Global Investors Holdings Deutschland GmbH from 2006 to 2009. Mr. Polisson is an attorney and has a retired status with the Massachusetts and District of Columbia Bar Associations. | N/A |
Pamela Wheelock
(Born 1959) | Trustee,
since January
2020; previously
Trustee from
January 2018 to
July 2019 | Retired. Executive and Senior Financial leadership positions in the public, private and nonprofit sectors. Interim President and CEO, McKnight Foundation, 2020. Interim Commissioner, Minnesota Department of Human Services, 2019. Chief Operating Officer, Twin Cities Habitat for Humanity, 2017-2019. Vice President for University Services, University of Minnesota, 2012-2016. Interim President and CEO, Blue Cross and Blue Shield of Minnesota, 2011-2012. Executive Vice-President and Chief Financial Officer, Minnesota Wild, 2002-2008. Commissioner, Minnesota Department of Finance, 1999-2002. Chair of the Board of Directors of Destination Medical Center Corporation. Board member of the Minnesota Wild Foundation. | N/A |
* Length of service dates reflect the Trustee’s commencement of service with the Trust’s predecessor entities, where applicable.
72 | Allspring Strategic Municipal Bond Fund
Other information (unaudited)
Officers2
Name and
year of birth | Position held and
length of service | Principal occupations during past five years or longer |
Andrew Owen
(Born 1960) | President,
since 2017 | President and Chief Executive Officer of Allspring Funds Management, LLC since 2017 and Head of Global Fund Governance of Allspring Global Investments since 2022. Prior thereto, co-president of Galliard Capital Management, LLC, an affiliate of Allspring Funds Management, LLC, from 2019 to 2022 and Head of Affiliated Managers, Allspring Global Investments, from 2014 to 2019 and Executive Vice President responsible for marketing, investments and product development for Allspring Funds Management, LLC, from 2009 to 2014. |
Jeremy DePalma
(Born 1974) | Treasurer,
since 2012
(for certain funds in
the Fund Complex);
since 2021 (for
the remaining funds in the
Fund Complex) | Senior Vice President of Allspring Funds Management, LLC since 2009. Senior Vice President of Evergreen Investment Management Company, LLC from 2008 to 2010 and head of the Fund Reporting and Control Team within Fund Administration from 2005 to 2010. |
Christopher Baker
(Born 1976) | Chief Compliance Officer, since 2022 | Global Chief Compliance Officer for Allspring Global Investments since 2022. Prior thereto, Chief Compliance Officer for State Street Global Advisors from 2018 to 2021. Senior Compliance Officer for the State Street divisions of Alternative Investment Solutions, Sector Solutions, and Global Marketing from 2015 to 2018. From 2010 to 2015 Vice President, Global Head of Investment and Marketing Compliance for State Street Global Advisors. |
Matthew Prasse
(Born 1983) | Chief Legal Officer, since 2022; Secretary, since 2021 | Senior Counsel of the Allspring Legal Department since 2021. Senior Counsel of the Wells Fargo Legal Department from 2018 to 2021. Previously, Counsel for Barings LLC from 2015 to 2018. Prior to joining Barings, Associate at Morgan, Lewis & Bockius LLP from 2008 to 2015. |
1 The Statement of Additional Information includes additional information about the Trustees and is available, without charge, upon request, by calling 1-800-222-8222.
2 For those Officers with tenures at Allspring Global Investments and/or Allspring Funds Management, LLC that began prior to 2021, such tenures include years of service during which these businesses/entities were known as Wells Fargo Asset Management and Wells Fargo Funds Management, LLC, respectively.
Allspring Strategic Municipal Bond Fund | 73
For more information
More information about Allspring Funds is available free upon request. To obtain literature, please write, visit the Fund's website, or call:
Allspring Funds
P.O. Box 219967
Kansas City, MO 64121-9967
Website: allspringglobal.com
Individual investors: 1-800-222-8222
Retail investment professionals: 1-888-877-9275
Institutional investment professionals: 1-800-260-5969
This report and the financial statements contained herein are submitted for the general information of the shareholders of the Fund. If this report is used for promotional purposes, distribution of the report must be accompanied or preceded by a current prospectus. Before investing, please consider the investment objectives, risks, charges, and expenses of the investment. For a current prospectus and, if available, a summary prospectus, containing this information, call
1-800-222-8222 or visit the Fund's website at allspringglobal.com. Read the prospectus carefully before you invest or send money.
Allspring Global InvestmentsTM is the trade name for the asset management firms of Allspring Global Investments Holdings, LLC, a holding company indirectly owned by certain private funds of GTCR LLC and Reverence Capital Partners, L.P. These firms include but are not limited to Allspring Global Investments, LLC, and Allspring Funds Management, LLC. Certain products managed by Allspring entities are distributed by Allspring Funds Distributor, LLC (a broker-dealer and Member FINRA/SIPC).
This material is for general informational and educational purposes only and is NOT intended to provide investment advice or a recommendation of any kind - including a recommendation for any specific investment, strategy, or plan.
© 2023 Allspring Global Investments Holdings, LLC. All rights reserved.
ALL-01092023-c4tnazo5 02-23
SAR4313 12-22
Semi-Annual Report
December 31, 2022
Allspring Ultra Short-Term
Municipal Income Fund
The views expressed and any forward-looking statements are as of December 31, 2022, unless otherwise noted, and are those of the Fund's portfolio managers and/or Allspring Global Investments. Discussions of individual securities or the markets generally are not intended as individual recommendations. Future events or results may vary significantly from those expressed in any forward-looking statements. The views expressed are subject to change at any time in response to changing circumstances in the market. Allspring Global Investments disclaims any obligation to publicly update or revise any views expressed or forward-looking statements.
Allspring Ultra Short-Term Municipal Income Fund | 1
Letter to shareholders (unaudited)
Andrew Owen
President
Allspring Funds
Dear Shareholder:
We are pleased to offer you this semi-annual report for the Allspring Ultra Short-Term Municipal Income Fund for the six-month period that ended December 31, 2022. Globally, stocks and bonds experienced heightened volatility and generally negative returns through the challenging period. Earlier tailwinds provided by global stimulus programs, vaccination rollouts, and recovering consumer and corporate sentiment were wiped away by the highest rate of inflation in four decades, the impact of ongoing aggressive central bank rate hikes and the prospect of more rate hikes. Compounding these concerns were the global reverberations of the Russia-Ukraine war and the impact of China’s strict COVID-19 lockdowns.
For the six-month period, stocks and bonds had mixed results, with emerging market equities trailing those of developed markets and both U.S. and non-U.S. bonds fighting an uphill battle in the face of sustained interest rate increases. For the period, U.S. stocks, based on the S&P 500 Index,1 gained 2.31%. International stocks, as measured by the MSCI ACWI ex USA Index (Net),2 returned 2.96%, while the MSCI EM Index (Net) (USD)3 declined 2.99%. Among bond indexes, the Bloomberg U.S. Aggregate Bond Index4 returned -2.97%, the Bloomberg Global Aggregate ex-USD Index (unhedged)5 returned -2.65%, the Bloomberg Municipal Bond Index6 gained 0.50%, and the ICE BofA U.S. High Yield Index7 returned 3.33%.
Persistent inflation and economic fallout from the Russia-Ukraine war drove markets.
Markets rebounded from earlier losses in July, led by U.S. stocks. While evidence pointed to an economic slowdown after two consecutive quarters of declining gross domestic product (economic contraction), the U.S. labor market remained surprisingly strong: July nonfarm payrolls grew by more than 500,000 and U.S. unemployment dipped to 3.5%. Meanwhile, crude oil and retail gasoline prices, major contributors to recent overall inflation, fell substantially from earlier highs. And while U.S. home prices rose, sales fell as houses became less affordable with mortgage rates at a 13-year high. The Federal Reserve (Fed) raised the federal funds rate another 0.75% in July—to a range of 2.25% to 2.50%—and forecasts pointed to further rate hikes.
| 1 | The S&P 500 Index consists of 500 stocks chosen for market size, liquidity, and industry group representation. It is a market-value-weighted index with each stock's weight in the index proportionate to its market value. You cannot invest directly in an index. |
| 2 | The Morgan Stanley Capital International (MSCI) All Country World Index (ACWI) ex USA Index (Net) is a free-float-adjusted market-capitalization-weighted index that is designed to measure the equity market performance of developed and emerging markets, excluding the U.S. Source: MSCI. MSCI makes no express or implied warranties or representations and shall have no liability whatsoever with respect to any MSCI data contained herein. The MSCI data may not be further redistributed or used as a basis for other indexes or any securities or financial products. This report is not approved, reviewed, or produced by MSCI. You cannot invest directly in an index. |
| 3 | The MSCI Emerging Markets (EM) Index (Net) (USD) is a free-float-adjusted market-capitalization-weighted index that is designed to measure equity market performance of emerging markets. You cannot invest directly in an index. |
| 4 | The Bloomberg U.S. Aggregate Bond Index is a broad-based benchmark that measures the investment-grade, U.S.-dollar-denominated, fixed-rate taxable bond market, including Treasuries, government-related and corporate securities, mortgage-backed securities (agency fixed-rate and hybrid adjustable-rate mortgage pass-throughs), asset-backed securities, and commercial mortgage-backed securities. You cannot invest directly in an index. |
| 5 | The Bloomberg Global Aggregate ex-USD Index (unhedged) is an unmanaged index that provides a broad-based measure of the global investment-grade fixed-income markets excluding the U.S.-dollar-denominated debt market. You cannot invest directly in an index. |
| 6 | The Bloomberg Municipal Bond Index is an unmanaged index composed of long-term tax-exempt bonds with a minimum credit rating of Baa. You cannot invest directly in an index. |
| 7 | The ICE BofA U.S. High Yield Index is a market-capitalization-weighted index of domestic and Yankee high-yield bonds. The index tracks the performance of high-yield securities traded in the U.S. bond market. You cannot invest directly in an index. Copyright 2023. ICE Data Indices, LLC. All rights reserved. |
2 | Allspring Ultra Short-Term Municipal Income Fund
Letter to shareholders (unaudited)
August was yet another broadly challenging month for financial markets, with more red ink flowing. High inflation persisted, cresting 9% in the eurozone on an annual basis and remaining above 8% in the U.S. despite the Fed’s aggressive monetary policy and a major drop in global crude oil and gasoline prices from their June peak. One positive note was the resilience of the U.S. job market. However, the Fed’s job was clearly not complete. One longer-term bright spot was the U.S. Congress’s passage of the Inflation Reduction Act. Its primary stated goals include: to reduce inflation (though not immediately) by curbing the deficit, capping health care spending by seniors, and investing in domestic sources of clean energy.
The market misery continued in September. There was nowhere to hide as all asset classes suffered major losses at the hands of persistent inflation. Central banks kept up their battle against rapidly rising prices with more rate hikes. The strength of the U.S. dollar made things even more difficult for investors holding assets in other currencies. U.S. mortgage rates jumped to near 7% on 30-year fixed-rate mortgages; the decreased housing affordability began to cool demand somewhat. The U.K. experienced a sharp sell-off of government bonds and the British pound in September as investors panicked in response to a new government budget that was seen as financially unsound. The market meltdown forced the Bank of England to step in and buy long-dated government bonds.
Equities had a reprieve in October after two months of sharp declines. Value stocks and small caps fared best. Globally, developed markets outpaced emerging market equities, which were hurt by weakness among Chinese stocks. Central banks continued to try to curtail high inflation with aggressive interest rate hikes. Geopolitical risks persisted, including the ongoing Russia-Ukraine war and economic, financial market, and political turmoil in the U.K., which led to a second prime ministerial change in six weeks, as Rishi Sunak replaced Liz Truss in late October. Concerns over Europe’s energy crisis eased thanks to unseasonably warm weather and plentiful gas on hand. The U.S. labor market continued its resilience against rising prices, as unemployment stood at 3.7%, near a record low.
Stocks and bonds rallied in November, with emerging market equities gaining nearly 15% and developed market equities returning 7%. The S&P 500 Index rose 5.6% in November. Bonds also had positive monthly returns. Economic news was encouraging, driven by U.S. labor market strength. Although central banks kept raising rates, expectations grew regarding an impending easing in the pace of rate hikes and a possible end to central bank monetary tightening in 2023. Although inflation remained at record highs in the eurozone, with a 10.6% annual increase in October, Germany’s producer prices decreased 4.2% annually, signaling a possible decline in inflationary pressures. Meanwhile, U.S. inflation continued to moderate, with a 7.1% annual price rise in November and a monthly price increase of just 0.1%. China’s economic data remained weak, reflecting its zero-COVID-19 policy.
Financial markets cooled in December, with U.S. equities posting negative overall results in response to a weakening U.S. dollar. Fixed income securities ended one of their worst years ever with flat overall monthly returns as markets weighed the hopes for an end to the monetary tightening cycle with the reality that central banks had not completed their jobs yet. U.S. Consumer Price Index (CPI)1 data showed a strong consistent trend downward, which brought down the 12-month CPI to 6.5% in December from 9.1% in June. Other countries and regions reported still-high but declining inflation rates as the year winded down.
“ The market misery continued in September. There was nowhere to hide as all asset classes suffered major losses at the hands of persistent inflation.”
| 1 | The Consumer Price Index (CPI) is a measure of the average change over time in the prices paid by urban consumers for a market basket of consumer goods and services. You cannot invest directly in an index. |
Allspring Ultra Short-Term Municipal Income Fund | 3
Letter to shareholders (unaudited)
Don’t let short-term uncertainty derail long-term investment goals.
Periods of investment uncertainty can present challenges, but experience has taught us that maintaining long-term investment goals can be an effective way to plan for the future. To help you create a sound strategy based on your personal goals and risk tolerance, Allspring Funds offers more than 100 mutual funds spanning a wide range of asset classes and investment styles. Although diversification cannot guarantee an investment profit or prevent losses, we believe it can be an effective way to manage investment risk and potentially smooth out overall portfolio performance. We encourage investors to know their investments and to understand that appropriate levels of risk-taking may unlock opportunities.
Thank you for choosing to invest with Allspring Funds. We appreciate your confidence in us and remain committed to helping you meet your financial needs.
Sincerely,
Andrew Owen
President
Allspring Funds
For further information about your fund, contact your investment professional, visit our website at allspringglobal.com, or call us directly at 1-800-222-8222.
4 | Allspring Ultra Short-Term Municipal Income Fund
This page is intentionally left blank.
Performance highlights (unaudited)
| Investment objective | The Fund seeks current income exempt from federal income tax, consistent with capital preservation. |
| Manager | Allspring Funds Management, LLC |
| Subadviser | Allspring Global Investments, LLC |
| Portfolio managers | Bruce R. Johns, James Randazzo, Nicholos Venditti |
| Average annual total returns (%) as of December 31, 2022 |
| | | Including sales charge | | Excluding sales charge | | Expense ratios1 (%) |
| | Inception date | 1 year | 5 year | 10 year | | 1 year | 5 year | 10 year | | Gross | Net 2 |
| Class A (SMAVX) | 10-2-2000 | -2.76 | 0.19 | 0.23 | | -0.78 | 0.60 | 0.43 | | 0.66 | 0.50 |
| Class A2 (WFUNX)3 | 5-29-2020 | – | – | – | | -0.71 | 0.61 | 0.44 | | 0.56 | 0.40 |
| Class C (WFUSX) | 3-31-2008 | -1.83 | 0.22 | -0.12 | | -0.83 | 0.22 | -0.12 | | 1.41 | 1.25 |
| Class R6 (WUSRX)4 | 7-31-2018 | – | – | – | | -0.48 | 0.91 | 0.74 | | 0.28 | 0.20 |
| Administrator Class (WUSMX) | 7-30-2010 | – | – | – | | -0.78 | 0.63 | 0.48 | | 0.60 | 0.50 |
| Institutional Class (SMAIX) | 7-31-2000 | – | – | – | | -0.53 | 0.87 | 0.72 | | 0.33 | 0.25 |
| Ultra Short-Term Municipal Income Blended Index5 | – | – | – | – | | 0.07 | 0.98 | 0.69 | | – | – |
| Bloomberg 1 Year Municipal Bond Index6 | – | – | – | – | | -1.13 | 1.02 | 0.83 | | – | – |
| iMoneyNet Tax-Free National Institutional Money Market Funds Average7 | – | – | – | – | | 1.28 | 0.93 | 0.55 | | – | – |
Figures quoted represent past performance, which is no guarantee of future results, and do not reflect taxes that a shareholder may pay on an investment in a fund. Investment return and principal value of an investment will fluctuate so that an investor’s shares, when redeemed, may be worth more or less than their original cost. Performance shown without sales charges would be lower if sales charges were reflected. Current performance may be lower or higher than the performance data quoted, which assumes the reinvestment of dividends and capital gains. Current month-end performance is available on the Fund’s website, allspringglobal.com.
Index returns do not include transaction costs associated with buying and selling securities, any mutual fund fees or expenses, or any taxes. It is not possible to invest directly in an index.
For Class A shares, the maximum front-end sales charge is 2.00%. For Class C shares, the maximum contingent deferred sales charge is 1.00%. Performance including a contingent deferred sales charge assumes the sales charge for the corresponding time period. Class A2, Class R6, Administrator Class and Institutional Class shares are sold without a front-end sales charge or contingent deferred sales charge.
| 1 | Reflects the expense ratios as stated in the most recent prospectuses. The expense ratios shown are subject to change and may differ from the annualized expense ratios shown in the financial highlights of this report. |
| 2 | The manager has contractually committed through October 31, 2023, to waive fees and/or reimburse expenses to the extent necessary to cap total annual fund operating expenses after fee waivers at 0.50% for Class A, 0.40% for Class A2, 1.25% for Class C, 0.20% for Class R6, 0.50% for Administrator Class, and 0.25% for Institutional Class. Brokerage commissions, stamp duty fees, interest, taxes, acquired fund fees and expenses (if any), and extraordinary expenses are excluded from the expense caps. Prior to or after the commitment expiration date, the caps may be increased or the commitment to maintain the caps may be terminated only with the approval of the Board of Trustees. Without these caps, the Fund’s returns would have been lower. The expense ratio paid by an investor is the net expense ratio (the total annual fund operating expenses after fee waivers) as stated in the prospectuses. |
| 3 | Historical performance for the Class A2 shares prior to their inception reflects the performance of the Class A shares, and includes the higher expenses applicable to the Class A shares. If these expenses had not been included, returns for the Class A2 shares would be higher. |
| 4 | Historical performance shown for the Class R6 shares prior to their inception reflects the performance of the Institutional Class shares, and includes the higher expenses applicable to the Institutional Class shares. If these expenses had not been included, returns for the Class R6 shares would be higher. |
| 5 | Source: Allspring Funds Management LLC. The Ultra Short-Term Municipal Income Blended Index is composed 50% of the Bloomberg 1 Year Municipal Bond Index and 50% of the iMoneyNet Tax-Free National Institutional Money Market Funds Average. You cannot invest directly in an index. |
| 6 | The Bloomberg 1 Year Municipal Bond Index is the one-year component of the Bloomberg Municipal Bond Index, which is an unmanaged index composed of long-term tax-exempt bonds with a minimum credit rating of Baa. You cannot invest directly in an index. |
6 | Allspring Ultra Short-Term Municipal Income Fund
Performance highlights (unaudited)
| 7 | iMoneyNet Tax-Free National Institutional Money Market Funds Average is the return of an unmanaged group of money market funds. You cannot invest directly in this average. |
Bond values fluctuate in response to the financial condition of individual issuers, general market and economic conditions, and changes in interest rates. Changes in market conditions and government policies may lead to periods of heightened volatility in the bond market and reduced liquidity for certain bonds held by the Fund. In general, when interest rates rise, bond values fall and investors may lose principal value. Interest rate changes and their impact on the Fund and its share price can be sudden and unpredictable. The use of derivatives may reduce returns and/or increase volatility. Certain investment strategies tend to increase the total risk of an investment (relative to the broader market). This fund is exposed to high-yield securities risk and municipal securities risk. Consult the Fund’s prospectus for additional information on these and other risks. A portion of the Fund’s income may be subject to federal, state, and/or local income taxes or the Alternative Minimum Tax (AMT). Any capital gains distributions may be taxable.
Allspring Ultra Short-Term Municipal Income Fund | 7
Performance highlights (unaudited)
| Credit quality as of December 31, 20221 |
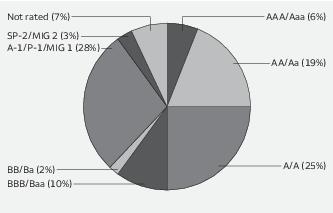
| 1 | The credit quality distribution of portfolio holdings reflected in the chart is based on ratings from Standard & Poor’s, Moody’s Investors Service, and/or Fitch Ratings Ltd. Credit quality ratings apply to the underlying holdings of the Fund and not to the Fund itself. The percentages of the portfolio with the ratings depicted in the chart are calculated based on the market value of fixed income securities held by the Fund. If a security was rated by all three rating agencies, the middle rating was utilized. If rated by two of the three rating agencies, the lower rating was utilized, and if rated by one of the rating agencies, that rating was utilized. Standard & Poor’s rates the creditworthiness of bonds, ranging from AAA (highest) to D (lowest). Ratings from A to CCC may be modified by the addition of a plus (+) or minus (-) sign to show relative standing within the rating categories. Standard & Poor’s rates the creditworthiness of short-term notes from SP-1 (highest) to SP-3 (lowest). Moody’s rates the creditworthiness of bonds, ranging from Aaa (highest) to C (lowest). Ratings Aa to B may be modified by the addition of a number 1 (highest) to 3 (lowest) to show relative standing within the ratings categories. Moody’s rates the creditworthiness of short-term U.S. tax-exempt municipal securities from MIG 1/VMIG 1 (highest) to SG (lowest). Fitch rates the creditworthiness of bonds, ranging from AAA (highest) to D (lowest). Credit quality distribution is subject to change and may have changed since the date specified. |
| Effective maturity distribution as of December 31, 20221 |
| 1 | Figures represent the percentage of the Fund's long-term investments. Allocations are subject to change and may have changed since the date specified. |
8 | Allspring Ultra Short-Term Municipal Income Fund
Fund expenses (unaudited)
As a shareholder of the Fund, you incur two types of costs: (1) transaction costs, including sales charges (loads) on purchase payments and contingent deferred sales charges (if any) on redemptions and (2) ongoing costs, including management fees, distribution (12b-1) and/or shareholder servicing fees, and other Fund expenses. This example is intended to help you understand your ongoing costs (in dollars) of investing in the Fund and to compare these costs with the ongoing costs of investing in other mutual funds.
The example is based on an investment of $1,000 invested at the beginning of the six-month period and held for the entire period from July 1, 2022 to December 31, 2022.
Actual expenses
The “Actual” line of the table below provides information about actual account values and actual expenses. You may use the information in this line, together with the amount you invested, to estimate the expenses that you paid over the period. Simply divide your account value by $1,000 (for example, an $8,600 account value divided by $1,000 = 8.6), then multiply the result by the number in the “Actual” line under the heading entitled “Expenses paid during period” for your applicable class of shares to estimate the expenses you paid on your account during this period.
Hypothetical example for comparison purposes
The “Hypothetical” line of the table below provides information about hypothetical account values and hypothetical expenses based on the Fund’s actual expense ratio and an assumed rate of return of 5% per year before expenses, which is not the Fund’s actual return. The hypothetical account values and expenses may not be used to estimate the actual ending account balance or expenses you paid for the period. You may use this information to compare the ongoing costs of investing in the Fund and other funds. To do so, compare this 5% hypothetical example with the 5% hypothetical examples that appear in the shareholder reports of the other funds.
Please note that the expenses shown in the table are meant to highlight your ongoing costs only and do not reflect any transactional costs, such as sales charges (loads) and contingent deferred sales charges. Therefore, the “Hypothetical” line of the table is useful in comparing ongoing costs only, and will not help you determine the relative total costs of owning different funds. In addition, if these transactional costs were included, your costs would have been higher.
| | Beginning
account value
7-1-2022 | Ending
account value
12-31-2022 | Expenses
paid during
the period1 | Annualized net
expense ratio |
| Class A | | | | |
| Actual | $1,000.00 | $1,004.85 | $2.53 | 0.50% |
| Hypothetical (5% return before expenses) | $1,000.00 | $1,022.68 | $2.55 | 0.50% |
| Class A2 | | | | |
| Actual | $1,000.00 | $1,005.34 | $2.02 | 0.40% |
| Hypothetical (5% return before expenses) | $1,000.00 | $1,023.19 | $2.04 | 0.40% |
| Class C | | | | |
| Actual | $1,000.00 | $1,006.45 | $6.27 | 1.24% |
| Hypothetical (5% return before expenses) | $1,000.00 | $1,018.95 | $6.31 | 1.24% |
| Class R6 | | | | |
| Actual | $1,000.00 | $1,006.36 | $1.01 | 0.20% |
| Hypothetical (5% return before expenses) | $1,000.00 | $1,024.20 | $1.02 | 0.20% |
| Administrator Class | | | | |
| Actual | $1,000.00 | $1,004.84 | $2.53 | 0.50% |
| Hypothetical (5% return before expenses) | $1,000.00 | $1,022.68 | $2.55 | 0.50% |
| Institutional Class | | | | |
| Actual | $1,000.00 | $1,006.10 | $1.26 | 0.25% |
| Hypothetical (5% return before expenses) | $1,000.00 | $1,023.95 | $1.28 | 0.25% |
1 Expenses paid is equal to the annualized net expense ratio of each class multiplied by the average account value over the period, multiplied by 184 divided by 365 (to reflect the one-half-year period).
Allspring Ultra Short-Term Municipal Income Fund | 9
Portfolio of investments—December 31, 2022 (unaudited)
| | | | | Principal | Value |
| Closed end municipal bond fund obligations: 2.11% | | | | | |
| California: 0.59% | | | | | |
| Nuveen California AMT-Free Quality Municipal Income Fund MuniFund Preferred Shares Series A (70 shares) 1.28% 144Aø | | | | $ 7,000,000 | $ 7,000,000 |
| New York: 0.84% | | | | | |
| Nuveen New York Quality Municipal Income Fund Institutional MuniFund Term Preferred Shares (100 shares) 4.18% 144Aø | | | | 10,000,000 | 10,000,000 |
| Other: 0.68% | | | | | |
| Nuveen AMT-Free Municipal Credit Income Fund MuniFund Preferred Shares Series B (50 shares) 4.18% 144Aø | | | | 5,000,000 | 5,000,000 |
| Nuveen Quality Municipal Income Fund Series 1-2118 (30 shares) 3.83% 144Aø | | | | 3,000,000 | 3,000,000 |
| | | | | | 8,000,000 |
| Total Closed end municipal bond fund obligations (Cost $25,000,000) | | | | | 25,000,000 |
| | | Interest
rate | Maturity
date | | |
| Municipal obligations: 96.68% | | | | | |
| Alabama: 2.28% | | | | | |
| Education revenue: 0.04% | | | | | |
| University of South Alabama Series 2021 (BAM Insured) | | 4.00% | 4-1-2025 | 500,000 | 509,660 |
| Health revenue: 0.99% | | | | | |
| Alabama Health Care Authority for Baptist Health Series B (AGC Insured) € | | 3.75 | 11-15-2037 | 11,775,000 | 11,775,000 |
| Miscellaneous revenue: 0.09% | | | | | |
| Alabama Corrections Institution Finance Authority Revenue Bonds Series 2022A | | 5.00 | 7-1-2023 | 1,000,000 | 1,008,887 |
| Utilities revenue: 1.16% | | | | | |
| Black Belt Energy Gas District Revenue Bonds 2022 Series E | | 5.00 | 6-1-2025 | 1,250,000 | 1,289,035 |
| Black Belt Energy Gas Supply Revenue Bonds Series 2022D-2 (U.S. SOFR +1.40%)(Royal Bank of Canada LIQ) ± | | 4.28 | 7-1-2052 | 3,500,000 | 3,474,353 |
| Southeast Alabama Gas Supply District Project #1 Series A | | 4.00 | 4-1-2049 | 4,000,000 | 3,993,723 |
| Tender Option Bond Trust Receipts/Floater Certificates Series 2022-XF3073 144Aø | | 3.86 | 2-1-2053 | 5,000,000 | 5,000,000 |
| | | | | | 13,757,111 |
| | | | | | 27,050,658 |
| Alaska: 0.49% | | | | | |
| Airport revenue: 0.17% | | | | | |
| Alaska International Airports System Revenue Refunding Bonds Series 2021C | | 5.00 | 10-1-2025 | 2,000,000 | 2,083,619 |
The accompanying notes are an integral part of these financial statements.
10 | Allspring Ultra Short-Term Municipal Income Fund
Portfolio of investments—December 31, 2022 (unaudited)
| | | Interest
rate | Maturity
date | Principal | Value |
| Miscellaneous revenue: 0.32% | | | | | |
| Alaska Municipal Bond Bank Series 1 | | 5.00% | 12-1-2023 | $ 1,900,000 | $ 1,934,410 |
| Alaska Municipal Bond Bank Series 1 | | 5.00 | 12-1-2024 | 1,750,000 | 1,818,146 |
| | | | | | 3,752,556 |
| | | | | | 5,836,175 |
| Arizona: 1.03% | | | | | |
| Education revenue: 0.15% | | | | | |
| Tender Option Bond Trust Receipts/Floater Certificates Series 2020-XF2862 (Mizuho Capital Markets LLC LOC, Mizuho Capital Markets LLC LIQ) 144Aø | | 3.86 | 12-15-2047 | 1,820,000 | 1,820,000 |
| Health revenue: 0.38% | | | | | |
| Arizona Health Facilities Authority Banner Health Series B (SIFMA Municipal Swap +0.25%) ± | | 3.91 | 1-1-2046 | 4,000,000 | 3,864,180 |
| Maricopa County AZ IDA Series 2021A | | 5.00 | 9-1-2024 | 150,000 | 154,644 |
| Maricopa County AZ IDA Series 2021A | | 5.00 | 9-1-2025 | 500,000 | 525,161 |
| | | | | | 4,543,985 |
| Industrial development revenue: 0.50% | | | | | |
| Chandler AZ IDA Intel Corporation Project | | 2.70 | 12-1-2037 | 3,415,000 | 3,392,577 |
| Chandler AZ IDA Intel Corporation Project | | 5.00 | 6-1-2049 | 2,425,000 | 2,463,662 |
| | | | | | 5,856,239 |
| | | | | | 12,220,224 |
| Arkansas: 0.31% | | | | | |
| Health revenue: 0.12% | | | | | |
| Batesville AR Public Facilities Board Hospital White River Health System Incorporated | | 5.00 | 6-1-2024 | 1,345,000 | 1,365,779 |
| Housing revenue: 0.15% | | | | | |
| Arkansas Development Finance Authority MFHR Cottages Apartments (Department of Housing and Urban Development Insured) | | 1.25 | 12-1-2024 | 1,835,000 | 1,799,005 |
| Tax revenue: 0.04% | | | | | |
| Cabot AR Series 2021B | | 5.00 | 12-1-2023 | 200,000 | 203,658 |
| Cabot AR Series 2021B | | 5.00 | 12-1-2025 | 275,000 | 292,443 |
| | | | | | 496,101 |
| | | | | | 3,660,885 |
| California: 5.74% | | | | | |
| GO revenue: 0.72% | | | | | |
| Los Angeles CA Tax and Revenue Anticipation Notes | | 4.00 | 6-29-2023 | 8,500,000 | 8,543,696 |
| Health revenue: 2.83% | | | | | |
| California CDA Emanate Health Series A | | 5.00 | 4-1-2025 | 750,000 | 780,351 |
| California CDA Health Facilities Catholic Series F (AGM Insured) € | | 3.25 | 7-1-2040 | 9,725,000 | 9,725,000 |
| California HFFA Adventist Health System Series 2013A | | 5.00 | 3-1-2025 | 2,500,000 | 2,503,909 |
| California PFA Kaiser Permanente Series 2021A | | 4.00 | 10-15-2025 | 400,000 | 404,441 |
The accompanying notes are an integral part of these financial statements.
Allspring Ultra Short-Term Municipal Income Fund | 11
Portfolio of investments—December 31, 2022 (unaudited)
| | | Interest
rate | Maturity
date | Principal | Value |
| Health revenue (continued) | | | | | |
| California Statewide CDA Health Facilities Dignity Health Series D (AGM Insured) € | | 3.25% | 7-1-2041 | $17,850,000 | $ 17,850,000 |
| California Statewide CDA Health Facilities Dignity Health Series E (AGM Insured) € | | 3.90 | 7-1-2040 | 2,225,000 | 2,225,000 |
| | | | | | 33,488,701 |
| Housing revenue: 1.40% | | | | | |
| California CDA MFHR Refunding Bonds 2021 Series A (Landesbank Hessen-Thüringen LOC) ø | | 3.74 | 3-1-2057 | 10,730,000 | 10,730,000 |
| California CDA Uptown Newport Apartments Series 2017 AA & BB (East West Bank LOC) ø | | 3.72 | 3-1-2057 | 5,000,000 | 5,000,000 |
| Tender Option Bond Trust Receipts/Certificates Series 2020-MIZ9012 (Mizuho Capital Markets LLC LIQ) 144Aø | | 3.91 | 10-1-2036 | 862,000 | 862,000 |
| | | | | | 16,592,000 |
| Miscellaneous revenue: 0.16% | | | | | |
| California Infrastructure & Economic Development Bank Brightline West Passenger Rail Project Series 2021B øø | | 0.39 | 10-1-2047 | 2,000,000 | 1,950,530 |
| Tax revenue: 0.05% | | | | | |
| Cathedral City CA RDA Series 2021C (BAM Insured) | | 4.00 | 8-1-2025 | 600,000 | 613,077 |
| Transportation revenue: 0.30% | | | | | |
| Bay Area Toll Authority Series B (SIFMA Municipal Swap +0.28%) ± | | 3.94 | 4-1-2056 | 3,500,000 | 3,501,318 |
| Utilities revenue: 0.28% | | | | | |
| California Community Choice Financing Authority Clean Energy Project Series 2021A | | 4.00 | 12-1-2023 | 800,000 | 802,306 |
| Vernon CA Electric System Series A | | 5.00 | 10-1-2023 | 1,250,000 | 1,259,654 |
| Vernon CA Electric System Series A | | 5.00 | 10-1-2024 | 1,200,000 | 1,224,093 |
| | | | | | 3,286,053 |
| | | | | | 67,975,375 |
| Colorado: 1.48% | | | | | |
| Airport revenue: 0.68% | | | | | |
| Denver CO Airport System Subordinate Revenue Bonds Series 2013B | | 5.00 | 11-15-2025 | 2,835,000 | 2,889,993 |
| Denver CO City and County Airport Revenue Bonds AMT Series B-2 | | 5.00 | 11-15-2031 | 1,840,000 | 1,924,273 |
| Denver CO City and County Airport Revenue Bonds Series 2022C | | 5.00 | 11-15-2025 | 3,000,000 | 3,192,329 |
| | | | | | 8,006,595 |
| Education revenue: 0.12% | | | | | |
| University of Colorado Enterprise System Refunding Bond Series C | | 2.00 | 6-1-2054 | 1,500,000 | 1,466,070 |
| Health revenue: 0.04% | | | | | |
| Colorado Health Facilities Authority Catholic Health Initiatives Series B-3 | | 4.00 | 1-1-2024 | 530,000 | 522,976 |
The accompanying notes are an integral part of these financial statements.
12 | Allspring Ultra Short-Term Municipal Income Fund
Portfolio of investments—December 31, 2022 (unaudited)
| | | Interest
rate | Maturity
date | Principal | Value |
| Miscellaneous revenue: 0.37% | | | | | |
| Colorado Bridge Enterprise Central 70 Project Series 2017 | | 4.00% | 12-31-2023 | $ 1,385,000 | $ 1,397,901 |
| Colorado Bridge Enterprise Central 70 Project Series 2017 | | 4.00 | 6-30-2024 | 2,000,000 | 2,017,101 |
| Colorado Bridge Enterprise Senior Revenue Bonds AMT Central 70 Project Private Activity Bond | | 4.00 | 12-31-2024 | 1,000,000 | 1,009,504 |
| | | | | | 4,424,506 |
| Tax revenue: 0.03% | | | | | |
| Regional Transportation District Private Activity Revenue Denver Transit Partners Eagle P3 | | 5.00 | 7-15-2024 | 300,000 | 303,788 |
| Transportation revenue: 0.19% | | | | | |
| E-470 Public Highway Authority Revenue Series B (U.S. SOFR +0.35%) ± | | 3.23 | 9-1-2039 | 2,250,000 | 2,233,048 |
| Water & sewer revenue: 0.05% | | | | | |
| Central Weld County Water District Water Revenue (AGM Insured) | | 5.00 | 12-1-2025 | 520,000 | 551,636 |
| | | | | | 17,508,619 |
| Connecticut: 3.98% | | | | | |
| Education revenue: 1.39% | | | | | |
| Connecticut HEFAR Yale University Issue Series A øø | | 1.10 | 7-1-2048 | 7,405,000 | 7,384,947 |
| Connecticut HEFAR Yale University issue Series B øø | | 0.55 | 7-1-2037 | 8,150,000 | 8,013,624 |
| Connecticut Higher Education Supplemental Loan Authority CHESLA Loan Program | | 5.00 | 11-15-2024 | 585,000 | 609,383 |
| Connecticut Higher Education Supplemental Loan Authority CHESLA Loan Program Series B | | 5.00 | 11-15-2023 | 440,000 | 447,216 |
| | | | | | 16,455,170 |
| GO revenue: 0.94% | | | | | |
| Bridgeport CT Series A | | 5.00 | 6-1-2023 | 655,000 | 660,015 |
| Bridgeport CT Series A | | 5.00 | 6-1-2024 | 800,000 | 821,661 |
| Bridgeport CT Series A | | 5.00 | 6-1-2025 | 2,695,000 | 2,821,654 |
| Bridgeport CT Series C | | 5.00 | 2-15-2024 | 445,000 | 454,329 |
| Bridgeport CT Series C | | 5.00 | 2-15-2025 | 750,000 | 780,734 |
| Connecticut Series A | | 3.00 | 1-15-2025 | 3,000,000 | 3,008,890 |
| Connecticut Series C | | 3.00 | 6-1-2023 | 600,000 | 600,133 |
| Connecticut Series C | | 3.00 | 6-1-2024 | 1,055,000 | 1,058,316 |
| Connecticut Series C | | 4.00 | 6-1-2023 | 435,000 | 436,847 |
| Connecticut Series C | | 4.00 | 6-1-2024 | 500,000 | 508,429 |
| | | | | | 11,151,008 |
| Health revenue: 0.07% | | | | | |
| Connecticut HEFA Revenue Bonds Stamford Hospital Issue Series M | | 5.00 | 7-1-2023 | 175,000 | 176,035 |
| Connecticut HEFA Stamford Hospital Series L-1 | | 4.00 | 7-1-2024 | 600,000 | 601,758 |
| | | | | | 777,793 |
| Housing revenue: 1.36% | | | | | |
| Connecticut HFA Mortgage Finance Program Bonds Series A Subseries A-4 (SIFMA Municipal Swap +0.30%) ± | | 3.96 | 11-15-2050 | 15,000,000 | 14,864,978 |
| Connecticut HFA Series A Subseries A-1 | | 0.30 | 11-15-2024 | 500,000 | 473,154 |
The accompanying notes are an integral part of these financial statements.
Allspring Ultra Short-Term Municipal Income Fund | 13
Portfolio of investments—December 31, 2022 (unaudited)
| | | Interest
rate | Maturity
date | Principal | Value |
| Housing revenue (continued) | | | | | |
| Connecticut HFA Series A Subseries A-1 | | 0.40% | 11-15-2023 | $ 300,000 | $ 293,248 |
| Connecticut HFA Series A Subseries A-1 | | 0.40 | 5-15-2025 | 500,000 | 466,789 |
| | | | | | 16,098,169 |
| Tax revenue: 0.22% | | | | | |
| Connecticut Tax Obligation Revenue Transportation Infrastructure Purpose | | 5.00 | 5-1-2023 | 375,000 | 377,479 |
| Connecticut Tax Obligation Revenue Transportation Infrastructure Purpose | | 5.00 | 5-1-2024 | 1,000,000 | 1,028,993 |
| Connecticut Tax Obligation Revenue Transportation Infrastructure Purpose | | 5.00 | 5-1-2025 | 1,150,000 | 1,210,808 |
| | | | | | 2,617,280 |
| | | | | | 47,099,420 |
| District of Columbia: 2.73% | | | | | |
| Airport revenue: 0.26% | | | | | |
| Metropolitan Washington Airports Authority Revenue and Refunding Bonds Series 2021A | | 5.00 | 10-1-2024 | 3,000,000 | 3,079,619 |
| Housing revenue: 1.79% | | | | | |
| District of Columbia HFA MFHR Strand Residences Project | | 2.50 | 2-1-2039 | 1,500,000 | 1,489,323 |
| District of Columbia HFA Park Southern Apartments Project (FHA Insured) øø | | 0.70 | 6-1-2024 | 20,000,000 | 19,692,112 |
| | | | | | 21,181,435 |
| Tax revenue: 0.18% | | | | | |
| District of Columbia Income Tax Secured Revenue Bonds Series 2019A | | 5.00 | 3-1-2023 | 2,105,000 | 2,111,704 |
| Transportation revenue: 0.48% | | | | | |
| Washington DC Metropolitan Area Transit Authority Series A | | 5.00 | 7-15-2023 | 3,600,000 | 3,639,350 |
| Washington DC Metropolitan Area Transit Authority Series A | | 5.00 | 7-15-2024 | 2,000,000 | 2,067,305 |
| | | | | | 5,706,655 |
| Water & sewer revenue: 0.02% | | | | | |
| District of Columbia Water & Sewer Authority Public Utility Subordinated Lien Bond Series C | | 1.75 | 10-1-2054 | 300,000 | 289,947 |
| | | | | | 32,369,360 |
| Florida: 3.66% | | | | | |
| Education revenue: 0.06% | | | | | |
| Florida HEFAR Florida Institute of Technology | | 5.00 | 10-1-2023 | 500,000 | 504,190 |
| Florida HEFAR Florida Institute of Technology | | 5.00 | 10-1-2024 | 250,000 | 254,935 |
| | | | | | 759,125 |
| Health revenue: 0.61% | | | | | |
| Highlands County FL Health Facilities Authority Adventist Health System Series A-2 ø | | 1.14 | 11-15-2037 | 2,200,000 | 2,200,000 |
The accompanying notes are an integral part of these financial statements.
14 | Allspring Ultra Short-Term Municipal Income Fund
Portfolio of investments—December 31, 2022 (unaudited)
| | | Interest
rate | Maturity
date | Principal | Value |
| Health revenue (continued) | | | | | |
| Jacksonville FL HCFR Baptist Health Series D ø | | 3.65% | 8-1-2036 | $ 3,000,000 | $ 3,000,000 |
| Lee Memorial Health System Series B ø | | 4.21 | 4-1-2049 | 2,000,000 | 2,000,000 |
| | | | | | 7,200,000 |
| Housing revenue: 2.56% | | | | | |
| Capital Trust Agency Florida College Park Towers Apartments Project (Department of Housing and Urban Development Insured) | | 1.25 | 5-1-2024 | 14,000,000 | 13,896,145 |
| Capital Trust Agency Florida Council Towers Apartments Project Series A | | 1.50 | 11-1-2023 | 10,450,000 | 10,341,733 |
| Tender Option Bond Trust Receipts/Floater Certificates Series 2022-XF3058 (Mizuho Capital Markets LLC LOC) 144Aø | | 3.88 | 8-1-2039 | 6,100,000 | 6,100,000 |
| | | | | | 30,337,878 |
| Miscellaneous revenue: 0.27% | | | | | |
| Miami-Dade County FL School Board Certificate of Participation Series A | | 5.00 | 5-1-2031 | 3,100,000 | 3,180,896 |
| Water & sewer revenue: 0.16% | | | | | |
| North Sumter County Utility Dependent District Utility Revenue Bonds Series 2021 (AGM Insured) | | 5.00 | 10-1-2025 | 635,000 | 671,280 |
| North Sumter County Utility Dependent District Utility Revenue Bonds Series 2021 (AGM Insured) | | 5.00 | 10-1-2026 | 1,100,000 | 1,184,357 |
| | | | | | 1,855,637 |
| | | | | | 43,333,536 |
| Georgia: 2.88% | | | | | |
| Health revenue: 0.23% | | | | | |
| Cobb County GA Kennestone Hospital Authority Revenue Anticipation Certificate Wellstar Health System | | 5.00 | 4-1-2024 | 1,300,000 | 1,327,442 |
| Cobb County GA Kennestone Hospital Authority Revenue Anticipation Certificate Wellstar Health System | | 5.00 | 4-1-2025 | 660,000 | 685,400 |
| The Hospital Authority of Hall County & the City of Gainesville Revenue Anticipation Certificate Series 2021A | | 5.00 | 2-15-2026 | 700,000 | 730,677 |
| | | | | | 2,743,519 |
| Housing revenue: 1.55% | | | | | |
| Augusta GA Housing Authority Georgia Multifamily Housing Series 2021 (Department of Housing and Urban Development Insured) | | 1.25 | 12-1-2024 | 8,875,000 | 8,700,908 |
| College Park GA Business & IDA Series 2021B | | 1.25 | 7-1-2025 | 10,000,000 | 9,625,738 |
| | | | | | 18,326,646 |
| Utilities revenue: 1.10% | | | | | |
| Burke County GA Development Authority PCR Bonds First Series 2012 | | 2.88 | 12-1-2049 | 3,000,000 | 2,960,203 |
| Georgia Municipal Electric Authority Bonds | | 5.00 | 7-1-2025 | 200,000 | 208,621 |
| Georgia Municipal Electric Authority Bonds (AGM Insured) | | 5.00 | 7-1-2026 | 300,000 | 318,694 |
| Main Street Natural Gas Incorporated Gas Supply Revenue Bonds Series 2018C (Royal Bank of Canada LIQ) | | 4.00 | 8-1-2048 | 805,000 | 804,391 |
| Main Street Natural Gas Incorporated Gas Supply Revenue Bonds Series 2021C | | 4.00 | 12-1-2024 | 700,000 | 699,386 |
The accompanying notes are an integral part of these financial statements.
Allspring Ultra Short-Term Municipal Income Fund | 15
Portfolio of investments—December 31, 2022 (unaudited)
| | | Interest
rate | Maturity
date | Principal | Value |
| Utilities revenue (continued) | | | | | |
| Main Street Natural Gas Incorporated Gas Supply Revenue Bonds Series 2021C | | 4.00% | 12-1-2025 | $ 1,000,000 | $ 997,090 |
| Main Street Natural Gas Incorporated Gas Supply Revenue Bonds Series 2022A | | 4.00 | 12-1-2023 | 1,000,000 | 1,000,223 |
| Main Street Natural Gas Incorporated Gas Supply Revenue Bonds Series 2022C 144Aøø | | 4.00 | 8-1-2052 | 4,000,000 | 3,760,728 |
| Monroe County GA Development Authority PCR Georgia Power Company Plant Scherer Project First Series 2009 øø | | 1.00 | 7-1-2049 | 1,875,000 | 1,675,238 |
| Municipal Electric Authority of Georgia Plant Vogtle Units 3&4 Project J Bonds Series 2021A | | 5.00 | 1-1-2024 | 165,000 | 167,651 |
| Municipal Electric Authority of Georgia Plant Vogtle Units 3&4 Project J Bonds Series 2021A (AGM Insured) | | 5.00 | 1-1-2025 | 200,000 | 206,998 |
| Municipal Electric Authority of Georgia Plant Vogtle Units 3&4 Project J Bonds Series 2021A (AGM Insured) | | 5.00 | 1-1-2026 | 225,000 | 237,123 |
| | | | | | 13,036,346 |
| | | | | | 34,106,511 |
| Guam: 0.12% | | | | | |
| Airport revenue: 0.12% | | | | | |
| Guam International Airport Authority AMT Refunding Bond Series A | | 5.00 | 10-1-2023 | 1,395,000 | 1,410,985 |
| Hawaii: 0.91% | | | | | |
| GO revenue: 0.34% | | | | | |
| Honolulu HI GO Series 2022A | | 5.00 | 11-1-2023 | 2,250,000 | 2,289,494 |
| Honolulu HI GO Series 2022A | | 5.00 | 11-1-2024 | 1,750,000 | 1,822,717 |
| | | | | | 4,112,211 |
| Health revenue: 0.15% | | | | | |
| Hawaii Department of Budget & Finance Queens Health System Series B (SIFMA Municipal Swap +0.45%) ± | | 4.11 | 7-1-2039 | 1,750,000 | 1,750,000 |
| Miscellaneous revenue: 0.17% | | | | | |
| State of Hawaii Department of Transport Airports Division Lease Revenue Certificate of Participation Series 2013 | | 5.25 | 8-1-2024 | 2,000,000 | 2,021,499 |
| Utilities revenue: 0.25% | | | | | |
| Hawaii Department of Budget & Finance Hawaiian Electric Company Series 2017A | | 3.10 | 5-1-2026 | 3,000,000 | 2,929,193 |
| | | | | | 10,812,903 |
| Idaho: 0.15% | | | | | |
| Housing revenue: 0.15% | | | | | |
| Idaho Housing & Finance Association Series A ø | | 3.86 | 1-1-2038 | 1,800,000 | 1,800,000 |
The accompanying notes are an integral part of these financial statements.
16 | Allspring Ultra Short-Term Municipal Income Fund
Portfolio of investments—December 31, 2022 (unaudited)
| | | Interest
rate | Maturity
date | Principal | Value |
| Illinois: 6.99% | | | | | |
| Airport revenue: 0.58% | | | | | |
| Chicago IL O'Hare International Airport Senior Lien Refunding Bonds Series 2013A | | 5.00% | 1-1-2026 | $ 4,205,000 | $ 4,205,000 |
| Chicago IL O'Hare International Airport Senior Lien Refunding Bonds Series 2022D | | 5.00 | 1-1-2025 | 2,500,000 | 2,606,163 |
| | | | | | 6,811,163 |
| Education revenue: 0.47% | | | | | |
| Illinois Finance Authority Benedictine University Series 2021 | | 5.00 | 10-1-2025 | 600,000 | 608,570 |
| Illinois Finance Authority University of Chicago Series 2021A | | 5.00 | 10-1-2023 | 1,400,000 | 1,421,306 |
| Illinois Finance Authority University of Chicago Series 2021A | | 5.00 | 10-1-2025 | 1,500,000 | 1,591,410 |
| Southern Illinois University Housing and Auxiliary Facilities Refunding Revenue Bonds Series A (BAM Insured) | | 4.00 | 4-1-2024 | 1,200,000 | 1,207,795 |
| Southern Illinois University Housing and Auxiliary Facilities System Series 2022A (BAM Insured) | | 5.00 | 4-1-2025 | 750,000 | 776,395 |
| | | | | | 5,605,476 |
| GO revenue: 1.86% | | | | | |
| Chicago IL CAB City Colleges (NPFGC Insured) ¤ | | 0.00 | 1-1-2024 | 3,670,000 | 3,531,776 |
| Chicago IL Series 2002B | | 5.00 | 1-1-2026 | 2,750,000 | 2,794,548 |
| Chicago IL Series A | | 5.00 | 1-1-2025 | 2,500,000 | 2,548,065 |
| Illinois GO Series 2022B | | 5.00 | 3-1-2025 | 1,500,000 | 1,531,578 |
| Illinois GO Series March 2022A | | 5.00 | 3-1-2024 | 1,500,000 | 1,520,815 |
| Illinois GO Tax-Exempt Refunding Bonds 2019 Series B | | 5.00 | 9-1-2025 | 3,500,000 | 3,584,589 |
| Illinois Series 2022A | | 5.00 | 3-1-2023 | 2,000,000 | 2,004,263 |
| Kane & Cook Counties IL Community College District #509 Series 2021B | | 4.00 | 12-15-2025 | 1,200,000 | 1,240,683 |
| Peoria IL Refunding Bonds Series A (BAM Insured) | | 4.00 | 1-1-2025 | 1,250,000 | 1,273,745 |
| Peoria IL Refunding Bonds Series A (BAM Insured) | | 4.00 | 1-1-2026 | 500,000 | 515,540 |
| Whiteside & Lee Counties Community Unit School District 5 Series A (BAM Insured) | | 4.00 | 12-1-2023 | 1,435,000 | 1,446,300 |
| | | | | | 21,991,902 |
| Health revenue: 0.65% | | | | | |
| Illinois Finance Authority Healthcare System Series B-1 | | 5.00 | 5-15-2050 | 1,200,000 | 1,225,862 |
| Illinois Finance Authority Rehabilitation Institute of Chicago | | 5.00 | 7-1-2023 | 1,100,000 | 1,105,438 |
| Illinois Finance Authority Revenue Refunding Bonds Series 2022 | | 4.00 | 10-15-2023 | 205,000 | 203,793 |
| Illinois Finance Authority Revenue Refunding Bonds Series 2022 | | 4.00 | 10-15-2024 | 210,000 | 206,732 |
| Illinois Finance Authority Revenue Various Refunding Bond Northwestern Memorial (Barclays Bank plc SPA) ø | | 3.37 | 7-15-2055 | 5,000,000 | 5,000,000 |
| | | | | | 7,741,825 |
| Housing revenue: 0.41% | | | | | |
| Chicago Heights IL MFHR Series 2022 | | 2.88 | 8-1-2027 | 5,000,000 | 4,882,971 |
| Miscellaneous revenue: 0.52% | | | | | |
| Chicago IL Board of Education Series B | | 5.00 | 12-1-2023 | 1,150,000 | 1,160,936 |
The accompanying notes are an integral part of these financial statements.
Allspring Ultra Short-Term Municipal Income Fund | 17
Portfolio of investments—December 31, 2022 (unaudited)
| | | Interest
rate | Maturity
date | Principal | Value |
| Miscellaneous revenue (continued) | | | | | |
| Illinois Series 2014 | | 5.00% | 5-1-2025 | $ 2,000,000 | $ 2,025,708 |
| Illinois Series A | | 5.00 | 3-1-2023 | 3,000,000 | 3,006,394 |
| | | | | | 6,193,038 |
| Tax revenue: 2.05% | | | | | |
| Chicago Illinois Board of Education Refunding Bonds Series 2017F | | 5.00 | 12-1-2024 | 2,500,000 | 2,545,865 |
| Illinois Regional Transportation Authority Series B ø | | 2.75 | 6-1-2025 | 17,585,000 | 17,585,000 |
| Illinois Sales Tax Revenue Refunding Bond Series C | | 4.00 | 6-15-2023 | 1,000,000 | 1,002,339 |
| Illinois Series 2013 | | 5.00 | 6-15-2024 | 1,000,000 | 1,005,632 |
| Metropolitan Pier & Exposition Authority McCormick Place Project Refunding Bonds Series A | | 3.00 | 6-15-2024 | 2,100,000 | 2,081,815 |
| | | | | | 24,220,651 |
| Water & sewer revenue: 0.45% | | | | | |
| Chicago IL Water Revenue Refunding Bonds Series 2004 | | 5.00 | 11-1-2023 | 1,645,000 | 1,668,072 |
| Geneva IL Series 2021 | | 4.00 | 2-1-2024 | 650,000 | 656,709 |
| Joliet IL Waterworks and Sewerage Senior Lien Revenue BAN Series 2022 | | 5.00 | 1-1-2024 | 2,000,000 | 2,023,931 |
| South Sangamon IL Water Commission (AGM Insured) | | 4.00 | 1-1-2023 | 500,000 | 500,000 |
| South Sangamon IL Water Commission (AGM Insured) | | 4.00 | 1-1-2026 | 500,000 | 509,889 |
| | | | | | 5,358,601 |
| | | | | | 82,805,627 |
| Indiana: 2.72% | | | | | |
| Education revenue: 0.05% | | | | | |
| Town of Upland IN Economic Development Revenue Bonds Series 2021 | | 4.00 | 9-1-2025 | 590,000 | 599,891 |
| GO revenue: 0.26% | | | | | |
| Center Grove IN Community School Corporation Series 2021B | | 4.00 | 7-1-2023 | 2,025,000 | 2,027,597 |
| Whitestown IN Series 2022 | | 4.25 | 12-31-2023 | 1,060,000 | 1,062,120 |
| | | | | | 3,089,717 |
| Housing revenue: 0.11% | | | | | |
| Indianapolis IN MFHR Series 2022A | | 3.00 | 5-1-2027 | 1,251,000 | 1,242,843 |
| Industrial development revenue: 1.41% | | | | | |
| Indiana Finance Authority Tax-Exempt Private Activity Bonds Ohio River Bridges East End Crossing Partners LLC Project Series A-P3 | | 5.00 | 7-1-2048 | 14,315,000 | 14,421,948 |
| Whiting IN Environmental Facilities North America Incorporated Project | | 5.00 | 11-1-2047 | 2,250,000 | 2,281,175 |
| | | | | | 16,703,123 |
| Miscellaneous revenue: 0.41% | | | | | |
| Fort Wayne IN RDA Indiana Lease Rental Revenue Refunding Bonds Series 2022 | | 4.00 | 8-1-2023 | 795,000 | 799,075 |
| Fort Wayne IN RDA Lease Rental Revenue Refunding Bonds Series 2022 | | 4.00 | 8-1-2024 | 730,000 | 741,563 |
| Indianapolis IN Series 2021A | | 5.00 | 6-1-2024 | 1,700,000 | 1,742,950 |
The accompanying notes are an integral part of these financial statements.
18 | Allspring Ultra Short-Term Municipal Income Fund
Portfolio of investments—December 31, 2022 (unaudited)
| | | Interest
rate | Maturity
date | Principal | Value |
| Miscellaneous revenue (continued) | | | | | |
| Marion Industry High School Building Corporation First Mortgage Bonds Series B | | 4.00% | 7-15-2023 | $ 210,000 | $ 210,966 |
| Marion Industry High School Building Corporation First Mortgage Bonds Series B | | 4.00 | 1-15-2024 | 215,000 | 216,984 |
| Marion Industry High School Building Corporation First Mortgage Bonds Series B | | 4.00 | 7-15-2024 | 220,000 | 223,268 |
| Marion Industry High School Building Corporation First Mortgage Bonds Series B | | 4.00 | 1-15-2025 | 225,000 | 229,309 |
| Marion Industry High School Building Corporation First Mortgage Bonds Series B | | 4.00 | 7-15-2025 | 225,000 | 230,036 |
| Tippecanoe County IN Vinton-Tecumseh School Building Corporation Series 2021 | | 3.00 | 1-15-2025 | 505,000 | 504,996 |
| | | | | | 4,899,147 |
| Utilities revenue: 0.48% | | | | | |
| Mount Vernon Industry Environmental Southern Industry Gas and Electric Company øø | | 0.88 | 9-1-2055 | 5,750,000 | 5,652,012 |
| | | | | | 32,186,733 |
| Iowa: 0.25% | | | | | |
| Industrial development revenue: 0.25% | | | | | |
| Iowa Finance Authority Solid Waste Facilities Revenue (Citibank NA LOC) | | 1.50 | 1-1-2042 | 3,000,000 | 2,931,311 |
| Kansas: 0.46% | | | | | |
| Health revenue: 0.04% | | | | | |
| Wichita KS HCFR Series I | | 3.75 | 5-15-2023 | 485,000 | 482,668 |
| Utilities revenue: 0.42% | | | | | |
| Burlington KS Environmental Impact Series A ø | | 3.68 | 9-1-2035 | 5,000,000 | 5,000,000 |
| | | | | | 5,482,668 |
| Kentucky: 0.67% | | | | | |
| Education revenue: 0.08% | | | | | |
| Columbia KY Kentucky Educational Development Funding Revenue Bonds Series 2021 | | 4.00 | 12-1-2023 | 450,000 | 451,537 |
| Columbia KY Kentucky Educational Development Funding Revenue Bonds Series 2021 | | 4.00 | 12-1-2025 | 485,000 | 480,054 |
| | | | | | 931,591 |
| Health revenue: 0.25% | | | | | |
| Louisville/Jefferson County KY Metro Government Health System Revenue Bonds Series 2020B | | 5.00 | 10-1-2047 | 3,000,000 | 3,020,980 |
| Utilities revenue: 0.17% | | | | | |
| Paducah KY Electric Plant Board Refunding Bond | | 5.00 | 10-1-2023 | 1,995,000 | 2,020,502 |
| Water & sewer revenue: 0.17% | | | | | |
| Kentucky Rural Water Financing Agency Series 2021A | | 0.40 | 5-1-2023 | 2,000,000 | 1,977,510 |
| | | | | | 7,950,583 |
The accompanying notes are an integral part of these financial statements.
Allspring Ultra Short-Term Municipal Income Fund | 19
Portfolio of investments—December 31, 2022 (unaudited)
| | | Interest
rate | Maturity
date | Principal | Value |
| Louisiana: 2.08% | | | | | |
| Health revenue: 0.42% | | | | | |
| Louisiana Public Facilities Authority Hospital Revenue Louisiana Children's Medical Center Project | | 5.00% | 6-1-2045 | $ 5,000,000 | $ 5,025,461 |
| Miscellaneous revenue: 1.25% | | | | | |
| Louisiana Local Government Environmental Facilities and CDA Subordinated Lien Bond East Baton Rouge øø | | 0.88 | 2-1-2046 | 9,000,000 | 8,491,478 |
| Louisiana Stadium & Exposition District Revenue BAN | | 4.00 | 7-3-2023 | 6,250,000 | 6,257,676 |
| | | | | | 14,749,154 |
| Tax revenue: 0.41% | | | | | |
| Louisiana Gasoline and Fuel Tax Second Lien Revenue Refunding Bonds Series A (U.S. SOFR +0.50%) ± | | 3.51 | 5-1-2043 | 4,960,000 | 4,835,482 |
| | | | | | 24,610,097 |
| Maine: 0.11% | | | | | |
| Health revenue: 0.11% | | | | | |
| Maine HEFAR Bonds Series 2020A | | 4.00 | 7-1-2024 | 335,000 | 339,822 |
| Maine HEFAR Bonds Series 2020A | | 4.00 | 7-1-2024 | 420,000 | 427,029 |
| Maine HEFAR Bonds Series 2020A | | 5.00 | 7-1-2023 | 255,000 | 257,254 |
| Maine HEFAR Bonds Series 2020A | | 5.00 | 7-1-2023 | 320,000 | 323,094 |
| | | | | | 1,347,199 |
| Maryland: 3.61% | | | | | |
| Health revenue: 0.12% | | | | | |
| Maryland Health & HEFAR Adventist Healthcare Series 2021 | | 5.00 | 1-1-2023 | 795,000 | 795,000 |
| Maryland Health & HEFAR Adventist Healthcare Series 2021 | | 5.00 | 1-1-2024 | 540,000 | 545,936 |
| | | | | | 1,340,936 |
| Housing revenue: 3.49% | | | | | |
| CDA Department of Housing & Community Development Multifamily Development Revenue Bonds Series 2021B | | 0.80 | 9-1-2023 | 15,000,000 | 14,633,228 |
| Maryland CDA Department of Housing & Community Multifamily Development Series 2022-D | | 3.15 | 7-1-2024 | 4,000,000 | 3,912,805 |
| Maryland CDA Department of Housing & Community Multifamily Development Windsor Valley III Apartments Series G (FHA Insured) | | 1.05 | 12-1-2023 | 10,000,000 | 9,683,786 |
| Maryland CDA Department of Housing & Community Multifamily Development Woodside Gardens Series A 144A | | 1.33 | 1-1-2024 | 6,000,000 | 5,802,893 |
| Maryland CDA Department of Housing Rosemont Tower LLC Series A (GNMA Insured) 144A | | 0.83 | 5-1-2023 | 7,400,000 | 7,342,269 |
| | | | | | 41,374,981 |
| | | | | | 42,715,917 |
| Massachusetts: 2.62% | | | | | |
| Education revenue: 0.13% | | | | | |
| Massachusetts Development Finance Agency Lasell University Revenue Refunding Bonds | | 4.00 | 7-1-2023 | 210,000 | 209,463 |
The accompanying notes are an integral part of these financial statements.
20 | Allspring Ultra Short-Term Municipal Income Fund
Portfolio of investments—December 31, 2022 (unaudited)
| | | Interest
rate | Maturity
date | Principal | Value |
| Education revenue (continued) | | | | | |
| Massachusetts Development Finance Agency Lasell University Revenue Refunding Bonds | | 4.00% | 7-1-2024 | $ 225,000 | $ 222,883 |
| Massachusetts Development Finance Agency Revenue Bonds Series 2021A | | 5.00 | 6-1-2025 | 1,065,000 | 1,094,542 |
| | | | | | 1,526,888 |
| Health revenue: 0.71% | | | | | |
| Massachusetts Development Finance Agency Milford Regional Medical Center Series G 144A | | 5.00 | 7-15-2023 | 125,000 | 125,702 |
| Massachusetts Development Finance Agency Milford Regional Medical Center Series G 144A | | 5.00 | 7-15-2024 | 125,000 | 127,098 |
| Massachusetts Development Finance Agency Wellforce Incorporate Series C (AGM Insured) | | 5.00 | 10-1-2023 | 635,000 | 642,650 |
| Massachusetts HEFA Partners Healthcare Series G-2 (AGM Insured) € | | 2.41 | 7-1-2042 | 7,520,000 | 7,520,000 |
| | | | | | 8,415,450 |
| Housing revenue: 0.32% | | | | | |
| Boston Housing Authority Capital Program Revenue Refunding Bond Series B | | 5.00 | 10-1-2024 | 650,000 | 675,080 |
| Boston Housing Authority Capital Program Revenue Refunding Bond Series B | | 5.00 | 10-1-2025 | 380,000 | 403,779 |
| Massachusetts Development Finance Agency MFHR Bonds Salem Heights Series B øø | | 0.25 | 7-1-2024 | 2,750,000 | 2,693,479 |
| | | | | | 3,772,338 |
| Tax revenue: 0.15% | | | | | |
| Massachusetts Bay Transportation Authority Series B-1 | | 5.00 | 7-1-2023 | 1,775,000 | 1,793,118 |
| Transportation revenue: 1.31% | | | | | |
| Massachusetts Department of Transportation Refunding Bond ø | | 5.00 | 1-1-2039 | 15,490,000 | 15,490,000 |
| | | | | | 30,997,794 |
| Michigan: 0.44% | | | | | |
| Education revenue: 0.04% | | | | | |
| Lake Superior State University Michigan Revenue Refunding General Revenue Refunding Bonds Series 2012 (AGM Insured) | | 4.00 | 11-15-2023 | 525,000 | 529,207 |
| GO revenue: 0.23% | | | | | |
| Genesee County MI Carman-Ainsworth Community School | | 4.00 | 5-1-2025 | 2,685,000 | 2,739,821 |
| Health revenue: 0.17% | | | | | |
| Kent MI Hospital Finance Authority Series 2015A ø | | 3.91 | 1-15-2047 | 2,000,000 | 2,000,000 |
| | | | | | 5,269,028 |
| Minnesota: 0.66% | | | | | |
| GO revenue: 0.16% | | | | | |
| Hennepin County MN Series 2018B (TD Bank NA SPA) ø | | 3.58 | 12-1-2038 | 1,930,000 | 1,930,000 |
| Health revenue: 0.04% | | | | | |
| Minnesota HCFR Maple Grove Hospital Corporation | | 5.00 | 5-1-2023 | 390,000 | 392,031 |
The accompanying notes are an integral part of these financial statements.
Allspring Ultra Short-Term Municipal Income Fund | 21
Portfolio of investments—December 31, 2022 (unaudited)
| | | Interest
rate | Maturity
date | Principal | Value |
| Miscellaneous revenue: 0.25% | | | | | |
| Lake Agassiz Education Cooperative Certificate of Participation Series A | | 3.00% | 2-1-2023 | $ 255,000 | $ 254,750 |
| Lake Agassiz Education Cooperative Certificate of Participation Series A | | 3.00 | 2-1-2024 | 265,000 | 262,399 |
| Minnesota Rural Water Financial Authority Public Projects Construction Notes | | 2.63 | 12-1-2023 | 2,500,000 | 2,466,036 |
| | | | | | 2,983,185 |
| Utilities revenue: 0.21% | | | | | |
| Minnesota Municipal Gas Agency Commodity Supply Revenue Bonds Series 2022 (Royal Bank of Canada LIQ) | | 4.00 | 12-1-2023 | 2,500,000 | 2,501,664 |
| | | | | | 7,806,880 |
| Missouri: 0.45% | | | | | |
| Miscellaneous revenue: 0.45% | | | | | |
| Missouri Public Utilities Commission Interim Construction Notes | | 0.75 | 8-1-2023 | 5,400,000 | 5,294,566 |
| Nebraska: 1.75% | | | | | |
| Miscellaneous revenue: 0.52% | | | | | |
| Gretna NE Series 2021 | | 4.00 | 12-15-2025 | 3,000,000 | 3,052,812 |
| Gretna NE Tax Supported Certificates Series 2022 | | 5.00 | 12-15-2025 | 3,000,000 | 3,109,547 |
| | | | | | 6,162,359 |
| Utilities revenue: 1.23% | | | | | |
| Nebraska Central Plains Energy Gas Project #4 | | 5.00 | 3-1-2050 | 4,600,000 | 4,643,339 |
| Nebraska Public Power District Revenue General Series A øø | | 0.60 | 1-1-2051 | 10,075,000 | 9,935,540 |
| | | | | | 14,578,879 |
| | | | | | 20,741,238 |
| Nevada: 1.69% | | | | | |
| GO revenue: 0.22% | | | | | |
| Clark County NV School District Refunding Bond Limited Tax Series A | | 5.00 | 6-15-2023 | 2,095,000 | 2,113,043 |
| Clark County NV School District Refunding Bond Limited Tax Series C | | 5.00 | 6-15-2023 | 500,000 | 504,306 |
| | | | | | 2,617,349 |
| Industrial development revenue: 1.47% | | | | | |
| Director of the State of Nevada Department of Business and Industry Revenue Bonds Series 2020A 144Aøø | | 0.85 | 1-1-2050 | 17,500,000 | 17,466,237 |
| | | | | | 20,083,586 |
| New Jersey: 2.63% | | | | | |
| Education revenue: 0.10% | | | | | |
| New Jersey Higher Education Assistance Authority Series B | | 5.00 | 12-1-2023 | 300,000 | 303,814 |
| New Jersey Higher Education Assistance Authority Series B | | 5.00 | 12-1-2025 | 850,000 | 884,078 |
| | | | | | 1,187,892 |
The accompanying notes are an integral part of these financial statements.
22 | Allspring Ultra Short-Term Municipal Income Fund
Portfolio of investments—December 31, 2022 (unaudited)
| | | Interest
rate | Maturity
date | Principal | Value |
| GO revenue: 1.56% | | | | | |
| New Jersey EDA Revenue Refunding Bonds School Facilities Construction Series GGG 144A | | 5.25% | 9-1-2026 | $ 5,000,000 | $ 5,336,017 |
| New Jersey EDA Series G 144A | | 5.25 | 9-1-2023 | 10,000,000 | 10,123,207 |
| Newark NJ General Capital Improvement BAN Series 2022D | | 4.00 | 9-29-2023 | 3,028,000 | 3,035,192 |
| | | | | | 18,494,416 |
| Miscellaneous revenue: 0.22% | | | | | |
| New Jersey Transportation Trust Fund Series D | | 5.25 | 12-15-2023 | 2,600,000 | 2,647,078 |
| Tax revenue: 0.25% | | | | | |
| New Jersey COVID-19 Emergency Series A | | 4.00 | 6-1-2023 | 3,000,000 | 3,011,639 |
| Transportation revenue: 0.08% | | | | | |
| New Brunswick NJ Parking Authority City Guaranteed Series B (BAM Insured) | | 5.00 | 9-1-2024 | 875,000 | 904,534 |
| Water & sewer revenue: 0.42% | | | | | |
| New Jersey EDA Refunding Bond AMT American Water Company Incorporated | | 1.20 | 11-1-2034 | 5,000,000 | 4,950,494 |
| | | | | | 31,196,053 |
| New Mexico: 0.64% | | | | | |
| Health revenue: 0.05% | | | | | |
| New Mexico Hospital Equipment Loan Council Hospital Improvement System Sanitary Juan Regional | | 5.00 | 6-1-2023 | 665,000 | 669,333 |
| Utilities revenue: 0.59% | | | | | |
| Farmington NM PCR Bonds Series 2010B | | 3.00 | 6-1-2040 | 7,000,000 | 6,956,947 |
| | | | | | 7,626,280 |
| New York: 10.18% | | | | | |
| Airport revenue: 0.22% | | | | | |
| New York Transportation Development Corporation Special Facility Revenue Terminal 4 John F Kennedy International | | 5.00 | 12-1-2023 | 1,260,000 | 1,275,004 |
| New York Transportation Development Corporation Special Facility Revenue Terminal 4 John F Kennedy International | | 5.00 | 12-1-2024 | 1,250,000 | 1,283,663 |
| | | | | | 2,558,667 |
| Education revenue: 0.36% | | | | | |
| Albany NY IDA Foundation State University Project Series A ø | | 3.74 | 7-1-2032 | 2,120,000 | 2,120,000 |
| New York Dormitory Authority Iona College Series 2022 | | 5.00 | 7-1-2023 | 550,000 | 553,520 |
| Saratoga County NY Capital Resource Corporation Revenue Refunding Skidmore College Series A | | 5.00 | 7-1-2023 | 575,000 | 580,644 |
| Saratoga County NY Capital Resource Corporation Revenue Refunding Skidmore College Series A | | 5.00 | 7-1-2024 | 600,000 | 617,324 |
| Saratoga County NY Capital Resource Corporation Revenue Refunding Skidmore College Series A | | 5.00 | 7-1-2025 | 425,000 | 445,401 |
| | | | | | 4,316,889 |
| GO revenue: 2.82% | | | | | |
| Long Beach NY Public Improvement Series A | | 5.00 | 9-1-2023 | 2,075,000 | 2,094,376 |
The accompanying notes are an integral part of these financial statements.
Allspring Ultra Short-Term Municipal Income Fund | 23
Portfolio of investments—December 31, 2022 (unaudited)
| | | Interest
rate | Maturity
date | Principal | Value |
| GO revenue (continued) | | | | | |
| New York NY Adjusted Fiscal 2008 Subordinate Bond Series A-4 (AGM Insured) € | | 3.79% | 8-1-2026 | $ 125,000 | $ 125,000 |
| New York NY Adjusted Fiscal 2008 Subordinate Bond Series C-4 (AGC Insured) € | | 4.15 | 10-1-2027 | 13,050,000 | 13,050,000 |
| New York NY Series J Subordinate Bond Series J-2 (AGM Insured) € | | 4.09 | 6-1-2036 | 1,350,000 | 1,350,000 |
| New York NY Series J Subordinate Bond Series J3 (AGM Insured) € | | 4.15 | 6-1-2036 | 2,900,000 | 2,900,000 |
| New York NY Subordinate Bond Series C-4 (AGM Insured) € | | 4.15 | 1-1-2032 | 800,000 | 800,000 |
| New York NY Various Fiscal 2021 Series 2 ø | | 3.97 | 4-1-2042 | 500,000 | 500,000 |
| Oyster Bay NY New York Water District Notes 2022 | | 3.00 | 3-9-2023 | 12,000,000 | 11,997,642 |
| Yonkers NY Series 2021A (AGM Insured) | | 5.00 | 2-15-2025 | 315,000 | 329,029 |
| Yonkers NY Series 2021B (AGM Insured) | | 5.00 | 2-15-2025 | 305,000 | 318,967 |
| | | | | | 33,465,014 |
| Health revenue: 0.41% | | | | | |
| Broome County NY Local Development Corporation United Health Services Hospital Incorporated Project (AGM Insured) | | 5.00 | 4-1-2024 | 500,000 | 511,784 |
| Broome County NY Local Development Corporation United Health Services Hospital Incorporated Project (AGM Insured) | | 5.00 | 4-1-2025 | 500,000 | 519,573 |
| New York NY Health & Hospital Corporation Health System Bonds Series A | | 5.00 | 2-15-2025 | 3,615,000 | 3,781,304 |
| | | | | | 4,812,661 |
| Housing revenue: 1.11% | | | | | |
| Deutsche Bank Short Puttable Exempt Adjustable Receipts/Long Inverse Floating Exempt Receipts Trust Series DBE-8063 (Deutsche Bank LOC, Deutsche Bank LIQ) 144Aø | | 4.06 | 10-1-2045 | 718,814 | 718,814 |
| New York Housing Finance Agency Revenue Affordable Housing Series J Climate | | 0.75 | 5-1-2025 | 8,250,000 | 7,739,005 |
| New York NY Housing Development Corporation Series A-3 | | 1.13 | 5-1-2060 | 4,000,000 | 3,812,972 |
| New York NY Housing Development Corporation Series C-2 øø | | 0.70 | 11-1-2060 | 1,000,000 | 926,141 |
| | | | | | 13,196,932 |
| Industrial development revenue: 1.60% | | | | | |
| New York Energy Research & Development Authority PCR Keyspan Generation Series A (Ambac Insured) € | | 3.40 | 10-1-2028 | 900,000 | 900,000 |
| New York Transportation Development Corporation Series 2018 | | 5.00 | 1-1-2023 | 12,750,000 | 12,750,000 |
| New York Transportation Development Corporation Special Facilities Revenue Delta Airlines Incorporated LaGuardia Airport Terminals C&D Redevelopment Project | | 5.00 | 1-1-2024 | 5,250,000 | 5,283,451 |
| | | | | | 18,933,451 |
| Miscellaneous revenue: 1.10% | | | | | |
| New York IDA Series 2021A (AGM Insured) | | 5.00 | 1-1-2026 | 1,000,000 | 1,057,106 |
| RBC Municipal Products Incorporated Series E-154 (Royal Bank of Canada LOC, Royal Bank of Canada LIQ) 144Aø | | 3.76 | 6-1-2028 | 12,000,000 | 12,000,000 |
| | | | | | 13,057,106 |
The accompanying notes are an integral part of these financial statements.
24 | Allspring Ultra Short-Term Municipal Income Fund
Portfolio of investments—December 31, 2022 (unaudited)
| | | Interest
rate | Maturity
date | Principal | Value |
| Tax revenue: 0.33% | | | | | |
| Tender Option Bond Trust Receipts/Certificates Series 2021-XF1125 (Deutsche Bank LIQ) 144Aø | | 3.72% | 5-15-2051 | $ 1,105,500 | $ 1,105,500 |
| Triborough Bridge & Tunnel Authority Series 2022B | | 5.00 | 5-15-2024 | 2,705,000 | 2,787,052 |
| | | | | | 3,892,552 |
| Transportation revenue: 1.58% | | | | | |
| New York Metropolitan Transportation Authority BAN | | 5.00 | 2-1-2023 | 4,050,000 | 4,052,958 |
| New York Metropolitan Transportation Authority Refunding Green Bonds Series D1 | | 5.00 | 11-15-2034 | 9,000,000 | 9,223,397 |
| Triborough Bridge & Tunnel Authority Series 2013A (U.S. SOFR +0.38%) ± | | 3.26 | 1-1-2032 | 3,910,000 | 3,864,013 |
| Triborough Bridge & Tunnel Authority Series A | | 5.00 | 11-15-2023 | 1,570,000 | 1,581,878 |
| | | | | | 18,722,246 |
| Water & sewer revenue: 0.65% | | | | | |
| New York Municipal Water Finance Authority Second General Resolution Revenue Bonds Series DD ø | | 4.00 | 6-15-2033 | 3,000,000 | 3,000,000 |
| New York Municipal Water Finance Authority Water & Sewer System Revenue Second General Resolution | | 4.00 | 6-15-2024 | 3,000,000 | 3,054,402 |
| New York Water Finance Authority Series DD | | 5.00 | 6-15-2025 | 1,535,000 | 1,624,419 |
| | | | | | 7,678,821 |
| | | | | | 120,634,339 |
| North Carolina: 1.16% | | | | | |
| Health revenue: 0.18% | | | | | |
| Charlotte Mecklenburg Hospital Authority North Carolina Health Care System Atrium Health Series E øø | | 0.80 | 1-15-2048 | 1,500,000 | 1,412,716 |
| North Carolina Health Care Facilities First Mortgage Revenue Bonds Series A | | 3.00 | 3-1-2023 | 200,000 | 199,533 |
| North Carolina Health Care Facilities First Mortgage Revenue Bonds Series A | | 4.00 | 3-1-2024 | 215,000 | 213,813 |
| North Carolina Health Care Facilities First Mortgage Revenue Bonds Series A | | 4.00 | 3-1-2025 | 265,000 | 262,076 |
| | | | | | 2,088,138 |
| Industrial development revenue: 0.14% | | | | | |
| Columbus County NC PCFA International Paper Company Project Series 2019C | | 2.10 | 3-1-2027 | 1,750,000 | 1,686,858 |
| Resource recovery revenue: 0.84% | | | | | |
| North Carolina Capital Finance Republic Services Incorporated Project Series 2013 | | 3.75 | 6-1-2038 | 10,000,000 | 9,995,162 |
| | | | | | 13,770,158 |
| North Dakota: 0.40% | | | | | |
| Miscellaneous revenue: 0.40% | | | | | |
| Cass County ND Joint Water Resources District Refunding Bond Temporary Improvement Series A | | 0.48 | 5-1-2024 | 5,000,000 | 4,752,648 |
The accompanying notes are an integral part of these financial statements.
Allspring Ultra Short-Term Municipal Income Fund | 25
Portfolio of investments—December 31, 2022 (unaudited)
| | | Interest
rate | Maturity
date | Principal | Value |
| Ohio: 4.57% | | | | | |
| Airport revenue: 0.10% | | | | | |
| Cleveland OH Airport System Revenue Bonds Series 2019B | | 5.00% | 1-1-2023 | $ 1,200,000 | $ 1,200,000 |
| Education revenue: 0.08% | | | | | |
| Ohio Higher Educational Facility Commission | | 5.00 | 5-1-2025 | 885,000 | 920,812 |
| GO revenue: 1.33% | | | | | |
| Elyria OH Various Purpose BAN Series 2022 | | 3.13 | 6-28-2023 | 1,890,000 | 1,888,294 |
| Licking County OH Airport Facilities Improvement BAN Series 2022 | | 4.00 | 8-29-2023 | 2,200,000 | 2,206,243 |
| Lorain County OH Various Purpose BAN Series 2022A | | 2.50 | 5-3-2023 | 4,000,000 | 3,986,654 |
| Newark City OH Various Purpose Anticipation Notes Series 2022 | | 4.00 | 9-26-2023 | 5,000,000 | 5,017,848 |
| Newark OH Various Purpose BAN Series 2022 | | 2.00 | 3-23-2023 | 2,175,000 | 2,167,343 |
| Toledo OH Refunding Bond Limited Tax Various Purpose | | 3.00 | 12-1-2023 | 440,000 | 439,639 |
| | | | | | 15,706,021 |
| Health revenue: 0.77% | | | | | |
| Allen County OH Hospital Facilities Revenue Bonds Series 2022B-1 | | 5.00 | 10-1-2049 | 5,000,000 | 5,315,458 |
| Allen County OH Mercy Health Hospital | | 5.00 | 12-1-2024 | 2,325,000 | 2,411,584 |
| Ohio State Hospital Revenue Bonds Series 2013 B ø | | 4.14 | 1-15-2033 | 1,405,000 | 1,405,000 |
| | | | | | 9,132,042 |
| Housing revenue: 1.28% | | | | | |
| Ohio HFA MFHR Series 2022 (Department of Housing and Urban Development Insured) | | 3.00 | 10-1-2024 | 3,750,000 | 3,732,064 |
| Ohio HFA MFHR Series 2022 (Department of Housing and Urban Development Insured) | | 3.35 | 7-1-2025 | 2,000,000 | 1,981,422 |
| Ohio HFA MFHR Series 2022A (Department of Housing and Urban Development Insured) | | 3.50 | 7-1-2025 | 5,000,000 | 4,976,075 |
| Ohio HFA Series 2021 (Department of Housing and Urban Development Insured) | | 1.25 | 8-1-2024 | 4,500,000 | 4,442,566 |
| | | | | | 15,132,127 |
| Miscellaneous revenue: 0.29% | | | | | |
| American Municipal Power Incorporated BAN Electric System Improvement | | 3.50 | 6-22-2023 | 2,600,000 | 2,597,393 |
| Board of Education of Southeast Local School District Counties of Wayne, Holmes & Stark Certificate of Participation Series 2021 | | 3.00 | 12-1-2023 | 585,000 | 584,841 |
| Board of Education of Southeast Local School District Counties of Wayne, Holmes & Stark Certificate of Participation Series 2021 | | 3.00 | 12-1-2024 | 230,000 | 230,009 |
| | | | | | 3,412,243 |
| Tax revenue: 0.25% | | | | | |
| Lakewood OH Various Purpose Income Tax Revenue Notes Series 2022 | | 1.75 | 3-16-2023 | 3,000,000 | 2,990,332 |
The accompanying notes are an integral part of these financial statements.
26 | Allspring Ultra Short-Term Municipal Income Fund
Portfolio of investments—December 31, 2022 (unaudited)
| | | Interest
rate | Maturity
date | Principal | Value |
| Utilities revenue: 0.47% | | | | | |
| American Municipal Power Incorporated BAN Electric System Improvement | | 5.00% | 2-15-2025 | $ 500,000 | $ 521,221 |
| Lancaster OH Port Authority Gas Supply Series A (Royal Bank of Canada LIQ) | | 5.00 | 8-1-2049 | 5,000,000 | 5,084,829 |
| | | | | | 5,606,050 |
| | | | | | 54,099,627 |
| Oklahoma: 0.46% | | | | | |
| Education revenue: 0.05% | | | | | |
| University of Oklahoma General Revenue Refunding Bond Series 2020B | | 5.00 | 7-1-2025 | 510,000 | 535,358 |
| Miscellaneous revenue: 0.41% | | | | | |
| Kay County OK Public Building Authority | | 4.00 | 4-1-2023 | 450,000 | 450,374 |
| Oklahoma County OK Finance Authority Jones Public School Project | | 4.00 | 9-1-2023 | 430,000 | 431,273 |
| Oklahoma County OK Finance Authority Jones Public School Project | | 4.00 | 9-1-2024 | 525,000 | 532,343 |
| Osage County OK Industrial Authority Use Tax Revenue BAN Series 2022 | | 2.00 | 9-1-2023 | 3,500,000 | 3,450,411 |
| | | | | | 4,864,401 |
| | | | | | 5,399,759 |
| Oregon: 1.04% | | | | | |
| Education revenue: 0.07% | | | | | |
| Yamhill County OR Linfield University Project Series A | | 4.00 | 10-1-2024 | 850,000 | 855,591 |
| GO revenue: 0.06% | | | | | |
| Morrow County OR Series 2021A | | 4.00 | 6-1-2024 | 325,000 | 328,680 |
| Morrow County OR Series 2021A | | 4.00 | 6-1-2025 | 325,000 | 331,679 |
| | | | | | 660,359 |
| Health revenue: 0.07% | | | | | |
| Multnomah County OR Hospital Facilities Authority Revenue Refunding Bonds Terwilliger Plaza Parkview | | 0.95 | 6-1-2027 | 1,000,000 | 872,650 |
| Industrial development revenue: 0.84% | | | | | |
| Oregon Business Development Commission Intel Corporation Project Series 232 | | 2.40 | 12-1-2040 | 10,000,000 | 9,922,357 |
| | | | | | 12,310,957 |
| Pennsylvania: 5.95% | | | | | |
| Airport revenue: 0.14% | | | | | |
| Philadelphia PA Airport Revenue Refunding Bond Series A Private Activity Bond | | 5.00 | 7-1-2025 | 1,545,000 | 1,620,680 |
| Education revenue: 0.60% | | | | | |
| Delaware County Authority University Revenue Neumann University | | 5.00 | 10-1-2024 | 500,000 | 505,828 |
| Delaware County Authority University Revenue Neumann University | | 5.00 | 10-1-2025 | 525,000 | 534,535 |
The accompanying notes are an integral part of these financial statements.
Allspring Ultra Short-Term Municipal Income Fund | 27
Portfolio of investments—December 31, 2022 (unaudited)
| | | Interest
rate | Maturity
date | Principal | Value |
| Education revenue (continued) | | | | | |
| Huntington County PA General Authority Revenue Bond Series 2021 TT3 | | 5.00% | 10-1-2025 | $ 355,000 | $ 367,393 |
| Huntington County PA General Authority Revenue Bond Series 2021 TT3 | | 5.00 | 10-1-2026 | 430,000 | 449,884 |
| Northampton County General Purpose Authority College Revenue Refunding Bonds Series of 2003 (U.S. Bank NA SPA) ø | | 3.71 | 11-1-2023 | 150,000 | 150,000 |
| Pennsylvania HEFA Association of Independent Colleges & Universities of Pennsylvania Financing Program Series T-3 | | 3.50 | 5-1-2033 | 2,000,000 | 1,988,067 |
| Pennsylvania HEFA Thomas Jefferson University Revenue Bonds Series 2015B ø | | 4.17 | 9-1-2045 | 150,000 | 150,000 |
| Tender Option Bond Trust Receipts/Floater Certificates Series 2019-XF2836 (Mizuho Capital Markets LLC LOC, Mizuho Capital Markets LLC LIQ) 144Aø | | 3.86 | 6-15-2039 | 3,000,000 | 3,000,000 |
| | | | | | 7,145,707 |
| GO revenue: 0.41% | | | | | |
| Albert Gallatin PA Area School District Series A (AGM Insured) | | 4.00 | 9-1-2023 | 1,000,000 | 1,005,819 |
| Albert Gallatin PA Area School District Series A (AGM Insured) | | 4.00 | 9-1-2024 | 725,000 | 737,360 |
| Dunmore PA Series A (AGM Insured) | | 2.00 | 9-1-2024 | 765,000 | 743,615 |
| Dunmore PA Series A (AGM Insured) | | 2.00 | 9-1-2026 | 170,000 | 160,248 |
| Hollidaysburg PA Area School District | | 4.00 | 7-15-2023 | 525,000 | 528,023 |
| Octorara PA Area School District (AGM Insured) | | 4.00 | 4-1-2025 | 600,000 | 614,605 |
| Riverside PA School District GO (BAM Insured) | | 3.00 | 10-15-2023 | 480,000 | 479,545 |
| Riverside PA School District GO (BAM Insured) | | 4.00 | 10-15-2025 | 550,000 | 566,250 |
| | | | | | 4,835,465 |
| Health revenue: 1.53% | | | | | |
| Allegheny County PA Hospital Development Authority Series 2017D-2 (SIFMA Municipal Swap +0.70%) ± | | 4.36 | 11-15-2047 | 6,000,000 | 5,829,767 |
| Doylestown Hospital Authority Hospital Series A | | 5.00 | 7-1-2023 | 1,090,000 | 1,090,090 |
| Montgomery County PA Higher Education & Health Authority Series 2018D ø | | 4.17 | 9-1-2050 | 10,000,000 | 10,000,000 |
| Tender Option Bond Trust Receipts/Floater Certificates Series 2020-XF2885 (Barclays Bank plc LOC, Barclays Bank plc LIQ) 144Aø | | 3.46 | 9-1-2037 | 1,250,000 | 1,250,000 |
| | | | | | 18,169,857 |
| Housing revenue: 1.90% | | | | | |
| Pennsylvania HFA Limited Obligation Multifamily Development Bonds Series 2022 (Department of Housing and Urban Development Insured) | | 1.50 | 7-1-2024 | 5,000,000 | 4,947,514 |
| Pennsylvania HFA Single Family Series 2021-137 | | 0.40 | 4-1-2023 | 325,000 | 322,687 |
| Pennsylvania HFA Single Family Series 2021-137 | | 0.45 | 10-1-2023 | 325,000 | 318,302 |
| Pennsylvania Housing Finance Agency Limited Norris Homes Phase V | | 1.40 | 1-1-2043 | 10,500,000 | 10,500,000 |
| Pennsylvania Housing Finance Agency MFHR Sherman Hills (Department of Housing and Urban Development Insured) øø | | 1.25 | 2-1-2025 | 6,675,000 | 6,488,762 |
| | | | | | 22,577,265 |
The accompanying notes are an integral part of these financial statements.
28 | Allspring Ultra Short-Term Municipal Income Fund
Portfolio of investments—December 31, 2022 (unaudited)
| | | Interest
rate | Maturity
date | Principal | Value |
| Miscellaneous revenue: 0.53% | | | | | |
| Pennsylvania EDFA Refunding Bond Philadelphia Bioslides Facility | | 3.00% | 1-1-2024 | $ 865,000 | $ 862,077 |
| Pittsburgh & Allegheny Counties Sports and Exhibition Authority Regional Asset District (AGM Insured) | | 4.00 | 2-1-2025 | 1,860,000 | 1,885,749 |
| Southeastern Pennsylvania Transportation | | 5.00 | 6-1-2024 | 1,000,000 | 1,029,171 |
| Southeastern Pennsylvania Transportation | | 5.00 | 6-1-2025 | 1,000,000 | 1,047,234 |
| State Public School Building Authority Prerefunded Bond Series A (AGM Insured) | | 5.00 | 12-1-2023 | 1,450,000 | 1,474,167 |
| | | | | | 6,298,398 |
| Resource recovery revenue: 0.24% | | | | | |
| Pennsylvania EDFA Solid Waste Disposal Refunding Revenue Bonds Series 2021B | | 1.10 | 6-1-2031 | 1,000,000 | 874,241 |
| Pennsylvania EDFA Solid Waste Disposal Republic Services Incorporated Project Series 2014A | | 3.60 | 6-1-2044 | 2,000,000 | 2,000,000 |
| | | | | | 2,874,241 |
| Tax revenue: 0.06% | | | | | |
| Allentown PA Neighborhood Improvement Zone Development Authority Tax Revenue Refunding Bonds Series 2022 | | 5.00 | 5-1-2024 | 150,000 | 152,562 |
| Allentown PA Neighborhood Improvement Zone Development Authority Tax Revenue Refunding Bonds Series 2022 | | 5.00 | 5-1-2025 | 500,000 | 514,231 |
| | | | | | 666,793 |
| Transportation revenue: 0.08% | | | | | |
| Pennsylvania Turnpike Series B | | 5.00 | 12-1-2023 | 425,000 | 432,505 |
| Pennsylvania Turnpike Series B | | 5.00 | 12-1-2024 | 450,000 | 467,949 |
| | | | | | 900,454 |
| Water & sewer revenue: 0.46% | | | | | |
| Allegheny County PA Sanitary Authority Series A | | 4.00 | 6-1-2024 | 300,000 | 304,891 |
| Allegheny County PA Sanitary Authority Series A | | 4.00 | 6-1-2025 | 150,000 | 154,247 |
| Pittsburgh PA Water & Sewer Authority Series C (SIFMA Municipal Swap +0.65%)(AGM Insured) ± | | 4.31 | 9-1-2040 | 5,000,000 | 4,995,020 |
| | | | | | 5,454,158 |
| | | | | | 70,543,018 |
| Rhode Island: 0.41% | | | | | |
| Health revenue: 0.32% | | | | | |
| Rhode Island Health & Educational Building Corporation Refunding Bond Hospital Financing Lifespan Obligated Group | | 5.00 | 5-15-2023 | 1,300,000 | 1,304,610 |
| Rhode Island Health & Educational Building Corporation Refunding Bond Hospital Financing Lifespan Obligated Group | | 5.00 | 5-15-2024 | 2,475,000 | 2,511,465 |
| | | | | | 3,816,075 |
The accompanying notes are an integral part of these financial statements.
Allspring Ultra Short-Term Municipal Income Fund | 29
Portfolio of investments—December 31, 2022 (unaudited)
| | | Interest
rate | Maturity
date | Principal | Value |
| Miscellaneous revenue: 0.09% | | | | | |
| Providence RI Public Buildings Authority Revenue Capital Improvement Program Projects Series A (AGM Insured) | | 4.00% | 9-15-2023 | $ 1,000,000 | $ 1,006,676 |
| | | | | | 4,822,751 |
| South Carolina: 0.76% | | | | | |
| Utilities revenue: 0.76% | | | | | |
| Patriots Energy Group Financing Agency Series A (Royal Bank of Canada LIQ) | | 4.00 | 10-1-2048 | 9,000,000 | 8,992,054 |
| Tennessee: 1.25% | | | | | |
| Airport revenue: 0.41% | | | | | |
| Memphis TN Airport Revenue Refunding Bonds Series 2020B | | 5.00 | 7-1-2023 | 2,000,000 | 2,013,774 |
| Shelby County TN Airport Authority Series 2021A | | 5.00 | 7-1-2025 | 2,750,000 | 2,848,501 |
| | | | | | 4,862,275 |
| Utilities revenue: 0.84% | | | | | |
| Memphis TN Electric System Series A | | 5.00 | 12-1-2023 | 425,000 | 433,043 |
| Memphis TN Electric System Series A | | 5.00 | 12-1-2024 | 500,000 | 521,365 |
| Tennessee Energy Acquisition Corporation Gas Project Series 2017A | | 4.00 | 5-1-2048 | 5,320,000 | 5,328,607 |
| Tennessee Energy Acquisition Corporation Gas Revenue Bonds Series 2006 A | | 5.25 | 9-1-2024 | 1,690,000 | 1,715,652 |
| Tennessee Energy Acquisition Corporation Gas Revenue Bonds Series 2006C | | 5.00 | 2-1-2023 | 2,000,000 | 2,000,681 |
| | | | | | 9,999,348 |
| | | | | | 14,861,623 |
| Texas: 9.58% | | | | | |
| Airport revenue: 0.39% | | | | | |
| Dallas Fort Worth TX International Airport Series A | | 5.00 | 11-1-2024 | 1,500,000 | 1,556,885 |
| Love Field Airport Modernization Corporation General Airport Revenue Refunding Bonds Series 2021 | | 5.00 | 11-1-2024 | 3,000,000 | 3,086,761 |
| | | | | | 4,643,646 |
| Education revenue: 0.15% | | | | | |
| Arlington TX Higher Education Finance Corporation Education Revenue Bonds Series 2021A | | 4.00 | 2-15-2024 | 110,000 | 111,304 |
| Arlington TX Higher Education Finance Corporation Education Revenue Bonds Series 2021A | | 4.00 | 2-15-2025 | 170,000 | 173,789 |
| Arlington TX Higher Education Finance Corporation Education Revenue Bonds Series 2021A | | 4.00 | 2-15-2026 | 280,000 | 288,026 |
| Hale Center TX Educational Facilities Corporation Revenue Improvement and Refunding Bonds Series 2022 | | 5.00 | 3-1-2026 | 675,000 | 697,617 |
| Odessa College District Consolidated Fund Revenue Bonds Series 2021 (AGM Insured) | | 4.00 | 7-1-2023 | 500,000 | 502,291 |
| | | | | | 1,773,027 |
| GO revenue: 3.16% | | | | | |
| Andrews County TX Hospital District Series 2021 | | 5.00 | 3-15-2025 | 1,140,000 | 1,185,419 |
| Beaumont TX Certificate of Obligation Series 2021 | | 5.00 | 3-1-2025 | 1,065,000 | 1,115,052 |
| Cypress-Fairbanks Independent High School Series B-1 øø | | 0.28 | 2-15-2040 | 3,825,000 | 3,660,218 |
The accompanying notes are an integral part of these financial statements.
30 | Allspring Ultra Short-Term Municipal Income Fund
Portfolio of investments—December 31, 2022 (unaudited)
| | | Interest
rate | Maturity
date | Principal | Value |
| GO revenue (continued) | | | | | |
| Fort Bend Independent School District School Building Series B øø | | 0.88% | 8-1-2050 | $ 3,130,000 | $ 2,924,178 |
| Georgetown Independent School District Series 2019-B | | 2.50 | 8-1-2044 | 5,000,000 | 4,975,919 |
| Katy Independent School District School Building Bonds Series 2021C | | 1.50 | 8-15-2050 | 4,500,000 | 4,381,565 |
| Little Elm Independent School Series 2020 øø | | 0.68 | 8-15-2048 | 1,690,000 | 1,593,452 |
| North East Independent School District Series 2022B | | 2.00 | 8-1-2052 | 2,600,000 | 2,577,955 |
| Northside Independent School District Building Project | | 1.60 | 8-1-2049 | 3,170,000 | 3,069,868 |
| Plainview Independent School District Series B | | 1.50 | 2-15-2050 | 9,000,000 | 8,904,778 |
| Port Arthur TX Certificate of Obligation (BAM Insured) | | 5.00 | 2-15-2023 | 565,000 | 566,164 |
| Port Arthur TX Certificate of Obligation (BAM Insured) | | 5.00 | 2-15-2025 | 445,000 | 463,886 |
| Tomball Independent School District School Building Series B-1 øø | | 0.45 | 2-15-2036 | 2,000,000 | 1,969,880 |
| | | | | | 37,388,334 |
| Health revenue: 0.89% | | | | | |
| Coastal Bend TX Health Facilities Development Corporation (AGM Insured) € | | 3.79 | 7-1-2031 | 2,450,000 | 2,450,000 |
| Harris County TX Cultural Education Facilities Finance Corporation Hospital Memorial Hermann Series 2020C-2 | | 5.00 | 6-1-2032 | 3,100,000 | 3,202,611 |
| Harris County TX Health Facilities Development Corporation Series A3 (AGM Insured) € | | 3.79 | 7-1-2031 | 2,400,000 | 2,400,000 |
| Harris County TX Health Facilities Development Corporation Series A4 (AGM Insured) € | | 3.79 | 7-1-2031 | 1,200,000 | 1,200,000 |
| Tarrant County Texas Cultural Education Buckner Retirement Services Incorporate Series 2016A | | 5.00 | 11-15-2023 | 1,245,000 | 1,254,992 |
| | | | | | 10,507,603 |
| Housing revenue: 2.72% | | | | | |
| Cameron County TX Housing Finance Corporation Series 2022 | | 3.50 | 12-1-2024 | 3,800,000 | 3,786,084 |
| Galveston TX Public Facility Corporation MFHR Bonds Series 2021 (Department of Housing and Urban Development Insured) øø | | 0.47 | 8-1-2025 | 5,200,000 | 4,896,634 |
| Housing Options Incorporated MFHR Bonds Brooks Manor The Oaks Project Series 2021 øø | | 0.50 | 8-1-2041 | 6,250,000 | 5,731,441 |
| Housing Synergy Public Facility Corporation Tax Revenue Bonds Series 2022 (Department of Housing and Urban Development Insured) | | 3.50 | 8-1-2025 | 5,000,000 | 4,989,123 |
| Odessa TX Housing Finance Corporation MFHR Vera Odessa Apartments (FHA Insured) øø | | 0.35 | 9-1-2023 | 6,500,000 | 6,456,733 |
| Port Aransas TX Public Facilities Corporation MFHR Palladium Port Aransas Apartments ø | | 0.70 | 1-1-2024 | 6,400,000 | 6,400,000 |
| | | | | | 32,260,015 |
| Industrial development revenue: 0.48% | | | | | |
| Austin TX Convention First Tier Series A | | 5.00 | 1-1-2023 | 750,000 | 750,000 |
| Port Arthur TX Navigation District Industrial Development Corporation Total Petrochemicals USA Incorporated Project ø | | 3.74 | 6-1-2041 | 5,000,000 | 5,000,000 |
| | | | | | 5,750,000 |
The accompanying notes are an integral part of these financial statements.
Allspring Ultra Short-Term Municipal Income Fund | 31
Portfolio of investments—December 31, 2022 (unaudited)
| | | Interest
rate | Maturity
date | Principal | Value |
| Miscellaneous revenue: 0.08% | | | | | |
| Dallas TX Performing Arts Cultural Facilities Corporation Revenue Bonds Series 2008A (Bank of America NA LOC) ø | | 3.71% | 9-1-2041 | $ 448,000 | $ 448,000 |
| Wise County TX Lease Revenue Refunding Bond Parker County Junior College | | 5.00 | 8-15-2024 | 450,000 | 459,988 |
| | | | | | 907,988 |
| Resource recovery revenue: 0.84% | | | | | |
| Port Corpus Christi Solid Waste Disposal Revenue Bonds Series 2002A 144Aø | | 3.90 | 7-1-2029 | 10,000,000 | 10,000,000 |
| Transportation revenue: 0.22% | | | | | |
| Central Texas Regional Mobility Authority Revenue Subordinated Lien BAN Series F | | 5.00 | 1-1-2025 | 2,500,000 | 2,564,923 |
| Utilities revenue: 0.65% | | | | | |
| Lower Colorado River Authority Series 2022 | | 5.00 | 5-15-2023 | 395,000 | 397,535 |
| San Antonio TX Electric and Gas Systems Refunding Bonds Series 2018 (SIFMA Municipal Swap +0.87%) ± | | 4.53 | 2-1-2048 | 4,000,000 | 4,000,022 |
| Texas Municipal Gas Acquisition & Supply Corporation | | 5.00 | 12-15-2024 | 1,500,000 | 1,524,984 |
| Texas Municipal Power Agency Transmission System (AGM Insured) | | 3.00 | 9-1-2024 | 750,000 | 749,412 |
| Texas Municipal Power Agency Transmission System (AGM Insured) | | 3.00 | 9-1-2025 | 1,000,000 | 991,825 |
| | | | | | 7,663,778 |
| | | | | | 113,459,314 |
| Utah: 0.12% | | | | | |
| Airport revenue: 0.12% | | | | | |
| Salt Lake City UT International Airport Airport Revenue Bonds Series 2021A | | 5.00 | 7-1-2025 | 1,325,000 | 1,375,027 |
| Vermont: 0.16% | | | | | |
| Education revenue: 0.16% | | | | | |
| Vermont Educational & Health Buildings St. Michael's College Project | | 5.00 | 10-1-2023 | 1,185,000 | 1,185,667 |
| Vermont Educational & Health Buildings St. Michael's College Project | | 5.00 | 10-1-2024 | 675,000 | 675,330 |
| | | | | | 1,860,997 |
| Virginia: 2.87% | | | | | |
| Education revenue: 0.06% | | | | | |
| Virginia College Building Authority Regent University Project | | 5.00 | 6-1-2023 | 250,000 | 250,696 |
| Virginia College Building Authority Regent University Project | | 5.00 | 6-1-2024 | 225,000 | 227,521 |
| Virginia College Building Authority Regent University Project | | 5.00 | 6-1-2025 | 250,000 | 254,856 |
| | | | | | 733,073 |
The accompanying notes are an integral part of these financial statements.
32 | Allspring Ultra Short-Term Municipal Income Fund
Portfolio of investments—December 31, 2022 (unaudited)
| | | Interest
rate | Maturity
date | Principal | Value |
| Health revenue: 0.09% | | | | | |
| Virginia Small Business Financing Authority Revenue National Senior Campuses Incorporate Series A | | 5.00% | 1-1-2023 | $ 500,000 | $ 500,000 |
| Virginia Small Business Financing Authority Revenue National Senior Campuses Incorporate Series A | | 5.00 | 1-1-2024 | 500,000 | 508,425 |
| | | | | | 1,008,425 |
| Housing revenue: 1.21% | | | | | |
| Fairfax County VA Redevelopment and Housing Authority MFHR One University Senior Apartments | | 1.25 | 12-1-2025 | 15,000,000 | 14,305,697 |
| Industrial development revenue: 0.33% | | | | | |
| Louisa VA IDA Pollution Control Virginia Electric & Power Company Series A | | 1.90 | 11-1-2035 | 4,000,000 | 3,955,203 |
| Miscellaneous revenue: 0.23% | | | | | |
| Louisa VA IDA Electric and Power Company Project Series A øø | | 0.75 | 11-1-2035 | 3,000,000 | 2,719,096 |
| Transportation revenue: 0.38% | | | | | |
| Chesapeake VA Bay Bridge & Tunnel District First Tier Generation Resolution | | 5.00 | 11-1-2023 | 4,520,000 | 4,561,294 |
| Utilities revenue: 0.57% | | | | | |
| Halifax County VA IDA Recovery Zone Facility Revenue Bonds Series 2010A | | 1.65 | 12-1-2041 | 3,500,000 | 3,360,706 |
| Wise County VA IDA Solid Waste & Sewage Disposal Revenue Bond | | 1.20 | 11-1-2040 | 3,525,000 | 3,363,330 |
| | | | | | 6,724,036 |
| | | | | | 34,006,824 |
| Washington: 0.63% | | | | | |
| Airport revenue: 0.22% | | | | | |
| Port of Seattle WA AMT Intermediate Lien Series C | | 5.00 | 4-1-2025 | 2,500,000 | 2,566,349 |
| Health revenue: 0.04% | | | | | |
| Washington HCFR Series 2021 144A | | 5.00 | 12-1-2023 | 250,000 | 254,122 |
| Washington HCFR Series 2021 144A | | 5.00 | 12-1-2024 | 195,000 | 202,041 |
| | | | | | 456,163 |
| Housing revenue: 0.37% | | | | | |
| Everett WA Housing Authority MFHR Baker Heights Legacy øø | | 0.30 | 9-1-2024 | 2,500,000 | 2,432,702 |
| Seattle WA Housing Authority Northgate Plaza Project | | 1.00 | 6-1-2026 | 2,175,000 | 1,978,577 |
| | | | | | 4,411,279 |
| | | | | | 7,433,791 |
| West Virginia: 0.57% | | | | | |
| Health revenue: 0.34% | | | | | |
| West Virginia Hospital Finance Authority United Health System | | 5.00 | 6-1-2024 | 4,000,000 | 4,097,720 |
The accompanying notes are an integral part of these financial statements.
Allspring Ultra Short-Term Municipal Income Fund | 33
Portfolio of investments—December 31, 2022 (unaudited)
| | | Interest
rate | Maturity
date | Principal | Value |
| Industrial development revenue: 0.23% | | | | | |
| West Virginia EDA Solid Waste Disposal Facilities Revenue Refunding Bond Appalachian Power Company øø | | 0.63% | 12-1-2038 | $ 3,000,000 | $ 2,704,552 |
| | | | | | 6,802,272 |
| Wisconsin: 2.87% | | | | | |
| Education revenue: 0.17% | | | | | |
| Wisconsin HEFA Series 2022 | | 5.00 | 10-1-2023 | 2,000,000 | 2,026,893 |
| GO revenue: 0.08% | | | | | |
| Dane County WI AMT Promissory Notes Apartment Project Series D | | 2.63 | 6-1-2023 | 980,000 | 975,086 |
| Health revenue: 1.14% | | | | | |
| Wisconsin HEFA Advocate Aurora Health Credit Group Series C3 (SIFMA Municipal Swap +0.55%) ± | | 4.21 | 8-15-2054 | 7,065,000 | 7,064,012 |
| Wisconsin HEFA Revenue Bonds Series 2022A ø | | 4.23 | 2-15-2053 | 2,000,000 | 2,000,000 |
| Wisconsin HEFA Series 2022 | | 4.00 | 9-15-2023 | 710,000 | 708,468 |
| Wisconsin HEFA Series 2022 | | 4.00 | 9-15-2024 | 735,000 | 729,493 |
| Wisconsin HEFA Series 2053 ø | | 4.23 | 2-15-2053 | 1,500,000 | 1,500,000 |
| Wisconsin HEFA St. Camillus Health System Series A | | 5.00 | 11-1-2023 | 125,000 | 124,443 |
| Wisconsin HEFA St. Camillus Health System Series A | | 5.00 | 7-1-2024 | 945,000 | 966,450 |
| Wisconsin Hospital Renown Regional Medical Center Project PFA Series A | | 5.00 | 6-1-2025 | 385,000 | 398,823 |
| | | | | | 13,491,689 |
| Housing revenue: 0.52% | | | | | |
| Municipal Fund Trust Various States (Barclays Bank plc LOC) 144Aø | | 4.56 | 11-1-2024 | 6,140,000 | 6,140,000 |
| Miscellaneous revenue: 0.58% | | | | | |
| Appleton WI RDA Fox Cities Performing Arts Center Project Series B (Associated Bank NA LOC) ø | | 4.10 | 6-1-2036 | 500,000 | 500,000 |
| Clayton WI BAN Series B | | 2.00 | 6-1-2026 | 1,000,000 | 939,083 |
| PMA Levy and Aid Anticipation Notes Series 2022A | | 4.00 | 6-23-2023 | 2,500,000 | 2,508,875 |
| Wisconsin GO Series A (SIFMA Municipal Swap +0.42%) ± | | 4.08 | 5-1-2025 | 3,000,000 | 2,960,875 |
| | | | | | 6,908,833 |
| Utilities revenue: 0.26% | | | | | |
| PFA PCR Duke Energy Progress Project Series 2022A | | 3.30 | 10-1-2046 | 3,000,000 | 3,005,717 |
| Water & sewer revenue: 0.12% | | | | | |
| Clayton WI Water System and Sewer System Series C | | 2.00 | 6-1-2026 | 1,500,000 | 1,408,624 |
| | | | | | 33,956,842 |
| Wyoming: 0.17% | | | | | |
| Health revenue: 0.07% | | | | | |
| Laramie County WY Series 2021 | | 4.00 | 5-1-2025 | 750,000 | 767,569 |
| Housing revenue: 0.10% | | | | | |
| Wyoming CDA Housing Revenue Bonds 2021 Series B | | 0.35 | 12-1-2023 | 1,235,000 | 1,205,548 |
| | | | | | 1,973,117 |
| Total Municipal obligations (Cost $1,164,746,606) | | | | | 1,145,285,329 |
The accompanying notes are an integral part of these financial statements.
34 | Allspring Ultra Short-Term Municipal Income Fund
Portfolio of investments—December 31, 2022 (unaudited)
| | | Yield | | Shares | Value |
| Short-term investments: 0.72% | | | | | |
| Investment companies: 0.72% | | | | | |
| Allspring Municipal Cash Management Money Market Fund Institutional Class ♠∞ | | 3.56% | | 8,545,072 | $ 8,546,781 |
| Total Short-term investments (Cost $8,546,781) | | | | | 8,546,781 |
| Total investments in securities (Cost $1,198,293,387) | 99.51% | | | | 1,178,832,110 |
| Other assets and liabilities, net | 0.49 | | | | 5,859,884 |
| Total net assets | 100.00% | | | | $1,184,691,994 |
| 144A | The security may be resold in transactions exempt from registration, normally to qualified institutional buyers, pursuant to Rule 144A under the Securities Act of 1933. |
| ø | Variable rate demand notes are subject to a demand feature which reduces the effective maturity. The maturity date shown represents the final maturity date of the security. The interest rate is determined and reset by the issuer daily, weekly, or monthly depending upon the terms of the security. The rate shown is the rate in effect at period end. |
| € | The security is an auction-rate security which has an interest rate that resets at predetermined short-term intervals through a Dutch auction. The rate shown is the rate in effect at period end. |
| ± | Variable rate investment. The rate shown is the rate in effect at period end. |
| øø | The interest rate is determined and reset by the issuer periodically depending upon the terms of the security. The rate shown is the rate in effect at period end. |
| ¤ | The security is issued in zero coupon form with no periodic interest payments. |
| ♠ | The issuer of the security is an affiliated person of the Fund as defined in the Investment Company Act of 1940. |
| ∞ | The rate represents the 7-day annualized yield at period end. |
| Abbreviations: |
| AGC | Assured Guaranty Corporation |
| AGM | Assured Guaranty Municipal |
| Ambac | Ambac Financial Group Incorporated |
| AMT | Alternative minimum tax |
| BAM | Build America Mutual Assurance Company |
| BAN | Bond anticipation notes |
| CAB | Capital appreciation bond |
| CDA | Community Development Authority |
| EDA | Economic Development Authority |
| EDFA | Economic Development Finance Authority |
| FHA | Federal Housing Administration |
| GNMA | Government National Mortgage Association |
| GO | General obligation |
| HCFR | Healthcare facilities revenue |
| HEFA | Health & Educational Facilities Authority |
| HEFAR | Higher Education Facilities Authority Revenue |
| HFA | Housing Finance Authority |
| HFFA | Health Facilities Financing Authority |
| IDA | Industrial Development Authority |
| LIQ | Liquidity agreement |
| LOC | Letter of credit |
| MFHR | Multifamily housing revenue |
| NPFGC | National Public Finance Guarantee Corporation |
| PCFA | Pollution Control Financing Authority |
| PCR | Pollution control revenue |
| PFA | Public Finance Authority |
| RDA | Redevelopment Authority |
| SIFMA | Securities Industry and Financial Markets Association |
| SOFR | Secured Overnight Financing Rate |
| SPA | Standby purchase agreement |
The accompanying notes are an integral part of these financial statements.
Allspring Ultra Short-Term Municipal Income Fund | 35
Portfolio of investments—December 31, 2022 (unaudited)
Investments in affiliates
An affiliated investment is an investment in which the Fund owns at least 5% of the outstanding voting shares of the issuer or as a result of other relationships, such as the Fund and the issuer having the same investment manager. Transactions with issuers that were affiliates of the Fund at the end of the period were as follows:
| | Value,
beginning of
period | Purchases | Sales
proceeds | Net
realized
gains
(losses) | Net
change in
unrealized
gains
(losses) | Value,
end of
period | Shares,
end
of period | Income
from
affiliated
securities |
| Short-term investments | | | | | | | |
| Allspring Municipal Cash Management Money Market Fund Institutional Class | $34,898,697 | $376,386,125 | $(402,728,730) | $(9,311) | $0 | $8,546,781 | 8,545,072 | $124,206 |
The accompanying notes are an integral part of these financial statements.
36 | Allspring Ultra Short-Term Municipal Income Fund
Statement of assets and liabilities—December 31, 2022 (unaudited)
| | |
| Assets | |
Investments in unaffiliated securities, at value (cost $1,189,746,606)
| $ 1,170,285,329 |
Investments in affiliated securities, at value (cost $8,546,781)
| 8,546,781 |
Cash due from broker
| 5,000,344 |
Receivable for interest
| 9,278,425 |
Receivable for Fund shares sold
| 2,019,225 |
Receivable for investments sold
| 590,000 |
Total assets
| 1,195,720,104 |
| Liabilities | |
Overdraft due to custodian bank
| 4,958,997 |
Payable for Fund shares redeemed
| 2,417,187 |
Payable for investments purchased
| 2,200,000 |
Dividends payable
| 793,193 |
Management fee payable
| 148,277 |
Administration fees payable
| 87,570 |
Distribution fee payable
| 2,163 |
Trustees’ fees and expenses payable
| 1,914 |
Accrued expenses and other liabilities
| 418,809 |
Total liabilities
| 11,028,110 |
Total net assets
| $1,184,691,994 |
| Net assets consist of | |
Paid-in capital
| $ 1,236,402,750 |
Total distributable loss
| (51,710,756) |
Total net assets
| $1,184,691,994 |
| Computation of net asset value and offering price per share | |
Net assets – Class A
| $ 255,428,345 |
Shares outstanding – Class A1
| 27,062,913 |
Net asset value per share – Class A
| $9.44 |
Maximum offering price per share – Class A2
| $9.63 |
Net assets – Class A2
| $ 28,047,985 |
Shares outstanding – Class A21
| 2,971,905 |
Net asset value per share – Class A2
| $9.44 |
Net assets – Class C
| $ 3,215,015 |
Shares outstanding – Class C1
| 343,533 |
Net asset value per share – Class C
| $9.36 |
Net assets – Class R6
| $ 427,905,818 |
Shares outstanding – Class R61
| 45,341,056 |
Net asset value per share – Class R6
| $9.44 |
Net assets – Administrator Class
| $ 8,892,022 |
Shares outstanding – Administrator Class1
| 941,959 |
Net asset value per share – Administrator Class
| $9.44 |
Net assets – Institutional Class
| $ 461,202,809 |
Shares outstanding – Institutional Class1
| 48,855,699 |
Net asset value per share – Institutional Class
| $9.44 |
| 1 | The Fund has an unlimited number of authorized shares. |
| 2 | Maximum offering price is computed as 100/98.00 of net asset value. On investments of $100,000 or more, the offering price is reduced. |
The accompanying notes are an integral part of these financial statements.
Allspring Ultra Short-Term Municipal Income Fund | 37
Statement of operations—six months ended December 31, 2022 (unaudited)
| | |
| Investment income | |
Interest
| $ 11,627,142 |
Income from affiliated securities
| 124,206 |
Total investment income
| 11,751,348 |
| Expenses | |
Management fee
| 1,737,894 |
| Administration fees | |
Class A
| 223,430 |
Class A2
| 28,621 |
Class C
| 2,368 |
Class R6
| 85,044 |
Administrator Class
| 4,971 |
Institutional Class
| 214,650 |
| Shareholder servicing fees | |
Class A
| 347,420 |
Class A2
| 26,832 |
Class C
| 3,701 |
Administrator Class
| 12,276 |
| Distribution fee | |
Class C
| 11,102 |
Custody and accounting fees
| 30,947 |
Professional fees
| 23,125 |
Registration fees
| 206 |
Shareholder report expenses
| 14,983 |
Trustees’ fees and expenses
| 11,164 |
Other fees and expenses
| 3,919 |
Total expenses
| 2,782,653 |
| Less: Fee waivers and/or expense reimbursements | |
Fund-level
| (595,567) |
Class A
| (123,315) |
Class A2
| (14,065) |
Class C
| (1,307) |
Administrator Class
| (976) |
Net expenses
| 2,047,423 |
Net investment income
| 9,703,925 |
| Realized and unrealized gains (losses) on investments | |
| Net realized losses on | |
Unaffiliated securities
| (1,301,550) |
Affiliated securities
| (9,311) |
Net realized losses on investments
| (1,310,861) |
Net change in unrealized gains (losses) on investments
| (1,135,070) |
Net realized and unrealized gains (losses) on investments
| (2,445,931) |
Net increase in net assets resulting from operations
| $ 7,257,994 |
The accompanying notes are an integral part of these financial statements.
38 | Allspring Ultra Short-Term Municipal Income Fund
Statement of changes in net assets
| | | | | |
| | Six months ended
December 31, 2022
(unaudited) | Year ended
June 30, 2022 |
| Operations | | | | |
Net investment income
| | $ 9,703,925 | | $ 9,953,322 |
Net realized losses on investments
| | (1,310,861) | | (3,377,534) |
Net change in unrealized gains (losses) on investments
| | (1,135,070) | | (27,597,940) |
Net increase (decrease) in net assets resulting from operations
| | 7,257,994 | | (21,022,152) |
| Distributions to shareholders from | | | | |
| Net investment income and net realized gains | | | | |
Class A
| | (1,627,006) | | (865,557) |
Class A2
| | (223,565) | | (131,876) |
Class C
| | (6,632) | | (248) |
Class R6
| | (4,069,602) | | (4,825,090) |
Administrator Class
| | (57,349) | | (35,353) |
Institutional Class
| | (3,721,189) | | (4,088,084) |
Total distributions to shareholders
| | (9,705,343) | | (9,946,208) |
| Capital share transactions | Shares | | Shares | |
| Proceeds from shares sold | | | | |
Class A
| 716,026 | 6,743,173 | 7,968,345 | 76,073,481 |
Class A2
| 264,054 | 2,499,832 | 2,041,156 | 19,575,873 |
Class C
| 82,669 | 772,355 | 201,436 | 1,874,708 |
Class R6
| 27,801,411 | 262,294,752 | 88,642,693 | 846,259,035 |
Administrator Class
| 133,381 | 1,257,063 | 177,949 | 1,693,573 |
Institutional Class
| 17,410,272 | 164,323,673 | 65,339,432 | 623,543,205 |
| | | 437,890,848 | | 1,569,019,875 |
| Reinvestment of distributions | | | | |
Class A
| 163,843 | 1,543,949 | 87,879 | 835,057 |
Class A2
| 23,442 | 220,924 | 13,879 | 131,851 |
Class C
| 103 | 964 | 12 | 110 |
Class R6
| 13,785 | 129,928 | 26,441 | 253,024 |
Administrator Class
| 5,856 | 55,192 | 3,673 | 34,931 |
Institutional Class
| 347,808 | 3,278,594 | 346,770 | 3,303,797 |
| | | 5,229,551 | | 4,558,770 |
| Payment for shares redeemed | | | | |
Class A
| (4,600,982) | (43,344,878) | (10,322,156) | (98,496,147) |
Class A2
| (1,502,142) | (14,179,555) | (2,275,348) | (21,707,756) |
Class C
| (1,793) | (16,686) | (114,010) | (1,077,939) |
Class R6
| (53,212,863) | (502,052,826) | (125,369,945) | (1,197,296,289) |
Administrator Class
| (353,197) | (3,328,641) | (602,756) | (5,745,921) |
Institutional Class
| (46,581,502) | (440,009,882) | (69,550,721) | (664,217,591) |
| | | (1,002,932,468) | | (1,988,541,643) |
Net decrease in net assets resulting from capital share transactions
| | (559,812,069) | | (414,962,998) |
Total decrease in net assets
| | (562,259,418) | | (445,931,358) |
| Net assets | | | | |
Beginning of period
| | 1,746,951,412 | | 2,192,882,770 |
End of period
| | $ 1,184,691,994 | | $ 1,746,951,412 |
The accompanying notes are an integral part of these financial statements.
Allspring Ultra Short-Term Municipal Income Fund | 39
Financial highlights
(For a share outstanding throughout each period)
| | | Year ended June 30 |
| Class A | Six months ended
December 31, 2022
(unaudited) | 2022 | 2021 | 2020 | 2019 | 2018 |
Net asset value, beginning of period
| $9.45 | $9.61 | $9.59 | $9.60 | $9.57 | $9.57 |
Net investment income
| 0.06 1 | 0.03 | 0.04 | 0.12 | 0.12 1 | 0.08 |
Net realized and unrealized gains (losses) on investments
| (0.01) | (0.16) | 0.02 | (0.01) | 0.03 | 0.00 2 |
Total from investment operations
| 0.05 | (0.13) | 0.06 | 0.11 | 0.15 | 0.08 |
| Distributions to shareholders from | | | | | | |
Net investment income
| (0.06) | (0.03) | (0.04) | (0.12) | (0.12) | (0.08) |
Net asset value, end of period
| $9.44 | $9.45 | $9.61 | $9.59 | $9.60 | $9.57 |
Total return3
| 0.48% | (1.38)% | 0.62% | 1.13% | 1.63% | 0.88% |
| Ratios to average net assets (annualized) | | | | | | |
Gross expenses
| 0.66% | 0.66% | 0.66% | 0.77% | 0.77% | 0.77% |
Net expenses
| 0.50% | 0.50% | 0.50% | 0.65% | 0.67% | 0.67% |
Net investment income
| 1.17% | 0.29% | 0.42% | 1.21% | 1.28% | 0.86% |
| Supplemental data | | | | | | |
Portfolio turnover rate
| 15% | 46% | 30% | 55% | 55% | 50% |
Net assets, end of period (000s omitted)
| $255,428 | $291,008 | $317,609 | $376,203 | $444,581 | $702,570 |
| 1 | Calculated based upon average shares outstanding |
| 2 | Amount is less than $0.005. |
| 3 | Total return calculations do not include any sales charges. Returns for periods of less than one year are not annualized. |
The accompanying notes are an integral part of these financial statements.
40 | Allspring Ultra Short-Term Municipal Income Fund
Financial highlights
(For a share outstanding throughout each period)
| | | Year ended June 30 |
| Class A2 | Six months ended
December 31, 2022
(unaudited) | 2022 | 2021 | 2020 1 |
Net asset value, beginning of period
| $9.45 | $9.61 | $9.59 | $9.58 |
Net investment income
| 0.06 | 0.03 | 0.04 | 0.01 |
Net realized and unrealized gains (losses) on investments
| (0.01) | (0.16) | 0.02 | 0.01 |
Total from investment operations
| 0.05 | (0.13) | 0.06 | 0.02 |
| Distributions to shareholders from | | | | |
Net investment income
| (0.06) | (0.03) | (0.04) | (0.01) |
Net asset value, end of period
| $9.44 | $9.45 | $9.61 | $9.59 |
Total return2
| 0.53% | (1.36)% | 0.62% | 0.18% |
| Ratios to average net assets (annualized) | | | | |
Gross expenses
| 0.56% | 0.64% | 0.66% | 0.65% |
Net expenses
| 0.40% | 0.48% | 0.50% | 0.50% |
Net investment income
| 1.25% | 0.29% | 0.40% | 0.88% |
| Supplemental data | | | | |
Portfolio turnover rate
| 15% | 46% | 30% | 55% |
Net assets, end of period (000s omitted)
| $28,048 | $39,575 | $42,354 | $25 |
| 1 | For the period from May 29, 2020 (commencement of class operations) to June 30, 2020 |
| 2 | Returns for periods of less than one year are not annualized. |
The accompanying notes are an integral part of these financial statements.
Allspring Ultra Short-Term Municipal Income Fund | 41
Financial highlights
(For a share outstanding throughout each period)
| | | Year ended June 30 |
| Class C | Six months ended
December 31, 2022
(unaudited) | 2022 | 2021 | 2020 | 2019 | 2018 |
Net asset value, beginning of period
| $9.32 | $9.48 | $9.41 | $9.43 | $9.40 | $9.40 |
Net investment income
| 0.02 1 | 0.00 1,2 | 0.00 1,2 | 0.04 1 | 0.05 1 | 0.01 1 |
Payment from affiliate
| 0.00 | 0.00 | 0.07 | 0.00 | 0.00 | 0.00 |
Net realized and unrealized gains (losses) on investments
| 0.04 | (0.16) | 0.00 | (0.02) | 0.03 | 0.00 2 |
Total from investment operations
| 0.06 | (0.16) | 0.07 | 0.02 | 0.08 | 0.01 |
| Distributions to shareholders from | | | | | | |
Net investment income
| (0.02) | (0.00) 2 | (0.00) 2 | (0.04) | (0.05) | (0.01) |
Net asset value, end of period
| $9.36 | $9.32 | $9.48 | $9.41 | $9.43 | $9.40 |
Total return3
| 0.64% 4 | (1.67)% | 0.76% 5 | 0.26% | 0.87% | 0.16% |
| Ratios to average net assets (annualized) | | | | | | |
Gross expenses
| 1.42% | 1.40% | 1.41% | 1.51% | 1.52% | 1.52% |
Net expenses
| 1.24% * | 0.81% * | 0.92% * | 1.41% | 1.42% | 1.42% |
Net investment income
| 0.45% | 0.02% | 0.02% | 0.47% | 0.54% | 0.11% |
| Supplemental data | | | | | | |
Portfolio turnover rate
| 15% | 46% | 30% | 55% | 55% | 50% |
Net assets, end of period (000s omitted)
| $3,215 | $2,448 | $1,659 | $2,925 | $10,135 | $17,154 |
| * | Ratio includes class-level expenses which were voluntarily waived by the investment manager. Without this voluntary waiver, the net expense ratio would be increased by the following amounts: |
| Six months ended December 31, 2022 (unaudited) | 0.01% |
| Year ended June 30, 2022 | 0.44% |
| Year ended June 30, 2021 | 0.33% |
| 1 | Calculated based upon average shares outstanding |
| 2 | Amount is less than $0.005. |
| 3 | Total return calculations do not include any sales charges. Returns for periods of less than one year are not annualized. |
| 4 | During the six months ended December 31, 2022, the Fund received payments from a service provider which had a 0.44% impact on the total return. |
| 5 | During the year ended June 30, 2021, the Fund received a payment from an affiliate that had an impact of 0.73% on total return. |
The accompanying notes are an integral part of these financial statements.
42 | Allspring Ultra Short-Term Municipal Income Fund
Financial highlights
(For a share outstanding throughout each period)
| | | Year ended June 30 |
| Class R6 | Six months ended
December 31, 2022
(unaudited) | 2022 | 2021 | 2020 | 2019 1 |
Net asset value, beginning of period
| $9.45 | $9.61 | $9.59 | $9.60 | $9.58 |
Net investment income
| 0.07 | 0.06 | 0.07 | 0.15 | 0.15 2 |
Net realized and unrealized gains (losses) on investments
| (0.01) | (0.16) | 0.02 | (0.01) | 0.02 |
Total from investment operations
| 0.06 | (0.10) | 0.09 | 0.14 | 0.17 |
| Distributions to shareholders from | | | | | |
Net investment income
| (0.07) | (0.06) | (0.07) | (0.15) | (0.15) |
Net asset value, end of period
| $9.44 | $9.45 | $9.61 | $9.59 | $9.60 |
Total return3
| 0.64% | (1.09)% | 0.92% | 1.47% | 1.76% |
| Ratios to average net assets (annualized) | | | | | |
Gross expenses
| 0.28% | 0.28% | 0.28% | 0.38% | 0.39% |
Net expenses
| 0.20% | 0.20% | 0.20% | 0.31% | 0.32% |
Net investment income
| 1.44% | 0.56% | 0.71% | 1.54% | 1.73% |
| Supplemental data | | | | | |
Portfolio turnover rate
| 15% | 46% | 30% | 55% | 55% |
Net assets, end of period (000s omitted)
| $427,906 | $668,633 | $1,032,413 | $822,986 | $770,634 |
| 1 | For the period from July 31, 2018 (commencement of class operations) to June 30, 2019 |
| 2 | Calculated based upon average shares outstanding |
| 3 | Returns for periods of less than one year are not annualized. |
The accompanying notes are an integral part of these financial statements.
Allspring Ultra Short-Term Municipal Income Fund | 43
Financial highlights
(For a share outstanding throughout each period)
| | | Year ended June 30 |
| Administrator Class | Six months ended
December 31, 2022
(unaudited) | 2022 | 2021 | 2020 | 2019 | 2018 |
Net asset value, beginning of period
| $9.45 | $9.61 | $9.59 | $9.60 | $9.57 | $9.57 |
Net investment income
| 0.06 1 | 0.03 1 | 0.04 | 0.12 1 | 0.13 1 | 0.08 1 |
Net realized and unrealized gains (losses) on investments
| (0.01) | (0.16) | 0.02 | (0.01) | 0.03 | 0.01 |
Total from investment operations
| 0.05 | (0.13) | 0.06 | 0.11 | 0.16 | 0.09 |
| Distributions to shareholders from | | | | | | |
Net investment income
| (0.06) | (0.03) | (0.04) | (0.12) | (0.13) | (0.09) |
Net asset value, end of period
| $9.44 | $9.45 | $9.61 | $9.59 | $9.60 | $9.57 |
Total return2
| 0.48% | (1.39)% | 0.62% | 1.19% | 1.70% | 0.95% |
| Ratios to average net assets (annualized) | | | | | | |
Gross expenses
| 0.60% | 0.60% | 0.60% | 0.70% | 0.70% | 0.70% |
Net expenses
| 0.50% | 0.50% | 0.50% | 0.59% | 0.60% | 0.60% |
Net investment income
| 1.15% | 0.27% | 0.42% | 1.28% | 1.34% | 0.82% |
| Supplemental data | | | | | | |
Portfolio turnover rate
| 15% | 46% | 30% | 55% | 55% | 50% |
Net assets, end of period (000s omitted)
| $8,892 | $10,929 | $15,157 | $18,243 | $25,649 | $53,746 |
| 1 | Calculated based upon average shares outstanding |
| 2 | Returns for periods of less than one year are not annualized. |
The accompanying notes are an integral part of these financial statements.
44 | Allspring Ultra Short-Term Municipal Income Fund
Financial highlights
(For a share outstanding throughout each period)
| | | Year ended June 30 |
| Institutional Class | Six months ended
December 31, 2022
(unaudited) | 2022 | 2021 | 2020 | 2019 | 2018 |
Net asset value, beginning of period
| $9.45 | $9.61 | $9.59 | $9.60 | $9.57 | $9.58 |
Net investment income
| 0.07 | 0.05 | 0.06 | 0.14 | 0.15 1 | 0.11 |
Net realized and unrealized gains (losses) on investments
| (0.01) | (0.16) | 0.02 | 0.00 | 0.03 | (0.01) |
Total from investment operations
| 0.06 | (0.11) | 0.08 | 0.14 | 0.18 | 0.10 |
| Distributions to shareholders from | | | | | | |
Net investment income
| (0.07) | (0.05) | (0.06) | (0.15) | (0.15) | (0.11) |
Net asset value, end of period
| $9.44 | $9.45 | $9.61 | $9.59 | $9.60 | $9.57 |
Total return2
| 0.61% | (1.14)% | 0.87% | 1.42% | 1.93% | 1.07% |
| Ratios to average net assets (annualized) | | | | | | |
Gross expenses
| 0.33% | 0.33% | 0.33% | 0.43% | 0.44% | 0.44% |
Net expenses
| 0.25% | 0.25% | 0.25% | 0.36% | 0.37% | 0.37% |
Net investment income
| 1.39% | 0.52% | 0.66% | 1.50% | 1.56% | 1.16% |
| Supplemental data | | | | | | |
Portfolio turnover rate
| 15% | 46% | 30% | 55% | 55% | 50% |
Net assets, end of period (000s omitted)
| $461,203 | $734,360 | $783,690 | $685,081 | $643,762 | $2,141,197 |
| 1 | Calculated based upon average shares outstanding |
| 2 | Returns for periods of less than one year are not annualized. |
The accompanying notes are an integral part of these financial statements.
Allspring Ultra Short-Term Municipal Income Fund | 45
Notes to financial statements (unaudited)
1. ORGANIZATION
Allspring Funds Trust (the "Trust"), a Delaware statutory trust organized on March 10, 1999, is an open-end management investment company registered under the Investment Company Act of 1940, as amended (the "1940 Act"). As an investment company, the Trust follows the accounting and reporting guidance in Financial Accounting Standards Board ("FASB") Accounting Standards Codification Topic 946, Financial Services – Investment Companies. These financial statements report on the Allspring Ultra Short-Term Municipal Income Fund (the "Fund") which is a diversified series of the Trust.
2. SIGNIFICANT ACCOUNTING POLICIES
The following significant accounting policies, which are consistently followed in the preparation of the financial statements of the Fund, are in conformity with U.S. generally accepted accounting principles which require management to make estimates and assumptions that affect the reported amounts of assets and liabilities, disclosure of contingent assets and liabilities at the date of the financial statements, and the reported amounts of income and expenses during the reporting period. Actual results could differ from those estimates.
Securities valuation
All investments are valued each business day as of the close of regular trading on the New York Stock Exchange (generally 4 p.m. Eastern Time), although the Fund may deviate from this calculation time under unusual or unexpected circumstances.
Debt securities are valued at the evaluated bid price provided by an independent pricing service (e.g. taking into account various factors, including yields, maturities, or credit ratings) or, if a reliable price is not available, the quoted bid price from an independent broker-dealer.
Investments in registered open-end investment companies (other than those listed on a foreign or domestic exchange or market) are valued at net asset value.
Investments which are not valued using the methods discussed above are valued at their fair value, as determined in good faith by Allspring Funds Management, LLC ("Allspring Funds Management"), which was named the valuation designee by the Board of Trustees. As the valuation designee, Allspring Funds Management is responsible for day-to-day valuation activities for the Allspring Funds. In connection with these responsibilities, Allspring Funds Management has established a Valuation Committee and has delegated to it the authority to take any actions regarding the valuation of portfolio securities that the Valuation Committee deems necessary or appropriate, including determining the fair value of portfolio securities. On a quarterly basis, the Board of Trustees receives reports of valuation actions taken by the Valuation Committee. On at least an annual basis, the Board of Trustees receives an assessment of the adequacy and effectiveness of Allspring Funds Management's process for determining the fair value of the portfolio of investments.
When-issued transactions
The Fund may purchase securities on a forward commitment or when-issued basis. The Fund records a when-issued transaction on the trade date and will segregate assets in an amount at least equal in value to the Fund's commitment to purchase when-issued securities. Securities purchased on a when-issued basis are marked-to-market daily and the Fund begins earning interest on the settlement date. Losses may arise due to changes in the market value of the underlying securities or if the counterparty does not perform under the contract.
Security transactions and income recognition
Securities transactions are recorded on a trade date basis. Realized gains or losses are recorded on the basis of identified cost.
Interest income is accrued daily and bond discounts are accreted and premiums are amortized daily. To the extent debt obligations are placed on non-accrual status, any related interest income may be reduced by writing off interest receivables when the collection of all or a portion of interest has been determined to be doubtful based on consistently applied procedures and the fair value has decreased. If the issuer subsequently resumes interest payments or when the collectability of interest is reasonably assured, the debt obligation is removed from non-accrual status.
Distributions to shareholders
Distributions to shareholders from net investment income are declared daily and paid monthly. Distributions from net realized gains, if any, are recorded on the ex-dividend date and paid at least annually. Such distributions are determined in accordance with income tax regulations and may differ from U.S. generally accepted accounting principles. Dividend sources are estimated at the time of declaration. The tax character of distributions is determined as of the Fund's fiscal year end. Therefore, a portion of the Fund's distributions made prior to the Fund’s fiscal year end may be categorized as a tax return of capital at year end.
46 | Allspring Ultra Short-Term Municipal Income Fund
Notes to financial statements (unaudited)
Federal and other taxes
The Fund intends to continue to qualify as a regulated investment company by distributing substantially all of its investment company taxable and tax-exempt income and any net realized capital gains (after reduction for capital loss carryforwards) sufficient to relieve it from all, or substantially all, federal income taxes. Accordingly, no provision for federal income taxes was required.
The Fund’s income and federal excise tax returns and all financial records supporting those returns for the prior three fiscal years are subject to examination by the federal and Delaware revenue authorities. Management has analyzed the Fund's tax positions taken on federal, state, and foreign tax returns, as applicable, for all open tax years and does not believe that there are any uncertain tax positions that require recognition of a tax liability.
As of December 31, 2022, the aggregate cost of all investments for federal income tax purposes was $1,198,293,387 and the unrealized gains (losses) consisted of:
| Gross unrealized gains | $ 278,669 |
| Gross unrealized losses | (19,739,946) |
| Net unrealized losses | $(19,461,277) |
As of June 30, 2022, the Fund had capital loss carryforwards which consisted of $5,261,612 in short-term capital losses and $25,175,206 in long-term capital losses.
Class allocations
The separate classes of shares offered by the Fund differ principally in applicable sales charges, distribution, shareholder servicing, and administration fees. Class specific expenses are charged directly to that share class. Investment income, common fund-level expenses, and realized and unrealized gains (losses) on investments are allocated daily to each class of shares based on the relative proportion of net assets of each class.
3. FAIR VALUATION MEASUREMENTS
Fair value measurements of investments are determined within a framework that has established a fair value hierarchy based upon the various data inputs utilized in determining the value of the Fund’s investments. The three-level hierarchy gives the highest priority to unadjusted quoted prices in active markets for identical assets or liabilities (Level 1) and the lowest priority to unobservable inputs (Level 3). The Fund’s investments are classified within the fair value hierarchy based on the lowest level of input that is significant to the fair value measurement. The inputs are summarized into three broad levels as follows:
| ■ | Level 1 – quoted prices in active markets for identical securities |
| ■ | Level 2 – other significant observable inputs (including quoted prices for similar securities, interest rates, prepayment speeds, credit risk, etc.) |
| ■ | Level 3 – significant unobservable inputs (including the Fund’s own assumptions in determining the fair value of investments) |
The inputs or methodologies used for valuing investments in securities are not necessarily an indication of the risk associated with investing in those securities.
The following is a summary of the inputs used in valuing the Fund’s assets and liabilities as of December 31, 2022:
| | Quoted prices
(Level 1) | Other significant
observable inputs
(Level 2) | Significant
unobservable inputs
(Level 3) | Total |
| Assets | | | | |
| Investments in: | | | | |
| Closed end municipal bond fund obligations | $ 0 | $ 25,000,000 | $0 | $ 25,000,000 |
| Municipal obligations | 0 | 1,145,285,329 | 0 | 1,145,285,329 |
| Short-term investments | | | | |
| Investment companies | 8,546,781 | 0 | 0 | 8,546,781 |
| Total assets | $8,546,781 | $1,170,285,329 | $0 | $1,178,832,110 |
Additional sector, industry or geographic detail, if any, is included in the Portfolio of Investments.
Allspring Ultra Short-Term Municipal Income Fund | 47
Notes to financial statements (unaudited)
For the six months ended December 31, 2022, the Fund did not have any transfers into/out of Level 3.
4. TRANSACTIONS WITH AFFILIATES
Management fee
Allspring Funds Management, a wholly owned subsidiary of Allspring Global Investments Holdings, LLC, a holding company indirectly owned by certain private funds of GTCR LLC and Reverence Capital Partners, L.P., is the manager of the Fund and provides advisory and fund-level administrative services under an investment management agreement. Under the investment management agreement, Allspring Funds Management is responsible for, among other services, implementing the investment objectives and strategies of the Fund, supervising the subadviser and providing fund-level administrative services in connection with the Fund’s operations. As compensation for its services under the investment management agreement, Allspring Funds Management is entitled to receive a management fee at the following annual rate based on the Fund’s average daily net assets:
| Average daily net assets | Management fee |
| First $1 billion | 0.250% |
| Next $4 billion | 0.225 |
| Next $5 billion | 0.190 |
| Over $10 billion | 0.180 |
For the six months ended December 31, 2022, the management fee was equivalent to an annual rate of 0.24% of the Fund’s average daily net assets.
Allspring Funds Management has retained the services of a subadviser to provide daily portfolio management to the Fund. The fee for subadvisory services is borne by Allspring Funds Management. Allspring Global Investments, LLC, an affiliate of Allspring Funds Management and a wholly owned subsidiary of Allspring Global Investments Holdings, LLC, is the subadviser to the Fund and is entitled to receive a fee from Allspring Funds Management at an annual rate starting at 0.15% and declining to 0.05% as the average daily net assets of the Fund increase.
Administration fees
Under a class-level administration agreement, Allspring Funds Management provides class-level administrative services to the Fund, which includes paying fees and expenses for services provided by the transfer agent, sub-transfer agents, omnibus account servicers and record-keepers. As compensation for its services under the class-level administration agreement, Allspring Funds Management receives an annual fee which is calculated based on the average daily net assets of each class as follows:
| | Class-level
administration fee |
| Class A | 0.16% |
| Class A2 | 0.16 |
| Class C | 0.16 |
| Class R6 | 0.03 |
| Administrator Class | 0.10 |
| Institutional Class | 0.08 |
Waivers and/or expense reimbursements
Allspring Funds Management has contractually committed to waive and/or reimburse management and administration fees to the extent necessary to maintain certain net operating expense ratios for the Fund. When each class of the Fund has exceeded its expense cap, Allspring Funds Management will waive fees and/or reimburse expenses from fund-level expenses on a proportionate basis and then from class specific expenses. When only certain classes exceed their expense caps, waivers and/or reimbursements are applied against class specific expenses before fund-level expenses. Allspring Funds Management has contractually committed through October 31, 2023 to waive fees and/or reimburse expenses to the extent necessary to cap expenses. Prior to or after the commitment expiration date, the caps may be increased or the commitment to maintain the caps may be terminated only with the approval of the Board of Trustees. In addition to the contractual waivers and/or
48 | Allspring Ultra Short-Term Municipal Income Fund
Notes to financial statements (unaudited)
reimbursements, Allspring Funds Management also voluntarily waived certain class-level expenses during the six months ended December 31, 2022. These voluntary class-level waivers may be discontinued at any time. As of December 31, 2022, the contractual expense caps are as follows:
| | Expense ratio caps |
| Class A | 0.50% |
| Class A2 | 0.40 |
| Class C | 1.25 |
| Class R6 | 0.20 |
| Administrator Class | 0.50 |
| Institutional Class | 0.25 |
Distribution fee
The Trust has adopted a distribution plan for Class C shares pursuant to Rule 12b-1 under the 1940 Act. A distribution fee is charged to Class C shares and paid to Allspring Funds Distributor, LLC ("Allspring Funds Distributor"), the principal underwriter, an affiliate of Allspring Funds Management, at an annual rate up to 0.75% of the average daily net assets of Class C shares.
In addition, Allspring Funds Distributor is entitled to receive the front-end sales charge from the purchase of Class A shares and a contingent deferred sales charge on the redemption of certain Class A shares. Allspring Funds Distributor is also entitled to receive the contingent deferred sales charges from redemptions of Class C shares. For the six months ended December 31, 2022, Allspring Funds Distributor received $106 from the sale of Class A shares. No contingent deferred sales charges were incurred by Class A and Class C shares for the six months ended December 31, 2022.
Shareholder servicing fees
The Trust has entered into contracts with one or more shareholder servicing agents, whereby Class A, Class C, and Administrator Class are charged a fee at an annual rate up to 0.25% of the average daily net assets of each respective class. Class A2 shares are charged a fee at an annual rate up to 0.15% of its average daily net assets. A portion of these total shareholder servicing fees were paid to affiliates of the Fund.
Interfund transactions
The Fund may purchase or sell portfolio investment securities to certain affiliates pursuant to Rule 17a-7 under the 1940 Act and under procedures adopted by the Board of Trustees. The procedures have been designed to ensure that these interfund transactions, which do not incur broker commissions, are effected at current market prices. Pursuant to these procedures, the Fund had $87,810,000, $196,420,000 and $0 in interfund purchases, sales and net realized gains (losses), respectively, during the six months ended December 31, 2022.
5. INVESTMENT PORTFOLIO TRANSACTIONS
Purchases and sales of investments, excluding U.S. government obligations (if any) and short-term securities, for the six months ended December 31, 2022 were $175,486,112 and $300,848,002, respectively.
6. BANK BORROWINGS
The Trust (excluding the money market funds), Allspring Master Trust and Allspring Variable Trust are parties to a $350,000,000 revolving credit agreement whereby the Fund is permitted to use bank borrowings for temporary or emergency purposes, such as to fund shareholder redemption requests. Interest under the credit agreement is charged to the Fund based on a borrowing rate equal to the higher of the Federal Funds rate or the overnight bank funding rate in effect on that day plus a spread. In addition, an annual commitment fee equal based on the unused balance is allocated to each participating fund.
For the six months ended December 31, 2022, there were no borrowings by the Fund under the agreement.
7. MARKET RISKS
On March 11, 2020, the World Health Organization announced that it had made the assessment that coronavirus disease 2019 (“COVID-19”) is a pandemic. The impacts of COVID-19 are affecting the entire global economy, individual companies and investment products, the funds, and the market in general. There is significant uncertainty around the extent and duration of business disruptions related to COVID-19 and the impacts may last for an extended period of time. COVID-19 has led to significant uncertainty and volatility in the financial markets.
Allspring Ultra Short-Term Municipal Income Fund | 49
Notes to financial statements (unaudited)
8. INDEMNIFICATION
Under the Fund's organizational documents, the officers and Trustees have been granted certain indemnification rights against certain liabilities that may arise out of performance of their duties to the Fund. The Fund has entered into a separate agreement with each Trustee that converts indemnification rights currently existing under the Fund’s organizational documents into contractual rights that cannot be changed in the future without the consent of the Trustee. Additionally, in the normal course of business, the Fund may enter into contracts with service providers that contain a variety of indemnification clauses. The Fund’s maximum exposure under these arrangements is dependent on future claims that may be made against the Fund and, therefore, cannot be estimated.
50 | Allspring Ultra Short-Term Municipal Income Fund
Other information (unaudited)
PROXY VOTING INFORMATION
A description of the policies and procedures used to determine how to vote proxies relating to portfolio securities is available without charge, upon request, by calling 1-800-222-8222, visiting our website at allspringglobal.com, or visiting the SEC website at sec.gov. Information regarding how the proxies related to portfolio securities were voted during the most recent 12-month period ended June 30 is available on the website at allspringglobal.com or by visiting the SEC website at sec.gov.
QUARTERLY PORTFOLIO HOLDINGS INFORMATION
The Fund files its complete schedule of portfolio holdings with the SEC for the first and third quarters of each fiscal year as an exhibit to its reports on Form N-PORT. Shareholders may view the filed Form N-PORT by visiting the SEC website at sec.gov.
Allspring Ultra Short-Term Municipal Income Fund | 51
Other information (unaudited)
BOARD OF TRUSTEES AND OFFICERS
Each of the Trustees and Officers listed in the table below acts in identical capacities for each fund in the Allspring family of funds, which consists of 127 mutual funds comprising the Allspring Funds Trust, Allspring Variable Trust, Allspring Master Trust and four closed-end funds (collectively the “Fund Complex”). This table should be read in conjunction with the Prospectus and the Statement of Additional Information1. The mailing address of each Trustee and Officer is 1415 Vantage Park Drive, 3rd Floor, Charlotte, NC 28203. Each Trustee and Officer serves an indefinite term, however, each Trustee serves such term until reaching the mandatory retirement age established by the Trustees.
Independent Trustees
Name and
year of birth | Position held and
length of service* | Principal occupations during past five years or longer | Current other
public company or
investment
company
directorships |
William R. Ebsworth
(Born 1957) | Trustee,
since 2015 | Retired. From 1984 to 2013, equities analyst, portfolio manager, research director and chief investment officer at Fidelity Management and Research Company in Boston, Tokyo, and Hong Kong, and retired in 2013 as Chief Investment Officer of Fidelity Strategic Advisers, Inc. where he led a team of investment professionals managing client assets. Prior thereto, Board member of Hong Kong Securities Clearing Co., Hong Kong Options Clearing Corp., the Thailand International Fund, Ltd., Fidelity Investments Life Insurance Company, and Empire Fidelity Investments Life Insurance Company. Audit Committee Chair and Investment Committee Chair of the Vincent Memorial Hospital Foundation (non-profit organization). Mr. Ebsworth is a CFA® charterholder. | N/A |
Jane A. Freeman
(Born 1953) | Trustee,
since 2015;
Chair Liaison,
since 2018 | Retired. From 2012 to 2014 and 1999 to 2008, Chief Financial Officer of Scientific Learning Corporation. From 2008 to 2012, Ms. Freeman provided consulting services related to strategic business projects. Prior to 1999, Portfolio Manager at Rockefeller & Co. and Scudder, Stevens & Clark. Board member of the Harding Loevner Funds from 1996 to 2014, serving as both Lead Independent Director and chair of the Audit Committee. Board member of the Russell Exchange Traded Funds Trust from 2011 to 2012 and the chair of the Audit Committee. Ms. Freeman is also an inactive Chartered Financial Analyst. | N/A |
Isaiah Harris, Jr.
(Born 1952) | Trustee,
since 2009; Audit
Committee
Chair,
since 2019 | Retired. Member of the Advisory Board of CEF of East Central Florida. Chairman of the Board of CIGNA Corporation from 2009 to 2021, and Director from 2005 to 2008. From 2003 to 2011, Director of Deluxe Corporation. Prior thereto, President and CEO of BellSouth Advertising and Publishing Corp. from 2005 to 2007, President and CEO of BellSouth Enterprises from 2004 to 2005 and President of BellSouth Consumer Services from 2000 to 2003. Emeritus member of the Iowa State University Foundation Board of Governors. Emeritus Member of the Advisory Board of Iowa State University School of Business. Advisory Board Member, Palm Harbor Academy (private school). Advisory Board Member, Fellowship of Christian Athletes. Mr. Harris is a certified public accountant (inactive status). | N/A |
David F. Larcker
(Born 1950) | Trustee,
since 2009 | Distinguished Visiting Fellow at the Hoover Institution since 2022. James Irvin Miller Professor of Accounting at the Graduate School of Business (Emeritus), Stanford University, Director of the Corporate Governance Research Initiative and Senior Faculty of The Rock Center for Corporate Governance since 2006. From 2005 to 2008, Professor of Accounting at the Graduate School of Business, Stanford University. Prior thereto, Ernst & Young Professor of Accounting at The Wharton School, University of Pennsylvania from 1985 to 2005. | N/A |
52 | Allspring Ultra Short-Term Municipal Income Fund
Other information (unaudited)
Name and
year of birth | Position held and
length of service* | Principal occupations during past five years or longer | Current other
public company or
investment
company
directorships |
Olivia S. Mitchell
(Born 1953) | Trustee,
since 2006;
Nominating and
Governance
Committee Chair,
since 2018 | International Foundation of Employee Benefit Plans Professor since 1993, Wharton School of the University of Pennsylvania. Director of Wharton’s Pension Research Council and Boettner Center on Pensions & Retirement Research, and Research Associate at the National Bureau of Economic Research. Previously taught at Cornell University from 1978 to 1993. | N/A |
Timothy J. Penny
(Born 1951) | Trustee,
since 1996;
Chair,
since 2018 | President and Chief Executive Officer of Southern Minnesota Initiative Foundation, a non-profit organization, since 2007. Vice Chair of the Economic Club of Minnesota, since 2007. Co-Chair of the Committee for a Responsible Federal Budget, since 1995. Member of the Board of Trustees of NorthStar Education Finance, Inc., a non-profit organization, from 2007-2022. Senior Fellow of the University of Minnesota Humphrey Institute from 1995 to 2017. | N/A |
James G. Polisson
(Born 1959) | Trustee,
since 2018 | Retired. Chief Marketing Officer, Source (ETF) UK Services, Ltd, from 2015 to 2017. From 2012 to 2015, Principal of The Polisson Group, LLC, a management consulting, corporate advisory and principal investing company. Chief Executive Officer and Managing Director at Russell Investments, Global Exchange Traded Funds from 2010 to 2012. Managing Director of Barclays Global Investors from 1998 to 2010 and Global Chief Marketing Officer for iShares and Barclays Global Investors from 2000 to 2010. Trustee of the San Francisco Mechanics’ Institute, a non-profit organization, from 2013 to 2015. Board member of the Russell Exchange Traded Fund Trust from 2011 to 2012. Director of Barclays Global Investors Holdings Deutschland GmbH from 2006 to 2009. Mr. Polisson is an attorney and has a retired status with the Massachusetts and District of Columbia Bar Associations. | N/A |
Pamela Wheelock
(Born 1959) | Trustee,
since January
2020; previously
Trustee from
January 2018 to
July 2019 | Retired. Executive and Senior Financial leadership positions in the public, private and nonprofit sectors. Interim President and CEO, McKnight Foundation, 2020. Interim Commissioner, Minnesota Department of Human Services, 2019. Chief Operating Officer, Twin Cities Habitat for Humanity, 2017-2019. Vice President for University Services, University of Minnesota, 2012-2016. Interim President and CEO, Blue Cross and Blue Shield of Minnesota, 2011-2012. Executive Vice-President and Chief Financial Officer, Minnesota Wild, 2002-2008. Commissioner, Minnesota Department of Finance, 1999-2002. Chair of the Board of Directors of Destination Medical Center Corporation. Board member of the Minnesota Wild Foundation. | N/A |
* Length of service dates reflect the Trustee’s commencement of service with the Trust’s predecessor entities, where applicable.
Allspring Ultra Short-Term Municipal Income Fund | 53
Other information (unaudited)
Officers2
Name and
year of birth | Position held and
length of service | Principal occupations during past five years or longer |
Andrew Owen
(Born 1960) | President,
since 2017 | President and Chief Executive Officer of Allspring Funds Management, LLC since 2017 and Head of Global Fund Governance of Allspring Global Investments since 2022. Prior thereto, co-president of Galliard Capital Management, LLC, an affiliate of Allspring Funds Management, LLC, from 2019 to 2022 and Head of Affiliated Managers, Allspring Global Investments, from 2014 to 2019 and Executive Vice President responsible for marketing, investments and product development for Allspring Funds Management, LLC, from 2009 to 2014. |
Jeremy DePalma
(Born 1974) | Treasurer,
since 2012
(for certain funds in
the Fund Complex);
since 2021 (for
the remaining funds in the
Fund Complex) | Senior Vice President of Allspring Funds Management, LLC since 2009. Senior Vice President of Evergreen Investment Management Company, LLC from 2008 to 2010 and head of the Fund Reporting and Control Team within Fund Administration from 2005 to 2010. |
Christopher Baker
(Born 1976) | Chief Compliance Officer, since 2022 | Global Chief Compliance Officer for Allspring Global Investments since 2022. Prior thereto, Chief Compliance Officer for State Street Global Advisors from 2018 to 2021. Senior Compliance Officer for the State Street divisions of Alternative Investment Solutions, Sector Solutions, and Global Marketing from 2015 to 2018. From 2010 to 2015 Vice President, Global Head of Investment and Marketing Compliance for State Street Global Advisors. |
Matthew Prasse
(Born 1983) | Chief Legal Officer, since 2022; Secretary, since 2021 | Senior Counsel of the Allspring Legal Department since 2021. Senior Counsel of the Wells Fargo Legal Department from 2018 to 2021. Previously, Counsel for Barings LLC from 2015 to 2018. Prior to joining Barings, Associate at Morgan, Lewis & Bockius LLP from 2008 to 2015. |
1 The Statement of Additional Information includes additional information about the Trustees and is available, without charge, upon request, by calling 1-800-222-8222 or by visiting the website at allspringglobal.com.
2 For those Officers with tenures at Allspring Global Investments and/or Allspring Funds Management, LLC that began prior to 2021, such tenures include years of service during which these businesses/entities were known as Wells Fargo Asset Management and Wells Fargo Funds Management, LLC, respectively.
54 | Allspring Ultra Short-Term Municipal Income Fund
For more information
More information about Allspring Funds is available free upon request. To obtain literature, please write, visit the Fund's website, or call:
Allspring Funds
P.O. Box 219967
Kansas City, MO 64121-9967
Website: allspringglobal.com
Individual investors: 1-800-222-8222
Retail investment professionals: 1-888-877-9275
Institutional investment professionals: 1-800-260-5969
This report and the financial statements contained herein are submitted for the general information of the shareholders of the Fund. If this report is used for promotional purposes, distribution of the report must be accompanied or preceded by a current prospectus. Before investing, please consider the investment objectives, risks, charges, and expenses of the investment. For a current prospectus and, if available, a summary prospectus, containing this information, call
1-800-222-8222 or visit the Fund's website at allspringglobal.com. Read the prospectus carefully before you invest or send money.
Allspring Global InvestmentsTM is the trade name for the asset management firms of Allspring Global Investments Holdings, LLC, a holding company indirectly owned by certain private funds of GTCR LLC and Reverence Capital Partners, L.P. These firms include but are not limited to Allspring Global Investments, LLC, and Allspring Funds Management, LLC. Certain products managed by Allspring entities are distributed by Allspring Funds Distributor, LLC (a broker-dealer and Member FINRA/SIPC).
This material is for general informational and educational purposes only and is NOT intended to provide investment advice or a recommendation of any kind - including a recommendation for any specific investment, strategy, or plan.
© 2023 Allspring Global Investments Holdings, LLC. All rights reserved.
ALL-01092023-iy0qjfzu 02-23
SAR3011 12-22
Semi-Annual Report
December 31, 2022
Allspring
Wisconsin Tax-Free Fund
The views expressed and any forward-looking statements are as of December 31, 2022, unless otherwise noted, and are those of the Fund's portfolio managers and/or Allspring Global Investments. Discussions of individual securities or the markets generally are not intended as individual recommendations. Future events or results may vary significantly from those expressed in any forward-looking statements. The views expressed are subject to change at any time in response to changing circumstances in the market. Allspring Global Investments disclaims any obligation to publicly update or revise any views expressed or forward-looking statements.
Allspring Wisconsin Tax-Free Fund | 1
Letter to shareholders (unaudited)
Andrew Owen
President
Allspring Funds
Dear Shareholder:
We are pleased to offer you this semi-annual report for the Allspring Wisconsin Tax-Free Fund for the six-month period that ended December 31, 2022. Globally, stocks and bonds experienced heightened volatility and generally negative returns through the challenging period. Earlier tailwinds provided by global stimulus programs, vaccination rollouts, and recovering consumer and corporate sentiment were wiped away by the highest rate of inflation in four decades, the impact of ongoing aggressive central bank rate hikes and the prospect of more rate hikes. Compounding these concerns were the global reverberations of the Russia-Ukraine war and the impact of China’s strict COVID-19 lockdowns.
For the six-month period, stocks and bonds had mixed results, with emerging market equities trailing those of developed markets and both U.S. and non-U.S. bonds fighting an uphill battle in the face of sustained interest rate increases. For the period, U.S. stocks, based on the S&P 500 Index,1 gained 2.31%. International stocks, as measured by the MSCI ACWI ex USA Index (Net),2 returned 2.96%, while the MSCI EM Index (Net) (USD)3 declined 2.99%. Among bond indexes, the Bloomberg U.S. Aggregate Bond Index4 returned -2.97%, the Bloomberg Global Aggregate ex-USD Index (unhedged)5 returned -2.65%, the Bloomberg Municipal Bond Index6 gained 0.50%, and the ICE BofA U.S. High Yield Index7 returned 3.33%.
Persistent inflation and economic fallout from the Russia-Ukraine war drove markets.
Markets rebounded from earlier losses in July, led by U.S. stocks. While evidence pointed to an economic slowdown after two consecutive quarters of declining gross domestic product (economic contraction), the U.S. labor market remained surprisingly strong: July nonfarm payrolls grew by more than 500,000 and U.S. unemployment dipped to 3.5%. Meanwhile, crude oil and retail gasoline prices, major contributors to recent overall inflation, fell substantially from earlier highs. And while U.S. home prices rose, sales fell as houses became less affordable with mortgage rates at a 13-year high. The Federal Reserve (Fed) raised the federal funds rate another 0.75% in July—to a range of 2.25% to 2.50%—and forecasts pointed to further rate hikes.
| 1 | The S&P 500 Index consists of 500 stocks chosen for market size, liquidity, and industry group representation. It is a market-value-weighted index with each stock's weight in the index proportionate to its market value. You cannot invest directly in an index. |
| 2 | The Morgan Stanley Capital International (MSCI) All Country World Index (ACWI) ex USA Index (Net) is a free-float-adjusted market-capitalization-weighted index that is designed to measure the equity market performance of developed and emerging markets, excluding the U.S. Source: MSCI. MSCI makes no express or implied warranties or representations and shall have no liability whatsoever with respect to any MSCI data contained herein. The MSCI data may not be further redistributed or used as a basis for other indexes or any securities or financial products. This report is not approved, reviewed, or produced by MSCI. You cannot invest directly in an index. |
| 3 | The MSCI Emerging Markets (EM) Index (Net) (USD) is a free-float-adjusted market-capitalization-weighted index that is designed to measure equity market performance of emerging markets. You cannot invest directly in an index. |
| 4 | The Bloomberg U.S. Aggregate Bond Index is a broad-based benchmark that measures the investment-grade, U.S.-dollar-denominated, fixed-rate taxable bond market, including Treasuries, government-related and corporate securities, mortgage-backed securities (agency fixed-rate and hybrid adjustable-rate mortgage pass-throughs), asset-backed securities, and commercial mortgage-backed securities. You cannot invest directly in an index. |
| 5 | The Bloomberg Global Aggregate ex-USD Index (unhedged) is an unmanaged index that provides a broad-based measure of the global investment-grade fixed-income markets excluding the U.S.-dollar-denominated debt market. You cannot invest directly in an index. |
| 6 | The Bloomberg Municipal Bond Index is an unmanaged index composed of long-term tax-exempt bonds with a minimum credit rating of Baa. You cannot invest directly in an index. |
| 7 | The ICE BofA U.S. High Yield Index is a market-capitalization-weighted index of domestic and Yankee high-yield bonds. The index tracks the performance of high-yield securities traded in the U.S. bond market. You cannot invest directly in an index. Copyright 2023. ICE Data Indices, LLC. All rights reserved. |
2 | Allspring Wisconsin Tax-Free Fund
Letter to shareholders (unaudited)
August was yet another broadly challenging month for financial markets, with more red ink flowing. High inflation persisted, cresting 9% in the eurozone on an annual basis and remaining above 8% in the U.S. despite the Fed’s aggressive monetary policy and a major drop in global crude oil and gasoline prices from their June peak. One positive note was the resilience of the U.S. job market. However, the Fed’s job was clearly not complete. One longer-term bright spot was the U.S. Congress’s passage of the Inflation Reduction Act. Its primary stated goals include: to reduce inflation (though not immediately) by curbing the deficit, capping health care spending by seniors, and investing in domestic sources of clean energy.
The market misery continued in September. There was nowhere to hide as all asset classes suffered major losses at the hands of persistent inflation. Central banks kept up their battle against rapidly rising prices with more rate hikes. The strength of the U.S. dollar made things even more difficult for investors holding assets in other currencies. U.S. mortgage rates jumped to near 7% on 30-year fixed-rate mortgages; the decreased housing affordability began to cool demand somewhat. The U.K. experienced a sharp sell-off of government bonds and the British pound in September as investors panicked in response to a new government budget that was seen as financially unsound. The market meltdown forced the Bank of England to step in and buy long-dated government bonds.
Equities had a reprieve in October after two months of sharp declines. Value stocks and small caps fared best. Globally, developed markets outpaced emerging market equities, which were hurt by weakness among Chinese stocks. Central banks continued to try to curtail high inflation with aggressive interest rate hikes. Geopolitical risks persisted, including the ongoing Russia-Ukraine war and economic, financial market, and political turmoil in the U.K., which led to a second prime ministerial change in six weeks, as Rishi Sunak replaced Liz Truss in late October. Concerns over Europe’s energy crisis eased thanks to unseasonably warm weather and plentiful gas on hand. The U.S. labor market continued its resilience against rising prices, as unemployment stood at 3.7%, near a record low.
Stocks and bonds rallied in November, with emerging market equities gaining nearly 15% and developed market equities returning 7%. The S&P 500 Index rose 5.6% in November. Bonds also had positive monthly returns. Economic news was encouraging, driven by U.S. labor market strength. Although central banks kept raising rates, expectations grew regarding an impending easing in the pace of rate hikes and a possible end to central bank monetary tightening in 2023. Although inflation remained at record highs in the eurozone, with a 10.6% annual increase in October, Germany’s producer prices decreased 4.2% annually, signaling a possible decline in inflationary pressures. Meanwhile, U.S. inflation continued to moderate, with a 7.1% annual price rise in November and a monthly price increase of just 0.1%. China’s economic data remained weak, reflecting its zero-COVID-19 policy.
Financial markets cooled in December, with U.S. equities posting negative overall results in response to a weakening U.S. dollar. Fixed income securities ended one of their worst years ever with flat overall monthly returns as markets weighed the hopes for an end to the monetary tightening cycle with the reality that central banks had not completed their jobs yet. U.S. Consumer Price Index (CPI)1 data showed a strong consistent trend downward, which brought down the 12-month CPI to 6.5% in December from 9.1% in June. Other countries and regions reported still-high but declining inflation rates as the year winded down.
“ The market misery continued in September. There was nowhere to hide as all asset classes suffered major losses at the hands of persistent inflation.”
| 1 | The Consumer Price Index (CPI) is a measure of the average change over time in the prices paid by urban consumers for a market basket of consumer goods and services. You cannot invest directly in an index. |
Allspring Wisconsin Tax-Free Fund | 3
Letter to shareholders (unaudited)
Don’t let short-term uncertainty derail long-term investment goals.
Periods of investment uncertainty can present challenges, but experience has taught us that maintaining long-term investment goals can be an effective way to plan for the future. To help you create a sound strategy based on your personal goals and risk tolerance, Allspring Funds offers more than 100 mutual funds spanning a wide range of asset classes and investment styles. Although diversification cannot guarantee an investment profit or prevent losses, we believe it can be an effective way to manage investment risk and potentially smooth out overall portfolio performance. We encourage investors to know their investments and to understand that appropriate levels of risk-taking may unlock opportunities.
Thank you for choosing to invest with Allspring Funds. We appreciate your confidence in us and remain committed to helping you meet your financial needs.
Sincerely,
Andrew Owen
President
Allspring Funds
For further information about your fund, contact your investment professional, visit our website at allspringglobal.com, or call us directly at 1-800-222-8222.
4 | Allspring Wisconsin Tax-Free Fund
This page is intentionally left blank.
Performance highlights (unaudited)
| Investment objective | The Fund seeks current income exempt from federal income tax and Wisconsin individual income tax. |
| Manager | Allspring Funds Management, LLC |
| Subadviser | Allspring Global Investments, LLC |
| Portfolio managers | Bruce R. Johns, Kerry Laurin, Thomas Stoeckmann |
| Average annual total returns (%) as of December 31, 2022 |
| | | Including sales charge | | Excluding sales charge | | Expense ratios1 (%) |
| | Inception date | 1 year | 5 year | 10 year | | 1 year | 5 year | 10 year | | Gross | Net 2 |
| Class A (WWTFX) | 3-31-2008 | -11.50 | -0.01 | 1.22 | | -7.32 | 0.92 | 1.69 | | 0.92 | 0.70 |
| Class C (WWTCX) | 12-26-2002 | -9.03 | 0.15 | 1.08 | | -8.03 | 0.15 | 1.08 | | 1.67 | 1.45 |
| Institutional Class (WWTIX)3 | 10-31-2016 | – | – | – | | -7.16 | 1.09 | 1.80 | | 0.59 | 0.52 |
| Bloomberg Municipal Bond Index4 | – | – | – | – | | -8.53 | 1.25 | 2.13 | | – | – |
| Bloomberg Wisconsin Municipal Bond Index5 | – | – | – | – | | -8.48 | 0.98 | 1.88 | | – | – |
Figures quoted represent past performance, which is no guarantee of future results, and do not reflect taxes that a shareholder may pay on an investment in a fund. Investment return and principal value of an investment will fluctuate so that an investor’s shares, when redeemed, may be worth more or less than their original cost. Performance shown without sales charges would be lower if sales charges were reflected. Current performance may be lower or higher than the performance data quoted, which assumes the reinvestment of dividends and capital gains. Current month-end performance is available on the Fund’s website, allspringglobal.com.
Index returns do not include transaction costs associated with buying and selling securities, any mutual fund fees or expenses, or any taxes. It is not possible to invest directly in an index.
For Class A shares, the maximum front-end sales charge is 4.50%. For Class C shares, the maximum contingent deferred sales charge is 1.00%. Performance including a contingent deferred sales charge assumes the sales charge for the corresponding time period. Institutional Class shares are sold without a front-end sales charge or contingent deferred sales charge.
| 1 | Reflects the expense ratios as stated in the most recent prospectuses. The expense ratios shown are subject to change and may differ from the annualized expense ratios shown in the financial highlights of this report. |
| 2 | The manager has contractually committed through October 31, 2023, to waive fees and/or reimburse expenses to the extent necessary to cap total annual fund operating expenses after fee waivers at 0.70% for Class A, 1.45% for Class C, and 0.52% for Institutional Class. Brokerage commissions, stamp duty fees, interest, taxes, acquired fund fees and expenses (if any), and extraordinary expenses are excluded from the expense caps. Prior to or after the commitment expiration date, the caps may be increased or the commitment to maintain the caps may be terminated only with the approval of the Board of Trustees. Without these caps, the Fund’s returns would have been lower. The expense ratio paid by an investor is the net expense ratio (the total annual fund operating expenses after fee waivers) as stated in the prospectuses. |
| 3 | Historical performance shown for the Institutional Class shares prior to their inception reflects the performance of the Class A shares , and includes the higher expenses applicable to the Class A shares. If these expenses had not been included, returns for the Institutional Class shares would be higher. |
| 4 | The Bloomberg Municipal Bond Index is an unmanaged index composed of long-term tax-exempt bonds with a minimum credit rating of Baa. You cannot invest directly in an index. |
| 5 | The Bloomberg Wisconsin Municipal Bond Index is the Wisconsin component of the Bloomberg Municipal Bond Index. You cannot invest directly in an index. |
Bond values fluctuate in response to the financial condition of individual issuers, general market and economic conditions, and changes in interest rates. Changes in market conditions and government policies may lead to periods of heightened volatility in the bond market and reduced liquidity for certain bonds held by the Fund. In general, when interest rates rise, bond values fall and investors may lose principal value. Interest rate changes and their impact on the Fund and its share price can be sudden and unpredictable. The use of derivatives may reduce returns and/or increase volatility. Certain investment strategies tend to increase the total risk of an investment (relative to the broader market). This fund is exposed to Wisconsin and Puerto Rico municipal securities risk, high-yield securities risk, and non-diversification risk. Consult the Fund’s prospectus for additional information on these and other risks. A portion of the Fund’s income may be subject to federal, state, and/or local income taxes or the Alternative Minimum Tax (AMT). Any capital gains distributions may be taxable.
6 | Allspring Wisconsin Tax-Free Fund
Performance highlights (unaudited)
| Credit quality as of December 31, 20221 |
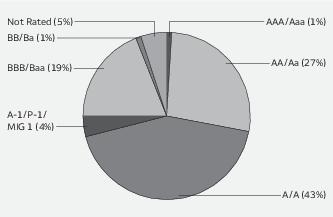
| 1 | The credit quality distribution of portfolio holdings reflected in the chart is based on ratings from Standard & Poor’s, Moody’s Investors Service, and/or Fitch Ratings Ltd. Credit quality ratings apply to the underlying holdings of the Fund and not to the Fund itself. The percentages of the portfolio with the ratings depicted in the chart are calculated based on the market value of fixed income securities held by the Fund. If a security was rated by all three rating agencies, the middle rating was utilized. If rated by two of the three rating agencies, the lower rating was utilized, and if rated by one of the rating agencies, that rating was utilized. Standard & Poor’s rates the creditworthiness of bonds, ranging from AAA (highest) to D (lowest). Ratings from A to CCC may be modified by the addition of a plus (+) or minus (-) sign to show relative standing within the rating categories. Standard & Poor’s rates the creditworthiness of short-term notes from SP-1 (highest) to SP-3 (lowest). Moody’s rates the creditworthiness of bonds, ranging from Aaa (highest) to C (lowest). Ratings Aa to B may be modified by the addition of a number 1 (highest) to 3 (lowest) to show relative standing within the ratings categories. Moody’s rates the creditworthiness of short-term U.S. tax-exempt municipal securities from MIG 1/VMIG 1 (highest) to SG (lowest). Fitch rates the creditworthiness of bonds, ranging from AAA (highest) to D (lowest). Credit quality distribution is subject to change and may have changed since the date specified. |
| Effective maturity distribution as of December 31, 20221 |
| 1 | Figures represent the percentage of the Fund's long-term investments. Allocations are subject to change and may have changed since the date specified. |
Allspring Wisconsin Tax-Free Fund | 7
Fund expenses (unaudited)
As a shareholder of the Fund, you incur two types of costs: (1) transaction costs, including sales charges (loads) on purchase payments and contingent deferred sales charges (if any) on redemptions and (2) ongoing costs, including management fees, distribution (12b-1) and/or shareholder servicing fees, and other Fund expenses. This example is intended to help you understand your ongoing costs (in dollars) of investing in the Fund and to compare these costs with the ongoing costs of investing in other mutual funds.
The example is based on an investment of $1,000 invested at the beginning of the six-month period and held for the entire period from July 1, 2022 to December 31, 2022.
Actual expenses
The “Actual” line of the table below provides information about actual account values and actual expenses. You may use the information in this line, together with the amount you invested, to estimate the expenses that you paid over the period. Simply divide your account value by $1,000 (for example, an $8,600 account value divided by $1,000 = 8.6), then multiply the result by the number in the “Actual” line under the heading entitled “Expenses paid during period” for your applicable class of shares to estimate the expenses you paid on your account during this period.
Hypothetical example for comparison purposes
The “Hypothetical” line of the table below provides information about hypothetical account values and hypothetical expenses based on the Fund’s actual expense ratio and an assumed rate of return of 5% per year before expenses, which is not the Fund’s actual return. The hypothetical account values and expenses may not be used to estimate the actual ending account balance or expenses you paid for the period. You may use this information to compare the ongoing costs of investing in the Fund and other funds. To do so, compare this 5% hypothetical example with the 5% hypothetical examples that appear in the shareholder reports of the other funds.
Please note that the expenses shown in the table are meant to highlight your ongoing costs only and do not reflect any transactional costs, such as sales charges (loads) and contingent deferred sales charges. Therefore, the “Hypothetical” line of the table is useful in comparing ongoing costs only, and will not help you determine the relative total costs of owning different funds. In addition, if these transactional costs were included, your costs would have been higher.
| | Beginning
account value
7-1-2022 | Ending
account value
12-31-2022 | Expenses
paid during
the period1 | Annualized net
expense ratio |
| Class A | | | | |
| Actual | $1,000.00 | $ 999.79 | $3.48 | 0.69% |
| Hypothetical (5% return before expenses) | $1,000.00 | $1,021.73 | $3.52 | 0.69% |
| Class C | | | | |
| Actual | $1,000.00 | $ 995.96 | $7.29 | 1.45% |
| Hypothetical (5% return before expenses) | $1,000.00 | $1,017.90 | $7.38 | 1.45% |
| Institutional Class | | | | |
| Actual | $1,000.00 | $1,000.66 | $2.62 | 0.52% |
| Hypothetical (5% return before expenses) | $1,000.00 | $1,022.58 | $2.65 | 0.52% |
1 Expenses paid is equal to the annualized net expense ratio of each class multiplied by the average account value over the period, multiplied by 184 divided by 365 (to reflect the one-half-year period).
8 | Allspring Wisconsin Tax-Free Fund
Portfolio of investments—December 31, 2022 (unaudited)
| | | Interest
rate | Maturity
date | Principal | Value |
| Municipal obligations: 98.55% | | | | | |
| Alabama: 0.72% | | | | | |
| Utilities revenue: 0.72% | | | | | |
| Black Belt Energy Gas District Series 2021C-1 | | 4.00% | 10-1-2052 | $1,000,000 | $ 987,716 |
| Georgia: 0.34% | | | | | |
| Utilities revenue: 0.34% | | | | | |
| Main Street Natural Gas Incorporated Gas Supply Revenue Bonds Series 2022C 144Aøø | | 4.00 | 8-1-2052 | 500,000 | 470,091 |
| Guam: 6.90% | | | | | |
| Airport revenue: 3.26% | | | | | |
| Guam International Airport Authority AMT Refunding Bond Series A | | 5.00 | 10-1-2023 | 825,000 | 834,454 |
| Guam International Airport Authority Prerefunded Revenue Bond AMT General Series C (AGM Insured) | | 6.13 | 10-1-2043 | 270,000 | 275,457 |
| Guam International Airport Authority Prerefunded Revenue Bond AMT General Series C (AGM Insured) | | 6.13 | 10-1-2043 | 1,230,000 | 1,254,858 |
| Guam International Airport Authority Revenue Bond A.B. Won Pat International Airport Series 2013C (AGM Insured) | | 6.00 | 10-1-2034 | 365,000 | 372,046 |
| Guam International Airport Authority Revenue Bonds Series A %% | | 5.25 | 10-1-2031 | 250,000 | 252,993 |
| Guam Port Authority AMT Series A | | 5.00 | 7-1-2048 | 1,000,000 | 1,015,708 |
| Guam Port Authority AMT Series B | | 5.00 | 7-1-2034 | 445,000 | 469,679 |
| | | | | | 4,475,195 |
| Tax revenue: 1.08% | | | | | |
| Guam Government Business Privilege Tax Revenue Refunding Bonds Series F | | 4.00 | 1-1-2042 | 500,000 | 435,755 |
| Guam Government Hotel Occupancy Refunding Bond Series A | | 5.00 | 11-1-2035 | 1,000,000 | 1,042,100 |
| | | | | | 1,477,855 |
| Utilities revenue: 0.38% | | | | | |
| Guam Power Authority Series A | | 5.00 | 10-1-2026 | 500,000 | 524,549 |
| Water & sewer revenue: 2.18% | | | | | |
| Guam Government Waterworks Authority Series A | | 5.00 | 1-1-2050 | 300,000 | 297,324 |
| Guam Government Waterworks Authority Water and Wastewater Refunding Bond | | 5.00 | 7-1-2034 | 500,000 | 512,325 |
| Guam Government Waterworks Authority Water and Wastewater Revenue Bonds Series 2016 | | 5.00 | 1-1-2046 | 2,215,000 | 2,179,376 |
| | | | | | 2,989,025 |
| | | | | | 9,466,624 |
| Illinois: 3.36% | | | | | |
| GO revenue: 2.13% | | | | | |
| Chicago IL CAB City Colleges (NPFGC Insured) ¤ | | 0.00 | 1-1-2027 | 1,000,000 | 856,583 |
| Chicago IL Park District Special Recreation Activity Series E | | 5.00 | 11-15-2027 | 1,000,000 | 1,049,604 |
| Illinois GO Series March 2022A | | 5.00 | 3-1-2024 | 500,000 | 506,938 |
| Illinois GO Series March 2022A | | 5.25 | 3-1-2037 | 500,000 | 510,904 |
| | | | | | 2,924,029 |
The accompanying notes are an integral part of these financial statements.
Allspring Wisconsin Tax-Free Fund | 9
Portfolio of investments—December 31, 2022 (unaudited)
| | | Interest
rate | Maturity
date | Principal | Value |
| Miscellaneous revenue: 1.23% | | | | | |
| Chicago IL Special Assessment Improvement Bonds Refunding Series 2022 Lakeshore East Project 144A | | 2.69% | 12-1-2026 | $ 305,000 | $ 280,564 |
| Illinois GO Series July 2013 | | 5.50 | 7-1-2026 | 250,000 | 251,985 |
| Illinois GO Series June 2013 | | 5.25 | 7-1-2028 | 500,000 | 502,494 |
| Illinois GO Series November 2017C | | 5.00 | 11-1-2029 | 630,000 | 645,408 |
| | | | | | 1,680,451 |
| | | | | | 4,604,480 |
| Maryland: 0.71% | | | | | |
| Housing revenue: 0.71% | | | | | |
| Maryland CDA Department of Housing & Community Multifamily Development Series 2022-D | | 3.15 | 7-1-2024 | 1,000,000 | 978,201 |
| New Jersey: 1.33% | | | | | |
| Education revenue: 0.32% | | | | | |
| Camden County NJ Improvement Authority School Revenue Bonds 2022 Project | | 6.00 | 6-15-2047 | 425,000 | 446,772 |
| Transportation revenue: 1.01% | | | | | |
| New Jersey TTFA CAB Series A ¤ | | 0.00 | 12-15-2031 | 2,000,000 | 1,382,841 |
| | | | | | 1,829,613 |
| New York: 1.03% | | | | | |
| Education revenue: 1.03% | | | | | |
| Hempstead NY Local Development Corporation The Academy Charter School Project Series A | | 4.45 | 2-1-2041 | 500,000 | 391,908 |
| Hempstead NY Local Development Corporation The Academy Charter School Project Series A | | 6.24 | 2-1-2047 | 1,000,000 | 1,021,155 |
| | | | | | 1,413,063 |
| Pennsylvania: 3.26% | | | | | |
| Education revenue: 0.43% | | | | | |
| Lehigh County PA General Purpose Authority Charter School Revenue Bonds Series 2022 | | 4.00 | 6-1-2032 | 600,000 | 585,956 |
| Health revenue: 1.41% | | | | | |
| Montgomery County PA Higher Education and Health Authority Thomas Jefferson University Revenue Bonds Series 2022B | | 5.00 | 5-1-2052 | 2,000,000 | 1,938,761 |
| Housing revenue: 1.42% | | | | | |
| Pennsylvania Housing Finance Agency MFHR Sherman Hills (Department of Housing and Urban Development Insured) øø | | 1.25 | 2-1-2025 | 2,000,000 | 1,944,198 |
| | | | | | 4,468,915 |
| Puerto Rico: 1.42% | | | | | |
| Health revenue: 1.42% | | | | | |
| Puerto Rico Industrial Tourist Educational Medical & Environmental Control Facilities Financing Authority Hospital Auxilio Mutuo Obligated Group Project 2021 | | 5.00 | 7-1-2026 | 205,000 | 215,002 |
The accompanying notes are an integral part of these financial statements.
10 | Allspring Wisconsin Tax-Free Fund
Portfolio of investments—December 31, 2022 (unaudited)
| | | Interest
rate | Maturity
date | Principal | Value |
| Health revenue (continued) | | | | | |
| Puerto Rico Industrial Tourist Educational Medical & Environmental Control Facilities Financing Authority Hospital Auxilio Mutuo Obligated Group Project 2021 | | 5.00% | 7-1-2031 | $ 435,000 | $ 479,581 |
| Puerto Rico Industrial Tourist Educational Medical & Environmental Control Facilities Financing Authority Hospital Auxilio Mutuo Obligated Group Project 2021 | | 5.00 | 7-1-2032 | 925,000 | 1,010,674 |
| Puerto Rico Industrial Tourist Educational Medical & Environmental Control Facilities Financing Authority Hospital Auxilio Mutuo Obligated Group Project 2021 | | 5.00 | 7-1-2034 | 220,000 | 238,853 |
| | | | | | 1,944,110 |
| South Carolina: 0.73% | | | | | |
| Utilities revenue: 0.73% | | | | | |
| South Carolina Statewide Public Service Authority Revenue Refunding Bond and Improvement Series A | | 4.00 | 12-1-2033 | 1,000,000 | 995,067 |
| Texas: 2.13% | | | | | |
| Education revenue: 0.75% | | | | | |
| Hale Center Texas Education Facilities Corporation Revenue Refunding Bond Wayland Baptist University Project Series 2022 | | 5.00 | 3-1-2027 | 990,000 | 1,029,178 |
| GO revenue: 1.38% | | | | | |
| Denton TX Independent School District School Building | | 4.00 | 8-15-2048 | 2,000,000 | 1,898,389 |
| | | | | | 2,927,567 |
| Wisconsin: 76.62% | | | | | |
| Education revenue: 7.72% | | | | | |
| Milwaukee WI RDA Science Education Consortium Incorporated Project Series A | | 6.25 | 8-1-2043 | 2,100,000 | 2,119,014 |
| Wisconsin HEFA Milwaukee School Engineering Project (AGM Insured) | | 2.00 | 4-1-2038 | 1,200,000 | 865,140 |
| Wisconsin HEFA Milwaukee School Engineering Project (AGM Insured) | | 2.13 | 4-1-2039 | 1,000,000 | 719,718 |
| Wisconsin HEFA Milwaukee School Engineering Project (AGM Insured) | | 2.13 | 4-1-2040 | 1,000,000 | 702,576 |
| Wisconsin HEFA Milwaukee School Engineering Project (AGM Insured) | | 2.25 | 4-1-2041 | 750,000 | 529,478 |
| Wisconsin HEFA Milwaukee School Engineering Project (AGM Insured) | | 2.25 | 4-1-2042 | 1,000,000 | 698,170 |
| Wisconsin HEFA Revenue Lawrence University | | 4.00 | 3-15-2040 | 1,555,000 | 1,362,918 |
| Wisconsin HEFA Revenue Lawrence University | | 4.00 | 2-1-2045 | 1,685,000 | 1,496,504 |
| Wisconsin HEFA The Medical College of Wisconsin Incorporated Series 2022 | | 5.00 | 12-1-2041 | 2,000,000 | 2,099,356 |
| | | | | | 10,592,874 |
| GO revenue: 1.26% | | | | | |
| Milwaukee WI Series B6 | | 3.00 | 4-1-2024 | 570,000 | 567,549 |
| Milwaukee WI Series B6 | | 5.00 | 4-1-2023 | 580,000 | 582,156 |
| Milwaukee WI Series B6 | | 5.00 | 4-1-2025 | 550,000 | 576,032 |
| | | | | | 1,725,737 |
The accompanying notes are an integral part of these financial statements.
Allspring Wisconsin Tax-Free Fund | 11
Portfolio of investments—December 31, 2022 (unaudited)
| | | Interest
rate | Maturity
date | Principal | Value |
| Health revenue: 21.53% | | | | | |
| PFA Wisconsin Healthcare Facilities Appalachian Regional Healthcare System Series A | | 5.00% | 7-1-2037 | $ 275,000 | $ 285,802 |
| PFA Wisconsin Healthcare Facilities Appalachian Regional Healthcare System Series A | | 5.00 | 7-1-2038 | 375,000 | 387,747 |
| Wisconsin HEFA Bellin Memorial Hospital Incorporated Refunding Revenue Bond Series 2015 | | 3.38 | 12-1-2031 | 180,000 | 179,587 |
| Wisconsin HEFA Bellin Memorial Hospital Incorporated Series 2015 | | 3.13 | 12-1-2029 | 150,000 | 147,889 |
| Wisconsin HEFA Bellin Memorial Hospital Incorporated Series A | | 5.00 | 12-1-2027 | 175,000 | 188,357 |
| Wisconsin HEFA Bellin Memorial Hospital Incorporated Series A | | 5.00 | 12-1-2029 | 150,000 | 165,213 |
| Wisconsin HEFA Bellin Memorial Hospital Project Series 2022 | | 5.50 | 12-1-2052 | 2,500,000 | 2,674,398 |
| Wisconsin HEFA Beloit Health System Incorporated | | 4.00 | 7-1-2036 | 3,000,000 | 2,946,105 |
| Wisconsin HEFA Beloit Health System Incorporated | | 5.00 | 7-1-2028 | 50,000 | 53,940 |
| Wisconsin HEFA Beloit Health System Incorporated | | 5.00 | 7-1-2029 | 1,270,000 | 1,379,776 |
| Wisconsin HEFA Marshfield Clinic Health System | | 3.00 | 2-15-2031 | 230,000 | 221,665 |
| Wisconsin HEFA Marshfield Clinic Health System | | 3.25 | 2-15-2032 | 185,000 | 181,182 |
| Wisconsin HEFA Marshfield Clinic Health System | | 4.00 | 2-15-2042 | 500,000 | 446,801 |
| Wisconsin HEFA Marshfield Clinic Health System | | 5.00 | 2-15-2047 | 3,385,000 | 3,390,531 |
| Wisconsin HEFA Marshfield Clinic Health System Obligated Group Series C | | 5.00 | 2-15-2027 | 400,000 | 421,896 |
| Wisconsin HEFA Marshfield Clinic Health System Obligated Group Series C | | 5.00 | 2-15-2028 | 650,000 | 685,425 |
| Wisconsin HEFA Marshfield Clinic Health System Obligated Group Series C | | 5.00 | 2-15-2029 | 500,000 | 523,857 |
| Wisconsin HEFA Monroe Clinic Incorporated | | 3.00 | 2-15-2035 | 520,000 | 522,589 |
| Wisconsin HEFA Monroe Clinic Incorporated | | 4.00 | 2-15-2031 | 900,000 | 927,697 |
| Wisconsin HEFA Monroe Clinic Incorporated | | 4.00 | 2-15-2033 | 550,000 | 566,926 |
| Wisconsin HEFA Monroe Clinic Incorporated | | 5.00 | 2-15-2028 | 900,000 | 950,235 |
| Wisconsin HEFA Monroe Clinic Incorporated | | 5.00 | 2-15-2029 | 575,000 | 607,095 |
| Wisconsin HEFA Monroe Clinic Incorporated | | 5.00 | 2-15-2030 | 340,000 | 358,978 |
| Wisconsin HEFA Refunding Bond Bellin Memorial Hospital Incorporated | | 4.00 | 12-1-2035 | 1,000,000 | 1,001,069 |
| Wisconsin HEFA Refunding Bond Bellin Memorial Hospital Incorporated | | 5.00 | 12-1-2026 | 1,740,000 | 1,786,729 |
| Wisconsin HEFA Revenue Bonds Series 2018 B | | 5.00 | 6-1-2038 | 350,000 | 350,287 |
| Wisconsin HEFA Rogers Memorial Hospital Incorporated Series A | | 5.00 | 7-1-2044 | 200,000 | 202,570 |
| Wisconsin HEFA Rogers Memorial Hospital Incorporated Series A | | 5.00 | 7-1-2049 | 250,000 | 251,615 |
| Wisconsin HEFA Rogers Memorial Hospital Incorporated Series B | | 5.00 | 7-1-2044 | 3,485,000 | 3,504,990 |
| Wisconsin HEFA Saint John's Communities Incorporated Series 2022 | | 4.00 | 9-15-2045 | 650,000 | 513,028 |
| Wisconsin HEFA Saint John's Communities Incorporated Series B | | 4.00 | 9-15-2045 | 475,000 | 382,705 |
| Wisconsin HEFA Three Pillars Senior Living Communities Series 2021A | | 4.00 | 8-15-2023 | 125,000 | 124,718 |
| Wisconsin HEFA Three Pillars Senior Living Communities Series 2021A | | 4.00 | 8-15-2024 | 125,000 | 124,002 |
| Wisconsin HEFA Three Pillars Senior Living Communities Series 2021A | | 4.00 | 8-15-2030 | 100,000 | 94,810 |
| Wisconsin HEFA Three Pillars Senior Living Communities Series 2021A | | 4.00 | 8-15-2031 | 75,000 | 70,296 |
The accompanying notes are an integral part of these financial statements.
12 | Allspring Wisconsin Tax-Free Fund
Portfolio of investments—December 31, 2022 (unaudited)
| | | Interest
rate | Maturity
date | Principal | Value |
| Health revenue (continued) | | | | | |
| Wisconsin HEFA Three Pillars Senior Living Communities Series 2021A | | 4.00% | 8-15-2041 | $2,145,000 | $ 1,826,557 |
| Wisconsin HEFA Three Pillars Senior Living Communities Series 2021A | | 4.00 | 8-15-2046 | 850,000 | 691,231 |
| Wisconsin HEFA Three Pillars Senior Living Communities Series 2021A | | 4.00 | 8-15-2051 | 500,000 | 394,294 |
| | | | | | 29,532,592 |
| Housing revenue: 16.37% | | | | | |
| Green Bay WI Housing Authority Housing Revenue Refunding Bond Student University Village Housing Incorporated | | 2.00 | 4-1-2023 | 50,000 | 49,736 |
| Green Bay WI Housing Authority Housing Revenue Refunding Bond Student University Village Housing Incorporated | | 2.00 | 4-1-2028 | 125,000 | 115,511 |
| Green Bay WI Housing Authority Housing Revenue Refunding Bond Student University Village Housing Incorporated | | 2.00 | 4-1-2029 | 250,000 | 226,093 |
| Green Bay WI Housing Authority Housing Revenue Refunding Bond Student University Village Housing Incorporated | | 2.00 | 4-1-2030 | 875,000 | 775,165 |
| Wisconsin Housing & EDA AMT Series A | | 4.63 | 11-1-2037 | 10,000 | 10,003 |
| Wisconsin Housing & EDA Madison Pool Project Series A | | 4.55 | 7-1-2037 | 165,000 | 168,551 |
| Wisconsin Housing & EDA Madison Pool Project Series A | | 4.70 | 7-1-2047 | 2,300,000 | 2,311,624 |
| Wisconsin Housing & EDA Madison Pool Project Series A | | 4.85 | 7-1-2052 | 3,000,000 | 3,023,544 |
| Wisconsin Housing & EDA Series A | | 3.38 | 5-1-2057 | 635,000 | 478,766 |
| Wisconsin Housing & EDA Series A | | 3.40 | 11-1-2032 | 2,450,000 | 2,429,542 |
| Wisconsin Housing & EDA Series A | | 3.95 | 11-1-2038 | 2,000,000 | 1,970,037 |
| Wisconsin Housing & EDA Series A | | 4.05 | 12-1-2049 | 800,000 | 737,479 |
| Wisconsin Housing & EDA Series A | | 5.75 | 11-1-2043 | 1,240,000 | 1,251,382 |
| Wisconsin Housing & EDA Series B (Department of Housing and Urban Development Insured) øø | | 0.40 | 5-1-2045 | 1,445,000 | 1,397,787 |
| Wisconsin Housing & EDA Series C (Department of Housing and Urban Development Insured) øø | | 0.61 | 11-1-2042 | 2,900,000 | 2,760,586 |
| Wisconsin Housing & EDA Series C (Department of Housing and Urban Development Insured) | | 0.80 | 5-1-2025 | 275,000 | 260,035 |
| Wisconsin Housing & EDA Series C (Department of Housing and Urban Development Insured) | | 0.85 | 11-1-2025 | 320,000 | 299,739 |
| Wisconsin Housing & EDA Series C (Department of Housing and Urban Development Insured) | | 0.95 | 5-1-2026 | 205,000 | 189,932 |
| Wisconsin Housing & EDA Series C (Department of Housing and Urban Development Insured) | | 1.00 | 11-1-2026 | 330,000 | 302,875 |
| Wisconsin Housing & EDA Series C (Department of Housing and Urban Development Insured) | | 1.20 | 5-1-2027 | 310,000 | 282,098 |
| Wisconsin Housing & EDA Series C (Department of Housing and Urban Development Insured) | | 1.35 | 11-1-2027 | 345,000 | 312,880 |
| Wisconsin Housing & EDA Series C | | 3.88 | 11-1-2035 | 1,100,000 | 1,104,940 |
| Wisconsin Housing and Economic Development Authority Demand Home Ownership Revenue Bonds Series E (FHLB SPA) ø | | 3.78 | 9-1-2035 | 2,000,000 | 2,000,000 |
| | | | | | 22,458,305 |
| Miscellaneous revenue: 18.34% | | | | | |
| Appleton WI RDA Fox Cities Performing Arts Center Project Series B (Associated Bank NA LOC) ø | | 4.10 | 6-1-2036 | 1,000,000 | 1,000,000 |
| Ashwaubenon WI CDA Lease Revenue Brown County Expo Center Project | | 4.00 | 6-1-2031 | 1,310,000 | 1,385,562 |
| Ashwaubenon WI CDA Lease Revenue Brown County Expo Center Project | | 4.00 | 6-1-2035 | 900,000 | 927,993 |
The accompanying notes are an integral part of these financial statements.
Allspring Wisconsin Tax-Free Fund | 13
Portfolio of investments—December 31, 2022 (unaudited)
| | | Interest
rate | Maturity
date | Principal | Value |
| Miscellaneous revenue (continued) | | | | | |
| Ashwaubenon WI CDA Lease Revenue Brown County Expo Center Project | | 4.00% | 6-1-2036 | $ 265,000 | $ 269,440 |
| Ashwaubenon WI CDA Lease Revenue Brown County Expo Center Project CAB ¤ | | 0.00 | 6-1-2049 | 8,000,000 | 2,293,881 |
| Kaukauna WI RDA | | 3.75 | 6-1-2032 | 850,000 | 858,698 |
| Kaukauna WI RDA | | 4.00 | 6-1-2023 | 200,000 | 200,557 |
| Kaukauna WI RDA | | 4.00 | 6-1-2025 | 425,000 | 435,635 |
| Kaukauna WI RDA | | 4.00 | 6-1-2028 | 425,000 | 433,862 |
| Kaukauna WI RDA | | 4.00 | 6-1-2035 | 900,000 | 911,247 |
| Milwaukee WI RDA Lease Public Schools | | 5.00 | 11-15-2033 | 750,000 | 803,315 |
| Milwaukee WI RDA Lease Public Schools Series A | | 5.00 | 11-15-2026 | 220,000 | 236,804 |
| Milwaukee WI RDA Milwaukee Public Schools | | 5.00 | 11-15-2028 | 325,000 | 350,071 |
| Milwaukee WI RDA Milwaukee Public Schools | | 5.00 | 11-15-2034 | 675,000 | 722,984 |
| Milwaukee WI RDA Milwaukee Public Schools | | 5.00 | 11-15-2035 | 1,000,000 | 1,069,580 |
| Milwaukee WI RDA Milwaukee Public Schools | | 5.00 | 11-15-2036 | 500,000 | 534,037 |
| Milwaukee WI RDA Milwaukee Public Schools Series A | | 5.00 | 11-15-2024 | 280,000 | 290,514 |
| Milwaukee WI RDA Milwaukee Public Schools Series A | | 5.00 | 11-15-2027 | 1,020,000 | 1,100,623 |
| Milwaukee WI RDA Milwaukee Public Schools Series A | | 5.00 | 11-15-2028 | 1,000,000 | 1,077,142 |
| Milwaukee WI RDA Milwaukee Public Schools Series A | | 5.00 | 11-15-2031 | 750,000 | 804,448 |
| Milwaukee WI RDA Revenue Refunding Bond Milwaukee Public Schools (NPFGC Insured) | | 4.00 | 8-1-2023 | 1,500,000 | 1,507,091 |
| Weston WI CDA Series A | | 1.90 | 10-1-2023 | 800,000 | 790,670 |
| Weston WI CDA Series A | | 2.00 | 10-1-2024 | 625,000 | 607,831 |
| Weston WI CDA Series A | | 2.15 | 10-1-2025 | 615,000 | 599,844 |
| Weston WI CDA Series A | | 2.25 | 10-1-2026 | 940,000 | 915,658 |
| Weston WI CDA Series A | | 2.40 | 10-1-2027 | 570,000 | 556,987 |
| Wisconsin Dells Community Development Authority Series B | | 3.35 | 3-1-2026 | 530,000 | 521,827 |
| Wisconsin GO Series A (SIFMA Municipal Swap +0.42%) ± | | 4.08 | 5-1-2025 | 4,000,000 | 3,947,833 |
| | | | | | 25,154,134 |
| Tax revenue: 11.03% | | | | | |
| Southeast Wisconsin Professional Baseball Park District Series A (NPFGC Insured) | | 5.50 | 12-15-2023 | 1,600,000 | 1,637,181 |
| Southeast Wisconsin Professional Baseball Park District Series A (NPFGC Insured) | | 5.50 | 12-15-2026 | 2,435,000 | 2,606,331 |
| Warrens WI CDA Interim Community Development Workout Extension | | 3.70 | 11-1-2029 | 132,418 | 90,451 |
| Wisconsin Center District Appropriation Milwaukee Arena Project 2016 | | 5.00 | 12-15-2023 | 550,000 | 560,340 |
| Wisconsin Center District CAB (AGM Insured) ¤ | | 0.00 | 12-15-2030 | 295,000 | 218,228 |
| Wisconsin Center District CAB Junior Dedicated Series D ¤ | | 0.00 | 12-15-2045 | 1,250,000 | 420,984 |
| Wisconsin Center District CAB Senior Dedicated Milwaukee Arena Project Series A (BAM Insured) ¤ | | 0.00 | 12-15-2033 | 2,985,000 | 1,910,449 |
| Wisconsin Center District CAB Series A (NPFGC Insured) ¤ | | 0.00 | 12-15-2027 | 100,000 | 83,525 |
| Wisconsin Center District Junior Dedicated Tax Revenue Prerefunded Bond (AGM Insured) | | 5.25 | 12-15-2023 | 285,000 | 285,936 |
| Wisconsin Center District Junior Dedicated Tax Revenue Prerefunded Bond (AGM Insured) | | 5.25 | 12-15-2027 | 220,000 | 237,433 |
| Wisconsin Center District Junior Dedicated Tax Revenue Unrefunded Balance Refunding Bond (AGM Insured) | | 5.25 | 12-15-2023 | 315,000 | 320,526 |
| Wisconsin Center District Junior Dedicated Tax Revenue Unrefunded Balance Refunding Bond (AGM Insured) | | 5.25 | 12-15-2027 | 785,000 | 847,310 |
| Wisconsin Center District Milwaukee Arena Project | | 4.00 | 12-15-2032 | 1,100,000 | 1,137,621 |
| Wisconsin Center District Milwaukee Arena Project | | 4.00 | 12-15-2033 | 920,000 | 953,609 |
| Wisconsin Center District Milwaukee Arena Project | | 4.00 | 12-15-2034 | 2,000,000 | 2,060,383 |
The accompanying notes are an integral part of these financial statements.
14 | Allspring Wisconsin Tax-Free Fund
Portfolio of investments—December 31, 2022 (unaudited)
| | | Interest
rate | Maturity
date | Principal | Value |
| Tax revenue (continued) | | | | | |
| Wisconsin Center District Milwaukee Arena Project | | 5.00% | 12-15-2032 | $ 85,000 | $ 90,777 |
| Wisconsin Center District Tax Revenue CAB Senior Dedicated Series C (AGM Insured) ¤ | | 0.00 | 12-15-2028 | 1,075,000 | 866,641 |
| Wisconsin Center District Tax Revenue CAB Senior Dedicated Series C (AGM Insured) ¤ | | 0.00 | 12-15-2030 | 1,095,000 | 810,034 |
| | | | | | 15,137,759 |
| Utilities revenue: 0.37% | | | | | |
| PFA PCR Duke Energy Progress Project Series 2022A ## | | 3.30 | 10-1-2046 | 500,000 | 500,953 |
| | | | | | 105,102,354 |
| Total Municipal obligations (Cost $143,375,756) | | | | | 135,187,801 |
| Total investments in securities (Cost $143,375,756) | 98.55% | | | | 135,187,801 |
| Other assets and liabilities, net | 1.45 | | | | 1,991,863 |
| Total net assets | 100.00% | | | | $137,179,664 |
| 144A | The security may be resold in transactions exempt from registration, normally to qualified institutional buyers, pursuant to Rule 144A under the Securities Act of 1933. |
| øø | The interest rate is determined and reset by the issuer periodically depending upon the terms of the security. The rate shown is the rate in effect at period end. |
| ¤ | The security is issued in zero coupon form with no periodic interest payments. |
| ø | Variable rate demand notes are subject to a demand feature which reduces the effective maturity. The maturity date shown represents the final maturity date of the security. The interest rate is determined and reset by the issuer daily, weekly, or monthly depending upon the terms of the security. The rate shown is the rate in effect at period end. |
| ± | Variable rate investment. The rate shown is the rate in effect at period end. |
| ## | All or a portion of this security is segregated for when-issued securities. |
| %% | The security is purchased on a when-issued basis. |
| Abbreviations: |
| AGM | Assured Guaranty Municipal |
| AMT | Alternative minimum tax |
| BAM | Build America Mutual Assurance Company |
| CAB | Capital appreciation bond |
| CDA | Community Development Authority |
| EDA | Economic Development Authority |
| FHLB | Federal Home Loan Bank |
| GO | General obligation |
| HEFA | Health & Educational Facilities Authority |
| LOC | Letter of credit |
| MFHR | Multifamily housing revenue |
| NPFGC | National Public Finance Guarantee Corporation |
| PCR | Pollution control revenue |
| PFA | Public Finance Authority |
| RDA | Redevelopment Authority |
| SIFMA | Securities Industry and Financial Markets Association |
| SPA | Standby purchase agreement |
| TTFA | Transportation Trust Fund Authority |
The accompanying notes are an integral part of these financial statements.
Allspring Wisconsin Tax-Free Fund | 15
Statement of assets and liabilities—December 31, 2022 (unaudited)
| | |
| Assets | |
Investments in unaffiliated securities, at value (cost $143,375,756)
| $ 135,187,801 |
Cash
| 392,686 |
Receivable for interest
| 1,422,721 |
Receivable for Fund shares sold
| 895,450 |
Prepaid expenses and other assets
| 55,171 |
Total assets
| 137,953,829 |
| Liabilities | |
Payable for Fund shares redeemed
| 396,504 |
Payable for when-issued transactions
| 254,488 |
Dividends payable
| 30,665 |
Management fee payable
| 30,607 |
Administration fees payable
| 14,907 |
Distribution fee payable
| 2,708 |
Accrued expenses and other liabilities
| 44,286 |
Total liabilities
| 774,165 |
Total net assets
| $137,179,664 |
| Net assets consist of | |
Paid-in capital
| $ 145,810,928 |
Total distributable loss
| (8,631,264) |
Total net assets
| $137,179,664 |
| Computation of net asset value and offering price per share | |
Net assets – Class A
| $ 61,502,918 |
Shares outstanding – Class A1
| 6,042,452 |
Net asset value per share – Class A
| $10.18 |
Maximum offering price per share – Class A2
| $10.66 |
Net assets – Class C
| $ 3,951,398 |
Shares outstanding – Class C1
| 388,216 |
Net asset value per share – Class C
| $10.18 |
Net assets – Institutional Class
| $ 71,725,348 |
Shares outstanding – Institutional Class1
| 7,045,811 |
Net asset value per share – Institutional Class
| $10.18 |
| 1 | The Fund has an unlimited number of authorized shares. |
| 2 | Maximum offering price is computed as 100/95.50 of net asset value. On investments of $50,000 or more, the offering price is reduced. |
The accompanying notes are an integral part of these financial statements.
16 | Allspring Wisconsin Tax-Free Fund
Statement of operations—six months ended December 31, 2022 (unaudited)
| | |
| Investment income | |
Interest
| $ 2,190,734 |
| Expenses | |
Management fee
| 295,707 |
| Administration fees | |
Class A
| 52,666 |
Class C
| 3,264 |
Institutional Class
| 31,176 |
| Shareholder servicing fees | |
Class A
| 82,203 |
Class C
| 5,082 |
| Distribution fee | |
Class C
| 15,246 |
Custody and accounting fees
| 3,953 |
Professional fees
| 29,710 |
Registration fees
| 29,013 |
Shareholder report expenses
| 14,573 |
Trustees’ fees and expenses
| 11,164 |
Other fees and expenses
| 2,915 |
Total expenses
| 576,672 |
| Less: Fee waivers and/or expense reimbursements | |
Fund-level
| (116,993) |
Net expenses
| 459,679 |
Net investment income
| 1,731,055 |
| Realized and unrealized gains (losses) on investments | |
Net realized losses on investments
| (228,181) |
Net change in unrealized gains (losses) on investments
| (1,630,284) |
Net realized and unrealized gains (losses) on investments
| (1,858,465) |
Net decrease in net assets resulting from operations
| $ (127,410) |
The accompanying notes are an integral part of these financial statements.
Allspring Wisconsin Tax-Free Fund | 17
Statement of changes in net assets
| | | | | |
| | Six months ended
December 31, 2022
(unaudited) | Year ended
June 30, 2022 |
| Operations | | | | |
Net investment income
| | $ 1,731,055 | | $ 3,147,668 |
Net realized losses on investments
| | (228,181) | | (185,821) |
Net change in unrealized gains (losses) on investments
| | (1,630,284) | | (14,929,330) |
Net decrease in net assets resulting from operations
| | (127,410) | | (11,967,483) |
| Distributions to shareholders from | | | | |
| Net investment income and net realized gains | | | | |
Class A
| | (747,982) | | (1,413,674) |
Class C
| | (30,880) | | (58,669) |
Institutional Class
| | (952,196) | | (1,850,887) |
Total distributions to shareholders
| | (1,731,058) | | (3,323,230) |
| Capital share transactions | Shares | | Shares | |
| Proceeds from shares sold | | | | |
Class A
| 361,753 | 3,685,232 | 620,159 | 6,828,863 |
Class C
| 38,432 | 391,878 | 91,176 | 995,979 |
Institutional Class
| 2,106,856 | 21,431,350 | 3,238,533 | 35,149,888 |
| | | 25,508,460 | | 42,974,730 |
| Reinvestment of distributions | | | | |
Class A
| 67,753 | 686,485 | 116,034 | 1,267,180 |
Class C
| 2,972 | 30,099 | 5,293 | 57,878 |
Institutional Class
| 91,761 | 929,915 | 166,521 | 1,819,075 |
| | | 1,646,499 | | 3,144,133 |
| Payment for shares redeemed | | | | |
Class A
| (833,724) | (8,417,491) | (1,100,996) | (11,868,079) |
Class C
| (61,451) | (627,033) | (175,453) | (1,884,410) |
Institutional Class
| (2,812,158) | (28,551,421) | (3,600,905) | (38,548,690) |
| | | (37,595,945) | | (52,301,179) |
Net decrease in net assets resulting from capital share transactions
| | (10,440,986) | | (6,182,316) |
Total decrease in net assets
| | (12,299,454) | | (21,473,029) |
| Net assets | | | | |
Beginning of period
| | 149,479,118 | | 170,952,147 |
End of period
| | $137,179,664 | | $149,479,118 |
The accompanying notes are an integral part of these financial statements.
18 | Allspring Wisconsin Tax-Free Fund
Financial highlights
(For a share outstanding throughout each period)
| | | Year ended June 30 |
| Class A | Six months ended
December 31, 2022
(unaudited) | 2022 | 2021 | 2020 | 2019 | 2018 |
Net asset value, beginning of period
| $10.30 | $11.28 | $11.12 | $11.04 | $10.74 | $10.83 |
Net investment income
| 0.12 | 0.20 | 0.21 | 0.25 | 0.29 | 0.28 |
Net realized and unrealized gains (losses) on investments
| (0.12) | (0.97) | 0.16 | 0.08 | 0.30 | (0.09) |
Total from investment operations
| 0.00 | (0.77) | 0.37 | 0.33 | 0.59 | 0.19 |
| Distributions to shareholders from | | | | | | |
Net investment income
| (0.12) | (0.20) | (0.21) | (0.25) | (0.29) | (0.28) |
Net realized gains
| 0.00 | (0.01) | 0.00 | (0.00) 1 | 0.00 | 0.00 |
Total distributions to shareholders
| (0.12) | (0.21) | (0.21) | (0.25) | (0.29) | (0.28) |
Net asset value, end of period
| $10.18 | $10.30 | $11.28 | $11.12 | $11.04 | $10.74 |
Total return2
| (0.02)% | (6.93)% | 3.37% | 3.05% | 5.56% | 1.76% |
| Ratios to average net assets (annualized) | | | | | | |
Gross expenses
| 0.93% | 0.92% | 0.92% | 0.95% | 0.94% | 0.88% |
Net expenses
| 0.69% | 0.69% | 0.68% | 0.69% | 0.70% | 0.70% |
Net investment income
| 2.27% | 1.79% | 1.88% | 2.24% | 2.66% | 2.57% |
| Supplemental data | | | | | | |
Portfolio turnover rate
| 9% | 12% | 10% | 24% | 8% | 11% |
Net assets, end of period (000s omitted)
| $61,503 | $66,388 | $76,836 | $81,173 | $84,924 | $87,790 |
| 1 | Amount is less than $0.005. |
| 2 | Total return calculations do not include any sales charges. Returns for periods of less than one year are not annualized. |
The accompanying notes are an integral part of these financial statements.
Allspring Wisconsin Tax-Free Fund | 19
Financial highlights
(For a share outstanding throughout each period)
| | | Year ended June 30 |
| Class C | Six months ended
December 31, 2022
(unaudited) | 2022 | 2021 | 2020 | 2019 | 2018 |
Net asset value, beginning of period
| $10.30 | $11.28 | $11.12 | $11.04 | $10.74 | $10.83 |
Net investment income
| 0.08 | 0.11 | 0.13 | 0.17 1 | 0.21 | 0.20 |
Net realized and unrealized gains (losses) on investments
| (0.12) | (0.97) | 0.16 | 0.08 | 0.30 | (0.09) |
Total from investment operations
| (0.04) | (0.86) | 0.29 | 0.25 | 0.51 | 0.11 |
| Distributions to shareholders from | | | | | | |
Net investment income
| (0.08) | (0.11) | (0.13) | (0.17) | (0.21) | (0.20) |
Net realized gains
| 0.00 | (0.01) | 0.00 | (0.00) 2 | 0.00 | 0.00 |
Total distributions to shareholders
| (0.08) | (0.12) | (0.13) | (0.17) | (0.21) | (0.20) |
Net asset value, end of period
| $10.18 | $10.30 | $11.28 | $11.12 | $11.04 | $10.74 |
Total return3
| (0.40)% | (7.64)% | 2.58% | 2.27% | 4.78% | 1.01% |
| Ratios to average net assets (annualized) | | | | | | |
Gross expenses
| 1.68% | 1.66% | 1.67% | 1.70% | 1.69% | 1.63% |
Net expenses
| 1.45% | 1.45% | 1.45% | 1.45% | 1.45% | 1.45% |
Net investment income
| 1.51% | 1.02% | 1.12% | 1.49% | 1.92% | 1.83% |
| Supplemental data | | | | | | |
Portfolio turnover rate
| 9% | 12% | 10% | 24% | 8% | 11% |
Net assets, end of period (000s omitted)
| $3,951 | $4,204 | $5,496 | $5,842 | $6,687 | $8,105 |
| 1 | Calculated based upon average shares outstanding |
| 2 | Amount is less than $0.005. |
| 3 | Total return calculations do not include any sales charges. Returns for periods of less than one year are not annualized. |
The accompanying notes are an integral part of these financial statements.
20 | Allspring Wisconsin Tax-Free Fund
Financial highlights
(For a share outstanding throughout each period)
| | | Year ended June 30 |
| Institutional Class | Six months ended
December 31, 2022
(unaudited) | 2022 | 2021 | 2020 | 2019 | 2018 |
Net asset value, beginning of period
| $10.30 | $11.28 | $11.12 | $11.04 | $10.74 | $10.83 |
Net investment income
| 0.13 | 0.22 | 0.23 | 0.27 | 0.31 | 0.30 |
Net realized and unrealized gains (losses) on investments
| (0.12) | (0.97) | 0.16 | 0.08 | 0.30 | (0.09) |
Total from investment operations
| 0.01 | (0.75) | 0.39 | 0.35 | 0.61 | 0.21 |
| Distributions to shareholders from | | | | | | |
Net investment income
| (0.13) | (0.22) | (0.23) | (0.27) | (0.31) | (0.30) |
Net realized gains
| 0.00 | (0.01) | 0.00 | (0.00) 1 | 0.00 | 0.00 |
Total distributions to shareholders
| (0.13) | (0.23) | (0.23) | (0.27) | (0.31) | (0.30) |
Net asset value, end of period
| $10.18 | $10.30 | $11.28 | $11.12 | $11.04 | $10.74 |
Total return2
| 0.07% | (6.78)% | 3.54% | 3.23% | 5.75% | 1.95% |
| Ratios to average net assets (annualized) | | | | | | |
Gross expenses
| 0.60% | 0.59% | 0.59% | 0.62% | 0.61% | 0.55% |
Net expenses
| 0.52% | 0.52% | 0.52% | 0.52% | 0.52% | 0.52% |
Net investment income
| 2.44% | 1.96% | 2.04% | 2.40% | 2.85% | 2.79% |
| Supplemental data | | | | | | |
Portfolio turnover rate
| 9% | 12% | 10% | 24% | 8% | 11% |
Net assets, end of period (000s omitted)
| $71,725 | $78,887 | $88,620 | $68,230 | $43,978 | $36,181 |
| 1 | Amount is less than $0.005. |
| 2 | Returns for periods of less than one year are not annualized. |
The accompanying notes are an integral part of these financial statements.
Allspring Wisconsin Tax-Free Fund | 21
Notes to financial statements (unaudited)
1. ORGANIZATION
Allspring Funds Trust (the "Trust"), a Delaware statutory trust organized on March 10, 1999, is an open-end management investment company registered under the Investment Company Act of 1940, as amended (the "1940 Act"). As an investment company, the Trust follows the accounting and reporting guidance in Financial Accounting Standards Board ("FASB") Accounting Standards Codification Topic 946, Financial Services – Investment Companies. These financial statements report on the Allspring Wisconsin Tax-Free Fund (the "Fund") which is a non-diversified series of the Trust.
2. SIGNIFICANT ACCOUNTING POLICIES
The following significant accounting policies, which are consistently followed in the preparation of the financial statements of the Fund, are in conformity with U.S. generally accepted accounting principles which require management to make estimates and assumptions that affect the reported amounts of assets and liabilities, disclosure of contingent assets and liabilities at the date of the financial statements, and the reported amounts of income and expenses during the reporting period. Actual results could differ from those estimates.
Securities valuation
All investments are valued each business day as of the close of regular trading on the New York Stock Exchange (generally 4 p.m. Eastern Time), although the Fund may deviate from this calculation time under unusual or unexpected circumstances.
Debt securities are valued at the evaluated bid price provided by an independent pricing service (e.g. taking into account various factors, including yields, maturities, or credit ratings) or, if a reliable price is not available, the quoted bid price from an independent broker-dealer.
Futures contracts that are listed on a foreign or domestic exchange or market are valued at the official closing price or, if none, the last sales price.
Investments which are not valued using the methods discussed above are valued at their fair value, as determined in good faith by Allspring Funds Management, LLC ("Allspring Funds Management"), which was named the valuation designee by the Board of Trustees. As the valuation designee, Allspring Funds Management is responsible for day-to-day valuation activities for the Allspring Funds. In connection with these responsibilities, Allspring Funds Management has established a Valuation Committee and has delegated to it the authority to take any actions regarding the valuation of portfolio securities that the Valuation Committee deems necessary or appropriate, including determining the fair value of portfolio securities. On a quarterly basis, the Board of Trustees receives reports of valuation actions taken by the Valuation Committee. On at least an annual basis, the Board of Trustees receives an assessment of the adequacy and effectiveness of Allspring Funds Management's process for determining the fair value of the portfolio of investments.
When-issued transactions
The Fund may purchase securities on a forward commitment or when-issued basis. The Fund records a when-issued transaction on the trade date and will segregate assets in an amount at least equal in value to the Fund's commitment to purchase when-issued securities. Securities purchased on a when-issued basis are marked-to-market daily and the Fund begins earning interest on the settlement date. Losses may arise due to changes in the market value of the underlying securities or if the counterparty does not perform under the contract.
Futures contracts
Futures contracts are agreements between the Fund and a counterparty to buy or sell a specific amount of a commodity, financial instrument or currency at a specified price on a specified date. The Fund may buy and sell futures contracts in order to gain exposure to, or protect against, changes in interest rates and is subject to interest rate risk. The primary risks associated with the use of futures contracts are the imperfect correlation between changes in market values of securities held by the Fund and the prices of futures contracts, and the possibility of an illiquid market. Futures contracts are generally entered into on a regulated futures exchange and cleared through a clearinghouse associated with the exchange. With futures contracts, there is minimal counterparty risk to the Fund since futures contracts are exchange traded and the exchange’s clearinghouse, as the counterparty to all exchange-traded futures, guarantees the futures contracts against default.
Upon entering into a futures contract, the Fund is required to deposit either cash or securities (initial margin) with the broker in an amount equal to a certain percentage of the contract value. Subsequent payments (variation margin) are paid to or from the broker each day equal to the daily changes in the contract value. Such payments are recorded as unrealized gains or losses and, if any, shown as variation margin receivable (payable) in the Statement of Assets and Liabilities. Should the Fund fail to make requested variation margin payments, the broker can gain access to the initial margin to satisfy the Fund’s payment obligations. When the contracts are closed, a realized gain or loss is recorded in the Statement of Operations.
22 | Allspring Wisconsin Tax-Free Fund
Notes to financial statements (unaudited)
Security transactions and income recognition
Securities transactions are recorded on a trade date basis. Realized gains or losses are recorded on the basis of identified cost.
Interest income is accrued daily and bond discounts are accreted and premiums are amortized daily. To the extent debt obligations are placed on non-accrual status, any related interest income may be reduced by writing off interest receivables when the collection of all or a portion of interest has been determined to be doubtful based on consistently applied procedures and the fair value has decreased. If the issuer subsequently resumes interest payments or when the collectability of interest is reasonably assured, the debt obligation is removed from non-accrual status.
Distributions to shareholders
Distributions to shareholders from net investment income are declared daily and paid monthly. Distributions from net realized gains, if any, are recorded on the ex-dividend date and paid at least annually. Such distributions are determined in accordance with income tax regulations and may differ from U.S. generally accepted accounting principles. Dividend sources are estimated at the time of declaration. The tax character of distributions is determined as of the Fund's fiscal year end. Therefore, a portion of the Fund's distributions made prior to the Fund’s fiscal year end may be categorized as a tax return of capital at year end.
Federal and other taxes
The Fund intends to continue to qualify as a regulated investment company by distributing substantially all of its investment company taxable and tax-exempt income and any net realized capital gains (after reduction for capital loss carryforwards) sufficient to relieve it from all, or substantially all, federal income taxes. Accordingly, no provision for federal income taxes was required.
The Fund’s income and federal excise tax returns and all financial records supporting those returns for the prior three fiscal years are subject to examination by the federal and Delaware revenue authorities. Management has analyzed the Fund's tax positions taken on federal, state, and foreign tax returns, as applicable, for all open tax years and does not believe that there are any uncertain tax positions that require recognition of a tax liability.
As of December 31, 2022, the aggregate cost of all investments for federal income tax purposes was $143,362,203 and the unrealized gains (losses) consisted of:
| Gross unrealized gains | $ 593,046 |
| Gross unrealized losses | (8,767,448) |
| Net unrealized losses | $(8,174,402) |
As of June 30, 2022, the Fund had current year deferred post-October capital losses consisting of $76,000 in short-term capital losses and $128,300 in long-term capital losses which was recognized in the first day of the current fiscal year.
Class allocations
The separate classes of shares offered by the Fund differ principally in applicable sales charges, distribution, shareholder servicing, and administration fees. Class specific expenses are charged directly to that share class. Investment income, common fund-level expenses, and realized and unrealized gains (losses) on investments are allocated daily to each class of shares based on the relative proportion of net assets of each class.
3. FAIR VALUATION MEASUREMENTS
Fair value measurements of investments are determined within a framework that has established a fair value hierarchy based upon the various data inputs utilized in determining the value of the Fund’s investments. The three-level hierarchy gives the highest priority to unadjusted quoted prices in active markets for identical assets or liabilities (Level 1) and the lowest priority to unobservable inputs (Level 3). The Fund’s investments are classified within the fair value hierarchy based on the lowest level of input that is significant to the fair value measurement. The inputs are summarized into three broad levels as follows:
| ■ | Level 1 – quoted prices in active markets for identical securities |
| ■ | Level 2 – other significant observable inputs (including quoted prices for similar securities, interest rates, prepayment speeds, credit risk, etc.) |
| ■ | Level 3 – significant unobservable inputs (including the Fund’s own assumptions in determining the fair value of investments) |
The inputs or methodologies used for valuing investments in securities are not necessarily an indication of the risk associated with investing in those securities.
Allspring Wisconsin Tax-Free Fund | 23
Notes to financial statements (unaudited)
The following is a summary of the inputs used in valuing the Fund’s assets and liabilities as of December 31, 2022:
| | Quoted prices
(Level 1) | Other significant
observable inputs
(Level 2) | Significant
unobservable inputs
(Level 3) | Total |
| Assets | | | | |
| Investments in: | | | | |
| Municipal obligations | $0 | $135,187,801 | $0 | $135,187,801 |
Additional sector, industry or geographic detail, if any, is included in the Portfolio of Investments.
For the six months ended December 31, 2022, the Fund did not have any transfers into/out of Level 3.
4. TRANSACTIONS WITH AFFILIATES
Management fee
Allspring Funds Management, a wholly owned subsidiary of Allspring Global Investments Holdings, LLC, a holding company indirectly owned by certain private funds of GTCR LLC and Reverence Capital Partners, L.P., is the manager of the Fund and provides advisory and fund-level administrative services under an investment management agreement. Under the investment management agreement, Allspring Funds Management is responsible for, among other services, implementing the investment objectives and strategies of the Fund, supervising the subadviser and providing fund-level administrative services in connection with the Fund’s operations. As compensation for its services under the investment management agreement, Allspring Funds Management is entitled to receive a management fee at the following annual rate based on the Fund’s average daily net assets:
| Average daily net assets | Management fee |
| First $500 million | 0.400% |
| Next $500 million | 0.375 |
| Next $2 billion | 0.350 |
| Next $2 billion | 0.325 |
| Next $5 billion | 0.290 |
| Over $10 billion | 0.280 |
For the six months ended December 31, 2022, the management fee was equivalent to an annual rate of 0.40% of the Fund’s average daily net assets.
Allspring Funds Management has retained the services of a subadviser to provide daily portfolio management to the Fund. The fee for subadvisory services is borne by Allspring Funds Management. Allspring Global Investments, LLC, an affiliate of Allspring Funds Management and a wholly owned subsidiary of Allspring Global Investments Holdings, LLC, is the subadviser to the Fund and is entitled to receive a fee from Allspring Funds Management at an annual rate starting at 0.20% and declining to 0.10% as the average daily net assets of the Fund increase.
Administration fees
Under a class-level administration agreement, Allspring Funds Management provides class-level administrative services to the Fund, which includes paying fees and expenses for services provided by the transfer agent, sub-transfer agents, omnibus account servicers and record-keepers. As compensation for its services under the class-level administration agreement, Allspring Funds Management receives an annual fee which is calculated based on the average daily net assets of each class as follows:
| | Class-level
administration fee |
| Class A | 0.16% |
| Class C | 0.16 |
| Institutional Class | 0.08 |
24 | Allspring Wisconsin Tax-Free Fund
Notes to financial statements (unaudited)
Waivers and/or expense reimbursements
Allspring Funds Management has contractually committed to waive and/or reimburse management and administration fees to the extent necessary to maintain certain net operating expense ratios for the Fund. When each class of the Fund has exceeded its expense cap, Allspring Funds Management will waive fees and/or reimburse expenses from fund-level expenses on a proportionate basis and then from class specific expenses. When only certain classes exceed their expense caps, waivers and/or reimbursements are applied against class specific expenses before fund-level expenses. Allspring Funds Management has contractually committed through October 31, 2023 to waive fees and/or reimburse expenses to the extent necessary to cap expenses. Prior to or after the commitment expiration date, the caps may be increased or the commitment to maintain the caps may be terminated only with the approval of the Board of Trustees. As of December 31, 2022, the contractual expense caps are as follows:
| | Expense ratio caps |
| Class A | 0.70% |
| Class C | 1.45 |
| Institutional Class | 0.52 |
Distribution fee
The Trust has adopted a distribution plan for Class C shares pursuant to Rule 12b-1 under the 1940 Act. A distribution fee is charged to Class C shares and paid to Allspring Funds Distributor, LLC ("Allspring Funds Distributor"), the principal underwriter, an affiliate of Allspring Funds Management, at an annual rate up to 0.75% of the average daily net assets of Class C shares.
In addition, Allspring Funds Distributor is entitled to receive the front-end sales charge from the purchase of Class A shares and a contingent deferred sales charge on the redemption of certain Class A shares. Allspring Funds Distributor is also entitled to receive the contingent deferred sales charges from redemptions of Class C shares. Allspring Funds Distributor did not receive any front-end or contingent deferred sales charges from Class A or Class C shares for the six months ended December 31, 2022.
Shareholder servicing fees
The Trust has entered into contracts with one or more shareholder servicing agents, whereby Class A and Class C are charged a fee at an annual rate up to 0.25% of the average daily net assets of each respective class. A portion of these total shareholder servicing fees were paid to affiliates of the Fund.
Interfund transactions
The Fund may purchase or sell portfolio investment securities to certain affiliates pursuant to Rule 17a-7 under the 1940 Act and under procedures adopted by the Board of Trustees. The procedures have been designed to ensure that these interfund transactions, which do not incur broker commissions, are effected at current market prices. Pursuant to these procedures, the Fund had $0, $9,510,000 and $0 in interfund purchases, sales and net realized gains (losses), respectively, during the six months ended December 31, 2022.
5. INVESTMENT PORTFOLIO TRANSACTIONS
Purchases and sales of investments, excluding U.S. government obligations (if any) and short-term securities, for the six months ended December 31, 2022 were $11,911,483 and $21,178,827, respectively.
6. BANK BORROWINGS
The Trust (excluding the money market funds), Allspring Master Trust and Allspring Variable Trust are parties to a $350,000,000 revolving credit agreement whereby the Fund is permitted to use bank borrowings for temporary or emergency purposes, such as to fund shareholder redemption requests. Interest under the credit agreement is charged to the Fund based on a borrowing rate equal to the higher of the Federal Funds rate or the overnight bank funding rate in effect on that day plus a spread. In addition, an annual commitment fee equal based on the unused balance is allocated to each participating fund.
For the six months ended December 31, 2022, there were no borrowings by the Fund under the agreement.
Allspring Wisconsin Tax-Free Fund | 25
Notes to financial statements (unaudited)
7. CONCENTRATION RISK
The Fund invests a substantial portion of its assets in issuers of municipal debt securities located in a single state or territory of the U.S. Therefore, it may be more affected by economic and political developments in that state or region than would be a comparable general tax-exempt fund. As of the end of the period, the Fund's investments were concentrated in the state of Wisconsin.
8. MARKET RISKS
On March 11, 2020, the World Health Organization announced that it had made the assessment that coronavirus disease 2019 (“COVID-19”) is a pandemic. The impacts of COVID-19 are affecting the entire global economy, individual companies and investment products, the funds, and the market in general. There is significant uncertainty around the extent and duration of business disruptions related to COVID-19 and the impacts may last for an extended period of time. COVID-19 has led to significant uncertainty and volatility in the financial markets.
9. INDEMNIFICATION
Under the Fund's organizational documents, the officers and Trustees have been granted certain indemnification rights against certain liabilities that may arise out of performance of their duties to the Fund. The Fund has entered into a separate agreement with each Trustee that converts indemnification rights currently existing under the Fund’s organizational documents into contractual rights that cannot be changed in the future without the consent of the Trustee. Additionally, in the normal course of business, the Fund may enter into contracts with service providers that contain a variety of indemnification clauses. The Fund’s maximum exposure under these arrangements is dependent on future claims that may be made against the Fund and, therefore, cannot be estimated.
26 | Allspring Wisconsin Tax-Free Fund
Other information (unaudited)
PROXY VOTING INFORMATION
A description of the policies and procedures used to determine how to vote proxies relating to portfolio securities is available without charge, upon request, by calling 1-800-222-8222, visiting our website at allspringglobal.com, or visiting the SEC website at sec.gov. Information regarding how the proxies related to portfolio securities were voted during the most recent 12-month period ended June 30 is available on the website at allspringglobal.com or by visiting the SEC website at sec.gov.
QUARTERLY PORTFOLIO HOLDINGS INFORMATION
The Fund files its complete schedule of portfolio holdings with the SEC for the first and third quarters of each fiscal year as an exhibit to its reports on Form N-PORT. Shareholders may view the filed Form N-PORT by visiting the SEC website at sec.gov.
Allspring Wisconsin Tax-Free Fund | 27
Other information (unaudited)
BOARD OF TRUSTEES AND OFFICERS
Each of the Trustees and Officers listed in the table below acts in identical capacities for each fund in the Allspring family of funds, which consists of 127 mutual funds comprising the Allspring Funds Trust, Allspring Variable Trust, Allspring Master Trust and four closed-end funds (collectively the “Fund Complex”). This table should be read in conjunction with the Prospectus and the Statement of Additional Information1. The mailing address of each Trustee and Officer is 1415 Vantage Park Drive, 3rd Floor, Charlotte, NC 28203. Each Trustee and Officer serves an indefinite term, however, each Trustee serves such term until reaching the mandatory retirement age established by the Trustees.
Independent Trustees
Name and
year of birth | Position held and
length of service* | Principal occupations during past five years or longer | Current other
public company or
investment
company
directorships |
William R. Ebsworth
(Born 1957) | Trustee,
since 2015 | Retired. From 1984 to 2013, equities analyst, portfolio manager, research director and chief investment officer at Fidelity Management and Research Company in Boston, Tokyo, and Hong Kong, and retired in 2013 as Chief Investment Officer of Fidelity Strategic Advisers, Inc. where he led a team of investment professionals managing client assets. Prior thereto, Board member of Hong Kong Securities Clearing Co., Hong Kong Options Clearing Corp., the Thailand International Fund, Ltd., Fidelity Investments Life Insurance Company, and Empire Fidelity Investments Life Insurance Company. Audit Committee Chair and Investment Committee Chair of the Vincent Memorial Hospital Foundation (non-profit organization). Mr. Ebsworth is a CFA® charterholder. | N/A |
Jane A. Freeman
(Born 1953) | Trustee,
since 2015;
Chair Liaison,
since 2018 | Retired. From 2012 to 2014 and 1999 to 2008, Chief Financial Officer of Scientific Learning Corporation. From 2008 to 2012, Ms. Freeman provided consulting services related to strategic business projects. Prior to 1999, Portfolio Manager at Rockefeller & Co. and Scudder, Stevens & Clark. Board member of the Harding Loevner Funds from 1996 to 2014, serving as both Lead Independent Director and chair of the Audit Committee. Board member of the Russell Exchange Traded Funds Trust from 2011 to 2012 and the chair of the Audit Committee. Ms. Freeman is also an inactive Chartered Financial Analyst. | N/A |
Isaiah Harris, Jr.
(Born 1952) | Trustee,
since 2009; Audit
Committee
Chair,
since 2019 | Retired. Member of the Advisory Board of CEF of East Central Florida. Chairman of the Board of CIGNA Corporation from 2009 to 2021, and Director from 2005 to 2008. From 2003 to 2011, Director of Deluxe Corporation. Prior thereto, President and CEO of BellSouth Advertising and Publishing Corp. from 2005 to 2007, President and CEO of BellSouth Enterprises from 2004 to 2005 and President of BellSouth Consumer Services from 2000 to 2003. Emeritus member of the Iowa State University Foundation Board of Governors. Emeritus Member of the Advisory Board of Iowa State University School of Business. Advisory Board Member, Palm Harbor Academy (private school). Advisory Board Member, Fellowship of Christian Athletes. Mr. Harris is a certified public accountant (inactive status). | N/A |
David F. Larcker
(Born 1950) | Trustee,
since 2009 | Distinguished Visiting Fellow at the Hoover Institution since 2022. James Irvin Miller Professor of Accounting at the Graduate School of Business (Emeritus), Stanford University, Director of the Corporate Governance Research Initiative and Senior Faculty of The Rock Center for Corporate Governance since 2006. From 2005 to 2008, Professor of Accounting at the Graduate School of Business, Stanford University. Prior thereto, Ernst & Young Professor of Accounting at The Wharton School, University of Pennsylvania from 1985 to 2005. | N/A |
28 | Allspring Wisconsin Tax-Free Fund
Other information (unaudited)
Name and
year of birth | Position held and
length of service* | Principal occupations during past five years or longer | Current other
public company or
investment
company
directorships |
Olivia S. Mitchell
(Born 1953) | Trustee,
since 2006;
Nominating and
Governance
Committee Chair,
since 2018 | International Foundation of Employee Benefit Plans Professor since 1993, Wharton School of the University of Pennsylvania. Director of Wharton’s Pension Research Council and Boettner Center on Pensions & Retirement Research, and Research Associate at the National Bureau of Economic Research. Previously taught at Cornell University from 1978 to 1993. | N/A |
Timothy J. Penny
(Born 1951) | Trustee,
since 1996;
Chair,
since 2018 | President and Chief Executive Officer of Southern Minnesota Initiative Foundation, a non-profit organization, since 2007. Vice Chair of the Economic Club of Minnesota, since 2007. Co-Chair of the Committee for a Responsible Federal Budget, since 1995. Member of the Board of Trustees of NorthStar Education Finance, Inc., a non-profit organization, from 2007-2022. Senior Fellow of the University of Minnesota Humphrey Institute from 1995 to 2017. | N/A |
James G. Polisson
(Born 1959) | Trustee,
since 2018 | Retired. Chief Marketing Officer, Source (ETF) UK Services, Ltd, from 2015 to 2017. From 2012 to 2015, Principal of The Polisson Group, LLC, a management consulting, corporate advisory and principal investing company. Chief Executive Officer and Managing Director at Russell Investments, Global Exchange Traded Funds from 2010 to 2012. Managing Director of Barclays Global Investors from 1998 to 2010 and Global Chief Marketing Officer for iShares and Barclays Global Investors from 2000 to 2010. Trustee of the San Francisco Mechanics’ Institute, a non-profit organization, from 2013 to 2015. Board member of the Russell Exchange Traded Fund Trust from 2011 to 2012. Director of Barclays Global Investors Holdings Deutschland GmbH from 2006 to 2009. Mr. Polisson is an attorney and has a retired status with the Massachusetts and District of Columbia Bar Associations. | N/A |
Pamela Wheelock
(Born 1959) | Trustee,
since January
2020; previously
Trustee from
January 2018 to
July 2019 | Retired. Executive and Senior Financial leadership positions in the public, private and nonprofit sectors. Interim President and CEO, McKnight Foundation, 2020. Interim Commissioner, Minnesota Department of Human Services, 2019. Chief Operating Officer, Twin Cities Habitat for Humanity, 2017-2019. Vice President for University Services, University of Minnesota, 2012-2016. Interim President and CEO, Blue Cross and Blue Shield of Minnesota, 2011-2012. Executive Vice-President and Chief Financial Officer, Minnesota Wild, 2002-2008. Commissioner, Minnesota Department of Finance, 1999-2002. Chair of the Board of Directors of Destination Medical Center Corporation. Board member of the Minnesota Wild Foundation. | N/A |
* Length of service dates reflect the Trustee’s commencement of service with the Trust’s predecessor entities, where applicable.
Allspring Wisconsin Tax-Free Fund | 29
Other information (unaudited)
Officers2
Name and
year of birth | Position held and
length of service | Principal occupations during past five years or longer |
Andrew Owen
(Born 1960) | President,
since 2017 | President and Chief Executive Officer of Allspring Funds Management, LLC since 2017 and Head of Global Fund Governance of Allspring Global Investments since 2022. Prior thereto, co-president of Galliard Capital Management, LLC, an affiliate of Allspring Funds Management, LLC, from 2019 to 2022 and Head of Affiliated Managers, Allspring Global Investments, from 2014 to 2019 and Executive Vice President responsible for marketing, investments and product development for Allspring Funds Management, LLC, from 2009 to 2014. |
Jeremy DePalma
(Born 1974) | Treasurer,
since 2012
(for certain funds in
the Fund Complex);
since 2021 (for
the remaining funds in the
Fund Complex) | Senior Vice President of Allspring Funds Management, LLC since 2009. Senior Vice President of Evergreen Investment Management Company, LLC from 2008 to 2010 and head of the Fund Reporting and Control Team within Fund Administration from 2005 to 2010. |
Christopher Baker
(Born 1976) | Chief Compliance Officer, since 2022 | Global Chief Compliance Officer for Allspring Global Investments since 2022. Prior thereto, Chief Compliance Officer for State Street Global Advisors from 2018 to 2021. Senior Compliance Officer for the State Street divisions of Alternative Investment Solutions, Sector Solutions, and Global Marketing from 2015 to 2018. From 2010 to 2015 Vice President, Global Head of Investment and Marketing Compliance for State Street Global Advisors. |
Matthew Prasse
(Born 1983) | Chief Legal Officer, since 2022; Secretary, since 2021 | Senior Counsel of the Allspring Legal Department since 2021. Senior Counsel of the Wells Fargo Legal Department from 2018 to 2021. Previously, Counsel for Barings LLC from 2015 to 2018. Prior to joining Barings, Associate at Morgan, Lewis & Bockius LLP from 2008 to 2015. |
1 The Statement of Additional Information includes additional information about the Trustees and is available, without charge, upon request, by calling 1-800-222-8222 or by visiting the website at allspringglobal.com.
2 For those Officers with tenures at Allspring Global Investments and/or Allspring Funds Management, LLC that began prior to 2021, such tenures include years of service during which these businesses/entities were known as Wells Fargo Asset Management and Wells Fargo Funds Management, LLC, respectively.
30 | Allspring Wisconsin Tax-Free Fund
For more information
More information about Allspring Funds is available free upon request. To obtain literature, please write, visit the Fund's website, or call:
Allspring Funds
P.O. Box 219967
Kansas City, MO 64121-9967
Website: allspringglobal.com
Individual investors: 1-800-222-8222
Retail investment professionals: 1-888-877-9275
Institutional investment professionals: 1-800-260-5969
This report and the financial statements contained herein are submitted for the general information of the shareholders of the Fund. If this report is used for promotional purposes, distribution of the report must be accompanied or preceded by a current prospectus. Before investing, please consider the investment objectives, risks, charges, and expenses of the investment. For a current prospectus and, if available, a summary prospectus, containing this information, call
1-800-222-8222 or visit the Fund's website at allspringglobal.com. Read the prospectus carefully before you invest or send money.
Allspring Global InvestmentsTM is the trade name for the asset management firms of Allspring Global Investments Holdings, LLC, a holding company indirectly owned by certain private funds of GTCR LLC and Reverence Capital Partners, L.P. These firms include but are not limited to Allspring Global Investments, LLC, and Allspring Funds Management, LLC. Certain products managed by Allspring entities are distributed by Allspring Funds Distributor, LLC (a broker-dealer and Member FINRA/SIPC).
This material is for general informational and educational purposes only and is NOT intended to provide investment advice or a recommendation of any kind - including a recommendation for any specific investment, strategy, or plan.
© 2023 Allspring Global Investments Holdings, LLC. All rights reserved.
ALL-01092023-6zcthmuw 02-23
SAR3328 12-22
Semi-Annual Report
December 31, 2022
Allspring
Alternative Risk Premia Fund
The views expressed and any forward-looking statements are as of December 31, 2022, unless otherwise noted, and are those of the Fund's portfolio managers and/or Allspring Global Investments. Discussions of individual securities or the markets generally are not intended as individual recommendations. Future events or results may vary significantly from those expressed in any forward-looking statements. The views expressed are subject to change at any time in response to changing circumstances in the market. Allspring Global Investments disclaims any obligation to publicly update or revise any views expressed or forward-looking statements.
Allspring Alternative Risk Premia Fund | 1
Letter to shareholders (unaudited)
Andrew Owen
President
Allspring Funds
Dear Shareholder:
We are pleased to offer you this semi-annual report for the Allspring Alternative Risk Premia Fund for the six-month period that ended December 31, 2022. Globally, stocks and bonds experienced heightened volatility and generally negative returns through the challenging period. Earlier tailwinds provided by global stimulus programs, vaccination rollouts, and recovering consumer and corporate sentiment were wiped away by the highest rate of inflation in four decades, the impact of ongoing aggressive central bank rate hikes and the prospect of more rate hikes. Compounding these concerns were the global reverberations of the Russia-Ukraine war and the impact of China’s strict COVID-19 lockdowns.
For the six-month period, stocks and bonds had mixed results, with emerging market equities trailing those of developed markets and both U.S. and non-U.S. bonds fighting an uphill battle in the face of sustained interest rate increases. For the period, U.S. stocks, based on the S&P 500 Index,1 gained 2.31%. International stocks, as measured by the MSCI ACWI ex USA Index (Net),2 returned 2.96%, while the MSCI EM Index (Net) (USD)3 declined 2.99%. Among bond indexes, the Bloomberg U.S. Aggregate Bond Index4 returned -2.97%, the Bloomberg Global Aggregate ex-USD Index (unhedged)5 returned -2.65%, the Bloomberg Municipal Bond Index6 gained 0.50%, and the ICE BofA U.S. High Yield Index7 returned 3.33%.
Persistent inflation and economic fallout from the Russia-Ukraine war drove markets.
Markets rebounded from earlier losses in July, led by U.S. stocks. While evidence pointed to an economic slowdown after two consecutive quarters of declining gross domestic product (economic contraction), the U.S. labor market remained surprisingly strong: July nonfarm payrolls grew by more than 500,000 and U.S. unemployment dipped to 3.5%. Meanwhile, crude oil and retail gasoline prices, major contributors to recent overall inflation, fell substantially from earlier highs. And while U.S. home prices rose, sales fell as houses became less affordable with mortgage rates at a 13-year high. The Federal Reserve (Fed) raised the federal funds rate another 0.75% in July—to a range of 2.25% to 2.50%—and forecasts pointed to further rate hikes.
| 1 | The S&P 500 Index consists of 500 stocks chosen for market size, liquidity, and industry group representation. It is a market-value-weighted index with each stock's weight in the index proportionate to its market value. You cannot invest directly in an index. |
| 2 | The Morgan Stanley Capital International (MSCI) All Country World Index (ACWI) ex USA Index (Net) is a free-float-adjusted market-capitalization-weighted index that is designed to measure the equity market performance of developed and emerging markets, excluding the U.S. Source: MSCI. MSCI makes no express or implied warranties or representations and shall have no liability whatsoever with respect to any MSCI data contained herein. The MSCI data may not be further redistributed or used as a basis for other indexes or any securities or financial products. This report is not approved, reviewed, or produced by MSCI. You cannot invest directly in an index. |
| 3 | The MSCI Emerging Markets (EM) Index (Net) (USD) is a free-float-adjusted market-capitalization-weighted index that is designed to measure equity market performance of emerging markets. You cannot invest directly in an index. |
| 4 | The Bloomberg U.S. Aggregate Bond Index is a broad-based benchmark that measures the investment-grade, U.S.-dollar-denominated, fixed-rate taxable bond market, including Treasuries, government-related and corporate securities, mortgage-backed securities (agency fixed-rate and hybrid adjustable-rate mortgage pass-throughs), asset-backed securities, and commercial mortgage-backed securities. You cannot invest directly in an index. |
| 5 | The Bloomberg Global Aggregate ex-USD Index (unhedged) is an unmanaged index that provides a broad-based measure of the global investment-grade fixed-income markets excluding the U.S.-dollar-denominated debt market. You cannot invest directly in an index. |
| 6 | The Bloomberg Municipal Bond Index is an unmanaged index composed of long-term tax-exempt bonds with a minimum credit rating of Baa. You cannot invest directly in an index. |
| 7 | The ICE BofA U.S. High Yield Index is a market-capitalization-weighted index of domestic and Yankee high-yield bonds. The index tracks the performance of high-yield securities traded in the U.S. bond market. You cannot invest directly in an index. Copyright 2023. ICE Data Indices, LLC. All rights reserved. |
2 | Allspring Alternative Risk Premia Fund
Letter to shareholders (unaudited)
August was yet another broadly challenging month for financial markets, with more red ink flowing. High inflation persisted, cresting 9% in the eurozone on an annual basis and remaining above 8% in the U.S. despite the Fed’s aggressive monetary policy and a major drop in global crude oil and gasoline prices from their June peak. One positive note was the resilience of the U.S. job market. However, the Fed’s job was clearly not complete. One longer-term bright spot was the U.S. Congress’s passage of the Inflation Reduction Act. Its primary stated goals include: to reduce inflation (though not immediately) by curbing the deficit, capping health care spending by seniors, and investing in domestic sources of clean energy.
The market misery continued in September. There was nowhere to hide as all asset classes suffered major losses at the hands of persistent inflation. Central banks kept up their battle against rapidly rising prices with more rate hikes. The strength of the U.S. dollar made things even more difficult for investors holding assets in other currencies. U.S. mortgage rates jumped to near 7% on 30-year fixed-rate mortgages; the decreased housing affordability began to cool demand somewhat. The U.K. experienced a sharp sell-off of government bonds and the British pound in September as investors panicked in response to a new government budget that was seen as financially unsound. The market meltdown forced the Bank of England to step in and buy long-dated government bonds.
Equities had a reprieve in October after two months of sharp declines. Value stocks and small caps fared best. Globally, developed markets outpaced emerging market equities, which were hurt by weakness among Chinese stocks. Central banks continued to try to curtail high inflation with aggressive interest rate hikes. Geopolitical risks persisted, including the ongoing Russia-Ukraine war and economic, financial market, and political turmoil in the U.K., which led to a second prime ministerial change in six weeks, as Rishi Sunak replaced Liz Truss in late October. Concerns over Europe’s energy crisis eased thanks to unseasonably warm weather and plentiful gas on hand. The U.S. labor market continued its resilience against rising prices, as unemployment stood at 3.7%, near a record low.
Stocks and bonds rallied in November, with emerging market equities gaining nearly 15% and developed market equities returning 7%. The S&P 500 Index rose 5.6% in November. Bonds also had positive monthly returns. Economic news was encouraging, driven by U.S. labor market strength. Although central banks kept raising rates, expectations grew regarding an impending easing in the pace of rate hikes and a possible end to central bank monetary tightening in 2023. Although inflation remained at record highs in the eurozone, with a 10.6% annual increase in October, Germany’s producer prices decreased 4.2% annually, signaling a possible decline in inflationary pressures. Meanwhile, U.S. inflation continued to moderate, with a 7.1% annual price rise in November and a monthly price increase of just 0.1%. China’s economic data remained weak, reflecting its zero-COVID-19 policy.
Financial markets cooled in December, with U.S. equities posting negative overall results in response to a weakening U.S. dollar. Fixed income securities ended one of their worst years ever with flat overall monthly returns as markets weighed the hopes for an end to the monetary tightening cycle with the reality that central banks had not completed their jobs yet. U.S. Consumer Price Index (CPI)1 data showed a strong consistent trend downward, which brought down the 12-month CPI to 6.5% in December from 9.1% in June. Other countries and regions reported still-high but declining inflation rates as the year winded down.
“ The market misery continued in September. There was nowhere to hide as all asset classes suffered major losses at the hands of persistent inflation.”
| 1 | The Consumer Price Index (CPI) is a measure of the average change over time in the prices paid by urban consumers for a market basket of consumer goods and services. You cannot invest directly in an index. |
Allspring Alternative Risk Premia Fund | 3
Letter to shareholders (unaudited)
Don’t let short-term uncertainty derail long-term investment goals.
Periods of investment uncertainty can present challenges, but experience has taught us that maintaining long-term investment goals can be an effective way to plan for the future. To help you create a sound strategy based on your personal goals and risk tolerance, Allspring Funds offers more than 100 mutual funds spanning a wide range of asset classes and investment styles. Although diversification cannot guarantee an investment profit or prevent losses, we believe it can be an effective way to manage investment risk and potentially smooth out overall portfolio performance. We encourage investors to know their investments and to understand that appropriate levels of risk-taking may unlock opportunities.
Thank you for choosing to invest with Allspring Funds. We appreciate your confidence in us and remain committed to helping you meet your financial needs.
Sincerely,
Andrew Owen
President
Allspring Funds
For further information about your fund, contact your investment professional, visit our website at allspringglobal.com, or call us directly at 1-800-222-8222.
4 | Allspring Alternative Risk Premia Fund
This page is intentionally left blank.
Performance highlights (unaudited)
| Investment objective | The Fund seeks long-term capital appreciation. |
| Manager | Allspring Funds Management, LLC |
| Subadvisers | Allspring Global Investments, LLC |
| | Allspring Global Investments (UK) Limited |
| Portfolio managers | Petros N. Bocray, CFA®‡, FRM, Eddie Cheng, CFA®‡, Monisha Jayakumar |
| Average annual total returns (%) as of December 31, 2022 |
| | | | | Expense ratios1 (%) |
| | Inception date | 1 year | Since inception | Gross | Net 2 |
| Class R6 (WRPRX) | 1-29-2019 | 10.39 | -1.49 | 1.18 | 0.65 |
| Institutional Class (WRPIX) | 1-29-2019 | 10.40 | -1.58 | 1.28 | 0.75 |
| ICE BofA 3-Month U.S. Treasury Bill Index3 | – | 1.47 | 1.09 * | – | – |
Figures quoted represent past performance, which is no guarantee of future results, and do not reflect taxes that a shareholder may pay on an investment in a fund. Investment return and principal value of an investment will fluctuate so that an investor’s shares, when sold, may be worth more or less than their original cost. Current performance may be lower or higher than the performance data quoted, which assumes the reinvestment of dividends and capital gains. Current month-end performance is available on the Fund's website, allspringglobal.com..
Index returns do not include transaction costs associated with buying and selling securities, any mutual fund fees or expenses, or any taxes. It is not possible to invest directly in an index.
Class R6 and Institutional Class shares are sold without a front-end sales charge or contingent deferred sales charge.
| * | Based on the inception date of the oldest Fund class. |
| 1 | Reflects the expense ratios as stated in the most recent prospectuses, which include the impact of 0.03% in acquired fund fees and expenses. The expense ratios shown are subject to change and may differ from the annualized expense ratios shown in the financial highlights of this report, which do not include acquired fund fees and expenses. |
| 2 | The manager has contractually committed through October 31, 2023, to waive fees and/or reimburse expenses to the extent necessary to cap total annual fund operating expenses after fee waivers at 0.62% for Class R6 and 0.72% for Institutional Class. Brokerage commissions, stamp duty fees, interest, taxes, acquired fund fees and expenses (if any), and extraordinary expenses are excluded from the expense caps. Prior to or after the commitment expiration date, the caps may be increased or the commitment to maintain the caps may be terminated only with the approval of the Board of Trustees. Without these caps, the Fund’s returns would have been lower. The expense ratio paid by an investor is the net expense ratio (the total annual fund operating expenses after fee waivers) as stated in the prospectuses. |
| 3 | The ICE BofA 3-Month U.S. Treasury Bill Index is an unmanaged index that is comprised of a single U.S. Treasury issue with approximately three months to final maturity, purchased at the beginning of each month and held for one full month. You cannot invest directly in an index. Copyright 2023. ICE Data Indices, LLC. All rights reserved. |
The investment techniques employed by the Fund create leverage. As a result, the sum of the Fund's investment exposures will typically exceed the amount of the Fund's net assets. These exposures may vary over time. We expect gross notional exposure of the Fund to be in a range of 400% to 1200% of the net asset value of the Fund under normal market conditions. Leverage may be significantly different (higher or lower) as deemed necessary by the investment manager. We expect net notional exposure of the Fund to be in a range of -200% to 200% of the net asset value of the Fund under normal market conditions.
| ‡ | CFA® and Chartered Financial Analyst® are trademarks owned by CFA Institute. |
6 | Allspring Alternative Risk Premia Fund
Performance highlights (unaudited)
Alternative risk premia investment risk is the Fund's ability to achieve its investment objective depending largely upon the portfolio managers' successful evaluation of the risks, potential returns, and correlation properties with respect to the various risk premia in which the Fund invests. Stock values fluctuate in response to the activities of individual companies and general market and economic conditions. Bond values fluctuate in response to the financial condition of individual issuers, general market and economic conditions, and changes in interest rates. Changes in market conditions and government policies may lead to periods of heightened volatility in the bond market and reduced liquidity for certain bonds held by the Fund. In general, when interest rates rise, bond values fall and investors may lose principal value. Interest rate changes and their impact on the Fund and its share price can be sudden and unpredictable. The use of leverage results in certain risks, including, among others, the likelihood of greater volatility of net asset value. Short selling is generally considered speculative, has the potential for unlimited loss, and may involve leverage. Foreign investments are especially volatile and can rise or fall dramatically due to differences in the political and economic conditions of the host country. The use of derivatives may reduce returns and/or increase volatility. Certain investment strategies tend to increase the total risk of an investment (relative to the broader market). This fund is exposed to subsidiary risk and smaller-company securities risk. Consult the Fund’s prospectus for additional information on these and other risks.
| Net asset exposure as of December 31, 2022 |
| | % of net assets |
| | Long
positions | Short
positions |
| Stocks | 32 | 23 |
| Bond futures | 19 | 29 |
| Currency forwards | 48 | 69 |
| Equity index futures | 11 | 3 |
| Commodity futures | 13 | 13 |
| 1 | Figures are subject to change and may have changed since the date specified. |
Allspring Alternative Risk Premia Fund | 7
Consolidated fund expenses (unaudited)
As a shareholder of the Fund, you incur including management fees and other Fund expenses. This example is intended to help you understand your ongoing costs (in dollars) of investing in the Fund and to compare these costs with the ongoing costs of investing in other mutual funds.
The example is based on an investment of $1,000 invested at the beginning of the six-month period and held for the entire period from July 1, 2022 to December 31, 2022.
Actual expenses
The “Actual” line of the table below provides information about actual account values and actual expenses. You may use the information in this line, together with the amount you invested, to estimate the expenses that you paid over the period. Simply divide your account value by $1,000 (for example, an $8,600 account value divided by $1,000 = 8.6), then multiply the result by the number in the “Actual” line under the heading entitled “Expenses paid during period” for your applicable class of shares to estimate the expenses you paid on your account during this period.
Hypothetical example for comparison purposes
The “Hypothetical” line of the table below provides information about hypothetical account values and hypothetical expenses based on the Fund’s actual expense ratio and an assumed rate of return of 5% per year before expenses, which is not the Fund’s actual return. The hypothetical account values and expenses may not be used to estimate the actual ending account balance or expenses you paid for the period. You may use this information to compare the ongoing costs of investing in the Fund and other funds. To do so, compare this 5% hypothetical example with the 5% hypothetical examples that appear in the shareholder reports of the other funds.
Please note that the expenses shown in the table are meant to highlight your ongoing costs only. Therefore, the “Hypothetical” line of the table is useful in comparing ongoing costs only, and will not help you determine the relative total costs of owning different funds.
| | Beginning
account value
7-1-2022 | Ending
account value
12-31-2022 | Consolidated
expenses
paid during
the period1 | Annualized net
expense ratio |
| Class R6 | | | | |
| Actual | $1,000.00 | $1,021.64 | $3.16 | 0.62% |
| Hypothetical (5% return before expenses) | $1,000.00 | $1,022.08 | $3.16 | 0.62% |
| Institutional Class | | | | |
| Actual | $1,000.00 | $1,022.71 | $3.67 | 0.72% |
| Hypothetical (5% return before expenses) | $1,000.00 | $1,021.58 | $3.67 | 0.72% |
1 Expenses paid is equal to the annualized net expense ratio of each class multiplied by the average account value over the period, multiplied by 184 divided by 365 (to reflect the one-half-year period).
8 | Allspring Alternative Risk Premia Fund
Consolidated portfolio of investments—December 31, 2022 (unaudited)
| | | Yield | | Shares | Value |
| Short-term investments: 79.34% | | | | | |
| Investment companies: 20.03% | | | | | |
| Allspring Government Money Market Fund Select Class ♠∞* | | 4.09% | | 7,815,114 | $ 7,815,114 |
| | | | Maturity
date | Principal | |
| U.S. Treasury securities: 59.31% | | | | | |
| U.S. Treasury Bill ☼ | | 2.10 | 1-12-2023 | $14,900,000 | 14,887,065 |
| U.S. Treasury Bill ☼# | | 2.64 | 6-15-2023 | 2,750,000 | 2,694,563 |
| U.S. Treasury Bill ☼ | | 4.58 | 6-29-2023 | 3,000,000 | 2,933,588 |
| U.S. Treasury Bill ☼# | | 4.68 | 12-28-2023 | 2,750,000 | 2,626,320 |
| | | | | | 23,141,536 |
| Total Short-term investments (Cost $30,980,871) | | | | | 30,956,650 |
| Total investments in securities (Cost $30,980,871) | 79.34% | | | | 30,956,650 |
| Other assets and liabilities, net | 20.66 | | | | 8,063,445 |
| Total net assets | 100.00% | | | | $39,020,095 |
| ♠ | The issuer of the security is an affiliated person of the Fund as defined in the Investment Company Act of 1940. |
| * | A portion of the holding represents an investment held in Alt Risk Premia Special Investments (Cayman) Ltd., the consolidated entity. |
| ∞ | The rate represents the 7-day annualized yield at period end. |
| ☼ | Zero coupon security. The rate represents the current yield to maturity. |
| # | All or a portion of this security is segregated as collateral for investments in derivative instruments. |
Investments in affiliates
An affiliated investment is an investment in which the Fund owns at least 5% of the outstanding voting shares of the issuer or as a result of other relationships, such as the Fund and the issuer having the same investment manager. Transactions with issuers that were affiliates of the Fund at the end of the period were as follows:
| | Value,
beginning of
period | Purchases | Sales
proceeds | Net
realized
gains
(losses) | Net
change in
unrealized
gains
(losses) | Value,
end of
period | Shares,
end
of period | Income
from
affiliated
securities |
| Short-term investments | | | | | | | |
| Allspring Government Money Market Fund Select Class | $26,833,161 | $31,403,860 | $(50,421,907) | $0 | $0 | $7,815,114 | 7,815,114 | $228,547 |
The accompanying notes are an integral part of these consolidated financial statements.
Allspring Alternative Risk Premia Fund | 9
Consolidated portfolio of investments—December 31, 2022 (unaudited)
Forward foreign currency contracts
Currency to be
received | Currency to be
delivered | Counterparty | Settlement
date | Unrealized
gains | | Unrealized
losses |
| 3,861,000 SEK | 379,965 USD | Goldman Sachs International | 1-18-2023 | $ 0 | | $ (9,656) |
| 5,800,000 EUR | 6,200,502 USD | Goldman Sachs International | 1-18-2023 | 14,005 | | 0 |
| 6,031,000 ZAR | 350,459 USD | Goldman Sachs International | 1-18-2023 | 4,066 | | 0 |
| 7,817,000 PLN | 1,771,811 USD | Goldman Sachs International | 1-18-2023 | 10,469 | | 0 |
| 293,479,000 JPY | 2,187,783 USD | Goldman Sachs International | 1-18-2023 | 52,281 | | 0 |
| 168,000 GBP | 208,856 USD | Goldman Sachs International | 1-18-2023 | 0 | | (5,677) |
| 1,160,465,000 CLP | 1,333,010 USD | Goldman Sachs International | 1-18-2023 | 33,324 | | 0 |
| 1,164,000 NZD | 751,754 USD | Goldman Sachs International | 1-18-2023 | 0 | | (12,596) |
| 36,909,000 MXN | 1,862,933 USD | Goldman Sachs International | 1-18-2023 | 26,423 | | 0 |
| 614,292,000 HUF | 1,602,306 USD | Goldman Sachs International | 1-18-2023 | 37,507 | | 0 |
| 6,014,000 BRL | 1,123,995 USD | Goldman Sachs International | 1-18-2023 | 11,899 | | 0 |
| 19,244,000 CZK | 844,858 USD | Goldman Sachs International | 1-18-2023 | 5,976 | | 0 |
| 5,841,570 USD | 8,494,000 AUD | Goldman Sachs International | 1-18-2023 | 55,158 | | 0 |
| 5,624,116 USD | 7,623,000 CAD | Goldman Sachs International | 1-18-2023 | 0 | | (6,278) |
| 1,509,673 USD | 23,482,962,000 IDR | Goldman Sachs International | 1-18-2023 | 1,426 | | 0 |
| 7,560,454 USD | 6,950,000 CHF | Goldman Sachs International | 1-18-2023 | 32,827 | | 0 |
| 5,943,854 USD | 57,821,000 NOK | Goldman Sachs International | 1-18-2023 | 38,453 | | 0 |
| 364,426 USD | 30,118,000 INR | Goldman Sachs International | 1-18-2023 | 653 | | 0 |
| 160,674 USD | 208,121,000 KRW | Goldman Sachs International | 1-18-2023 | 0 | | (3,953) |
| | | | | $324,467 | | $(38,160) |
The accompanying notes are an integral part of these consolidated financial statements.
10 | Allspring Alternative Risk Premia Fund
Consolidated portfolio of investments—December 31, 2022 (unaudited)
Futures contracts
| Description | Number of
contracts | Expiration
date | Notional
cost | Notional
value | Unrealized
gains | | Unrealized
losses |
| Long | | | | | | | |
| London Metal Exchange Aluminum Futures** | 4 | 1-16-2023 | $ 247,819 | $ 234,951 | $ 0 | | $ (12,868) |
| London Metal Exchange Nickel Futures** | 1 | 1-16-2023 | 165,161 | 179,406 | 14,245 | | 0 |
| CAC 40 Index | 8 | 1-20-2023 | 569,923 | 554,107 | 0 | | (15,816) |
| Brent Crude Oil Futures** | 2 | 1-31-2023 | 177,145 | 171,820 | 0 | | (5,325) |
| NY Harbor Ultra-Low Sulfur Diesel Futures** | 2 | 1-31-2023 | 263,296 | 276,780 | 13,484 | | 0 |
| Low Sugar Gas Oil Futures** | 6 | 2-10-2023 | 532,365 | 543,600 | 11,235 | | 0 |
| Sugar #11 World Futures** | 33 | 2-28-2023 | 699,379 | 740,678 | 41,299 | | 0 |
| Cotton #2 Futures** | 19 | 3-9-2023 | 800,744 | 792,015 | 0 | | (8,729) |
| TOPIX Index | 4 | 3-9-2023 | 592,985 | 576,501 | 0 | | (16,484) |
| Corn Futures** | 9 | 3-14-2023 | 298,147 | 305,325 | 7,178 | | 0 |
| KC Hard Red Winter Wheat Futures** | 2 | 3-14-2023 | 89,320 | 88,800 | 0 | | (520) |
| Soybean Futures** | 10 | 3-14-2023 | 741,913 | 762,000 | 20,087 | | 0 |
| Soybean Meal Futures** | 23 | 3-14-2023 | 1,034,168 | 1,083,300 | 49,132 | | 0 |
| Soybean Oil Futures** | 6 | 3-14-2023 | 228,119 | 230,652 | 2,533 | | 0 |
| S&P/TSX 60 Index | 3 | 3-16-2023 | 536,937 | 518,420 | 0 | | (18,517) |
| SPI 200 Index | 5 | 3-16-2023 | 610,308 | 595,063 | 0 | | (15,245) |
| DAX Index | 1 | 3-17-2023 | 385,566 | 374,336 | 0 | | (11,230) |
| E-Mini S&P 500 Index | 3 | 3-17-2023 | 595,336 | 579,150 | 0 | | (16,186) |
| Euro STOXX 50 Index | 13 | 3-17-2023 | 546,360 | 526,715 | 0 | | (19,645) |
| FTSE 100 Index | 7 | 3-17-2023 | 630,481 | 631,822 | 1,341 | | 0 |
| 10-Year Canadian Treasury Bonds | 58 | 3-22-2023 | 5,430,041 | 5,249,557 | 0 | | (180,484) |
| 10-Year U.S. Treasury Notes | 19 | 3-22-2023 | 2,139,478 | 2,133,641 | 0 | | (5,837) |
| Silver Futures** | 2 | 3-29-2023 | 220,957 | 240,400 | 19,443 | | 0 |
| Short | | | | | | | |
| London Metal Exchange Aluminum Futures** | (18) | 1-16-2023 | (1,015,903) | (1,057,280) | 0 | | (41,377) |
| London Metal Exchange Lead Futures** | (3) | 1-16-2023 | (162,586) | (174,188) | 0 | | (11,602) |
| London Metal Exchange Nickel Futures** | (1) | 1-16-2023 | (143,583) | (179,406) | 0 | | (35,823) |
| London Metal Exchange Zinc Futures** | (7) | 1-16-2023 | (505,866) | (523,294) | 0 | | (17,428) |
| WTI Crude Oil Futures** | (6) | 1-20-2023 | (443,020) | (481,560) | 0 | | (38,540) |
| Gasoline RBOB Futures** | (1) | 1-31-2023 | (92,036) | (104,089) | 0 | | (12,053) |
| Lean Hogs Futures** | (11) | 2-14-2023 | (389,008) | (385,880) | 3,128 | | 0 |
| Gold 100 Ounces Futures** | (2) | 2-24-2023 | (362,533) | (365,240) | 0 | | (2,707) |
| Natural Gas Futures** | (2) | 2-24-2023 | (116,894) | (82,080) | 34,814 | | 0 |
| Live Cattle Futures** | (19) | 2-28-2023 | (1,161,024) | (1,200,040) | 0 | | (39,016) |
| Euro-Bund Futures | (23) | 3-8-2023 | (3,482,996) | (3,272,782) | 210,214 | | 0 |
| London Metal Exchange Copper Futures** | (1) | 3-13-2023 | (208,627) | (209,388) | 0 | | (761) |
| Wheat Futures** | (3) | 3-14-2023 | (118,376) | (118,800) | 0 | | (424) |
| 10-Year Australian Treasury Bonds | (27) | 3-15-2023 | (2,252,802) | (2,126,567) | 126,235 | | 0 |
| Cocoa Futures** | (7) | 3-16-2023 | (176,093) | (182,000) | 0 | | (5,907) |
| E-Mini Nasdaq 100 Index | (2) | 3-17-2023 | (467,433) | (440,890) | 26,543 | | 0 |
| E-Mini Russell 2000 Index | (4) | 3-17-2023 | (362,339) | (354,180) | 8,159 | | 0 |
| MSCI Emerging Markets Index | (10) | 3-17-2023 | (485,271) | (479,700) | 5,571 | | 0 |
| Coffee C Futures** | (8) | 3-21-2023 | (498,775) | (501,900) | 0 | | (3,125) |
| Long Gilt Bonds | (50) | 3-29-2023 | (6,305,786) | (6,038,706) | 267,080 | | 0 |
| | | | | | $861,721 | | $(535,649) |
| ** | Represents an investment held in Alt Risk Premia Special Investments (Cayman) Ltd., the consolidated entity. |
The accompanying notes are an integral part of these consolidated financial statements.
Allspring Alternative Risk Premia Fund | 11
Consolidated portfolio of investments—December 31, 2022 (unaudited)
OTC swap contracts
| Reference asset/index | Counterparty | Payment
frequency | Maturity
date | Notional
amount | Value | Unrealized
gains | Unrealized
losses |
| Synthetic total return swap† | Goldman Sachs International | Monthly | 2-1-2024 | $3,435,609 | $3,643,046 | $207,437 | $0 |
| † | The Fund receives or pays the difference between the total return on a portfolio of long and short positions underlying the total return swap and the return on a specified benchmark (either the Federal Funds Effective Rate or the One Month LIBOR), plus or minus a spread in a typical range of 20-75 basis points (bps; 100 bps equal 1.00%). The spread is determined based upon the country and/or currency of the individual underlying positions. Certain short positions may be subject to higher market rates. |
The following table represents components of the synthetic total return swap basket as of the end of the period which are in excess of 1% of the notional value of the synthetic total return swap basket.
| Reference asset | | Shares | Value | % of swap
basket value |
| Long positions | | | | |
| Common stocks | | | | |
| Communication services | | | | |
| Diversified telecommunication services | | | | |
| Spark New Zealand Limited | | 15,240 | $ 52,250 | 1.43% |
| Entertainment | | | | |
| Toho Company Limited Tokyo | | 1,100 | 42,579 | 1.17 |
| Ubisoft Entertainment SA | | 2,112 | 59,707 | 1.64 |
| Interactive media & services | | | | |
| Auto Trader Group plc | | 14,024 | 87,416 | 2.40 |
| Kakaku.com Incorporated | | 3,300 | 53,106 | 1.46 |
| Wireless telecommunication services | | | | |
| Tele2 AB Class B | | 7,634 | 62,258 | 1.71 |
| | | | 357,316 | |
| Consumer discretionary | | | | |
| Automobiles | | | | |
| Isuzu Motors Limited | | 4,100 | 48,329 | 1.33 |
| Mazda Motor Corporation | | 11,700 | 89,596 | 2.46 |
| Diversified consumer services | | | | |
| Exor NV | | 779 | 56,954 | 1.56 |
| Hotels, restaurants & leisure | | | | |
| Aramark | | 1,984 | 82,019 | 2.25 |
| Domino's Pizza Enterprises Limited | | 1,743 | 78,620 | 2.16 |
| Domino's Pizza Incorporated | | 136 | 47,110 | 1.29 |
| Household durables | | | | |
| Iida Group Holdings Company Limited | | 2,900 | 44,216 | 1.21 |
| Internet & direct marketing retail | | | | |
| Chewy Incorporated Class A | | 1,694 | 62,813 | 1.73 |
| Wayfair Incorporated Class A | | 1,529 | 50,289 | 1.38 |
| Specialty retail | | | | |
| AutoZone Incorporated | | 17 | 41,925 | 1.15 |
| Bath & Body Works Incorporated | | 1,048 | 44,163 | 1.21 |
| USS Company Limited | | 2,300 | 36,715 | 1.01 |
| Textiles, apparel & luxury goods | | | | |
| Pandora AS | | 1,100 | 77,289 | 2.12 |
| | | | 760,038 | |
The accompanying notes are an integral part of these consolidated financial statements.
12 | Allspring Alternative Risk Premia Fund
Consolidated portfolio of investments—December 31, 2022 (unaudited)
| Reference asset | | Shares | Value | % of swap
basket value |
| Long positions (continued) | | | | |
| Consumer staples | | | | |
| Food & staples retailing | | | | |
| Kobe Bussan Company Limited | | 1,300 | $ 37,542 | 1.03% |
| SpartanNash Company | | 1,467 | 44,362 | 1.22 |
| Food products | | | | |
| Campbell Soup Company | | 2,113 | 119,913 | 3.29 |
| Kellogg Company | | 656 | 46,733 | 1.28 |
| The J.M. Smucker Company | | 312 | 49,440 | 1.36 |
| | | | 297,990 | |
| Energy | | | | |
| Oil, gas & consumable fuels | | | | |
| Idemitsu Kosan Company Limited | | 2,300 | 53,802 | 1.48 |
| Origin Energy Limited | | 9,240 | 48,567 | 1.33 |
| | | | 102,369 | |
| Financials | | | | |
| Banks | | | | |
| Banco Bilbao Vizcaya Argentaria SA | | 9,694 | 58,464 | 1.61 |
| Danske Bank AS | | 2,440 | 48,225 | 1.32 |
| Capital markets | | | | |
| Blucora Incorporated | | 1,434 | 36,610 | 1.00 |
| Hargreaves Lansdown plc | | 6,179 | 63,959 | 1.76 |
| Invesco Limited | | 4,342 | 78,113 | 2.14 |
| SEI Investments Company | | 1,416 | 82,553 | 2.27 |
| Stonex Group Incorporated | | 444 | 42,313 | 1.16 |
| Diversified financial services | | | | |
| Kinnevik AB | | 3,940 | 54,069 | 1.48 |
| Mitsubishi UFJ Lease & Finance Company Limited | | 11,600 | 57,364 | 1.58 |
| Wendel SA | | 639 | 59,646 | 1.64 |
| Insurance | | | | |
| American Financial Group Incorporated | | 766 | 105,156 | 2.89 |
| Assurant Incorporated | | 506 | 63,280 | 1.74 |
| Erie Indemnity Company Class A | | 305 | 75,860 | 2.08 |
| Fairfax Financial Holdings Limited | | 100 | 59,237 | 1.62 |
| Medibank Private Limited | | 26,069 | 52,360 | 1.44 |
| | | | 937,209 | |
| Health care | | | | |
| Biotechnology | | | | |
| Rigel Pharmaceuticals Incorporated | | 25,419 | 38,129 | 1.05 |
| Health care equipment & supplies | | | | |
| BioMerieux Incorporated | | 450 | 47,168 | 1.30 |
| Getinge AB Class B | | 2,428 | 50,329 | 1.38 |
| Life sciences tools & services | | | | |
| Waters Corporation | | 160 | 54,813 | 1.50 |
| Pharmaceuticals | | | | |
| Bristol-Myers Squibb Company | | 638 | 45,904 | 1.26 |
| Ipsen SA | | 457 | 49,164 | 1.35 |
| Orion Oyj Class B | | 2,384 | 130,762 | 3.59 |
| | | | 416,269 | |
The accompanying notes are an integral part of these consolidated financial statements.
Allspring Alternative Risk Premia Fund | 13
Consolidated portfolio of investments—December 31, 2022 (unaudited)
| Reference asset | | Shares | Value | % of swap
basket value |
| Long positions (continued) | | | | |
| Industrials | | | | |
| Aerospace & defense | | | | |
| Rheinmetall AG | | 216 | $ 43,018 | 1.18% |
| Air freight & logistics | | | | |
| C.H. Robinson Worldwide Incorporated | | 485 | 44,407 | 1.22 |
| Airlines | | | | |
| Norwegian Air Shuttle ASA | | 50,395 | 37,778 | 1.04 |
| Electrical equipment | | | | |
| ABB Limited | | 1,976 | 59,965 | 1.65 |
| Fuji Electric Holdings Company Limited | | 1,200 | 45,992 | 1.26 |
| Prysmian SpA | | 1,709 | 63,407 | 1.74 |
| Industrial conglomerates | | | | |
| Keppel Corporation Limited | | 7,300 | 39,568 | 1.08 |
| Machinery | | | | |
| Mitsubishi Heavy Industries Limited | | 2,200 | 87,738 | 2.41 |
| Professional services | | | | |
| Booz Allen Hamilton Holding Corporation | | 613 | 64,071 | 1.76 |
| Persol Holdings Company Limited | | 2,900 | 62,490 | 1.71 |
| Randstad Holdings NV | | 637 | 38,840 | 1.07 |
| Road & rail | | | | |
| J.B. Hunt Transport Services Incorporated | | 281 | 48,995 | 1.35 |
| Nippon Express Holdings Incorporated | | 1,200 | 68,943 | 1.89 |
| Trading companies & distributors | | | | |
| W.W. Grainger Incorporated | | 90 | 50,062 | 1.37 |
| | | | 755,274 | |
| Information technology | | | | |
| Communications equipment | | | | |
| Juniper Networks Incorporated | | 1,726 | 55,163 | 1.52 |
| Electronic equipment, instruments & components | | | | |
| Arrow Electronics Incorporated | | 719 | 75,186 | 2.06 |
| Venture Corporation Limited | | 5,200 | 66,232 | 1.82 |
| IT services | | | | |
| CGI Incorporated | | 900 | 77,577 | 2.13 |
| Cognizant Technology Solutions Corporation Class A | | 1,166 | 66,683 | 1.83 |
| Gartner Incorporated | | 163 | 54,791 | 1.50 |
| Jack Henry & Associates Incorporated | | 551 | 96,734 | 2.66 |
| Otsuka Corporation | | 1,200 | 37,991 | 1.04 |
| The Western Union Company | | 6,145 | 84,617 | 2.32 |
| Verisign Incorporated | | 257 | 52,798 | 1.45 |
| Software | | | | |
| Blackberry Limited TSX | | 12,300 | 40,061 | 1.10 |
| Cadence Design Systems Incorporated | | 281 | 45,140 | 1.24 |
| Concensus Cloud Solution | | 681 | 36,611 | 1.00 |
| Dropbox Incorporated Class A | | 3,355 | 75,085 | 2.06 |
| Fair Isaac Corporation | | 137 | 82,005 | 2.25 |
| The Sage Group plc | | 12,682 | 114,315 | 3.14 |
| Trend Micro Incorporated | | 1,300 | 60,820 | 1.67 |
| | | | 1,121,809 | |
| Materials | | | | |
| Chemicals | | | | |
| CF Industries Holdings Incorporated | | 447 | 38,084 | 1.05 |
| Clariant AG | | 2,545 | 40,323 | 1.11 |
The accompanying notes are an integral part of these consolidated financial statements.
14 | Allspring Alternative Risk Premia Fund
Consolidated portfolio of investments—December 31, 2022 (unaudited)
| Reference asset | | Shares | Value | % of swap
basket value |
| Long positions (continued) | | | | |
| Chemicals (continued) | | | | |
| Johnson Matthey plc | | 3,575 | $ 91,929 | 2.52% |
| Orica Limited | | 8,435 | 86,489 | 2.37 |
| | | | 256,825 | |
| Real estate | | | | |
| Equity REITs | | | | |
| Artis REIT | | 7,200 | 47,911 | 1.31 |
| Real estate management & development | | | | |
| Leopalace21 Corporation | | 21,400 | 47,450 | 1.30 |
| Sino Land Company | | 48,000 | 60,020 | 1.65 |
| | | | 155,381 | |
| Utilities | | | | |
| Electric utilities | | | | |
| Exelon Corporation | | 1,343 | 58,058 | 1.59 |
| Multi-utilities | | | | |
| Consolidated Edison Incorporated | | 422 | 40,221 | 1.11 |
| DTE Energy Company | | 484 | 56,884 | 1.56 |
| | | | 155,163 | |
| Short positions | | | | |
| Common stocks | | | | |
| Communication services | | | | |
| Diversified telecommunication services | | | | |
| Cellnex Telecom SA | | (2,941) | (97,342) | (2.67) |
| Interactive media & services | | | | |
| Adevinta ASA | | (6,755) | (45,232) | (1.24) |
| Wireless telecommunication services | | | | |
| Softbank Corporation | | (4,100) | (46,486) | (1.28) |
| Softbank Group Corporation | | (1,400) | (60,207) | (1.65) |
| | | | (249,267) | |
| Consumer discretionary | | | | |
| Auto components | | | | |
| Aptiv plc | | (604) | (56,251) | (1.54) |
| Automobiles | | | | |
| Rivian Automotive Incorporated Class A | | (2,081) | (38,353) | (1.05) |
| Toyota Motor Corporation | | (4,000) | (55,242) | (1.52) |
| Household durables | | | | |
| Garmin Limited | | (746) | (68,848) | (1.89) |
| Sony Corporation | | (1,200) | (91,756) | (2.52) |
| Specialty retail | | | | |
| Floor & Decor Holdings Inc Class A | | (532) | (37,043) | (1.02) |
| Nitori Holdings Company Limited | | (600) | (77,949) | (2.14) |
| RH | | (150) | (40,078) | (1.10) |
| Textiles, apparel & luxury goods | | | | |
| LVMH Moet Hennessy Louis Vuitton SE | | (63) | (45,851) | (1.26) |
| | | | (511,371) | |
The accompanying notes are an integral part of these consolidated financial statements.
Allspring Alternative Risk Premia Fund | 15
Consolidated portfolio of investments—December 31, 2022 (unaudited)
| Reference asset | | Shares | Value | % of swap
basket value |
| Short positions (continued) | | | | |
| Consumer staples | | | | |
| Food & staples retailing | | | | |
| Aeon Company Limited | | (2,200) | $ (46,652) | (1.28)% |
| Food products | | | | |
| Nestle SA | | (479) | (55,502) | (1.52) |
| | | | (102,154) | |
| Energy | | | | |
| Oil, gas & consumable fuels | | | | |
| Enbridge Incorporated | | (1,800) | (70,352) | (1.93) |
| TC Energy Corporation | | (1,000) | (39,867) | (1.10) |
| Washington H. Soul Pattison & Company Limited | | (3,702) | (69,717) | (1.91) |
| | | | (179,936) | |
| Financials | | | | |
| Banks | | | | |
| JPMorgan Chase & Company | | (496) | (66,513) | (1.83) |
| Western Alliance Bancorporation | | (612) | (36,451) | (1.00) |
| Capital markets | | | | |
| Euronext NV | | (723) | (53,525) | (1.47) |
| Matsui Securities Company Limited | | (8,100) | (48,450) | (1.33) |
| S&P Global Incorporated | | (178) | (59,619) | (1.63) |
| Diversified financial services | | | | |
| Apollo Global Management Incorporated | | (1,427) | (91,028) | (2.50) |
| Groupe Bruxelles Lambert SA | | (478) | (38,161) | (1.05) |
| Insurance | | | | |
| AIA Group Limited | | (7,000) | (77,843) | (2.14) |
| Allianz SE | | (281) | (60,430) | (1.66) |
| Great-West Lifeco Incorporated | | (2,200) | (50,857) | (1.39) |
| Phoenix Group Holdings plc | | (10,000) | (73,576) | (2.02) |
| Thrifts & mortgage finance | | | | |
| TFS Financial Corporation | | (3,128) | (45,075) | (1.24) |
| | | | (701,528) | |
| Health care | | | | |
| Biotechnology | | | | |
| Exact Sciences Corporations | | (940) | (46,539) | (1.28) |
| Health care equipment & supplies | | | | |
| Intuitive Surgical Incorporated | | (195) | (51,743) | (1.42) |
| Life sciences tools & services | | | | |
| Illumina Incorporated | | (273) | (55,201) | (1.51) |
| Pharmaceuticals | | | | |
| AstraZeneca plc | | (387) | (52,485) | (1.44) |
| | | | (205,968) | |
| Industrials | | | | |
| Aerospace & defense | | | | |
| Rolls Royce Holdings plc | | (47,465) | (53,481) | (1.47) |
| Safran SA | | (577) | (72,215) | (1.98) |
| Building products | | | | |
| Daikin Industries Limited | | (400) | (61,567) | (1.69) |
| Commercial services & supplies | | | | |
| MSA Safety Incorporated | | (258) | (37,201) | (1.02) |
The accompanying notes are an integral part of these consolidated financial statements.
16 | Allspring Alternative Risk Premia Fund
Consolidated portfolio of investments—December 31, 2022 (unaudited)
| Reference asset | | Shares | Value | % of swap
basket value |
| Short positions (continued) | | | | |
| Construction & engineering | | | | |
| Kinden Corporation | | (3,400) | $ (37,254) | (1.03)% |
| Vinci SA | | (548) | (54,724) | (1.50) |
| Machinery | | | | |
| Makita Corporation | | (2,200) | (51,631) | (1.42) |
| RBC Bearings Incorporated | | (186) | (38,939) | (1.07) |
| Stanley Black & Decker Incorporated | | (979) | (73,542) | (2.02) |
| Toyota Industries Corporation | | (1,600) | (88,266) | (2.42) |
| Professional services | | | | |
| Clarivate plc | | (4,843) | (40,391) | (1.11) |
| Road & rail | | | | |
| Central Japan Railway Company | | (400) | (49,391) | (1.35) |
| Grab Holdings Incorporated Class A | | (18,861) | (60,732) | (1.67) |
| Trading companies & distributors | | | | |
| AerCap Holdings NV | | (1,461) | (85,206) | (2.34) |
| Transportation infrastructure | | | | |
| Transurban Group | | (7,023) | (62,065) | (1.70) |
| | | | (866,605) | |
| Information technology | | | | |
| Electronic equipment, instruments & components | | | | |
| Hexagon AB Series B | | (6,996) | (73,079) | (2.01) |
| Keyence Corporation | | (100) | (39,180) | (1.07) |
| Teledyne Technologies Incorporated | | (119) | (47,589) | (1.31) |
| IT services | | | | |
| Nexi SpA | | (8,238) | (64,956) | (1.78) |
| Okta Incorporated | | (604) | (41,271) | (1.13) |
| Shopify Incorporated Class A | | (1,700) | (59,023) | (1.62) |
| Snowflake Incorporated Class A | | (271) | (38,900) | (1.07) |
| Square Incorporated Class A | | (1,018) | (63,971) | (1.76) |
| Twilio Incorporated Class A | | (819) | (40,098) | (1.10) |
| Semiconductors & semiconductor equipment | | | | |
| Analog Devices Incorporated | | (370) | (60,691) | (1.67) |
| Nvidia Corporation | | (265) | (38,727) | (1.06) |
| Software | | | | |
| salesforce.com Incorporated | | (545) | (72,262) | (1.98) |
| ServiceNow Incorporated | | (105) | (40,768) | (1.12) |
| Technology hardware, storage & peripherals | | | | |
| Fijifilm Holdings Corporation | | (1,400) | (70,672) | (1.94) |
| | | | (751,187) | |
| Materials | | | | |
| Chemicals | | | | |
| Ecolab Incorporated | | (332) | (48,326) | (1.33) |
| International Flavors & Fragrances Incorporated | | (718) | (75,275) | (2.06) |
| Metals & mining | | | | |
| Ivanhoe Mines Limited Class A | | (8,100) | (64,010) | (1.76) |
| | | | (187,611) | |
The accompanying notes are an integral part of these consolidated financial statements.
Allspring Alternative Risk Premia Fund | 17
Consolidated portfolio of investments—December 31, 2022 (unaudited)
| Reference asset | | Shares | Value | % of swap
basket value |
| Short positions (continued) | | | | |
| Real estate | | | | |
| Equity REITs | | | | |
| Nippon Building Fund Incorporated | | (11) | $ (49,284) | (1.35)% |
| Realty Income Corporation | | (1,355) | (85,948) | (2.36) |
| | | | (135,232) | |
| Utilities | | | | |
| Electric utilities | | | | |
| Enel SpA | | (7,861) | (42,327) | (1.16) |
| Nextera Energy Incorporated | | (534) | (44,642) | (1.23) |
| Gas utilities | | | | |
| The Hong Kong and China Gas Company Limited | | (94,000) | (89,358) | (2.45) |
| | | | (176,327) | |
| Abbreviations: |
| REIT | Real estate investment trust |
The accompanying notes are an integral part of these consolidated financial statements.
18 | Allspring Alternative Risk Premia Fund
Consolidated statement of assets and liabilities—December 31, 2022 (unaudited)
| | |
| Assets | |
Investments in unaffiliated securities, at value (cost $23,165,757)
| $ 23,141,536 |
Investments in affiliated securities, at value (cost $7,815,114)
| 7,815,114 |
Cash at broker segregated for futures contracts
| 7,885,297 |
Unrealized gains on forward foreign currency contracts
| 324,467 |
Receivable for daily variation margin on open futures contracts
| 289,223 |
Unrealized gains on swap contracts
| 207,437 |
Receivable for interest
| 28,997 |
Receivable from manager
| 10,065 |
Prepaid expenses and other assets
| 51,708 |
Total assets
| 39,753,844 |
| Liabilities | |
Cash collateral due to broker for forward foreign currency contracts
| 260,000 |
Overdraft due to custodian bank
| 162,523 |
Cash due to broker
| 105,448 |
Payable for daily variation margin on open futures contracts
| 98,137 |
Payable for Fund shares redeemed
| 44,840 |
Unrealized losses on forward foreign currency contracts
| 38,160 |
Trustees’ fees and expenses payable
| 3,552 |
Administration fees payable
| 1,151 |
Accrued expenses and other liabilities
| 19,938 |
Total liabilities
| 733,749 |
Total net assets
| $39,020,095 |
| Net assets consist of | |
Paid-in capital
| $ 40,468,551 |
Total distributable loss
| (1,448,456) |
Total net assets
| $39,020,095 |
| Computation of net asset value per share | |
Net assets – Class R6
| $ 38,088,934 |
Shares outstanding – Class R61
| 4,714,599 |
Net asset value per share – Class R6
| $8.08 |
Net assets – Institutional Class
| $ 931,161 |
Shares outstanding – Institutional Class1
| 115,595 |
Net asset value per share – Institutional Class
| $8.06 |
| 1 | The Fund has an unlimited number of authorized shares. |
The accompanying notes are an integral part of these consolidated financial statements.
Allspring Alternative Risk Premia Fund | 19
Consolidated statement of operations— six months ended December 31, 2022 (unaudited)
| | |
| Investment income | |
Interest
| $ 314,125 |
Income from affiliated securities
| 228,547 |
Total investment income
| 542,672 |
| Expenses | |
Management fee
| 154,926 |
| Administration fees | |
Class R6
| 7,604 |
Institutional Class
| 617 |
Custody and accounting fees
| 36,455 |
Professional fees
| 43,511 |
Registration fees
| 22,101 |
Shareholder report expenses
| 15,272 |
Trustees’ fees and expenses
| 11,158 |
Other fees and expenses
| 46,680 |
Total expenses
| 338,324 |
| Less: Fee waivers and/or expense reimbursements | |
Fund-level
| (177,712) |
Institutional Class
| (47) |
Net expenses
| 160,565 |
Net investment income
| 382,107 |
| Realized and unrealized gains (losses) on investments | |
| Net realized gains (losses) on | |
Unaffiliated securities
| (99,573) |
Forward foreign currency contracts
| 745,830 |
Futures contracts
| (812,592) |
Swap contracts
| 1,041,260 |
Net realized gains on investments
| 874,925 |
| Net change in unrealized gains (losses) on | |
Unaffiliated securities
| (19,278) |
Forward foreign currency contracts
| 402,771 |
Futures contracts
| (776,271) |
Swap contracts
| (31,610) |
Net change in unrealized gains (losses) on investments
| (424,388) |
Net realized and unrealized gains (losses) on investments
| 450,537 |
Net increase in net assets resulting from operations
| $ 832,644 |
The accompanying notes are an integral part of these consolidated financial statements.
20 | Allspring Alternative Risk Premia Fund
Consolidated statement of changes in net assets
| | | | | |
| | Six months ended
December 31, 2022
(unaudited) | Year ended
June 30, 2022 |
| Operations | | | | |
Net investment income (loss)
| | $ 382,107 | | $ (378,293) |
Net realized gains on investments
| | 874,925 | | 3,935,291 |
Net change in unrealized gains (losses) on investments
| | (424,388) | | 934,009 |
Net increase in net assets resulting from operations
| | 832,644 | | 4,491,007 |
| Distributions to shareholders from | | | | |
| Net investment income and net realized gains | | | | |
Class R6
| | (5,243,974) | | 0 |
Institutional Class
| | (126,693) | | 0 |
Total distributions to shareholders
| | (5,370,667) | | 0 |
| Capital share transactions | Shares | | Shares | |
| Proceeds from shares sold | | | | |
Class R6
| 2,055,026 | 18,740,999 | 104,165 | 886,741 |
Institutional Class
| 0 | 0 | 100,000 | 853,000 |
| | | 18,740,999 | | 1,739,741 |
| Reinvestment of distributions | | | | |
Class R6
| 638,607 | 5,243,974 | 0 | 0 |
Institutional Class
| 15,484 | 126,693 | 0 | 0 |
| | | 5,370,667 | | 0 |
| Payment for shares redeemed | | | | |
Class R6
| (3,918,356) | (35,669,864) | (2,679,117) | (23,152,340) |
Institutional Class
| (2,389) | (21,716) | 0 | 0 |
| | | (35,691,580) | | (23,152,340) |
Net decrease in net assets resulting from capital share transactions
| | (11,579,914) | | (21,412,599) |
Total decrease in net assets
| | (16,117,937) | | (16,921,592) |
| Net assets | | | | |
Beginning of period
| | 55,138,032 | | 72,059,624 |
End of period
| | $ 39,020,095 | | $ 55,138,032 |
The accompanying notes are an integral part of these consolidated financial statements.
Allspring Alternative Risk Premia Fund | 21
Consolidated financial highlights
(For a share outstanding throughout each period)
| | | Year ended June 30 |
| Class R6 | Six months ended
December 31, 2022
(unaudited) | 2022 | 2021 | 2020 | 2019 1 |
Net asset value, beginning of period
| $9.13 | $8.46 | $8.02 | $9.75 | $10.00 |
Net investment income (loss)
| 0.19 | (0.11) | (0.05) 2 | 0.10 | 0.07 |
Net realized and unrealized gains (losses) on investments
| (0.01) | 0.78 | 0.49 | (1.73) | (0.32) |
Total from investment operations
| 0.18 | 0.67 | 0.44 | (1.63) | (0.25) |
| Distributions to shareholders from | | | | | |
Net investment income
| (0.83) | 0.00 | 0.00 | (0.03) | 0.00 |
Net realized gains
| (0.40) | 0.00 | 0.00 | (0.07) | 0.00 |
Total distributions to shareholders
| (1.23) | 0.00 | 0.00 | (0.10) | 0.00 |
Net asset value, end of period
| $8.08 | $9.13 | $8.46 | $8.02 | $9.75 |
Total return3
| 2.16% | 7.92% | 5.49% | (16.78)% | (2.50)% |
| Ratios to average net assets (annualized) | | | | | |
Gross expenses
| 1.31% | 1.15% | 1.09% | 1.04% | 1.56% |
Net expenses
| 0.62% | 0.62% | 0.62% | 0.62% | 0.62% |
Net investment income (loss)
| 1.48% | (0.56)% | (0.58)% | 1.03% | 1.78% |
| Supplemental data | | | | | |
Portfolio turnover rate
| 0% | 0% | 0% | 0% | 0% |
Net assets, end of period (000s omitted)
| $38,089 | $54,205 | $72,039 | $65,765 | $38,957 |
| 1 | For the period from January 29, 2019 (commencement of class operations) to June 30, 2019 |
| 2 | Calculated based upon average shares outstanding |
| 3 | Returns for periods of less than one year are not annualized. |
The accompanying notes are an integral part of these consolidated financial statements.
22 | Allspring Alternative Risk Premia Fund
Consolidated financial highlights
(For a share outstanding throughout each period)
| | | Year ended June 30 |
| Institutional Class | Six months ended
December 31, 2022
(unaudited) | 2022 | 2021 | 2020 | 2019 1 |
Net asset value, beginning of period
| $9.10 | $8.44 | $8.02 | $9.74 | $10.00 |
Net investment income (loss)
| 0.13 | (0.10) | (0.05) | 0.09 | 0.07 |
Net realized and unrealized gains (losses) on investments
| 0.06 | 0.76 | 0.47 | (1.72) | (0.33) |
Total from investment operations
| 0.19 | 0.66 | 0.42 | (1.63) | (0.26) |
| Distributions to shareholders from | | | | | |
Net investment income
| (0.83) | 0.00 | 0.00 | (0.02) | 0.00 |
Net realized gains
| (0.40) | 0.00 | 0.00 | (0.07) | 0.00 |
Total distributions to shareholders
| (1.23) | 0.00 | 0.00 | (0.09) | 0.00 |
Net asset value, end of period
| $8.06 | $9.10 | $8.44 | $8.02 | $9.74 |
Total return2
| 2.27% | 7.82% | 5.24% | (16.87)% | (2.60)% |
| Ratios to average net assets (annualized) | | | | | |
Gross expenses
| 1.42% | 1.35% | 1.21% | 1.15% | 1.68% |
Net expenses
| 0.72% | 0.72% | 0.72% | 0.72% | 0.72% |
Net investment income (loss)
| 1.41% | (0.53)% | (0.68)% | 0.95% | 1.69% |
| Supplemental data | | | | | |
Portfolio turnover rate
| 0% | 0% | 0% | 0% | 0% |
Net assets, end of period (000s omitted)
| $931 | $933 | $21 | $20 | $24 |
| 1 | For the period from January 29, 2019 (commencement of class operations) to June 30, 2019 |
| 2 | Returns for periods of less than one year are not annualized. |
The accompanying notes are an integral part of these consolidated financial statements.
Allspring Alternative Risk Premia Fund | 23
Notes to consolidated financial statements (unaudited)
1. ORGANIZATION
Allspring Funds Trust (the "Trust"), a Delaware statutory trust organized on March 10, 1999, is an open-end management investment company registered under the Investment Company Act of 1940, as amended (the "1940 Act"). As an investment company, the Trust follows the accounting and reporting guidance in Financial Accounting Standards Board ("FASB") Accounting Standards Codification Topic 946, Financial Services – Investment Companies. These consolidated financial statements report on the Allspring Alternative Risk Premia Fund (the "Fund") which is a diversified series of the Trust.
2. INVESTMENT IN SUBSIDIARY
The Fund invests in direct or indirect investments in various derivatives, including commodity-linked derivatives, through Alt Risk Premia Special Investments (Cayman) Ltd. (the “Subsidiary”), a wholly owned subsidiary incorporated on October 2, 2018 under the laws of the Cayman Islands as an exempted segregated portfolio company with limited liability. As of December 31, 2022, the Subsidiary had $7,829,119 of investments in affiliates and cash at broker segregated for futures contacts representing 153.06% of its assets. As of December 31, 2022, the Fund held $5,114,986 in the Subsidiary, representing 15.09% of the Fund’s net assets prior to consolidation.
The consolidated financial statements of the Fund include the financial results of the Subsidiary. The Consolidated Portfolio of Investments includes positions of the Fund and the Subsidiary and the consolidated financial statements include the accounts of the Fund and the Subsidiary. Accordingly, all interfund balances and transactions between the Fund and the Subsidiary have been eliminated in consolidation.
3. SIGNIFICANT ACCOUNTING POLICIES
The following significant accounting policies, which are consistently followed in the preparation of the consolidated financial statements of the Fund, are in conformity with U.S. generally accepted accounting principles which require management to make estimates and assumptions that affect the reported amounts of assets and liabilities, disclosure of contingent assets and liabilities at the date of the consolidated financial statements, and the reported amounts of income and expenses during the reporting period. Actual results could differ from those estimates.
Securities valuation
All investments are valued each business day as of the close of regular trading on the New York Stock Exchange (generally 4 p.m. Eastern Time), although the Fund may deviate from this calculation time under unusual or unexpected circumstances.
Debt securities are valued at the evaluated bid price provided by an independent pricing service (e.g. taking into account various factors, including yields, maturities, or credit ratings) or, if a reliable price is not available, the quoted bid price from an independent broker-dealer.
Futures contracts that are listed on a foreign or domestic exchange or market are valued at the official closing price or, if none, the last sales price.
Forward foreign currency contracts are recorded at the forward rate provided by an independent foreign currency pricing source at a time each business day specified by the Allspring Global Investments Valuation Committee at Allspring Global Investments, LLC ("Allspring Global Investments").
Swap contracts are valued at the evaluated price provided by an independent pricing service or, if a reliable price is not available, the quoted bid price from an independent broker-dealer.
Investments in registered open-end investment companies (other than those listed on a foreign or domestic exchange or market) are valued at net asset value.
Investments which are not valued using the methods discussed above are valued at their fair value, as determined in good faith by Allspring Funds Management, LLC ("Allspring Funds Management"), which was named the valuation designee by the Board of Trustees. As the valuation designee, Allspring Funds Management is responsible for day-to-day valuation activities for the Allspring Funds. In connection with these responsibilities, Allspring Funds Management has established a Valuation Committee and has delegated to it the authority to take any actions regarding the valuation of portfolio securities that the Valuation Committee deems necessary or appropriate, including determining the fair value of portfolio securities. On a quarterly basis, the Board of Trustees receives reports of valuation actions taken by the Valuation Committee. On at least an annual basis, the Board of Trustees receives an assessment of the adequacy and effectiveness of Allspring Funds Management's process for determining the fair value of the portfolio of investments.
24 | Allspring Alternative Risk Premia Fund
Notes to consolidated financial statements (unaudited)
Foreign currency translation
The accounting records of the Fund are maintained in U.S. dollars. The values of other assets and liabilities denominated in foreign currencies are translated into U.S. dollars at rates provided by an independent foreign currency pricing source at a time each business day specified by the Allspring Global Investments Valuation Committee. Purchases and sales of securities, and income and expenses are converted at the rate of exchange on the respective dates of such transactions. Net realized foreign exchange gains or losses arise from sales of foreign currencies, currency gains or losses realized between the trade and settlement dates on securities transactions, and the difference between the amounts of dividends, interest and foreign withholding taxes recorded and the U.S. dollar equivalent of the amounts actually paid or received. Net unrealized foreign exchange gains and losses arise from changes in the fair value of assets and liabilities other than investments in securities resulting from changes in exchange rates. The changes in net assets arising from changes in exchange rates of securities and the changes in net assets resulting from changes in market prices of securities are not separately presented. Such changes are included in net realized and unrealized gains or losses from investments.
Forward foreign currency contracts
A forward foreign currency contract is an agreement between two parties to purchase or sell a specific currency for an agreed-upon price at a future date. The Fund enters into forward foreign currency contracts to facilitate transactions in foreign-denominated securities and to attempt to minimize the risk to the Fund from adverse changes in the relationship between currencies. Forward foreign currency contracts are recorded at the forward rate and marked-to-market daily. When the contracts are closed, realized gains and losses arising from such transactions are recorded as realized gains or losses on forward foreign currency contracts. The Fund is subject to foreign currency risk and may be exposed to risks if the counterparties to the contracts are unable to meet the terms of their contracts or if the value of the foreign currency changes unfavorably. The Fund's maximum risk of loss from counterparty credit risk is the unrealized gains on the contracts. This risk may be mitigated if there is a master netting arrangement between the Fund and the counterparty.
Futures contracts
Futures contracts are agreements between the Fund and the Subsidiary and a counterparty to buy or sell a specific amount of a commodity, financial instrument or currency at a specified price and on a specified date. The Fund and the Subsidiary may buy and sell futures contracts in order to gain exposure to, or protect against, changes in interest rates, security values, commodity prices and foreign exchange rates and is subject to interest rate risk, equity price risk, commodity price risk and foreign currency risk. The primary risks associated with the use of futures contracts are the imperfect correlation between changes in market values of securities held by the Fund and the Subsidiary and the prices of futures contracts, and the possibility of an illiquid market. Futures contracts are generally entered into on a regulated futures exchange and cleared through a clearinghouse associated with the exchange. With futures contracts, there is minimal counterparty risk to the Fund and the Subsidiary since futures contracts are exchange traded and the exchange’s clearinghouse, as the counterparty to all exchange traded futures, guarantees the futures contracts against default.
Upon entering into a futures contracts, the Fund and the Subsidiary are required to deposit either cash or securities (initial margin) with the broker in an amount equal to a certain percentage of the contract value. Subsequent payments (variation margin) are paid to or from the broker each day equal to the daily changes in the contract value. Such payments are recorded as unrealized gains or losses and, if any, shown as variation margin receivable (payable) in the undefined of Assets and Liabilities. Should the Fund and the Subsidiary fail to make requested variation margin payments, the broker can gain access to the initial margin to satisfy the Fund’s and the Subsidiary's payment obligations. When the contracts are closed, a realized gain or loss is recorded in the Consolidated Statement of Operations.
Swap contracts
Swap contracts are agreements between the Fund and a counterparty to exchange a series of cash flows over a specified period. Swap agreements are privately negotiated contracts between the Fund that are entered into as bilateral contracts in the over-the-counter ("OTC") market (“OTC swaps”) or centrally cleared with a central clearinghouse.
The Fund entered into OTC swaps. For OTC swaps, any upfront premiums paid and any upfront fees received are shown as swap premiums paid and swap premiums received, respectively, in the Consolidated Statement of Assets and Liabilities and amortized over the term of the contract. The daily fluctuations in market value are recorded as unrealized gains or losses on swap contracts in the Consolidated Statement of Assets and Liabilities. Payments received or paid are recorded in the Consolidated Statement of Operations as realized gains or losses, respectively. When an OTC swap is terminated, a realized gain or loss is recorded in the Consolidated Statement of Operations equal to the difference between the proceeds from (or cost of) the closing transaction and the Fund’s basis in the contract, if any. Generally, the cost basis of the contract is the premium received or paid.
Allspring Alternative Risk Premia Fund | 25
Notes to consolidated financial statements (unaudited)
Total return basket swaps
The Fund may enter into total return basket swap contracts to obtain exposure to a custom basket of long and short securities without owning such securities. The Fund has the ability to trade in and out of the long and short positions within the swap and receives the economic benefits and risks equivalent to direct investments in these positions. Under the terms of the contract, the Fund and the counterparty exchange periodic payments based on the total return of reference assets within a basket for a specified interest rate. Benefits and risks include capital appreciation (depreciation), corporate actions and dividends received and paid, all of which are reflected in the swap’s market value. The market value also includes interest charges and credits (“financing fees”) related to the notional values of the long and short positions and cash balances within the swap. To the extent the total return of the reference assets exceeds or falls short of the offsetting interest rate obligation, the Fund will receive a payment from, or make a payment to, the counterparty. Positions within the swap are reset periodically. During a reset, any unrealized appreciation (depreciation) on positions and accrued financing fees become available for cash settlement between the Fund and the counterparty. The amounts that are available for cash settlement are recorded as realized gains or losses on swap contracts in the Consolidated Statement of Operations. Cash settlement in and out of the swap may occur at a reset date or any other date, at the discretion of the Fund and the counterparty, over the life of the agreement. Certain swaps have no stated expiration and can be terminated by either party at any time.
The Fund is exposed to risks if the counterparty defaults on its obligation to perform, or if there are unfavorable changes in the fluctuation of interest rates or in the price of the reference securities in the basket. In addition to counterparty credit risk, the Fund is subject to liquidity risk if there is no market for the contracts and is exposed to the market risk associated with the reference securities in the basket.
Security transactions and income recognition
Securities transactions are recorded on a trade date basis. Realized gains or losses are recorded on the basis of identified cost.
Interest income is accrued daily and bond discounts are accreted and premiums are amortized daily. To the extent debt obligations are placed on non-accrual status, any related interest income may be reduced by writing off interest receivables when the collection of all or a portion of interest has been determined to be doubtful based on consistently applied procedures and the fair value has decreased. If the issuer subsequently resumes interest payments or when the collectability of interest is reasonably assured, the debt obligation is removed from non-accrual status.
Distributions to shareholders
Distributions to shareholders from net investment income and any net realized gains are recorded on the ex-dividend date and paid at least annually. Such distributions are determined in accordance with income tax regulations and may differ from U.S. generally accepted accounting principles. Dividend sources are estimated at the time of declaration. The tax character of distributions is determined as of the Fund's fiscal year end. Therefore, a portion of the Fund's distributions made prior to the Fund’s fiscal year end may be categorized as a tax return of capital at year end.
Federal and other taxes
The Fund intends to continue to qualify as a regulated investment company by distributing substantially all of its investment company taxable income and any net realized capital gains (after reduction for capital loss carryforwards) sufficient to relieve it from all, or substantially all, federal income taxes. Accordingly, no provision for federal income taxes was required.
The Subsidiary is classified as a controlled foreign corporation under Subchapter N of the Internal Revenue Code. Therefore, the Fund is required to increase its taxable income by its share of the Subsidiary’s income. Net investment losses of the Subsidiary cannot be deducted by the Fund in the current period nor carried forward to offset taxable income in future periods.
The Fund’s income and federal excise tax returns and all financial records supporting those returns for the prior three fiscal years are subject to examination by the federal and Delaware revenue authorities. Management has analyzed the Fund's tax positions taken on federal, state, and foreign tax returns, as applicable, for all open tax years and does not believe that there are any uncertain tax positions that require recognition of a tax liability.
As of December 31, 2022, the aggregate cost of all investments for federal income tax purposes was $31,763,027 and the unrealized gains (losses) consisted of:
| Gross unrealized gains | $ 1,506,693 |
| Gross unrealized losses | (1,493,254) |
| Net unrealized gains | $ 13,439 |
26 | Allspring Alternative Risk Premia Fund
Notes to consolidated financial statements (unaudited)
Class allocations
The separate classes of shares offered by the Fund differ principally in administration fees. Class specific expenses are charged directly to that share class. Investment income, common fund-level expenses, and realized and unrealized gains (losses) on investments are allocated daily to each class of shares based on the relative proportion of net assets of each class.
4. FAIR VALUATION MEASUREMENTS
Fair value measurements of investments are determined within a framework that has established a fair value hierarchy based upon the various data inputs utilized in determining the value of the Fund’s investments. The three-level hierarchy gives the highest priority to unadjusted quoted prices in active markets for identical assets or liabilities (Level 1) and the lowest priority to unobservable inputs (Level 3). The Fund’s investments are classified within the fair value hierarchy based on the lowest level of input that is significant to the fair value measurement. The inputs are summarized into three broad levels as follows:
| ■ | Level 1 – quoted prices in active markets for identical securities |
| ■ | Level 2 – other significant observable inputs (including quoted prices for similar securities, interest rates, prepayment speeds, credit risk, etc.) |
| ■ | Level 3 – significant unobservable inputs (including the Fund’s own assumptions in determining the fair value of investments) |
The inputs or methodologies used for valuing investments in securities are not necessarily an indication of the risk associated with investing in those securities.
The following is a summary of the inputs used in valuing the Fund’s assets and liabilities as of December 31, 2022:
| | Quoted prices
(Level 1) | Other significant
observable inputs
(Level 2) | Significant
unobservable inpouts
(level 3) | Total |
| Assets | | | | |
| Investments in: | | | | |
| Short-term investments | | | | |
| Investment companies | $ 7,815,114 | $ 0 | $0 | $ 7,815,114 |
| U.S. Treasury securites | 23,141,536 | 0 | 0 | 23,141,536 |
| | 30,956,650 | 0 | 0 | 30,956,650 |
| Forward foreign currency contracts | 0 | 324,467 | 0 | 324,467 |
| Futures contracts | 861,721 | 0 | 0 | 861,721 |
| Swap contracts | 0 | 207,437 | 0 | 207,437 |
| Total assets | $31,818,371 | $531,904 | $0 | $32,350,275 |
| Liabilitites | | | | |
| Forward foreign currency contracts | $ 0 | $ 38,160 | $0 | $ 38,160 |
| Futures contracts | 535,649 | 0 | 0 | 535,649 |
| Total liabilities | $ 535,649 | $ 38,160 | $0 | $ 573,809 |
Futures contracts, forward foreign currency contracts and swap contracts are reported at their cumulative unrealized gains (losses) at measurement date as reported in the tables following the Consolidated Portfolio of Investments. For futures contracts, the current day’s variation margin is reported on the Consolidated Statement of Assets and Liabilities. All other assets and liabilities are reported at their market value at measurement date.
For the six months ended December 31, 2022, the Fund did not have any transfers into/out of Level 3.
5. TRANSACTIONS WITH AFFILIATES
Management fee
Allspring Funds Management, a wholly owned subsidiary of Allspring Global Investments Holdings, LLC, a holding company indirectly owned by certain private funds of GTCR LLC and Reverence Capital Partners, L.P., is the manager of the Fund and provides advisory and fund-level administrative services under an investment management agreement. Under the investment management agreement, Allspring Funds Management is responsible for, among other services, implementing the investment objectives and strategies of the Fund, supervising the subadvisers and providing fund-level administrative services in
Allspring Alternative Risk Premia Fund | 27
Notes to consolidated financial statements (unaudited)
connection with the Fund’s operations. As compensation for its services under the investment management agreement, Allspring Funds Management is entitled to receive a management fee at the following annual rate based on the Fund’s average daily net assets:
| Average daily net assets | Management fee |
| First $500 million | 0.600% |
| Next $500 million | 0.575 |
| Next $2 billion | 0.550 |
| Next $2 billion | 0.525 |
| Next $5 billion | 0.490 |
| Over $10 billion | 0.480 |
For the six months ended December 31, 2022, the management fee was equivalent to an annual rate of 0.60% of the Fund’s average daily net assets.
The Subsidiary has entered into a separate advisory contract with Allspring Funds Management to manage the investment and reinvestment of its assets in conformity with its investment objectives and restrictions. Under this agreement, the Subsidiary does not pay Allspring Funds Management a fee for its services.
Allspring Funds Management has retained the services of certain subavisers to provide daily portfolio management to the Fund. The fee for subadvisory services is borne by Allspring Funds Management. Allspring Global Investments, LLC ("Allspring Investments") and Allspring Global Investments (UK) Limited ("Allspring UK"), each an affiliate of Allspring Funds Management and a wholly owned subsidiary of Allspring Global Investments Holdings, LLC, serves as subadvisers to the Fund. Allspring Investments receives a subadvisory fee at an annual rate starting at 0.20% and declining to 0.10% as the average daily net assets of the Fund increase. Allspring UK receives a subadvisory fee for its asset allocation services at an annual rate of 0.10% of the Fund's average daily net assets and a fee for portfolio management services on the assets it co-manages with Allspring Investments at an annual rate starting at 0.15% and declining to 0.075%.
Administration fees
Under a class-level administration agreement, Allspring Funds Management provides class-level administrative services to the Fund, which includes paying fees and expenses for services provided by the transfer agent, sub-transfer agents, omnibus account servicers and record-keepers. As compensation for its services under the class-level administration agreement, Allspring Funds Management receives an annual fee which is calculated based on the average daily net assets of each class as follows:
| | Class-level
administration fee |
| Class R6 | 0.03% |
| Institutional Class | 0.13 |
Waivers and/or expense reimbursements
Allspring Funds Management has contractually committed to waive and/or reimburse management and administration fees to the extent necessary to maintain certain net operating expense ratios for the Fund. When each class of the Fund has exceeded its expense cap, Allspring Funds Management will waive fees and/or reimburse expenses from fund-level expenses on a proportionate basis and then from class specific expenses. When only certain classes exceed their expense caps, waivers and/or reimbursements are applied against class specific expenses before fund-level expenses. Allspring Funds Management has contractually committed through October 31, 2023 to waive fees and/or reimburse expenses to the extent necessary to cap expenses. Prior to or after the commitment expiration date, the caps may be increased or the commitment to maintain the caps may be terminated only with the approval of the Board of Trustees. As of December 31, 2022, the contractual expense caps are as follows:
28 | Allspring Alternative Risk Premia Fund
Notes to consolidated financial statements (unaudited)
| | Expense ratio caps |
| Class R6 | 0.62% |
| Institutional Class | 0.72 |
Interfund transactions
The Fund may purchase or sell portfolio investment securities to certain affiliates pursuant to Rule 17a-7 under the 1940 Act and under procedures adopted by the Board of Trustees. The procedures have been designed to ensure that these interfund transactions, which do not incur broker commissions, are effected at current market prices.
6. INVESTMENT PORTFOLIO TRANSACTIONS
For the six months ended December 31, 2022, the Fund did not have any purchases and sales of securities, excluding any short-term securities.
7. DERIVATIVE TRANSACTIONS
During the six months ended December 31, 2022, in order to provide investors with exposure to sources of excess return (known as alternative risk premia), the Fund and the Subsidiary entered into both long and short positions in equities, fixed income, currencies and commodities directly or with derivatives. The derivative holdings included futures contracts, forward foreign currency contracts and swap contracts.
The volume of the Fund's derivative activity during the six months ended December 31, 2022 was as follows:
| Futures contracts | |
| Average notional balance on long futures | $113,047,409 |
| Average notional balance on short futures | 133,331,229 |
| Forward foreign currency contracts | |
| Average contract amounts to buy | $ 8,146,028 |
| Average contract amounts to sell | 12,748,171 |
| Swap contracts | |
| Average notional balance | $ 4,836,391 |
The Fund's swap transactions may contain provisions for early termination in the event the net assets of the Fund declines below specific levels identified by the counterparty. If these levels are triggered, the counterparty may terminate the transaction and seek payment or request full collateralization of the derivative transactions in net liability positions.
A summary of the location of derivative instruments on the financial statements by primary risk exposure is outlined in the following tables.
Allspring Alternative Risk Premia Fund | 29
Notes to consolidated financial statements (unaudited)
The fair value of derivative instruments as of December 31, 2022 by primary risk type was as follows for the Fund:
| | Asset derivatives | | Liability derivatives |
| | Consolidated Statement of
Assets and Liabilities location | Fair value | | Consolidated Statement of
Assets and Liabilities location | Fair value |
| Interest rate risk | Unrealized gains on futures contracts | $ 603,529* | | Unrealized losses on futures contracts | $ 186,321* |
| Commodity risk | Unrealized gains on futures contracts | 216,578* | | Unrealized losses on futures contracts | 236,205* |
| Equity risk | Unrealized gains on futures contracts | 41,614* | | Unrealized losses on futures contracts | 113,123* |
| | Unrealized gains on swaps contracts | 207,437 | | Unrealized losses on swaps contracts | 0 |
| Foreign currency risk | Unrealized gains on forward foreign currency contracts | 324,467 | | Unrealized losses on forward foreign currency contracts | 38,160 |
| | | $1,393,625 | | | $573,809 |
| * | Amount represents the cumulative unrealized gains (losses) as reported in the table following the Consolidated Portfolio of Investments. For futures contracts, only the current day's variation margin as of December 31, 2022 is reported separately on the Consolidated Statement of Assets and Liabilities. |
The effect of derivative instruments on the Consolidated Statement of Operations for the six months ended December 31, 2022 was as follows:
| | Net realized gains (losses) on derivatives |
| | Forward
foreign
currency
contracts | Futures
contracts | Swap
contracts | Total |
| Interest rate risk | $ 0 | $(1,045,642) | $ 0 | $(1,045,642) |
| Commodity risk | 0 | 666,516 | 0 | 666,516 |
| Equity risk | 0 | (433,466) | 1,041,260 | 607,794 |
| Foreign currency risk | 745,830 | 0 | 0 | 745,830 |
| | $745,830 | $ (812,592) | $1,041,260 | $ 974,498 |
| | Net change in unrealized gains (losses) on derivatives |
| | Forward
foreign
currency
contracts | Futures
contracts | Swap
contracts | Total |
| Interest rate risk | $ 0 | $ (337,921) | $ 0 | $ (337,921) |
| Commodity risk | 0 | (363,279) | 0 | (363,279) |
| Equity risk | 0 | (75,071) | (31,610) | (106,681) |
| Foreign currency risk | 402,771 | 0 | 0 | 402,771 |
| | $402,771 | $(776,271) | $(31,610) | $(405,110) |
For certain types of derivative transactions, the Fund and the Subsidiary have entered into International Swaps and Derivatives Association, Inc. master agreements (“ISDA Master Agreements”) or similar agreements with approved counterparties. The ISDA Master Agreements or similar agreements may have requirements to deliver/deposit securities or cash to/with an exchange or broker-dealer as collateral and allows the Fund and the Subsidiary to offset, with each counterparty, certain derivative financial instrument’s assets and/or liabilities with collateral held or pledged. Collateral requirements differ by type of derivative. Collateral or margin requirements are set by the broker or exchange clearinghouse for exchange traded derivatives while collateral terms are contract specific for over-the-counter traded derivatives. Cash collateral that has been pledged to cover obligations of the Fund and the Subsidiary under ISDA Master Agreements or similar agreements, if any, are reported
30 | Allspring Alternative Risk Premia Fund
Notes to consolidated financial statements (unaudited)
separately in the Consolidated Statement of Assets and Liabilities. Securities pledged as collateral, if any, are noted in the Consolidated Portfolio of Investments. With respect to balance sheet offsetting, absent an event of default by the counterparty or a termination of the agreement, the reported amounts of financial assets and financial liabilities in the Consolidated Statement of Assets and Liabilities are not offset across transactions between the Fund and the applicable counterparty. A reconciliation of the gross amounts on the Consolidated Statement of Assets and Liabilities to the net amounts by counterparty, including any collateral exposure, for OTC derivatives is as follows:
| Counterparty | Gross amounts
of assets in the
Consolidated
Statement of
Assets and
Liabilities | Amounts
subject to
netting
agreements | Collateral
received | Net amount
of assets |
| Goldman Sachs International | $531,904 | $(38,160) | $(260,000) | $233,744 |
| Counterparty | Gross amounts
of liabilities in the
Consolidated
Statement of
Assets and
Liabilities | Amounts
subject to
netting
agreements | Collateral
pledged | Net amount
of assets |
| Goldman Sachs International | $38,160 | $(38,160) | $0 | $0 |
8. BANK BORROWINGS
The Trust (excluding the money market funds), Allspring Master Trust and Allspring Variable Trust are parties to a $350,000,000 revolving credit agreement whereby the Fund is permitted to use bank borrowings for temporary or emergency purposes, such as to fund shareholder redemption requests. Interest under the credit agreement is charged to the Fund based on a borrowing rate equal to the higher of the Federal Funds rate or the overnight bank funding rate in effect on that day plus a spread. In addition, an annual commitment fee equal based on the unused balance is allocated to each participating fund.
For the six months ended December 31, 2022, there were no borrowings by the Fund under the agreement.
9. MARKET RISKS
On March 11, 2020, the World Health Organization announced that it had made the assessment that coronavirus disease 2019 (“COVID-19”) is a pandemic. The impacts of COVID-19 are affecting the entire global economy, individual companies and investment products, the funds, and the market in general. There is significant uncertainty around the extent and duration of business disruptions related to COVID-19 and the impacts may last for an extended period of time. COVID-19 has led to significant uncertainty and volatility in the financial markets.
10. INDEMNIFICATION
Under the Fund's organizational documents, the officers and Trustees have been granted certain indemnification rights against certain liabilities that may arise out of performance of their duties to the Fund. The Fund has entered into a separate agreement with each Trustee that converts indemnification rights currently existing under the Fund’s organizational documents into contractual rights that cannot be changed in the future without the consent of the Trustee. Additionally, in the normal course of business, the Fund may enter into contracts with service providers that contain a variety of indemnification clauses. The Fund’s maximum exposure under these arrangements is dependent on future claims that may be made against the Fund and, therefore, cannot be estimated.
Allspring Alternative Risk Premia Fund | 31
Other information (unaudited)
PROXY VOTING INFORMATION
A description of the policies and procedures used to determine how to vote proxies relating to portfolio securities is available without charge, upon request, by calling 1-800-222-8222, visiting our website at allspringglobal.com, or visiting the SEC website at sec.gov. Information regarding how the proxies related to portfolio securities were voted during the most recent 12-month period ended June 30 is available on the website at allspringglobal.com or by visiting the SEC website at sec.gov.
QUARTERLY PORTFOLIO HOLDINGS INFORMATION
The Fund files its complete schedule of portfolio holdings with the SEC for the first and third quarters of each fiscal year as an exhibit to its reports on Form N-PORT. Shareholders may view the filed Form N-PORT by visiting the SEC website at sec.gov.
32 | Allspring Alternative Risk Premia Fund
Other information (unaudited)
BOARD OF TRUSTEES AND OFFICERS
Each of the Trustees and Officers listed in the table below acts in identical capacities for each fund in the Allspring family of funds, which consists of 127 mutual funds comprising the Allspring Funds Trust, Allspring Variable Trust, Allspring Master Trust and four closed-end funds (collectively the “Fund Complex”). This table should be read in conjunction with the Prospectus and the Statement of Additional Information1. The mailing address of each Trustee and Officer is 1415 Vantage Park Drive, 3rd Floor, Charlotte, NC 28203. Each Trustee and Officer serves an indefinite term, however, each Trustee serves such term until reaching the mandatory retirement age established by the Trustees.
Independent Trustees
Name and
year of birth | Position held and
length of service* | Principal occupations during past five years or longer | Current other
public company or
investment
company
directorships |
William R. Ebsworth
(Born 1957) | Trustee,
since 2015 | Retired. From 1984 to 2013, equities analyst, portfolio manager, research director and chief investment officer at Fidelity Management and Research Company in Boston, Tokyo, and Hong Kong, and retired in 2013 as Chief Investment Officer of Fidelity Strategic Advisers, Inc. where he led a team of investment professionals managing client assets. Prior thereto, Board member of Hong Kong Securities Clearing Co., Hong Kong Options Clearing Corp., the Thailand International Fund, Ltd., Fidelity Investments Life Insurance Company, and Empire Fidelity Investments Life Insurance Company. Audit Committee Chair and Investment Committee Chair of the Vincent Memorial Hospital Foundation (non-profit organization). Mr. Ebsworth is a CFA® charterholder. | N/A |
Jane A. Freeman
(Born 1953) | Trustee,
since 2015;
Chair Liaison,
since 2018 | Retired. From 2012 to 2014 and 1999 to 2008, Chief Financial Officer of Scientific Learning Corporation. From 2008 to 2012, Ms. Freeman provided consulting services related to strategic business projects. Prior to 1999, Portfolio Manager at Rockefeller & Co. and Scudder, Stevens & Clark. Board member of the Harding Loevner Funds from 1996 to 2014, serving as both Lead Independent Director and chair of the Audit Committee. Board member of the Russell Exchange Traded Funds Trust from 2011 to 2012 and the chair of the Audit Committee. Ms. Freeman is also an inactive Chartered Financial Analyst. | N/A |
Isaiah Harris, Jr.
(Born 1952) | Trustee,
since 2009; Audit
Committee
Chair,
since 2019 | Retired. Member of the Advisory Board of CEF of East Central Florida. Chairman of the Board of CIGNA Corporation from 2009 to 2021, and Director from 2005 to 2008. From 2003 to 2011, Director of Deluxe Corporation. Prior thereto, President and CEO of BellSouth Advertising and Publishing Corp. from 2005 to 2007, President and CEO of BellSouth Enterprises from 2004 to 2005 and President of BellSouth Consumer Services from 2000 to 2003. Emeritus member of the Iowa State University Foundation Board of Governors. Emeritus Member of the Advisory Board of Iowa State University School of Business. Advisory Board Member, Palm Harbor Academy (private school). Advisory Board Member, Fellowship of Christian Athletes. Mr. Harris is a certified public accountant (inactive status). | N/A |
David F. Larcker
(Born 1950) | Trustee,
since 2009 | Distinguished Visiting Fellow at the Hoover Institution since 2022. James Irvin Miller Professor of Accounting at the Graduate School of Business (Emeritus), Stanford University, Director of the Corporate Governance Research Initiative and Senior Faculty of The Rock Center for Corporate Governance since 2006. From 2005 to 2008, Professor of Accounting at the Graduate School of Business, Stanford University. Prior thereto, Ernst & Young Professor of Accounting at The Wharton School, University of Pennsylvania from 1985 to 2005. | N/A |
Allspring Alternative Risk Premia Fund | 33
Other information (unaudited)
Name and
year of birth | Position held and
length of service* | Principal occupations during past five years or longer | Current other
public company or
investment
company
directorships |
Olivia S. Mitchell
(Born 1953) | Trustee,
since 2006;
Nominating and
Governance
Committee Chair,
since 2018 | International Foundation of Employee Benefit Plans Professor since 1993, Wharton School of the University of Pennsylvania. Director of Wharton’s Pension Research Council and Boettner Center on Pensions & Retirement Research, and Research Associate at the National Bureau of Economic Research. Previously taught at Cornell University from 1978 to 1993. | N/A |
Timothy J. Penny
(Born 1951) | Trustee,
since 1996;
Chair,
since 2018 | President and Chief Executive Officer of Southern Minnesota Initiative Foundation, a non-profit organization, since 2007. Vice Chair of the Economic Club of Minnesota, since 2007. Co-Chair of the Committee for a Responsible Federal Budget, since 1995. Member of the Board of Trustees of NorthStar Education Finance, Inc., a non-profit organization, from 2007-2022. Senior Fellow of the University of Minnesota Humphrey Institute from 1995 to 2017. | N/A |
James G. Polisson
(Born 1959) | Trustee,
since 2018 | Retired. Chief Marketing Officer, Source (ETF) UK Services, Ltd, from 2015 to 2017. From 2012 to 2015, Principal of The Polisson Group, LLC, a management consulting, corporate advisory and principal investing company. Chief Executive Officer and Managing Director at Russell Investments, Global Exchange Traded Funds from 2010 to 2012. Managing Director of Barclays Global Investors from 1998 to 2010 and Global Chief Marketing Officer for iShares and Barclays Global Investors from 2000 to 2010. Trustee of the San Francisco Mechanics’ Institute, a non-profit organization, from 2013 to 2015. Board member of the Russell Exchange Traded Fund Trust from 2011 to 2012. Director of Barclays Global Investors Holdings Deutschland GmbH from 2006 to 2009. Mr. Polisson is an attorney and has a retired status with the Massachusetts and District of Columbia Bar Associations. | N/A |
Pamela Wheelock
(Born 1959) | Trustee,
since January
2020; previously
Trustee from
January 2018 to
July 2019 | Retired. Executive and Senior Financial leadership positions in the public, private and nonprofit sectors. Interim President and CEO, McKnight Foundation, 2020. Interim Commissioner, Minnesota Department of Human Services, 2019. Chief Operating Officer, Twin Cities Habitat for Humanity, 2017-2019. Vice President for University Services, University of Minnesota, 2012-2016. Interim President and CEO, Blue Cross and Blue Shield of Minnesota, 2011-2012. Executive Vice-President and Chief Financial Officer, Minnesota Wild, 2002-2008. Commissioner, Minnesota Department of Finance, 1999-2002. Chair of the Board of Directors of Destination Medical Center Corporation. Board member of the Minnesota Wild Foundation. | N/A |
* Length of service dates reflect the Trustee’s commencement of service with the Trust’s predecessor entities, where applicable.
34 | Allspring Alternative Risk Premia Fund
Other information (unaudited)
Officers2
Name and
year of birth | Position held and
length of service | Principal occupations during past five years or longer |
Andrew Owen
(Born 1960) | President,
since 2017 | President and Chief Executive Officer of Allspring Funds Management, LLC since 2017 and Head of Global Fund Governance of Allspring Global Investments since 2022. Prior thereto, co-president of Galliard Capital Management, LLC, an affiliate of Allspring Funds Management, LLC, from 2019 to 2022 and Head of Affiliated Managers, Allspring Global Investments, from 2014 to 2019 and Executive Vice President responsible for marketing, investments and product development for Allspring Funds Management, LLC, from 2009 to 2014. |
Jeremy DePalma
(Born 1974) | Treasurer,
since 2012
(for certain funds in
the Fund Complex);
since 2021 (for
the remaining funds in the
Fund Complex) | Senior Vice President of Allspring Funds Management, LLC since 2009. Senior Vice President of Evergreen Investment Management Company, LLC from 2008 to 2010 and head of the Fund Reporting and Control Team within Fund Administration from 2005 to 2010. |
Christopher Baker
(Born 1976) | Chief Compliance Officer, since 2022 | Global Chief Compliance Officer for Allspring Global Investments since 2022. Prior thereto, Chief Compliance Officer for State Street Global Advisors from 2018 to 2021. Senior Compliance Officer for the State Street divisions of Alternative Investment Solutions, Sector Solutions, and Global Marketing from 2015 to 2018. From 2010 to 2015 Vice President, Global Head of Investment and Marketing Compliance for State Street Global Advisors. |
Matthew Prasse
(Born 1983) | Chief Legal Officer, since 2022; Secretary, since 2021 | Senior Counsel of the Allspring Legal Department since 2021. Senior Counsel of the Wells Fargo Legal Department from 2018 to 2021. Previously, Counsel for Barings LLC from 2015 to 2018. Prior to joining Barings, Associate at Morgan, Lewis & Bockius LLP from 2008 to 2015. |
1 The Statement of Additional Information includes additional information about the Trustees and is available, without charge, upon request, by calling 1-800-222-8222 or by visiting the website at allspringglobal.com.
2 For those Officers with tenures at Allspring Global Investments and/or Allspring Funds Management, LLC that began prior to 2021, such tenures include years of service during which these businesses/entities were known as Wells Fargo Asset Management and Wells Fargo Funds Management, LLC, respectively.
Allspring Alternative Risk Premia Fund | 35
For more information
More information about Allspring Funds is available free upon request. To obtain literature, please write, visit the Fund's website, or call:
Allspring Funds
P.O. Box 219967
Kansas City, MO 64121-9967
Website: allspringglobal.com
Individual investors: 1-800-222-8222
Retail investment professionals: 1-888-877-9275
Institutional investment professionals: 1-800-260-5969
This report and the financial statements contained herein are submitted for the general information of the shareholders of the Fund. If this report is used for promotional purposes, distribution of the report must be accompanied or preceded by a current prospectus. Before investing, please consider the investment objectives, risks, charges, and expenses of the investment. For a current prospectus and, if available, a summary prospectus, containing this information, call
1-800-222-8222 or visit the Fund's website at allspringglobal.com. Read the prospectus carefully before you invest or send money.
Allspring Global InvestmentsTM is the trade name for the asset management firms of Allspring Global Investments Holdings, LLC, a holding company indirectly owned by certain private funds of GTCR LLC and Reverence Capital Partners, L.P. These firms include but are not limited to Allspring Global Investments, LLC, and Allspring Funds Management, LLC. Certain products managed by Allspring entities are distributed by Allspring Funds Distributor, LLC (a broker-dealer and Member FINRA/SIPC).
This material is for general informational and educational purposes only and is NOT intended to provide investment advice or a recommendation of any kind - including a recommendation for any specific investment, strategy, or plan.
© 2023 Allspring Global Investments Holdings, LLC. All rights reserved.
ALL-01092023-uhrcgln0 02-23
SAR4723 12-22
ITEM 2. CODE OF ETHICS
Not applicable.
ITEM 3. AUDIT COMMITTEE FINANCIAL EXPERT
Not applicable.
ITEM 4. PRINCIPAL ACCOUNTANT FEES AND SERVICES
Not applicable.
ITEM 5. AUDIT COMMITTEE OF LISTED REGISTRANTS
Not applicable.
ITEM 6. INVESTMENTS
A Portfolio of Investments for each series of Allspring Funds Trust is included as part of the report to shareholders filed under Item 1 of this Form.
ITEM 7. DISCLOSURE OF PROXY VOTING POLICIES AND PROCEDURES FOR CLOSED-END MANAGEMENT INVESTMENT COMPANIES
Not applicable.
ITEM 8. PORTFOLIO MANAGERS OF CLOSED-END MANAGEMENT INVESTMENT COMPANIES
Not applicable.
ITEM 9. PURCHASES OF EQUITY SECURITIES BY CLOSED-END MANAGEMEENT INVESTMENT COMPANY AND AFFILIATED PURCHASERS
Not applicable.
ITEM 10. SUBMISSION OF MATTERS TO A VOTE OF SECURITY HOLDERS
There have been no material changes to the procedures by which shareholders may recommend nominees to the registrant’s Board of Trustees that have been implemented since the registrant’s last provided disclosure in response to the requirements of this Item.
ITEM 11. CONTROLS AND PROCEDURES
(a) The President and Treasurer have concluded that the Allspring Funds Trust disclosure controls and procedures (as defined in Rule 30a-3(c) under the Investment Company Act of 1940) provide reasonable assurances that material information relating to the registrant is made known to them by the appropriate persons, based on their evaluation of these controls and procedures as of a date within 90 days of the filing of this report.
(b) There were no significant changes in the registrant’s internal controls over financial reporting (as defined in Rule 30a-3(d) under the Investment Company Act of 1940) that occurred during the most recent fiscal half-year of the period covered by this report that materially affected, or is reasonably likely to materially affect, the registrant’s internal control over financial reporting.
ITEM 12. DISCLOSURES OF SECURITIES LENDING ACTIVITES FOR CLOSED-END MANAGEMENT INVESTMENT COMPANIES
Not applicable.
ITEM 13. EXHIBITS
(a)(1) Not applicable.
(a)(2) Certifications pursuant to Section 302 of the Sarbanes-Oxley Act of 2002.
(b) Certifications pursuant to Section 906 of the Sarbanes-Oxley Act of 2002.
SIGNATURES
Pursuant to the requirements of the Securities Exchange Act of 1934 and the Investment Company Act of 1940, the registrant has duly caused this report to be signed on its behalf by the undersigned, thereunto duly authorized.
| | |
| Allspring Funds Trust |
| |
| By: | | /s/ Andrew Owen |
| | Andrew Owen |
| | President |
| |
| Date: | | February 27, 2023 |
Pursuant to the requirements of the Securities Exchange Act of 1934 and the Investment Company Act of 1940, this report has been signed below by the following persons on behalf of the registrant and in the capacities and on the date indicated.
| | |
| Allspring Funds Trust |
| |
| By: | | /s/ Andrew Owen |
| | Andrew Owen |
| | President |
| |
| Date: | | February 27, 2023 |
| |
| By: | | /s/ Jeremy DePalma |
| | Jeremy DePalma |
| | Treasurer |
| |
| Date: | | February 27, 2023 |