UNITED STATES
SECURITIES AND EXCHANGE COMMISSION
Washington, D.C. 20549
FORM N-CSRS
CERTIFIED SHAREHOLDER REPORT OF REGISTERED
MANAGEMENT INVESTMENT COMPANIES
Investment Company Act file number: 811-09253
Allspring Funds Trust
(Exact name of registrant as specified in charter)
1415 Vantage Park Drive, 3rd Floor, Charlotte, NC 28203
(Address of principal executive offices) (Zip code)
Matthew Prasse
Allspring Funds Management, LLC
1415 Vantage Park Drive, 3rd Floor, Charlotte, NC 28203
(Name and address of agent for service)
Registrant’s telephone number, including area code: 800-222-8222
Date of fiscal year end: July 31
Registrant is making a filing for 9 of its series:
Allspring Disciplined U.S. Core Fund, Allspring Discovery Large Cap Growth Fund, Allspring Growth Fund, Allspring Special Large Cap Value Fund, Allspring Large Cap Core Fund, Allspring Large Cap Growth Fund, Allspring Large Company Value Fund, Allspring Discovery All Cap Growth Fund and Allspring Premier Large Company Growth Fund.
Date of reporting period: January 31, 2023
| ITEM 1. | REPORT TO STOCKHOLDERS |
Semi-Annual Report
January 31, 2023
Allspring
Special Large Cap Value Fund
The views expressed and any forward-looking statements are as of January 31, 2023, unless otherwise noted, and are those of the Fund's portfolio managers and/or Allspring Global Investments. Discussions of individual securities or the markets generally are not intended as individual recommendations. Future events or results may vary significantly from those expressed in any forward-looking statements. The views expressed are subject to change at any time in response to changing circumstances in the market. Allspring Global Investments disclaims any obligation to publicly update or revise any views expressed or forward-looking statements.
Allspring Special Large Cap Value Fund | 1
Letter to shareholders (unaudited)
Andrew Owen
President
Allspring Funds
Dear Shareholder:
We are pleased to offer you this semi-annual report for the Allspring Special Large Cap Value Fund for the six-month period that ended January 31, 2023. Globally, stocks and bonds experienced heightened volatility through the challenging period. Earlier tailwinds provided by global stimulus programs, vaccination rollouts, and recovering consumer and corporate sentiment were wiped away by the highest rate of inflation in four decades as well as the impact of ongoing aggressive central bank rate hikes and the prospect of more rate hikes. Compounding these concerns were the global reverberations of the Russia-Ukraine war and the impact of China’s strict COVID-19 lockdowns.
For the six-month period, stocks and bonds had mixed results, with non-U.S. equities––both developed market and emerging market––outperforming U.S. stocks overall. Bonds––both U.S. and non-U.S.––struggled to cope with sustained aggressive interest rate increases. For the period, U.S. stocks, based on the S&P 500 Index,1 lost 0.44%. International stocks, as measured by the MSCI ACWI ex USA Index (Net),2 returned 7.63%, while the MSCI EM Index (Net) (USD)3 gained 4.92%. Among bond indexes, the Bloomberg U.S. Aggregate Bond Index4 returned -2.37%, the Bloomberg Global Aggregate ex-USD Index (unhedged)5 returned -1.15%, the Bloomberg Municipal Bond Index6 gained 0.73%, and the ICE BofA U.S. High Yield Index7 returned 1.27%.
The Russia-Ukraine war, high inflation, and central bank rate hikes rocked markets
August was yet another broadly challenging month for financial markets, with more red ink flowing. High inflation persisted, cresting 9% in the eurozone on an annual basis and remaining above 8% in the U.S. despite the Federal Reserve’s (Fed’s) aggressive monetary policy and a major drop in global crude oil and gasoline prices from their June peak. One positive note was the resilience of the U.S. job market. However, the Fed’s job was clearly not complete. One longer-term bright spot was the U.S. Congress’s passage of the Inflation Reduction Act. Its primary stated goals include: to reduce inflation (though not immediately) by curbing the deficit, capping health care spending by seniors, and investing in domestic sources of clean energy.
“August was yet another broadly challenging month for financial markets, with more red ink flowing.”
| 1 | The S&P 500 Index consists of 500 stocks chosen for market size, liquidity, and industry group representation. It is a market-value-weighted index with each stock's weight in the index proportionate to its market value. You cannot invest directly in an index. |
| 2 | The Morgan Stanley Capital International (MSCI) All Country World Index (ACWI) ex USA Index (Net) is a free-float-adjusted market-capitalization-weighted index that is designed to measure the equity market performance of developed and emerging markets, excluding the U.S. Source: MSCI. MSCI makes no express or implied warranties or representations and shall have no liability whatsoever with respect to any MSCI data contained herein. The MSCI data may not be further redistributed or used as a basis for other indexes or any securities or financial products. This report is not approved, reviewed, or produced by MSCI. You cannot invest directly in an index. |
| 3 | The MSCI Emerging Markets (EM) Index (Net) (USD) is a free-float-adjusted market-capitalization-weighted index that is designed to measure equity market performance of emerging markets. You cannot invest directly in an index. |
| 4 | The Bloomberg U.S. Aggregate Bond Index is a broad-based benchmark that measures the investment-grade, U.S.-dollar-denominated, fixed-rate taxable bond market, including Treasuries, government-related and corporate securities, mortgage-backed securities (agency fixed-rate and hybrid adjustable-rate mortgage pass-throughs), asset-backed securities, and commercial mortgage-backed securities. You cannot invest directly in an index. |
| 5 | The Bloomberg Global Aggregate ex-USD Index (unhedged) is an unmanaged index that provides a broad-based measure of the global investment-grade fixed-income markets excluding the U.S.-dollar-denominated debt market. You cannot invest directly in an index. |
| 6 | The Bloomberg Municipal Bond Index is an unmanaged index composed of long-term tax-exempt bonds with a minimum credit rating of Baa. You cannot invest directly in an index. |
| 7 | The ICE BofA U.S. High Yield Index is a market-capitalization-weighted index of domestic and Yankee high-yield bonds. The index tracks the performance of high-yield securities traded in the U.S. bond market. You cannot invest directly in an index. Copyright 2023. ICE Data Indices, LLC. All rights reserved. |
2 | Allspring Special Large Cap Value Fund
Letter to shareholders (unaudited)
The market misery continued in September. There was nowhere to hide as all asset classes suffered major losses at the hands of persistent inflation. Central banks kept up their battle against rapidly rising prices with more rate hikes. The strength of the U.S. dollar made things even more difficult for investors holding assets in other currencies. U.S. mortgage rates jumped to near 7% on 30-year fixed-rate mortgages; the decreased housing affordability began to cool demand somewhat. The U.K. experienced a sharp sell-off of government bonds and the British pound in September as investors panicked in response to a new government budget that was seen as financially unsound. The market meltdown forced the Bank of England to step in and buy long-dated government bonds.
Equities had a reprieve in October after two months of sharp declines. Value stocks and small caps fared best. Globally, developed markets outpaced emerging market equities, which were hurt by weakness among Chinese stocks. Central banks continued to try to curtail high inflation with aggressive interest rate hikes. Geopolitical risks persisted, including the ongoing Russia-Ukraine war and economic, financial market, and political turmoil in the U.K., which led to a second prime ministerial change in six weeks, as Rishi Sunak replaced Liz Truss in late October. Concerns over Europe’s energy crisis eased thanks to unseasonably warm weather and plentiful gas on hand. The U.S. labor market continued its resilience against rising prices, as unemployment stood at 3.7%, near a record low.
Stocks and bonds rallied in November, with emerging market equities gaining nearly 15% and developed market equities returning 7%. The S&P 500 Index rose 5.6% in November. Bonds also had positive monthly returns. Economic news was encouraging, driven by U.S. labor market strength. Although central banks kept raising rates, expectations grew regarding an impending easing in the pace of rate hikes and a possible end to central bank monetary tightening in 2023. Although inflation remained at record highs in the eurozone, with a 10.6% annual increase in October, Germany’s producer prices decreased 4.2% annually, signaling a possible decline in inflationary pressures. Meanwhile, U.S. inflation continued to moderate, with a 7.1% annual price rise in November and a monthly price increase of just 0.1%. China’s economic data remained weak, reflecting its zero-COVID-19 policy.
Financial markets cooled in December, with U.S. equities posting negative overall results in response to a weakening U.S. dollar. Fixed income securities ended one of their worst years ever with flat overall monthly returns as markets weighed the hopes for an end to the monetary tightening cycle with the reality that central banks had not completed their jobs yet. U.S. Consumer Price Index (CPI)1 data showed a strong consistent trend downward, which brought down the 12-month CPI to 6.5% in December from 9.1% in June. Other countries and regions reported still-high but declining inflation rates as the year winded down.
The year 2023 began with a broad rally across global equities and fixed income securities. Investor optimism rose in response to data indicating declining inflation rates and the reopening of China’s economy with the abrupt end to its zero-COVID-19 policy. The U.S. reported surprisingly strong job gains––employers added more than 500,000 jobs––and unemployment fell to 3.4%, the lowest level since 1969. Meanwhile, wage growth, seen as a potential contributor to ongoing high inflation, continued to moderate. All eyes remained fixed on the Fed and on how many additional rate hikes it will announce before reaching the peak (“terminal”) rate, expected to be above 5%. The 0.25% federal funds rate hike announced in January was the Fed’s smallest rate increase since March 2022.
| 1 | The Consumer Price Index (CPI) is a measure of the average change over time in the prices paid by urban consumers for a market basket of consumer goods and services. You cannot invest directly in an index. |
Allspring Special Large Cap Value Fund | 3
Letter to shareholders (unaudited)
Don’t let short-term uncertainty derail long-term investment goals.
Periods of investment uncertainty can present challenges, but experience has taught us that maintaining long-term investment goals can be an effective way to plan for the future. To help you create a sound strategy based on your personal goals and risk tolerance, Allspring Funds offers more than 100 mutual funds spanning a wide range of asset classes and investment styles. Although diversification cannot guarantee an investment profit or prevent losses, we believe it can be an effective way to manage investment risk and potentially smooth out overall portfolio performance. We encourage investors to know their investments and to understand that appropriate levels of risk-taking may unlock opportunities.
Thank you for choosing to invest with Allspring Funds. We appreciate your confidence in us and remain committed to helping you meet your financial needs.
Sincerely,
Andrew Owen
President
Allspring Funds
For further information about your fund, contact your investment professional, visit our website at allspringglobal.com, or call us directly at 1-800-222-8222.
4 | Allspring Special Large Cap Value Fund
This page is intentionally left blank.
Performance highlights (unaudited)
| Investment objective | The Fund seeks long-term capital appreciation. |
| Manager | Allspring Funds Management, LLC |
| Subadviser | Allspring Global Investments, LLC |
| Portfolio managers | James M. Tringas, CFA ®‡, Bryant VanCronkhite, CFA ®‡, CPA, Shane Zweck, CFA ®‡ |
| Average annual total returns (%) as of January 31, 2023 |
| | | Including sales charge | | Excluding sales charge | | Expense ratios1 (%) |
| | Inception date | 1 year | 5 year | 10 year | | 1 year | 5 year | 10 year | | Gross | Net 2 |
| Class A (EIVAX) | 8-1-2006 | -5.98 | 6.21 | 9.05 | | -0.25 | 7.48 | 9.69 | | 1.18 | 1.11 |
| Class C (EIVCX) | 8-1-2006 | -2.01 | 6.71 | 9.05 | | -1.01 | 6.71 | 9.05 | | 1.93 | 1.86 |
| Class R (EIVTX)3 | 3-1-2013 | – | – | – | | -0.49 | 7.26 | 9.46 | | 1.43 | 1.36 |
| Class R6 (EIVFX) | 11-30-2012 | – | – | – | | 0.25 | 8.14 | 10.24 | | 0.75 | 0.65 |
| Administrator Class (EIVDX) | 7-30-2010 | – | – | – | | -0.08 | 7.66 | 9.89 | | 1.10 | 0.95 |
| Institutional Class (EIVIX) | 8-1-2006 | – | – | – | | 0.15 | 7.91 | 10.15 | | 0.85 | 0.70 |
| Russell 1000® Value Index4 | – | – | – | – | | -0.43 | 6.94 | 10.15 | | – | – |
Figures quoted represent past performance, which is no guarantee of future results, and do not reflect taxes that a shareholder may pay on an investment in a fund. Investment return and principal value of an investment will fluctuate so that an investor’s shares, when redeemed, may be worth more or less than their original cost. Performance shown without sales charges would be lower if sales charges were reflected. Current performance may be lower or higher than the performance data quoted, which assumes the reinvestment of dividends and capital gains. Current month-end performance is available on the Fund’s website, allspringglobal.com.
Index returns do not include transaction costs associated with buying and selling securities, any mutual fund fees or expenses, or any taxes. It is not possible to invest directly in an index.
For Class A shares, the maximum front-end sales charge is 5.75%. For Class C shares, the maximum contingent deferred sales charge is 1.00%. Performance including a contingent deferred sales charge assumes the sales charge for the corresponding time period. Class R, Class R6, Administrator Class and Institutional Class shares are sold without a front-end sales charge or contingent deferred sales charge.
| 1 | Reflects the expense ratios as stated in the most recent prospectuses. The expense ratios shown are subject to change and may differ from the annualized expense ratios shown in the financial highlights of this report. |
| 2 | The manager has contractually committed through November 30, 2023, to waive fees and/or reimburse expenses to the extent necessary to cap total annual fund operating expenses after fee waivers at 1.11% for Class A, 1.86% for Class C, 1.36% for Class R, 0.65% for Class R6, 0.95% for Administrator Class, and 0.70% for Institutional Class. Brokerage commissions, stamp duty fees, interest, taxes, acquired fund fees and expenses (if any), and extraordinary expenses are excluded from the expense caps. Prior to or after the commitment expiration date, the caps may be increased or the commitment to maintain the caps may be terminated only with the approval of the Board of Trustees. Without these caps, the Fund’s returns would have been lower. The expense ratio paid by an investor is the net expense ratio (the total annual fund operating expenses after fee waivers) as stated in the prospectuses. |
| 3 | Historical performance shown for the Class R shares prior to their inception reflects the performance of the Institutional Class shares, adjusted to reflect the higher expenses applicable to the Class R shares. |
| 4 | The Russell 1000® Value Index measures the performance of those Russell 1000 companies with lower price/book ratios and lower forecasted growth values. You cannot invest directly in an index. |
Stock values fluctuate in response to the activities of individual companies and general market and economic conditions. Certain investment strategies tend to increase the total risk of an investment (relative to the broader market). This fund is exposed to foreign investment risk and focused portfolio risk. Consult the Fund’s prospectus for additional information on these and other risks.
| ‡ | CFA® and Chartered Financial Analyst® are trademarks owned by CFA Institute. |
6 | Allspring Special Large Cap Value Fund
Performance highlights (unaudited)
| Ten largest holdings (%) as of January 31, 20231 |
| Walmart Incorporated | 3.79 |
| AerCap Holdings NV | 3.77 |
| General Motors Company | 3.24 |
| ConocoPhillips | 3.20 |
| Caterpillar Incorporated | 3.16 |
| Merck & Company Incorporated | 3.13 |
| American International Group Incorporated | 3.09 |
| Alphabet Incorporated Class C | 3.07 |
| Bank of America Corporation | 3.02 |
| NextEra Energy Incorporated | 3.00 |
| 1 | Figures represent the percentage of the Fund's net assets. Holdings are subject to change and may have changed since the date specified. |
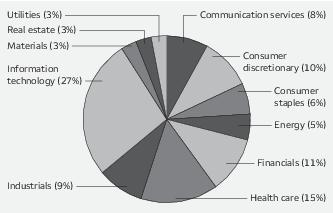
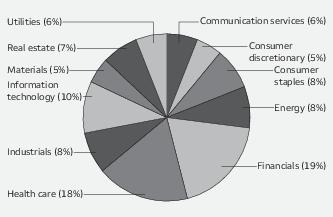
| Sector allocation as of January 31, 20231 |
| 1 | Figures represent the percentage of the Fund's long-term investments. Allocations are subject to change and may have changed since the date specified. |
Allspring Special Large Cap Value Fund | 7
Fund expenses (unaudited)
As a shareholder of the Fund, you incur two types of costs: (1) transaction costs, including sales charges (loads) on purchase payments and contingent deferred sales charges (if any) on redemptions and (2) ongoing costs, including management fees, distribution (12b-1) and/or shareholder servicing fees, and other Fund expenses. This example is intended to help you understand your ongoing costs (in dollars) of investing in the Fund and to compare these costs with the ongoing costs of investing in other mutual funds.
The example is based on an investment of $1,000 invested at the beginning of the six-month period and held for the entire period from August 1, 2022 to January 31, 2023.
Actual expenses
The “Actual” line of the table below provides information about actual account values and actual expenses. You may use the information in this line, together with the amount you invested, to estimate the expenses that you paid over the period. Simply divide your account value by $1,000 (for example, an $8,600 account value divided by $1,000 = 8.6), then multiply the result by the number in the “Actual” line under the heading entitled “Expenses paid during period” for your applicable class of shares to estimate the expenses you paid on your account during this period.
Hypothetical example for comparison purposes
The “Hypothetical” line of the table below provides information about hypothetical account values and hypothetical expenses based on the Fund’s actual expense ratio and an assumed rate of return of 5% per year before expenses, which is not the Fund’s actual return. The hypothetical account values and expenses may not be used to estimate the actual ending account balance or expenses you paid for the period. You may use this information to compare the ongoing costs of investing in the Fund and other funds. To do so, compare this 5% hypothetical example with the 5% hypothetical examples that appear in the shareholder reports of the other funds.
Please note that the expenses shown in the table are meant to highlight your ongoing costs only and do not reflect any transactional costs, such as sales charges (loads) and contingent deferred sales charges. Therefore, the “Hypothetical” line of the table is useful in comparing ongoing costs only, and will not help you determine the relative total costs of owning different funds. In addition, if these transactional costs were included, your costs would have been higher.
| | Beginning
account value
8-1-2022 | Ending
account value
1-31-2023 | Expenses
paid during
the period1 | Annualized net
expense ratio |
| Class A | | | | |
| Actual | $1,000.00 | $1,087.35 | $5.79 | 1.10% |
| Hypothetical (5% return before expenses) | $1,000.00 | $1,019.66 | $5.60 | 1.10% |
| Class C | | | | |
| Actual | $1,000.00 | $1,082.88 | $9.76 | 1.86% |
| Hypothetical (5% return before expenses) | $1,000.00 | $1,015.83 | $9.45 | 1.86% |
| Class R | | | | |
| Actual | $1,000.00 | $1,085.43 | $7.15 | 1.36% |
| Hypothetical (5% return before expenses) | $1,000.00 | $1,018.35 | $6.92 | 1.36% |
| Class R6 | | | | |
| Actual | $1,000.00 | $1,090.24 | $3.42 | 0.65% |
| Hypothetical (5% return before expenses) | $1,000.00 | $1,021.93 | $3.31 | 0.65% |
| Administrator Class | | | | |
| Actual | $1,000.00 | $1,088.17 | $5.00 | 0.95% |
| Hypothetical (5% return before expenses) | $1,000.00 | $1,020.42 | $4.84 | 0.95% |
| Institutional Class | | | | |
| Actual | $1,000.00 | $1,090.03 | $3.69 | 0.70% |
| Hypothetical (5% return before expenses) | $1,000.00 | $1,021.68 | $3.57 | 0.70% |
1 Expenses paid is equal to the annualized net expense ratio of each class multiplied by the average account value over the period, multiplied by 184 divided by 365 (to reflect the one-half-year period).
8 | Allspring Special Large Cap Value Fund
Portfolio of investments—January 31, 2023
| | | | | Shares | Value |
| Common stocks: 97.44% | | | | | |
| Communication services: 4.74% | | | | | |
| Interactive media & services: 3.07% | | | | | |
| Alphabet Incorporated Class C † | | | | 248,602 | $ 24,827,882 |
| Media: 1.67% | | | | | |
| Comcast Corporation Class A | | | | 342,622 | 13,482,176 |
| Consumer discretionary: 6.00% | | | | | |
| Automobiles: 3.24% | | | | | |
| General Motors Company | | | | 666,539 | 26,208,313 |
| Household durables: 2.76% | | | | | |
| D.R. Horton Incorporated | | | | 226,268 | 22,330,389 |
| Consumer staples: 8.17% | | | | | |
| Beverages: 1.95% | | | | | |
| Keurig Dr. Pepper Incorporated | | | | 446,003 | 15,734,986 |
| Food & staples retailing: 3.79% | | | | | |
| Walmart Incorporated | | | | 212,729 | 30,605,321 |
| Personal products: 2.43% | | | | | |
| Unilever plc ADR | | | | 385,293 | 19,688,472 |
| Energy: 8.19% | | | | | |
| Oil, gas & consumable fuels: 8.19% | | | | | |
| ConocoPhillips | | | | 212,162 | 25,856,183 |
| EOG Resources Incorporated | | | | 169,239 | 22,381,858 |
| Exxon Mobil Corporation | | | | 154,848 | 17,963,916 |
| | | | | | 66,201,957 |
| Financials: 15.08% | | | | | |
| Banks: 6.02% | | | | | |
| Bank of America Corporation | | | | 688,240 | 24,418,755 |
| JPMorgan Chase & Company | | | | 173,242 | 24,246,950 |
| | | | | | 48,665,705 |
| Capital markets: 3.44% | | | | | |
| Intercontinental Exchange Incorporated | | | | 182,570 | 19,635,404 |
| The Goldman Sachs Group Incorporated | | | | 22,321 | 8,165,245 |
| | | | | | 27,800,649 |
| Insurance: 5.62% | | | | | |
| American International Group Incorporated | | | | 394,788 | 24,958,497 |
| The Allstate Corporation | | | | 159,570 | 20,499,958 |
| | | | | | 45,458,455 |
| Health care: 15.52% | | | | | |
| Biotechnology: 1.37% | | | | | |
| Vertex Pharmaceuticals Incorporated † | | | | 34,361 | 11,102,039 |
The accompanying notes are an integral part of these financial statements.
Allspring Special Large Cap Value Fund | 9
Portfolio of investments—January 31, 2023
| | | | | Shares | Value |
| Health care equipment & supplies: 6.29% | | | | | |
| Abbott Laboratories | | | | 73,103 | $ 8,081,536 |
| Medtronic plc | | | | 233,293 | 19,524,291 |
| Stryker Corporation | | | | 23,435 | 5,948,037 |
| Teleflex Incorporated | | | | 71,177 | 17,325,905 |
| | | | | | 50,879,769 |
| Health care providers & services: 4.73% | | | | | |
| Cigna Corporation | | | | 71,465 | 22,630,822 |
| Humana Incorporated | | | | 30,455 | 15,583,824 |
| | | | | | 38,214,646 |
| Pharmaceuticals: 3.13% | | | | | |
| Merck & Company Incorporated | | | | 235,294 | 25,272,929 |
| Industrials: 17.43% | | | | | |
| Aerospace & defense: 3.47% | | | | | |
| L3Harris Technologies Incorporated | | | | 40,973 | 8,801,820 |
| Raytheon Technologies Corporation | | | | 192,788 | 19,249,882 |
| | | | | | 28,051,702 |
| Commercial services & supplies: 2.28% | | | | | |
| Waste Management Incorporated | | | | 119,087 | 18,426,332 |
| Industrial conglomerates: 2.63% | | | | | |
| Honeywell International Incorporated | | | | 101,831 | 21,229,727 |
| Machinery: 3.68% | | | | | |
| Caterpillar Incorporated | | | | 101,382 | 25,577,665 |
| Parker-Hannifin Corporation | | | | 12,805 | 4,174,430 |
| | | | | | 29,752,095 |
| Trading companies & distributors: 5.37% | | | | | |
| AerCap Holdings NV † | | | | 483,011 | 30,531,125 |
| Ferguson plc | | | | 90,810 | 12,925,895 |
| | | | | | 43,457,020 |
| Information technology: 12.51% | | | | | |
| IT services: 7.10% | | | | | |
| Accenture plc Class A | | | | 55,590 | 15,512,390 |
| Akamai Technologies Incorporated † | | | | 173,925 | 15,470,629 |
| Fiserv Incorporated † | | | | 114,797 | 12,246,544 |
| Visa Incorporated Class A | | | | 61,472 | 14,151,469 |
| | | | | | 57,381,032 |
| Semiconductors & semiconductor equipment: 1.39% | | | | | |
| NXP Semiconductors NV | | | | 61,215 | 11,282,537 |
| Software: 4.02% | | | | | |
| Cadence Design Systems Incorporated † | | | | 52,286 | 9,559,449 |
| Microsoft Corporation | | | | 92,486 | 22,918,956 |
| | | | | | 32,478,405 |
The accompanying notes are an integral part of these financial statements.
10 | Allspring Special Large Cap Value Fund
Portfolio of investments—January 31, 2023
| | | | | Shares | Value |
| Materials: 2.86% | | | | | |
| Construction materials: 2.86% | | | | | |
| Vulcan Materials Company | | | | 126,293 | $ 23,153,296 |
| Real estate: 3.94% | | | | | |
| Equity REITs: 2.31% | | | | | |
| Boston Properties Incorporated | | | | 139,228 | 10,378,055 |
| Public Storage Incorporated | | | | 27,394 | 8,337,090 |
| | | | | | 18,715,145 |
| Real estate management & development: 1.63% | | | | | |
| CBRE Group Incorporated Class A † | | | | 153,846 | 13,155,371 |
| Utilities: 3.00% | | | | | |
| Electric utilities: 3.00% | | | | | |
| NextEra Energy Incorporated | | | | 325,533 | 24,294,528 |
| Total Common stocks (Cost $621,637,015) | | | | | 787,850,878 |
| | | Yield | | | |
| Short-term investments: 2.94% | | | | | |
| Investment companies: 2.94% | | | | | |
| Allspring Government Money Market Fund Select Class ♠∞ | | 4.16% | | 23,820,636 | 23,820,636 |
| Total Short-term investments (Cost $23,820,636) | | | | | 23,820,636 |
| Total investments in securities (Cost $645,457,651) | 100.38% | | | | 811,671,514 |
| Other assets and liabilities, net | (0.38) | | | | (3,110,983) |
| Total net assets | 100.00% | | | | $808,560,531 |
| † | Non-income-earning security |
| ♠ | The issuer of the security is an affiliated person of the Fund as defined in the Investment Company Act of 1940. |
| ∞ | The rate represents the 7-day annualized yield at period end. |
| Abbreviations: |
| ADR | American depositary receipt |
| REIT | Real estate investment trust |
The accompanying notes are an integral part of these financial statements.
Allspring Special Large Cap Value Fund | 11
Portfolio of investments—January 31, 2023
Investments in affiliates
An affiliated investment is an investment in which the Fund owns at least 5% of the outstanding voting shares of the issuer or as a result of other relationships, such as the Fund and the issuer having the same investment manager. Transactions with issuers that were affiliates of the Fund at the end of the period were as follows:
| | Value,
beginning of
period | Purchases | Sales
proceeds | Net
realized
gains
(losses) | | Net
change in
unrealized
gains
(losses) | | Value,
end of
period | Shares,
end
of period | Income
from
affiliated
securities |
| Short-term investments | | | | | | | | | |
| Allspring Government Money Market Fund Select Class | $24,131,967 | $98,004,045 | $(98,315,376) | $0 | | $0 | | $ 23,820,636 | 23,820,636 | $ 386,454 |
Investments in affiliates no
longer held at end of period | | | | | | | | | | |
| Securities Lending Cash Investments LLC | 0 | 36,875 | (36,875) | 0 | | 0 | | 0 | 0 | 67 # |
| | | | | $0 | | $0 | | $23,820,636 | | $386,521 |
| # | Amount shown represents income before fees and rebates. |
The accompanying notes are an integral part of these financial statements.
12 | Allspring Special Large Cap Value Fund
Statement of assets and liabilities—January 31, 2023 (unaudited)
| | |
| Assets | |
Investments in unaffiliated securities, at value (cost $621,637,015)
| $ 787,850,878 |
Investments in affiliated securities, at value (cost $23,820,636)
| 23,820,636 |
Receivable for dividends
| 463,480 |
Receivable for Fund shares sold
| 28,317 |
Prepaid expenses and other assets
| 43,979 |
Total assets
| 812,207,290 |
| Liabilities | |
Payable for investments purchased
| 2,221,241 |
Payable for Fund shares redeemed
| 622,646 |
Management fee payable
| 382,169 |
Administration fees payable
| 101,616 |
Trustees’ fees and expenses payable
| 6,166 |
Distribution fees payable
| 960 |
Accrued expenses and other liabilities
| 311,961 |
Total liabilities
| 3,646,759 |
Total net assets
| $808,560,531 |
| Net assets consist of | |
Paid-in capital
| $ 632,099,228 |
Total distributable earnings
| 176,461,303 |
Total net assets
| $808,560,531 |
| Computation of net asset value and offering price per share | |
Net assets – Class A
| $ 255,583,666 |
Shares outstanding – Class A1
| 22,028,127 |
Net asset value per share – Class A
| $11.60 |
Maximum offering price per share – Class A2
| $12.31 |
Net assets – Class C
| $ 1,502,092 |
Shares outstanding – Class C1
| 133,582 |
Net asset value per share – Class C
| $11.24 |
Net assets – Class R
| $ 116,406 |
Shares outstanding – Class R1
| 9,909 |
Net asset value per share – Class R
| $11.75 |
Net assets – Class R6
| $ 41,668,412 |
Shares outstanding – Class R61
| 3,681,379 |
Net asset value per share – Class R6
| $11.32 |
Net assets – Administrator Class
| $ 451,644,957 |
Shares outstanding – Administrator Class1
| 36,240,381 |
Net asset value per share – Administrator Class
| $12.46 |
Net assets – Institutional Class
| $ 58,044,998 |
Shares outstanding – Institutional Class1
| 4,959,803 |
Net asset value per share – Institutional Class
| $11.70 |
| 1 | The Fund has an unlimited number of authorized shares. |
| 2 | Maximum offering price is computed as 100/94.25 of net asset value. On investments of $50,000 or more, the offering price is reduced. |
The accompanying notes are an integral part of these financial statements.
Allspring Special Large Cap Value Fund | 13
Statement of operations—six months ended January 31, 2023 (unaudited)
| | |
| Investment income | |
Dividends (net of foreign withholdings taxes of $17,576)
| $ 8,368,667 |
Income from affiliated securities
| 386,459 |
Total investment income
| 8,755,126 |
| Expenses | |
Management fee
| 2,696,025 |
| Administration fees | |
Class A
| 260,488 |
Class C
| 1,727 |
Class R
| 114 |
Class R6
| 6,194 |
Administrator Class
| 285,136 |
Institutional Class
| 32,726 |
| Shareholder servicing fees | |
Class A
| 303,021 |
Class C
| 2,051 |
Class R
| 136 |
Administrator Class
| 544,114 |
| Distribution fees | |
Class C
| 6,154 |
Class R
| 118 |
Custody and accounting fees
| 19,780 |
Professional fees
| 23,832 |
Registration fees
| 37,836 |
Shareholder report expenses
| 25,210 |
Trustees’ fees and expenses
| 11,027 |
Other fees and expenses
| 7,137 |
Total expenses
| 4,262,826 |
| Less: Fee waivers and/or expense reimbursements | |
Fund-level
| (275,323) |
Class A
| (9,179) |
Class R6
| (6,194) |
Administrator Class
| (176,913) |
Institutional Class
| (20,608) |
Net expenses
| 3,774,609 |
Net investment income
| 4,980,517 |
| Realized and unrealized gains (losses) on investments | |
Net realized gains on investments
| 9,821,478 |
Net change in unrealized gains (losses) on investments
| 51,680,236 |
Net realized and unrealized gains (losses) on investments
| 61,501,714 |
Net increase in net assets resulting from operations
| $66,482,231 |
The accompanying notes are an integral part of these financial statements.
14 | Allspring Special Large Cap Value Fund
Statement of changes in net assets
| | | | | |
| | Six months ended
January 31, 2023
(unaudited) | Year ended
July 31, 2022 |
| Operations | | | | |
Net investment income
| | $ 4,980,517 | | $ 5,610,182 |
Net realized gains on investments
| | 9,821,478 | | 76,574,770 |
Net change in unrealized gains (losses) on investments
| | 51,680,236 | | (125,314,708) |
Net increase (decrease) in net assets resulting from operations
| | 66,482,231 | | (43,129,756) |
| Distributions to shareholders from | | | | |
| Net investment income and net realized gains | | | | |
Class A
| | (21,506,191) | | (53,341,156) |
Class C
| | (109,116) | | (416,230) |
Class R
| | (9,285) | | (18,487) |
Class R6
| | (3,760,345) | | (1,180,752) |
Administrator Class
| | (36,706,544) | | (87,453,886) |
Institutional Class
| | (4,220,939) | | (12,533,899) |
Total distributions to shareholders
| | (66,312,420) | | (154,944,410) |
| Capital share transactions | Shares | | Shares | |
| Proceeds from shares sold | | | | |
Class A
| 216,778 | 2,476,591 | 324,090 | 4,276,971 |
Class C
| 19,163 | 208,599 | 36,301 | 482,008 |
Class R
| 284 | 3,339 | 948 | 12,262 |
Class R6
| 207,479 | 2,242,283 | 3,978,072 | 49,735,620 |
Administrator Class
| 55,765 | 683,413 | 171,967 | 2,395,405 |
Institutional Class
| 1,142,568 | 12,964,487 | 1,030,473 | 15,516,545 |
| | | 18,578,712 | | 72,418,811 |
| Reinvestment of distributions | | | | |
Class A
| 1,821,930 | 20,569,076 | 3,914,851 | 50,679,898 |
Class C
| 10,048 | 109,116 | 33,272 | 416,230 |
Class R
| 814 | 9,285 | 1,414 | 18,487 |
Class R6
| 340,628 | 3,760,345 | 92,916 | 1,180,752 |
Administrator Class
| 2,870,257 | 34,825,949 | 5,964,339 | 82,619,695 |
Institutional Class
| 366,284 | 4,179,246 | 904,435 | 11,838,887 |
| | | 63,453,017 | | 146,753,949 |
| Payment for shares redeemed | | | | |
Class A
| (1,387,056) | (16,111,769) | (2,509,378) | (32,782,415) |
Class C
| (66,203) | (757,587) | (60,475) | (791,051) |
Class R
| (36) | (404) | (1,052) | (16,024) |
Class R6
| (621,746) | (7,060,844) | (1,355,475) | (18,601,665) |
Administrator Class
| (1,682,770) | (20,872,562) | (2,691,847) | (37,718,367) |
Institutional Class
| (922,815) | (10,783,512) | (1,720,987) | (23,698,526) |
| | | (55,586,678) | | (113,608,048) |
Net increase in net assets resulting from capital share transactions
| | 26,445,051 | | 105,564,712 |
Total increase (decrease) in net assets
| | 26,614,862 | | (92,509,454) |
| Net assets | | | | |
Beginning of period
| | 781,945,669 | | 874,455,123 |
End of period
| | $808,560,531 | | $ 781,945,669 |
The accompanying notes are an integral part of these financial statements.
Allspring Special Large Cap Value Fund | 15
Financial highlights
(For a share outstanding throughout each period)
| | | Year ended July 31 |
| Class A | Six months ended
January 31, 2023
(unaudited) | 2022 | 2021 | 2020 | 2019 | 2018 |
Net asset value, beginning of period
| $11.66 | $14.98 | $11.35 | $13.13 | $13.05 | $12.61 |
Net investment income
| 0.06 | 0.06 | 0.11 | 0.14 | 0.10 | 0.11 |
Payment from affiliate
| 0.00 | 0.00 | 0.00 1 | 0.00 | 0.00 | 0.00 |
Net realized and unrealized gains (losses) on investments
| 0.92 | (0.59) | 3.66 | (0.58) | 0.94 | 1.39 |
Total from investment operations
| 0.98 | (0.53) | 3.77 | (0.44) | 1.04 | 1.50 |
| Distributions to shareholders from | | | | | | |
Net investment income
| (0.10) | (0.09) | (0.14) | (0.10) | (0.12) | (0.06) |
Net realized gains
| (0.94) | (2.70) | 0.00 | (1.24) | (0.84) | (1.00) |
Total distributions to shareholders
| (1.04) | (2.79) | (0.14) | (1.34) | (0.96) | (1.06) |
Net asset value, end of period
| $11.60 | $11.66 | $14.98 | $11.35 | $13.13 | $13.05 |
Total return2
| 8.73% | (5.29)% | 33.49% 3 | (4.25)% | 9.03% | 12.43% |
| Ratios to average net assets (annualized) | | | | | | |
Gross expenses
| 1.18% | 1.17% | 1.18% | 1.18% | 1.18% | 1.18% |
Net expenses
| 1.10% | 1.09% | 1.09% | 1.10% | 1.10% | 1.10% |
Net investment income
| 1.15% | 0.52% | 0.77% | 1.20% | 0.81% | 0.83% |
| Supplemental data | | | | | | |
Portfolio turnover rate
| 22% | 40% | 46% | 34% | 27% | 21% |
Net assets, end of period (000s omitted)
| $255,584 | $249,213 | $294,248 | $245,977 | $291,111 | $289,683 |
| 1 | Amount is less than $0.005. |
| 2 | Total return calculations do not include any sales charges. Returns for periods of less than one year are not annualized. |
| 3 | During the year ended July 31, 2021, the Fund received a payment from an affiliate that had an impact of less than 0.005% on total return. |
The accompanying notes are an integral part of these financial statements.
16 | Allspring Special Large Cap Value Fund
Financial highlights
(For a share outstanding throughout each period)
| | | Year ended July 31 |
| Class C | Six months ended
January 31, 2023
(unaudited) | 2022 | 2021 | 2020 | 2019 | 2018 |
Net asset value, beginning of period
| $11.28 | $14.59 | $10.99 | $12.75 | $12.69 | $12.31 |
Net investment income (loss)
| 0.02 1 | (0.03) 1 | 0.01 1 | 0.05 1 | 0.00 1,2 | 0.01 1 |
Payment from affiliate
| 0.00 | 0.00 | 0.05 | 0.00 | 0.00 | 0.00 |
Net realized and unrealized gains (losses) on investments
| 0.88 | (0.58) | 3.54 | (0.57) | 0.92 | 1.37 |
Total from investment operations
| 0.90 | (0.61) | 3.60 | (0.52) | 0.92 | 1.38 |
| Distributions to shareholders from | | | | | | |
Net investment income
| 0.00 | 0.00 | 0.00 | 0.00 | (0.02) | 0.00 |
Net realized gains
| (0.94) | (2.70) | 0.00 | (1.24) | (0.84) | (1.00) |
Total distributions to shareholders
| (0.94) | (2.70) | 0.00 | (1.24) | (0.86) | (1.00) |
Net asset value, end of period
| $11.24 | $11.28 | $14.59 | $10.99 | $12.75 | $12.69 |
Total return3
| 8.29% | (5.99)% | 32.76% 4 | (4.99)% | 8.16% | 11.65% |
| Ratios to average net assets (annualized) | | | | | | |
Gross expenses
| 1.93% | 1.92% | 1.93% | 1.94% | 1.94% | 1.93% |
Net expenses
| 1.86% | 1.86% | 1.86% | 1.86% | 1.86% | 1.86% |
Net investment income (loss)
| 0.38% | (0.24)% | 0.05% | 0.44% | 0.03% | 0.08% |
| Supplemental data | | | | | | |
Portfolio turnover rate
| 22% | 40% | 46% | 34% | 27% | 21% |
Net assets, end of period (000s omitted)
| $1,502 | $1,923 | $2,356 | $4,401 | $7,370 | $19,874 |
| 1 | Calculated based upon average shares outstanding |
| 2 | Amount is less than $0.005. |
| 3 | Total return calculations do not include any sales charges. Returns for periods of less than one year are not annualized. |
| 4 | During the year ended July 31, 2021, the Fund received a payment from an affiliate that had an impact of 0.50% on total return. |
The accompanying notes are an integral part of these financial statements.
Allspring Special Large Cap Value Fund | 17
Financial highlights
(For a share outstanding throughout each period)
| | | Year ended July 31 |
| Class R | Six months ended
January 31, 2023
(unaudited) | 2022 | 2021 | 2020 | 2019 | 2018 |
Net asset value, beginning of period
| $11.79 | $15.11 | $11.42 | $13.22 | $13.15 | $12.70 |
Net investment income
| 0.05 | 0.04 | 0.07 | 0.11 | 0.06 | 0.05 |
Payment from affiliate
| 0.00 | 0.00 | 0.03 | 0.00 | 0.00 | 0.00 |
Net realized and unrealized gains (losses) on investments
| 0.93 | (0.61) | 3.71 | (0.59) | 0.95 | 1.44 |
Total from investment operations
| 0.98 | (0.57) | 3.81 | (0.48) | 1.01 | 1.49 |
| Distributions to shareholders from | | | | | | |
Net investment income
| (0.08) | (0.05) | (0.12) | (0.08) | (0.10) | (0.04) |
Net realized gains
| (0.94) | (2.70) | 0.00 | (1.24) | (0.84) | (1.00) |
Total distributions to shareholders
| (1.02) | (2.75) | (0.12) | (1.32) | (0.94) | (1.04) |
Net asset value, end of period
| $11.75 | $11.79 | $15.11 | $11.42 | $13.22 | $13.15 |
Total return1
| 8.64% | (5.47)% | 33.51% 2 | (4.56)% | 8.70% | 12.21% |
| Ratios to average net assets (annualized) | | | | | | |
Gross expenses
| 1.40% | 1.36% | 1.41% | 1.41% | 1.43% | 1.44% |
Net expenses
| 1.36% | 1.33% | 1.36% | 1.36% | 1.36% | 1.36% |
Net investment income
| 0.89% | 0.30% | 0.49% | 0.95% | 0.55% | 0.56% |
| Supplemental data | | | | | | |
Portfolio turnover rate
| 22% | 40% | 46% | 34% | 27% | 21% |
Net assets, end of period (000s omitted)
| $116 | $104 | $114 | $76 | $88 | $74 |
| 1 | Returns for periods of less than one year are not annualized. |
| 2 | During the year ended July 31, 2021, the Fund received a payment from an affiliate that had an impact of 0.23% on total return. |
The accompanying notes are an integral part of these financial statements.
18 | Allspring Special Large Cap Value Fund
Financial highlights
(For a share outstanding throughout each period)
| | | Year ended July 31 |
| Class R6 | Six months ended
January 31, 2023
(unaudited) | 2022 | 2021 | 2020 | 2019 | 2018 |
Net asset value, beginning of period
| $11.42 | $14.73 | $11.16 | $12.93 | $12.92 | $12.49 |
Net investment income
| 0.09 | 0.18 | 0.16 | 0.19 1 | 0.16 1 | 0.16 |
Net realized and unrealized gains (losses) on investments
| 0.90 | (0.64) | 3.60 | (0.57) | 1.00 | 1.39 |
Total from investment operations
| 0.99 | (0.46) | 3.76 | (0.38) | 1.16 | 1.55 |
| Distributions to shareholders from | | | | | | |
Net investment income
| (0.15) | (0.15) | (0.19) | (0.15) | (0.31) | (0.12) |
Net realized gains
| (0.94) | (2.70) | 0.00 | (1.24) | (0.84) | (1.00) |
Total distributions to shareholders
| (1.09) | (2.85) | (0.19) | (1.39) | (1.15) | (1.12) |
Net asset value, end of period
| $11.32 | $11.42 | $14.73 | $11.16 | $12.93 | $12.92 |
Total return2
| 9.02% | (4.86)% | 34.05% | (3.87)% | 10.38% | 12.96% |
| Ratios to average net assets (annualized) | | | | | | |
Gross expenses
| 0.75% | 0.75% | 0.76% | 0.76% | 0.76% | 0.75% |
Net expenses
| 0.65% | 0.65% | 0.65% | 0.65% | 0.65% | 0.65% |
Net investment income
| 1.60% | 0.97% | 1.22% | 1.67% | 1.27% | 1.29% |
| Supplemental data | | | | | | |
Portfolio turnover rate
| 22% | 40% | 46% | 34% | 27% | 21% |
Net assets, end of period (000s omitted)
| $41,668 | $42,878 | $15,313 | $11,552 | $4,231 | $2,578 |
| 1 | Calculated based upon average shares outstanding |
| 2 | Returns for periods of less than one year are not annualized. |
The accompanying notes are an integral part of these financial statements.
Allspring Special Large Cap Value Fund | 19
Financial highlights
(For a share outstanding throughout each period)
| | | Year ended July 31 |
| Administrator Class | Six months ended
January 31, 2023
(unaudited) | 2022 | 2021 | 2020 | 2019 | 2018 |
Net asset value, beginning of period
| $12.47 | $15.83 | $11.99 | $13.81 | $13.68 | $13.17 |
Net investment income
| 0.08 | 0.09 | 0.13 | 0.17 | 0.12 | 0.13 |
Payment from affiliate
| 0.00 | 0.00 | 0.00 1 | 0.00 | 0.00 | 0.00 |
Net realized and unrealized gains (losses) on investments
| 0.98 | (0.63) | 3.88 | (0.62) | 1.00 | 1.47 |
Total from investment operations
| 1.06 | (0.54) | 4.01 | (0.45) | 1.12 | 1.60 |
| Distributions to shareholders from | | | | | | |
Net investment income
| (0.13) | (0.12) | (0.17) | (0.13) | (0.15) | (0.09) |
Net realized gains
| (0.94) | (2.70) | 0.00 | (1.24) | (0.84) | (1.00) |
Total distributions to shareholders
| (1.07) | (2.82) | (0.17) | (1.37) | (0.99) | (1.09) |
Net asset value, end of period
| $12.46 | $12.47 | $15.83 | $11.99 | $13.81 | $13.68 |
Total return2
| 8.82% | (5.07)% | 33.75% 3 | (4.15)% | 9.21% | 12.63% |
| Ratios to average net assets (annualized) | | | | | | |
Gross expenses
| 1.10% | 1.09% | 1.11% | 1.11% | 1.11% | 1.10% |
Net expenses
| 0.95% | 0.92% | 0.92% | 0.93% | 0.95% | 0.95% |
Net investment income
| 1.30% | 0.70% | 0.94% | 1.37% | 0.96% | 0.98% |
| Supplemental data | | | | | | |
Portfolio turnover rate
| 22% | 40% | 46% | 34% | 27% | 21% |
Net assets, end of period (000s omitted)
| $451,645 | $436,335 | $499,628 | $402,567 | $464,041 | $469,464 |
| 1 | Amount is less than $0.005. |
| 2 | Returns for periods of less than one year are not annualized. |
| 3 | During the year ended July 31, 2021, the Fund received a payment from an affiliate that had an impact of 0.03% on total return. |
The accompanying notes are an integral part of these financial statements.
20 | Allspring Special Large Cap Value Fund
Financial highlights
(For a share outstanding throughout each period)
| | | Year ended July 31 |
| Institutional Class | Six months ended
January 31, 2023
(unaudited) | 2022 | 2021 | 2020 | 2019 | 2018 |
Net asset value, beginning of period
| $11.77 | $15.10 | $11.44 | $13.22 | $13.14 | $12.68 |
Net investment income
| 0.09 1 | 0.12 1 | 0.16 1 | 0.19 1 | 0.15 1 | 0.22 |
Net realized and unrealized gains (losses) on investments
| 0.93 | (0.61) | 3.70 | (0.58) | 0.94 | 1.35 |
Total from investment operations
| 1.02 | (0.49) | 3.86 | (0.39) | 1.09 | 1.57 |
| Distributions to shareholders from | | | | | | |
Net investment income
| (0.15) | (0.14) | (0.20) | (0.15) | (0.17) | (0.11) |
Net realized gains
| (0.94) | (2.70) | 0.00 | (1.24) | (0.84) | (1.00) |
Total distributions to shareholders
| (1.09) | (2.84) | (0.20) | (1.39) | (1.01) | (1.11) |
Net asset value, end of period
| $11.70 | $11.77 | $15.10 | $11.44 | $13.22 | $13.14 |
Total return2
| 9.00% | (4.96)% | 34.01% | (3.86)% | 9.44% | 12.96% |
| Ratios to average net assets (annualized) | | | | | | |
Gross expenses
| 0.85% | 0.85% | 0.86% | 0.86% | 0.86% | 0.85% |
Net expenses
| 0.70% | 0.70% | 0.70% | 0.70% | 0.70% | 0.70% |
Net investment income
| 1.50% | 0.92% | 1.22% | 1.59% | 1.22% | 1.24% |
| Supplemental data | | | | | | |
Portfolio turnover rate
| 22% | 40% | 46% | 34% | 27% | 21% |
Net assets, end of period (000s omitted)
| $58,045 | $51,492 | $62,796 | $84,544 | $106,869 | $137,263 |
| 1 | Calculated based upon average shares outstanding |
| 2 | Returns for periods of less than one year are not annualized. |
The accompanying notes are an integral part of these financial statements.
Allspring Special Large Cap Value Fund | 21
Notes to financial statements (unaudited)
1. ORGANIZATION
Allspring Funds Trust (the "Trust"), a Delaware statutory trust organized on March 10, 1999, is an open-end management investment company registered under the Investment Company Act of 1940, as amended (the "1940 Act"). As an investment company, the Trust follows the accounting and reporting guidance in Financial Accounting Standards Board ("FASB") Accounting Standards Codification Topic 946, Financial Services – Investment Companies. These financial statements report on the Allspring Special Large Cap Value Fund (the "Fund") which is a diversified series of the Trust.
2. SIGNIFICANT ACCOUNTING POLICIES
The following significant accounting policies, which are consistently followed in the preparation of the financial statements of the Fund, are in conformity with U.S. generally accepted accounting principles which require management to make estimates and assumptions that affect the reported amounts of assets and liabilities, disclosure of contingent assets and liabilities at the date of the financial statements, and the reported amounts of income and expenses during the reporting period. Actual results could differ from those estimates.
Securities valuation
All investments are valued each business day as of the close of regular trading on the New York Stock Exchange (generally 4 p.m. Eastern Time), although the Fund may deviate from this calculation time under unusual or unexpected circumstances.
Equity securities that are listed on a foreign or domestic exchange or market are valued at the official closing price or, if none, the last sales price.
Investments in registered open-end investment companies (other than those listed on a foreign or domestic exchange or market) are valued at net asset value. Interests in non-registered investment companies that are redeemable at net asset value are fair valued normally at net asset value.
Investments which are not valued using the methods discussed above are valued at their fair value, as determined in good faith by Allspring Funds Management, LLC ("Allspring Funds Management"), which was named the valuation designee by the Board of Trustees. As the valuation designee, Allspring Funds Management is responsible for day-to-day valuation activities for the Allspring Funds. In connection with these responsibilities, Allspring Funds Management has established a Valuation Committee and has delegated to it the authority to take any actions regarding the valuation of portfolio securities that the Valuation Committee deems necessary or appropriate, including determining the fair value of portfolio securities. On a quarterly basis, the Board of Trustees receives reports of valuation actions taken by the Valuation Committee. On at least an annual basis, the Board of Trustees receives an assessment of the adequacy and effectiveness of Allspring Funds Management's process for determining the fair value of the portfolio of investments.
Securities lending
The Fund may lend its securities from time to time in order to earn additional income in the form of fees or interest on securities received as collateral or the investment of any cash received as collateral. When securities are on loan, the Fund receives interest or dividends on those securities. Cash collateral received in connection with its securities lending transactions is invested in Securities Lending Cash Investments, LLC (the "Securities Lending Fund"), an affiliated non-registered investment company. Investments in Securities Lending Fund are valued at the evaluated bid price provided by an independent pricing service. Income earned from investment in the Securities Lending Fund (net of fees and rebates), if any, is included in income from affiliated securities on the Statement of Operations.
In a securities lending transaction, the net asset value of the Fund is affected by an increase or decrease in the value of the securities loaned and by an increase or decrease in the value of the instrument in which collateral is invested. The amount of securities lending activity undertaken by the Fund fluctuates from time to time. The Fund has the right under the lending agreement to recover the securities from the borrower on demand. In the event of default or bankruptcy by the borrower, the Fund may be prevented from recovering the loaned securities or gaining access to the collateral or may experience delays or costs in doing so. In such an event, the terms of the agreement allow the unaffiliated securities lending agent to use the collateral to purchase replacement securities on behalf of the Fund or pay the Fund the market value of the loaned securities. The Fund bears the risk of loss with respect to depreciation of its investment of the cash collateral.
Security transactions and income recognition
Securities transactions are recorded on a trade date basis. Realized gains or losses are recorded on the basis of identified cost.
Dividend income is recognized on the ex-dividend date. Dividend income is recorded net of foreign taxes withheld where recovery of such taxes is not assured.
22 | Allspring Special Large Cap Value Fund
Notes to financial statements (unaudited)
Distributions to shareholders
Distributions to shareholders from net investment income and any net realized gains are recorded on the ex-dividend date and paid at least annually. Such distributions are determined in accordance with income tax regulations and may differ from U.S. generally accepted accounting principles. Dividend sources are estimated at the time of declaration. The tax character of distributions is determined as of the Fund's fiscal year end. Therefore, a portion of the Fund's distributions made prior to the Fund’s fiscal year end may be categorized as a tax return of capital at year end.
Federal and other taxes
The Fund intends to continue to qualify as a regulated investment company by distributing substantially all of its investment company taxable income and any net realized capital gains (after reduction for capital loss carryforwards) sufficient to relieve it from all, or substantially all, federal income taxes. Accordingly, no provision for federal income taxes was required.
The Fund’s income and federal excise tax returns and all financial records supporting those returns for the prior three fiscal years are subject to examination by the federal and Delaware revenue authorities. Management has analyzed the Fund's tax positions taken on federal, state, and foreign tax returns, as applicable, for all open tax years and does not believe that there are any uncertain tax positions that require recognition of a tax liability.
As of January 31, 2023, the aggregate cost of all investments for federal income tax purposes was $644,689,803 and the unrealized gains (losses) consisted of:
| Gross unrealized gains | $189,786,301 |
| Gross unrealized losses | (22,804,590) |
| Net unrealized gains | $166,981,711 |
Class allocations
The separate classes of shares offered by the Fund differ principally in applicable sales charges, distribution, shareholder servicing, and administration fees. Class specific expenses are charged directly to that share class. Investment income, common fund-level expenses, and realized and unrealized gains (losses) on investments are allocated daily to each class of shares based on the relative proportion of net assets of each class.
3. FAIR VALUATION MEASUREMENTS
Fair value measurements of investments are determined within a framework that has established a fair value hierarchy based upon the various data inputs utilized in determining the value of the Fund’s investments. The three-level hierarchy gives the highest priority to unadjusted quoted prices in active markets for identical assets or liabilities (Level 1) and the lowest priority to unobservable inputs (Level 3). The Fund’s investments are classified within the fair value hierarchy based on the lowest level of input that is significant to the fair value measurement. The inputs are summarized into three broad levels as follows:
| ■ | Level 1 – quoted prices in active markets for identical securities |
| ■ | Level 2 – other significant observable inputs (including quoted prices for similar securities, interest rates, prepayment speeds, credit risk, etc.) |
| ■ | Level 3 – significant unobservable inputs (including the Fund’s own assumptions in determining the fair value of investments) |
The inputs or methodologies used for valuing investments in securities are not necessarily an indication of the risk associated with investing in those securities.
Allspring Special Large Cap Value Fund | 23
Notes to financial statements (unaudited)
The following is a summary of the inputs used in valuing the Fund’s assets and liabilities as of January 31, 2023:
| | Quoted prices
(Level 1) | Other significant
observable inputs
(Level 2) | Significant
unobservable inputs
(Level 3) | Total |
| Assets | | | | |
| Investments in: | | | | |
| Common stocks | | | | |
| Communication services | $ 38,310,058 | $0 | $0 | $ 38,310,058 |
| Consumer discretionary | 48,538,702 | 0 | 0 | 48,538,702 |
| Consumer staples | 66,028,779 | 0 | 0 | 66,028,779 |
| Energy | 66,201,957 | 0 | 0 | 66,201,957 |
| Financials | 121,924,809 | 0 | 0 | 121,924,809 |
| Health care | 125,469,383 | 0 | 0 | 125,469,383 |
| Industrials | 140,916,876 | 0 | 0 | 140,916,876 |
| Information technology | 101,141,974 | 0 | 0 | 101,141,974 |
| Materials | 23,153,296 | 0 | 0 | 23,153,296 |
| Real estate | 31,870,516 | 0 | 0 | 31,870,516 |
| Utilities | 24,294,528 | 0 | 0 | 24,294,528 |
| Short-term investments | | | | |
| Investment companies | 23,820,636 | 0 | 0 | 23,820,636 |
| Total assets | $811,671,514 | $0 | $0 | $811,671,514 |
Additional sector, industry or geographic detail, if any, is included in the Portfolio of Investments.
For the six months ended January 31, 2023, the Fund did not have any transfers into/out of Level 3.
4. TRANSACTIONS WITH AFFILIATES
Management fee
Allspring Funds Management, a wholly owned subsidiary of Allspring Global Investments Holdings, LLC, a holding company indirectly owned by certain private funds of GTCR LLC and Reverence Capital Partners, L.P., is the manager of the Fund and provides advisory and fund-level administrative services under an investment management agreement. Under the investment management agreement, Allspring Funds Management is responsible for, among other services, implementing the investment objectives and strategies of the Fund, supervising the subadviser and providing fund-level administrative services in connection with the Fund’s operations. As compensation for its services under the investment management agreement, Allspring Funds Management is entitled to receive a management fee at the following annual rate based on the Fund’s average daily net assets:
| Average daily net assets | Management fee |
| First $500 million | 0.700% |
| Next $500 million | 0.675 |
| Next $1 billion | 0.650 |
| Next $2 billion | 0.625 |
| Next $1 billion | 0.600 |
| Next $3 billion | 0.590 |
| Next $2 billion | 0.565 |
| Next $2 billion | 0.555 |
| Next $4 billion | 0.530 |
| Over $16 billion | 0.505 |
For the six months ended January 31, 2023, the management fee was equivalent to an annual rate of 0.69% of the Fund’s average daily net assets.
24 | Allspring Special Large Cap Value Fund
Notes to financial statements (unaudited)
Allspring Funds Management has retained the services of a subadviser to provide daily portfolio management to the Fund. The fee for subadvisory services is borne by Allspring Funds Management. Allspring Global Investments, LLC ("Allspring Investments"), an affiliate of Allspring Funds Management and a wholly owned subsidiary of Allspring Global Investments Holdings, LLC, is the subadviser to the Fund and is entitled to receive a fee from Allspring Funds Management at an annual rate starting at 0.35% and declining to 0.25% as the average daily net assets of the Fund increase.
Administration fees
Under a class-level administration agreement, Allspring Funds Management provides class-level administrative services to the Fund, which includes paying fees and expenses for services provided by the transfer agent, sub-transfer agents, omnibus account servicers and record-keepers. As compensation for its services under the class-level administration agreement, Allspring Funds Management receives an annual fee which is calculated based on the average daily net assets of each class as follows:
| | Class-level
administration fee |
| Class A | 0.21% |
| Class C | 0.21 |
| Class R | 0.21 |
| Class R6 | 0.03 |
| Administrator Class | 0.13 |
| Institutional Class | 0.13 |
Waivers and/or expense reimbursements
Allspring Funds Management has contractually committed to waive and/or reimburse management and administration fees to the extent necessary to maintain certain net operating expense ratios for the Fund. When each class of the Fund has exceeded its expense cap, Allspring Funds Management will waive fees and/or reimburse expenses from fund-level expenses on a proportionate basis and then from class specific expenses. When only certain classes exceed their expense caps, waivers and/or reimbursements are applied against class specific expenses before fund-level expenses. Allspring Funds Management has contractually committed through November 30, 2023 to waive fees and/or reimburse expenses to the extent necessary to cap expenses. Prior to or after the commitment expiration date, the caps may be increased or the commitment to maintain the caps may be terminated only with the approval of the Board of Trustees. As of January 31, 2023, the contractual expense caps are as follows:
| | Expense ratio caps |
| Class A | 1.11% |
| Class C | 1.86 |
| Class R | 1.36 |
| Class R6 | 0.65 |
| Administrator Class | 0.95 |
| Institutional Class | 0.70 |
Distribution fees
The Trust has adopted a distribution plan for Class C and Class R shares pursuant to Rule 12b-1 under the 1940 Act. Distribution fees are charged to Class C and Class R shares and paid to Allspring Funds Distributor, LLC ("Allspring Funds Distributor"), the principal underwriter, an affiliate of Allspring Funds Management, at an annual rate up to 0.75% of the average daily net assets of Class C shares and up to 0.25% of the average daily net assets of Class R shares.
In addition, Allspring Funds Distributor is entitled to receive the front-end sales charge from the purchase of Class A shares and a contingent deferred sales charge on the redemption of certain Class A shares. Allspring Funds Distributor is also entitled to receive the contingent deferred sales charges from redemptions of Class C shares. For the six months ended January 31, 2023, Allspring Funds Distributor received $879 from the sale of Class A shares. No contingent deferred sales charges were incurred by Class A and Class C shares for the six months ended January 31, 2023.
Allspring Special Large Cap Value Fund | 25
Notes to financial statements (unaudited)
Shareholder servicing fees
The Trust has entered into contracts with one or more shareholder servicing agents, whereby Class A, Class C, Class R, and Administrator Class are charged a fee at an annual rate up to 0.25% of the average daily net assets of each respective class. A portion of these total shareholder servicing fees were paid to affiliates of the Fund.
Interfund transactions
The Fund may purchase or sell portfolio investment securities to certain affiliates pursuant to Rule 17a-7 under the 1940 Act and under procedures adopted by the Board of Trustees. The procedures have been designed to ensure that these interfund transactions, which do not incur broker commissions, are effected at current market prices.
5. INVESTMENT PORTFOLIO TRANSACTIONS
Purchases and sales of investments, excluding U.S. government obligations (if any) and short-term securities, for the six months ended January 31, 2023 were $168,042,378 and $199,997,393, respectively.
6. SECURITIES LENDING TRANSACTIONS
The Fund lends its securities through an unaffiliated securities lending agent and receives collateral in the form of cash or securities with a value at least equal to the value of the securities on loan. The value of the loaned securities is determined at the close of each business day and any increases or decreases in the required collateral are exchanged between the Fund and the counterparty on the next business day. Cash collateral received is invested in the Securities Lending Fund which seeks to provide a positive return compared to the daily Federal Funds Open Rate by investing in high-quality, U.S. dollar-denominated short-term money market instruments and is exempt from registration under Section 3(c)(7) of the 1940 Act. Securities Lending Fund is managed by Allspring Funds Management and is subadvised by Allspring Investments. Allspring Funds Management receives an advisory fee starting at 0.05% and declining to 0.01% as the average daily net assets of the Securities Lending Fund increase. All of the fees received by Allspring Funds Management are paid to Allspring Investments for its services as subadviser.
In the event of counterparty default or the failure of a borrower to return a loaned security, the Fund has the right to use the collateral to offset any losses incurred. As of January 31, 2023, the Fund did not have any securities on loan.
7. BANK BORROWINGS
The Trust (excluding the money market funds), Allspring Master Trust and Allspring Variable Trust are parties to a $350,000,000 revolving credit agreement whereby the Fund is permitted to use bank borrowings for temporary or emergency purposes, such as to fund shareholder redemption requests. Interest under the credit agreement is charged to the Fund based on a borrowing rate equal to the higher of the Federal Funds rate or the overnight bank funding rate in effect on that day plus a spread. In addition, an annual commitment fee equal based on the unused balance is allocated to each participating fund.
For the six months ended January 31, 2023, there were no borrowings by the Fund under the agreement.
8. MARKET RISKS
On March 11, 2020, the World Health Organization announced that it had made the assessment that coronavirus disease 2019 (“COVID-19”) is a pandemic. The impacts of COVID-19 are affecting the entire global economy, individual companies and investment products, the funds, and the market in general. There is significant uncertainty around the extent and duration of business disruptions related to COVID-19 and the impacts may last for an extended period of time. COVID-19 has led to significant uncertainty and volatility in the financial markets.
9. INDEMNIFICATION
Under the Fund's organizational documents, the officers and Trustees have been granted certain indemnification rights against certain liabilities that may arise out of performance of their duties to the Fund. The Fund has entered into a separate agreement with each Trustee that converts indemnification rights currently existing under the Fund’s organizational documents into contractual rights that cannot be changed in the future without the consent of the Trustee. Additionally, in the normal course of business, the Fund may enter into contracts with service providers that contain a variety of indemnification clauses. The Fund’s maximum exposure under these arrangements is dependent on future claims that may be made against the Fund and, therefore, cannot be estimated.
26 | Allspring Special Large Cap Value Fund
Other information (unaudited)
PROXY VOTING INFORMATION
A description of the policies and procedures used to determine how to vote proxies relating to portfolio securities is available without charge, upon request, by calling 1-800-222-8222, visiting our website at allspringglobal.com, or visiting the SEC website at sec.gov. Information regarding how the proxies related to portfolio securities were voted during the most recent 12-month period ended June 30 is available on the website at allspringglobal.com or by visiting the SEC website at sec.gov.
QUARTERLY PORTFOLIO HOLDINGS INFORMATION
The Fund files its complete schedule of portfolio holdings with the SEC for the first and third quarters of each fiscal year as an exhibit to its reports on Form N-PORT. Shareholders may view the filed Form N-PORT by visiting the SEC website at sec.gov.
Allspring Special Large Cap Value Fund | 27
Other information (unaudited)
BOARD OF TRUSTEES AND OFFICERS
Each of the Trustees and Officers listed in the table below acts in identical capacities for each fund in the Allspring family of funds, which consists of 127 mutual funds comprising the Allspring Funds Trust, Allspring Variable Trust, Allspring Master Trust and four closed-end funds (collectively the “Fund Complex”). This table should be read in conjunction with the Prospectus and the Statement of Additional Information1. The mailing address of each Trustee and Officer is 1415 Vantage Park Drive, 3rd Floor, Charlotte, NC 28203. Each Trustee and Officer serves an indefinite term, however, each Trustee serves such term until reaching the mandatory retirement age established by the Trustees.
Independent Trustees
Name and
year of birth | Position held and
length of service* | Principal occupations during past five years or longer | Current other
public company or
investment
company
directorships |
William R. Ebsworth
(Born 1957) | Trustee,
since 2015 | Retired. From 1984 to 2013, equities analyst, portfolio manager, research director and chief investment officer at Fidelity Management and Research Company in Boston, Tokyo, and Hong Kong, and retired in 2013 as Chief Investment Officer of Fidelity Strategic Advisers, Inc. where he led a team of investment professionals managing client assets. Prior thereto, Board member of Hong Kong Securities Clearing Co., Hong Kong Options Clearing Corp., the Thailand International Fund, Ltd., Fidelity Investments Life Insurance Company, and Empire Fidelity Investments Life Insurance Company. Audit Committee Chair and Investment Committee Chair of the Vincent Memorial Hospital Foundation (non-profit organization). Mr. Ebsworth is a CFA® charterholder. | N/A |
Jane A. Freeman
(Born 1953) | Trustee,
since 2015;
Chair Liaison,
since 2018 | Retired. From 2012 to 2014 and 1999 to 2008, Chief Financial Officer of Scientific Learning Corporation. From 2008 to 2012, Ms. Freeman provided consulting services related to strategic business projects. Prior to 1999, Portfolio Manager at Rockefeller & Co. and Scudder, Stevens & Clark. Board member of the Harding Loevner Funds from 1996 to 2014, serving as both Lead Independent Director and chair of the Audit Committee. Board member of the Russell Exchange Traded Funds Trust from 2011 to 2012 and the chair of the Audit Committee. Ms. Freeman is also an inactive Chartered Financial Analyst. | N/A |
Isaiah Harris, Jr.
(Born 1952) | Trustee,
since 2009; Audit
Committee
Chair,
since 2019 | Retired. Member of the Advisory Board of CEF of East Central Florida. Chairman of the Board of CIGNA Corporation from 2009 to 2021, and Director from 2005 to 2008. From 2003 to 2011, Director of Deluxe Corporation. Prior thereto, President and CEO of BellSouth Advertising and Publishing Corp. from 2005 to 2007, President and CEO of BellSouth Enterprises from 2004 to 2005 and President of BellSouth Consumer Services from 2000 to 2003. Emeritus member of the Iowa State University Foundation Board of Governors. Emeritus Member of the Advisory Board of Iowa State University School of Business. Advisory Board Member, Palm Harbor Academy (private school). Advisory Board Member, Fellowship of Christian Athletes. Mr. Harris is a certified public accountant (inactive status). | N/A |
David F. Larcker
(Born 1950) | Trustee,
since 2009 | Distinguished Visiting Fellow at the Hoover Institution since 2022. James Irvin Miller Professor of Accounting at the Graduate School of Business (Emeritus), Stanford University, Director of the Corporate Governance Research Initiative and Senior Faculty of The Rock Center for Corporate Governance since 2006. From 2005 to 2008, Professor of Accounting at the Graduate School of Business, Stanford University. Prior thereto, Ernst & Young Professor of Accounting at The Wharton School, University of Pennsylvania from 1985 to 2005. | N/A |
28 | Allspring Special Large Cap Value Fund
Other information (unaudited)
Name and
year of birth | Position held and
length of service* | Principal occupations during past five years or longer | Current other
public company or
investment
company
directorships |
Olivia S. Mitchell
(Born 1953) | Trustee,
since 2006;
Nominating and
Governance
Committee Chair,
since 2018 | International Foundation of Employee Benefit Plans Professor since 1993, Wharton School of the University of Pennsylvania. Director of Wharton’s Pension Research Council and Boettner Center on Pensions & Retirement Research, and Research Associate at the National Bureau of Economic Research. Previously taught at Cornell University from 1978 to 1993. | N/A |
Timothy J. Penny
(Born 1951) | Trustee,
since 1996;
Chair,
since 2018 | President and Chief Executive Officer of Southern Minnesota Initiative Foundation, a non-profit organization, since 2007. Vice Chair of the Economic Club of Minnesota, since 2007. Co-Chair of the Committee for a Responsible Federal Budget, since 1995. Member of the Board of Trustees of NorthStar Education Finance, Inc., a non-profit organization, from 2007-2022. Senior Fellow of the University of Minnesota Humphrey Institute from 1995 to 2017. | N/A |
James G. Polisson
(Born 1959) | Trustee,
since 2018 | Retired. Chief Marketing Officer, Source (ETF) UK Services, Ltd, from 2015 to 2017. From 2012 to 2015, Principal of The Polisson Group, LLC, a management consulting, corporate advisory and principal investing company. Chief Executive Officer and Managing Director at Russell Investments, Global Exchange Traded Funds from 2010 to 2012. Managing Director of Barclays Global Investors from 1998 to 2010 and Global Chief Marketing Officer for iShares and Barclays Global Investors from 2000 to 2010. Trustee of the San Francisco Mechanics’ Institute, a non-profit organization, from 2013 to 2015. Board member of the Russell Exchange Traded Fund Trust from 2011 to 2012. Director of Barclays Global Investors Holdings Deutschland GmbH from 2006 to 2009. Mr. Polisson is an attorney and has a retired status with the Massachusetts and District of Columbia Bar Associations. | N/A |
Pamela Wheelock
(Born 1959) | Trustee,
since January
2020; previously
Trustee from
January 2018 to
July 2019 | Retired. Executive and Senior Financial leadership positions in the public, private and nonprofit sectors. Interim President and CEO, McKnight Foundation, 2020. Interim Commissioner, Minnesota Department of Human Services, 2019. Chief Operating Officer, Twin Cities Habitat for Humanity, 2017-2019. Vice President for University Services, University of Minnesota, 2012-2016. Interim President and CEO, Blue Cross and Blue Shield of Minnesota, 2011-2012. Executive Vice-President and Chief Financial Officer, Minnesota Wild, 2002-2008. Commissioner, Minnesota Department of Finance, 1999-2002. Chair of the Board of Directors of Destination Medical Center Corporation. Board member of the Minnesota Wild Foundation. | N/A |
* Length of service dates reflect the Trustee’s commencement of service with the Trust’s predecessor entities, where applicable.
Allspring Special Large Cap Value Fund | 29
Other information (unaudited)
Officers2
Name and
year of birth | Position held and
length of service | Principal occupations during past five years or longer |
Andrew Owen
(Born 1960) | President,
since 2017 | President and Chief Executive Officer of Allspring Funds Management, LLC since 2017 and Head of Global Fund Governance of Allspring Global Investments since 2022. Prior thereto, co-president of Galliard Capital Management, LLC, an affiliate of Allspring Funds Management, LLC, from 2019 to 2022 and Head of Affiliated Managers, Allspring Global Investments, from 2014 to 2019 and Executive Vice President responsible for marketing, investments and product development for Allspring Funds Management, LLC, from 2009 to 2014. |
Jeremy DePalma
(Born 1974) | Treasurer,
since 2012
(for certain funds in
the Fund Complex);
since 2021 (for
the remaining funds in the
Fund Complex) | Senior Vice President of Allspring Funds Management, LLC since 2009. Senior Vice President of Evergreen Investment Management Company, LLC from 2008 to 2010 and head of the Fund Reporting and Control Team within Fund Administration from 2005 to 2010. |
Christopher Baker
(Born 1976) | Chief Compliance Officer, since 2022 | Global Chief Compliance Officer for Allspring Global Investments since 2022. Prior thereto, Chief Compliance Officer for State Street Global Advisors from 2018 to 2021. Senior Compliance Officer for the State Street divisions of Alternative Investment Solutions, Sector Solutions, and Global Marketing from 2015 to 2018. From 2010 to 2015 Vice President, Global Head of Investment and Marketing Compliance for State Street Global Advisors. |
Matthew Prasse
(Born 1983) | Chief Legal Officer, since 2022; Secretary, since 2021 | Senior Counsel of the Allspring Legal Department since 2021. Senior Counsel of the Wells Fargo Legal Department from 2018 to 2021. Previously, Counsel for Barings LLC from 2015 to 2018. Prior to joining Barings, Associate at Morgan, Lewis & Bockius LLP from 2008 to 2015. |
1 The Statement of Additional Information includes additional information about the Trustees and is available, without charge, upon request, by calling 1-800-222-8222 or by visiting the website at allspringglobal.com.
2 For those Officers with tenures at Allspring Global Investments and/or Allspring Funds Management, LLC that began prior to 2021, such tenures include years of service during which these businesses/entities were known as Wells Fargo Asset Management and Wells Fargo Funds Management, LLC, respectively.
30 | Allspring Special Large Cap Value Fund
For more information
More information about Allspring Funds is available free upon request. To obtain literature, please write, visit the Fund's website, or call:
Allspring Funds
P.O. Box 219967
Kansas City, MO 64121-9967
Website: allspringglobal.com
Individual investors: 1-800-222-8222
Retail investment professionals: 1-888-877-9275
Institutional investment professionals: 1-800-260-5969
This report and the financial statements contained herein are submitted for the general information of the shareholders of the Fund. If this report is used for promotional purposes, distribution of the report must be accompanied or preceded by a current prospectus. Before investing, please consider the investment objectives, risks, charges, and expenses of the investment. For a current prospectus and, if available, a summary prospectus, containing this information, call
1-800-222-8222 or visit the Fund's website at allspringglobal.com. Read the prospectus carefully before you invest or send money.
Allspring Global InvestmentsTM is the trade name for the asset management firms of Allspring Global Investments Holdings, LLC, a holding company indirectly owned by certain private funds of GTCR LLC and Reverence Capital Partners, L.P. These firms include but are not limited to Allspring Global Investments, LLC, and Allspring Funds Management, LLC. Certain products managed by Allspring entities are distributed by Allspring Funds Distributor, LLC (a broker-dealer and Member FINRA/SIPC).
This material is for general informational and educational purposes only and is NOT intended to provide investment advice or a recommendation of any kind - including a recommendation for any specific investment, strategy, or plan.
© 2023 Allspring Global Investments Holdings, LLC. All rights reserved.
ALL-02092023-vbqis3pu 03-23
SAR4302 01-23
Semi-Annual Report
January 31, 2023
Allspring
Disciplined U.S. Core Fund
The views expressed and any forward-looking statements are as of January 31, 2023, unless otherwise noted, and are those of the Fund's portfolio managers and/or Allspring Global Investments. Discussions of individual securities or the markets generally are not intended as individual recommendations. Future events or results may vary significantly from those expressed in any forward-looking statements. The views expressed are subject to change at any time in response to changing circumstances in the market. Allspring Global Investments disclaims any obligation to publicly update or revise any views expressed or forward-looking statements.
Allspring Disciplined U.S. Core Fund | 1
Letter to shareholders (unaudited)
Andrew Owen
President
Allspring Funds
Dear Shareholder:
We are pleased to offer you this semi-annual report for the Allspring Disciplined U.S. Core Fund for the six-month period that ended January 31, 2023. Globally, stocks and bonds experienced heightened volatility through the challenging period. Earlier tailwinds provided by global stimulus programs, vaccination rollouts, and recovering consumer and corporate sentiment were wiped away by the highest rate of inflation in four decades as well as the impact of ongoing aggressive central bank rate hikes and the prospect of more rate hikes. Compounding these concerns were the global reverberations of the Russia-Ukraine war and the impact of China’s strict COVID-19 lockdowns.
For the six-month period, stocks and bonds had mixed results, with non-U.S. equities––both developed market and emerging market––outperforming U.S. stocks overall. Bonds––both U.S. and non-U.S.––struggled to cope with sustained aggressive interest rate increases. For the period, U.S. stocks, based on the S&P 500 Index,1 lost 0.44%. International stocks, as measured by the MSCI ACWI ex USA Index (Net),2 returned 7.63%, while the MSCI EM Index (Net) (USD)3 gained 4.92%. Among bond indexes, the Bloomberg U.S. Aggregate Bond Index4 returned -2.37%, the Bloomberg Global Aggregate ex-USD Index (unhedged)5 returned -1.15%, the Bloomberg Municipal Bond Index6 gained 0.73%, and the ICE BofA U.S. High Yield Index7 returned 1.27%.
The Russia-Ukraine war, high inflation, and central bank rate hikes rocked markets
August was yet another broadly challenging month for financial markets, with more red ink flowing. High inflation persisted, cresting 9% in the eurozone on an annual basis and remaining above 8% in the U.S. despite the Federal Reserve’s (Fed’s) aggressive monetary policy and a major drop in global crude oil and gasoline prices from their June peak. One positive note was the resilience of the U.S. job market. However, the Fed’s job was clearly not complete. One longer-term bright spot was the U.S. Congress’s passage of the Inflation Reduction Act. Its primary stated goals include: to reduce inflation (though not immediately) by curbing the deficit, capping health care spending by seniors, and investing in domestic sources of clean energy.
“August was yet another broadly challenging month for financial markets, with more red ink flowing.”
| 1 | The S&P 500 Index consists of 500 stocks chosen for market size, liquidity, and industry group representation. It is a market-value-weighted index with each stock's weight in the index proportionate to its market value. You cannot invest directly in an index. |
| 2 | The Morgan Stanley Capital International (MSCI) All Country World Index (ACWI) ex USA Index (Net) is a free-float-adjusted market-capitalization-weighted index that is designed to measure the equity market performance of developed and emerging markets, excluding the U.S. Source: MSCI. MSCI makes no express or implied warranties or representations and shall have no liability whatsoever with respect to any MSCI data contained herein. The MSCI data may not be further redistributed or used as a basis for other indexes or any securities or financial products. This report is not approved, reviewed, or produced by MSCI. You cannot invest directly in an index. |
| 3 | The MSCI Emerging Markets (EM) Index (Net) (USD) is a free-float-adjusted market-capitalization-weighted index that is designed to measure equity market performance of emerging markets. You cannot invest directly in an index. |
| 4 | The Bloomberg U.S. Aggregate Bond Index is a broad-based benchmark that measures the investment-grade, U.S.-dollar-denominated, fixed-rate taxable bond market, including Treasuries, government-related and corporate securities, mortgage-backed securities (agency fixed-rate and hybrid adjustable-rate mortgage pass-throughs), asset-backed securities, and commercial mortgage-backed securities. You cannot invest directly in an index. |
| 5 | The Bloomberg Global Aggregate ex-USD Index (unhedged) is an unmanaged index that provides a broad-based measure of the global investment-grade fixed-income markets excluding the U.S.-dollar-denominated debt market. You cannot invest directly in an index. |
| 6 | The Bloomberg Municipal Bond Index is an unmanaged index composed of long-term tax-exempt bonds with a minimum credit rating of Baa. You cannot invest directly in an index. |
| 7 | The ICE BofA U.S. High Yield Index is a market-capitalization-weighted index of domestic and Yankee high-yield bonds. The index tracks the performance of high-yield securities traded in the U.S. bond market. You cannot invest directly in an index. Copyright 2023. ICE Data Indices, LLC. All rights reserved. |
2 | Allspring Disciplined U.S. Core Fund
Letter to shareholders (unaudited)
The market misery continued in September. There was nowhere to hide as all asset classes suffered major losses at the hands of persistent inflation. Central banks kept up their battle against rapidly rising prices with more rate hikes. The strength of the U.S. dollar made things even more difficult for investors holding assets in other currencies. U.S. mortgage rates jumped to near 7% on 30-year fixed-rate mortgages; the decreased housing affordability began to cool demand somewhat. The U.K. experienced a sharp sell-off of government bonds and the British pound in September as investors panicked in response to a new government budget that was seen as financially unsound. The market meltdown forced the Bank of England to step in and buy long-dated government bonds.
Equities had a reprieve in October after two months of sharp declines. Value stocks and small caps fared best. Globally, developed markets outpaced emerging market equities, which were hurt by weakness among Chinese stocks. Central banks continued to try to curtail high inflation with aggressive interest rate hikes. Geopolitical risks persisted, including the ongoing Russia-Ukraine war and economic, financial market, and political turmoil in the U.K., which led to a second prime ministerial change in six weeks, as Rishi Sunak replaced Liz Truss in late October. Concerns over Europe’s energy crisis eased thanks to unseasonably warm weather and plentiful gas on hand. The U.S. labor market continued its resilience against rising prices, as unemployment stood at 3.7%, near a record low.
Stocks and bonds rallied in November, with emerging market equities gaining nearly 15% and developed market equities returning 7%. The S&P 500 Index rose 5.6% in November. Bonds also had positive monthly returns. Economic news was encouraging, driven by U.S. labor market strength. Although central banks kept raising rates, expectations grew regarding an impending easing in the pace of rate hikes and a possible end to central bank monetary tightening in 2023. Although inflation remained at record highs in the eurozone, with a 10.6% annual increase in October, Germany’s producer prices decreased 4.2% annually, signaling a possible decline in inflationary pressures. Meanwhile, U.S. inflation continued to moderate, with a 7.1% annual price rise in November and a monthly price increase of just 0.1%. China’s economic data remained weak, reflecting its zero-COVID-19 policy.
Financial markets cooled in December, with U.S. equities posting negative overall results in response to a weakening U.S. dollar. Fixed income securities ended one of their worst years ever with flat overall monthly returns as markets weighed the hopes for an end to the monetary tightening cycle with the reality that central banks had not completed their jobs yet. U.S. Consumer Price Index (CPI)1 data showed a strong consistent trend downward, which brought down the 12-month CPI to 6.5% in December from 9.1% in June. Other countries and regions reported still-high but declining inflation rates as the year winded down.
The year 2023 began with a broad rally across global equities and fixed income securities. Investor optimism rose in response to data indicating declining inflation rates and the reopening of China’s economy with the abrupt end to its zero-COVID-19 policy. The U.S. reported surprisingly strong job gains––employers added more than 500,000 jobs––and unemployment fell to 3.4%, the lowest level since 1969. Meanwhile, wage growth, seen as a potential contributor to ongoing high inflation, continued to moderate. All eyes remained fixed on the Fed and on how many additional rate hikes it will announce before reaching the peak (“terminal”) rate, expected to be above 5%. The 0.25% federal funds rate hike announced in January was the Fed’s smallest rate increase since March 2022.
| 1 | The Consumer Price Index (CPI) is a measure of the average change over time in the prices paid by urban consumers for a market basket of consumer goods and services. You cannot invest directly in an index. |
Allspring Disciplined U.S. Core Fund | 3
Letter to shareholders (unaudited)
Don’t let short-term uncertainty derail long-term investment goals.
Periods of investment uncertainty can present challenges, but experience has taught us that maintaining long-term investment goals can be an effective way to plan for the future. To help you create a sound strategy based on your personal goals and risk tolerance, Allspring Funds offers more than 100 mutual funds spanning a wide range of asset classes and investment styles. Although diversification cannot guarantee an investment profit or prevent losses, we believe it can be an effective way to manage investment risk and potentially smooth out overall portfolio performance. We encourage investors to know their investments and to understand that appropriate levels of risk-taking may unlock opportunities.
Thank you for choosing to invest with Allspring Funds. We appreciate your confidence in us and remain committed to helping you meet your financial needs.
Sincerely,
Andrew Owen
President
Allspring Funds
For further information about your fund, contact your investment professional, visit our website at allspringglobal.com, or call us directly at 1-800-222-8222.
4 | Allspring Disciplined U.S. Core Fund
This page is intentionally left blank.
Performance highlights (unaudited)
| Investment objective | The Fund seeks long-term capital appreciation. |
| Manager | Allspring Funds Management, LLC |
| Subadviser | Allspring Global Investments, LLC |
| Portfolio managers | Justin P. Carr, CFA®‡, Robert M. Wicentowski, CFA®‡ |
| Average annual total returns (%) as of January 31, 2023 |
| | | Including sales charge | | Excluding sales charge | | Expense ratios1 (%) |
| | Inception date | 1 year | 5 year | 10 year | | 1 year | 5 year | 10 year | | Gross | Net 2 |
| Class A (EVSAX) | 2-28-1990 | -13.69 | 6.87 | 11.39 | | -8.43 | 8.15 | 12.05 | | 0.84 | 0.84 |
| Class C (EVSTX) | 6-30-1999 | -10.13 | 7.34 | 11.39 | | -9.13 | 7.34 | 11.39 | | 1.59 | 1.59 |
| Class R (EVSHX)3 | 9-30-2015 | – | – | – | | -8.66 | 7.88 | 11.77 | | 1.09 | 1.09 |
| Class R6 (EVSRX)4 | 9-30-2015 | – | – | – | | -8.04 | 8.61 | 12.53 | | 0.41 | 0.41 |
| Administrator Class (EVSYX) | 2-21-1995 | – | – | – | | -8.33 | 8.27 | 12.19 | | 0.76 | 0.74 |
| Institutional Class (EVSIX) | 7-30-2010 | – | – | – | | -8.12 | 8.55 | 12.48 | | 0.51 | 0.48 |
| S&P 500 Index5 | – | – | – | – | | -8.22 | 9.54 | 12.68 | | – | – |
Figures quoted represent past performance, which is no guarantee of future results, and do not reflect taxes that a shareholder may pay on an investment in a fund. Investment return and principal value of an investment will fluctuate so that an investor’s shares, when redeemed, may be worth more or less than their original cost. Performance shown without sales charges would be lower if sales charges were reflected. Current performance may be lower or higher than the performance data quoted, which assumes the reinvestment of dividends and capital gains. Current month-end performance is available on the Fund’s website, allspringglobal.com.
Index returns do not include transaction costs associated with buying and selling securities, any mutual fund fees or expenses, or any taxes. It is not possible to invest directly in an index.
For Class A shares, the maximum front-end sales charge is 5.75%. For Class C shares, the maximum contingent deferred sales charge is 1.00%. Performance including a contingent deferred sales charge assumes the sales charge for the corresponding time period. Class R, Class R6, Administrator Class and Institutional Class shares are sold without a front-end sales charge or contingent deferred sales charge.
| 1 | Reflects the expense ratios as stated in the most recent prospectuses. The expense ratios shown are subject to change and may differ from the annualized expense ratios shown in the financial highlights of this report. |
| 2 | The manager has contractually committed through November 30, 2023, to waive fees and/or reimburse expenses to the extent necessary to cap total annual fund operating expenses after fee waivers at 0.87% for Class A, 1.62% for Class C, 1.12% for Class R, 0.43% for Class R6, 0.74% for Administrator Class, and 0.48% for Institutional Class. Brokerage commissions, stamp duty fees, interest, taxes, acquired fund fees and expenses (if any), and extraordinary expenses are excluded from the expense caps. Prior to or after the commitment expiration date, the caps may be increased or the commitment to maintain the caps may be terminated only with the approval of the Board of Trustees. Without these caps, the Fund’s returns would have been lower. The expense ratio paid by an investor is the net expense ratio (the total annual fund operating expenses after fee waivers) as stated in the prospectuses. |
| 3 | Historical performance shown for the Class R shares prior to their inception reflects the performance of the Administrator Class shares, adjusted to reflect the higher expenses applicable to the Class R shares. |
| 4 | Historical performance shown for the Class R6 shares prior to their inception reflects the performance of the Institutional Class shares, and includes the higher expenses applicable to the Institutional Class shares. If these expenses had not been included, returns for the Class R6 shares would be higher. |
| 5 | The S&P 500 Index consists of 500 stocks chosen for market size, liquidity, and industry group representation. It is a market-value weighted index with each stock’s weight in the index proportionate to its market value. You cannot invest directly in an index. |
Stock values fluctuate in response to the activities of individual companies and general market and economic conditions. The use of derivatives may reduce returns and/or increase volatility. Consult the Fund’s prospectus for additional information on these and other risks.
| ‡ | CFA® and Chartered Financial Analyst® are trademarks owned by CFA Institute. |
6 | Allspring Disciplined U.S. Core Fund
Performance highlights (unaudited)
| Ten largest holdings (%) as of January 31, 20231 |
| Apple Incorporated | 6.25 |
| Microsoft Corporation | 5.67 |
| Amazon.com Incorporated | 2.30 |
| Exxon Mobil Corporation | 2.08 |
| Alphabet Incorporated Class C | 2.00 |
| Visa Incorporated Class A | 1.76 |
| Berkshire Hathaway Incorporated Class B | 1.70 |
| Alphabet Incorporated Class A | 1.65 |
| Johnson & Johnson | 1.56 |
| Chevron Corporation | 1.45 |
| 1 | Figures represent the percentage of the Fund's net assets. Holdings are subject to change and may have changed since the date specified. |
| Sector allocation as of January 31, 20231 |
| 1 | Figures represent the percentage of the Fund's long-term investments. Allocations are subject to change and may have changed since the date specified. |
Allspring Disciplined U.S. Core Fund | 7
Fund expenses (unaudited)
As a shareholder of the Fund, you incur two types of costs: (1) transaction costs, including sales charges (loads) on purchase payments and contingent deferred sales charges (if any) on redemptions and (2) ongoing costs, including management fees, distribution (12b-1) and/or shareholder servicing fees, and other Fund expenses. This example is intended to help you understand your ongoing costs (in dollars) of investing in the Fund and to compare these costs with the ongoing costs of investing in other mutual funds.
The example is based on an investment of $1,000 invested at the beginning of the six-month period and held for the entire period from August 1, 2022 to January 31, 2023.
Actual expenses
The “Actual” line of the table below provides information about actual account values and actual expenses. You may use the information in this line, together with the amount you invested, to estimate the expenses that you paid over the period. Simply divide your account value by $1,000 (for example, an $8,600 account value divided by $1,000 = 8.6), then multiply the result by the number in the “Actual” line under the heading entitled “Expenses paid during period” for your applicable class of shares to estimate the expenses you paid on your account during this period.
Hypothetical example for comparison purposes
The “Hypothetical” line of the table below provides information about hypothetical account values and hypothetical expenses based on the Fund’s actual expense ratio and an assumed rate of return of 5% per year before expenses, which is not the Fund’s actual return. The hypothetical account values and expenses may not be used to estimate the actual ending account balance or expenses you paid for the period. You may use this information to compare the ongoing costs of investing in the Fund and other funds. To do so, compare this 5% hypothetical example with the 5% hypothetical examples that appear in the shareholder reports of the other funds.
Please note that the expenses shown in the table are meant to highlight your ongoing costs only and do not reflect any transactional costs, such as sales charges (loads) and contingent deferred sales charges. Therefore, the “Hypothetical” line of the table is useful in comparing ongoing costs only, and will not help you determine the relative total costs of owning different funds. In addition, if these transactional costs were included, your costs would have been higher.
| | Beginning
account value
8-1-2022 | Ending
account value
1-31-2023 | Expenses
paid during
the period1 | Annualized net
expense ratio |
| Class A | | | | |
| Actual | $1,000.00 | $ 993.05 | $4.27 | 0.85% |
| Hypothetical (5% return before expenses) | $1,000.00 | $1,020.92 | $4.33 | 0.85% |
| Class C | | | | |
| Actual | $1,000.00 | $ 988.88 | $7.97 | 1.59% |
| Hypothetical (5% return before expenses) | $1,000.00 | $1,017.19 | $8.08 | 1.59% |
| Class R | | | | |
| Actual | $1,000.00 | $ 991.68 | $5.47 | 1.09% |
| Hypothetical (5% return before expenses) | $1,000.00 | $1,019.71 | $5.55 | 1.09% |
| Class R6 | | | | |
| Actual | $1,000.00 | $ 994.74 | $2.11 | 0.42% |
| Hypothetical (5% return before expenses) | $1,000.00 | $1,023.09 | $2.14 | 0.42% |
| Administrator Class | | | | |
| Actual | $1,000.00 | $ 993.48 | $3.72 | 0.74% |
| Hypothetical (5% return before expenses) | $1,000.00 | $1,021.48 | $3.77 | 0.74% |
| Institutional Class | | | | |
| Actual | $1,000.00 | $ 994.29 | $2.41 | 0.48% |
| Hypothetical (5% return before expenses) | $1,000.00 | $1,022.79 | $2.45 | 0.48% |
1 Expenses paid is equal to the annualized net expense ratio of each class multiplied by the average account value over the period, multiplied by 184 divided by 365 (to reflect the one-half-year period).
8 | Allspring Disciplined U.S. Core Fund
Portfolio of investments—January 31, 2023 (unaudited)
| | | | | Shares | Value |
| Common stocks: 99.14% | | | | | |
| Communication services: 7.70% | | | | | |
| Diversified telecommunication services: 0.61% | | | | | |
| AT&T Incorporated | | | | 177,852 | $ 3,622,845 |
| Verizon Communications Incorporated | | | | 43,490 | 1,807,879 |
| | | | | | 5,430,724 |
| Entertainment: 1.41% | | | | | |
| Activision Blizzard Incorporated | | | | 67,239 | 5,148,490 |
| Netflix Incorporated † | | | | 14,761 | 5,223,327 |
| The Walt Disney Company † | | | | 19,018 | 2,063,263 |
| | | | | | 12,435,080 |
| Interactive media & services: 4.89% | | | | | |
| Alphabet Incorporated Class A † | | | | 147,799 | 14,608,453 |
| Alphabet Incorporated Class C † | | | | 177,129 | 17,689,873 |
| Meta Platforms Incorporated Class A † | | | | 73,335 | 10,924,715 |
| | | | | | 43,223,041 |
| Media: 0.79% | | | | | |
| Comcast Corporation Class A | | | | 128,514 | 5,057,026 |
| Fox Corporation Class A | | | | 55,467 | 1,882,550 |
| | | | | | 6,939,576 |
| Consumer discretionary: 9.66% | | | | | |
| Automobiles: 1.87% | | | | | |
| Ford Motor Company | | | | 398,128 | 5,378,709 |
| Tesla Motors Incorporated † | | | | 64,257 | 11,130,598 |
| | | | | | 16,509,307 |
| Hotels, restaurants & leisure: 0.78% | | | | | |
| McDonald's Corporation | | | | 18,115 | 4,843,951 |
| Starbucks Corporation | | | | 18,988 | 2,072,350 |
| | | | | | 6,916,301 |
| Household durables: 1.07% | | | | | |
| D.R. Horton Incorporated | | | | 29,711 | 2,932,179 |
| Lennar Corporation Class A | | | | 22,309 | 2,284,442 |
| PulteGroup Incorporated | | | | 75,213 | 4,278,868 |
| | | | | | 9,495,489 |
| Internet & direct marketing retail: 2.30% | | | | | |
| Amazon.com Incorporated † | | | | 197,228 | 20,340,125 |
| Multiline retail: 0.23% | | | | | |
| Target Corporation | | | | 11,874 | 2,043,990 |
| Specialty retail: 2.95% | | | | | |
| AutoZone Incorporated † | | | | 1,220 | 2,975,397 |
| Lowe's Companies Incorporated | | | | 27,605 | 5,748,741 |
| The Home Depot Incorporated | | | | 33,498 | 10,859,047 |
| Ulta Beauty Incorporated † | | | | 12,523 | 6,436,321 |
| | | | | | 26,019,506 |
The accompanying notes are an integral part of these financial statements.
Allspring Disciplined U.S. Core Fund | 9
Portfolio of investments—January 31, 2023 (unaudited)
| | | | | Shares | Value |
| Textiles, apparel & luxury goods: 0.46% | | | | | |
| Nike Incorporated Class B | | | | 15,375 | $ 1,957,699 |
| Tapestry Incorporated | | | | 45,697 | 2,082,412 |
| | | | | | 4,040,111 |
| Consumer staples: 6.34% | | | | | |
| Beverages: 0.63% | | | | | |
| Monster Beverage Corporation † | | | | 10,844 | 1,128,644 |
| PepsiCo Incorporated | | | | 12,096 | 2,068,658 |
| The Coca-Cola Company | | | | 38,416 | 2,355,669 |
| | | | | | 5,552,971 |
| Food & staples retailing: 2.61% | | | | | |
| Costco Wholesale Corporation | | | | 17,364 | 8,875,435 |
| Performance Food Group Company † | | | | 61,226 | 3,754,378 |
| The Kroger Company | | | | 103,599 | 4,623,623 |
| Walmart Incorporated | | | | 40,243 | 5,789,760 |
| | | | | | 23,043,196 |
| Food products: 1.72% | | | | | |
| Archer Daniels Midland Company | | | | 73,043 | 6,051,613 |
| Bunge Limited | | | | 45,092 | 4,468,617 |
| Tyson Foods Incorporated Class A | | | | 71,373 | 4,692,775 |
| | | | | | 15,213,005 |
| Household products: 0.67% | | | | | |
| The Procter & Gamble Company | | | | 41,599 | 5,922,866 |
| Tobacco: 0.71% | | | | | |
| Altria Group Incorporated | | | | 55,748 | 2,510,890 |
| Philip Morris International Incorporated | | | | 36,212 | 3,774,739 |
| | | | | | 6,285,629 |
| Energy: 5.12% | | | | | |
| Oil, gas & consumable fuels: 5.12% | | | | | |
| Chevron Corporation | | | | 73,366 | 12,767,151 |
| EOG Resources Incorporated | | | | 19,629 | 2,595,935 |
| EQT Corporation | | | | 49,564 | 1,619,256 |
| Exxon Mobil Corporation | | | | 158,052 | 18,335,613 |
| Marathon Petroleum Corporation | | | | 44,267 | 5,689,195 |
| Valero Energy Corporation | | | | 29,600 | 4,144,888 |
| Vitesse Energy Incorporated †« | | | | 5,327 | 85,019 |
| | | | | | 45,237,057 |
| Financials: 11.33% | | | | | |
| Banks: 3.38% | | | | | |
| Bank of America Corporation | | | | 151,038 | 5,358,828 |
| Citigroup Incorporated | | | | 50,108 | 2,616,640 |
| Citizens Financial Group Incorporated | | | | 54,495 | 2,360,723 |
| JPMorgan Chase & Company | | | | 86,727 | 12,138,311 |
| Popular Incorporated | | | | 36,784 | 2,524,854 |
| US Bancorp | | | | 97,271 | 4,844,096 |
| | | | | | 29,843,452 |
The accompanying notes are an integral part of these financial statements.
10 | Allspring Disciplined U.S. Core Fund
Portfolio of investments—January 31, 2023 (unaudited)
| | | | | Shares | Value |
| Capital markets: 2.37% | | | | | |
| Bank of New York Mellon Corporation | | | | 121,681 | $ 6,153,408 |
| Interactive Brokers Group Incorporated Class A | | | | 28,342 | 2,265,659 |
| Jefferies Financial Group Incorporated | | | | 45,262 | 1,777,891 |
| Northern Trust Corporation | | | | 37,076 | 3,595,260 |
| The Carlyle Group Incorporated | | | | 53,494 | 1,924,179 |
| The Goldman Sachs Group Incorporated | | | | 14,291 | 5,227,791 |
| | | | | | 20,944,188 |
| Consumer finance: 0.71% | | | | | |
| Capital One Financial Corporation | | | | 42,728 | 5,084,632 |
| Synchrony Financial | | | | 31,646 | 1,162,358 |
| | | | | | 6,246,990 |
| Diversified financial services: 1.70% | | | | | |
| Berkshire Hathaway Incorporated Class B † | | | | 48,040 | 14,965,421 |
| Insurance: 3.17% | | | | | |
| Arch Capital Group Limited † | | | | 52,645 | 3,387,706 |
| Everest Reinsurance Group Limited | | | | 17,365 | 6,072,367 |
| Fidelity National Financial Incorporated | | | | 23,209 | 1,021,892 |
| MetLife Incorporated | | | | 89,961 | 6,568,952 |
| Reinsurance Group of America Incorporated | | | | 15,664 | 2,377,325 |
| The Hartford Financial Services Group Incorporated | | | | 45,715 | 3,547,941 |
| W.R. Berkley Corporation | | | | 72,111 | 5,057,866 |
| | | | | | 28,034,049 |
| Health care: 14.94% | | | | | |
| Biotechnology: 2.75% | | | | | |
| AbbVie Incorporated | | | | 11,815 | 1,745,666 |
| Biogen Incorporated † | | | | 8,701 | 2,531,121 |
| Exelixis Incorporated † | | | | 317,702 | 5,597,909 |
| Moderna Incorporated † | | | | 15,083 | 2,655,513 |
| United Therapeutics Corporation † | | | | 19,408 | 5,107,603 |
| Vertex Pharmaceuticals Incorporated † | | | | 20,714 | 6,692,693 |
| | | | | | 24,330,505 |
| Health care equipment & supplies: 2.26% | | | | | |
| Abbott Laboratories | | | | 58,903 | 6,511,727 |
| Edwards Lifesciences Corporation † | | | | 22,015 | 1,688,551 |
| Hologic Incorporated † | | | | 52,893 | 4,303,903 |
| Intuitive Surgical Incorporated † | | | | 12,437 | 3,055,647 |
| Medtronic plc | | | | 52,333 | 4,379,749 |
| | | | | | 19,939,577 |
| Health care providers & services: 4.58% | | | | | |
| AmerisourceBergen Corporation | | | | 36,909 | 6,236,145 |
| Cardinal Health Incorporated | | | | 8,593 | 663,809 |
| Centene Corporation † | | | | 44,256 | 3,374,077 |
| CVS Health Corporation | | | | 80,584 | 7,109,120 |
| Elevance Health Incorporated | | | | 9,297 | 4,648,407 |
| McKesson Corporation | | | | 17,024 | 6,446,648 |
| Molina Healthcare Incorporated † | | | | 10,672 | 3,327,850 |
| UnitedHealth Group Incorporated | | | | 17,230 | 8,601,044 |
| | | | | | 40,407,100 |
The accompanying notes are an integral part of these financial statements.
Allspring Disciplined U.S. Core Fund | 11
Portfolio of investments—January 31, 2023 (unaudited)
| | | | | Shares | Value |
| Life sciences tools & services: 0.28% | | | | | |
| Thermo Fisher Scientific Incorporated | | | | 4,351 | $ 2,481,506 |
| Pharmaceuticals: 5.07% | | | | | |
| Bristol-Myers Squibb Company | | | | 117,666 | 8,548,435 |
| Eli Lilly & Company | | | | 5,469 | 1,882,156 |
| Jazz Pharmaceuticals plc † | | | | 11,563 | 1,811,460 |
| Johnson & Johnson | | | | 84,349 | 13,784,314 |
| Merck & Company Incorporated | | | | 91,015 | 9,775,921 |
| Pfizer Incorporated | | | | 202,942 | 8,961,919 |
| | | | | | 44,764,205 |
| Industrials: 8.63% | | | | | |
| Aerospace & defense: 1.29% | | | | | |
| General Dynamics Corporation | | | | 24,382 | 5,682,469 |
| Lockheed Martin Corporation | | | | 12,341 | 5,717,092 |
| | | | | | 11,399,561 |
| Air freight & logistics: 1.39% | | | | | |
| Expeditors International of Washington Incorporated | | | | 54,373 | 5,880,440 |
| FedEx Corporation | | | | 25,118 | 4,869,375 |
| United Parcel Service Incorporated Class B | | | | 8,149 | 1,509,439 |
| | | | | | 12,259,254 |
| Airlines: 0.65% | | | | | |
| Alaska Air Group Incorporated † | | | | 112,832 | 5,792,795 |
| Building products: 1.38% | | | | | |
| Builders FirstSource Incorporated † | | | | 28,123 | 2,241,403 |
| Masco Corporation | | | | 83,887 | 4,462,788 |
| Owens Corning Incorporated | | | | 56,587 | 5,469,134 |
| | | | | | 12,173,325 |
| Commercial services & supplies: 0.44% | | | | | |
| Waste Management Incorporated | | | | 25,182 | 3,896,411 |
| Electrical equipment: 1.29% | | | | | |
| Acuity Brands Incorporated | | | | 22,352 | 4,213,799 |
| AMETEK Incorporated | | | | 12,296 | 1,781,936 |
| Regal Rexnord Corporation | | | | 38,617 | 5,375,486 |
| | | | | | 11,371,221 |
| Machinery: 1.29% | | | | | |
| AGCO Corporation | | | | 23,906 | 3,302,136 |
| Cummins Incorporated | | | | 4,549 | 1,135,157 |
| Parker-Hannifin Corporation | | | | 14,772 | 4,815,672 |
| The Timken Company | | | | 25,599 | 2,108,078 |
| | | | | | 11,361,043 |
| Road & rail: 0.35% | | | | | |
| CSX Corporation | | | | 101,733 | 3,145,584 |
| Trading companies & distributors: 0.55% | | | | | |
| United Rentals Incorporated † | | | | 10,991 | 4,846,481 |
The accompanying notes are an integral part of these financial statements.
12 | Allspring Disciplined U.S. Core Fund
Portfolio of investments—January 31, 2023 (unaudited)
| | | | | Shares | Value |
| Information technology: 26.75% | | | | | |
| Communications equipment: 1.13% | | | | | |
| Cisco Systems Incorporated | | | | 204,445 | $ 9,950,338 |
| Electronic equipment, instruments & components: 0.99% | | | | | |
| Jabil Circuit Incorporated | | | | 67,466 | 5,304,852 |
| Keysight Technologies Incorporated † | | | | 19,314 | 3,463,966 |
| | | | | | 8,768,818 |
| IT services: 4.77% | | | | | |
| Accenture plc Class A | | | | 20,696 | 5,775,219 |
| Amdocs Limited | | | | 20,164 | 1,853,677 |
| Cognizant Technology Solutions Corporation Class A | | | | 23,923 | 1,596,860 |
| FleetCor Technologies Incorporated † | | | | 19,808 | 4,136,108 |
| MasterCard Incorporated Class A | | | | 29,646 | 10,986,808 |
| PayPal Holdings Incorporated † | | | | 27,355 | 2,229,159 |
| Visa Incorporated Class A | | | | 67,344 | 15,503,262 |
| | | | | | 42,081,093 |
| Semiconductors & semiconductor equipment: 5.34% | | | | | |
| Advanced Micro Devices Incorporated † | | | | 26,878 | 2,019,882 |
| Broadcom Incorporated | | | | 19,235 | 11,252,667 |
| Enphase Energy Incorporated † | | | | 10,845 | 2,400,866 |
| KLA Corporation | | | | 14,127 | 5,544,565 |
| Lam Research Corporation | | | | 1,830 | 915,183 |
| Microchip Technology Incorporated | | | | 55,069 | 4,274,456 |
| Monolithic Power Systems Incorporated | | | | 3,323 | 1,417,459 |
| NVIDIA Corporation | | | | 63,489 | 12,403,846 |
| Qualcomm Incorporated | | | | 52,138 | 6,945,303 |
| | | | | | 47,174,227 |
| Software: 8.06% | | | | | |
| Adobe Incorporated † | | | | 9,540 | 3,533,044 |
| Cadence Design Systems Incorporated † | | | | 7,100 | 1,298,093 |
| Dropbox Incorporated Class A † | | | | 205,388 | 4,771,163 |
| Fortinet Incorporated † | | | | 47,492 | 2,485,731 |
| Microsoft Corporation | | | | 201,996 | 50,056,629 |
| Salesforce.com Incorporated † | | | | 23,572 | 3,959,389 |
| Synopsys Incorporated † | | | | 14,375 | 5,085,156 |
| | | | | | 71,189,205 |
| Technology hardware, storage & peripherals: 6.46% | | | | | |
| Apple Incorporated | | | | 382,520 | 55,193,811 |
| HP Incorporated | | | | 64,939 | 1,892,322 |
| | | | | | 57,086,133 |
| Materials: 2.75% | | | | | |
| Chemicals: 2.15% | | | | | |
| Celanese Corporation Series A | | | | 19,318 | 2,379,978 |
| CF Industries Holdings Incorporated | | | | 58,356 | 4,942,753 |
| LyondellBasell Industries NV Class A | | | | 50,116 | 4,845,716 |
| Olin Corporation | | | | 32,990 | 2,130,824 |
| Westlake Chemical Corporation | | | | 38,140 | 4,681,685 |
| | | | | | 18,980,956 |
The accompanying notes are an integral part of these financial statements.
Allspring Disciplined U.S. Core Fund | 13
Portfolio of investments—January 31, 2023 (unaudited)
| | | | | Shares | Value |
| Metals & mining: 0.60% | | | | | |
| Reliance Steel & Aluminum Company | | | | 23,461 | $ 5,336,204 |
| Real estate: 2.85% | | | | | |
| Equity REITs: 2.85% | | | | | |
| CubeSmart | | | | 37,453 | 1,714,973 |
| Extra Space Storage Incorporated | | | | 29,328 | 4,628,838 |
| Gaming and Leisure Properties Incorporated | | | | 32,941 | 1,764,320 |
| Medical Properties Trust Incorporated | | | | 353,393 | 4,576,439 |
| Prologis Incorporated | | | | 30,827 | 3,985,315 |
| Public Storage Incorporated | | | | 8,469 | 2,577,455 |
| SBA Communications Corporation | | | | 9,467 | 2,816,717 |
| Simon Property Group Incorporated | | | | 24,439 | 3,139,434 |
| | | | | | 25,203,491 |
| Utilities: 3.07% | | | | | |
| Electric utilities: 0.95% | | | | | |
| American Electric Power Company Incorporated | | | | 26,102 | 2,452,544 |
| NextEra Energy Incorporated | | | | 47,047 | 3,511,118 |
| The Southern Company | | | | 35,403 | 2,396,075 |
| | | | | | 8,359,737 |
| Gas utilities: 0.53% | | | | | |
| National Fuel Gas Company | | | | 81,232 | 4,716,330 |
| Independent power & renewable electricity producers: 0.40% | | | | | |
| AES Corporation | | | | 127,945 | 3,506,972 |
| Multi-utilities: 1.19% | | | | | |
| DTE Energy Company | | | | 44,041 | 5,125,051 |
| Sempra Energy | | | | 33,746 | 5,410,496 |
| | | | | | 10,535,547 |
| Total Common stocks (Cost $526,089,455) | | | | | 875,739,693 |
| | | Yield | | | |
| Short-term investments: 0.75% | | | | | |
| Investment companies: 0.75% | | | | | |
| Allspring Government Money Market Fund Select Class ♠∞ | | 4.16% | | 6,609,351 | 6,609,351 |
| Securities Lending Cash Investments LLC ♠∩∞ | | 4.38 | | 871 | 871 |
| Total Short-term investments (Cost $6,610,222) | | | | | 6,610,222 |
| Total investments in securities (Cost $532,699,677) | 99.89% | | | | 882,349,915 |
| Other assets and liabilities, net | 0.11 | | | | 939,829 |
| Total net assets | 100.00% | | | | $883,289,744 |
| † | Non-income-earning security |
| « | All or a portion of this security is on loan. |
| ♠ | The issuer of the security is an affiliated person of the Fund as defined in the Investment Company Act of 1940. |
| ∩ | The investment is a non-registered investment company purchased with cash collateral received from securities on loan. |
| ∞ | The rate represents the 7-day annualized yield at period end. |
The accompanying notes are an integral part of these financial statements.
14 | Allspring Disciplined U.S. Core Fund
Portfolio of investments—January 31, 2023 (unaudited)
| Abbreviations: |
| REIT | Real estate investment trust |
Investments in affiliates
An affiliated investment is an investment in which the Fund owns at least 5% of the outstanding voting shares of the issuer or as a result of other relationships, such as the Fund and the issuer having the same investment manager. Transactions with issuers that were affiliates of the Fund at the end of the period were as follows:
| | Value,
beginning of
period | Purchases | Sales
proceeds | Net
realized
gains
(losses) | | Net
change in
unrealized
gains
(losses) | | Value,
end of
period | Shares,
end
of period | Income
from
affiliated
securities |
| Short-term investments | | | | | | | | | |
| Allspring Government Money Market Fund Select Class | $8,984,426 | $55,884,779 | $(58,259,854) | $0 | | $0 | | $ 6,609,351 | 6,609,351 | $ 207,883 |
| Securities Lending Cash Investments LLC | 0 | 4,861,226 | (4,860,359) | 4 | | 0 | | 871 | 871 | 1,714 # |
| | | | | $4 | | $0 | | $6,610,222 | | $209,597 |
| # | Amount shown represents income before fees and rebates. |
Futures contracts
| Description | Number of
contracts | Expiration
date | Notional
cost | Notional
value | Unrealized
gains | Unrealized
losses |
| Long | | | | | | |
| E-Mini S&P 500 Index | 30 | 3-17-2023 | $5,970,980 | $6,135,000 | $164,020 | $0 |
The accompanying notes are an integral part of these financial statements.
Allspring Disciplined U.S. Core Fund | 15
Statement of assets and liabilities—January 31, 2023 (unaudited)
| | |
| Assets | |
Investments in unaffiliated securities (including $844 of securities loaned), at value (cost $526,089,455)
| $ 875,739,693 |
Investments in affiliated securities, at value (cost $6,610,222)
| 6,610,222 |
Cash
| 299 |
Cash at broker segregated for futures contracts
| 1,587,600 |
Receivable for dividends
| 596,117 |
Receivable for Fund shares sold
| 220,054 |
Receivable for daily variation margin on open futures contracts
| 94,927 |
Receivable for securities lending income, net
| 161 |
Prepaid expenses and other assets
| 123,278 |
Total assets
| 884,972,351 |
| Liabilities | |
Payable for Fund shares redeemed
| 1,164,847 |
Management fee payable
| 250,010 |
Administration fees payable
| 102,970 |
Shareholder servicing fees payable
| 101,190 |
Distribution fees payable
| 9,613 |
Trustees’ fees and expenses payable
| 4,442 |
Payable upon receipt of securities loaned
| 866 |
Accrued expenses and other liabilities
| 48,669 |
Total liabilities
| 1,682,607 |
Total net assets
| $883,289,744 |
| Net assets consist of | |
Paid-in capital
| $ 492,022,378 |
Total distributable earnings
| 391,267,366 |
Total net assets
| $883,289,744 |
| Computation of net asset value and offering price per share | |
Net assets – Class A
| $ 429,336,284 |
Shares outstanding – Class A1
| 24,368,808 |
Net asset value per share – Class A
| $17.62 |
Maximum offering price per share – Class A2
| $18.69 |
Net assets – Class C
| $ 17,472,608 |
Shares outstanding – Class C1
| 1,102,907 |
Net asset value per share – Class C
| $15.84 |
Net assets – Class R
| $ 2,881,227 |
Shares outstanding – Class R1
| 161,435 |
Net asset value per share – Class R
| $17.85 |
Net assets – Class R6
| $ 256,931,308 |
Shares outstanding – Class R61
| 14,093,771 |
Net asset value per share – Class R6
| $18.23 |
Net assets – Administrator Class
| $ 44,955,685 |
Shares outstanding – Administrator Class1
| 2,451,441 |
Net asset value per share – Administrator Class
| $18.34 |
Net assets – Institutional Class
| $ 131,712,632 |
Shares outstanding – Institutional Class1
| 7,316,167 |
Net asset value per share – Institutional Class
| $18.00 |
| 1 | The Fund has an unlimited number of authorized shares. |
| 2 | Maximum offering price is computed as 100/94.25 of net asset value. On investments of $50,000 or more, the offering price is reduced. |
The accompanying notes are an integral part of these financial statements.
16 | Allspring Disciplined U.S. Core Fund
Statement of operations—six months ended January 31, 2023 (unaudited)
| | |
| Investment income | |
Dividends (net of foreign withholdings taxes of $2,070)
| $ 7,411,631 |
Income from affiliated securities
| 208,044 |
Total investment income
| 7,619,675 |
| Expenses | |
Management fee
| 1,548,113 |
| Administration fees | |
Class A
| 448,366 |
Class C
| 19,922 |
Class R
| 3,021 |
Class R6
| 38,502 |
Administrator Class
| 29,226 |
Institutional Class
| 87,183 |
| Shareholder servicing fees | |
Class A
| 533,769 |
Class C
| 23,650 |
Class R
| 3,592 |
Administrator Class
| 53,290 |
| Distribution fees | |
Class C
| 70,950 |
Class R
| 3,544 |
Custody and accounting fees
| 26,686 |
Professional fees
| 24,574 |
Registration fees
| 42,707 |
Shareholder report expenses
| 25,553 |
Trustees’ fees and expenses
| 11,026 |
Other fees and expenses
| 27,733 |
Total expenses
| 3,021,407 |
| Less: Fee waivers and/or expense reimbursements | |
Administrator Class
| (2,928) |
Institutional Class
| (23,985) |
Net expenses
| 2,994,494 |
Net investment income
| 4,625,181 |
| Realized and unrealized gains (losses) on investments | |
| Net realized gains (losses) on | |
Unaffiliated securities
| 42,271,297 |
Affiliated securities
| 4 |
Futures contracts
| (335,575) |
Net realized gains on investments
| 41,935,726 |
| Net change in unrealized gains (losses) on | |
Unaffiliated securities
| (54,495,119) |
Futures contracts
| (339,312) |
Net change in unrealized gains (losses) on investments
| (54,834,431) |
Net realized and unrealized gains (losses) on investments
| (12,898,705) |
Net decrease in net assets resulting from operations
| $ (8,273,524) |
The accompanying notes are an integral part of these financial statements.
Allspring Disciplined U.S. Core Fund | 17
Statement of changes in net assets
| | | | | |
| | Six months ended
January 31, 2023
(unaudited) | Year ended
July 31, 2022 |
| Operations | | | | |
Net investment income
| | $ 4,625,181 | | $ 9,388,867 |
Net realized gains on investments
| | 41,935,726 | | 100,713,525 |
Net change in unrealized gains (losses) on investments
| | (54,834,431) | | (140,109,744) |
Net decrease in net assets resulting from operations
| | (8,273,524) | | (30,007,352) |
| Distributions to shareholders from | | | | |
| Net investment income and net realized gains | | | | |
Class A
| | (52,376,607) | �� | (41,800,708) |
Class C
| | (2,335,076) | | (2,103,959) |
Class R
| | (328,100) | | (325,019) |
Class R6
| | (31,761,771) | | (27,186,743) |
Administrator Class
| | (5,446,143) | | (4,249,188) |
Institutional Class
| | (16,672,329) | | (13,233,665) |
Total distributions to shareholders
| | (108,920,026) | | (88,899,282) |
| Capital share transactions | Shares | | Shares | |
| Proceeds from shares sold | | | | |
Class A
| 715,213 | 12,720,931 | 872,276 | 19,043,317 |
Class C
| 17,007 | 279,357 | 66,563 | 1,291,580 |
Class R
| 8,172 | 156,415 | 32,976 | 767,963 |
Class R6
| 219,466 | 4,091,642 | 374,988 | 8,156,586 |
Administrator Class
| 81,035 | 1,555,691 | 261,446 | 6,154,474 |
Institutional Class
| 526,253 | 9,984,497 | 837,224 | 18,892,679 |
| | | 28,788,533 | | 54,306,599 |
| Reinvestment of distributions | | | | |
Class A
| 2,876,593 | 49,070,040 | 1,721,849 | 39,080,723 |
Class C
| 150,602 | 2,295,178 | 100,635 | 2,069,063 |
Class R
| 19,052 | 328,100 | 14,203 | 325,019 |
Class R6
| 1,721,944 | 30,504,253 | 1,103,953 | 25,895,916 |
Administrator Class
| 268,307 | 4,768,503 | 164,016 | 3,859,677 |
Institutional Class
| 858,896 | 15,013,566 | 509,416 | 11,813,677 |
| | | 101,979,640 | | 83,044,075 |
| Payment for shares redeemed | | | | |
Class A
| (1,631,037) | (29,758,169) | (3,094,354) | (68,315,947) |
Class C
| (228,658) | (3,768,982) | (305,748) | (6,087,730) |
Class R
| (19,488) | (369,615) | (72,052) | (1,563,821) |
Class R6
| (1,130,812) | (22,000,777) | (2,713,444) | (63,086,684) |
Administrator Class
| (175,461) | (3,306,193) | (325,023) | (7,511,866) |
Institutional Class
| (970,645) | (17,985,735) | (1,475,152) | (33,016,713) |
| | | (77,189,471) | | (179,582,761) |
Net increase (decrease) in net assets resulting from capital share transactions
| | 53,578,702 | | (42,232,087) |
Total decrease in net assets
| | (63,614,848) | | (161,138,721) |
| Net assets | | | | |
Beginning of period
| | 946,904,592 | | 1,108,043,313 |
End of period
| | $ 883,289,744 | | $ 946,904,592 |
The accompanying notes are an integral part of these financial statements.
18 | Allspring Disciplined U.S. Core Fund
Financial highlights
(For a share outstanding throughout each period)
| | | Year ended July 31 |
| Class A | Six months ended
January 31, 2023
(unaudited) | 2022 | 2021 | 2020 | 2019 | 2018 |
Net asset value, beginning of period
| $20.25 | $22.77 | $18.22 | $17.29 | $17.70 | $16.30 |
Net investment income
| 0.07 | 0.16 | 0.14 | 0.23 | 0.25 | 0.24 |
Net realized and unrealized gains (losses) on investments
| (0.31) | (0.78) | 6.18 | 1.47 | 0.38 | 1.90 |
Total from investment operations
| (0.24) | (0.62) | 6.32 | 1.70 | 0.63 | 2.14 |
| Distributions to shareholders from | | | | | | |
Net investment income
| (0.15) | (0.16) | (0.33) | (0.33) | (0.19) | (0.15) |
Net realized gains
| (2.24) | (1.74) | (1.44) | (0.44) | (0.85) | (0.59) |
Total distributions to shareholders
| (2.39) | (1.90) | (1.77) | (0.77) | (1.04) | (0.74) |
Net asset value, end of period
| $17.62 | $20.25 | $22.77 | $18.22 | $17.29 | $17.70 |
Total return1
| (0.69)% | (3.60)% | 36.73% | 9.97% | 4.31% | 13.28% |
| Ratios to average net assets (annualized) | | | | | | |
Gross expenses
| 0.85% | 0.84% | 0.85% | 0.86% | 0.84% | 0.83% |
Net expenses
| 0.85% | 0.84% | 0.85% | 0.85% | 0.84% | 0.83% |
Net investment income
| 0.88% | 0.73% | 0.76% | 1.25% | 1.40% | 1.33% |
| Supplemental data | | | | | | |
Portfolio turnover rate
| 23% | 25% | 36% | 50% | 63% | 73% |
Net assets, end of period (000s omitted)
| $429,336 | $453,829 | $521,702 | $421,005 | $434,367 | $480,602 |
| 1 | Total return calculations do not include any sales charges. Returns for periods of less than one year are not annualized. |
The accompanying notes are an integral part of these financial statements.
Allspring Disciplined U.S. Core Fund | 19
Financial highlights
(For a share outstanding throughout each period)
| | | Year ended July 31 |
| Class C | Six months ended
January 31, 2023
(unaudited) | 2022 | 2021 | 2020 | 2019 | 2018 |
Net asset value, beginning of period
| $18.37 | $20.82 | $16.70 | $15.85 | $16.28 | $15.04 |
Net investment income (loss)
| 0.02 | (0.00) 1 | 0.02 | 0.11 | 0.12 | 0.09 |
Net realized and unrealized gains (losses) on investments
| (0.31) | (0.71) | 5.64 | 1.32 | 0.35 | 1.76 |
Total from investment operations
| (0.29) | (0.71) | 5.66 | 1.43 | 0.47 | 1.85 |
| Distributions to shareholders from | | | | | | |
Net investment income
| 0.00 | 0.00 | (0.10) | (0.14) | (0.05) | (0.02) |
Net realized gains
| (2.24) | (1.74) | (1.44) | (0.44) | (0.85) | (0.59) |
Total distributions to shareholders
| (2.24) | (1.74) | (1.54) | (0.58) | (0.90) | (0.61) |
Net asset value, end of period
| $15.84 | $18.37 | $20.82 | $16.70 | $15.85 | $16.28 |
Total return2
| (1.11)% | (4.30)% | 35.80% | 9.09% | 3.59% | 12.41% |
| Ratios to average net assets (annualized) | | | | | | |
Gross expenses
| 1.59% | 1.59% | 1.60% | 1.60% | 1.59% | 1.58% |
Net expenses
| 1.59% | 1.59% | 1.60% | 1.60% | 1.59% | 1.58% |
Net investment income (loss)
| 0.15% | (0.02)% | 0.02% | 0.51% | 0.66% | 0.58% |
| Supplemental data | | | | | | |
Portfolio turnover rate
| 23% | 25% | 36% | 50% | 63% | 73% |
Net assets, end of period (000s omitted)
| $17,473 | $21,381 | $27,121 | $29,141 | $38,708 | $52,647 |
| 1 | Amount is more than $(0.005). |
| 2 | Total return calculations do not include any sales charges. Returns for periods of less than one year are not annualized. |
The accompanying notes are an integral part of these financial statements.
20 | Allspring Disciplined U.S. Core Fund
Financial highlights
(For a share outstanding throughout each period)
| | | Year ended July 31 |
| Class R | Six months ended
January 31, 2023
(unaudited) | 2022 | 2021 | 2020 | 2019 | 2018 |
Net asset value, beginning of period
| $20.43 | $22.96 | $18.38 | $17.44 | $17.88 | $16.51 |
Net investment income
| 0.06 1 | 0.04 | 0.07 | 0.18 | 0.19 1 | 0.18 1 |
Net realized and unrealized gains (losses) on investments
| (0.32) | (0.73) | 6.25 | 1.49 | 0.41 | 1.94 |
Total from investment operations
| (0.26) | (0.69) | 6.32 | 1.67 | 0.60 | 2.12 |
| Distributions to shareholders from | | | | | | |
Net investment income
| (0.08) | (0.10) | (0.30) | (0.29) | (0.19) | (0.16) |
Net realized gains
| (2.24) | (1.74) | (1.44) | (0.44) | (0.85) | (0.59) |
Total distributions to shareholders
| (2.32) | (1.84) | (1.74) | (0.73) | (1.04) | (0.75) |
Net asset value, end of period
| $17.85 | $20.43 | $22.96 | $18.38 | $17.44 | $17.88 |
Total return2
| (0.83)% | (3.82)% | 36.38% | 9.68% | 4.07% | 12.97% |
| Ratios to average net assets (annualized) | | | | | | |
Gross expenses
| 1.09% | 1.09% | 1.10% | 1.10% | 1.09% | 1.08% |
Net expenses
| 1.09% | 1.09% | 1.10% | 1.10% | 1.09% | 1.08% |
Net investment income
| 0.68% | 0.48% | 0.51% | 0.97% | 1.15% | 1.04% |
| Supplemental data | | | | | | |
Portfolio turnover rate
| 23% | 25% | 36% | 50% | 63% | 73% |
Net assets, end of period (000s omitted)
| $2,881 | $3,140 | $4,101 | $3,507 | $3,126 | $3,298 |
| 1 | Calculated based upon average shares outstanding |
| 2 | Returns for periods of less than one year are not annualized. |
The accompanying notes are an integral part of these financial statements.
Allspring Disciplined U.S. Core Fund | 21
Financial highlights
(For a share outstanding throughout each period)
| | | Year ended July 31 |
| Class R6 | Six months ended
January 31, 2023
(unaudited) | 2022 | 2021 | 2020 | 2019 | 2018 |
Net asset value, beginning of period
| $20.93 | $23.46 | $18.72 | $17.76 | $18.17 | $16.71 |
Net investment income
| 0.13 | 0.26 1 | 0.24 | 0.31 | 0.32 | 0.30 1 |
Net realized and unrealized gains (losses) on investments
| (0.34) | (0.80) | 6.36 | 1.51 | 0.40 | 1.97 |
Total from investment operations
| (0.21) | (0.54) | 6.60 | 1.82 | 0.72 | 2.27 |
| Distributions to shareholders from | | | | | | |
Net investment income
| (0.25) | (0.25) | (0.42) | (0.42) | (0.28) | (0.22) |
Net realized gains
| (2.24) | (1.74) | (1.44) | (0.44) | (0.85) | (0.59) |
Total distributions to shareholders
| (2.49) | (1.99) | (1.86) | (0.86) | (1.13) | (0.81) |
Net asset value, end of period
| $18.23 | $20.93 | $23.46 | $18.72 | $17.76 | $18.17 |
Total return2
| (0.53)% | (3.15)% | 37.35% | 10.39% | 4.77% | 13.78% |
| Ratios to average net assets (annualized) | | | | | | |
Gross expenses
| 0.42% | 0.41% | 0.42% | 0.43% | 0.41% | 0.40% |
Net expenses
| 0.42% | 0.41% | 0.42% | 0.42% | 0.41% | 0.40% |
Net investment income
| 1.31% | 1.16% | 1.18% | 1.70% | 1.84% | 1.71% |
| Supplemental data | | | | | | |
Portfolio turnover rate
| 23% | 25% | 36% | 50% | 63% | 73% |
Net assets, end of period (000s omitted)
| $256,931 | $277,956 | $340,631 | $253,223 | $340,606 | $445,678 |
| 1 | Calculated based upon average shares outstanding |
| 2 | Returns for periods of less than one year are not annualized. |
The accompanying notes are an integral part of these financial statements.
22 | Allspring Disciplined U.S. Core Fund
Financial highlights
(For a share outstanding throughout each period)
| | | Year ended July 31 |
| Administrator Class | Six months ended
January 31, 2023
(unaudited) | 2022 | 2021 | 2020 | 2019 | 2018 |
Net asset value, beginning of period
| $21.00 | $23.55 | $18.78 | $17.80 | $18.17 | $16.71 |
Net investment income
| 0.10 1 | 0.19 1 | 0.19 1 | 0.24 1 | 0.26 1 | 0.25 1 |
Net realized and unrealized gains (losses) on investments
| (0.34) | (0.82) | 6.37 | 1.53 | 0.41 | 1.97 |
Total from investment operations
| (0.24) | (0.63) | 6.56 | 1.77 | 0.67 | 2.22 |
| Distributions to shareholders from | | | | | | |
Net investment income
| (0.18) | (0.18) | (0.35) | (0.35) | (0.19) | (0.17) |
Net realized gains
| (2.24) | (1.74) | (1.44) | (0.44) | (0.85) | (0.59) |
Total distributions to shareholders
| (2.42) | (1.92) | (1.79) | (0.79) | (1.04) | (0.76) |
Net asset value, end of period
| $18.34 | $21.00 | $23.55 | $18.78 | $17.80 | $18.17 |
Total return2
| (0.65)% | (3.49)% | 36.93% | 10.08% | 4.43% | 13.40% |
| Ratios to average net assets (annualized) | | | | | | |
Gross expenses
| 0.75% | 0.74% | 0.77% | 0.77% | 0.76% | 0.75% |
Net expenses
| 0.74% | 0.73% | 0.74% | 0.74% | 0.74% | 0.74% |
Net investment income
| 1.03% | 0.85% | 0.89% | 1.37% | 1.50% | 1.42% |
| Supplemental data | | | | | | |
Portfolio turnover rate
| 23% | 25% | 36% | 50% | 63% | 73% |
Net assets, end of period (000s omitted)
| $44,956 | $47,831 | $51,271 | $50,655 | $58,808 | $94,058 |
| 1 | Calculated based upon average shares outstanding |
| 2 | Returns for periods of less than one year are not annualized. |
The accompanying notes are an integral part of these financial statements.
Allspring Disciplined U.S. Core Fund | 23
Financial highlights
(For a share outstanding throughout each period)
| | | Year ended July 31 |
| Institutional Class | Six months ended
January 31, 2023
(unaudited) | 2022 | 2021 | 2020 | 2019 | 2018 |
Net asset value, beginning of period
| $20.69 | $23.22 | $18.54 | $17.57 | $17.98 | $16.55 |
Net investment income
| 0.12 1 | 0.24 | 0.23 1 | 0.29 1 | 0.30 1 | 0.28 |
Net realized and unrealized gains (losses) on investments
| (0.34) | (0.80) | 6.29 | 1.51 | 0.40 | 1.95 |
Total from investment operations
| (0.22) | (0.56) | 6.52 | 1.80 | 0.70 | 2.23 |
| Distributions to shareholders from | | | | | | |
Net investment income
| (0.23) | (0.23) | (0.40) | (0.39) | (0.26) | (0.21) |
Net realized gains
| (2.24) | (1.74) | (1.44) | (0.44) | (0.85) | (0.59) |
Total distributions to shareholders
| (2.47) | (1.97) | (1.84) | (0.83) | (1.11) | (0.80) |
Net asset value, end of period
| $18.00 | $20.69 | $23.22 | $18.54 | $17.57 | $17.98 |
Total return2
| (0.57)% | (3.24)% | 37.26% | 10.39% | 4.69% | 13.65% |
| Ratios to average net assets (annualized) | | | | | | |
Gross expenses
| 0.52% | 0.51% | 0.52% | 0.52% | 0.51% | 0.50% |
Net expenses
| 0.48% | 0.48% | 0.48% | 0.48% | 0.48% | 0.48% |
Net investment income
| 1.31% | 1.09% | 1.14% | 1.67% | 1.77% | 1.67% |
| Supplemental data | | | | | | |
Portfolio turnover rate
| 23% | 25% | 36% | 50% | 63% | 73% |
Net assets, end of period (000s omitted)
| $131,713 | $142,768 | $163,217 | $146,707 | $285,616 | $411,988 |
| 1 | Calculated based upon average shares outstanding |
| 2 | Returns for periods of less than one year are not annualized. |
The accompanying notes are an integral part of these financial statements.
24 | Allspring Disciplined U.S. Core Fund
Notes to financial statements (unaudited)
1. ORGANIZATION
Allspring Funds Trust (the "Trust"), a Delaware statutory trust organized on March 10, 1999, is an open-end management investment company registered under the Investment Company Act of 1940, as amended (the "1940 Act"). As an investment company, the Trust follows the accounting and reporting guidance in Financial Accounting Standards Board ("FASB") Accounting Standards Codification Topic 946, Financial Services – Investment Companies. These financial statements report on the Allspring Disciplined U.S. Core Fund (the "Fund") which is a diversified series of the Trust.
2. SIGNIFICANT ACCOUNTING POLICIES
The following significant accounting policies, which are consistently followed in the preparation of the financial statements of the Fund, are in conformity with U.S. generally accepted accounting principles which require management to make estimates and assumptions that affect the reported amounts of assets and liabilities, disclosure of contingent assets and liabilities at the date of the financial statements, and the reported amounts of income and expenses during the reporting period. Actual results could differ from those estimates.
Securities valuation
All investments are valued each business day as of the close of regular trading on the New York Stock Exchange (generally 4 p.m. Eastern Time), although the Fund may deviate from this calculation time under unusual or unexpected circumstances.
Equity securities and futures contracts that are listed on a foreign or domestic exchange or market are valued at the official closing price or, if none, the last sales price.
Investments in registered open-end investment companies (other than those listed on a foreign or domestic exchange or market) are valued at net asset value. Interests in non-registered investment companies that are redeemable at net asset value are fair valued normally at net asset value.
Investments which are not valued using the methods discussed above are valued at their fair value, as determined in good faith by Allspring Funds Management, LLC ("Allspring Funds Management"), which was named the valuation designee by the Board of Trustees. As the valuation designee, Allspring Funds Management is responsible for day-to-day valuation activities for the Allspring Funds. In connection with these responsibilities, Allspring Funds Management has established a Valuation Committee and has delegated to it the authority to take any actions regarding the valuation of portfolio securities that the Valuation Committee deems necessary or appropriate, including determining the fair value of portfolio securities. On a quarterly basis, the Board of Trustees receives reports of valuation actions taken by the Valuation Committee. On at least an annual basis, the Board of Trustees receives an assessment of the adequacy and effectiveness of Allspring Funds Management's process for determining the fair value of the portfolio of investments.
Securities lending
The Fund may lend its securities from time to time in order to earn additional income in the form of fees or interest on securities received as collateral or the investment of any cash received as collateral. When securities are on loan, the Fund receives interest or dividends on those securities. Cash collateral received in connection with its securities lending transactions is invested in Securities Lending Cash Investments, LLC (the "Securities Lending Fund"), an affiliated non-registered investment company. Investments in Securities Lending Fund are valued at the evaluated bid price provided by an independent pricing service. Income earned from investment in the Securities Lending Fund (net of fees and rebates), if any, is included in income from affiliated securities on the Statement of Operations.
In a securities lending transaction, the net asset value of the Fund is affected by an increase or decrease in the value of the securities loaned and by an increase or decrease in the value of the instrument in which collateral is invested. The amount of securities lending activity undertaken by the Fund fluctuates from time to time. The Fund has the right under the lending agreement to recover the securities from the borrower on demand. In the event of default or bankruptcy by the borrower, the Fund may be prevented from recovering the loaned securities or gaining access to the collateral or may experience delays or costs in doing so. In such an event, the terms of the agreement allow the unaffiliated securities lending agent to use the collateral to purchase replacement securities on behalf of the Fund or pay the Fund the market value of the loaned securities. The Fund bears the risk of loss with respect to depreciation of its investment of the cash collateral.
Futures contracts
Futures contracts are agreements between the Fund and a counterparty to buy or sell a specific amount of a commodity, financial instrument or currency at a specified price on a specified date. The Fund may buy and sell futures contracts in order to gain exposure to, or protect against, changes in security values and is subject to equity price risk. The primary risks associated with the use of futures contracts are the imperfect correlation between changes in market values of securities held by the Fund
Allspring Disciplined U.S. Core Fund | 25
Notes to financial statements (unaudited)
and the prices of futures contracts, and the possibility of an illiquid market. Futures contracts are generally entered into on a regulated futures exchange and cleared through a clearinghouse associated with the exchange. With futures contracts, there is minimal counterparty risk to the Fund since futures contracts are exchange traded and the exchange’s clearinghouse, as the counterparty to all exchange-traded futures, guarantees the futures contracts against default.
Upon entering into a futures contract, the Fund is required to deposit either cash or securities (initial margin) with the broker in an amount equal to a certain percentage of the contract value. Subsequent payments (variation margin) are paid to or from the broker each day equal to the daily changes in the contract value. Such payments are recorded as unrealized gains or losses and, if any, shown as variation margin receivable (payable) in the Statement of Assets and Liabilities. Should the Fund fail to make requested variation margin payments, the broker can gain access to the initial margin to satisfy the Fund’s payment obligations. When the contracts are closed, a realized gain or loss is recorded in the Statement of Operations.
Security transactions and income recognition
Securities transactions are recorded on a trade date basis. Realized gains or losses are recorded on the basis of identified cost.
Dividend income is recognized on the ex-dividend date. Dividend income is recorded net of foreign taxes withheld where recovery of such taxes is not assured.
Distributions to shareholders
Distributions to shareholders from net investment income and any net realized gains are recorded on the ex-dividend date and paid at least annually. Such distributions are determined in accordance with income tax regulations and may differ from U.S. generally accepted accounting principles. Dividend sources are estimated at the time of declaration. The tax character of distributions is determined as of the Fund's fiscal year end. Therefore, a portion of the Fund's distributions made prior to the Fund’s fiscal year end may be categorized as a tax return of capital at year end.
Federal and other taxes
The Fund intends to continue to qualify as a regulated investment company by distributing substantially all of its investment company taxable income and any net realized capital gains (after reduction for capital loss carryforwards) sufficient to relieve it from all, or substantially all, federal income taxes. Accordingly, no provision for federal income taxes was required.
The Fund’s income and federal excise tax returns and all financial records supporting those returns for the prior three fiscal years are subject to examination by the federal and Delaware revenue authorities. Management has analyzed the Fund's tax positions taken on federal, state, and foreign tax returns, as applicable, for all open tax years and does not believe that there are any uncertain tax positions that require recognition of a tax liability.
As of January 31, 2023, the aggregate cost of all investments for federal income tax purposes was $535,230,565 and the unrealized gains (losses) consisted of:
| Gross unrealized gains | $362,303,085 |
| Gross unrealized losses | (15,019,715) |
| Net unrealized gains | $347,283,370 |
Class allocations
The separate classes of shares offered by the Fund differ principally in applicable sales charges, distribution, shareholder servicing, and administration fees. Class specific expenses are charged directly to that share class. Investment income, common fund-level expenses, and realized and unrealized gains (losses) on investments are allocated daily to each class of shares based on the relative proportion of net assets of each class.
26 | Allspring Disciplined U.S. Core Fund
Notes to financial statements (unaudited)
3. FAIR VALUATION MEASUREMENTS
Fair value measurements of investments are determined within a framework that has established a fair value hierarchy based upon the various data inputs utilized in determining the value of the Fund’s investments. The three-level hierarchy gives the highest priority to unadjusted quoted prices in active markets for identical assets or liabilities (Level 1) and the lowest priority to unobservable inputs (Level 3). The Fund’s investments are classified within the fair value hierarchy based on the lowest level of input that is significant to the fair value measurement. The inputs are summarized into three broad levels as follows:
| ■ | Level 1 – quoted prices in active markets for identical securities |
| ■ | Level 2 – other significant observable inputs (including quoted prices for similar securities, interest rates, prepayment speeds, credit risk, etc.) |
| ■ | Level 3 – significant unobservable inputs (including the Fund’s own assumptions in determining the fair value of investments) |
The inputs or methodologies used for valuing investments in securities are not necessarily an indication of the risk associated with investing in those securities.
The following is a summary of the inputs used in valuing the Fund’s assets and liabilities as of January 31, 2023:
| | Quoted prices
(Level 1) | Other significant
observable inputs
(Level 2) | Significant
unobservable inputs
(Level 3) | Total |
| Assets | | | | |
| Investments in: | | | | |
| Common stocks | | | | |
| Communication services | $ 68,028,421 | $0 | $0 | $ 68,028,421 |
| Consumer discretionary | 85,364,829 | 0 | 0 | 85,364,829 |
| Consumer staples | 56,017,667 | 0 | 0 | 56,017,667 |
| Energy | 45,237,057 | 0 | 0 | 45,237,057 |
| Financials | 100,034,100 | 0 | 0 | 100,034,100 |
| Health care | 131,922,893 | 0 | 0 | 131,922,893 |
| Industrials | 76,245,675 | 0 | 0 | 76,245,675 |
| Information technology | 236,249,814 | 0 | 0 | 236,249,814 |
| Materials | 24,317,160 | 0 | 0 | 24,317,160 |
| Real estate | 25,203,491 | 0 | 0 | 25,203,491 |
| Utilities | 27,118,586 | 0 | 0 | 27,118,586 |
| Short-term investments | | | | |
| Investment companies | 6,610,222 | 0 | 0 | 6,610,222 |
| | 882,349,915 | 0 | 0 | 882,349,915 |
| Futures contracts | 164,020 | 0 | 0 | 164,020 |
| Total assets | $882,513,935 | $0 | $0 | $882,513,935 |
Futures contracts are reported at their cumulative unrealized gains (losses) at measurement date as reported in the table following the Portfolio of Investments. For futures contracts, the current day’s variation margin is reported on the Statement of Assets and Liabilities. All other assets and liabilities are reported at their market value at measurement date.
Additional sector, industry or geographic detail, if any, is included in the Portfolio of Investments.
For the six months ended January 31, 2023, the Fund did not have any transfers into/out of Level 3.
4. TRANSACTIONS WITH AFFILIATES
Management fee
Allspring Funds Management, a wholly owned subsidiary of Allspring Global Investments Holdings, LLC, a holding company indirectly owned by certain private funds of GTCR LLC and Reverence Capital Partners, L.P., is the manager of the Fund and provides advisory and fund-level administrative services under an investment management agreement. Under the investment management agreement, Allspring Funds Management is responsible for, among other services, implementing the investment objectives and strategies of the Fund, supervising the subadviser and providing fund-level administrative services in connection
Allspring Disciplined U.S. Core Fund | 27
Notes to financial statements (unaudited)
with the Fund’s operations. As compensation for its services under the investment management agreement, Allspring Funds Management is entitled to receive a management fee at the following annual rate based on the Fund’s average daily net assets:
| Average daily net assets | Management fee |
| First $1 billion | 0.350% |
| Next $4 billion | 0.325 |
| Next $5 billion | 0.290 |
| Over $10 billion | 0.280 |
For the six months ended January 31, 2023, the management fee was equivalent to an annual rate of 0.35% of the Fund’s average daily net assets.
Allspring Funds Management has retained the services of a subadviser to provide daily portfolio management to the Fund. The fee for subadvisory services is borne by Allspring Funds Management. Allspring Global Investments, LLC ("Allspring Investments"), an affiliate of Allspring Funds Management and a wholly owned subsidiary of Allspring Global Investments Holdings, LLC, is the subadviser to the Fund and is entitled to receive a fee from Allspring Funds Management at an annual rate starting at 0.25% and declining to 0.15% as the average daily net assets of the Fund increase.
Administration fees
Under a class-level administration agreement, Allspring Funds Management provides class-level administrative services to the Fund, which includes paying fees and expenses for services provided by the transfer agent, sub-transfer agents, omnibus account servicers and record-keepers. As compensation for its services under the class-level administration agreement, Allspring Funds Management receives an annual fee which is calculated based on the average daily net assets of each class as follows:
| | Class-level
administration fee |
| Class A | 0.21% |
| Class C | 0.21 |
| Class R | 0.21 |
| Class R6 | 0.03 |
| Administrator Class | 0.13 |
| Institutional Class | 0.13 |
Waivers and/or expense reimbursements
Allspring Funds Management has contractually committed to waive and/or reimburse management and administration fees to the extent necessary to maintain certain net operating expense ratios for the Fund. When each class of the Fund has exceeded its expense cap, Allspring Funds Management will waive fees and/or reimburse expenses from fund-level expenses on a proportionate basis and then from class specific expenses. When only certain classes exceed their expense caps, waivers and/or reimbursements are applied against class specific expenses before fund-level expenses. Allspring Funds Management has contractually committed through November 30, 2023 to waive fees and/or reimburse expenses to the extent necessary to cap expenses. Prior to or after the commitment expiration date, the caps may be increased or the commitment to maintain the caps may be terminated only with the approval of the Board of Trustees. As of January 31, 2023, the contractual expense caps are as follows:
28 | Allspring Disciplined U.S. Core Fund
Notes to financial statements (unaudited)
| | Expense ratio caps |
| Class A | 0.87% |
| Class C | 1.62 |
| Class R | 1.12 |
| Class R6 | 0.43 |
| Administrator Class | 0.74 |
| Institutional Class | 0.48 |
Distribution fees
The Trust has adopted a distribution plan for Class C and Class R shares pursuant to Rule 12b-1 under the 1940 Act. Distribution fees are charged to Class C and Class R shares and paid to Allspring Funds Distributor, LLC ("Allspring Funds Distributor"), the principal underwriter, an affiliate of Allspring Funds Management, at an annual rate up to 0.75% of the average daily net assets of Class C shares and up to 0.25% of the average daily net assets of Class R shares.
In addition, Allspring Funds Distributor is entitled to receive the front-end sales charge from the purchase of Class A shares and a contingent deferred sales charge on the redemption of certain Class A shares. Allspring Funds Distributor is also entitled to receive the contingent deferred sales charges from redemptions of Class C shares. For the six months ended January 31, 2023, Allspring Funds Distributor received $1,712 from the sale of Class A shares. No contingent deferred sales charges were incurred by Class A and Class C shares for the six months ended January 31, 2023.
Shareholder servicing fees
The Trust has entered into contracts with one or more shareholder servicing agents, whereby Class A, Class C, Class R, and Administrator Class are charged a fee at an annual rate up to 0.25% of the average daily net assets of each respective class. A portion of these total shareholder servicing fees were paid to affiliates of the Fund.
Interfund transactions
The Fund may purchase or sell portfolio investment securities to certain affiliates pursuant to Rule 17a-7 under the 1940 Act and under procedures adopted by the Board of Trustees. The procedures have been designed to ensure that these interfund transactions, which do not incur broker commissions, are effected at current market prices.
5. INVESTMENT PORTFOLIO TRANSACTIONS
Purchases and sales of investments, excluding U.S. government obligations (if any) and short-term securities, for the six months ended January 31, 2023 were $200,401,339 and $247,968,193, respectively.
6. SECURITIES LENDING TRANSACTIONS
The Fund lends its securities through an unaffiliated securities lending agent and receives collateral in the form of cash or securities with a value at least equal to the value of the securities on loan. The value of the loaned securities is determined at the close of each business day and any increases or decreases in the required collateral are exchanged between the Fund and the counterparty on the next business day. Cash collateral received is invested in the Securities Lending Fund which seeks to provide a positive return compared to the daily Federal Funds Open Rate by investing in high-quality, U.S. dollar-denominated short-term money market instruments and is exempt from registration under Section 3(c)(7) of the 1940 Act. Securities Lending Fund is managed by Allspring Funds Management and is subadvised by Allspring Investments. Allspring Funds Management receives an advisory fee starting at 0.05% and declining to 0.01% as the average daily net assets of the Securities Lending Fund increase. All of the fees received by Allspring Funds Management are paid to Allspring Investments for its services as subadviser.
In the event of counterparty default or the failure of a borrower to return a loaned security, the Fund has the right to use the collateral to offset any losses incurred. As of January 31, 2023, the Fund had securities lending transactions with the following counterparties which are subject to offset:
Allspring Disciplined U.S. Core Fund | 29
Notes to financial statements (unaudited)
| Counterparty | Value of
securities on
loan | Collateral
received1 | Net amount |
| Credit Suisse Securities (USA) LLC | $844 | $(844) | $0 |
1 Collateral disclosed within this table is limited to the net transaction with the counterparty.
7. DERIVATIVE TRANSACTIONS
During the six months ended January 31, 2023, the Fund entered into futures contracts to gain market exposure. The Fund had an average notional amount of $14,082,260 in long futures contracts during the six months ended January 31, 2023.
The fair value, realized gains or losses and change in unrealized gains or losses, if any, on derivative instruments are reflected in the corresponding financial statement captions.
8. BANK BORROWINGS
The Trust (excluding the money market funds), Allspring Master Trust and Allspring Variable Trust are parties to a $350,000,000 revolving credit agreement whereby the Fund is permitted to use bank borrowings for temporary or emergency purposes, such as to fund shareholder redemption requests. Interest under the credit agreement is charged to the Fund based on a borrowing rate equal to the higher of the Federal Funds rate or the overnight bank funding rate in effect on that day plus a spread. In addition, an annual commitment fee equal based on the unused balance is allocated to each participating fund.
For the six months ended January 31, 2023, there were no borrowings by the Fund under the agreement.
9. CONCENTRATION RISKS
As of the end of the period, the Fund concentrated its portfolio of investments in the information technology sector. A fund that invests a substantial portion of its assets in any sector may be more affected by changes in that sector than would be a fund whose investments are not heavily weighted in any sector.
10. MARKET RISKS
On March 11, 2020, the World Health Organization announced that it had made the assessment that coronavirus disease 2019 (“COVID-19”) is a pandemic. The impacts of COVID-19 are affecting the entire global economy, individual companies and investment products, the funds, and the market in general. There is significant uncertainty around the extent and duration of business disruptions related to COVID-19 and the impacts may last for an extended period of time. COVID-19 has led to significant uncertainty and volatility in the financial markets.
11. INDEMNIFICATION
Under the Fund's organizational documents, the officers and Trustees have been granted certain indemnification rights against certain liabilities that may arise out of performance of their duties to the Fund. The Fund has entered into a separate agreement with each Trustee that converts indemnification rights currently existing under the Fund’s organizational documents into contractual rights that cannot be changed in the future without the consent of the Trustee. Additionally, in the normal course of business, the Fund may enter into contracts with service providers that contain a variety of indemnification clauses. The Fund’s maximum exposure under these arrangements is dependent on future claims that may be made against the Fund and, therefore, cannot be estimated.
30 | Allspring Disciplined U.S. Core Fund
Other information (unaudited)
PROXY VOTING INFORMATION
A description of the policies and procedures used to determine how to vote proxies relating to portfolio securities is available without charge, upon request, by calling 1-800-222-8222, visiting our website at allspringglobal.com, or visiting the SEC website at sec.gov. Information regarding how the proxies related to portfolio securities were voted during the most recent 12-month period ended June 30 is available on the website at allspringglobal.com or by visiting the SEC website at sec.gov.
QUARTERLY PORTFOLIO HOLDINGS INFORMATION
The Fund files its complete schedule of portfolio holdings with the SEC for the first and third quarters of each fiscal year as an exhibit to its reports on Form N-PORT. Shareholders may view the filed Form N-PORT by visiting the SEC website at sec.gov.
Allspring Disciplined U.S. Core Fund | 31
Other information (unaudited)
BOARD OF TRUSTEES AND OFFICERS
Each of the Trustees and Officers listed in the table below acts in identical capacities for each fund in the Allspring family of funds, which consists of 127 mutual funds comprising the Allspring Funds Trust, Allspring Variable Trust, Allspring Master Trust and four closed-end funds (collectively the “Fund Complex”). This table should be read in conjunction with the Prospectus and the Statement of Additional Information1. The mailing address of each Trustee and Officer is 1415 Vantage Park Drive, 3rd Floor, Charlotte, NC 28203. Each Trustee and Officer serves an indefinite term, however, each Trustee serves such term until reaching the mandatory retirement age established by the Trustees.
Independent Trustees
Name and
year of birth | Position held and
length of service* | Principal occupations during past five years or longer | Current other
public company or
investment
company
directorships |
William R. Ebsworth
(Born 1957) | Trustee,
since 2015 | Retired. From 1984 to 2013, equities analyst, portfolio manager, research director and chief investment officer at Fidelity Management and Research Company in Boston, Tokyo, and Hong Kong, and retired in 2013 as Chief Investment Officer of Fidelity Strategic Advisers, Inc. where he led a team of investment professionals managing client assets. Prior thereto, Board member of Hong Kong Securities Clearing Co., Hong Kong Options Clearing Corp., the Thailand International Fund, Ltd., Fidelity Investments Life Insurance Company, and Empire Fidelity Investments Life Insurance Company. Audit Committee Chair and Investment Committee Chair of the Vincent Memorial Hospital Foundation (non-profit organization). Mr. Ebsworth is a CFA® charterholder. | N/A |
Jane A. Freeman
(Born 1953) | Trustee,
since 2015;
Chair Liaison,
since 2018 | Retired. From 2012 to 2014 and 1999 to 2008, Chief Financial Officer of Scientific Learning Corporation. From 2008 to 2012, Ms. Freeman provided consulting services related to strategic business projects. Prior to 1999, Portfolio Manager at Rockefeller & Co. and Scudder, Stevens & Clark. Board member of the Harding Loevner Funds from 1996 to 2014, serving as both Lead Independent Director and chair of the Audit Committee. Board member of the Russell Exchange Traded Funds Trust from 2011 to 2012 and the chair of the Audit Committee. Ms. Freeman is also an inactive Chartered Financial Analyst. | N/A |
Isaiah Harris, Jr.
(Born 1952) | Trustee,
since 2009; Audit
Committee
Chair,
since 2019 | Retired. Member of the Advisory Board of CEF of East Central Florida. Chairman of the Board of CIGNA Corporation from 2009 to 2021, and Director from 2005 to 2008. From 2003 to 2011, Director of Deluxe Corporation. Prior thereto, President and CEO of BellSouth Advertising and Publishing Corp. from 2005 to 2007, President and CEO of BellSouth Enterprises from 2004 to 2005 and President of BellSouth Consumer Services from 2000 to 2003. Emeritus member of the Iowa State University Foundation Board of Governors. Emeritus Member of the Advisory Board of Iowa State University School of Business. Advisory Board Member, Palm Harbor Academy (private school). Advisory Board Member, Fellowship of Christian Athletes. Mr. Harris is a certified public accountant (inactive status). | N/A |
David F. Larcker
(Born 1950) | Trustee,
since 2009 | Distinguished Visiting Fellow at the Hoover Institution since 2022. James Irvin Miller Professor of Accounting at the Graduate School of Business (Emeritus), Stanford University, Director of the Corporate Governance Research Initiative and Senior Faculty of The Rock Center for Corporate Governance since 2006. From 2005 to 2008, Professor of Accounting at the Graduate School of Business, Stanford University. Prior thereto, Ernst & Young Professor of Accounting at The Wharton School, University of Pennsylvania from 1985 to 2005. | N/A |
32 | Allspring Disciplined U.S. Core Fund
Other information (unaudited)
Name and
year of birth | Position held and
length of service* | Principal occupations during past five years or longer | Current other
public company or
investment
company
directorships |
Olivia S. Mitchell
(Born 1953) | Trustee,
since 2006;
Nominating and
Governance
Committee Chair,
since 2018 | International Foundation of Employee Benefit Plans Professor since 1993, Wharton School of the University of Pennsylvania. Director of Wharton’s Pension Research Council and Boettner Center on Pensions & Retirement Research, and Research Associate at the National Bureau of Economic Research. Previously taught at Cornell University from 1978 to 1993. | N/A |
Timothy J. Penny
(Born 1951) | Trustee,
since 1996;
Chair,
since 2018 | President and Chief Executive Officer of Southern Minnesota Initiative Foundation, a non-profit organization, since 2007. Vice Chair of the Economic Club of Minnesota, since 2007. Co-Chair of the Committee for a Responsible Federal Budget, since 1995. Member of the Board of Trustees of NorthStar Education Finance, Inc., a non-profit organization, from 2007-2022. Senior Fellow of the University of Minnesota Humphrey Institute from 1995 to 2017. | N/A |
James G. Polisson
(Born 1959) | Trustee,
since 2018 | Retired. Chief Marketing Officer, Source (ETF) UK Services, Ltd, from 2015 to 2017. From 2012 to 2015, Principal of The Polisson Group, LLC, a management consulting, corporate advisory and principal investing company. Chief Executive Officer and Managing Director at Russell Investments, Global Exchange Traded Funds from 2010 to 2012. Managing Director of Barclays Global Investors from 1998 to 2010 and Global Chief Marketing Officer for iShares and Barclays Global Investors from 2000 to 2010. Trustee of the San Francisco Mechanics’ Institute, a non-profit organization, from 2013 to 2015. Board member of the Russell Exchange Traded Fund Trust from 2011 to 2012. Director of Barclays Global Investors Holdings Deutschland GmbH from 2006 to 2009. Mr. Polisson is an attorney and has a retired status with the Massachusetts and District of Columbia Bar Associations. | N/A |
Pamela Wheelock
(Born 1959) | Trustee,
since January
2020; previously
Trustee from
January 2018 to
July 2019 | Retired. Executive and Senior Financial leadership positions in the public, private and nonprofit sectors. Interim President and CEO, McKnight Foundation, 2020. Interim Commissioner, Minnesota Department of Human Services, 2019. Chief Operating Officer, Twin Cities Habitat for Humanity, 2017-2019. Vice President for University Services, University of Minnesota, 2012-2016. Interim President and CEO, Blue Cross and Blue Shield of Minnesota, 2011-2012. Executive Vice-President and Chief Financial Officer, Minnesota Wild, 2002-2008. Commissioner, Minnesota Department of Finance, 1999-2002. Chair of the Board of Directors of Destination Medical Center Corporation. Board member of the Minnesota Wild Foundation. | N/A |
* Length of service dates reflect the Trustee’s commencement of service with the Trust’s predecessor entities, where applicable.
Allspring Disciplined U.S. Core Fund | 33
Other information (unaudited)
Officers2
Name and
year of birth | Position held and
length of service | Principal occupations during past five years or longer |
Andrew Owen
(Born 1960) | President,
since 2017 | President and Chief Executive Officer of Allspring Funds Management, LLC since 2017 and Head of Global Fund Governance of Allspring Global Investments since 2022. Prior thereto, co-president of Galliard Capital Management, LLC, an affiliate of Allspring Funds Management, LLC, from 2019 to 2022 and Head of Affiliated Managers, Allspring Global Investments, from 2014 to 2019 and Executive Vice President responsible for marketing, investments and product development for Allspring Funds Management, LLC, from 2009 to 2014. |
Jeremy DePalma
(Born 1974) | Treasurer,
since 2012
(for certain funds in
the Fund Complex);
since 2021 (for
the remaining funds in the
Fund Complex) | Senior Vice President of Allspring Funds Management, LLC since 2009. Senior Vice President of Evergreen Investment Management Company, LLC from 2008 to 2010 and head of the Fund Reporting and Control Team within Fund Administration from 2005 to 2010. |
Christopher Baker
(Born 1976) | Chief Compliance Officer, since 2022 | Global Chief Compliance Officer for Allspring Global Investments since 2022. Prior thereto, Chief Compliance Officer for State Street Global Advisors from 2018 to 2021. Senior Compliance Officer for the State Street divisions of Alternative Investment Solutions, Sector Solutions, and Global Marketing from 2015 to 2018. From 2010 to 2015 Vice President, Global Head of Investment and Marketing Compliance for State Street Global Advisors. |
Matthew Prasse
(Born 1983) | Chief Legal Officer, since 2022; Secretary, since 2021 | Senior Counsel of the Allspring Legal Department since 2021. Senior Counsel of the Wells Fargo Legal Department from 2018 to 2021. Previously, Counsel for Barings LLC from 2015 to 2018. Prior to joining Barings, Associate at Morgan, Lewis & Bockius LLP from 2008 to 2015. |
1 The Statement of Additional Information includes additional information about the Trustees and is available, without charge, upon request, by calling 1-800-222-8222 or by visiting the website at allspringglobal.com.
2 For those Officers with tenures at Allspring Global Investments and/or Allspring Funds Management, LLC that began prior to 2021, such tenures include years of service during which these businesses/entities were known as Wells Fargo Asset Management and Wells Fargo Funds Management, LLC, respectively.
34 | Allspring Disciplined U.S. Core Fund
For more information
More information about Allspring Funds is available free upon request. To obtain literature, please write, visit the Fund's website, or call:
Allspring Funds
P.O. Box 219967
Kansas City, MO 64121-9967
Website: allspringglobal.com
Individual investors: 1-800-222-8222
Retail investment professionals: 1-888-877-9275
Institutional investment professionals: 1-800-260-5969
This report and the financial statements contained herein are submitted for the general information of the shareholders of the Fund. If this report is used for promotional purposes, distribution of the report must be accompanied or preceded by a current prospectus. Before investing, please consider the investment objectives, risks, charges, and expenses of the investment. For a current prospectus and, if available, a summary prospectus, containing this information, call
1-800-222-8222 or visit the Fund's website at allspringglobal.com. Read the prospectus carefully before you invest or send money.
Allspring Global InvestmentsTM is the trade name for the asset management firms of Allspring Global Investments Holdings, LLC, a holding company indirectly owned by certain private funds of GTCR LLC and Reverence Capital Partners, L.P. These firms include but are not limited to Allspring Global Investments, LLC, and Allspring Funds Management, LLC. Certain products managed by Allspring entities are distributed by Allspring Funds Distributor, LLC (a broker-dealer and Member FINRA/SIPC).
This material is for general informational and educational purposes only and is NOT intended to provide investment advice or a recommendation of any kind - including a recommendation for any specific investment, strategy, or plan.
© 2023 Allspring Global Investments Holdings, LLC. All rights reserved.
ALL-02092023-v2qwf7ur 03-23
SAR0616 01-23
Semi-Annual Report
January 31, 2023
Allspring
Discovery Large Cap Growth Fund
The views expressed and any forward-looking statements are as of January 31, 2023, unless otherwise noted, and are those of the Fund's portfolio managers and/or Allspring Global Investments. Discussions of individual securities or the markets generally are not intended as individual recommendations. Future events or results may vary significantly from those expressed in any forward-looking statements. The views expressed are subject to change at any time in response to changing circumstances in the market. Allspring Global Investments disclaims any obligation to publicly update or revise any views expressed or forward-looking statements.
Allspring Discovery Large Cap Growth Fund | 1
Letter to shareholders (unaudited)
Andrew Owen
President
Allspring Funds
Dear Shareholder:
We are pleased to offer you this semi-annual report for the Allspring Discovery Large Cap Growth Fund for the six-month period that ended January 31, 2023. Globally, stocks and bonds experienced heightened volatility through the challenging period. Earlier tailwinds provided by global stimulus programs, vaccination rollouts, and recovering consumer and corporate sentiment were wiped away by the highest rate of inflation in four decades as well as the impact of ongoing aggressive central bank rate hikes and the prospect of more rate hikes. Compounding these concerns were the global reverberations of the Russia-Ukraine war and the impact of China’s strict COVID-19 lockdowns.
For the six-month period, stocks and bonds had mixed results, with non-U.S. equities––both developed market and emerging market––outperforming U.S. stocks overall. Bonds––both U.S. and non-U.S.––struggled to cope with sustained aggressive interest rate increases. For the period, U.S. stocks, based on the S&P 500 Index,1 lost 0.44%. International stocks, as measured by the MSCI ACWI ex USA Index (Net),2 returned 7.63%, while the MSCI EM Index (Net) (USD)3 gained 4.92%. Among bond indexes, the Bloomberg U.S. Aggregate Bond Index4 returned -2.37%, the Bloomberg Global Aggregate ex-USD Index (unhedged)5 returned -1.15%, the Bloomberg Municipal Bond Index6 gained 0.73%, and the ICE BofA U.S. High Yield Index7 returned 1.27%.
The Russia-Ukraine war, high inflation, and central bank rate hikes rocked markets
August was yet another broadly challenging month for financial markets, with more red ink flowing. High inflation persisted, cresting 9% in the eurozone on an annual basis and remaining above 8% in the U.S. despite the Federal Reserve’s (Fed’s) aggressive monetary policy and a major drop in global crude oil and gasoline prices from their June peak. One positive note was the resilience of the U.S. job market. However, the Fed’s job was clearly not complete. One longer-term bright spot was the U.S. Congress’s passage of the Inflation Reduction Act. Its primary stated goals include: to reduce inflation (though not immediately) by curbing the deficit, capping health care spending by seniors, and investing in domestic sources of clean energy.
“August was yet another broadly challenging month for financial markets, with more red ink flowing.”
| 1 | The S&P 500 Index consists of 500 stocks chosen for market size, liquidity, and industry group representation. It is a market-value-weighted index with each stock's weight in the index proportionate to its market value. You cannot invest directly in an index. |
| 2 | The Morgan Stanley Capital International (MSCI) All Country World Index (ACWI) ex USA Index (Net) is a free-float-adjusted market-capitalization-weighted index that is designed to measure the equity market performance of developed and emerging markets, excluding the U.S. Source: MSCI. MSCI makes no express or implied warranties or representations and shall have no liability whatsoever with respect to any MSCI data contained herein. The MSCI data may not be further redistributed or used as a basis for other indexes or any securities or financial products. This report is not approved, reviewed, or produced by MSCI. You cannot invest directly in an index. |
| 3 | The MSCI Emerging Markets (EM) Index (Net) (USD) is a free-float-adjusted market-capitalization-weighted index that is designed to measure equity market performance of emerging markets. You cannot invest directly in an index. |
| 4 | The Bloomberg U.S. Aggregate Bond Index is a broad-based benchmark that measures the investment-grade, U.S.-dollar-denominated, fixed-rate taxable bond market, including Treasuries, government-related and corporate securities, mortgage-backed securities (agency fixed-rate and hybrid adjustable-rate mortgage pass-throughs), asset-backed securities, and commercial mortgage-backed securities. You cannot invest directly in an index. |
| 5 | The Bloomberg Global Aggregate ex-USD Index (unhedged) is an unmanaged index that provides a broad-based measure of the global investment-grade fixed-income markets excluding the U.S.-dollar-denominated debt market. You cannot invest directly in an index. |
| 6 | The Bloomberg Municipal Bond Index is an unmanaged index composed of long-term tax-exempt bonds with a minimum credit rating of Baa. You cannot invest directly in an index. |
| 7 | The ICE BofA U.S. High Yield Index is a market-capitalization-weighted index of domestic and Yankee high-yield bonds. The index tracks the performance of high-yield securities traded in the U.S. bond market. You cannot invest directly in an index. Copyright 2023. ICE Data Indices, LLC. All rights reserved. |
2 | Allspring Discovery Large Cap Growth Fund
Letter to shareholders (unaudited)
The market misery continued in September. There was nowhere to hide as all asset classes suffered major losses at the hands of persistent inflation. Central banks kept up their battle against rapidly rising prices with more rate hikes. The strength of the U.S. dollar made things even more difficult for investors holding assets in other currencies. U.S. mortgage rates jumped to near 7% on 30-year fixed-rate mortgages; the decreased housing affordability began to cool demand somewhat. The U.K. experienced a sharp sell-off of government bonds and the British pound in September as investors panicked in response to a new government budget that was seen as financially unsound. The market meltdown forced the Bank of England to step in and buy long-dated government bonds.
Equities had a reprieve in October after two months of sharp declines. Value stocks and small caps fared best. Globally, developed markets outpaced emerging market equities, which were hurt by weakness among Chinese stocks. Central banks continued to try to curtail high inflation with aggressive interest rate hikes. Geopolitical risks persisted, including the ongoing Russia-Ukraine war and economic, financial market, and political turmoil in the U.K., which led to a second prime ministerial change in six weeks, as Rishi Sunak replaced Liz Truss in late October. Concerns over Europe’s energy crisis eased thanks to unseasonably warm weather and plentiful gas on hand. The U.S. labor market continued its resilience against rising prices, as unemployment stood at 3.7%, near a record low.
Stocks and bonds rallied in November, with emerging market equities gaining nearly 15% and developed market equities returning 7%. The S&P 500 Index rose 5.6% in November. Bonds also had positive monthly returns. Economic news was encouraging, driven by U.S. labor market strength. Although central banks kept raising rates, expectations grew regarding an impending easing in the pace of rate hikes and a possible end to central bank monetary tightening in 2023. Although inflation remained at record highs in the eurozone, with a 10.6% annual increase in October, Germany’s producer prices decreased 4.2% annually, signaling a possible decline in inflationary pressures. Meanwhile, U.S. inflation continued to moderate, with a 7.1% annual price rise in November and a monthly price increase of just 0.1%. China’s economic data remained weak, reflecting its zero-COVID-19 policy.
Financial markets cooled in December, with U.S. equities posting negative overall results in response to a weakening U.S. dollar. Fixed income securities ended one of their worst years ever with flat overall monthly returns as markets weighed the hopes for an end to the monetary tightening cycle with the reality that central banks had not completed their jobs yet. U.S. Consumer Price Index (CPI)1 data showed a strong consistent trend downward, which brought down the 12-month CPI to 6.5% in December from 9.1% in June. Other countries and regions reported still-high but declining inflation rates as the year winded down.
The year 2023 began with a broad rally across global equities and fixed income securities. Investor optimism rose in response to data indicating declining inflation rates and the reopening of China’s economy with the abrupt end to its zero-COVID-19 policy. The U.S. reported surprisingly strong job gains––employers added more than 500,000 jobs––and unemployment fell to 3.4%, the lowest level since 1969. Meanwhile, wage growth, seen as a potential contributor to ongoing high inflation, continued to moderate. All eyes remained fixed on the Fed and on how many additional rate hikes it will announce before reaching the peak (“terminal”) rate, expected to be above 5%. The 0.25% federal funds rate hike announced in January was the Fed’s smallest rate increase since March 2022.
| 1 | The Consumer Price Index (CPI) is a measure of the average change over time in the prices paid by urban consumers for a market basket of consumer goods and services. You cannot invest directly in an index. |
Allspring Discovery Large Cap Growth Fund | 3
Letter to shareholders (unaudited)
Don’t let short-term uncertainty derail long-term investment goals.
Periods of investment uncertainty can present challenges, but experience has taught us that maintaining long-term investment goals can be an effective way to plan for the future. To help you create a sound strategy based on your personal goals and risk tolerance, Allspring Funds offers more than 100 mutual funds spanning a wide range of asset classes and investment styles. Although diversification cannot guarantee an investment profit or prevent losses, we believe it can be an effective way to manage investment risk and potentially smooth out overall portfolio performance. We encourage investors to know their investments and to understand that appropriate levels of risk-taking may unlock opportunities.
Thank you for choosing to invest with Allspring Funds. We appreciate your confidence in us and remain committed to helping you meet your financial needs.
Sincerely,
Andrew Owen
President
Allspring Funds
For further information about your fund, contact your investment professional, visit our website at allspringglobal.com, or call us directly at 1-800-222-8222.
4 | Allspring Discovery Large Cap Growth Fund
This page is intentionally left blank.
Performance highlights (unaudited)
| Investment objective | The Fund seeks long-term capital appreciation. |
| Manager | Allspring Funds Management, LLC |
| Subadviser | Allspring Global Investments, LLC |
| Portfolio managers | Michael T. Smith, CFA®‡, Christopher J. Warner, CFA®‡ |
| Average annual total returns (%) as of January 31, 2023 |
| | | Including sales charge | | Excluding sales charge | | Expense ratios1 (%) |
| | Inception date | 1 year | 5 year | 10 year | | 1 year | 5 year | 10 year | | Gross | Net 2 |
| Class A (STAEX) | 12-29-2000 | -24.05 | 7.22 | 11.66 | | -19.43 | 8.50 | 12.32 | | 1.26 | 1.03 |
| Class C (WECCX) | 12-29-2000 | -20.96 | 7.68 | 11.65 | | -19.96 | 7.68 | 11.65 | | 2.01 | 1.78 |
| Class R6 (WECRX)3 | 9-20-2019 | – | – | – | | -19.15 | 8.96 | 12.80 | | 0.83 | 0.60 |
| Administrator Class (WECDX) | 4-8-2005 | – | – | – | | -19.38 | 8.69 | 12.54 | | 1.18 | 0.94 |
| Institutional Class (WFCIX) | 4-8-2005 | – | – | – | | -19.32 | 8.85 | 12.74 | | 0.93 | 0.70 |
| Russell 1000® Growth Index4 | – | – | – | – | | -16.02 | 11.22 | 14.53 | | – | – |
Figures quoted represent past performance, which is no guarantee of future results, and do not reflect taxes that a shareholder may pay on an investment in a fund. Investment return and principal value of an investment will fluctuate so that an investor’s shares, when redeemed, may be worth more or less than their original cost. Performance shown without sales charges would be lower if sales charges were reflected. Current performance may be lower or higher than the performance data quoted, which assumes the reinvestment of dividends and capital gains. Current month-end performance is available on the Fund’s website, allspringglobal.com.
Index returns do not include transaction costs associated with buying and selling securities, any mutual fund fees or expenses, or any taxes. It is not possible to invest directly in an index.
For Class A shares, the maximum front-end sales charge is 5.75%. For Class C shares, the maximum contingent deferred sales charge is 1.00%. Performance including a contingent deferred sales charge assumes the sales charge for the corresponding time period. Class R6, Administrator Class and Institutional Class shares are sold without a front-end sales charge or contingent deferred sales charge.
| 1 | Reflects the expense ratios as stated in the most recent prospectuses. The expense ratios shown are subject to change and may differ from the annualized expense ratios shown in the financial highlights of this report. |
| 2 | The manager has contractually committed through November 30, 2023, to waive fees and/or reimburse expenses to the extent necessary to cap total annual fund operating expenses after fee waivers at 1.03% for Class A, 1.78% for Class C, 0.60% for Class R6, 0.94% for Administrator Class, and 0.70% for Institutional Class. Brokerage commissions, stamp duty fees, interest, taxes, acquired fund fees and expenses (if any), and extraordinary expenses are excluded from the expense caps. Prior to or after the commitment expiration date, the caps may be increased or the commitment to maintain the caps may be terminated only with the approval of the Board of Trustees. Without these caps, the Fund’s returns would have been lower. The expense ratio paid by an investor is the net expense ratio (the total annual fund operating expenses after fee waivers) as stated in the prospectuses. |
| 3 | Historical performance shown for the Class R6 shares prior to their inception reflects the performance of the Institutional Class shares, and includes the higher expenses applicable to the Institutional Class shares. If these expenses had not been included, returns for the Class R6 shares would be higher. |
| 4 | The Russell 1000® Growth Index measures the performance of those Russell 1000 companies with higher price/book ratios and higher forecasted growth values. You cannot invest directly in an index. |
Stock values fluctuate in response to the activities of individual companies and general market and economic conditions. Certain investment strategies tend to increase the total risk of an investment (relative to the broader market). This fund is exposed to foreign investment risk, focused portfolio risk, and smaller-company securities risk. Consult the Fund’s prospectus for additional information on these and other risks.
| ‡ | CFA® and Chartered Financial Analyst® are trademarks owned by CFA Institute. |
6 | Allspring Discovery Large Cap Growth Fund
Performance highlights (unaudited)
| Ten largest holdings (%) as of January 31, 20231 |
| Microsoft Corporation | 9.41 |
| Amazon.com Incorporated | 7.15 |
| Alphabet Incorporated Class A | 6.47 |
| Visa Incorporated Class A | 5.95 |
| Waste Connections Incorporated | 3.34 |
| UnitedHealth Group Incorporated | 3.15 |
| Cadence Design Systems Incorporated | 3.11 |
| Chipotle Mexican Grill Incorporated | 2.88 |
| The Home Depot Incorporated | 2.76 |
| Motorola Solutions Incorporated | 2.57 |
| 1 | Figures represent the percentage of the Fund's net assets. Holdings are subject to change and may have changed since the date specified. |
| Sector allocation as of January 31, 20231 |
| 1 | Figures represent the percentage of the Fund's long-term investments. Allocations are subject to change and may have changed since the date specified. |
Allspring Discovery Large Cap Growth Fund | 7
Fund expenses (unaudited)
As a shareholder of the Fund, you incur two types of costs: (1) transaction costs, including sales charges (loads) on purchase payments and contingent deferred sales charges (if any) on redemptions and (2) ongoing costs, including management fees, distribution (12b-1) and/or shareholder servicing fees, and other Fund expenses. This example is intended to help you understand your ongoing costs (in dollars) of investing in the Fund and to compare these costs with the ongoing costs of investing in other mutual funds.
The example is based on an investment of $1,000 invested at the beginning of the six-month period and held for the entire period from August 1, 2022 to January 31, 2023.
Actual expenses
The “Actual” line of the table below provides information about actual account values and actual expenses. You may use the information in this line, together with the amount you invested, to estimate the expenses that you paid over the period. Simply divide your account value by $1,000 (for example, an $8,600 account value divided by $1,000 = 8.6), then multiply the result by the number in the “Actual” line under the heading entitled “Expenses paid during period” for your applicable class of shares to estimate the expenses you paid on your account during this period.
Hypothetical example for comparison purposes
The “Hypothetical” line of the table below provides information about hypothetical account values and hypothetical expenses based on the Fund’s actual expense ratio and an assumed rate of return of 5% per year before expenses, which is not the Fund’s actual return. The hypothetical account values and expenses may not be used to estimate the actual ending account balance or expenses you paid for the period. You may use this information to compare the ongoing costs of investing in the Fund and other funds. To do so, compare this 5% hypothetical example with the 5% hypothetical examples that appear in the shareholder reports of the other funds.
Please note that the expenses shown in the table are meant to highlight your ongoing costs only and do not reflect any transactional costs, such as sales charges (loads) and contingent deferred sales charges. Therefore, the “Hypothetical” line of the table is useful in comparing ongoing costs only, and will not help you determine the relative total costs of owning different funds. In addition, if these transactional costs were included, your costs would have been higher.
| | Beginning
account value
8-1-2022 | Ending
account value
1-31-2023 | Expenses
paid during
the period1 | Annualized net
expense ratio |
| Class A | | | | |
| Actual | $1,000.00 | $ 951.07 | $5.07 | 1.03% |
| Hypothetical (5% return before expenses) | $1,000.00 | $1,020.01 | $5.24 | 1.03% |
| Class C | | | | |
| Actual | $1,000.00 | $ 945.66 | $8.73 | 1.78% |
| Hypothetical (5% return before expenses) | $1,000.00 | $1,016.23 | $9.05 | 1.78% |
| Class R6 | | | | |
| Actual | $1,000.00 | $ 952.40 | $2.95 | 0.60% |
| Hypothetical (5% return before expenses) | $1,000.00 | $1,022.18 | $3.06 | 0.60% |
| Administrator Class | | | | |
| Actual | $1,000.00 | $ 951.57 | $4.62 | 0.94% |
| Hypothetical (5% return before expenses) | $1,000.00 | $1,020.47 | $4.79 | 0.94% |
| Institutional Class | | | | |
| Actual | $1,000.00 | $ 951.06 | $3.44 | 0.70% |
| Hypothetical (5% return before expenses) | $1,000.00 | $1,021.68 | $3.57 | 0.70% |
1 Expenses paid is equal to the annualized net expense ratio of each class multiplied by the average account value over the period, multiplied by 184 divided by 365 (to reflect the one-half-year period).
8 | Allspring Discovery Large Cap Growth Fund
Portfolio of investments—January 31, 2023 (unaudited)
| | | | | Shares | Value |
| Common stocks: 97.36% | | | | | |
| Communication services: 9.87% | | | | | |
| Entertainment: 1.48% | | | | | |
| Spotify Technology SA † | | | | 24,100 | $ 2,716,552 |
| Interactive media & services: 8.39% | | | | | |
| Alphabet Incorporated Class A † | | | | 119,840 | 11,844,986 |
| Alphabet Incorporated Class C † | | | | 11,700 | 1,168,479 |
| Match Group Incorporated † | | | | 43,486 | 2,353,462 |
| | | | | | 15,366,927 |
| Consumer discretionary: 19.18% | | | | | |
| Auto components: 1.46% | | | | | |
| Aptiv plc † | | | | 23,650 | 2,674,579 |
| Automobiles: 2.44% | | | | | |
| Ferrari NV | | | | 17,800 | 4,473,318 |
| Hotels, restaurants & leisure: 2.88% | | | | | |
| Chipotle Mexican Grill Incorporated † | | | | 3,200 | 5,268,416 |
| Internet & direct marketing retail: 9.64% | | | | | |
| Amazon.com Incorporated † | | | | 127,060 | 13,103,698 |
| MercadoLibre Incorporated † | | | | 3,850 | 4,549,507 |
| | | | | | 17,653,205 |
| Specialty retail: 2.76% | | | | | |
| The Home Depot Incorporated | | | | 15,616 | 5,062,239 |
| Financials: 8.86% | | | | | |
| Capital markets: 6.41% | | | | | |
| Intercontinental Exchange Incorporated | | | | 34,090 | 3,666,380 |
| MarketAxess Holdings Incorporated | | | | 10,700 | 3,893,195 |
| S&P Global Incorporated | | | | 11,141 | 4,177,207 |
| | | | | | 11,736,782 |
| Insurance: 2.45% | | | | | |
| Progressive Corporation | | | | 33,000 | 4,499,550 |
| Health care: 11.08% | | | | | |
| Health care equipment & supplies: 7.93% | | | | | |
| Align Technology Incorporated † | | | | 7,900 | 2,130,867 |
| DexCom Incorporated † | | | | 43,900 | 4,701,251 |
| Edwards Lifesciences Corporation † | | | | 43,850 | 3,363,295 |
| Intuitive Surgical Incorporated † | | | | 17,650 | 4,336,429 |
| | | | | | 14,531,842 |
| Health care providers & services: 3.15% | | | | | |
| UnitedHealth Group Incorporated | | | | 11,547 | 5,764,147 |
| Industrials: 8.17% | | | | | |
| Commercial services & supplies: 3.34% | | | | | |
| Waste Connections Incorporated | | | | 46,040 | 6,118,716 |
The accompanying notes are an integral part of these financial statements.
Allspring Discovery Large Cap Growth Fund | 9
Portfolio of investments—January 31, 2023 (unaudited)
| | | | | Shares | Value |
| Machinery: 2.31% | | | | | |
| Deere & Company | | | | 10,000 | $ 4,228,400 |
| Road & rail: 2.52% | | | | | |
| Union Pacific Corporation | | | | 22,600 | 4,614,694 |
| Information technology: 35.65% | | | | | |
| Communications equipment: 2.57% | | | | | |
| Motorola Solutions Incorporated | | | | 18,300 | 4,703,283 |
| IT services: 12.52% | | | | | |
| Adyen NV ADR † | | | | 229,500 | 3,451,680 |
| Fiserv Incorporated † | | | | 36,794 | 3,925,180 |
| MongoDB Incorporated † | | | | 9,700 | 2,077,837 |
| PayPal Holdings Incorporated † | | | | 31,700 | 2,583,233 |
| Visa Incorporated Class A | | | | 47,328 | 10,895,379 |
| | | | | | 22,933,309 |
| Semiconductors & semiconductor equipment: 1.12% | | | | | |
| Advanced Micro Devices Incorporated † | | | | 27,400 | 2,059,110 |
| Software: 19.44% | | | | | |
| Atlassian Corporation Class A † | | | | 18,300 | 2,957,646 |
| Bill.com Holdings Incorporated † | | | | 23,800 | 2,751,756 |
| Cadence Design Systems Incorporated † | | | | 31,200 | 5,704,296 |
| Crowdstrike Holdings Incorporated Class A † | | | | 22,500 | 2,382,750 |
| Microsoft Corporation | | | | 69,534 | 17,231,221 |
| ServiceNow Incorporated † | | | | 10,080 | 4,587,710 |
| | | | | | 35,615,379 |
| Materials: 2.44% | | | | | |
| Chemicals: 2.44% | | | | | |
| The Sherwin-Williams Company | | | | 18,850 | 4,459,722 |
| Real estate: 2.11% | | | | | |
| Equity REITs: 2.11% | | | | | |
| SBA Communications Corporation | | | | 13,000 | 3,867,890 |
| Total Common stocks (Cost $98,225,889) | | | | | 178,348,060 |
| | | Yield | | | |
| Short-term investments: 2.46% | | | | | |
| Investment companies: 2.46% | | | | | |
| Allspring Government Money Market Fund Select Class ♠∞ | | 4.16% | | 4,504,996 | 4,504,996 |
| Total Short-term investments (Cost $4,504,996) | | | | | 4,504,996 |
| Total investments in securities (Cost $102,730,885) | 99.82% | | | | 182,853,056 |
| Other assets and liabilities, net | 0.18 | | | | 325,172 |
| Total net assets | 100.00% | | | | $183,178,228 |
| † | Non-income-earning security |
| ♠ | The issuer of the security is an affiliated person of the Fund as defined in the Investment Company Act of 1940. |
| ∞ | The rate represents the 7-day annualized yield at period end. |
The accompanying notes are an integral part of these financial statements.
10 | Allspring Discovery Large Cap Growth Fund
Portfolio of investments—January 31, 2023 (unaudited)
| Abbreviations: |
| ADR | American depositary receipt |
| REIT | Real estate investment trust |
Investments in affiliates
An affiliated investment is an investment in which the Fund owns at least 5% of the outstanding voting shares of the issuer or as a result of other relationships, such as the Fund and the issuer having the same investment manager. Transactions with issuers that were affiliates of the Fund at the end of the period were as follows:
| | Value,
beginning of
period | Purchases | Sales
proceeds | Net
realized
gains
(losses) | | Net
change in
unrealized
gains
(losses) | | Value,
end of
period | Shares,
end
of period | Income
from
affiliated
securities |
| Short-term investments | | | | | | | | | |
| Allspring Government Money Market Fund Select Class | $6,229,120 | $24,126,713 | $(25,850,837) | $0 | | $0 | | $ 4,504,996 | 4,504,996 | $ 46,659 |
Investments in affiliates no longer
held at end of period | | | | | | | | | | |
| Securities Lending Cash Investments LLC | 0 | 322,650 | (322,650) | 0 | | 0 | | 0 | 0 | 21 # |
| | | | | $0 | | $0 | | $4,504,996 | | $46,680 |
| # | Amount shown represents income before fees and rebates. |
The accompanying notes are an integral part of these financial statements.
Allspring Discovery Large Cap Growth Fund | 11
Statement of assets and liabilities—January 31, 2023 (unaudited)
| | |
| Assets | |
Investments in unaffiliated securities, at value (cost $98,225,889)
| $ 178,348,060 |
Investments in affiliated securities, at value (cost $4,504,996)
| 4,504,996 |
Receivable for investments sold
| 468,774 |
Receivable for dividends
| 37,977 |
Receivable for Fund shares sold
| 11,151 |
Prepaid expenses and other assets
| 117,185 |
Total assets
| 183,488,143 |
| Liabilities | |
Payable for Fund shares redeemed
| 160,443 |
Management fee payable
| 64,261 |
Administration fees payable
| 22,304 |
Shareholder servicing fees payable
| 20,028 |
Trustees’ fees and expenses payable
| 4,587 |
Distribution fee payable
| 1,323 |
Accrued expenses and other liabilities
| 36,969 |
Total liabilities
| 309,915 |
Total net assets
| $183,178,228 |
| Net assets consist of | |
Paid-in capital
| $ 105,040,724 |
Total distributable earnings
| 78,137,504 |
Total net assets
| $183,178,228 |
| Computation of net asset value and offering price per share | |
Net assets – Class A
| $ 92,018,049 |
Shares outstanding – Class A1
| 14,453,390 |
Net asset value per share – Class A
| $6.37 |
Maximum offering price per share – Class A2
| $6.76 |
Net assets – Class C
| $ 2,173,214 |
Shares outstanding – Class C1
| 1,109,637 |
Net asset value per share – Class C
| $1.96 |
Net assets – Class R6
| $ 38,673,086 |
Shares outstanding – Class R61
| 4,724,170 |
Net asset value per share – Class R6
| $8.19 |
Net assets – Administrator Class
| $ 5,374,384 |
Shares outstanding – Administrator Class1
| 723,681 |
Net asset value per share – Administrator Class
| $7.43 |
Net assets – Institutional Class
| $ 44,939,495 |
Shares outstanding – Institutional Class1
| 5,517,630 |
Net asset value per share – Institutional Class
| $8.14 |
| 1 | The Fund has an unlimited number of authorized shares. |
| 2 | Maximum offering price is computed as 100/94.25 of net asset value. On investments of $50,000 or more, the offering price is reduced. |
The accompanying notes are an integral part of these financial statements.
12 | Allspring Discovery Large Cap Growth Fund
Statement of operations—six months ended January 31, 2023 (unaudited)
| | |
| Investment income | |
Dividends (net of foreign withholdings taxes of $3,817)
| $ 522,103 |
Income from affiliated securities
| 46,680 |
Total investment income
| 568,783 |
| Expenses | |
Management fee
| 685,899 |
| Administration fees | |
Class A
| 97,130 |
Class C
| 2,669 |
Class R6
| 5,602 |
Administrator Class
| 3,486 |
Institutional Class
| 37,841 |
| Shareholder servicing fees | |
Class A
| 115,541 |
Class C
| 3,134 |
Administrator Class
| 6,648 |
| Distribution fee | |
Class C
| 9,403 |
Custody and accounting fees
| 9,865 |
Professional fees
| 25,998 |
Registration fees
| 41,322 |
Shareholder report expenses
| 18,980 |
Trustees’ fees and expenses
| 11,025 |
Other fees and expenses
| 17,089 |
Total expenses
| 1,091,632 |
| Less: Fee waivers and/or expense reimbursements | |
Fund-level
| (234,713) |
Class A
| (6,891) |
Class R6
| (3,704) |
Administrator Class
| (532) |
Institutional Class
| (5,774) |
Net expenses
| 840,018 |
Net investment loss
| (271,235) |
| Realized and unrealized gains (losses) on investments | |
Net realized gains on investments
| 1,050,454 |
Net change in unrealized gains (losses) on investments
| (12,383,639) |
Net realized and unrealized gains (losses) on investments
| (11,333,185) |
Net decrease in net assets resulting from operations
| $(11,604,420) |
The accompanying notes are an integral part of these financial statements.
Allspring Discovery Large Cap Growth Fund | 13
Statement of changes in net assets
| | | | | |
| | Six months ended
January 31, 2023
(unaudited) | Year ended
July 31, 2022 |
| Operations | | | | |
Net investment loss
| | $ (271,235) | | $ (1,117,783) |
Net realized gains on investments
| | 1,050,454 | | 32,559,187 |
Net change in unrealized gains (losses) on investments
| | (12,383,639) | | (92,425,273) |
Net decrease in net assets resulting from operations
| | (11,604,420) | | (60,983,869) |
| Distributions to shareholders from | | | | |
| Net investment income and net realized gains | | | | |
Class A
| | (10,974,909) | | (23,155,876) |
Class C
| | (715,269) | | (1,745,947) |
Class R6
| | (3,654,350) | | (5,165,574) |
Administrator Class
| | (556,035) | | (1,537,533) |
Institutional Class
| | (5,651,251) | | (12,444,118) |
Total distributions to shareholders
| | (21,551,814) | | (44,049,048) |
| Capital share transactions | Shares | | Shares | |
| Proceeds from shares sold | | | | |
Class A
| 451,315 | 2,910,253 | 967,499 | 9,750,987 |
Class C
| 57,380 | 120,814 | 240,590 | 993,153 |
Class R6
| 565,982 | 4,781,171 | 2,451,711 | 25,577,401 |
Administrator Class
| 11,328 | 85,471 | 50,063 | 601,613 |
Institutional Class
| 848,650 | 6,953,535 | 1,940,962 | 19,549,872 |
| | | 14,851,244 | | 56,473,026 |
| Reinvestment of distributions | | | | |
Class A
| 1,786,246 | 10,735,336 | 2,215,143 | 22,638,764 |
Class C
| 386,632 | 715,269 | 430,036 | 1,745,947 |
Class R6
| 472,749 | 3,654,350 | 406,418 | 5,165,574 |
Administrator Class
| 78,917 | 553,210 | 130,906 | 1,531,605 |
Institutional Class
| 733,124 | 5,637,727 | 974,855 | 12,351,415 |
| | | 21,295,892 | | 43,433,305 |
| Payment for shares redeemed | | | | |
Class A
| (1,090,491) | (7,251,149) | (2,032,288) | (18,646,650) |
Class C
| (360,148) | (864,218) | (664,761) | (2,681,191) |
Class R6
| (541,674) | (4,944,516) | (1,908,298) | (21,891,244) |
Administrator Class
| (37,728) | (290,007) | (346,530) | (3,550,440) |
Institutional Class
| (3,195,280) | (25,453,132) | (2,871,527) | (32,714,655) |
| | | (38,803,022) | | (79,484,180) |
Net increase (decrease) in net assets resulting from capital share transactions
| | (2,655,886) | | 20,422,151 |
Total decrease in net assets
| | (35,812,120) | | (84,610,766) |
| Net assets | | | | |
Beginning of period
| | 218,990,348 | | 303,601,114 |
End of period
| | $183,178,228 | | $218,990,348 |
The accompanying notes are an integral part of these financial statements.
14 | Allspring Discovery Large Cap Growth Fund
Financial highlights
(For a share outstanding throughout each period)
| | | Year ended July 31 |
| Class A | Six months ended
January 31, 2023
(unaudited) | 2022 | 2021 | 2020 | 2019 | 2018 |
Net asset value, beginning of period
| $7.65 | $11.65 | $9.62 | $8.33 | $9.43 | $9.09 |
Net investment loss
| (0.02) 1 | (0.06) 1 | (0.05) 1 | (0.03) 1 | (0.03) 1 | (0.04) 1 |
Net realized and unrealized gains (losses) on investments
| (0.41) | (2.01) | 2.93 | 2.08 | 0.97 | 2.23 |
Total from investment operations
| (0.43) | (2.07) | 2.88 | 2.05 | 0.94 | 2.19 |
| Distributions to shareholders from | | | | | | |
Net realized gains
| (0.85) | (1.93) | (0.85) | (0.76) | (2.04) | (1.85) |
Net asset value, end of period
| $6.37 | $7.65 | $11.65 | $9.62 | $8.33 | $9.43 |
Total return2
| (4.89)% | (21.94)% | 31.66% | 26.57% | 15.37% | 27.35% |
| Ratios to average net assets (annualized) | | | | | | |
Gross expenses
| 1.29% | 1.26% | 1.25% | 1.26% | 1.30% | 1.25% |
Net expenses
| 1.03% | 1.01% | 1.01% | 1.02% | 1.20% | 1.20% |
Net investment loss
| (0.45)% | (0.58)% | (0.50)% | (0.30)% | (0.35)% | (0.49)% |
| Supplemental data | | | | | | |
Portfolio turnover rate
| 6% | 27% | 21% | 16% | 20% | 36% |
Net assets, end of period (000s omitted)
| $92,018 | $101,833 | $141,657 | $124,271 | $17,940 | $16,301 |
| 1 | Calculated based upon average shares outstanding |
| 2 | Total return calculations do not include any sales charges. Returns for periods of less than one year are not annualized. |
The accompanying notes are an integral part of these financial statements.
Allspring Discovery Large Cap Growth Fund | 15
Financial highlights
(For a share outstanding throughout each period)
| | | Year ended July 31 |
| Class C | Six months ended
January 31, 2023
(unaudited) | 2022 | 2021 | 2020 | 2019 | 2018 |
Net asset value, beginning of period
| $3.03 | $5.76 | $5.18 | $4.86 | $6.46 | $6.80 |
Net investment loss
| (0.02) 1 | (0.06) 1 | (0.07) 1 | (0.05) 1 | (0.06) 1 | (0.08) 1 |
Net realized and unrealized gains (losses) on investments
| (0.20) | (0.74) | 1.50 | 1.13 | 0.50 | 1.59 |
Total from investment operations
| (0.22) | (0.80) | 1.43 | 1.08 | 0.44 | 1.51 |
| Distributions to shareholders from | | | | | | |
Net realized gains
| (0.85) | (1.93) | (0.85) | (0.76) | (2.04) | (1.85) |
Net asset value, end of period
| $1.96 | $3.03 | $5.76 | $5.18 | $4.86 | $6.46 |
Total return2
| (5.43)% | (22.39)% | 30.71% | 25.48% | 14.51% | 26.43% |
| Ratios to average net assets (annualized) | | | | | | |
Gross expenses
| 2.02% | 2.00% | 2.00% | 2.01% | 2.05% | 2.00% |
Net expenses
| 1.78% | 1.78% | 1.78% | 1.79% | 1.95% | 1.95% |
Net investment loss
| (1.19)% | (1.35)% | (1.26)% | (1.06)% | (1.12)% | (1.22)% |
| Supplemental data | | | | | | |
Portfolio turnover rate
| 6% | 27% | 21% | 16% | 20% | 36% |
Net assets, end of period (000s omitted)
| $2,173 | $3,103 | $5,876 | $6,651 | $2,116 | $3,792 |
| 1 | Calculated based upon average shares outstanding |
| 2 | Total return calculations do not include any sales charges. Returns for periods of less than one year are not annualized. |
The accompanying notes are an integral part of these financial statements.
16 | Allspring Discovery Large Cap Growth Fund
Financial highlights
(For a share outstanding throughout each period)
| | | Year ended July 31 |
| Class R6 | Six months ended
January 31, 2023
(unaudited) | 2022 | 2021 | 2020 1 |
Net asset value, beginning of period
| $9.55 | $14.03 | $11.37 | $9.63 |
Net investment income (loss)
| (0.00) 2,3 | (0.02) 2 | (0.01) 2 | 0.01 |
Net realized and unrealized gains (losses) on investments
| (0.51) | (2.53) | 3.52 | 2.49 |
Total from investment operations
| (0.51) | (2.55) | 3.51 | 2.50 |
| Distributions to shareholders from | | | | |
Net realized gains
| (0.85) | (1.93) | (0.85) | (0.76) |
Net asset value, end of period
| $8.19 | $9.55 | $14.03 | $11.37 |
Total return4
| (4.76)% | (21.60)% | 32.36% | 27.68% |
| Ratios to average net assets (annualized) | | | | |
Gross expenses
| 0.86% | 0.83% | 0.82% | 0.82% |
Net expenses
| 0.60% | 0.60% | 0.60% | 0.60% |
Net investment income (loss)
| (0.03)% | (0.15)% | (0.09)% | 0.11% |
| Supplemental data | | | | |
Portfolio turnover rate
| 6% | 27% | 21% | 16% |
Net assets, end of period (000s omitted)
| $38,673 | $40,356 | $45,970 | $48,435 |
| 1 | For the period from September 20, 2019 (commencement of class operations) to July 31, 2020 |
| 2 | Calculated based upon average shares outstanding |
| 3 | Amount is more than $(0.005) |
| 4 | Returns for periods of less than one year are not annualized. |
The accompanying notes are an integral part of these financial statements.
Allspring Discovery Large Cap Growth Fund | 17
Financial highlights
(For a share outstanding throughout each period)
| | | Year ended July 31 |
| Administrator Class | Six months ended
January 31, 2023
(unaudited) | 2022 | 2021 | 2020 | 2019 | 2018 |
Net asset value, beginning of period
| $8.76 | $13.07 | $10.66 | $9.15 | $10.12 | $9.62 |
Net investment loss
| (0.01) 1 | (0.06) 1 | (0.05) 1 | (0.02) 1 | (0.01) 1 | (0.03) 1 |
Net realized and unrealized gains (losses) on investments
| (0.47) | (2.32) | 3.31 | 2.29 | 1.08 | 2.38 |
Total from investment operations
| (0.48) | (2.38) | 3.26 | 2.27 | 1.07 | 2.35 |
| Distributions to shareholders from | | | | | | |
Net realized gains
| (0.85) | (1.93) | (0.85) | (0.76) | (2.04) | (1.85) |
Net asset value, end of period
| $7.43 | $8.76 | $13.07 | $10.66 | $9.15 | $10.12 |
Total return2
| (4.84)% | (21.92)% | 32.15% | 26.59% | 15.63% | 27.55% |
| Ratios to average net assets (annualized) | | | | | | |
Gross expenses
| 1.20% | 1.17% | 1.17% | 1.18% | 1.21% | 1.16% |
Net expenses
| 0.94% | 0.94% | 0.94% | 0.94% | 1.00% | 1.00% |
Net investment loss
| (0.37)% | (0.50)% | (0.43)% | (0.21)% | (0.16)% | (0.28)% |
| Supplemental data | | | | | | |
Portfolio turnover rate
| 6% | 27% | 21% | 16% | 20% | 36% |
Net assets, end of period (000s omitted)
| $5,374 | $5,882 | $10,934 | $8,979 | $2,590 | $3,068 |
| 1 | Calculated based upon average shares outstanding |
| 2 | Returns for periods of less than one year are not annualized. |
The accompanying notes are an integral part of these financial statements.
18 | Allspring Discovery Large Cap Growth Fund
Financial highlights
(For a share outstanding throughout each period)
| | | Year ended July 31 |
| Institutional Class | Six months ended
January 31, 2023
(unaudited) | 2022 | 2021 | 2020 | 2019 | 2018 |
Net asset value, beginning of period
| $9.51 | $13.99 | $11.36 | $9.68 | $10.57 | $9.95 |
Net investment income (loss)
| (0.00) 1,2 | (0.03) 1 | (0.02) 1 | 0.01 1 | 0.00 1,3 | (0.01) 1 |
Net realized and unrealized gains (losses) on investments
| (0.52) | (2.52) | 3.50 | 2.43 | 1.15 | 2.49 |
Total from investment operations
| (0.52) | (2.55) | 3.48 | 2.44 | 1.15 | 2.48 |
| Distributions to shareholders from | | | | | | |
Net investment income
| 0.00 | 0.00 | 0.00 | 0.00 | 0.00 | (0.01) |
Net realized gains
| (0.85) | (1.93) | (0.85) | (0.76) | (2.04) | (1.85) |
Total distributions to shareholders
| (0.85) | (1.93) | (0.85) | (0.76) | (2.04) | (1.86) |
Net asset value, end of period
| $8.14 | $9.51 | $13.99 | $11.36 | $9.68 | $10.57 |
Total return4
| (4.89)% | (21.67)% | 32.11% | 26.91% | 15.76% | 28.01% |
| Ratios to average net assets (annualized) | | | | | | |
Gross expenses
| 0.96% | 0.93% | 0.92% | 0.93% | 0.97% | 0.92% |
Net expenses
| 0.70% | 0.70% | 0.70% | 0.72% | 0.80% | 0.80% |
Net investment income (loss)
| (0.11)% | (0.27)% | (0.19)% | 0.07% | 0.05% | (0.08)% |
| Supplemental data | | | | | | |
Portfolio turnover rate
| 6% | 27% | 21% | 16% | 20% | 36% |
Net assets, end of period (000s omitted)
| $44,939 | $67,816 | $99,164 | $86,407 | $107,670 | $131,655 |
| 1 | Calculated based upon average shares outstanding |
| 2 | Amount is more than $(0.005) |
| 3 | Amount is less than $0.005. |
| 4 | Returns for periods of less than one year are not annualized. |
The accompanying notes are an integral part of these financial statements.
Allspring Discovery Large Cap Growth Fund | 19
Notes to financial statements (unaudited)
1. ORGANIZATION
Allspring Funds Trust (the "Trust"), a Delaware statutory trust organized on March 10, 1999, is an open-end management investment company registered under the Investment Company Act of 1940, as amended (the "1940 Act"). As an investment company, the Trust follows the accounting and reporting guidance in Financial Accounting Standards Board ("FASB") Accounting Standards Codification Topic 946, Financial Services – Investment Companies. These financial statements report on the Allspring Discovery Large Cap Growth Fund (the "Fund") which is a diversified series of the Trust.
2. SIGNIFICANT ACCOUNTING POLICIES
The following significant accounting policies, which are consistently followed in the preparation of the financial statements of the Fund, are in conformity with U.S. generally accepted accounting principles which require management to make estimates and assumptions that affect the reported amounts of assets and liabilities, disclosure of contingent assets and liabilities at the date of the financial statements, and the reported amounts of income and expenses during the reporting period. Actual results could differ from those estimates.
Securities valuation
All investments are valued each business day as of the close of regular trading on the New York Stock Exchange (generally 4 p.m. Eastern Time), although the Fund may deviate from this calculation time under unusual or unexpected circumstances.
Equity securities that are listed on a foreign or domestic exchange or market are valued at the official closing price or, if none, the last sales price.
Investments in registered open-end investment companies (other than those listed on a foreign or domestic exchange or market) are valued at net asset value. Interests in non-registered investment companies that are redeemable at net asset value are fair valued normally at net asset value.
Investments which are not valued using the methods discussed above are valued at their fair value, as determined in good faith by Allspring Funds Management, LLC ("Allspring Funds Management"), which was named the valuation designee by the Board of Trustees. As the valuation designee, Allspring Funds Management is responsible for day-to-day valuation activities for the Allspring Funds. In connection with these responsibilities, Allspring Funds Management has established a Valuation Committee and has delegated to it the authority to take any actions regarding the valuation of portfolio securities that the Valuation Committee deems necessary or appropriate, including determining the fair value of portfolio securities. On a quarterly basis, the Board of Trustees receives reports of valuation actions taken by the Valuation Committee. On at least an annual basis, the Board of Trustees receives an assessment of the adequacy and effectiveness of Allspring Funds Management's process for determining the fair value of the portfolio of investments.
Foreign currency translation
The accounting records of the Fund are maintained in U.S. dollars. The values of other assets and liabilities denominated in foreign currencies are translated into U.S. dollars at rates provided by an independent foreign currency pricing source at a time each business day specified by the Allspring Global Investments Pricing Committee. Purchases and sales of securities, and income and expenses are converted at the rate of exchange on the respective dates of such transactions. Net realized foreign exchange gains or losses arise from sales of foreign currencies, currency gains or losses realized between the trade and settlement dates on securities transactions, and the difference between the amounts of dividends, interest and foreign withholding taxes recorded and the U.S. dollar equivalent of the amounts actually paid or received. Net unrealized foreign exchange gains and losses arise from changes in the fair value of assets and liabilities other than investments in securities resulting from changes in exchange rates. The changes in net assets arising from changes in exchange rates of securities and the changes in net assets resulting from changes in market prices of securities are not separately presented. Such changes are included in net realized and unrealized gains or losses from investments.
Securities lending
The Fund may lend its securities from time to time in order to earn additional income in the form of fees or interest on securities received as collateral or the investment of any cash received as collateral. When securities are on loan, the Fund receives interest or dividends on those securities. Cash collateral received in connection with its securities lending transactions is invested in Securities Lending Cash Investments, LLC (the "Securities Lending Fund"), an affiliated non-registered investment company. Investments in Securities Lending Fund are valued at the evaluated bid price provided by an independent pricing service. Income earned from investment in the Securities Lending Fund (net of fees and rebates), if any, is included in income from affiliated securities on the Statement of Operations.
20 | Allspring Discovery Large Cap Growth Fund
Notes to financial statements (unaudited)
In a securities lending transaction, the net asset value of the Fund is affected by an increase or decrease in the value of the securities loaned and by an increase or decrease in the value of the instrument in which collateral is invested. The amount of securities lending activity undertaken by the Fund fluctuates from time to time. The Fund has the right under the lending agreement to recover the securities from the borrower on demand. In the event of default or bankruptcy by the borrower, the Fund may be prevented from recovering the loaned securities or gaining access to the collateral or may experience delays or costs in doing so. In such an event, the terms of the agreement allow the unaffiliated securities lending agent to use the collateral to purchase replacement securities on behalf of the Fund or pay the Fund the market value of the loaned securities. The Fund bears the risk of loss with respect to depreciation of its investment of the cash collateral.
Security transactions and income recognition
Securities transactions are recorded on a trade date basis. Realized gains or losses are recorded on the basis of identified cost.
Dividend income is recognized on the ex-dividend date. Dividend income is recorded net of foreign taxes withheld where recovery of such taxes is not assured.
Distributions to shareholders
Distributions to shareholders from net investment income and any net realized gains are recorded on the ex-dividend date and paid at least annually. Such distributions are determined in accordance with income tax regulations and may differ from U.S. generally accepted accounting principles. Dividend sources are estimated at the time of declaration. The tax character of distributions is determined as of the Fund's fiscal year end. Therefore, a portion of the Fund's distributions made prior to the Fund’s fiscal year end may be categorized as a tax return of capital at year end.
Federal and other taxes
The Fund intends to continue to qualify as a regulated investment company by distributing substantially all of its investment company taxable income and any net realized capital gains (after reduction for capital loss carryforwards) sufficient to relieve it from all, or substantially all, federal income taxes. Accordingly, no provision for federal income taxes was required.
The Fund’s income and federal excise tax returns and all financial records supporting those returns for the prior three fiscal years are subject to examination by the federal and Delaware revenue authorities. Management has analyzed the Fund's tax positions taken on federal, state, and foreign tax returns, as applicable, for all open tax years and does not believe that there are any uncertain tax positions that require recognition of a tax liability.
As of January 31, 2023, the aggregate cost of all investments for federal income tax purposes was $10,884,239 and the unrealized gains (losses) consisted of:
| Gross unrealized gains | $203,435,902 |
| Gross unrealized losses | (31,467,085) |
| Net unrealized gains | $171,968,817 |
As of July 31, 2022, the Fund had a qualified late-year ordinary loss of $567,749 which was recognized on the first day of the current fiscal year.
Class allocations
The separate classes of shares offered by the Fund differ principally in applicable sales charges, distribution, shareholder servicing, and administration fees. Class specific expenses are charged directly to that share class. Investment income, common fund-level expenses, and realized and unrealized gains (losses) on investments are allocated daily to each class of shares based on the relative proportion of net assets of each class.
Allspring Discovery Large Cap Growth Fund | 21
Notes to financial statements (unaudited)
3. FAIR VALUATION MEASUREMENTS
Fair value measurements of investments are determined within a framework that has established a fair value hierarchy based upon the various data inputs utilized in determining the value of the Fund’s investments. The three-level hierarchy gives the highest priority to unadjusted quoted prices in active markets for identical assets or liabilities (Level 1) and the lowest priority to unobservable inputs (Level 3). The Fund’s investments are classified within the fair value hierarchy based on the lowest level of input that is significant to the fair value measurement. The inputs are summarized into three broad levels as follows:
| ■ | Level 1 – quoted prices in active markets for identical securities |
| ■ | Level 2 – other significant observable inputs (including quoted prices for similar securities, interest rates, prepayment speeds, credit risk, etc.) |
| ■ | Level 3 – significant unobservable inputs (including the Fund’s own assumptions in determining the fair value of investments) |
The inputs or methodologies used for valuing investments in securities are not necessarily an indication of the risk associated with investing in those securities.
The following is a summary of the inputs used in valuing the Fund’s assets and liabilities as of January 31, 2023:
| | Quoted prices
(Level 1) | Other significant
observable inputs
(Level 2) | Significant
unobservable inputs
(Level 3) | Total |
| Assets | | | | |
| Investments in: | | | | |
| Common stocks | | | | |
| Communication services | $ 18,083,479 | $0 | $0 | $ 18,083,479 |
| Consumer discretionary | 35,131,757 | 0 | 0 | 35,131,757 |
| Financials | 16,236,332 | 0 | 0 | 16,236,332 |
| Health care | 20,295,989 | 0 | 0 | 20,295,989 |
| Industrials | 14,961,810 | 0 | 0 | 14,961,810 |
| Information technology | 65,311,081 | 0 | 0 | 65,311,081 |
| Materials | 4,459,722 | 0 | 0 | 4,459,722 |
| Real estate | 3,867,890 | 0 | 0 | 3,867,890 |
| Short-term investments | | | | |
| Investment companies | 4,504,996 | 0 | 0 | 4,504,996 |
| Total assets | $182,853,056 | $0 | $0 | $182,853,056 |
Additional sector, industry or geographic detail, if any, is included in the Portfolio of Investments.
For the six months ended January 31, 2023, the Fund did not have any transfers into/out of Level 3.
4. TRANSACTIONS WITH AFFILIATES
Management fee
Allspring Funds Management, a wholly owned subsidiary of Allspring Global Investments Holdings, LLC, a holding company indirectly owned by certain private funds of GTCR LLC and Reverence Capital Partners, L.P., is the manager of the Fund and provides advisory and fund-level administrative services under an investment management agreement. Under the investment management agreement, Allspring Funds Management is responsible for, among other services, implementing the investment objectives and strategies of the Fund, supervising the subadviser and providing fund-level administrative services in connection with the Fund’s operations. As compensation for its services under the investment management agreement, Allspring Funds Management is entitled to receive a management fee at the following annual rate based on the Fund’s average daily net assets:
22 | Allspring Discovery Large Cap Growth Fund
Notes to financial statements (unaudited)
| Average daily net assets | Management fee |
| First $500 million | 0.700% |
| Next $500 million | 0.675 |
| Next $1 billion | 0.650 |
| Next $2 billion | 0.625 |
| Next $1 billion | 0.600 |
| Next $3 billion | 0.590 |
| Next $2 billion | 0.565 |
| Next $2 billion | 0.555 |
| Next $4 billion | 0.530 |
| Over $16 billion | 0.505 |
For the six months ended January 31, 2023, the management fee was equivalent to an annual rate of 0.70% of the Fund’s average daily net assets.
Allspring Funds Management has retained the services of a subadviser to provide daily portfolio management to the Fund. The fee for subadvisory services is borne by Allspring Funds Management. Allspring Global Investments, LLC ("Allspring Investments"), an affiliate of Allspring Funds Management and a wholly owned subsidiary of Allspring Global Investments Holdings, LLC, is the subadviser to the Fund and is entitled to receive a fee from Allspring Funds Management at an annual rate starting at 0.30% and declining to 0.20% as the average daily net assets of the Fund increase.
Administration fees
Under a class-level administration agreement, Allspring Funds Management provides class-level administrative services to the Fund, which includes paying fees and expenses for services provided by the transfer agent, sub-transfer agents, omnibus account servicers and record-keepers. As compensation for its services under the class-level administration agreement, Allspring Funds Management receives an annual fee which is calculated based on the average daily net assets of each class as follows:
| | Class-level
administration fee |
| Class A | 0.21% |
| Class C | 0.21 |
| Class R6 | 0.03 |
| Administrator Class | 0.13 |
| Institutional Class | 0.13 |
Waivers and/or expense reimbursements
Allspring Funds Management has contractually committed to waive and/or reimburse management and administration fees to the extent necessary to maintain certain net operating expense ratios for the Fund. When each class of the Fund has exceeded its expense cap, Allspring Funds Management will waive fees and/or reimburse expenses from fund-level expenses on a proportionate basis and then from class specific expenses. When only certain classes exceed their expense caps, waivers and/or reimbursements are applied against class specific expenses before fund-level expenses. Allspring Funds Management has contractually committed through November 30, 2023 to waive fees and/or reimburse expenses to the extent necessary to cap expenses. Prior to or after the commitment expiration date, the caps may be increased or the commitment to maintain the caps may be terminated only with the approval of the Board of Trustees. As of January 31, 2023, the contractual expense caps are as follows:
Allspring Discovery Large Cap Growth Fund | 23
Notes to financial statements (unaudited)
| | Expense ratio caps |
| Class A | 1.03% |
| Class C | 1.78 |
| Class R6 | 0.60 |
| Administrator Class | 0.94 |
| Institutional Class | 0.70 |
Distribution fee
The Trust has adopted a distribution plan for Class C shares pursuant to Rule 12b-1 under the 1940 Act. A distribution fee is charged to Class C shares and paid to Allspring Funds Distributor, LLC ("Allspring Funds Distributor"), the principal underwriter, an affiliate of Allspring Funds Management, at an annual rate up to 0.75% of the average daily net assets of Class C shares.
In addition, Allspring Funds Distributor is entitled to receive the front-end sales charge from the purchase of Class A shares and a contingent deferred sales charge on the redemption of certain Class A shares. Allspring Funds Distributor is also entitled to receive the contingent deferred sales charges from redemptions of Class C shares. For the six months ended January 31, 2023, Allspring Funds Distributor received $806 from the sale of Class A shares. No contingent deferred sales charges were incurred by Class A and Class C shares for the six months ended January 31, 2023.
Shareholder servicing fees
The Trust has entered into contracts with one or more shareholder servicing agents, whereby Class A, Class C and Administrator Class are charged a fee at an annual rate up to 0.25% of the average daily net assets of each respective class. A portion of these total shareholder servicing fees were paid to affiliates of the Fund.
Interfund transactions
The Fund may purchase or sell portfolio investment securities to certain affiliates pursuant to Rule 17a-7 under the 1940 Act and under procedures adopted by the Board of Trustees. The procedures have been designed to ensure that these interfund transactions, which do not incur broker commissions, are effected at current market prices.
5. INVESTMENT PORTFOLIO TRANSACTIONS
Purchases and sales of investments, excluding U.S. government obligations (if any) and short-term securities, for the six months ended January 31, 2023 were $451,769,206 and $452,526,899, respectively.
6. SECURITIES LENDING TRANSACTIONS
The Fund lends its securities through an unaffiliated securities lending agent and receives collateral in the form of cash or securities with a value at least equal to the value of the securities on loan. The value of the loaned securities is determined at the close of each business day and any increases or decreases in the required collateral are exchanged between the Fund and the counterparty on the next business day. Cash collateral received is invested in the Securities Lending Fund which seeks to provide a positive return compared to the daily Federal Funds Open Rate by investing in high-quality, U.S. dollar-denominated short-term money market instruments and is exempt from registration under Section 3(c)(7) of the 1940 Act. Securities Lending Fund is managed by Allspring Funds Management and is subadvised by Allspring Investments. Allspring Funds Management receives an advisory fee starting at 0.05% and declining to 0.01% as the average daily net assets of the Securities Lending Fund increase. All of the fees received by Allspring Funds Management are paid to Allspring Investments for its services as subadviser.
In the event of counterparty default or the failure of a borrower to return a loaned security, the Fund has the right to use the collateral to offset any losses incurred. As of January 31, 2023, the Fund did not have any securities on loan.
7. BANK BORROWINGS
The Trust (excluding the money market funds), Allspring Master Trust and Allspring Variable Trust are parties to a $350,000,000 revolving credit agreement whereby the Fund is permitted to use bank borrowings for temporary or emergency purposes, such as to fund shareholder redemption requests. Interest under the credit agreement is charged to the Fund based on a borrowing rate equal to the higher of the Federal Funds rate or the overnight bank funding rate in effect on that day plus a spread. In addition, an annual commitment fee equal based on the unused balance is allocated to each participating fund.
For the six months ended January 31, 2023, there were no borrowings by the Fund under the agreement.
24 | Allspring Discovery Large Cap Growth Fund
Notes to financial statements (unaudited)
8. CONCENTRATION RISKS
As of the end of the period, the Fund concentrated its portfolio of investments in the information technology sector. A fund that invests a substantial portion of its assets in any sector may be more affected by changes in that sector than would be a fund whose investments are not heavily weighted in any sector.
9. MARKET RISKS
On March 11, 2020, the World Health Organization announced that it had made the assessment that coronavirus disease 2019 (“COVID-19”) is a pandemic. The impacts of COVID-19 are affecting the entire global economy, individual companies and investment products, the funds, and the market in general. There is significant uncertainty around the extent and duration of business disruptions related to COVID-19 and the impacts may last for an extended period of time. COVID-19 has led to significant uncertainty and volatility in the financial markets.
10. INDEMNIFICATION
Under the Fund's organizational documents, the officers and Trustees have been granted certain indemnification rights against certain liabilities that may arise out of performance of their duties to the Fund. The Fund has entered into a separate agreement with each Trustee that converts indemnification rights currently existing under the Fund’s organizational documents into contractual rights that cannot be changed in the future without the consent of the Trustee. Additionally, in the normal course of business, the Fund may enter into contracts with service providers that contain a variety of indemnification clauses. The Fund’s maximum exposure under these arrangements is dependent on future claims that may be made against the Fund and, therefore, cannot be estimated.
Allspring Discovery Large Cap Growth Fund | 25
Other information (unaudited)
PROXY VOTING INFORMATION
A description of the policies and procedures used to determine how to vote proxies relating to portfolio securities is available without charge, upon request, by calling 1-800-222-8222, visiting our website at allspringglobal.com, or visiting the SEC website at sec.gov. Information regarding how the proxies related to portfolio securities were voted during the most recent 12-month period ended June 30 is available on the website at allspringglobal.com or by visiting the SEC website at sec.gov.
QUARTERLY PORTFOLIO HOLDINGS INFORMATION
The Fund files its complete schedule of portfolio holdings with the SEC for the first and third quarters of each fiscal year as an exhibit to its reports on Form N-PORT. Shareholders may view the filed Form N-PORT by visiting the SEC website at sec.gov.
26 | Allspring Discovery Large Cap Growth Fund
Other information (unaudited)
BOARD OF TRUSTEES AND OFFICERS
Each of the Trustees and Officers listed in the table below acts in identical capacities for each fund in the Allspring family of funds, which consists of 127 mutual funds comprising the Allspring Funds Trust, Allspring Variable Trust, Allspring Master Trust and four closed-end funds (collectively the “Fund Complex”). This table should be read in conjunction with the Prospectus and the Statement of Additional Information1. The mailing address of each Trustee and Officer is 1415 Vantage Park Drive, 3rd Floor, Charlotte, NC 28203. Each Trustee and Officer serves an indefinite term, however, each Trustee serves such term until reaching the mandatory retirement age established by the Trustees.
Independent Trustees
Name and
year of birth | Position held and
length of service* | Principal occupations during past five years or longer | Current other
public company or
investment
company
directorships |
William R. Ebsworth
(Born 1957) | Trustee,
since 2015 | Retired. From 1984 to 2013, equities analyst, portfolio manager, research director and chief investment officer at Fidelity Management and Research Company in Boston, Tokyo, and Hong Kong, and retired in 2013 as Chief Investment Officer of Fidelity Strategic Advisers, Inc. where he led a team of investment professionals managing client assets. Prior thereto, Board member of Hong Kong Securities Clearing Co., Hong Kong Options Clearing Corp., the Thailand International Fund, Ltd., Fidelity Investments Life Insurance Company, and Empire Fidelity Investments Life Insurance Company. Audit Committee Chair and Investment Committee Chair of the Vincent Memorial Hospital Foundation (non-profit organization). Mr. Ebsworth is a CFA® charterholder. | N/A |
Jane A. Freeman
(Born 1953) | Trustee,
since 2015;
Chair Liaison,
since 2018 | Retired. From 2012 to 2014 and 1999 to 2008, Chief Financial Officer of Scientific Learning Corporation. From 2008 to 2012, Ms. Freeman provided consulting services related to strategic business projects. Prior to 1999, Portfolio Manager at Rockefeller & Co. and Scudder, Stevens & Clark. Board member of the Harding Loevner Funds from 1996 to 2014, serving as both Lead Independent Director and chair of the Audit Committee. Board member of the Russell Exchange Traded Funds Trust from 2011 to 2012 and the chair of the Audit Committee. Ms. Freeman is also an inactive Chartered Financial Analyst. | N/A |
Isaiah Harris, Jr.
(Born 1952) | Trustee,
since 2009; Audit
Committee
Chair,
since 2019 | Retired. Member of the Advisory Board of CEF of East Central Florida. Chairman of the Board of CIGNA Corporation from 2009 to 2021, and Director from 2005 to 2008. From 2003 to 2011, Director of Deluxe Corporation. Prior thereto, President and CEO of BellSouth Advertising and Publishing Corp. from 2005 to 2007, President and CEO of BellSouth Enterprises from 2004 to 2005 and President of BellSouth Consumer Services from 2000 to 2003. Emeritus member of the Iowa State University Foundation Board of Governors. Emeritus Member of the Advisory Board of Iowa State University School of Business. Advisory Board Member, Palm Harbor Academy (private school). Advisory Board Member, Fellowship of Christian Athletes. Mr. Harris is a certified public accountant (inactive status). | N/A |
David F. Larcker
(Born 1950) | Trustee,
since 2009 | Distinguished Visiting Fellow at the Hoover Institution since 2022. James Irvin Miller Professor of Accounting at the Graduate School of Business (Emeritus), Stanford University, Director of the Corporate Governance Research Initiative and Senior Faculty of The Rock Center for Corporate Governance since 2006. From 2005 to 2008, Professor of Accounting at the Graduate School of Business, Stanford University. Prior thereto, Ernst & Young Professor of Accounting at The Wharton School, University of Pennsylvania from 1985 to 2005. | N/A |
Allspring Discovery Large Cap Growth Fund | 27
Other information (unaudited)
Name and
year of birth | Position held and
length of service* | Principal occupations during past five years or longer | Current other
public company or
investment
company
directorships |
Olivia S. Mitchell
(Born 1953) | Trustee,
since 2006;
Nominating and
Governance
Committee Chair,
since 2018 | International Foundation of Employee Benefit Plans Professor since 1993, Wharton School of the University of Pennsylvania. Director of Wharton’s Pension Research Council and Boettner Center on Pensions & Retirement Research, and Research Associate at the National Bureau of Economic Research. Previously taught at Cornell University from 1978 to 1993. | N/A |
Timothy J. Penny
(Born 1951) | Trustee,
since 1996;
Chair,
since 2018 | President and Chief Executive Officer of Southern Minnesota Initiative Foundation, a non-profit organization, since 2007. Vice Chair of the Economic Club of Minnesota, since 2007. Co-Chair of the Committee for a Responsible Federal Budget, since 1995. Member of the Board of Trustees of NorthStar Education Finance, Inc., a non-profit organization, from 2007-2022. Senior Fellow of the University of Minnesota Humphrey Institute from 1995 to 2017. | N/A |
James G. Polisson
(Born 1959) | Trustee,
since 2018 | Retired. Chief Marketing Officer, Source (ETF) UK Services, Ltd, from 2015 to 2017. From 2012 to 2015, Principal of The Polisson Group, LLC, a management consulting, corporate advisory and principal investing company. Chief Executive Officer and Managing Director at Russell Investments, Global Exchange Traded Funds from 2010 to 2012. Managing Director of Barclays Global Investors from 1998 to 2010 and Global Chief Marketing Officer for iShares and Barclays Global Investors from 2000 to 2010. Trustee of the San Francisco Mechanics’ Institute, a non-profit organization, from 2013 to 2015. Board member of the Russell Exchange Traded Fund Trust from 2011 to 2012. Director of Barclays Global Investors Holdings Deutschland GmbH from 2006 to 2009. Mr. Polisson is an attorney and has a retired status with the Massachusetts and District of Columbia Bar Associations. | N/A |
Pamela Wheelock
(Born 1959) | Trustee,
since January
2020; previously
Trustee from
January 2018 to
July 2019 | Retired. Executive and Senior Financial leadership positions in the public, private and nonprofit sectors. Interim President and CEO, McKnight Foundation, 2020. Interim Commissioner, Minnesota Department of Human Services, 2019. Chief Operating Officer, Twin Cities Habitat for Humanity, 2017-2019. Vice President for University Services, University of Minnesota, 2012-2016. Interim President and CEO, Blue Cross and Blue Shield of Minnesota, 2011-2012. Executive Vice-President and Chief Financial Officer, Minnesota Wild, 2002-2008. Commissioner, Minnesota Department of Finance, 1999-2002. Chair of the Board of Directors of Destination Medical Center Corporation. Board member of the Minnesota Wild Foundation. | N/A |
* Length of service dates reflect the Trustee’s commencement of service with the Trust’s predecessor entities, where applicable.
28 | Allspring Discovery Large Cap Growth Fund
Other information (unaudited)
Officers2
Name and
year of birth | Position held and
length of service | Principal occupations during past five years or longer |
Andrew Owen
(Born 1960) | President,
since 2017 | President and Chief Executive Officer of Allspring Funds Management, LLC since 2017 and Head of Global Fund Governance of Allspring Global Investments since 2022. Prior thereto, co-president of Galliard Capital Management, LLC, an affiliate of Allspring Funds Management, LLC, from 2019 to 2022 and Head of Affiliated Managers, Allspring Global Investments, from 2014 to 2019 and Executive Vice President responsible for marketing, investments and product development for Allspring Funds Management, LLC, from 2009 to 2014. |
Jeremy DePalma
(Born 1974) | Treasurer,
since 2012
(for certain funds in
the Fund Complex);
since 2021 (for
the remaining funds in the
Fund Complex) | Senior Vice President of Allspring Funds Management, LLC since 2009. Senior Vice President of Evergreen Investment Management Company, LLC from 2008 to 2010 and head of the Fund Reporting and Control Team within Fund Administration from 2005 to 2010. |
Christopher Baker
(Born 1976) | Chief Compliance Officer, since 2022 | Global Chief Compliance Officer for Allspring Global Investments since 2022. Prior thereto, Chief Compliance Officer for State Street Global Advisors from 2018 to 2021. Senior Compliance Officer for the State Street divisions of Alternative Investment Solutions, Sector Solutions, and Global Marketing from 2015 to 2018. From 2010 to 2015 Vice President, Global Head of Investment and Marketing Compliance for State Street Global Advisors. |
Matthew Prasse
(Born 1983) | Chief Legal Officer, since 2022; Secretary, since 2021 | Senior Counsel of the Allspring Legal Department since 2021. Senior Counsel of the Wells Fargo Legal Department from 2018 to 2021. Previously, Counsel for Barings LLC from 2015 to 2018. Prior to joining Barings, Associate at Morgan, Lewis & Bockius LLP from 2008 to 2015. |
1 The Statement of Additional Information includes additional information about the Trustees and is available, without charge, upon request, by calling 1-800-222-8222 or by visiting the website at allspringglobal.com.
2 For those Officers with tenures at Allspring Global Investments and/or Allspring Funds Management, LLC that began prior to 2021, such tenures include years of service during which these businesses/entities were known as Wells Fargo Asset Management and Wells Fargo Funds Management, LLC, respectively.
Allspring Discovery Large Cap Growth Fund | 29
For more information
More information about Allspring Funds is available free upon request. To obtain literature, please write, visit the Fund's website, or call:
Allspring Funds
P.O. Box 219967
Kansas City, MO 64121-9967
Website: allspringglobal.com
Individual investors: 1-800-222-8222
Retail investment professionals: 1-888-877-9275
Institutional investment professionals: 1-800-260-5969
This report and the financial statements contained herein are submitted for the general information of the shareholders of the Fund. If this report is used for promotional purposes, distribution of the report must be accompanied or preceded by a current prospectus. Before investing, please consider the investment objectives, risks, charges, and expenses of the investment. For a current prospectus and, if available, a summary prospectus, containing this information, call
1-800-222-8222 or visit the Fund's website at allspringglobal.com. Read the prospectus carefully before you invest or send money.
Allspring Global InvestmentsTM is the trade name for the asset management firms of Allspring Global Investments Holdings, LLC, a holding company indirectly owned by certain private funds of GTCR LLC and Reverence Capital Partners, L.P. These firms include but are not limited to Allspring Global Investments, LLC, and Allspring Funds Management, LLC. Certain products managed by Allspring entities are distributed by Allspring Funds Distributor, LLC (a broker-dealer and Member FINRA/SIPC).
This material is for general informational and educational purposes only and is NOT intended to provide investment advice or a recommendation of any kind - including a recommendation for any specific investment, strategy, or plan.
© 2023 Allspring Global Investments Holdings, LLC. All rights reserved.
ALL-02092023-qhzkk7on 03-23
SAR4303 01-23
Semi-Annual Report
January 31, 2023
The views expressed and any forward-looking statements are as of January 31, 2023, unless otherwise noted, and are those of the Fund's portfolio managers and/or Allspring Global Investments. Discussions of individual securities or the markets generally are not intended as individual recommendations. Future events or results may vary significantly from those expressed in any forward-looking statements. The views expressed are subject to change at any time in response to changing circumstances in the market. Allspring Global Investments disclaims any obligation to publicly update or revise any views expressed or forward-looking statements.
Allspring Growth Fund | 1
Letter to shareholders (unaudited)
Andrew Owen
President
Allspring Funds
Dear Shareholder:
We are pleased to offer you this semi-annual report for the Allspring Growth Fund for the six-month period that ended January 31, 2023. Globally, stocks and bonds experienced heightened volatility through the challenging period. Earlier tailwinds provided by global stimulus programs, vaccination rollouts, and recovering consumer and corporate sentiment were wiped away by the highest rate of inflation in four decades as well as the impact of ongoing aggressive central bank rate hikes and the prospect of more rate hikes. Compounding these concerns were the global reverberations of the Russia-Ukraine war and the impact of China’s strict COVID-19 lockdowns.
For the six-month period, stocks and bonds had mixed results, with non-U.S. equities––both developed market and emerging market––outperforming U.S. stocks overall. Bonds––both U.S. and non-U.S.––struggled to cope with sustained aggressive interest rate increases. For the period, U.S. stocks, based on the S&P 500 Index,1 lost 0.44%. International stocks, as measured by the MSCI ACWI ex USA Index (Net),2 returned 7.63%, while the MSCI EM Index (Net) (USD)3 gained 4.92%. Among bond indexes, the Bloomberg U.S. Aggregate Bond Index4 returned -2.37%, the Bloomberg Global Aggregate ex-USD Index (unhedged)5 returned -1.15%, the Bloomberg Municipal Bond Index6 gained 0.73%, and the ICE BofA U.S. High Yield Index7 returned 1.27%.
The Russia-Ukraine war, high inflation, and central bank rate hikes rocked markets
August was yet another broadly challenging month for financial markets, with more red ink flowing. High inflation persisted, cresting 9% in the eurozone on an annual basis and remaining above 8% in the U.S. despite the Federal Reserve’s (Fed’s) aggressive monetary policy and a major drop in global crude oil and gasoline prices from their June peak. One positive note was the resilience of the U.S. job market. However, the Fed’s job was clearly not complete. One longer-term bright spot was the U.S. Congress’s passage of the Inflation Reduction Act. Its primary stated goals include: to reduce inflation (though not immediately) by curbing the deficit, capping health care spending by seniors, and investing in domestic sources of clean energy.
“August was yet another broadly challenging month for financial markets, with more red ink flowing.”
| 1 | The S&P 500 Index consists of 500 stocks chosen for market size, liquidity, and industry group representation. It is a market-value-weighted index with each stock's weight in the index proportionate to its market value. You cannot invest directly in an index. |
| 2 | The Morgan Stanley Capital International (MSCI) All Country World Index (ACWI) ex USA Index (Net) is a free-float-adjusted market-capitalization-weighted index that is designed to measure the equity market performance of developed and emerging markets, excluding the U.S. Source: MSCI. MSCI makes no express or implied warranties or representations and shall have no liability whatsoever with respect to any MSCI data contained herein. The MSCI data may not be further redistributed or used as a basis for other indexes or any securities or financial products. This report is not approved, reviewed, or produced by MSCI. You cannot invest directly in an index. |
| 3 | The MSCI Emerging Markets (EM) Index (Net) (USD) is a free-float-adjusted market-capitalization-weighted index that is designed to measure equity market performance of emerging markets. You cannot invest directly in an index. |
| 4 | The Bloomberg U.S. Aggregate Bond Index is a broad-based benchmark that measures the investment-grade, U.S.-dollar-denominated, fixed-rate taxable bond market, including Treasuries, government-related and corporate securities, mortgage-backed securities (agency fixed-rate and hybrid adjustable-rate mortgage pass-throughs), asset-backed securities, and commercial mortgage-backed securities. You cannot invest directly in an index. |
| 5 | The Bloomberg Global Aggregate ex-USD Index (unhedged) is an unmanaged index that provides a broad-based measure of the global investment-grade fixed-income markets excluding the U.S.-dollar-denominated debt market. You cannot invest directly in an index. |
| 6 | The Bloomberg Municipal Bond Index is an unmanaged index composed of long-term tax-exempt bonds with a minimum credit rating of Baa. You cannot invest directly in an index. |
| 7 | The ICE BofA U.S. High Yield Index is a market-capitalization-weighted index of domestic and Yankee high-yield bonds. The index tracks the performance of high-yield securities traded in the U.S. bond market. You cannot invest directly in an index. Copyright 2023. ICE Data Indices, LLC. All rights reserved. |
2 | Allspring Growth Fund
Letter to shareholders (unaudited)
The market misery continued in September. There was nowhere to hide as all asset classes suffered major losses at the hands of persistent inflation. Central banks kept up their battle against rapidly rising prices with more rate hikes. The strength of the U.S. dollar made things even more difficult for investors holding assets in other currencies. U.S. mortgage rates jumped to near 7% on 30-year fixed-rate mortgages; the decreased housing affordability began to cool demand somewhat. The U.K. experienced a sharp sell-off of government bonds and the British pound in September as investors panicked in response to a new government budget that was seen as financially unsound. The market meltdown forced the Bank of England to step in and buy long-dated government bonds.
Equities had a reprieve in October after two months of sharp declines. Value stocks and small caps fared best. Globally, developed markets outpaced emerging market equities, which were hurt by weakness among Chinese stocks. Central banks continued to try to curtail high inflation with aggressive interest rate hikes. Geopolitical risks persisted, including the ongoing Russia-Ukraine war and economic, financial market, and political turmoil in the U.K., which led to a second prime ministerial change in six weeks, as Rishi Sunak replaced Liz Truss in late October. Concerns over Europe’s energy crisis eased thanks to unseasonably warm weather and plentiful gas on hand. The U.S. labor market continued its resilience against rising prices, as unemployment stood at 3.7%, near a record low.
Stocks and bonds rallied in November, with emerging market equities gaining nearly 15% and developed market equities returning 7%. The S&P 500 Index rose 5.6% in November. Bonds also had positive monthly returns. Economic news was encouraging, driven by U.S. labor market strength. Although central banks kept raising rates, expectations grew regarding an impending easing in the pace of rate hikes and a possible end to central bank monetary tightening in 2023. Although inflation remained at record highs in the eurozone, with a 10.6% annual increase in October, Germany’s producer prices decreased 4.2% annually, signaling a possible decline in inflationary pressures. Meanwhile, U.S. inflation continued to moderate, with a 7.1% annual price rise in November and a monthly price increase of just 0.1%. China’s economic data remained weak, reflecting its zero-COVID-19 policy.
Financial markets cooled in December, with U.S. equities posting negative overall results in response to a weakening U.S. dollar. Fixed income securities ended one of their worst years ever with flat overall monthly returns as markets weighed the hopes for an end to the monetary tightening cycle with the reality that central banks had not completed their jobs yet. U.S. Consumer Price Index (CPI)1 data showed a strong consistent trend downward, which brought down the 12-month CPI to 6.5% in December from 9.1% in June. Other countries and regions reported still-high but declining inflation rates as the year winded down.
The year 2023 began with a broad rally across global equities and fixed income securities. Investor optimism rose in response to data indicating declining inflation rates and the reopening of China’s economy with the abrupt end to its zero-COVID-19 policy. The U.S. reported surprisingly strong job gains––employers added more than 500,000 jobs––and unemployment fell to 3.4%, the lowest level since 1969. Meanwhile, wage growth, seen as a potential contributor to ongoing high inflation, continued to moderate. All eyes remained fixed on the Fed and on how many additional rate hikes it will announce before reaching the peak (“terminal”) rate, expected to be above 5%. The 0.25% federal funds rate hike announced in January was the Fed’s smallest rate increase since March 2022.
| 1 | The Consumer Price Index (CPI) is a measure of the average change over time in the prices paid by urban consumers for a market basket of consumer goods and services. You cannot invest directly in an index. |
Allspring Growth Fund | 3
Letter to shareholders (unaudited)
Don’t let short-term uncertainty derail long-term investment goals.
Periods of investment uncertainty can present challenges, but experience has taught us that maintaining long-term investment goals can be an effective way to plan for the future. To help you create a sound strategy based on your personal goals and risk tolerance, Allspring Funds offers more than 100 mutual funds spanning a wide range of asset classes and investment styles. Although diversification cannot guarantee an investment profit or prevent losses, we believe it can be an effective way to manage investment risk and potentially smooth out overall portfolio performance. We encourage investors to know their investments and to understand that appropriate levels of risk-taking may unlock opportunities.
Thank you for choosing to invest with Allspring Funds. We appreciate your confidence in us and remain committed to helping you meet your financial needs.
Sincerely,
Andrew Owen
President
Allspring Funds
For further information about your fund, contact your investment professional, visit our website at allspringglobal.com, or call us directly at 1-800-222-8222.
4 | Allspring Growth Fund
This page is intentionally left blank.
Performance highlights (unaudited)
| Investment objective | The Fund seeks long-term capital appreciation. |
| Manager | Allspring Funds Management, LLC |
| Subadviser | Allspring Global Investments, LLC |
| Portfolio managers | Robert Gruendyke, CFA®‡, Thomas C. Ognar, CFA®‡ |
| Average annual total returns (%) as of January 31, 2023 |
| | | Including sales charge | | Excluding sales charge | | Expense ratios1 (%) |
| | Inception date | 1 year | 5 year | 10 year | | 1 year | 5 year | 10 year | | Gross | Net 2 |
| Class A (SGRAX) | 2-24-2000 | -25.83 | 5.50 | 9.81 | | -21.31 | 6.75 | 10.46 | | 1.17 | 1.16 |
| Class C (WGFCX) | 12-26-2002 | -22.56 | 6.37 | 9.96 | | -21.56 | 6.37 | 9.96 | | 1.92 | 1.91 |
| Class R6 (SGRHX)3 | 9-30-2015 | – | – | – | | -20.95 | 7.23 | 10.96 | | 0.74 | 0.70 |
| Administrator Class (SGRKX) | 8-30-2002 | – | – | – | | -21.15 | 6.95 | 10.68 | | 1.09 | 0.96 |
| Institutional Class (SGRNX) | 2-24-2000 | – | – | – | | -20.99 | 7.18 | 10.91 | | 0.84 | 0.75 |
| Russell 3000® Growth Index4 | – | – | – | – | | -15.48 | 10.78 | 14.18 | | – | – |
Figures quoted represent past performance, which is no guarantee of future results, and do not reflect taxes that a shareholder may pay on an investment in a fund. Investment return and principal value of an investment will fluctuate so that an investor’s shares, when redeemed, may be worth more or less than their original cost. Performance shown without sales charges would be lower if sales charges were reflected. Current performance may be lower or higher than the performance data quoted, which assumes the reinvestment of dividends and capital gains. Current month-end performance is available on the Fund’s website, allspringglobal.com.
Index returns do not include transaction costs associated with buying and selling securities, any mutual fund fees or expenses, or any taxes. It is not possible to invest directly in an index.
For Class A shares, the maximum front-end sales charge is 5.75%. For Class C shares, the maximum contingent deferred sales charge is 1.00%. Performance including a contingent deferred sales charge assumes the sales charge for the corresponding time period. Class R6, Administrator Class and Institutional Class shares are sold without a front-end sales charge or contingent deferred sales charge.
| 1 | Reflects the expense ratios as stated in the most recent prospectuses. The expense ratios shown are subject to change and may differ from the annualized expense ratios shown in the financial highlights of this report. |
| 2 | The manager has contractually committed through November 30, 2023, to waive fees and/or reimburse expenses to the extent necessary to cap total annual fund operating expenses after fee waivers at 1.16% for Class A, 1.91% for Class C, 0.70% for Class R6, 0.96% for Administrator Class, and 0.75% for Institutional Class. Brokerage commissions, stamp duty fees, interest, taxes, acquired fund fees and expenses (if any), and extraordinary expenses are excluded from the expense caps. Prior to or after the commitment expiration date, the caps may be increased or the commitment to maintain the caps may be terminated only with the approval of the Board of Trustees. Without these caps, the Fund’s returns would have been lower. The expense ratio paid by an investor is the net expense ratio (the total annual fund operating expenses after fee waivers) as stated in the prospectuses. |
| 3 | Historical performance shown for the Class R6 shares prior to their inception reflects the performance of the Institutional Class shares, and includes the higher expenses applicable to the Institutional Class shares. If these expenses had not been included, returns for the Class R6 shares would be higher. |
| 4 | The Russell 3000® Growth Index measures the performance of those Russell 3000® Index companies with higher price/book ratios and higher forecasted growth values. You cannot invest directly in an index. |
Stock values fluctuate in response to the activities of individual companies and general market and economic conditions. Certain investment strategies tend to increase the total risk of an investment (relative to the broader market). This fund is exposed to foreign investment risk and smaller-company securities risk. Consult the Fund’s prospectus for additional information on these and other risks.
| ‡ | CFA® and Chartered Financial Analyst® are trademarks owned by CFA Institute. |
6 | Allspring Growth Fund
Performance highlights (unaudited)
| Ten largest holdings (%) as of January 31, 20231 |
| Microsoft Corporation | 9.29 |
| Apple Incorporated | 6.60 |
| Alphabet Incorporated Class A | 5.68 |
| Amazon.com Incorporated | 5.62 |
| MasterCard Incorporated Class A | 4.03 |
| Tradeweb Markets Incorporated Class A | 2.94 |
| Copart Incorporated | 2.58 |
| Boston Scientific Corporation | 2.32 |
| Monolithic Power Systems Incorporated | 2.15 |
| Microchip Technology Incorporated | 1.90 |
| 1 | Figures represent the percentage of the Fund's net assets. Holdings are subject to change and may have changed since the date specified. |
| Sector allocation as of January 31, 20231 |
| 1 | Figures represent the percentage of the Fund's long-term investments. Allocations are subject to change and may have changed since the date specified. |
Allspring Growth Fund | 7
Fund expenses (unaudited)
As a shareholder of the Fund, you incur two types of costs: (1) transaction costs, including sales charges (loads) on purchase payments and contingent deferred sales charges (if any) on redemptions and (2) ongoing costs, including management fees, distribution (12b-1) and/or shareholder servicing fees, and other Fund expenses. This example is intended to help you understand your ongoing costs (in dollars) of investing in the Fund and to compare these costs with the ongoing costs of investing in other mutual funds.
The example is based on an investment of $1,000 invested at the beginning of the six-month period and held for the entire period from August 1, 2022 to January 31, 2023.
Actual expenses
The “Actual” line of the table below provides information about actual account values and actual expenses. You may use the information in this line, together with the amount you invested, to estimate the expenses that you paid over the period. Simply divide your account value by $1,000 (for example, an $8,600 account value divided by $1,000 = 8.6), then multiply the result by the number in the “Actual” line under the heading entitled “Expenses paid during period” for your applicable class of shares to estimate the expenses you paid on your account during this period.
Hypothetical example for comparison purposes
The “Hypothetical” line of the table below provides information about hypothetical account values and hypothetical expenses based on the Fund’s actual expense ratio and an assumed rate of return of 5% per year before expenses, which is not the Fund’s actual return. The hypothetical account values and expenses may not be used to estimate the actual ending account balance or expenses you paid for the period. You may use this information to compare the ongoing costs of investing in the Fund and other funds. To do so, compare this 5% hypothetical example with the 5% hypothetical examples that appear in the shareholder reports of the other funds.
Please note that the expenses shown in the table are meant to highlight your ongoing costs only and do not reflect any transactional costs, such as sales charges (loads) and contingent deferred sales charges. Therefore, the “Hypothetical” line of the table is useful in comparing ongoing costs only, and will not help you determine the relative total costs of owning different funds. In addition, if these transactional costs were included, your costs would have been higher.
| | Beginning
account value
8-1-2022 | Ending
account value
1-31-2023 | Expenses
paid during
the period1 | Annualized net
expense ratio |
| Class A | | | | |
| Actual | $1,000.00 | $ 944.62 | $5.69 | 1.16% |
| Hypothetical (5% return before expenses) | $1,000.00 | $1,019.36 | $5.90 | 1.16% |
| Class C | | | | |
| Actual | $1,000.00 | $ 940.70 | $9.34 | 1.91% |
| Hypothetical (5% return before expenses) | $1,000.00 | $1,015.58 | $9.70 | 1.91% |
| Class R6 | | | | |
| Actual | $1,000.00 | $ 947.10 | $3.44 | 0.70% |
| Hypothetical (5% return before expenses) | $1,000.00 | $1,021.68 | $3.57 | 0.70% |
| Administrator Class | | | | |
| Actual | $1,000.00 | $ 945.75 | $4.71 | 0.96% |
| Hypothetical (5% return before expenses) | $1,000.00 | $1,020.37 | $4.89 | 0.96% |
| Institutional Class | | | | |
| Actual | $1,000.00 | $ 947.01 | $3.68 | 0.75% |
| Hypothetical (5% return before expenses) | $1,000.00 | $1,021.42 | $3.82 | 0.75% |
1 Expenses paid is equal to the annualized net expense ratio of each class multiplied by the average account value over the period, multiplied by 184 divided by 365 (to reflect the one-half-year period).
8 | Allspring Growth Fund
Portfolio of investments—January 31, 2023 (unaudited)
| | | | | Shares | Value |
| Common stocks: 98.42% | | | | | |
| Communication services: 7.64% | | | | | |
| Entertainment: 0.36% | | | | | |
| Live Nation Entertainment Incorporated † | | | | 138,794 | $ 11,171,529 |
| Interactive media & services: 7.28% | | | | | |
| Alphabet Incorporated Class A † | | | | 1,766,620 | 174,612,721 |
| Alphabet Incorporated Class C † | | | | 256,224 | 25,589,091 |
| ZoomInfo Technologies Incorporated † | | | | 826,329 | 23,327,268 |
| | | | | | 223,529,080 |
| Consumer discretionary: 15.77% | | | | | |
| Hotels, restaurants & leisure: 3.29% | | | | | |
| Airbnb Incorporated Class A † | | | | 174,368 | 19,374,028 |
| Chipotle Mexican Grill Incorporated † | | | | 21,138 | 34,801,180 |
| Papa John's International Incorporated | | | | 205,732 | 18,452,103 |
| Planet Fitness Incorporated Class A † | | | | 335,626 | 28,410,741 |
| | | | | | 101,038,052 |
| Internet & direct marketing retail: 5.67% | | | | | |
| Amazon.com Incorporated † | | | | 1,673,336 | 172,571,142 |
| MercadoLibre Incorporated † | | | | 1,294 | 1,529,107 |
| | | | | | 174,100,249 |
| Specialty retail: 5.85% | | | | | |
| AutoZone Incorporated † | | | | 2,393 | 5,836,168 |
| Boot Barn Holdings Incorporated † | | | | 36,972 | 3,086,792 |
| Five Below Incorporated † | | | | 186,204 | 36,706,395 |
| Floor & Decor Holdings Incorporated Class A † | | | | 351,530 | 31,908,378 |
| Leslie's Incorporated † | | | | 2,566,610 | 39,756,789 |
| O'Reilly Automotive Incorporated † | | | | 11,169 | 8,849,757 |
| Petco Health & Wellness Company † | | | | 1,056,774 | 12,353,688 |
| Tractor Supply Company | | | | 13,492 | 3,076,041 |
| Ulta Beauty Incorporated † | | | | 74,596 | 38,339,360 |
| | | | | | 179,913,368 |
| Textiles, apparel & luxury goods: 0.96% | | | | | |
| lululemon athletica Incorporated † | | | | 49,506 | 15,192,401 |
| On Holding AG Class A † | | | | 619,236 | 14,366,275 |
| | | | | | 29,558,676 |
| Consumer staples: 1.54% | | | | | |
| Beverages: 0.65% | | | | | |
| Constellation Brands Incorporated Class A | | | | 85,972 | 19,904,237 |
| Food & staples retailing: 0.65% | | | | | |
| Sysco Corporation | | | | 258,222 | 20,001,876 |
| Personal products: 0.24% | | | | | |
| The Estee Lauder Companies Incorporated Class A | | | | 26,869 | 7,444,863 |
The accompanying notes are an integral part of these financial statements.
Allspring Growth Fund | 9
Portfolio of investments—January 31, 2023 (unaudited)
| | | | | Shares | Value |
| Financials: 10.59% | | | | | |
| Capital markets: 10.28% | | | | | |
| BlackRock Incorporated | | | | 19,952 | $ 15,147,758 |
| CME Group Incorporated | | | | 260,171 | 45,961,809 |
| Interactive Brokers Group Incorporated Class A | | | | 287,836 | 23,009,610 |
| Intercontinental Exchange Incorporated | | | | 146,816 | 15,790,061 |
| LPL Financial Holdings Incorporated | | | | 240,031 | 56,916,151 |
| MarketAxess Holdings Incorporated | | | | 86,409 | 31,439,915 |
| Raymond James Financial Incorporated | | | | 58,604 | 6,608,773 |
| The Charles Schwab Corporation | | | | 396,291 | 30,680,849 |
| Tradeweb Markets Incorporated Class A | | | | 1,212,401 | 90,372,371 |
| | | | | | 315,927,297 |
| Insurance: 0.31% | | | | | |
| Progressive Corporation | | | | 70,484 | 9,610,493 |
| Health care: 14.14% | | | | | |
| Biotechnology: 2.83% | | | | | |
| Argenx SE † | | | | 11,664 | 4,458,564 |
| BioMarin Pharmaceutical Incorporated † | | | | 151,247 | 17,446,341 |
| Horizon Therapeutics plc † | | | | 278,442 | 30,550,656 |
| Sarepta Therapeutics Incorporated † | | | | 20,067 | 2,507,773 |
| Seagen Incorporated † | | | | 80,673 | 11,252,270 |
| Vertex Pharmaceuticals Incorporated † | | | | 64,075 | 20,702,633 |
| | | | | | 86,918,237 |
| Health care equipment & supplies: 5.64% | | | | | |
| Boston Scientific Corporation † | | | | 1,541,041 | 71,273,146 |
| Hologic Incorporated † | | | | 313,665 | 25,522,921 |
| Insulet Corporation † | | | | 83,443 | 23,974,843 |
| Intuitive Surgical Incorporated † | | | | 100,264 | 24,633,862 |
| iRhythm Technologies Incorporated † | | | | 60,976 | 5,993,941 |
| Penumbra Incorporated † | | | | 25,376 | 6,354,404 |
| Stryker Corporation | | | | 61,035 | 15,491,293 |
| | | | | | 173,244,410 |
| Health care providers & services: 2.05% | | | | | |
| Cardinal Health Incorporated | | | | 116,144 | 8,972,124 |
| UnitedHealth Group Incorporated | | | | 108,556 | 54,190,070 |
| | | | | | 63,162,194 |
| Health care technology: 0.78% | | | | | |
| Veeva Systems Incorporated Class A † | | | | 140,574 | 23,974,896 |
| Life sciences tools & services: 1.46% | | | | | |
| Agilent Technologies Incorporated | | | | 31,902 | 4,851,656 |
| Bio-Techne Corporation | | | | 105,415 | 8,397,359 |
| Repligen Corporation † | | | | 38,119 | 7,063,451 |
| Thermo Fisher Scientific Incorporated | | | | 12,581 | 7,175,322 |
| West Pharmaceutical Services Incorporated | | | | 65,218 | 17,321,901 |
| | | | | | 44,809,689 |
| Pharmaceuticals: 1.38% | | | | | |
| Revance Therapeutics Incorporated † | | | | 549,622 | 19,060,891 |
The accompanying notes are an integral part of these financial statements.
10 | Allspring Growth Fund
Portfolio of investments—January 31, 2023 (unaudited)
| | | | | Shares | Value |
| Pharmaceuticals (continued) | | | | | |
| Royalty Pharma plc Class A | | | | 300,548 | $ 11,778,476 |
| Zoetis Incorporated | | | | 70,046 | 11,591,913 |
| | | | | | 42,431,280 |
| Industrials: 6.62% | | | | | |
| Aerospace & defense: 0.17% | | | | | |
| TransDigm Group Incorporated | | | | 7,098 | 5,094,590 |
| Air freight & logistics: 0.54% | | | | | |
| United Parcel Service Incorporated Class B | | | | 90,316 | 16,729,233 |
| Commercial services & supplies: 3.21% | | | | | |
| Casella Waste Systems Incorporated Class A † | | | | 243,827 | 19,535,419 |
| Copart Incorporated † | | | | 1,188,451 | 79,162,721 |
| | | | | | 98,698,140 |
| Electrical equipment: 0.76% | | | | | |
| Shoals Technologies Group Class A † | | | | 831,846 | 23,200,185 |
| Machinery: 0.62% | | | | | |
| Fortive Corporation | | | | 279,142 | 18,990,030 |
| Road & rail: 1.32% | | | | | |
| J.B. Hunt Transport Services Incorporated | | | | 92,157 | 17,422,281 |
| Union Pacific Corporation | | | | 113,866 | 23,250,299 |
| | | | | | 40,672,580 |
| Information technology: 39.40% | | | | | |
| Electronic equipment, instruments & components: 0.40% | | | | | |
| Zebra Technologies Corporation Class A † | | | | 38,291 | 12,106,848 |
| IT services: 9.32% | | | | | |
| DigitalOcean Holdings Incorporated † | | | | 475,909 | 13,967,929 |
| Flywire Corporation † | | | | 796,910 | 21,492,663 |
| MasterCard Incorporated Class A | | | | 333,939 | 123,757,793 |
| MongoDB Incorporated † | | | | 135,134 | 28,947,054 |
| PayPal Holdings Incorporated † | | | | 394,990 | 32,187,735 |
| Thoughtworks Holding Incorporated † | | | | 1,777,647 | 19,198,588 |
| Visa Incorporated Class A | | | | 203,108 | 46,757,493 |
| | | | | | 286,309,255 |
| Semiconductors & semiconductor equipment: 7.38% | | | | | |
| Advanced Micro Devices Incorporated † | | | | 63,923 | 4,803,813 |
| Allegro MicroSystems Incorporated † | | | | 1,467,066 | 55,997,909 |
| Microchip Technology Incorporated | | | | 753,558 | 58,491,172 |
| Monolithic Power Systems Incorporated | | | | 154,830 | 66,044,285 |
| NVIDIA Corporation | | | | 148,680 | 29,047,612 |
| Qualcomm Incorporated | | | | 93,936 | 12,513,215 |
| | | | | | 226,898,006 |
| Software: 15.70% | | | | | |
| Black Knight Incorporated † | | | | 378,943 | 22,960,156 |
| Crowdstrike Holdings Incorporated Class A † | | | | 89,631 | 9,491,923 |
| Dynatrace Incorporated † | | | | 464,421 | 17,847,699 |
The accompanying notes are an integral part of these financial statements.
Allspring Growth Fund | 11
Portfolio of investments—January 31, 2023 (unaudited)
| | | | | Shares | Value |
| Software (continued) | | | | | |
| Fair Isaac Corporation † | | | | 40,634 | $ 27,060,212 |
| Five9 Incorporated † | | | | 102,311 | 8,060,061 |
| Intuit Incorporated | | | | 79,887 | 33,765,838 |
| Jamf Holding Corporation † | | | | 152,605 | 3,032,261 |
| Microsoft Corporation | | | | 1,151,572 | 285,371,057 |
| Palo Alto Networks Incorporated † | | | | 193,962 | 30,770,132 |
| Paycom Software Incorporated † | | | | 27,708 | 8,975,730 |
| Paycor HCM Incorporated † | | | | 691,476 | 17,362,962 |
| ServiceNow Incorporated † | | | | 39,249 | 17,863,397 |
| | | | | | 482,561,428 |
| Technology hardware, storage & peripherals: 6.60% | | | | | |
| Apple Incorporated | | | | 1,405,726 | 202,832,205 |
| Materials: 1.55% | | | | | |
| Chemicals: 1.55% | | | | | |
| Linde plc | | | | 143,854 | 47,607,043 |
| Real estate: 1.17% | | | | | |
| Equity REITs: 0.67% | | | | | |
| Equinix Incorporated | | | | 6,549 | 4,834,013 |
| SBA Communications Corporation | | | | 52,695 | 15,678,343 |
| | | | | | 20,512,356 |
| Real estate management & development: 0.50% | | | | | |
| CBRE Group Incorporated Class A † | | | | 179,310 | 15,332,797 |
| Total Common stocks (Cost $1,626,907,133) | | | | | 3,024,285,122 |
| | | Yield | | | |
| Short-term investments: 1.09% | | | | | |
| Investment companies: 1.09% | | | | | |
| Allspring Government Money Market Fund Select Class ♠∞ | | 4.16% | | 33,712,743 | 33,712,743 |
| Total Short-term investments (Cost $33,712,743) | | | | | 33,712,743 |
| Total investments in securities (Cost $1,660,619,876) | 99.51% | | | | 3,057,997,865 |
| Other assets and liabilities, net | 0.49 | | | | 14,920,558 |
| Total net assets | 100.00% | | | | $3,072,918,423 |
| † | Non-income-earning security |
| ♠ | The issuer of the security is an affiliated person of the Fund as defined in the Investment Company Act of 1940. |
| ∞ | The rate represents the 7-day annualized yield at period end. |
| Abbreviations: |
| REIT | Real estate investment trust |
The accompanying notes are an integral part of these financial statements.
12 | Allspring Growth Fund
Portfolio of investments—January 31, 2023 (unaudited)
Investments in affiliates
An affiliated investment is an investment in which the Fund owns at least 5% of the outstanding voting shares of the issuer or as a result of other relationships, such as the Fund and the issuer having the same investment manager. Transactions with issuers that were affiliates of the Fund at the end of the period were as follows:
| | Value,
beginning of
period | Purchases | Sales
proceeds | Net
realized
gains
(losses) | | Net
change in
unrealized
gains
(losses) | | Value,
end of
period | Shares,
end
of period | Income
from
affiliated
securities |
| Short-term investments | | | | | | | | | |
| Allspring Government Money Market Fund Select Class | $147,500,432 | $392,372,916 | $(506,160,605) | $ 0 | | $0 | | $ 33,712,743 | 33,712,743 | $ 1,244,852 |
Investments in affiliates
no longer held at end of period | | | | | | | | | | |
| Securities Lending Cash Investments LLC | 61,735,900 | 83,253,237 | (144,989,076) | (61) | | 0 | | 0 | 0 | 300,789 # |
| | | | | $ (61) | | $0 | | $33,712,743 | | $1,545,641 |
| # | Amount shown represents income before fees and rebates. |
The accompanying notes are an integral part of these financial statements.
Allspring Growth Fund | 13
Statement of assets and liabilities—January 31, 2023 (unaudited)
| | |
| Assets | |
Investments in unaffiliated securities, at value (cost $1,626,907,133)
| $ 3,024,285,122 |
Investments in affiliated securities, at value (cost $33,712,743)
| 33,712,743 |
Cash
| 915,244 |
Receivable for investments sold
| 38,638,371 |
Receivable for Fund shares sold
| 985,756 |
Receivable for dividends
| 356,719 |
Prepaid expenses and other assets
| 207,270 |
Total assets
| 3,099,101,225 |
| Liabilities | |
Payable for investments purchased
| 21,374,139 |
Payable for Fund shares redeemed
| 1,804,973 |
Management fee payable
| 1,615,872 |
Administration fees payable
| 403,958 |
Distribution fee payable
| 8,749 |
Trustees’ fees and expenses payable
| 5,336 |
Accrued expenses and other liabilities
| 969,775 |
Total liabilities
| 26,182,802 |
Total net assets
| $3,072,918,423 |
| Net assets consist of | |
Paid-in capital
| $ 1,624,564,782 |
Total distributable earnings
| 1,448,353,641 |
Total net assets
| $3,072,918,423 |
| Computation of net asset value and offering price per share | |
Net assets – Class A
| $ 1,650,609,219 |
Shares outstanding – Class A1
| 69,934,308 |
Net asset value per share – Class A
| $23.60 |
Maximum offering price per share – Class A2
| $25.04 |
Net assets – Class C
| $ 14,458,776 |
Shares outstanding – Class C1
| 1,170,343 |
Net asset value per share – Class C
| $12.35 |
Net assets – Class R6
| $ 356,200,169 |
Shares outstanding – Class R61
| 9,865,582 |
Net asset value per share – Class R6
| $36.11 |
Net assets – Administrator Class
| $ 200,497,632 |
Shares outstanding – Administrator Class1
| 6,516,370 |
Net asset value per share – Administrator Class
| $30.77 |
Net assets – Institutional Class
| $ 851,152,627 |
Shares outstanding – Institutional Class1
| 23,738,323 |
Net asset value per share – Institutional Class
| $35.86 |
| 1 | The Fund has an unlimited number of authorized shares. |
| 2 | Maximum offering price is computed as 100/94.25 of net asset value. On investments of $50,000 or more, the offering price is reduced. |
The accompanying notes are an integral part of these financial statements.
14 | Allspring Growth Fund
Statement of operations—six months ended January 31, 2023 (unaudited)
| | |
| Investment income | |
Dividends
| $ 9,716,935 |
Income from affiliated securities
| 1,287,230 |
Total investment income
| 11,004,165 |
| Expenses | |
Management fee
| 11,467,715 |
| Administration fees | |
Class A
| 1,767,478 |
Class C
| 16,963 |
Class R6
| 53,291 |
Administrator Class
| 167,221 |
Institutional Class
| 584,338 |
| Shareholder servicing fees | |
Class A
| 2,100,635 |
Class C
| 20,123 |
Administrator Class
| 319,515 |
| Distribution fee | |
Class C
| 60,338 |
Custody and accounting fees
| 124,771 |
Professional fees
| 27,750 |
Registration fees
| 18,464 |
Shareholder report expenses
| 62,978 |
Trustees’ fees and expenses
| 11,025 |
Other fees and expenses
| 60,392 |
Total expenses
| 16,862,997 |
| Less: Fee waivers and/or expense reimbursements | |
Fund-level
| (518,598) |
Class R6
| (53,291) |
Administrator Class
| (153,972) |
Institutional Class
| (370,160) |
Net expenses
| 15,766,976 |
Net investment loss
| (4,762,811) |
| Realized and unrealized gains (losses) on investments | |
| Net realized gains (losses) on | |
Unaffiliated securities
| 80,026,584 |
Affiliated securities
| (61) |
Net realized gains on investments
| 80,026,523 |
Net change in unrealized gains (losses) on investments
| (292,464,163) |
Net realized and unrealized gains (losses) on investments
| (212,437,640) |
Net decrease in net assets resulting from operations
| $(217,200,451) |
The accompanying notes are an integral part of these financial statements.
Allspring Growth Fund | 15
Statement of changes in net assets
| | | | | |
| | Six months ended
January 31, 2023
(unaudited) | Year ended
July 31, 2022 |
| Operations | | | | |
Net investment loss
| | $ (4,762,811) | | $ (34,278,023) |
Net realized gains on investments
| | 80,026,523 | | 452,045,114 |
Net change in unrealized gains (losses) on investments
| | (292,464,163) | | (2,133,081,244) |
Net decrease in net assets resulting from operations
| | (217,200,451) | | (1,715,314,153) |
| Distributions to shareholders from | | | | |
| Net investment income and net realized gains | | | | |
Class A
| | (108,869,642) | | (569,285,399) |
Class C
| | (1,767,487) | | (10,976,765) |
Class R6
| | (15,329,845) | | (69,584,122) |
Administrator Class
| | (12,943,905) | | (96,628,240) |
Institutional Class
| | (38,192,678) | | (256,416,897) |
Total distributions to shareholders
| | (177,103,557) | | (1,002,891,423) |
| Capital share transactions | Shares | | Shares | |
| Proceeds from shares sold | | | | |
Class A
| 622,438 | 14,836,878 | 1,587,549 | 56,321,377 |
Class C
| 32,427 | 433,189 | 165,557 | 3,406,222 |
Class R6
| 772,868 | 27,620,681 | 2,817,456 | 130,744,052 |
Administrator Class
| 340,160 | 10,526,269 | 1,063,551 | 44,787,131 |
Institutional Class
| 1,672,446 | 59,882,529 | 3,690,262 | 181,234,986 |
| | | 113,299,546 | | 416,493,768 |
| Reinvestment of distributions | | | | |
Class A
| 4,695,625 | 104,665,476 | 14,811,926 | 547,893,130 |
Class C
| 144,818 | 1,691,480 | 485,765 | 10,021,324 |
Class R6
| 416,402 | 14,190,969 | 1,149,664 | 63,197,038 |
Administrator Class
| 439,148 | 12,757,242 | 2,018,217 | 95,582,763 |
Institutional Class
| 1,098,744 | 37,181,487 | 4,557,460 | 249,019,631 |
| | | 170,486,654 | | 965,713,886 |
| Payment for shares redeemed | | | | |
Class A
| (5,768,566) | (136,257,998) | (11,515,400) | (392,523,025) |
Class C
| (292,093) | (3,815,261) | (714,991) | (14,273,738) |
Class R6
| (1,550,220) | (57,061,562) | (1,668,671) | (82,352,828) |
Administrator Class
| (3,601,947) | (107,543,938) | (4,956,152) | (205,413,567) |
Institutional Class
| (4,914,285) | (173,240,965) | (12,429,230) | (564,164,472) |
| | | (477,919,724) | | (1,258,727,630) |
Net increase (decrease) in net assets resulting from capital share transactions
| | (194,133,524) | | 123,480,024 |
Total decrease in net assets
| | (588,437,532) | | (2,594,725,552) |
| Net assets | | | | |
Beginning of period
| | 3,661,355,955 | | 6,256,081,507 |
End of period
| | $3,072,918,423 | | $ 3,661,355,955 |
The accompanying notes are an integral part of these financial statements.
16 | Allspring Growth Fund
Financial highlights
(For a share outstanding throughout each period)
| | | Year ended July 31 |
| Class A | Six months ended
January 31, 2023
(unaudited) | 2022 | 2021 | 2020 | 2019 | 2018 |
Net asset value, beginning of period
| $26.80 | $47.16 | $39.86 | $35.56 | $38.67 | $40.38 |
Net investment loss
| (0.06) | (0.30) 1 | (0.32) | (0.19) | (0.13) | (0.12) |
Payment from affiliate
| 0.00 | 0.00 | 0.00 2 | 0.00 | 0.00 | 0.00 |
Net realized and unrealized gains (losses) on investments
| (1.52) | (11.07) | 13.52 | 8.77 | 3.73 | 9.49 |
Total from investment operations
| (1.58) | (11.37) | 13.20 | 8.58 | 3.60 | 9.37 |
| Distributions to shareholders from | | | | | | |
Net realized gains
| (1.62) | (8.99) | (5.90) | (4.28) | (6.71) | (11.08) |
Net asset value, end of period
| $23.60 | $26.80 | $47.16 | $39.86 | $35.56 | $38.67 |
Total return3
| (5.54)% | (29.35)% | 35.61% 4 | 27.08% | 13.55% | 27.66% |
| Ratios to average net assets (annualized) | | | | | | |
Gross expenses
| 1.19% | 1.16% | 1.16% | 1.17% | 1.18% | 1.18% |
Net expenses
| 1.16% | 1.13% | 1.14% | 1.14% | 1.16% | 1.16% |
Net investment loss
| (0.48)% | (0.85)% | (0.83)% | (0.59)% | (0.45)% | (0.45)% |
| Supplemental data | | | | | | |
Portfolio turnover rate
| 31% | 43% | 36% | 37% | 39% | 37% |
Net assets, end of period (000s omitted)
| $1,650,609 | $1,885,963 | $3,088,763 | $2,443,132 | $2,116,542 | $2,142,855 |
| 1 | Calculated based upon average shares outstanding |
| 2 | Amount is less than $0.005. |
| 3 | Total return calculations do not include any sales charges. Returns for periods of less than one year are not annualized. |
| 4 | During the year ended July 31, 2021, the Fund received a payment from an affiliate which had a 0.01% impact on the total return. |
The accompanying notes are an integral part of these financial statements.
Allspring Growth Fund | 17
Financial highlights
(For a share outstanding throughout each period)
| | | Year ended July 31 |
| Class C | Six months ended
January 31, 2023
(unaudited) | 2022 | 2021 | 2020 | 2019 | 2018 |
Net asset value, beginning of period
| $14.95 | $30.47 | $27.32 | $25.87 | $30.33 | $34.05 |
Net investment loss
| (0.08) 1 | (0.34) 1 | (0.45) 1 | (0.32) 1 | (0.31) 1 | (0.33) |
Payment from affiliate
| 0.00 | 0.00 | 1.32 | 0.00 | 0.00 | 0.00 |
Net realized and unrealized gains (losses) on investments
| (0.90) | (6.19) | 8.18 | 6.05 | 2.56 | 7.69 |
Total from investment operations
| (0.98) | (6.53) | 9.05 | 5.73 | 2.25 | 7.36 |
| Distributions to shareholders from | | | | | | |
Net realized gains
| (1.62) | (8.99) | (5.90) | (4.28) | (6.71) | (11.08) |
Net asset value, end of period
| $12.35 | $14.95 | $30.47 | $27.32 | $25.87 | $30.33 |
Total return2
| (5.93)% | (29.54)% 3 | 36.64% 4 | 26.11% | 12.68% | 26.73% |
| Ratios to average net assets (annualized) | | | | | | |
Gross expenses
| 1.94% | 1.89% | 1.91% | 1.92% | 1.93% | 1.93% |
Net expenses
| 1.91% | 1.89% | 1.91% | 1.91% | 1.91% | 1.91% |
Net investment loss
| (1.22)% | (1.61)% | (1.57)% | (1.35)% | (1.19)% | (1.19)% |
| Supplemental data | | | | | | |
Portfolio turnover rate
| 31% | 43% | 36% | 37% | 39% | 37% |
Net assets, end of period (000s omitted)
| $14,459 | $19,208 | $41,094 | $114,123 | $156,056 | $185,346 |
| 1 | Calculated based upon average shares outstanding |
| 2 | Total return calculations do not include any sales charges. Returns for periods of less than one year are not annualized. |
| 3 | During the year ended July 31, 2022, the Fund received payments from a service provider which had a 0.14% impact on the total return. |
| 4 | During the year ended July 31, 2021, the Fund received a payment from an affiliate which had a 5.92% impact on the total return. |
The accompanying notes are an integral part of these financial statements.
18 | Allspring Growth Fund
Financial highlights
(For a share outstanding throughout each period)
| | | Year ended July 31 |
| Class R6 | Six months ended
January 31, 2023
(unaudited) | 2022 | 2021 | 2020 | 2019 | 2018 |
Net asset value, beginning of period
| $39.94 | $65.50 | $53.17 | $45.84 | $47.53 | $47.13 |
Net investment income (loss)
| (0.00) 1,2 | (0.21) 1 | (0.23) | (0.07) | 0.00 1,3 | (0.01) 1 |
Net realized and unrealized gains (losses) on investments
| (2.21) | (16.36) | 18.46 | 11.68 | 5.02 | 11.49 |
Total from investment operations
| (2.21) | (16.57) | 18.23 | 11.61 | 5.02 | 11.48 |
| Distributions to shareholders from | | | | | | |
Net realized gains
| (1.62) | (8.99) | (5.90) | (4.28) | (6.71) | (11.08) |
Net asset value, end of period
| $36.11 | $39.94 | $65.50 | $53.17 | $45.84 | $47.53 |
Total return4
| (5.29)% | (29.05)% | 36.19% | 27.65% | 14.06% | 28.26% |
| Ratios to average net assets (annualized) | | | | | | |
Gross expenses
| 0.76% | 0.73% | 0.73% | 0.74% | 0.75% | 0.75% |
Net expenses
| 0.70% | 0.70% | 0.70% | 0.70% | 0.70% | 0.70% |
Net investment income (loss)
| (0.02)% | (0.41)% | (0.40)% | (0.15)% | 0.00% | (0.02)% |
| Supplemental data | | | | | | |
Portfolio turnover rate
| 31% | 43% | 36% | 37% | 39% | 37% |
Net assets, end of period (000s omitted)
| $356,200 | $408,403 | $519,293 | $391,705 | $337,260 | $242,838 |
| 1 | Calculated based upon average shares outstanding |
| 2 | Amount is more than $(0.005) |
| 3 | Amount is less than $0.005. |
| 4 | Returns for periods of less than one year are not annualized. |
The accompanying notes are an integral part of these financial statements.
Allspring Growth Fund | 19
Financial highlights
(For a share outstanding throughout each period)
| | | Year ended July 31 |
| Administrator Class | Six months ended
January 31, 2023
(unaudited) | 2022 | 2021 | 2020 | 2019 | 2018 |
Net asset value, beginning of period
| $34.34 | $57.75 | $47.60 | $41.58 | $43.89 | $44.40 |
Net investment loss
| (0.04) 1 | (0.31) 1 | (0.29) | (0.16) 1 | (0.10) 1 | (0.11) 1 |
Net realized and unrealized gains (losses) on investments
| (1.91) | (14.11) | 16.34 | 10.46 | 4.50 | 10.68 |
Total from investment operations
| (1.95) | (14.42) | 16.05 | 10.30 | 4.40 | 10.57 |
| Distributions to shareholders from | | | | | | |
Net realized gains
| (1.62) | (8.99) | (5.90) | (4.28) | (6.71) | (11.08) |
Net asset value, end of period
| $30.77 | $34.34 | $57.75 | $47.60 | $41.58 | $43.89 |
Total return2
| (5.43)% | (29.22)% | 35.82% | 27.31% | 13.78% | 27.90% |
| Ratios to average net assets (annualized) | | | | | | |
Gross expenses
| 1.11% | 1.08% | 1.08% | 1.09% | 1.10% | 1.10% |
Net expenses
| 0.96% | 0.96% | 0.96% | 0.96% | 0.96% | 0.96% |
Net investment loss
| (0.26)% | (0.68)% | (0.65)% | (0.40)% | (0.25)% | (0.24)% |
| Supplemental data | | | | | | |
Portfolio turnover rate
| 31% | 43% | 36% | 37% | 39% | 37% |
Net assets, end of period (000s omitted)
| $200,498 | $320,744 | $647,618 | $559,109 | $561,900 | $564,391 |
| 1 | Calculated based upon average shares outstanding |
| 2 | Returns for periods of less than one year are not annualized. |
The accompanying notes are an integral part of these financial statements.
20 | Allspring Growth Fund
Financial highlights
(For a share outstanding throughout each period)
| | | Year ended July 31 |
| Institutional Class | Six months ended
January 31, 2023
(unaudited) | 2022 | 2021 | 2020 | 2019 | 2018 |
Net asset value, beginning of period
| $39.68 | $65.17 | $52.96 | $45.70 | $47.43 | $47.07 |
Net investment loss
| (0.01) 1 | (0.24) 1 | (0.26) 1 | (0.09) 1 | (0.01) 1 | (0.02) 1 |
Net realized and unrealized gains (losses) on investments
| (2.19) | (16.26) | 18.37 | 11.63 | 4.99 | 11.46 |
Total from investment operations
| (2.20) | (16.50) | 18.11 | 11.54 | 4.98 | 11.44 |
| Distributions to shareholders from | | | | | | |
Net realized gains
| (1.62) | (8.99) | (5.90) | (4.28) | (6.71) | (11.08) |
Net asset value, end of period
| $35.86 | $39.68 | $65.17 | $52.96 | $45.70 | $47.43 |
Total return2
| (5.30)% | (29.09)% | 36.10% | 27.58% | 14.00% | 28.21% |
| Ratios to average net assets (annualized) | | | | | | |
Gross expenses
| 0.86% | 0.83% | 0.83% | 0.84% | 0.85% | 0.85% |
Net expenses
| 0.75% | 0.75% | 0.75% | 0.75% | 0.75% | 0.75% |
Net investment loss
| (0.07)% | (0.47)% | (0.44)% | (0.20)% | (0.03)% | (0.03)% |
| Supplemental data | | | | | | |
Portfolio turnover rate
| 31% | 43% | 36% | 37% | 39% | 37% |
Net assets, end of period (000s omitted)
| $851,153 | $1,027,038 | $1,959,313 | $1,607,803 | $1,503,753 | $1,614,575 |
| 1 | Calculated based upon average shares outstanding |
| 2 | Returns for periods of less than one year are not annualized. |
The accompanying notes are an integral part of these financial statements.
Allspring Growth Fund | 21
Notes to financial statements (unaudited)
1. ORGANIZATION
Allspring Funds Trust (the "Trust"), a Delaware statutory trust organized on March 10, 1999, is an open-end management investment company registered under the Investment Company Act of 1940, as amended (the "1940 Act"). As an investment company, the Trust follows the accounting and reporting guidance in Financial Accounting Standards Board ("FASB") Accounting Standards Codification Topic 946, Financial Services – Investment Companies. These financial statements report on the Allspring Growth Fund (the "Fund") which is a diversified series of the Trust.
2. SIGNIFICANT ACCOUNTING POLICIES
The following significant accounting policies, which are consistently followed in the preparation of the financial statements of the Fund, are in conformity with U.S. generally accepted accounting principles which require management to make estimates and assumptions that affect the reported amounts of assets and liabilities, disclosure of contingent assets and liabilities at the date of the financial statements, and the reported amounts of income and expenses during the reporting period. Actual results could differ from those estimates.
Securities valuation
All investments are valued each business day as of the close of regular trading on the New York Stock Exchange (generally 4 p.m. Eastern Time), although the Fund may deviate from this calculation time under unusual or unexpected circumstances.
Equity securities that are listed on a foreign or domestic exchange or market are valued at the official closing price or, if none, the last sales price.
Investments in registered open-end investment companies (other than those listed on a foreign or domestic exchange or market) are valued at net asset value. Interests in non-registered investment companies that are redeemable at net asset value are fair valued normally at net asset value.
Investments which are not valued using the methods discussed above are valued at their fair value, as determined in good faith by Allspring Funds Management, LLC ("Allspring Funds Management"), which was named the valuation designee by the Board of Trustees. As the valuation designee, Allspring Funds Management is responsible for day-to-day valuation activities for the Allspring Funds. In connection with these responsibilities, Allspring Funds Management has established a Valuation Committee and has delegated to it the authority to take any actions regarding the valuation of portfolio securities that the Valuation Committee deems necessary or appropriate, including determining the fair value of portfolio securities. On a quarterly basis, the Board of Trustees receives reports of valuation actions taken by the Valuation Committee. On at least an annual basis, the Board of Trustees receives an assessment of the adequacy and effectiveness of Allspring Funds Management's process for determining the fair value of the portfolio of investments.
Securities lending
The Fund may lend its securities from time to time in order to earn additional income in the form of fees or interest on securities received as collateral or the investment of any cash received as collateral. When securities are on loan, the Fund receives interest or dividends on those securities. Cash collateral received in connection with its securities lending transactions is invested in Securities Lending Cash Investments, LLC (the "Securities Lending Fund"), an affiliated non-registered investment company. Investments in Securities Lending Fund are valued at the evaluated bid price provided by an independent pricing service. Income earned from investment in the Securities Lending Fund (net of fees and rebates), if any, is included in income from affiliated securities on the Statement of Operations.
In a securities lending transaction, the net asset value of the Fund is affected by an increase or decrease in the value of the securities loaned and by an increase or decrease in the value of the instrument in which collateral is invested. The amount of securities lending activity undertaken by the Fund fluctuates from time to time. The Fund has the right under the lending agreement to recover the securities from the borrower on demand. In the event of default or bankruptcy by the borrower, the Fund may be prevented from recovering the loaned securities or gaining access to the collateral or may experience delays or costs in doing so. In such an event, the terms of the agreement allow the unaffiliated securities lending agent to use the collateral to purchase replacement securities on behalf of the Fund or pay the Fund the market value of the loaned securities. The Fund bears the risk of loss with respect to depreciation of its investment of the cash collateral.
Security transactions and income recognition
Securities transactions are recorded on a trade date basis. Realized gains or losses are recorded on the basis of identified cost.
Dividend income is recognized on the ex-dividend date.
22 | Allspring Growth Fund
Notes to financial statements (unaudited)
Distributions to shareholders
Distributions to shareholders from net investment income and any net realized gains are recorded on the ex-dividend date and paid at least annually. Such distributions are determined in accordance with income tax regulations and may differ from U.S. generally accepted accounting principles. Dividend sources are estimated at the time of declaration. The tax character of distributions is determined as of the Fund's fiscal year end. Therefore, a portion of the Fund's distributions made prior to the Fund’s fiscal year end may be categorized as a tax return of capital at year end.
Federal and other taxes
The Fund intends to continue to qualify as a regulated investment company by distributing substantially all of its investment company taxable income and any net realized capital gains (after reduction for capital loss carryforwards) sufficient to relieve it from all, or substantially all, federal income taxes. Accordingly, no provision for federal income taxes was required.
The Fund’s income and federal excise tax returns and all financial records supporting those returns for the prior three fiscal years are subject to examination by the federal and Delaware revenue authorities. Management has analyzed the Fund's tax positions taken on federal, state, and foreign tax returns, as applicable, for all open tax years and does not believe that there are any uncertain tax positions that require recognition of a tax liability.
As of January 31, 2023, the aggregate cost of all investments for federal income tax purposes was $1,664,987,898 and the unrealized gains (losses) consisted of:
| Gross unrealized gains | $1,446,529,981 |
| Gross unrealized losses | (53,520,014) |
| Net unrealized gains | $1,393,009,967 |
As of July 31, 2022, the Fund had a qualified late-year ordinary loss of $15,811,339 which was recognized on the first day of the current fiscal year.
Class allocations
The separate classes of shares offered by the Fund differ principally in applicable sales charges, distribution, shareholder servicing, and administration fees. Class specific expenses are charged directly to that share class. Investment income, common fund-level expenses, and realized and unrealized gains (losses) on investments are allocated daily to each class of shares based on the relative proportion of net assets of each class.
3. FAIR VALUATION MEASUREMENTS
Fair value measurements of investments are determined within a framework that has established a fair value hierarchy based upon the various data inputs utilized in determining the value of the Fund’s investments. The three-level hierarchy gives the highest priority to unadjusted quoted prices in active markets for identical assets or liabilities (Level 1) and the lowest priority to unobservable inputs (Level 3). The Fund’s investments are classified within the fair value hierarchy based on the lowest level of input that is significant to the fair value measurement. The inputs are summarized into three broad levels as follows:
| ■ | Level 1 – quoted prices in active markets for identical securities |
| ■ | Level 2 – other significant observable inputs (including quoted prices for similar securities, interest rates, prepayment speeds, credit risk, etc.) |
| ■ | Level 3 – significant unobservable inputs (including the Fund’s own assumptions in determining the fair value of investments) |
The inputs or methodologies used for valuing investments in securities are not necessarily an indication of the risk associated with investing in those securities.
Allspring Growth Fund | 23
Notes to financial statements (unaudited)
The following is a summary of the inputs used in valuing the Fund’s assets and liabilities as of January 31, 2023:
| | Quoted prices
(Level 1) | Other significant
observable inputs
(Level 2) | Significant
unobservable inputs
(Level 3) | Total |
| Assets | | | | |
| Investments in: | | | | |
| Common stocks | | | | |
| Communication services | $ 234,700,609 | $0 | $0 | $ 234,700,609 |
| Consumer discretionary | 484,610,345 | 0 | 0 | 484,610,345 |
| Consumer staples | 47,350,976 | 0 | 0 | 47,350,976 |
| Financials | 325,537,790 | 0 | 0 | 325,537,790 |
| Health care | 434,540,706 | 0 | 0 | 434,540,706 |
| Industrials | 203,384,758 | 0 | 0 | 203,384,758 |
| Information technology | 1,210,707,742 | 0 | 0 | 1,210,707,742 |
| Materials | 47,607,043 | 0 | 0 | 47,607,043 |
| Real estate | 35,845,153 | 0 | 0 | 35,845,153 |
| Short-term investments | | | | |
| Investment companies | 33,712,743 | 0 | 0 | 33,712,743 |
| Total assets | $3,057,997,865 | $0 | $0 | $3,057,997,865 |
Additional sector, industry or geographic detail, if any, is included in the Portfolio of Investments.
For the six months ended January 31, 2023, the Fund did not have any transfers into/out of Level 3.
4. TRANSACTIONS WITH AFFILIATES
Management fee
Allspring Funds Management, a wholly owned subsidiary of Allspring Global Investments Holdings, LLC, a holding company indirectly owned by certain private funds of GTCR LLC and Reverence Capital Partners, L.P., is the manager of the Fund and provides advisory and fund-level administrative services under an investment management agreement. Under the investment management agreement, Allspring Funds Management is responsible for, among other services, implementing the investment objectives and strategies of the Fund, supervising the subadviser and providing fund-level administrative services in connection with the Fund’s operations. As compensation for its services under the investment management agreement, Allspring Funds Management is entitled to receive a management fee at the following annual rate based on the Fund’s average daily net assets:
| Average daily net assets | Management fee |
| First $500 million | 0.800% |
| Next $500 million | 0.750 |
| Next $1 billion | 0.700 |
| Next $2 billion | 0.675 |
| Next $1 billion | 0.650 |
| Next $3 billion | 0.640 |
| Next $2 billion | 0.615 |
| Next $2 billion | 0.605 |
| Next $4 billion | 0.580 |
| Over $16 billion | 0.555 |
For the six months ended January 31, 2023, the management fee was equivalent to an annual rate of 0.71% of the Fund’s average daily net assets.
Allspring Funds Management has retained the services of a subadviser to provide daily portfolio management to the Fund. The fee for subadvisory services is borne by Allspring Funds Management. Allspring Global Investments, LLC ("Allspring
24 | Allspring Growth Fund
Notes to financial statements (unaudited)
Investments"), an affiliate of Allspring Funds Management and a wholly owned subsidiary of Allspring Global Investments Holdings, LLC, is the subadviser to the Fund and is entitled to receive a fee from Allspring Funds Management at an annual rate starting at 0.45% and declining to 0.30% as the average daily net assets of the Fund increase.
Administration fees
Under a class-level administration agreement, Allspring Funds Management provides class-level administrative services to the Fund, which includes paying fees and expenses for services provided by the transfer agent, sub-transfer agents, omnibus account servicers and record-keepers. As compensation for its services under the class-level administration agreement, Allspring Funds Management receives an annual fee which is calculated based on the average daily net assets of each class as follows:
| | Class-level
administration fee |
| Class A | 0.21% |
| Class C | 0.21 |
| Class R6 | 0.03 |
| Administrator Class | 0.13 |
| Institutional Class | 0.13 |
Waivers and/or expense reimbursements
Allspring Funds Management has contractually committed to waive and/or reimburse management and administration fees to the extent necessary to maintain certain net operating expense ratios for the Fund. When each class of the Fund has exceeded its expense cap, Allspring Funds Management will waive fees and/or reimburse expenses from fund-level expenses on a proportionate basis and then from class specific expenses. When only certain classes exceed their expense caps, waivers and/or reimbursements are applied against class specific expenses before fund-level expenses. Allspring Funds Management has contractually committed through November 30, 2023 to waive fees and/or reimburse expenses to the extent necessary to cap expenses. Prior to or after the commitment expiration date, the caps may be increased or the commitment to maintain the caps may be terminated only with the approval of the Board of Trustees. As of January 31, 2023, the contractual expense caps are as follows:
| | Expense ratio caps |
| Class A | 1.16% |
| Class C | 1.91 |
| Class R6 | 0.70 |
| Administrator Class | 0.96 |
| Institutional Class | 0.75 |
Distribution fee
The Trust has adopted a distribution plan for Class C shares pursuant to Rule 12b-1 under the 1940 Act. A distribution fee is charged to Class C shares and paid to Allspring Funds Distributor, LLC ("Allspring Funds Distributor"), the principal underwriter, an affiliate of Allspring Funds Management, at an annual rate up to 0.75% of the average daily net assets of Class C shares.
In addition, Allspring Funds Distributor is entitled to receive the front-end sales charge from the purchase of Class A shares and a contingent deferred sales charge on the redemption of certain Class A shares. Allspring Funds Distributor is also entitled to receive the contingent deferred sales charges from redemptions of Class C shares. Allspring Funds Distributor did not receive any front-end or contingent deferred sales charges from Class A or Class C shares for the six months ended January 31, 2023.
Shareholder servicing fees
The Trust has entered into contracts with one or more shareholder servicing agents, whereby Class A, Class C and Administrator Class are charged a fee at an annual rate up to 0.25% of the average daily net assets of each respective class. A portion of these total shareholder servicing fees were paid to affiliates of the Fund.
Allspring Growth Fund | 25
Notes to financial statements (unaudited)
Interfund transactions
The Fund may purchase or sell portfolio investment securities to certain affiliates pursuant to Rule 17a-7 under the 1940 Act and under procedures adopted by the Board of Trustees. The procedures have been designed to ensure that these interfund transactions, which do not incur broker commissions, are effected at current market prices.
5. INVESTMENT PORTFOLIO TRANSACTIONS
Purchases and sales of investments, excluding U.S. government obligations (if any) and short-term securities, for the six months ended January 31, 2023 were $971,208,747 and $1,215,187,171, respectively.
6. SECURITIES LENDING TRANSACTIONS
The Fund lends its securities through an unaffiliated securities lending agent and receives collateral in the form of cash or securities with a value at least equal to the value of the securities on loan. The value of the loaned securities is determined at the close of each business day and any increases or decreases in the required collateral are exchanged between the Fund and the counterparty on the next business day. Cash collateral received is invested in the Securities Lending Fund which seeks to provide a positive return compared to the daily Federal Funds Open Rate by investing in high-quality, U.S. dollar-denominated short-term money market instruments and is exempt from registration under Section 3(c)(7) of the 1940 Act. Securities Lending Fund is managed by Allspring Funds Management and is subadvised by Allspring Investments. Allspring Funds Management receives an advisory fee starting at 0.05% and declining to 0.01% as the average daily net assets of the Securities Lending Fund increase. All of the fees received by Allspring Funds Management are paid to Allspring Investments for its services as subadviser.
In the event of counterparty default or the failure of a borrower to return a loaned security, the Fund has the right to use the collateral to offset any losses incurred. As of January 31, 2023, the Fund did not have any securities on loan.
7. BANK BORROWINGS
The Trust (excluding the money market funds), Allspring Master Trust and Allspring Variable Trust are parties to a $350,000,000 revolving credit agreement whereby the Fund is permitted to use bank borrowings for temporary or emergency purposes, such as to fund shareholder redemption requests. Interest under the credit agreement is charged to the Fund based on a borrowing rate equal to the higher of the Federal Funds rate or the overnight bank funding rate in effect on that day plus a spread. In addition, an annual commitment fee equal based on the unused balance is allocated to each participating fund.
For the six months ended January 31, 2023, there were no borrowings by the Fund under the agreement.
8. CONCENTRATION RISKS
As of the end of the period, the Fund concentrated its portfolio of investments in the information technology sector. A fund that invests a substantial portion of its assets in any sector may be more affected by changes in that sector than would be a fund whose investments are not heavily weighted in any sector.
9. MARKET RISKS
On March 11, 2020, the World Health Organization announced that it had made the assessment that coronavirus disease 2019 (“COVID-19”) is a pandemic. The impacts of COVID-19 are affecting the entire global economy, individual companies and investment products, the funds, and the market in general. There is significant uncertainty around the extent and duration of business disruptions related to COVID-19 and the impacts may last for an extended period of time. COVID-19 has led to significant uncertainty and volatility in the financial markets.
10. INDEMNIFICATION
Under the Fund's organizational documents, the officers and Trustees have been granted certain indemnification rights against certain liabilities that may arise out of performance of their duties to the Fund. The Fund has entered into a separate agreement with each Trustee that converts indemnification rights currently existing under the Fund’s organizational documents into contractual rights that cannot be changed in the future without the consent of the Trustee. Additionally, in the normal course of business, the Fund may enter into contracts with service providers that contain a variety of indemnification clauses. The Fund’s maximum exposure under these arrangements is dependent on future claims that may be made against the Fund and, therefore, cannot be estimated.
26 | Allspring Growth Fund
Other information (unaudited)
PROXY VOTING INFORMATION
A description of the policies and procedures used to determine how to vote proxies relating to portfolio securities is available without charge, upon request, by calling 1-800-222-8222, visiting our website at allspringglobal.com, or visiting the SEC website at sec.gov. Information regarding how the proxies related to portfolio securities were voted during the most recent 12-month period ended June 30 is available on the website at allspringglobal.com or by visiting the SEC website at sec.gov.
QUARTERLY PORTFOLIO HOLDINGS INFORMATION
The Fund files its complete schedule of portfolio holdings with the SEC for the first and third quarters of each fiscal year as an exhibit to its reports on Form N-PORT. Shareholders may view the filed Form N-PORT by visiting the SEC website at sec.gov.
Allspring Growth Fund | 27
Other information (unaudited)
BOARD OF TRUSTEES AND OFFICERS
Each of the Trustees and Officers listed in the table below acts in identical capacities for each fund in the Allspring family of funds, which consists of 127 mutual funds comprising the Allspring Funds Trust, Allspring Variable Trust, Allspring Master Trust and four closed-end funds (collectively the “Fund Complex”). This table should be read in conjunction with the Prospectus and the Statement of Additional Information1. The mailing address of each Trustee and Officer is 1415 Vantage Park Drive, 3rd Floor, Charlotte, NC 28203. Each Trustee and Officer serves an indefinite term, however, each Trustee serves such term until reaching the mandatory retirement age established by the Trustees.
Independent Trustees
Name and
year of birth | Position held and
length of service* | Principal occupations during past five years or longer | Current other
public company or
investment
company
directorships |
William R. Ebsworth
(Born 1957) | Trustee,
since 2015 | Retired. From 1984 to 2013, equities analyst, portfolio manager, research director and chief investment officer at Fidelity Management and Research Company in Boston, Tokyo, and Hong Kong, and retired in 2013 as Chief Investment Officer of Fidelity Strategic Advisers, Inc. where he led a team of investment professionals managing client assets. Prior thereto, Board member of Hong Kong Securities Clearing Co., Hong Kong Options Clearing Corp., the Thailand International Fund, Ltd., Fidelity Investments Life Insurance Company, and Empire Fidelity Investments Life Insurance Company. Audit Committee Chair and Investment Committee Chair of the Vincent Memorial Hospital Foundation (non-profit organization). Mr. Ebsworth is a CFA® charterholder. | N/A |
Jane A. Freeman
(Born 1953) | Trustee,
since 2015;
Chair Liaison,
since 2018 | Retired. From 2012 to 2014 and 1999 to 2008, Chief Financial Officer of Scientific Learning Corporation. From 2008 to 2012, Ms. Freeman provided consulting services related to strategic business projects. Prior to 1999, Portfolio Manager at Rockefeller & Co. and Scudder, Stevens & Clark. Board member of the Harding Loevner Funds from 1996 to 2014, serving as both Lead Independent Director and chair of the Audit Committee. Board member of the Russell Exchange Traded Funds Trust from 2011 to 2012 and the chair of the Audit Committee. Ms. Freeman is also an inactive Chartered Financial Analyst. | N/A |
Isaiah Harris, Jr.
(Born 1952) | Trustee,
since 2009; Audit
Committee
Chair,
since 2019 | Retired. Member of the Advisory Board of CEF of East Central Florida. Chairman of the Board of CIGNA Corporation from 2009 to 2021, and Director from 2005 to 2008. From 2003 to 2011, Director of Deluxe Corporation. Prior thereto, President and CEO of BellSouth Advertising and Publishing Corp. from 2005 to 2007, President and CEO of BellSouth Enterprises from 2004 to 2005 and President of BellSouth Consumer Services from 2000 to 2003. Emeritus member of the Iowa State University Foundation Board of Governors. Emeritus Member of the Advisory Board of Iowa State University School of Business. Advisory Board Member, Palm Harbor Academy (private school). Advisory Board Member, Fellowship of Christian Athletes. Mr. Harris is a certified public accountant (inactive status). | N/A |
David F. Larcker
(Born 1950) | Trustee,
since 2009 | Distinguished Visiting Fellow at the Hoover Institution since 2022. James Irvin Miller Professor of Accounting at the Graduate School of Business (Emeritus), Stanford University, Director of the Corporate Governance Research Initiative and Senior Faculty of The Rock Center for Corporate Governance since 2006. From 2005 to 2008, Professor of Accounting at the Graduate School of Business, Stanford University. Prior thereto, Ernst & Young Professor of Accounting at The Wharton School, University of Pennsylvania from 1985 to 2005. | N/A |
28 | Allspring Growth Fund
Other information (unaudited)
Name and
year of birth | Position held and
length of service* | Principal occupations during past five years or longer | Current other
public company or
investment
company
directorships |
Olivia S. Mitchell
(Born 1953) | Trustee,
since 2006;
Nominating and
Governance
Committee Chair,
since 2018 | International Foundation of Employee Benefit Plans Professor since 1993, Wharton School of the University of Pennsylvania. Director of Wharton’s Pension Research Council and Boettner Center on Pensions & Retirement Research, and Research Associate at the National Bureau of Economic Research. Previously taught at Cornell University from 1978 to 1993. | N/A |
Timothy J. Penny
(Born 1951) | Trustee,
since 1996;
Chair,
since 2018 | President and Chief Executive Officer of Southern Minnesota Initiative Foundation, a non-profit organization, since 2007. Vice Chair of the Economic Club of Minnesota, since 2007. Co-Chair of the Committee for a Responsible Federal Budget, since 1995. Member of the Board of Trustees of NorthStar Education Finance, Inc., a non-profit organization, from 2007-2022. Senior Fellow of the University of Minnesota Humphrey Institute from 1995 to 2017. | N/A |
James G. Polisson
(Born 1959) | Trustee,
since 2018 | Retired. Chief Marketing Officer, Source (ETF) UK Services, Ltd, from 2015 to 2017. From 2012 to 2015, Principal of The Polisson Group, LLC, a management consulting, corporate advisory and principal investing company. Chief Executive Officer and Managing Director at Russell Investments, Global Exchange Traded Funds from 2010 to 2012. Managing Director of Barclays Global Investors from 1998 to 2010 and Global Chief Marketing Officer for iShares and Barclays Global Investors from 2000 to 2010. Trustee of the San Francisco Mechanics’ Institute, a non-profit organization, from 2013 to 2015. Board member of the Russell Exchange Traded Fund Trust from 2011 to 2012. Director of Barclays Global Investors Holdings Deutschland GmbH from 2006 to 2009. Mr. Polisson is an attorney and has a retired status with the Massachusetts and District of Columbia Bar Associations. | N/A |
Pamela Wheelock
(Born 1959) | Trustee,
since January
2020; previously
Trustee from
January 2018 to
July 2019 | Retired. Executive and Senior Financial leadership positions in the public, private and nonprofit sectors. Interim President and CEO, McKnight Foundation, 2020. Interim Commissioner, Minnesota Department of Human Services, 2019. Chief Operating Officer, Twin Cities Habitat for Humanity, 2017-2019. Vice President for University Services, University of Minnesota, 2012-2016. Interim President and CEO, Blue Cross and Blue Shield of Minnesota, 2011-2012. Executive Vice-President and Chief Financial Officer, Minnesota Wild, 2002-2008. Commissioner, Minnesota Department of Finance, 1999-2002. Chair of the Board of Directors of Destination Medical Center Corporation. Board member of the Minnesota Wild Foundation. | N/A |
* Length of service dates reflect the Trustee’s commencement of service with the Trust’s predecessor entities, where applicable.
Allspring Growth Fund | 29
Other information (unaudited)
Officers2
Name and
year of birth | Position held and
length of service | Principal occupations during past five years or longer |
Andrew Owen
(Born 1960) | President,
since 2017 | President and Chief Executive Officer of Allspring Funds Management, LLC since 2017 and Head of Global Fund Governance of Allspring Global Investments since 2022. Prior thereto, co-president of Galliard Capital Management, LLC, an affiliate of Allspring Funds Management, LLC, from 2019 to 2022 and Head of Affiliated Managers, Allspring Global Investments, from 2014 to 2019 and Executive Vice President responsible for marketing, investments and product development for Allspring Funds Management, LLC, from 2009 to 2014. |
Jeremy DePalma
(Born 1974) | Treasurer,
since 2012
(for certain funds in
the Fund Complex);
since 2021 (for
the remaining funds in the
Fund Complex) | Senior Vice President of Allspring Funds Management, LLC since 2009. Senior Vice President of Evergreen Investment Management Company, LLC from 2008 to 2010 and head of the Fund Reporting and Control Team within Fund Administration from 2005 to 2010. |
Christopher Baker
(Born 1976) | Chief Compliance Officer, since 2022 | Global Chief Compliance Officer for Allspring Global Investments since 2022. Prior thereto, Chief Compliance Officer for State Street Global Advisors from 2018 to 2021. Senior Compliance Officer for the State Street divisions of Alternative Investment Solutions, Sector Solutions, and Global Marketing from 2015 to 2018. From 2010 to 2015 Vice President, Global Head of Investment and Marketing Compliance for State Street Global Advisors. |
Matthew Prasse
(Born 1983) | Chief Legal Officer, since 2022; Secretary, since 2021 | Senior Counsel of the Allspring Legal Department since 2021. Senior Counsel of the Wells Fargo Legal Department from 2018 to 2021. Previously, Counsel for Barings LLC from 2015 to 2018. Prior to joining Barings, Associate at Morgan, Lewis & Bockius LLP from 2008 to 2015. |
1 The Statement of Additional Information includes additional information about the Trustees and is available, without charge, upon request, by calling 1-800-222-8222 or by visiting the website at allspringglobal.com.
2 For those Officers with tenures at Allspring Global Investments and/or Allspring Funds Management, LLC that began prior to 2021, such tenures include years of service during which these businesses/entities were known as Wells Fargo Asset Management and Wells Fargo Funds Management, LLC, respectively.
30 | Allspring Growth Fund
For more information
More information about Allspring Funds is available free upon request. To obtain literature, please write, visit the Fund's website, or call:
Allspring Funds
P.O. Box 219967
Kansas City, MO 64121-9967
Website: allspringglobal.com
Individual investors: 1-800-222-8222
Retail investment professionals: 1-888-877-9275
Institutional investment professionals: 1-800-260-5969
This report and the financial statements contained herein are submitted for the general information of the shareholders of the Fund. If this report is used for promotional purposes, distribution of the report must be accompanied or preceded by a current prospectus. Before investing, please consider the investment objectives, risks, charges, and expenses of the investment. For a current prospectus and, if available, a summary prospectus, containing this information, call
1-800-222-8222 or visit the Fund's website at allspringglobal.com. Read the prospectus carefully before you invest or send money.
Allspring Global InvestmentsTM is the trade name for the asset management firms of Allspring Global Investments Holdings, LLC, a holding company indirectly owned by certain private funds of GTCR LLC and Reverence Capital Partners, L.P. These firms include but are not limited to Allspring Global Investments, LLC, and Allspring Funds Management, LLC. Certain products managed by Allspring entities are distributed by Allspring Funds Distributor, LLC (a broker-dealer and Member FINRA/SIPC).
This material is for general informational and educational purposes only and is NOT intended to provide investment advice or a recommendation of any kind - including a recommendation for any specific investment, strategy, or plan.
© 2023 Allspring Global Investments Holdings, LLC. All rights reserved.
ALL-02092023-9ldeyu2o 03-23
SAR3009 01-23
Semi-Annual Report
January 31, 2023
Allspring Large Cap Core Fund
The views expressed and any forward-looking statements are as of January 31, 2023, unless otherwise noted, and are those of the Fund's portfolio managers and/or Allspring Global Investments. Discussions of individual securities or the markets generally are not intended as individual recommendations. Future events or results may vary significantly from those expressed in any forward-looking statements. The views expressed are subject to change at any time in response to changing circumstances in the market. Allspring Global Investments disclaims any obligation to publicly update or revise any views expressed or forward-looking statements.
Allspring Large Cap Core Fund | 1
Letter to shareholders (unaudited)
Andrew Owen
President
Allspring Funds
Dear Shareholder:
We are pleased to offer you this semi-annual report for the Allspring Large Cap Core Fund for the six-month period that ended January 31, 2023. Globally, stocks and bonds experienced heightened volatility through the challenging period. Earlier tailwinds provided by global stimulus programs, vaccination rollouts, and recovering consumer and corporate sentiment were wiped away by the highest rate of inflation in four decades as well as the impact of ongoing aggressive central bank rate hikes and the prospect of more rate hikes. Compounding these concerns were the global reverberations of the Russia-Ukraine war and the impact of China’s strict COVID-19 lockdowns.
For the six-month period, stocks and bonds had mixed results, with non-U.S. equities––both developed market and emerging market––outperforming U.S. stocks overall. Bonds––both U.S. and non-U.S.––struggled to cope with sustained aggressive interest rate increases. For the period, U.S. stocks, based on the S&P 500 Index,1 lost 0.44%. International stocks, as measured by the MSCI ACWI ex USA Index (Net),2 returned 7.63%, while the MSCI EM Index (Net) (USD)3 gained 4.92%. Among bond indexes, the Bloomberg U.S. Aggregate Bond Index4 returned -2.37%, the Bloomberg Global Aggregate ex-USD Index (unhedged)5 returned -1.15%, the Bloomberg Municipal Bond Index6 gained 0.73%, and the ICE BofA U.S. High Yield Index7 returned 1.27%.
The Russia-Ukraine war, high inflation, and central bank rate hikes rocked markets
August was yet another broadly challenging month for financial markets, with more red ink flowing. High inflation persisted, cresting 9% in the eurozone on an annual basis and remaining above 8% in the U.S. despite the Federal Reserve’s (Fed’s) aggressive monetary policy and a major drop in global crude oil and gasoline prices from their June peak. One positive note was the resilience of the U.S. job market. However, the Fed’s job was clearly not complete. One longer-term bright spot was the U.S. Congress’s passage of the Inflation Reduction Act. Its primary stated goals include: to reduce inflation (though not immediately) by curbing the deficit, capping health care spending by seniors, and investing in domestic sources of clean energy.
“August was yet another broadly challenging month for financial markets, with more red ink flowing.”
| 1 | The S&P 500 Index consists of 500 stocks chosen for market size, liquidity, and industry group representation. It is a market-value-weighted index with each stock's weight in the index proportionate to its market value. You cannot invest directly in an index. |
| 2 | The Morgan Stanley Capital International (MSCI) All Country World Index (ACWI) ex USA Index (Net) is a free-float-adjusted market-capitalization-weighted index that is designed to measure the equity market performance of developed and emerging markets, excluding the U.S. Source: MSCI. MSCI makes no express or implied warranties or representations and shall have no liability whatsoever with respect to any MSCI data contained herein. The MSCI data may not be further redistributed or used as a basis for other indexes or any securities or financial products. This report is not approved, reviewed, or produced by MSCI. You cannot invest directly in an index. |
| 3 | The MSCI Emerging Markets (EM) Index (Net) (USD) is a free-float-adjusted market-capitalization-weighted index that is designed to measure equity market performance of emerging markets. You cannot invest directly in an index. |
| 4 | The Bloomberg U.S. Aggregate Bond Index is a broad-based benchmark that measures the investment-grade, U.S.-dollar-denominated, fixed-rate taxable bond market, including Treasuries, government-related and corporate securities, mortgage-backed securities (agency fixed-rate and hybrid adjustable-rate mortgage pass-throughs), asset-backed securities, and commercial mortgage-backed securities. You cannot invest directly in an index. |
| 5 | The Bloomberg Global Aggregate ex-USD Index (unhedged) is an unmanaged index that provides a broad-based measure of the global investment-grade fixed-income markets excluding the U.S.-dollar-denominated debt market. You cannot invest directly in an index. |
| 6 | The Bloomberg Municipal Bond Index is an unmanaged index composed of long-term tax-exempt bonds with a minimum credit rating of Baa. You cannot invest directly in an index. |
| 7 | The ICE BofA U.S. High Yield Index is a market-capitalization-weighted index of domestic and Yankee high-yield bonds. The index tracks the performance of high-yield securities traded in the U.S. bond market. You cannot invest directly in an index. Copyright 2023. ICE Data Indices, LLC. All rights reserved. |
2 | Allspring Large Cap Core Fund
Letter to shareholders (unaudited)
The market misery continued in September. There was nowhere to hide as all asset classes suffered major losses at the hands of persistent inflation. Central banks kept up their battle against rapidly rising prices with more rate hikes. The strength of the U.S. dollar made things even more difficult for investors holding assets in other currencies. U.S. mortgage rates jumped to near 7% on 30-year fixed-rate mortgages; the decreased housing affordability began to cool demand somewhat. The U.K. experienced a sharp sell-off of government bonds and the British pound in September as investors panicked in response to a new government budget that was seen as financially unsound. The market meltdown forced the Bank of England to step in and buy long-dated government bonds.
Equities had a reprieve in October after two months of sharp declines. Value stocks and small caps fared best. Globally, developed markets outpaced emerging market equities, which were hurt by weakness among Chinese stocks. Central banks continued to try to curtail high inflation with aggressive interest rate hikes. Geopolitical risks persisted, including the ongoing Russia-Ukraine war and economic, financial market, and political turmoil in the U.K., which led to a second prime ministerial change in six weeks, as Rishi Sunak replaced Liz Truss in late October. Concerns over Europe’s energy crisis eased thanks to unseasonably warm weather and plentiful gas on hand. The U.S. labor market continued its resilience against rising prices, as unemployment stood at 3.7%, near a record low.
Stocks and bonds rallied in November, with emerging market equities gaining nearly 15% and developed market equities returning 7%. The S&P 500 Index rose 5.6% in November. Bonds also had positive monthly returns. Economic news was encouraging, driven by U.S. labor market strength. Although central banks kept raising rates, expectations grew regarding an impending easing in the pace of rate hikes and a possible end to central bank monetary tightening in 2023. Although inflation remained at record highs in the eurozone, with a 10.6% annual increase in October, Germany’s producer prices decreased 4.2% annually, signaling a possible decline in inflationary pressures. Meanwhile, U.S. inflation continued to moderate, with a 7.1% annual price rise in November and a monthly price increase of just 0.1%. China’s economic data remained weak, reflecting its zero-COVID-19 policy.
Financial markets cooled in December, with U.S. equities posting negative overall results in response to a weakening U.S. dollar. Fixed income securities ended one of their worst years ever with flat overall monthly returns as markets weighed the hopes for an end to the monetary tightening cycle with the reality that central banks had not completed their jobs yet. U.S. Consumer Price Index (CPI)1 data showed a strong consistent trend downward, which brought down the 12-month CPI to 6.5% in December from 9.1% in June. Other countries and regions reported still-high but declining inflation rates as the year winded down.
The year 2023 began with a broad rally across global equities and fixed income securities. Investor optimism rose in response to data indicating declining inflation rates and the reopening of China’s economy with the abrupt end to its zero-COVID-19 policy. The U.S. reported surprisingly strong job gains––employers added more than 500,000 jobs––and unemployment fell to 3.4%, the lowest level since 1969. Meanwhile, wage growth, seen as a potential contributor to ongoing high inflation, continued to moderate. All eyes remained fixed on the Fed and on how many additional rate hikes it will announce before reaching the peak (“terminal”) rate, expected to be above 5%. The 0.25% federal funds rate hike announced in January was the Fed’s smallest rate increase since March 2022.
| 1 | The Consumer Price Index (CPI) is a measure of the average change over time in the prices paid by urban consumers for a market basket of consumer goods and services. You cannot invest directly in an index. |
Allspring Large Cap Core Fund | 3
Letter to shareholders (unaudited)
Don’t let short-term uncertainty derail long-term investment goals.
Periods of investment uncertainty can present challenges, but experience has taught us that maintaining long-term investment goals can be an effective way to plan for the future. To help you create a sound strategy based on your personal goals and risk tolerance, Allspring Funds offers more than 100 mutual funds spanning a wide range of asset classes and investment styles. Although diversification cannot guarantee an investment profit or prevent losses, we believe it can be an effective way to manage investment risk and potentially smooth out overall portfolio performance. We encourage investors to know their investments and to understand that appropriate levels of risk-taking may unlock opportunities.
Thank you for choosing to invest with Allspring Funds. We appreciate your confidence in us and remain committed to helping you meet your financial needs.
Sincerely,
Andrew Owen
President
Allspring Funds
For further information about your fund, contact your investment professional, visit our website at allspringglobal.com, or call us directly at 1-800-222-8222.
4 | Allspring Large Cap Core Fund
This page is intentionally left blank.
Performance highlights (unaudited)
| Investment objective | The Fund seeks long-term capital appreciation. |
| Manager | Allspring Funds Management, LLC |
| Subadviser | Allspring Global Investments, LLC |
| Portfolio managers | John R. Campbell, CFA®‡, Vince Fioramonti, CFA®‡ |
| Average annual total returns (%) as of January 31, 2023 |
| | | Including sales charge | | Excluding sales charge | | Expense ratios1 (%) |
| | Inception date | 1 year | 5 year | 10 year | | 1 year | 5 year | 10 year | | Gross | Net 2 |
| Class A (EGOAX) | 12-17-2007 | -10.51 | 5.76 | 10.90 | | -5.06 | 7.02 | 11.56 | | 1.20 | 1.08 |
| Class C (EGOCX) | 12-17-2007 | -6.81 | 6.21 | 10.89 | | -5.81 | 6.21 | 10.89 | | 1.95 | 1.83 |
| Class R (EGOHX)3 | 9-30-2015 | – | – | – | | -5.32 | 6.76 | 11.29 | | 1.45 | 1.33 |
| Class R6 (EGORX)4 | 9-30-2015 | – | – | – | | -4.75 | 7.46 | 12.38 | | 0.77 | 0.65 |
| Administrator Class (WFLLX) | 7-16-2010 | – | – | – | | -5.05 | 7.13 | 11.72 | | 1.12 | 0.97 |
| Institutional Class (EGOIX) | 12-17-2007 | – | – | – | | -4.74 | 7.44 | 12.04 | | 0.87 | 0.67 |
| S&P 500 Index5 | – | – | – | – | | -8.22 | 9.54 | 12.68 | | – | ��� |
Figures quoted represent past performance, which is no guarantee of future results, and do not reflect taxes that a shareholder may pay on an investment in a fund. Investment return and principal value of an investment will fluctuate so that an investor’s shares, when redeemed, may be worth more or less than their original cost. Performance shown without sales charges would be lower if sales charges were reflected. Current performance may be lower or higher than the performance data quoted, which assumes the reinvestment of dividends and capital gains. Current month-end performance is available on the Fund’s website, allspringglobal.com.
Index returns do not include transaction costs associated with buying and selling securities, any mutual fund fees or expenses, or any taxes. It is not possible to invest directly in an index.
For Class A shares, the maximum front-end sales charge is 5.75%. For Class C shares, the maximum contingent deferred sales charge is 1.00%. Performance including a contingent deferred sales charge assumes the sales charge for the corresponding time period. Class R, Class R6, Administrator Class and Institutional Class shares are sold without a front-end sales charge or contingent deferred sales charge.
| 1 | Reflects the expense ratios as stated in the most recent prospectuses. The expense ratios shown are subject to change and may differ from the annualized expense ratios shown in the financial highlights of this report. |
| 2 | The manager has contractually committed through November 30, 2023, to waive fees and/or reimburse expenses to the extent necessary to cap total annual fund operating expenses after fee waivers at 1.08% for Class A, 1.83% for Class C, 1.33% for Class R, 0.65% for Class R6, 0.97% for Administrator Class, and 0.67% for Institutional Class. Brokerage commissions, stamp duty fees, interest, taxes, acquired fund fees and expenses (if any), and extraordinary expenses are excluded from the expense caps. Prior to or after the commitment expiration date, the caps may be increased or the commitment to maintain the caps may be terminated only with the approval of the Board of Trustees. Without these caps, the Fund’s returns would have been lower. The expense ratio paid by an investor is the net expense ratio (the total annual fund operating expenses after fee waivers) as stated in the prospectuses. |
| 3 | Historical performance shown for the Class R shares prior to their inception reflects the performance of the Administrator Class shares, adjusted to reflect the higher expenses applicable to the Class R shares. |
| 4 | Historical performance shown for the Class R6 shares prior to their inception reflects the performance of the Institutional Class shares, and includes the higher expenses applicable to the Institutional Class shares. If these expenses had not been included, returns for the Class R6 shares would be higher. |
| 5 | The S&P 500 Index consists of 500 stocks chosen for market size, liquidity, and industry group representation. It is a market-value weighted index with each stock’s weight in the index proportionate to its market value. You cannot invest directly in an index. |
Stock values fluctuate in response to the activities of individual companies and general market and economic conditions. Certain investment strategies tend to increase the total risk of an investment (relative to the broader market). This fund is exposed to foreign investment risk and focused portfolio risk. Consult the Fund’s prospectus for additional information on these and other risks.
| ‡ | CFA® and Chartered Financial Analyst® are trademarks owned by CFA Institute. |
6 | Allspring Large Cap Core Fund
Performance highlights (unaudited)
| Ten largest holdings (%) as of January 31, 20231 |
| Apple Incorporated | 4.76 |
| Microsoft Corporation | 4.61 |
| Alphabet Incorporated Class C | 2.90 |
| Costco Wholesale Corporation | 2.40 |
| EMCOR Group Incorporated | 2.36 |
| Simon Property Group Incorporated | 2.35 |
| Copart Incorporated | 2.23 |
| MasterCard Incorporated Class A | 2.23 |
| Halliburton Company | 2.16 |
| Nucor Corporation | 2.07 |
| 1 | Figures represent the percentage of the Fund's net assets. Holdings are subject to change and may have changed since the date specified. |
| Sector allocation as of January 31, 20231 |
| 1 | Figures represent the percentage of the Fund's long-term investments. Allocations are subject to change and may have changed since the date specified. |
Allspring Large Cap Core Fund | 7
Fund expenses (unaudited)
As a shareholder of the Fund, you incur two types of costs: (1) transaction costs, including sales charges (loads) on purchase payments and contingent deferred sales charges (if any) on redemptions and (2) ongoing costs, including management fees, distribution (12b-1) and/or shareholder servicing fees, and other Fund expenses. This example is intended to help you understand your ongoing costs (in dollars) of investing in the Fund and to compare these costs with the ongoing costs of investing in other mutual funds.
The example is based on an investment of $1,000 invested at the beginning of the six-month period and held for the entire period from August 1, 2022 to January 31, 2023.
Actual expenses
The “Actual” line of the table below provides information about actual account values and actual expenses. You may use the information in this line, together with the amount you invested, to estimate the expenses that you paid over the period. Simply divide your account value by $1,000 (for example, an $8,600 account value divided by $1,000 = 8.6), then multiply the result by the number in the “Actual” line under the heading entitled “Expenses paid during period” for your applicable class of shares to estimate the expenses you paid on your account during this period.
Hypothetical example for comparison purposes
The “Hypothetical” line of the table below provides information about hypothetical account values and hypothetical expenses based on the Fund’s actual expense ratio and an assumed rate of return of 5% per year before expenses, which is not the Fund’s actual return. The hypothetical account values and expenses may not be used to estimate the actual ending account balance or expenses you paid for the period. You may use this information to compare the ongoing costs of investing in the Fund and other funds. To do so, compare this 5% hypothetical example with the 5% hypothetical examples that appear in the shareholder reports of the other funds.
Please note that the expenses shown in the table are meant to highlight your ongoing costs only and do not reflect any transactional costs, such as sales charges (loads) and contingent deferred sales charges. Therefore, the “Hypothetical” line of the table is useful in comparing ongoing costs only, and will not help you determine the relative total costs of owning different funds. In addition, if these transactional costs were included, your costs would have been higher.
| | Beginning
account value
8-1-2022 | Ending
account value
1-31-2023 | Expenses
paid during
the period1 | Annualized net
expense ratio |
| Class A | | | | |
| Actual | $1,000.00 | $1,023.65 | $5.51 | 1.08% |
| Hypothetical (5% return before expenses) | $1,000.00 | $1,019.76 | $5.50 | 1.08% |
| Class C | | | | |
| Actual | $1,000.00 | $1,019.60 | $9.32 | 1.83% |
| Hypothetical (5% return before expenses) | $1,000.00 | $1,015.98 | $9.30 | 1.83% |
| Class R | | | | |
| Actual | $1,000.00 | $1,022.09 | $6.78 | 1.33% |
| Hypothetical (5% return before expenses) | $1,000.00 | $1,018.50 | $6.77 | 1.33% |
| Class R6 | | | | |
| Actual | $1,000.00 | $1,025.22 | $3.32 | 0.65% |
| Hypothetical (5% return before expenses) | $1,000.00 | $1,021.93 | $3.31 | 0.65% |
| Administrator Class | | | | |
| Actual | $1,000.00 | $1,023.90 | $4.95 | 0.97% |
| Hypothetical (5% return before expenses) | $1,000.00 | $1,020.32 | $4.94 | 0.97% |
| Institutional Class | | | | |
| Actual | $1,000.00 | $1,025.17 | $3.42 | 0.67% |
| Hypothetical (5% return before expenses) | $1,000.00 | $1,021.83 | $3.41 | 0.67% |
1 Expenses paid is equal to the annualized net expense ratio of each class multiplied by the average account value over the period, multiplied by 184 divided by 365 (to reflect the one-half-year period).
8 | Allspring Large Cap Core Fund
Portfolio of investments—January 31, 2023 (unaudited)
| | | | | Shares | Value |
| Common stocks: 99.23% | | | | | |
| Communication services: 4.61% | | | | | |
| Entertainment: 1.71% | | | | | |
| Activision Blizzard Incorporated | | | | 94,703 | $ 7,251,409 |
| Interactive media & services: 2.90% | | | | | |
| Alphabet Incorporated Class C † | | | | 123,122 | 12,296,194 |
| Consumer discretionary: 8.67% | | | | | |
| Household durables: 3.86% | | | | | |
| Lennar Corporation Class A | | | | 81,443 | 8,339,763 |
| PulteGroup Incorporated | | | | 140,632 | 8,000,554 |
| | | | | | 16,340,317 |
| Internet & direct marketing retail: 1.61% | | | | | |
| Amazon.com Incorporated † | | | | 66,291 | 6,836,592 |
| Multiline retail: 1.41% | | | | | |
| Target Corporation | | | | 34,566 | 5,950,191 |
| Specialty retail: 1.79% | | | | | |
| O'Reilly Automotive Incorporated † | | | | 9,586 | 7,595,467 |
| Consumer staples: 4.18% | | | | | |
| Food & staples retailing: 2.40% | | | | | |
| Costco Wholesale Corporation | | | | 19,888 | 10,165,552 |
| Food products: 1.78% | | | | | |
| Archer Daniels Midland Company | | | | 91,171 | 7,553,517 |
| Energy: 7.99% | | | | | |
| Energy equipment & services: 2.16% | | | | | |
| Halliburton Company | | | | 222,313 | 9,163,742 |
| Oil, gas & consumable fuels: 5.83% | | | | | |
| Chevron Corporation | | | | 47,625 | 8,287,703 |
| ConocoPhillips | | | | 66,301 | 8,080,103 |
| Devon Energy Corporation | | | | 131,420 | 8,311,001 |
| | | | | | 24,678,807 |
| Financials: 10.11% | | | | | |
| Banks: 5.19% | | | | | |
| Citigroup Incorporated | | | | 118,140 | 6,169,271 |
| Citizens Financial Group Incorporated | | | | 166,675 | 7,220,361 |
| JPMorgan Chase & Company | | | | 61,557 | 8,615,518 |
| | | | | | 22,005,150 |
| Capital markets: 4.92% | | | | | |
| Evercore Partners Incorporated Class A | | | | 58,241 | 7,560,264 |
| The Goldman Sachs Group Incorporated | | | | 22,964 | 8,400,461 |
| Virtu Financial Incorporated Class A | | | | 252,381 | 4,873,477 |
| | | | | | 20,834,202 |
The accompanying notes are an integral part of these financial statements.
Allspring Large Cap Core Fund | 9
Portfolio of investments—January 31, 2023 (unaudited)
| | | | | Shares | Value |
| Health care: 15.73% | | | | | |
| Biotechnology: 5.31% | | | | | |
| AbbVie Incorporated | | | | 47,588 | $ 7,031,127 |
| Regeneron Pharmaceuticals Incorporated † | | | | 10,654 | 8,080,739 |
| United Therapeutics Corporation † | | | | 28,127 | 7,402,183 |
| | | | | | 22,514,049 |
| Health care equipment & supplies: 1.60% | | | | | |
| Hologic Incorporated † | | | | 83,337 | 6,781,132 |
| Health care providers & services: 5.43% | | | | | |
| CVS Health Corporation | | | | 86,416 | 7,623,620 |
| Elevance Health Incorporated | | | | 15,685 | 7,842,343 |
| UnitedHealth Group Incorporated | | | | 15,092 | 7,533,775 |
| | | | | | 22,999,738 |
| Pharmaceuticals: 3.39% | | | | | |
| Bristol-Myers Squibb Company | | | | 89,729 | 6,518,812 |
| Pfizer Incorporated | | | | 178,041 | 7,862,291 |
| | | | | | 14,381,103 |
| Industrials: 10.23% | | | | | |
| Commercial services & supplies: 2.23% | | | | | |
| Copart Incorporated † | | | | 141,580 | 9,430,644 |
| Construction & engineering: 2.36% | | | | | |
| EMCOR Group Incorporated | | | | 67,475 | 10,003,169 |
| Electrical equipment: 2.02% | | | | | |
| nVent Electric plc | | | | 215,113 | 8,550,742 |
| Machinery: 2.04% | | | | | |
| AGCO Corporation | | | | 62,739 | 8,666,138 |
| Road & rail: 1.58% | | | | | |
| J.B. Hunt Transport Services Incorporated | | | | 35,486 | 6,708,628 |
| Information technology: 27.99% | | | | | |
| Communications equipment: 1.92% | | | | | |
| Arista Networks Incorporated † | | | | 64,450 | 8,121,989 |
| IT services: 4.05% | | | | | |
| Accenture plc Class A | | | | 27,701 | 7,729,964 |
| MasterCard Incorporated Class A | | | | 25,442 | 9,428,805 |
| | | | | | 17,158,769 |
| Semiconductors & semiconductor equipment: 7.47% | | | | | |
| Applied Materials Incorporated | | | | 61,557 | 6,862,990 |
| Broadcom Incorporated | | | | 14,678 | 8,586,777 |
| Microchip Technology Incorporated | | | | 109,673 | 8,512,818 |
| Qualcomm Incorporated | | | | 57,768 | 7,695,275 |
| | | | | | 31,657,860 |
| Software: 9.79% | | | | | |
| Adobe Incorporated † | | | | 14,207 | 5,261,420 |
The accompanying notes are an integral part of these financial statements.
10 | Allspring Large Cap Core Fund
Portfolio of investments—January 31, 2023 (unaudited)
| | | | | Shares | Value |
| Software (continued) | | | | | |
| Fortinet Incorporated † | | | | 166,006 | $ 8,688,754 |
| Microsoft Corporation | | | | 78,839 | 19,537,093 |
| Oracle Corporation | | | | 90,677 | 8,021,287 |
| | | | | | 41,508,554 |
| Technology hardware, storage & peripherals: 4.76% | | | | | |
| Apple Incorporated | | | | 139,662 | 20,151,830 |
| Materials: 5.45% | | | | | |
| Chemicals: 1.55% | | | | | |
| CF Industries Holdings Incorporated | | | | 77,343 | 6,550,952 |
| Metals & mining: 3.90% | | | | | |
| Nucor Corporation | | | | 51,957 | 8,781,772 |
| Reliance Steel & Aluminum Company | | | | 34,134 | 7,763,778 |
| | | | | | 16,545,550 |
| Real estate: 4.27% | | | | | |
| Equity REITs: 4.27% | | | | | |
| Simon Property Group Incorporated | | | | 77,655 | 9,975,561 |
| Weyerhaeuser Company | | | | 236,045 | 8,127,029 |
| | | | | | 18,102,590 |
| Total Common stocks (Cost $306,014,837) | | | | | 420,504,577 |
| | | Yield | | | |
| Short-term investments: 0.72% | | | | | |
| Investment companies: 0.72% | | | | | |
| Allspring Government Money Market Fund Select Class ♠∞ | | 4.16% | | 3,042,579 | 3,042,579 |
| Total Short-term investments (Cost $3,042,579) | | | | | 3,042,579 |
| Total investments in securities (Cost $309,057,416) | 99.95% | | | | 423,547,156 |
| Other assets and liabilities, net | 0.05 | | | | 207,833 |
| Total net assets | 100.00% | | | | $423,754,989 |
| † | Non-income-earning security |
| ♠ | The issuer of the security is an affiliated person of the Fund as defined in the Investment Company Act of 1940. |
| ∞ | The rate represents the 7-day annualized yield at period end. |
| Abbreviations: |
| REIT | Real estate investment trust |
The accompanying notes are an integral part of these financial statements.
Allspring Large Cap Core Fund | 11
Portfolio of investments—January 31, 2023 (unaudited)
Investments in affiliates
An affiliated investment is an investment in which the Fund owns at least 5% of the outstanding voting shares of the issuer or as a result of other relationships, such as the Fund and the issuer having the same investment manager. Transactions with issuers that were affiliates of the Fund at the end of the period were as follows:
| | Value,
beginning of
period | Purchases | Sales
proceeds | Net
realized
gains
(losses) | Net
change in
unrealized
gains
(losses) | Value,
end of
period | Shares,
end
of period | Income
from
affiliated
securities |
| Short-term investments | | | | | | | |
| Allspring Government Money Market Fund Select Class | $4,015,223 | $37,074,563 | $(38,047,207) | $0 | $0 | $3,042,579 | 3,042,579 | $53,610 |
The accompanying notes are an integral part of these financial statements.
12 | Allspring Large Cap Core Fund
Statement of assets and liabilities—January 31, 2023 (unaudited)
| | |
| Assets | |
Investments in unaffiliated securities, at value (cost $306,014,837)
| $ 420,504,577 |
Investments in affiliated securities, at value (cost $3,042,579)
| 3,042,579 |
Cash
| 395 |
Receivable for dividends
| 470,914 |
Receivable for Fund shares sold
| 438,068 |
Prepaid expenses and other assets
| 77,952 |
Total assets
| 424,534,485 |
| Liabilities | |
Payable for Fund shares redeemed
| 341,359 |
Management fee payable
| 188,493 |
Shareholder servicing fees payable
| 69,379 |
Administration fees payable
| 67,265 |
Distribution fees payable
| 8,568 |
Trustees’ fees and expenses payable
| 4,198 |
Accrued expenses and other liabilities
| 100,234 |
Total liabilities
| 779,496 |
Total net assets
| $423,754,989 |
| Net assets consist of | |
Paid-in capital
| $ 299,625,960 |
Total distributable earnings
| 124,129,029 |
Total net assets
| $423,754,989 |
| Computation of net asset value and offering price per share | |
Net assets – Class A
| $ 322,115,678 |
Shares outstanding – Class A1
| 22,222,180 |
Net asset value per share – Class A
| $14.50 |
Maximum offering price per share – Class A2
| $15.38 |
Net assets – Class C
| $ 13,328,775 |
Shares outstanding – Class C1
| 945,398 |
Net asset value per share – Class C
| $14.10 |
Net assets – Class R
| $ 198,262 |
Shares outstanding – Class R1
| 13,462 |
Net asset value per share – Class R
| $14.73 |
Net assets – Class R6
| $ 2,783,899 |
Shares outstanding – Class R61
| 190,651 |
Net asset value per share – Class R6
| $14.60 |
Net assets – Administrator Class
| $ 1,577,347 |
Shares outstanding – Administrator Class1
| 106,140 |
Net asset value per share – Administrator Class
| $14.86 |
Net assets – Institutional Class
| $ 83,751,028 |
Shares outstanding – Institutional Class1
| 5,728,339 |
Net asset value per share – Institutional Class
| $14.62 |
| 1 | The Fund has an unlimited number of authorized shares. |
| 2 | Maximum offering price is computed as 100/94.25 of net asset value. On investments of $50,000 or more, the offering price is reduced. |
The accompanying notes are an integral part of these financial statements.
Allspring Large Cap Core Fund | 13
Statement of operations—six months ended January 31, 2023 (unaudited)
| | |
| Investment income | |
Dividends
| $ 3,922,907 |
Income from affiliated securities
| 53,610 |
Total investment income
| 3,976,517 |
| Expenses | |
Management fee
| 1,512,616 |
| Administration fees | |
Class A
| 333,821 |
Class C
| 16,705 |
Class R
| 194 |
Class R6
| 597 |
Administrator Class
| 992 |
Institutional Class
| 60,223 |
| Shareholder servicing fees | |
Class A
| 397,406 |
Class C
| 19,815 |
Class R
| 231 |
Administrator Class
| 1,879 |
| Distribution fees | |
Class C
| 59,442 |
Class R
| 200 |
Custody and accounting fees
| 15,416 |
Professional fees
| 27,140 |
Registration fees
| 38,000 |
Shareholder report expenses
| 25,865 |
Trustees’ fees and expenses
| 11,026 |
Other fees and expenses
| 6,957 |
Total expenses
| 2,528,525 |
| Less: Fee waivers and/or expense reimbursements | |
Fund-level
| (281,574) |
Class A
| (12,639) |
Class R6
| (140) |
Administrator Class
| (264) |
Institutional Class
| (39,710) |
Net expenses
| 2,194,198 |
Net investment income
| 1,782,319 |
| Realized and unrealized gains (losses) on investments | |
Net realized gains on investments
| 16,463,601 |
Net change in unrealized gains (losses) on investments
| (9,232,620) |
Net realized and unrealized gains (losses) on investments
| 7,230,981 |
Net increase in net assets resulting from operations
| $ 9,013,300 |
The accompanying notes are an integral part of these financial statements.
14 | Allspring Large Cap Core Fund
Statement of changes in net assets
| | | | | |
| | Six months ended
January 31, 2023
(unaudited) | Year ended
July 31, 2022 |
| Operations | | | | |
Net investment income
| | $ 1,782,319 | | $ 2,977,683 |
Net realized gains on investments
| | 16,463,601 | | 51,089,392 |
Net change in unrealized gains (losses) on investments
| | (9,232,620) | | (71,803,083) |
Net increase (decrease) in net assets resulting from operations
| | 9,013,300 | | (17,736,008) |
| Distributions to shareholders from | | | | |
| Net investment income and net realized gains | | | | |
Class A
| | (33,915,521) | | (47,154,331) |
Class C
| | (1,532,255) | | (3,108,743) |
Class R
| | (18,398) | | (22,264) |
Class R6
| | (479,983) | | (746,242) |
Administrator Class
| | (166,658) | | (378,532) |
Institutional Class
| | (9,427,220) | | (17,341,089) |
Total distributions to shareholders
| | (45,540,035) | | (68,751,201) |
| Capital share transactions | Shares | | Shares | |
| Proceeds from shares sold | | | | |
Class A
| 519,754 | 7,582,972 | 1,097,088 | 19,147,813 |
Class C
| 46,075 | 631,426 | 29,275 | 502,832 |
Class R
| 3,870 | 60,810 | 2,207 | 40,355 |
Class R6
| 45,331 | 720,429 | 15,663 | 266,817 |
Administrator Class
| 14,368 | 208,782 | 59,959 | 1,204,301 |
Institutional Class
| 450,118 | 6,514,077 | 1,676,327 | 29,645,655 |
| | | 15,718,496 | | 50,807,773 |
| Reinvestment of distributions | | | | |
Class A
| 2,282,716 | 32,296,341 | 2,550,202 | 44,759,070 |
Class C
| 110,947 | 1,517,749 | 179,061 | 3,060,161 |
Class R
| 1,288 | 18,398 | 1,260 | 22,264 |
Class R6
| 7,651 | 109,454 | 9,372 | 166,069 |
Administrator Class
| 11,421 | 165,760 | 20,990 | 377,210 |
Institutional Class
| 638,501 | 9,137,834 | 894,254 | 15,863,211 |
| | | 43,245,536 | | 64,247,985 |
| Payment for shares redeemed | | | | |
Class A
| (1,439,250) | (21,341,808) | (2,328,633) | (40,154,334) |
Class C
| (385,767) | (5,508,418) | (574,944) | (10,038,659) |
Class R
| (605) | (9,763) | (24,131) | (477,364) |
Class R6
| (146,027) | (2,140,908) | (54,832) | (979,083) |
Administrator Class
| (13,848) | (203,655) | (118,858) | (2,102,057) |
Institutional Class
| (2,035,892) | (31,193,363) | (2,878,046) | (49,352,502) |
| | | (60,397,915) | | (103,103,999) |
Net increase (decrease) in net assets resulting from capital share transactions
| | (1,433,883) | | 11,951,759 |
Total decrease in net assets
| | (37,960,618) | | (74,535,450) |
| Net assets | | | | |
Beginning of period
| | 461,715,607 | | 536,251,057 |
End of period
| | $423,754,989 | | $ 461,715,607 |
The accompanying notes are an integral part of these financial statements.
Allspring Large Cap Core Fund | 15
Financial highlights
(For a share outstanding throughout each period)
| | | Year ended July 31 |
| Class A | Six months ended
January 31, 2023
(unaudited) | 2022 | 2021 | 2020 | 2019 | 2018 |
Net asset value, beginning of period
| $15.85 | $18.77 | $15.71 | $18.57 | $20.82 | $18.01 |
Net investment income
| 0.06 | 0.09 | 0.08 1 | 0.14 | 0.25 | 0.15 |
Net realized and unrealized gains (losses) on investments
| 0.26 | (0.55) | 5.33 | 0.51 | (0.29) | 3.01 |
Total from investment operations
| 0.32 | (0.46) | 5.41 | 0.65 | (0.04) | 3.16 |
| Distributions to shareholders from | | | | | | |
Net investment income
| (0.12) | (0.04) | (0.15) | (0.29) | (0.16) | (0.13) |
Net realized gains
| (1.55) | (2.42) | (2.20) | (3.22) | (2.05) | (0.22) |
Total distributions to shareholders
| (1.67) | (2.46) | (2.35) | (3.51) | (2.21) | (0.35) |
Net asset value, end of period
| $14.50 | $15.85 | $18.77 | $15.71 | $18.57 | $20.82 |
Total return2
| 2.37% | (3.66)% | 37.90% | 2.86% | 1.10% | 17.66% |
| Ratios to average net assets (annualized) | | | | | | |
Gross expenses
| 1.22% | 1.20% | 1.23% | 1.23% | 1.19% | 1.18% |
Net expenses
| 1.08% | 1.06% | 1.06% | 1.06% | 1.08% | 1.10% |
Net investment income
| 0.76% | 0.52% | 0.49% | 0.97% | 1.42% | 0.73% |
| Supplemental data | | | | | | |
Portfolio turnover rate
| 13% | 31% | 46% | 28% | 45% | 33% |
Net assets, end of period (000s omitted)
| $322,116 | $330,584 | $366,731 | $300,373 | $341,045 | $360,937 |
| 1 | Calculated based upon average shares outstanding |
| 2 | Total return calculations do not include any sales charges. Returns for periods of less than one year are not annualized. |
The accompanying notes are an integral part of these financial statements.
16 | Allspring Large Cap Core Fund
Financial highlights
(For a share outstanding throughout each period)
| | | Year ended July 31 |
| Class C | Six months ended
January 31, 2023
(unaudited) | 2022 | 2021 | 2020 | 2019 | 2018 |
Net asset value, beginning of period
| $15.40 | $18.39 | $15.41 | $18.22 | $20.44 | $17.70 |
Net investment income (loss)
| 0.00 1,2 | (0.05) 1 | (0.04) 1 | 0.03 | 0.13 | (0.00) 3 |
Net realized and unrealized gains (losses) on investments
| 0.25 | (0.52) | 5.23 | 0.47 | (0.30) | 2.96 |
Total from investment operations
| 0.25 | (0.57) | 5.19 | 0.50 | (0.17) | 2.96 |
| Distributions to shareholders from | | | | | | |
Net investment income
| 0.00 | 0.00 | (0.01) | (0.09) | 0.00 | 0.00 |
Net realized gains
| (1.55) | (2.42) | (2.20) | (3.22) | (2.05) | (0.22) |
Total distributions to shareholders
| (1.55) | (2.42) | (2.21) | (3.31) | (2.05) | (0.22) |
Net asset value, end of period
| $14.10 | $15.40 | $18.39 | $15.41 | $18.22 | $20.44 |
Total return4
| 1.96% | (4.39)% | 36.87% | 2.01% | 0.34% | 16.78% |
| Ratios to average net assets (annualized) | | | | | | |
Gross expenses
| 1.96% | 1.94% | 1.98% | 1.97% | 1.94% | 1.93% |
Net expenses
| 1.83% | 1.83% | 1.83% | 1.83% | 1.83% | 1.85% |
Net investment income (loss)
| 0.01% | (0.27)% | (0.25)% | 0.21% | 0.67% | (0.02)% |
| Supplemental data | | | | | | |
Portfolio turnover rate
| 13% | 31% | 46% | 28% | 45% | 33% |
Net assets, end of period (000s omitted)
| $13,329 | $18,081 | $28,335 | $33,405 | $47,649 | $61,529 |
| 1 | Calculated based upon average shares outstanding |
| 2 | Amount is less than $0.005. |
| 3 | Amount is more than $(0.005) |
| 4 | Total return calculations do not include any sales charges. Returns for periods of less than one year are not annualized. |
The accompanying notes are an integral part of these financial statements.
Allspring Large Cap Core Fund | 17
Financial highlights
(For a share outstanding throughout each period)
| | | Year ended July 31 |
| Class R | Six months ended
January 31, 2023
(unaudited) | 2022 | 2021 | 2020 | 2019 | 2018 |
Net asset value, beginning of period
| $15.98 | $18.89 | $15.70 | $18.57 | $20.81 | $18.04 |
Net investment income
| 0.04 1 | 0.03 1 | 0.04 1 | 0.11 1 | 0.21 | 0.12 |
Net realized and unrealized gains (losses) on investments
| 0.26 | (0.52) | 5.35 | 0.49 | (0.29) | 2.99 |
Total from investment operations
| 0.30 | (0.49) | 5.39 | 0.60 | (0.08) | 3.11 |
| Distributions to shareholders from | | | | | | |
Net investment income
| 0.00 | 0.00 | (0.00) 2 | (0.25) | (0.11) | (0.12) |
Net realized gains
| (1.55) | (2.42) | (2.20) | (3.22) | (2.05) | (0.22) |
Total distributions to shareholders
| (1.55) | (2.42) | (2.20) | (3.47) | (2.16) | (0.34) |
Net asset value, end of period
| $14.73 | $15.98 | $18.89 | $15.70 | $18.57 | $20.81 |
Total return3
| 2.21% | (3.81)% | 37.56% | 2.56% | 0.87% | 17.37% |
| Ratios to average net assets (annualized) | | | | | | |
Gross expenses
| 1.43% | 1.40% | 1.47% | 1.47% | 1.44% | 1.43% |
Net expenses
| 1.33% | 1.31% | 1.33% | 1.33% | 1.33% | 1.34% |
Net investment income
| 0.50% | 0.19% | 0.27% | 0.69% | 1.18% | 0.48% |
| Supplemental data | | | | | | |
Portfolio turnover rate
| 13% | 31% | 46% | 28% | 45% | 33% |
Net assets, end of period (000s omitted)
| $198 | $142 | $559 | $910 | $2,043 | $2,042 |
| 1 | Calculated based upon average shares outstanding |
| 2 | Amount is less than $0.005. |
| 3 | Returns for periods of less than one year are not annualized. |
The accompanying notes are an integral part of these financial statements.
18 | Allspring Large Cap Core Fund
Financial highlights
(For a share outstanding throughout each period)
| | | Year ended July 31 |
| Class R6 | Six months ended
January 31, 2023
(unaudited) | 2022 | 2021 | 2020 | 2019 | 2018 |
Net asset value, beginning of period
| $15.99 | $18.91 | $15.81 | $18.68 | $20.92 | $18.09 |
Net investment income
| 0.10 | 0.17 | 0.16 | 0.24 1 | 0.34 | 0.22 1 |
Net realized and unrealized gains (losses) on investments
| 0.24 | (0.55) | 5.36 | 0.48 | (0.30) | 3.04 |
Total from investment operations
| 0.34 | (0.38) | 5.52 | 0.72 | 0.04 | 3.26 |
| Distributions to shareholders from | | | | | | |
Net investment income
| (0.18) | (0.12) | (0.22) | (0.37) | (0.23) | (0.21) |
Net realized gains
| (1.55) | (2.42) | (2.20) | (3.22) | (2.05) | (0.22) |
Total distributions to shareholders
| (1.73) | (2.54) | (2.42) | (3.59) | (2.28) | (0.43) |
Net asset value, end of period
| $14.60 | $15.99 | $18.91 | $15.81 | $18.68 | $20.92 |
Total return2
| 2.52% | (3.25)% | 38.47% | 3.23% | 1.60% | 18.16% |
| Ratios to average net assets (annualized) | | | | | | |
Gross expenses
| 0.79% | 0.77% | 0.80% | 0.79% | 0.75% | 0.75% |
Net expenses
| 0.65% | 0.65% | 0.65% | 0.65% | 0.65% | 0.65% |
Net investment income
| 1.23% | 0.92% | 0.92% | 1.40% | 1.83% | 1.08% |
| Supplemental data | | | | | | |
Portfolio turnover rate
| 13% | 31% | 46% | 28% | 45% | 33% |
Net assets, end of period (000s omitted)
| $2,784 | $4,535 | $5,928 | $6,570 | $13,223 | $15,225 |
| 1 | Calculated based upon average shares outstanding |
| 2 | Returns for periods of less than one year are not annualized. |
The accompanying notes are an integral part of these financial statements.
Allspring Large Cap Core Fund | 19
Financial highlights
(For a share outstanding throughout each period)
| | | Year ended July 31 |
| Administrator Class | Six months ended
January 31, 2023
(unaudited) | 2022 | 2021 | 2020 | 2019 | 2018 |
Net asset value, beginning of period
| $16.22 | $19.16 | $15.96 | $18.82 | $21.05 | $18.21 |
Net investment income
| 0.07 1 | 0.10 1 | 0.10 1 | 0.18 1 | 0.29 1 | 0.17 1 |
Net realized and unrealized gains (losses) on investments
| 0.26 | (0.55) | 5.43 | 0.49 | (0.30) | 3.05 |
Total from investment operations
| 0.33 | (0.45) | 5.53 | 0.67 | (0.01) | 3.22 |
| Distributions to shareholders from | | | | | | |
Net investment income
| (0.14) | (0.07) | (0.13) | (0.31) | (0.17) | (0.16) |
Net realized gains
| (1.55) | (2.42) | (2.20) | (3.22) | (2.05) | (0.22) |
Total distributions to shareholders
| (1.69) | (2.49) | (2.33) | (3.53) | (2.22) | (0.38) |
Net asset value, end of period
| $14.86 | $16.22 | $19.16 | $15.96 | $18.82 | $21.05 |
Total return2
| 2.39% | (3.57)% | 38.04% | 2.90% | 1.26% | 17.81% |
| Ratios to average net assets (annualized) | | | | | | |
Gross expenses
| 1.13% | 1.11% | 1.15% | 1.13% | 1.10% | 1.10% |
Net expenses
| 0.97% | 0.97% | 0.97% | 0.97% | 0.97% | 0.98% |
Net investment income
| 0.86% | 0.56% | 0.58% | 1.04% | 1.52% | 0.86% |
| Supplemental data | | | | | | |
Portfolio turnover rate
| 13% | 31% | 46% | 28% | 45% | 33% |
Net assets, end of period (000s omitted)
| $1,577 | $1,528 | $2,531 | $2,241 | $16,566 | $25,444 |
| 1 | Calculated based upon average shares outstanding |
| 2 | Returns for periods of less than one year are not annualized. |
The accompanying notes are an integral part of these financial statements.
20 | Allspring Large Cap Core Fund
Financial highlights
(For a share outstanding throughout each period)
| | | Year ended July 31 |
| Institutional Class | Six months ended
January 31, 2023
(unaudited) | 2022 | 2021 | 2020 | 2019 | 2018 |
Net asset value, beginning of period
| $16.01 | $18.93 | $15.83 | $18.70 | $20.95 | $18.12 |
Net investment income
| 0.09 1 | 0.16 | 0.19 | 0.24 1 | 0.34 | 0.23 |
Net realized and unrealized gains (losses) on investments
| 0.25 | (0.55) | 5.33 | 0.48 | (0.30) | 3.03 |
Total from investment operations
| 0.34 | (0.39) | 5.52 | 0.72 | 0.04 | 3.26 |
| Distributions to shareholders from | | | | | | |
Net investment income
| (0.18) | (0.11) | (0.22) | (0.37) | (0.24) | (0.21) |
Net realized gains
| (1.55) | (2.42) | (2.20) | (3.22) | (2.05) | (0.22) |
Total distributions to shareholders
| (1.73) | (2.53) | (2.42) | (3.59) | (2.29) | (0.43) |
Net asset value, end of period
| $14.62 | $16.01 | $18.93 | $15.83 | $18.70 | $20.95 |
Total return2
| 2.52% | (3.27)% | 38.42% | 3.22% | 1.56% | 18.16% |
| Ratios to average net assets (annualized) | | | | | | |
Gross expenses
| 0.89% | 0.87% | 0.90% | 0.89% | 0.86% | 0.85% |
Net expenses
| 0.67% | 0.67% | 0.67% | 0.67% | 0.67% | 0.68% |
Net investment income
| 1.18% | 0.91% | 0.90% | 1.40% | 1.82% | 1.15% |
| Supplemental data | | | | | | |
Portfolio turnover rate
| 13% | 31% | 46% | 28% | 45% | 33% |
Net assets, end of period (000s omitted)
| $83,751 | $106,846 | $132,167 | $145,425 | $600,595 | $690,855 |
| 1 | Calculated based upon average shares outstanding |
| 2 | Returns for periods of less than one year are not annualized. |
The accompanying notes are an integral part of these financial statements.
Allspring Large Cap Core Fund | 21
Notes to financial statements (unaudited)
1. ORGANIZATION
Allspring Funds Trust (the "Trust"), a Delaware statutory trust organized on March 10, 1999, is an open-end management investment company registered under the Investment Company Act of 1940, as amended (the "1940 Act"). As an investment company, the Trust follows the accounting and reporting guidance in Financial Accounting Standards Board ("FASB") Accounting Standards Codification Topic 946, Financial Services – Investment Companies. These financial statements report on the Allspring Large Cap Core Fund (the "Fund") which is a diversified series of the Trust.
2. SIGNIFICANT ACCOUNTING POLICIES
The following significant accounting policies, which are consistently followed in the preparation of the financial statements of the Fund, are in conformity with U.S. generally accepted accounting principles which require management to make estimates and assumptions that affect the reported amounts of assets and liabilities, disclosure of contingent assets and liabilities at the date of the financial statements, and the reported amounts of income and expenses during the reporting period. Actual results could differ from those estimates.
Securities valuation
All investments are valued each business day as of the close of regular trading on the New York Stock Exchange (generally 4 p.m. Eastern Time), although the Fund may deviate from this calculation time under unusual or unexpected circumstances.
Equity securities that are listed on a foreign or domestic exchange or market are valued at the official closing price or, if none, the last sales price.
Investments in registered open-end investment companies (other than those listed on a foreign or domestic exchange or market) are valued at net asset value. Interests in non-registered investment companies that are redeemable at net asset value are fair valued normally at net asset value.
Investments which are not valued using the methods discussed above are valued at their fair value, as determined in good faith by Allspring Funds Management, LLC ("Allspring Funds Management"), which was named the valuation designee by the Board of Trustees. As the valuation designee, Allspring Funds Management is responsible for day-to-day valuation activities for the Allspring Funds. In connection with these responsibilities, Allspring Funds Management has established a Valuation Committee and has delegated to it the authority to take any actions regarding the valuation of portfolio securities that the Valuation Committee deems necessary or appropriate, including determining the fair value of portfolio securities. On a quarterly basis, the Board of Trustees receives reports of valuation actions taken by the Valuation Committee. On at least an annual basis, the Board of Trustees receives an assessment of the adequacy and effectiveness of Allspring Funds Management's process for determining the fair value of the portfolio of investments.
Securities lending
The Fund may lend its securities from time to time in order to earn additional income in the form of fees or interest on securities received as collateral or the investment of any cash received as collateral. When securities are on loan, the Fund receives interest or dividends on those securities. Cash collateral received in connection with its securities lending transactions is invested in Securities Lending Cash Investments, LLC (the "Securities Lending Fund"), an affiliated non-registered investment company. Investments in Securities Lending Fund are valued at the evaluated bid price provided by an independent pricing service. Income earned from investment in the Securities Lending Fund (net of fees and rebates), if any, is included in income from affiliated securities on the Statement of Operations.
In a securities lending transaction, the net asset value of the Fund is affected by an increase or decrease in the value of the securities loaned and by an increase or decrease in the value of the instrument in which collateral is invested. The amount of securities lending activity undertaken by the Fund fluctuates from time to time. The Fund has the right under the lending agreement to recover the securities from the borrower on demand. In the event of default or bankruptcy by the borrower, the Fund may be prevented from recovering the loaned securities or gaining access to the collateral or may experience delays or costs in doing so. In such an event, the terms of the agreement allow the unaffiliated securities lending agent to use the collateral to purchase replacement securities on behalf of the Fund or pay the Fund the market value of the loaned securities. The Fund bears the risk of loss with respect to depreciation of its investment of the cash collateral.
Security transactions and income recognition
Securities transactions are recorded on a trade date basis. Realized gains or losses are recorded on the basis of identified cost.
Dividend income is recognized on the ex-dividend date.
22 | Allspring Large Cap Core Fund
Notes to financial statements (unaudited)
Distributions to shareholders
Distributions to shareholders from net investment income and any net realized gains are recorded on the ex-dividend date and paid at least annually. Such distributions are determined in accordance with income tax regulations and may differ from U.S. generally accepted accounting principles. Dividend sources are estimated at the time of declaration. The tax character of distributions is determined as of the Fund's fiscal year end. Therefore, a portion of the Fund's distributions made prior to the Fund’s fiscal year end may be categorized as a tax return of capital at year end.
Federal and other taxes
The Fund intends to continue to qualify as a regulated investment company by distributing substantially all of its investment company taxable income and any net realized capital gains (after reduction for capital loss carryforwards) sufficient to relieve it from all, or substantially all, federal income taxes. Accordingly, no provision for federal income taxes was required.
The Fund’s income and federal excise tax returns and all financial records supporting those returns for the prior three fiscal years are subject to examination by the federal and Delaware revenue authorities. Management has analyzed the Fund's tax positions taken on federal, state, and foreign tax returns, as applicable, for all open tax years and does not believe that there are any uncertain tax positions that require recognition of a tax liability.
As of January 31, 2023, the aggregate cost of all investments for federal income tax purposes was $309,095,162 and the unrealized gains (losses) consisted of:
| Gross unrealized gains | $131,830,759 |
| Gross unrealized losses | (17,378,765) |
| Net unrealized gains | $114,451,994 |
Class allocations
The separate classes of shares offered by the Fund differ principally in applicable sales charges, distribution, shareholder servicing, and administration fees. Class specific expenses are charged directly to that share class. Investment income, common fund-level expenses, and realized and unrealized gains (losses) on investments are allocated daily to each class of shares based on the relative proportion of net assets of each class.
3. FAIR VALUATION MEASUREMENTS
Fair value measurements of investments are determined within a framework that has established a fair value hierarchy based upon the various data inputs utilized in determining the value of the Fund’s investments. The three-level hierarchy gives the highest priority to unadjusted quoted prices in active markets for identical assets or liabilities (Level 1) and the lowest priority to unobservable inputs (Level 3). The Fund’s investments are classified within the fair value hierarchy based on the lowest level of input that is significant to the fair value measurement. The inputs are summarized into three broad levels as follows:
| ■ | Level 1 – quoted prices in active markets for identical securities |
| ■ | Level 2 – other significant observable inputs (including quoted prices for similar securities, interest rates, prepayment speeds, credit risk, etc.) |
| ■ | Level 3 – significant unobservable inputs (including the Fund’s own assumptions in determining the fair value of investments) |
The inputs or methodologies used for valuing investments in securities are not necessarily an indication of the risk associated with investing in those securities.
Allspring Large Cap Core Fund | 23
Notes to financial statements (unaudited)
The following is a summary of the inputs used in valuing the Fund’s assets and liabilities as of January 31, 2023:
| | Quoted prices
(Level 1) | Other significant
observable inputs
(Level 2) | Significant
unobservable inputs
(Level 3) | Total |
| Assets | | | | |
| Investments in: | | | | |
| Common stocks | | | | |
| Communication services | $ 19,547,603 | $0 | $0 | $ 19,547,603 |
| Consumer discretionary | 36,722,567 | 0 | 0 | 36,722,567 |
| Consumer staples | 17,719,069 | 0 | 0 | 17,719,069 |
| Energy | 33,842,549 | 0 | 0 | 33,842,549 |
| Financials | 42,839,352 | 0 | 0 | 42,839,352 |
| Health care | 66,676,022 | 0 | 0 | 66,676,022 |
| Industrials | 43,359,321 | 0 | 0 | 43,359,321 |
| Information technology | 118,599,002 | 0 | 0 | 118,599,002 |
| Materials | 23,096,502 | 0 | 0 | 23,096,502 |
| Real estate | 18,102,590 | 0 | 0 | 18,102,590 |
| Short-term investments | | | | |
| Investment companies | 3,042,579 | 0 | 0 | 3,042,579 |
| Total assets | $423,547,156 | $0 | $0 | $423,547,156 |
Additional sector, industry or geographic detail, if any, is included in the Portfolio of Investments.
For the six months ended January 31, 2023, the Fund did not have any transfers into/out of Level 3.
4. TRANSACTIONS WITH AFFILIATES
Management fee
Allspring Funds Management, a wholly owned subsidiary of Allspring Global Investments Holdings, LLC, a holding company indirectly owned by certain private funds of GTCR LLC and Reverence Capital Partners, L.P., is the manager of the Fund and provides advisory and fund-level administrative services under an investment management agreement. Under the investment management agreement, Allspring Funds Management is responsible for, among other services, implementing the investment objectives and strategies of the Fund, supervising the subadviser and providing fund-level administrative services in connection with the Fund’s operations. As compensation for its services under the investment management agreement, Allspring Funds Management is entitled to receive a management fee at the following annual rate based on the Fund’s average daily net assets:
| Average daily net assets | Management fee |
| First $500 million | 0.700% |
| Next $500 million | 0.675 |
| Next $1 billion | 0.650 |
| Next $2 billion | 0.625 |
| Next $1 billion | 0.600 |
| Next $3 billion | 0.590 |
| Next $2 billion | 0.565 |
| Next $2 billion | 0.555 |
| Next $4 billion | 0.530 |
| Over $16 billion | 0.505 |
For the six months ended January 31, 2023, the management fee was equivalent to an annual rate of 0.70% of the Fund’s average daily net assets.
24 | Allspring Large Cap Core Fund
Notes to financial statements (unaudited)
Allspring Funds Management has retained the services of a subadviser to provide daily portfolio management to the Fund. The fee for subadvisory services is borne by Allspring Funds Management. Allspring Global Investments, LLC ("Allspring Investments"), an affiliate of Allspring Funds Management and a wholly owned subsidiary of Allspring Global Investments Holdings, LLC, is the subadviser to the Fund and is entitled to receive a fee from Allspring Funds Management at an annual rate starting at 0.35% and declining to 0.30% as the average daily net assets of the Fund increase.
Administration fees
Under a class-level administration agreement, Allspring Funds Management provides class-level administrative services to the Fund, which includes paying fees and expenses for services provided by the transfer agent, sub-transfer agents, omnibus account servicers and record-keepers. As compensation for its services under the class-level administration agreement, Allspring Funds Management receives an annual fee which is calculated based on the average daily net assets of each class as follows:
| | Class-level
administration fee |
| Class A | 0.21% |
| Class C | 0.21 |
| Class R | 0.21 |
| Class R6 | 0.03 |
| Administrator Class | 0.13 |
| Institutional Class | 0.13 |
Waivers and/or expense reimbursements
Allspring Funds Management has contractually committed to waive and/or reimburse management and administration fees to the extent necessary to maintain certain net operating expense ratios for the Fund. When each class of the Fund has exceeded its expense cap, Allspring Funds Management will waive fees and/or reimburse expenses from fund-level expenses on a proportionate basis and then from class specific expenses. When only certain classes exceed their expense caps, waivers and/or reimbursements are applied against class specific expenses before fund-level expenses. Allspring Funds Management has contractually committed through November 30, 2023 to waive fees and/or reimburse expenses to the extent necessary to cap expenses. Prior to or after the commitment expiration date, the caps may be increased or the commitment to maintain the caps may be terminated only with the approval of the Board of Trustees. As of January 31, 2023, the contractual expense caps are as follows:
| | Expense ratio caps |
| Class A | 1.08% |
| Class C | 1.83 |
| Class R | 1.33 |
| Class R6 | 0.65 |
| Administrator Class | 0.97 |
| Institutional Class | 0.67 |
Distribution fees
The Trust has adopted a distribution plan for Class C and Class R shares pursuant to Rule 12b-1 under the 1940 Act. Distribution fees are charged to Class C and Class R shares and paid to Allspring Funds Distributor, LLC ("Allspring Funds Distributor"), the principal underwriter, an affiliate of Allspring Funds Management, at an annual rate up to 0.75% of the average daily net assets of Class C shares and up to 0.25% of the average daily net assets of Class R shares.
In addition, Allspring Funds Distributor is entitled to receive the front-end sales charge from the purchase of Class A shares and a contingent deferred sales charge on the redemption of certain Class A shares. Allspring Funds Distributor is also entitled to receive the contingent deferred sales charges from redemptions of Class C shares. For the six months ended January 31, 2023, Allspring Funds Distributor received $981 from the sale of Class A shares. No contingent deferred sales charges were incurred by Class A and Class C shares for the six months ended January 31, 2023.
Allspring Large Cap Core Fund | 25
Notes to financial statements (unaudited)
Shareholder servicing fees
The Trust has entered into contracts with one or more shareholder servicing agents, whereby Class A, Class C, Class R, and Administrator Class are charged a fee at an annual rate up to 0.25% of the average daily net assets of each respective class. A portion of these total shareholder servicing fees were paid to affiliates of the Fund.
Interfund transactions
The Fund may purchase or sell portfolio investment securities to certain affiliates pursuant to Rule 17a-7 under the 1940 Act and under procedures adopted by the Board of Trustees. The procedures have been designed to ensure that these interfund transactions, which do not incur broker commissions, are effected at current market prices.
5. INVESTMENT PORTFOLIO TRANSACTIONS
Purchases and sales of investments, excluding U.S. government obligations (if any) and short-term securities, for the six months ended January 31, 2023 were $56,338,637 and $101,150,530, respectively.
6. SECURITIES LENDING TRANSACTIONS
The Fund lends its securities through an unaffiliated securities lending agent and receives collateral in the form of cash or securities with a value at least equal to the value of the securities on loan. The value of the loaned securities is determined at the close of each business day and any increases or decreases in the required collateral are exchanged between the Fund and the counterparty on the next business day. Cash collateral received is invested in the Securities Lending Fund which seeks to provide a positive return compared to the daily Federal Funds Open Rate by investing in high-quality, U.S. dollar-denominated short-term money market instruments and is exempt from registration under Section 3(c)(7) of the 1940 Act. Securities Lending Fund is managed by Allspring Funds Management and is subadvised by Allspring Investments. Allspring Funds Management receives an advisory fee starting at 0.05% and declining to 0.01% as the average daily net assets of the Securities Lending Fund increase. All of the fees received by Allspring Funds Management are paid to Allspring Investments for its services as subadviser.
In the event of counterparty default or the failure of a borrower to return a loaned security, the Fund has the right to use the collateral to offset any losses incurred. As of January 31, 2023, the Fund did not have any securities on loan.
7. BANK BORROWINGS
The Trust (excluding the money market funds), Allspring Master Trust and Allspring Variable Trust are parties to a $350,000,000 revolving credit agreement whereby the Fund is permitted to use bank borrowings for temporary or emergency purposes, such as to fund shareholder redemption requests. Interest under the credit agreement is charged to the Fund based on a borrowing rate equal to the higher of the Federal Funds rate or the overnight bank funding rate in effect on that day plus a spread. In addition, an annual commitment fee equal based on the unused balance is allocated to each participating fund.
For the six months ended January 31, 2023, there were no borrowings by the Fund under the agreement.
8. CONCENTRATION RISKS
As of the end of the period, the Fund concentrated its portfolio of investments in the information technology sector. A fund that invests a substantial portion of its assets in any sector may be more affected by changes in that sector than would be a fund whose investments are not heavily weighted in any sector.
9. MARKET RISKS
On March 11, 2020, the World Health Organization announced that it had made the assessment that coronavirus disease 2019 (“COVID-19”) is a pandemic. The impacts of COVID-19 are affecting the entire global economy, individual companies and investment products, the funds, and the market in general. There is significant uncertainty around the extent and duration of business disruptions related to COVID-19 and the impacts may last for an extended period of time. COVID-19 has led to significant uncertainty and volatility in the financial markets.
10. INDEMNIFICATION
Under the Fund's organizational documents, the officers and Trustees have been granted certain indemnification rights against certain liabilities that may arise out of performance of their duties to the Fund. The Fund has entered into a separate agreement with each Trustee that converts indemnification rights currently existing under the Fund’s organizational documents into contractual rights that cannot be changed in the future without the consent of the Trustee. Additionally, in the normal course of business, the Fund may enter into contracts with service providers that contain a variety of indemnification
26 | Allspring Large Cap Core Fund
Notes to financial statements (unaudited)
clauses. The Fund’s maximum exposure under these arrangements is dependent on future claims that may be made against the Fund and, therefore, cannot be estimated.
Allspring Large Cap Core Fund | 27
Other information (unaudited)
PROXY VOTING INFORMATION
A description of the policies and procedures used to determine how to vote proxies relating to portfolio securities is available without charge, upon request, by calling 1-800-222-8222, visiting our website at allspringglobal.com, or visiting the SEC website at sec.gov. Information regarding how the proxies related to portfolio securities were voted during the most recent 12-month period ended June 30 is available on the website at allspringglobal.com or by visiting the SEC website at sec.gov.
QUARTERLY PORTFOLIO HOLDINGS INFORMATION
The Fund files its complete schedule of portfolio holdings with the SEC for the first and third quarters of each fiscal year as an exhibit to its reports on Form N-PORT. Shareholders may view the filed Form N-PORT by visiting the SEC website at sec.gov.
28 | Allspring Large Cap Core Fund
Other information (unaudited)
BOARD OF TRUSTEES AND OFFICERS
Each of the Trustees and Officers listed in the table below acts in identical capacities for each fund in the Allspring family of funds, which consists of 127 mutual funds comprising the Allspring Funds Trust, Allspring Variable Trust, Allspring Master Trust and four closed-end funds (collectively the “Fund Complex”). This table should be read in conjunction with the Prospectus and the Statement of Additional Information1. The mailing address of each Trustee and Officer is 1415 Vantage Park Drive, 3rd Floor, Charlotte, NC 28203. Each Trustee and Officer serves an indefinite term, however, each Trustee serves such term until reaching the mandatory retirement age established by the Trustees.
Independent Trustees
Name and
year of birth | Position held and
length of service* | Principal occupations during past five years or longer | Current other
public company or
investment
company
directorships |
William R. Ebsworth
(Born 1957) | Trustee,
since 2015 | Retired. From 1984 to 2013, equities analyst, portfolio manager, research director and chief investment officer at Fidelity Management and Research Company in Boston, Tokyo, and Hong Kong, and retired in 2013 as Chief Investment Officer of Fidelity Strategic Advisers, Inc. where he led a team of investment professionals managing client assets. Prior thereto, Board member of Hong Kong Securities Clearing Co., Hong Kong Options Clearing Corp., the Thailand International Fund, Ltd., Fidelity Investments Life Insurance Company, and Empire Fidelity Investments Life Insurance Company. Audit Committee Chair and Investment Committee Chair of the Vincent Memorial Hospital Foundation (non-profit organization). Mr. Ebsworth is a CFA® charterholder. | N/A |
Jane A. Freeman
(Born 1953) | Trustee,
since 2015;
Chair Liaison,
since 2018 | Retired. From 2012 to 2014 and 1999 to 2008, Chief Financial Officer of Scientific Learning Corporation. From 2008 to 2012, Ms. Freeman provided consulting services related to strategic business projects. Prior to 1999, Portfolio Manager at Rockefeller & Co. and Scudder, Stevens & Clark. Board member of the Harding Loevner Funds from 1996 to 2014, serving as both Lead Independent Director and chair of the Audit Committee. Board member of the Russell Exchange Traded Funds Trust from 2011 to 2012 and the chair of the Audit Committee. Ms. Freeman is also an inactive Chartered Financial Analyst. | N/A |
Isaiah Harris, Jr.
(Born 1952) | Trustee,
since 2009; Audit
Committee
Chair,
since 2019 | Retired. Member of the Advisory Board of CEF of East Central Florida. Chairman of the Board of CIGNA Corporation from 2009 to 2021, and Director from 2005 to 2008. From 2003 to 2011, Director of Deluxe Corporation. Prior thereto, President and CEO of BellSouth Advertising and Publishing Corp. from 2005 to 2007, President and CEO of BellSouth Enterprises from 2004 to 2005 and President of BellSouth Consumer Services from 2000 to 2003. Emeritus member of the Iowa State University Foundation Board of Governors. Emeritus Member of the Advisory Board of Iowa State University School of Business. Advisory Board Member, Palm Harbor Academy (private school). Advisory Board Member, Fellowship of Christian Athletes. Mr. Harris is a certified public accountant (inactive status). | N/A |
David F. Larcker
(Born 1950) | Trustee,
since 2009 | Distinguished Visiting Fellow at the Hoover Institution since 2022. James Irvin Miller Professor of Accounting at the Graduate School of Business (Emeritus), Stanford University, Director of the Corporate Governance Research Initiative and Senior Faculty of The Rock Center for Corporate Governance since 2006. From 2005 to 2008, Professor of Accounting at the Graduate School of Business, Stanford University. Prior thereto, Ernst & Young Professor of Accounting at The Wharton School, University of Pennsylvania from 1985 to 2005. | N/A |
Allspring Large Cap Core Fund | 29
Other information (unaudited)
Name and
year of birth | Position held and
length of service* | Principal occupations during past five years or longer | Current other
public company or
investment
company
directorships |
Olivia S. Mitchell
(Born 1953) | Trustee,
since 2006;
Nominating and
Governance
Committee Chair,
since 2018 | International Foundation of Employee Benefit Plans Professor since 1993, Wharton School of the University of Pennsylvania. Director of Wharton’s Pension Research Council and Boettner Center on Pensions & Retirement Research, and Research Associate at the National Bureau of Economic Research. Previously taught at Cornell University from 1978 to 1993. | N/A |
Timothy J. Penny
(Born 1951) | Trustee,
since 1996;
Chair,
since 2018 | President and Chief Executive Officer of Southern Minnesota Initiative Foundation, a non-profit organization, since 2007. Vice Chair of the Economic Club of Minnesota, since 2007. Co-Chair of the Committee for a Responsible Federal Budget, since 1995. Member of the Board of Trustees of NorthStar Education Finance, Inc., a non-profit organization, from 2007-2022. Senior Fellow of the University of Minnesota Humphrey Institute from 1995 to 2017. | N/A |
James G. Polisson
(Born 1959) | Trustee,
since 2018 | Retired. Chief Marketing Officer, Source (ETF) UK Services, Ltd, from 2015 to 2017. From 2012 to 2015, Principal of The Polisson Group, LLC, a management consulting, corporate advisory and principal investing company. Chief Executive Officer and Managing Director at Russell Investments, Global Exchange Traded Funds from 2010 to 2012. Managing Director of Barclays Global Investors from 1998 to 2010 and Global Chief Marketing Officer for iShares and Barclays Global Investors from 2000 to 2010. Trustee of the San Francisco Mechanics’ Institute, a non-profit organization, from 2013 to 2015. Board member of the Russell Exchange Traded Fund Trust from 2011 to 2012. Director of Barclays Global Investors Holdings Deutschland GmbH from 2006 to 2009. Mr. Polisson is an attorney and has a retired status with the Massachusetts and District of Columbia Bar Associations. | N/A |
Pamela Wheelock
(Born 1959) | Trustee,
since January
2020; previously
Trustee from
January 2018 to
July 2019 | Retired. Executive and Senior Financial leadership positions in the public, private and nonprofit sectors. Interim President and CEO, McKnight Foundation, 2020. Interim Commissioner, Minnesota Department of Human Services, 2019. Chief Operating Officer, Twin Cities Habitat for Humanity, 2017-2019. Vice President for University Services, University of Minnesota, 2012-2016. Interim President and CEO, Blue Cross and Blue Shield of Minnesota, 2011-2012. Executive Vice-President and Chief Financial Officer, Minnesota Wild, 2002-2008. Commissioner, Minnesota Department of Finance, 1999-2002. Chair of the Board of Directors of Destination Medical Center Corporation. Board member of the Minnesota Wild Foundation. | N/A |
* Length of service dates reflect the Trustee’s commencement of service with the Trust’s predecessor entities, where applicable.
30 | Allspring Large Cap Core Fund
Other information (unaudited)
Officers2
Name and
year of birth | Position held and
length of service | Principal occupations during past five years or longer |
Andrew Owen
(Born 1960) | President,
since 2017 | President and Chief Executive Officer of Allspring Funds Management, LLC since 2017 and Head of Global Fund Governance of Allspring Global Investments since 2022. Prior thereto, co-president of Galliard Capital Management, LLC, an affiliate of Allspring Funds Management, LLC, from 2019 to 2022 and Head of Affiliated Managers, Allspring Global Investments, from 2014 to 2019 and Executive Vice President responsible for marketing, investments and product development for Allspring Funds Management, LLC, from 2009 to 2014. |
Jeremy DePalma
(Born 1974) | Treasurer,
since 2012
(for certain funds in
the Fund Complex);
since 2021 (for
the remaining funds in the
Fund Complex) | Senior Vice President of Allspring Funds Management, LLC since 2009. Senior Vice President of Evergreen Investment Management Company, LLC from 2008 to 2010 and head of the Fund Reporting and Control Team within Fund Administration from 2005 to 2010. |
Christopher Baker
(Born 1976) | Chief Compliance Officer, since 2022 | Global Chief Compliance Officer for Allspring Global Investments since 2022. Prior thereto, Chief Compliance Officer for State Street Global Advisors from 2018 to 2021. Senior Compliance Officer for the State Street divisions of Alternative Investment Solutions, Sector Solutions, and Global Marketing from 2015 to 2018. From 2010 to 2015 Vice President, Global Head of Investment and Marketing Compliance for State Street Global Advisors. |
Matthew Prasse
(Born 1983) | Chief Legal Officer, since 2022; Secretary, since 2021 | Senior Counsel of the Allspring Legal Department since 2021. Senior Counsel of the Wells Fargo Legal Department from 2018 to 2021. Previously, Counsel for Barings LLC from 2015 to 2018. Prior to joining Barings, Associate at Morgan, Lewis & Bockius LLP from 2008 to 2015. |
1 The Statement of Additional Information includes additional information about the Trustees and is available, without charge, upon request, by calling 1-800-222-8222 or by visiting the website at allspringglobal.com.
2 For those Officers with tenures at Allspring Global Investments and/or Allspring Funds Management, LLC that began prior to 2021, such tenures include years of service during which these businesses/entities were known as Wells Fargo Asset Management and Wells Fargo Funds Management, LLC, respectively.
Allspring Large Cap Core Fund | 31
For more information
More information about Allspring Funds is available free upon request. To obtain literature, please write, visit the Fund's website, or call:
Allspring Funds
P.O. Box 219967
Kansas City, MO 64121-9967
Website: allspringglobal.com
Individual investors: 1-800-222-8222
Retail investment professionals: 1-888-877-9275
Institutional investment professionals: 1-800-260-5969
This report and the financial statements contained herein are submitted for the general information of the shareholders of the Fund. If this report is used for promotional purposes, distribution of the report must be accompanied or preceded by a current prospectus. Before investing, please consider the investment objectives, risks, charges, and expenses of the investment. For a current prospectus and, if available, a summary prospectus, containing this information, call
1-800-222-8222 or visit the Fund's website at allspringglobal.com. Read the prospectus carefully before you invest or send money.
Allspring Global InvestmentsTM is the trade name for the asset management firms of Allspring Global Investments Holdings, LLC, a holding company indirectly owned by certain private funds of GTCR LLC and Reverence Capital Partners, L.P. These firms include but are not limited to Allspring Global Investments, LLC, and Allspring Funds Management, LLC. Certain products managed by Allspring entities are distributed by Allspring Funds Distributor, LLC (a broker-dealer and Member FINRA/SIPC).
This material is for general informational and educational purposes only and is NOT intended to provide investment advice or a recommendation of any kind - including a recommendation for any specific investment, strategy, or plan.
© 2023 Allspring Global Investments Holdings, LLC. All rights reserved.
ALL-02092023-tobcvwau 03-23
SAR4314 01-23
Semi-Annual Report
January 31, 2023
Allspring Large Cap Growth Fund
The views expressed and any forward-looking statements are as of January 31, 2023, unless otherwise noted, and are those of the Fund's portfolio managers and/or Allspring Global Investments. Discussions of individual securities or the markets generally are not intended as individual recommendations. Future events or results may vary significantly from those expressed in any forward-looking statements. The views expressed are subject to change at any time in response to changing circumstances in the market. Allspring Global Investments disclaims any obligation to publicly update or revise any views expressed or forward-looking statements.
Allspring Large Cap Growth Fund | 1
Letter to shareholders (unaudited)
Andrew Owen
President
Allspring Funds
Dear Shareholder:
We are pleased to offer you this semi-annual report for the Allspring Large Cap Growth Fund for the six-month period that ended January 31, 2023. Globally, stocks and bonds experienced heightened volatility through the challenging period. Earlier tailwinds provided by global stimulus programs, vaccination rollouts, and recovering consumer and corporate sentiment were wiped away by the highest rate of inflation in four decades as well as the impact of ongoing aggressive central bank rate hikes and the prospect of more rate hikes. Compounding these concerns were the global reverberations of the Russia-Ukraine war and the impact of China’s strict COVID-19 lockdowns.
For the six-month period, stocks and bonds had mixed results, with non-U.S. equities––both developed market and emerging market––outperforming U.S. stocks overall. Bonds––both U.S. and non-U.S.––struggled to cope with sustained aggressive interest rate increases. For the period, U.S. stocks, based on the S&P 500 Index,1 lost 0.44%. International stocks, as measured by the MSCI ACWI ex USA Index (Net),2 returned 7.63%, while the MSCI EM Index (Net) (USD)3 gained 4.92%. Among bond indexes, the Bloomberg U.S. Aggregate Bond Index4 returned -2.37%, the Bloomberg Global Aggregate ex-USD Index (unhedged)5 returned -1.15%, the Bloomberg Municipal Bond Index6 gained 0.73%, and the ICE BofA U.S. High Yield Index7 returned 1.27%.
The Russia-Ukraine war, high inflation, and central bank rate hikes rocked markets
August was yet another broadly challenging month for financial markets, with more red ink flowing. High inflation persisted, cresting 9% in the eurozone on an annual basis and remaining above 8% in the U.S. despite the Federal Reserve’s (Fed’s) aggressive monetary policy and a major drop in global crude oil and gasoline prices from their June peak. One positive note was the resilience of the U.S. job market. However, the Fed’s job was clearly not complete. One longer-term bright spot was the U.S. Congress’s passage of the Inflation Reduction Act. Its primary stated goals include: to reduce inflation (though not immediately) by curbing the deficit, capping health care spending by seniors, and investing in domestic sources of clean energy.
“August was yet another broadly challenging month for financial markets, with more red ink flowing.”
| 1 | The S&P 500 Index consists of 500 stocks chosen for market size, liquidity, and industry group representation. It is a market-value-weighted index with each stock's weight in the index proportionate to its market value. You cannot invest directly in an index. |
| 2 | The Morgan Stanley Capital International (MSCI) All Country World Index (ACWI) ex USA Index (Net) is a free-float-adjusted market-capitalization-weighted index that is designed to measure the equity market performance of developed and emerging markets, excluding the U.S. Source: MSCI. MSCI makes no express or implied warranties or representations and shall have no liability whatsoever with respect to any MSCI data contained herein. The MSCI data may not be further redistributed or used as a basis for other indexes or any securities or financial products. This report is not approved, reviewed, or produced by MSCI. You cannot invest directly in an index. |
| 3 | The MSCI Emerging Markets (EM) Index (Net) (USD) is a free-float-adjusted market-capitalization-weighted index that is designed to measure equity market performance of emerging markets. You cannot invest directly in an index. |
| 4 | The Bloomberg U.S. Aggregate Bond Index is a broad-based benchmark that measures the investment-grade, U.S.-dollar-denominated, fixed-rate taxable bond market, including Treasuries, government-related and corporate securities, mortgage-backed securities (agency fixed-rate and hybrid adjustable-rate mortgage pass-throughs), asset-backed securities, and commercial mortgage-backed securities. You cannot invest directly in an index. |
| 5 | The Bloomberg Global Aggregate ex-USD Index (unhedged) is an unmanaged index that provides a broad-based measure of the global investment-grade fixed-income markets excluding the U.S.-dollar-denominated debt market. You cannot invest directly in an index. |
| 6 | The Bloomberg Municipal Bond Index is an unmanaged index composed of long-term tax-exempt bonds with a minimum credit rating of Baa. You cannot invest directly in an index. |
| 7 | The ICE BofA U.S. High Yield Index is a market-capitalization-weighted index of domestic and Yankee high-yield bonds. The index tracks the performance of high-yield securities traded in the U.S. bond market. You cannot invest directly in an index. Copyright 2023. ICE Data Indices, LLC. All rights reserved. |
2 | Allspring Large Cap Growth Fund
Letter to shareholders (unaudited)
The market misery continued in September. There was nowhere to hide as all asset classes suffered major losses at the hands of persistent inflation. Central banks kept up their battle against rapidly rising prices with more rate hikes. The strength of the U.S. dollar made things even more difficult for investors holding assets in other currencies. U.S. mortgage rates jumped to near 7% on 30-year fixed-rate mortgages; the decreased housing affordability began to cool demand somewhat. The U.K. experienced a sharp sell-off of government bonds and the British pound in September as investors panicked in response to a new government budget that was seen as financially unsound. The market meltdown forced the Bank of England to step in and buy long-dated government bonds.
Equities had a reprieve in October after two months of sharp declines. Value stocks and small caps fared best. Globally, developed markets outpaced emerging market equities, which were hurt by weakness among Chinese stocks. Central banks continued to try to curtail high inflation with aggressive interest rate hikes. Geopolitical risks persisted, including the ongoing Russia-Ukraine war and economic, financial market, and political turmoil in the U.K., which led to a second prime ministerial change in six weeks, as Rishi Sunak replaced Liz Truss in late October. Concerns over Europe’s energy crisis eased thanks to unseasonably warm weather and plentiful gas on hand. The U.S. labor market continued its resilience against rising prices, as unemployment stood at 3.7%, near a record low.
Stocks and bonds rallied in November, with emerging market equities gaining nearly 15% and developed market equities returning 7%. The S&P 500 Index rose 5.6% in November. Bonds also had positive monthly returns. Economic news was encouraging, driven by U.S. labor market strength. Although central banks kept raising rates, expectations grew regarding an impending easing in the pace of rate hikes and a possible end to central bank monetary tightening in 2023. Although inflation remained at record highs in the eurozone, with a 10.6% annual increase in October, Germany’s producer prices decreased 4.2% annually, signaling a possible decline in inflationary pressures. Meanwhile, U.S. inflation continued to moderate, with a 7.1% annual price rise in November and a monthly price increase of just 0.1%. China’s economic data remained weak, reflecting its zero-COVID-19 policy.
Financial markets cooled in December, with U.S. equities posting negative overall results in response to a weakening U.S. dollar. Fixed income securities ended one of their worst years ever with flat overall monthly returns as markets weighed the hopes for an end to the monetary tightening cycle with the reality that central banks had not completed their jobs yet. U.S. Consumer Price Index (CPI)1 data showed a strong consistent trend downward, which brought down the 12-month CPI to 6.5% in December from 9.1% in June. Other countries and regions reported still-high but declining inflation rates as the year winded down.
The year 2023 began with a broad rally across global equities and fixed income securities. Investor optimism rose in response to data indicating declining inflation rates and the reopening of China’s economy with the abrupt end to its zero-COVID-19 policy. The U.S. reported surprisingly strong job gains––employers added more than 500,000 jobs––and unemployment fell to 3.4%, the lowest level since 1969. Meanwhile, wage growth, seen as a potential contributor to ongoing high inflation, continued to moderate. All eyes remained fixed on the Fed and on how many additional rate hikes it will announce before reaching the peak (“terminal”) rate, expected to be above 5%. The 0.25% federal funds rate hike announced in January was the Fed’s smallest rate increase since March 2022.
| 1 | The Consumer Price Index (CPI) is a measure of the average change over time in the prices paid by urban consumers for a market basket of consumer goods and services. You cannot invest directly in an index. |
Allspring Large Cap Growth Fund | 3
Letter to shareholders (unaudited)
Don’t let short-term uncertainty derail long-term investment goals.
Periods of investment uncertainty can present challenges, but experience has taught us that maintaining long-term investment goals can be an effective way to plan for the future. To help you create a sound strategy based on your personal goals and risk tolerance, Allspring Funds offers more than 100 mutual funds spanning a wide range of asset classes and investment styles. Although diversification cannot guarantee an investment profit or prevent losses, we believe it can be an effective way to manage investment risk and potentially smooth out overall portfolio performance. We encourage investors to know their investments and to understand that appropriate levels of risk-taking may unlock opportunities.
Thank you for choosing to invest with Allspring Funds. We appreciate your confidence in us and remain committed to helping you meet your financial needs.
Sincerely,
Andrew Owen
President
Allspring Funds
For further information about your fund, contact your investment professional, visit our website at allspringglobal.com, or call us directly at 1-800-222-8222.
4 | Allspring Large Cap Growth Fund
This page is intentionally left blank.
Performance highlights (unaudited)
| Investment objective | The Fund seeks long-term capital appreciation. |
| Manager | Allspring Funds Management, LLC |
| Subadviser | Allspring Global Investments, LLC |
| Portfolio managers | Robert Gruendyke, CFA®‡, Thomas C. Ognar, CFA®‡ |
| Average annual total returns (%) as of January 31, 2023 |
| | | Including sales charge | | Excluding sales charge | | Expense ratios1 (%) |
| | Inception date | 1 year | 5 year | 10 year | | 1 year | 5 year | 10 year | | Gross | Net 2 |
| Class A (STAFX) | 7-30-2010 | -22.43 | 5.44 | 10.54 | | -17.70 | 6.70 | 11.20 | | 1.17 | 1.07 |
| Class C (STOFX) | 7-30-2010 | -19.33 | 5.88 | 10.53 | | -18.33 | 5.88 | 10.53 | | 1.92 | 1.82 |
| Class R (STMFX) | 6-15-2012 | – | – | – | | -17.90 | 6.43 | 10.92 | | 1.42 | 1.32 |
| Class R4 (SLGRX) | 11-30-2012 | – | – | – | | -17.50 | 6.92 | 11.49 | | 0.89 | 0.80 |
| Class R6 (STFFX) | 11-30-2012 | – | – | – | | -17.37 | 7.13 | 11.68 | | 0.74 | 0.65 |
| Administrator Class (STDFX) | 7-30-2010 | – | – | – | | -17.63 | 6.81 | 11.33 | | 1.09 | 0.95 |
| Institutional Class (STNFX) | 7-30-2010 | – | – | – | | -17.46 | 7.02 | 11.58 | | 0.84 | 0.75 |
| Russell 1000® Growth Index3 | – | – | – | – | | -16.02 | 11.22 | 14.53 | | – | – |
Figures quoted represent past performance, which is no guarantee of future results, and do not reflect taxes that a shareholder may pay on an investment in a fund. Investment return and principal value of an investment will fluctuate so that an investor’s shares, when redeemed, may be worth more or less than their original cost. Performance shown without sales charges would be lower if sales charges were reflected. Current performance may be lower or higher than the performance data quoted, which assumes the reinvestment of dividends and capital gains. Current month-end performance is available on the Fund’s website, allspringglobal.com.
Index returns do not include transaction costs associated with buying and selling securities, any mutual fund fees or expenses, or any taxes. It is not possible to invest directly in an index.
For Class A shares, the maximum front-end sales charge is 5.75%. For Class C shares, the maximum contingent deferred sales charge is 1.00%. Performance including a contingent deferred sales charge assumes the sales charge for the corresponding time period. Class R, Class R4, Class R6, Administrator Class and Institutional Class shares are sold without a front-end sales charge or contingent deferred sales charge.
| 1 | Reflects the expense ratios as stated in the most recent prospectuses. The expense ratios shown are subject to change and may differ from the annualized expense ratios shown in the financial highlights of this report. |
| 2 | The manager has contractually committed through November 30, 2023, to waive fees and/or reimburse expenses to the extent necessary to cap total annual fund operating expenses after fee waivers at 1.07% for Class A, 1.82% for Class C, 1.32% for Class R, 0.80% for Class R4, 0.65% for Class R6, 0.95% for Administrator Class, and 0.75% for Institutional Class. Brokerage commissions, stamp duty fees, interest, taxes, acquired fund fees and expenses (if any), and extraordinary expenses are excluded from the expense caps. Prior to or after the commitment expiration date, the caps may be increased or the commitment to maintain the caps may be terminated only with the approval of the Board of Trustees. Without these caps, the Fund’s returns would have been lower. The expense ratio paid by an investor is the net expense ratio (the total annual fund operating expenses after fee waivers) as stated in the prospectuses. |
| 3 | The Russell 1000® Growth Index measures the performance of those Russell 1000 companies with higher price/book ratios and higher forecasted growth values. You cannot invest directly in an index. |
Stock values fluctuate in response to the activities of individual companies and general market and economic conditions. Certain investment strategies tend to increase the total risk of an investment (relative to the broader market). This fund is exposed to foreign investment risk. Consult the Fund’s prospectus for additional information on these and other risks.
| ‡ | CFA® and Chartered Financial Analyst® are trademarks owned by CFA Institute. |
6 | Allspring Large Cap Growth Fund
Performance highlights (unaudited)
| Ten largest holdings (%) as of January 31, 20231 |
| Microsoft Corporation | 9.81 |
| Apple Incorporated | 8.35 |
| Amazon.com Incorporated | 5.61 |
| Alphabet Incorporated Class A | 5.12 |
| MasterCard Incorporated Class A | 3.95 |
| The TJX Companies Incorporated | 2.72 |
| UnitedHealth Group Incorporated | 2.51 |
| Boston Scientific Corporation | 2.39 |
| Copart Incorporated | 2.28 |
| NVIDIA Corporation | 2.25 |
| 1 | Figures represent the percentage of the Fund's net assets. Holdings are subject to change and may have changed since the date specified. |
| Sector allocation as of January 31, 20231 |
| 1 | Figures represent the percentage of the Fund's long-term investments. Allocations are subject to change and may have changed since the date specified. |
Allspring Large Cap Growth Fund | 7
Fund expenses (unaudited)
As a shareholder of the Fund, you incur two types of costs: (1) transaction costs, including sales charges (loads) on purchase payments and contingent deferred sales charges (if any) on redemptions and (2) ongoing costs, including management fees, distribution (12b-1) and/or shareholder servicing fees, and other Fund expenses. This example is intended to help you understand your ongoing costs (in dollars) of investing in the Fund and to compare these costs with the ongoing costs of investing in other mutual funds.
The example is based on an investment of $1,000 invested at the beginning of the six-month period and held for the entire period from August 1, 2022 to January 31, 2023.
Actual expenses
The “Actual” line of the table below provides information about actual account values and actual expenses. You may use the information in this line, together with the amount you invested, to estimate the expenses that you paid over the period. Simply divide your account value by $1,000 (for example, an $8,600 account value divided by $1,000 = 8.6), then multiply the result by the number in the “Actual” line under the heading entitled “Expenses paid during period” for your applicable class of shares to estimate the expenses you paid on your account during this period.
Hypothetical example for comparison purposes
The “Hypothetical” line of the table below provides information about hypothetical account values and hypothetical expenses based on the Fund’s actual expense ratio and an assumed rate of return of 5% per year before expenses, which is not the Fund’s actual return. The hypothetical account values and expenses may not be used to estimate the actual ending account balance or expenses you paid for the period. You may use this information to compare the ongoing costs of investing in the Fund and other funds. To do so, compare this 5% hypothetical example with the 5% hypothetical examples that appear in the shareholder reports of the other funds.
Please note that the expenses shown in the table are meant to highlight your ongoing costs only and do not reflect any transactional costs, such as sales charges (loads) and contingent deferred sales charges. Therefore, the “Hypothetical” line of the table is useful in comparing ongoing costs only, and will not help you determine the relative total costs of owning different funds. In addition, if these transactional costs were included, your costs would have been higher.
| | Beginning
account value
8-1-2022 | Ending
account value
1-31-2023 | Expenses
paid during
the period1 | Annualized net
expense ratio |
| Class A | | | | |
| Actual | $1,000.00 | $ 959.04 | $5.28 | 1.07% |
| Hypothetical (5% return before expenses) | $1,000.00 | $1,019.81 | $5.45 | 1.07% |
| Class C | | | | |
| Actual | $1,000.00 | $ 955.52 | $8.97 | 1.82% |
| Hypothetical (5% return before expenses) | $1,000.00 | $1,016.03 | $9.25 | 1.82% |
| Class R | | | | |
| Actual | $1,000.00 | $ 957.76 | $6.51 | 1.32% |
| Hypothetical (5% return before expenses) | $1,000.00 | $1,018.55 | $6.72 | 1.32% |
| Class R4 | | | | |
| Actual | $1,000.00 | $ 960.14 | $3.95 | 0.80% |
| Hypothetical (5% return before expenses) | $1,000.00 | $1,021.17 | $4.08 | 0.80% |
| Class R6 | | | | |
| Actual | $1,000.00 | $ 961.08 | $3.21 | 0.65% |
| Hypothetical (5% return before expenses) | $1,000.00 | $1,021.93 | $3.31 | 0.65% |
| Administrator Class | | | | |
| Actual | $1,000.00 | $ 959.50 | $4.69 | 0.95% |
| Hypothetical (5% return before expenses) | $1,000.00 | $1,020.42 | $4.84 | 0.95% |
| Institutional Class | | | | |
| Actual | $1,000.00 | $ 960.70 | $3.71 | 0.75% |
| Hypothetical (5% return before expenses) | $1,000.00 | $1,021.42 | $3.82 | 0.75% |
1 Expenses paid is equal to the annualized net expense ratio of each class multiplied by the average account value over the period, multiplied by 184 divided by 365 (to reflect the one-half-year period).
8 | Allspring Large Cap Growth Fund
Portfolio of investments—January 31, 2023 (unaudited)
| | | | | Shares | Value |
| Common stocks: 98.18% | | | | | |
| Communication services: 8.37% | | | | | |
| Entertainment: 0.47% | | | | | |
| Netflix Incorporated † | | | | 9,754 | $ 3,451,550 |
| Interactive media & services: 7.25% | | | | | |
| Alphabet Incorporated Class A † | | | | 384,396 | 37,993,701 |
| Alphabet Incorporated Class C † | | | | 121,094 | 12,093,658 |
| Meta Platforms Incorporated Class A † | | | | 25,145 | 3,745,851 |
| | | | | | 53,833,210 |
| Wireless telecommunication services: 0.65% | | | | | |
| T-Mobile US Incorporated † | | | | 32,155 | 4,801,063 |
| Consumer discretionary: 17.84% | | | | | |
| Hotels, restaurants & leisure: 3.47% | | | | | |
| Airbnb Incorporated Class A † | | | | 36,804 | 4,089,292 |
| Chipotle Mexican Grill Incorporated † | | | | 9,732 | 16,022,570 |
| Starbucks Corporation | | | | 51,389 | 5,608,595 |
| | | | | | 25,720,457 |
| Internet & direct marketing retail: 5.75% | | | | | |
| Amazon.com Incorporated † | | | | 403,543 | 41,617,390 |
| MercadoLibre Incorporated † | | | | 912 | 1,077,701 |
| | | | | | 42,695,091 |
| Specialty retail: 6.85% | | | | | |
| AutoZone Incorporated † | | | | 1,074 | 2,619,325 |
| O'Reilly Automotive Incorporated † | | | | 9,842 | 7,798,309 |
| The Home Depot Incorporated | | | | 25,328 | 8,210,578 |
| The TJX Companies Incorporated | | | | 246,321 | 20,163,837 |
| Ulta Beauty Incorporated † | | | | 23,466 | 12,060,585 |
| | | | | | 50,852,634 |
| Textiles, apparel & luxury goods: 1.77% | | | | | |
| lululemon athletica Incorporated † | | | | 18,128 | 5,563,121 |
| Nike Incorporated Class B | | | | 59,255 | 7,544,939 |
| | | | | | 13,108,060 |
| Consumer staples: 2.72% | | | | | |
| Beverages: 1.13% | | | | | |
| Constellation Brands Incorporated Class A | | | | 36,219 | 8,385,423 |
| Food & staples retailing: 1.24% | | | | | |
| Sysco Corporation | | | | 119,179 | 9,231,605 |
| Personal products: 0.35% | | | | | |
| The Estee Lauder Companies Incorporated Class A | | | | 9,338 | 2,587,373 |
| Energy: 0.36% | | | | | |
| Oil, gas & consumable fuels: 0.36% | | | | | |
| Hess Corporation | | | | 17,847 | 2,679,906 |
The accompanying notes are an integral part of these financial statements.
Allspring Large Cap Growth Fund | 9
Portfolio of investments—January 31, 2023 (unaudited)
| | | | | Shares | Value |
| Financials: 5.60% | | | | | |
| Capital markets: 4.82% | | | | | |
| BlackRock Incorporated | | | | 8,609 | $ 6,536,039 |
| CME Group Incorporated | | | | 71,584 | 12,646,029 |
| Intercontinental Exchange Incorporated | | | | 30,239 | 3,252,204 |
| The Charles Schwab Corporation | | | | 171,743 | 13,296,343 |
| | | | | | 35,730,615 |
| Insurance: 0.78% | | | | | |
| Progressive Corporation | | | | 42,490 | 5,793,512 |
| Health care: 15.70% | | | | | |
| Biotechnology: 3.29% | | | | | |
| Alnylam Pharmaceuticals Incorporated † | | | | 31,599 | 7,154,014 |
| BioMarin Pharmaceutical Incorporated † | | | | 40,064 | 4,621,382 |
| Seagen Incorporated † | | | | 13,260 | 1,849,505 |
| Vertex Pharmaceuticals Incorporated † | | | | 33,392 | 10,788,955 |
| | | | | | 24,413,856 |
| Health care equipment & supplies: 5.72% | | | | | |
| Abbott Laboratories | | | | 39,836 | 4,403,870 |
| Boston Scientific Corporation † | | | | 383,239 | 17,724,804 |
| Intuitive Surgical Incorporated † | | | | 23,604 | 5,799,267 |
| Stryker Corporation | | | | 57,151 | 14,505,495 |
| | | | | | 42,433,436 |
| Health care providers & services: 3.16% | | | | | |
| Cardinal Health Incorporated | | | | 62,582 | 4,834,460 |
| UnitedHealth Group Incorporated | | | | 37,274 | 18,606,808 |
| | | | | | 23,441,268 |
| Health care technology: 0.75% | | | | | |
| Veeva Systems Incorporated Class A † | | | | 32,749 | 5,585,342 |
| Life sciences tools & services: 1.98% | | | | | |
| Agilent Technologies Incorporated | | | | 66,896 | 10,173,544 |
| Thermo Fisher Scientific Incorporated | | | | 8,020 | 4,574,047 |
| | | | | | 14,747,591 |
| Pharmaceuticals: 0.80% | | | | | |
| Eli Lilly & Company | | | | 9,487 | 3,264,951 |
| Zoetis Incorporated | | | | 16,141 | 2,671,174 |
| | | | | | 5,936,125 |
| Industrials: 8.08% | | | | | |
| Aerospace & defense: 0.30% | | | | | |
| TransDigm Group Incorporated | | | | 3,127 | 2,244,404 |
| Air freight & logistics: 1.85% | | | | | |
| United Parcel Service Incorporated Class B | | | | 73,990 | 13,705,168 |
| Building products: 0.23% | | | | | |
| Johnson Controls International plc | | | | 24,785 | 1,724,292 |
The accompanying notes are an integral part of these financial statements.
10 | Allspring Large Cap Growth Fund
Portfolio of investments—January 31, 2023 (unaudited)
| | | | | Shares | Value |
| Commercial services & supplies: 2.28% | | | | | |
| Copart Incorporated † | | | | 253,656 | $ 16,896,026 |
| Machinery: 1.11% | | | | | |
| Fortive Corporation | | | | 121,761 | 8,283,401 |
| Road & rail: 2.31% | | | | | |
| CSX Corporation | | | | 152,282 | 4,708,559 |
| J.B. Hunt Transport Services Incorporated | | | | 23,729 | 4,485,967 |
| Uber Technologies Incorporated † | | | | 74,048 | 2,290,305 |
| Union Pacific Corporation | | | | 27,629 | 5,641,566 |
| | | | | | 17,126,397 |
| Information technology: 36.15% | | | | | |
| IT services: 7.60% | | | | | |
| MasterCard Incorporated Class A | | | | 79,022 | 29,285,553 |
| PayPal Holdings Incorporated † | | | | 132,441 | 10,792,617 |
| Visa Incorporated Class A | | | | 70,711 | 16,278,379 |
| | | | | | 56,356,549 |
| Semiconductors & semiconductor equipment: 5.53% | | | | | |
| Advanced Micro Devices Incorporated † | | | | 54,083 | 4,064,337 |
| Enphase Energy Incorporated † | | | | 2,314 | 512,273 |
| Marvell Technology Incorporated | | | | 48,936 | 2,111,588 |
| Microchip Technology Incorporated | | | | 167,185 | 12,976,900 |
| NVIDIA Corporation | | | | 85,637 | 16,730,901 |
| Qualcomm Incorporated | | | | 34,967 | 4,657,954 |
| | | | | | 41,053,953 |
| Software: 14.67% | | | | | |
| Crowdstrike Holdings Incorporated Class A † | | | | 15,927 | 1,686,669 |
| Intuit Incorporated | | | | 21,205 | 8,962,717 |
| Microsoft Corporation | | | | 293,907 | 72,833,094 |
| Oracle Corporation | | | | 77,763 | 6,878,915 |
| Palo Alto Networks Incorporated † | | | | 49,882 | 7,913,280 |
| ServiceNow Incorporated † | | | | 17,549 | 7,987,076 |
| Workday Incorporated Class A † | | | | 14,502 | 2,631,098 |
| | | | | | 108,892,849 |
| Technology hardware, storage & peripherals: 8.35% | | | | | |
| Apple Incorporated | | | | 429,448 | 61,965,052 |
| Materials: 1.52% | | | | | |
| Chemicals: 1.52% | | | | | |
| Linde plc | | | | 34,102 | 11,285,717 |
| Real estate: 1.84% | | | | | |
| Equity REITs: 1.00% | | | | | |
| Equinix Incorporated | | | | 2,874 | 2,121,386 |
| SBA Communications Corporation | | | | 17,958 | 5,343,044 |
| | | | | | 7,464,430 |
The accompanying notes are an integral part of these financial statements.
Allspring Large Cap Growth Fund | 11
Portfolio of investments—January 31, 2023 (unaudited)
| | | | | Shares | Value |
| Real estate management & development: 0.84% | | | | | |
| CBRE Group Incorporated Class A † | | | | 72,651 | $ 6,212,387 |
| Total Common stocks (Cost $393,394,802) | | | | | 728,638,742 |
| | | Yield | | | |
| Short-term investments: 0.94% | | | | | |
| Investment companies: 0.94% | | | | | |
| Allspring Government Money Market Fund Select Class ♠∞ | | 4.16% | | 6,986,243 | 6,986,243 |
| Total Short-term investments (Cost $6,986,243) | | | | | 6,986,243 |
| Total investments in securities (Cost $400,381,045) | 99.12% | | | | 735,624,985 |
| Other assets and liabilities, net | 0.88 | | | | 6,555,754 |
| Total net assets | 100.00% | | | | $742,180,739 |
| † | Non-income-earning security |
| ♠ | The issuer of the security is an affiliated person of the Fund as defined in the Investment Company Act of 1940. |
| ∞ | The rate represents the 7-day annualized yield at period end. |
| Abbreviations: |
| REIT | Real estate investment trust |
Investments in affiliates
An affiliated investment is an investment in which the Fund owns at least 5% of the outstanding voting shares of the issuer or as a result of other relationships, such as the Fund and the issuer having the same investment manager. Transactions with issuers that were affiliates of the Fund at the end of the period were as follows:
| | Value,
beginning of
period | Purchases | Sales
proceeds | Net
realized
gains
(losses) | | Net
change in
unrealized
gains
(losses) | | Value,
end of
period | Shares,
end
of period | Income
from
affiliated
securities |
| Short-term investments | | | | | | | | | |
| Allspring Government Money Market Fund Select Class | $13,554,667 | $101,110,019 | $(107,678,443) | $ 0 | | $0 | | $ 6,986,243 | 6,986,243 | $ 266,142 |
Investments in affiliates no
longer held at end of period | | | | | | | | | | |
| Securities Lending Cash Investments LLC | 0 | 404,600 | (404,640) | 40 | | 0 | | 0 | 0 | 233 # |
| | | | | $40 | | $0 | | $6,986,243 | | $266,375 |
| # | Amount shown represents income before fees and rebates. |
The accompanying notes are an integral part of these financial statements.
12 | Allspring Large Cap Growth Fund
Statement of assets and liabilities—January 31, 2023 (unaudited)
| | |
| Assets | |
Investments in unaffiliated securities, at value (cost $393,394,802)
| $ 728,638,742 |
Investments in affiliated securities, at value (cost $6,986,243)
| 6,986,243 |
Receivable for investments sold
| 10,510,429 |
Receivable for Fund shares sold
| 111,810 |
Receivable for dividends
| 110,880 |
Prepaid expenses and other assets
| 71,479 |
Total assets
| 746,429,583 |
| Liabilities | |
Payable for investments purchased
| 3,000,995 |
Payable for Fund shares redeemed
| 520,295 |
Management fee payable
| 346,689 |
Administration fees payable
| 91,701 |
Trustees’ fees and expenses payable
| 6,837 |
Distribution fees payable
| 1,928 |
Accrued expenses and other liabilities
| 280,399 |
Total liabilities
| 4,248,844 |
Total net assets
| $742,180,739 |
| Net assets consist of | |
Paid-in capital
| $ 388,814,665 |
Total distributable earnings
| 353,366,074 |
Total net assets
| $742,180,739 |
| Computation of net asset value and offering price per share | |
Net assets – Class A
| $ 445,176,912 |
Shares outstanding – Class A1
| 13,746,833 |
Net asset value per share – Class A
| $32.38 |
Maximum offering price per share – Class A2
| $34.36 |
Net assets – Class C
| $ 2,453,323 |
Shares outstanding – Class C1
| 95,660 |
Net asset value per share – Class C
| $25.65 |
Net assets – Class R
| $ 2,102,837 |
Shares outstanding – Class R1
| 69,178 |
Net asset value per share – Class R
| $30.40 |
Net assets – Class R4
| $ 15,476 |
Shares outstanding – Class R41
| 450 |
Net asset value per share – Class R4
| $34.39 |
Net assets – Class R6
| $ 206,242,647 |
Shares outstanding – Class R61
| 5,883,218 |
Net asset value per share – Class R6
| $35.06 |
Net assets – Administrator Class
| $ 53,847,191 |
Shares outstanding – Administrator Class1
| 1,617,023 |
Net asset value per share – Administrator Class
| $33.30 |
Net assets – Institutional Class
| $ 32,342,353 |
Shares outstanding – Institutional Class1
| 932,723 |
Net asset value per share – Institutional Class
| $34.68 |
| 1 | The Fund has an unlimited number of authorized shares. |
| 2 | Maximum offering price is computed as 100/94.25 of net asset value. On investments of $50,000 or more, the offering price is reduced. |
The accompanying notes are an integral part of these financial statements.
Allspring Large Cap Growth Fund | 13
Statement of operations—six months ended January 31, 2023 (unaudited)
| | |
| Investment income | |
Dividends
| $ 3,242,476 |
Income from affiliated securities
| 266,304 |
Total investment income
| 3,508,780 |
| Expenses | |
Management fee
| 2,600,370 |
| Administration fees | |
Class A
| 472,459 |
Class C
| 2,774 |
Class R
| 2,253 |
Class R4
| 6 |
Class R6
| 30,753 |
Administrator Class
| 35,686 |
Institutional Class
| 24,132 |
| Shareholder servicing fees | |
Class A
| 561,496 |
Class C
| 3,287 |
Class R
| 2,475 |
Class R4
| 8 |
Administrator Class
| 68,534 |
| Distribution fees | |
Class C
| 9,863 |
Class R
| 2,475 |
Custody and accounting fees
| 27,733 |
Professional fees
| 24,293 |
Registration fees
| 46,059 |
Shareholder report expenses
| 28,135 |
Trustees’ fees and expenses
| 11,026 |
Other fees and expenses
| 8,755 |
Total expenses
| 3,962,572 |
| Less: Fee waivers and/or expense reimbursements | |
Fund-level
| (339,147) |
Class A
| (67,232) |
Class C
| (331) |
Class R6
| (21,203) |
Administrator Class
| (19,082) |
Institutional Class
| (3,710) |
Net expenses
| 3,511,867 |
Net investment loss
| (3,087) |
| Realized and unrealized gains (losses) on investments | |
| Net realized gains on | |
Unaffiliated securities
| 23,280,448 |
Affiliated securities
| 40 |
Net realized gains on investments
| 23,280,488 |
Net change in unrealized gains (losses) on investments
| (58,144,973) |
Net realized and unrealized gains (losses) on investments
| (34,864,485) |
Net decrease in net assets resulting from operations
| $(34,867,572) |
The accompanying notes are an integral part of these financial statements.
14 | Allspring Large Cap Growth Fund
Statement of changes in net assets
| | | | | |
| | Six months ended
January 31, 2023
(unaudited) | Year ended
July 31, 2022 |
| Operations | | | | |
Net investment loss
| | $ (3,087) | | $ (4,018,264) |
Net realized gains on investments
| | 23,280,488 | | 129,735,058 |
Net change in unrealized gains (losses) on investments
| | (58,144,973) | | (357,443,950) |
Net decrease in net assets resulting from operations
| | (34,867,572) | | (231,727,156) |
| Distributions to shareholders from | | | | |
| Net investment income and net realized gains | | | | |
Class A
| | (44,292,446) | | (94,969,340) |
Class C
| | (313,544) | | (885,940) |
Class R
| | (216,039) | | (440,556) |
Class R4
| | (1,433) | | (2,756) |
Class R6
| | (19,033,722) | | (47,295,062) |
Administrator Class
| | (5,257,541) | | (11,436,683) |
Institutional Class
| | (3,236,556) | | (11,138,623) |
Total distributions to shareholders
| | (72,351,281) | | (166,168,960) |
| Capital share transactions | Shares | | Shares | |
| Proceeds from shares sold | | | | |
Class A
| 181,287 | 5,775,402 | 208,098 | 9,675,849 |
Class C
| 9,010 | 256,587 | 14,823 | 602,775 |
Class R
| 4,012 | 131,872 | 24,867 | 948,090 |
Class R6
| 412,433 | 15,680,800 | 279,638 | 13,594,825 |
Administrator Class
| 21,421 | 753,664 | 44,131 | 1,918,024 |
Institutional Class
| 89,851 | 3,122,944 | 303,730 | 16,712,575 |
| | | 25,721,269 | | 43,452,138 |
| Reinvestment of distributions | | | | |
Class A
| 1,378,131 | 43,052,757 | 1,893,114 | 92,137,889 |
Class C
| 12,658 | 313,544 | 22,198 | 885,940 |
Class R
| 7,146 | 209,670 | 8,564 | 394,893 |
Class R4
| 43 | 1,433 | 54 | 2,756 |
Class R6
| 543,092 | 18,356,494 | 873,534 | 45,458,706 |
Administrator Class
| 163,684 | 5,257,541 | 229,215 | 11,426,420 |
Institutional Class
| 93,398 | 3,123,225 | 196,289 | 10,126,530 |
| | | 70,314,664 | | 160,433,134 |
| Payment for shares redeemed | | | | |
Class A
| (910,006) | (30,424,164) | (1,510,134) | (67,884,626) |
Class C
| (30,598) | (883,233) | (68,591) | (2,691,286) |
Class R
| (16,981) | (604,013) | (14,112) | (558,622) |
Class R6
| (438,360) | (16,021,506) | (2,266,673) | (110,291,919) |
Administrator Class
| (127,709) | (4,424,657) | (241,347) | (11,229,775) |
Institutional Class
| (343,684) | (12,179,867) | (754,103) | (34,467,686) |
| | | (64,537,440) | | (227,123,914) |
Net increase (decrease) in net assets resulting from capital share transactions
| | 31,498,493 | | (23,238,642) |
Total decrease in net assets
| | (75,720,360) | | (421,134,758) |
| Net assets | | | | |
Beginning of period
| | 817,901,099 | | 1,239,035,857 |
End of period
| | $742,180,739 | | $ 817,901,099 |
The accompanying notes are an integral part of these financial statements.
Allspring Large Cap Growth Fund | 15
Financial highlights
(For a share outstanding throughout each period)
| | | Year ended July 31 |
| Class A | Six months ended
January 31, 2023
(unaudited) | 2022 | 2021 | 2020 | 2019 | 2018 |
Net asset value, beginning of period
| $37.58 | $55.05 | $49.63 | $44.23 | $52.01 | $50.10 |
Net investment loss
| (0.02) 1 | (0.24) 1 | (0.25) 1 | (0.11) 1 | (0.03) 1 | (0.08) 1 |
Net realized and unrealized gains (losses) on investments
| (1.66) | (9.43) | 12.60 | 9.66 | 3.47 | 12.56 |
Total from investment operations
| (1.68) | (9.67) | 12.35 | 9.55 | 3.44 | 12.48 |
| Distributions to shareholders from | | | | | | |
Net realized gains
| (3.52) | (7.80) | (6.93) | (4.15) | (11.22) | (10.57) |
Net asset value, end of period
| $32.38 | $37.58 | $55.05 | $49.63 | $44.23 | $52.01 |
Total return2
| (4.10)% | (20.79)% | 27.25% | 23.51% | 11.00% | 27.98% |
| Ratios to average net assets (annualized) | | | | | | |
Gross expenses
| 1.19% | 1.17% | 1.17% | 1.18% | 1.18% | 1.17% |
Net expenses
| 1.07% | 1.04% | 1.05% | 1.05% | 1.07% | 1.07% |
Net investment loss
| (0.14)% | (0.52)% | (0.53)% | (0.24)% | (0.07)% | (0.16)% |
| Supplemental data | | | | | | |
Portfolio turnover rate
| 25% | 43% | 39% | 34% | 43% | 34% |
Net assets, end of period (000s omitted)
| $445,177 | $492,177 | $688,523 | $587,771 | $529,110 | $534,694 |
| 1 | Calculated based upon average shares outstanding |
| 2 | Total return calculations do not include any sales charges. Returns for periods of less than one year are not annualized. |
The accompanying notes are an integral part of these financial statements.
16 | Allspring Large Cap Growth Fund
Financial highlights
(For a share outstanding throughout each period)
| | | Year ended July 31 |
| Class C | Six months ended
January 31, 2023
(unaudited) | 2022 | 2021 | 2020 | 2019 | 2018 |
Net asset value, beginning of period
| $30.66 | $46.65 | $43.32 | $39.41 | $47.97 | $47.25 |
Net investment loss
| (0.12) 1 | (0.49) 1 | (0.56) 1 | (0.38) 1 | (0.32) 1 | (0.31) 1 |
Net realized and unrealized gains (losses) on investments
| (1.37) | (7.70) | 10.82 | 8.44 | 2.98 | 11.60 |
Total from investment operations
| (1.49) | (8.19) | 10.26 | 8.06 | 2.66 | 11.29 |
| Distributions to shareholders from | | | | | | |
Net realized gains
| (3.52) | (7.80) | (6.93) | (4.15) | (11.22) | (10.57) |
Net asset value, end of period
| $25.65 | $30.66 | $46.65 | $43.32 | $39.41 | $47.97 |
Total return2
| (4.45)% | (21.42)% | 26.28% | 22.57% | 10.17% | 27.03% |
| Ratios to average net assets (annualized) | | | | | | |
Gross expenses
| 1.94% | 1.92% | 1.92% | 1.93% | 1.93% | 1.92% |
Net expenses
| 1.82% | 1.82% | 1.82% | 1.82% | 1.82% | 1.82% |
Net investment loss
| (0.88)% | (1.29)% | (1.29)% | (1.00)% | (0.80)% | (0.90)% |
| Supplemental data | | | | | | |
Portfolio turnover rate
| 25% | 43% | 39% | 34% | 43% | 34% |
Net assets, end of period (000s omitted)
| $2,453 | $3,207 | $6,351 | $9,918 | $11,504 | $15,586 |
| 1 | Calculated based upon average shares outstanding |
| 2 | Total return calculations do not include any sales charges. Returns for periods of less than one year are not annualized. |
The accompanying notes are an integral part of these financial statements.
Allspring Large Cap Growth Fund | 17
Financial highlights
(For a share outstanding throughout each period)
| | | Year ended July 31 |
| Class R | Six months ended
January 31, 2023
(unaudited) | 2022 | 2021 | 2020 | 2019 | 2018 |
Net asset value, beginning of period
| $35.55 | $52.61 | $47.81 | $42.86 | $50.89 | $49.34 |
Net investment loss
| (0.06) 1 | (0.32) 1 | (0.37) 1 | (0.20) 1 | (0.13) 1 | (0.20) 1 |
Net realized and unrealized gains (losses) on investments
| (1.57) | (8.94) | 12.10 | 9.30 | 3.32 | 12.32 |
Total from investment operations
| (1.63) | (9.26) | 11.73 | 9.10 | 3.19 | 12.12 |
| Distributions to shareholders from | | | | | | |
Net realized gains
| (3.52) | (7.80) | (6.93) | (4.15) | (11.22) | (10.57) |
Net asset value, end of period
| $30.40 | $35.55 | $52.61 | $47.81 | $42.86 | $50.89 |
Total return2
| (4.22)% | (20.99)% | 26.97% | 23.16% | 10.74% | 27.65% |
| Ratios to average net assets (annualized) | | | | | | |
Gross expenses
| 1.40% | 1.33% | 1.33% | 1.41% | 1.42% | 1.42% |
Net expenses
| 1.32% | 1.28% | 1.29% | 1.32% | 1.32% | 1.32% |
Net investment loss
| (0.38)% | (0.75)% | (0.77)% | (0.49)% | (0.29)% | (0.40)% |
| Supplemental data | | | | | | |
Portfolio turnover rate
| 25% | 43% | 39% | 34% | 43% | 34% |
Net assets, end of period (000s omitted)
| $2,103 | $2,666 | $2,929 | $3,322 | $4,499 | $5,661 |
| 1 | Calculated based upon average shares outstanding |
| 2 | Returns for periods of less than one year are not annualized. |
The accompanying notes are an integral part of these financial statements.
18 | Allspring Large Cap Growth Fund
Financial highlights
(For a share outstanding throughout each period)
| | | Year ended July 31 |
| Class R4 | Six months ended
January 31, 2023
(unaudited) | 2022 | 2021 | 2020 | 2019 | 2018 |
Net asset value, beginning of period
| $39.62 | $57.50 | $51.43 | $45.72 | $53.23 | $50.94 |
Net investment income (loss)
| 0.02 1 | (0.13) 1 | (0.15) 1 | 0.02 1 | 0.11 1 | 0.05 1 |
Net realized and unrealized gains (losses) on investments
| (1.73) | (9.95) | 13.15 | 9.91 | 3.60 | 12.81 |
Total from investment operations
| (1.71) | (10.08) | 13.00 | 9.93 | 3.71 | 12.86 |
| Distributions to shareholders from | | | | | | |
Net investment income
| 0.00 | 0.00 | 0.00 | (0.07) | 0.00 | 0.00 |
Net realized gains
| (3.52) | (7.80) | (6.93) | (4.15) | (11.22) | (10.57) |
Total distributions to shareholders
| (3.52) | (7.80) | (6.93) | (4.22) | (11.22) | (10.57) |
Net asset value, end of period
| $34.39 | $39.62 | $57.50 | $51.43 | $45.72 | $53.23 |
Total return2
| (3.99)% | (20.60)% | 27.56% | 23.59% | 11.32% | 28.31% |
| Ratios to average net assets (annualized) | | | | | | |
Gross expenses
| 0.89% | 0.88% | 0.86% | 0.90% | 0.90% | 0.90% |
Net expenses
| 0.80% | 0.80% | 0.80% | 0.80% | 0.80% | 0.80% |
Net investment income (loss)
| 0.13% | (0.27)% | (0.28)% | 0.05% | 0.24% | 0.10% |
| Supplemental data | | | | | | |
Portfolio turnover rate
| 25% | 43% | 39% | 34% | 43% | 34% |
Net assets, end of period (000s omitted)
| $15 | $16 | $20 | $18 | $896 | $2,089 |
| 1 | Calculated based upon average shares outstanding |
| 2 | Returns for periods of less than one year are not annualized. |
The accompanying notes are an integral part of these financial statements.
Allspring Large Cap Growth Fund | 19
Financial highlights
(For a share outstanding throughout each period)
| | | Year ended July 31 |
| Class R6 | Six months ended
January 31, 2023
(unaudited) | 2022 | 2021 | 2020 | 2019 | 2018 |
Net asset value, beginning of period
| $40.28 | $58.26 | $51.95 | $46.06 | $53.49 | $51.12 |
Net investment income (loss)
| 0.05 1 | (0.06) 1 | (0.08) 1 | 0.08 1 | 0.16 1 | 0.14 1 |
Net realized and unrealized gains (losses) on investments
| (1.75) | (10.12) | 13.32 | 10.09 | 3.65 | 12.85 |
Total from investment operations
| (1.70) | (10.18) | 13.24 | 10.17 | 3.81 | 12.99 |
| Distributions to shareholders from | | | | | | |
Net investment income
| 0.00 | 0.00 | 0.00 | (0.13) | (0.02) | (0.05) |
Net realized gains
| (3.52) | (7.80) | (6.93) | (4.15) | (11.22) | (10.57) |
Total distributions to shareholders
| (3.52) | (7.80) | (6.93) | (4.28) | (11.24) | (10.62) |
Net asset value, end of period
| $35.06 | $40.28 | $58.26 | $51.95 | $46.06 | $53.49 |
Total return2
| (3.89)% | (20.49)% | 27.76% | 24.03% | 11.46% | 28.51% |
| Ratios to average net assets (annualized) | | | | | | |
Gross expenses
| 0.76% | 0.74% | 0.74% | 0.75% | 0.75% | 0.75% |
Net expenses
| 0.65% | 0.65% | 0.65% | 0.65% | 0.65% | 0.65% |
Net investment income (loss)
| 0.28% | (0.13)% | (0.13)% | 0.17% | 0.35% | 0.27% |
| Supplemental data | | | | | | |
Portfolio turnover rate
| 25% | 43% | 39% | 34% | 43% | 34% |
Net assets, end of period (000s omitted)
| $206,243 | $216,150 | $377,470 | $327,584 | $326,990 | $327,943 |
| 1 | Calculated based upon average shares outstanding |
| 2 | Returns for periods of less than one year are not annualized. |
The accompanying notes are an integral part of these financial statements.
20 | Allspring Large Cap Growth Fund
Financial highlights
(For a share outstanding throughout each period)
| | | Year ended July 31 |
| Administrator Class | Six months ended
January 31, 2023
(unaudited) | 2022 | 2021 | 2020 | 2019 | 2018 |
Net asset value, beginning of period
| $38.51 | $56.18 | $50.47 | $44.87 | $52.54 | $50.46 |
Net investment income (loss)
| (0.00) 1,2 | (0.20) | (0.23) | (0.07) | 0.02 | (0.01) |
Net realized and unrealized gains (losses) on investments
| (1.69) | (9.67) | 12.87 | 9.83 | 3.53 | 12.66 |
Total from investment operations
| (1.69) | (9.87) | 12.64 | 9.76 | 3.55 | 12.65 |
| Distributions to shareholders from | | | | | | |
Net investment income
| 0.00 | 0.00 | 0.00 | (0.01) | 0.00 | 0.00 |
Net realized gains
| (3.52) | (7.80) | (6.93) | (4.15) | (11.22) | (10.57) |
Total distributions to shareholders
| (3.52) | (7.80) | (6.93) | (4.16) | (11.22) | (10.57) |
Net asset value, end of period
| $33.30 | $38.51 | $56.18 | $50.47 | $44.87 | $52.54 |
Total return3
| (4.05)% | (20.72)% | 27.38% | 23.63% | 11.14% | 28.14% |
| Ratios to average net assets (annualized) | | | | | | |
Gross expenses
| 1.11% | 1.09% | 1.09% | 1.10% | 1.10% | 1.09% |
Net expenses
| 0.95% | 0.95% | 0.95% | 0.95% | 0.95% | 0.95% |
Net investment income (loss)
| (0.02)% | (0.42)% | (0.43)% | (0.14)% | 0.05% | (0.03)% |
| Supplemental data | | | | | | |
Portfolio turnover rate
| 25% | 43% | 39% | 34% | 43% | 34% |
Net assets, end of period (000s omitted)
| $53,847 | $60,062 | $85,825 | $79,334 | $67,158 | $79,154 |
| 1 | Calculated based upon average shares outstanding |
| 2 | Amount is more than $(0.005) |
| 3 | Returns for periods of less than one year are not annualized. |
The accompanying notes are an integral part of these financial statements.
Allspring Large Cap Growth Fund | 21
Financial highlights
(For a share outstanding throughout each period)
| | | Year ended July 31 |
| Institutional Class | Six months ended
January 31, 2023
(unaudited) | 2022 | 2021 | 2020 | 2019 | 2018 |
Net asset value, beginning of period
| $39.90 | $57.83 | $51.67 | $45.84 | $53.31 | $51.00 |
Net investment income (loss)
| 0.03 1 | (0.11) 1 | (0.12) 1 | 0.03 1 | 0.12 1 | 0.10 1 |
Net realized and unrealized gains (losses) on investments
| (1.73) | (10.02) | 13.21 | 10.04 | 3.63 | 12.80 |
Total from investment operations
| (1.70) | (10.13) | 13.09 | 10.07 | 3.75 | 12.90 |
| Distributions to shareholders from | | | | | | |
Net investment income
| 0.00 | 0.00 | 0.00 | (0.09) | 0.00 | (0.02) |
Net realized gains
| (3.52) | (7.80) | (6.93) | (4.15) | (11.22) | (10.57) |
Total distributions to shareholders
| (3.52) | (7.80) | (6.93) | (4.24) | (11.22) | (10.59) |
Net asset value, end of period
| $34.68 | $39.90 | $57.83 | $51.67 | $45.84 | $53.31 |
Total return2
| (3.93)% | (20.57)% | 27.61% | 23.89% | 11.37% | 28.37% |
| Ratios to average net assets (annualized) | | | | | | |
Gross expenses
| 0.86% | 0.84% | 0.84% | 0.85% | 0.85% | 0.84% |
Net expenses
| 0.75% | 0.75% | 0.75% | 0.75% | 0.75% | 0.75% |
Net investment income (loss)
| 0.18% | (0.22)% | (0.23)% | 0.07% | 0.26% | 0.18% |
| Supplemental data | | | | | | |
Portfolio turnover rate
| 25% | 43% | 39% | 34% | 43% | 34% |
Net assets, end of period (000s omitted)
| $32,342 | $43,622 | $77,917 | $72,681 | $80,194 | $95,809 |
| 1 | Calculated based upon average shares outstanding |
| 2 | Returns for periods of less than one year are not annualized. |
The accompanying notes are an integral part of these financial statements.
22 | Allspring Large Cap Growth Fund
Notes to financial statements (unaudited)
1. ORGANIZATION
Allspring Funds Trust (the "Trust"), a Delaware statutory trust organized on March 10, 1999, is an open-end management investment company registered under the Investment Company Act of 1940, as amended (the "1940 Act"). As an investment company, the Trust follows the accounting and reporting guidance in Financial Accounting Standards Board ("FASB") Accounting Standards Codification Topic 946, Financial Services – Investment Companies. These financial statements report on the Allspring Large Cap Growth Fund (the "Fund") which is a diversified series of the Trust.
2. SIGNIFICANT ACCOUNTING POLICIES
The following significant accounting policies, which are consistently followed in the preparation of the financial statements of the Fund, are in conformity with U.S. generally accepted accounting principles which require management to make estimates and assumptions that affect the reported amounts of assets and liabilities, disclosure of contingent assets and liabilities at the date of the financial statements, and the reported amounts of income and expenses during the reporting period. Actual results could differ from those estimates.
Securities valuation
All investments are valued each business day as of the close of regular trading on the New York Stock Exchange (generally 4 p.m. Eastern Time), although the Fund may deviate from this calculation time under unusual or unexpected circumstances.
Equity securities that are listed on a foreign or domestic exchange or market are valued at the official closing price or, if none, the last sales price.
Investments in registered open-end investment companies (other than those listed on a foreign or domestic exchange or market) are valued at net asset value. Interests in non-registered investment companies that are redeemable at net asset value are fair valued normally at net asset value.
Investments which are not valued using the methods discussed above are valued at their fair value, as determined in good faith by Allspring Funds Management, LLC ("Allspring Funds Management"), which was named the valuation designee by the Board of Trustees. As the valuation designee, Allspring Funds Management is responsible for day-to-day valuation activities for the Allspring Funds. In connection with these responsibilities, Allspring Funds Management has established a Valuation Committee and has delegated to it the authority to take any actions regarding the valuation of portfolio securities that the Valuation Committee deems necessary or appropriate, including determining the fair value of portfolio securities. On a quarterly basis, the Board of Trustees receives reports of valuation actions taken by the Valuation Committee. On at least an annual basis, the Board of Trustees receives an assessment of the adequacy and effectiveness of Allspring Funds Management's process for determining the fair value of the portfolio of investments.
Securities lending
The Fund may lend its securities from time to time in order to earn additional income in the form of fees or interest on securities received as collateral or the investment of any cash received as collateral. When securities are on loan, the Fund receives interest or dividends on those securities. Cash collateral received in connection with its securities lending transactions is invested in Securities Lending Cash Investments, LLC (the "Securities Lending Fund"), an affiliated non-registered investment company. Investments in Securities Lending Fund are valued at the evaluated bid price provided by an independent pricing service. Income earned from investment in the Securities Lending Fund (net of fees and rebates), if any, is included in income from affiliated securities on the Statement of Operations.
In a securities lending transaction, the net asset value of the Fund is affected by an increase or decrease in the value of the securities loaned and by an increase or decrease in the value of the instrument in which collateral is invested. The amount of securities lending activity undertaken by the Fund fluctuates from time to time. The Fund has the right under the lending agreement to recover the securities from the borrower on demand. In the event of default or bankruptcy by the borrower, the Fund may be prevented from recovering the loaned securities or gaining access to the collateral or may experience delays or costs in doing so. In such an event, the terms of the agreement allow the unaffiliated securities lending agent to use the collateral to purchase replacement securities on behalf of the Fund or pay the Fund the market value of the loaned securities. The Fund bears the risk of loss with respect to depreciation of its investment of the cash collateral.
Security transactions and income recognition
Securities transactions are recorded on a trade date basis. Realized gains or losses are recorded on the basis of identified cost.
Dividend income is recognized on the ex-dividend date.
Allspring Large Cap Growth Fund | 23
Notes to financial statements (unaudited)
Distributions to shareholders
Distributions to shareholders from net investment income and any net realized gains are recorded on the ex-dividend date and paid at least annually. Such distributions are determined in accordance with income tax regulations and may differ from U.S. generally accepted accounting principles. Dividend sources are estimated at the time of declaration. The tax character of distributions is determined as of the Fund's fiscal year end. Therefore, a portion of the Fund's distributions made prior to the Fund’s fiscal year end may be categorized as a tax return of capital at year end.
Federal and other taxes
The Fund intends to continue to qualify as a regulated investment company by distributing substantially all of its investment company taxable income and any net realized capital gains (after reduction for capital loss carryforwards) sufficient to relieve it from all, or substantially all, federal income taxes. Accordingly, no provision for federal income taxes was required.
The Fund’s income and federal excise tax returns and all financial records supporting those returns for the prior three fiscal years are subject to examination by the federal and Delaware revenue authorities. Management has analyzed the Fund's tax positions taken on federal, state, and foreign tax returns, as applicable, for all open tax years and does not believe that there are any uncertain tax positions that require recognition of a tax liability.
As of January 31, 2023, the aggregate cost of all investments for federal income tax purposes was $400,381,045 and the unrealized gains (losses) consisted of:
| Gross unrealized gains | $340,101,299 |
| Gross unrealized losses | (4,857,359) |
| Net unrealized gains | $335,243,940 |
As of July 31, 2022, the Fund had a qualified late-year ordinary loss of $1,787,517 which was recognized on the first day of the current fiscal year.
Class allocations
The separate classes of shares offered by the Fund differ principally in applicable sales charges, distribution, shareholder servicing, and administration fees. Class specific expenses are charged directly to that share class. Investment income, common fund-level expenses, and realized and unrealized gains (losses) on investments are allocated daily to each class of shares based on the relative proportion of net assets of each class.
3. FAIR VALUATION MEASUREMENTS
Fair value measurements of investments are determined within a framework that has established a fair value hierarchy based upon the various data inputs utilized in determining the value of the Fund’s investments. The three-level hierarchy gives the highest priority to unadjusted quoted prices in active markets for identical assets or liabilities (Level 1) and the lowest priority to unobservable inputs (Level 3). The Fund’s investments are classified within the fair value hierarchy based on the lowest level of input that is significant to the fair value measurement. The inputs are summarized into three broad levels as follows:
| ■ | Level 1 – quoted prices in active markets for identical securities |
| ■ | Level 2 – other significant observable inputs (including quoted prices for similar securities, interest rates, prepayment speeds, credit risk, etc.) |
| ■ | Level 3 – significant unobservable inputs (including the Fund’s own assumptions in determining the fair value of investments) |
The inputs or methodologies used for valuing investments in securities are not necessarily an indication of the risk associated with investing in those securities.
24 | Allspring Large Cap Growth Fund
Notes to financial statements (unaudited)
The following is a summary of the inputs used in valuing the Fund’s assets and liabilities as of January 31, 2023:
| | Quoted prices
(Level 1) | Other significant
observable inputs
(Level 2) | Significant
unobservable inputs
(Level 3) | Total |
| Assets | | | | |
| Investments in: | | | | |
| Common stocks | | | | |
| Communication services | $ 62,085,823 | $0 | $0 | $ 62,085,823 |
| Consumer discretionary | 132,376,242 | 0 | 0 | 132,376,242 |
| Consumer staples | 20,204,401 | 0 | 0 | 20,204,401 |
| Energy | 2,679,906 | 0 | 0 | 2,679,906 |
| Financials | 41,524,127 | 0 | 0 | 41,524,127 |
| Health care | 116,557,618 | 0 | 0 | 116,557,618 |
| Industrials | 59,979,688 | 0 | 0 | 59,979,688 |
| Information technology | 268,268,403 | 0 | 0 | 268,268,403 |
| Materials | 11,285,717 | 0 | 0 | 11,285,717 |
| Real estate | 13,676,817 | 0 | 0 | 13,676,817 |
| Short-term investments | | | | |
| Investment companies | 6,986,243 | 0 | 0 | 6,986,243 |
| Total assets | $735,624,985 | $0 | $0 | $735,624,985 |
Additional sector, industry or geographic detail, if any, is included in the Portfolio of Investments.
For the six months ended January 31, 2023, the Fund did not have any transfers into/out of Level 3.
4. TRANSACTIONS WITH AFFILIATES
Management fee
Allspring Funds Management, a wholly owned subsidiary of Allspring Global Investments Holdings, LLC, a holding company indirectly owned by certain private funds of GTCR LLC and Reverence Capital Partners, L.P., is the manager of the Fund and provides advisory and fund-level administrative services under an investment management agreement. Under the investment management agreement, Allspring Funds Management is responsible for, among other services, implementing the investment objectives and strategies of the Fund, supervising the subadviser and providing fund-level administrative services in connection with the Fund’s operations. As compensation for its services under the investment management agreement, Allspring Funds Management is entitled to receive a management fee at the following annual rate based on the Fund’s average daily net assets:
| Average daily net assets | Management fee |
| First $500 million | 0.700% |
| Next $500 million | 0.675 |
| Next $1 billion | 0.650 |
| Next $2 billion | 0.625 |
| Next $1 billion | 0.600 |
| Next $3 billion | 0.590 |
| Next $2 billion | 0.565 |
| Next $2 billion | 0.555 |
| Next $4 billion | 0.530 |
| Over $16 billion | 0.505 |
For the six months ended January 31, 2023, the management fee was equivalent to an annual rate of 0.69% of the Fund’s average daily net assets.
Allspring Large Cap Growth Fund | 25
Notes to financial statements (unaudited)
Allspring Funds Management has retained the services of a subadviser to provide daily portfolio management to the Fund. The fee for subadvisory services is borne by Allspring Funds Management. Allspring Global Investments, LLC ("Allspring Investments"), an affiliate of Allspring Funds Management and a wholly owned subsidiary of Allspring Global Investments Holdings, LLC, is the subadviser to the Fund and is entitled to receive a fee from Allspring Funds Management at an annual rate starting at 0.30% and declining to 0.20% as the average daily net assets of the Fund increase.
Administration fees
Under a class-level administration agreement, Allspring Funds Management provides class-level administrative services to the Fund, which includes paying fees and expenses for services provided by the transfer agent, sub-transfer agents, omnibus account servicers and record-keepers. As compensation for its services under the class-level administration agreement, Allspring Funds Management receives an annual fee which is calculated based on the average daily net assets of each class as follows:
| | Class-level
administration fee |
| Class A | 0.21% |
| Class C | 0.21 |
| Class R | 0.21 |
| Class R4 | 0.08 |
| Class R6 | 0.03 |
| Administrator Class | 0.13 |
| Institutional Class | 0.13 |
Waivers and/or expense reimbursements
Allspring Funds Management has contractually committed to waive and/or reimburse management and administration fees to the extent necessary to maintain certain net operating expense ratios for the Fund. When each class of the Fund has exceeded its expense cap, Allspring Funds Management will waive fees and/or reimburse expenses from fund-level expenses on a proportionate basis and then from class specific expenses. When only certain classes exceed their expense caps, waivers and/or reimbursements are applied against class specific expenses before fund-level expenses. Allspring Funds Management has contractually committed through November 30, 2023 to waive fees and/or reimburse expenses to the extent necessary to cap expenses. Prior to or after the commitment expiration date, the caps may be increased or the commitment to maintain the caps may be terminated only with the approval of the Board of Trustees. As of January 31, 2023, the contractual expense caps are as follows:
| | Expense ratio caps |
| Class A | 1.07% |
| Class C | 1.82 |
| Class R | 1.32 |
| Class R4 | 0.80 |
| Class R6 | 0.65 |
| Administrator Class | 0.95 |
| Institutional Class | 0.75 |
Distribution fees
The Trust has adopted a distribution plan for Class C and Class R shares pursuant to Rule 12b-1 under the 1940 Act. Distribution fees are charged to Class C and Class R shares and paid to Allspring Funds Distributor, LLC ("Allspring Funds Distributor"), the principal underwriter, an affiliate of Allspring Funds Management, at an annual rate up to 0.75% of the average daily net assets of Class C shares and up to 0.25% of the average daily net assets of Class R shares.
In addition, Allspring Funds Distributor is entitled to receive the front-end sales charge from the purchase of Class A shares and a contingent deferred sales charge on the redemption of certain Class A shares. Allspring Funds Distributor is also entitled to
26 | Allspring Large Cap Growth Fund
Notes to financial statements (unaudited)
receive the contingent deferred sales charges from redemptions of Class C shares. For the six months ended January 31, 2023, Allspring Funds Distributor received $267 from the sale of Class A shares. No contingent deferred sales charges were incurred by Class A and Class C shares for the six months ended January 31, 2023.
Shareholder servicing fees
The Trust has entered into contracts with one or more shareholder servicing agents, whereby Class A, Class C, Class R, and Administrator Class are charged a fee at an annual rate up to 0.25% of the average daily net assets of each respective class. Class R4 is charged a fee at an annual rate up to 0.10% of its average daily net assets. A portion of these total shareholder servicing fees were paid to affiliates of the Fund.
Interfund transactions
The Fund may purchase or sell portfolio investment securities to certain affiliates pursuant to Rule 17a-7 under the 1940 Act and under procedures adopted by the Board of Trustees. The procedures have been designed to ensure that these interfund transactions, which do not incur broker commissions, are effected at current market prices.
5. INVESTMENT PORTFOLIO TRANSACTIONS
Purchases and sales of investments, excluding U.S. government obligations (if any) and short-term securities, for the six months ended January 31, 2023 were $179,954,574 and $216,416,169, respectively.
6. SECURITIES LENDING TRANSACTIONS
The Fund lends its securities through an unaffiliated securities lending agent and receives collateral in the form of cash or securities with a value at least equal to the value of the securities on loan. The value of the loaned securities is determined at the close of each business day and any increases or decreases in the required collateral are exchanged between the Fund and the counterparty on the next business day. Cash collateral received is invested in the Securities Lending Fund which seeks to provide a positive return compared to the daily Federal Funds Open Rate by investing in high-quality, U.S. dollar-denominated short-term money market instruments and is exempt from registration under Section 3(c)(7) of the 1940 Act. Securities Lending Fund is managed by Allspring Funds Management and is subadvised by Allspring Investments. Allspring Funds Management receives an advisory fee starting at 0.05% and declining to 0.01% as the average daily net assets of the Securities Lending Fund increase. All of the fees received by Allspring Funds Management are paid to Allspring Investments for its services as subadviser.
In the event of counterparty default or the failure of a borrower to return a loaned security, the Fund has the right to use the collateral to offset any losses incurred. As of January 31, 2023, the Fund did not have any securities on loan.
7. BANK BORROWINGS
The Trust (excluding the money market funds), Allspring Master Trust and Allspring Variable Trust are parties to a $350,000,000 revolving credit agreement whereby the Fund is permitted to use bank borrowings for temporary or emergency purposes, such as to fund shareholder redemption requests. Interest under the credit agreement is charged to the Fund based on a borrowing rate equal to the higher of the Federal Funds rate or the overnight bank funding rate in effect on that day plus a spread. In addition, an annual commitment fee equal based on the unused balance is allocated to each participating fund.
For the six months ended January 31, 2023, there were no borrowings by the Fund under the agreement.
8. CONCENTRATION RISKS
As of the end of the period, the Fund concentrated its portfolio of investments in the information technology sector. A fund that invests a substantial portion of its assets in any sector may be more affected by changes in that sector than would be a fund whose investments are not heavily weighted in any sector.
9. MARKET RISKS
On March 11, 2020, the World Health Organization announced that it had made the assessment that coronavirus disease 2019 (“COVID-19”) is a pandemic. The impacts of COVID-19 are affecting the entire global economy, individual companies and investment products, the funds, and the market in general. There is significant uncertainty around the extent and duration of business disruptions related to COVID-19 and the impacts may last for an extended period of time. COVID-19 has led to significant uncertainty and volatility in the financial markets.
Allspring Large Cap Growth Fund | 27
Notes to financial statements (unaudited)
10. INDEMNIFICATION
Under the Fund's organizational documents, the officers and Trustees have been granted certain indemnification rights against certain liabilities that may arise out of performance of their duties to the Fund. The Fund has entered into a separate agreement with each Trustee that converts indemnification rights currently existing under the Fund’s organizational documents into contractual rights that cannot be changed in the future without the consent of the Trustee. Additionally, in the normal course of business, the Fund may enter into contracts with service providers that contain a variety of indemnification clauses. The Fund’s maximum exposure under these arrangements is dependent on future claims that may be made against the Fund and, therefore, cannot be estimated.
28 | Allspring Large Cap Growth Fund
Other information (unaudited)
PROXY VOTING INFORMATION
A description of the policies and procedures used to determine how to vote proxies relating to portfolio securities is available without charge, upon request, by calling 1-800-222-8222, visiting our website at allspringglobal.com, or visiting the SEC website at sec.gov. Information regarding how the proxies related to portfolio securities were voted during the most recent 12-month period ended June 30 is available on the website at allspringglobal.com or by visiting the SEC website at sec.gov.
QUARTERLY PORTFOLIO HOLDINGS INFORMATION
The Fund files its complete schedule of portfolio holdings with the SEC for the first and third quarters of each fiscal year as an exhibit to its reports on Form N-PORT. Shareholders may view the filed Form N-PORT by visiting the SEC website at sec.gov.
Allspring Large Cap Growth Fund | 29
Other information (unaudited)
BOARD OF TRUSTEES AND OFFICERS
Each of the Trustees and Officers listed in the table below acts in identical capacities for each fund in the Allspring family of funds, which consists of 127 mutual funds comprising the Allspring Funds Trust, Allspring Variable Trust, Allspring Master Trust and four closed-end funds (collectively the “Fund Complex”). This table should be read in conjunction with the Prospectus and the Statement of Additional Information1. The mailing address of each Trustee and Officer is 1415 Vantage Park Drive, 3rd Floor, Charlotte, NC 28203. Each Trustee and Officer serves an indefinite term, however, each Trustee serves such term until reaching the mandatory retirement age established by the Trustees.
Independent Trustees
Name and
year of birth | Position held and
length of service* | Principal occupations during past five years or longer | Current other
public company or
investment
company
directorships |
William R. Ebsworth
(Born 1957) | Trustee,
since 2015 | Retired. From 1984 to 2013, equities analyst, portfolio manager, research director and chief investment officer at Fidelity Management and Research Company in Boston, Tokyo, and Hong Kong, and retired in 2013 as Chief Investment Officer of Fidelity Strategic Advisers, Inc. where he led a team of investment professionals managing client assets. Prior thereto, Board member of Hong Kong Securities Clearing Co., Hong Kong Options Clearing Corp., the Thailand International Fund, Ltd., Fidelity Investments Life Insurance Company, and Empire Fidelity Investments Life Insurance Company. Audit Committee Chair and Investment Committee Chair of the Vincent Memorial Hospital Foundation (non-profit organization). Mr. Ebsworth is a CFA® charterholder. | N/A |
Jane A. Freeman
(Born 1953) | Trustee,
since 2015;
Chair Liaison,
since 2018 | Retired. From 2012 to 2014 and 1999 to 2008, Chief Financial Officer of Scientific Learning Corporation. From 2008 to 2012, Ms. Freeman provided consulting services related to strategic business projects. Prior to 1999, Portfolio Manager at Rockefeller & Co. and Scudder, Stevens & Clark. Board member of the Harding Loevner Funds from 1996 to 2014, serving as both Lead Independent Director and chair of the Audit Committee. Board member of the Russell Exchange Traded Funds Trust from 2011 to 2012 and the chair of the Audit Committee. Ms. Freeman is also an inactive Chartered Financial Analyst. | N/A |
Isaiah Harris, Jr.
(Born 1952) | Trustee,
since 2009; Audit
Committee
Chair,
since 2019 | Retired. Member of the Advisory Board of CEF of East Central Florida. Chairman of the Board of CIGNA Corporation from 2009 to 2021, and Director from 2005 to 2008. From 2003 to 2011, Director of Deluxe Corporation. Prior thereto, President and CEO of BellSouth Advertising and Publishing Corp. from 2005 to 2007, President and CEO of BellSouth Enterprises from 2004 to 2005 and President of BellSouth Consumer Services from 2000 to 2003. Emeritus member of the Iowa State University Foundation Board of Governors. Emeritus Member of the Advisory Board of Iowa State University School of Business. Advisory Board Member, Palm Harbor Academy (private school). Advisory Board Member, Fellowship of Christian Athletes. Mr. Harris is a certified public accountant (inactive status). | N/A |
David F. Larcker
(Born 1950) | Trustee,
since 2009 | Distinguished Visiting Fellow at the Hoover Institution since 2022. James Irvin Miller Professor of Accounting at the Graduate School of Business (Emeritus), Stanford University, Director of the Corporate Governance Research Initiative and Senior Faculty of The Rock Center for Corporate Governance since 2006. From 2005 to 2008, Professor of Accounting at the Graduate School of Business, Stanford University. Prior thereto, Ernst & Young Professor of Accounting at The Wharton School, University of Pennsylvania from 1985 to 2005. | N/A |
30 | Allspring Large Cap Growth Fund
Other information (unaudited)
Name and
year of birth | Position held and
length of service* | Principal occupations during past five years or longer | Current other
public company or
investment
company
directorships |
Olivia S. Mitchell
(Born 1953) | Trustee,
since 2006;
Nominating and
Governance
Committee Chair,
since 2018 | International Foundation of Employee Benefit Plans Professor since 1993, Wharton School of the University of Pennsylvania. Director of Wharton’s Pension Research Council and Boettner Center on Pensions & Retirement Research, and Research Associate at the National Bureau of Economic Research. Previously taught at Cornell University from 1978 to 1993. | N/A |
Timothy J. Penny
(Born 1951) | Trustee,
since 1996;
Chair,
since 2018 | President and Chief Executive Officer of Southern Minnesota Initiative Foundation, a non-profit organization, since 2007. Vice Chair of the Economic Club of Minnesota, since 2007. Co-Chair of the Committee for a Responsible Federal Budget, since 1995. Member of the Board of Trustees of NorthStar Education Finance, Inc., a non-profit organization, from 2007-2022. Senior Fellow of the University of Minnesota Humphrey Institute from 1995 to 2017. | N/A |
James G. Polisson
(Born 1959) | Trustee,
since 2018 | Retired. Chief Marketing Officer, Source (ETF) UK Services, Ltd, from 2015 to 2017. From 2012 to 2015, Principal of The Polisson Group, LLC, a management consulting, corporate advisory and principal investing company. Chief Executive Officer and Managing Director at Russell Investments, Global Exchange Traded Funds from 2010 to 2012. Managing Director of Barclays Global Investors from 1998 to 2010 and Global Chief Marketing Officer for iShares and Barclays Global Investors from 2000 to 2010. Trustee of the San Francisco Mechanics’ Institute, a non-profit organization, from 2013 to 2015. Board member of the Russell Exchange Traded Fund Trust from 2011 to 2012. Director of Barclays Global Investors Holdings Deutschland GmbH from 2006 to 2009. Mr. Polisson is an attorney and has a retired status with the Massachusetts and District of Columbia Bar Associations. | N/A |
Pamela Wheelock
(Born 1959) | Trustee,
since January
2020; previously
Trustee from
January 2018 to
July 2019 | Retired. Executive and Senior Financial leadership positions in the public, private and nonprofit sectors. Interim President and CEO, McKnight Foundation, 2020. Interim Commissioner, Minnesota Department of Human Services, 2019. Chief Operating Officer, Twin Cities Habitat for Humanity, 2017-2019. Vice President for University Services, University of Minnesota, 2012-2016. Interim President and CEO, Blue Cross and Blue Shield of Minnesota, 2011-2012. Executive Vice-President and Chief Financial Officer, Minnesota Wild, 2002-2008. Commissioner, Minnesota Department of Finance, 1999-2002. Chair of the Board of Directors of Destination Medical Center Corporation. Board member of the Minnesota Wild Foundation. | N/A |
* Length of service dates reflect the Trustee’s commencement of service with the Trust’s predecessor entities, where applicable.
Allspring Large Cap Growth Fund | 31
Other information (unaudited)
Officers2
Name and
year of birth | Position held and
length of service | Principal occupations during past five years or longer |
Andrew Owen
(Born 1960) | President,
since 2017 | President and Chief Executive Officer of Allspring Funds Management, LLC since 2017 and Head of Global Fund Governance of Allspring Global Investments since 2022. Prior thereto, co-president of Galliard Capital Management, LLC, an affiliate of Allspring Funds Management, LLC, from 2019 to 2022 and Head of Affiliated Managers, Allspring Global Investments, from 2014 to 2019 and Executive Vice President responsible for marketing, investments and product development for Allspring Funds Management, LLC, from 2009 to 2014. |
Jeremy DePalma
(Born 1974) | Treasurer,
since 2012
(for certain funds in
the Fund Complex);
since 2021 (for
the remaining funds in the
Fund Complex) | Senior Vice President of Allspring Funds Management, LLC since 2009. Senior Vice President of Evergreen Investment Management Company, LLC from 2008 to 2010 and head of the Fund Reporting and Control Team within Fund Administration from 2005 to 2010. |
Christopher Baker
(Born 1976) | Chief Compliance Officer, since 2022 | Global Chief Compliance Officer for Allspring Global Investments since 2022. Prior thereto, Chief Compliance Officer for State Street Global Advisors from 2018 to 2021. Senior Compliance Officer for the State Street divisions of Alternative Investment Solutions, Sector Solutions, and Global Marketing from 2015 to 2018. From 2010 to 2015 Vice President, Global Head of Investment and Marketing Compliance for State Street Global Advisors. |
Matthew Prasse
(Born 1983) | Chief Legal Officer, since 2022; Secretary, since 2021 | Senior Counsel of the Allspring Legal Department since 2021. Senior Counsel of the Wells Fargo Legal Department from 2018 to 2021. Previously, Counsel for Barings LLC from 2015 to 2018. Prior to joining Barings, Associate at Morgan, Lewis & Bockius LLP from 2008 to 2015. |
1 The Statement of Additional Information includes additional information about the Trustees and is available, without charge, upon request, by calling 1-800-222-8222 or by visiting the website at allspringglobal.com.
2 For those Officers with tenures at Allspring Global Investments and/or Allspring Funds Management, LLC that began prior to 2021, such tenures include years of service during which these businesses/entities were known as Wells Fargo Asset Management and Wells Fargo Funds Management, LLC, respectively.
32 | Allspring Large Cap Growth Fund
For more information
More information about Allspring Funds is available free upon request. To obtain literature, please write, visit the Fund's website, or call:
Allspring Funds
P.O. Box 219967
Kansas City, MO 64121-9967
Website: allspringglobal.com
Individual investors: 1-800-222-8222
Retail investment professionals: 1-888-877-9275
Institutional investment professionals: 1-800-260-5969
This report and the financial statements contained herein are submitted for the general information of the shareholders of the Fund. If this report is used for promotional purposes, distribution of the report must be accompanied or preceded by a current prospectus. Before investing, please consider the investment objectives, risks, charges, and expenses of the investment. For a current prospectus and, if available, a summary prospectus, containing this information, call
1-800-222-8222 or visit the Fund's website at allspringglobal.com. Read the prospectus carefully before you invest or send money.
Allspring Global InvestmentsTM is the trade name for the asset management firms of Allspring Global Investments Holdings, LLC, a holding company indirectly owned by certain private funds of GTCR LLC and Reverence Capital Partners, L.P. These firms include but are not limited to Allspring Global Investments, LLC, and Allspring Funds Management, LLC. Certain products managed by Allspring entities are distributed by Allspring Funds Distributor, LLC (a broker-dealer and Member FINRA/SIPC).
This material is for general informational and educational purposes only and is NOT intended to provide investment advice or a recommendation of any kind - including a recommendation for any specific investment, strategy, or plan.
© 2023 Allspring Global Investments Holdings, LLC. All rights reserved.
ALL-02092023-zdesq57j 03-23
SAR3354 01-23
Semi-Annual Report
January 31, 2023
Allspring
Large Company Value Fund
The views expressed and any forward-looking statements are as of January 31, 2023, unless otherwise noted, and are those of the Fund's portfolio managers and/or Allspring Global Investments. Discussions of individual securities or the markets generally are not intended as individual recommendations. Future events or results may vary significantly from those expressed in any forward-looking statements. The views expressed are subject to change at any time in response to changing circumstances in the market. Allspring Global Investments disclaims any obligation to publicly update or revise any views expressed or forward-looking statements.
Allspring Large Company Value Fund | 1
Letter to shareholders (unaudited)
Andrew Owen
President
Allspring Funds
Dear Shareholder:
We are pleased to offer you this semi-annual report for the Allspring Large Company Value Fund for the six-month period that ended January 31, 2023. Globally, stocks and bonds experienced heightened volatility through the challenging period. Earlier tailwinds provided by global stimulus programs, vaccination rollouts, and recovering consumer and corporate sentiment were wiped away by the highest rate of inflation in four decades as well as the impact of ongoing aggressive central bank rate hikes and the prospect of more rate hikes. Compounding these concerns were the global reverberations of the Russia-Ukraine war and the impact of China’s strict COVID-19 lockdowns.
For the six-month period, stocks and bonds had mixed results, with non-U.S. equities––both developed market and emerging market––outperforming U.S. stocks overall. Bonds––both U.S. and non-U.S.––struggled to cope with sustained aggressive interest rate increases. For the period, U.S. stocks, based on the S&P 500 Index,1 lost 0.44%. International stocks, as measured by the MSCI ACWI ex USA Index (Net),2 returned 7.63%, while the MSCI EM Index (Net) (USD)3 gained 4.92%. Among bond indexes, the Bloomberg U.S. Aggregate Bond Index4 returned -2.37%, the Bloomberg Global Aggregate ex-USD Index (unhedged)5 returned -1.15%, the Bloomberg Municipal Bond Index6 gained 0.73%, and the ICE BofA U.S. High Yield Index7 returned 1.27%.
The Russia-Ukraine war, high inflation, and central bank rate hikes rocked markets
August was yet another broadly challenging month for financial markets, with more red ink flowing. High inflation persisted, cresting 9% in the eurozone on an annual basis and remaining above 8% in the U.S. despite the Federal Reserve’s (Fed’s) aggressive monetary policy and a major drop in global crude oil and gasoline prices from their June peak. One positive note was the resilience of the U.S. job market. However, the Fed’s job was clearly not complete. One longer-term bright spot was the U.S. Congress’s passage of the Inflation Reduction Act. Its primary stated goals include: to reduce inflation (though not immediately) by curbing the deficit, capping health care spending by seniors, and investing in domestic sources of clean energy.
“August was yet another broadly challenging month for financial markets, with more red ink flowing.”
| 1 | The S&P 500 Index consists of 500 stocks chosen for market size, liquidity, and industry group representation. It is a market-value-weighted index with each stock's weight in the index proportionate to its market value. You cannot invest directly in an index. |
| 2 | The Morgan Stanley Capital International (MSCI) All Country World Index (ACWI) ex USA Index (Net) is a free-float-adjusted market-capitalization-weighted index that is designed to measure the equity market performance of developed and emerging markets, excluding the U.S. Source: MSCI. MSCI makes no express or implied warranties or representations and shall have no liability whatsoever with respect to any MSCI data contained herein. The MSCI data may not be further redistributed or used as a basis for other indexes or any securities or financial products. This report is not approved, reviewed, or produced by MSCI. You cannot invest directly in an index. |
| 3 | The MSCI Emerging Markets (EM) Index (Net) (USD) is a free-float-adjusted market-capitalization-weighted index that is designed to measure equity market performance of emerging markets. You cannot invest directly in an index. |
| 4 | The Bloomberg U.S. Aggregate Bond Index is a broad-based benchmark that measures the investment-grade, U.S.-dollar-denominated, fixed-rate taxable bond market, including Treasuries, government-related and corporate securities, mortgage-backed securities (agency fixed-rate and hybrid adjustable-rate mortgage pass-throughs), asset-backed securities, and commercial mortgage-backed securities. You cannot invest directly in an index. |
| 5 | The Bloomberg Global Aggregate ex-USD Index (unhedged) is an unmanaged index that provides a broad-based measure of the global investment-grade fixed-income markets excluding the U.S.-dollar-denominated debt market. You cannot invest directly in an index. |
| 6 | The Bloomberg Municipal Bond Index is an unmanaged index composed of long-term tax-exempt bonds with a minimum credit rating of Baa. You cannot invest directly in an index. |
| 7 | The ICE BofA U.S. High Yield Index is a market-capitalization-weighted index of domestic and Yankee high-yield bonds. The index tracks the performance of high-yield securities traded in the U.S. bond market. You cannot invest directly in an index. Copyright 2023. ICE Data Indices, LLC. All rights reserved. |
2 | Allspring Large Company Value Fund
Letter to shareholders (unaudited)
The market misery continued in September. There was nowhere to hide as all asset classes suffered major losses at the hands of persistent inflation. Central banks kept up their battle against rapidly rising prices with more rate hikes. The strength of the U.S. dollar made things even more difficult for investors holding assets in other currencies. U.S. mortgage rates jumped to near 7% on 30-year fixed-rate mortgages; the decreased housing affordability began to cool demand somewhat. The U.K. experienced a sharp sell-off of government bonds and the British pound in September as investors panicked in response to a new government budget that was seen as financially unsound. The market meltdown forced the Bank of England to step in and buy long-dated government bonds.
Equities had a reprieve in October after two months of sharp declines. Value stocks and small caps fared best. Globally, developed markets outpaced emerging market equities, which were hurt by weakness among Chinese stocks. Central banks continued to try to curtail high inflation with aggressive interest rate hikes. Geopolitical risks persisted, including the ongoing Russia-Ukraine war and economic, financial market, and political turmoil in the U.K., which led to a second prime ministerial change in six weeks, as Rishi Sunak replaced Liz Truss in late October. Concerns over Europe’s energy crisis eased thanks to unseasonably warm weather and plentiful gas on hand. The U.S. labor market continued its resilience against rising prices, as unemployment stood at 3.7%, near a record low.
Stocks and bonds rallied in November, with emerging market equities gaining nearly 15% and developed market equities returning 7%. The S&P 500 Index rose 5.6% in November. Bonds also had positive monthly returns. Economic news was encouraging, driven by U.S. labor market strength. Although central banks kept raising rates, expectations grew regarding an impending easing in the pace of rate hikes and a possible end to central bank monetary tightening in 2023. Although inflation remained at record highs in the eurozone, with a 10.6% annual increase in October, Germany’s producer prices decreased 4.2% annually, signaling a possible decline in inflationary pressures. Meanwhile, U.S. inflation continued to moderate, with a 7.1% annual price rise in November and a monthly price increase of just 0.1%. China’s economic data remained weak, reflecting its zero-COVID-19 policy.
Financial markets cooled in December, with U.S. equities posting negative overall results in response to a weakening U.S. dollar. Fixed income securities ended one of their worst years ever with flat overall monthly returns as markets weighed the hopes for an end to the monetary tightening cycle with the reality that central banks had not completed their jobs yet. U.S. Consumer Price Index (CPI)1 data showed a strong consistent trend downward, which brought down the 12-month CPI to 6.5% in December from 9.1% in June. Other countries and regions reported still-high but declining inflation rates as the year winded down.
The year 2023 began with a broad rally across global equities and fixed income securities. Investor optimism rose in response to data indicating declining inflation rates and the reopening of China’s economy with the abrupt end to its zero-COVID-19 policy. The U.S. reported surprisingly strong job gains––employers added more than 500,000 jobs––and unemployment fell to 3.4%, the lowest level since 1969. Meanwhile, wage growth, seen as a potential contributor to ongoing high inflation, continued to moderate. All eyes remained fixed on the Fed and on how many additional rate hikes it will announce before reaching the peak (“terminal”) rate, expected to be above 5%. The 0.25% federal funds rate hike announced in January was the Fed’s smallest rate increase since March 2022.
| 1 | The Consumer Price Index (CPI) is a measure of the average change over time in the prices paid by urban consumers for a market basket of consumer goods and services. You cannot invest directly in an index. |
Allspring Large Company Value Fund | 3
Letter to shareholders (unaudited)
Don’t let short-term uncertainty derail long-term investment goals.
Periods of investment uncertainty can present challenges, but experience has taught us that maintaining long-term investment goals can be an effective way to plan for the future. To help you create a sound strategy based on your personal goals and risk tolerance, Allspring Funds offers more than 100 mutual funds spanning a wide range of asset classes and investment styles. Although diversification cannot guarantee an investment profit or prevent losses, we believe it can be an effective way to manage investment risk and potentially smooth out overall portfolio performance. We encourage investors to know their investments and to understand that appropriate levels of risk-taking may unlock opportunities.
Thank you for choosing to invest with Allspring Funds. We appreciate your confidence in us and remain committed to helping you meet your financial needs.
Sincerely,
Andrew Owen
President
Allspring Funds
For further information about your fund, contact your investment professional, visit our website at allspringglobal.com, or call us directly at 1-800-222-8222.
4 | Allspring Large Company Value Fund
This page is intentionally left blank.
Performance highlights (unaudited)
| Investment objective | The Fund seeks long-term capital appreciation. |
| Manager | Allspring Funds Management, LLC |
| Subadviser | Allspring Global Investments, LLC |
| Portfolio managers | Ryan Brown, CFA®‡, Harindra de Silva, Ph.D., CFA®‡ |
| Average annual total returns (%) as of January 31, 2023 |
| | | Including sales charge | | Excluding sales charge | | Expense ratios1 (%) |
| | Inception date | 1 year | 5 year | 10 year | | 1 year | 5 year | 10 year | | Gross | Net 2 |
| Class A (WLCAX) | 3-31-2008 | -7.70 | 6.16 | 9.01 | | -2.04 | 7.43 | 9.65 | | 0.96 | 0.83 |
| Class C (WFLVX) | 3-31-2008 | -3.78 | 6.62 | 9.00 | | -2.78 | 6.62 | 9.00 | | 1.71 | 1.58 |
| Class R6 (WTLVX)3 | 4-7-2017 | – | – | – | | -1.67 | 7.88 | 10.12 | | 0.53 | 0.40 |
| Administrator Class (WWIDX) | 12-31-2001 | – | – | – | | -2.03 | 7.50 | 9.79 | | 0.88 | 0.75 |
| Institutional Class (WLCIX) | 3-31-2008 | – | – | – | | -1.78 | 7.77 | 10.05 | | 0.63 | 0.50 |
| Russell 1000® Value Index4 | – | – | – | – | | -0.43 | 6.94 | 10.15 | | – | – |
Figures quoted represent past performance, which is no guarantee of future results, and do not reflect taxes that a shareholder may pay on an investment in a fund. Investment return and principal value of an investment will fluctuate so that an investor’s shares, when redeemed, may be worth more or less than their original cost. Performance shown without sales charges would be lower if sales charges were reflected. Current performance may be lower or higher than the performance data quoted, which assumes the reinvestment of dividends and capital gains. Current month-end performance is available on the Fund’s website, allspringglobal.com.
Index returns do not include transaction costs associated with buying and selling securities, any mutual fund fees or expenses, or any taxes. It is not possible to invest directly in an index.
For Class A shares, the maximum front-end sales charge is 5.75%. For Class C shares, the maximum contingent deferred sales charge is 1.00%. Performance including a contingent deferred sales charge assumes the sales charge for the corresponding time period. Class R6, Administrator Class and Institutional Class shares are sold without a front-end sales charge or contingent deferred sales charge.
| 1 | Reflects the expense ratios as stated in the most recent prospectuses. The expense ratios shown are subject to change and may differ from the annualized expense ratios shown in the financial highlights of this report. |
| 2 | The manager has contractually committed through November 30, 2023, to waive fees and/or reimburse expenses to the extent necessary to cap total annual fund operating expenses after fee waivers at 0.83% for Class A, 1.58% for Class C, 0.40% for Class R6, 0.75% for Administrator Class, and 0.50% for Institutional Class. Brokerage commissions, stamp duty fees, interest, taxes, acquired fund fees and expenses (if any) from funds in which the affiliated master portfolio invests, and extraordinary expenses are excluded from the expense caps. Prior to or after the commitment expiration date, the caps may be increased or the commitment to maintain the caps may be terminated only with the approval of the Board of Trustees. Without these caps, the Fund’s returns would have been lower. The expense ratio paid by an investor is the net expense ratio (the total annual fund operating expenses after fee waivers) as stated in the prospectuses. |
| 3 | Historical performance shown for the Class R6 shares prior to their inception reflects the performance of the Institutional Class shares, and includes the higher expenses applicable to the Institutional Class shares. If these expenses had not been included, returns for the Class R6 shares would be higher. |
| 4 | The Russell 1000® Value Index measures the performance of those Russell 1000 companies with lower price/book ratios and lower forecasted growth values. You cannot invest directly in an index. |
Stock values fluctuate in response to the activities of individual companies and general market and economic conditions. Certain investment strategies tend to increase the total risk of an investment (relative to the broader market). This fund is exposed to foreign investment risk. Consult the Fund’s prospectus for additional information on these and other risks.
| ‡ | CFA® and Chartered Financial Analyst® are trademarks owned by CFA Institute. |
6 | Allspring Large Company Value Fund
Performance highlights (unaudited)
| Ten largest holdings (%) as of January 31, 20231 |
| Berkshire Hathaway Incorporated Class B | 3.76 |
| JPMorgan Chase & Company | 3.00 |
| Exxon Mobil Corporation | 2.99 |
| Linde plc | 2.75 |
| S&P Global Incorporated | 2.75 |
| AT&T Incorporated | 2.53 |
| NextEra Energy Incorporated | 2.49 |
| Bank of America Corporation | 2.29 |
| Realty Income Corporation | 2.28 |
| Elevance Health Incorporated | 2.22 |
| 1 | Figures represent the percentage of the Fund's net assets. Holdings are subject to change and may have changed since the date specified. |
| Sector allocation as of January 31, 20231 |
| 1 | Figures represent the percentage of the Fund's long-term investments. Allocations are subject to change and may have changed since the date specified. |
Allspring Large Company Value Fund | 7
Fund expenses (unaudited)
As a shareholder of the Fund, you incur two types of costs: (1) transaction costs, including sales charges (loads) on purchase payments and contingent deferred sales charges (if any) on redemptions and (2) ongoing costs, including management fees, distribution (12b-1) and/or shareholder servicing fees, and other Fund expenses. This example is intended to help you understand your ongoing costs (in dollars) of investing in the Fund and to compare these costs with the ongoing costs of investing in other mutual funds.
The example is based on an investment of $1,000 invested at the beginning of the six-month period and held for the entire period from August 1, 2022 to January 31, 2023.
Actual expenses
The “Actual” line of the table below provides information about actual account values and actual expenses. You may use the information in this line, together with the amount you invested, to estimate the expenses that you paid over the period. Simply divide your account value by $1,000 (for example, an $8,600 account value divided by $1,000 = 8.6), then multiply the result by the number in the “Actual” line under the heading entitled “Expenses paid during period” for your applicable class of shares to estimate the expenses you paid on your account during this period.
Hypothetical example for comparison purposes
The “Hypothetical” line of the table below provides information about hypothetical account values and hypothetical expenses based on the Fund’s actual expense ratio and an assumed rate of return of 5% per year before expenses, which is not the Fund’s actual return. The hypothetical account values and expenses may not be used to estimate the actual ending account balance or expenses you paid for the period. You may use this information to compare the ongoing costs of investing in the Fund and other funds. To do so, compare this 5% hypothetical example with the 5% hypothetical examples that appear in the shareholder reports of the other funds.
Please note that the expenses shown in the table are meant to highlight your ongoing costs only and do not reflect any transactional costs, such as sales charges (loads) and contingent deferred sales charges. Therefore, the “Hypothetical” line of the table is useful in comparing ongoing costs only, and will not help you determine the relative total costs of owning different funds. In addition, if these transactional costs were included, your costs would have been higher.
| | Beginning
account value
8-1-2022 | Ending
account value
1-31-2023 | Expenses
paid during
the period1 | Annualized net
expense ratio |
| Class A | | | | |
| Actual | $1,000.00 | $1,034.31 | $4.26 | 0.83% |
| Hypothetical (5% return before expenses) | $1,000.00 | $1,021.02 | $4.23 | 0.83% |
| Class C | | | | |
| Actual | $1,000.00 | $1,031.08 | $8.09 | 1.58% |
| Hypothetical (5% return before expenses) | $1,000.00 | $1,017.24 | $8.03 | 1.58% |
| Class R6 | | | | |
| Actual | $1,000.00 | $1,036.54 | $2.05 | 0.40% |
| Hypothetical (5% return before expenses) | $1,000.00 | $1,023.19 | $2.04 | 0.40% |
| Administrator Class | | | | |
| Actual | $1,000.00 | $1,035.05 | $3.80 | 0.74% |
| Hypothetical (5% return before expenses) | $1,000.00 | $1,021.48 | $3.77 | 0.74% |
| Institutional Class | | | | |
| Actual | $1,000.00 | $1,035.91 | $2.57 | 0.50% |
| Hypothetical (5% return before expenses) | $1,000.00 | $1,022.68 | $2.55 | 0.50% |
1 Expenses paid is equal to the annualized net expense ratio of each class multiplied by the average account value over the period, multiplied by 184 divided by 365 (to reflect the one-half-year period).
8 | Allspring Large Company Value Fund
Portfolio of investments—January 31, 2023 (unaudited)
| | | | | Shares | Value |
| Common stocks: 97.70% | | | | | |
| Communication services: 5.42% | | | | | |
| Diversified telecommunication services: 2.55% | | | | | |
| AT&T Incorporated | | | | 288,766 | $ 5,882,163 |
| Verizon Communications Incorporated | | | | 1,146 | 47,639 |
| | | | | | 5,929,802 |
| Entertainment: 0.37% | | | | | |
| Spotify Technology SA † | | | | 996 | 112,269 |
| The Walt Disney Company † | | | | 6,871 | 745,435 |
| | | | | | 857,704 |
| Interactive media & services: 0.98% | | | | | |
| Meta Platforms Incorporated Class A † | | | | 15,218 | 2,267,025 |
| Media: 1.09% | | | | | |
| Comcast Corporation Class A | | | | 55,799 | 2,195,691 |
| DISH Network Corporation Class A † | | | | 23,179 | 333,546 |
| | | | | | 2,529,237 |
| Wireless telecommunication services: 0.43% | | | | | |
| T-Mobile US Incorporated † | | | | 6,668 | 995,599 |
| Consumer discretionary: 5.30% | | | | | |
| Automobiles: 1.29% | | | | | |
| General Motors Company | | | | 75,858 | 2,982,737 |
| Distributors: 0.02% | | | | | |
| LKQ Corporation | | | | 716 | 42,215 |
| Diversified consumer services: 0.20% | | | | | |
| Graham Holdings Company Class B | | | | 716 | 467,770 |
| Hotels, restaurants & leisure: 1.72% | | | | | |
| Bloomin' Brands Incorporated | | | | 44,784 | 1,086,012 |
| Marriott International Incorporated Class A | | | | 14,625 | 2,547,383 |
| Travel Leisure Company | | | | 8,478 | 359,213 |
| | | | | | 3,992,608 |
| Internet & direct marketing retail: 0.02% | | | | | |
| Amazon.com Incorporated † | | | | 452 | 46,615 |
| Multiline retail: 0.15% | | | | | |
| Macy's Incorporated | | | | 14,410 | 340,508 |
| Specialty retail: 1.90% | | | | | |
| Advance Auto Parts Incorporated | | | | 2,589 | 394,253 |
| AutoZone Incorporated † | | | | 366 | 892,619 |
| O'Reilly Automotive Incorporated † | | | | 3,480 | 2,757,378 |
| Signet Jewelers Limited | | | | 4,706 | 361,468 |
| | | | | | 4,405,718 |
The accompanying notes are an integral part of these financial statements.
Allspring Large Company Value Fund | 9
Portfolio of investments—January 31, 2023 (unaudited)
| | | | | Shares | Value |
| Consumer staples: 8.25% | | | | | |
| Food & staples retailing: 2.54% | | | | | |
| Costco Wholesale Corporation | | | | 5,846 | $ 2,988,124 |
| The Kroger Company | | | | 2,910 | 129,873 |
| Walmart Incorporated | | | | 19,218 | 2,764,894 |
| | | | | | 5,882,891 |
| Food products: 2.22% | | | | | |
| Cal-Maine Foods Incorporated | | | | 49,861 | 2,853,046 |
| General Mills Incorporated | | | | 3,832 | 300,276 |
| Mondelez International Incorporated Class A | | | | 28,581 | 1,870,341 |
| The Hershey Company | | | | 606 | 136,108 |
| | | | | | 5,159,771 |
| Household products: 0.18% | | | | | |
| Colgate-Palmolive Company | | | | 5,549 | 413,567 |
| Personal products: 0.96% | | | | | |
| The Estee Lauder Companies Incorporated Class A | | | | 8,034 | 2,226,061 |
| Tobacco: 2.35% | | | | | |
| Altria Group Incorporated | | | | 63,931 | 2,879,452 |
| Philip Morris International Incorporated | | | | 19,375 | 2,019,650 |
| Vector Group Limited | | | | 41,989 | 543,758 |
| | | | | | 5,442,860 |
| Energy: 7.75% | | | | | |
| Oil, gas & consumable fuels: 7.75% | | | | | |
| Chevron Corporation | | | | 18,663 | 3,247,735 |
| Delek US Holdings Incorporated | | | | 94,487 | 2,528,472 |
| Exxon Mobil Corporation | | | | 59,721 | 6,928,233 |
| Hess Corporation | | | | 15,403 | 2,312,914 |
| Kinder Morgan Incorporated | | | | 23,680 | 433,344 |
| Phillips 66 | | | | 19,545 | 1,959,777 |
| Targa Resources Corporation | | | | 7,489 | 561,825 |
| | | | | | 17,972,300 |
| Financials: 18.17% | | | | | |
| Banks: 7.67% | | | | | |
| Bank of America Corporation | | | | 149,600 | 5,307,808 |
| Bank of N.T. Butterfield & Son Limited | | | | 14,594 | 466,424 |
| Citigroup Incorporated | | | | 85,581 | 4,469,040 |
| Glacier Bancorp Incorporated | | | | 2,025 | 92,320 |
| JPMorgan Chase & Company | | | | 49,614 | 6,943,975 |
| Park National Corporation | | | | 623 | 78,031 |
| PNC Financial Services Group Incorporated | | | | 2,574 | 425,817 |
| | | | | | 17,783,415 |
| Capital markets: 3.36% | | | | | |
| Bank of New York Mellon Corporation | | | | 11,558 | 584,488 |
| BlackRock Incorporated | | | | 521 | 395,548 |
The accompanying notes are an integral part of these financial statements.
10 | Allspring Large Company Value Fund
Portfolio of investments—January 31, 2023 (unaudited)
| | | | | Shares | Value |
| Capital markets (continued) | | | | | |
| Intercontinental Exchange Incorporated | | | | 4,107 | $ 441,708 |
| S&P Global Incorporated | | | | 17,032 | 6,385,978 |
| | | | | | 7,807,722 |
| Diversified financial services: 3.92% | | | | | |
| Berkshire Hathaway Incorporated Class B † | | | | 27,963 | 8,711,034 |
| Jackson Financial Incorporation Class A | | | | 8,470 | 373,019 |
| | | | | | 9,084,053 |
| Insurance: 3.22% | | | | | |
| AFLAC Incorporated | | | | 31,482 | 2,313,927 |
| Arthur J. Gallagher & Company | | | | 20,970 | 4,104,248 |
| Chubb Limited | | | | 2,245 | 510,715 |
| Loews Corporation | | | | 492 | 30,248 |
| Progressive Corporation | | | | 355 | 48,404 |
| Reinsurance Group of America Incorporated | | | | 2,982 | 452,578 |
| | | | | | 7,460,120 |
| Health care: 17.55% | | | | | |
| Biotechnology: 3.61% | | | | | |
| Biogen Incorporated † | | | | 8,347 | 2,428,142 |
| Gilead Sciences Incorporated | | | | 35,764 | 3,002,030 |
| Neurocrine Biosciences Incorporated † | | | | 19,896 | 2,207,063 |
| Sage Therapeutics Incorporated † | | | | 16,696 | 740,301 |
| | | | | | 8,377,536 |
| Health care equipment & supplies: 2.23% | | | | | |
| Baxter International Incorporated | | | | 618 | 28,236 |
| Boston Scientific Corporation † | | | | 11,680 | 540,200 |
| GE HealthCare Technology † | | | | 3,996 | 277,802 |
| Medtronic plc | | | | 51,600 | 4,318,404 |
| | | | | | 5,164,642 |
| Health care providers & services: 5.11% | | | | | |
| Cigna Corporation | | | | 9,410 | 2,979,865 |
| Elevance Health Incorporated | | | | 10,296 | 5,147,897 |
| HCA Healthcare Incorporated | | | | 11,807 | 3,011,611 |
| Humana Incorporated | | | | 1,367 | 699,494 |
| | | | | | 11,838,867 |
| Life sciences tools & services: 2.19% | | | | | |
| Danaher Corporation | | | | 8,570 | 2,265,737 |
| Syneos Health Incorporated † | | | | 78,237 | 2,810,273 |
| | | | | | 5,076,010 |
| Pharmaceuticals: 4.41% | | | | | |
| Eli Lilly & Company | | | | 2,125 | 731,319 |
| Johnson & Johnson | | | | 5,640 | 921,689 |
| Merck & Company Incorporated | | | | 3,931 | 422,229 |
| Organon & Company | | | | 69,145 | 2,083,339 |
| Pfizer Incorporated | | | | 62,740 | 2,770,598 |
| Viatris Incorporated | | | | 272,153 | 3,309,380 |
| | | | | | 10,238,554 |
The accompanying notes are an integral part of these financial statements.
Allspring Large Company Value Fund | 11
Portfolio of investments—January 31, 2023 (unaudited)
| | | | | Shares | Value |
| Industrials: 7.66% | | | | | |
| Aerospace & defense: 2.72% | | | | | |
| General Dynamics Corporation | | | | 11,911 | $ 2,775,978 |
| Northrop Grumman Corporation | | | | 7,902 | 3,540,412 |
| | | | | | 6,316,390 |
| Air freight & logistics: 1.69% | | | | | |
| United Parcel Service Incorporated Class B | | | | 21,213 | 3,929,284 |
| Airlines: 0.52% | | | | | |
| United Airlines Holdings Incorporated † | | | | 24,634 | 1,206,081 |
| Commercial services & supplies: 0.73% | | | | | |
| ADT Incorporated | | | | 7,483 | 65,775 |
| Cintas Corporation | | | | 2,501 | 1,109,794 |
| Waste Management Incorporated | | | | 3,303 | 511,073 |
| | | | | | 1,686,642 |
| Electrical equipment: 0.83% | | | | | |
| Vertiv Holdings Company | | | | 134,788 | 1,916,685 |
| Industrial conglomerates: 0.06% | | | | | |
| Honeywell International Incorporated | | | | 660 | 137,597 |
| Professional services: 0.37% | | | | | |
| Leidos Holdings Incorporated | | | | 5,141 | 508,136 |
| TransUnion | | | | 4,737 | 339,880 |
| | | | | | 848,016 |
| Road & rail: 0.74% | | | | | |
| Norfolk Southern Corporation | | | | 6,963 | 1,711,575 |
| Information technology: 9.95% | | | | | |
| Communications equipment: 2.39% | | | | | |
| Cisco Systems Incorporated | | | | 89,483 | 4,355,138 |
| CommScope Holdings Incorporated † | | | | 141,854 | 1,191,574 |
| | | | | | 5,546,712 |
| Electronic equipment, instruments & components: 1.02% | | | | | |
| Vishay Intertechnology Incorporated | | | | 81,472 | 1,864,894 |
| Vontier Corporation | | | | 22,018 | 507,075 |
| | | | | | 2,371,969 |
| IT services: 1.01% | | | | | |
| FleetCor Technologies Incorporated † | | | | 5,223 | 1,090,615 |
| StoneCo Limited Class A † | | | | 38,438 | 428,968 |
| The Western Union Company | | | | 11,857 | 168,014 |
| Visa Incorporated Class A | | | | 2,519 | 579,899 |
| WEX Incorporated † | | | | 426 | 78,797 |
| | | | | | 2,346,293 |
| Semiconductors & semiconductor equipment: 1.43% | | | | | |
| Intel Corporation | | | | 60,917 | 1,721,514 |
The accompanying notes are an integral part of these financial statements.
12 | Allspring Large Company Value Fund
Portfolio of investments—January 31, 2023 (unaudited)
| | | | | Shares | Value |
| Semiconductors & semiconductor equipment (continued) | | | | | |
| Qorvo Incorporated † | | | | 982 | $ 106,704 |
| Skyworks Solutions Incorporated | | | | 13,473 | 1,477,584 |
| | | | | | 3,305,802 |
| Software: 3.27% | | | | | |
| Autodesk Incorporated † | | | | 8,803 | 1,894,053 |
| NCR Corporation † | | | | 34,630 | 949,555 |
| Roper Technologies Incorporated | | | | 3,148 | 1,343,409 |
| Salesforce.com Incorporated † | | | | 15,914 | 2,673,075 |
| Teradata Corporation † | | | | 20,562 | 717,203 |
| | | | | | 7,577,295 |
| Technology hardware, storage & peripherals: 0.83% | | | | | |
| Apple Incorporated | | | | 13,329 | 1,923,241 |
| Materials: 4.85% | | | | | |
| Chemicals: 4.04% | | | | | |
| Air Products & Chemicals Incorporated | | | | 9,322 | 2,987,794 |
| Linde plc | | | | 19,298 | 6,386,480 |
| | | | | | 9,374,274 |
| Containers & packaging: 0.81% | | | | | |
| AptarGroup Incorporated | | | | 1,455 | 168,256 |
| O-I Glass Incorporated † | | | | 60,333 | 1,161,410 |
| WestRock Company | | | | 13,820 | 542,297 |
| | | | | | 1,871,963 |
| Real estate: 6.64% | | | | | |
| Equity REITs: 6.64% | | | | | |
| Alexandria Real Estate Equities Incorporated | | | | 21,958 | 3,529,529 |
| American Homes 4 Rent Class A | | | | 70,293 | 2,410,347 |
| Equinix Incorporated | | | | 739 | 545,478 |
| Public Storage Incorporated | | | | 4,261 | 1,296,793 |
| Realty Income Corporation | | | | 77,817 | 5,278,327 |
| Rexford Industrial Realty Incorporated | | | | 31,622 | 2,007,048 |
| Weyerhaeuser Company | | | | 9,419 | 324,296 |
| | | | | | 15,391,818 |
| Utilities: 6.16% | | | | | |
| Electric utilities: 3.13% | | | | | |
| American Electric Power Company Incorporated | | | | 717 | 67,369 |
| Duke Energy Corporation | | | | 12,969 | 1,328,674 |
| NextEra Energy Incorporated | | | | 77,322 | 5,770,541 |
| NRG Energy Incorporated | | | | 2,655 | 90,854 |
| | | | | | 7,257,438 |
| Gas utilities: 2.24% | | | | | |
| Atmos Energy Corporation | | | | 34,707 | 4,079,461 |
| Brookfield Infrastructure Corporation Class A | | | | 24,836 | 1,098,248 |
| | | | | | 5,177,709 |
| Independent power & renewable electricity producers: 0.19% | | | | | |
| Vistra Energy Corporation | | | | 19,416 | 447,733 |
The accompanying notes are an integral part of these financial statements.
Allspring Large Company Value Fund | 13
Portfolio of investments—January 31, 2023 (unaudited)
| | | | | Shares | Value |
| Multi-utilities: 0.60% | | | | | |
| Dominion Energy Incorporated | | | | 18,156 | $ 1,155,448 |
| Public Service Enterprise Group Incorporated | | | | 3,795 | 235,024 |
| | | | | | 1,390,472 |
| Total Common stocks (Cost $211,286,072) | | | | | 226,520,896 |
| | | Yield | | | |
| Short-term investments: 1.94% | | | | | |
| Investment companies: 1.94% | | | | | |
| Allspring Government Money Market Fund Select Class ♠∞ | | 4.16% | | 4,488,853 | 4,488,853 |
| Total Short-term investments (Cost $4,488,853) | | | | | 4,488,853 |
| Total investments in securities (Cost $215,774,925) | 99.64% | | | | 231,009,749 |
| Other assets and liabilities, net | 0.36 | | | | 845,665 |
| Total net assets | 100.00% | | | | $231,855,414 |
| † | Non-income-earning security |
| ♠ | The issuer of the security is an affiliated person of the Fund as defined in the Investment Company Act of 1940. |
| ∞ | The rate represents the 7-day annualized yield at period end. |
| Abbreviations: |
| REIT | Real estate investment trust |
Investments in affiliates
An affiliated investment is an investment in which the Fund owns at least 5% of the outstanding voting shares of the issuer or as a result of other relationships, such as the Fund and the issuer having the same investment manager. Transactions with issuers that were affiliates of the Fund at the end of the period were as follows:
| | Value,
beginning of
period | Purchases | Sales
proceeds | Net
realized
gains
(losses) | | Net
change in
unrealized
gains
(losses) | | Value,
end of
period | Shares,
end
of period | Income
from
affiliated
securities |
| Short-term investments | | | | | | | | | |
| Allspring Government Money Market Fund Select Class | $6,030,286 | $14,346,071 | $(15,887,504) | $0 | | $0 | | $ 4,488,853 | 4,488,853 | $ 89,614 |
Investments in affiliates no longer
held at end of period | | | | | | | | | | |
| Securities Lending Cash Investments LLC | 0 | 927,750 | (927,750) | 0 | | 0 | | 0 | 0 | 391 # |
| | | | | $0 | | $0 | | $4,488,853 | | $90,005 |
| # | Amount shown represents income before fees and rebates. |
Futures contracts
| Description | Number of
contracts | Expiration
date | Notional
cost | Notional
value | Unrealized
gains | Unrealized
losses |
| Long | | | | | | |
| E-Mini S&P 500 Index | 24 | 3-17-2023 | $4,764,504 | $4,908,000 | $143,496 | $0 |
The accompanying notes are an integral part of these financial statements.
14 | Allspring Large Company Value Fund
Statement of assets and liabilities—January 31, 2023 (unaudited)
| | |
| Assets | |
Investments in unaffiliated securities, at value (cost $211,286,072)
| $ 226,520,896 |
Investments in affiliated securities, at value (cost $4,488,853)
| 4,488,853 |
Cash
| 185 |
Cash at broker segregated for futures contracts
| 721,000 |
Receivable for dividends
| 268,658 |
Receivable for daily variation margin on open futures contracts
| 69,000 |
Receivable for Fund shares sold
| 32,335 |
Prepaid expenses and other assets
| 89,547 |
Total assets
| 232,190,474 |
| Liabilities | |
Payable for Fund shares redeemed
| 144,503 |
Management fee payable
| 52,923 |
Shareholder servicing fees payable
| 47,098 |
Administration fees payable
| 39,454 |
Trustees’ fees and expenses payable
| 4,575 |
Distribution fee payable
| 1,955 |
Accrued expenses and other liabilities
| 44,552 |
Total liabilities
| 335,060 |
Total net assets
| $231,855,414 |
| Net assets consist of | |
Paid-in capital
| $ 223,054,154 |
Total distributable earnings
| 8,801,260 |
Total net assets
| $231,855,414 |
| Computation of net asset value and offering price per share | |
Net assets – Class A
| $ 212,318,421 |
Shares outstanding – Class A1
| 17,097,774 |
Net asset value per share – Class A
| $12.42 |
Maximum offering price per share – Class A2
| $13.18 |
Net assets – Class C
| $ 2,951,420 |
Shares outstanding – Class C1
| 226,735 |
Net asset value per share – Class C
| $13.02 |
Net assets – Class R6
| $ 930,015 |
Shares outstanding – Class R61
| 74,418 |
Net asset value per share – Class R6
| $12.50 |
Net assets – Administrator Class
| $ 10,562,109 |
Shares outstanding – Administrator Class1
| 838,234 |
Net asset value per share – Administrator Class
| $12.60 |
Net assets – Institutional Class
| $ 5,093,449 |
Shares outstanding – Institutional Class1
| 406,730 |
Net asset value per share – Institutional Class
| $12.52 |
| 1 | The Fund has an unlimited number of authorized shares. |
| 2 | Maximum offering price is computed as 100/94.25 of net asset value. On investments of $50,000 or more, the offering price is reduced. |
The accompanying notes are an integral part of these financial statements.
Allspring Large Company Value Fund | 15
Statement of operations—six months ended January 31, 2023 (unaudited)
| | |
| Investment income | |
Dividends (net of foreign withholdings taxes of $541)
| $ 2,598,302 |
Income from affiliated securities
| 91,028 |
Total investment income
| 2,689,330 |
| Expenses | |
Management fee
| 447,693 |
| Administration fees | |
Class A
| 215,481 |
Class C
| 2,736 |
Class R6
| 129 |
Administrator Class
| 6,732 |
Institutional Class
| 3,123 |
| Shareholder servicing fees | |
Class A
| 256,525 |
Class C
| 3,257 |
Administrator Class
| 12,760 |
| Distribution fee | |
Class C
| 9,772 |
Custody and accounting fees
| 10,044 |
Professional fees
| 24,365 |
Registration fees
| 35,381 |
Shareholder report expenses
| 21,051 |
Trustees’ fees and expenses
| 11,026 |
Other fees and expenses
| 8,860 |
Total expenses
| 1,068,935 |
| Less: Fee waivers and/or expense reimbursements | |
Fund-level
| (144,122) |
Net expenses
| 924,813 |
Net investment income
| 1,764,517 |
| Realized and unrealized gains (losses) on investments | |
| Net realized gains (losses) on | |
Unaffiliated securities
| (631,849) |
Futures contracts
| 143,173 |
Net realized losses on investments
| (488,676) |
| Net change in unrealized gains (losses) on | |
Unaffiliated securities
| 6,763,976 |
Futures contracts
| (382,687) |
Net change in unrealized gains (losses) on investments
| 6,381,289 |
Net realized and unrealized gains (losses) on investments
| 5,892,613 |
Net increase in net assets resulting from operations
| $7,657,130 |
The accompanying notes are an integral part of these financial statements.
16 | Allspring Large Company Value Fund
Statement of changes in net assets
| | | | | |
| | Six months ended
January 31, 2023
(unaudited) | Year ended
July 31, 2022 |
| Operations | | | | |
Net investment income
| | $ 1,764,517 | | $ 3,172,177 |
Net realized losses on investments
| | (488,676) | | (635,828) |
Net change in unrealized gains (losses) on investments
| | 6,381,289 | | (3,281,183) |
Net increase (decrease) in net assets resulting from operations
| | 7,657,130 | | (744,834) |
| Distributions to shareholders from | | | | |
| Net investment income and net realized gains | | | | |
Class A
| | (1,464,281) | | (69,443,204) |
Class C
| | (7,817) | | (251,171) |
Class R6
| | (8,107) | | (86,276) |
Administrator Class
| | (77,178) | | (4,848,775) |
Institutional Class
| | (43,145) | | (1,377,309) |
Total distributions to shareholders
| | (1,600,528) | | (76,006,735) |
| Capital share transactions | Shares | | Shares | |
| Proceeds from shares sold | | | | |
Class A
| 376,313 | 4,427,639 | 543,328 | 7,419,850 |
Class C
| 66,486 | 827,016 | 134,741 | 1,741,851 |
Class R6
| 6,103 | 73,463 | 109,779 | 1,464,312 |
Administrator Class
| 18,809 | 228,529 | 33,271 | 527,147 |
Institutional Class
| 68,744 | 838,291 | 152,312 | 2,120,636 |
| | | 6,394,938 | | 13,273,796 |
| Reinvestment of distributions | | | | |
Class A
| 128,651 | 1,435,070 | 5,322,527 | 67,769,743 |
Class C
| 675 | 7,817 | 18,878 | 251,171 |
Class R6
| 719 | 8,107 | 6,739 | 86,178 |
Administrator Class
| 6,497 | 73,566 | 367,797 | 4,755,104 |
Institutional Class
| 3,820 | 43,145 | 107,135 | 1,377,163 |
| | | 1,567,705 | | 74,239,359 |
| Payment for shares redeemed | | | | |
Class A
| (746,449) | (8,830,152) | (1,973,957) | (27,390,524) |
Class C
| (22,421) | (283,075) | (22,460) | (319,335) |
Class R6
| (1,558) | (18,028) | (60,314) | (772,823) |
Administrator Class
| (47,803) | (578,241) | (463,319) | (5,873,746) |
Institutional Class
| (46,259) | (556,334) | (112,541) | (1,495,683) |
| | | (10,265,830) | | (35,852,111) |
Net increase (decrease) in net assets resulting from capital share transactions
| | (2,303,187) | | 51,661,044 |
Total increase (decrease) in net assets
| | 3,753,415 | | (25,090,525) |
| Net assets | | | | |
Beginning of period
| | 228,101,999 | | 253,192,524 |
End of period
| | $231,855,414 | | $228,101,999 |
The accompanying notes are an integral part of these financial statements.
Allspring Large Company Value Fund | 17
Financial highlights
(For a share outstanding throughout each period)
| | | Year ended July 31 |
| Class A | Six months ended
January 31, 2023
(unaudited) | 2022 | 2021 | 2020 | 2019 | 2018 |
Net asset value, beginning of period
| $12.10 | $17.25 | $12.31 | $12.92 | $14.46 | $16.54 |
Net investment income
| 0.09 | 0.17 | 0.19 | 0.20 | 0.24 | 0.19 |
Net realized and unrealized gains (losses) on investments
| 0.32 | (0.06) | 5.20 | (0.53) | (0.15) | 1.29 |
Total from investment operations
| 0.41 | 0.11 | 5.39 | (0.33) | 0.09 | 1.48 |
| Distributions to shareholders from | | | | | | |
Net investment income
| (0.09) | (0.18) | (0.19) | (0.21) | (0.25) | (0.18) |
Net realized gains
| 0.00 | (5.08) | (0.26) | (0.07) | (1.38) | (3.38) |
Total distributions to shareholders
| (0.09) | (5.26) | (0.45) | (0.28) | (1.63) | (3.56) |
Net asset value, end of period
| $12.42 | $12.10 | $17.25 | $12.31 | $12.92 | $14.46 |
Total return1
| 3.43% | (0.51)% | 44.41% | (2.49)% | 1.44% | 9.39% |
| Ratios to average net assets (annualized) | | | | | | |
Gross expenses
| 0.96% | 0.94% | 0.96% | 0.99% | 0.97% | 0.94% |
Net expenses
| 0.83% | 0.81% | 0.81% | 0.82% | 0.83% | 0.83% |
Net investment income
| 1.57% | 1.28% | 1.23% | 1.63% | 1.84% | 1.28% |
| Supplemental data | | | | | | |
Portfolio turnover rate
| 209% | 365% | 488% | 366% | 221% | 258% |
Net assets, end of period (000s omitted)
| $212,318 | $209,748 | $231,930 | $174,028 | $196,075 | $214,247 |
| 1 | Total return calculations do not include any sales charges. Returns for periods of less than one year are not annualized. |
The accompanying notes are an integral part of these financial statements.
18 | Allspring Large Company Value Fund
Financial highlights
(For a share outstanding throughout each period)
| | | Year ended July 31 |
| Class C | Six months ended
January 31, 2023
(unaudited) | 2022 | 2021 | 2020 | 2019 | 2018 |
Net asset value, beginning of period
| $12.67 | $17.84 | $12.75 | $13.34 | $14.81 | $16.86 |
Net investment income
| 0.07 | 0.08 1 | 0.07 1 | 0.12 1 | 0.16 1 | 0.08 |
Net realized and unrealized gains (losses) on investments
| 0.32 | (0.09) | 5.40 | (0.56) | (0.15) | 1.30 |
Total from investment operations
| 0.39 | (0.01) | 5.47 | (0.44) | 0.01 | 1.38 |
| Distributions to shareholders from | | | | | | |
Net investment income
| (0.04) | (0.08) | (0.12) | (0.08) | (0.10) | (0.05) |
Net realized gains
| 0.00 | (5.08) | (0.26) | (0.07) | (1.38) | (3.38) |
Total distributions to shareholders
| (0.04) | (5.16) | (0.38) | (0.15) | (1.48) | (3.43) |
Net asset value, end of period
| $13.02 | $12.67 | $17.84 | $12.75 | $13.34 | $14.81 |
Total return2
| 3.11% | (1.30)% | 43.33% | (3.27)% | 0.76% | 8.49% |
| Ratios to average net assets (annualized) | | | | | | |
Gross expenses
| 1.71% | 1.69% | 1.70% | 1.74% | 1.71% | 1.69% |
Net expenses
| 1.58% | 1.58% | 1.58% | 1.58% | 1.58% | 1.58% |
Net investment income
| 0.83% | 0.59% | 0.47% | 0.92% | 1.15% | 0.55% |
| Supplemental data | | | | | | |
Portfolio turnover rate
| 209% | 365% | 488% | 366% | 221% | 258% |
Net assets, end of period (000s omitted)
| $2,951 | $2,307 | $907 | $482 | $966 | $2,926 |
| 1 | Calculated based upon average shares outstanding |
| 2 | Total return calculations do not include any sales charges. Returns for periods of less than one year are not annualized. |
The accompanying notes are an integral part of these financial statements.
Allspring Large Company Value Fund | 19
Financial highlights
(For a share outstanding throughout each period)
| | | Year ended July 31 |
| Class R6 | Six months ended
January 31, 2023
(unaudited) | 2022 | 2021 | 2020 | 2019 | 2018 |
Net asset value, beginning of period
| $12.18 | $17.33 | $12.37 | $13.04 | $14.59 | $16.66 |
Net investment income
| 0.12 | 0.24 1 | 0.25 | 0.30 | 0.30 | 0.26 |
Net realized and unrealized gains (losses) on investments
| 0.31 | (0.07) | 5.22 | (0.57) | (0.14) | 1.30 |
Total from investment operations
| 0.43 | 0.17 | 5.47 | (0.27) | 0.16 | 1.56 |
| Distributions to shareholders from | | | | | | |
Net investment income
| (0.11) | (0.24) | (0.25) | (0.33) | (0.33) | (0.25) |
Net realized gains
| 0.00 | (5.08) | (0.26) | (0.07) | (1.38) | (3.38) |
Total distributions to shareholders
| (0.11) | (5.32) | (0.51) | (0.40) | (1.71) | (3.63) |
Net asset value, end of period
| $12.50 | $12.18 | $17.33 | $12.37 | $13.04 | $14.59 |
Total return2
| 3.65% | (0.10)% | 44.94% | (2.09)% | 1.92% | 9.88% |
| Ratios to average net assets (annualized) | | | | | | |
Gross expenses
| 0.53% | 0.51% | 0.53% | 0.58% | 0.55% | 0.51% |
Net expenses
| 0.40% | 0.40% | 0.40% | 0.40% | 0.40% | 0.40% |
Net investment income
| 2.00% | 1.79% | 1.65% | 1.69% | 2.26% | 1.73% |
| Supplemental data | | | | | | |
Portfolio turnover rate
| 209% | 365% | 488% | 366% | 221% | 258% |
Net assets, end of period (000s omitted)
| $930 | $842 | $224 | $151 | $20 | $23 |
| 1 | Calculated based upon average shares outstanding |
| 2 | Returns for periods of less than one year are not annualized. |
The accompanying notes are an integral part of these financial statements.
20 | Allspring Large Company Value Fund
Financial highlights
(For a share outstanding throughout each period)
| | | Year ended July 31 |
| Administrator Class | Six months ended
January 31, 2023
(unaudited) | 2022 | 2021 | 2020 | 2019 | 2018 |
Net asset value, beginning of period
| $12.27 | $17.42 | $12.44 | $13.06 | $14.59 | $16.66 |
Net investment income
| 0.10 | 0.19 | 0.20 | 0.22 | 0.26 | 0.20 |
Net realized and unrealized gains (losses) on investments
| 0.32 | (0.08) | 5.24 | (0.54) | (0.14) | 1.30 |
Total from investment operations
| 0.42 | 0.11 | 5.44 | (0.32) | 0.12 | 1.50 |
| Distributions to shareholders from | | | | | | |
Net investment income
| (0.09) | (0.18) | (0.20) | (0.23) | (0.27) | (0.19) |
Net realized gains
| 0.00 | (5.08) | (0.26) | (0.07) | (1.38) | (3.38) |
Total distributions to shareholders
| (0.09) | (5.26) | (0.46) | (0.30) | (1.65) | (3.57) |
Net asset value, end of period
| $12.60 | $12.27 | $17.42 | $12.44 | $13.06 | $14.59 |
Total return1
| 3.51% | (0.49)% | 44.36% | (2.41)% | 1.61% | 9.44% |
| Ratios to average net assets (annualized) | | | | | | |
Gross expenses
| 0.88% | 0.85% | 0.88% | 0.91% | 0.89% | 0.86% |
Net expenses
| 0.74% | 0.75% | 0.75% | 0.75% | 0.75% | 0.75% |
Net investment income
| 1.65% | 1.31% | 1.30% | 1.71% | 1.93% | 1.37% |
| Supplemental data | | | | | | |
Portfolio turnover rate
| 209% | 365% | 488% | 366% | 221% | 258% |
Net assets, end of period (000s omitted)
| $10,562 | $10,564 | $16,080 | $11,813 | $13,854 | $16,744 |
| 1 | Returns for periods of less than one year are not annualized. |
The accompanying notes are an integral part of these financial statements.
Allspring Large Company Value Fund | 21
Financial highlights
(For a share outstanding throughout each period)
| | | Year ended July 31 |
| Institutional Class | Six months ended
January 31, 2023
(unaudited) | 2022 | 2021 | 2020 | 2019 | 2018 |
Net asset value, beginning of period
| $12.20 | $17.35 | $12.38 | $13.04 | $14.58 | $16.65 |
Net investment income
| 0.11 | 0.23 1 | 0.22 | 0.26 | 0.29 1 | 0.24 |
Net realized and unrealized gains (losses) on investments
| 0.32 | (0.08) | 5.25 | (0.55) | (0.14) | 1.30 |
Total from investment operations
| 0.43 | 0.15 | 5.47 | (0.29) | 0.15 | 1.54 |
| Distributions to shareholders from | | | | | | |
Net investment income
| (0.11) | (0.22) | (0.24) | (0.30) | (0.31) | (0.23) |
Net realized gains
| 0.00 | (5.08) | (0.26) | (0.07) | (1.38) | (3.38) |
Total distributions to shareholders
| (0.11) | (5.30) | (0.50) | (0.37) | (1.69) | (3.61) |
Net asset value, end of period
| $12.52 | $12.20 | $17.35 | $12.38 | $13.04 | $14.58 |
Total return2
| 3.59% | (0.22)% | 44.84% | (2.20)% | 1.86% | 9.77% |
| Ratios to average net assets (annualized) | | | | | | |
Gross expenses
| 0.63% | 0.61% | 0.63% | 0.66% | 0.63% | 0.62% |
Net expenses
| 0.50% | 0.50% | 0.50% | 0.50% | 0.50% | 0.50% |
Net investment income
| 1.90% | 1.61% | 1.56% | 1.96% | 2.14% | 1.60% |
| Supplemental data | | | | | | |
Portfolio turnover rate
| 209% | 365% | 488% | 366% | 221% | 258% |
Net assets, end of period (000s omitted)
| $5,093 | $4,641 | $4,051 | $2,142 | $2,948 | $17,606 |
| 1 | Calculated based upon average shares outstanding |
| 2 | Returns for periods of less than one year are not annualized. |
The accompanying notes are an integral part of these financial statements.
22 | Allspring Large Company Value Fund
Notes to financial statements (unaudited)
1. ORGANIZATION
Allspring Funds Trust (the "Trust"), a Delaware statutory trust organized on March 10, 1999, is an open-end management investment company registered under the Investment Company Act of 1940, as amended (the "1940 Act"). As an investment company, the Trust follows the accounting and reporting guidance in Financial Accounting Standards Board ("FASB") Accounting Standards Codification Topic 946, Financial Services – Investment Companies. These financial statements report on the Allspring Large Company Value Fund (the "Fund") which is a diversified series of the Trust.
2. SIGNIFICANT ACCOUNTING POLICIES
The following significant accounting policies, which are consistently followed in the preparation of the financial statements of the Fund, are in conformity with U.S. generally accepted accounting principles which require management to make estimates and assumptions that affect the reported amounts of assets and liabilities, disclosure of contingent assets and liabilities at the date of the financial statements, and the reported amounts of income and expenses during the reporting period. Actual results could differ from those estimates.
Securities valuation
All investments are valued each business day as of the close of regular trading on the New York Stock Exchange (generally 4 p.m. Eastern Time), although the Fund may deviate from this calculation time under unusual or unexpected circumstances.
Equity securities and futures contracts that are listed on a foreign or domestic exchange or market are valued at the official closing price or, if none, the last sales price.
Investments in registered open-end investment companies (other than those listed on a foreign or domestic exchange or market) are valued at net asset value. Interests in non-registered investment companies that are redeemable at net asset value are fair valued normally at net asset value.
Investments which are not valued using the methods discussed above are valued at their fair value, as determined in good faith by Allspring Funds Management, LLC ("Allspring Funds Management"), which was named the valuation designee by the Board of Trustees. As the valuation designee, Allspring Funds Management is responsible for day-to-day valuation activities for the Allspring Funds. In connection with these responsibilities, Allspring Funds Management has established a Valuation Committee and has delegated to it the authority to take any actions regarding the valuation of portfolio securities that the Valuation Committee deems necessary or appropriate, including determining the fair value of portfolio securities. On a quarterly basis, the Board of Trustees receives reports of valuation actions taken by the Valuation Committee. On at least an annual basis, the Board of Trustees receives an assessment of the adequacy and effectiveness of Allspring Funds Management's process for determining the fair value of the portfolio of investments.
Securities lending
The Fund may lend its securities from time to time in order to earn additional income in the form of fees or interest on securities received as collateral or the investment of any cash received as collateral. When securities are on loan, the Fund receives interest or dividends on those securities. Cash collateral received in connection with its securities lending transactions is invested in Securities Lending Cash Investments, LLC (the "Securities Lending Fund"), an affiliated non-registered investment company. Investments in Securities Lending Fund are valued at the evaluated bid price provided by an independent pricing service. Income earned from investment in the Securities Lending Fund (net of fees and rebates), if any, is included in income from affiliated securities on the Statement of Operations.
In a securities lending transaction, the net asset value of the Fund is affected by an increase or decrease in the value of the securities loaned and by an increase or decrease in the value of the instrument in which collateral is invested. The amount of securities lending activity undertaken by the Fund fluctuates from time to time. The Fund has the right under the lending agreement to recover the securities from the borrower on demand. In the event of default or bankruptcy by the borrower, the Fund may be prevented from recovering the loaned securities or gaining access to the collateral or may experience delays or costs in doing so. In such an event, the terms of the agreement allow the unaffiliated securities lending agent to use the collateral to purchase replacement securities on behalf of the Fund or pay the Fund the market value of the loaned securities. The Fund bears the risk of loss with respect to depreciation of its investment of the cash collateral.
Futures contracts
Futures contracts are agreements between the Fund and a counterparty to buy or sell a specific amount of a commodity, financial instrument or currency at a specified price on a specified date. The Fund may buy and sell futures contracts in order to gain exposure to, or protect against, changes in security values and is subject to equity price risk. The primary risks associated with the use of futures contracts are the imperfect correlation between changes in market values of securities held by the Fund
Allspring Large Company Value Fund | 23
Notes to financial statements (unaudited)
and the prices of futures contracts, and the possibility of an illiquid market. Futures contracts are generally entered into on a regulated futures exchange and cleared through a clearinghouse associated with the exchange. With futures contracts, there is minimal counterparty risk to the Fund since futures contracts are exchange traded and the exchange’s clearinghouse, as the counterparty to all exchange-traded futures, guarantees the futures contracts against default.
Upon entering into a futures contract, the Fund is required to deposit either cash or securities (initial margin) with the broker in an amount equal to a certain percentage of the contract value. Subsequent payments (variation margin) are paid to or from the broker each day equal to the daily changes in the contract value. Such payments are recorded as unrealized gains or losses and, if any, shown as variation margin receivable (payable) in the Statement of Assets and Liabilities. Should the Fund fail to make requested variation margin payments, the broker can gain access to the initial margin to satisfy the Fund’s payment obligations. When the contracts are closed, a realized gain or loss is recorded in the Statement of Operations.
Security transactions and income recognition
Securities transactions are recorded on a trade date basis. Realized gains or losses are recorded on the basis of identified cost.
Dividend income is recognized on the ex-dividend date. Dividend income is recorded net of foreign taxes withheld where recovery of such taxes is not assured.
Distributions to shareholders
Distributions to shareholders are recorded on the ex-dividend date and paid from net investment income quarterly and any net realized gains are paid at least annually. Such distributions are determined in accordance with income tax regulations and may differ from U.S. generally accepted accounting principles. Dividend sources are estimated at the time of declaration. The tax character of distributions is determined as of the Fund's fiscal year end. Therefore, a portion of the Fund's distributions made prior to the Fund’s fiscal year end may be categorized as a tax return of capital at year end.
Federal and other taxes
The Fund intends to continue to qualify as a regulated investment company by distributing substantially all of its investment company taxable income and any net realized capital gains (after reduction for capital loss carryforwards) sufficient to relieve it from all, or substantially all, federal income taxes. Accordingly, no provision for federal income taxes was required.
The Fund’s income and federal excise tax returns and all financial records supporting those returns for the prior three fiscal years are subject to examination by the federal and Delaware revenue authorities. Management has analyzed the Fund's tax positions taken on federal, state, and foreign tax returns, as applicable, for all open tax years and does not believe that there are any uncertain tax positions that require recognition of a tax liability.
As of January 31, 2023, the aggregate cost of all investments for federal income tax purposes was $215,082,461 and the unrealized gains (losses) consisted of:
| Gross unrealized gains | $18,222,483 |
| Gross unrealized losses | (2,151,699) |
| Net unrealized gains | $16,070,784 |
As of July 31, 2022, the Fund had current year deferred post-October capital losses consisting of $3,934,173 in short-term capital losses and $779,473 in long-term capital gains which was recognized in the first day of the current fiscal year.
Class allocations
The separate classes of shares offered by the Fund differ principally in applicable sales charges, distribution, shareholder servicing, and administration fees. Class specific expenses are charged directly to that share class. Investment income, common fund-level expenses, and realized and unrealized gains (losses) on investments are allocated daily to each class of shares based on the relative proportion of net assets of each class.
24 | Allspring Large Company Value Fund
Notes to financial statements (unaudited)
3. FAIR VALUATION MEASUREMENTS
Fair value measurements of investments are determined within a framework that has established a fair value hierarchy based upon the various data inputs utilized in determining the value of the Fund’s investments. The three-level hierarchy gives the highest priority to unadjusted quoted prices in active markets for identical assets or liabilities (Level 1) and the lowest priority to unobservable inputs (Level 3). The Fund’s investments are classified within the fair value hierarchy based on the lowest level of input that is significant to the fair value measurement. The inputs are summarized into three broad levels as follows:
| ■ | Level 1 – quoted prices in active markets for identical securities |
| ■ | Level 2 – other significant observable inputs (including quoted prices for similar securities, interest rates, prepayment speeds, credit risk, etc.) |
| ■ | Level 3 – significant unobservable inputs (including the Fund’s own assumptions in determining the fair value of investments) |
The inputs or methodologies used for valuing investments in securities are not necessarily an indication of the risk associated with investing in those securities.
The following is a summary of the inputs used in valuing the Fund’s assets and liabilities as of January 31, 2023:
| | Quoted prices
(Level 1) | Other significant
observable inputs
(Level 2) | Significant
unobservable inputs
(Level 3) | Total |
| Assets | | | | |
| Investments in: | | | | |
| Common stocks | | | | |
| Communication services | $ 12,579,367 | $0 | $0 | $ 12,579,367 |
| Consumer discretionary | 12,278,171 | 0 | 0 | 12,278,171 |
| Consumer staples | 19,125,150 | 0 | 0 | 19,125,150 |
| Energy | 17,972,300 | 0 | 0 | 17,972,300 |
| Financials | 42,135,310 | 0 | 0 | 42,135,310 |
| Health care | 40,695,609 | 0 | 0 | 40,695,609 |
| Industrials | 17,752,270 | 0 | 0 | 17,752,270 |
| Information technology | 23,071,312 | 0 | 0 | 23,071,312 |
| Materials | 11,246,237 | 0 | 0 | 11,246,237 |
| Real estate | 15,391,818 | 0 | 0 | 15,391,818 |
| Utilities | 14,273,352 | 0 | 0 | 14,273,352 |
| Short-term investments | | | | |
| Investment companies | 4,488,853 | 0 | 0 | 4,488,853 |
| | 231,009,749 | 0 | 0 | 231,009,749 |
| Futures contracts | 143,496 | 0 | 0 | 143,496 |
| Total assets | $231,153,245 | $0 | $0 | $231,153,245 |
Futures contracts are reported at their cumulative unrealized gains (losses) at measurement date as reported in the table following the Portfolio of Investments. For futures contracts, the current day’s variation margin is reported on the Statement of Assets and Liabilities. All other assets and liabilities are reported at their market value at measurement date.
Additional sector, industry or geographic detail, if any, is included in the Portfolio of Investments.
For the six months ended January 31, 2023, the Fund did not have any transfers into/out of Level 3.
4. TRANSACTIONS WITH AFFILIATES
Management fee
Allspring Funds Management, a wholly owned subsidiary of Allspring Global Investments Holdings, LLC, a holding company indirectly owned by certain private funds of GTCR LLC and Reverence Capital Partners, L.P., is the manager of the Fund and provides advisory and fund-level administrative services under an investment management agreement. Under the investment management agreement, Allspring Funds Management is responsible for, among other services, implementing the investment objectives and strategies of the Fund, supervising the subadviser and providing fund-level administrative services in connection
Allspring Large Company Value Fund | 25
Notes to financial statements (unaudited)
with the Fund’s operations. As compensation for its services under the investment management agreement, Allspring Funds Management is entitled to receive a management fee at the following annual rate based on the Fund’s average daily net assets:
| Average daily net assets | Management fee |
| First $1 billion | 0.400% |
| Next $4 billion | 0.375 |
| Next $5 billion | 0.340 |
| Over $10 billion | 0.330 |
For the six months ended January 31, 2023, the management fee was equivalent to an annual rate of 0.40% of the Fund’s average daily net assets.
Allspring Funds Management has retained the services of a subadviser to provide daily portfolio management to the Fund. The fee for subadvisory services is borne by Allspring Funds Management. Allspring Global Investments, LLC ("Allspring Investments"), an affiliate of Allspring Funds Management and a wholly owned subsidiary of Allspring Global Investments Holdings, LLC, is the subadviser to the Fund and is entitled to receive a fee from Allspring Funds Management at an annual rate starting at 0.25% and declining to 0.15% as the average daily net assets of the Fund increase.
Administration fees
Under a class-level administration agreement, Allspring Funds Management provides class-level administrative services to the Fund, which includes paying fees and expenses for services provided by the transfer agent, sub-transfer agents, omnibus account servicers and record-keepers. As compensation for its services under the class-level administration agreement, Allspring Funds Management receives an annual fee which is calculated based on the average daily net assets of each class as follows:
| | Class-level
administration fee |
| Class A | 0.21% |
| Class C | 0.21 |
| Class R6 | 0.03 |
| Administrator Class | 0.13 |
| Institutional Class | 0.13 |
Waivers and/or expense reimbursements
Allspring Funds Management has contractually committed to waive and/or reimburse management and administration fees to the extent necessary to maintain certain net operating expense ratios for the Fund. When each class of the Fund has exceeded its expense cap, Allspring Funds Management will waive fees and/or reimburse expenses from fund-level expenses on a proportionate basis and then from class specific expenses. When only certain classes exceed their expense caps, waivers and/or reimbursements are applied against class specific expenses before fund-level expenses. Allspring Funds Management has contractually committed through November 30, 2023 to waive fees and/or reimburse expenses to the extent necessary to cap expenses. Prior to or after the commitment expiration date, the caps may be increased or the commitment to maintain the caps may be terminated only with the approval of the Board of Trustees. As of January 31, 2023, the contractual expense caps are as follows:
| | Expense ratio caps |
| Class A | 0.83% |
| Class C | 1.58 |
| Class R6 | 0.40 |
| Administrator Class | 0.75 |
| Institutional Class | 0.50 |
26 | Allspring Large Company Value Fund
Notes to financial statements (unaudited)
Distribution fee
The Trust has adopted a distribution plan for Class C shares pursuant to Rule 12b-1 under the 1940 Act. A distribution fee is charged to Class C shares and paid to Allspring Funds Distributor, LLC ("Allspring Funds Distributor"), the principal underwriter, an affiliate of Allspring Funds Management, at an annual rate up to 0.75% of the average daily net assets of Class C shares.
In addition, Allspring Funds Distributor is entitled to receive the front-end sales charge from the purchase of Class A shares and a contingent deferred sales charge on the redemption of certain Class A shares. Allspring Funds Distributor is also entitled to receive the contingent deferred sales charges from redemptions of Class C shares. For the six months ended January 31, 2023, Allspring Funds Distributor received $1,125 from the sale of Class A shares. No contingent deferred sales charges were incurred by Class A and Class C shares for the six months ended January 31, 2023.
Shareholder servicing fees
The Trust has entered into contracts with one or more shareholder servicing agents, whereby Class A, Class C and Administrator Class are charged a fee at an annual rate up to 0.25% of the average daily net assets of each respective class. A portion of these total shareholder servicing fees were paid to affiliates of the Fund.
Interfund transactions
The Fund may purchase or sell portfolio investment securities to certain affiliates pursuant to Rule 17a-7 under the 1940 Act and under procedures adopted by the Board of Trustees. The procedures have been designed to ensure that these interfund transactions, which do not incur broker commissions, are effected at current market prices.
5. INVESTMENT PORTFOLIO TRANSACTIONS
Purchases and sales of investments, excluding U.S. government obligations (if any) and short-term securities, for the six months ended January 31, 2023 were $451,769,206 and $452,526,899, respectively.
6. SECURITIES LENDING TRANSACTIONS
The Fund lends its securities through an unaffiliated securities lending agent and receives collateral in the form of cash or securities with a value at least equal to the value of the securities on loan. The value of the loaned securities is determined at the close of each business day and any increases or decreases in the required collateral are exchanged between the Fund and the counterparty on the next business day. Cash collateral received is invested in the Securities Lending Fund which seeks to provide a positive return compared to the daily Federal Funds Open Rate by investing in high-quality, U.S. dollar-denominated short-term money market instruments and is exempt from registration under Section 3(c)(7) of the 1940 Act. Securities Lending Fund is managed by Allspring Funds Management and is subadvised by Allspring Investments. Allspring Funds Management receives an advisory fee starting at 0.05% and declining to 0.01% as the average daily net assets of the Securities Lending Fund increase. All of the fees received by Allspring Funds Management are paid to Allspring Investments for its services as subadviser.
In the event of counterparty default or the failure of a borrower to return a loaned security, the Fund has the right to use the collateral to offset any losses incurred. As of January 31, 2023, the Fund did not have any securities on loan.
7. DERIVATIVE TRANSACTIONS
During the six months ended January 31, 2023, the Fund entered into futures contracts to gain market exposure. The Fund had an average notional amount of $5,954,887 in long futures contracts during the six months ended January 31, 2023.
The fair value, realized gains or losses and change in unrealized gains or losses, if any, on derivative instruments are reflected in the corresponding financial statement captions.
8. BANK BORROWINGS
The Trust (excluding the money market funds), Allspring Master Trust and Allspring Variable Trust are parties to a $350,000,000 revolving credit agreement whereby the Fund is permitted to use bank borrowings for temporary or emergency purposes, such as to fund shareholder redemption requests. Interest under the credit agreement is charged to the Fund based on a borrowing rate equal to the higher of the Federal Funds rate or the overnight bank funding rate in effect on that day plus a spread. In addition, an annual commitment fee equal based on the unused balance is allocated to each participating fund.
For the six months ended January 31, 2023, there were no borrowings by the Fund under the agreement.
Allspring Large Company Value Fund | 27
Notes to financial statements (unaudited)
9. MARKET RISKS
On March 11, 2020, the World Health Organization announced that it had made the assessment that coronavirus disease 2019 (“COVID-19”) is a pandemic. The impacts of COVID-19 are affecting the entire global economy, individual companies and investment products, the funds, and the market in general. There is significant uncertainty around the extent and duration of business disruptions related to COVID-19 and the impacts may last for an extended period of time. COVID-19 has led to significant uncertainty and volatility in the financial markets.
10. INDEMNIFICATION
Under the Fund's organizational documents, the officers and Trustees have been granted certain indemnification rights against certain liabilities that may arise out of performance of their duties to the Fund. The Fund has entered into a separate agreement with each Trustee that converts indemnification rights currently existing under the Fund’s organizational documents into contractual rights that cannot be changed in the future without the consent of the Trustee. Additionally, in the normal course of business, the Fund may enter into contracts with service providers that contain a variety of indemnification clauses. The Fund’s maximum exposure under these arrangements is dependent on future claims that may be made against the Fund and, therefore, cannot be estimated.
28 | Allspring Large Company Value Fund
Other information (unaudited)
PROXY VOTING INFORMATION
A description of the policies and procedures used to determine how to vote proxies relating to portfolio securities is available without charge, upon request, by calling 1-800-222-8222, visiting our website at allspringglobal.com, or visiting the SEC website at sec.gov. Information regarding how the proxies related to portfolio securities were voted during the most recent 12-month period ended June 30 is available on the website at allspringglobal.com or by visiting the SEC website at sec.gov.
QUARTERLY PORTFOLIO HOLDINGS INFORMATION
The Fund files its complete schedule of portfolio holdings with the SEC for the first and third quarters of each fiscal year as an exhibit to its reports on Form N-PORT. Shareholders may view the filed Form N-PORT by visiting the SEC website at sec.gov.
Allspring Large Company Value Fund | 29
Other information (unaudited)
BOARD OF TRUSTEES AND OFFICERS
Each of the Trustees and Officers listed in the table below acts in identical capacities for each fund in the Allspring family of funds, which consists of 127 mutual funds comprising the Allspring Funds Trust, Allspring Variable Trust, Allspring Master Trust and four closed-end funds (collectively the “Fund Complex”). This table should be read in conjunction with the Prospectus and the Statement of Additional Information1. The mailing address of each Trustee and Officer is 1415 Vantage Park Drive, 3rd Floor, Charlotte, NC 28203. Each Trustee and Officer serves an indefinite term, however, each Trustee serves such term until reaching the mandatory retirement age established by the Trustees.
Independent Trustees
Name and
year of birth | Position held and
length of service* | Principal occupations during past five years or longer | Current other
public company or
investment
company
directorships |
William R. Ebsworth
(Born 1957) | Trustee,
since 2015 | Retired. From 1984 to 2013, equities analyst, portfolio manager, research director and chief investment officer at Fidelity Management and Research Company in Boston, Tokyo, and Hong Kong, and retired in 2013 as Chief Investment Officer of Fidelity Strategic Advisers, Inc. where he led a team of investment professionals managing client assets. Prior thereto, Board member of Hong Kong Securities Clearing Co., Hong Kong Options Clearing Corp., the Thailand International Fund, Ltd., Fidelity Investments Life Insurance Company, and Empire Fidelity Investments Life Insurance Company. Audit Committee Chair and Investment Committee Chair of the Vincent Memorial Hospital Foundation (non-profit organization). Mr. Ebsworth is a CFA® charterholder. | N/A |
Jane A. Freeman
(Born 1953) | Trustee,
since 2015;
Chair Liaison,
since 2018 | Retired. From 2012 to 2014 and 1999 to 2008, Chief Financial Officer of Scientific Learning Corporation. From 2008 to 2012, Ms. Freeman provided consulting services related to strategic business projects. Prior to 1999, Portfolio Manager at Rockefeller & Co. and Scudder, Stevens & Clark. Board member of the Harding Loevner Funds from 1996 to 2014, serving as both Lead Independent Director and chair of the Audit Committee. Board member of the Russell Exchange Traded Funds Trust from 2011 to 2012 and the chair of the Audit Committee. Ms. Freeman is also an inactive Chartered Financial Analyst. | N/A |
Isaiah Harris, Jr.
(Born 1952) | Trustee,
since 2009; Audit
Committee
Chair,
since 2019 | Retired. Member of the Advisory Board of CEF of East Central Florida. Chairman of the Board of CIGNA Corporation from 2009 to 2021, and Director from 2005 to 2008. From 2003 to 2011, Director of Deluxe Corporation. Prior thereto, President and CEO of BellSouth Advertising and Publishing Corp. from 2005 to 2007, President and CEO of BellSouth Enterprises from 2004 to 2005 and President of BellSouth Consumer Services from 2000 to 2003. Emeritus member of the Iowa State University Foundation Board of Governors. Emeritus Member of the Advisory Board of Iowa State University School of Business. Advisory Board Member, Palm Harbor Academy (private school). Advisory Board Member, Fellowship of Christian Athletes. Mr. Harris is a certified public accountant (inactive status). | N/A |
David F. Larcker
(Born 1950) | Trustee,
since 2009 | Distinguished Visiting Fellow at the Hoover Institution since 2022. James Irvin Miller Professor of Accounting at the Graduate School of Business (Emeritus), Stanford University, Director of the Corporate Governance Research Initiative and Senior Faculty of The Rock Center for Corporate Governance since 2006. From 2005 to 2008, Professor of Accounting at the Graduate School of Business, Stanford University. Prior thereto, Ernst & Young Professor of Accounting at The Wharton School, University of Pennsylvania from 1985 to 2005. | N/A |
30 | Allspring Large Company Value Fund
Other information (unaudited)
Name and
year of birth | Position held and
length of service* | Principal occupations during past five years or longer | Current other
public company or
investment
company
directorships |
Olivia S. Mitchell
(Born 1953) | Trustee,
since 2006;
Nominating and
Governance
Committee Chair,
since 2018 | International Foundation of Employee Benefit Plans Professor since 1993, Wharton School of the University of Pennsylvania. Director of Wharton’s Pension Research Council and Boettner Center on Pensions & Retirement Research, and Research Associate at the National Bureau of Economic Research. Previously taught at Cornell University from 1978 to 1993. | N/A |
Timothy J. Penny
(Born 1951) | Trustee,
since 1996;
Chair,
since 2018 | President and Chief Executive Officer of Southern Minnesota Initiative Foundation, a non-profit organization, since 2007. Vice Chair of the Economic Club of Minnesota, since 2007. Co-Chair of the Committee for a Responsible Federal Budget, since 1995. Member of the Board of Trustees of NorthStar Education Finance, Inc., a non-profit organization, from 2007-2022. Senior Fellow of the University of Minnesota Humphrey Institute from 1995 to 2017. | N/A |
James G. Polisson
(Born 1959) | Trustee,
since 2018 | Retired. Chief Marketing Officer, Source (ETF) UK Services, Ltd, from 2015 to 2017. From 2012 to 2015, Principal of The Polisson Group, LLC, a management consulting, corporate advisory and principal investing company. Chief Executive Officer and Managing Director at Russell Investments, Global Exchange Traded Funds from 2010 to 2012. Managing Director of Barclays Global Investors from 1998 to 2010 and Global Chief Marketing Officer for iShares and Barclays Global Investors from 2000 to 2010. Trustee of the San Francisco Mechanics’ Institute, a non-profit organization, from 2013 to 2015. Board member of the Russell Exchange Traded Fund Trust from 2011 to 2012. Director of Barclays Global Investors Holdings Deutschland GmbH from 2006 to 2009. Mr. Polisson is an attorney and has a retired status with the Massachusetts and District of Columbia Bar Associations. | N/A |
Pamela Wheelock
(Born 1959) | Trustee,
since January
2020; previously
Trustee from
January 2018 to
July 2019 | Retired. Executive and Senior Financial leadership positions in the public, private and nonprofit sectors. Interim President and CEO, McKnight Foundation, 2020. Interim Commissioner, Minnesota Department of Human Services, 2019. Chief Operating Officer, Twin Cities Habitat for Humanity, 2017-2019. Vice President for University Services, University of Minnesota, 2012-2016. Interim President and CEO, Blue Cross and Blue Shield of Minnesota, 2011-2012. Executive Vice-President and Chief Financial Officer, Minnesota Wild, 2002-2008. Commissioner, Minnesota Department of Finance, 1999-2002. Chair of the Board of Directors of Destination Medical Center Corporation. Board member of the Minnesota Wild Foundation. | N/A |
* Length of service dates reflect the Trustee’s commencement of service with the Trust’s predecessor entities, where applicable.
Allspring Large Company Value Fund | 31
Other information (unaudited)
Officers2
Name and
year of birth | Position held and
length of service | Principal occupations during past five years or longer |
Andrew Owen
(Born 1960) | President,
since 2017 | President and Chief Executive Officer of Allspring Funds Management, LLC since 2017 and Head of Global Fund Governance of Allspring Global Investments since 2022. Prior thereto, co-president of Galliard Capital Management, LLC, an affiliate of Allspring Funds Management, LLC, from 2019 to 2022 and Head of Affiliated Managers, Allspring Global Investments, from 2014 to 2019 and Executive Vice President responsible for marketing, investments and product development for Allspring Funds Management, LLC, from 2009 to 2014. |
Jeremy DePalma
(Born 1974) | Treasurer,
since 2012
(for certain funds in
the Fund Complex);
since 2021 (for
the remaining funds in the
Fund Complex) | Senior Vice President of Allspring Funds Management, LLC since 2009. Senior Vice President of Evergreen Investment Management Company, LLC from 2008 to 2010 and head of the Fund Reporting and Control Team within Fund Administration from 2005 to 2010. |
Christopher Baker
(Born 1976) | Chief Compliance Officer, since 2022 | Global Chief Compliance Officer for Allspring Global Investments since 2022. Prior thereto, Chief Compliance Officer for State Street Global Advisors from 2018 to 2021. Senior Compliance Officer for the State Street divisions of Alternative Investment Solutions, Sector Solutions, and Global Marketing from 2015 to 2018. From 2010 to 2015 Vice President, Global Head of Investment and Marketing Compliance for State Street Global Advisors. |
Matthew Prasse
(Born 1983) | Chief Legal Officer, since 2022; Secretary, since 2021 | Senior Counsel of the Allspring Legal Department since 2021. Senior Counsel of the Wells Fargo Legal Department from 2018 to 2021. Previously, Counsel for Barings LLC from 2015 to 2018. Prior to joining Barings, Associate at Morgan, Lewis & Bockius LLP from 2008 to 2015. |
1 The Statement of Additional Information includes additional information about the Trustees and is available, without charge, upon request, by calling 1-800-222-8222 or by visiting the website at allspringglobal.com.
2 For those Officers with tenures at Allspring Global Investments and/or Allspring Funds Management, LLC that began prior to 2021, such tenures include years of service during which these businesses/entities were known as Wells Fargo Asset Management and Wells Fargo Funds Management, LLC, respectively.
32 | Allspring Large Company Value Fund
For more information
More information about Allspring Funds is available free upon request. To obtain literature, please write, visit the Fund's website, or call:
Allspring Funds
P.O. Box 219967
Kansas City, MO 64121-9967
Website: allspringglobal.com
Individual investors: 1-800-222-8222
Retail investment professionals: 1-888-877-9275
Institutional investment professionals: 1-800-260-5969
This report and the financial statements contained herein are submitted for the general information of the shareholders of the Fund. If this report is used for promotional purposes, distribution of the report must be accompanied or preceded by a current prospectus. Before investing, please consider the investment objectives, risks, charges, and expenses of the investment. For a current prospectus and, if available, a summary prospectus, containing this information, call
1-800-222-8222 or visit the Fund's website at allspringglobal.com. Read the prospectus carefully before you invest or send money.
Allspring Global InvestmentsTM is the trade name for the asset management firms of Allspring Global Investments Holdings, LLC, a holding company indirectly owned by certain private funds of GTCR LLC and Reverence Capital Partners, L.P. These firms include but are not limited to Allspring Global Investments, LLC, and Allspring Funds Management, LLC. Certain products managed by Allspring entities are distributed by Allspring Funds Distributor, LLC (a broker-dealer and Member FINRA/SIPC).
This material is for general informational and educational purposes only and is NOT intended to provide investment advice or a recommendation of any kind - including a recommendation for any specific investment, strategy, or plan.
© 2023 Allspring Global Investments Holdings, LLC. All rights reserved.
ALL-02092023-8t5hzljs 03-23
SAR3325 01-23
Semi-Annual Report
January 31, 2023
Allspring
Discovery All Cap Growth Fund
The views expressed and any forward-looking statements are as of January 31, 2023, unless otherwise noted, and are those of the Fund's portfolio managers and/or Allspring Global Investments. Discussions of individual securities or the markets generally are not intended as individual recommendations. Future events or results may vary significantly from those expressed in any forward-looking statements. The views expressed are subject to change at any time in response to changing circumstances in the market. Allspring Global Investments disclaims any obligation to publicly update or revise any views expressed or forward-looking statements.
Allspring Discovery All Cap Growth Fund | 1
Letter to shareholders (unaudited)
Andrew Owen
President
Allspring Funds
Dear Shareholder:
We are pleased to offer you this semi-annual report for the Allspring Discovery All Cap Growth Fund for the six-month period that ended January 31, 2023. Globally, stocks and bonds experienced heightened volatility through the challenging period. Earlier tailwinds provided by global stimulus programs, vaccination rollouts, and recovering consumer and corporate sentiment were wiped away by the highest rate of inflation in four decades as well as the impact of ongoing aggressive central bank rate hikes and the prospect of more rate hikes. Compounding these concerns were the global reverberations of the Russia-Ukraine war and the impact of China’s strict COVID-19 lockdowns.
For the six-month period, stocks and bonds had mixed results, with non-U.S. equities––both developed market and emerging market––outperforming U.S. stocks overall. Bonds––both U.S. and non-U.S.––struggled to cope with sustained aggressive interest rate increases. For the period, U.S. stocks, based on the S&P 500 Index,1 lost 0.44%. International stocks, as measured by the MSCI ACWI ex USA Index (Net),2 returned 7.63%, while the MSCI EM Index (Net) (USD)3 gained 4.92%. Among bond indexes, the Bloomberg U.S. Aggregate Bond Index4 returned -2.37%, the Bloomberg Global Aggregate ex-USD Index (unhedged)5 returned -1.15%, the Bloomberg Municipal Bond Index6 gained 0.73%, and the ICE BofA U.S. High Yield Index7 returned 1.27%.
The Russia-Ukraine war, high inflation, and central bank rate hikes rocked markets
August was yet another broadly challenging month for financial markets, with more red ink flowing. High inflation persisted, cresting 9% in the eurozone on an annual basis and remaining above 8% in the U.S. despite the Federal Reserve’s (Fed’s) aggressive monetary policy and a major drop in global crude oil and gasoline prices from their June peak. One positive note was the resilience of the U.S. job market. However, the Fed’s job was clearly not complete. One longer-term bright spot was the U.S. Congress’s passage of the Inflation Reduction Act. Its primary stated goals include: to reduce inflation (though not immediately) by curbing the deficit, capping health care spending by seniors, and investing in domestic sources of clean energy.
“August was yet another broadly challenging month for financial markets, with more red ink flowing.”
| 1 | The S&P 500 Index consists of 500 stocks chosen for market size, liquidity, and industry group representation. It is a market-value-weighted index with each stock's weight in the index proportionate to its market value. You cannot invest directly in an index. |
| 2 | The Morgan Stanley Capital International (MSCI) All Country World Index (ACWI) ex USA Index (Net) is a free-float-adjusted market-capitalization-weighted index that is designed to measure the equity market performance of developed and emerging markets, excluding the U.S. Source: MSCI. MSCI makes no express or implied warranties or representations and shall have no liability whatsoever with respect to any MSCI data contained herein. The MSCI data may not be further redistributed or used as a basis for other indexes or any securities or financial products. This report is not approved, reviewed, or produced by MSCI. You cannot invest directly in an index. |
| 3 | The MSCI Emerging Markets (EM) Index (Net) (USD) is a free-float-adjusted market-capitalization-weighted index that is designed to measure equity market performance of emerging markets. You cannot invest directly in an index. |
| 4 | The Bloomberg U.S. Aggregate Bond Index is a broad-based benchmark that measures the investment-grade, U.S.-dollar-denominated, fixed-rate taxable bond market, including Treasuries, government-related and corporate securities, mortgage-backed securities (agency fixed-rate and hybrid adjustable-rate mortgage pass-throughs), asset-backed securities, and commercial mortgage-backed securities. You cannot invest directly in an index. |
| 5 | The Bloomberg Global Aggregate ex-USD Index (unhedged) is an unmanaged index that provides a broad-based measure of the global investment-grade fixed-income markets excluding the U.S.-dollar-denominated debt market. You cannot invest directly in an index. |
| 6 | The Bloomberg Municipal Bond Index is an unmanaged index composed of long-term tax-exempt bonds with a minimum credit rating of Baa. You cannot invest directly in an index. |
| 7 | The ICE BofA U.S. High Yield Index is a market-capitalization-weighted index of domestic and Yankee high-yield bonds. The index tracks the performance of high-yield securities traded in the U.S. bond market. You cannot invest directly in an index. Copyright 2023. ICE Data Indices, LLC. All rights reserved. |
2 | Allspring Discovery All Cap Growth Fund
Letter to shareholders (unaudited)
The market misery continued in September. There was nowhere to hide as all asset classes suffered major losses at the hands of persistent inflation. Central banks kept up their battle against rapidly rising prices with more rate hikes. The strength of the U.S. dollar made things even more difficult for investors holding assets in other currencies. U.S. mortgage rates jumped to near 7% on 30-year fixed-rate mortgages; the decreased housing affordability began to cool demand somewhat. The U.K. experienced a sharp sell-off of government bonds and the British pound in September as investors panicked in response to a new government budget that was seen as financially unsound. The market meltdown forced the Bank of England to step in and buy long-dated government bonds.
Equities had a reprieve in October after two months of sharp declines. Value stocks and small caps fared best. Globally, developed markets outpaced emerging market equities, which were hurt by weakness among Chinese stocks. Central banks continued to try to curtail high inflation with aggressive interest rate hikes. Geopolitical risks persisted, including the ongoing Russia-Ukraine war and economic, financial market, and political turmoil in the U.K., which led to a second prime ministerial change in six weeks, as Rishi Sunak replaced Liz Truss in late October. Concerns over Europe’s energy crisis eased thanks to unseasonably warm weather and plentiful gas on hand. The U.S. labor market continued its resilience against rising prices, as unemployment stood at 3.7%, near a record low.
Stocks and bonds rallied in November, with emerging market equities gaining nearly 15% and developed market equities returning 7%. The S&P 500 Index rose 5.6% in November. Bonds also had positive monthly returns. Economic news was encouraging, driven by U.S. labor market strength. Although central banks kept raising rates, expectations grew regarding an impending easing in the pace of rate hikes and a possible end to central bank monetary tightening in 2023. Although inflation remained at record highs in the eurozone, with a 10.6% annual increase in October, Germany’s producer prices decreased 4.2% annually, signaling a possible decline in inflationary pressures. Meanwhile, U.S. inflation continued to moderate, with a 7.1% annual price rise in November and a monthly price increase of just 0.1%. China’s economic data remained weak, reflecting its zero-COVID-19 policy.
Financial markets cooled in December, with U.S. equities posting negative overall results in response to a weakening U.S. dollar. Fixed income securities ended one of their worst years ever with flat overall monthly returns as markets weighed the hopes for an end to the monetary tightening cycle with the reality that central banks had not completed their jobs yet. U.S. Consumer Price Index (CPI)1 data showed a strong consistent trend downward, which brought down the 12-month CPI to 6.5% in December from 9.1% in June. Other countries and regions reported still-high but declining inflation rates as the year winded down.
The year 2023 began with a broad rally across global equities and fixed income securities. Investor optimism rose in response to data indicating declining inflation rates and the reopening of China’s economy with the abrupt end to its zero-COVID-19 policy. The U.S. reported surprisingly strong job gains––employers added more than 500,000 jobs––and unemployment fell to 3.4%, the lowest level since 1969. Meanwhile, wage growth, seen as a potential contributor to ongoing high inflation, continued to moderate. All eyes remained fixed on the Fed and on how many additional rate hikes it will announce before reaching the peak (“terminal”) rate, expected to be above 5%. The 0.25% federal funds rate hike announced in January was the Fed’s smallest rate increase since March 2022.
| 1 | The Consumer Price Index (CPI) is a measure of the average change over time in the prices paid by urban consumers for a market basket of consumer goods and services. You cannot invest directly in an index. |
Allspring Discovery All Cap Growth Fund | 3
Letter to shareholders (unaudited)
Don’t let short-term uncertainty derail long-term investment goals.
Periods of investment uncertainty can present challenges, but experience has taught us that maintaining long-term investment goals can be an effective way to plan for the future. To help you create a sound strategy based on your personal goals and risk tolerance, Allspring Funds offers more than 100 mutual funds spanning a wide range of asset classes and investment styles. Although diversification cannot guarantee an investment profit or prevent losses, we believe it can be an effective way to manage investment risk and potentially smooth out overall portfolio performance. We encourage investors to know their investments and to understand that appropriate levels of risk-taking may unlock opportunities.
Thank you for choosing to invest with Allspring Funds. We appreciate your confidence in us and remain committed to helping you meet your financial needs.
Sincerely,
Andrew Owen
President
Allspring Funds
For further information about your fund, contact your investment professional, visit our website at allspringglobal.com, or call us directly at 1-800-222-8222.
4 | Allspring Discovery All Cap Growth Fund
This page is intentionally left blank.
Performance highlights (unaudited)
| Investment objective | The Fund seeks long-term capital appreciation. |
| Manager | Allspring Funds Management, LLC |
| Subadviser | Allspring Global Investments, LLC |
| Portfolio managers | Michael T. Smith, CFA®‡, Christopher J. Warner, CFA®‡ |
| Average annual total returns (%) as of January 31, 2023 |
| | | Including sales charge | | Excluding sales charge | | Expense ratios1 (%) |
| | Inception date | 1 year | 5 year | 10 year | | 1 year | 5 year | 10 year | | Gross | Net 2 |
| Class A (EKOAX) | 4-29-1968 | -26.24 | 5.54 | 10.37 | | -21.74 | 6.80 | 11.02 | | 1.26 | 1.26 |
| Class C (EKOCX) | 8-2-1993 | -23.30 | 6.07 | 10.39 | | -22.30 | 6.07 | 10.39 | | 2.01 | 2.01 |
| Class R (EKORX) | 10-10-2003 | – | – | – | | -21.92 | 6.54 | 10.75 | | 1.51 | 1.51 |
| Administrator Class (EOMYX) | 1-13-1997 | – | – | – | | -21.60 | 6.98 | 11.24 | | 1.18 | 1.10 |
| Institutional Class (EKONX) | 7-30-2010 | – | – | – | | -21.41 | 7.24 | 11.52 | | 0.93 | 0.85 |
| Russell 3000® Growth Index3 | – | – | – | – | | -15.48 | 10.78 | 14.18 | | – | – |
Figures quoted represent past performance, which is no guarantee of future results, and do not reflect taxes that a shareholder may pay on an investment in a fund. Investment return and principal value of an investment will fluctuate so that an investor’s shares, when redeemed, may be worth more or less than their original cost. Performance shown without sales charges would be lower if sales charges were reflected. Current performance may be lower or higher than the performance data quoted, which assumes the reinvestment of dividends and capital gains. Current month-end performance is available on the Fund’s website, allspringglobal.com.
Index returns do not include transaction costs associated with buying and selling securities, any mutual fund fees or expenses, or any taxes. It is not possible to invest directly in an index.
For Class A shares, the maximum front-end sales charge is 5.75%. For Class C shares, the maximum contingent deferred sales charge is 1.00%. Performance including a contingent deferred sales charge assumes the sales charge for the corresponding time period. Class R, Administrator Class and Institutional Class shares are sold without a front-end sales charge or contingent deferred sales charge.
| 1 | Reflects the expense ratios as stated in the most recent prospectuses. The expense ratios shown are subject to change and may differ from the annualized expense ratios shown in the financial highlights of this report. |
| 2 | The manager has contractually committed through November 30, 2023, to waive fees and/or reimburse expenses to the extent necessary to cap total annual fund operating expenses after fee waivers at 1.26% for Class A, 2.01% for Class C, 1.51% for Class R, 1.10% for Administrator Class, and 0.85% for Institutional Class. Brokerage commissions, stamp duty fees, interest, taxes, acquired fund fees and expenses (if any), and extraordinary expenses are excluded from the expense caps. Prior to or after the commitment expiration date, the caps may be increased or the commitment to maintain the caps may be terminated only with the approval of the Board of Trustees. Without these caps, the Fund’s returns would have been lower. The expense ratio paid by an investor is the net expense ratio (the total annual fund operating expenses after fee waivers) as stated in the prospectuses. |
| 3 | The Russell 3000® Growth Index measures the performance of those Russell 3000® Index companies with higher price/book ratios and higher forecasted growth values. You cannot invest directly in an index. |
Stock values fluctuate in response to the activities of individual companies and general market and economic conditions. Certain investment strategies tend to increase the total risk of an investment (relative to the broader market). This fund is exposed to foreign investment risk and smaller-company securities risk. Consult the Fund’s prospectus for additional information on these and other risks.
| ‡ | CFA® and Chartered Financial Analyst® are trademarks owned by CFA Institute. |
6 | Allspring Discovery All Cap Growth Fund
Performance highlights (unaudited)
| Ten largest holdings (%) as of January 31, 20231 |
| Microsoft Corporation | 9.76 |
| Amazon.com Incorporated | 6.10 |
| Alphabet Incorporated Class A | 5.76 |
| Visa Incorporated Class A | 5.60 |
| UnitedHealth Group Incorporated | 2.99 |
| Cadence Design Systems Incorporated | 2.61 |
| Waste Connections Incorporated | 2.30 |
| The Home Depot Incorporated | 2.25 |
| Chipotle Mexican Grill Incorporated | 2.22 |
| MercadoLibre Incorporated | 2.07 |
| 1 | Figures represent the percentage of the Fund's net assets. Holdings are subject to change and may have changed since the date specified. |
| Sector allocation as of January 31, 20231 |
| 1 | Figures represent the percentage of the Fund's long-term investments. Allocations are subject to change and may have changed since the date specified. |
Allspring Discovery All Cap Growth Fund | 7
Fund expenses (unaudited)
As a shareholder of the Fund, you incur two types of costs: (1) transaction costs, including sales charges (loads) on purchase payments and contingent deferred sales charges (if any) on redemptions and (2) ongoing costs, including management fees, distribution (12b-1) and/or shareholder servicing fees, and other Fund expenses. This example is intended to help you understand your ongoing costs (in dollars) of investing in the Fund and to compare these costs with the ongoing costs of investing in other mutual funds.
The example is based on an investment of $1,000 invested at the beginning of the six-month period and held for the entire period from August 1, 2022 to January 31, 2023.
Actual expenses
The “Actual” line of the table below provides information about actual account values and actual expenses. You may use the information in this line, together with the amount you invested, to estimate the expenses that you paid over the period. Simply divide your account value by $1,000 (for example, an $8,600 account value divided by $1,000 = 8.6), then multiply the result by the number in the “Actual” line under the heading entitled “Expenses paid during period” for your applicable class of shares to estimate the expenses you paid on your account during this period.
Hypothetical example for comparison purposes
The “Hypothetical” line of the table below provides information about hypothetical account values and hypothetical expenses based on the Fund’s actual expense ratio and an assumed rate of return of 5% per year before expenses, which is not the Fund’s actual return. The hypothetical account values and expenses may not be used to estimate the actual ending account balance or expenses you paid for the period. You may use this information to compare the ongoing costs of investing in the Fund and other funds. To do so, compare this 5% hypothetical example with the 5% hypothetical examples that appear in the shareholder reports of the other funds.
Please note that the expenses shown in the table are meant to highlight your ongoing costs only and do not reflect any transactional costs, such as sales charges (loads) and contingent deferred sales charges. Therefore, the “Hypothetical” line of the table is useful in comparing ongoing costs only, and will not help you determine the relative total costs of owning different funds. In addition, if these transactional costs were included, your costs would have been higher.
| | Beginning
account value
8-1-2022 | Ending
account value
1-31-2023 | Expenses
paid during
the period1 | Annualized net
expense ratio |
| Class A | | | | |
| Actual | $1,000.00 | $ 949.16 | $ 6.19 | 1.26% |
| Hypothetical (5% return before expenses) | $1,000.00 | $1,018.85 | $ 6.41 | 1.26% |
| Class C | | | | |
| Actual | $1,000.00 | $ 945.76 | $ 9.86 | 2.01% |
| Hypothetical (5% return before expenses) | $1,000.00 | $1,015.07 | $10.21 | 2.01% |
| Class R | | | | |
| Actual | $1,000.00 | $ 948.09 | $ 7.41 | 1.51% |
| Hypothetical (5% return before expenses) | $1,000.00 | $1,017.59 | $ 7.68 | 1.51% |
| Administrator Class | | | | |
| Actual | $1,000.00 | $ 949.93 | $ 5.41 | 1.10% |
| Hypothetical (5% return before expenses) | $1,000.00 | $1,019.66 | $ 5.60 | 1.10% |
| Institutional Class | | | | |
| Actual | $1,000.00 | $ 951.16 | $ 4.18 | 0.85% |
| Hypothetical (5% return before expenses) | $1,000.00 | $1,020.92 | $ 4.33 | 0.85% |
1 Expenses paid is equal to the annualized net expense ratio of each class multiplied by the average account value over the period, multiplied by 184 divided by 365 (to reflect the one-half-year period).
8 | Allspring Discovery All Cap Growth Fund
Portfolio of investments—January 31, 2023 (unaudited)
| | | | | Shares | Value |
| Common stocks: 97.42% | | | | | |
| Communication services: 11.26% | | | | | |
| Entertainment: 3.04% | | | | | |
| Spotify Technology SA † | | | | 86,900 | $ 9,795,368 |
| Warner Music Group Corporation Class A | | | | 281,400 | 10,257,030 |
| | | | | | 20,052,398 |
| Interactive media & services: 8.22% | | | | | |
| Alphabet Incorporated Class A † | | | | 384,140 | 37,968,398 |
| Alphabet Incorporated Class C † | | | | 35,400 | 3,535,398 |
| Match Group Incorporated † | | | | 122,132 | 6,609,784 |
| ZoomInfo Technologies Incorporated † | | | | 214,400 | 6,052,512 |
| | | | | | 54,166,092 |
| Consumer discretionary: 17.37% | | | | | |
| Auto components: 1.31% | | | | | |
| Aptiv plc † | | | | 76,300 | 8,628,767 |
| Automobiles: 1.73% | | | | | |
| Ferrari NV | | | | 45,200 | 11,359,212 |
| Hotels, restaurants & leisure: 2.22% | | | | | |
| Chipotle Mexican Grill Incorporated † | | | | 8,900 | 14,652,782 |
| Internet & direct marketing retail: 8.62% | | | | | |
| Amazon.com Incorporated † | | | | 389,980 | 40,218,637 |
| Doordash Incorporated † | | | | 51,500 | 2,982,880 |
| MercadoLibre Incorporated † | | | | 11,542 | 13,639,066 |
| | | | | | 56,840,583 |
| Specialty retail: 2.25% | | | | | |
| The Home Depot Incorporated | | | | 45,713 | 14,818,783 |
| Textiles, apparel & luxury goods: 1.24% | | | | | |
| lululemon athletica Incorporated † | | | | 26,700 | 8,193,696 |
| Financials: 5.27% | | | | | |
| Capital markets: 3.33% | | | | | |
| Intercontinental Exchange Incorporated | | | | 100,730 | 10,833,512 |
| MarketAxess Holdings Incorporated | | | | 30,563 | 11,120,348 |
| | | | | | 21,953,860 |
| Insurance: 1.94% | | | | | |
| Progressive Corporation | | | | 94,000 | 12,816,900 |
| Health care: 13.80% | | | | | |
| Health care equipment & supplies: 6.28% | | | | | |
| Align Technology Incorporated † | | | | 30,534 | 8,235,936 |
| DexCom Incorporated † | | | | 120,600 | 12,915,054 |
| Edwards Lifesciences Corporation † | | | | 96,900 | 7,432,230 |
| Intuitive Surgical Incorporated † | | | | 52,200 | 12,825,018 |
| | | | | | 41,408,238 |
The accompanying notes are an integral part of these financial statements.
Allspring Discovery All Cap Growth Fund | 9
Portfolio of investments—January 31, 2023 (unaudited)
| | | | | Shares | Value |
| Health care providers & services: 4.53% | | | | | |
| Centene Corporation † | | | | 132,800 | $ 10,124,672 |
| UnitedHealth Group Incorporated | | | | 39,469 | 19,702,530 |
| | | | | | 29,827,202 |
| Life sciences tools & services: 2.99% | | | | | |
| Bio-Techne Corporation | | | | 95,100 | 7,575,666 |
| Illumina Incorporated † | | | | 24,200 | 5,183,640 |
| Waters Corporation † | | | | 21,200 | 6,965,896 |
| | | | | | 19,725,202 |
| Industrials: 8.04% | | | | | |
| Commercial services & supplies: 2.30% | | | | | |
| Waste Connections Incorporated | | | | 114,198 | 15,176,914 |
| Machinery: 1.84% | | | | | |
| Deere & Company | | | | 28,700 | 12,135,508 |
| Professional services: 1.86% | | | | | |
| Equifax Incorporated | | | | 55,200 | 12,265,440 |
| Road & rail: 2.04% | | | | | |
| Union Pacific Corporation | | | | 65,757 | 13,426,922 |
| Information technology: 37.98% | | | | | |
| Communications equipment: 2.06% | | | | | |
| Motorola Solutions Incorporated | | | | 52,900 | 13,595,829 |
| Electronic equipment, instruments & components: 3.27% | | | | | |
| Teledyne Technologies Incorporated † | | | | 28,100 | 11,921,706 |
| Zebra Technologies Corporation Class A † | | | | 30,500 | 9,643,490 |
| | | | | | 21,565,196 |
| IT services: 12.36% | | | | | |
| Adyen NV ADR † | | | | 618,600 | 9,303,744 |
| Fiserv Incorporated † | | | | 97,340 | 10,384,231 |
| Globant SA † | | | | 25,500 | 4,135,590 |
| MongoDB Incorporated † | | | | 24,100 | 5,162,461 |
| PayPal Holdings Incorporated † | | | | 116,238 | 9,472,235 |
| Snowflake Incorporated Class A † | | | | 38,900 | 6,085,516 |
| Visa Incorporated Class A | | | | 160,499 | 36,948,475 |
| | | | | | 81,492,252 |
| Semiconductors & semiconductor equipment: 2.09% | | | | | |
| Advanced Micro Devices Incorporated † | | | | 96,900 | 7,282,033 |
| Monolithic Power Systems Incorporated | | | | 15,200 | 6,483,712 |
| | | | | | 13,765,745 |
| Software: 18.20% | | | | | |
| Atlassian Corporation Class A † | | | | 41,800 | 6,755,716 |
| Bill.com Holdings Incorporated † | | | | 59,900 | 6,925,638 |
| Cadence Design Systems Incorporated † | | | | 94,100 | 17,204,303 |
| Crowdstrike Holdings Incorporated Class A † | | | | 56,400 | 5,972,760 |
| Datadog Incorporated Class A †« | | | | 69,700 | 5,214,257 |
The accompanying notes are an integral part of these financial statements.
10 | Allspring Discovery All Cap Growth Fund
Portfolio of investments—January 31, 2023 (unaudited)
| | | | | Shares | Value |
| Software (continued) | | | | | |
| Microsoft Corporation | | | | 259,750 | $ 64,368,648 |
| ServiceNow Incorporated † | | | | 29,700 | 13,517,361 |
| | | | | | 119,958,683 |
| Materials: 2.00% | | | | | |
| Chemicals: 2.00% | | | | | |
| The Sherwin-Williams Company | | | | 55,762 | 13,192,732 |
| Real estate: 1.70% | | | | | |
| Equity REITs: 1.70% | | | | | |
| SBA Communications Corporation | | | | 37,600 | 11,187,128 |
| Total Common stocks (Cost $396,552,568) | | | | | 642,206,064 |
| | | Yield | | | |
| Short-term investments: 3.50% | | | | | |
| Investment companies: 3.50% | | | | | |
| Allspring Government Money Market Fund Select Class ♠∞ | | 4.16% | | 17,871,661 | 17,871,661 |
| Securities Lending Cash Investments LLC ♠∩∞ | | 4.38 | | 5,217,074 | 5,217,074 |
| Total Short-term investments (Cost $23,088,695) | | | | | 23,088,735 |
| Total investments in securities (Cost $419,641,263) | 100.92% | | | | 665,294,799 |
| Other assets and liabilities, net | (0.92) | | | | (6,055,801) |
| Total net assets | 100.00% | | | | $659,238,998 |
| † | Non-income-earning security |
| « | All or a portion of this security is on loan. |
| ♠ | The issuer of the security is an affiliated person of the Fund as defined in the Investment Company Act of 1940. |
| ∩ | The investment is a non-registered investment company purchased with cash collateral received from securities on loan. |
| ∞ | The rate represents the 7-day annualized yield at period end. |
| Abbreviations: |
| ADR | American depositary receipt |
| REIT | Real estate investment trust |
The accompanying notes are an integral part of these financial statements.
Allspring Discovery All Cap Growth Fund | 11
Portfolio of investments—January 31, 2023 (unaudited)
Investments in affiliates
An affiliated investment is an investment in which the Fund owns at least 5% of the outstanding voting shares of the issuer or as a result of other relationships, such as the Fund and the issuer having the same investment manager. Transactions with issuers that were affiliates of the Fund at the end of the period were as follows:
| | Value,
beginning of
period | Purchases | Sales
proceeds | Net
realized
gains
(losses) | | Net
change in
unrealized
gains
(losses) | | Value,
end of
period | Shares,
end
of period | Income
from
affiliated
securities |
| Short-term investments | | | | | | | | | |
| Allspring Government Money Market Fund Select Class | $12,712,088 | $84,412,834 | $(79,253,261) | $0 | | $ 0 | | $ 17,871,661 | 17,871,661 | $ 207,395 |
| Securities Lending Cash Investments LLC | 0 | 13,739,200 | (8,522,166) | 0 | | 40 | | 5,217,074 | 5,217,074 | 15,643 # |
| | | | | $0 | | $40 | | $23,088,735 | | $223,038 |
| # | Amount shown represents income before fees and rebates. |
The accompanying notes are an integral part of these financial statements.
12 | Allspring Discovery All Cap Growth Fund
Statement of assets and liabilities—January 31, 2023 (unaudited)
| | |
| Assets | |
Investments in unaffiliated securities (including $5,102,344 of securities loaned), at value (cost $396,552,568)
| $ 642,206,064 |
Investments in affiliated securities, at value (cost $23,088,695)
| 23,088,735 |
Receivable for dividends
| 114,017 |
Receivable for Fund shares sold
| 83,010 |
Receivable for securities lending income, net
| 864 |
Prepaid expenses and other assets
| 76,474 |
Total assets
| 665,569,164 |
| Liabilities | |
Payable upon receipt of securities loaned
| 5,217,074 |
Payable for Fund shares redeemed
| 407,197 |
Management fee payable
| 401,852 |
Administration fees payable
| 108,853 |
Trustees’ fees and expenses payable
| 4,999 |
Distribution fees payable
| 3,470 |
Accrued expenses and other liabilities
| 186,721 |
Total liabilities
| 6,330,166 |
Total net assets
| $659,238,998 |
| Net assets consist of | |
Paid-in capital
| $ 416,215,471 |
Total distributable earnings
| 243,023,527 |
Total net assets
| $659,238,998 |
| Computation of net asset value and offering price per share | |
Net assets – Class A
| $ 596,170,988 |
Shares outstanding – Class A1
| 13,096,158 |
Net asset value per share – Class A
| $45.52 |
Maximum offering price per share – Class A2
| $48.30 |
Net assets – Class C
| $ 4,780,283 |
Shares outstanding – Class C1
| 215,146 |
Net asset value per share – Class C
| $22.22 |
Net assets – Class R
| $ 3,101,489 |
Shares outstanding – Class R1
| 75,357 |
Net asset value per share – Class R
| $41.16 |
Net assets – Administrator Class
| $ 21,740,695 |
Shares outstanding – Administrator Class1
| 416,658 |
Net asset value per share – Administrator Class
| $52.18 |
Net assets – Institutional Class
| $ 33,445,543 |
Shares outstanding – Institutional Class1
| 605,833 |
Net asset value per share – Institutional Class
| $55.21 |
| 1 | The Fund has an unlimited number of authorized shares. |
| 2 | Maximum offering price is computed as 100/94.25 of net asset value. On investments of $50,000 or more, the offering price is reduced. |
The accompanying notes are an integral part of these financial statements.
Allspring Discovery All Cap Growth Fund | 13
Statement of operations—six months ended January 31, 2023 (unaudited)
| | |
| Investment income | |
Dividends (net of foreign withholdings taxes of $16,832)
| $ 1,681,104 |
Income from affiliated securities
| 209,036 |
Total investment income
| 1,890,140 |
| Expenses | |
Management fee
| 2,689,955 |
| Administration fees | |
Class A
| 637,300 |
Class C
| 5,775 |
Class R
| 3,236 |
Administrator Class
| 14,261 |
Institutional Class
| 30,057 |
| Shareholder servicing fees | |
Class A
| 757,369 |
Class C
| 6,848 |
Class R
| 3,845 |
Administrator Class
| 26,445 |
| Distribution fees | |
Class C
| 20,275 |
Class R
| 3,845 |
Custody and accounting fees
| 25,448 |
Professional fees
| 20,422 |
Registration fees
| 37,205 |
Shareholder report expenses
| 36,143 |
Trustees’ fees and expenses
| 11,026 |
Other fees and expenses
| 8,794 |
Total expenses
| 4,338,249 |
| Less: Fee waivers and/or expense reimbursements | |
Fund-level
| (734) |
Class A
| (82,835) |
Administrator Class
| (10,851) |
Institutional Class
| (24,300) |
Net expenses
| 4,219,529 |
Net investment loss
| (2,329,389) |
| Realized and unrealized gains (losses) on investments | |
Net realized gains on investments
| 5,052,923 |
| Net change in unrealized gains (losses) on | |
Unaffiliated securities
| (45,928,605) |
Affiliated securities
| 40 |
Net change in unrealized gains (losses) on investments
| (45,928,565) |
Net realized and unrealized gains (losses) on investments
| (40,875,642) |
Net decrease in net assets resulting from operations
| $(43,205,031) |
The accompanying notes are an integral part of these financial statements.
14 | Allspring Discovery All Cap Growth Fund
Statement of changes in net assets
| | | | | |
| | Six months ended
January 31, 2023
(unaudited) | Year ended
July 31, 2022 |
| Operations | | | | |
Net investment loss
| | $ (2,329,389) | | $ (8,541,967) |
Net realized gains on investments
| | 5,052,923 | | 104,462,254 |
Net change in unrealized gains (losses) on investments
| | (45,928,565) | | (409,078,683) |
Net decrease in net assets resulting from operations
| | (43,205,031) | | (313,158,396) |
| Distributions to shareholders from | | | | |
| Net investment income and net realized gains | | | | |
Class A
| | (54,898,486) | | (121,148,916) |
Class C
| | (866,613) | | (2,406,526) |
Class R
| | (304,370) | | (676,869) |
Administrator Class
| | (1,767,086) | | (3,927,696) |
Institutional Class
| | (2,699,274) | | (11,872,753) |
Total distributions to shareholders
| | (60,535,829) | | (140,032,760) |
| Capital share transactions | Shares | | Shares | |
| Proceeds from shares sold | | | | |
Class A
| 80,405 | 3,676,953 | 219,171 | 15,490,689 |
Class C
| 8,266 | 200,589 | 28,194 | 1,043,099 |
Class R
| 3,827 | 163,839 | 6,255 | 363,627 |
Administrator Class
| 3,342 | 174,166 | 11,839 | 836,637 |
Institutional Class
| 40,405 | 2,292,503 | 200,533 | 15,639,020 |
| | | 6,508,050 | | 33,373,072 |
| Reinvestment of distributions | | | | |
Class A
| 1,220,643 | 52,719,587 | 1,570,459 | 116,182,478 |
Class C
| 41,072 | 866,613 | 60,148 | 2,406,526 |
Class R
| 7,773 | 303,617 | 9,970 | 675,390 |
Administrator Class
| 34,250 | 1,695,061 | 44,622 | 3,731,324 |
Institutional Class
| 50,950 | 2,666,737 | 133,993 | 11,768,627 |
| | | 58,251,615 | | 134,764,345 |
| Payment for shares redeemed | | | | |
Class A
| (861,807) | (39,938,255) | (1,343,090) | (89,808,431) |
Class C
| (68,455) | (1,682,087) | (173,239) | (7,232,231) |
Class R
| (7,469) | (322,343) | (12,968) | (761,541) |
Administrator Class
| (20,081) | (1,047,325) | (57,641) | (4,435,541) |
Institutional Class
| (605,224) | (33,625,456) | (413,787) | (29,889,860) |
| | | (76,615,466) | | (132,127,604) |
Net increase (decrease) in net assets resulting from capital share transactions
| | (11,855,801) | | 36,009,813 |
Total decrease in net assets
| | (115,596,661) | | (417,181,343) |
| Net assets | | | | |
Beginning of period
| | 774,835,659 | | 1,192,017,002 |
End of period
| | $ 659,238,998 | | $ 774,835,659 |
The accompanying notes are an integral part of these financial statements.
Allspring Discovery All Cap Growth Fund | 15
Financial highlights
(For a share outstanding throughout each period)
| | | Year ended July 31 |
| Class A | Six months ended
January 31, 2023
(unaudited) | 2022 | 2021 | 2020 | 2019 | 2018 |
Net asset value, beginning of period
| $52.95 | $83.33 | $64.95 | $55.19 | $54.77 | $49.43 |
Net investment loss
| (0.17) 1 | (0.60) 1 | (0.65) | (0.38) 1 | (0.33) 1 | (0.32) 1 |
Payment from affiliate
| 0.00 | 0.00 | 0.00 2 | 0.00 | 0.00 | 0.00 |
Net realized and unrealized gains (losses) on investments
| (2.76) | (19.62) | 23.40 | 13.24 | 6.56 | 12.57 |
Total from investment operations
| (2.93) | (20.22) | 22.75 | 12.86 | 6.23 | 12.25 |
| Distributions to shareholders from | | | | | | |
Net realized gains
| (4.50) | (10.16) | (4.37) | (3.10) | (5.81) | (6.91) |
Net asset value, end of period
| $45.52 | $52.95 | $83.33 | $64.95 | $55.19 | $54.77 |
Total return3
| (5.08)% | (27.73)% | 36.32% 4 | 24.55% | 13.89% | 26.86% |
| Ratios to average net assets (annualized) | | | | | | |
Gross expenses
| 1.29% | 1.26% | 1.26% | 1.28% | 1.28% | 1.28% |
Net expenses
| 1.26% | 1.25% | 1.26% | 1.28% | 1.28% | 1.28% |
Net investment loss
| (0.71)% | (0.89)% | (0.90)% | (0.68)% | (0.64)% | (0.63)% |
| Supplemental data | | | | | | |
Portfolio turnover rate
| 7% | 27% | 24% | 23% | 39% | 48% |
Net assets, end of period (000s omitted)
| $596,171 | $670,221 | $1,017,512 | $800,199 | $714,411 | $662,751 |
| 1 | Calculated based upon average shares outstanding |
| 2 | Amount is less than $0.005. |
| 3 | Total return calculations do not include any sales charges. Returns for periods of less than one year are not annualized. |
| 4 | During the year ended July 31, 2021, the Fund received a payment from an affiliate which had a 0.005% impact on the total return. |
The accompanying notes are an integral part of these financial statements.
16 | Allspring Discovery All Cap Growth Fund
Financial highlights
(For a share outstanding throughout each period)
| | | Year ended July 31 |
| Class C | Six months ended
January 31, 2023
(unaudited) | 2022 | 2021 | 2020 | 2019 | 2018 |
Net asset value, beginning of period
| $28.50 | $49.82 | $40.52 | $35.83 | $38.02 | $36.47 |
Net investment loss
| (0.18) 1 | (0.63) 1 | (0.72) 1 | (0.50) 1 | (0.48) 1 | (0.50) 1 |
Payment from affiliate
| 0.00 | 0.00 | 0.23 | 0.00 | 0.00 | 0.00 |
Net realized and unrealized gains (losses) on investments
| (1.60) | (10.53) | 14.16 | 8.29 | 4.10 | 8.96 |
Total from investment operations
| (1.78) | (11.16) | 13.67 | 7.79 | 3.62 | 8.46 |
| Distributions to shareholders from | | | | | | |
Net realized gains
| (4.50) | (10.16) | (4.37) | (3.10) | (5.81) | (6.91) |
Net asset value, end of period
| $22.22 | $28.50 | $49.82 | $40.52 | $35.83 | $38.02 |
Total return2
| (5.42)% | (28.27)% | 35.74% 3 | 23.61% | 13.04% | 25.88% |
| Ratios to average net assets (annualized) | | | | | | |
Gross expenses
| 2.02% | 1.98% | 2.01% | 2.03% | 2.03% | 2.03% |
Net expenses
| 2.01% | 1.98% | 2.01% | 2.03% | 2.03% | 2.03% |
Net investment loss
| (1.45)% | (1.62)% | (1.63)% | (1.42)% | (1.40)% | (1.38)% |
| Supplemental data | | | | | | |
Portfolio turnover rate
| 7% | 27% | 24% | 23% | 39% | 48% |
Net assets, end of period (000s omitted)
| $4,780 | $6,678 | $15,900 | $22,077 | $26,122 | $62,074 |
| 1 | Calculated based upon average shares outstanding |
| 2 | Total return calculations do not include any sales charges. Returns for periods of less than one year are not annualized. |
| 3 | During the year ended July 31, 2021, the Fund received a payment from an affiliate which had a 0.62% impact on the total return. |
The accompanying notes are an integral part of these financial statements.
Allspring Discovery All Cap Growth Fund | 17
Financial highlights
(For a share outstanding throughout each period)
| | | Year ended July 31 |
| Class R | Six months ended
January 31, 2023
(unaudited) | 2022 | 2021 | 2020 | 2019 | 2018 |
Net asset value, beginning of period
| $48.41 | $77.22 | $60.60 | $51.82 | $51.92 | $47.30 |
Net investment loss
| (0.21) 1 | (0.70) 1 | (0.76) 1 | (0.47) 1 | (0.43) 1 | (0.43) 1 |
Net realized and unrealized gains (losses) on investments
| (2.54) | (17.95) | 21.75 | 12.35 | 6.14 | 11.96 |
Total from investment operations
| (2.75) | (18.65) | 20.99 | 11.88 | 5.71 | 11.53 |
| Distributions to shareholders from | | | | | | |
Net realized gains
| (4.50) | (10.16) | (4.37) | (3.10) | (5.81) | (6.91) |
Net asset value, end of period
| $41.16 | $48.41 | $77.22 | $60.60 | $51.82 | $51.92 |
Total return2
| (5.19)% | (27.91)% | 36.01% | 24.24% | 13.63% | 26.53% |
| Ratios to average net assets (annualized) | | | | | | |
Gross expenses
| 1.54% | 1.49% | 1.49% | 1.52% | 1.53% | 1.53% |
Net expenses
| 1.51% | 1.49% | 1.49% | 1.52% | 1.53% | 1.53% |
Net investment loss
| (0.96)% | (1.13)% | (1.12)% | (0.91)% | (0.88)% | (0.88)% |
| Supplemental data | | | | | | |
Portfolio turnover rate
| 7% | 27% | 24% | 23% | 39% | 48% |
Net assets, end of period (000s omitted)
| $3,101 | $3,448 | $5,249 | $4,647 | $6,097 | $7,494 |
| 1 | Calculated based upon average shares outstanding |
| 2 | Returns for periods of less than one year are not annualized. |
The accompanying notes are an integral part of these financial statements.
18 | Allspring Discovery All Cap Growth Fund
Financial highlights
(For a share outstanding throughout each period)
| | | Year ended July 31 |
| Administrator Class | Six months ended
January 31, 2023
(unaudited) | 2022 | 2021 | 2020 | 2019 | 2018 |
Net asset value, beginning of period
| $59.92 | $92.83 | $71.80 | $60.58 | $59.39 | $52.99 |
Net investment loss
| (0.15) 1 | (0.55) | (0.62) | (0.30) 1 | (0.25) 1 | (0.25) 1 |
Net realized and unrealized gains (losses) on investments
| (3.09) | (22.20) | 26.02 | 14.62 | 7.25 | 13.56 |
Total from investment operations
| (3.24) | (22.75) | 25.40 | 14.32 | 7.00 | 13.31 |
| Distributions to shareholders from | | | | | | |
Net realized gains
| (4.50) | (10.16) | (4.37) | (3.10) | (5.81) | (6.91) |
Net asset value, end of period
| $52.18 | $59.92 | $92.83 | $71.80 | $60.58 | $59.39 |
Total return2
| (5.01)% | (27.61)% | 36.55% | 24.78% | 14.12% | 27.07% |
| Ratios to average net assets (annualized) | | | | | | |
Gross expenses
| 1.20% | 1.16% | 1.18% | 1.20% | 1.20% | 1.20% |
Net expenses
| 1.10% | 1.09% | 1.09% | 1.09% | 1.10% | 1.10% |
Net investment loss
| (0.55)% | (0.73)% | (0.73)% | (0.49)% | (0.45)% | (0.45)% |
| Supplemental data | | | | | | |
Portfolio turnover rate
| 7% | 27% | 24% | 23% | 39% | 48% |
Net assets, end of period (000s omitted)
| $21,741 | $23,917 | $37,163 | $28,712 | $26,141 | $24,140 |
| 1 | Calculated based upon average shares outstanding |
| 2 | Returns for periods of less than one year are not annualized. |
The accompanying notes are an integral part of these financial statements.
Allspring Discovery All Cap Growth Fund | 19
Financial highlights
(For a share outstanding throughout each period)
| | | Year ended July 31 |
| Institutional Class | Six months ended
January 31, 2023
(unaudited) | 2022 | 2021 | 2020 | 2019 | 2018 |
Net asset value, beginning of period
| $63.03 | $96.91 | $74.62 | $62.69 | $61.10 | $54.21 |
Net investment loss
| (0.08) 1 | (0.29) | (0.40) | (0.16) 1 | (0.12) 1 | (0.11) 1 |
Net realized and unrealized gains (losses) on investments
| (3.24) | (23.43) | 27.06 | 15.19 | 7.52 | 13.91 |
Total from investment operations
| (3.32) | (23.72) | 26.66 | 15.03 | 7.40 | 13.80 |
| Distributions to shareholders from | | | | | | |
Net realized gains
| (4.50) | (10.16) | (4.37) | (3.10) | (5.81) | (6.91) |
Net asset value, end of period
| $55.21 | $63.03 | $96.91 | $74.62 | $62.69 | $61.10 |
Total return2
| (4.88)% | (27.44)% | 36.87% | 25.09% | 14.39% | 27.39% |
| Ratios to average net assets (annualized) | | | | | | |
Gross expenses
| 0.96% | 0.93% | 0.93% | 0.95% | 0.95% | 0.95% |
Net expenses
| 0.85% | 0.85% | 0.85% | 0.85% | 0.85% | 0.85% |
Net investment loss
| (0.26)% | (0.49)% | (0.49)% | (0.25)% | (0.20)% | (0.20)% |
| Supplemental data | | | | | | |
Portfolio turnover rate
| 7% | 27% | 24% | 23% | 39% | 48% |
Net assets, end of period (000s omitted)
| $33,446 | $70,572 | $116,193 | $90,900 | $75,456 | $64,792 |
| 1 | Calculated based upon average shares outstanding |
| 2 | Returns for periods of less than one year are not annualized. |
The accompanying notes are an integral part of these financial statements.
20 | Allspring Discovery All Cap Growth Fund
Notes to financial statements (unaudited)
1. ORGANIZATION
Allspring Funds Trust (the "Trust"), a Delaware statutory trust organized on March 10, 1999, is an open-end management investment company registered under the Investment Company Act of 1940, as amended (the "1940 Act"). As an investment company, the Trust follows the accounting and reporting guidance in Financial Accounting Standards Board ("FASB") Accounting Standards Codification Topic 946, Financial Services – Investment Companies. These financial statements report on the Allspring Discovery All Cap Growth Fund (the "Fund") which is a diversified series of the Trust.
2. SIGNIFICANT ACCOUNTING POLICIES
The following significant accounting policies, which are consistently followed in the preparation of the financial statements of the Fund, are in conformity with U.S. generally accepted accounting principles which require management to make estimates and assumptions that affect the reported amounts of assets and liabilities, disclosure of contingent assets and liabilities at the date of the financial statements, and the reported amounts of income and expenses during the reporting period. Actual results could differ from those estimates.
Securities valuation
All investments are valued each business day as of the close of regular trading on the New York Stock Exchange (generally 4 p.m. Eastern Time), although the Fund may deviate from this calculation time under unusual or unexpected circumstances.
Equity securities that are listed on a foreign or domestic exchange or market are valued at the official closing price or, if none, the last sales price.
Investments in registered open-end investment companies (other than those listed on a foreign or domestic exchange or market) are valued at net asset value. Interests in non-registered investment companies that are redeemable at net asset value are fair valued normally at net asset value.
Investments which are not valued using the methods discussed above are valued at their fair value, as determined in good faith by Allspring Funds Management, LLC ("Allspring Funds Management"), which was named the valuation designee by the Board of Trustees. As the valuation designee, Allspring Funds Management is responsible for day-to-day valuation activities for the Allspring Funds. In connection with these responsibilities, Allspring Funds Management has established a Valuation Committee and has delegated to it the authority to take any actions regarding the valuation of portfolio securities that the Valuation Committee deems necessary or appropriate, including determining the fair value of portfolio securities. On a quarterly basis, the Board of Trustees receives reports of valuation actions taken by the Valuation Committee. On at least an annual basis, the Board of Trustees receives an assessment of the adequacy and effectiveness of Allspring Funds Management's process for determining the fair value of the portfolio of investments.
Foreign currency translation
The accounting records of the Fund are maintained in U.S. dollars. The values of other assets and liabilities denominated in foreign currencies are translated into U.S. dollars at rates provided by an independent foreign currency pricing source at a time each business day specified by the Allspring Global Investments Pricing Committee. Purchases and sales of securities, and income and expenses are converted at the rate of exchange on the respective dates of such transactions. Net realized foreign exchange gains or losses arise from sales of foreign currencies, currency gains or losses realized between the trade and settlement dates on securities transactions, and the difference between the amounts of dividends, interest and foreign withholding taxes recorded and the U.S. dollar equivalent of the amounts actually paid or received. Net unrealized foreign exchange gains and losses arise from changes in the fair value of assets and liabilities other than investments in securities resulting from changes in exchange rates. The changes in net assets arising from changes in exchange rates of securities and the changes in net assets resulting from changes in market prices of securities are not separately presented. Such changes are included in net realized and unrealized gains or losses from investments.
Securities lending
The Fund may lend its securities from time to time in order to earn additional income in the form of fees or interest on securities received as collateral or the investment of any cash received as collateral. When securities are on loan, the Fund receives interest or dividends on those securities. Cash collateral received in connection with its securities lending transactions is invested in Securities Lending Cash Investments, LLC (the "Securities Lending Fund"), an affiliated non-registered investment company. Investments in Securities Lending Fund are valued at the evaluated bid price provided by an independent pricing service. Income earned from investment in the Securities Lending Fund (net of fees and rebates), if any, is included in income from affiliated securities on the Statement of Operations.
Allspring Discovery All Cap Growth Fund | 21
Notes to financial statements (unaudited)
In a securities lending transaction, the net asset value of the Fund is affected by an increase or decrease in the value of the securities loaned and by an increase or decrease in the value of the instrument in which collateral is invested. The amount of securities lending activity undertaken by the Fund fluctuates from time to time. The Fund has the right under the lending agreement to recover the securities from the borrower on demand. In the event of default or bankruptcy by the borrower, the Fund may be prevented from recovering the loaned securities or gaining access to the collateral or may experience delays or costs in doing so. In such an event, the terms of the agreement allow the unaffiliated securities lending agent to use the collateral to purchase replacement securities on behalf of the Fund or pay the Fund the market value of the loaned securities. The Fund bears the risk of loss with respect to depreciation of its investment of the cash collateral.
Security transactions and income recognition
Securities transactions are recorded on a trade date basis. Realized gains or losses are recorded on the basis of identified cost.
Dividend income is recognized on the ex-dividend date. Dividend income is recorded net of foreign taxes withheld where recovery of such taxes is not assured.
Distributions to shareholders
Distributions to shareholders from net investment income and any net realized gains are recorded on the ex-dividend date and paid at least annually. Such distributions are determined in accordance with income tax regulations and may differ from U.S. generally accepted accounting principles. Dividend sources are estimated at the time of declaration. The tax character of distributions is determined as of the Fund's fiscal year end. Therefore, a portion of the Fund's distributions made prior to the Fund’s fiscal year end may be categorized as a tax return of capital at year end.
Federal and other taxes
The Fund intends to continue to qualify as a regulated investment company by distributing substantially all of its investment company taxable income and any net realized capital gains (after reduction for capital loss carryforwards) sufficient to relieve it from all, or substantially all, federal income taxes. Accordingly, no provision for federal income taxes was required.
The Fund’s income and federal excise tax returns and all financial records supporting those returns for the prior three fiscal years are subject to examination by the federal and Delaware revenue authorities. Management has analyzed the Fund's tax positions taken on federal, state, and foreign tax returns, as applicable, for all open tax years and does not believe that there are any uncertain tax positions that require recognition of a tax liability.
As of January 31, 2023, the aggregate cost of all investments for federal income tax purposes was $420,197,781 and the unrealized gains (losses) consisted of:
| Gross unrealized gains | $306,248,299 |
| Gross unrealized losses | (61,151,281) |
| Net unrealized gains | $245,097,018 |
As of July 31, 2022, the Fund had a qualified late-year ordinary loss of $4,237,579 which was recognized on the first day of the current fiscal year.
Class allocations
The separate classes of shares offered by the Fund differ principally in applicable sales charges, distribution, shareholder servicing, and administration fees. Class specific expenses are charged directly to that share class. Investment income, common fund-level expenses, and realized and unrealized gains (losses) on investments are allocated daily to each class of shares based on the relative proportion of net assets of each class.
22 | Allspring Discovery All Cap Growth Fund
Notes to financial statements (unaudited)
3. FAIR VALUATION MEASUREMENTS
Fair value measurements of investments are determined within a framework that has established a fair value hierarchy based upon the various data inputs utilized in determining the value of the Fund’s investments. The three-level hierarchy gives the highest priority to unadjusted quoted prices in active markets for identical assets or liabilities (Level 1) and the lowest priority to unobservable inputs (Level 3). The Fund’s investments are classified within the fair value hierarchy based on the lowest level of input that is significant to the fair value measurement. The inputs are summarized into three broad levels as follows:
| ■ | Level 1 – quoted prices in active markets for identical securities |
| ■ | Level 2 – other significant observable inputs (including quoted prices for similar securities, interest rates, prepayment speeds, credit risk, etc.) |
| ■ | Level 3 – significant unobservable inputs (including the Fund’s own assumptions in determining the fair value of investments) |
The inputs or methodologies used for valuing investments in securities are not necessarily an indication of the risk associated with investing in those securities.
The following is a summary of the inputs used in valuing the Fund’s assets and liabilities as of January 31, 2023:
| | Quoted prices
(Level 1) | Other significant
observable inputs
(Level 2) | Significant
unobservable inputs
(Level 3) | Total |
| Assets | | | | |
| Investments in: | | | | |
| Common stocks | | | | |
| Communication services | $ 74,218,490 | $0 | $0 | $ 74,218,490 |
| Consumer discretionary | 114,493,823 | 0 | 0 | 114,493,823 |
| Financials | 34,770,760 | 0 | 0 | 34,770,760 |
| Health care | 90,960,642 | 0 | 0 | 90,960,642 |
| Industrials | 53,004,784 | 0 | 0 | 53,004,784 |
| Information technology | 250,377,705 | 0 | 0 | 250,377,705 |
| Materials | 13,192,732 | 0 | 0 | 13,192,732 |
| Real estate | 11,187,128 | 0 | 0 | 11,187,128 |
| Short-term investments | | | | |
| Investment companies | 23,088,735 | 0 | 0 | 23,088,735 |
| Total assets | $665,294,799 | $0 | $0 | $665,294,799 |
Additional sector, industry or geographic detail, if any, is included in the Portfolio of Investments.
For the six months ended January 31, 2023, the Fund did not have any transfers into/out of Level 3.
4. TRANSACTIONS WITH AFFILIATES
Management fee
Allspring Funds Management, a wholly owned subsidiary of Allspring Global Investments Holdings, LLC, a holding company indirectly owned by certain private funds of GTCR LLC and Reverence Capital Partners, L.P., is the manager of the Fund and provides advisory and fund-level administrative services under an investment management agreement. Under the investment management agreement, Allspring Funds Management is responsible for, among other services, implementing the investment objectives and strategies of the Fund, supervising the subadviser and providing fund-level administrative services in connection with the Fund’s operations. As compensation for its services under the investment management agreement, Allspring Funds Management is entitled to receive a management fee at the following annual rate based on the Fund’s average daily net assets:
Allspring Discovery All Cap Growth Fund | 23
Notes to financial statements (unaudited)
| Average daily net assets | Management fee |
| First $500 million | 0.800% |
| Next $500 million | 0.750 |
| Next $1 billion | 0.700 |
| Next $2 billion | 0.675 |
| Next $1 billion | 0.650 |
| Next $3 billion | 0.640 |
| Next $2 billion | 0.615 |
| Next $2 billion | 0.605 |
| Next $4 billion | 0.580 |
| Over $16 billion | 0.555 |
For the six months ended January 31, 2023, the management fee was equivalent to an annual rate of 0.79% of the Fund’s average daily net assets.
Allspring Funds Management has retained the services of a subadviser to provide daily portfolio management to the Fund. The fee for subadvisory services is borne by Allspring Funds Management. Allspring Global Investments, LLC ("Allspring Investments"), an affiliate of Allspring Funds Management and a wholly owned subsidiary of Allspring Global Investments Holdings, LLC, is the subadviser to the Fund and is entitled to receive a fee from Allspring Funds Management at an annual rate starting at 0.45% and declining to 0.30% as the average daily net assets of the Fund increase.
Administration fees
Under a class-level administration agreement, Allspring Funds Management provides class-level administrative services to the Fund, which includes paying fees and expenses for services provided by the transfer agent, sub-transfer agents, omnibus account servicers and record-keepers. As compensation for its services under the class-level administration agreement, Allspring Funds Management receives an annual fee which is calculated based on the average daily net assets of each class as follows:
| | Class-level
administration fee |
| Class A | 0.21% |
| Class C | 0.21 |
| Class R | 0.21 |
| Administrator Class | 0.13 |
| Institutional Class | 0.13 |
Waivers and/or expense reimbursements
Allspring Funds Management has contractually committed to waive and/or reimburse management and administration fees to the extent necessary to maintain certain net operating expense ratios for the Fund. When each class of the Fund has exceeded its expense cap, Allspring Funds Management will waive fees and/or reimburse expenses from fund-level expenses on a proportionate basis and then from class specific expenses. When only certain classes exceed their expense caps, waivers and/or reimbursements are applied against class specific expenses before fund-level expenses. Allspring Funds Management has contractually committed through November 30, 2023 to waive fees and/or reimburse expenses to the extent necessary to cap expenses. Prior to or after the commitment expiration date, the caps may be increased or the commitment to maintain the caps may be terminated only with the approval of the Board of Trustees. As of January 31, 2023, the contractual expense caps are as follows:
24 | Allspring Discovery All Cap Growth Fund
Notes to financial statements (unaudited)
| | Expense ratio caps |
| Class A | 1.26% |
| Class C | 2.01 |
| Class R | 1.51 |
| Administrator Class | 1.10 |
| Institutional Class | 0.85 |
Distribution fees
The Trust has adopted a distribution plan for Class C and Class R shares pursuant to Rule 12b-1 under the 1940 Act. Distribution fees are charged to Class C and Class R shares and paid to Allspring Funds Distributor, LLC ("Allspring Funds Distributor"), the principal underwriter, an affiliate of Allspring Funds Management, at an annual rate up to 0.75% of the average daily net assets of Class C shares and up to 0.25% of the average daily net assets of Class R shares.
In addition, Allspring Funds Distributor is entitled to receive the front-end sales charge from the purchase of Class A shares and a contingent deferred sales charge on the redemption of certain Class A shares. Allspring Funds Distributor is also entitled to receive the contingent deferred sales charges from redemptions of Class C shares. For the six months ended January 31, 2023, Allspring Funds Distributor received $2,422 from the sale of Class A shares. No contingent deferred sales charges were incurred by Class A and Class C shares for the six months ended January 31, 2023.
Shareholder servicing fees
The Trust has entered into contracts with one or more shareholder servicing agents, whereby Class A, Class C, Class R, and Administrator Class are charged a fee at an annual rate up to 0.25% of the average daily net assets of each respective class. A portion of these total shareholder servicing fees were paid to affiliates of the Fund.
Interfund transactions
The Fund may purchase or sell portfolio investment securities to certain affiliates pursuant to Rule 17a-7 under the 1940 Act and under procedures adopted by the Board of Trustees. The procedures have been designed to ensure that these interfund transactions, which do not incur broker commissions, are effected at current market prices.
5. INVESTMENT PORTFOLIO TRANSACTIONS
Purchases and sales of investments, excluding U.S. government obligations (if any) and short-term securities, for the six months ended January 31, 2023 were $47,911,235 and $127,908,859, respectively.
6. SECURITIES LENDING TRANSACTIONS
The Fund lends its securities through an unaffiliated securities lending agent and receives collateral in the form of cash or securities with a value at least equal to the value of the securities on loan. The value of the loaned securities is determined at the close of each business day and any increases or decreases in the required collateral are exchanged between the Fund and the counterparty on the next business day. Cash collateral received is invested in the Securities Lending Fund which seeks to provide a positive return compared to the daily Federal Funds Open Rate by investing in high-quality, U.S. dollar-denominated short-term money market instruments and is exempt from registration under Section 3(c)(7) of the 1940 Act. Securities Lending Fund is managed by Allspring Funds Management and is subadvised by Allspring Investments. Allspring Funds Management receives an advisory fee starting at 0.05% and declining to 0.01% as the average daily net assets of the Securities Lending Fund increase. All of the fees received by Allspring Funds Management are paid to Allspring Investments for its services as subadviser.
In the event of counterparty default or the failure of a borrower to return a loaned security, the Fund has the right to use the collateral to offset any losses incurred. As of January 31, 2023, the Fund had securities lending transactions with the following counterparties which are subject to offset:
| Counterparty | Value of
securities on
loan | Collateral
received1 | Net Amount |
| National Bank of Canada | $5,102,344 | $(5,102,344) | $0 |
1 Collateral disclosed within this table is limited to the net transaction with the counterparty.
Allspring Discovery All Cap Growth Fund | 25
Notes to financial statements (unaudited)
7. BANK BORROWINGS
The Trust (excluding the money market funds), Allspring Master Trust and Allspring Variable Trust are parties to a $350,000,000 revolving credit agreement whereby the Fund is permitted to use bank borrowings for temporary or emergency purposes, such as to fund shareholder redemption requests. Interest under the credit agreement is charged to the Fund based on a borrowing rate equal to the higher of the Federal Funds rate or the overnight bank funding rate in effect on that day plus a spread. In addition, an annual commitment fee equal based on the unused balance is allocated to each participating fund.
For the six months ended January 31, 2023, there were no borrowings by the Fund under the agreement.
8. CONCENTRATION RISKS
As of the end of the period, the Fund concentrated its portfolio of investments in the information technology sector. A fund that invests a substantial portion of its assets in any sector may be more affected by changes in that sector than would be a fund whose investments are not heavily weighted in any sector.
9. MARKET RISKS
On March 11, 2020, the World Health Organization announced that it had made the assessment that coronavirus disease 2019 (“COVID-19”) is a pandemic. The impacts of COVID-19 are affecting the entire global economy, individual companies and investment products, the funds, and the market in general. There is significant uncertainty around the extent and duration of business disruptions related to COVID-19 and the impacts may last for an extended period of time. COVID-19 has led to significant uncertainty and volatility in the financial markets.
10. INDEMNIFICATION
Under the Fund's organizational documents, the officers and Trustees have been granted certain indemnification rights against certain liabilities that may arise out of performance of their duties to the Fund. The Fund has entered into a separate agreement with each Trustee that converts indemnification rights currently existing under the Fund’s organizational documents into contractual rights that cannot be changed in the future without the consent of the Trustee. Additionally, in the normal course of business, the Fund may enter into contracts with service providers that contain a variety of indemnification clauses. The Fund’s maximum exposure under these arrangements is dependent on future claims that may be made against the Fund and, therefore, cannot be estimated.
26 | Allspring Discovery All Cap Growth Fund
Other information (unaudited)
PROXY VOTING INFORMATION
A description of the policies and procedures used to determine how to vote proxies relating to portfolio securities is available without charge, upon request, by calling 1-800-222-8222, visiting our website at allspringglobal.com, or visiting the SEC website at sec.gov. Information regarding how the proxies related to portfolio securities were voted during the most recent 12-month period ended June 30 is available on the website at allspringglobal.com or by visiting the SEC website at sec.gov.
QUARTERLY PORTFOLIO HOLDINGS INFORMATION
The Fund files its complete schedule of portfolio holdings with the SEC for the first and third quarters of each fiscal year as an exhibit to its reports on Form N-PORT. Shareholders may view the filed Form N-PORT by visiting the SEC website at sec.gov.
Allspring Discovery All Cap Growth Fund | 27
Other information (unaudited)
BOARD OF TRUSTEES AND OFFICERS
Each of the Trustees and Officers listed in the table below acts in identical capacities for each fund in the Allspring family of funds, which consists of 127 mutual funds comprising the Allspring Funds Trust, Allspring Variable Trust, Allspring Master Trust and four closed-end funds (collectively the “Fund Complex”). This table should be read in conjunction with the Prospectus and the Statement of Additional Information1. The mailing address of each Trustee and Officer is 1415 Vantage Park Drive, 3rd Floor, Charlotte, NC 28203. Each Trustee and Officer serves an indefinite term, however, each Trustee serves such term until reaching the mandatory retirement age established by the Trustees.
Independent Trustees
Name and
year of birth | Position held and
length of service* | Principal occupations during past five years or longer | Current other
public company or
investment
company
directorships |
William R. Ebsworth
(Born 1957) | Trustee,
since 2015 | Retired. From 1984 to 2013, equities analyst, portfolio manager, research director and chief investment officer at Fidelity Management and Research Company in Boston, Tokyo, and Hong Kong, and retired in 2013 as Chief Investment Officer of Fidelity Strategic Advisers, Inc. where he led a team of investment professionals managing client assets. Prior thereto, Board member of Hong Kong Securities Clearing Co., Hong Kong Options Clearing Corp., the Thailand International Fund, Ltd., Fidelity Investments Life Insurance Company, and Empire Fidelity Investments Life Insurance Company. Audit Committee Chair and Investment Committee Chair of the Vincent Memorial Hospital Foundation (non-profit organization). Mr. Ebsworth is a CFA® charterholder. | N/A |
Jane A. Freeman
(Born 1953) | Trustee,
since 2015;
Chair Liaison,
since 2018 | Retired. From 2012 to 2014 and 1999 to 2008, Chief Financial Officer of Scientific Learning Corporation. From 2008 to 2012, Ms. Freeman provided consulting services related to strategic business projects. Prior to 1999, Portfolio Manager at Rockefeller & Co. and Scudder, Stevens & Clark. Board member of the Harding Loevner Funds from 1996 to 2014, serving as both Lead Independent Director and chair of the Audit Committee. Board member of the Russell Exchange Traded Funds Trust from 2011 to 2012 and the chair of the Audit Committee. Ms. Freeman is also an inactive Chartered Financial Analyst. | N/A |
Isaiah Harris, Jr.
(Born 1952) | Trustee,
since 2009; Audit
Committee
Chair,
since 2019 | Retired. Member of the Advisory Board of CEF of East Central Florida. Chairman of the Board of CIGNA Corporation from 2009 to 2021, and Director from 2005 to 2008. From 2003 to 2011, Director of Deluxe Corporation. Prior thereto, President and CEO of BellSouth Advertising and Publishing Corp. from 2005 to 2007, President and CEO of BellSouth Enterprises from 2004 to 2005 and President of BellSouth Consumer Services from 2000 to 2003. Emeritus member of the Iowa State University Foundation Board of Governors. Emeritus Member of the Advisory Board of Iowa State University School of Business. Advisory Board Member, Palm Harbor Academy (private school). Advisory Board Member, Fellowship of Christian Athletes. Mr. Harris is a certified public accountant (inactive status). | N/A |
David F. Larcker
(Born 1950) | Trustee,
since 2009 | Distinguished Visiting Fellow at the Hoover Institution since 2022. James Irvin Miller Professor of Accounting at the Graduate School of Business (Emeritus), Stanford University, Director of the Corporate Governance Research Initiative and Senior Faculty of The Rock Center for Corporate Governance since 2006. From 2005 to 2008, Professor of Accounting at the Graduate School of Business, Stanford University. Prior thereto, Ernst & Young Professor of Accounting at The Wharton School, University of Pennsylvania from 1985 to 2005. | N/A |
28 | Allspring Discovery All Cap Growth Fund
Other information (unaudited)
Name and
year of birth | Position held and
length of service* | Principal occupations during past five years or longer | Current other
public company or
investment
company
directorships |
Olivia S. Mitchell
(Born 1953) | Trustee,
since 2006;
Nominating and
Governance
Committee Chair,
since 2018 | International Foundation of Employee Benefit Plans Professor since 1993, Wharton School of the University of Pennsylvania. Director of Wharton’s Pension Research Council and Boettner Center on Pensions & Retirement Research, and Research Associate at the National Bureau of Economic Research. Previously taught at Cornell University from 1978 to 1993. | N/A |
Timothy J. Penny
(Born 1951) | Trustee,
since 1996;
Chair,
since 2018 | President and Chief Executive Officer of Southern Minnesota Initiative Foundation, a non-profit organization, since 2007. Vice Chair of the Economic Club of Minnesota, since 2007. Co-Chair of the Committee for a Responsible Federal Budget, since 1995. Member of the Board of Trustees of NorthStar Education Finance, Inc., a non-profit organization, from 2007-2022. Senior Fellow of the University of Minnesota Humphrey Institute from 1995 to 2017. | N/A |
James G. Polisson
(Born 1959) | Trustee,
since 2018 | Retired. Chief Marketing Officer, Source (ETF) UK Services, Ltd, from 2015 to 2017. From 2012 to 2015, Principal of The Polisson Group, LLC, a management consulting, corporate advisory and principal investing company. Chief Executive Officer and Managing Director at Russell Investments, Global Exchange Traded Funds from 2010 to 2012. Managing Director of Barclays Global Investors from 1998 to 2010 and Global Chief Marketing Officer for iShares and Barclays Global Investors from 2000 to 2010. Trustee of the San Francisco Mechanics’ Institute, a non-profit organization, from 2013 to 2015. Board member of the Russell Exchange Traded Fund Trust from 2011 to 2012. Director of Barclays Global Investors Holdings Deutschland GmbH from 2006 to 2009. Mr. Polisson is an attorney and has a retired status with the Massachusetts and District of Columbia Bar Associations. | N/A |
Pamela Wheelock
(Born 1959) | Trustee,
since January
2020; previously
Trustee from
January 2018 to
July 2019 | Retired. Executive and Senior Financial leadership positions in the public, private and nonprofit sectors. Interim President and CEO, McKnight Foundation, 2020. Interim Commissioner, Minnesota Department of Human Services, 2019. Chief Operating Officer, Twin Cities Habitat for Humanity, 2017-2019. Vice President for University Services, University of Minnesota, 2012-2016. Interim President and CEO, Blue Cross and Blue Shield of Minnesota, 2011-2012. Executive Vice-President and Chief Financial Officer, Minnesota Wild, 2002-2008. Commissioner, Minnesota Department of Finance, 1999-2002. Chair of the Board of Directors of Destination Medical Center Corporation. Board member of the Minnesota Wild Foundation. | N/A |
* Length of service dates reflect the Trustee’s commencement of service with the Trust’s predecessor entities, where applicable.
Allspring Discovery All Cap Growth Fund | 29
Other information (unaudited)
Officers2
Name and
year of birth | Position held and
length of service | Principal occupations during past five years or longer |
Andrew Owen
(Born 1960) | President,
since 2017 | President and Chief Executive Officer of Allspring Funds Management, LLC since 2017 and Head of Global Fund Governance of Allspring Global Investments since 2022. Prior thereto, co-president of Galliard Capital Management, LLC, an affiliate of Allspring Funds Management, LLC, from 2019 to 2022 and Head of Affiliated Managers, Allspring Global Investments, from 2014 to 2019 and Executive Vice President responsible for marketing, investments and product development for Allspring Funds Management, LLC, from 2009 to 2014. |
Jeremy DePalma
(Born 1974) | Treasurer,
since 2012
(for certain funds in
the Fund Complex);
since 2021 (for
the remaining funds in the
Fund Complex) | Senior Vice President of Allspring Funds Management, LLC since 2009. Senior Vice President of Evergreen Investment Management Company, LLC from 2008 to 2010 and head of the Fund Reporting and Control Team within Fund Administration from 2005 to 2010. |
Christopher Baker
(Born 1976) | Chief Compliance Officer, since 2022 | Global Chief Compliance Officer for Allspring Global Investments since 2022. Prior thereto, Chief Compliance Officer for State Street Global Advisors from 2018 to 2021. Senior Compliance Officer for the State Street divisions of Alternative Investment Solutions, Sector Solutions, and Global Marketing from 2015 to 2018. From 2010 to 2015 Vice President, Global Head of Investment and Marketing Compliance for State Street Global Advisors. |
Matthew Prasse
(Born 1983) | Chief Legal Officer, since 2022; Secretary, since 2021 | Senior Counsel of the Allspring Legal Department since 2021. Senior Counsel of the Wells Fargo Legal Department from 2018 to 2021. Previously, Counsel for Barings LLC from 2015 to 2018. Prior to joining Barings, Associate at Morgan, Lewis & Bockius LLP from 2008 to 2015. |
1 The Statement of Additional Information includes additional information about the Trustees and is available, without charge, upon request, by calling 1-800-222-8222 or by visiting the website at allspringglobal.com.
2 For those Officers with tenures at Allspring Global Investments and/or Allspring Funds Management, LLC that began prior to 2021, such tenures include years of service during which these businesses/entities were known as Wells Fargo Asset Management and Wells Fargo Funds Management, LLC, respectively.
30 | Allspring Discovery All Cap Growth Fund
For more information
More information about Allspring Funds is available free upon request. To obtain literature, please write, visit the Fund's website, or call:
Allspring Funds
P.O. Box 219967
Kansas City, MO 64121-9967
Website: allspringglobal.com
Individual investors: 1-800-222-8222
Retail investment professionals: 1-888-877-9275
Institutional investment professionals: 1-800-260-5969
This report and the financial statements contained herein are submitted for the general information of the shareholders of the Fund. If this report is used for promotional purposes, distribution of the report must be accompanied or preceded by a current prospectus. Before investing, please consider the investment objectives, risks, charges, and expenses of the investment. For a current prospectus and, if available, a summary prospectus, containing this information, call
1-800-222-8222 or visit the Fund's website at allspringglobal.com. Read the prospectus carefully before you invest or send money.
Allspring Global InvestmentsTM is the trade name for the asset management firms of Allspring Global Investments Holdings, LLC, a holding company indirectly owned by certain private funds of GTCR LLC and Reverence Capital Partners, L.P. These firms include but are not limited to Allspring Global Investments, LLC, and Allspring Funds Management, LLC. Certain products managed by Allspring entities are distributed by Allspring Funds Distributor, LLC (a broker-dealer and Member FINRA/SIPC).
This material is for general informational and educational purposes only and is NOT intended to provide investment advice or a recommendation of any kind - including a recommendation for any specific investment, strategy, or plan.
© 2023 Allspring Global Investments Holdings, LLC. All rights reserved.
ALL-02142023-5wzhtmn6 03-23
SAR0419 01-23
Semi-Annual Report
January 31, 2023
Allspring Premier Large Company Growth Fund
The views expressed and any forward-looking statements are as of January 31, 2023, unless otherwise noted, and are those of the Fund's portfolio managers and/or Allspring Global Investments. Discussions of individual securities or the markets generally are not intended as individual recommendations. Future events or results may vary significantly from those expressed in any forward-looking statements. The views expressed are subject to change at any time in response to changing circumstances in the market. Allspring Global Investments disclaims any obligation to publicly update or revise any views expressed or forward-looking statements.
Allspring Premier Large Company Growth Fund | 1
Letter to shareholders (unaudited)
Andrew Owen
President
Allspring Funds
Dear Shareholder:
We are pleased to offer you this semi-annual report for the Allspring Premier Large Company Growth Fund for the six-month period that ended January 31, 2023. Globally, stocks and bonds experienced heightened volatility through the challenging period. Earlier tailwinds provided by global stimulus programs, vaccination rollouts, and recovering consumer and corporate sentiment were wiped away by the highest rate of inflation in four decades as well as the impact of ongoing aggressive central bank rate hikes and the prospect of more rate hikes. Compounding these concerns were the global reverberations of the Russia-Ukraine war and the impact of China’s strict COVID-19 lockdowns.
For the six-month period, stocks and bonds had mixed results, with non-U.S. equities––both developed market and emerging market––outperforming U.S. stocks overall. Bonds––both U.S. and non-U.S.––struggled to cope with sustained aggressive interest rate increases. For the period, U.S. stocks, based on the S&P 500 Index,1 lost 0.44%. International stocks, as measured by the MSCI ACWI ex USA Index (Net),2 returned 7.63%, while the MSCI EM Index (Net) (USD)3 gained 4.92%. Among bond indexes, the Bloomberg U.S. Aggregate Bond Index4 returned -2.37%, the Bloomberg Global Aggregate ex-USD Index (unhedged)5 returned -1.15%, the Bloomberg Municipal Bond Index6 gained 0.73%, and the ICE BofA U.S. High Yield Index7 returned 1.27%.
The Russia-Ukraine war, high inflation, and central bank rate hikes rocked markets
August was yet another broadly challenging month for financial markets, with more red ink flowing. High inflation persisted, cresting 9% in the eurozone on an annual basis and remaining above 8% in the U.S. despite the Federal Reserve’s (Fed’s) aggressive monetary policy and a major drop in global crude oil and gasoline prices from their June peak. One positive note was the resilience of the U.S. job market. However, the Fed’s job was clearly not complete. One longer-term bright spot was the U.S. Congress’s passage of the Inflation Reduction Act. Its primary stated goals include: to reduce inflation (though not immediately) by curbing the deficit, capping health care spending by seniors, and investing in domestic sources of clean energy.
“August was yet another broadly challenging month for financial markets, with more red ink flowing.”
| 1 | The S&P 500 Index consists of 500 stocks chosen for market size, liquidity, and industry group representation. It is a market-value-weighted index with each stock's weight in the index proportionate to its market value. You cannot invest directly in an index. |
| 2 | The Morgan Stanley Capital International (MSCI) All Country World Index (ACWI) ex USA Index (Net) is a free-float-adjusted market-capitalization-weighted index that is designed to measure the equity market performance of developed and emerging markets, excluding the U.S. Source: MSCI. MSCI makes no express or implied warranties or representations and shall have no liability whatsoever with respect to any MSCI data contained herein. The MSCI data may not be further redistributed or used as a basis for other indexes or any securities or financial products. This report is not approved, reviewed, or produced by MSCI. You cannot invest directly in an index. |
| 3 | The MSCI Emerging Markets (EM) Index (Net) (USD) is a free-float-adjusted market-capitalization-weighted index that is designed to measure equity market performance of emerging markets. You cannot invest directly in an index. |
| 4 | The Bloomberg U.S. Aggregate Bond Index is a broad-based benchmark that measures the investment-grade, U.S.-dollar-denominated, fixed-rate taxable bond market, including Treasuries, government-related and corporate securities, mortgage-backed securities (agency fixed-rate and hybrid adjustable-rate mortgage pass-throughs), asset-backed securities, and commercial mortgage-backed securities. You cannot invest directly in an index. |
| 5 | The Bloomberg Global Aggregate ex-USD Index (unhedged) is an unmanaged index that provides a broad-based measure of the global investment-grade fixed-income markets excluding the U.S.-dollar-denominated debt market. You cannot invest directly in an index. |
| 6 | The Bloomberg Municipal Bond Index is an unmanaged index composed of long-term tax-exempt bonds with a minimum credit rating of Baa. You cannot invest directly in an index. |
| 7 | The ICE BofA U.S. High Yield Index is a market-capitalization-weighted index of domestic and Yankee high-yield bonds. The index tracks the performance of high-yield securities traded in the U.S. bond market. You cannot invest directly in an index. Copyright 2023. ICE Data Indices, LLC. All rights reserved. |
2 | Allspring Premier Large Company Growth Fund
Letter to shareholders (unaudited)
The market misery continued in September. There was nowhere to hide as all asset classes suffered major losses at the hands of persistent inflation. Central banks kept up their battle against rapidly rising prices with more rate hikes. The strength of the U.S. dollar made things even more difficult for investors holding assets in other currencies. U.S. mortgage rates jumped to near 7% on 30-year fixed-rate mortgages; the decreased housing affordability began to cool demand somewhat. The U.K. experienced a sharp sell-off of government bonds and the British pound in September as investors panicked in response to a new government budget that was seen as financially unsound. The market meltdown forced the Bank of England to step in and buy long-dated government bonds.
Equities had a reprieve in October after two months of sharp declines. Value stocks and small caps fared best. Globally, developed markets outpaced emerging market equities, which were hurt by weakness among Chinese stocks. Central banks continued to try to curtail high inflation with aggressive interest rate hikes. Geopolitical risks persisted, including the ongoing Russia-Ukraine war and economic, financial market, and political turmoil in the U.K., which led to a second prime ministerial change in six weeks, as Rishi Sunak replaced Liz Truss in late October. Concerns over Europe’s energy crisis eased thanks to unseasonably warm weather and plentiful gas on hand. The U.S. labor market continued its resilience against rising prices, as unemployment stood at 3.7%, near a record low.
Stocks and bonds rallied in November, with emerging market equities gaining nearly 15% and developed market equities returning 7%. The S&P 500 Index rose 5.6% in November. Bonds also had positive monthly returns. Economic news was encouraging, driven by U.S. labor market strength. Although central banks kept raising rates, expectations grew regarding an impending easing in the pace of rate hikes and a possible end to central bank monetary tightening in 2023. Although inflation remained at record highs in the eurozone, with a 10.6% annual increase in October, Germany’s producer prices decreased 4.2% annually, signaling a possible decline in inflationary pressures. Meanwhile, U.S. inflation continued to moderate, with a 7.1% annual price rise in November and a monthly price increase of just 0.1%. China’s economic data remained weak, reflecting its zero-COVID-19 policy.
Financial markets cooled in December, with U.S. equities posting negative overall results in response to a weakening U.S. dollar. Fixed income securities ended one of their worst years ever with flat overall monthly returns as markets weighed the hopes for an end to the monetary tightening cycle with the reality that central banks had not completed their jobs yet. U.S. Consumer Price Index (CPI)1 data showed a strong consistent trend downward, which brought down the 12-month CPI to 6.5% in December from 9.1% in June. Other countries and regions reported still-high but declining inflation rates as the year winded down.
The year 2023 began with a broad rally across global equities and fixed income securities. Investor optimism rose in response to data indicating declining inflation rates and the reopening of China’s economy with the abrupt end to its zero-COVID-19 policy. The U.S. reported surprisingly strong job gains––employers added more than 500,000 jobs––and unemployment fell to 3.4%, the lowest level since 1969. Meanwhile, wage growth, seen as a potential contributor to ongoing high inflation, continued to moderate. All eyes remained fixed on the Fed and on how many additional rate hikes it will announce before reaching the peak (“terminal”) rate, expected to be above 5%. The 0.25% federal funds rate hike announced in January was the Fed’s smallest rate increase since March 2022.
| 1 | The Consumer Price Index (CPI) is a measure of the average change over time in the prices paid by urban consumers for a market basket of consumer goods and services. You cannot invest directly in an index. |
Allspring Premier Large Company Growth Fund | 3
Letter to shareholders (unaudited)
Don’t let short-term uncertainty derail long-term investment goals.
Periods of investment uncertainty can present challenges, but experience has taught us that maintaining long-term investment goals can be an effective way to plan for the future. To help you create a sound strategy based on your personal goals and risk tolerance, Allspring Funds offers more than 100 mutual funds spanning a wide range of asset classes and investment styles. Although diversification cannot guarantee an investment profit or prevent losses, we believe it can be an effective way to manage investment risk and potentially smooth out overall portfolio performance. We encourage investors to know their investments and to understand that appropriate levels of risk-taking may unlock opportunities.
Thank you for choosing to invest with Allspring Funds. We appreciate your confidence in us and remain committed to helping you meet your financial needs.
Sincerely,
Andrew Owen
President
Allspring Funds
For further information about your fund, contact your investment professional, visit our website at allspringglobal.com, or call us directly at 1-800-222-8222.
4 | Allspring Premier Large Company Growth Fund
This page is intentionally left blank.
Performance highlights (unaudited)
| Investment objective | The Fund seeks long-term capital appreciation. |
| Manager | Allspring Funds Management, LLC |
| Subadviser | Allspring Global Investments, LLC |
| Portfolio managers | Robert Gruendyke, CFA®‡, Thomas C. Ognar, CFA®‡ |
| Average annual total returns (%) as of January 31, 2023 |
| | | Including sales charge | | Excluding sales charge | | Expense ratios1 (%) |
| | Inception date | 1 year | 5 year | 10 year | | 1 year | 5 year | 10 year | | Gross | Net 2 |
| Class A (EKJAX) | 1-20-1998 | -23.55 | 5.60 | 10.05 | | -18.89 | 6.87 | 10.70 | | 1.13 | 1.11 |
| Class C (EKJCX) | 1-22-1998 | -20.53 | 6.05 | 10.03 | | -19.53 | 6.05 | 10.03 | | 1.88 | 1.86 |
| Class R4 (EKJRX) | 11-30-2012 | – | – | – | | -18.53 | 7.22 | 11.05 | | 0.85 | 0.80 |
| Class R6 (EKJFX) | 11-30-2012 | – | – | – | | -18.56 | 7.35 | 11.20 | | 0.70 | 0.65 |
| Administrator Class (WFPDX) | 7-16-2010 | – | – | – | | -18.81 | 6.98 | 10.84 | | 1.05 | 1.00 |
| Institutional Class (EKJYX) | 6-30-1999 | – | – | – | | -18.58 | 7.30 | 11.16 | | 0.80 | 0.70 |
| Russell 1000® Growth Index | – | – | – | – | | -16.02 | 11.22 | 14.53 | | – | – |
Figures quoted represent past performance, which is no guarantee of future results, and do not reflect taxes that a shareholder may pay on an investment in a fund. Investment return and principal value of an investment will fluctuate so that an investor’s shares, when redeemed, may be worth more or less than their original cost. Performance shown without sales charges would be lower if sales charges were reflected. Current performance may be lower or higher than the performance data quoted, which assumes the reinvestment of dividends and capital gains. Current month-end performance is available on the Fund’s website, allspringglobal.com.
Index returns do not include transaction costs associated with buying and selling securities, any mutual fund fees or expenses, or any taxes. It is not possible to invest directly in an index.
For Class A shares, the maximum front-end sales charge is 5.75%. For Class C shares, the maximum contingent deferred sales charge is 1.00%. Performance including a contingent deferred sales charge assumes the sales charge for the corresponding time period. Class R4, Class R6, Administrator Class and Institutional Class shares are sold without a front-end sales charge or contingent deferred sales charge.
| 1 | Reflects the expense ratios as stated in the most recent prospectuses. The expense ratios shown are subject to change and may differ from the annualized expense ratios shown in the financial highlights of this report. |
| 2 | The manager has contractually committed through November 30, 2023, to waive fees and/or reimburse expenses to the extent necessary to cap total annual fund operating expenses after fee waivers at 1.11% for Class A, 1.86% for Class C, 0.80% for Class R4, 0.65% for Class R6, 1.00% for Administrator Class, and 0.70% for Institutional Class. Brokerage commissions, stamp duty fees, interest, taxes, acquired fund fees and expenses (if any), and extraordinary expenses are excluded from the expense caps. Prior to or after the commitment expiration date, the caps may be increased or the commitment to maintain the caps may be terminated only with the approval of the Board of Trustees. Without these caps, the Fund’s returns would have been lower. The expense ratio paid by an investor is the net expense ratio (the total annual fund operating expenses after fee waivers) as stated in the prospectuses. |
Stock values fluctuate in response to the activities of individual companies and general market and economic conditions. Certain investment strategies tend to increase the total risk of an investment (relative to the broader market). This fund is exposed to foreign investment risk. Consult the Fund’s prospectus for additional information on these and other risks.
| ‡ | CFA® and Chartered Financial Analyst® are trademarks owned by CFA Institute. |
6 | Allspring Premier Large Company Growth Fund
Performance highlights (unaudited)
| Ten largest holdings (%) as of January 31, 20231 |
| Microsoft Corporation | 8.77 |
| MasterCard Incorporated Class A | 5.54 |
| Apple Incorporated | 4.12 |
| Alphabet Incorporated Class A | 3.86 |
| Amazon.com Incorporated | 3.15 |
| Deckers Outdoor Corporation | 2.32 |
| Visa Incorporated Class A | 1.96 |
| HEICO Corporation | 1.90 |
| NVIDIA Corporation | 1.80 |
| Tradeweb Markets Incorporated Class A | 1.77 |
| 1 | Figures represent the percentage of the Fund's net assets. Holdings are subject to change and may have changed since the date specified. |
| Sector allocation as of January 31, 20231 |
| 1 | Figures represent the percentage of the Fund's long-term investments. Allocations are subject to change and may have changed since the date specified. |
Allspring Premier Large Company Growth Fund | 7
Fund expenses (unaudited)
As a shareholder of the Fund, you incur two types of costs: (1) transaction costs, including sales charges (loads) on purchase payments and contingent deferred sales charges (if any) on redemptions and (2) ongoing costs, including management fees, distribution (12b-1) and/or shareholder servicing fees, and other Fund expenses. This example is intended to help you understand your ongoing costs (in dollars) of investing in the Fund and to compare these costs with the ongoing costs of investing in other mutual funds.
The example is based on an investment of $1,000 invested at the beginning of the six-month period and held for the entire period from August 1, 2022 to January 31, 2023.
Actual expenses
The “Actual” line of the table below provides information about actual account values and actual expenses. You may use the information in this line, together with the amount you invested, to estimate the expenses that you paid over the period. Simply divide your account value by $1,000 (for example, an $8,600 account value divided by $1,000 = 8.6), then multiply the result by the number in the “Actual” line under the heading entitled “Expenses paid during period” for your applicable class of shares to estimate the expenses you paid on your account during this period.
Hypothetical example for comparison purposes
The “Hypothetical” line of the table below provides information about hypothetical account values and hypothetical expenses based on the Fund’s actual expense ratio and an assumed rate of return of 5% per year before expenses, which is not the Fund’s actual return. The hypothetical account values and expenses may not be used to estimate the actual ending account balance or expenses you paid for the period. You may use this information to compare the ongoing costs of investing in the Fund and other funds. To do so, compare this 5% hypothetical example with the 5% hypothetical examples that appear in the shareholder reports of the other funds.
Please note that the expenses shown in the table are meant to highlight your ongoing costs only and do not reflect any transactional costs, such as sales charges (loads) and contingent deferred sales charges. Therefore, the “Hypothetical” line of the table is useful in comparing ongoing costs only, and will not help you determine the relative total costs of owning different funds. In addition, if these transactional costs were included, your costs would have been higher.
| | Beginning
account value
8-1-2022 | Ending
account value
1-31-2023 | Expenses
paid during
the period1 | Annualized net
expense ratio |
| Class A | | | | |
| Actual | $1,000.00 | $ 934.14 | $5.41 | 1.11% |
| Hypothetical (5% return before expenses) | $1,000.00 | $1,019.61 | $5.65 | 1.11% |
| Class C | | | | |
| Actual | $1,000.00 | $ 930.30 | $9.05 | 1.86% |
| Hypothetical (5% return before expenses) | $1,000.00 | $1,015.83 | $9.45 | 1.86% |
| Class R4 | | | | |
| Actual | $1,000.00 | $ 934.92 | $3.90 | 0.80% |
| Hypothetical (5% return before expenses) | $1,000.00 | $1,021.17 | $4.08 | 0.80% |
| Class R6 | | | | |
| Actual | $1,000.00 | $ 935.86 | $3.17 | 0.65% |
| Hypothetical (5% return before expenses) | $1,000.00 | $1,021.93 | $3.31 | 0.65% |
| Administrator Class | | | | |
| Actual | $1,000.00 | $ 934.78 | $4.88 | 1.00% |
| Hypothetical (5% return before expenses) | $1,000.00 | $1,020.16 | $5.09 | 1.00% |
| Institutional Class | | | | |
| Actual | $1,000.00 | $ 936.09 | $3.42 | 0.70% |
| Hypothetical (5% return before expenses) | $1,000.00 | $1,021.68 | $3.57 | 0.70% |
1 Expenses paid is equal to the annualized net expense ratio of each class multiplied by the average account value over the period, multiplied by 184 divided by 365 (to reflect the one-half-year period).
8 | Allspring Premier Large Company Growth Fund
Portfolio of investments—January 31, 2023 (unaudited)
| | | | | Shares | Value |
| Common stocks: 99.49% | | | | | |
| Communication services: 9.10% | | | | | |
| Entertainment: 1.98% | | | | | |
| Liberty Media Corporation † | | | | 187,800 | $ 13,296,240 |
| Live Nation Entertainment Incorporated † | | | | 315,079 | 25,360,709 |
| | | | | | 38,656,949 |
| Interactive media & services: 5.94% | | | | | |
| Alphabet Incorporated Class A † | | | | 762,725 | 75,387,739 |
| Alphabet Incorporated Class C † | | | | 273,158 | 27,280,289 |
| ZoomInfo Technologies Incorporated † | | | | 473,957 | 13,379,806 |
| | | | | | 116,047,834 |
| Wireless telecommunication services: 1.18% | | | | | |
| T-Mobile US Incorporated † | | | | 155,000 | 23,143,050 |
| Consumer discretionary: 14.99% | | | | | |
| Hotels, restaurants & leisure: 2.56% | | | | | |
| Chipotle Mexican Grill Incorporated † | | | | 15,616 | 25,709,870 |
| Hilton Worldwide Holdings Incorporated | | | | 167,338 | 24,279,070 |
| | | | | | 49,988,940 |
| Internet & direct marketing retail: 4.01% | | | | | |
| Amazon.com Incorporated † | | | | 596,142 | 61,480,124 |
| MercadoLibre Incorporated † | | | | 14,234 | 16,820,175 |
| | | | | | 78,300,299 |
| Specialty retail: 4.77% | | | | | |
| AutoZone Incorporated † | | | | 12,900 | 31,461,165 |
| Five Below Incorporated † | | | | 18,133 | 3,574,558 |
| Tractor Supply Company | | | | 106,965 | 24,386,950 |
| Ulta Beauty Incorporated † | | | | 65,928 | 33,884,355 |
| | | | | | 93,307,028 |
| Textiles, apparel & luxury goods: 3.65% | | | | | |
| Deckers Outdoor Corporation † | | | | 106,058 | 45,337,674 |
| lululemon athletica Incorporated † | | | | 84,866 | 26,043,678 |
| | | | | | 71,381,352 |
| Consumer staples: 1.37% | | | | | |
| Beverages: 0.15% | | | | | |
| Monster Beverage Corporation † | | | | 28,100 | 2,924,648 |
| Food & staples retailing: 1.22% | | | | | |
| Costco Wholesale Corporation | | | | 46,555 | 23,796,123 |
| Financials: 8.37% | | | | | |
| Capital markets: 6.63% | | | | | |
| LPL Financial Holdings Incorporated | | | | 83,200 | 19,728,384 |
| MarketAxess Holdings Incorporated | | | | 25,081 | 9,125,722 |
| MSCI Incorporated | | | | 34,387 | 18,278,754 |
| S&P Global Incorporated | | | | 72,500 | 27,183,150 |
The accompanying notes are an integral part of these financial statements.
Allspring Premier Large Company Growth Fund | 9
Portfolio of investments—January 31, 2023 (unaudited)
| | | | | Shares | Value |
| Capital markets (continued) | | | | | |
| The Charles Schwab Corporation | | | | 265,254 | $ 20,535,965 |
| Tradeweb Markets Incorporated Class A | | | | 464,110 | 34,594,759 |
| | | | | | 129,446,734 |
| Insurance: 1.74% | | | | | |
| Kinsale Capital Group Incorporated | | | | 49,321 | 13,732,939 |
| Progressive Corporation | | | | 149,174 | 20,339,875 |
| | | | | | 34,072,814 |
| Health care: 14.01% | | | | | |
| Biotechnology: 4.73% | | | | | |
| Argenx SE † | | | | 41,414 | 15,830,502 |
| BioMarin Pharmaceutical Incorporated † | | | | 139,070 | 16,041,725 |
| Neurocrine Biosciences Incorporated † | | | | 162,989 | 18,080,370 |
| Sarepta Therapeutics Incorporated † | | | | 95,600 | 11,947,132 |
| Vertex Pharmaceuticals Incorporated † | | | | 94,321 | 30,475,115 |
| | | | | | 92,374,844 |
| Health care equipment & supplies: 5.44% | | | | | |
| Boston Scientific Corporation † | | | | 675,792 | 31,255,380 |
| DexCom Incorporated † | | | | 102,400 | 10,966,016 |
| Hologic Incorporated † | | | | 117,700 | 9,577,249 |
| Insulet Corporation † | | | | 106,549 | 30,613,659 |
| Penumbra Incorporated † | | | | 95,678 | 23,958,728 |
| | | | | | 106,371,032 |
| Health care providers & services: 1.24% | | | | | |
| Humana Incorporated | | | | 18,286 | 9,356,946 |
| UnitedHealth Group Incorporated | | | | 29,988 | 14,969,710 |
| | | | | | 24,326,656 |
| Health care technology: 0.67% | | | | | |
| Veeva Systems Incorporated Class A † | | | | 76,594 | 13,063,107 |
| Life sciences tools & services: 1.93% | | | | | |
| Agilent Technologies Incorporated | | | | 121,674 | 18,504,182 |
| Repligen Corporation † | | | | 103,373 | 19,155,017 |
| | | | | | 37,659,199 |
| Industrials: 7.53% | | | | | |
| Aerospace & defense: 1.90% | | | | | |
| HEICO Corporation | | | | 217,169 | 37,125,041 |
| Building products: 2.49% | | | | | |
| Advanced Drainage Systems Incorporated | | | | 225,975 | 22,787,317 |
| Johnson Controls International plc | | | | 245,436 | 17,074,983 |
| Trex Company Incorporated † | | | | 166,400 | 8,772,608 |
| | | | | | 48,634,908 |
| Commercial services & supplies: 0.71% | | | | | |
| Copart Incorporated † | | | | 208,674 | 13,899,775 |
| Construction & engineering: 0.61% | | | | | |
| WillScot Mobile Mini Holdings Corporation † | | | | 244,200 | 11,833,932 |
The accompanying notes are an integral part of these financial statements.
10 | Allspring Premier Large Company Growth Fund
Portfolio of investments—January 31, 2023 (unaudited)
| | | | | Shares | Value |
| Machinery: 1.05% | | | | | |
| Fortive Corporation | | | | 302,554 | $ 20,582,749 |
| Road & rail: 0.77% | | | | | |
| J.B. Hunt Transport Services Incorporated | | | | 79,271 | 14,986,183 |
| Information technology: 41.34% | | | | | |
| Communications equipment: 0.62% | | | | | |
| Arista Networks Incorporated † | | | | 96,425 | 12,151,479 |
| Electronic equipment, instruments & components: 1.15% | | | | | |
| Keysight Technologies Incorporated † | | | | 79,962 | 14,341,185 |
| Mobileye Global Incorporated Class A † | | | | 212,900 | 8,217,940 |
| | | | | | 22,559,125 |
| IT services: 10.01% | | | | | |
| Block Incorporated Class A † | | | | 170,800 | 13,957,776 |
| Jack Henry & Associates Incorporated | | | | 88,900 | 16,010,001 |
| MasterCard Incorporated Class A | | | | 291,879 | 108,170,357 |
| PayPal Holdings Incorporated † | | | | 234,065 | 19,073,957 |
| Visa Incorporated Class A | | | | 166,600 | 38,352,986 |
| | | | | | 195,565,077 |
| Semiconductors & semiconductor equipment: 8.10% | | | | | |
| Allegro MicroSystems Incorporated † | | | | 272,334 | 10,394,989 |
| Microchip Technology Incorporated | | | | 412,827 | 32,043,632 |
| Monolithic Power Systems Incorporated | | | | 76,509 | 32,635,679 |
| NVIDIA Corporation | | | | 179,785 | 35,124,595 |
| NXP Semiconductors NV | | | | 117,585 | 21,672,091 |
| Qualcomm Incorporated | | | | 198,149 | 26,395,428 |
| | | | | | 158,266,414 |
| Software: 17.34% | | | | | |
| Dynatrace Incorporated † | | | | 573,276 | 22,030,997 |
| Fair Isaac Corporation † | | | | 27,676 | 18,430,832 |
| Five9 Incorporated † | | | | 218,210 | 17,190,584 |
| Intuit Incorporated | | | | 65,433 | 27,656,566 |
| Microsoft Corporation | | | | 691,570 | 171,377,962 |
| Oracle Corporation | | | | 246,700 | 21,823,082 |
| Palo Alto Networks Incorporated † | | | | 145,494 | 23,081,168 |
| Paycom Software Incorporated † | | | | 33,100 | 10,722,414 |
| ServiceNow Incorporated † | | | | 58,165 | 26,472,636 |
| | | | | | 338,786,241 |
| Technology hardware, storage & peripherals: 4.12% | | | | | |
| Apple Incorporated | | | | 558,238 | 80,548,161 |
| Materials: 1.56% | | | | | |
| Chemicals: 1.56% | | | | | |
| Linde plc | | | | 91,855 | 30,398,494 |
| Real estate: 1.22% | | | | | |
| Equity REITs: 0.29% | | | | | |
| SBA Communications Corporation | | | | 19,274 | 5,734,593 |
The accompanying notes are an integral part of these financial statements.
Allspring Premier Large Company Growth Fund | 11
Portfolio of investments—January 31, 2023 (unaudited)
| | | | | Shares | Value |
| Real estate management & development: 0.93% | | | | | |
| CBRE Group Incorporated Class A † | | | | 212,500 | $ 18,170,875 |
| Total Common stocks (Cost $1,332,196,083) | | | | | 1,944,103,656 |
| | | Yield | | | |
| Short-term investments: 0.71% | | | | | |
| Investment companies: 0.71% | | | | | |
| Allspring Government Money Market Fund Select Class ♠∞ | | 4.16% | | 13,836,619 | 13,836,619 |
| Total Short-term investments (Cost $13,836,619) | | | | | 13,836,619 |
| Total investments in securities (Cost $1,346,032,702) | 100.20% | | | | 1,957,940,275 |
| Other assets and liabilities, net | (0.20) | | | | (3,840,546) |
| Total net assets | 100.00% | | | | $1,954,099,729 |
| † | Non-income-earning security |
| ♠ | The issuer of the security is an affiliated person of the Fund as defined in the Investment Company Act of 1940. |
| ∞ | The rate represents the 7-day annualized yield at period end. |
| Abbreviations: |
| REIT | Real estate investment trust |
Investments in affiliates
An affiliated investment is an investment in which the Fund owns at least 5% of the outstanding voting shares of the issuer or as a result of other relationships, such as the Fund and the issuer having the same investment manager. Transactions with issuers that were affiliates of the Fund at the end of the period were as follows:
| | Value,
beginning of
period | Purchases | Sales
proceeds | Net
realized
gains
(losses) | Net
change in
unrealized
gains
(losses) | Value,
end of
period | Shares,
end
of period | Income
from
affiliated
securities |
| Short-term investments | | | | | | | |
| Allspring Government Money Market Fund Select Class | $14,233,380 | $289,849,262 | $(290,246,023) | $0 | $0 | $13,836,619 | 13,836,619 | $411,838 |
The accompanying notes are an integral part of these financial statements.
12 | Allspring Premier Large Company Growth Fund
Statement of assets and liabilities—January 31, 2023 (unaudited)
| | |
| Assets | |
Investments in unaffiliated securities, at value (cost $1,332,196,083)
| $ 1,944,103,656 |
Investments in affiliated securities, at value (cost $13,836,619)
| 13,836,619 |
Cash
| 143 |
Receivable for investments sold
| 12,028,468 |
Receivable for Fund shares sold
| 482,129 |
Receivable for dividends
| 211,898 |
Prepaid expenses and other assets
| 163,491 |
Total assets
| 1,970,826,404 |
| Liabilities | |
Payable for investments purchased
| 13,753,457 |
Payable for Fund shares redeemed
| 1,404,766 |
Management fee payable
| 959,038 |
Administration fees payable
| 204,246 |
Distribution fee payable
| 10,622 |
Trustees’ fees and expenses payable
| 4,320 |
Accrued expenses and other liabilities
| 390,226 |
Total liabilities
| 16,726,675 |
Total net assets
| $1,954,099,729 |
| Net assets consist of | |
Paid-in capital
| $ 1,211,949,688 |
Total distributable earnings
| 742,150,041 |
Total net assets
| $1,954,099,729 |
| Computation of net asset value and offering price per share | |
Net assets – Class A
| $ 872,396,571 |
Shares outstanding – Class A1
| 80,936,654 |
Net asset value per share – Class A
| $10.78 |
Maximum offering price per share – Class A2
| $11.44 |
Net assets – Class C
| $ 17,467,543 |
Shares outstanding – Class C1
| 2,843,915 |
Net asset value per share – Class C
| $6.14 |
Net assets – Class R4
| $ 121,428 |
Shares outstanding – Class R41
| 10,304 |
Net asset value per share – Class R4
| $11.78 |
Net assets – Class R6
| $ 745,658,105 |
Shares outstanding – Class R61
| 61,574,888 |
Net asset value per share – Class R6
| $12.11 |
Net assets – Administrator Class
| $ 18,066,480 |
Shares outstanding – Administrator Class1
| 1,616,280 |
Net asset value per share – Administrator Class
| $11.18 |
Net assets – Institutional Class
| $ 300,389,602 |
Shares outstanding – Institutional Class1
| 25,014,938 |
Net asset value per share – Institutional Class
| $12.01 |
| 1 | The Fund has an unlimited number of authorized shares. |
| 2 | Maximum offering price is computed as 100/94.25 of net asset value. On investments of $50,000 or more, the offering price is reduced. |
The accompanying notes are an integral part of these financial statements.
Allspring Premier Large Company Growth Fund | 13
Statement of operations—six months ended January 31, 2023 (unaudited)
| | |
| Investment income | |
Dividends (net of foreign withholdings taxes of $38,788)
| $ 4,880,501 |
Income from affiliated securities
| 411,838 |
Total investment income
| 5,292,339 |
| Expenses | |
Management fee
| 6,812,456 |
| Administration fees | |
Class A
| 940,797 |
Class C
| 20,407 |
Class R4
| 48 |
Class R6
| 114,819 |
Administrator Class
| 12,739 |
Institutional Class
| 221,265 |
| Shareholder servicing fees | |
Class A
| 1,118,008 |
Class C
| 24,196 |
Class R4
| 59 |
Administrator Class
| 24,009 |
| Distribution fee | |
Class C
| 72,214 |
Custody and accounting fees
| 69,860 |
Professional fees
| 27,505 |
Registration fees
| 36,962 |
Shareholder report expenses
| 49,978 |
Trustees’ fees and expenses
| 11,026 |
Other fees and expenses
| 34,482 |
Total expenses
| 9,590,830 |
| Less: Fee waivers and/or expense reimbursements | |
Fund-level
| (406,714) |
Class R4
| (18) |
Class R6
| (114,819) |
Administrator Class
| (1,960) |
Institutional Class
| (136,163) |
Net expenses
| 8,931,156 |
Net investment loss
| (3,638,817) |
| Realized and unrealized gains (losses) on investments | |
Net realized gains on investments
| 149,367,066 |
Net change in unrealized gains (losses) on investments
| (300,004,407) |
Net realized and unrealized gains (losses) on investments
| (150,637,341) |
Net decrease in net assets resulting from operations
| $(154,276,158) |
The accompanying notes are an integral part of these financial statements.
14 | Allspring Premier Large Company Growth Fund
Statement of changes in net assets
| | | | | |
| | Six months ended
January 31, 2023
(unaudited) | Year ended
July 31, 2022 |
| Operations | | | | |
Net investment loss
| | $ (3,638,817) | | $ (15,412,403) |
Net realized gains on investments
| | 149,367,066 | | 230,342,200 |
Net change in unrealized gains (losses) on investments
| | (300,004,407) | | (994,308,831) |
Net decrease in net assets resulting from operations
| | (154,276,158) | | (779,379,034) |
| Distributions to shareholders from | | | | |
| Net investment income and net realized gains | | | | |
Class A
| | 0 | | (309,130,200) |
Class C
| | 0 | | (15,056,315) |
Class R4
| | 0 | | (291,397) |
Class R6
| | 0 | | (222,688,114) |
Administrator Class
| | 0 | | (13,378,433) |
Institutional Class
| | 0 | | (126,375,453) |
Total distributions to shareholders
| | 0 | | (686,919,912) |
| Capital share transactions | Shares | | Shares | |
| Proceeds from shares sold | | | | |
Class A
| 1,008,604 | 10,572,818 | 3,310,399 | 50,327,381 |
Class C
| 125,459 | 744,350 | 223,387 | 2,029,703 |
Class R4
| 176 | 2,023 | 4,488 | 72,140 |
Class R6
| 2,489,322 | 29,398,928 | 8,122,366 | 122,467,136 |
Administrator Class
| 46,031 | 513,988 | 198,706 | 3,310,040 |
Institutional Class
| 1,307,594 | 15,155,253 | 5,740,987 | 88,249,584 |
| | | 56,387,360 | | 266,455,984 |
| Reinvestment of distributions | | | | |
Class A
| 0 | 0 | 19,056,650 | 289,089,373 |
Class C
| 0 | 0 | 1,669,149 | 14,554,977 |
Class R4
| 0 | 0 | 17,671 | 291,397 |
Class R6
| 0 | 0 | 12,933,032 | 219,214,894 |
Administrator Class
| 0 | 0 | 824,167 | 12,947,669 |
Institutional Class
| 0 | 0 | 6,622,898 | 111,397,139 |
| | | 0 | | 647,495,449 |
| Payment for shares redeemed | | | | |
Class A
| (6,880,010) | (73,003,653) | (13,457,217) | (193,624,038) |
Class C
| (790,323) | (4,734,091) | (2,936,526) | (26,914,649) |
Class R4
| (34) | (388) | (82,779) | (1,205,111) |
Class R6
| (7,088,141) | (84,295,581) | (10,939,862) | (168,824,630) |
Administrator Class
| (314,554) | (3,469,424) | (2,451,692) | (34,510,357) |
Institutional Class
| (8,229,940) | (96,093,206) | (12,833,169) | (192,974,882) |
| | | (261,596,343) | | (618,053,667) |
Net increase (decrease) in net assets resulting from capital share transactions
| | (205,208,983) | | 295,897,766 |
Total decrease in net assets
| | (359,485,141) | | (1,170,401,180) |
| Net assets | | | | |
Beginning of period
| | 2,313,584,870 | | 3,483,986,050 |
End of period
| | $1,954,099,729 | | $ 2,313,584,870 |
The accompanying notes are an integral part of these financial statements.
Allspring Premier Large Company Growth Fund | 15
Financial highlights
(For a share outstanding throughout each period)
| | | Year ended July 31 |
| Class A | Six months ended
January 31, 2023
(unaudited) | 2022 | 2021 | 2020 | 2019 | 2018 |
Net asset value, beginning of period
| $11.54 | $19.28 | $16.08 | $14.19 | $15.10 | $15.34 |
Net investment loss
| (0.03) 1 | (0.11) 1 | (0.13) 1 | (0.07) | (0.05) | (0.05) |
Net realized and unrealized gains (losses) on investments
| (0.73) | (3.54) | 5.36 | 3.07 | 1.50 | 3.56 |
Total from investment operations
| (0.76) | (3.65) | 5.23 | 3.00 | 1.45 | 3.51 |
| Distributions to shareholders from | | | | | | |
Net realized gains
| 0.00 | (4.09) | (2.03) | (1.11) | (2.36) | (3.75) |
Net asset value, end of period
| $10.78 | $11.54 | $19.28 | $16.08 | $14.19 | $15.10 |
Total return2
| (6.59)% | (24.02)% | 34.93% | 22.78% | 12.97% | 26.54% |
| Ratios to average net assets (annualized) | | | | | | |
Gross expenses
| 1.15% | 1.13% | 1.13% | 1.14% | 1.15% | 1.15% |
Net expenses
| 1.11% | 1.10% | 1.10% | 1.10% | 1.11% | 1.11% |
Net investment loss
| (0.59)% | (0.75)% | (0.77)% | (0.52)% | (0.40)% | (0.34)% |
| Supplemental data | | | | | | |
Portfolio turnover rate
| 35% | 54% | 48% | 45% | 60% | 45% |
Net assets, end of period (000s omitted)
| $872,397 | $1,001,892 | $1,501,805 | $1,178,453 | $1,050,751 | $1,048,632 |
| 1 | Calculated based upon average shares outstanding |
| 2 | Total return calculations do not include any sales charges. Returns for periods of less than one year are not annualized. |
The accompanying notes are an integral part of these financial statements.
16 | Allspring Premier Large Company Growth Fund
Financial highlights
(For a share outstanding throughout each period)
| | | Year ended July 31 |
| Class C | Six months ended
January 31, 2023
(unaudited) | 2022 | 2021 | 2020 | 2019 | 2018 |
Net asset value, beginning of period
| $6.60 | $12.85 | $11.40 | $10.45 | $11.87 | $12.86 |
Net investment loss
| (0.04) 1 | (0.14) 1 | (0.18) 1 | (0.13) 1 | (0.12) 1 | (0.13) 1 |
Net realized and unrealized gains (losses) on investments
| (0.42) | (2.02) | 3.66 | 2.19 | 1.06 | 2.89 |
Total from investment operations
| (0.46) | (2.16) | 3.48 | 2.06 | 0.94 | 2.76 |
| Distributions to shareholders from | | | | | | |
Net realized gains
| 0.00 | (4.09) | (2.03) | (1.11) | (2.36) | (3.75) |
Net asset value, end of period
| $6.14 | $6.60 | $12.85 | $11.40 | $10.45 | $11.87 |
Total return2
| (6.97)% | (24.57)% | 33.80% | 21.87% | 12.09% | 25.68% |
| Ratios to average net assets (annualized) | | | | | | |
Gross expenses
| 1.89% | 1.86% | 1.87% | 1.89% | 1.90% | 1.90% |
Net expenses
| 1.86% | 1.85% | 1.86% | 1.86% | 1.86% | 1.86% |
Net investment loss
| (1.34)% | (1.51)% | (1.52)% | (1.27)% | (1.14)% | (1.09)% |
| Supplemental data | | | | | | |
Portfolio turnover rate
| 35% | 54% | 48% | 45% | 60% | 45% |
Net assets, end of period (000s omitted)
| $17,468 | $23,163 | $58,524 | $111,046 | $153,404 | $201,138 |
| 1 | Calculated based upon average shares outstanding |
| 2 | Total return calculations do not include any sales charges. Returns for periods of less than one year are not annualized. |
The accompanying notes are an integral part of these financial statements.
Allspring Premier Large Company Growth Fund | 17
Financial highlights
(For a share outstanding throughout each period)
| | | Year ended July 31 |
| Class R4 | Six months ended
January 31, 2023
(unaudited) | 2022 | 2021 | 2020 | 2019 | 2018 |
Net asset value, beginning of period
| $12.60 | $20.58 | $17.00 | $14.89 | $15.69 | $15.75 |
Net investment loss
| (0.02) 1 | (0.08) 1 | (0.09) 1 | (0.03) 1 | (0.03) | (0.00) 1,2 |
Net realized and unrealized gains (losses) on investments
| (0.80) | (3.81) | 5.70 | 3.25 | 1.59 | 3.69 |
Total from investment operations
| (0.82) | (3.89) | 5.61 | 3.22 | 1.56 | 3.69 |
| Distributions to shareholders from | | | | | | |
Net realized gains
| 0.00 | (4.09) | (2.03) | (1.11) | (2.36) | (3.75) |
Net asset value, end of period
| $11.78 | $12.60 | $20.58 | $17.00 | $14.89 | $15.69 |
Total return3
| (6.51)% | (23.61)% | 35.30% | 23.20% | 13.21% | 27.06% |
| Ratios to average net assets (annualized) | | | | | | |
Gross expenses
| 0.87% | 0.85% | 0.85% | 0.86% | 0.87% | 0.87% |
Net expenses
| 0.80% | 0.80% | 0.80% | 0.80% | 0.80% | 0.80% |
Net investment loss
| (0.29)% | (0.47)% | (0.47)% | (0.20)% | (0.10)% | (0.02)% |
| Supplemental data | | | | | | |
Portfolio turnover rate
| 35% | 54% | 48% | 45% | 60% | 45% |
Net assets, end of period (000s omitted)
| $121 | $128 | $1,457 | $1,129 | $3,940 | $3,727 |
| 1 | Calculated based upon average shares outstanding |
| 2 | Amount is more than $(0.005) |
| 3 | Returns for periods of less than one year are not annualized. |
The accompanying notes are an integral part of these financial statements.
18 | Allspring Premier Large Company Growth Fund
Financial highlights
(For a share outstanding throughout each period)
| | | Year ended July 31 |
| Class R6 | Six months ended
January 31, 2023
(unaudited) | 2022 | 2021 | 2020 | 2019 | 2018 |
Net asset value, beginning of period
| $12.94 | $21.03 | $17.31 | $15.12 | $15.87 | $15.87 |
Net investment income (loss)
| (0.01) 1 | (0.05) 1 | (0.06) 1 | (0.01) | (0.00) 1,2 | 0.02 1 |
Net realized and unrealized gains (losses) on investments
| (0.82) | (3.95) | 5.81 | 3.31 | 1.61 | 3.73 |
Total from investment operations
| (0.83) | (4.00) | 5.75 | 3.30 | 1.61 | 3.75 |
| Distributions to shareholders from | | | | | | |
Net realized gains
| 0.00 | (4.09) | (2.03) | (1.11) | (2.36) | (3.75) |
Net asset value, end of period
| $12.11 | $12.94 | $21.03 | $17.31 | $15.12 | $15.87 |
Total return3
| (6.41)% | (23.64)% | 35.49% | 23.39% | 13.40% | 27.27% |
| Ratios to average net assets (annualized) | | | | | | |
Gross expenses
| 0.72% | 0.70% | 0.70% | 0.71% | 0.71% | 0.72% |
Net expenses
| 0.65% | 0.65% | 0.65% | 0.65% | 0.65% | 0.65% |
Net investment income (loss)
| (0.13)% | (0.30)% | (0.32)% | (0.07)% | (0.02)% | 0.12% |
| Supplemental data | | | | | | |
Portfolio turnover rate
| 35% | 54% | 48% | 45% | 60% | 45% |
Net assets, end of period (000s omitted)
| $745,658 | $856,050 | $1,179,098 | $954,852 | $820,383 | $196,934 |
| 1 | Calculated based upon average shares outstanding |
| 2 | Amount is more than $(0.005) |
| 3 | Returns for periods of less than one year are not annualized. |
The accompanying notes are an integral part of these financial statements.
Allspring Premier Large Company Growth Fund | 19
Financial highlights
(For a share outstanding throughout each period)
| | | Year ended July 31 |
| Administrator Class | Six months ended
January 31, 2023
(unaudited) | 2022 | 2021 | 2020 | 2019 | 2018 |
Net asset value, beginning of period
| $11.96 | $19.82 | $16.47 | $14.48 | $15.35 | $15.52 |
Net investment loss
| (0.03) 1 | (0.11) 1 | (0.12) 1 | (0.06) 1 | (0.04) 1 | (0.03) 1 |
Net realized and unrealized gains (losses) on investments
| (0.75) | (3.66) | 5.50 | 3.16 | 1.53 | 3.61 |
Total from investment operations
| (0.78) | (3.77) | 5.38 | 3.10 | 1.49 | 3.58 |
| Distributions to shareholders from | | | | | | |
Net realized gains
| 0.00 | (4.09) | (2.03) | (1.11) | (2.36) | (3.75) |
Net asset value, end of period
| $11.18 | $11.96 | $19.82 | $16.47 | $14.48 | $15.35 |
Total return2
| (6.52)% | (23.96)% | 35.02% | 23.02% | 13.02% | 26.70% |
| Ratios to average net assets (annualized) | | | | | | |
Gross expenses
| 1.06% | 1.04% | 1.05% | 1.06% | 1.07% | 1.07% |
Net expenses
| 1.00% | 1.00% | 1.00% | 1.00% | 1.00% | 1.00% |
Net investment loss
| (0.48)% | (0.68)% | (0.67)% | (0.42)% | (0.29)% | (0.22)% |
| Supplemental data | | | | | | |
Portfolio turnover rate
| 35% | 54% | 48% | 45% | 60% | 45% |
Net assets, end of period (000s omitted)
| $18,066 | $22,546 | $65,665 | $54,341 | $49,042 | $57,582 |
| 1 | Calculated based upon average shares outstanding |
| 2 | Returns for periods of less than one year are not annualized. |
The accompanying notes are an integral part of these financial statements.
20 | Allspring Premier Large Company Growth Fund
Financial highlights
(For a share outstanding throughout each period)
| | | Year ended July 31 |
| Institutional Class | Six months ended
January 31, 2023
(unaudited) | 2022 | 2021 | 2020 | 2019 | 2018 |
Net asset value, beginning of period
| $12.83 | $20.90 | $17.22 | $15.06 | $15.82 | $15.84 |
Net investment income (loss)
| (0.01) 1 | (0.06) 1 | (0.07) 1 | (0.02) 1 | 0.00 1,2 | 0.01 1 |
Net realized and unrealized gains (losses) on investments
| (0.81) | (3.92) | 5.78 | 3.29 | 1.60 | 3.72 |
Total from investment operations
| (0.82) | (3.98) | 5.71 | 3.27 | 1.60 | 3.73 |
| Distributions to shareholders from | | | | | | |
Net realized gains
| 0.00 | (4.09) | (2.03) | (1.11) | (2.36) | (3.75) |
Net asset value, end of period
| $12.01 | $12.83 | $20.90 | $17.22 | $15.06 | $15.82 |
Total return3
| (6.39)% | (23.70)% | 35.43% | 23.28% | 13.38% | 27.17% |
| Ratios to average net assets (annualized) | | | | | | |
Gross expenses
| 0.82% | 0.80% | 0.80% | 0.81% | 0.82% | 0.82% |
Net expenses
| 0.70% | 0.70% | 0.70% | 0.70% | 0.70% | 0.70% |
Net investment income (loss)
| (0.18)% | (0.35)% | (0.37)% | (0.12)% | 0.02% | 0.07% |
| Supplemental data | | | | | | |
Portfolio turnover rate
| 35% | 54% | 48% | 45% | 60% | 45% |
Net assets, end of period (000s omitted)
| $300,390 | $409,806 | $677,437 | $648,357 | $643,578 | $1,043,161 |
| 1 | Calculated based upon average shares outstanding |
| 2 | Amount is less than $0.005. |
| 3 | Returns for periods of less than one year are not annualized. |
The accompanying notes are an integral part of these financial statements.
Allspring Premier Large Company Growth Fund | 21
Notes to financial statements (unaudited)
1. ORGANIZATION
Allspring Funds Trust (the "Trust"), a Delaware statutory trust organized on March 10, 1999, is an open-end management investment company registered under the Investment Company Act of 1940, as amended (the "1940 Act"). As an investment company, the Trust follows the accounting and reporting guidance in Financial Accounting Standards Board ("FASB") Accounting Standards Codification Topic 946, Financial Services – Investment Companies. These financial statements report on the Allspring Premier Large Company Growth Fund (the "Fund") which is a diversified series of the Trust.
2. SIGNIFICANT ACCOUNTING POLICIES
The following significant accounting policies, which are consistently followed in the preparation of the financial statements of the Fund, are in conformity with U.S. generally accepted accounting principles which require management to make estimates and assumptions that affect the reported amounts of assets and liabilities, disclosure of contingent assets and liabilities at the date of the financial statements, and the reported amounts of income and expenses during the reporting period. Actual results could differ from those estimates.
Securities valuation
All investments are valued each business day as of the close of regular trading on the New York Stock Exchange (generally 4 p.m. Eastern Time), although the Fund may deviate from this calculation time under unusual or unexpected circumstances.
Equity securities that are listed on a foreign or domestic exchange or market are valued at the official closing price or, if none, the last sales price.
Investments in registered open-end investment companies (other than those listed on a foreign or domestic exchange or market) are valued at net asset value. Interests in non-registered investment companies that are redeemable at net asset value are fair valued normally at net asset value.
Investments which are not valued using the methods discussed above are valued at their fair value, as determined in good faith by Allspring Funds Management, LLC ("Allspring Funds Management"), which was named the valuation designee by the Board of Trustees. As the valuation designee, Allspring Funds Management is responsible for day-to-day valuation activities for the Allspring Funds. In connection with these responsibilities, Allspring Funds Management has established a Valuation Committee and has delegated to it the authority to take any actions regarding the valuation of portfolio securities that the Valuation Committee deems necessary or appropriate, including determining the fair value of portfolio securities. On a quarterly basis, the Board of Trustees receives reports of valuation actions taken by the Valuation Committee. On at least an annual basis, the Board of Trustees receives an assessment of the adequacy and effectiveness of Allspring Funds Management's process for determining the fair value of the portfolio of investments.
Securities lending
The Fund may lend its securities from time to time in order to earn additional income in the form of fees or interest on securities received as collateral or the investment of any cash received as collateral. When securities are on loan, the Fund receives interest or dividends on those securities. Cash collateral received in connection with its securities lending transactions is invested in Securities Lending Cash Investments, LLC (the "Securities Lending Fund"), an affiliated non-registered investment company. Investments in Securities Lending Fund are valued at the evaluated bid price provided by an independent pricing service. Income earned from investment in the Securities Lending Fund (net of fees and rebates), if any, is included in income from affiliated securities on the Statement of Operations.
In a securities lending transaction, the net asset value of the Fund is affected by an increase or decrease in the value of the securities loaned and by an increase or decrease in the value of the instrument in which collateral is invested. The amount of securities lending activity undertaken by the Fund fluctuates from time to time. The Fund has the right under the lending agreement to recover the securities from the borrower on demand. In the event of default or bankruptcy by the borrower, the Fund may be prevented from recovering the loaned securities or gaining access to the collateral or may experience delays or costs in doing so. In such an event, the terms of the agreement allow the unaffiliated securities lending agent to use the collateral to purchase replacement securities on behalf of the Fund or pay the Fund the market value of the loaned securities. The Fund bears the risk of loss with respect to depreciation of its investment of the cash collateral.
Security transactions and income recognition
Securities transactions are recorded on a trade date basis. Realized gains or losses are recorded on the basis of identified cost.
Dividend income is recognized on the ex-dividend date. Dividend income is recorded net of foreign taxes withheld where recovery of such taxes is not assured.
22 | Allspring Premier Large Company Growth Fund
Notes to financial statements (unaudited)
Distributions to shareholders
Distributions to shareholders from net investment income and any net realized gains are recorded on the ex-dividend date and paid at least annually. Such distributions are determined in accordance with income tax regulations and may differ from U.S. generally accepted accounting principles. Dividend sources are estimated at the time of declaration. The tax character of distributions is determined as of the Fund's fiscal year end. Therefore, a portion of the Fund's distributions made prior to the Fund’s fiscal year end may be categorized as a tax return of capital at year end.
Federal and other taxes
The Fund intends to continue to qualify as a regulated investment company by distributing substantially all of its investment company taxable income and any net realized capital gains (after reduction for capital loss carryforwards) sufficient to relieve it from all, or substantially all, federal income taxes. Accordingly, no provision for federal income taxes was required.
The Fund’s income and federal excise tax returns and all financial records supporting those returns for the prior three fiscal years are subject to examination by the federal and Delaware revenue authorities. Management has analyzed the Fund's tax positions taken on federal, state, and foreign tax returns, as applicable, for all open tax years and does not believe that there are any uncertain tax positions that require recognition of a tax liability.
As of January 31, 2023, the aggregate cost of all investments for federal income tax purposes was $1,346,253,782 and the unrealized gains (losses) consisted of:
| Gross unrealized gains | $642,424,337 |
| Gross unrealized losses | (30,737,844) |
| Net unrealized gains | $611,686,493 |
As of July 31, 2022 the Fund had current year deferred post-October capital losses consisting of $237,060,741 in short-term capital losses and $229,887,993 in long-term capital gains which was recognized in the first day of the current fiscal year.
As of July 31, 2022, the Fund had a qualified late-year ordinary loss $6,841,340, which was recognized on the first day of the current fiscal year.
Class allocations
The separate classes of shares offered by the Fund differ principally in applicable sales charges, distribution, shareholder servicing, and administration fees. Class specific expenses are charged directly to that share class. Investment income, common fund-level expenses, and realized and unrealized gains (losses) on investments are allocated daily to each class of shares based on the relative proportion of net assets of each class.
3. FAIR VALUATION MEASUREMENTS
Fair value measurements of investments are determined within a framework that has established a fair value hierarchy based upon the various data inputs utilized in determining the value of the Fund’s investments. The three-level hierarchy gives the highest priority to unadjusted quoted prices in active markets for identical assets or liabilities (Level 1) and the lowest priority to unobservable inputs (Level 3). The Fund’s investments are classified within the fair value hierarchy based on the lowest level of input that is significant to the fair value measurement. The inputs are summarized into three broad levels as follows:
| ■ | Level 1 – quoted prices in active markets for identical securities |
| ■ | Level 2 – other significant observable inputs (including quoted prices for similar securities, interest rates, prepayment speeds, credit risk, etc.) |
| ■ | Level 3 – significant unobservable inputs (including the Fund’s own assumptions in determining the fair value of investments) |
The inputs or methodologies used for valuing investments in securities are not necessarily an indication of the risk associated with investing in those securities.
Allspring Premier Large Company Growth Fund | 23
Notes to financial statements (unaudited)
The following is a summary of the inputs used in valuing the Fund’s assets and liabilities as of January 31, 2023:
| | Quoted prices
(Level 1) | Other significant
observable inputs
(Level 2) | Significant
unobservable inputs
(Level 3) | Total |
| Assets | | | | |
| Investments in: | | | | |
| Common stocks | | | | |
| Communication services | $ 177,847,833 | $0 | $0 | $ 177,847,833 |
| Consumer discretionary | 292,977,619 | 0 | 0 | 292,977,619 |
| Consumer staples | 26,720,771 | 0 | 0 | 26,720,771 |
| Financials | 163,519,548 | 0 | 0 | 163,519,548 |
| Health care | 273,794,838 | 0 | 0 | 273,794,838 |
| Industrials | 147,062,588 | 0 | 0 | 147,062,588 |
| Information technology | 807,876,497 | 0 | 0 | 807,876,497 |
| Materials | 30,398,494 | 0 | 0 | 30,398,494 |
| Real estate | 23,905,468 | 0 | 0 | 23,905,468 |
| Short-term investments | | | | |
| Investment companies | 13,836,619 | 0 | 0 | 13,836,619 |
| Total assets | $1,957,940,275 | $0 | $0 | $1,957,940,275 |
Additional sector, industry or geographic detail, if any, is included in the Portfolio of Investments.
For the six months ended January 31, 2023, the Fund did not have any transfers into/out of Level 3.
4. TRANSACTIONS WITH AFFILIATES
Management fee
Allspring Funds Management, a wholly owned subsidiary of Allspring Global Investments Holdings, LLC, a holding company indirectly owned by certain private funds of GTCR LLC and Reverence Capital Partners, L.P., is the manager of the Fund and provides advisory and fund-level administrative services under an investment management agreement. Under the investment management agreement, Allspring Funds Management is responsible for, among other services, implementing the investment objectives and strategies of the Fund, supervising the subadviser and providing fund-level administrative services in connection with the Fund’s operations. As compensation for its services under the investment management agreement, Allspring Funds Management is entitled to receive a management fee at the following annual rate based on the Fund’s average daily net assets:
| Average daily net assets | Management fee |
| First $500 million | 0.700% |
| Next $500 million | 0.675 |
| Next $1 billion | 0.650 |
| Next $2 billion | 0.625 |
| Next $1 billion | 0.600 |
| Next $3 billion | 0.590 |
| Next $2 billion | 0.565 |
| Next $2 billion | 0.555 |
| Next $4 billion | 0.530 |
| Over $16 billion | 0.505 |
For the six months ended January 31, 2023, the management fee was equivalent to an annual rate of 0.67% of the Fund’s average daily net assets.
Allspring Funds Management has retained the services of a subadviser to provide daily portfolio management to the Fund. The fee for subadvisory services is borne by Allspring Funds Management. Allspring Global Investments, LLC ("Allspring
24 | Allspring Premier Large Company Growth Fund
Notes to financial statements (unaudited)
Investments"), an affiliate of Allspring Funds Management and a wholly owned subsidiary of Allspring Global Investments Holdings, LLC, is the subadviser to the Fund and is entitled to receive a fee from Allspring Funds Management at an annual rate starting at 0.35% and declining to 0.275% as the average daily net assets of the Fund increase.
Administration fees
Under a class-level administration agreement, Allspring Funds Management provides class-level administrative services to the Fund, which includes paying fees and expenses for services provided by the transfer agent, sub-transfer agents, omnibus account servicers and record-keepers. As compensation for its services under the class-level administration agreement, Allspring Funds Management receives an annual fee which is calculated based on the average daily net assets of each class as follows:
| | Class-level
administration fee |
| Class A | 0.21% |
| Class C | 0.21 |
| Class R4 | 0.08 |
| Class R6 | 0.03 |
| Administrator Class | 0.13 |
| Institutional Class | 0.13 |
Waivers and/or expense reimbursements
Allspring Funds Management has contractually committed to waive and/or reimburse management and administration fees to the extent necessary to maintain certain net operating expense ratios for the Fund. When each class of the Fund has exceeded its expense cap, Allspring Funds Management will waive fees and/or reimburse expenses from fund-level expenses on a proportionate basis and then from class specific expenses. When only certain classes exceed their expense caps, waivers and/or reimbursements are applied against class specific expenses before fund-level expenses. Allspring Funds Management has contractually committed through November 30, 2023 to waive fees and/or reimburse expenses to the extent necessary to cap expenses. Prior to or after the commitment expiration date, the caps may be increased or the commitment to maintain the caps may be terminated only with the approval of the Board of Trustees. As of January 31, 2023, the contractual expense caps are as follows:
| | Expense ratio caps |
| Class A | 1.11% |
| Class C | 1.86 |
| Class R4 | 0.80 |
| Class R6 | 0.65 |
| Administrator Class | 1.00 |
| Institutional Class | 0.70 |
Distribution fee
The Trust has adopted a distribution plan for Class C shares pursuant to Rule 12b-1 under the 1940 Act. A distribution fee is charged to Class C shares and paid to Allspring Funds Distributor, LLC ("Allspring Funds Distributor"), the principal underwriter, an affiliate of Allspring Funds Management, at an annual rate up to 0.75% of the average daily net assets of Class C shares.
In addition, Allspring Funds Distributor is entitled to receive the front-end sales charge from the purchase of Class A shares and a contingent deferred sales charge on the redemption of certain Class A shares. Allspring Funds Distributor is also entitled to receive the contingent deferred sales charges from redemptions of Class C shares. For the six months ended January 31, 2023, Allspring Funds Distributor received $1,662 from the sale of Class A shares. No contingent deferred sales charges were incurred by Class A and Class C shares for the six months ended January 31, 2023.
Allspring Premier Large Company Growth Fund | 25
Notes to financial statements (unaudited)
Shareholder servicing fees
The Trust has entered into contracts with one or more shareholder servicing agents, whereby Class A, Class C and Administrator Class are charged a fee at an annual rate up to 0.25% of the average daily net assets of each respective class. Class R4 is charged a fee at an annual rate up to 0.10% of its average daily net assets. A portion of these total shareholder servicing fees were paid to affiliates of the Fund.
Interfund transactions
The Fund may purchase or sell portfolio investment securities to certain affiliates pursuant to Rule 17a-7 under the 1940 Act and under procedures adopted by the Board of Trustees. The procedures have been designed to ensure that these interfund transactions, which do not incur broker commissions, are effected at current market prices.
5. INVESTMENT PORTFOLIO TRANSACTIONS
Purchases and sales of investments, excluding U.S. government obligations (if any) and short-term securities, for the six months ended January 31, 2023 were $709,002,165 and $906,050,949, respectively.
6. SECURITIES LENDING TRANSACTIONS
The Fund lends its securities through an unaffiliated securities lending agent and receives collateral in the form of cash or securities with a value at least equal to the value of the securities on loan. The value of the loaned securities is determined at the close of each business day and any increases or decreases in the required collateral are exchanged between the Fund and the counterparty on the next business day. Cash collateral received is invested in the Securities Lending Fund which seeks to provide a positive return compared to the daily Federal Funds Open Rate by investing in high-quality, U.S. dollar-denominated short-term money market instruments and is exempt from registration under Section 3(c)(7) of the 1940 Act. Securities Lending Fund is managed by Allspring Funds Management and is subadvised by Allspring Investments. Allspring Funds Management receives an advisory fee starting at 0.05% and declining to 0.01% as the average daily net assets of the Securities Lending Fund increase. All of the fees received by Allspring Funds Management are paid to Allspring Investments for its services as subadviser.
In the event of counterparty default or the failure of a borrower to return a loaned security, the Fund has the right to use the collateral to offset any losses incurred. As of January 31, 2023, the Fund did not have any securities on loan.
7. BANK BORROWINGS
The Trust (excluding the money market funds), Allspring Master Trust and Allspring Variable Trust are parties to a $350,000,000 revolving credit agreement whereby the Fund is permitted to use bank borrowings for temporary or emergency purposes, such as to fund shareholder redemption requests. Interest under the credit agreement is charged to the Fund based on a borrowing rate equal to the higher of the Federal Funds rate or the overnight bank funding rate in effect on that day plus a spread. In addition, an annual commitment fee equal based on the unused balance is allocated to each participating fund.
For the six months ended January 31, 2023, there were no borrowings by the Fund under the agreement.
8. CONCENTRATION RISKS
As of the end of the period, the Fund concentrated its portfolio of investments in the information technology sector. A fund that invests a substantial portion of its assets in any sector may be more affected by changes in that sector than would be a fund whose investments are not heavily weighted in any sector.
9. MARKET RISKS
On March 11, 2020, the World Health Organization announced that it had made the assessment that coronavirus disease 2019 (“COVID-19”) is a pandemic. The impacts of COVID-19 are affecting the entire global economy, individual companies and investment products, the funds, and the market in general. There is significant uncertainty around the extent and duration of business disruptions related to COVID-19 and the impacts may last for an extended period of time. COVID-19 has led to significant uncertainty and volatility in the financial markets.
10. INDEMNIFICATION
Under the Fund's organizational documents, the officers and Trustees have been granted certain indemnification rights against certain liabilities that may arise out of performance of their duties to the Fund. The Fund has entered into a separate agreement with each Trustee that converts indemnification rights currently existing under the Fund’s organizational documents into contractual rights that cannot be changed in the future without the consent of the Trustee. Additionally, in the
26 | Allspring Premier Large Company Growth Fund
Notes to financial statements (unaudited)
normal course of business, the Fund may enter into contracts with service providers that contain a variety of indemnification clauses. The Fund’s maximum exposure under these arrangements is dependent on future claims that may be made against the Fund and, therefore, cannot be estimated.
Allspring Premier Large Company Growth Fund | 27
Other information (unaudited)
PROXY VOTING INFORMATION
A description of the policies and procedures used to determine how to vote proxies relating to portfolio securities is available without charge, upon request, by calling 1-800-222-8222, visiting our website at allspringglobal.com, or visiting the SEC website at sec.gov. Information regarding how the proxies related to portfolio securities were voted during the most recent 12-month period ended June 30 is available on the website at allspringglobal.com or by visiting the SEC website at sec.gov.
QUARTERLY PORTFOLIO HOLDINGS INFORMATION
The Fund files its complete schedule of portfolio holdings with the SEC for the first and third quarters of each fiscal year as an exhibit to its reports on Form N-PORT. Shareholders may view the filed Form N-PORT by visiting the SEC website at sec.gov.
28 | Allspring Premier Large Company Growth Fund
Other information (unaudited)
BOARD OF TRUSTEES AND OFFICERS
Each of the Trustees and Officers listed in the table below acts in identical capacities for each fund in the Allspring family of funds, which consists of 127 mutual funds comprising the Allspring Funds Trust, Allspring Variable Trust, Allspring Master Trust and four closed-end funds (collectively the “Fund Complex”). This table should be read in conjunction with the Prospectus and the Statement of Additional Information1. The mailing address of each Trustee and Officer is 1415 Vantage Park Drive, 3rd Floor, Charlotte, NC 28203. Each Trustee and Officer serves an indefinite term, however, each Trustee serves such term until reaching the mandatory retirement age established by the Trustees.
Independent Trustees
Name and
year of birth | Position held and
length of service* | Principal occupations during past five years or longer | Current other
public company or
investment
company
directorships |
William R. Ebsworth
(Born 1957) | Trustee,
since 2015 | Retired. From 1984 to 2013, equities analyst, portfolio manager, research director and chief investment officer at Fidelity Management and Research Company in Boston, Tokyo, and Hong Kong, and retired in 2013 as Chief Investment Officer of Fidelity Strategic Advisers, Inc. where he led a team of investment professionals managing client assets. Prior thereto, Board member of Hong Kong Securities Clearing Co., Hong Kong Options Clearing Corp., the Thailand International Fund, Ltd., Fidelity Investments Life Insurance Company, and Empire Fidelity Investments Life Insurance Company. Audit Committee Chair and Investment Committee Chair of the Vincent Memorial Hospital Foundation (non-profit organization). Mr. Ebsworth is a CFA® charterholder. | N/A |
Jane A. Freeman
(Born 1953) | Trustee,
since 2015;
Chair Liaison,
since 2018 | Retired. From 2012 to 2014 and 1999 to 2008, Chief Financial Officer of Scientific Learning Corporation. From 2008 to 2012, Ms. Freeman provided consulting services related to strategic business projects. Prior to 1999, Portfolio Manager at Rockefeller & Co. and Scudder, Stevens & Clark. Board member of the Harding Loevner Funds from 1996 to 2014, serving as both Lead Independent Director and chair of the Audit Committee. Board member of the Russell Exchange Traded Funds Trust from 2011 to 2012 and the chair of the Audit Committee. Ms. Freeman is also an inactive Chartered Financial Analyst. | N/A |
Isaiah Harris, Jr.
(Born 1952) | Trustee,
since 2009; Audit
Committee
Chair,
since 2019 | Retired. Member of the Advisory Board of CEF of East Central Florida. Chairman of the Board of CIGNA Corporation from 2009 to 2021, and Director from 2005 to 2008. From 2003 to 2011, Director of Deluxe Corporation. Prior thereto, President and CEO of BellSouth Advertising and Publishing Corp. from 2005 to 2007, President and CEO of BellSouth Enterprises from 2004 to 2005 and President of BellSouth Consumer Services from 2000 to 2003. Emeritus member of the Iowa State University Foundation Board of Governors. Emeritus Member of the Advisory Board of Iowa State University School of Business. Advisory Board Member, Palm Harbor Academy (private school). Advisory Board Member, Fellowship of Christian Athletes. Mr. Harris is a certified public accountant (inactive status). | N/A |
David F. Larcker
(Born 1950) | Trustee,
since 2009 | Distinguished Visiting Fellow at the Hoover Institution since 2022. James Irvin Miller Professor of Accounting at the Graduate School of Business (Emeritus), Stanford University, Director of the Corporate Governance Research Initiative and Senior Faculty of The Rock Center for Corporate Governance since 2006. From 2005 to 2008, Professor of Accounting at the Graduate School of Business, Stanford University. Prior thereto, Ernst & Young Professor of Accounting at The Wharton School, University of Pennsylvania from 1985 to 2005. | N/A |
Allspring Premier Large Company Growth Fund | 29
Other information (unaudited)
Name and
year of birth | Position held and
length of service* | Principal occupations during past five years or longer | Current other
public company or
investment
company
directorships |
Olivia S. Mitchell
(Born 1953) | Trustee,
since 2006;
Nominating and
Governance
Committee Chair,
since 2018 | International Foundation of Employee Benefit Plans Professor since 1993, Wharton School of the University of Pennsylvania. Director of Wharton’s Pension Research Council and Boettner Center on Pensions & Retirement Research, and Research Associate at the National Bureau of Economic Research. Previously taught at Cornell University from 1978 to 1993. | N/A |
Timothy J. Penny
(Born 1951) | Trustee,
since 1996;
Chair,
since 2018 | President and Chief Executive Officer of Southern Minnesota Initiative Foundation, a non-profit organization, since 2007. Vice Chair of the Economic Club of Minnesota, since 2007. Co-Chair of the Committee for a Responsible Federal Budget, since 1995. Member of the Board of Trustees of NorthStar Education Finance, Inc., a non-profit organization, from 2007-2022. Senior Fellow of the University of Minnesota Humphrey Institute from 1995 to 2017. | N/A |
James G. Polisson
(Born 1959) | Trustee,
since 2018 | Retired. Chief Marketing Officer, Source (ETF) UK Services, Ltd, from 2015 to 2017. From 2012 to 2015, Principal of The Polisson Group, LLC, a management consulting, corporate advisory and principal investing company. Chief Executive Officer and Managing Director at Russell Investments, Global Exchange Traded Funds from 2010 to 2012. Managing Director of Barclays Global Investors from 1998 to 2010 and Global Chief Marketing Officer for iShares and Barclays Global Investors from 2000 to 2010. Trustee of the San Francisco Mechanics’ Institute, a non-profit organization, from 2013 to 2015. Board member of the Russell Exchange Traded Fund Trust from 2011 to 2012. Director of Barclays Global Investors Holdings Deutschland GmbH from 2006 to 2009. Mr. Polisson is an attorney and has a retired status with the Massachusetts and District of Columbia Bar Associations. | N/A |
Pamela Wheelock
(Born 1959) | Trustee,
since January
2020; previously
Trustee from
January 2018 to
July 2019 | Retired. Executive and Senior Financial leadership positions in the public, private and nonprofit sectors. Interim President and CEO, McKnight Foundation, 2020. Interim Commissioner, Minnesota Department of Human Services, 2019. Chief Operating Officer, Twin Cities Habitat for Humanity, 2017-2019. Vice President for University Services, University of Minnesota, 2012-2016. Interim President and CEO, Blue Cross and Blue Shield of Minnesota, 2011-2012. Executive Vice-President and Chief Financial Officer, Minnesota Wild, 2002-2008. Commissioner, Minnesota Department of Finance, 1999-2002. Chair of the Board of Directors of Destination Medical Center Corporation. Board member of the Minnesota Wild Foundation. | N/A |
* Length of service dates reflect the Trustee’s commencement of service with the Trust’s predecessor entities, where applicable.
30 | Allspring Premier Large Company Growth Fund
Other information (unaudited)
Officers2
Name and
year of birth | Position held and
length of service | Principal occupations during past five years or longer |
Andrew Owen
(Born 1960) | President,
since 2017 | President and Chief Executive Officer of Allspring Funds Management, LLC since 2017 and Head of Global Fund Governance of Allspring Global Investments since 2022. Prior thereto, co-president of Galliard Capital Management, LLC, an affiliate of Allspring Funds Management, LLC, from 2019 to 2022 and Head of Affiliated Managers, Allspring Global Investments, from 2014 to 2019 and Executive Vice President responsible for marketing, investments and product development for Allspring Funds Management, LLC, from 2009 to 2014. |
Jeremy DePalma
(Born 1974) | Treasurer,
since 2012
(for certain funds in
the Fund Complex);
since 2021 (for
the remaining funds in the
Fund Complex) | Senior Vice President of Allspring Funds Management, LLC since 2009. Senior Vice President of Evergreen Investment Management Company, LLC from 2008 to 2010 and head of the Fund Reporting and Control Team within Fund Administration from 2005 to 2010. |
Christopher Baker
(Born 1976) | Chief Compliance Officer, since 2022 | Global Chief Compliance Officer for Allspring Global Investments since 2022. Prior thereto, Chief Compliance Officer for State Street Global Advisors from 2018 to 2021. Senior Compliance Officer for the State Street divisions of Alternative Investment Solutions, Sector Solutions, and Global Marketing from 2015 to 2018. From 2010 to 2015 Vice President, Global Head of Investment and Marketing Compliance for State Street Global Advisors. |
Matthew Prasse
(Born 1983) | Chief Legal Officer, since 2022; Secretary, since 2021 | Senior Counsel of the Allspring Legal Department since 2021. Senior Counsel of the Wells Fargo Legal Department from 2018 to 2021. Previously, Counsel for Barings LLC from 2015 to 2018. Prior to joining Barings, Associate at Morgan, Lewis & Bockius LLP from 2008 to 2015. |
1 The Statement of Additional Information includes additional information about the Trustees and is available, without charge, upon request, by calling 1-800-222-8222 or by visiting the website at allspringglobal.com.
2 For those Officers with tenures at Allspring Global Investments and/or Allspring Funds Management, LLC that began prior to 2021, such tenures include years of service during which these businesses/entities were known as Wells Fargo Asset Management and Wells Fargo Funds Management, LLC, respectively.
Allspring Premier Large Company Growth Fund | 31
For more information
More information about Allspring Funds is available free upon request. To obtain literature, please write, visit the Fund's website, or call:
Allspring Funds
P.O. Box 219967
Kansas City, MO 64121-9967
Website: allspringglobal.com
Individual investors: 1-800-222-8222
Retail investment professionals: 1-888-877-9275
Institutional investment professionals: 1-800-260-5969
This report and the financial statements contained herein are submitted for the general information of the shareholders of the Fund. If this report is used for promotional purposes, distribution of the report must be accompanied or preceded by a current prospectus. Before investing, please consider the investment objectives, risks, charges, and expenses of the investment. For a current prospectus and, if available, a summary prospectus, containing this information, call
1-800-222-8222 or visit the Fund's website at allspringglobal.com. Read the prospectus carefully before you invest or send money.
Allspring Global InvestmentsTM is the trade name for the asset management firms of Allspring Global Investments Holdings, LLC, a holding company indirectly owned by certain private funds of GTCR LLC and Reverence Capital Partners, L.P. These firms include but are not limited to Allspring Global Investments, LLC, and Allspring Funds Management, LLC. Certain products managed by Allspring entities are distributed by Allspring Funds Distributor, LLC (a broker-dealer and Member FINRA/SIPC).
This material is for general informational and educational purposes only and is NOT intended to provide investment advice or a recommendation of any kind - including a recommendation for any specific investment, strategy, or plan.
© 2023 Allspring Global Investments Holdings, LLC. All rights reserved.
ALL-02092023-3jvah8n5 03-23
SAR4325 01-23
Not applicable.
| ITEM 3. | AUDIT COMMITTEE FINANCIAL EXPERT |
Not applicable.
| ITEM 4. | PRINCIPAL ACCOUNTANT FEES AND SERVICES |
Not applicable.
| ITEM 5. | AUDIT COMMITTEE OF LISTED REGISTRANTS |
Not applicable.
A Portfolio of Investments for each series of Allspring Funds Trust is included as part of the report to shareholders filed under Item 1 of this Form.
| ITEM 7. | DISCLOSURE OF PROXY VOTING POLICIES AND PROCEDURES FOR CLOSED-END MANAGEMENT INVESTMENT COMPANIES |
Not applicable.
| ITEM 8. | PORTFOLIO MANAGERS OF CLOSED-END MANAGEMENT INVESTMENT COMPANIES |
Not applicable.
| ITEM 9. | PURCHASES OF EQUITY SECURITIES BY CLOSED-END MANAGEMEENT INVESTMENT COMPANY AND AFFILIATED PURCHASERS |
Not applicable.
| ITEM 10. | SUBMISSION OF MATTERS TO A VOTE OF SECURITY HOLDERS |
There have been no material changes to the procedures by which shareholders may recommend nominees to the registrant’s Board of Trustees that have been implemented since the registrant’s last provided disclosure in response to the requirements of this Item.
| ITEM 11. | CONTROLS AND PROCEDURES |
(a) The President and Treasurer have concluded that the Allspring Funds Trust disclosure controls and procedures (as defined in Rule 30a-3(c) under the Investment Company Act of 1940) provide reasonable assurances that material information relating to the registrant is made known to them by the appropriate persons, based on their evaluation of these controls and procedures as of a date within 90 days of the filing of this report.
(b) There were no significant changes in the registrant’s internal controls over financial reporting (as defined in Rule 30a-3(d) under the Investment Company Act of 1940) that occurred during the most recent fiscal half-year of the period covered by this report that materially affected, or is reasonably likely to materially affect, the registrant’s internal control over financial reporting.
| ITEM 12. | DISCLOSURES OF SECURITIES LENDING ACTIVITES FOR CLOSED-END MANAGEMENT INVESTMENT COMPANIES |
Not applicable.
(a)(1) Not applicable.
(a)(2) Certifications pursuant to Section 302 of the Sarbanes-Oxley Act of 2002.
(b) Certifications pursuant to Section 906 of the Sarbanes-Oxley Act of 2002.
SIGNATURES
Pursuant to the requirements of the Securities Exchange Act of 1934 and the Investment Company Act of 1940, the registrant has duly caused this report to be signed on its behalf by the undersigned, thereunto duly authorized.
| | |
Allspring Funds Trust |
| |
By: | | /s/ Andrew Owen |
| | Andrew Owen |
| | President |
|
Date: March 30, 2023 |
Pursuant to the requirements of the Securities Exchange Act of 1934 and the Investment Company Act of 1940, this report has been signed below by the following persons on behalf of the registrant and in the capacities and on the date indicated.
| | |
| Allspring Funds Trust |
| |
| By: | | /s/ Andrew Owen |
| | Andrew Owen |
| | President |
|
| Date: March 30, 2023 |
| |
| By: | | /s/ Jeremy DePalma |
| | Jeremy DePalma |
| | Treasurer |
|
| Date: March 30, 2023 |